UNITED STATES
SECURITIES AND EXCHANGE COMMISSION
Washington, D.C. 20549
FORM N-CSR
CERTIFIED SHAREHOLDER REPORT OF REGISTERED
MANAGEMENT INVESTMENT COMPANIES
Investment Company Act file number 811-03329
Variable Insurance Products Fund
(Exact name of registrant as specified in charter)
245 Summer St., Boston, MA 02210
(Address of principal executive offices) (Zip code)
Margaret Carey, Secretary
245 Summer St.
Boston, Massachusetts 02210
(Name and address of agent for service)
Registrant's telephone number, including area code:
617-563-7000
| |
Date of fiscal year end: | December 31 |
|
|
Date of reporting period: | June 30, 2023 |
Item 1.
Reports to Stockholders
Fidelity® Variable Insurance Products:
VIP High Income Portfolio
Semi-Annual Report
June 30, 2023
Contents
To view a fund's proxy voting guidelines and proxy voting record for the 12-month period ended June 30, visit http://www.fidelity.com/proxyvotingresults or visit the Securities and Exchange Commission's (SEC) web site at http://www.sec.gov.
You may also call 1-877-208-0098 to request a free copy of the proxy voting guidelines.
Fidelity® Variable Insurance Products are separate account options which are purchased through a variable insurance contract.
Standard & Poor's, S&P and S&P 500 are registered service marks of The McGraw-Hill Companies, Inc. and have been licensed for use by Fidelity Distributors Corporation.
Other third-party marks appearing herein are the property of their respective owners.
All other marks appearing herein are registered or unregistered trademarks or service marks of FMR LLC or an affiliated company. © 2023 FMR LLC. All rights reserved.
This report and the financial statements contained herein are submitted for the general information of the shareholders of the Fund. This report is not authorized for distribution to prospective investors in the Fund unless preceded or accompanied by an effective prospectus.
A fund files its complete schedule of portfolio holdings with the SEC for the first and third quarters of each fiscal year on Form N-PORT. Forms N-PORT are available on the SEC's web site at http://www.sec.gov. A fund's Forms N-PORT may be reviewed and copied at the SEC's Public Reference Room in Washington, DC. Information regarding the operation of the SEC's Public Reference Room may be obtained by calling 1-800-SEC-0330.
For a complete list of a fund's portfolio holdings, view the most recent holdings listing, semiannual report, or annual report on Fidelity's web site at http://www.fidelity.com, http://www.institutional.fidelity.com, or http://www.401k.com, as applicable.
NOT FDIC INSURED •MAY LOSE VALUE •NO BANK GUARANTEE
Neither the Fund nor Fidelity Distributors Corporation is a bank.
| Top Bond Issuers (% of Fund's net assets) |
(with maturities greater than one year) |
| Uniti Group LP / Uniti Group Finance, Inc. | 2.0 | |
| Occidental Petroleum Corp. | 1.9 | |
| Mesquite Energy, Inc. | 1.8 | |
| Ford Motor Credit Co. LLC | 1.8 | |
| CCO Holdings LLC/CCO Holdings Capital Corp. | 1.8 | |
| Tallgrass Energy Partners LP / Tallgrass Energy Finance Corp. | 1.8 | |
| Community Health Systems, Inc. | 1.5 | |
| TransDigm, Inc. | 1.4 | |
| Fidelity Private Credit Central Fund LLC | 1.2 | |
| DISH Network Corp. | 1.2 | |
| | 16.4 | |
| |
| Market Sectors (% of Fund's net assets) |
| |
| Energy | 14.5 | |
| Technology | 7.5 | |
| Services | 6.7 | |
| Healthcare | 6.4 | |
| Telecommunications | 6.1 | |
| |
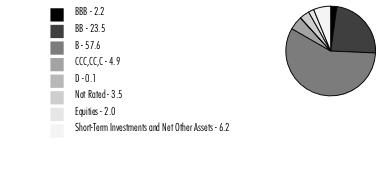
Quality Diversification (% of Fund's net assets) |
|
| |
| We have used ratings from Moody's Investors Service, Inc. Where Moody's® ratings are not available, we have used S&P® ratings. All ratings are as of the date indicated and do not reflect subsequent changes. |
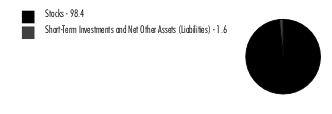
Asset Allocation (% of Fund's net assets) |
|
|
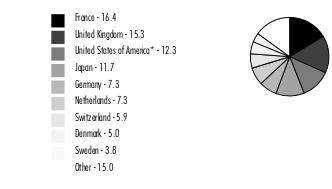
Geographic Diversification (% of Fund's net assets) |
|
* Includes Short-Term investments and Net Other Assets (Liabilities). Percentages are adjusted for the effect of derivatives, if applicable. |
| |
Showing Percentage of Net Assets
| Corporate Bonds - 82.5% |
| | | Principal Amount (a) | Value ($) |
| Convertible Bonds - 1.3% | | | |
| Broadcasting - 1.0% | | | |
| DISH Network Corp.: | | | |
| 2.375% 3/15/24 | | 3,658,000 | 3,241,903 |
| 3.375% 8/15/26 | | 8,064,000 | 4,092,480 |
| | | | 7,334,383 |
| Energy - 0.2% | | | |
| Mesquite Energy, Inc. 15% 7/15/23 (b)(c) | | 649,253 | 649,253 |
| Mesquite Energy, Inc. 15% 7/15/23 (b)(c) | | 1,120,884 | 1,120,884 |
| | | | 1,770,137 |
| Homebuilders/Real Estate - 0.1% | | | |
| Redfin Corp. 0.5% 4/1/27 | | 1,046,000 | 715,782 |
TOTAL CONVERTIBLE BONDS | | | 9,820,302 |
| Nonconvertible Bonds - 81.2% | | | |
| Aerospace - 2.5% | | | |
| ATI, Inc.: | | | |
| 4.875% 10/1/29 | | 250,000 | 225,047 |
| 5.875% 12/1/27 | | 770,000 | 745,181 |
| Bombardier, Inc. 7.875% 4/15/27 (d) | | 2,425,000 | 2,418,567 |
| BWX Technologies, Inc. 4.125% 6/30/28 (d) | | 2,000,000 | 1,824,699 |
| Howmet Aerospace, Inc.: | | | |
| 5.9% 2/1/27 | | 684,000 | 689,501 |
| 6.875% 5/1/25 | | 684,000 | 694,986 |
| Kaiser Aluminum Corp.: | | | |
| 4.5% 6/1/31 (d) | | 485,000 | 386,632 |
| 4.625% 3/1/28 (d) | | 1,735,000 | 1,517,362 |
| Moog, Inc. 4.25% 12/15/27 (d) | | 110,000 | 101,792 |
| TransDigm, Inc.: | | | |
| 4.625% 1/15/29 | | 855,000 | 760,572 |
| 5.5% 11/15/27 | | 3,970,000 | 3,741,725 |
| 6.25% 3/15/26 (d) | | 3,755,000 | 3,736,648 |
| 6.375% 6/15/26 | | 705,000 | 695,840 |
| 6.75% 8/15/28 (d) | | 1,100,000 | 1,104,169 |
| 7.5% 3/15/27 | | 425,000 | 425,604 |
| VistaJet Malta Finance PLC / XO Management Holding, Inc. 9.5% 6/1/28 (d) | | 275,000 | 252,491 |
| | | | 19,320,816 |
| Air Transportation - 0.9% | | | |
| Air Canada 3.875% 8/15/26 (d) | | 874,000 | 810,069 |
| American Airlines, Inc. 7.25% 2/15/28 (d) | | 365,000 | 362,826 |
| American Airlines, Inc. / AAdvantage Loyalty IP Ltd. 5.5% 4/20/26 (d) | | 2,345,000 | 2,323,167 |
| Mileage Plus Holdings LLC 6.5% 6/20/27 (d) | | 280,000 | 280,699 |
| Rand Parent LLC 8.5% 2/15/30 (d) | | 1,720,000 | 1,557,207 |
| Spirit Loyalty Cayman Ltd. / Spirit IP Cayman Ltd. 8% 9/20/25 (d) | | 1,735,000 | 1,747,954 |
| | | | 7,081,922 |
| Automotive - 0.3% | | | |
| Ford Motor Co.: | | | |
| 6.1% 8/19/32 | | 1,190,000 | 1,150,002 |
| 7.4% 11/1/46 | | 290,000 | 296,131 |
| Ford Motor Credit Co. LLC 3.625% 6/17/31 | | 980,000 | 803,264 |
| | | | 2,249,397 |
| Automotive & Auto Parts - 2.3% | | | |
| Adient Global Holdings Ltd. 7% 4/15/28 (d) | | 205,000 | 207,233 |
| Allison Transmission, Inc. 4.75% 10/1/27 (d) | | 167,000 | 157,371 |
| Dana Financing Luxembourg SARL 5.75% 4/15/25 (d) | | 83,000 | 81,807 |
| Dana, Inc.: | | | |
| 4.25% 9/1/30 | | 167,000 | 139,033 |
| 5.375% 11/15/27 | | 167,000 | 158,192 |
| Ford Motor Co.: | | | |
| 3.25% 2/12/32 | | 892,000 | 701,646 |
| 4.346% 12/8/26 | | 167,000 | 161,400 |
| 4.75% 1/15/43 | | 360,000 | 276,820 |
| 5.291% 12/8/46 | | 145,000 | 119,392 |
| Ford Motor Credit Co. LLC: | | | |
| U.S. Secured Overnight Fin. Rate (SOFR) Index + 2.950% 8.0398% 3/6/26 (e)(f) | | 995,000 | 997,491 |
| 2.3% 2/10/25 | | 3,230,000 | 3,019,720 |
| 2.9% 2/10/29 | | 2,030,000 | 1,679,691 |
| 3.375% 11/13/25 | | 517,000 | 480,745 |
| 3.815% 11/2/27 | | 925,000 | 826,737 |
| 4% 11/13/30 | | 350,000 | 299,104 |
| 4.125% 8/17/27 | | 790,000 | 721,384 |
| 4.389% 1/8/26 | | 705,000 | 667,214 |
| 4.95% 5/28/27 | | 1,410,000 | 1,330,035 |
| 5.125% 6/16/25 | | 355,000 | 345,248 |
| 6.95% 3/6/26 | | 2,845,000 | 2,860,127 |
| IHO Verwaltungs GmbH 4.75% 9/15/26 pay-in-kind (d)(e) | | 145,000 | 133,776 |
| Macquarie AirFinance Holdings 8.375% 5/1/28 (d) | | 735,000 | 745,246 |
| Rivian Holdco & Rivian LLC & Rivian Automotive LLC 6 month U.S. LIBOR + 5.620% 10.9311% 10/15/26 (d)(e)(f) | | 205,000 | 198,718 |
| ZF North America Capital, Inc.: | | | |
| 4.75% 4/29/25 (d) | | 845,000 | 823,808 |
| 6.875% 4/14/28 (d) | | 370,000 | 374,693 |
| 7.125% 4/14/30 (d) | | 370,000 | 376,344 |
| | | | 17,882,975 |
| Banks & Thrifts - 0.4% | | | |
| Ally Financial, Inc.: | | | |
| 5.75% 11/20/25 | | 235,000 | 226,319 |
| 6.7% 2/14/33 | | 1,465,000 | 1,296,215 |
| Jane Street Group LLC/JSG Finance, Inc. 4.5% 11/15/29 (d) | | 560,000 | 481,862 |
| Quicken Loans LLC/Quicken Loans Co.-Issuer, Inc. 4% 10/15/33 (d) | | 295,000 | 230,761 |
| VistaJet Malta Finance PLC / XO Management Holding, Inc.: | | | |
| 6.375% 2/1/30 (d) | | 280,000 | 225,465 |
| 7.875% 5/1/27 (d) | | 280,000 | 251,566 |
| | | | 2,712,188 |
| Broadcasting - 1.3% | | | |
| Diamond Sports Group LLC/Diamond Sports Finance Co. 5.375% (d)(g) | | 5,215,000 | 176,006 |
| DISH Network Corp. 11.75% 11/15/27 (d) | | 1,770,000 | 1,727,363 |
| Sinclair Television Group, Inc. 5.5% 3/1/30 (d) | | 660,000 | 380,457 |
| Sirius XM Radio, Inc.: | | | |
| 3.125% 9/1/26 (d) | | 167,000 | 149,506 |
| 4% 7/15/28 (d) | | 2,920,000 | 2,537,107 |
| 4.125% 7/1/30 (d) | | 1,360,000 | 1,110,514 |
| 5.5% 7/1/29 (d) | | 410,000 | 369,843 |
| TEGNA, Inc.: | | | |
| 4.625% 3/15/28 | | 1,100,000 | 970,750 |
| 5% 9/15/29 | | 425,000 | 366,665 |
| Univision Communications, Inc.: | | | |
| 4.5% 5/1/29 (d) | | 1,265,000 | 1,086,834 |
| 6.625% 6/1/27 (d) | | 890,000 | 860,229 |
| | | | 9,735,274 |
| Building Materials - 0.5% | | | |
| Advanced Drain Systems, Inc.: | | | |
| 5% 9/30/27 (d) | | 1,207,000 | 1,142,322 |
| 6.375% 6/15/30 (d) | | 300,000 | 296,781 |
| Builders FirstSource, Inc. 4.25% 2/1/32 (d) | | 1,270,000 | 1,105,089 |
| SRS Distribution, Inc.: | | | |
| 4.625% 7/1/28 (d) | | 780,000 | 696,365 |
| 6% 12/1/29 (d) | | 715,000 | 617,081 |
| | | | 3,857,638 |
| Cable/Satellite TV - 3.5% | | | |
| Block Communications, Inc. 4.875% 3/1/28 (d) | | 167,000 | 138,193 |
| CCO Holdings LLC/CCO Holdings Capital Corp.: | | | |
| 4.25% 2/1/31 (d) | | 2,925,000 | 2,366,236 |
| 4.25% 1/15/34 (d) | | 1,370,000 | 1,035,402 |
| 4.5% 8/15/30 (d) | | 1,750,000 | 1,457,209 |
| 4.5% 5/1/32 | | 2,885,000 | 2,303,548 |
| 4.5% 6/1/33 (d) | | 2,837,000 | 2,227,854 |
| 4.75% 2/1/32 (d) | | 1,975,000 | 1,610,573 |
| 5% 2/1/28 (d) | | 905,000 | 824,536 |
| 5.125% 5/1/27 (d) | | 2,334,000 | 2,173,526 |
| CSC Holdings LLC: | | | |
| 3.375% 2/15/31 (d) | | 2,500,000 | 1,692,226 |
| 4.125% 12/1/30 (d) | | 795,000 | 556,123 |
| 4.5% 11/15/31 (d) | | 345,000 | 240,540 |
| 4.625% 12/1/30 (d) | | 4,050,000 | 1,801,995 |
| 5.375% 2/1/28 (d) | | 1,930,000 | 1,550,834 |
| 5.75% 1/15/30 (d) | | 1,940,000 | 916,010 |
| DIRECTV Financing LLC / DIRECTV Financing Co-Obligor, Inc. 5.875% 8/15/27 (d) | | 527,000 | 477,270 |
| DISH DBS Corp.: | | | |
| 5.75% 12/1/28 (d) | | 1,760,000 | 1,309,059 |
| 5.875% 11/15/24 | | 167,000 | 146,068 |
| Dolya Holdco 18 DAC 5% 7/15/28 (d) | | 851,000 | 744,398 |
| Radiate Holdco LLC/Radiate Financial Service Ltd.: | | | |
| 4.5% 9/15/26 (d) | | 815,000 | 649,771 |
| 6.5% 9/15/28 (d) | | 900,000 | 525,209 |
| Telenet Finance Luxembourg Notes SARL 5.5% 3/1/28 (d) | | 1,000,000 | 917,000 |
| Ziggo BV 4.875% 1/15/30 (d) | | 990,000 | 821,630 |
| | | | 26,485,210 |
| Capital Goods - 1.0% | | | |
| Mueller Water Products, Inc. 4% 6/15/29 (d) | | 1,277,000 | 1,133,067 |
| Regal Rexnord Corp.: | | | |
| 6.05% 2/15/26 (d) | | 1,050,000 | 1,051,333 |
| 6.05% 4/15/28 (d) | | 705,000 | 699,859 |
| 6.3% 2/15/30 (d) | | 705,000 | 702,913 |
| Vertical Holdco GmbH 7.625% 7/15/28 (d) | | 935,000 | 848,561 |
| Vertical U.S. Newco, Inc. 5.25% 7/15/27 (d) | | 3,410,000 | 3,150,406 |
| | | | 7,586,139 |
| Chemicals - 3.6% | | | |
| CVR Partners LP 6.125% 6/15/28 (d) | | 1,029,000 | 895,028 |
| Element Solutions, Inc. 3.875% 9/1/28 (d) | | 645,000 | 562,683 |
| Kobe U.S. Midco 2, Inc. 9.25% 11/1/26 pay-in-kind (d)(e) | | 135,000 | 89,100 |
| Kronos Acquisition Holdings, Inc. / KIK Custom Products, Inc.: | | | |
| 5% 12/31/26 (d) | | 1,040,000 | 951,600 |
| 7% 12/31/27 (d) | | 260,000 | 230,160 |
| LSB Industries, Inc. 6.25% 10/15/28 (d) | | 620,000 | 553,630 |
| Methanex Corp.: | | | |
| 5.125% 10/15/27 | | 2,855,000 | 2,657,683 |
| 5.65% 12/1/44 | | 2,267,000 | 1,850,179 |
| NOVA Chemicals Corp.: | | | |
| 4.25% 5/15/29 (d) | | 1,135,000 | 926,208 |
| 4.875% 6/1/24 (d) | | 2,000,000 | 1,953,960 |
| 5% 5/1/25 (d) | | 530,000 | 507,184 |
| 5.25% 6/1/27 (d) | | 1,245,000 | 1,107,205 |
| Nufarm Australia Ltd. 5% 1/27/30 (d) | | 1,480,000 | 1,310,699 |
| Olin Corp. 5% 2/1/30 | | 690,000 | 637,629 |
| Olympus Water U.S. Holding Corp.: | | | |
| 4.25% 10/1/28 (d) | | 1,180,000 | 932,845 |
| 6.25% 10/1/29 (d) | | 1,250,000 | 904,127 |
| 9.75% 11/15/28 (d) | | 1,535,000 | 1,497,086 |
| SCIH Salt Holdings, Inc.: | | | |
| 4.875% 5/1/28 (d) | | 1,955,000 | 1,745,826 |
| 6.625% 5/1/29 (d) | | 690,000 | 578,113 |
| SCIL IV LLC / SCIL U.S.A. Holdings LLC 5.375% 11/1/26 (d) | | 905,000 | 824,916 |
| The Chemours Co. LLC: | | | |
| 4.625% 11/15/29 (d) | | 515,000 | 435,235 |
| 5.375% 5/15/27 | | 2,147,000 | 2,022,471 |
| 5.75% 11/15/28 (d) | | 1,745,000 | 1,603,463 |
| Tronox, Inc. 4.625% 3/15/29 (d) | | 365,000 | 303,327 |
| W.R. Grace Holding LLC: | | | |
| 5.625% 8/15/29 (d) | | 2,490,000 | 2,040,057 |
| 7.375% 3/1/31 (d) | | 295,000 | 289,094 |
| | | | 27,409,508 |
| Consumer Products - 0.8% | | | |
| Ferrellgas LP/Ferrellgas Finance Corp. 5.375% 4/1/26 (d) | | 167,000 | 155,326 |
| Mattel, Inc.: | | | |
| 3.375% 4/1/26 (d) | | 2,032,000 | 1,869,841 |
| 3.75% 4/1/29 (d) | | 2,010,000 | 1,768,461 |
| 5.45% 11/1/41 | | 290,000 | 240,418 |
| 5.875% 12/15/27 (d) | | 167,000 | 164,017 |
| Newell Brands, Inc.: | | | |
| 4.7% 4/1/26 | | 350,000 | 328,773 |
| 6% 4/1/46 (h) | | 290,000 | 229,430 |
| 6.375% 9/15/27 | | 350,000 | 335,163 |
| 6.625% 9/15/29 | | 380,000 | 364,283 |
| The Scotts Miracle-Gro Co.: | | | |
| 4% 4/1/31 | | 145,000 | 113,389 |
| 4.375% 2/1/32 | | 220,000 | 173,224 |
| | | | 5,742,325 |
| Containers - 1.6% | | | |
| ARD Finance SA 6.5% 6/30/27 pay-in-kind (d)(e) | | 1,190,000 | 964,636 |
| Ardagh Packaging Finance PLC/Ardagh MP Holdings U.S.A., Inc.: | | | |
| 5.25% 8/15/27 (d) | | 1,479,000 | 1,251,763 |
| 5.25% 8/15/27 (d) | | 1,740,000 | 1,472,662 |
| Ball Corp.: | | | |
| 2.875% 8/15/30 | | 365,000 | 302,409 |
| 4.875% 3/15/26 | | 1,060,000 | 1,031,075 |
| 6% 6/15/29 | | 440,000 | 436,700 |
| Berry Global, Inc. 4.875% 7/15/26 (d) | | 585,000 | 562,331 |
| BWAY Holding Co. 7.875% 8/15/26 (d) | | 1,095,000 | 1,087,892 |
| Graham Packaging Co., Inc. 7.125% 8/15/28 (d) | | 350,000 | 298,813 |
| Graphic Packaging International, Inc. 3.75% 2/1/30 (d) | | 500,000 | 431,342 |
| LABL, Inc.: | | | |
| 5.875% 11/1/28 (d) | | 205,000 | 186,443 |
| 6.75% 7/15/26 (d) | | 135,000 | 132,710 |
| 9.5% 11/1/28 (d) | | 135,000 | 137,347 |
| 10.5% 7/15/27 (d) | | 405,000 | 388,828 |
| Owens-Brockway Glass Container, Inc. 7.25% 5/15/31 (d) | | 345,000 | 349,313 |
| Sealed Air Corp. 5% 4/15/29 (d) | | 1,265,000 | 1,177,000 |
| Sealed Air Corp./Sealed Air Cor 6.125% 2/1/28 (d) | | 435,000 | 431,793 |
| Trivium Packaging Finance BV: | | | |
| 5.5% 8/15/26 (d) | | 1,165,000 | 1,118,576 |
| 8.5% 8/15/27 (d) | | 655,000 | 630,514 |
| | | | 12,392,147 |
| Diversified Financial Services - 3.5% | | | |
| Aercap Global Aviation Trust 6.5% 6/15/45 (d)(e) | | 685,000 | 662,106 |
| Coinbase Global, Inc. 3.375% 10/1/28 (d) | | 690,000 | 461,501 |
| Emerald Debt Merger Sub LLC 6.625% 12/15/30 (d) | | 2,975,000 | 2,948,969 |
| GGAM Finance Ltd.: | | | |
| 7.75% 5/15/26 (d) | | 690,000 | 692,588 |
| 8% 6/15/28 (d) | | 1,040,000 | 1,040,530 |
| Hightower Holding LLC 6.75% 4/15/29 (d) | | 1,110,000 | 960,062 |
| HTA Group Ltd. 7% 12/18/25 (d) | | 2,360,000 | 2,229,752 |
| Icahn Enterprises LP/Icahn Enterprises Finance Corp.: | | | |
| 4.375% 2/1/29 | | 2,755,000 | 2,164,604 |
| 5.25% 5/15/27 | | 500,000 | 431,250 |
| 6.25% 5/15/26 | | 4,517,000 | 4,111,007 |
| 6.375% 12/15/25 | | 810,000 | 753,555 |
| Jefferies Finance LLC/JFIN Co-Issuer Corp. 5% 8/15/28 (d) | | 372,000 | 304,971 |
| Ladder Capital Finance Holdings LLLP/Ladder Capital Finance Corp. 4.75% 6/15/29 (d) | | 820,000 | 667,346 |
| LPL Holdings, Inc. 4.375% 5/15/31 (d) | | 365,000 | 315,348 |
| MSCI, Inc.: | | | |
| 3.25% 8/15/33 (d) | | 925,000 | 744,957 |
| 3.625% 9/1/30 (d) | | 1,405,000 | 1,211,656 |
| OneMain Finance Corp.: | | | |
| 3.5% 1/15/27 | | 1,905,000 | 1,634,376 |
| 3.875% 9/15/28 | | 2,625,000 | 2,145,938 |
| 6.875% 3/15/25 | | 145,000 | 143,569 |
| 7.125% 3/15/26 | | 2,750,000 | 2,701,922 |
| | | | 26,326,007 |
| Diversified Media - 0.2% | | | |
| Advantage Sales & Marketing, Inc. 6.5% 11/15/28 (d) | | 1,755,000 | 1,484,081 |
| Cmg Media Corp. 8.875% 12/15/27 (d) | | 120,000 | 84,102 |
| | | | 1,568,183 |
| Electric Utilities No Longer Use - 0.1% | | | |
| FirstEnergy Corp.: | | | |
| 1.6% 1/15/26 | | 167,000 | 151,030 |
| 2.05% 3/1/25 | | 167,000 | 156,282 |
| 7.375% 11/15/31 | | 167,000 | 190,470 |
| | | | 497,782 |
| Energy - 12.2% | | | |
| Altus Midstream LP 5.875% 6/15/30 (d) | | 890,000 | 845,936 |
| Antero Midstream Partners LP/Antero Midstream Finance Corp.: | | | |
| 5.75% 3/1/27 (d) | | 532,000 | 513,080 |
| 7.875% 5/15/26 (d) | | 532,000 | 539,544 |
| Antero Resources Corp. 7.625% 2/1/29 (d) | | 167,000 | 169,441 |
| Apache Corp.: | | | |
| 4.25% 1/15/30 | | 612,000 | 545,108 |
| 5.1% 9/1/40 | | 655,000 | 532,188 |
| Atlantica Sustainable Infrastructure PLC 4.125% 6/15/28 (d) | | 1,480,000 | 1,318,546 |
| California Resources Corp. 7.125% 2/1/26 (d) | | 495,000 | 497,475 |
| Calumet Specialty Products Partners LP/Calumet Finance Corp. 9.75% 7/15/28 (d) | | 590,000 | 580,413 |
| Centennial Resource Production LLC: | | | |
| 5.875% 7/1/29 (d) | | 1,010,000 | 949,400 |
| 7.75% 2/15/26 (d) | | 540,000 | 542,297 |
| CGG SA 8.75% 4/1/27 (d) | | 855,000 | 715,399 |
| Cheniere Energy Partners LP: | | | |
| 3.25% 1/31/32 | | 1,410,000 | 1,159,936 |
| 4% 3/1/31 | | 730,000 | 642,757 |
| Cheniere Energy, Inc. 4.625% 10/15/28 | | 167,000 | 155,942 |
| Citgo Petroleum Corp. 6.375% 6/15/26 (d) | | 1,535,000 | 1,477,438 |
| CNX Resources Corp.: | | | |
| 7.25% 3/14/27 (d) | | 268,000 | 265,210 |
| 7.375% 1/15/31 (d) | | 385,000 | 374,582 |
| Comstock Resources, Inc.: | | | |
| 5.875% 1/15/30 (d) | | 880,000 | 763,990 |
| 6.75% 3/1/29 (d) | | 1,180,000 | 1,079,637 |
| Crestwood Midstream Partners LP/Crestwood Midstream Finance Corp.: | | | |
| 5.625% 5/1/27 (d) | | 4,198,000 | 3,979,704 |
| 5.75% 4/1/25 | | 2,497,000 | 2,453,319 |
| 7.375% 2/1/31 (d) | | 725,000 | 714,597 |
| CrownRock LP/CrownRock Finance, Inc.: | | | |
| 5% 5/1/29 (d) | | 920,000 | 861,350 |
| 5.625% 10/15/25 (d) | | 130,000 | 128,076 |
| CVR Energy, Inc.: | | | |
| 5.25% 2/15/25 (d) | | 2,321,000 | 2,237,769 |
| 5.75% 2/15/28 (d) | | 1,334,000 | 1,173,920 |
| Delek Logistics Partners LP 7.125% 6/1/28 (d) | | 2,255,000 | 2,089,253 |
| DT Midstream, Inc.: | | | |
| 4.125% 6/15/29 (d) | | 935,000 | 820,533 |
| 4.375% 6/15/31 (d) | | 365,000 | 314,357 |
| Endeavor Energy Resources LP/EER Finance, Inc. 5.75% 1/30/28 (d) | | 600,000 | 586,908 |
| EnLink Midstream LLC: | | | |
| 5.625% 1/15/28 (d) | | 395,000 | 382,235 |
| 6.5% 9/1/30 (d) | | 660,000 | 659,196 |
| EnLink Midstream Partners LP 4.85% 7/15/26 | | 650,000 | 627,250 |
| EQM Midstream Partners LP: | | | |
| 4% 8/1/24 | | 670,000 | 655,420 |
| 4.75% 1/15/31 (d) | | 300,000 | 262,795 |
| 6% 7/1/25 (d) | | 85,000 | 84,061 |
| 6.5% 7/1/27 (d) | | 415,000 | 409,303 |
| 6.5% 7/15/48 | | 150,000 | 135,653 |
| Global Partners LP/GLP Finance Corp. 6.875% 1/15/29 | | 1,220,000 | 1,133,075 |
| Harvest Midstream I LP 7.5% 9/1/28 (d) | | 645,000 | 639,479 |
| Hess Midstream Partners LP: | | | |
| 4.25% 2/15/30 (d) | | 635,000 | 554,038 |
| 5.125% 6/15/28 (d) | | 2,465,000 | 2,306,971 |
| 5.5% 10/15/30 (d) | | 365,000 | 337,623 |
| 5.625% 2/15/26 (d) | | 1,710,000 | 1,682,213 |
| Holly Energy Partners LP/Holly Energy Finance Corp. 5% 2/1/28 (d) | | 1,350,000 | 1,245,320 |
| Howard Midstream Energy Partners LLC 8.875% 7/15/28 (d) | | 745,000 | 748,725 |
| Jonah Energy Parent LLC 12% 11/5/25 (b)(c) | | 1,295,305 | 1,308,258 |
| MEG Energy Corp. 7.125% 2/1/27 (d) | | 167,000 | 169,686 |
| Mesquite Energy, Inc. 7.25% (c)(d)(g) | | 5,722,000 | 1 |
| New Fortress Energy, Inc. 6.5% 9/30/26 (d) | | 3,695,000 | 3,305,903 |
| NGL Energy Operating LLC/NGL Energy Finance Corp. 7.5% 2/1/26 (d) | | 1,030,000 | 1,014,418 |
| Northern Oil & Gas, Inc.: | | | |
| 8.125% 3/1/28 (d) | | 1,085,000 | 1,063,300 |
| 8.75% 6/15/31 (d) | | 345,000 | 338,963 |
| Occidental Petroleum Corp.: | | | |
| 4.2% 3/15/48 | | 360,000 | 266,670 |
| 4.4% 4/15/46 | | 1,100,000 | 849,494 |
| 4.4% 8/15/49 | | 510,000 | 374,590 |
| 4.5% 7/15/44 | | 900,000 | 686,250 |
| 5.5% 12/1/25 | | 1,310,000 | 1,293,324 |
| 5.55% 3/15/26 | | 377,000 | 372,193 |
| 5.875% 9/1/25 | | 2,955,000 | 2,934,896 |
| 6.125% 1/1/31 | | 1,090,000 | 1,106,786 |
| 6.45% 9/15/36 | | 840,000 | 862,092 |
| 6.625% 9/1/30 | | 1,284,000 | 1,334,204 |
| 7.5% 5/1/31 | | 1,440,000 | 1,572,250 |
| 7.875% 9/15/31 | | 375,000 | 418,051 |
| 7.95% 6/15/39 | | 185,000 | 209,600 |
| 8.5% 7/15/27 | | 1,100,000 | 1,188,231 |
| 8.875% 7/15/30 | | 1,270,000 | 1,459,713 |
| Range Resources Corp.: | | | |
| 4.875% 5/15/25 | | 167,000 | 163,670 |
| 8.25% 1/15/29 | | 167,000 | 173,880 |
| Rockies Express Pipeline LLC: | | | |
| 4.8% 5/15/30 (d) | | 250,000 | 218,495 |
| 4.95% 7/15/29 (d) | | 1,010,000 | 924,150 |
| 6.875% 4/15/40 (d) | | 385,000 | 347,466 |
| SM Energy Co. 5.625% 6/1/25 | | 690,000 | 674,261 |
| Southwestern Energy Co. 4.75% 2/1/32 | | 925,000 | 815,236 |
| Suburban Propane Partners LP/Suburban Energy Finance Corp. 5.875% 3/1/27 | | 302,000 | 291,785 |
| Sunnova Energy Corp. 5.875% 9/1/26 (d) | | 550,000 | 502,699 |
| Sunoco LP/Sunoco Finance Corp.: | | | |
| 4.5% 5/15/29 | | 620,000 | 550,058 |
| 5.875% 3/15/28 | | 500,000 | 480,813 |
| Superior Plus LP / Superior General Partner, Inc. 4.5% 3/15/29 (d) | | 670,000 | 587,335 |
| Tallgrass Energy Partners LP / Tallgrass Energy Finance Corp.: | | | |
| 5.5% 1/15/28 (d) | | 2,252,000 | 2,058,289 |
| 6% 3/1/27 (d) | | 2,995,000 | 2,810,535 |
| 6% 12/31/30 (d) | | 3,930,000 | 3,462,330 |
| 6% 9/1/31 (d) | | 2,100,000 | 1,806,910 |
| 7.5% 10/1/25 (d) | | 2,794,000 | 2,788,649 |
| Targa Resources Partners LP/Targa Resources Partners Finance Corp. 4.875% 2/1/31 | | 730,000 | 674,622 |
| Teine Energy Ltd. 6.875% 4/15/29 (d) | | 167,000 | 152,461 |
| Transocean Poseidon Ltd. 6.875% 2/1/27 (d) | | 483,438 | 478,603 |
| Transocean, Inc.: | | | |
| 7.5% 1/15/26 (d) | | 525,000 | 498,750 |
| 8% 2/1/27 (d) | | 1,275,000 | 1,155,813 |
| 8.75% 2/15/30 (d) | | 940,000 | 954,100 |
| Valaris Ltd. 8.375% 4/30/30 (d) | | 950,000 | 953,192 |
| Venture Global Calcasieu Pass LLC: | | | |
| 3.875% 8/15/29 (d) | | 2,305,000 | 2,013,626 |
| 4.125% 8/15/31 (d) | | 1,085,000 | 933,063 |
| 6.25% 1/15/30 (d) | | 935,000 | 927,461 |
| Western Gas Partners LP: | | | |
| 3.35% 2/1/25 | | 1,427,000 | 1,364,041 |
| 3.95% 6/1/25 | | 365,000 | 350,606 |
| 5.3% 3/1/48 | | 365,000 | 304,200 |
| 5.5% 8/15/48 | | 220,000 | 183,978 |
| 5.5% 2/1/50 | | 725,000 | 593,826 |
| | | | 93,215,238 |
| Environmental - 1.0% | | | |
| Clean Harbors, Inc. 6.375% 2/1/31 (d) | | 340,000 | 342,128 |
| Covanta Holding Corp. 4.875% 12/1/29 (d) | | 985,000 | 852,025 |
| Darling Ingredients, Inc. 6% 6/15/30 (d) | | 510,000 | 498,094 |
| GFL Environmental, Inc.: | | | |
| 3.75% 8/1/25 (d) | | 705,000 | 670,715 |
| 5.125% 12/15/26 (d) | | 705,000 | 680,175 |
| Madison IAQ LLC: | | | |
| 4.125% 6/30/28 (d) | | 1,515,000 | 1,333,647 |
| 5.875% 6/30/29 (d) | | 1,535,000 | 1,243,210 |
| Stericycle, Inc.: | | | |
| 3.875% 1/15/29 (d) | | 1,970,000 | 1,749,163 |
| 5.375% 7/15/24 (d) | | 325,000 | 320,800 |
| | | | 7,689,957 |
| Food & Drug Retail - 0.9% | | | |
| Albertsons Companies LLC/Safeway, Inc./New Albertson's, Inc./Albertson's LLC: | | | |
| 3.25% 3/15/26 (d) | | 195,000 | 180,096 |
| 3.5% 3/15/29 (d) | | 1,662,000 | 1,438,694 |
| 4.875% 2/15/30 (d) | | 1,200,000 | 1,107,864 |
| BellRing Brands, Inc. 7% 3/15/30 (d) | | 290,000 | 291,813 |
| Emergent BioSolutions, Inc. 3.875% 8/15/28 (d) | | 2,490,000 | 1,448,196 |
| Murphy Oil U.S.A., Inc. 3.75% 2/15/31 (d) | | 460,000 | 385,572 |
| Parkland Corp. 4.625% 5/1/30 (d) | | 2,140,000 | 1,855,498 |
| SEG Holding LLC/SEG Finance Corp. 5.625% 10/15/28 (d) | | 242,000 | 228,784 |
| | | | 6,936,517 |
| Food/Beverage/Tobacco - 2.0% | | | |
| C&S Group Enterprises LLC 5% 12/15/28 (d) | | 1,190,000 | 916,300 |
| Chobani LLC/Finance Corp., Inc. 4.625% 11/15/28 (d) | | 290,000 | 263,900 |
| Lamb Weston Holdings, Inc.: | | | |
| 4.125% 1/31/30 (d) | | 2,730,000 | 2,439,840 |
| 4.375% 1/31/32 (d) | | 365,000 | 326,046 |
| Performance Food Group, Inc.: | | | |
| 4.25% 8/1/29 (d) | | 1,650,000 | 1,469,012 |
| 5.5% 10/15/27 (d) | | 125,000 | 120,442 |
| 6.875% 5/1/25 (d) | | 167,000 | 167,140 |
| Pilgrim's Pride Corp.: | | | |
| 3.5% 3/1/32 | | 365,000 | 288,569 |
| 4.25% 4/15/31 | | 457,000 | 391,900 |
| 5.875% 9/30/27 (d) | | 167,000 | 164,996 |
| Post Holdings, Inc.: | | | |
| 4.625% 4/15/30 (d) | | 1,125,000 | 985,904 |
| 5.75% 3/1/27 (d) | | 334,000 | 326,025 |
| Primo Water Holdings, Inc. 4.375% 4/30/29 (d) | | 1,815,000 | 1,555,183 |
| TreeHouse Foods, Inc. 4% 9/1/28 | | 480,000 | 410,266 |
| Triton Water Holdings, Inc. 6.25% 4/1/29 (d) | | 4,100,000 | 3,518,702 |
| U.S. Foods, Inc.: | | | |
| 4.625% 6/1/30 (d) | | 475,000 | 425,714 |
| 4.75% 2/15/29 (d) | | 1,285,000 | 1,176,481 |
| United Natural Foods, Inc. 6.75% 10/15/28 (d) | | 145,000 | 120,188 |
| | | | 15,066,608 |
| Gaming - 2.0% | | | |
| Affinity Gaming LLC 6.875% 12/15/27 (d) | | 2,425,000 | 2,133,993 |
| Caesars Entertainment, Inc.: | | | |
| 6.25% 7/1/25 (d) | | 1,210,000 | 1,204,397 |
| 7% 2/15/30 (d) | | 875,000 | 878,710 |
| 8.125% 7/1/27 (d) | | 1,700,000 | 1,739,897 |
| Caesars Resort Collection LLC 5.75% 7/1/25 (d) | | 1,485,000 | 1,502,559 |
| Carnival Corp. 10.5% 6/1/30 (d) | | 1,230,000 | 1,304,879 |
| Fertitta Entertainment LLC / Fertitta Entertainment Finance Co., Inc.: | | | |
| 4.625% 1/15/29 (d) | | 1,847,000 | 1,620,743 |
| 6.75% 1/15/30 (d) | | 1,365,000 | 1,161,666 |
| Golden Entertainment, Inc. 7.625% 4/15/26 (d) | | 945,000 | 949,035 |
| Jacobs Entertainment, Inc. 6.75% 2/15/29 (d) | | 555,000 | 496,753 |
| Las Vegas Sands Corp.: | | | |
| 2.9% 6/25/25 | | 167,000 | 156,917 |
| 3.5% 8/18/26 | | 167,000 | 155,548 |
| Station Casinos LLC 4.5% 2/15/28 (d) | | 750,000 | 673,178 |
| Transocean, Inc. 7.25% 11/1/25 (d) | | 345,000 | 331,200 |
| VICI Properties LP / VICI Note Co. 4.125% 8/15/30 (d) | | 730,000 | 642,714 |
| Wynn Resorts Finance LLC / Wynn Resorts Capital Corp. 7.125% 2/15/31 (d) | | 365,000 | 362,789 |
| | | | 15,314,978 |
| Healthcare - 6.0% | | | |
| 1375209 BC Ltd. 9% 1/30/28 (d) | | 755,000 | 756,888 |
| 180 Medical, Inc. 3.875% 10/15/29 (d) | | 650,000 | 566,874 |
| Amgen, Inc. 5.6% 3/2/43 | | 805,000 | 807,436 |
| AMN Healthcare 4% 4/15/29 (d) | | 420,000 | 366,265 |
| Avantor Funding, Inc.: | | | |
| 3.875% 11/1/29 (d) | | 830,000 | 726,689 |
| 4.625% 7/15/28 (d) | | 548,000 | 507,954 |
| Cano Health, Inc. 6.25% 10/1/28 (d) | | 335,000 | 209,375 |
| Catalent Pharma Solutions 3.5% 4/1/30 (d) | | 830,000 | 672,300 |
| Centene Corp.: | | | |
| 2.5% 3/1/31 | | 985,000 | 785,508 |
| 3% 10/15/30 | | 950,000 | 791,632 |
| Charles River Laboratories International, Inc.: | | | |
| 3.75% 3/15/29 (d) | | 660,000 | 580,822 |
| 4% 3/15/31 (d) | | 822,000 | 713,954 |
| 4.25% 5/1/28 (d) | | 290,000 | 265,516 |
| Community Health Systems, Inc.: | | | |
| 4.75% 2/15/31 (d) | | 2,405,000 | 1,817,660 |
| 5.25% 5/15/30 (d) | | 4,605,000 | 3,627,484 |
| 5.625% 3/15/27 (d) | | 3,150,000 | 2,775,899 |
| 6% 1/15/29 (d) | | 930,000 | 782,363 |
| 6.125% 4/1/30 (d) | | 1,365,000 | 813,158 |
| 6.875% 4/15/29 (d) | | 920,000 | 574,558 |
| 8% 3/15/26 (d) | | 745,000 | 725,702 |
| 8% 12/15/27 (d) | | 167,000 | 161,664 |
| CTR Partnership LP/CareTrust Capital Corp. 3.875% 6/30/28 (d) | | 1,200,000 | 1,032,000 |
| DaVita HealthCare Partners, Inc.: | | | |
| 3.75% 2/15/31 (d) | | 510,000 | 407,761 |
| 4.625% 6/1/30 (d) | | 2,795,000 | 2,399,446 |
| Embecta Corp. 5% 2/15/30 (d) | | 620,000 | 514,774 |
| Grifols Escrow Issuer SA 4.75% 10/15/28 (d) | | 935,000 | 811,468 |
| HCA Holdings, Inc. 5.5% 6/15/47 | | 725,000 | 682,870 |
| HealthEquity, Inc. 4.5% 10/1/29 (d) | | 1,275,000 | 1,123,698 |
| Hologic, Inc. 3.25% 2/15/29 (d) | | 500,000 | 437,452 |
| Humana, Inc. 5.875% 3/1/33 | | 730,000 | 758,618 |
| IQVIA, Inc. 6.5% 5/15/30 (d) | | 690,000 | 696,813 |
| Jazz Securities DAC 4.375% 1/15/29 (d) | | 1,250,000 | 1,115,237 |
| ModivCare Escrow Issuer, Inc. 5% 10/1/29 (d) | | 450,000 | 333,000 |
| Molina Healthcare, Inc.: | | | |
| 3.875% 11/15/30 (d) | | 855,000 | 734,581 |
| 3.875% 5/15/32 (d) | | 390,000 | 326,956 |
| Mozart Borrower LP 3.875% 4/1/29 (d) | | 365,000 | 317,208 |
| Option Care Health, Inc. 4.375% 10/31/29 (d) | | 205,000 | 180,432 |
| Organon & Co. / Organon Foreign Debt Co-Issuer BV: | | | |
| 4.125% 4/30/28 (d) | | 2,265,000 | 2,010,257 |
| 5.125% 4/30/31 (d) | | 730,000 | 602,268 |
| Owens & Minor, Inc. 4.5% 3/31/29 (d) | | 585,000 | 485,778 |
| Pediatrix Medical Group, Inc. 5.375% 2/15/30 (d) | | 1,670,000 | 1,536,400 |
| RP Escrow Issuer LLC 5.25% 12/15/25 (d) | | 995,000 | 734,012 |
| Teleflex, Inc. 4.25% 6/1/28 (d) | | 535,000 | 488,853 |
| Tenet Healthcare Corp.: | | | |
| 4.25% 6/1/29 | | 1,545,000 | 1,395,795 |
| 4.375% 1/15/30 | | 1,660,000 | 1,497,976 |
| 4.625% 6/15/28 | | 750,000 | 700,490 |
| 6.125% 10/1/28 | | 1,240,000 | 1,193,748 |
| 6.125% 6/15/30 | | 1,640,000 | 1,615,892 |
| 6.25% 2/1/27 | | 1,195,000 | 1,182,773 |
| 6.75% 5/15/31 (d) | | 240,000 | 240,585 |
| Teva Pharmaceutical Finance Netherlands III BV: | | | |
| 3.15% 10/1/26 | | 820,000 | 733,520 |
| 7.875% 9/15/29 | | 210,000 | 216,426 |
| 8.125% 9/15/31 | | 210,000 | 220,074 |
| | | | 45,756,862 |
| Homebuilders/Real Estate - 3.9% | | | |
| Ashton Woods U.S.A. LLC/Ashton Woods Finance Co. 4.625% 8/1/29 (d) | | 565,000 | 481,510 |
| Howard Hughes Corp.: | | | |
| 4.125% 2/1/29 (d) | | 555,000 | 459,118 |
| 4.375% 2/1/31 (d) | | 455,000 | 363,108 |
| Kennedy-Wilson, Inc. 4.75% 2/1/30 | | 975,000 | 735,311 |
| MPT Operating Partnership LP/MPT Finance Corp.: | | | |
| 3.5% 3/15/31 | | 2,877,000 | 1,982,321 |
| 4.625% 8/1/29 | | 1,780,000 | 1,345,609 |
| 5% 10/15/27 | | 5,847,000 | 4,919,197 |
| 5.25% 8/1/26 | | 682,000 | 606,340 |
| Railworks Holdings LP 8.25% 11/15/28 (d) | | 1,160,000 | 1,078,270 |
| Realogy Group LLC/Realogy Co-Issuer Corp. 5.75% 1/15/29 (d) | | 400,000 | 300,000 |
| Realogy Group LLC/Realogy Co.-Issuer Corp. 5.25% 4/15/30 (d) | | 315,000 | 223,866 |
| Taylor Morrison Communities, Inc./Monarch Communities, Inc.: | | | |
| 5.125% 8/1/30 (d) | | 352,000 | 325,002 |
| 5.625% 3/1/24 (d) | | 402,000 | 398,985 |
| 5.875% 6/15/27 (d) | | 167,000 | 164,026 |
| TopBuild Corp. 4.125% 2/15/32 (d) | | 800,000 | 681,531 |
| TRI Pointe Group, Inc./TRI Pointe Holdings, Inc. 5.875% 6/15/24 | | 15,000 | 14,888 |
| TRI Pointe Homes, Inc. 5.7% 6/15/28 | | 140,000 | 135,240 |
| Uniti Group LP / Uniti Group Finance, Inc.: | | | |
| 4.75% 4/15/28 (d) | | 5,020,000 | 4,166,104 |
| 6.5% 2/15/29 (d) | | 13,955,000 | 9,875,652 |
| 10.5% 2/15/28 (d) | | 1,455,000 | 1,443,453 |
| | | | 29,699,531 |
| Hotels - 0.7% | | | |
| Hilton Domestic Operating Co., Inc.: | | | |
| 3.625% 2/15/32 (d) | | 2,820,000 | 2,351,137 |
| 3.75% 5/1/29 (d) | | 295,000 | 261,846 |
| 4% 5/1/31 (d) | | 1,615,000 | 1,402,597 |
| Wyndham Hotels & Resorts, Inc. 4.375% 8/15/28 (d) | | 1,060,000 | 967,992 |
| | | | 4,983,572 |
| Insurance - 1.6% | | | |
| Acrisure LLC / Acrisure Finance, Inc.: | | | |
| 4.25% 2/15/29 (d) | | 290,000 | 250,327 |
| 7% 11/15/25 (d) | | 145,000 | 140,372 |
| Alliant Holdings Intermediate LLC: | | | |
| 4.25% 10/15/27 (d) | | 1,775,000 | 1,592,872 |
| 5.875% 11/1/29 (d) | | 840,000 | 730,733 |
| 6.75% 10/15/27 (d) | | 4,250,000 | 3,995,000 |
| 6.75% 4/15/28 (d) | | 365,000 | 361,985 |
| AmWINS Group, Inc. 4.875% 6/30/29 (d) | | 2,230,000 | 2,013,652 |
| AssuredPartners, Inc. 5.625% 1/15/29 (d) | | 795,000 | 688,103 |
| HUB International Ltd.: | | | |
| 7% 5/1/26 (d) | | 480,000 | 478,730 |
| 7.25% 6/15/30 (d) | | 2,210,000 | 2,282,046 |
| | | | 12,533,820 |
| Leisure - 2.3% | | | |
| Carnival Corp.: | | | |
| 5.75% 3/1/27 (d) | | 2,095,000 | 1,928,745 |
| 6% 5/1/29 (d) | | 1,310,000 | 1,169,570 |
| 6.65% 1/15/28 | | 175,000 | 159,675 |
| 7.625% 3/1/26 (d) | | 2,880,000 | 2,820,668 |
| 10.5% 2/1/26 (d) | | 167,000 | 175,558 |
| MajorDrive Holdings IV LLC 6.375% 6/1/29 (d) | | 965,000 | 766,229 |
| NCL Corp. Ltd.: | | | |
| 5.875% 3/15/26 (d) | | 525,000 | 491,171 |
| 7.75% 2/15/29 (d) | | 1,120,000 | 1,063,932 |
| NCL Finance Ltd. 6.125% 3/15/28 (d) | | 370,000 | 333,007 |
| Royal Caribbean Cruises Ltd.: | | | |
| 4.25% 7/1/26 (d) | | 2,390,000 | 2,193,819 |
| 5.375% 7/15/27 (d) | | 875,000 | 818,172 |
| 5.5% 8/31/26 (d) | | 2,375,000 | 2,251,766 |
| 5.5% 4/1/28 (d) | | 1,850,000 | 1,725,749 |
| 7.25% 1/15/30 (d) | | 365,000 | 369,688 |
| Viking Cruises Ltd. 9.125% 7/15/31 (d) | | 760,000 | 767,600 |
| Viking Ocean Cruises Ship VII Ltd. 5.625% 2/15/29 (d) | | 370,000 | 338,550 |
| Voc Escrow Ltd. 5% 2/15/28 (d) | | 510,000 | 467,925 |
| | | | 17,841,824 |
| Metals/Mining - 1.1% | | | |
| Cleveland-Cliffs, Inc. 4.875% 3/1/31 (d) | | 145,000 | 127,435 |
| Constellium NV 5.875% 2/15/26 (d) | | 334,000 | 327,226 |
| Eldorado Gold Corp. 6.25% 9/1/29 (d) | | 350,000 | 314,013 |
| ERO Copper Corp. 6.5% 2/15/30 (d) | | 2,015,000 | 1,733,384 |
| First Quantum Minerals Ltd.: | | | |
| 6.875% 10/15/27 (d) | | 2,238,000 | 2,170,569 |
| 8.625% 6/1/31 (d) | | 260,000 | 266,469 |
| FMG Resources Pty Ltd.: | | | |
| 4.375% 4/1/31 (d) | | 365,000 | 311,643 |
| 4.5% 9/15/27 (d) | | 422,000 | 392,987 |
| Howmet Aerospace, Inc. 5.95% 2/1/37 | | 290,000 | 295,233 |
| HudBay Minerals, Inc. 4.5% 4/1/26 (d) | | 500,000 | 465,570 |
| Mineral Resources Ltd. 8.5% 5/1/30 (d) | | 790,000 | 792,708 |
| Novelis Corp.: | | | |
| 3.25% 11/15/26 (d) | | 205,000 | 185,559 |
| 3.875% 8/15/31 (d) | | 340,000 | 279,688 |
| PMHC II, Inc. 9% 2/15/30 (d) | | 1,185,000 | 908,006 |
| | | | 8,570,490 |
| Paper - 0.9% | | | |
| Ardagh Metal Packaging Finance U.S.A. LLC/Ardagh Metal Packaging Finance PLC: | | | |
| 4% 9/1/29 (d) | | 680,000 | 538,541 |
| 6% 6/15/27 (d) | | 1,155,000 | 1,134,680 |
| Clydesdale Acquisition Holdings, Inc.: | | | |
| 6.625% 4/15/29 (d) | | 1,995,000 | 1,902,629 |
| 8.75% 4/15/30 (d) | | 1,445,000 | 1,275,536 |
| Glatfelter Corp. 4.75% 11/15/29 (d) | | 810,000 | 529,964 |
| Mercer International, Inc. 5.125% 2/1/29 | | 475,000 | 369,652 |
| SPA Holdings 3 OY 4.875% 2/4/28 (d) | | 1,270,000 | 1,051,746 |
| | | | 6,802,748 |
| Publishing/Printing - 0.1% | | | |
| News Corp. 5.125% 2/15/32 (d) | | 940,000 | 857,624 |
| Railroad - 0.1% | | | |
| First Student Bidco, Inc./First Transit Parent, Inc. 4% 7/31/29 (d) | | 680,000 | 576,205 |
| Restaurants - 0.6% | | | |
| 1011778 BC Unlimited Liability Co./New Red Finance, Inc.: | | | |
| 3.875% 1/15/28 (d) | | 580,000 | 530,221 |
| 4% 10/15/30 (d) | | 1,425,000 | 1,219,561 |
| 5.75% 4/15/25 (d) | | 297,000 | 296,552 |
| Garden SpinCo Corp. 8.625% 7/20/30 (d) | | 335,000 | 360,042 |
| Yum! Brands, Inc.: | | | |
| 3.625% 3/15/31 | | 365,000 | 315,300 |
| 4.625% 1/31/32 | | 1,985,000 | 1,793,041 |
| 4.75% 1/15/30 (d) | | 167,000 | 156,380 |
| 5.375% 4/1/32 | | 290,000 | 275,634 |
| | | | 4,946,731 |
| Services - 5.1% | | | |
| ADT Corp. 4.125% 8/1/29 (d) | | 895,000 | 773,056 |
| AECOM 5.125% 3/15/27 | | 487,000 | 471,207 |
| Allied Universal Holdco LLC / Allied Universal Finance Corp.: | | | |
| 6% 6/1/29 (d) | | 1,265,000 | 933,450 |
| 9.75% 7/15/27 (d) | | 915,000 | 808,817 |
| APX Group, Inc.: | | | |
| 5.75% 7/15/29 (d) | | 690,000 | 598,853 |
| 6.75% 2/15/27 (d) | | 837,000 | 820,243 |
| Aramark Services, Inc. 6.375% 5/1/25 (d) | | 1,615,000 | 1,613,510 |
| ASGN, Inc. 4.625% 5/15/28 (d) | | 635,000 | 574,472 |
| Booz Allen Hamilton, Inc. 3.875% 9/1/28 (d) | | 2,678,000 | 2,422,145 |
| Brand Energy & Infrastructure Services, Inc. 8.5% 7/15/25 (d) | | 5,130,000 | 4,961,609 |
| CoreCivic, Inc.: | | | |
| 4.75% 10/15/27 | | 1,240,000 | 1,062,020 |
| 8.25% 4/15/26 | | 1,870,000 | 1,887,017 |
| CoreLogic, Inc. 4.5% 5/1/28 (d) | | 955,000 | 769,969 |
| Fair Isaac Corp.: | | | |
| 4% 6/15/28 (d) | | 1,322,000 | 1,212,811 |
| 5.25% 5/15/26 (d) | | 167,000 | 162,942 |
| Gartner, Inc.: | | | |
| 3.625% 6/15/29 (d) | | 200,000 | 176,065 |
| 3.75% 10/1/30 (d) | | 287,000 | 249,953 |
| GEMS MENASA Cayman Ltd. 7.125% 7/31/26 (d) | | 3,535,000 | 3,422,658 |
| Iron Mountain, Inc. 4.5% 2/15/31 (d) | | 365,000 | 313,618 |
| Korn Ferry 4.625% 12/15/27 (d) | | 337,000 | 316,658 |
| Legends Hospitality Holding Co. LLC/Legends Hospitality Co-Issuer, Inc. 5% 2/1/26 (d) | | 965,000 | 868,500 |
| Life Time, Inc. 8% 4/15/26 (d) | | 1,030,000 | 1,017,002 |
| Neptune BidCo U.S., Inc. 9.29% 4/15/29 (d) | | 1,410,000 | 1,294,397 |
| PowerTeam Services LLC 9.033% 12/4/25 (d) | | 490,000 | 428,750 |
| Prime Securities Services Borrower LLC/Prime Finance, Inc. 5.75% 4/15/26 (d) | | 705,000 | 692,047 |
| Service Corp. International: | | | |
| 4% 5/15/31 | | 582,000 | 495,852 |
| 4.625% 12/15/27 | | 167,000 | 158,233 |
| 5.125% 6/1/29 | | 365,000 | 343,910 |
| Sotheby's 7.375% 10/15/27 (d) | | 810,000 | 728,508 |
| The GEO Group, Inc.: | | | |
| 9.5% 12/31/28 (d) | | 1,315,000 | 1,282,099 |
| 10.5% 6/30/28 | | 220,000 | 220,549 |
| TriNet Group, Inc. 3.5% 3/1/29 (d) | | 1,930,000 | 1,678,118 |
| Uber Technologies, Inc. 4.5% 8/15/29 (d) | | 4,462,000 | 4,106,816 |
| United Rentals North America, Inc. 6% 12/15/29 (d) | | 365,000 | 364,112 |
| WASH Multifamily Acquisition, Inc. 5.75% 4/15/26 (d) | | 2,028,000 | 1,893,286 |
| | | | 39,123,252 |
| Steel - 0.3% | | | |
| Commercial Metals Co.: | | | |
| 3.875% 2/15/31 | | 440,000 | 376,974 |
| 4.125% 1/15/30 | | 940,000 | 836,507 |
| Roller Bearing Co. of America, Inc. 4.375% 10/15/29 (d) | | 912,000 | 817,068 |
| | | | 2,030,549 |
| Super Retail - 2.0% | | | |
| Bath & Body Works, Inc. 6.694% 1/15/27 | | 375,000 | 376,993 |
| Carvana Co.: | | | |
| 4.875% 9/1/29 (d) | | 2,340,000 | 1,327,093 |
| 5.5% 4/15/27 (d) | | 1,245,000 | 833,302 |
| 5.875% 10/1/28 (d) | | 610,000 | 353,802 |
| 10.25% 5/1/30 (d) | | 170,000 | 133,913 |
| EG Global Finance PLC: | | | |
| 6.75% 2/7/25 (d) | | 2,170,000 | 2,107,613 |
| 8.5% 10/30/25 (d) | | 3,690,000 | 3,580,284 |
| Hanesbrands, Inc. 4.875% 5/15/26 (d) | | 167,000 | 155,901 |
| LBM Acquisition LLC 6.25% 1/15/29 (d) | | 1,295,000 | 1,071,289 |
| Levi Strauss & Co. 3.5% 3/1/31 (d) | | 410,000 | 339,275 |
| Michaels Companies, Inc.: | | | |
| 5.25% 5/1/28 (d) | | 810,000 | 654,431 |
| 7.875% 5/1/29 (d) | | 620,000 | 417,750 |
| Nordstrom, Inc.: | | | |
| 4.25% 8/1/31 | | 950,000 | 740,525 |
| 4.375% 4/1/30 | | 635,000 | 524,831 |
| Sally Holdings LLC 5.625% 12/1/25 | | 775,000 | 764,344 |
| The William Carter Co. 5.625% 3/15/27 (d) | | 167,000 | 162,045 |
| Under Armour, Inc. 3.25% 6/15/26 | | 334,000 | 306,912 |
| Wolverine World Wide, Inc. 4% 8/15/29 (d) | | 1,855,000 | 1,477,044 |
| | | | 15,327,347 |
| Technology - 6.6% | | | |
| Acuris Finance U.S. 5% 5/1/28 (d) | | 3,345,000 | 2,588,983 |
| Athenahealth Group, Inc. 6.5% 2/15/30 (d) | | 450,000 | 378,738 |
| Black Knight InfoServ LLC 3.625% 9/1/28 (d) | | 2,525,000 | 2,259,875 |
| Block, Inc.: | | | |
| 2.75% 6/1/26 | | 532,000 | 484,382 |
| 3.5% 6/1/31 | | 1,652,000 | 1,368,223 |
| Broadcom, Inc.: | | | |
| 2.45% 2/15/31 (d) | | 1,325,000 | 1,077,624 |
| 2.6% 2/15/33 (d) | | 1,015,000 | 793,216 |
| Clarivate Science Holdings Corp.: | | | |
| 3.875% 7/1/28 (d) | | 400,000 | 354,578 |
| 4.875% 7/1/29 (d) | | 405,000 | 359,278 |
| Cloud Software Group, Inc.: | | | |
| 6.5% 3/31/29 (d) | | 825,000 | 734,564 |
| 9% 9/30/29 (d) | | 3,160,000 | 2,760,053 |
| Coherent Corp. 5% 12/15/29 (d) | | 1,990,000 | 1,796,194 |
| CommScope, Inc.: | | | |
| 4.75% 9/1/29 (d) | | 825,000 | 650,431 |
| 6% 3/1/26 (d) | | 1,015,000 | 945,953 |
| Elastic NV 4.125% 7/15/29 (d) | | 1,195,000 | 1,030,896 |
| Entegris Escrow Corp.: | | | |
| 4.75% 4/15/29 (d) | | 1,705,000 | 1,582,796 |
| 5.95% 6/15/30 (d) | | 2,980,000 | 2,856,724 |
| Entegris, Inc. 3.625% 5/1/29 (d) | | 630,000 | 542,921 |
| Gartner, Inc. 4.5% 7/1/28 (d) | | 1,470,000 | 1,373,290 |
| Gen Digital, Inc.: | | | |
| 5% 4/15/25 (d) | | 685,000 | 670,859 |
| 7.125% 9/30/30 (d) | | 340,000 | 340,569 |
| Go Daddy Operating Co. LLC / GD Finance Co., Inc.: | | | |
| 3.5% 3/1/29 (d) | | 1,232,000 | 1,055,630 |
| 5.25% 12/1/27 (d) | | 322,000 | 305,900 |
| GrafTech Global Enterprises, Inc. 9.875% 12/15/28 (d) | | 675,000 | 669,938 |
| ION Trading Technologies Ltd. 5.75% 5/15/28 (d) | | 2,823,000 | 2,436,842 |
| Match Group Holdings II LLC: | | | |
| 3.625% 10/1/31 (d) | | 220,000 | 180,827 |
| 4.125% 8/1/30 (d) | | 847,000 | 725,456 |
| 5% 12/15/27 (d) | | 167,000 | 154,878 |
| MicroStrategy, Inc. 6.125% 6/15/28 (d) | | 1,910,000 | 1,712,496 |
| ON Semiconductor Corp. 3.875% 9/1/28 (d) | | 1,282,000 | 1,166,748 |
| Open Text Corp. 3.875% 12/1/29 (d) | | 1,020,000 | 852,580 |
| Open Text Holdings, Inc.: | | | |
| 4.125% 2/15/30 (d) | | 1,465,000 | 1,240,568 |
| 4.125% 12/1/31 (d) | | 1,110,000 | 909,886 |
| Rackspace Hosting, Inc.: | | | |
| 3.5% 2/15/28 (d) | | 1,695,000 | 762,797 |
| 5.375% 12/1/28 (d) | | 6,912,000 | 2,145,745 |
| Roblox Corp. 3.875% 5/1/30 (d) | | 1,955,000 | 1,648,124 |
| Seagate HDD Cayman: | | | |
| 5.75% 12/1/34 | | 755,000 | 669,648 |
| 8.25% 12/15/29 (d) | | 345,000 | 360,342 |
| 8.5% 7/15/31 (d) | | 415,000 | 435,206 |
| Sensata Technologies BV: | | | |
| 4% 4/15/29 (d) | | 760,000 | 676,643 |
| 5% 10/1/25 (d) | | 145,000 | 141,959 |
| Sensata Technologies, Inc. 3.75% 2/15/31 (d) | | 365,000 | 312,254 |
| SS&C Technologies, Inc. 5.5% 9/30/27 (d) | | 270,000 | 258,479 |
| TTM Technologies, Inc. 4% 3/1/29 (d) | | 3,020,000 | 2,566,911 |
| Uber Technologies, Inc.: | | | |
| 7.5% 5/15/25 (d) | | 1,835,000 | 1,856,946 |
| 8% 11/1/26 (d) | | 2,220,000 | 2,262,429 |
| | | | 50,459,379 |
| Telecommunications - 5.9% | | | |
| Altice Financing SA: | | | |
| 5% 1/15/28 (d) | | 685,000 | 547,427 |
| 5.75% 8/15/29 (d) | | 4,565,000 | 3,536,595 |
| Altice France Holding SA 6% 2/15/28 (d) | | 1,740,000 | 839,550 |
| Altice France SA: | | | |
| 5.125% 1/15/29 (d) | | 2,490,000 | 1,774,970 |
| 5.5% 1/15/28 (d) | | 1,615,000 | 1,219,775 |
| 5.5% 10/15/29 (d) | | 15,000 | 10,727 |
| C&W Senior Financing Designated Activity Co. 6.875% 9/15/27 (d) | | 4,885,000 | 4,237,738 |
| Cablevision Lightpath LLC: | | | |
| 3.875% 9/15/27 (d) | | 455,000 | 381,063 |
| 5.625% 9/15/28 (d) | | 360,000 | 266,689 |
| Consolidated Communications, Inc. 5% 10/1/28 (d) | | 535,000 | 401,625 |
| Frontier Communications Holdings LLC: | | | |
| 5% 5/1/28 (d) | | 1,360,000 | 1,173,422 |
| 5.875% 10/15/27 (d) | | 940,000 | 862,695 |
| 5.875% 11/1/29 | | 1,430,000 | 1,043,900 |
| 8.75% 5/15/30 (d) | | 955,000 | 933,392 |
| IHS Netherlands Holdco BV 8% 9/18/27 (d) | | 415,000 | 376,725 |
| Intelsat Jackson Holdings SA 6.5% 3/15/30 (d) | | 1,895,000 | 1,725,126 |
| LCPR Senior Secured Financing DAC 5.125% 7/15/29 (d) | | 675,000 | 567,193 |
| Level 3 Financing, Inc.: | | | |
| 3.625% 1/15/29 (d) | | 340,000 | 203,916 |
| 4.25% 7/1/28 (d) | | 2,325,000 | 1,496,988 |
| 10.5% 5/15/30 (d) | | 2,370,000 | 2,404,680 |
| Millicom International Cellular SA: | | | |
| 4.5% 4/27/31 (d) | | 2,275,000 | 1,741,513 |
| 5.125% 1/15/28 (d) | | 261,000 | 227,569 |
| Sable International Finance Ltd. 5.75% 9/7/27 (d) | | 464,000 | 426,546 |
| SBA Communications Corp.: | | | |
| 3.125% 2/1/29 | | 372,000 | 315,328 |
| 3.875% 2/15/27 | | 167,000 | 153,841 |
| Sprint Corp.: | | | |
| 7.125% 6/15/24 | | 2,860,000 | 2,885,577 |
| 7.625% 2/15/25 | | 1,237,000 | 1,263,553 |
| 7.625% 3/1/26 | | 2,602,000 | 2,702,890 |
| 7.875% 9/15/23 | | 730,000 | 731,763 |
| Telecom Italia Capital SA: | | | |
| 6% 9/30/34 | | 1,185,000 | 950,361 |
| 7.2% 7/18/36 | | 845,000 | 726,338 |
| 7.721% 6/4/38 | | 235,000 | 207,789 |
| Uniti Group, Inc. 6% 1/15/30 (d) | | 4,060,000 | 2,750,650 |
| Virgin Media Secured Finance PLC 4.5% 8/15/30 (d) | | 690,000 | 578,441 |
| VMED O2 UK Financing I PLC 4.25% 1/31/31 (d) | | 415,000 | 335,621 |
| Windstream Escrow LLC 7.75% 8/15/28 (d) | | 3,980,000 | 3,303,025 |
| Zayo Group Holdings, Inc.: | | | |
| 4% 3/1/27 (d) | | 1,600,000 | 1,130,007 |
| 6.125% 3/1/28 (d) | | 1,020,000 | 637,366 |
| | | | 45,072,374 |
| Textiles/Apparel - 0.2% | | | |
| Crocs, Inc.: | | | |
| 4.125% 8/15/31 (d) | | 477,000 | 385,178 |
| 4.25% 3/15/29 (d) | | 167,000 | 141,983 |
| Foot Locker, Inc. 4% 10/1/29 (d) | | 440,000 | 331,342 |
| Kontoor Brands, Inc. 4.125% 11/15/29 (d) | | 335,000 | 279,738 |
| Victoria's Secret & Co. 4.625% 7/15/29 (d) | | 505,000 | 369,098 |
| | | | 1,507,339 |
| Transportation Ex Air/Rail - 0.6% | | | |
| Golar LNG Ltd. 7% 10/20/25 (d) | | 1,025,000 | 992,907 |
| Great Lakes Dredge & Dock Corp. 5.25% 6/1/29 (d) | | 595,000 | 496,962 |
| Seaspan Corp. 5.5% 8/1/29 (d) | | 2,790,000 | 2,185,742 |
| XPO, Inc.: | | | |
| 6.25% 6/1/28 (d) | | 205,000 | 201,562 |
| 7.125% 6/1/31 (d) | | 345,000 | 347,679 |
| | | | 4,224,852 |
| Utilities - 2.6% | | | |
| Clearway Energy Operating LLC: | | | |
| 3.75% 2/15/31 (d) | | 1,525,000 | 1,265,522 |
| 3.75% 1/15/32 (d) | | 170,000 | 138,364 |
| 4.75% 3/15/28 (d) | | 585,000 | 539,733 |
| DPL, Inc.: | | | |
| 4.125% 7/1/25 | | 896,000 | 853,440 |
| 4.35% 4/15/29 | | 120,000 | 105,046 |
| EnLink Midstream Partners LP 4.15% 6/1/25 | | 335,000 | 324,984 |
| FirstEnergy Corp. 3.4% 3/1/50 | | 1,460,000 | 1,006,174 |
| Global Partners LP/GLP Finance Corp. 7% 8/1/27 | | 1,132,000 | 1,098,415 |
| NRG Energy, Inc.: | | | |
| 3.375% 2/15/29 (d) | | 1,535,000 | 1,255,442 |
| 3.625% 2/15/31 (d) | | 525,000 | 409,839 |
| 5.25% 6/15/29 (d) | | 1,405,000 | 1,256,393 |
| 6.625% 1/15/27 | | 334,000 | 331,555 |
| PG&E Corp.: | | | |
| 5% 7/1/28 | | 2,715,000 | 2,491,297 |
| 5.25% 7/1/30 | | 4,230,000 | 3,791,320 |
| Pike Corp. 5.5% 9/1/28 (d) | | 2,615,000 | 2,346,476 |
| Vistra Operations Co. LLC: | | | |
| 5% 7/31/27 (d) | | 167,000 | 156,315 |
| 5.5% 9/1/26 (d) | | 817,000 | 786,154 |
| 5.625% 2/15/27 (d) | | 1,455,000 | 1,394,584 |
| | | | 19,551,053 |
TOTAL NONCONVERTIBLE BONDS | | | 618,936,361 |
| TOTAL CORPORATE BONDS (Cost $704,934,522) | | | 628,756,663 |
| | | | |
| Common Stocks - 2.3% |
| | | Shares | Value ($) |
| Automotive & Auto Parts - 0.1% | | | |
| Aptiv PLC (i) | | 7,500 | 765,675 |
| Capital Goods - 0.1% | | | |
| Regal Rexnord Corp. | | 6,000 | 923,400 |
| Energy - 1.8% | | | |
| California Resources Corp. warrants 10/27/24 (i) | | 1,768 | 20,968 |
| Mesquite Energy, Inc. (c)(i) | | 82,533 | 12,336,160 |
| New Fortress Energy, Inc. | | 43,900 | 1,175,642 |
TOTAL ENERGY | | | 13,532,770 |
| Healthcare - 0.2% | | | |
| Centene Corp. (i) | | 16,800 | 1,133,160 |
| Technology - 0.1% | | | |
| Coherent Corp. (i) | | 21,200 | 1,080,776 |
| Telecommunications - 0.0% | | | |
| CUI Acquisition Corp. Class E (c)(i) | | 1 | 0 |
| GTT Communications, Inc. (c) | | 23,507 | 290,321 |
TOTAL TELECOMMUNICATIONS | | | 290,321 |
| TOTAL COMMON STOCKS (Cost $8,210,967) | | | 17,726,102 |
| | | | |
| Bank Loan Obligations - 5.4% |
| | | Principal Amount (a) | Value ($) |
| Broadcasting - 0.1% | | | |
| Diamond Sports Group LLC: | | | |
| 1LN, term loan CME Term SOFR 1 Month Index + 8.000% 15.2534% 8/24/26 (e)(f)(j) | | 1,131,410 | 863,413 |
| 2LN, term loan CME Term SOFR 1 Month Index + 3.250% 8.0255% 8/24/26 (e)(f)(j) | | 2,551,051 | 81,481 |
TOTAL BROADCASTING | | | 944,894 |
| Building Materials - 0.2% | | | |
| Acproducts Holdings, Inc. Tranche B 1LN, term loan 1 month U.S. LIBOR + 4.250% 9.7535% 5/17/28 (e)(f)(j) | | 1,337,490 | 1,121,151 |
| Chemicals - 0.3% | | | |
| Consolidated Energy Finance SA Tranche B 1LN, term loan 3 month U.S. LIBOR + 3.500% 9.0379% 5/7/25 (c)(e)(f)(j) | | 1,484,818 | 1,440,274 |
| Discovery Purchaser Corp. 1LN, term loan CME Term SOFR 3 Month Index + 4.370% 9.6169% 10/4/29 (e)(f)(j) | | 1,223,850 | 1,168,397 |
TOTAL CHEMICALS | | | 2,608,671 |
| Consumer Products - 0.1% | | | |
| Mattress Firm, Inc. Tranche B 1LN, term loan 6 month U.S. LIBOR + 4.250% 9.95% 9/24/28 (e)(f)(j) | | 1,037,262 | 1,013,062 |
| Energy - 0.3% | | | |
| EG America LLC Tranche B 1LN, term loan 3 month U.S. LIBOR + 4.000% 9.1645% 2/6/25 (e)(f)(j) | | 1,377,314 | 1,352,067 |
| EG Finco Ltd. Tranche B, term loan 3 month U.S. LIBOR + 4.000% 9.1645% 2/6/25 (e)(f)(j) | | 927,964 | 910,954 |
| Mesquite Energy, Inc.: | | | |
| 1LN, term loan 3 month U.S. LIBOR + 8.000% 0% (c)(f)(g)(j) | | 1,525,908 | 0 |
| term loan 3 month U.S. LIBOR + 0.000% 0% (c)(f)(g)(j) | | 658,000 | 0 |
TOTAL ENERGY | | | 2,263,021 |
| Healthcare - 0.2% | | | |
| Cano Health, Inc. Tranche B 1LN, term loan CME Term SOFR 1 Month Index + 4.000% 9.2534% 11/23/27 (e)(f)(j) | | 1,476,271 | 1,236,377 |
| Da Vinci Purchaser Corp. Tranche B 1LN, term loan 1 month U.S. LIBOR + 4.000% 9.217% 1/8/27 (e)(f)(j) | | 73,671 | 72,197 |
| Gainwell Acquisition Corp. Tranche B 1LN, term loan 3 month U.S. LIBOR + 4.000% 9.3419% 10/1/27 (e)(f)(j) | | 532,270 | 523,621 |
TOTAL HEALTHCARE | | | 1,832,195 |
| Homebuilders/Real Estate - 0.1% | | | |
| Breakwater Energy Tranche B 1LN, term loan 11% 9/1/26 (c)(e)(j) | | 339,071 | 322,117 |
| Insurance - 0.0% | | | |
| Alliant Holdings Intermediate LLC Tranche B5 1LN, term loan CME Term SOFR 1 Month Index + 3.500% 8.647% 11/6/27 (e)(f)(j) | | 129,192 | 128,277 |
| Leisure - 0.6% | | | |
| City Football Group Ltd. Tranche B 1LN, term loan 1 month U.S. LIBOR + 3.000% 8.2727% 7/21/28 (e)(f)(j) | | 3,374,612 | 3,307,120 |
| ClubCorp Holdings, Inc. Tranche B 1LN, term loan 3 month U.S. LIBOR + 2.750% 8.2879% 9/18/24 (e)(f)(j) | | 1,535,926 | 1,470,096 |
TOTAL LEISURE | | | 4,777,216 |
| Paper - 0.0% | | | |
| Clydesdale Acquisition Holdings, Inc. 1LN, term loan CME Term SOFR 1 Month Index + 4.170% 9.3775% 4/13/29 (e)(f)(j) | | 207,801 | 204,233 |
| Services - 1.6% | | | |
| ABG Intermediate Holdings 2 LLC: | | | |
| Tranche B 2LN, term loan CME Term SOFR 1 Month Index + 6.000% 11.2025% 12/20/29 (e)(f)(j) | | 75,000 | 69,375 |
| Tranche B1 LN, term loan CME Term SOFR 1 Month Index + 3.500% 8.7025% 12/21/28 (e)(f)(j) | | 341,550 | 339,586 |
| Tranche B2 1LN, term loan CME Term SOFR 1 Month Index + 4.000% 9.2025% 12/21/28 (e)(f)(j) | | 361,481 | 360,036 |
| Tranche DD 1LN, term loan CME Term SOFR 1 Month Index + 4.000% 12/21/28 (f)(j)(k) | | 118,519 | 118,044 |
| Ascend Learning LLC: | | | |
| 2LN, term loan 1 month U.S. LIBOR + 5.750% 10.9525% 12/10/29 (e)(f)(j) | | 130,000 | 109,958 |
| Tranche B 1LN, term loan 1 month U.S. LIBOR + 3.500% 8.7025% 12/10/28 (e)(f)(j) | | 1,285,425 | 1,205,690 |
| Brand Energy & Infrastructure Services, Inc. Tranche B, term loan 3 month U.S. LIBOR + 4.250% 9.42% 6/21/24 (e)(f)(j) | | 3,355,037 | 3,308,201 |
| CoreLogic, Inc. Tranche B 1LN, term loan 1 month U.S. LIBOR + 3.500% 8.75% 6/2/28 (e)(f)(j) | | 1,557,076 | 1,403,704 |
| Finastra U.S.A., Inc.: | | | |
| Tranche 2LN, term loan 3 month U.S. LIBOR + 7.250% 12.981% 6/13/25 (e)(f)(j) | | 345,000 | 310,976 |
| Tranche B 1LN, term loan 3 month U.S. LIBOR + 3.500% 9.231% 6/13/24 (e)(f)(j) | | 812,726 | 779,794 |
| Neptune BidCo U.S., Inc. Tranche B 1LN, term loan CME Term SOFR 1 Month Index + 5.000% 10.0044% 4/11/29 (e)(f)(j) | | 2,320,000 | 2,036,960 |
| Spin Holdco, Inc. Tranche B 1LN, term loan 3 month U.S. LIBOR + 4.000% 9.2303% 3/4/28 (e)(f)(j) | | 2,035,676 | 1,737,592 |
TOTAL SERVICES | | | 11,779,916 |
| Super Retail - 0.6% | | | |
| Bass Pro Group LLC Tranche B 1LN, term loan 1 month U.S. LIBOR + 3.750% 8.943% 3/5/28 (e)(f)(j) | | 1,545,339 | 1,531,817 |
| LBM Acquisition LLC Tranche B 1LN, term loan 1 month U.S. LIBOR + 3.750% 8.9525% 12/18/27 (e)(f)(j) | | 3,171,517 | 3,039,709 |
TOTAL SUPER RETAIL | | | 4,571,526 |
| Technology - 0.8% | | | |
| Athenahealth Group, Inc.: | | | |
| Tranche B 1LN, term loan CME Term SOFR 1 Month Index + 3.500% 8.5892% 2/15/29 (e)(f)(j) | | 1,180,274 | 1,134,538 |
| Tranche DD 1LN, term loan CME Term SOFR 1 Month Index + 3.500% 2/15/29 (f)(j)(k) | | 144,994 | 139,375 |
| Sophia LP Tranche B 1LN, term loan 3 month U.S. LIBOR + 3.500% 9.0379% 10/7/27 (e)(f)(j) | | 417,873 | 412,913 |
| Ultimate Software Group, Inc.: | | | |
| 1LN, term loan 1 month U.S. LIBOR + 3.250% 8.2706% 5/3/26 (e)(f)(j) | | 1,524,011 | 1,494,003 |
| 2LN, term loan CME Term SOFR 3 Month Index + 5.250% 10.2706% 5/3/27 (e)(f)(j) | | 2,110,000 | 2,040,665 |
| Verscend Holding Corp. Tranche B 1LN, term loan 1 month U.S. LIBOR + 4.000% 9.217% 8/27/25 (e)(f)(j) | | 460,060 | 459,388 |
TOTAL TECHNOLOGY | | | 5,680,882 |
| Telecommunications - 0.2% | | | |
| GTT Communications, Inc. 1LN, term loan CME Term SOFR 3 Month Index + 9.000% 14.3419% 6/30/28 (e)(f)(j) | | 922,239 | 513,383 |
| Gtt Remainco LLC 1LN, term loan CME Term SOFR 1 Month Index + 7.000% 12.2025% 12/30/27 (e)(f)(j) | | 1,169,069 | 970,327 |
TOTAL TELECOMMUNICATIONS | | | 1,483,710 |
| Utilities - 0.3% | | | |
| PG&E Corp. Tranche B 1LN, term loan 1 month U.S. LIBOR + 3.000% 8.217% 6/23/25 (e)(f)(j) | | 2,138,560 | 2,133,599 |
| TOTAL BANK LOAN OBLIGATIONS (Cost $44,959,364) | | | 40,864,470 |
| | | | |
| Preferred Securities - 0.9% |
| | | Principal Amount (a) | Value ($) |
| Air Transportation - 0.1% | | | |
| AerCap Holdings NV 5.875% 10/10/79 (e) | | 760,000 | 726,779 |
| Banks & Thrifts - 0.7% | | | |
| Ally Financial, Inc.: | | | |
| 4.7% (e)(l) | | 1,120,000 | 796,323 |
| 4.7% (e)(l) | | 1,110,000 | 722,613 |
| Bank of America Corp. 5.875% (e)(l) | | 1,360,000 | 1,269,549 |
| JPMorgan Chase & Co.: | | | |
| 4.6% (e)(l) | | 980,000 | 932,530 |
| 6.1% (e)(l) | | 1,360,000 | 1,377,497 |
| Wells Fargo & Co. 5.9% (e)(l) | | 745,000 | 736,678 |
TOTAL BANKS & THRIFTS | | | 5,835,190 |
| Diversified Financial Services - 0.1% | | | |
| Charles Schwab Corp. 4% (e)(l) | | 870,000 | 637,719 |
| TOTAL PREFERRED SECURITIES (Cost $6,886,385) | | | 7,199,688 |
| | | | |
| Other - 1.2% |
| | | Shares | Value ($) |
| Other - 1.2% | | | |
Fidelity Private Credit Central Fund LLC (b)(m) (Cost $9,430,927) | | 948,292 | 9,482,915 |
| | | | |
| Money Market Funds - 6.6% |
| | | Shares | Value ($) |
Fidelity Cash Central Fund 5.14% (n) (Cost $50,406,367) | | 50,396,288 | 50,406,367 |
| | | | |
| TOTAL INVESTMENT IN SECURITIES - 98.9% (Cost $824,828,532) | 754,436,205 |
NET OTHER ASSETS (LIABILITIES) - 1.1% | 8,114,338 |
| NET ASSETS - 100.0% | 762,550,543 |
| | |
Legend
| (a) | Amount is stated in United States dollars unless otherwise noted. |
| (b) | Restricted securities (including private placements) - Investment in securities not registered under the Securities Act of 1933 (excluding 144A issues). At the end of the period, the value of restricted securities (excluding 144A issues) amounted to $12,561,310 or 1.6% of net assets. |
| (d) | Security exempt from registration under Rule 144A of the Securities Act of 1933. These securities may be resold in transactions exempt from registration, normally to qualified institutional buyers. At the end of the period, the value of these securities amounted to $473,404,812 or 62.1% of net assets. |
| (e) | Coupon rates for floating and adjustable rate securities reflect the rates in effect at period end. |
| (f) | Coupon is indexed to a floating interest rate which may be multiplied by a specified factor and/or subject to caps or floors. |
| (g) | Non-income producing - Security is in default. |
| (h) | Security initially issued at one coupon which converts to a higher coupon at a specified date. The rate shown is the rate at period end. |
| (j) | Remaining maturities of bank loan obligations may be less than the stated maturities shown as a result of contractual or optional prepayments by the borrower. Such prepayments cannot be predicted with certainty. |
| (k) | Position or a portion of the position represents an unfunded loan commitment. At period end, the total principal amount and market value of unfunded commitments totaled $263,512 and $257,420, respectively. |
| (l) | Security is perpetual in nature with no stated maturity date. |
| (m) | Affiliated fund that is generally available only to investment companies and other accounts managed by Fidelity Investments. |
| (n) | Affiliated fund that is generally available only to investment companies and other accounts managed by Fidelity Investments. The rate quoted is the annualized seven-day yield of the fund at period end. A complete unaudited listing of the fund's holdings as of its most recent quarter end is available upon request. In addition, each Fidelity Central Fund's financial statements are available on the SEC's website or upon request. |
| Additional information on each restricted holding is as follows: |
| Security | Acquisition Date | Acquisition Cost ($) |
| Fidelity Private Credit Central Fund LLC | 12/09/21 - 6/06/22 | 9,430,927 |
| | | |
| Jonah Energy Parent LLC 12% 11/5/25 | 5/05/23 | 1,269,399 |
| | | |
| Mesquite Energy, Inc. 15% 7/15/23 | 7/10/20 - 1/18/22 | 649,253 |
| | | |
| Mesquite Energy, Inc. 15% 7/15/23 | 11/05/20 - 1/18/22 | 1,120,884 |
| | | |
Affiliated Central Funds
Fiscal year to date information regarding the Fund's investments in Fidelity Central Funds, including the ownership percentage, is presented below.
| Affiliate | Value, beginning of period ($) | Purchases ($) | Sales Proceeds ($) | Dividend Income ($) | Realized Gain (loss) ($) | Change in Unrealized appreciation (depreciation) ($) | Value, end of period ($) | % ownership, end of period |
| Fidelity Cash Central Fund 5.14% | 46,606,159 | 155,815,005 | 152,014,797 | 740,749 | - | - | 50,406,367 | 0.1% |
| Fidelity Private Credit Central Fund LLC | 7,033,396 | 2,356,371 | - | 492,366 | 12,341 | 80,807 | 9,482,915 | 1.5% |
| Fidelity Securities Lending Cash Central Fund 5.14% | - | 11,222,107 | 11,222,107 | 86 | - | - | - | 0.0% |
| Total | 53,639,555 | 169,393,483 | 163,236,904 | 1,233,201 | 12,341 | 80,807 | 59,889,282 | |
| | | | | | | | | |
Amounts in the dividend income column in the above table include any capital gain distributions from underlying funds, which are presented in the corresponding line item in the Statement of Operations, if applicable.
Amounts in the dividend income column for Fidelity Securities Lending Cash Central Fund represents the income earned on investing cash collateral, less rebates paid to borrowers and any lending agent fees associated with the loan, plus any premium payments received for lending certain types of securities.
Amounts included in the purchases and sales proceeds columns may include in-kind transactions, if applicable.
Investment Valuation
The following is a summary of the inputs used, as of June 30, 2023, involving the Fund's assets and liabilities carried at fair value. The inputs or methodology used for valuing securities may not be an indication of the risk associated with investing in those securities. For more information on valuation inputs, and their aggregation into the levels used below, please refer to the Investment Valuation section in the accompanying Notes to Financial Statements.
| Valuation Inputs at Reporting Date: |
| Description | Total ($) | Level 1 ($) | Level 2 ($) | Level 3 ($) |
Investments in Securities: | | | | |
|
| Equities: | | | | |
Communication Services | - | - | - | - |
Consumer Discretionary | 765,675 | 765,675 | - | - |
Energy | 13,532,770 | 1,196,610 | - | 12,336,160 |
Health Care | 1,133,160 | 1,133,160 | - | - |
Industrials | 923,400 | 923,400 | - | - |
Information Technology | 1,371,097 | 1,080,776 | - | 290,321 |
|
| Corporate Bonds | 628,756,663 | - | 625,678,267 | 3,078,396 |
|
| Bank Loan Obligations | 40,864,470 | - | 39,102,079 | 1,762,391 |
|
| Preferred Securities | 7,199,688 | - | 7,199,688 | - |
|
| Other | 9,482,915 | - | 9,482,915 | - |
|
| Money Market Funds | 50,406,367 | 50,406,367 | - | - |
| Total Investments in Securities: | 754,436,205 | 55,505,988 | 681,462,949 | 17,467,268 |
The following is a reconciliation of Investments in Securities for which Level 3 inputs were used in determining value:
| |
| Investments in Securities: | |
| Energy | | | |
| Beginning Balance | $ | 8,212,552 | |
| Net Realized Gain (Loss) on Investment Securities | | 1,827,890 | |
| Net Unrealized Gain (Loss) on Investment Securities | | 4,928,133 | |
| Cost of Purchases | | - | |
| Proceeds of Sales | | (2,632,415) | |
| Amortization/Accretion | | - | |
| Transfers into Level 3 | | - | |
| Transfers out of Level 3 | | - | |
| Ending Balance | $ | 12,336,160 | |
| The change in unrealized gain (loss) for the period attributable to Level 3 securities held at June 30, 2023 | $ | 7,418,871 | |
| Corporate Bonds | | | |
| Beginning Balance | $ | 11,280,376 | |
| Net Realized Gain (Loss) on Investment Securities | | - | |
| Net Unrealized Gain (Loss) on Investment Securities | | (9,472,755) | |
| Cost of Purchases | | 1,269,399 | |
| Proceeds of Sales | | - | |
| Amortization/Accretion | | 1,376 | |
| Transfers into Level 3 | | - | |
| Transfers out of Level 3 | | - | |
| Ending Balance | $ | 3,078,396 | |
| The change in unrealized gain (loss) for the period attributable to Level 3 securities held at June 30, 2023 | $ | (9,472,755) | |
| Other Investments in Securities | | | |
| Beginning Balance | $ | 2,903,158 | |
| Net Realized Gain (Loss) on Investment Securities | | 150 | |
| Net Unrealized Gain (Loss) on Investment Securities | | (34,251) | |
| Cost of Purchases | | 377,787 | |
| Proceeds of Sales | | (8,505) | |
| Amortization/Accretion | | 5,705 | |
| Transfers into Level 3 | | - | |
| Transfers out of Level 3 | | (1,191,332) | |
| Ending Balance | $ | 2,052,712 | |
| The change in unrealized gain (loss) for the period attributable to Level 3 securities held at June 30, 2023 | $ | (34,251) | |
| The information used in the above reconciliation represents fiscal year to date activity for any Investments in Securities identified as using Level 3 inputs at either the beginning or the end of the current fiscal period. Cost of purchases and proceeds of sales may include securities received and/or delivered through in-kind transactions, corporate actions or exchanges. Transfers into Level 3 were attributable to a lack of observable market data resulting from decreases in market activity, decreases in liquidity, security restructurings or corporate actions. Transfers out of Level 3 were attributable to observable market data becoming available for those securities. Transfers in or out of Level 3 represent the beginning value of any Security or Instrument where a change in the pricing level occurred from the beginning to the end of the period. Realized and unrealized gains (losses) disclosed in the reconciliation are included in Net Gain (Loss) on the Fund's Statement of Operations. | |
| Statement of Assets and Liabilities |
| | | | June 30, 2023 (Unaudited) |
| | | | | |
| Assets | | | | |
| Investment in securities, at value - See accompanying schedule: | | | | |
Unaffiliated issuers (cost $764,991,238) | $ | 694,546,923 | | |
Fidelity Central Funds (cost $59,837,294) | | 59,889,282 | | |
| | | | | |
| | | | | |
| Total Investment in Securities (cost $824,828,532) | | | $ | 754,436,205 |
| Cash | | | | 409,923 |
| Receivable for investments sold | | | | 2,285,601 |
| Receivable for fund shares sold | | | | 1,596,173 |
| Dividends receivable | | | | 2,100 |
| Interest receivable | | | | 11,397,614 |
| Distributions receivable from Fidelity Central Funds | | | | 161,210 |
Total assets | | | | 770,288,826 |
| Liabilities | | | | |
| Payable for investments purchased | $ | 7,013,896 | | |
| Payable for fund shares redeemed | | 240,274 | | |
| Accrued management fee | | 336,813 | | |
| Distribution and service plan fees payable | | 29,257 | | |
| Other affiliated payables | | 75,358 | | |
| Other payables and accrued expenses | | 42,685 | | |
| Total Liabilities | | | | 7,738,283 |
| Commitments and contingent liabilities (see Commitments note) | | | | |
| Net Assets | | | $ | 762,550,543 |
| Net Assets consist of: | | | | |
| Paid in capital | | | $ | 953,114,505 |
| Total accumulated earnings (loss) | | | | (190,563,962) |
| Net Assets | | | $ | 762,550,543 |
| | | | | |
| Net Asset Value and Maximum Offering Price | | | | |
| Initial Class : | | | | |
Net Asset Value , offering price and redemption price per share ($236,391,195 ÷ 51,450,524 shares) | | | $ | 4.59 |
| Service Class : | | | | |
Net Asset Value , offering price and redemption price per share ($62,954,725 ÷ 13,824,679 shares) | | | $ | 4.55 |
| Service Class 2 : | | | | |
Net Asset Value , offering price and redemption price per share ($123,220,664 ÷ 28,119,643 shares) | | | $ | 4.38 |
| Investor Class : | | | | |
Net Asset Value , offering price and redemption price per share ($339,983,959 ÷ 74,536,952 shares) | | | $ | 4.56 |
| Statement of Operations |
| | | | Six months ended June 30, 2023 (Unaudited) |
| Investment Income | | | | |
| Dividends | | | $ | 1,024,942 |
| Interest | | | | 22,104,772 |
| Income from Fidelity Central Funds (including $86 from security lending) | | | | 1,233,201 |
| Total Income | | | | 24,362,915 |
| Expenses | | | | |
| Management fee | $ | 2,061,666 | | |
| Transfer agent fees | | 313,716 | | |
| Distribution and service plan fees | | 179,833 | | |
| Accounting fees | | 141,746 | | |
| Custodian fees and expenses | | 7,349 | | |
| Independent trustees' fees and expenses | | 2,540 | | |
| Audit | | 43,018 | | |
| Legal | | 69,795 | | |
| Interest | | 2,404 | | |
| Miscellaneous | | 2,225 | | |
| Total expenses before reductions | | 2,824,292 | | |
| Expense reductions | | (20,876) | | |
| Total expenses after reductions | | | | 2,803,416 |
| Net Investment income (loss) | | | | 21,559,499 |
| Realized and Unrealized Gain (Loss) | | | | |
| Net realized gain (loss) on: | | | | |
| Investment Securities: | | | | |
| Unaffiliated issuers | | (35,596,796) | | |
| Fidelity Central Funds | | 12,341 | | |
| Total net realized gain (loss) | | | | (35,584,455) |
| Change in net unrealized appreciation (depreciation) on: | | | | |
| Investment Securities: | | | | |
| Unaffiliated issuers | | 43,707,917 | | |
| Fidelity Central Funds | | 80,807 | | |
| Total change in net unrealized appreciation (depreciation) | | | | 43,788,724 |
| Net gain (loss) | | | | 8,204,269 |
| Net increase (decrease) in net assets resulting from operations | | | $ | 29,763,768 |
| Statement of Changes in Net Assets |
| |
| | Six months ended June 30, 2023 (Unaudited) | | Year ended December 31, 2022 |
| Increase (Decrease) in Net Assets | | | | |
| Operations | | | | |
| Net investment income (loss) | $ | 21,559,499 | $ | 41,888,073 |
| Net realized gain (loss) | | (35,584,455) | | (25,101,677) |
| Change in net unrealized appreciation (depreciation) | | 43,788,724 | | (125,003,877) |
| Net increase (decrease) in net assets resulting from operations | | 29,763,768 | | (108,217,481) |
| Distributions to shareholders | | (498,942) | | (40,140,205) |
| | | | | |
| Share transactions - net increase (decrease) | | (10,254,957) | | (83,467,685) |
| Total increase (decrease) in net assets | | 19,009,869 | | (231,825,371) |
| | | | | |
| Net Assets | | | | |
| Beginning of period | | 743,540,674 | | 975,366,045 |
| End of period | $ | 762,550,543 | $ | 743,540,674 |
| | | | | |
| | | | | |
| VIP High Income Portfolio Initial Class |
| |
| | Six months ended (Unaudited) June 30, 2023 | | Years ended December 31, 2022 | | 2021 | | 2020 | | 2019 | | 2018 |
Selected Per-Share Data | | | | | | | | | | | | |
| Net asset value, beginning of period | $ | 4.41 | $ | 5.25 | $ | 5.31 | $ | 5.43 | $ | 4.97 | $ | 5.46 |
| Income from Investment Operations | | | | | | | | | | | | |
Net investment income (loss) A,B | | .132 | | .251 | | .245 | | .266 | | .286 | | .288 |
| Net realized and unrealized gain (loss) | | .051 | | (.842) | | (.016) | | (.121) | | .457 | | (.473) |
| Total from investment operations | | .183 | | (.591) | | .229 | | .145 | | .743 | | (.185) |
| Distributions from net investment income | | (.003) | | (.249) | | (.289) | | (.265) | | (.283) | | (.305) |
| Total distributions | | (.003) | | (.249) | | (.289) | | (.265) | | (.283) | | (.305) |
| Net asset value, end of period | $ | 4.59 | $ | 4.41 | $ | 5.25 | $ | 5.31 | $ | 5.43 | $ | 4.97 |
Total Return C,D,E | | 4.15% | | (11.37)% | | 4.41% | | 2.75% | | 15.11% | | (3.46)% |
Ratios to Average Net Assets B,F,G | | | | | | | | | | | | |
| Expenses before reductions | | .70% H | | .72% | | .67% | | .67% | | .67% | | .67% |
| Expenses net of fee waivers, if any | | .69% H | | .71% | | .66% | | .67% | | .67% | | .67% |
| Expenses net of all reductions | | .69% H | | .71% | | .66% | | .67% | | .67% | | .67% |
| Net investment income (loss) | | 5.86% H | | 5.22% | | 4.57% | | 5.14% | | 5.31% | | 5.33% |
| Supplemental Data | | | | | | | | | | | | |
| Net assets, end of period (000 omitted) | $ | 236,391 | $ | 235,522 | $ | 312,771 | $ | 313,973 | $ | 327,442 | $ | 299,239 |
Portfolio turnover rate I | | 64% H | | 32% | | 66% | | 72% | | 30% | | 69% |
A Calculated based on average shares outstanding during the period.
B Net investment income (loss) is affected by the timing of the declaration of dividends by any underlying mutual funds or exchange-traded funds (ETFs). Net investment income (loss) of any mutual funds or ETFs is not included in the Fund's net investment income (loss) ratio.
C Total returns for periods of less than one year are not annualized.
D Total returns do not reflect charges attributable to your insurance company's separate account. Inclusion of these charges would reduce the total returns shown.
E Total returns would have been lower if certain expenses had not been reduced during the applicable periods shown.
F Fees and expenses of any underlying mutual funds or exchange-traded funds (ETFs) are not included in the Fund's expense ratio. The Fund indirectly bears its proportionate share of these expenses. For additional expense information related to investments in Fidelity Central Funds, please refer to the "Investments in Fidelity Central Funds" note found in the Notes to Financial Statements section of the most recent Annual or Semi-Annual report. For additional expense information related to investments in Fidelity Private Credit Central Fund LLC, please refer to the Investment in Fidelity Private Credit Central Fund LLC note found in the Notes to Financial Statements section of the most recent Annual or Semi-Annual report.
G Expense ratios reflect operating expenses of the class. Expenses before reductions do not reflect amounts reimbursed, waived, or reduced through arrangements with the investment adviser, brokerage services, or other offset arrangements, if applicable, and do not represent the amount paid by the class during periods when reimbursements, waivers or reductions occur.
H Annualized.
I Amount does not include the portfolio activity of any underlying mutual funds or exchange-traded funds (ETFs).
| VIP High Income Portfolio Service Class |
| |
| | Six months ended (Unaudited) June 30, 2023 | | Years ended December 31, 2022 | | 2021 | | 2020 | | 2019 | | 2018 |
Selected Per-Share Data | | | | | | | | | | | | |
| Net asset value, beginning of period | $ | 4.37 | $ | 5.21 | $ | 5.26 | $ | 5.38 | $ | 4.93 | $ | 5.42 |
| Income from Investment Operations | | | | | | | | | | | | |
Net investment income (loss) A,B | | .128 | | .244 | | .238 | | .259 | | .279 | | .280 |
| Net realized and unrealized gain (loss) | | .055 | | (.840) | | (.007) | | (.120) | | .449 | | (.471) |
| Total from investment operations | | .183 | | (.596) | | .231 | | .139 | | .728 | | (.191) |
| Distributions from net investment income | | (.003) | | (.244) | | (.281) | | (.259) | | (.278) | | (.299) |
| Total distributions | | (.003) | | (.244) | | (.281) | | (.259) | | (.278) | | (.299) |
| Net asset value, end of period | $ | 4.55 | $ | 4.37 | $ | 5.21 | $ | 5.26 | $ | 5.38 | $ | 4.93 |
Total Return C,D,E | | 4.19% | | (11.56)% | | 4.50% | | 2.65% | | 14.92% | | (3.60)% |
Ratios to Average Net Assets B,F,G | | | | | | | | | | | | |
| Expenses before reductions | | .80% H | | .81% | | .77% | | .77% | | .77% | | .77% |
| Expenses net of fee waivers, if any | | .79% H | | .81% | | .76% | | .77% | | .77% | | .77% |
| Expenses net of all reductions | | .79% H | | .81% | | .76% | | .77% | | .77% | | .77% |
| Net investment income (loss) | | 5.76% H | | 5.12% | | 4.47% | | 5.04% | | 5.21% | | 5.23% |
| Supplemental Data | | | | | | | | | | | | |
| Net assets, end of period (000 omitted) | $ | 62,955 | $ | 43,707 | $ | 53,927 | $ | 53,326 | $ | 66,123 | $ | 58,231 |
Portfolio turnover rate I | | 64% H | | 32% | | 66% | | 72% | | 30% | | 69% |
A Calculated based on average shares outstanding during the period.
B Net investment income (loss) is affected by the timing of the declaration of dividends by any underlying mutual funds or exchange-traded funds (ETFs). Net investment income (loss) of any mutual funds or ETFs is not included in the Fund's net investment income (loss) ratio.
C Total returns for periods of less than one year are not annualized.
D Total returns do not reflect charges attributable to your insurance company's separate account. Inclusion of these charges would reduce the total returns shown.
E Total returns would have been lower if certain expenses had not been reduced during the applicable periods shown.
F Fees and expenses of any underlying mutual funds or exchange-traded funds (ETFs) are not included in the Fund's expense ratio. The Fund indirectly bears its proportionate share of these expenses. For additional expense information related to investments in Fidelity Central Funds, please refer to the "Investments in Fidelity Central Funds" note found in the Notes to Financial Statements section of the most recent Annual or Semi-Annual report. For additional expense information related to investments in Fidelity Private Credit Central Fund LLC, please refer to the Investment in Fidelity Private Credit Central Fund LLC note found in the Notes to Financial Statements section of the most recent Annual or Semi-Annual report.
G Expense ratios reflect operating expenses of the class. Expenses before reductions do not reflect amounts reimbursed, waived, or reduced through arrangements with the investment adviser, brokerage services, or other offset arrangements, if applicable, and do not represent the amount paid by the class during periods when reimbursements, waivers or reductions occur.
H Annualized.
I Amount does not include the portfolio activity of any underlying mutual funds or exchange-traded funds (ETFs).
| VIP High Income Portfolio Service Class 2 |
| |
| | Six months ended (Unaudited) June 30, 2023 | | Years ended December 31, 2022 | | 2021 | | 2020 | | 2019 | | 2018 |
Selected Per-Share Data | | | | | | | | | | | | |
| Net asset value, beginning of period | $ | 4.21 | $ | 5.03 | $ | 5.09 | $ | 5.22 | $ | 4.79 | $ | 5.27 |
| Income from Investment Operations | | | | | | | | | | | | |
Net investment income (loss) A,B | | .120 | | .228 | | .222 | | .244 | | .262 | | .264 |
| Net realized and unrealized gain (loss) | | .052 | | (.809) | | (.009) | | (.121) | | .438 | | (.451) |
| Total from investment operations | | .172 | | (.581) | | .213 | | .123 | | .700 | | (.187) |
| Distributions from net investment income | | (.002) | | (.239) | | (.273) | | (.253) | | (.270) | | (.293) |
| Total distributions | | (.002) | | (.239) | | (.273) | | (.253) | | (.270) | | (.293) |
| Net asset value, end of period | $ | 4.38 | $ | 4.21 | $ | 5.03 | $ | 5.09 | $ | 5.22 | $ | 4.79 |
Total Return C,D,E | | 4.09% | | (11.67)% | | 4.29% | | 2.42% | | 14.77% | | (3.63)% |
Ratios to Average Net Assets B,F,G | | | | | | | | | | | | |
| Expenses before reductions | | .95% H | | .96% | | .92% | | .92% | | .92% | | .92% |
| Expenses net of fee waivers, if any | | .95% H | | .96% | | .91% | | .92% | | .92% | | .92% |
| Expenses net of all reductions | | .94% H | | .96% | | .91% | | .92% | | .92% | | .92% |
| Net investment income (loss) | | 5.61% H | | 4.97% | | 4.32% | | 4.89% | | 5.06% | | 5.08% |
| Supplemental Data | | | | | | | | | | | | |
| Net assets, end of period (000 omitted) | $ | 123,221 | $ | 127,406 | $ | 166,773 | $ | 170,257 | $ | 187,747 | $ | 139,564 |
Portfolio turnover rate I | | 64% H | | 32% | | 66% | | 72% | | 30% | | 69% |
A Calculated based on average shares outstanding during the period.
B Net investment income (loss) is affected by the timing of the declaration of dividends by any underlying mutual funds or exchange-traded funds (ETFs). Net investment income (loss) of any mutual funds or ETFs is not included in the Fund's net investment income (loss) ratio.
C Total returns for periods of less than one year are not annualized.
D Total returns do not reflect charges attributable to your insurance company's separate account. Inclusion of these charges would reduce the total returns shown.
E Total returns would have been lower if certain expenses had not been reduced during the applicable periods shown.
F Fees and expenses of any underlying mutual funds or exchange-traded funds (ETFs) are not included in the Fund's expense ratio. The Fund indirectly bears its proportionate share of these expenses. For additional expense information related to investments in Fidelity Central Funds, please refer to the "Investments in Fidelity Central Funds" note found in the Notes to Financial Statements section of the most recent Annual or Semi-Annual report. For additional expense information related to investments in Fidelity Private Credit Central Fund LLC, please refer to the Investment in Fidelity Private Credit Central Fund LLC note found in the Notes to Financial Statements section of the most recent Annual or Semi-Annual report.
G Expense ratios reflect operating expenses of the class. Expenses before reductions do not reflect amounts reimbursed, waived, or reduced through arrangements with the investment adviser, brokerage services, or other offset arrangements, if applicable, and do not represent the amount paid by the class during periods when reimbursements, waivers or reductions occur.
H Annualized.
I Amount does not include the portfolio activity of any underlying mutual funds or exchange-traded funds (ETFs).
| VIP High Income Portfolio Investor Class |
| |
| | Six months ended (Unaudited) June 30, 2023 | | Years ended December 31, 2022 | | 2021 | | 2020 | | 2019 | | 2018 |
Selected Per-Share Data | | | | | | | | | | | | |
| Net asset value, beginning of period | $ | 4.38 | $ | 5.22 | $ | 5.27 | $ | 5.39 | $ | 4.94 | $ | 5.43 |
| Income from Investment Operations | | | | | | | | | | | | |
Net investment income (loss) A,B | | .130 | | .248 | | .242 | | .263 | | .283 | | .284 |
| Net realized and unrealized gain (loss) | | .053 | | (.840) | | (.004) | | (.119) | | .448 | | (.470) |
| Total from investment operations | | .183 | | (.592) | | .238 | | .144 | | .731 | | (.186) |
| Distributions from net investment income | | (.003) | | (.248) | | (.288) | | (.264) | | (.281) | | (.304) |
| Total distributions | | (.003) | | (.248) | | (.288) | | (.264) | | (.281) | | (.304) |
| Net asset value, end of period | $ | 4.56 | $ | 4.38 | $ | 5.22 | $ | 5.27 | $ | 5.39 | $ | 4.94 |
Total Return C,D,E | | 4.18% | | (11.46)% | | 4.63% | | 2.74% | | 14.94% | | (3.50)% |
Ratios to Average Net Assets B,F,G | | | | | | | | | | | | |
| Expenses before reductions | | .73% H | | .75% | | .70% | | .71% | | .70% | | .71% |
| Expenses net of fee waivers, if any | | .73% H | | .75% | | .70% | | .71% | | .70% | | .71% |
| Expenses net of all reductions | | .72% H | | .75% | | .70% | | .71% | | .70% | | .71% |
| Net investment income (loss) | | 5.83% H | | 5.19% | | 4.53% | | 5.11% | | 5.28% | | 5.30% |
| Supplemental Data | | | | | | | | | | | | |
| Net assets, end of period (000 omitted) | $ | 339,984 | $ | 336,906 | $ | 441,896 | $ | 431,557 | $ | 462,593 | $ | 391,173 |
Portfolio turnover rate I | | 64% H | | 32% | | 66% | | 72% | | 30% | | 69% |
A Calculated based on average shares outstanding during the period.
B Net investment income (loss) is affected by the timing of the declaration of dividends by any underlying mutual funds or exchange-traded funds (ETFs). Net investment income (loss) of any mutual funds or ETFs is not included in the Fund's net investment income (loss) ratio.
C Total returns for periods of less than one year are not annualized.
D Total returns do not reflect charges attributable to your insurance company's separate account. Inclusion of these charges would reduce the total returns shown.
E Total returns would have been lower if certain expenses had not been reduced during the applicable periods shown.
F Fees and expenses of any underlying mutual funds or exchange-traded funds (ETFs) are not included in the Fund's expense ratio. The Fund indirectly bears its proportionate share of these expenses. For additional expense information related to investments in Fidelity Central Funds, please refer to the "Investments in Fidelity Central Funds" note found in the Notes to Financial Statements section of the most recent Annual or Semi-Annual report. For additional expense information related to investments in Fidelity Private Credit Central Fund LLC, please refer to the Investment in Fidelity Private Credit Central Fund LLC note found in the Notes to Financial Statements section of the most recent Annual or Semi-Annual report.
G Expense ratios reflect operating expenses of the class. Expenses before reductions do not reflect amounts reimbursed, waived, or reduced through arrangements with the investment adviser, brokerage services, or other offset arrangements, if applicable, and do not represent the amount paid by the class during periods when reimbursements, waivers or reductions occur.
H Annualized.
I Amount does not include the portfolio activity of any underlying mutual funds or exchange-traded funds (ETFs).
For the period ended June 30, 2023
1. Organization.
VIP High Income Portfolio (the Fund) is a fund of Variable Insurance Products Fund (the Trust) and is authorized to issue an unlimited number of shares. The Trust is registered under the Investment Company Act of 1940, as amended (the 1940 Act), as an open-end management investment company organized as a Massachusetts business trust. Shares of the Fund may only be purchased by insurance companies for the purpose of funding variable annuity or variable life insurance contracts. The Fund offers the following classes of shares: Initial Class shares, Service Class shares, Service Class 2 shares and Investor Class shares. All classes have equal rights and voting privileges, except for matters affecting a single class.
2. Investments in Fidelity Central Funds.
Funds may invest in Fidelity Central Funds, which are open-end investment companies generally available only to other investment companies and accounts managed by the investment adviser and its affiliates. The Schedule of Investments lists any Fidelity Central Funds held as an investment as of period end, but does not include the underlying holdings of each Fidelity Central Fund. An investing fund indirectly bears its proportionate share of the expenses of the underlying Fidelity Central Funds.
Based on its investment objective, each Fidelity Central Fund may invest or participate in various investment vehicles or strategies that are similar to those of the investing fund. These strategies are consistent with the investment objectives of the investing fund and may involve certain economic risks which may cause a decline in value of each of the Fidelity Central Funds and thus a decline in the value of the investing fund.
| Fidelity Central Fund | Investment Manager | Investment Objective | Investment Practices | Expense Ratio A |
| Fidelity Money Market Central Funds | Fidelity Management & Research Company LLC (FMR) | Each fund seeks to obtain a high level of current income consistent with the preservation of capital and liquidity. | Short-term Investments | Less than .005% |
A Expenses expressed as a percentage of average net assets and are as of each underlying Central Fund's most recent annual or semi-annual shareholder report.
A complete unaudited list of holdings for each Fidelity Central Fund is available upon request or at the Securities and Exchange Commission website at www.sec.gov. In addition, the financial statements of the Fidelity Central Funds which contain the significant accounting policies (including investment valuation policies) of those funds, and are not covered by the Report of Independent Registered Public Accounting Firm, are available on the Securities and Exchange Commission website or upon request.
3. Investment in Fidelity Private Credit Central Fund LLC.
The Fund invests in Fidelity Private Credit Central Fund LLC (formerly Fidelity Direct Lending Fund, LP), which is a limited liability company available only to certain investment companies managed by the investment adviser and its affiliates. On June 1, 2023, Fidelity Private Credit Central Fund elected to be regulated as a business development company (BDC). Fidelity Private Credit Central Fund LLC's units are not registered under the Securities Act of 1933 and are subject to substantial restrictions on transfer. The Fund has no redemption rights under Fidelity Private Credit Central Fund LLC's limited liability company agreement. There will be no trading market for the units.
Based on its investment objective, Fidelity Private Credit Central Fund LLC may invest or participate in various investments or strategies that are similar to those in which the Fund may invest or participate. These strategies are consistent with the investment objectives of the Fund and may involve certain economic risks which may cause a decline in value of Fidelity Private Credit Central Fund LLC and thus a decline in the value of the Fund. Fidelity Private Credit Central Fund LLC intends to invest primarily in directly originated loans to private companies but also with liquid credit investments, like broadly syndicated loans, and other select private credit investments.
The Schedule of Investments lists Fidelity Private Credit Central Fund LLC as an investment as of period end, but does not include the underlying holdings of Fidelity Private Credit Central Fund LLC. Fidelity Private Credit Central Fund LLC represented less than 5% of the Fund's net assets at period end. The Fund indirectly bears its proportionate share of the expenses of Fidelity Private Credit Central Fund LLC. The annualized expense ratio for Fidelity Private Credit Central Fund LLC for the sixth month period ended June 30, 2023 was 8.51%.
4. Significant Accounting Policies.
The Fund is an investment company and applies the accounting and reporting guidance of the Financial Accounting Standards Board (FASB) Accounting Standards Codification Topic 946 Financial Services - Investment Companies . The financial statements have been prepared in conformity with accounting principles generally accepted in the United States of America (GAAP), which require management to make certain estimates and assumptions at the date of the financial statements. Actual results could differ from those estimates. Subsequent events, if any, through the date that the financial statements were issued have been evaluated in the preparation of the financial statements. The Fund's Schedule of Investments lists any underlying mutual funds or exchange-traded funds (ETFs) but does not include the underlying holdings of these funds. The following summarizes the significant accounting policies of the Fund:
Investment Valuation. Investments are valued as of 4:00 p.m. Eastern time on the last calendar day of the period. The Board of Trustees (the Board) has designated the Fund's investment adviser as the valuation designee responsible for the fair valuation function and performing fair value determinations as needed. The investment adviser has established a Fair Value Committee (the Committee) to carry out the day-to-day fair valuation responsibilities and has adopted policies and procedures to govern the fair valuation process and the activities of the Committee. In accordance with these fair valuation policies and procedures, which have been approved by the Board, the Fund attempts to obtain prices from one or more third party pricing services or brokers to value its investments. When current market prices, quotations or currency exchange rates are not readily available or reliable, investments will be fair valued in good faith by the Committee, in accordance with the policies and procedures. Factors used in determining fair value vary by investment type and may include market or investment specific events, transaction data, estimated cash flows, and market observations of comparable investments. The frequency that the fair valuation procedures are used cannot be predicted and they may be utilized to a significant extent. The Committee manages the Fund's fair valuation practices and maintains the fair valuation policies and procedures. The Fund's investment adviser reports to the Board information regarding the fair valuation process and related material matters.
The Fund categorizes the inputs to valuation techniques used to value its investments into a disclosure hierarchy consisting of three levels as shown below:
Level 1 - unadjusted quoted prices in active markets for identical investments
Level 2 - other significant observable inputs (including quoted prices for similar investments, interest rates, prepayment speeds, etc.)
Level 3 - unobservable inputs (including the Fund's own assumptions based on the best information available)
Valuation techniques used to value the Fund's investments by major category are as follows:
Debt securities, including restricted securities, are valued based on evaluated prices received from third party pricing services or from brokers who make markets in such securities. Corporate bonds, bank loan obligations and preferred securities are valued by pricing services who utilize matrix pricing which considers yield or price of bonds of comparable quality, coupon, maturity and type or by broker-supplied prices. When independent prices are unavailable or unreliable, debt securities may be valued utilizing pricing methodologies which consider similar factors that would be used by third party pricing services. Debt securities are generally categorized as Level 2 in the hierarchy but may be Level 3 depending on the circumstances. The Fund invests a significant portion of its assets in below investment grade securities. The value of these securities can be more volatile due to changes in the credit quality of the issuer and is sensitive to changes in economic, market and regulatory conditions.
Equity securities, including restricted securities, for which market quotations are readily available, are valued at the last reported sale price or official closing price as reported by a third party pricing service on the primary market or exchange on which they are traded and are categorized as Level 1 in the hierarchy. In the event there were no sales during the day or closing prices are not available, securities are valued at the last quoted bid price or may be valued using the last available price and are generally categorized as Level 2 in the hierarchy. For equity securities, including restricted securities, where observable inputs are limited, assumptions about market activity and risk are used and these securities may be categorized as Level 3 in the hierarchy. Securities, including private placements or other restricted securities, for which observable inputs are not available are valued using alternate valuation approaches, including the market approach, the income approach and cost approach, and are categorized as Level 3 in the hierarchy. The market approach considers factors including the price of recent investments in the same or a similar security or financial metrics of comparable securities. The income approach considers factors including expected future cash flows, security specific risks and corresponding discount rates. The cost approach considers factors including the value of the security's underlying assets and liabilities.
Investments in open-end mutual funds, including the Fidelity Central Funds, are valued at their closing net asset value (NAV) each business day and are categorized as Level 1 in the hierarchy.
Fidelity Private Credit Central Fund LLC is valued at its net asset value (NAV) each month end and is categorized as Level 2 in the hierarchy.
The following provides information on Level 3 securities held by the Fund that were valued at period end based on unobservable inputs. These amounts exclude valuations provided by a broker and valuations using NAV as a practical expedient.
| Asset Type | Fair Value | Valuation Technique(s) | Unobservable Input | Amount or Range/Weighted Average | Impact to Valuation from an Increase in Input A |
| Equities | $12,626,481 | Recovery value | Recovery value | $0.00 | Increase |
| | | Market approach | Transaction price | $613.00 | Increase |
| | | | Discount rate | 5.0% | Decrease |
| | | | Parity price | $12.35 | Increase |
| Corporate Bonds | $3,078,396 | Market comparable | Enterprise value/EBITDA multiple (EV/EBITDA) | 5.4 | Increase |
| | | | Enterprise Value/Proved Reserves multiple | 0.7 | Increase |
| | | | Enterprise value/PV-10 multiple (EV/PV-10) | 0.3 | Increase |
| | | | Daily production multiple ($/Million cubic feet per day) | $3,665.00 | Increase |
| | | Recovery value | Recovery value | $0.00 | Increase |
| | | Market approach | Transaction price | $100.00 | Increase |
| | | Discounted cash flow | Yield | 18.5% | Decrease |
| Bank Loan Obligations | $1,762,391 | Recovery value | Recovery value | $0.00 | Increase |
| | | Market approach | Transaction price | $95.00 | Increase |
| | | Indicative market price | Evaluated bid | $97.00 | Increase |
| | | | | | |
A Represents the directional change in the fair value of the Level 3 investments that could have resulted from an increase in the corresponding input as of period end. A decrease to the unobservable input would have had the opposite effect. Significant changes in these inputs may have resulted in a significantly higher or lower fair value measurement at period end.
Changes in valuation techniques may result in transfers in or out of an assigned level within the disclosure hierarchy. The aggregate value of investments by input level as of June 30, 2023, as well as a roll forward of Level 3 investments, is included at the end of the Fund's Schedule of Investments.
Investment Transactions and Income. For financial reporting purposes, the Fund's investment holdings and NAV include trades executed through the end of the last business day of the period. The NAV per share for processing shareholder transactions is calculated as of the close of business of the New York Stock Exchange (NYSE), normally 4:00 p.m. Eastern time and includes trades executed through the end of the prior business day. Gains and losses on securities sold are determined on the basis of identified cost and include proceeds received from litigation. Commissions paid to certain brokers with whom the investment adviser, or its affiliates, places trades on behalf of a fund include an amount in addition to trade execution, which may be rebated back to a fund. Any such rebates are included in net realized gain (loss) on investments in the Statement of Operations. Dividend income is recorded on the ex-dividend date, except for certain dividends from foreign securities where the ex-dividend date may have passed, which are recorded as soon as the Fund is informed of the ex-dividend date. Non-cash dividends included in dividend income, if any, are recorded at the fair market value of the securities received. Income and capital gain distributions from Fidelity Central Funds, if any, are recorded on the ex-dividend date. Interest income is accrued as earned and includes coupon interest and amortization of premium and accretion of discount on debt securities as applicable. Paid in Kind (PIK) income is recorded at the fair market value of the securities received. Debt obligations may be placed on non-accrual status and related interest income may be reduced by ceasing current accruals and writing off interest receivables when the collection of all or a portion of interest has become doubtful based on consistently applied procedures. A debt obligation is removed from non-accrual status when the issuer resumes interest payments or when collectability of interest is reasonably assured.
Class Allocations and Expenses. Investment income, realized and unrealized capital gains and losses, common expenses of a fund, and certain fund-level expense reductions, if any, are allocated daily on a pro-rata basis to each class based on the relative net assets of each class to the total net assets of a fund. Each class differs with respect to transfer agent and distribution and service plan fees incurred, as applicable. Certain expense reductions may also differ by class, if applicable. For the reporting period, the allocated portion of income and expenses to each class as a percent of its average net assets may vary due to the timing of recording these transactions in relation to fluctuating net assets of the classes. Expenses directly attributable to a fund are charged to that fund. Expenses attributable to more than one fund are allocated among the respective funds on the basis of relative net assets or other appropriate methods. Expenses included in the accompanying financial statements reflect the expenses of that fund and do not include any expenses associated with any underlying mutual funds or exchange-traded funds (ETFs). Although not included in a fund's expenses, a fund indirectly bears its proportionate share of these expenses through the net asset value of each underlying mutual fund or exchange-traded fund (ETF). Expense estimates are accrued in the period to which they relate and adjustments are made when actual amounts are known.
Income Tax Information and Distributions to Shareholders. Each year, the Fund intends to qualify as a regulated investment company under Subchapter M of the Internal Revenue Code, including distributing substantially all of its taxable income and realized gains. As a result, no provision for U.S. Federal income taxes is required. The Fund files a U.S. federal tax return, in addition to state and local tax returns as required. The Fund's federal income tax returns are subject to examination by the Internal Revenue Service (IRS) for a period of three fiscal years after they are filed. State and local tax returns may be subject to examination for an additional fiscal year depending on the jurisdiction.
Distributions are declared and recorded on the ex-dividend date. Income and capital gain distributions are declared separately for each class. Income and capital gain distributions are determined in accordance with income tax regulations, which may differ from GAAP.
Capital accounts within the financial statements are adjusted for permanent book-tax differences. These adjustments have no impact on net assets or the results of operations. Capital accounts are not adjusted for temporary book-tax differences which will reverse in a subsequent period.
Book-tax differences are primarily due to market discount, partnerships, capital loss carryforwards and losses deferred due to wash sales.
As of period end, the cost and unrealized appreciation (depreciation) in securities, and derivatives if applicable, for federal income tax purposes were as follows:
| Gross unrealized appreciation | $17,976,007 |
| Gross unrealized depreciation | (84,376,170) |
| Net unrealized appreciation (depreciation) | $(66,400,163) |
| Tax cost | $820,836,368 |
Capital loss carryforwards are only available to offset future capital gains of the Fund to the extent provided by regulations and may be limited. The capital loss carryforward information presented below, including any applicable limitation, is estimated as of prior fiscal period end and is subject to adjustment.
Short-term | $(48,034,496) |
Long-term | (61,599,252) |
| Total capital loss carryforward | $(109,633,748) |
Restricted Securities (including Private Placements). Funds may invest in securities that are subject to legal or contractual restrictions on resale. These securities generally may be resold in transactions exempt from registration or to the public if the securities are registered. Disposal of these securities may involve time-consuming negotiations and expense, and prompt sale at an acceptable price may be difficult. Information regarding restricted securities held at period end is included at the end of the Schedule of Investments, if applicable.
Loans and Other Direct Debt Instruments. Direct debt instruments are interests in amounts owed to lenders by corporate or other borrowers. These instruments may be in the form of loans, trade claims or other receivables and may include standby financing commitments such as revolving credit facilities that obligate a fund to supply additional cash to the borrower on demand. Loans may be acquired through assignment, participation, or may be made directly to a borrower. Such instruments are presented in the Bank Loan Obligations section in the Schedule of Investments. Certain funds may also invest in unfunded loan commitments, which are contractual obligations for future funding. Information regarding unfunded commitments is included at the end of the Schedule of Investments, if applicable.
Commitments. A commitment is an agreement to acquire an investment at a future date (subject to conditions) in connection with a potential public or non-public offering. The amount of commitments outstanding at period end are presented in the table below. These commitments are not included in the net assets of the Fund at period end.
| | Investment to be Acquired | Commitment Amount |
| VIP High Income Portfolio | Fidelity Private Credit Central Fund LLC | $2,398,010 |
New Accounting Pronouncement. In June 2022, the Financial Accounting Standards Board (FASB) issued Accounting Standards Update (ASU) 2022-03 Fair Value Measurement (Topic 820): Fair Value Measurement of Equity Securities Subject to Contractual Sale Restrictions. The amendments in this ASU clarify that a contractual restriction on the sale of an equity security is not considered part of the unit of account of the equity security and, therefore, is not considered in measuring fair value. They also clarify that an entity cannot, as a separate unit of account, recognize and measure a contractual sale restriction. They also require additional disclosures for equity securities subject to contractual sale restrictions. ASU 2022-03 will be effective for fiscal years, including interim periods within those fiscal years, beginning after December 15, 2023, and allows for early adoption. ASU 2022-03 will only be applicable to an equity security in which the contractual arrangement that restricts its sale is executed or modified on or after the adoption date. Management is currently evaluating the potential impact of ASU 2022-03 to the financial statements.
5. Purchases and Sales of Investments.
Purchases and sales of securities, other than short-term securities and in-kind transactions, as applicable, are noted in the table below.
| | Purchases ($) | Sales ($) |
| VIP High Income Portfolio | 233,293,088 | 223,871,787 |
6. Fees and Other Transactions with Affiliates.
Management Fee. Fidelity Management & Research Company LLC (the investment adviser) and its affiliates provide the Fund with investment management related services for which the Fund pays a monthly management fee. The management fee is the sum of an individual fund fee rate that is based on an annual rate of .45% of the Fund's average net assets and an annualized group fee rate that averaged .10% during the period. The group fee rate is based upon the monthly average net assets of a group of registered investment companies with which the investment adviser has management contracts. The group fee rate decreases as assets under management increase and increases as assets under management decrease. For the reporting period, the total annualized management fee rate was .55% of the Fund's average net assets.
Distribution and Service Plan Fees. In accordance with Rule 12b-1 of the 1940 Act, the Fund has adopted separate 12b-1 Plans for each Service Class of shares. Each Service Class pays Fidelity Distributors Company LLC (FDC), an affiliate of the investment adviser, a service fee. For the period, the service fee is based on an annual rate of .10% of Service Class' average net assets and .25% of Service Class 2's average net assets.
For the period, total fees, all of which were re-allowed to insurance companies for the distribution of shares and providing shareholder support services, were as follows:
| Service Class | $25,195 |
| Service Class 2 | 154,638 |
| | $179,833 |
Transfer Agent Fees. Fidelity Investments Institutional Operations Company LLC (FIIOC), an affiliate of the investment adviser, is the Fund's transfer, dividend disbursing, and shareholder servicing agent. FIIOC receives an asset-based fee with respect to each class. Each class pays a fee for transfer agent services, typesetting and printing and mailing of shareholder reports, excluding mailing of proxy statements. For the period, transfer agent fees for each class were as follows:
| | Amount | % of Class-Level Average Net Assets A |
| Initial Class | $80,885 | .07 |
| Service Class | 17,133 | .07 |
| Service Class 2 | 42,061 | .07 |
| Investor Class | 173,637 | .10 |
| | $313,716 | |
A Annualized
Accounting Fees. Fidelity Service Company, Inc. (FSC), an affiliate of the investment adviser, maintains the Fund's accounting records. The accounting fee is based on the level of average net assets for each month. For the period, the fees were equivalent to the following annualized rates:
| | % of Average Net Assets |
| VIP High Income Portfolio | .04 |
Brokerage Commissions. A portion of portfolio transactions were placed with brokerage firms which are affiliates of the investment adviser. Brokerage commissions are included in net realized gain (loss) and change in net unrealized appreciation (depreciation) in the Statement of Operations. The commissions paid to these affiliated firms were as follows:
| | Amount |
| VIP High Income Portfolio | $ 165 |
Interfund Lending Program. Pursuant to an Exemptive Order issued by the Securities and Exchange Commission (the SEC), the Fund, along with other registered investment companies having management contracts with Fidelity Management & Research Company LLC (FMR), or other affiliated entities of FMR, may participate in an interfund lending program. This program provides an alternative credit facility allowing the Fund to borrow from, or lend money to, other participating affiliated funds. At period end, there were no interfund loans outstanding. Activity in this program during the period for which loans were outstanding was as follows:
| | Borrower or Lender | Average Loan Balance | Weighted Average Interest Rate | Interest Expense |
| VIP High Income Portfolio | Borrower | $ 2,569,000 | 4.81% | $ 2,404 |
Interfund Trades. Funds may purchase from or sell securities to other Fidelity Funds under procedures adopted by the Board. The procedures have been designed to ensure these interfund trades are executed in accordance with Rule 17a-7 of the 1940 Act. Any interfund trades are included within the respective purchases and sales amounts shown in the Purchases and Sales of Investments note. During the period, there were no interfund trades.
7. Committed Line of Credit.
Certain Funds participate with other funds managed by the investment adviser or an affiliate in a $4.25 billion credit facility (the "line of credit") to be utilized for temporary or emergency purposes to fund shareholder redemptions or for other short-term liquidity purposes. The participating funds have agreed to pay commitment fees on their pro-rata portion of the line of credit, which are reflected in Miscellaneous expenses on the Statement of Operations, and are listed below. During the period, there were no borrowings on this line of credit.
| | Amount |
| VIP High Income Portfolio | $743 |
8. Security Lending.
Funds lend portfolio securities from time to time in order to earn additional income. Lending agents are used, including National Financial Services (NFS), an affiliate of the investment adviser. Pursuant to a securities lending agreement, NFS will receive a fee, which is capped at 9.9% of a fund's daily lending revenue, for its services as lending agent. A fund may lend securities to certain qualified borrowers, including NFS. On the settlement date of the loan, a fund receives collateral (in the form of U.S. Treasury obligations, letters of credit and/or cash) against the loaned securities and maintains collateral in an amount not less than 100% of the market value of the loaned securities during the period of the loan. The market value of the loaned securities is determined at the close of business of a fund and any additional required collateral is delivered to a fund on the next business day. A fund or borrower may terminate the loan at any time, and if the borrower defaults on its obligation to return the securities loaned because of insolvency or other reasons, a fund may apply collateral received from the borrower against the obligation. A fund may experience delays and costs in recovering the securities loaned. Any cash collateral received is invested in the Fidelity Securities Lending Cash Central Fund. Any loaned securities are identified as such in the Schedule of Investments, and the value of loaned securities and cash collateral at period end, as applicable, are presented in the Statement of Assets and Liabilities. Security lending income represents the income earned on investing cash collateral, less rebates paid to borrowers and any lending agent fees associated with the loan, plus any premium payments received for lending certain types of securities. Security lending income is presented in the Statement of Operations as a component of income from Fidelity Central Funds. Affiliated security lending activity, if any, was as follows:
| | Total Security Lending Fees Paid to NFS | Security Lending Income From Securities Loaned to NFS | Value of Securities Loaned to NFS at Period End |
| VIP High Income Portfolio | $9 | $ - | $- |
9. Expense Reductions.
The investment adviser has contractually agreed to waive the Fund's management fee with respect to the portion of the Fund's assets invested in Fidelity Private Credit Central Fund LLC until April 30, 2024. During the period, this waiver reduced the Fund's management fee by $3,081.
Through arrangements with the Fund's custodian, credits realized as a result of certain uninvested cash balances were used to reduce the Fund's expenses. During the period, custodian credits reduced the Fund's expenses by $5,671.
In addition, during the period the investment adviser or an affiliate reimbursed and/or waived a portion of fund-level operating expenses in the amount of $12,124.
10. Distributions to Shareholders.
Distributions to shareholders of each class were as follows:
| | Six months ended June 30, 2023 | Year ended December 31, 2022 |
| VIP High Income Portfolio | | |
| Distributions to shareholders | | |
| Initial Class | $159,425 | $12,725,157 |
| Service Class | 43,940 | 2,297,407 |
| Service Class 2 | 60,636 | 6,951,637 |
| Investor Class | 234,941 | 18,166,004 |
Total | $498,942 | $40,140,205 |
11. Share Transactions.
Transactions for each class of shares were as follows and may contain in-kind transactions:
| | Shares | Shares | Dollars | Dollars |
| | Six months ended June 30, 2023 | Year ended December 31, 2022 | Six months ended June 30, 2023 | Year ended December 31, 2022 |
| VIP High Income Portfolio | | | | |
| Initial Class | | | | |
| Shares sold | 2,048,345 | 8,972,527 | $9,233,882 | $43,454,864 |
| Reinvestment of distributions | 34,582 | 2,812,389 | 159,425 | 12,725,094 |
| Shares redeemed | (4,044,709) | (17,891,419) | (18,290,116) | (86,649,158) |
| Net increase (decrease) | (1,961,782) | (6,106,503) | $(8,896,809) | $(30,469,200) |
| Service Class | | | | |
| Shares sold | 9,379,468 | 9,351,371 | $42,630,115 | $44,866,682 |
| Reinvestment of distributions | 9,615 | 512,294 | 43,940 | 2,297,407 |
| Shares redeemed | (5,560,999) | (10,213,228) | (24,736,444) | (47,686,210) |
| Net increase (decrease) | 3,828,084 | (349,563) | $17,937,611 | $(522,121) |
| Service Class 2 | | | | |
| Shares sold | 4,279,292 | 14,698,776 | $18,609,474 | $67,799,017 |
| Reinvestment of distributions | 13,781 | 1,607,586 | 60,636 | 6,951,637 |
| Shares redeemed | (6,436,656) | (19,191,491) | (27,634,654) | (88,751,788) |
| Net increase (decrease) | (2,143,583) | (2,885,129) | $(8,964,544) | $(14,001,134) |
| Investor Class | | | | |
| Shares sold | 6,725,419 | 15,127,519 | $30,343,086 | $72,075,364 |
| Reinvestment of distributions | 51,297 | 4,041,803 | 234,941 | 18,165,818 |
| Shares redeemed | (9,186,690) | (26,866,685) | (40,909,242) | (128,716,412) |
| Net increase (decrease) | (2,409,974) | (7,697,363) | $(10,331,215) | $(38,475,230) |
12. Other.
A fund's organizational documents provide former and current trustees and officers with a limited indemnification against liabilities arising in connection with the performance of their duties to the fund. In the normal course of business, a fund may also enter into contracts that provide general indemnifications. A fund's maximum exposure under these arrangements is unknown as this would be dependent on future claims that may be made against a fund. The risk of material loss from such claims is considered remote.
At the end of the period, the investment adviser or its affiliates were owners of record of more than 10% and certain otherwise unaffiliated shareholders were owners of record of more than 10% of the outstanding shares as follows:
| Fund | Affiliated % | Number ofUnaffiliated Shareholders | Unaffiliated Shareholders % |
| VIP High Income Portfolio | 53% | 1 | 14% |
13. Litigation.
The Fund and other entities managed by FMR or its affiliates are involved with proceedings arising out of disputes in the United States Bankruptcy Court for the Southern District of Texas ("Bankruptcy Court"), relating to the In re Sanchez Energy Corporation chapter 11 bankruptcy case (Case No. 19-34508). A Bankruptcy Court-appointed representative of unsecured creditors asserted that eight million shares of Mesquite Energy, Inc. (formerly known as Sanchez Energy Corporation) (the "Company"), held in escrow pursuant to the terms of the Company's confirmed chapter 11 plan, should be awarded to the unsecured creditors instead of the Company's current equity holders, including the Fund, which were providers of debtor-in-possession financing to the Company during its chapter 11 case and holders of secured notes issued by the Company in 2018. The unsecured creditors also asserted that certain additional equity issued by the Company in 2020 in connection with two post-bankruptcy financings, also held by the Fund, is invalid. Subsequent to period-end, the Bankruptcy Court issued an opinion awarding a portion of the eight million shares to the unsecured creditors, diluting the value of the Fund's holdings in Mesquite. The Fund will appeal this decision. At this time, Management cannot determine any additional loss or dilution that may be realized. The Fund is also incurring legal costs in defending the disputes.
14. Risk and Uncertainties.
Many factors affect a fund's performance. Developments that disrupt global economies and financial markets, such as pandemics, epidemics, outbreaks of infectious diseases, war, terrorism, and environmental disasters, may significantly affect a fund's investment performance. The effects of these developments to a fund will be impacted by the types of securities in which a fund invests, the financial condition, industry, economic sector, and geographic location of an issuer, and a fund's level of investment in the securities of that issuer. Significant concentrations in security types, issuers, industries, sectors, and geographic locations may magnify the factors that affect a fund's performance.
As a shareholder, you incur two types of costs: (1) transaction costs, which may include sales charges (loads) on purchase payments or redemption proceeds, as applicable and (2) ongoing costs, which generally include management fees, distribution and/or service (12b-1) fees and other Fund expenses. This Example is intended to help you understand your ongoing costs (in dollars) of investing in a fund and to compare these costs with the ongoing costs of investing in other mutual funds.
| The Example is based on an investment of $1,000 invested at the beginning of the period and held for the entire period (January 1, 2023 to June 30, 2023). |
Actual Expenses
The first line of the accompanying table provides information about actual account values and actual expenses. You may use the information in this line, together with the amount you invested, to estimate the expenses that you paid over the period. Simply divide your account value by $1,000.00 (for example, an $8,600 account value divided by $1,000.00 = 8.6), then multiply the result by the number in the first line for a class/Fund under the heading entitled "Expenses Paid During Period" to estimate the expenses you paid on your account during this period. If any fund is a shareholder of any underlying mutual funds or exchange-traded funds (ETFs) (the Underlying Funds), such fund indirectly bears its proportional share of the expenses of the Underlying Funds in addition to the direct expenses incurred presented in the table. These fees and expenses are not included in the annualized expense ratio used to calculate the expense estimate in the table below. The estimate of expenses does not include any fees or other expenses of any variable annuity or variable life insurance product. If they were, the estimate of expenses you paid during the period would be higher, and your ending account value would be lower.
Hypothetical Example for Comparison Purposes
The second line of the accompanying table provides information about hypothetical account values and hypothetical expenses based on the actual expense ratio and an assumed rate of return of 5% per year before expenses, which is not the actual return. The hypothetical account values and expenses may not be used to estimate the actual ending account balance or expenses you paid for the period. You may use this information to compare the ongoing costs of investing in the Fund and other funds. To do so, compare this 5% hypothetical example with the 5% hypothetical examples that appear in the shareholder reports of the other funds. If any fund is a shareholder of any Underlying Funds, such fund indirectly bears its proportional share of the expenses of the Underlying Funds in addition to the direct expenses as presented in the table. These fees and expenses are not included in the annualized expense ratio used to calculate the expense estimate in the table below. The estimate of expenses does not include any fees or other expenses of any variable annuity or variable life insurance product. If they were, the estimate of expenses you paid during the period would be higher, and your ending account value would be lower.
Please note that the expenses shown in the table are meant to highlight your ongoing costs only and do not reflect any transaction costs. Therefore, the second line of the table is useful in comparing ongoing costs only, and will not help you determine the relative total costs of owning different funds. In addition, if these transactional costs were included, your costs would have been higher.
| | | | | Annualized Expense Ratio- A | | Beginning Account Value January 1, 2023 | | Ending Account Value June 30, 2023 | | Expenses Paid During Period- C January 1, 2023 to June 30, 2023 |
| VIP High Income Portfolio | | | | | | | | | | |
| Initial Class | | | | .69% | | | | | | |
| Actual | | | | | | $ 1,000 | | $ 1,041.50 | | $ 3.49 |
Hypothetical- B | | | | | | $ 1,000 | | $ 1,021.37 | | $ 3.46 |
| Service Class | | | | .79% | | | | | | |
| Actual | | | | | | $ 1,000 | | $ 1,041.90 | | $ 4.00 |
Hypothetical- B | | | | | | $ 1,000 | | $ 1,020.88 | | $ 3.96 |
| Service Class 2 | | | | .95% | | | | | | |
| Actual | | | | | | $ 1,000 | | $ 1,040.90 | | $ 4.81 |
Hypothetical- B | | | | | | $ 1,000 | | $ 1,020.08 | | $ 4.76 |
| Investor Class | | | | .73% | | | | | | |
| Actual | | | | | | $ 1,000 | | $ 1,041.80 | | $ 3.70 |
Hypothetical- B | | | | | | $ 1,000 | | $ 1,021.17 | | $ 3.66 |
| |
A Annualized expense ratio reflects expenses net of applicable fee waivers.
B 5% return per year before expenses
C Expenses are equal to the annualized expense ratio, multiplied by the average account value over the period, multiplied by 181/ 365 (to reflect the one-half year period). The fees and expenses of any Underlying Funds are not included in each annualized expense ratio.
Board Approval of Investment Advisory Contracts
VIP High Income Portfolio
At its May 2023 meeting, the Board of Trustees, including the Independent Trustees (together, the Board), voted to continue the management contract with Fidelity Management & Research Company LLC (FMR), and the sub-advisory agreements and sub-subadvisory agreements, in each case, where applicable (together, the Advisory Contracts) for the fund for two months from June 1, 2023 through July 31, 2023. The Board determined that it will consider the annual renewal of the fund's Advisory Contracts for a full one year period in July 2023, following its review of additional materials provided by FMR.
The Board considered that the approval of the fund's Advisory Contracts will not result in any changes in (i) the investment process or strategies employed in the management of the fund's assets; (ii) the fees and expenses paid by shareholders; (iii) the nature, extent or quality of services provided under the fund's Advisory Contracts; or (iv) the day-to-day management of the fund or the persons primarily responsible for such management. The Board also considered that since its last approval of the fund's Advisory Contracts, FMR had provided additional information on the fund in support of the annual contract renewal process, including competitive analyses on total expenses and management fees and in-depth reviews of fund performance and fund profitability information. The Board concluded that the fund's Advisory Contracts are fair and reasonable, and that the fund's Advisory Contracts should be renewed, without modification, through July 31, 2023, with the understanding that the Board will consider the annual renewal for a full one year period in July 2023.
In connection with its consideration of future renewals of the fund's Advisory Contracts, the Board will consider: (i) the nature, extent and quality of services provided to the fund, including shareholder and administrative services and investment performance; (ii) the competitiveness of the management fee and total expenses for the fund; (iii) the costs of the services and profitability, including the revenues earned and the expenses incurred in conducting the business of developing, marketing, distributing, managing, administering, and servicing the fund and its shareholders, to the extent applicable; and (iv) whether there have been economies of scale in respect of the Fidelity funds, whether the Fidelity funds (including the fund) have appropriately benefited from any such economies of scale, and whether there is the potential for realization of any further economies.
Based on its evaluation of all of the conclusions noted above, and after considering all factors it believed relevant, the Board ultimately concluded that the fund's management fee structure is fair and reasonable, and that the continuation of the fund's Advisory Contracts should be approved for two months from June 1, 2023 through July 31, 2023.
The Securities and Exchange Commission adopted Rule 22e-4 under the Investment Company Act of 1940 (the Liquidity Rule) to promote effective liquidity risk management throughout the open-end investment company industry, thereby reducing the risk that funds will be unable to meet their redemption obligations and mitigating dilution of the interests of fund shareholders.
The Fund has adopted and implemented a liquidity risk management program (the Program) reasonably designed to assess and manage the Fund's liquidity risk and to comply with the requirements of the Liquidity Rule. The Fund's Board of Trustees (the Board) has designated the Fund's investment adviser as administrator of the Program. The Fidelity advisers have established a Liquidity Risk Management Committee (the LRM Committee) to manage the Program for each of the Fidelity Funds. The LRM Committee monitors the adequacy and effectiveness of implementation of the Program and on a periodic basis assesses each Fund's liquidity risk based on a variety of factors including (1) the Fund's investment strategy, (2) portfolio liquidity and cash flow projections during normal and reasonably foreseeable stressed conditions, (3) shareholder redemptions, (4) borrowings and other funding sources and (5) certain factors specific to ETFs including the effect of the Fund's prices and spreads, market participants, and basket compositions on the overall liquidity of the Fund's portfolio, as applicable.
In accordance with the Program, each of the Fund's portfolio investments is classified into one of four defined liquidity categories based on a determination of a reasonable expectation for how long it would take to convert the investment to cash (or sell or dispose of the investment) without significantly changing its market value.
- Highly liquid investments - cash or convertible to cash within three business days or less
- Moderately liquid investments - convertible to cash in three to seven calendar days
- Less liquid investments - can be sold or disposed of, but not settled, within seven calendar days
- Illiquid investments - cannot be sold or disposed of within seven calendar days
Liquidity classification determinations take into account a variety of factors including various market, trading and investment-specific considerations, as well as market depth, and generally utilize analysis from a third-party liquidity metrics service.
The Liquidity Rule places a 15% limit on a fund's illiquid investments and requires funds that do not primarily hold assets that are highly liquid investments to determine and maintain a minimum percentage of the fund's net assets to be invested in highly liquid investments (highly liquid investment minimum or HLIM). The Program includes provisions reasonably designed to comply with the 15% limit on illiquid investments and for determining, periodically reviewing and complying with the HLIM requirement as applicable.
At a recent meeting of the Fund's Board of Trustees, the LRM Committee provided a written report to the Board pertaining to the operation, adequacy, and effectiveness of the Program for the period December 1, 2021 through November 30, 2022. The report concluded that the Program is operating effectively and is reasonably designed to assess and manage the Fund's liquidity risk.
1.705694.125
VIPHI-SANN-0823
Fidelity® Variable Insurance Products:
VIP Equity-Income Portfolio℠
Semi-Annual Report
June 30, 2023
Contents
To view a fund's proxy voting guidelines and proxy voting record for the 12-month period ended June 30, visit http://www.fidelity.com/proxyvotingresults or visit the Securities and Exchange Commission's (SEC) web site at http://www.sec.gov.
You may also call 1-877-208-0098 to request a free copy of the proxy voting guidelines.
Fidelity® Variable Insurance Products are separate account options which are purchased through a variable insurance contract.
Standard & Poor's, S&P and S&P 500 are registered service marks of The McGraw-Hill Companies, Inc. and have been licensed for use by Fidelity Distributors Corporation.
Other third-party marks appearing herein are the property of their respective owners.
All other marks appearing herein are registered or unregistered trademarks or service marks of FMR LLC or an affiliated company. © 2023 FMR LLC. All rights reserved.
This report and the financial statements contained herein are submitted for the general information of the shareholders of the Fund. This report is not authorized for distribution to prospective investors in the Fund unless preceded or accompanied by an effective prospectus.
A fund files its complete schedule of portfolio holdings with the SEC for the first and third quarters of each fiscal year on Form N-PORT. Forms N-PORT are available on the SEC's web site at http://www.sec.gov. A fund's Forms N-PORT may be reviewed and copied at the SEC's Public Reference Room in Washington, DC. Information regarding the operation of the SEC's Public Reference Room may be obtained by calling 1-800-SEC-0330.
For a complete list of a fund's portfolio holdings, view the most recent holdings listing, semiannual report, or annual report on Fidelity's web site at http://www.fidelity.com, http://www.institutional.fidelity.com, or http://www.401k.com, as applicable.
NOT FDIC INSURED •MAY LOSE VALUE •NO BANK GUARANTEE
Neither the Fund nor Fidelity Distributors Corporation is a bank.
This report and the financial statements contained herein are submitted for the general information of the shareholders of the Fund. This report is not authorized for distribution to prospective investors in the Fund unless preceded or accompanied by an effective prospectus.
A fund files its complete schedule of portfolio holdings with the SEC for the first and third quarters of each fiscal year on Form N-PORT. Forms N-PORT are available on the SEC's web site at http://www.sec.gov. A fund's Forms N-PORT may be reviewed and copied at the SEC's Public Reference Room in Washington, DC. Information regarding the operation of the SEC's Public Reference Room may be obtained by calling 1-800-SEC-0330.
For a complete list of a fund's portfolio holdings, view the most recent holdings listing, semiannual report, or annual report on Fidelity's web site at http://www.fidelity.com, http://www.institutional.fidelity.com, or http://www.401k.com, as applicable.
NOT FDIC INSURED •MAY LOSE VALUE •NO BANK GUARANTEE
Neither the Fund nor Fidelity Distributors Corporation is a bank.
Top Holdings (% of Fund's net assets) |
| |
| JPMorgan Chase & Co. | 3.5 | |
| Exxon Mobil Corp. | 3.2 | |
| Johnson & Johnson | 2.2 | |
| Linde PLC | 2.2 | |
| Bank of America Corp. | 2.1 | |
| Danaher Corp. | 1.9 | |
| Cisco Systems, Inc. | 1.8 | |
| Procter & Gamble Co. | 1.6 | |
| McDonald's Corp. | 1.6 | |
| Merck & Co., Inc. | 1.6 | |
| | 21.7 | |
| |
| Market Sectors (% of Fund's net assets) |
| |
| Health Care | 17.2 | |
| Financials | 15.9 | |
| Industrials | 11.3 | |
| Information Technology | 11.2 | |
| Consumer Staples | 10.4 | |
| Energy | 7.7 | |
| Communication Services | 6.2 | |
| Utilities | 5.7 | |
| Materials | 4.9 | |
| Consumer Discretionary | 4.3 | |
| Real Estate | 2.1 | |
| |
Asset Allocation (% of Fund's net assets) |
|
|
Showing Percentage of Net Assets
| Common Stocks - 96.9% |
| | | Shares | Value ($) |
| COMMUNICATION SERVICES - 6.2% | | | |
| Diversified Telecommunication Services - 1.5% | | | |
| AT&T, Inc. | | 2,184,370 | 34,840,702 |
| Verizon Communications, Inc. | | 1,386,560 | 51,566,166 |
| | | | 86,406,868 |
| Entertainment - 0.6% | | | |
| Activision Blizzard, Inc. | | 382,300 | 32,227,890 |
| Interactive Media & Services - 1.3% | | | |
| Alphabet, Inc. Class A (a) | | 637,460 | 76,303,962 |
| Media - 1.7% | | | |
| Comcast Corp. Class A | | 1,827,633 | 75,938,151 |
| Interpublic Group of Companies, Inc. | | 471,373 | 18,185,570 |
| | | | 94,123,721 |
| Wireless Telecommunication Services - 1.1% | | | |
| Rogers Communications, Inc. Class B (non-vtg.) | | 313,900 | 14,321,280 |
| T-Mobile U.S., Inc. (a) | | 352,518 | 48,964,750 |
| | | | 63,286,030 |
TOTAL COMMUNICATION SERVICES | | | 352,348,471 |
| CONSUMER DISCRETIONARY - 4.3% | | | |
| Diversified Consumer Services - 0.2% | | | |
| H&R Block, Inc. | | 377,000 | 12,014,990 |
| Hotels, Restaurants & Leisure - 1.6% | | | |
| McDonald's Corp. | | 307,580 | 91,784,948 |
| Specialty Retail - 2.2% | | | |
| Best Buy Co., Inc. | | 132,500 | 10,858,375 |
| Burlington Stores, Inc. (a) | | 144,378 | 22,723,653 |
| Dick's Sporting Goods, Inc. | | 21,700 | 2,868,523 |
| Lowe's Companies, Inc. | | 69,200 | 15,618,440 |
| TJX Companies, Inc. | | 828,174 | 70,220,873 |
| | | | 122,289,864 |
| Textiles, Apparel & Luxury Goods - 0.3% | | | |
| Columbia Sportswear Co. | | 47,100 | 3,638,004 |
| Tapestry, Inc. | | 321,500 | 13,760,200 |
| | | | 17,398,204 |
TOTAL CONSUMER DISCRETIONARY | | | 243,488,006 |
| CONSUMER STAPLES - 10.4% | | | |
| Beverages - 1.7% | | | |
| Keurig Dr. Pepper, Inc. | | 1,404,300 | 43,912,461 |
| The Coca-Cola Co. | | 895,646 | 53,935,802 |
| | | | 97,848,263 |
| Consumer Staples Distribution & Retail - 4.2% | | | |
| Albertsons Companies, Inc. | | 368,700 | 8,045,034 |
| Alimentation Couche-Tard, Inc. Class A (multi-vtg.) | | 325,700 | 16,701,114 |
| BJ's Wholesale Club Holdings, Inc. (a) | | 385,405 | 24,284,369 |
| Costco Wholesale Corp. | | 43,000 | 23,150,340 |
| Dollar Tree, Inc. (a) | | 305,800 | 43,882,300 |
| Metro, Inc. | | 348,200 | 19,665,842 |
| Target Corp. | | 83,108 | 10,961,945 |
| Walmart, Inc. | | 568,945 | 89,426,775 |
| | | | 236,117,719 |
| Food Products - 1.2% | | | |
| Bunge Ltd. | | 253,300 | 23,898,855 |
| Mondelez International, Inc. | | 636,871 | 46,453,371 |
| | | | 70,352,226 |
| Household Products - 1.6% | | | |
| Procter & Gamble Co. | | 613,244 | 93,053,645 |
| Personal Care Products - 0.6% | | | |
| Estee Lauder Companies, Inc. Class A | | 88,600 | 17,399,268 |
| Kenvue, Inc. | | 370,100 | 9,778,042 |
| Unilever PLC | | 157,900 | 8,222,522 |
| | | | 35,399,832 |
| Tobacco - 1.1% | | | |
| Philip Morris International, Inc. | | 630,800 | 61,578,696 |
TOTAL CONSUMER STAPLES | | | 594,350,381 |
| ENERGY - 7.7% | | | |
| Oil, Gas & Consumable Fuels - 7.7% | | | |
| Canadian Natural Resources Ltd. | | 672,800 | 37,826,114 |
| ConocoPhillips Co. | | 652,504 | 67,605,939 |
| Enterprise Products Partners LP | | 1,365,744 | 35,987,354 |
| Exxon Mobil Corp. | | 1,708,366 | 183,222,254 |
| Hess Corp. | | 294,500 | 40,037,275 |
| Imperial Oil Ltd. | | 766,135 | 39,198,815 |
| Phillips 66 Co. | | 195,400 | 18,637,252 |
| Valero Energy Corp. | | 154,134 | 18,079,918 |
| | | | 440,594,921 |
| FINANCIALS - 15.9% | | | |
| Banks - 9.5% | | | |
| Bank of America Corp. | | 4,169,009 | 119,608,868 |
| Huntington Bancshares, Inc. | | 2,802,170 | 30,207,393 |
| JPMorgan Chase & Co. | | 1,384,075 | 201,299,870 |
| M&T Bank Corp. | | 280,767 | 34,747,724 |
| PNC Financial Services Group, Inc. | | 562,100 | 70,796,495 |
| Wells Fargo & Co. | | 1,981,001 | 84,549,123 |
| | | | 541,209,473 |
| Consumer Finance - 0.6% | | | |
| Capital One Financial Corp. | | 289,916 | 31,708,113 |
| Financial Services - 1.1% | | | |
| Edenred SA | | 417,400 | 27,938,338 |
| Visa, Inc. Class A | | 147,042 | 34,919,534 |
| | | | 62,857,872 |
| Insurance - 4.7% | | | |
| American Financial Group, Inc. | | 278,600 | 33,083,750 |
| Chubb Ltd. | | 400,282 | 77,078,302 |
| Hartford Financial Services Group, Inc. | | 802,400 | 57,788,848 |
| Marsh & McLennan Companies, Inc. | | 242,700 | 45,647,016 |
| The Travelers Companies, Inc. | | 310,240 | 53,876,278 |
| | | | 267,474,194 |
TOTAL FINANCIALS | | | 903,249,652 |
| HEALTH CARE - 17.2% | | | |
| Biotechnology - 1.6% | | | |
| AbbVie, Inc. | | 37,610 | 5,067,195 |
| Amgen, Inc. | | 79,597 | 17,672,126 |
| Gilead Sciences, Inc. | | 884,200 | 68,145,294 |
| | | | 90,884,615 |
| Health Care Providers & Services - 3.0% | | | |
| Cigna Group | | 298,209 | 83,677,445 |
| UnitedHealth Group, Inc. | | 178,912 | 85,992,264 |
| | | | 169,669,709 |
| Life Sciences Tools & Services - 1.9% | | | |
| Danaher Corp. | | 457,568 | 109,816,320 |
| Pharmaceuticals - 10.7% | | | |
| AstraZeneca PLC (United Kingdom) | | 500,036 | 71,682,300 |
| Bristol-Myers Squibb Co. | | 1,002,337 | 64,099,451 |
| Eli Lilly & Co. | | 170,558 | 79,988,291 |
| Johnson & Johnson | | 755,596 | 125,066,250 |
| Merck & Co., Inc. | | 792,700 | 91,469,653 |
| Roche Holding AG (participation certificate) | | 236,951 | 72,381,436 |
| Royalty Pharma PLC | | 1,009,200 | 31,022,808 |
| Sanofi SA | | 709,255 | 76,355,404 |
| | | | 612,065,593 |
TOTAL HEALTH CARE | | | 982,436,237 |
| INDUSTRIALS - 11.3% | | | |
| Aerospace & Defense - 3.0% | | | |
| Huntington Ingalls Industries, Inc. | | 140,500 | 31,977,800 |
| Lockheed Martin Corp. | | 15,401 | 7,090,312 |
| Northrop Grumman Corp. | | 98,901 | 45,079,076 |
| The Boeing Co. (a) | | 411,800 | 86,955,688 |
| | | | 171,102,876 |
| Air Freight & Logistics - 0.8% | | | |
| United Parcel Service, Inc. Class B | | 260,414 | 46,679,210 |
| Building Products - 0.6% | | | |
| Johnson Controls International PLC | | 472,200 | 32,175,708 |
| Commercial Services & Supplies - 0.2% | | | |
| GFL Environmental, Inc. | | 296,474 | 11,512,076 |
| Electrical Equipment - 1.1% | | | |
| AMETEK, Inc. | | 305,552 | 49,462,758 |
| Regal Rexnord Corp. | | 93,900 | 14,451,210 |
| | | | 63,913,968 |
| Industrial Conglomerates - 2.3% | | | |
| General Electric Co. | | 797,020 | 87,552,647 |
| Hitachi Ltd. | | 269,900 | 16,781,440 |
| Siemens AG | | 159,029 | 26,510,271 |
| | | | 130,844,358 |
| Machinery - 2.1% | | | |
| Crane Co. | | 252,600 | 22,511,712 |
| Crane Nxt Co. | | 276,000 | 15,577,440 |
| Fortive Corp. | | 368,916 | 27,583,849 |
| ITT, Inc. | | 575,214 | 53,615,697 |
| | | | 119,288,698 |
| Professional Services - 0.6% | | | |
| Experian PLC | | 179,808 | 6,901,211 |
| KBR, Inc. | | 329,800 | 21,456,788 |
| Paychex, Inc. | | 45,400 | 5,078,898 |
| | | | 33,436,897 |
| Trading Companies & Distributors - 0.6% | | | |
| Watsco, Inc. (b) | | 83,758 | 31,951,164 |
TOTAL INDUSTRIALS | | | 640,904,955 |
| INFORMATION TECHNOLOGY - 11.2% | | | |
| Communications Equipment - 1.8% | | | |
| Cisco Systems, Inc. | | 2,021,554 | 104,595,204 |
| IT Services - 1.9% | | | |
| Accenture PLC Class A | | 146,700 | 45,268,686 |
| Amdocs Ltd. | | 615,433 | 60,835,552 |
| | | | 106,104,238 |
| Semiconductors & Semiconductor Equipment - 3.3% | | | |
| Analog Devices, Inc. | | 259,300 | 50,514,233 |
| NXP Semiconductors NV | | 335,600 | 68,690,608 |
| Taiwan Semiconductor Manufacturing Co. Ltd. sponsored ADR | | 704,391 | 71,087,140 |
| | | | 190,291,981 |
| Software - 2.7% | | | |
| Gen Digital, Inc. | | 692,900 | 12,853,295 |
| Microsoft Corp. | | 222,350 | 75,719,069 |
| Roper Technologies, Inc. | | 134,894 | 64,857,035 |
| | | | 153,429,399 |
| Technology Hardware, Storage & Peripherals - 1.5% | | | |
| Apple, Inc. | | 87,429 | 16,958,603 |
| Samsung Electronics Co. Ltd. | | 1,121,876 | 61,777,926 |
| Seagate Technology Holdings PLC | | 105,100 | 6,502,537 |
| | | | 85,239,066 |
TOTAL INFORMATION TECHNOLOGY | | | 639,659,888 |
| MATERIALS - 4.9% | | | |
| Chemicals - 2.2% | | | |
| Linde PLC | | 324,689 | 123,732,484 |
| Containers & Packaging - 1.5% | | | |
| Ball Corp. | | 595,300 | 34,652,413 |
| Crown Holdings, Inc. | | 584,959 | 50,815,388 |
| | | | 85,467,801 |
| Metals & Mining - 1.2% | | | |
| Freeport-McMoRan, Inc. | | 1,760,600 | 70,424,000 |
TOTAL MATERIALS | | | 279,624,285 |
| REAL ESTATE - 2.1% | | | |
| Equity Real Estate Investment Trusts (REITs) - 2.1% | | | |
| American Tower Corp. | | 181,873 | 35,272,450 |
| Lamar Advertising Co. Class A | | 524,207 | 52,027,545 |
| Public Storage | | 113,096 | 33,010,460 |
| | | | 120,310,455 |
| UTILITIES - 5.7% | | | |
| Electric Utilities - 3.8% | | | |
| Constellation Energy Corp. | | 318,549 | 29,163,161 |
| Exelon Corp. | | 569,949 | 23,219,722 |
| FirstEnergy Corp. | | 472,800 | 18,382,464 |
| NextEra Energy, Inc. | | 1,020,116 | 75,692,607 |
| PG&E Corp. (a) | | 1,260,700 | 21,784,896 |
| Southern Co. | | 691,400 | 48,570,850 |
| | | | 216,813,700 |
| Independent Power and Renewable Electricity Producers - 0.4% | | | |
| Vistra Corp. | | 765,701 | 20,099,651 |
| Multi-Utilities - 1.5% | | | |
| Ameren Corp. | | 266,158 | 21,737,124 |
| CenterPoint Energy, Inc. | | 730,968 | 21,307,717 |
| Dominion Energy, Inc. | | 359,600 | 18,623,684 |
| WEC Energy Group, Inc. | | 262,225 | 23,138,734 |
| | | | 84,807,259 |
TOTAL UTILITIES | | | 321,720,610 |
| TOTAL COMMON STOCKS (Cost $3,832,590,535) | | | 5,518,687,861 |
| | | | |
| Money Market Funds - 3.7% |
| | | Shares | Value ($) |
| Fidelity Cash Central Fund 5.14% (c) | | 187,325,066 | 187,362,531 |
| Fidelity Securities Lending Cash Central Fund 5.14% (c)(d) | | 24,483,552 | 24,486,000 |
| TOTAL MONEY MARKET FUNDS (Cost $211,848,531) | | | 211,848,531 |
| | | | |
| TOTAL INVESTMENT IN SECURITIES - 100.6% (Cost $4,044,439,066) | 5,730,536,392 |
NET OTHER ASSETS (LIABILITIES) - (0.6)% | (31,705,291) |
| NET ASSETS - 100.0% | 5,698,831,101 |
| | |
Legend
| (b) | Security or a portion of the security is on loan at period end. |
| (c) | Affiliated fund that is generally available only to investment companies and other accounts managed by Fidelity Investments. The rate quoted is the annualized seven-day yield of the fund at period end. A complete unaudited listing of the fund's holdings as of its most recent quarter end is available upon request. In addition, each Fidelity Central Fund's financial statements are available on the SEC's website or upon request. |
| (d) | Investment made with cash collateral received from securities on loan. |
Affiliated Central Funds
Fiscal year to date information regarding the Fund's investments in Fidelity Central Funds, including the ownership percentage, is presented below.
| Affiliate | Value, beginning of period ($) | Purchases ($) | Sales Proceeds ($) | Dividend Income ($) | Realized Gain (loss) ($) | Change in Unrealized appreciation (depreciation) ($) | Value, end of period ($) | % ownership, end of period |
| Fidelity Cash Central Fund 5.14% | 210,287,544 | 258,015,383 | 280,940,396 | 5,633,857 | - | - | 187,362,531 | 0.5% |
| Fidelity Securities Lending Cash Central Fund 5.14% | 5,258,100 | 205,703,174 | 186,475,274 | 18,211 | - | - | 24,486,000 | 0.1% |
| Total | 215,545,644 | 463,718,557 | 467,415,670 | 5,652,068 | - | - | 211,848,531 | |
| | | | | | | | | |
Amounts in the dividend income column in the above table include any capital gain distributions from underlying funds, which are presented in the corresponding line item in the Statement of Operations, if applicable.
Amounts in the dividend income column for Fidelity Securities Lending Cash Central Fund represents the income earned on investing cash collateral, less rebates paid to borrowers and any lending agent fees associated with the loan, plus any premium payments received for lending certain types of securities.
Amounts included in the purchases and sales proceeds columns may include in-kind transactions, if applicable.
Investment Valuation
The following is a summary of the inputs used, as of June 30, 2023, involving the Fund's assets and liabilities carried at fair value. The inputs or methodology used for valuing securities may not be an indication of the risk associated with investing in those securities. For more information on valuation inputs, and their aggregation into the levels used below, please refer to the Investment Valuation section in the accompanying Notes to Financial Statements.
| Valuation Inputs at Reporting Date: |
| Description | Total ($) | Level 1 ($) | Level 2 ($) | Level 3 ($) |
Investments in Securities: | | | | |
|
| Equities: | | | | |
Communication Services | 352,348,471 | 352,348,471 | - | - |
Consumer Discretionary | 243,488,006 | 243,488,006 | - | - |
Consumer Staples | 594,350,381 | 586,127,859 | 8,222,522 | - |
Energy | 440,594,921 | 440,594,921 | - | - |
Financials | 903,249,652 | 903,249,652 | - | - |
Health Care | 982,436,237 | 762,017,097 | 220,419,140 | - |
Industrials | 640,904,955 | 590,712,033 | 50,192,922 | - |
Information Technology | 639,659,888 | 577,881,962 | 61,777,926 | - |
Materials | 279,624,285 | 279,624,285 | - | - |
Real Estate | 120,310,455 | 120,310,455 | - | - |
Utilities | 321,720,610 | 321,720,610 | - | - |
|
| Money Market Funds | 211,848,531 | 211,848,531 | - | - |
| Total Investments in Securities: | 5,730,536,392 | 5,389,923,882 | 340,612,510 | - |
| Statement of Assets and Liabilities |
| | | | June 30, 2023 (Unaudited) |
| | | | | |
| Assets | | | | |
| Investment in securities, at value (including securities loaned of $24,261,492) - See accompanying schedule: | | | | |
Unaffiliated issuers (cost $3,832,590,535) | $ | 5,518,687,861 | | |
Fidelity Central Funds (cost $211,848,531) | | 211,848,531 | | |
| | | | | |
| | | | | |
| Total Investment in Securities (cost $4,044,439,066) | | | $ | 5,730,536,392 |
| Cash | | | | 1,267,241 |
| Foreign currency held at value (cost $2,069,476) | | | | 2,069,476 |
| Receivable for investments sold | | | | 9,613,135 |
| Receivable for fund shares sold | | | | 6,071,694 |
| Dividends receivable | | | | 9,517,973 |
| Distributions receivable from Fidelity Central Funds | | | | 933,854 |
| Other receivables | | | | 16,614 |
Total assets | | | | 5,760,026,379 |
| Liabilities | | | | |
| Payable for investments purchased | $ | 26,318,983 | | |
| Payable for fund shares redeemed | | 7,599,472 | | |
| Accrued management fee | | 1,976,691 | | |
| Distribution and service plan fees payable | | 334,183 | | |
| Other affiliated payables | | 412,801 | | |
| Other payables and accrued expenses | | 67,148 | | |
| Collateral on securities loaned | | 24,486,000 | | |
| Total Liabilities | | | | 61,195,278 |
| Net Assets | | | $ | 5,698,831,101 |
| Net Assets consist of: | | | | |
| Paid in capital | | | $ | 3,823,529,637 |
| Total accumulated earnings (loss) | | | | 1,875,301,464 |
| Net Assets | | | $ | 5,698,831,101 |
| | | | | |
| Net Asset Value and Maximum Offering Price | | | | |
| Initial Class : | | | | |
Net Asset Value , offering price and redemption price per share ($3,285,818,843 ÷ 134,225,906 shares) | | | $ | 24.48 |
| Service Class : | | | | |
Net Asset Value , offering price and redemption price per share ($284,527,694 ÷ 11,716,404 shares) | | | $ | 24.28 |
| Service Class 2 : | | | | |
Net Asset Value , offering price and redemption price per share ($1,514,079,972 ÷ 64,226,202 shares) | | | $ | 23.57 |
| Investor Class : | | | | |
Net Asset Value , offering price and redemption price per share ($614,404,592 ÷ 25,303,193 shares) | | | $ | 24.28 |
| Statement of Operations |
| | | | Six months ended June 30, 2023 (Unaudited) |
| Investment Income | | | | |
| Dividends | | | $ | 68,407,494 |
| Income from Fidelity Central Funds (including $18,211 from security lending) | | | | 5,652,068 |
| Total Income | | | | 74,059,562 |
| Expenses | | | | |
| Management fee | $ | 11,926,386 | | |
| Transfer agent fees | | 1,993,610 | | |
| Distribution and service plan fees | | 2,021,156 | | |
| Accounting fees | | 491,753 | | |
| Custodian fees and expenses | | 33,194 | | |
| Independent trustees' fees and expenses | | 18,581 | | |
| Audit | | 47,163 | | |
| Legal | | 11,164 | | |
| Miscellaneous | | 15,914 | | |
| Total expenses before reductions | | 16,558,921 | | |
| Expense reductions | | (133,881) | | |
| Total expenses after reductions | | | | 16,425,040 |
| Net Investment income (loss) | | | | 57,634,522 |
| Realized and Unrealized Gain (Loss) | | | | |
| Net realized gain (loss) on: | | | | |
| Investment Securities: | | | | |
| Unaffiliated issuers | | 147,904,003 | | |
| Foreign currency transactions | | 61,739 | | |
| Total net realized gain (loss) | | | | 147,965,742 |
| Change in net unrealized appreciation (depreciation) on: | | | | |
| Investment Securities: | | | | |
| Unaffiliated issuers | | 8,414,146 | | |
| Assets and liabilities in foreign currencies | | 53,985 | | |
| Total change in net unrealized appreciation (depreciation) | | | | 8,468,131 |
| Net gain (loss) | | | | 156,433,873 |
| Net increase (decrease) in net assets resulting from operations | | | $ | 214,068,395 |
| Statement of Changes in Net Assets |
| |
| | Six months ended June 30, 2023 (Unaudited) | | Year ended December 31, 2022 |
| Increase (Decrease) in Net Assets | | | | |
| Operations | | | | |
| Net investment income (loss) | $ | 57,634,522 | $ | 107,679,155 |
| Net realized gain (loss) | | 147,965,742 | | 189,124,702 |
| Change in net unrealized appreciation (depreciation) | | 8,468,131 | | (623,257,072) |
| Net increase (decrease) in net assets resulting from operations | | 214,068,395 | | (326,453,215) |
| Distributions to shareholders | | - | | (298,100,306) |
| | | | | |
| Share transactions - net increase (decrease) | | (143,814,897) | | (127,565,741) |
| Total increase (decrease) in net assets | | 70,253,498 | | (752,119,262) |
| | | | | |
| Net Assets | | | | |
| Beginning of period | | 5,628,577,603 | | 6,380,696,865 |
| End of period | $ | 5,698,831,101 | $ | 5,628,577,603 |
| | | | | |
| | | | | |
| VIP Equity-Income Portfolio℠ Initial Class |
| |
| | Six months ended (Unaudited) June 30, 2023 | | Years ended December 31, 2022 | | 2021 | | 2020 | | 2019 | | 2018 |
Selected Per-Share Data | | | | | | | | | | | | |
| Net asset value, beginning of period | $ | 23.56 | $ | 26.15 | $ | 23.90 | $ | 23.77 | $ | 20.37 | $ | 23.89 |
| Income from Investment Operations | | | | | | | | | | | | |
Net investment income (loss) A,B | | .25 | | .48 | | .43 | | .39 | | .46 | | .58 |
| Net realized and unrealized gain (loss) | | .67 | | (1.76) | | 5.29 | | 1.12 | | 4.84 | | (2.50) |
| Total from investment operations | | .92 | | (1.28) | | 5.72 | | 1.51 | | 5.30 | | (1.92) |
| Distributions from net investment income | | - | | (.47) C | | (.51) | | (.39) | | (.45) | | (.52) |
| Distributions from net realized gain | | - | | (.84) C | | (2.95) | | (.99) | | (1.45) | | (1.07) |
| Total distributions | | - | | (1.31) | | (3.47) D | | (1.38) | | (1.90) | | (1.60) D |
| Net asset value, end of period | $ | 24.48 | $ | 23.56 | $ | 26.15 | $ | 23.90 | $ | 23.77 | $ | 20.37 |
Total Return E,F,G | | 3.90% | | (4.96)% | | 24.89% | | 6.69% | | 27.44% | | (8.29)% |
Ratios to Average Net Assets B,H,I | | | | | | | | | | | | |
| Expenses before reductions | | .51% J | | .51% | | .51% | | .53% | | .53% | | .53% |
| Expenses net of fee waivers, if any | | .51% J | | .51% | | .51% | | .53% | | .53% | | .53% |
| Expenses net of all reductions | | .51% J | | .51% | | .51% | | .52% | | .52% | | .52% |
| Net investment income (loss) | | 2.14% J | | 1.94% | | 1.63% | | 1.87% | | 2.11% | | 2.53% |
| Supplemental Data | | | | | | | | | | | | |
| Net assets, end of period (000 omitted) | $ | 3,285,819 | $ | 3,235,040 | $ | 3,766,480 | $ | 3,185,391 | $ | 3,202,982 | $ | 2,804,988 |
Portfolio turnover rate K | | 31% J | | 20% | | 27% | | 57% | | 32% | | 39% |
A Calculated based on average shares outstanding during the period.
B Net investment income (loss) is affected by the timing of the declaration of dividends by any underlying mutual funds or exchange-traded funds (ETFs). Net investment income (loss) of any mutual funds or ETFs is not included in the Fund's net investment income (loss) ratio.
C The amount shown reflects reclassifications related to book to tax differences that were made in the year shown.
D Total distributions per share do not sum due to rounding.
E Total returns for periods of less than one year are not annualized.
F Total returns do not reflect charges attributable to your insurance company's separate account. Inclusion of these charges would reduce the total returns shown.
G Total returns would have been lower if certain expenses had not been reduced during the applicable periods shown.
H Fees and expenses of any underlying mutual funds or exchange-traded funds (ETFs) are not included in the Fund's expense ratio. The Fund indirectly bears its proportionate share of these expenses. For additional expense information related to investments in Fidelity Central Funds, please refer to the "Investments in Fidelity Central Funds" note found in the Notes to Financial Statements section of the most recent Annual or Semi-Annual report.
I Expense ratios reflect operating expenses of the class. Expenses before reductions do not reflect amounts reimbursed, waived, or reduced through arrangements with the investment adviser, brokerage services, or other offset arrangements, if applicable, and do not represent the amount paid by the class during periods when reimbursements, waivers or reductions occur.
J Annualized.
K Amount does not include the portfolio activity of any underlying mutual funds or exchange-traded funds (ETFs).
| VIP Equity-Income Portfolio℠ Service Class |
| |
| | Six months ended (Unaudited) June 30, 2023 | | Years ended December 31, 2022 | | 2021 | | 2020 | | 2019 | | 2018 |
Selected Per-Share Data | | | | | | | | | | | | |
| Net asset value, beginning of period | $ | 23.38 | $ | 25.97 | $ | 23.74 | $ | 23.63 | $ | 20.26 | $ | 23.77 |
| Income from Investment Operations | | | | | | | | | | | | |
Net investment income (loss) A,B | | .24 | | .45 | | .40 | | .37 | | .44 | | .55 |
| Net realized and unrealized gain (loss) | | .66 | | (1.75) | | 5.26 | | 1.10 | | 4.81 | | (2.49) |
| Total from investment operations | | .90 | | (1.30) | | 5.66 | | 1.47 | | 5.25 | | (1.94) |
| Distributions from net investment income | | - | | (.45) C | | (.48) | | (.37) | | (.43) | | (.50) |
| Distributions from net realized gain | | - | | (.84) C | | (2.95) | | (.99) | | (1.45) | | (1.07) |
| Total distributions | | - | | (1.29) | | (3.43) | | (1.36) | | (1.88) | | (1.57) |
| Net asset value, end of period | $ | 24.28 | $ | 23.38 | $ | 25.97 | $ | 23.74 | $ | 23.63 | $ | 20.26 |
Total Return D,E,F | | 3.85% | | (5.09)% | | 24.83% | | 6.55% | | 27.32% | | (8.40)% |
Ratios to Average Net Assets B,G,H | | | | | | | | | | | | |
| Expenses before reductions | | .61% I | | .61% | | .61% | | .63% | | .63% | | .63% |
| Expenses net of fee waivers, if any | | .61% I | | .61% | | .61% | | .63% | | .63% | | .63% |
| Expenses net of all reductions | | .61% I | | .61% | | .61% | | .62% | | .62% | | .62% |
| Net investment income (loss) | | 2.04% I | | 1.84% | | 1.53% | | 1.77% | | 2.01% | | 2.43% |
| Supplemental Data | | | | | | | | | | | | |
| Net assets, end of period (000 omitted) | $ | 284,528 | $ | 286,805 | $ | 326,787 | $ | 284,767 | $ | 299,079 | $ | 264,055 |
Portfolio turnover rate J | | 31% I | | 20% | | 27% | | 57% | | 32% | | 39% |
A Calculated based on average shares outstanding during the period.
B Net investment income (loss) is affected by the timing of the declaration of dividends by any underlying mutual funds or exchange-traded funds (ETFs). Net investment income (loss) of any mutual funds or ETFs is not included in the Fund's net investment income (loss) ratio.
C The amount shown reflects reclassifications related to book to tax differences that were made in the year shown.
D Total returns for periods of less than one year are not annualized.
E Total returns do not reflect charges attributable to your insurance company's separate account. Inclusion of these charges would reduce the total returns shown.
F Total returns would have been lower if certain expenses had not been reduced during the applicable periods shown.
G Fees and expenses of any underlying mutual funds or exchange-traded funds (ETFs) are not included in the Fund's expense ratio. The Fund indirectly bears its proportionate share of these expenses. For additional expense information related to investments in Fidelity Central Funds, please refer to the "Investments in Fidelity Central Funds" note found in the Notes to Financial Statements section of the most recent Annual or Semi-Annual report.
H Expense ratios reflect operating expenses of the class. Expenses before reductions do not reflect amounts reimbursed, waived, or reduced through arrangements with the investment adviser, brokerage services, or other offset arrangements, if applicable, and do not represent the amount paid by the class during periods when reimbursements, waivers or reductions occur.
I Annualized.
J Amount does not include the portfolio activity of any underlying mutual funds or exchange-traded funds (ETFs).
| VIP Equity-Income Portfolio℠ Service Class 2 |
| |
| | Six months ended (Unaudited) June 30, 2023 | | Years ended December 31, 2022 | | 2021 | | 2020 | | 2019 | | 2018 |
Selected Per-Share Data | | | | | | | | | | | | |
| Net asset value, beginning of period | $ | 22.71 | $ | 25.27 | $ | 23.18 | $ | 23.10 | $ | 19.85 | $ | 23.32 |
| Income from Investment Operations | | | | | | | | | | | | |
Net investment income (loss) A,B | | .22 | | .40 | | .35 | | .33 | | .40 | | .51 |
| Net realized and unrealized gain (loss) | | .64 | | (1.71) | | 5.13 | | 1.09 | | 4.70 | | (2.44) |
| Total from investment operations | | .86 | | (1.31) | | 5.48 | | 1.42 | | 5.10 | | (1.93) |
| Distributions from net investment income | | - | | (.41) C | | (.44) | | (.34) | | (.40) | | (.47) |
| Distributions from net realized gain | | - | | (.84) C | | (2.95) | | (.99) | | (1.45) | | (1.07) |
| Total distributions | | - | | (1.25) | | (3.39) | | (1.34) D | | (1.85) | | (1.54) |
| Net asset value, end of period | $ | 23.57 | $ | 22.71 | $ | 25.27 | $ | 23.18 | $ | 23.10 | $ | 19.85 |
Total Return E,F,G | | 3.79% | | (5.25)% | | 24.60% | | 6.44% | | 27.11% | | (8.54)% |
Ratios to Average Net Assets B,H,I | | | | | | | | | | | | |
| Expenses before reductions | | .76% J | | .76% | | .76% | | .78% | | .78% | | .78% |
| Expenses net of fee waivers, if any | | .76% J | | .76% | | .76% | | .78% | | .78% | | .78% |
| Expenses net of all reductions | | .76% J | | .76% | | .76% | | .77% | | .77% | | .77% |
| Net investment income (loss) | | 1.89% J | | 1.69% | | 1.38% | | 1.62% | | 1.86% | | 2.28% |
| Supplemental Data | | | | | | | | | | | | |
| Net assets, end of period (000 omitted) | $ | 1,514,080 | $ | 1,509,527 | $ | 1,659,719 | $ | 1,563,662 | $ | 1,431,212 | $ | 1,200,026 |
Portfolio turnover rate K | | 31% J | | 20% | | 27% | | 57% | | 32% | | 39% |
A Calculated based on average shares outstanding during the period.
B Net investment income (loss) is affected by the timing of the declaration of dividends by any underlying mutual funds or exchange-traded funds (ETFs). Net investment income (loss) of any mutual funds or ETFs is not included in the Fund's net investment income (loss) ratio.
C The amount shown reflects reclassifications related to book to tax differences that were made in the year shown.
D Total distributions per share do not sum due to rounding.
E Total returns for periods of less than one year are not annualized.
F Total returns do not reflect charges attributable to your insurance company's separate account. Inclusion of these charges would reduce the total returns shown.
G Total returns would have been lower if certain expenses had not been reduced during the applicable periods shown.
H Fees and expenses of any underlying mutual funds or exchange-traded funds (ETFs) are not included in the Fund's expense ratio. The Fund indirectly bears its proportionate share of these expenses. For additional expense information related to investments in Fidelity Central Funds, please refer to the "Investments in Fidelity Central Funds" note found in the Notes to Financial Statements section of the most recent Annual or Semi-Annual report.
I Expense ratios reflect operating expenses of the class. Expenses before reductions do not reflect amounts reimbursed, waived, or reduced through arrangements with the investment adviser, brokerage services, or other offset arrangements, if applicable, and do not represent the amount paid by the class during periods when reimbursements, waivers or reductions occur.
J Annualized.
K Amount does not include the portfolio activity of any underlying mutual funds or exchange-traded funds (ETFs).
| VIP Equity-Income Portfolio℠ Investor Class |
| |
| | Six months ended (Unaudited) June 30, 2023 | | Years ended December 31, 2022 | | 2021 | | 2020 | | 2019 | | 2018 |
Selected Per-Share Data | | | | | | | | | | | | |
| Net asset value, beginning of period | $ | 23.38 | $ | 25.96 | $ | 23.74 | $ | 23.63 | $ | 20.26 | $ | 23.77 |
| Income from Investment Operations | | | | | | | | | | | | |
Net investment income (loss) A,B | | .24 | | .45 | | .41 | | .38 | | .44 | | .55 |
| Net realized and unrealized gain (loss) | | .66 | | (1.74) | | 5.26 | | 1.10 | | 4.81 | | (2.48) |
| Total from investment operations | | .90 | | (1.29) | | 5.67 | | 1.48 | | 5.25 | | (1.93) |
| Distributions from net investment income | | - | | (.45) C | | (.49) | | (.38) | | (.44) | | (.51) |
| Distributions from net realized gain | | - | | (.84) C | | (2.95) | | (.99) | | (1.45) | | (1.07) |
| Total distributions | | - | | (1.29) | | (3.45) D | | (1.37) | | (1.88) D | | (1.58) |
| Net asset value, end of period | $ | 24.28 | $ | 23.38 | $ | 25.96 | $ | 23.74 | $ | 23.63 | $ | 20.26 |
Total Return E,F,G | | 3.85% | | (5.02)% | | 24.83% | | 6.57% | | 27.35% | | (8.37)% |
Ratios to Average Net Assets B,H,I | | | | | | | | | | | | |
| Expenses before reductions | | .59% J | | .59% | | .59% | | .60% | | .61% | | .61% |
| Expenses net of fee waivers, if any | | .58% J | | .58% | | .58% | | .60% | | .61% | | .61% |
| Expenses net of all reductions | | .58% J | | .58% | | .58% | | .60% | | .60% | | .60% |
| Net investment income (loss) | | 2.06% J | | 1.86% | | 1.55% | | 1.80% | | 2.03% | | 2.45% |
| Supplemental Data | | | | | | | | | | | | |
| Net assets, end of period (000 omitted) | $ | 614,405 | $ | 597,206 | $ | 627,711 | $ | 464,283 | $ | 449,909 | $ | 382,041 |
Portfolio turnover rate K | | 31% J | | 20% | | 27% | | 57% | | 32% | | 39% |
A Calculated based on average shares outstanding during the period.
B Net investment income (loss) is affected by the timing of the declaration of dividends by any underlying mutual funds or exchange-traded funds (ETFs). Net investment income (loss) of any mutual funds or ETFs is not included in the Fund's net investment income (loss) ratio.
C The amount shown reflects reclassifications related to book to tax differences that were made in the year shown.
D Total distributions per share do not sum due to rounding.
E Total returns for periods of less than one year are not annualized.
F Total returns do not reflect charges attributable to your insurance company's separate account. Inclusion of these charges would reduce the total returns shown.
G Total returns would have been lower if certain expenses had not been reduced during the applicable periods shown.
H Fees and expenses of any underlying mutual funds or exchange-traded funds (ETFs) are not included in the Fund's expense ratio. The Fund indirectly bears its proportionate share of these expenses. For additional expense information related to investments in Fidelity Central Funds, please refer to the "Investments in Fidelity Central Funds" note found in the Notes to Financial Statements section of the most recent Annual or Semi-Annual report.
I Expense ratios reflect operating expenses of the class. Expenses before reductions do not reflect amounts reimbursed, waived, or reduced through arrangements with the investment adviser, brokerage services, or other offset arrangements, if applicable, and do not represent the amount paid by the class during periods when reimbursements, waivers or reductions occur.
J Annualized.
K Amount does not include the portfolio activity of any underlying mutual funds or exchange-traded funds (ETFs).
For the period ended June 30, 2023
1. Organization.
VIP Equity-Income Portfolio (the Fund) is a fund of Variable Insurance Products Fund (the Trust) and is authorized to issue an unlimited number of shares. The Trust is registered under the Investment Company Act of 1940, as amended (the 1940 Act), as an open-end management investment company organized as a Massachusetts business trust. Shares of the Fund may only be purchased by insurance companies for the purpose of funding variable annuity or variable life insurance contracts. The Fund offers the following classes of shares: Initial Class shares, Service Class shares, Service Class 2 shares and Investor Class shares. All classes have equal rights and voting privileges, except for matters affecting a single class.
2. Investments in Fidelity Central Funds.
Funds may invest in Fidelity Central Funds, which are open-end investment companies generally available only to other investment companies and accounts managed by the investment adviser and its affiliates. The Schedule of Investments lists any Fidelity Central Funds held as an investment as of period end, but does not include the underlying holdings of each Fidelity Central Fund. An investing fund indirectly bears its proportionate share of the expenses of the underlying Fidelity Central Funds.
Based on its investment objective, each Fidelity Central Fund may invest or participate in various investment vehicles or strategies that are similar to those of the investing fund. These strategies are consistent with the investment objectives of the investing fund and may involve certain economic risks which may cause a decline in value of each of the Fidelity Central Funds and thus a decline in the value of the investing fund.
| Fidelity Central Fund | Investment Manager | Investment Objective | Investment Practices | Expense Ratio A |
| Fidelity Money Market Central Funds | Fidelity Management & Research Company LLC (FMR) | Each fund seeks to obtain a high level of current income consistent with the preservation of capital and liquidity. | Short-term Investments | Less than .005% |
A Expenses expressed as a percentage of average net assets and are as of each underlying Central Fund's most recent annual or semi-annual shareholder report.
A complete unaudited list of holdings for each Fidelity Central Fund is available upon request or at the Securities and Exchange Commission website at www.sec.gov. In addition, the financial statements of the Fidelity Central Funds which contain the significant accounting policies (including investment valuation policies) of those funds, and are not covered by the Report of Independent Registered Public Accounting Firm, are available on the Securities and Exchange Commission website or upon request.
3. Significant Accounting Policies.
The Fund is an investment company and applies the accounting and reporting guidance of the Financial Accounting Standards Board (FASB) Accounting Standards Codification Topic 946 Financial Services - Investment Companies . The financial statements have been prepared in conformity with accounting principles generally accepted in the United States of America (GAAP), which require management to make certain estimates and assumptions at the date of the financial statements. Actual results could differ from those estimates. Subsequent events, if any, through the date that the financial statements were issued have been evaluated in the preparation of the financial statements. The Fund's Schedule of Investments lists any underlying mutual funds or exchange-traded funds (ETFs) but does not include the underlying holdings of these funds. The following summarizes the significant accounting policies of the Fund:
Investment Valuation. Investments are valued as of 4:00 p.m. Eastern time on the last calendar day of the period. The Board of Trustees (the Board) has designated the Fund's investment adviser as the valuation designee responsible for the fair valuation function and performing fair value determinations as needed. The investment adviser has established a Fair Value Committee (the Committee) to carry out the day-to-day fair valuation responsibilities and has adopted policies and procedures to govern the fair valuation process and the activities of the Committee. In accordance with these fair valuation policies and procedures, which have been approved by the Board, the Fund attempts to obtain prices from one or more third party pricing services or brokers to value its investments. When current market prices, quotations or currency exchange rates are not readily available or reliable, investments will be fair valued in good faith by the Committee, in accordance with the policies and procedures. Factors used in determining fair value vary by investment type and may include market or investment specific events, transaction data, estimated cash flows, and market observations of comparable investments. The frequency that the fair valuation procedures are used cannot be predicted and they may be utilized to a significant extent. The Committee manages the Fund's fair valuation practices and maintains the fair valuation policies and procedures. The Fund's investment adviser reports to the Board information regarding the fair valuation process and related material matters.
The Fund categorizes the inputs to valuation techniques used to value its investments into a disclosure hierarchy consisting of three levels as shown below:
Level 1 - unadjusted quoted prices in active markets for identical investments
Level 2 - other significant observable inputs (including quoted prices for similar investments, interest rates, prepayment speeds, etc.)
Level 3 - unobservable inputs (including the Fund's own assumptions based on the best information available)
Valuation techniques used to value the Fund's investments by major category are as follows:
Equity securities, including restricted securities, for which market quotations are readily available, are valued at the last reported sale price or official closing price as reported by a third party pricing service on the primary market or exchange on which they are traded and are categorized as Level 1 in the hierarchy. In the event there were no sales during the day or closing prices are not available, securities are valued at the last quoted bid price or may be valued using the last available price and are generally categorized as Level 2 in the hierarchy. For foreign equity securities, when market or security specific events arise, comparisons to the valuation of American Depositary Receipts (ADRs), futures contracts, ETFs and certain indexes as well as quoted prices for similar securities may be used and would be categorized as Level 2 in the hierarchy. For equity securities, including restricted securities, where observable inputs are limited, assumptions about market activity and risk are used and these securities may be categorized as Level 3 in the hierarchy.
Investments in open-end mutual funds, including the Fidelity Central Funds, are valued at their closing net asset value (NAV) each business day and are categorized as Level 1 in the hierarchy.
Changes in valuation techniques may result in transfers in or out of an assigned level within the disclosure hierarchy. The aggregate value of investments by input level as of June 30, 2023 is included at the end of the Fund's Schedule of Investments.
Foreign Currency. Certain Funds may use foreign currency contracts to facilitate transactions in foreign-denominated securities. Gains and losses from these transactions may arise from changes in the value of the foreign currency or if the counterparties do not perform under the contracts' terms.
Foreign-denominated assets, including investment securities, and liabilities are translated into U.S. dollars at the exchange rates at period end. Purchases and sales of investment securities, income and dividends received, and expenses denominated in foreign currencies are translated into U.S. dollars at the exchange rate in effect on the transaction date.
The effects of exchange rate fluctuations on investments are included with the net realized and unrealized gain (loss) on investment securities. Other foreign currency transactions resulting in realized and unrealized gain (loss) are disclosed separately.
Investment Transactions and Income. For financial reporting purposes, the Fund's investment holdings and NAV include trades executed through the end of the last business day of the period. The NAV per share for processing shareholder transactions is calculated as of the close of business of the New York Stock Exchange (NYSE), normally 4:00 p.m. Eastern time and includes trades executed through the end of the prior business day. Gains and losses on securities sold are determined on the basis of identified cost and include proceeds received from litigation. Commissions paid to certain brokers with whom the investment adviser, or its affiliates, places trades on behalf of a fund include an amount in addition to trade execution, which may be rebated back to a fund. Any such rebates are included in net realized gain (loss) on investments in the Statement of Operations. Dividend income is recorded on the ex-dividend date, except for certain dividends from foreign securities where the ex-dividend date may have passed, which are recorded as soon as the Fund is informed of the ex-dividend date. Non-cash dividends included in dividend income, if any, are recorded at the fair market value of the securities received. Income and capital gain distributions from Fidelity Central Funds, if any, are recorded on the ex-dividend date. Certain distributions received by the Fund represent a return of capital or capital gain. The Fund determines the components of these distributions subsequent to the ex-dividend date, based upon receipt of tax filings or other correspondence relating to the underlying investment. These distributions are recorded as a reduction of cost of investments and/or as a realized gain. Investment income is recorded net of foreign taxes withheld where recovery of such taxes is uncertain. Funds may file withholding tax reclaims in certain jurisdictions to recover a portion of amounts previously withheld. Any withholding tax reclaims income is included in the Statement of Operations in dividends. Any receivables for withholding tax reclaims are included in the Statement of Assets and Liabilities in dividends receivable.
Class Allocations and Expenses. Investment income, realized and unrealized capital gains and losses, common expenses of a fund, and certain fund-level expense reductions, if any, are allocated daily on a pro-rata basis to each class based on the relative net assets of each class to the total net assets of a fund. Each class differs with respect to transfer agent and distribution and service plan fees incurred, as applicable. Certain expense reductions may also differ by class, if applicable. For the reporting period, the allocated portion of income and expenses to each class as a percent of its average net assets may vary due to the timing of recording these transactions in relation to fluctuating net assets of the classes. Expenses directly attributable to a fund are charged to that fund. Expenses attributable to more than one fund are allocated among the respective funds on the basis of relative net assets or other appropriate methods. Expenses included in the accompanying financial statements reflect the expenses of that fund and do not include any expenses associated with any underlying mutual funds or exchange-traded funds (ETFs). Although not included in a fund's expenses, a fund indirectly bears its proportionate share of these expenses through the net asset value of each underlying mutual fund or exchange-traded fund (ETF). Expense estimates are accrued in the period to which they relate and adjustments are made when actual amounts are known.
Deferred Trustee Compensation. Under a Deferred Compensation Plan (the Plan) for certain Funds, certain independent Trustees have elected to defer receipt of a portion of their annual compensation. Deferred amounts are invested in affiliated mutual funds, are marked-to-market and remain in a fund until distributed in accordance with the Plan. The investment of deferred amounts and the offsetting payable to the Trustees presented below are included in the accompanying Statement of Assets and Liabilities in other receivables and other payables and accrued expenses, as applicable.
| VIP Equity-Income Portfolio | $16,184 |
Income Tax Information and Distributions to Shareholders. Each year, the Fund intends to qualify as a regulated investment company under Subchapter M of the Internal Revenue Code, including distributing substantially all of its taxable income and realized gains. As a result, no provision for U.S. Federal income taxes is required. The Fund files a U.S. federal tax return, in addition to state and local tax returns as required. The Fund's federal income tax returns are subject to examination by the Internal Revenue Service (IRS) for a period of three fiscal years after they are filed. State and local tax returns may be subject to examination for an additional fiscal year depending on the jurisdiction. Foreign taxes are provided for based on the Fund's understanding of the tax rules and rates that exist in the foreign markets in which it invests.
Distributions are declared and recorded on the ex-dividend date. Income and capital gain distributions are declared separately for each class. Income and capital gain distributions are determined in accordance with income tax regulations, which may differ from GAAP. These differences resulted in distribution reclassifications for the period ended December 31, 2022.
Capital accounts within the financial statements are adjusted for permanent book-tax differences. These adjustments have no impact on net assets or the results of operations. Capital accounts are not adjusted for temporary book-tax differences which will reverse in a subsequent period.
Book-tax differences are primarily due to foreign currency transactions, partnerships and losses deferred due to wash sales.
As of period end, the cost and unrealized appreciation (depreciation) in securities, and derivatives if applicable, for federal income tax purposes were as follows:
| Gross unrealized appreciation | $1,800,655,680 |
| Gross unrealized depreciation | (126,990,073) |
| Net unrealized appreciation (depreciation) | $1,673,665,607 |
| Tax cost | $4,056,870,785 |
4. Purchases and Sales of Investments.
Purchases and sales of securities, other than short-term securities and in-kind transactions, as applicable, are noted in the table below.
| | Purchases ($) | Sales ($) |
| VIP Equity-Income Portfolio | 840,070,984 | 879,748,753 |
5. Fees and Other Transactions with Affiliates.
Management Fee. Fidelity Management & Research Company LLC (the investment adviser) and its affiliates provide the Fund with investment management related services for which the Fund pays a monthly management fee. The management fee is the sum of an individual fund fee rate that is based on an annual rate of .20% of the Fund's average net assets and an annualized group fee rate that averaged .23% during the period. The group fee rate is based upon the monthly average net assets of a group of registered investment companies with which the investment adviser has management contracts. The group fee rate decreases as assets under management increase and increases as assets under management decrease. For the reporting period, the total annualized management fee rate was .43% of the Fund's average net assets.
Distribution and Service Plan Fees. In accordance with Rule 12b-1 of the 1940 Act, the Fund has adopted separate 12b-1 Plans for each Service Class of shares. Each Service Class pays Fidelity Distributors Company LLC (FDC), an affiliate of the investment adviser, a service fee. For the period, the service fee is based on an annual rate of .10% of Service Class' average net assets and .25% of Service Class 2's average net assets.
For the period, total fees, all of which were re-allowed to insurance companies for the distribution of shares and providing shareholder support services, were as follows:
| Service Class | $141,592 |
| Service Class 2 | 1,879,564 |
| | $2,021,156 |
Transfer Agent Fees. Fidelity Investments Institutional Operations Company LLC (FIIOC), an affiliate of the investment adviser, is the Fund's transfer, dividend disbursing, and shareholder servicing agent. FIIOC receives an asset-based fee with respect to each class. Each class pays a fee for transfer agent services, typesetting and printing and mailing of shareholder reports, excluding mailing of proxy statements. For the period, transfer agent fees for each class were as follows:
| | Amount | % of Class-Level Average Net Assets A |
| Initial Class | $1,016,527 | .06 |
| Service Class | 89,203 | .06 |
| Service Class 2 | 473,650 | .06 |
| Investor Class | 414,230 | .14 |
| | $1,993,610 | |
A Annualized
Accounting Fees. Fidelity Service Company, Inc. (FSC), an affiliate of the investment adviser, maintains the Fund's accounting records. The accounting fee is based on the level of average net assets for each month. For the period, the fees were equivalent to the following annualized rates:
| | % of Average Net Assets |
| VIP Equity-Income Portfolio | .02 |
Brokerage Commissions. A portion of portfolio transactions were placed with brokerage firms which are affiliates of the investment adviser. Brokerage commissions are included in net realized gain (loss) and change in net unrealized appreciation (depreciation) in the Statement of Operations. The commissions paid to these affiliated firms were as follows:
| | Amount |
| VIP Equity-Income Portfolio | $12,298 |
Interfund Trades. Funds may purchase from or sell securities to other Fidelity Funds under procedures adopted by the Board. The procedures have been designed to ensure these interfund trades are executed in accordance with Rule 17a-7 of the 1940 Act. Any interfund trades are included within the respective purchases and sales amounts shown in the Purchases and Sales of Investments note. Interfund trades during the period are noted in the table below.
| | Purchases ($) | Sales ($) | Realized Gain (Loss) ($) |
| VIP Equity-Income Portfolio | 115,944,605 | 107,544,005 | 16,274,651 |
6. Committed Line of Credit.
Certain Funds participate with other funds managed by the investment adviser or an affiliate in a $4.25 billion credit facility (the "line of credit") to be utilized for temporary or emergency purposes to fund shareholder redemptions or for other short-term liquidity purposes. The participating funds have agreed to pay commitment fees on their pro-rata portion of the line of credit, which are reflected in Miscellaneous expenses on the Statement of Operations, and are listed below. During the period, there were no borrowings on this line of credit.
| | Amount |
| VIP Equity-Income Portfolio | $5,545 |
7. Security Lending.
Funds lend portfolio securities from time to time in order to earn additional income. Lending agents are used, including National Financial Services (NFS), an affiliate of the investment adviser. Pursuant to a securities lending agreement, NFS will receive a fee, which is capped at 9.9% of a fund's daily lending revenue, for its services as lending agent. A fund may lend securities to certain qualified borrowers, including NFS. On the settlement date of the loan, a fund receives collateral (in the form of U.S. Treasury obligations, letters of credit and/or cash) against the loaned securities and maintains collateral in an amount not less than 100% of the market value of the loaned securities during the period of the loan. The market value of the loaned securities is determined at the close of business of a fund and any additional required collateral is delivered to a fund on the next business day. A fund or borrower may terminate the loan at any time, and if the borrower defaults on its obligation to return the securities loaned because of insolvency or other reasons, a fund may apply collateral received from the borrower against the obligation. A fund may experience delays and costs in recovering the securities loaned. Any cash collateral received is invested in the Fidelity Securities Lending Cash Central Fund. Any loaned securities are identified as such in the Schedule of Investments, and the value of loaned securities and cash collateral at period end, as applicable, are presented in the Statement of Assets and Liabilities. Security lending income represents the income earned on investing cash collateral, less rebates paid to borrowers and any lending agent fees associated with the loan, plus any premium payments received for lending certain types of securities. Security lending income is presented in the Statement of Operations as a component of income from Fidelity Central Funds. Affiliated security lending activity, if any, was as follows:
| | Total Security Lending Fees Paid to NFS | Security Lending Income From Securities Loaned to NFS | Value of Securities Loaned to NFS at Period End |
| VIP Equity-Income Portfolio | $1,973 | $- | $- |
8. Expense Reductions.
Through arrangements with the Fund's custodian, credits realized as a result of certain uninvested cash balances were used to reduce the Fund's expenses. During the period, custodian credits reduced the Fund's expenses by $4,622.
In addition, during the period the investment adviser or an affiliate reimbursed and/or waived a portion of fund-level operating expenses in the amount of $129,259.
9. Distributions to Shareholders.
Distributions to shareholders of each class were as follows:
| | Six months ended June 30, 2023 | Year ended December 31, 2022 |
| VIP Equity-Income Portfolio | | |
| Distributions to shareholders | | |
| Initial Class | $- | $172,087,787 |
| Service Class | - | 15,094,456 |
| Service Class 2 | - | 79,440,158 |
| Investor Class | - | 31,477,905 |
| Total | $- | $298,100,306 |
10. Share Transactions.
Transactions for each class of shares were as follows and may contain in-kind transactions:
| | Shares | Shares | Dollars | Dollars |
| | Six months ended June 30, 2023 | Year ended December 31, 2022 | Six months ended June 30, 2023 | Year ended December 31, 2022 |
| VIP Equity-Income Portfolio | | | | |
| Initial Class | | | | |
| Shares sold | 5,551,387 | 8,687,731 | $132,369,696 | $215,605,540 |
| Reinvestment of distributions | - | 7,190,967 | - | 172,087,787 |
| Shares redeemed | (8,649,554) | (22,577,302) | (206,290,548) | (556,735,404) |
| Net increase (decrease) | (3,098,167) | (6,698,604) | $(73,920,852) | $(169,042,077) |
| Service Class | | | | |
| Shares sold | 149,437 | 874,027 | $3,528,005 | $21,820,943 |
| Reinvestment of distributions | - | 635,539 | - | 15,094,456 |
| Shares redeemed | (699,331) | (1,828,012) | (16,544,866) | (44,876,939) |
| Net increase (decrease) | (549,894) | (318,446) | $(13,016,861) | $(7,961,540) |
| Service Class 2 | | | | |
| Shares sold | 2,891,196 | 8,220,770 | $66,334,432 | $194,576,846 |
| Reinvestment of distributions | - | 3,441,999 | - | 79,440,158 |
| Shares redeemed | (5,121,230) | (10,894,425) | (117,554,858) | (259,133,632) |
| Net increase (decrease) | (2,230,034) | 768,344 | $(51,220,426) | $14,883,372 |
| Investor Class | | | | |
| Shares sold | 1,378,037 | 3,283,706 | $32,693,687 | $81,421,149 |
| Reinvestment of distributions | - | 1,325,531 | - | 31,477,905 |
| Shares redeemed | (1,622,756) | (3,240,005) | (38,350,445) | (78,344,550) |
| Net increase (decrease) | (244,719) | 1,369,232 | $(5,656,758) | $34,554,504 |
11. Other.
A fund's organizational documents provide former and current trustees and officers with a limited indemnification against liabilities arising in connection with the performance of their duties to the fund. In the normal course of business, a fund may also enter into contracts that provide general indemnifications. A fund's maximum exposure under these arrangements is unknown as this would be dependent on future claims that may be made against a fund. The risk of material loss from such claims is considered remote.
At the end of the period, the investment adviser or its affiliates were owners of record of more than 10% and certain otherwise unaffiliated shareholders each were owners of record of more than 10% of the outstanding shares as follows:
| Fund | Affiliated % | Number of Unaffiliated Shareholders | Unaffiliated Shareholders % |
| VIP Equity-Income Portfolio | 18% | 2 | 29% |
12. Risk and Uncertainties.
Many factors affect a fund's performance. Developments that disrupt global economies and financial markets, such as pandemics, epidemics, outbreaks of infectious diseases, war, terrorism, and environmental disasters, may significantly affect a fund's investment performance. The effects of these developments to a fund will be impacted by the types of securities in which a fund invests, the financial condition, industry, economic sector, and geographic location of an issuer, and a fund's level of investment in the securities of that issuer. Significant concentrations in security types, issuers, industries, sectors, and geographic locations may magnify the factors that affect a fund's performance.
As a shareholder, you incur two types of costs: (1) transaction costs, which may include sales charges (loads) on purchase payments or redemption proceeds, as applicable and (2) ongoing costs, which generally include management fees, distribution and/or service (12b-1) fees and other Fund expenses. This Example is intended to help you understand your ongoing costs (in dollars) of investing in a fund and to compare these costs with the ongoing costs of investing in other mutual funds.
| The Example is based on an investment of $1,000 invested at the beginning of the period and held for the entire period (January 1, 2023 to June 30, 2023). |
Actual Expenses
The first line of the accompanying table provides information about actual account values and actual expenses. You may use the information in this line, together with the amount you invested, to estimate the expenses that you paid over the period. Simply divide your account value by $1,000.00 (for example, an $8,600 account value divided by $1,000.00 = 8.6), then multiply the result by the number in the first line for a class/Fund under the heading entitled "Expenses Paid During Period" to estimate the expenses you paid on your account during this period. If any fund is a shareholder of any underlying mutual funds or exchange-traded funds (ETFs) (the Underlying Funds), such fund indirectly bears its proportional share of the expenses of the Underlying Funds in addition to the direct expenses incurred presented in the table. These fees and expenses are not included in the annualized expense ratio used to calculate the expense estimate in the table below. The estimate of expenses does not include any fees or other expenses of any variable annuity or variable life insurance product. If they were, the estimate of expenses you paid during the period would be higher, and your ending account value would be lower.
Hypothetical Example for Comparison Purposes
The second line of the accompanying table provides information about hypothetical account values and hypothetical expenses based on the actual expense ratio and an assumed rate of return of 5% per year before expenses, which is not the actual return. The hypothetical account values and expenses may not be used to estimate the actual ending account balance or expenses you paid for the period. You may use this information to compare the ongoing costs of investing in the Fund and other funds. To do so, compare this 5% hypothetical example with the 5% hypothetical examples that appear in the shareholder reports of the other funds. If any fund is a shareholder of any Underlying Funds, such fund indirectly bears its proportional share of the expenses of the Underlying Funds in addition to the direct expenses as presented in the table. These fees and expenses are not included in the annualized expense ratio used to calculate the expense estimate in the table below. The estimate of expenses does not include any fees or other expenses of any variable annuity or variable life insurance product. If they were, the estimate of expenses you paid during the period would be higher, and your ending account value would be lower.
Please note that the expenses shown in the table are meant to highlight your ongoing costs only and do not reflect any transaction costs. Therefore, the second line of the table is useful in comparing ongoing costs only, and will not help you determine the relative total costs of owning different funds. In addition, if these transactional costs were included, your costs would have been higher.
| | | | | Annualized Expense Ratio- A | | Beginning Account Value January 1, 2023 | | Ending Account Value June 30, 2023 | | Expenses Paid During Period- C January 1, 2023 to June 30, 2023 |
| VIP Equity-Income Portfolio℠ | | | | | | | | | | |
| Initial Class | | | | .51% | | | | | | |
| Actual | | | | | | $ 1,000 | | $ 1,039.00 | | $ 2.58 |
Hypothetical- B | | | | | | $ 1,000 | | $ 1,022.27 | | $ 2.56 |
| Service Class | | | | .61% | | | | | | |
| Actual | | | | | | $ 1,000 | | $ 1,038.50 | | $ 3.08 |
Hypothetical- B | | | | | | $ 1,000 | | $ 1,021.77 | | $ 3.06 |
| Service Class 2 | | | | .76% | | | | | | |
| Actual | | | | | | $ 1,000 | | $ 1,037.90 | | $ 3.84 |
Hypothetical- B | | | | | | $ 1,000 | | $ 1,021.03 | | $ 3.81 |
| Investor Class | | | | .58% | | | | | | |
| Actual | | | | | | $ 1,000 | | $ 1,038.50 | | $ 2.93 |
Hypothetical- B | | | | | | $ 1,000 | | $ 1,021.92 | | $ 2.91 |
| |
A Annualized expense ratio reflects expenses net of applicable fee waivers.
B 5% return per year before expenses
C Expenses are equal to the annualized expense ratio, multiplied by the average account value over the period, multiplied by 181/ 365 (to reflect the one-half year period). The fees and expenses of any Underlying Funds are not included in each annualized expense ratio.
Board Approval of Investment Advisory Contracts
VIP Equity-Income Portfolio
At its May 2023 meeting, the Board of Trustees, including the Independent Trustees (together, the Board), voted to continue the management contract with Fidelity Management & Research Company LLC (FMR), and the sub-advisory agreements and sub-subadvisory agreements, in each case, where applicable (together, the Advisory Contracts) for the fund for two months from June 1, 2023 through July 31, 2023. The Board determined that it will consider the annual renewal of the fund's Advisory Contracts for a full one year period in July 2023, following its review of additional materials provided by FMR.
The Board considered that the approval of the fund's Advisory Contracts will not result in any changes in (i) the investment process or strategies employed in the management of the fund's assets; (ii) the fees and expenses paid by shareholders; (iii) the nature, extent or quality of services provided under the fund's Advisory Contracts; or (iv) the day-to-day management of the fund or the persons primarily responsible for such management. The Board also considered that since its last approval of the fund's Advisory Contracts, FMR had provided additional information on the fund in support of the annual contract renewal process, including competitive analyses on total expenses and management fees and in-depth reviews of fund performance and fund profitability information. The Board concluded that the fund's Advisory Contracts are fair and reasonable, and that the fund's Advisory Contracts should be renewed, without modification, through July 31, 2023, with the understanding that the Board will consider the annual renewal for a full one year period in July 2023.
In connection with its consideration of future renewals of the fund's Advisory Contracts, the Board will consider: (i) the nature, extent and quality of services provided to the fund, including shareholder and administrative services and investment performance; (ii) the competitiveness of the management fee and total expenses for the fund; (iii) the costs of the services and profitability, including the revenues earned and the expenses incurred in conducting the business of developing, marketing, distributing, managing, administering, and servicing the fund and its shareholders, to the extent applicable; and (iv) whether there have been economies of scale in respect of the Fidelity funds, whether the Fidelity funds (including the fund) have appropriately benefited from any such economies of scale, and whether there is the potential for realization of any further economies.
Based on its evaluation of all of the conclusions noted above, and after considering all factors it believed relevant, the Board ultimately concluded that the fund's management fee structure is fair and reasonable, and that the continuation of the fund's Advisory Contracts should be approved for two months from June 1, 2023 through July 31, 2023.
The Securities and Exchange Commission adopted Rule 22e-4 under the Investment Company Act of 1940 (the Liquidity Rule) to promote effective liquidity risk management throughout the open-end investment company industry, thereby reducing the risk that funds will be unable to meet their redemption obligations and mitigating dilution of the interests of fund shareholders.
The Fund has adopted and implemented a liquidity risk management program (the Program) reasonably designed to assess and manage the Fund's liquidity risk and to comply with the requirements of the Liquidity Rule. The Fund's Board of Trustees (the Board) has designated the Fund's investment adviser as administrator of the Program. The Fidelity advisers have established a Liquidity Risk Management Committee (the LRM Committee) to manage the Program for each of the Fidelity Funds. The LRM Committee monitors the adequacy and effectiveness of implementation of the Program and on a periodic basis assesses each Fund's liquidity risk based on a variety of factors including (1) the Fund's investment strategy, (2) portfolio liquidity and cash flow projections during normal and reasonably foreseeable stressed conditions, (3) shareholder redemptions, (4) borrowings and other funding sources and (5) certain factors specific to ETFs including the effect of the Fund's prices and spreads, market participants, and basket compositions on the overall liquidity of the Fund's portfolio, as applicable.
In accordance with the Program, each of the Fund's portfolio investments is classified into one of four defined liquidity categories based on a determination of a reasonable expectation for how long it would take to convert the investment to cash (or sell or dispose of the investment) without significantly changing its market value.
- Highly liquid investments - cash or convertible to cash within three business days or less
- Moderately liquid investments - convertible to cash in three to seven calendar days
- Less liquid investments - can be sold or disposed of, but not settled, within seven calendar days
- Illiquid investments - cannot be sold or disposed of within seven calendar days
Liquidity classification determinations take into account a variety of factors including various market, trading and investment-specific considerations, as well as market depth, and generally utilize analysis from a third-party liquidity metrics service.
The Liquidity Rule places a 15% limit on a fund's illiquid investments and requires funds that do not primarily hold assets that are highly liquid investments to determine and maintain a minimum percentage of the fund's net assets to be invested in highly liquid investments (highly liquid investment minimum or HLIM). The Program includes provisions reasonably designed to comply with the 15% limit on illiquid investments and for determining, periodically reviewing and complying with the HLIM requirement as applicable.
At a recent meeting of the Fund's Board of Trustees, the LRM Committee provided a written report to the Board pertaining to the operation, adequacy, and effectiveness of the Program for the period December 1, 2021 through November 30, 2022. The report concluded that the Program is operating effectively and is reasonably designed to assess and manage the Fund's liquidity risk.
1.705693.125
VIPEI-SANN-0823
Fidelity® Variable Insurance Products:
VIP Overseas Portfolio
Semi-Annual Report
June 30, 2023
Contents
To view a fund's proxy voting guidelines and proxy voting record for the 12-month period ended June 30, visit http://www.fidelity.com/proxyvotingresults or visit the Securities and Exchange Commission's (SEC) web site at http://www.sec.gov.
You may also call 1-877-208-0098 to request a free copy of the proxy voting guidelines.
Fidelity® Variable Insurance Products are separate account options which are purchased through a variable insurance contract.
Standard & Poor's, S&P and S&P 500 are registered service marks of The McGraw-Hill Companies, Inc. and have been licensed for use by Fidelity Distributors Corporation.
Other third-party marks appearing herein are the property of their respective owners.
All other marks appearing herein are registered or unregistered trademarks or service marks of FMR LLC or an affiliated company. © 2023 FMR LLC. All rights reserved.
This report and the financial statements contained herein are submitted for the general information of the shareholders of the Fund. This report is not authorized for distribution to prospective investors in the Fund unless preceded or accompanied by an effective prospectus.
A fund files its complete schedule of portfolio holdings with the SEC for the first and third quarters of each fiscal year on Form N-PORT. Forms N-PORT are available on the SEC's web site at http://www.sec.gov. A fund's Forms N-PORT may be reviewed and copied at the SEC's Public Reference Room in Washington, DC. Information regarding the operation of the SEC's Public Reference Room may be obtained by calling 1-800-SEC-0330.
For a complete list of a fund's portfolio holdings, view the most recent holdings listing, semiannual report, or annual report on Fidelity's web site at http://www.fidelity.com, http://www.institutional.fidelity.com, or http://www.401k.com, as applicable.
NOT FDIC INSURED •MAY LOSE VALUE •NO BANK GUARANTEE
Neither the Fund nor Fidelity Distributors Corporation is a bank.
This report and the financial statements contained herein are submitted for the general information of the shareholders of the Fund. This report is not authorized for distribution to prospective investors in the Fund unless preceded or accompanied by an effective prospectus.
A fund files its complete schedule of portfolio holdings with the SEC for the first and third quarters of each fiscal year on Form N-PORT. Forms N-PORT are available on the SEC's web site at http://www.sec.gov. A fund's Forms N-PORT may be reviewed and copied at the SEC's Public Reference Room in Washington, DC. Information regarding the operation of the SEC's Public Reference Room may be obtained by calling 1-800-SEC-0330.
For a complete list of a fund's portfolio holdings, view the most recent holdings listing, semiannual report, or annual report on Fidelity's web site at http://www.fidelity.com, http://www.institutional.fidelity.com, or http://www.401k.com, as applicable.
NOT FDIC INSURED •MAY LOSE VALUE •NO BANK GUARANTEE
Neither the Fund nor Fidelity Distributors Corporation is a bank.
Top Holdings (% of Fund's net assets) |
| |
| ASML Holding NV (Netherlands) (Netherlands, Semiconductors & Semiconductor Equipment) | 3.4 | |
| LVMH Moet Hennessy Louis Vuitton SE (France, Textiles, Apparel & Luxury Goods) | 3.3 | |
| AstraZeneca PLC (United Kingdom) (United Kingdom, Pharmaceuticals) | 2.5 | |
| Novo Nordisk A/S Series B (Denmark, Pharmaceuticals) | 2.5 | |
| Compagnie Financiere Richemont SA Series A (Switzerland, Textiles, Apparel & Luxury Goods) | 2.0 | |
| Diageo PLC (United Kingdom, Beverages) | 1.9 | |
| DSV A/S (Denmark, Air Freight & Logistics) | 1.9 | |
| Compass Group PLC (United Kingdom, Hotels, Restaurants & Leisure) | 1.9 | |
| AIA Group Ltd. (Hong Kong, Insurance) | 1.8 | |
| RELX PLC (London Stock Exchange) (United Kingdom, Professional Services) | 1.7 | |
| | 22.9 | |
| |
| Market Sectors (% of Fund's net assets) |
| |
| Industrials | 21.9 | |
| Financials | 20.8 | |
| Information Technology | 13.7 | |
| Health Care | 13.7 | |
| Consumer Discretionary | 11.9 | |
| Consumer Staples | 7.7 | |
| Materials | 6.1 | |
| Energy | 1.6 | |
| Real Estate | 1.1 | |
| Communication Services | 0.6 | |
| |
Asset Allocation (% of Fund's net assets) |
|
|
Geographic Diversification (% of Fund's net assets) |
|
* Includes Short-Term investments and Net Other Assets (Liabilities). Percentages are adjusted for the effect of derivatives, if applicable. |
| |
Showing Percentage of Net Assets
| Common Stocks - 99.4% |
| | | Shares | Value ($) |
| Australia - 0.7% | | | |
| Flutter Entertainment PLC (a) | | 66,090 | 13,261,619 |
| Bailiwick of Jersey - 0.3% | | | |
| JTC PLC (b) | | 601,600 | 5,413,167 |
| Belgium - 1.2% | | | |
| Azelis Group NV | | 231,800 | 5,281,391 |
| KBC Group NV | | 217,871 | 15,196,394 |
TOTAL BELGIUM | | | 20,477,785 |
| Canada - 1.6% | | | |
| Constellation Software, Inc. | | 13,295 | 27,546,016 |
| Lumine Group, Inc. | | 40,190 | 551,238 |
TOTAL CANADA | | | 28,097,254 |
| China - 0.5% | | | |
| Chervon Holdings Ltd. | | 137,100 | 542,381 |
| Wuliangye Yibin Co. Ltd. (A Shares) | | 358,500 | 8,106,399 |
TOTAL CHINA | | | 8,648,780 |
| Denmark - 5.0% | | | |
| Carlsberg A/S Series B | | 67,600 | 10,803,517 |
| DSV A/S | | 160,572 | 33,721,650 |
| Novo Nordisk A/S Series B | | 264,800 | 42,775,751 |
TOTAL DENMARK | | | 87,300,918 |
| Finland - 1.0% | | | |
| Nordea Bank ABP | | 1,601,803 | 17,420,992 |
| France - 16.4% | | | |
| Air Liquide SA | | 143,820 | 25,791,971 |
| ALTEN | | 110,181 | 17,349,118 |
| Antin Infrastructure Partners SA | | 40,800 | 662,472 |
| Capgemini SA | | 133,665 | 25,308,472 |
| Edenred SA | | 442,242 | 29,601,118 |
| EssilorLuxottica SA | | 133,005 | 25,050,311 |
| L'Oreal SA | | 54,900 | 25,609,537 |
| LVMH Moet Hennessy Louis Vuitton SE | | 61,330 | 57,828,811 |
| Pernod Ricard SA | | 119,942 | 26,490,256 |
| Safran SA | | 174,200 | 27,298,834 |
| TotalEnergies SE | | 497,312 | 28,548,013 |
TOTAL FRANCE | | | 289,538,913 |
| Germany - 7.3% | | | |
| Allianz SE | | 95,286 | 22,194,369 |
| Deutsche Borse AG | | 119,539 | 22,068,636 |
| Hannover Reuck SE | | 103,525 | 21,955,035 |
| Infineon Technologies AG | | 581,800 | 23,959,835 |
| Merck KGaA | | 117,200 | 19,381,523 |
| Siemens Healthineers AG (b) | | 328,700 | 18,601,012 |
TOTAL GERMANY | | | 128,160,410 |
| Hong Kong - 2.1% | | | |
| AIA Group Ltd. | | 3,166,400 | 32,159,540 |
| Techtronic Industries Co. Ltd. | | 432,500 | 4,699,767 |
TOTAL HONG KONG | | | 36,859,307 |
| India - 1.7% | | | |
| HCL Technologies Ltd. | | 469,200 | 6,819,460 |
| HDFC Bank Ltd. | | 1,105,991 | 22,947,184 |
TOTAL INDIA | | | 29,766,644 |
| Ireland - 0.8% | | | |
| Kingspan Group PLC (Ireland) | | 208,700 | 13,868,966 |
| Italy - 2.7% | | | |
| FinecoBank SpA | | 1,045,599 | 14,050,893 |
| GVS SpA (a)(b) | | 109,736 | 662,783 |
| Industrie de Nora SpA | | 79,500 | 1,668,210 |
| Recordati SpA | | 378,719 | 18,080,045 |
| UniCredit SpA | | 540,900 | 12,577,859 |
TOTAL ITALY | | | 47,039,790 |
| Japan - 11.7% | | | |
| Bandai Namco Holdings, Inc. | | 222,600 | 5,154,819 |
| BayCurrent Consulting, Inc. | | 148,600 | 5,528,153 |
| Capcom Co. Ltd. | | 265,200 | 10,466,849 |
| FUJIFILM Holdings Corp. | | 187,200 | 11,153,968 |
| Hoya Corp. | | 190,211 | 22,761,838 |
| Iriso Electronics Co. Ltd. | | 97,729 | 2,820,897 |
| Misumi Group, Inc. | | 339,360 | 6,747,454 |
| NOF Corp. | | 183,411 | 7,833,688 |
| Persol Holdings Co. Ltd. | | 503,503 | 9,034,057 |
| Relo Group, Inc. | | 391,074 | 5,298,518 |
| Shin-Etsu Chemical Co. Ltd. | | 600,300 | 20,060,799 |
| SMC Corp. | | 34,385 | 19,109,874 |
| Sony Group Corp. | | 315,633 | 28,492,257 |
| Suzuki Motor Corp. | | 315,876 | 11,454,549 |
| TIS, Inc. | | 232,074 | 5,775,514 |
| Tokio Marine Holdings, Inc. | | 811,300 | 18,703,360 |
| Tokyo Electron Ltd. | | 108,796 | 15,669,723 |
TOTAL JAPAN | | | 206,066,317 |
| Luxembourg - 0.4% | | | |
| Eurofins Scientific SA | | 104,491 | 6,631,437 |
| Netherlands - 7.3% | | | |
| ASM International NV (Netherlands) | | 41,700 | 17,671,106 |
| ASML Holding NV (Netherlands) | | 81,939 | 59,432,690 |
| IMCD NV | | 136,526 | 19,620,293 |
| Topicus.Com, Inc. (a) | | 23,814 | 1,953,117 |
| Wolters Kluwer NV | | 231,917 | 29,431,789 |
TOTAL NETHERLANDS | | | 128,108,995 |
| Spain - 1.4% | | | |
| Amadeus IT Holding SA Class A | | 333,707 | 25,380,633 |
| Sweden - 3.8% | | | |
| Addlife AB | | 541,224 | 6,107,077 |
| AddTech AB (B Shares) | | 752,251 | 16,376,709 |
| Atlas Copco AB (A Shares) | | 1,562,476 | 22,557,283 |
| Indutrade AB | | 878,756 | 19,790,719 |
| Kry International AB (a)(c)(d) | | 587 | 34,845 |
| Nordnet AB | | 111,939 | 1,497,661 |
TOTAL SWEDEN | | | 66,364,294 |
| Switzerland - 5.9% | | | |
| Compagnie Financiere Richemont SA Series A | | 212,440 | 36,086,760 |
| Julius Baer Group Ltd. | | 286,485 | 18,079,362 |
| Partners Group Holding AG | | 14,910 | 14,019,615 |
| Sika AG | | 96,564 | 27,655,990 |
| Sonova Holding AG | | 31,904 | 8,490,624 |
TOTAL SWITZERLAND | | | 104,332,351 |
| Taiwan - 0.6% | | | |
| Taiwan Semiconductor Manufacturing Co. Ltd. | | 574,600 | 10,612,222 |
| United Kingdom - 15.3% | | | |
| 3i Group PLC | | 669,300 | 16,562,464 |
| Ashtead Group PLC | | 235,800 | 16,302,929 |
| AstraZeneca PLC (United Kingdom) | | 302,900 | 43,422,011 |
| BAE Systems PLC | | 1,350,500 | 15,924,081 |
| Beazley PLC | | 1,028,501 | 7,693,496 |
| Compass Group PLC | | 1,193,639 | 33,425,653 |
| Diageo PLC | | 793,922 | 34,131,503 |
| Diploma PLC | | 305,335 | 11,571,220 |
| Hiscox Ltd. | | 600,245 | 8,316,815 |
| London Stock Exchange Group PLC | | 184,100 | 19,594,389 |
| RELX PLC (London Stock Exchange) | | 904,948 | 30,189,723 |
| Rentokil Initial PLC | | 2,764,989 | 21,618,646 |
| Sage Group PLC | | 408,177 | 4,794,023 |
| Volution Group PLC | | 1,405,597 | 6,751,279 |
TOTAL UNITED KINGDOM | | | 270,298,232 |
| United States of America - 11.7% | | | |
| CBRE Group, Inc. (a) | | 172,100 | 13,890,191 |
| CDW Corp. | | 54,400 | 9,982,400 |
| Equifax, Inc. | | 36,000 | 8,470,800 |
| Experian PLC | | 570,900 | 21,911,715 |
| Ferguson PLC | | 109,300 | 17,226,445 |
| ICON PLC (a) | | 69,500 | 17,388,900 |
| Linde PLC | | 70,368 | 26,815,837 |
| Marsh & McLennan Companies, Inc. | | 143,876 | 27,060,198 |
| Nestle SA (Reg. S) | | 244,195 | 29,374,609 |
| S&P Global, Inc. | | 54,721 | 21,937,102 |
| Thermo Fisher Scientific, Inc. | | 23,900 | 12,469,825 |
TOTAL UNITED STATES OF AMERICA | | | 206,528,022 |
| TOTAL COMMON STOCKS (Cost $1,258,212,448) | | | 1,750,177,048 |
| | | | |
| Nonconvertible Preferred Stocks - 0.0% |
| | | Shares | Value ($) |
| Sweden - 0.0% | | | |
Kry International AB Series E (a)(c)(d) (Cost $1,550,731) | | 3,392 | 201,353 |
| | | | |
| Money Market Funds - 0.4% |
| | | Shares | Value ($) |
Fidelity Cash Central Fund 5.14% (e) (Cost $5,943,072) | | 5,941,883 | 5,943,072 |
| | | | |
| TOTAL INVESTMENT IN SECURITIES - 99.8% (Cost $1,265,706,251) | 1,756,321,473 |
NET OTHER ASSETS (LIABILITIES) - 0.2% | 3,895,959 |
| NET ASSETS - 100.0% | 1,760,217,432 |
| | |
Legend
| (b) | Security exempt from registration under Rule 144A of the Securities Act of 1933. These securities may be resold in transactions exempt from registration, normally to qualified institutional buyers. At the end of the period, the value of these securities amounted to $24,676,962 or 1.4% of net assets. |
| (c) | Restricted securities (including private placements) - Investment in securities not registered under the Securities Act of 1933 (excluding 144A issues). At the end of the period, the value of restricted securities (excluding 144A issues) amounted to $236,198 or 0.0% of net assets. |
| (e) | Affiliated fund that is generally available only to investment companies and other accounts managed by Fidelity Investments. The rate quoted is the annualized seven-day yield of the fund at period end. A complete unaudited listing of the fund's holdings as of its most recent quarter end is available upon request. In addition, each Fidelity Central Fund's financial statements are available on the SEC's website or upon request. |
| Additional information on each restricted holding is as follows: |
| Security | Acquisition Date | Acquisition Cost ($) |
| Kry International AB | 5/14/21 | 254,938 |
| | | |
| Kry International AB Series E | 5/14/21 | 1,550,731 |
| | | |
Affiliated Central Funds
Fiscal year to date information regarding the Fund's investments in Fidelity Central Funds, including the ownership percentage, is presented below.
| Affiliate | Value, beginning of period ($) | Purchases ($) | Sales Proceeds ($) | Dividend Income ($) | Realized Gain (loss) ($) | Change in Unrealized appreciation (depreciation) ($) | Value, end of period ($) | % ownership, end of period |
| Fidelity Cash Central Fund 5.14% | 20,313,080 | 121,762,688 | 136,132,696 | 362,004 | - | - | 5,943,072 | 0.0% |
| Fidelity Securities Lending Cash Central Fund 5.14% | 13,289,712 | 57,751,866 | 71,041,578 | 67,844 | - | - | - | 0.0% |
| Total | 33,602,792 | 179,514,554 | 207,174,274 | 429,848 | - | - | 5,943,072 | |
| | | | | | | | | |
Amounts in the dividend income column in the above table include any capital gain distributions from underlying funds, which are presented in the corresponding line item in the Statement of Operations, if applicable.
Amounts in the dividend income column for Fidelity Securities Lending Cash Central Fund represents the income earned on investing cash collateral, less rebates paid to borrowers and any lending agent fees associated with the loan, plus any premium payments received for lending certain types of securities.
Amounts included in the purchases and sales proceeds columns may include in-kind transactions, if applicable.
Investment Valuation
The following is a summary of the inputs used, as of June 30, 2023, involving the Fund's assets and liabilities carried at fair value. The inputs or methodology used for valuing securities may not be an indication of the risk associated with investing in those securities. For more information on valuation inputs, and their aggregation into the levels used below, please refer to the Investment Valuation section in the accompanying Notes to Financial Statements.
| Valuation Inputs at Reporting Date: |
| Description | Total ($) | Level 1 ($) | Level 2 ($) | Level 3 ($) |
Investments in Securities: | | | | |
|
| Equities: | | | | |
Communication Services | 10,466,849 | 10,466,849 | - | - |
Consumer Discretionary | 211,627,482 | 39,184,633 | 172,442,849 | - |
Consumer Staples | 134,515,821 | 37,293,773 | 97,222,048 | - |
Energy | 28,548,013 | - | 28,548,013 | - |
Financials | 369,712,121 | 201,387,422 | 168,324,699 | - |
Health Care | 241,160,354 | 132,200,754 | 108,959,600 | - |
Industrials | 385,364,770 | 226,754,614 | 158,610,156 | - |
Information Technology | 241,635,997 | 88,443,429 | 152,956,370 | 236,198 |
Materials | 108,158,285 | 34,649,525 | 73,508,760 | - |
Real Estate | 19,188,709 | 19,188,709 | - | - |
|
| Money Market Funds | 5,943,072 | 5,943,072 | - | - |
| Total Investments in Securities: | 1,756,321,473 | 795,512,780 | 960,572,495 | 236,198 |
| Statement of Assets and Liabilities |
| | | | June 30, 2023 (Unaudited) |
| | | | | |
| Assets | | | | |
| Investment in securities, at value - See accompanying schedule: | | | | |
Unaffiliated issuers (cost $1,259,763,179) | $ | 1,750,378,401 | | |
Fidelity Central Funds (cost $5,943,072) | | 5,943,072 | | |
| | | | | |
| | | | | |
| Total Investment in Securities (cost $1,265,706,251) | | | $ | 1,756,321,473 |
| Foreign currency held at value (cost $400,356) | | | | 400,361 |
| Receivable for investments sold | | | | 2,792,359 |
| Receivable for fund shares sold | | | | 1,792,892 |
| Dividends receivable | | | | 1,144,948 |
| Reclaims receivable | | | | 5,868,065 |
| Distributions receivable from Fidelity Central Funds | | | | 131,558 |
| Other receivables | | | | 144,769 |
Total assets | | | | 1,768,596,425 |
| Liabilities | | | | |
| Payable for investments purchased | $ | 1,142,106 | | |
| Payable for fund shares redeemed | | 5,152,773 | | |
| Accrued management fee | | 947,469 | | |
| Distribution and service plan fees payable | | 80,430 | | |
| Other affiliated payables | | 180,086 | | |
| Deferred taxes | | 808,462 | | |
| Other payables and accrued expenses | | 67,667 | | |
| Total Liabilities | | | | 8,378,993 |
| Net Assets | | | $ | 1,760,217,432 |
| Net Assets consist of: | | | | |
| Paid in capital | | | $ | 1,266,341,353 |
| Total accumulated earnings (loss) | | | | 493,876,079 |
| Net Assets | | | $ | 1,760,217,432 |
| | | | | |
| Net Asset Value and Maximum Offering Price | | | | |
| Initial Class : | | | | |
Net Asset Value , offering price and redemption price per share ($881,961,706 ÷ 35,386,301 shares) | | | $ | 24.92 |
| Service Class : | | | | |
Net Asset Value , offering price and redemption price per share ($137,496,428 ÷ 5,549,274 shares) | | | $ | 24.78 |
| Service Class 2 : | | | | |
Net Asset Value , offering price and redemption price per share ($328,405,041 ÷ 13,353,547 shares) | | | $ | 24.59 |
| Investor Class : | | | | |
Net Asset Value , offering price and redemption price per share ($412,354,257 ÷ 16,621,492 shares) | | | $ | 24.81 |
| Statement of Operations |
| | | | Six months ended June 30, 2023 (Unaudited) |
| Investment Income | | | | |
| Dividends | | | $ | 24,875,693 |
| Income from Fidelity Central Funds (including $67,844 from security lending) | | | | 429,848 |
| Income before foreign taxes withheld | | | $ | 25,305,541 |
| Less foreign taxes withheld | | | | (2,867,331) |
| Total Income | | | | 22,438,210 |
| Expenses | | | | |
| Management fee | $ | 5,599,089 | | |
| Transfer agent fees | | 696,637 | | |
| Distribution and service plan fees | | 475,866 | | |
| Accounting fees | | 366,433 | | |
| Custodian fees and expenses | | 48,554 | | |
| Independent trustees' fees and expenses | | 5,588 | | |
| Audit | | 57,609 | | |
| Legal | | 3,110 | | |
| Interest | | 9,344 | | |
| Miscellaneous | | 4,594 | | |
| Total expenses before reductions | | 7,266,824 | | |
| Expense reductions | | (38,542) | | |
| Total expenses after reductions | | | | 7,228,282 |
| Net Investment income (loss) | | | | 15,209,928 |
| Realized and Unrealized Gain (Loss) | | | | |
| Net realized gain (loss) on: | | | | |
| Investment Securities: | | | | |
| Unaffiliated issuers (net of foreign taxes of $12,242) | | 34,916,268 | | |
| Foreign currency transactions | | (219,416) | | |
| Total net realized gain (loss) | | | | 34,696,852 |
| Change in net unrealized appreciation (depreciation) on: | | | | |
| Investment Securities: | | | | |
| Unaffiliated issuers(net of increase in deferred foreign taxes of $229,962) | | 184,167,472 | | |
| Assets and liabilities in foreign currencies | | 125,584 | | |
| Total change in net unrealized appreciation (depreciation) | | | | 184,293,056 |
| Net gain (loss) | | | | 218,989,908 |
| Net increase (decrease) in net assets resulting from operations | | | $ | 234,199,836 |
| Statement of Changes in Net Assets |
| |
| | Six months ended June 30, 2023 (Unaudited) | | Year ended December 31, 2022 |
| Increase (Decrease) in Net Assets | | | | |
| Operations | | | | |
| Net investment income (loss) | $ | 15,209,928 | $ | 17,404,913 |
| Net realized gain (loss) | | 34,696,852 | | (43,067,351) |
| Change in net unrealized appreciation (depreciation) | | 184,293,056 | | (500,493,944) |
| Net increase (decrease) in net assets resulting from operations | | 234,199,836 | | (526,156,382) |
| Distributions to shareholders | | - | | (32,358,063) |
| | | | | |
| Share transactions - net increase (decrease) | | (77,195,513) | | 49,313,373 |
| Total increase (decrease) in net assets | | 157,004,323 | | (509,201,072) |
| | | | | |
| Net Assets | | | | |
| Beginning of period | | 1,603,213,109 | | 2,112,414,181 |
| End of period | $ | 1,760,217,432 | $ | 1,603,213,109 |
| | | | | |
| | | | | |
| VIP Overseas Portfolio Initial Class |
| |
| | Six months ended (Unaudited) June 30, 2023 | | Years ended December 31, 2022 | | 2021 | | 2020 | | 2019 | | 2018 |
Selected Per-Share Data | | | | | | | | | | | | |
| Net asset value, beginning of period | $ | 21.70 | $ | 29.28 | $ | 26.52 | $ | 23.13 | $ | 19.13 | $ | 22.87 |
| Income from Investment Operations | | | | | | | | | | | | |
Net investment income (loss) A,B | | .22 | | .25 | | .15 | | .13 | | .40 | | .36 |
| Net realized and unrealized gain (loss) | | 3.00 | | (7.37) | | 4.91 | | 3.46 | | 4.74 | | (3.75) |
| Total from investment operations | | 3.22 | | (7.12) | | 5.06 | | 3.59 | | 5.14 | | (3.39) |
| Distributions from net investment income | | - | | (.25) | | (.14) C | | (.10) | | (.38) | | (.35) |
| Distributions from net realized gain | | - | | (.21) | | (2.16) C | | (.10) | | (.77) | | - |
| Total distributions | | - | | (.46) | | (2.30) | | (.20) | | (1.14) D | | (.35) |
| Net asset value, end of period | $ | 24.92 | $ | 21.70 | $ | 29.28 | $ | 26.52 | $ | 23.13 | $ | 19.13 |
Total Return E,F,G | | 14.84% | | (24.48)% | | 19.70% | | 15.61% | | 27.77% | | (14.81)% |
Ratios to Average Net Assets B,H,I | | | | | | | | | | | | |
| Expenses before reductions | | .77% J | | .77% | | .77% | | .79% | | .79% | | .79% |
| Expenses net of fee waivers, if any | | .77% J | | .77% | | .77% | | .79% | | .79% | | .79% |
| Expenses net of all reductions | | .77% J | | .77% | | .77% | | .77% | | .78% | | .78% |
| Net investment income (loss) | | 1.84% J | | 1.10% | | .51% | | .59% | | 1.87% | | 1.59% |
| Supplemental Data | | | | | | | | | | | | |
| Net assets, end of period (000 omitted) | $ | 881,962 | $ | 798,673 | $ | 1,034,416 | $ | 872,019 | $ | 826,554 | $ | 662,011 |
Portfolio turnover rate K | | 31% J | | 33% | | 26% | | 47% | | 38% | | 40% |
A Calculated based on average shares outstanding during the period.
B Net investment income (loss) is affected by the timing of the declaration of dividends by any underlying mutual funds or exchange-traded funds (ETFs). Net investment income (loss) of any mutual funds or ETFs is not included in the Fund's net investment income (loss) ratio.
C The amount shown reflects reclassifications related to book to tax differences that were made in the year shown.
D Total distributions per share do not sum due to rounding.
E Total returns for periods of less than one year are not annualized.
F Total returns do not reflect charges attributable to your insurance company's separate account. Inclusion of these charges would reduce the total returns shown.
G Total returns would have been lower if certain expenses had not been reduced during the applicable periods shown.
H Fees and expenses of any underlying mutual funds or exchange-traded funds (ETFs) are not included in the Fund's expense ratio. The Fund indirectly bears its proportionate share of these expenses. For additional expense information related to investments in Fidelity Central Funds, please refer to the "Investments in Fidelity Central Funds" note found in the Notes to Financial Statements section of the most recent Annual or Semi-Annual report.
I Expense ratios reflect operating expenses of the class. Expenses before reductions do not reflect amounts reimbursed, waived, or reduced through arrangements with the investment adviser, brokerage services, or other offset arrangements, if applicable, and do not represent the amount paid by the class during periods when reimbursements, waivers or reductions occur.
J Annualized.
K Amount does not include the portfolio activity of any underlying mutual funds or exchange-traded funds (ETFs).
| VIP Overseas Portfolio Service Class |
| |
| | Six months ended (Unaudited) June 30, 2023 | | Years ended December 31, 2022 | | 2021 | | 2020 | | 2019 | | 2018 |
Selected Per-Share Data | | | | | | | | | | | | |
| Net asset value, beginning of period | $ | 21.58 | $ | 29.13 | $ | 26.40 | $ | 23.03 | $ | 19.05 | $ | 22.77 |
| Income from Investment Operations | | | | | | | | | | | | |
Net investment income (loss) A,B | | .21 | | .23 | | .12 | | .11 | | .37 | | .33 |
| Net realized and unrealized gain (loss) | | 2.99 | | (7.35) | | 4.88 | | 3.44 | | 4.73 | | (3.72) |
| Total from investment operations | | 3.20 | | (7.12) | | 5.00 | | 3.55 | | 5.10 | | (3.39) |
| Distributions from net investment income | | - | | (.23) | | (.11) C | | (.08) | | (.36) | | (.33) |
| Distributions from net realized gain | | - | | (.21) | | (2.16) C | | (.10) | | (.77) | | - |
| Total distributions | | - | | (.43) D | | (2.27) | | (.18) | | (1.12) D | | (.33) |
| Net asset value, end of period | $ | 24.78 | $ | 21.58 | $ | 29.13 | $ | 26.40 | $ | 23.03 | $ | 19.05 |
Total Return E,F,G | | 14.83% | | (24.58)% | | 19.57% | | 15.49% | | 27.67% | | (14.88)% |
Ratios to Average Net Assets B,H,I | | | | | | | | | | | | |
| Expenses before reductions | | .87% J | | .87% | | .87% | | .89% | | .89% | | .89% |
| Expenses net of fee waivers, if any | | .87% J | | .87% | | .87% | | .89% | | .89% | | .89% |
| Expenses net of all reductions | | .87% J | | .87% | | .87% | | .87% | | .88% | | .88% |
| Net investment income (loss) | | 1.74% J | | 1.00% | | .41% | | .49% | | 1.77% | | 1.49% |
| Supplemental Data | | | | | | | | | | | | |
| Net assets, end of period (000 omitted) | $ | 137,496 | $ | 125,827 | $ | 168,369 | $ | 151,886 | $ | 134,648 | $ | 114,094 |
Portfolio turnover rate K | | 31% J | | 33% | | 26% | | 47% | | 38% | | 40% |
A Calculated based on average shares outstanding during the period.
B Net investment income (loss) is affected by the timing of the declaration of dividends by any underlying mutual funds or exchange-traded funds (ETFs). Net investment income (loss) of any mutual funds or ETFs is not included in the Fund's net investment income (loss) ratio.
C The amount shown reflects reclassifications related to book to tax differences that were made in the year shown.
D Total distributions per share do not sum due to rounding.
E Total returns for periods of less than one year are not annualized.
F Total returns do not reflect charges attributable to your insurance company's separate account. Inclusion of these charges would reduce the total returns shown.
G Total returns would have been lower if certain expenses had not been reduced during the applicable periods shown.
H Fees and expenses of any underlying mutual funds or exchange-traded funds (ETFs) are not included in the Fund's expense ratio. The Fund indirectly bears its proportionate share of these expenses. For additional expense information related to investments in Fidelity Central Funds, please refer to the "Investments in Fidelity Central Funds" note found in the Notes to Financial Statements section of the most recent Annual or Semi-Annual report.
I Expense ratios reflect operating expenses of the class. Expenses before reductions do not reflect amounts reimbursed, waived, or reduced through arrangements with the investment adviser, brokerage services, or other offset arrangements, if applicable, and do not represent the amount paid by the class during periods when reimbursements, waivers or reductions occur.
J Annualized.
K Amount does not include the portfolio activity of any underlying mutual funds or exchange-traded funds (ETFs).
| VIP Overseas Portfolio Service Class 2 |
| |
| | Six months ended (Unaudited) June 30, 2023 | | Years ended December 31, 2022 | | 2021 | | 2020 | | 2019 | | 2018 |
Selected Per-Share Data | | | | | | | | | | | | |
| Net asset value, beginning of period | $ | 21.44 | $ | 28.94 | $ | 26.25 | $ | 22.90 | $ | 18.95 | $ | 22.66 |
| Income from Investment Operations | | | | | | | | | | | | |
Net investment income (loss) A,B | | .19 | | .19 | | .07 | | .08 | | .34 | | .30 |
| Net realized and unrealized gain (loss) | | 2.96 | | (7.29) | | 4.86 | | 3.42 | | 4.71 | | (3.71) |
| Total from investment operations | | 3.15 | | (7.10) | | 4.93 | | 3.50 | | 5.05 | | (3.41) |
| Distributions from net investment income | | - | | (.19) | | (.08) C | | (.05) | | (.33) | | (.30) |
| Distributions from net realized gain | | - | | (.21) | | (2.16) C | | (.10) | | (.77) | | - |
| Total distributions | | - | | (.40) | | (2.24) | | (.15) | | (1.10) | | (.30) |
| Net asset value, end of period | $ | 24.59 | $ | 21.44 | $ | 28.94 | $ | 26.25 | $ | 22.90 | $ | 18.95 |
Total Return D,E,F | | 14.69% | | (24.68)% | | 19.39% | | 15.33% | | 27.50% | | (15.06)% |
Ratios to Average Net Assets B,G,H | | | | | | | | | | | | |
| Expenses before reductions | | 1.02% I | | 1.02% | | 1.02% | | 1.04% | | 1.04% | | 1.04% |
| Expenses net of fee waivers, if any | | 1.02% I | | 1.02% | | 1.02% | | 1.04% | | 1.04% | | 1.04% |
| Expenses net of all reductions | | 1.02% I | | 1.02% | | 1.02% | | 1.02% | | 1.03% | | 1.03% |
| Net investment income (loss) | | 1.59% I | | .85% | | .26% | | .34% | | 1.62% | | 1.34% |
| Supplemental Data | | | | | | | | | | | | |
| Net assets, end of period (000 omitted) | $ | 328,405 | $ | 306,315 | $ | 398,271 | $ | 352,459 | $ | 331,113 | $ | 291,392 |
Portfolio turnover rate J | | 31% I | | 33% | | 26% | | 47% | | 38% | | 40% |
A Calculated based on average shares outstanding during the period.
B Net investment income (loss) is affected by the timing of the declaration of dividends by any underlying mutual funds or exchange-traded funds (ETFs). Net investment income (loss) of any mutual funds or ETFs is not included in the Fund's net investment income (loss) ratio.
C The amount shown reflects reclassifications related to book to tax differences that were made in the year shown.
D Total returns for periods of less than one year are not annualized.
E Total returns do not reflect charges attributable to your insurance company's separate account. Inclusion of these charges would reduce the total returns shown.
F Total returns would have been lower if certain expenses had not been reduced during the applicable periods shown.
G Fees and expenses of any underlying mutual funds or exchange-traded funds (ETFs) are not included in the Fund's expense ratio. The Fund indirectly bears its proportionate share of these expenses. For additional expense information related to investments in Fidelity Central Funds, please refer to the "Investments in Fidelity Central Funds" note found in the Notes to Financial Statements section of the most recent Annual or Semi-Annual report.
H Expense ratios reflect operating expenses of the class. Expenses before reductions do not reflect amounts reimbursed, waived, or reduced through arrangements with the investment adviser, brokerage services, or other offset arrangements, if applicable, and do not represent the amount paid by the class during periods when reimbursements, waivers or reductions occur.
I Annualized.
J Amount does not include the portfolio activity of any underlying mutual funds or exchange-traded funds (ETFs).
| VIP Overseas Portfolio Investor Class |
| |
| | Six months ended (Unaudited) June 30, 2023 | | Years ended December 31, 2022 | | 2021 | | 2020 | | 2019 | | 2018 |
Selected Per-Share Data | | | | | | | | | | | | |
| Net asset value, beginning of period | $ | 21.61 | $ | 29.16 | $ | 26.42 | $ | 23.05 | $ | 19.06 | $ | 22.79 |
| Income from Investment Operations | | | | | | | | | | | | |
Net investment income (loss) A,B | | .21 | | .23 | | .12 | | .11 | | .38 | | .34 |
| Net realized and unrealized gain (loss) | | 2.99 | | (7.34) | | 4.90 | | 3.44 | | 4.74 | | (3.74) |
| Total from investment operations | | 3.20 | | (7.11) | | 5.02 | | 3.55 | | 5.12 | | (3.40) |
| Distributions from net investment income | | - | | (.23) | | (.12) C | | (.08) | | (.36) | | (.33) |
| Distributions from net realized gain | | - | | (.21) | | (2.16) C | | (.10) | | (.77) | | - |
| Total distributions | | - | | (.44) | | (2.28) | | (.18) | | (1.13) | | (.33) |
| Net asset value, end of period | $ | 24.81 | $ | 21.61 | $ | 29.16 | $ | 26.42 | $ | 23.05 | $ | 19.06 |
Total Return D,E,F | | 14.81% | | (24.54)% | | 19.63% | | 15.49% | | 27.74% | | (14.90)% |
Ratios to Average Net Assets B,G,H | | | | | | | | | | | | |
| Expenses before reductions | | .85% I | | .84% | | .85% | | .87% | | .87% | | .87% |
| Expenses net of fee waivers, if any | | .84% I | | .84% | | .84% | | .86% | | .87% | | .87% |
| Expenses net of all reductions | | .84% I | | .84% | | .84% | | .85% | | .86% | | .86% |
| Net investment income (loss) | | 1.76% I | | 1.02% | | .43% | | .51% | | 1.79% | | 1.51% |
| Supplemental Data | | | | | | | | | | | | |
| Net assets, end of period (000 omitted) | $ | 412,354 | $ | 372,398 | $ | 511,358 | $ | 419,888 | $ | 421,140 | $ | 340,705 |
Portfolio turnover rate J | | 31% I | | 33% | | 26% | | 47% | | 38% | | 40% |
A Calculated based on average shares outstanding during the period.
B Net investment income (loss) is affected by the timing of the declaration of dividends by any underlying mutual funds or exchange-traded funds (ETFs). Net investment income (loss) of any mutual funds or ETFs is not included in the Fund's net investment income (loss) ratio.
C The amount shown reflects reclassifications related to book to tax differences that were made in the year shown.
D Total returns for periods of less than one year are not annualized.
E Total returns do not reflect charges attributable to your insurance company's separate account. Inclusion of these charges would reduce the total returns shown.
F Total returns would have been lower if certain expenses had not been reduced during the applicable periods shown.
G Fees and expenses of any underlying mutual funds or exchange-traded funds (ETFs) are not included in the Fund's expense ratio. The Fund indirectly bears its proportionate share of these expenses. For additional expense information related to investments in Fidelity Central Funds, please refer to the "Investments in Fidelity Central Funds" note found in the Notes to Financial Statements section of the most recent Annual or Semi-Annual report.
H Expense ratios reflect operating expenses of the class. Expenses before reductions do not reflect amounts reimbursed, waived, or reduced through arrangements with the investment adviser, brokerage services, or other offset arrangements, if applicable, and do not represent the amount paid by the class during periods when reimbursements, waivers or reductions occur.
I Annualized.
J Amount does not include the portfolio activity of any underlying mutual funds or exchange-traded funds (ETFs).
For the period ended June 30, 2023
1. Organization.
VIP Overseas Portfolio (the Fund) is a fund of Variable Insurance Products Fund (the Trust) and is authorized to issue an unlimited number of shares. The Trust is registered under the Investment Company Act of 1940, as amended (the 1940 Act), as an open-end management investment company organized as a Massachusetts business trust. Shares of the Fund may only be purchased by insurance companies for the purpose of funding variable annuity or variable life insurance contracts. The Fund offers the following classes of shares: Initial Class shares, Service Class shares, Service Class 2 shares and Investor Class shares. All classes have equal rights and voting privileges, except for matters affecting a single class.
2. Investments in Fidelity Central Funds.
Funds may invest in Fidelity Central Funds, which are open-end investment companies generally available only to other investment companies and accounts managed by the investment adviser and its affiliates. The Schedule of Investments lists any Fidelity Central Funds held as an investment as of period end, but does not include the underlying holdings of each Fidelity Central Fund. An investing fund indirectly bears its proportionate share of the expenses of the underlying Fidelity Central Funds.
Based on its investment objective, each Fidelity Central Fund may invest or participate in various investment vehicles or strategies that are similar to those of the investing fund. These strategies are consistent with the investment objectives of the investing fund and may involve certain economic risks which may cause a decline in value of each of the Fidelity Central Funds and thus a decline in the value of the investing fund.
| Fidelity Central Fund | Investment Manager | Investment Objective | Investment Practices | Expense Ratio A |
| Fidelity Money Market Central Funds | Fidelity Management & Research Company LLC (FMR) | Each fund seeks to obtain a high level of current income consistent with the preservation of capital and liquidity. | Short-term Investments | Less than .005% |
A Expenses expressed as a percentage of average net assets and are as of each underlying Central Fund's most recent annual or semi-annual shareholder report.
A complete unaudited list of holdings for each Fidelity Central Fund is available upon request or at the Securities and Exchange Commission website at www.sec.gov. In addition, the financial statements of the Fidelity Central Funds which contain the significant accounting policies (including investment valuation policies) of those funds, and are not covered by the Report of Independent Registered Public Accounting Firm, are available on the Securities and Exchange Commission website or upon request.
3. Significant Accounting Policies.
The Fund is an investment company and applies the accounting and reporting guidance of the Financial Accounting Standards Board (FASB) Accounting Standards Codification Topic 946 Financial Services - Investment Companies . The financial statements have been prepared in conformity with accounting principles generally accepted in the United States of America (GAAP), which require management to make certain estimates and assumptions at the date of the financial statements. Actual results could differ from those estimates. Subsequent events, if any, through the date that the financial statements were issued have been evaluated in the preparation of the financial statements. The Fund's Schedule of Investments lists any underlying mutual funds or exchange-traded funds (ETFs) but does not include the underlying holdings of these funds. The following summarizes the significant accounting policies of the Fund:
Investment Valuation. Investments are valued as of 4:00 p.m. Eastern time on the last calendar day of the period. The Board of Trustees (the Board) has designated the Fund's investment adviser as the valuation designee responsible for the fair valuation function and performing fair value determinations as needed. The investment adviser has established a Fair Value Committee (the Committee) to carry out the day-to-day fair valuation responsibilities and has adopted policies and procedures to govern the fair valuation process and the activities of the Committee. In accordance with these fair valuation policies and procedures, which have been approved by the Board, the Fund attempts to obtain prices from one or more third party pricing services or brokers to value its investments. When current market prices, quotations or currency exchange rates are not readily available or reliable, investments will be fair valued in good faith by the Committee, in accordance with the policies and procedures. Factors used in determining fair value vary by investment type and may include market or investment specific events, transaction data, estimated cash flows, and market observations of comparable investments. The frequency that the fair valuation procedures are used cannot be predicted and they may be utilized to a significant extent. The Committee manages the Fund's fair valuation practices and maintains the fair valuation policies and procedures. The Fund's investment adviser reports to the Board information regarding the fair valuation process and related material matters.
The Fund categorizes the inputs to valuation techniques used to value its investments into a disclosure hierarchy consisting of three levels as shown below:
Level 1 - unadjusted quoted prices in active markets for identical investments
Level 2 - other significant observable inputs (including quoted prices for similar investments, interest rates, prepayment speeds, etc.)
Level 3 - unobservable inputs (including the Fund's own assumptions based on the best information available)
Valuation techniques used to value the Fund's investments by major category are as follows:
Equity securities, including restricted securities, for which market quotations are readily available, are valued at the last reported sale price or official closing price as reported by a third party pricing service on the primary market or exchange on which they are traded and are categorized as Level 1 in the hierarchy. In the event there were no sales during the day or closing prices are not available, securities are valued at the last quoted bid price or may be valued using the last available price and are generally categorized as Level 2 in the hierarchy. For foreign equity securities, when market or security specific events arise, comparisons to the valuation of American Depositary Receipts (ADRs), futures contracts, ETFs and certain indexes as well as quoted prices for similar securities may be used and would be categorized as Level 2 in the hierarchy. For equity securities, including restricted securities, where observable inputs are limited, assumptions about market activity and risk are used and these securities may be categorized as Level 3 in the hierarchy.
Investments in open-end mutual funds, including the Fidelity Central Funds, are valued at their closing net asset value (NAV) each business day and are categorized as Level 1 in the hierarchy.
Changes in valuation techniques may result in transfers in or out of an assigned level within the disclosure hierarchy. The aggregate value of investments by input level as of June 30, 2023 is included at the end of the Fund's Schedule of Investments.
Foreign Currency. Certain Funds may use foreign currency contracts to facilitate transactions in foreign-denominated securities. Gains and losses from these transactions may arise from changes in the value of the foreign currency or if the counterparties do not perform under the contracts' terms.
Foreign-denominated assets, including investment securities, and liabilities are translated into U.S. dollars at the exchange rates at period end. Purchases and sales of investment securities, income and dividends received, and expenses denominated in foreign currencies are translated into U.S. dollars at the exchange rate in effect on the transaction date.
The effects of exchange rate fluctuations on investments are included with the net realized and unrealized gain (loss) on investment securities. Other foreign currency transactions resulting in realized and unrealized gain (loss) are disclosed separately.
Investment Transactions and Income. For financial reporting purposes, the Fund's investment holdings and NAV include trades executed through the end of the last business day of the period. The NAV per share for processing shareholder transactions is calculated as of the close of business of the New York Stock Exchange (NYSE), normally 4:00 p.m. Eastern time and includes trades executed through the end of the prior business day. Gains and losses on securities sold are determined on the basis of identified cost and include proceeds received from litigation. Commissions paid to certain brokers with whom the investment adviser, or its affiliates, places trades on behalf of a fund include an amount in addition to trade execution, which may be rebated back to a fund. Any such rebates are included in net realized gain (loss) on investments in the Statement of Operations. Dividend income is recorded on the ex-dividend date, except for certain dividends from foreign securities where the ex-dividend date may have passed, which are recorded as soon as the Fund is informed of the ex-dividend date. Non-cash dividends included in dividend income, if any, are recorded at the fair market value of the securities received. Income and capital gain distributions from Fidelity Central Funds, if any, are recorded on the ex-dividend date. Investment income is recorded net of foreign taxes withheld where recovery of such taxes is uncertain. Funds may file withholding tax reclaims in certain jurisdictions to recover a portion of amounts previously withheld. Any withholding tax reclaims income is included in the Statement of Operations in foreign taxes withheld. Any receivables for withholding tax reclaims are included in the Statement of Assets and Liabilities in reclaims receivable.
Class Allocations and Expenses. Investment income, realized and unrealized capital gains and losses, common expenses of a fund, and certain fund-level expense reductions, if any, are allocated daily on a pro-rata basis to each class based on the relative net assets of each class to the total net assets of a fund. Each class differs with respect to transfer agent and distribution and service plan fees incurred, as applicable. Certain expense reductions may also differ by class, if applicable. For the reporting period, the allocated portion of income and expenses to each class as a percent of its average net assets may vary due to the timing of recording these transactions in relation to fluctuating net assets of the classes. Expenses directly attributable to a fund are charged to that fund. Expenses attributable to more than one fund are allocated among the respective funds on the basis of relative net assets or other appropriate methods. Expenses included in the accompanying financial statements reflect the expenses of that fund and do not include any expenses associated with any underlying mutual funds or ETFs. Although not included in a fund's expenses, a fund indirectly bears its proportionate share of these expenses through the net asset value of each underlying mutual fund or ETF. Expense estimates are accrued in the period to which they relate and adjustments are made when actual amounts are known.
Deferred Trustee Compensation. Under a Deferred Compensation Plan (the Plan) for certain Funds, certain independent Trustees have elected to defer receipt of a portion of their annual compensation. Deferred amounts are invested in affiliated mutual funds, are marked-to-market and remain in a fund until distributed in accordance with the Plan. The investment of deferred amounts and the offsetting payable to the Trustees presented below are included in the accompanying Statement of Assets and Liabilities in other receivables and other payables and accrued expenses, as applicable.
| VIP Overseas Portfolio | $10,084 |
Income Tax Information and Distributions to Shareholders. Each year, the Fund intends to qualify as a regulated investment company under Subchapter M of the Internal Revenue Code, including distributing substantially all of its taxable income and realized gains. As a result, no provision for U.S. Federal income taxes is required. The Fund files a U.S. federal tax return, in addition to state and local tax returns as required. The Fund's federal income tax returns are subject to examination by the Internal Revenue Service (IRS) for a period of three fiscal years after they are filed. State and local tax returns may be subject to examination for an additional fiscal year depending on the jurisdiction. Foreign taxes are provided for based on the Fund's understanding of the tax rules and rates that exist in the foreign markets in which it invests. The Fund is subject to a tax imposed on capital gains by certain countries in which it invests. An estimated deferred tax liability for net unrealized appreciation on the applicable securities is included in Deferred taxes on the Statement of Assets & Liabilities.
Distributions are declared and recorded on the ex-dividend date. Income and capital gain distributions are declared separately for each class. Income and capital gain distributions are determined in accordance with income tax regulations, which may differ from GAAP.
Capital accounts within the financial statements are adjusted for permanent book-tax differences. These adjustments have no impact on net assets or the results of operations. Capital accounts are not adjusted for temporary book-tax differences which will reverse in a subsequent period.
Book-tax differences are primarily due to foreign currency transactions, certain foreign taxes, capital loss carryforwards and losses deferred due to wash sales and excise tax regulations.
As of period end, the cost and unrealized appreciation (depreciation) in securities, and derivatives if applicable, for federal income tax purposes were as follows:
| Gross unrealized appreciation | $519,500,054 |
| Gross unrealized depreciation | (33,079,521) |
| Net unrealized appreciation (depreciation) | $486,420,533 |
| Tax cost | $1,269,900,940 |
Capital loss carryforwards are only available to offset future capital gains of the Fund to the extent provided by regulations and may be limited. The capital loss carryforward information presented below, including any applicable limitation, is estimated as of prior fiscal period end and is subject to adjustment.
| Short-term | $(36,980,524) |
| Long-term | - |
| Total capital loss carryforward | $(36,980,524) |
Restricted Securities (including Private Placements). Funds may invest in securities that are subject to legal or contractual restrictions on resale. These securities generally may be resold in transactions exempt from registration or to the public if the securities are registered. Disposal of these securities may involve time-consuming negotiations and expense, and prompt sale at an acceptable price may be difficult. Information regarding restricted securities held at period end is included at the end of the Schedule of Investments, if applicable.
4. Purchases and Sales of Investments.
Purchases and sales of securities, other than short-term securities and in-kind transactions, as applicable, are noted in the table below.
| | Purchases ($) | Sales ($) |
| VIP Overseas Portfolio | 258,137,802 | 304,048,907 |
5. Fees and Other Transactions with Affiliates.
Management Fee. Fidelity Management & Research Company LLC (the investment adviser) and its affiliates provide the Fund with investment management related services for which the Fund pays a monthly management fee. The management fee is the sum of an individual fund fee rate that is based on an annual rate of .424% of the Fund's average net assets and an annualized group fee rate that averaged .23% during the period. The group fee rate is based upon the monthly average net assets of a group of registered investment companies with which the investment adviser has management contracts. The group fee rate decreases as assets under management increase and increases as assets under management decrease. For the reporting period, the total annualized management fee rate was .65% of the Fund's average net assets.
Distribution and Service Plan Fees. In accordance with Rule 12b-1 of the 1940 Act, the Fund has adopted separate 12b-1 Plans for each Service Class of shares. Each Service Class pays Fidelity Distributors Company LLC (FDC), an affiliate of the investment adviser, a service fee. For the period, the service fee is based on an annual rate of .10% of Service Class' average net assets and .25% of Service Class 2's average net assets.
For the period, total fees, all of which were re-allowed to insurance companies for the distribution of shares and providing shareholder support services, were as follows:
| Service Class | $67,882 |
| Service Class 2 | 407,984 |
| | $475,866 |
Transfer Agent Fees. Fidelity Investments Institutional Operations Company LLC (FIIOC), an affiliate of the investment adviser, is the Fund's transfer, dividend disbursing, and shareholder servicing agent. FIIOC receives an asset-based fee with respect to each class. Each class pays a fee for transfer agent services, typesetting and printing and mailing of shareholder reports, excluding mailing of proxy statements. For the period, transfer agent fees for each class were as follows:
| | Amount | % of Class-Level Average Net Assets A |
| Initial Class | $270,738 | .06 |
| Service Class | 42,766 | .06 |
| Service Class 2 | 102,812 | .06 |
| Investor Class | 280,321 | .14 |
| | $696,637 | |
A Annualized
Accounting Fees. Fidelity Service Company, Inc. (FSC), an affiliate of the investment adviser, maintains the Fund's accounting records. The accounting fee is based on the level of average net assets for each month. For the period, the fees were equivalent to the following annualized rates:
| | % of Average Net Assets |
| VIP Overseas Portfolio | .04 |
Brokerage Commissions. A portion of portfolio transactions were placed with brokerage firms which are affiliates of the investment adviser. Brokerage commissions are included in net realized gain (loss) and change in net unrealized appreciation (depreciation) in the Statement of Operations. The commissions paid to these affiliated firms were as follows:
| | Amount |
| VIP Overseas Portfolio | $108 |
Interfund Lending Program. Pursuant to an Exemptive Order issued by the Securities and Exchange Commission (the SEC), the Fund, along with other registered investment companies having management contracts with Fidelity Management & Research Company LLC (FMR), or other affiliated entities of FMR, may participate in an interfund lending program. This program provides an alternative credit facility allowing the Fund to borrow from, or lend money to, other participating affiliated funds. At period end, there were no interfund loans outstanding. Activity in this program during the period for which loans were outstanding was as follows:
| | Borrower or Lender | Average Loan Balance | Weighted Average Interest Rate | Interest Expense |
| VIP Overseas Portfolio | Borrower | $ 8,294,125 | 5.07% | $ 9,344 |
Interfund Trades. Funds may purchase from or sell securities to other Fidelity Funds under procedures adopted by the Board. The procedures have been designed to ensure these interfund trades are executed in accordance with Rule 17a-7 of the 1940 Act. Any interfund trades are included within the respective purchases and sales amounts shown in the Purchases and Sales of Investments note. Interfund trades during the period are noted in the table below.
| | Purchases ($) | Sales ($) | Realized Gain (Loss) ($) |
| VIP Overseas Portfolio | 7,102,382 | 4,644,582 | (103,570) |
6. Committed Line of Credit.
Certain Funds participate with other funds managed by the investment adviser or an affiliate in a $4.25 billion credit facility (the "line of credit") to be utilized for temporary or emergency purposes to fund shareholder redemptions or for other short-term liquidity purposes. The participating funds have agreed to pay commitment fees on their pro-rata portion of the line of credit, which are reflected in Miscellaneous expenses on the Statement of Operations, and are listed below. During the period, there were no borrowings on this line of credit.
| | Amount |
| VIP Overseas Portfolio | $1,618 |
7. Security Lending.
Funds lend portfolio securities from time to time in order to earn additional income. Lending agents are used, including National Financial Services (NFS), an affiliate of the investment adviser. Pursuant to a securities lending agreement, NFS will receive a fee, which is capped at 9.9% of a fund's daily lending revenue, for its services as lending agent. A fund may lend securities to certain qualified borrowers, including NFS. On the settlement date of the loan, a fund receives collateral (in the form of U.S. Treasury obligations, letters of credit and/or cash) against the loaned securities and maintains collateral in an amount not less than 100% of the market value of the loaned securities during the period of the loan. The market value of the loaned securities is determined at the close of business of a fund and any additional required collateral is delivered to a fund on the next business day. A fund or borrower may terminate the loan at any time, and if the borrower defaults on its obligation to return the securities loaned because of insolvency or other reasons, a fund may apply collateral received from the borrower against the obligation. A fund may experience delays and costs in recovering the securities loaned. Any cash collateral received is invested in the Fidelity Securities Lending Cash Central Fund. Any loaned securities are identified as such in the Schedule of Investments, and the value of loaned securities and cash collateral at period end, as applicable, are presented in the Statement of Assets and Liabilities. Security lending income represents the income earned on investing cash collateral, less rebates paid to borrowers and any lending agent fees associated with the loan, plus any premium payments received for lending certain types of securities. Security lending income is presented in the Statement of Operations as a component of income from Fidelity Central Funds. Affiliated security lending activity, if any, was as follows:
| | Total Security Lending Fees Paid to NFS | Security Lending Income From Securities Loaned to NFS | Value of Securities Loaned to NFS at Period End |
| VIP Overseas Portfolio | $7,172 | $ - | $- |
8. Expense Reductions.
In addition, during the period the investment adviser or an affiliate reimbursed and/or waived a portion of fund-level operating expenses in the amount of $38,542.
9. Distributions to Shareholders.
Distributions to shareholders of each class were as follows:
| | Six months ended June 30, 2023 | Year ended December 31, 2022 |
| VIP Overseas Portfolio | | |
| Distributions to shareholders | | |
| Initial Class | $- | $16,648,031 |
| Service Class | - | 2,512,372 |
| Service Class 2 | - | 5,481,619 |
| Investor Class | - | 7,716,041 |
Total | $- | $32,358,063 |
10. Share Transactions.
Transactions for each class of shares were as follows and may contain in-kind transactions:
| | Shares | Shares | Dollars | Dollars |
| | Six months ended June 30, 2023 | Year ended December 31, 2022 | Six months ended June 30, 2023 | Year ended December 31, 2022 |
| VIP Overseas Portfolio | | | | |
| Initial Class | | | | |
| Shares sold | 2,959,619 | 15,978,609 | $70,517,440 | $369,361,688 |
| Reinvestment of distributions | - | 687,470 | - | 16,648,031 |
| Shares redeemed | (4,378,809) | (15,186,615) | (104,356,595) | (345,432,431) |
| Net increase (decrease) | (1,419,190) | 1,479,464 | $(33,839,155) | $40,577,288 |
| Service Class | | | | |
| Shares sold | 176,849 | 646,505 | $4,184,844 | $14,653,527 |
| Reinvestment of distributions | - | 103,833 | - | 2,512,372 |
| Shares redeemed | (457,455) | (700,870) | (10,957,171) | (15,950,114) |
| Net increase (decrease) | (280,606) | 49,468 | $(6,772,327) | $1,215,785 |
| Service Class 2 | | | | |
| Shares sold | 922,234 | 2,262,090 | $21,806,428 | $50,339,427 |
| Reinvestment of distributions | - | 226,690 | - | 5,481,619 |
| Shares redeemed | (1,856,394) | (1,964,135) | (43,598,816) | (45,187,038) |
| Net increase (decrease) | (934,160) | 524,645 | $(21,792,388) | $10,634,008 |
| Investor Class | | | | |
| Shares sold | 939,036 | 3,140,368 | $22,336,608 | $72,621,907 |
| Reinvestment of distributions | - | 318,283 | - | 7,716,041 |
| Shares redeemed | (1,552,103) | (3,761,171) | (37,128,251) | (83,451,656) |
| Net increase (decrease) | (613,067) | (302,520) | $(14,791,643) | $(3,113,708) |
11. Other.
A fund's organizational documents provide former and current trustees and officers with a limited indemnification against liabilities arising in connection with the performance of their duties to the fund. In the normal course of business, a fund may also enter into contracts that provide general indemnifications. A fund's maximum exposure under these arrangements is unknown as this would be dependent on future claims that may be made against a fund. The risk of material loss from such claims is considered remote.
At the end of the period, the investment adviser or its affiliates were owners of record of more than 10% and certain otherwise unaffiliated shareholders were owners of record of more than 10% of the outstanding shares as follows:
| Fund | % of shares held | Number of Unaffiliated Shareholders | Unaffiliated Shareholders % |
| VIP Overseas Portfolio | 29% | 1 | 15% |
Mutual funds managed by the investment adviser or its affiliates, in aggregate, were the owners of record of more than 20% of the total outstanding shares.
| Fund | % of shares held |
| VIP Overseas Portfolio | 38% |
12. Risk and Uncertainties.
Many factors affect a fund's performance. Developments that disrupt global economies and financial markets, such as pandemics, epidemics, outbreaks of infectious diseases, war, terrorism, and environmental disasters, may significantly affect a fund's investment performance. The effects of these developments to a fund will be impacted by the types of securities in which a fund invests, the financial condition, industry, economic sector, and geographic location of an issuer, and a fund's level of investment in the securities of that issuer. Significant concentrations in security types, issuers, industries, sectors, and geographic locations may magnify the factors that affect a fund's performance.
As a shareholder, you incur two types of costs: (1) transaction costs, which may include sales charges (loads) on purchase payments or redemption proceeds, as applicable and (2) ongoing costs, which generally include management fees, distribution and/or service (12b-1) fees and other Fund expenses. This Example is intended to help you understand your ongoing costs (in dollars) of investing in a fund and to compare these costs with the ongoing costs of investing in other mutual funds.
| The Example is based on an investment of $1,000 invested at the beginning of the period and held for the entire period (January 1, 2023 to June 30, 2023). |
Actual Expenses
The first line of the accompanying table provides information about actual account values and actual expenses. You may use the information in this line, together with the amount you invested, to estimate the expenses that you paid over the period. Simply divide your account value by $1,000.00 (for example, an $8,600 account value divided by $1,000.00 = 8.6), then multiply the result by the number in the first line for a class/Fund under the heading entitled "Expenses Paid During Period" to estimate the expenses you paid on your account during this period. If any fund is a shareholder of any underlying mutual funds or exchange-traded funds (ETFs) (the Underlying Funds), such fund indirectly bears its proportional share of the expenses of the Underlying Funds in addition to the direct expenses incurred presented in the table. These fees and expenses are not included in the annualized expense ratio used to calculate the expense estimate in the table below. The estimate of expenses does not include any fees or other expenses of any variable annuity or variable life insurance product. If they were, the estimate of expenses you paid during the period would be higher, and your ending account value would be lower.
Hypothetical Example for Comparison Purposes
The second line of the accompanying table provides information about hypothetical account values and hypothetical expenses based on the actual expense ratio and an assumed rate of return of 5% per year before expenses, which is not the actual return. The hypothetical account values and expenses may not be used to estimate the actual ending account balance or expenses you paid for the period. You may use this information to compare the ongoing costs of investing in the Fund and other funds. To do so, compare this 5% hypothetical example with the 5% hypothetical examples that appear in the shareholder reports of the other funds. If any fund is a shareholder of any Underlying Funds, such fund indirectly bears its proportional share of the expenses of the Underlying Funds in addition to the direct expenses as presented in the table. These fees and expenses are not included in the annualized expense ratio used to calculate the expense estimate in the table below. The estimate of expenses does not include any fees or other expenses of any variable annuity or variable life insurance product. If they were, the estimate of expenses you paid during the period would be higher, and your ending account value would be lower.
Please note that the expenses shown in the table are meant to highlight your ongoing costs only and do not reflect any transaction costs. Therefore, the second line of the table is useful in comparing ongoing costs only, and will not help you determine the relative total costs of owning different funds. In addition, if these transactional costs were included, your costs would have been higher.
| | | | | Annualized Expense Ratio- A | | Beginning Account Value January 1, 2023 | | Ending Account Value June 30, 2023 | | Expenses Paid During Period- C January 1, 2023 to June 30, 2023 |
| VIP Overseas Portfolio | | | | | | | | | | |
| Initial Class | | | | .77% | | | | | | |
| Actual | | | | | | $ 1,000 | | $ 1,148.40 | | $ 4.10 |
Hypothetical- B | | | | | | $ 1,000 | | $ 1,020.98 | | $ 3.86 |
| Service Class | | | | .87% | | | | | | |
| Actual | | | | | | $ 1,000 | | $ 1,148.30 | | $ 4.63 |
Hypothetical- B | | | | | | $ 1,000 | | $ 1,020.48 | | $ 4.36 |
| Service Class 2 | | | | 1.02% | | | | | | |
| Actual | | | | | | $ 1,000 | | $ 1,146.90 | | $ 5.43 |
Hypothetical- B | | | | | | $ 1,000 | | $ 1,019.74 | | $ 5.11 |
| Investor Class | | | | .84% | | | | | | |
| Actual | | | | | | $ 1,000 | | $ 1,148.10 | | $ 4.47 |
Hypothetical- B | | | | | | $ 1,000 | | $ 1,020.63 | | $ 4.21 |
| |
A Annualized expense ratio reflects expenses net of applicable fee waivers.
B 5% return per year before expenses
C Expenses are equal to the annualized expense ratio, multiplied by the average account value over the period, multiplied by 181/ 365 (to reflect the one-half year period). The fees and expenses of any Underlying Funds are not included in each annualized expense ratio.
Board Approval of Investment Advisory Contracts
VIP Overseas Portfolio
At its May 2023 meeting, the Board of Trustees, including the Independent Trustees (together, the Board), voted to continue the management contract with Fidelity Management & Research Company LLC (FMR), and the sub-advisory agreements and sub-subadvisory agreements, in each case, where applicable (together, the Advisory Contracts) for the fund for two months from June 1, 2023 through July 31, 2023. The Board determined that it will consider the annual renewal of the fund's Advisory Contracts for a full one year period in July 2023, following its review of additional materials provided by FMR.
The Board considered that the approval of the fund's Advisory Contracts will not result in any changes in (i) the investment process or strategies employed in the management of the fund's assets; (ii) the fees and expenses paid by shareholders; (iii) the nature, extent or quality of services provided under the fund's Advisory Contracts; or (iv) the day-to-day management of the fund or the persons primarily responsible for such management. The Board also considered that since its last approval of the fund's Advisory Contracts, FMR had provided additional information on the fund in support of the annual contract renewal process, including competitive analyses on total expenses and management fees and in-depth reviews of fund performance and fund profitability information. The Board concluded that the fund's Advisory Contracts are fair and reasonable, and that the fund's Advisory Contracts should be renewed, without modification, through July 31, 2023, with the understanding that the Board will consider the annual renewal for a full one year period in July 2023.
In connection with its consideration of future renewals of the fund's Advisory Contracts, the Board will consider: (i) the nature, extent and quality of services provided to the fund, including shareholder and administrative services and investment performance; (ii) the competitiveness of the management fee and total expenses for the fund; (iii) the costs of the services and profitability, including the revenues earned and the expenses incurred in conducting the business of developing, marketing, distributing, managing, administering, and servicing the fund and its shareholders, to the extent applicable; and (iv) whether there have been economies of scale in respect of the Fidelity funds, whether the Fidelity funds (including the fund) have appropriately benefited from any such economies of scale, and whether there is the potential for realization of any further economies.
Based on its evaluation of all of the conclusions noted above, and after considering all factors it believed relevant, the Board ultimately concluded that the fund's management fee structure is fair and reasonable, and that the continuation of the fund's Advisory Contracts should be approved for two months from June 1, 2023 through July 31, 2023.
The Securities and Exchange Commission adopted Rule 22e-4 under the Investment Company Act of 1940 (the Liquidity Rule) to promote effective liquidity risk management throughout the open-end investment company industry, thereby reducing the risk that funds will be unable to meet their redemption obligations and mitigating dilution of the interests of fund shareholders.
The Fund has adopted and implemented a liquidity risk management program (the Program) reasonably designed to assess and manage the Fund's liquidity risk and to comply with the requirements of the Liquidity Rule. The Fund's Board of Trustees (the Board) has designated the Fund's investment adviser as administrator of the Program. The Fidelity advisers have established a Liquidity Risk Management Committee (the LRM Committee) to manage the Program for each of the Fidelity Funds. The LRM Committee monitors the adequacy and effectiveness of implementation of the Program and on a periodic basis assesses each Fund's liquidity risk based on a variety of factors including (1) the Fund's investment strategy, (2) portfolio liquidity and cash flow projections during normal and reasonably foreseeable stressed conditions, (3) shareholder redemptions, (4) borrowings and other funding sources and (5) certain factors specific to ETFs including the effect of the Fund's prices and spreads, market participants, and basket compositions on the overall liquidity of the Fund's portfolio, as applicable.
In accordance with the Program, each of the Fund's portfolio investments is classified into one of four defined liquidity categories based on a determination of a reasonable expectation for how long it would take to convert the investment to cash (or sell or dispose of the investment) without significantly changing its market value.
- Highly liquid investments - cash or convertible to cash within three business days or less
- Moderately liquid investments - convertible to cash in three to seven calendar days
- Less liquid investments - can be sold or disposed of, but not settled, within seven calendar days
- Illiquid investments - cannot be sold or disposed of within seven calendar days
Liquidity classification determinations take into account a variety of factors including various market, trading and investment-specific considerations, as well as market depth, and generally utilize analysis from a third-party liquidity metrics service.
The Liquidity Rule places a 15% limit on a fund's illiquid investments and requires funds that do not primarily hold assets that are highly liquid investments to determine and maintain a minimum percentage of the fund's net assets to be invested in highly liquid investments (highly liquid investment minimum or HLIM). The Program includes provisions reasonably designed to comply with the 15% limit on illiquid investments and for determining, periodically reviewing and complying with the HLIM requirement as applicable.
At a recent meeting of the Fund's Board of Trustees, the LRM Committee provided a written report to the Board pertaining to the operation, adequacy, and effectiveness of the Program for the period December 1, 2021 through November 30, 2022. The report concluded that the Program is operating effectively and is reasonably designed to assess and manage the Fund's liquidity risk.
1.705696.125
VIPOVRS-SANN-0823
Fidelity® Variable Insurance Products:
VIP Value Portfolio
Semi-Annual Report
June 30, 2023
Contents
To view a fund's proxy voting guidelines and proxy voting record for the 12-month period ended June 30, visit http://www.fidelity.com/proxyvotingresults or visit the Securities and Exchange Commission's (SEC) web site at http://www.sec.gov.
You may also call 1-877-208-0098 to request a free copy of the proxy voting guidelines.
Fidelity® Variable Insurance Products are separate account options which are purchased through a variable insurance contract.
Standard & Poor's, S&P and S&P 500 are registered service marks of The McGraw-Hill Companies, Inc. and have been licensed for use by Fidelity Distributors Corporation.
Other third-party marks appearing herein are the property of their respective owners.
All other marks appearing herein are registered or unregistered trademarks or service marks of FMR LLC or an affiliated company. © 2023 FMR LLC. All rights reserved.
This report and the financial statements contained herein are submitted for the general information of the shareholders of the Fund. This report is not authorized for distribution to prospective investors in the Fund unless preceded or accompanied by an effective prospectus.
A fund files its complete schedule of portfolio holdings with the SEC for the first and third quarters of each fiscal year on Form N-PORT. Forms N-PORT are available on the SEC's web site at http://www.sec.gov. A fund's Forms N-PORT may be reviewed and copied at the SEC's Public Reference Room in Washington, DC. Information regarding the operation of the SEC's Public Reference Room may be obtained by calling 1-800-SEC-0330.
For a complete list of a fund's portfolio holdings, view the most recent holdings listing, semiannual report, or annual report on Fidelity's web site at http://www.fidelity.com, http://www.institutional.fidelity.com, or http://www.401k.com, as applicable.
NOT FDIC INSURED •MAY LOSE VALUE •NO BANK GUARANTEE
Neither the Fund nor Fidelity Distributors Corporation is a bank.
This report and the financial statements contained herein are submitted for the general information of the shareholders of the Fund. This report is not authorized for distribution to prospective investors in the Fund unless preceded or accompanied by an effective prospectus.
A fund files its complete schedule of portfolio holdings with the SEC for the first and third quarters of each fiscal year on Form N-PORT. Forms N-PORT are available on the SEC's web site at http://www.sec.gov. A fund's Forms N-PORT may be reviewed and copied at the SEC's Public Reference Room in Washington, DC. Information regarding the operation of the SEC's Public Reference Room may be obtained by calling 1-800-SEC-0330.
For a complete list of a fund's portfolio holdings, view the most recent holdings listing, semiannual report, or annual report on Fidelity's web site at http://www.fidelity.com, http://www.institutional.fidelity.com, or http://www.401k.com, as applicable.
NOT FDIC INSURED •MAY LOSE VALUE •NO BANK GUARANTEE
Neither the Fund nor Fidelity Distributors Corporation is a bank.
Top Holdings (% of Fund's net assets) |
| |
| Exxon Mobil Corp. | 2.9 | |
| Cigna Group | 2.3 | |
| Centene Corp. | 2.0 | |
| U.S. Foods Holding Corp. | 1.7 | |
| Flex Ltd. | 1.7 | |
| The Travelers Companies, Inc. | 1.7 | |
| AstraZeneca PLC sponsored ADR | 1.6 | |
| Keurig Dr. Pepper, Inc. | 1.6 | |
| Lumentum Holdings, Inc. | 1.5 | |
| PG&E Corp. | 1.5 | |
| | 18.5 | |
| |
| Market Sectors (% of Fund's net assets) |
| |
| Financials | 19.2 | |
| Industrials | 16.3 | |
| Health Care | 11.6 | |
| Energy | 10.9 | |
| Consumer Discretionary | 9.2 | |
| Materials | 6.9 | |
| Consumer Staples | 5.5 | |
| Communication Services | 5.5 | |
| Utilities | 5.4 | |
| Information Technology | 4.8 | |
| Real Estate | 4.8 | |
| |
Asset Allocation (% of Fund's net assets) |
|
Short-Term Investments and Net Other Assets (Liabilities) - (0.1)% |
|
Geographic Diversification (% of Fund's net assets) |
|
* Includes Short-Term investments and Net Other Assets (Liabilities). Percentages are adjusted for the effect of derivatives, if applicable. |
| |
Showing Percentage of Net Assets
| Common Stocks - 100.1% |
| | | Shares | Value ($) |
| COMMUNICATION SERVICES - 5.5% | | | |
| Diversified Telecommunication Services - 1.0% | | | |
| Cellnex Telecom SA (a) | | 118,600 | 4,787,110 |
| Interactive Media & Services - 2.5% | | | |
| Alphabet, Inc. Class A (b) | | 44,773 | 5,359,328 |
| Meta Platforms, Inc. Class A (b) | | 21,853 | 6,271,374 |
| | | | 11,630,702 |
| Media - 1.5% | | | |
| Comcast Corp. Class A | | 118,062 | 4,905,476 |
| Nexstar Broadcasting Group, Inc. Class A | | 14,400 | 2,398,320 |
| | | | 7,303,796 |
| Wireless Telecommunication Services - 0.5% | | | |
| T-Mobile U.S., Inc. (b) | | 15,300 | 2,125,170 |
TOTAL COMMUNICATION SERVICES | | | 25,846,778 |
| CONSUMER DISCRETIONARY - 9.2% | | | |
| Automobile Components - 1.4% | | | |
| Adient PLC (b) | | 76,000 | 2,912,320 |
| Autoliv, Inc. | | 40,671 | 3,458,662 |
| | | | 6,370,982 |
| Automobiles - 0.7% | | | |
| Harley-Davidson, Inc. | | 97,200 | 3,422,412 |
| Diversified Consumer Services - 0.5% | | | |
| Adtalem Global Education, Inc. (b) | | 75,064 | 2,577,698 |
| Hotels, Restaurants & Leisure - 0.8% | | | |
| Hilton Grand Vacations, Inc. (b) | | 83,694 | 3,803,055 |
| Household Durables - 0.8% | | | |
| Tempur Sealy International, Inc. | | 92,300 | 3,698,461 |
| Leisure Products - 1.5% | | | |
| Brunswick Corp. | | 39,500 | 3,422,280 |
| Mattel, Inc. (b) | | 195,600 | 3,822,024 |
| | | | 7,244,304 |
| Specialty Retail - 3.5% | | | |
| American Eagle Outfitters, Inc. | | 298,889 | 3,526,890 |
| Lithia Motors, Inc. Class A (sub. vtg.) | | 11,668 | 3,548,355 |
| Signet Jewelers Ltd. (c) | | 37,600 | 2,453,776 |
| Upbound Group, Inc. | | 133,029 | 4,141,193 |
| Victoria's Secret & Co. (b) | | 170,465 | 2,971,205 |
| | | | 16,641,419 |
TOTAL CONSUMER DISCRETIONARY | | | 43,758,331 |
| CONSUMER STAPLES - 5.5% | | | |
| Beverages - 1.7% | | | |
| Keurig Dr. Pepper, Inc. | | 242,923 | 7,596,202 |
| Primo Water Corp. | | 38,336 | 480,733 |
| | | | 8,076,935 |
| Consumer Staples Distribution & Retail - 1.7% | | | |
| U.S. Foods Holding Corp. (b) | | 188,543 | 8,295,892 |
| Food Products - 2.1% | | | |
| Bunge Ltd. | | 37,600 | 3,547,560 |
| Darling Ingredients, Inc. (b) | | 97,958 | 6,248,741 |
| | | | 9,796,301 |
TOTAL CONSUMER STAPLES | | | 26,169,128 |
| ENERGY - 10.9% | | | |
| Energy Equipment & Services - 1.0% | | | |
| Expro Group Holdings NV (b) | | 263,323 | 4,666,084 |
| Oil, Gas & Consumable Fuels - 9.9% | | | |
| Canadian Natural Resources Ltd. | | 106,588 | 5,992,583 |
| Cenovus Energy, Inc. (Canada) | | 243,900 | 4,142,480 |
| Exxon Mobil Corp. | | 128,795 | 13,813,264 |
| Hess Corp. | | 46,203 | 6,281,298 |
| Imperial Oil Ltd. (c) | | 115,756 | 5,922,583 |
| Targa Resources Corp. | | 63,154 | 4,806,019 |
| Tourmaline Oil Corp. (c) | | 125,981 | 5,936,014 |
| | | | 46,894,241 |
TOTAL ENERGY | | | 51,560,325 |
| FINANCIALS - 19.2% | | | |
| Banks - 4.9% | | | |
| East West Bancorp, Inc. | | 92,300 | 4,872,517 |
| First Citizens Bancshares, Inc. | | 4,544 | 5,831,997 |
| M&T Bank Corp. | | 37,084 | 4,589,516 |
| Popular, Inc. | | 52,800 | 3,195,456 |
| U.S. Bancorp | | 142,322 | 4,702,319 |
| | | | 23,191,805 |
| Capital Markets - 3.7% | | | |
| Ameriprise Financial, Inc. | | 19,677 | 6,535,912 |
| LPL Financial | | 28,454 | 6,186,753 |
| Raymond James Financial, Inc. | | 46,684 | 4,844,399 |
| | | | 17,567,064 |
| Consumer Finance - 2.0% | | | |
| OneMain Holdings, Inc. | | 122,647 | 5,358,447 |
| SLM Corp. | | 253,786 | 4,141,788 |
| | | | 9,500,235 |
| Financial Services - 3.7% | | | |
| Apollo Global Management, Inc. | | 87,170 | 6,695,528 |
| Global Payments, Inc. | | 60,113 | 5,922,333 |
| Walker & Dunlop, Inc. | | 61,978 | 4,901,840 |
| | | | 17,519,701 |
| Insurance - 4.9% | | | |
| American Financial Group, Inc. | | 34,723 | 4,123,356 |
| Assurant, Inc. | | 43,805 | 5,507,165 |
| Reinsurance Group of America, Inc. | | 39,221 | 5,439,560 |
| The Travelers Companies, Inc. | | 45,653 | 7,928,100 |
| | | | 22,998,181 |
TOTAL FINANCIALS | | | 90,776,986 |
| HEALTH CARE - 11.6% | | | |
| Health Care Providers & Services - 6.3% | | | |
| AdaptHealth Corp. (b) | | 249,671 | 3,038,496 |
| Centene Corp. (b) | | 136,856 | 9,230,937 |
| Cigna Group | | 39,037 | 10,953,782 |
| CVS Health Corp. | | 96,375 | 6,662,404 |
| | | | 29,885,619 |
| Pharmaceuticals - 5.3% | | | |
| AstraZeneca PLC sponsored ADR | | 107,931 | 7,724,622 |
| Jazz Pharmaceuticals PLC (b) | | 40,696 | 5,045,083 |
| Roche Holding AG (participation certificate) | | 20,717 | 6,328,423 |
| Sanofi SA sponsored ADR | | 114,968 | 6,196,775 |
| | | | 25,294,903 |
TOTAL HEALTH CARE | | | 55,180,522 |
| INDUSTRIALS - 16.3% | | | |
| Aerospace & Defense - 1.3% | | | |
| The Boeing Co. (b) | | 29,854 | 6,303,971 |
| Air Freight & Logistics - 1.4% | | | |
| FedEx Corp. | | 26,976 | 6,687,350 |
| Building Products - 1.0% | | | |
| Builders FirstSource, Inc. (b) | | 34,186 | 4,649,296 |
| Commercial Services & Supplies - 0.8% | | | |
| The Brink's Co. | | 58,834 | 3,990,710 |
| Construction & Engineering - 1.1% | | | |
| Willscot Mobile Mini Holdings (b) | | 106,667 | 5,097,616 |
| Electrical Equipment - 1.3% | | | |
| Regal Rexnord Corp. | | 33,897 | 5,216,748 |
| Sensata Technologies, Inc. PLC | | 22,309 | 1,003,682 |
| | | | 6,220,430 |
| Ground Transportation - 2.7% | | | |
| Knight-Swift Transportation Holdings, Inc. Class A | | 81,500 | 4,528,140 |
| U-Haul Holding Co. (non-vtg.) | | 82,997 | 4,205,458 |
| XPO, Inc. (b) | | 65,672 | 3,874,648 |
| | | | 12,608,246 |
| Industrial Conglomerates - 1.2% | | | |
| General Electric Co. | | 52,492 | 5,766,246 |
| Machinery - 3.2% | | | |
| Allison Transmission Holdings, Inc. | | 80,333 | 4,535,601 |
| Chart Industries, Inc. (b) | | 15,400 | 2,460,766 |
| Kennametal, Inc. | | 110,752 | 3,144,249 |
| Timken Co. | | 55,452 | 5,075,522 |
| | | | 15,216,138 |
| Professional Services - 1.6% | | | |
| Concentrix Corp. | | 48,659 | 3,929,214 |
| Manpower, Inc. | | 46,342 | 3,679,555 |
| | | | 7,608,769 |
| Trading Companies & Distributors - 0.7% | | | |
| Beacon Roofing Supply, Inc. (b) | | 38,117 | 3,162,949 |
TOTAL INDUSTRIALS | | | 77,311,721 |
| INFORMATION TECHNOLOGY - 4.8% | | | |
| Communications Equipment - 1.5% | | | |
| Lumentum Holdings, Inc. (b) | | 129,840 | 7,365,823 |
| Electronic Equipment, Instruments & Components - 1.7% | | | |
| Flex Ltd. (b) | | 287,996 | 7,960,209 |
| Software - 0.7% | | | |
| NCR Corp. (b) | | 133,186 | 3,356,287 |
| Technology Hardware, Storage & Peripherals - 0.9% | | | |
| Seagate Technology Holdings PLC | | 68,800 | 4,256,656 |
TOTAL INFORMATION TECHNOLOGY | | | 22,938,975 |
| MATERIALS - 6.9% | | | |
| Chemicals - 5.2% | | | |
| Axalta Coating Systems Ltd. (b) | | 102,478 | 3,362,303 |
| Celanese Corp. Class A | | 37,100 | 4,296,180 |
| Methanex Corp. | | 93,000 | 3,847,410 |
| Olin Corp. | | 83,080 | 4,269,481 |
| The Chemours Co. LLC | | 140,000 | 5,164,600 |
| Westlake Corp. | | 31,800 | 3,799,146 |
| | | | 24,739,120 |
| Metals & Mining - 0.9% | | | |
| Glencore PLC | | 716,500 | 4,062,473 |
| Paper & Forest Products - 0.8% | | | |
| Louisiana-Pacific Corp. | | 51,500 | 3,861,470 |
TOTAL MATERIALS | | | 32,663,063 |
| REAL ESTATE - 4.8% | | | |
| Equity Real Estate Investment Trusts (REITs) - 3.8% | | | |
| CubeSmart | | 52,496 | 2,344,471 |
| Equity Lifestyle Properties, Inc. | | 39,101 | 2,615,466 |
| Prologis (REIT), Inc. | | 36,653 | 4,494,757 |
| Ventas, Inc. | | 40,113 | 1,896,142 |
| Welltower, Inc. | | 82,354 | 6,661,615 |
| | | | 18,012,451 |
| Real Estate Management & Development - 1.0% | | | |
| Jones Lang LaSalle, Inc. (b) | | 29,980 | 4,670,884 |
TOTAL REAL ESTATE | | | 22,683,335 |
| UTILITIES - 5.4% | | | |
| Electric Utilities - 3.1% | | | |
| Constellation Energy Corp. | | 56,578 | 5,179,716 |
| Evergy, Inc. | | 9,466 | 553,004 |
| PG&E Corp. (b) | | 394,838 | 6,822,801 |
| PPL Corp. | | 73,999 | 1,958,014 |
| | | | 14,513,535 |
| Independent Power and Renewable Electricity Producers - 1.5% | | | |
| The AES Corp. | | 190,278 | 3,944,463 |
| Vistra Corp. | | 120,200 | 3,155,250 |
| | | | 7,099,713 |
| Multi-Utilities - 0.8% | | | |
| Sempra Energy | | 27,526 | 4,007,510 |
TOTAL UTILITIES | | | 25,620,758 |
| TOTAL COMMON STOCKS (Cost $390,442,794) | | | 474,509,922 |
| | | | |
| Money Market Funds - 2.6% |
| | | Shares | Value ($) |
Fidelity Securities Lending Cash Central Fund 5.14% (d)(e) (Cost $12,212,120) | | 12,210,899 | 12,212,121 |
| | | | |
| TOTAL INVESTMENT IN SECURITIES - 102.7% (Cost $402,654,914) | 486,722,043 |
NET OTHER ASSETS (LIABILITIES) - (2.7)% | (12,932,032) |
| NET ASSETS - 100.0% | 473,790,011 |
| | |
Legend
| (a) | Security exempt from registration under Rule 144A of the Securities Act of 1933. These securities may be resold in transactions exempt from registration, normally to qualified institutional buyers. At the end of the period, the value of these securities amounted to $4,787,110 or 1.0% of net assets. |
| (c) | Security or a portion of the security is on loan at period end. |
| (d) | Affiliated fund that is generally available only to investment companies and other accounts managed by Fidelity Investments. The rate quoted is the annualized seven-day yield of the fund at period end. A complete unaudited listing of the fund's holdings as of its most recent quarter end is available upon request. In addition, each Fidelity Central Fund's financial statements are available on the SEC's website or upon request. |
| (e) | Investment made with cash collateral received from securities on loan. |
Affiliated Central Funds
Fiscal year to date information regarding the Fund's investments in Fidelity Central Funds, including the ownership percentage, is presented below.
| Affiliate | Value, beginning of period ($) | Purchases ($) | Sales Proceeds ($) | Dividend Income ($) | Realized Gain (loss) ($) | Change in Unrealized appreciation (depreciation) ($) | Value, end of period ($) | % ownership, end of period |
| Fidelity Cash Central Fund 5.14% | 9,324,719 | 44,725,043 | 54,049,762 | 121,414 | - | - | - | 0.0% |
| Fidelity Securities Lending Cash Central Fund 5.14% | 2,787,331 | 73,968,303 | 64,543,514 | 16,650 | - | 1 | 12,212,121 | 0.0% |
| Total | 12,112,050 | 118,693,346 | 118,593,276 | 138,064 | - | 1 | 12,212,121 | |
| | | | | | | | | |
Amounts in the dividend income column in the above table include any capital gain distributions from underlying funds, which are presented in the corresponding line item in the Statement of Operations, if applicable.
Amounts in the dividend income column for Fidelity Securities Lending Cash Central Fund represents the income earned on investing cash collateral, less rebates paid to borrowers and any lending agent fees associated with the loan, plus any premium payments received for lending certain types of securities.
Amounts included in the purchases and sales proceeds columns may include in-kind transactions, if applicable.
Investment Valuation
The following is a summary of the inputs used, as of June 30, 2023, involving the Fund's assets and liabilities carried at fair value. The inputs or methodology used for valuing securities may not be an indication of the risk associated with investing in those securities. For more information on valuation inputs, and their aggregation into the levels used below, please refer to the Investment Valuation section in the accompanying Notes to Financial Statements.
| Valuation Inputs at Reporting Date: |
| Description | Total ($) | Level 1 ($) | Level 2 ($) | Level 3 ($) |
Investments in Securities: | | | | |
|
| Equities: | | | | |
Communication Services | 25,846,778 | 25,846,778 | - | - |
Consumer Discretionary | 43,758,331 | 43,758,331 | - | - |
Consumer Staples | 26,169,128 | 26,169,128 | - | - |
Energy | 51,560,325 | 51,560,325 | - | - |
Financials | 90,776,986 | 90,776,986 | - | - |
Health Care | 55,180,522 | 48,852,099 | 6,328,423 | - |
Industrials | 77,311,721 | 77,311,721 | - | - |
Information Technology | 22,938,975 | 22,938,975 | - | - |
Materials | 32,663,063 | 28,600,590 | 4,062,473 | - |
Real Estate | 22,683,335 | 22,683,335 | - | - |
Utilities | 25,620,758 | 25,620,758 | - | - |
|
| Money Market Funds | 12,212,121 | 12,212,121 | - | - |
| Total Investments in Securities: | 486,722,043 | 476,331,147 | 10,390,896 | - |
| Statement of Assets and Liabilities |
| | | | June 30, 2023 (Unaudited) |
| | | | | |
| Assets | | | | |
| Investment in securities, at value (including securities loaned of $11,137,070) - See accompanying schedule: | | | | |
Unaffiliated issuers (cost $390,442,794) | $ | 474,509,922 | | |
Fidelity Central Funds (cost $12,212,120) | | 12,212,121 | | |
| | | | | |
| | | | | |
| Total Investment in Securities (cost $402,654,914) | | | $ | 486,722,043 |
| Foreign currency held at value (cost $23,617) | | | | 23,617 |
| Receivable for investments sold | | | | 8,397,293 |
| Receivable for fund shares sold | | | | 133,633 |
| Dividends receivable | | | | 620,262 |
| Distributions receivable from Fidelity Central Funds | | | | 5,835 |
| Other receivables | | | | 78 |
Total assets | | | | 495,902,761 |
| Liabilities | | | | |
| Payable to custodian bank | $ | 1,183,320 | | |
| Payable for investments purchased | | 3,171,152 | | |
| Payable for fund shares redeemed | | 5,238,468 | | |
| Accrued management fee | | 206,378 | | |
| Distribution and service plan fees payable | | 10,145 | | |
| Other affiliated payables | | 57,797 | | |
| Other payables and accrued expenses | | 33,525 | | |
| Collateral on securities loaned | | 12,211,965 | | |
| Total Liabilities | | | | 22,112,750 |
| Net Assets | | | $ | 473,790,011 |
| Net Assets consist of: | | | | |
| Paid in capital | | | $ | 376,074,108 |
| Total accumulated earnings (loss) | | | | 97,715,903 |
| Net Assets | | | $ | 473,790,011 |
| | | | | |
| Net Asset Value and Maximum Offering Price | | | | |
| Initial Class : | | | | |
Net Asset Value , offering price and redemption price per share ($120,818,126 ÷ 6,722,131 shares) | | | $ | 17.97 |
| Service Class : | | | | |
Net Asset Value , offering price and redemption price per share ($257,140 ÷ 14,308 shares) | | | $ | 17.97 |
| Service Class 2 : | | | | |
Net Asset Value , offering price and redemption price per share ($50,213,946 ÷ 2,856,521 shares) | | | $ | 17.58 |
| Investor Class : | | | | |
Net Asset Value , offering price and redemption price per share ($302,500,799 ÷ 16,883,053 shares) | | | $ | 17.92 |
| Statement of Operations |
| | | | Six months ended June 30, 2023 (Unaudited) |
| Investment Income | | | | |
| Dividends | | | $ | 4,520,942 |
| Income from Fidelity Central Funds (including $16,650 from security lending) | | | | 138,064 |
| Total Income | | | | 4,659,006 |
| Expenses | | | | |
| Management fee | $ | 1,282,870 | | |
| Transfer agent fees | | 274,610 | | |
| Distribution and service plan fees | | 60,202 | | |
| Accounting fees | | 86,143 | | |
| Custodian fees and expenses | | 16,611 | | |
| Independent trustees' fees and expenses | | 1,603 | | |
| Audit | | 29,722 | | |
| Legal | | 5,560 | | |
| Miscellaneous | | 1,064 | | |
| Total expenses before reductions | | 1,758,385 | | |
| Expense reductions | | (11,240) | | |
| Total expenses after reductions | | | | 1,747,145 |
| Net Investment income (loss) | | | | 2,911,861 |
| Realized and Unrealized Gain (Loss) | | | | |
| Net realized gain (loss) on: | | | | |
| Investment Securities: | | | | |
| Unaffiliated issuers | | 11,754,937 | | |
| Foreign currency transactions | | 2,657 | | |
| Total net realized gain (loss) | | | | 11,757,594 |
| Change in net unrealized appreciation (depreciation) on: | | | | |
| Investment Securities: | | | | |
| Unaffiliated issuers | | 18,648,354 | | |
| Fidelity Central Funds | | 1 | | |
| Assets and liabilities in foreign currencies | | 5,744 | | |
| Total change in net unrealized appreciation (depreciation) | | | | 18,654,099 |
| Net gain (loss) | | | | 30,411,693 |
| Net increase (decrease) in net assets resulting from operations | | | $ | 33,323,554 |
| Statement of Changes in Net Assets |
| |
| | Six months ended June 30, 2023 (Unaudited) | | Year ended December 31, 2022 |
| Increase (Decrease) in Net Assets | | | | |
| Operations | | | | |
| Net investment income (loss) | $ | 2,911,861 | $ | 6,181,710 |
| Net realized gain (loss) | | 11,757,594 | | 10,091,130 |
| Change in net unrealized appreciation (depreciation) | | 18,654,099 | | (41,645,502) |
| Net increase (decrease) in net assets resulting from operations | | 33,323,554 | | (25,372,662) |
| Distributions to shareholders | | - | | (22,454,265) |
| | | | | |
| Share transactions - net increase (decrease) | | (42,805,049) | | 53,932,406 |
| Total increase (decrease) in net assets | | (9,481,495) | | 6,105,479 |
| | | | | |
| Net Assets | | | | |
| Beginning of period | | 483,271,506 | | 477,166,027 |
| End of period | $ | 473,790,011 | $ | 483,271,506 |
| | | | | |
| | | | | |
| VIP Value Portfolio Initial Class |
| |
| | Six months ended (Unaudited) June 30, 2023 | | Years ended December 31, 2022 | | 2021 | | 2020 | | 2019 | | 2018 |
Selected Per-Share Data | | | | | | | | | | | | |
| Net asset value, beginning of period | $ | 16.73 | $ | 18.28 | $ | 15.96 | $ | 15.78 | $ | 13.08 | $ | 16.36 |
| Income from Investment Operations | | | | | | | | | | | | |
Net investment income (loss) A,B | | .11 | | .23 | | .31 | | .19 | | .26 | | .21 |
| Net realized and unrealized gain (loss) | | 1.13 | | (.96) | | 4.41 | | .75 | | 3.74 | | (2.41) |
| Total from investment operations | | 1.24 | | (.73) | | 4.72 | | .94 | | 4.00 | | (2.20) |
| Distributions from net investment income | | - | | (.23) | | (.32) | | (.20) | | (.27) | | (.18) |
| Distributions from net realized gain | | - | | (.59) | | (2.07) | | (.56) | | (1.03) | | (.90) |
| Total distributions | | - | | (.82) | | (2.40) C | | (.76) | | (1.30) | | (1.08) |
| Net asset value, end of period | $ | 17.97 | $ | 16.73 | $ | 18.28 | $ | 15.96 | $ | 15.78 | $ | 13.08 |
Total Return D,E,F | | 7.41% | | (4.11)% | | 30.07% | | 6.33% | | 32.13% | | (13.84)% |
Ratios to Average Net Assets B,G,H | | | | | | | | | | | | |
| Expenses before reductions | | .65% I | | .64% | | .64% | | .67% | | .67% | | .67% |
| Expenses net of fee waivers, if any | | .64% I | | .64% | | .64% | | .67% | | .67% | | .67% |
| Expenses net of all reductions | | .64% I | | .64% | | .64% | | .65% | | .66% | | .66% |
| Net investment income (loss) | | 1.27% I | | 1.32% | | 1.62% | | 1.48% | | 1.78% | | 1.36% |
| Supplemental Data | | | | | | | | | | | | |
| Net assets, end of period (000 omitted) | $ | 120,818 | $ | 121,880 | $ | 159,917 | $ | 131,037 | $ | 116,401 | $ | 110,203 |
Portfolio turnover rate J | | 71% I | | 48% | | 68% | | 81% | | 67% | | 64% |
A Calculated based on average shares outstanding during the period.
B Net investment income (loss) is affected by the timing of the declaration of dividends by any underlying mutual funds or exchange-traded funds (ETFs). Net investment income (loss) of any mutual funds or ETFs is not included in the Fund's net investment income (loss) ratio.
C Total distributions per share do not sum due to rounding.
D Total returns for periods of less than one year are not annualized.
E Total returns do not reflect charges attributable to your insurance company's separate account. Inclusion of these charges would reduce the total returns shown.
F Total returns would have been lower if certain expenses had not been reduced during the applicable periods shown.
G Fees and expenses of any underlying mutual funds or exchange-traded funds (ETFs) are not included in the Fund's expense ratio. The Fund indirectly bears its proportionate share of these expenses. For additional expense information related to investments in Fidelity Central Funds, please refer to the "Investments in Fidelity Central Funds" note found in the Notes to Financial Statements section of the most recent Annual or Semi-Annual report.
H Expense ratios reflect operating expenses of the class. Expenses before reductions do not reflect amounts reimbursed, waived, or reduced through arrangements with the investment adviser, brokerage services, or other offset arrangements, if applicable, and do not represent the amount paid by the class during periods when reimbursements, waivers or reductions occur.
I Annualized.
J Amount does not include the portfolio activity of any underlying mutual funds or exchange-traded funds (ETFs).
| VIP Value Portfolio Service Class |
| |
| | Six months ended (Unaudited) June 30, 2023 | | Years ended December 31, 2022 | | 2021 | | 2020 | | 2019 | | 2018 |
Selected Per-Share Data | | | | | | | | | | | | |
| Net asset value, beginning of period | $ | 16.74 | $ | 18.28 | $ | 15.96 | $ | 15.78 | $ | 13.08 | $ | 16.36 |
| Income from Investment Operations | | | | | | | | | | | | |
Net investment income (loss) A,B | | .10 | | .21 | | .29 | | .18 | | .24 | | .20 |
| Net realized and unrealized gain (loss) | | 1.13 | | (.95) | | 4.40 | | .75 | | 3.75 | | (2.42) |
| Total from investment operations | | 1.23 | | (.74) | | 4.69 | | .93 | | 3.99 | | (2.22) |
| Distributions from net investment income | | - | | (.21) | | (.30) | | (.19) | | (.25) | | (.15) |
| Distributions from net realized gain | | - | | (.59) | | (2.07) | | (.56) | | (1.03) | | (.90) |
| Total distributions | | - | | (.80) | | (2.37) | | (.75) | | (1.29) C | | (1.06) C |
| Net asset value, end of period | $ | 17.97 | $ | 16.74 | $ | 18.28 | $ | 15.96 | $ | 15.78 | $ | 13.08 |
Total Return D,E,F | | 7.35% | | (4.17)% | | 29.92% | | 6.23% | | 32.01% | | (13.97)% |
Ratios to Average Net Assets B,G,H | | | | | | | | | | | | |
| Expenses before reductions | | .75% I | | .74% | | .74% | | .77% | | .77% | | .77% |
| Expenses net of fee waivers, if any | | .74% I | | .74% | | .74% | | .77% | | .77% | | .77% |
| Expenses net of all reductions | | .74% I | | .74% | | .74% | | .75% | | .76% | | .76% |
| Net investment income (loss) | | 1.17% I | | 1.22% | | 1.52% | | 1.38% | | 1.68% | | 1.26% |
| Supplemental Data | | | | | | | | | | | | |
| Net assets, end of period (000 omitted) | $ | 257 | $ | 240 | $ | 337 | $ | 275 | $ | 270 | $ | 233 |
Portfolio turnover rate J | | 71% I | | 48% | | 68% | | 81% | | 67% | | 64% |
A Calculated based on average shares outstanding during the period.
B Net investment income (loss) is affected by the timing of the declaration of dividends by any underlying mutual funds or exchange-traded funds (ETFs). Net investment income (loss) of any mutual funds or ETFs is not included in the Fund's net investment income (loss) ratio.
C Total distributions per share do not sum due to rounding.
D Total returns for periods of less than one year are not annualized.
E Total returns do not reflect charges attributable to your insurance company's separate account. Inclusion of these charges would reduce the total returns shown.
F Total returns would have been lower if certain expenses had not been reduced during the applicable periods shown.
G Fees and expenses of any underlying mutual funds or exchange-traded funds (ETFs) are not included in the Fund's expense ratio. The Fund indirectly bears its proportionate share of these expenses. For additional expense information related to investments in Fidelity Central Funds, please refer to the "Investments in Fidelity Central Funds" note found in the Notes to Financial Statements section of the most recent Annual or Semi-Annual report.
H Expense ratios reflect operating expenses of the class. Expenses before reductions do not reflect amounts reimbursed, waived, or reduced through arrangements with the investment adviser, brokerage services, or other offset arrangements, if applicable, and do not represent the amount paid by the class during periods when reimbursements, waivers or reductions occur.
I Annualized.
J Amount does not include the portfolio activity of any underlying mutual funds or exchange-traded funds (ETFs).
| VIP Value Portfolio Service Class 2 |
| |
| | Six months ended (Unaudited) June 30, 2023 | | Years ended December 31, 2022 | | 2021 | | 2020 | | 2019 | | 2018 |
Selected Per-Share Data | | | | | | | | | | | | |
| Net asset value, beginning of period | $ | 16.39 | $ | 17.93 | $ | 15.70 | $ | 15.55 | $ | 12.91 | $ | 16.15 |
| Income from Investment Operations | | | | | | | | | | | | |
Net investment income (loss) A,B | | .09 | | .18 | | .26 | | .16 | | .22 | | .17 |
| Net realized and unrealized gain (loss) | | 1.10 | | (.93) | | 4.33 | | .72 | | 3.68 | | (2.37) |
| Total from investment operations | | 1.19 | | (.75) | | 4.59 | | .88 | | 3.90 | | (2.20) |
| Distributions from net investment income | | - | | (.20) | | (.28) | | (.17) | | (.23) | | (.14) |
| Distributions from net realized gain | | - | | (.59) | | (2.07) | | (.56) | | (1.03) | | (.90) |
| Total distributions | | - | | (.79) | | (2.36) C | | (.73) | | (1.26) | | (1.04) |
| Net asset value, end of period | $ | 17.58 | $ | 16.39 | $ | 17.93 | $ | 15.70 | $ | 15.55 | $ | 12.91 |
Total Return D,E,F | | 7.26% | | (4.29)% | | 29.72% | | 6.02% | | 31.77% | | (14.02)% |
Ratios to Average Net Assets B,G,H | | | | | | | | | | | | |
| Expenses before reductions | | .90% I | | .89% | | .89% | | .92% | | .92% | | .92% |
| Expenses net of fee waivers, if any | | .89% I | | .89% | | .89% | | .92% | | .92% | | .92% |
| Expenses net of all reductions | | .89% I | | .89% | | .89% | | .91% | | .91% | | .91% |
| Net investment income (loss) | | 1.02% I | | 1.07% | | 1.37% | | 1.22% | | 1.53% | | 1.11% |
| Supplemental Data | | | | | | | | | | | | |
| Net assets, end of period (000 omitted) | $ | 50,214 | $ | 43,667 | $ | 26,890 | $ | 10,204 | $ | 9,262 | $ | 7,764 |
Portfolio turnover rate J | | 71% I | | 48% | | 68% | | 81% | | 67% | | 64% |
A Calculated based on average shares outstanding during the period.
B Net investment income (loss) is affected by the timing of the declaration of dividends by any underlying mutual funds or exchange-traded funds (ETFs). Net investment income (loss) of any mutual funds or ETFs is not included in the Fund's net investment income (loss) ratio.
C Total distributions per share do not sum due to rounding.
D Total returns for periods of less than one year are not annualized.
E Total returns do not reflect charges attributable to your insurance company's separate account. Inclusion of these charges would reduce the total returns shown.
F Total returns would have been lower if certain expenses had not been reduced during the applicable periods shown.
G Fees and expenses of any underlying mutual funds or exchange-traded funds (ETFs) are not included in the Fund's expense ratio. The Fund indirectly bears its proportionate share of these expenses. For additional expense information related to investments in Fidelity Central Funds, please refer to the "Investments in Fidelity Central Funds" note found in the Notes to Financial Statements section of the most recent Annual or Semi-Annual report.
H Expense ratios reflect operating expenses of the class. Expenses before reductions do not reflect amounts reimbursed, waived, or reduced through arrangements with the investment adviser, brokerage services, or other offset arrangements, if applicable, and do not represent the amount paid by the class during periods when reimbursements, waivers or reductions occur.
I Annualized.
J Amount does not include the portfolio activity of any underlying mutual funds or exchange-traded funds (ETFs).
| VIP Value Portfolio Investor Class |
| |
| | Six months ended (Unaudited) June 30, 2023 | | Years ended December 31, 2022 | | 2021 | | 2020 | | 2019 | | 2018 |
Selected Per-Share Data | | | | | | | | | | | | |
| Net asset value, beginning of period | $ | 16.69 | $ | 18.23 | $ | 15.92 | $ | 15.75 | $ | 13.06 | $ | 16.33 |
| Income from Investment Operations | | | | | | | | | | | | |
Net investment income (loss) A,B | | .10 | | .22 | | .29 | | .18 | | .25 | | .20 |
| Net realized and unrealized gain (loss) | | 1.13 | | (.95) | | 4.40 | | .74 | | 3.73 | | (2.40) |
| Total from investment operations | | 1.23 | | (.73) | | 4.69 | | .92 | | 3.98 | | (2.20) |
| Distributions from net investment income | | - | | (.22) | | (.31) | | (.19) | | (.26) | | (.16) |
| Distributions from net realized gain | | - | | (.59) | | (2.07) | | (.56) | | (1.03) | | (.90) |
| Total distributions | | - | | (.81) | | (2.38) | | (.75) | | (1.29) | | (1.07) C |
| Net asset value, end of period | $ | 17.92 | $ | 16.69 | $ | 18.23 | $ | 15.92 | $ | 15.75 | $ | 13.06 |
Total Return D,E,F | | 7.37% | | (4.13)% | | 29.98% | | 6.20% | | 32.01% | | (13.88)% |
Ratios to Average Net Assets B,G,H | | | | | | | | | | | | |
| Expenses before reductions | | .72% I | | .72% | | .72% | | .74% | | .75% | | .75% |
| Expenses net of fee waivers, if any | | .72% I | | .72% | | .72% | | .74% | | .75% | | .75% |
| Expenses net of all reductions | | .72% I | | .72% | | .72% | | .73% | | .74% | | .74% |
| Net investment income (loss) | | 1.19% I | | 1.24% | | 1.55% | | 1.40% | | 1.70% | | 1.28% |
| Supplemental Data | | | | | | | | | | | | |
| Net assets, end of period (000 omitted) | $ | 302,501 | $ | 317,484 | $ | 290,021 | $ | 190,229 | $ | 197,903 | $ | 170,228 |
Portfolio turnover rate J | | 71% I | | 48% | | 68% | | 81% | | 67% | | 64% |
A Calculated based on average shares outstanding during the period.
B Net investment income (loss) is affected by the timing of the declaration of dividends by any underlying mutual funds or exchange-traded funds (ETFs). Net investment income (loss) of any mutual funds or ETFs is not included in the Fund's net investment income (loss) ratio.
C Total distributions per share do not sum due to rounding.
D Total returns for periods of less than one year are not annualized.
E Total returns do not reflect charges attributable to your insurance company's separate account. Inclusion of these charges would reduce the total returns shown.
F Total returns would have been lower if certain expenses had not been reduced during the applicable periods shown.
G Fees and expenses of any underlying mutual funds or exchange-traded funds (ETFs) are not included in the Fund's expense ratio. The Fund indirectly bears its proportionate share of these expenses. For additional expense information related to investments in Fidelity Central Funds, please refer to the "Investments in Fidelity Central Funds" note found in the Notes to Financial Statements section of the most recent Annual or Semi-Annual report.
H Expense ratios reflect operating expenses of the class. Expenses before reductions do not reflect amounts reimbursed, waived, or reduced through arrangements with the investment adviser, brokerage services, or other offset arrangements, if applicable, and do not represent the amount paid by the class during periods when reimbursements, waivers or reductions occur.
I Annualized.
J Amount does not include the portfolio activity of any underlying mutual funds or exchange-traded funds (ETFs).
For the period ended June 30, 2023
1. Organization.
VIP Value Portfolio (the Fund) is a fund of Variable Insurance Products Fund (the Trust) and is authorized to issue an unlimited number of shares. The Trust is registered under the Investment Company Act of 1940, as amended (the 1940 Act), as an open-end management investment company organized as a Massachusetts business trust. Shares of the Fund may only be purchased by insurance companies for the purpose of funding variable annuity or variable life insurance contracts. The Fund offers the following classes of shares: Initial Class shares, Service Class shares, Service Class 2 shares and Investor Class shares. All classes have equal rights and voting privileges, except for matters affecting a single class.
2. Investments in Fidelity Central Funds.
Funds may invest in Fidelity Central Funds, which are open-end investment companies generally available only to other investment companies and accounts managed by the investment adviser and its affiliates. The Schedule of Investments lists any Fidelity Central Funds held as an investment as of period end, but does not include the underlying holdings of each Fidelity Central Fund. An investing fund indirectly bears its proportionate share of the expenses of the underlying Fidelity Central Funds.
Based on its investment objective, each Fidelity Central Fund may invest or participate in various investment vehicles or strategies that are similar to those of the investing fund. These strategies are consistent with the investment objectives of the investing fund and may involve certain economic risks which may cause a decline in value of each of the Fidelity Central Funds and thus a decline in the value of the investing fund.
| Fidelity Central Fund | Investment Manager | Investment Objective | Investment Practices | Expense Ratio A |
| Fidelity Money Market Central Funds | Fidelity Management & Research Company LLC (FMR) | Each fund seeks to obtain a high level of current income consistent with the preservation of capital and liquidity. | Short-term Investments | Less than .005% |
A Expenses expressed as a percentage of average net assets and are as of each underlying Central Fund's most recent annual or semi-annual shareholder report.
A complete unaudited list of holdings for each Fidelity Central Fund is available upon request or at the Securities and Exchange Commission website at www.sec.gov. In addition, the financial statements of the Fidelity Central Funds which contain the significant accounting policies (including investment valuation policies) of those funds, and are not covered by the Report of Independent Registered Public Accounting Firm, are available on the Securities and Exchange Commission website or upon request.
3. Significant Accounting Policies.
The Fund is an investment company and applies the accounting and reporting guidance of the Financial Accounting Standards Board (FASB) Accounting Standards Codification Topic 946 Financial Services - Investment Companies . The financial statements have been prepared in conformity with accounting principles generally accepted in the United States of America (GAAP), which require management to make certain estimates and assumptions at the date of the financial statements. Actual results could differ from those estimates. Subsequent events, if any, through the date that the financial statements were issued have been evaluated in the preparation of the financial statements. The Fund's Schedule of Investments lists any underlying mutual funds or exchange-traded funds (ETFs) but does not include the underlying holdings of these funds. The following summarizes the significant accounting policies of the Fund:
Investment Valuation. Investments are valued as of 4:00 p.m. Eastern time on the last calendar day of the period. The Board of Trustees (the Board) has designated the Fund's investment adviser as the valuation designee responsible for the fair valuation function and performing fair value determinations as needed. The investment adviser has established a Fair Value Committee (the Committee) to carry out the day-to-day fair valuation responsibilities and has adopted policies and procedures to govern the fair valuation process and the activities of the Committee. In accordance with these fair valuation policies and procedures, which have been approved by the Board, the Fund attempts to obtain prices from one or more third party pricing services or brokers to value its investments. When current market prices, quotations or currency exchange rates are not readily available or reliable, investments will be fair valued in good faith by the Committee, in accordance with the policies and procedures. Factors used in determining fair value vary by investment type and may include market or investment specific events, transaction data, estimated cash flows, and market observations of comparable investments. The frequency that the fair valuation procedures are used cannot be predicted and they may be utilized to a significant extent. The Committee manages the Fund's fair valuation practices and maintains the fair valuation policies and procedures. The Fund's investment adviser reports to the Board information regarding the fair valuation process and related material matters.
The Fund categorizes the inputs to valuation techniques used to value its investments into a disclosure hierarchy consisting of three levels as shown below:
Level 1 - unadjusted quoted prices in active markets for identical investments
Level 2 - other significant observable inputs (including quoted prices for similar investments, interest rates, prepayment speeds, etc.)
Level 3 - unobservable inputs (including the Fund's own assumptions based on the best information available)
Valuation techniques used to value the Fund's investments by major category are as follows:
Equity securities, including restricted securities, for which market quotations are readily available, are valued at the last reported sale price or official closing price as reported by a third party pricing service on the primary market or exchange on which they are traded and are categorized as Level 1 in the hierarchy. In the event there were no sales during the day or closing prices are not available, securities are valued at the last quoted bid price or may be valued using the last available price and are generally categorized as Level 2 in the hierarchy. For foreign equity securities, when market or security specific events arise, comparisons to the valuation of American Depositary Receipts (ADRs), futures contracts, ETFs and certain indexes as well as quoted prices for similar securities may be used and would be categorized as Level 2 in the hierarchy. For equity securities, including restricted securities, where observable inputs are limited, assumptions about market activity and risk are used and these securities may be categorized as Level 3 in the hierarchy.
Investments in open-end mutual funds, including the Fidelity Central Funds, are valued at their closing net asset value (NAV) each business day and are categorized as Level 1 in the hierarchy.
Changes in valuation techniques may result in transfers in or out of an assigned level within the disclosure hierarchy. The aggregate value of investments by input level as of June 30, 2023 is included at the end of the Fund's Schedule of Investments.
Foreign Currency. Certain Funds may use foreign currency contracts to facilitate transactions in foreign-denominated securities. Gains and losses from these transactions may arise from changes in the value of the foreign currency or if the counterparties do not perform under the contracts' terms.
Foreign-denominated assets, including investment securities, and liabilities are translated into U.S. dollars at the exchange rates at period end. Purchases and sales of investment securities, income and dividends received, and expenses denominated in foreign currencies are translated into U.S. dollars at the exchange rate in effect on the transaction date.
The effects of exchange rate fluctuations on investments are included with the net realized and unrealized gain (loss) on investment securities. Other foreign currency transactions resulting in realized and unrealized gain (loss) are disclosed separately.
Investment Transactions and Income. For financial reporting purposes, the Fund's investment holdings and NAV include trades executed through the end of the last business day of the period. The NAV per share for processing shareholder transactions is calculated as of the close of business of the New York Stock Exchange (NYSE), normally 4:00 p.m. Eastern time and includes trades executed through the end of the prior business day. Gains and losses on securities sold are determined on the basis of identified cost and include proceeds received from litigation. Commissions paid to certain brokers with whom the investment adviser, or its affiliates, places trades on behalf of a fund include an amount in addition to trade execution, which may be rebated back to a fund. Any such rebates are included in net realized gain (loss) on investments in the Statement of Operations. Dividend income is recorded on the ex-dividend date, except for certain dividends from foreign securities where the ex-dividend date may have passed, which are recorded as soon as the Fund is informed of the ex-dividend date. Non-cash dividends included in dividend income, if any, are recorded at the fair market value of the securities received. Income and capital gain distributions from Fidelity Central Funds, if any, are recorded on the ex-dividend date. Certain distributions received by the Fund represent a return of capital or capital gain. The Fund determines the components of these distributions subsequent to the ex-dividend date, based upon receipt of tax filings or other correspondence relating to the underlying investment. These distributions are recorded as a reduction of cost of investments and/or as a realized gain. Investment income is recorded net of foreign taxes withheld where recovery of such taxes is uncertain. Funds may file withholding tax reclaims in certain jurisdictions to recover a portion of amounts previously withheld. Any withholding tax reclaims income is included in the Statement of Operations in dividends. Any receivables for withholding tax reclaims are included in the Statement of Assets and Liabilities in dividends receivable.
Class Allocations and Expenses. Investment income, realized and unrealized capital gains and losses, common expenses of a fund, and certain fund-level expense reductions, if any, are allocated daily on a pro-rata basis to each class based on the relative net assets of each class to the total net assets of a fund. Each class differs with respect to transfer agent and distribution and service plan fees incurred, as applicable. Certain expense reductions may also differ by class, if applicable. For the reporting period, the allocated portion of income and expenses to each class as a percent of its average net assets may vary due to the timing of recording these transactions in relation to fluctuating net assets of the classes. Expenses directly attributable to a fund are charged to that fund. Expenses attributable to more than one fund are allocated among the respective funds on the basis of relative net assets or other appropriate methods. Expenses included in the accompanying financial statements reflect the expenses of that fund and do not include any expenses associated with any underlying mutual funds or exchange-traded funds (ETFs). Although not included in a fund's expenses, a fund indirectly bears its proportionate share of these expenses through the net asset value of each underlying mutual fund or exchange-traded fund (ETF). Expense estimates are accrued in the period to which they relate and adjustments are made when actual amounts are known.
Income Tax Information and Distributions to Shareholders. Each year, the Fund intends to qualify as a regulated investment company under Subchapter M of the Internal Revenue Code, including distributing substantially all of its taxable income and realized gains. As a result, no provision for U.S. Federal income taxes is required. The Fund files a U.S. federal tax return, in addition to state and local tax returns as required. The Fund's federal income tax returns are subject to examination by the Internal Revenue Service (IRS) for a period of three fiscal years after they are filed. State and local tax returns may be subject to examination for an additional fiscal year depending on the jurisdiction. Foreign taxes are provided for based on the Fund's understanding of the tax rules and rates that exist in the foreign markets in which it invests.
Distributions are declared and recorded on the ex-dividend date. Income and capital gain distributions are declared separately for each class. Income and capital gain distributions are determined in accordance with income tax regulations, which may differ from GAAP.
Capital accounts within the financial statements are adjusted for permanent book-tax differences. These adjustments have no impact on net assets or the results of operations. Capital accounts are not adjusted for temporary book-tax differences which will reverse in a subsequent period.
Book-tax differences are primarily due to foreign currency transactions, partnerships, losses deferred due to wash sales and excise tax regulations.
As of period end, the cost and unrealized appreciation (depreciation) in securities, and derivatives if applicable, for federal income tax purposes were as follows:
| Gross unrealized appreciation | $105,145,751 |
| Gross unrealized depreciation | (21,455,628) |
| Net unrealized appreciation (depreciation) | $83,690,123 |
| Tax cost | $403,031,920 |
The Fund elected to defer to its next fiscal year approximately $55,166 of capital losses recognized during the period November 1, 2022 to December 31, 2022.
Restricted Securities (including Private Placements). Funds may invest in securities that are subject to legal or contractual restrictions on resale. These securities generally may be resold in transactions exempt from registration or to the public if the securities are registered. Disposal of these securities may involve time-consuming negotiations and expense, and prompt sale at an acceptable price may be difficult. Information regarding restricted securities held at period end is included at the end of the Schedule of Investments, if applicable.
4. Purchases and Sales of Investments.
Purchases and sales of securities, other than short-term securities and in-kind transactions, as applicable, are noted in the table below.
| | Purchases ($) | Sales ($) |
| VIP Value Portfolio | 170,387,794 | 199,844,838 |
5. Fees and Other Transactions with Affiliates.
Management Fee. Fidelity Management & Research Company LLC (the investment adviser) and its affiliates provide the Fund with investment management related services for which the Fund pays a monthly management fee. The management fee is the sum of an individual fund fee rate that is based on an annual rate of .30% of the Fund's average net assets and an annualized group fee rate that averaged .23% during the period. The group fee rate is based upon the monthly average net assets of a group of registered investment companies with which the investment adviser has management contracts. The group fee rate decreases as assets under management increase and increases as assets under management decrease. For the reporting period, the total annualized management fee rate was .53% of the Fund's average net assets.
Distribution and Service Plan Fees. In accordance with Rule 12b-1 of the 1940 Act, the Fund has adopted separate 12b-1 Plans for each Service Class of shares. Each Service Class pays Fidelity Distributors Company LLC (FDC), an affiliate of the investment adviser, a service fee. For the period, the service fee is based on an annual rate of .10% of Service Class' average net assets and .25% of Service Class 2's average net assets.
For the period, total fees, all of which were re-allowed to insurance companies for the distribution of shares and providing shareholder support services, were as follows:
| Service Class | $124 |
| Service Class 2 | 60,078 |
| | $60,202 |
Transfer Agent Fees. Fidelity Investments Institutional Operations Company LLC (FIIOC), an affiliate of the investment adviser, is the Fund's transfer, dividend disbursing, and shareholder servicing agent. FIIOC receives an asset-based fee with respect to each class. Each class pays a fee for transfer agent services, typesetting and printing and mailing of shareholder reports, excluding mailing of proxy statements. For the period, transfer agent fees for each class were as follows:
| | Amount | % of Class-Level Average Net Assets A |
| Initial Class | $38,591 | .06 |
| Service Class | 78 | .06 |
| Service Class 2 | 15,140 | .06 |
| Investor Class | 220,801 | .14 |
| | $274,610 | |
A Annualized
Accounting Fees. Fidelity Service Company, Inc. (FSC), an affiliate of the investment adviser, maintains the Fund's accounting records. The accounting fee is based on the level of average net assets for each month. For the period, the fees were equivalent to the following annualized rates:
| | % of Average Net Assets |
| VIP Value Portfolio | .04 |
Brokerage Commissions. A portion of portfolio transactions were placed with brokerage firms which are affiliates of the investment adviser. Brokerage commissions are included in net realized gain (loss) and change in net unrealized appreciation (depreciation) in the Statement of Operations. The commissions paid to these affiliated firms were as follows:
| | Amount |
| VIP Value Portfolio | $3,626 |
Interfund Trades. Funds may purchase from or sell securities to other Fidelity Funds under procedures adopted by the Board. The procedures have been designed to ensure these interfund trades are executed in accordance with Rule 17a-7 of the 1940 Act. Any interfund trades are included within the respective purchases and sales amounts shown in the Purchases and Sales of Investments note. Interfund trades during the period are noted in the table below.
| | Purchases ($) | Sales ($) | Realized Gain (Loss) ($) |
| VIP Value Portfolio | 19,312,045 | 13,562,219 | 567,023 |
6. Committed Line of Credit.
Certain Funds participate with other funds managed by the investment adviser or an affiliate in a $4.25 billion credit facility (the "line of credit") to be utilized for temporary or emergency purposes to fund shareholder redemptions or for other short-term liquidity purposes. The participating funds have agreed to pay commitment fees on their pro-rata portion of the line of credit, which are reflected in Miscellaneous expenses on the Statement of Operations, and are listed below. During the period, there were no borrowings on this line of credit.
| | Amount |
| VIP Value Portfolio | $489 |
7. Security Lending.
Funds lend portfolio securities from time to time in order to earn additional income. Lending agents are used, including National Financial Services (NFS), an affiliate of the investment adviser. Pursuant to a securities lending agreement, NFS will receive a fee, which is capped at 9.9% of a fund's daily lending revenue, for its services as lending agent. A fund may lend securities to certain qualified borrowers, including NFS. On the settlement date of the loan, a fund receives collateral (in the form of U.S. Treasury obligations, letters of credit and/or cash) against the loaned securities and maintains collateral in an amount not less than 100% of the market value of the loaned securities during the period of the loan. The market value of the loaned securities is determined at the close of business of a fund and any additional required collateral is delivered to a fund on the next business day. A fund or borrower may terminate the loan at any time, and if the borrower defaults on its obligation to return the securities loaned because of insolvency or other reasons, a fund may apply collateral received from the borrower against the obligation. A fund may experience delays and costs in recovering the securities loaned. Any cash collateral received is invested in the Fidelity Securities Lending Cash Central Fund. Any loaned securities are identified as such in the Schedule of Investments, and the value of loaned securities and cash collateral at period end, as applicable, are presented in the Statement of Assets and Liabilities. Security lending income represents the income earned on investing cash collateral, less rebates paid to borrowers and any lending agent fees associated with the loan, plus any premium payments received for lending certain types of securities. Security lending income is presented in the Statement of Operations as a component of income from Fidelity Central Funds. Affiliated security lending activity, if any, was as follows:
| | Total Security Lending Fees Paid to NFS | Security Lending Income From Securities Loaned to NFS | Value of Securities Loaned to NFS at Period End |
| VIP Value Portfolio | $1,802 | $- | $- |
8. Expense Reductions.
During the period the investment adviser or an affiliate reimbursed and/or waived a portion of fund-level operating expenses in the amount of $11,240.
9. Distributions to Shareholders.
Distributions to shareholders of each class were as follows:
| | Six months ended June 30, 2023 | Year ended December 31, 2022 |
| VIP Value Portfolio | | |
| Distributions to shareholders | | |
| Initial Class | $- | $6,194,114 |
| Service Class | - | 12,231 |
| Service Class 2 | - | 1,749,253 |
| Investor Class | - | 14,498,667 |
Total | $- | $22,454,265 |
10. Share Transactions.
Transactions for each class of shares were as follows and may contain in-kind transactions:
| | Shares | Shares | Dollars | Dollars |
| | Six months ended June 30, 2023 | Year ended December 31, 2022 | Six months ended June 30, 2023 | Year ended December 31, 2022 |
| VIP Value Portfolio | | | | |
| Initial Class | | | | |
| Shares sold | 685,262 | 3,686,707 | $11,798,248 | $65,469,302 |
| Reinvestment of distributions | - | 356,830 | - | 6,194,114 |
| Shares redeemed | (1,247,044) | (5,508,430) | (21,793,752) | (96,408,515) |
| Net increase (decrease) | (561,782) | (1,464,893) | $(9,995,504) | $(24,745,099) |
| Service Class | | | | |
| Shares sold | - | 13,984 | $- | $239,677 |
| Reinvestment of distributions | - | 493 | - | 8,569 |
| Shares redeemed | (47) | (18,566) | (800) | (321,399) |
| Net increase (decrease) | (47) | (4,089) | $(800) | $(73,153) |
| Service Class 2 | | | | |
| Shares sold | 643,477 | 2,159,822 | $10,966,601 | $36,638,710 |
| Reinvestment of distributions | - | 103,474 | - | 1,749,253 |
| Shares redeemed | (451,866) | (1,097,796) | (7,452,993) | (18,269,781) |
| Net increase (decrease) | 191,611 | 1,165,500 | $3,513,608 | $20,118,182 |
| Investor Class | | | | |
| Shares sold | 659,890 | 6,099,854 | $11,592,351 | $108,956,648 |
| Reinvestment of distributions | - | 839,517 | - | 14,498,665 |
| Shares redeemed | (2,802,322) | (3,819,745) | (47,914,704) | (64,822,837) |
| Net increase (decrease) | (2,142,432) | 3,119,626 | $(36,322,353) | $58,632,476 |
11. Other.
A fund's organizational documents provide former and current trustees and officers with a limited indemnification against liabilities arising in connection with the performance of their duties to the fund. In the normal course of business, a fund may also enter into contracts that provide general indemnifications. A fund's maximum exposure under these arrangements is unknown as this would be dependent on future claims that may be made against a fund. The risk of material loss from such claims is considered remote.
At the end of the period, the investment adviser or its affiliates were owners of record of more than 10% of the outstanding shares as follows:
Fund | Affiliated % |
VIP Value Portfolio | 83% |
Mutual funds managed by the investment adviser or its affiliates, in aggregate, were the owners of record of more than 20% of the total outstanding shares.
Fund | % of shares held |
VIP Value Portfolio | 23% |
12. Risk and Uncertainties.
Many factors affect a fund's performance. Developments that disrupt global economies and financial markets, such as pandemics, epidemics, outbreaks of infectious diseases, war, terrorism, and environmental disasters, may significantly affect a fund's investment performance. The effects of these developments to a fund will be impacted by the types of securities in which a fund invests, the financial condition, industry, economic sector, and geographic location of an issuer, and a fund's level of investment in the securities of that issuer. Significant concentrations in security types, issuers, industries, sectors, and geographic locations may magnify the factors that affect a fund's performance.
As a shareholder, you incur two types of costs: (1) transaction costs, which may include sales charges (loads) on purchase payments or redemption proceeds, as applicable and (2) ongoing costs, which generally include management fees, distribution and/or service (12b-1) fees and other Fund expenses. This Example is intended to help you understand your ongoing costs (in dollars) of investing in a fund and to compare these costs with the ongoing costs of investing in other mutual funds.
| The Example is based on an investment of $1,000 invested at the beginning of the period and held for the entire period (January 1, 2023 to June 30, 2023). |
Actual Expenses
The first line of the accompanying table provides information about actual account values and actual expenses. You may use the information in this line, together with the amount you invested, to estimate the expenses that you paid over the period. Simply divide your account value by $1,000.00 (for example, an $8,600 account value divided by $1,000.00 = 8.6), then multiply the result by the number in the first line for a class/Fund under the heading entitled "Expenses Paid During Period" to estimate the expenses you paid on your account during this period. If any fund is a shareholder of any underlying mutual funds or exchange-traded funds (ETFs) (the Underlying Funds), such fund indirectly bears its proportional share of the expenses of the Underlying Funds in addition to the direct expenses incurred presented in the table. These fees and expenses are not included in the annualized expense ratio used to calculate the expense estimate in the table below. The estimate of expenses does not include any fees or other expenses of any variable annuity or variable life insurance product. If they were, the estimate of expenses you paid during the period would be higher, and your ending account value would be lower.
Hypothetical Example for Comparison Purposes
The second line of the accompanying table provides information about hypothetical account values and hypothetical expenses based on the actual expense ratio and an assumed rate of return of 5% per year before expenses, which is not the actual return. The hypothetical account values and expenses may not be used to estimate the actual ending account balance or expenses you paid for the period. You may use this information to compare the ongoing costs of investing in the Fund and other funds. To do so, compare this 5% hypothetical example with the 5% hypothetical examples that appear in the shareholder reports of the other funds. If any fund is a shareholder of any Underlying Funds, such fund indirectly bears its proportional share of the expenses of the Underlying Funds in addition to the direct expenses as presented in the table. These fees and expenses are not included in the annualized expense ratio used to calculate the expense estimate in the table below. The estimate of expenses does not include any fees or other expenses of any variable annuity or variable life insurance product. If they were, the estimate of expenses you paid during the period would be higher, and your ending account value would be lower.
Please note that the expenses shown in the table are meant to highlight your ongoing costs only and do not reflect any transaction costs. Therefore, the second line of the table is useful in comparing ongoing costs only, and will not help you determine the relative total costs of owning different funds. In addition, if these transactional costs were included, your costs would have been higher.
| | | | | Annualized Expense Ratio- A | | Beginning Account Value January 1, 2023 | | Ending Account Value June 30, 2023 | | Expenses Paid During Period- C January 1, 2023 to June 30, 2023 |
| VIP Value Portfolio | | | | | | | | | | |
| Initial Class | | | | .64% | | | | | | |
| Actual | | | | | | $ 1,000 | | $ 1,074.10 | | $ 3.29 |
Hypothetical- B | | | | | | $ 1,000 | | $ 1,021.62 | | $ 3.21 |
| Service Class | | | | .74% | | | | | | |
| Actual | | | | | | $ 1,000 | | $ 1,073.50 | | $ 3.80 |
Hypothetical- B | | | | | | $ 1,000 | | $ 1,021.12 | | $ 3.71 |
| Service Class 2 | | | | .89% | | | | | | |
| Actual | | | | | | $ 1,000 | | $ 1,072.60 | | $ 4.57 |
Hypothetical- B | | | | | | $ 1,000 | | $ 1,020.38 | | $ 4.46 |
| Investor Class | | | | .72% | | | | | | |
| Actual | | | | | | $ 1,000 | | $ 1,073.70 | | $ 3.70 |
Hypothetical- B | | | | | | $ 1,000 | | $ 1,021.22 | | $ 3.61 |
| |
A Annualized expense ratio reflects expenses net of applicable fee waivers.
B 5% return per year before expenses
C Expenses are equal to the annualized expense ratio, multiplied by the average account value over the period, multiplied by 181/ 365 (to reflect the one-half year period). The fees and expenses of any Underlying Funds are not included in each annualized expense ratio.
Board Approval of Investment Advisory Contracts
VIP Value Portfolio
At its May 2023 meeting, the Board of Trustees, including the Independent Trustees (together, the Board), voted to continue the management contract with Fidelity Management & Research Company LLC (FMR), and the sub-advisory agreements and sub-subadvisory agreements, in each case, where applicable (together, the Advisory Contracts) for the fund for two months from June 1, 2023 through July 31, 2023. The Board determined that it will consider the annual renewal of the fund's Advisory Contracts for a full one year period in July 2023, following its review of additional materials provided by FMR.
The Board considered that the approval of the fund's Advisory Contracts will not result in any changes in (i) the investment process or strategies employed in the management of the fund's assets; (ii) the fees and expenses paid by shareholders; (iii) the nature, extent or quality of services provided under the fund's Advisory Contracts; or (iv) the day-to-day management of the fund or the persons primarily responsible for such management. The Board also considered that since its last approval of the fund's Advisory Contracts, FMR had provided additional information on the fund in support of the annual contract renewal process, including competitive analyses on total expenses and management fees and in-depth reviews of fund performance and fund profitability information. The Board concluded that the fund's Advisory Contracts are fair and reasonable, and that the fund's Advisory Contracts should be renewed, without modification, through July 31, 2023, with the understanding that the Board will consider the annual renewal for a full one year period in July 2023.
In connection with its consideration of future renewals of the fund's Advisory Contracts, the Board will consider: (i) the nature, extent and quality of services provided to the fund, including shareholder and administrative services and investment performance; (ii) the competitiveness of the management fee and total expenses for the fund; (iii) the costs of the services and profitability, including the revenues earned and the expenses incurred in conducting the business of developing, marketing, distributing, managing, administering, and servicing the fund and its shareholders, to the extent applicable; and (iv) whether there have been economies of scale in respect of the Fidelity funds, whether the Fidelity funds (including the fund) have appropriately benefited from any such economies of scale, and whether there is the potential for realization of any further economies.
Based on its evaluation of all of the conclusions noted above, and after considering all factors it believed relevant, the Board ultimately concluded that the fund's management fee structure is fair and reasonable, and that the continuation of the fund's Advisory Contracts should be approved for two months from June 1, 2023 through July 31, 2023.
The Securities and Exchange Commission adopted Rule 22e-4 under the Investment Company Act of 1940 (the Liquidity Rule) to promote effective liquidity risk management throughout the open-end investment company industry, thereby reducing the risk that funds will be unable to meet their redemption obligations and mitigating dilution of the interests of fund shareholders.
The Fund has adopted and implemented a liquidity risk management program (the Program) reasonably designed to assess and manage the Fund's liquidity risk and to comply with the requirements of the Liquidity Rule. The Fund's Board of Trustees (the Board) has designated the Fund's investment adviser as administrator of the Program. The Fidelity advisers have established a Liquidity Risk Management Committee (the LRM Committee) to manage the Program for each of the Fidelity Funds. The LRM Committee monitors the adequacy and effectiveness of implementation of the Program and on a periodic basis assesses each Fund's liquidity risk based on a variety of factors including (1) the Fund's investment strategy, (2) portfolio liquidity and cash flow projections during normal and reasonably foreseeable stressed conditions, (3) shareholder redemptions, (4) borrowings and other funding sources and (5) certain factors specific to ETFs including the effect of the Fund's prices and spreads, market participants, and basket compositions on the overall liquidity of the Fund's portfolio, as applicable.
In accordance with the Program, each of the Fund's portfolio investments is classified into one of four defined liquidity categories based on a determination of a reasonable expectation for how long it would take to convert the investment to cash (or sell or dispose of the investment) without significantly changing its market value.
- Highly liquid investments - cash or convertible to cash within three business days or less
- Moderately liquid investments - convertible to cash in three to seven calendar days
- Less liquid investments - can be sold or disposed of, but not settled, within seven calendar days
- Illiquid investments - cannot be sold or disposed of within seven calendar days
Liquidity classification determinations take into account a variety of factors including various market, trading and investment-specific considerations, as well as market depth, and generally utilize analysis from a third-party liquidity metrics service.
The Liquidity Rule places a 15% limit on a fund's illiquid investments and requires funds that do not primarily hold assets that are highly liquid investments to determine and maintain a minimum percentage of the fund's net assets to be invested in highly liquid investments (highly liquid investment minimum or HLIM). The Program includes provisions reasonably designed to comply with the 15% limit on illiquid investments and for determining, periodically reviewing and complying with the HLIM requirement as applicable.
At a recent meeting of the Fund's Board of Trustees, the LRM Committee provided a written report to the Board pertaining to the operation, adequacy, and effectiveness of the Program for the period December 1, 2021 through November 30, 2022. The report concluded that the Program is operating effectively and is reasonably designed to assess and manage the Fund's liquidity risk.
1.761034.122
VIPVAL-SANN-0823
Fidelity® Variable Insurance Products:
VIP Growth Portfolio
Semi-Annual Report
June 30, 2023
Contents
To view a fund's proxy voting guidelines and proxy voting record for the 12-month period ended June 30, visit http://www.fidelity.com/proxyvotingresults or visit the Securities and Exchange Commission's (SEC) web site at http://www.sec.gov.
You may also call 1-877-208-0098 to request a free copy of the proxy voting guidelines.
Fidelity® Variable Insurance Products are separate account options which are purchased through a variable insurance contract.
Standard & Poor's, S&P and S&P 500 are registered service marks of The McGraw-Hill Companies, Inc. and have been licensed for use by Fidelity Distributors Corporation.
Other third-party marks appearing herein are the property of their respective owners.
All other marks appearing herein are registered or unregistered trademarks or service marks of FMR LLC or an affiliated company. © 2023 FMR LLC. All rights reserved.
This report and the financial statements contained herein are submitted for the general information of the shareholders of the Fund. This report is not authorized for distribution to prospective investors in the Fund unless preceded or accompanied by an effective prospectus.
A fund files its complete schedule of portfolio holdings with the SEC for the first and third quarters of each fiscal year on Form N-PORT. Forms N-PORT are available on the SEC's web site at http://www.sec.gov. A fund's Forms N-PORT may be reviewed and copied at the SEC's Public Reference Room in Washington, DC. Information regarding the operation of the SEC's Public Reference Room may be obtained by calling 1-800-SEC-0330.
For a complete list of a fund's portfolio holdings, view the most recent holdings listing, semiannual report, or annual report on Fidelity's web site at http://www.fidelity.com, http://www.institutional.fidelity.com, or http://www.401k.com, as applicable.
NOT FDIC INSURED •MAY LOSE VALUE •NO BANK GUARANTEE
Neither the Fund nor Fidelity Distributors Corporation is a bank.
This report and the financial statements contained herein are submitted for the general information of the shareholders of the Fund. This report is not authorized for distribution to prospective investors in the Fund unless preceded or accompanied by an effective prospectus.
A fund files its complete schedule of portfolio holdings with the SEC for the first and third quarters of each fiscal year on Form N-PORT. Forms N-PORT are available on the SEC's web site at http://www.sec.gov. A fund's Forms N-PORT may be reviewed and copied at the SEC's Public Reference Room in Washington, DC. Information regarding the operation of the SEC's Public Reference Room may be obtained by calling 1-800-SEC-0330.
For a complete list of a fund's portfolio holdings, view the most recent holdings listing, semiannual report, or annual report on Fidelity's web site at http://www.fidelity.com, http://www.institutional.fidelity.com, or http://www.401k.com, as applicable.
NOT FDIC INSURED •MAY LOSE VALUE •NO BANK GUARANTEE
Neither the Fund nor Fidelity Distributors Corporation is a bank.
Top Holdings (% of Fund's net assets) |
| |
| Microsoft Corp. | 12.2 | |
| NVIDIA Corp. | 7.2 | |
| Alphabet, Inc. Class A | 5.1 | |
| Apple, Inc. | 4.4 | |
| Uber Technologies, Inc. | 3.4 | |
| Amazon.com, Inc. | 3.3 | |
| Vertex Pharmaceuticals, Inc. | 2.3 | |
| UnitedHealth Group, Inc. | 2.3 | |
| Eli Lilly & Co. | 2.0 | |
| Netflix, Inc. | 1.9 | |
| | 44.1 | |
| |
| Market Sectors (% of Fund's net assets) |
| |
| Information Technology | 37.6 | |
| Health Care | 16.4 | |
| Industrials | 12.3 | |
| Consumer Discretionary | 10.5 | |
| Communication Services | 9.7 | |
| Financials | 5.9 | |
| Energy | 4.0 | |
| Consumer Staples | 1.5 | |
| Materials | 0.3 | |
| Utilities | 0.0 | |
| |
Asset Allocation (% of Fund's net assets) |
|
|
Geographic Diversification (% of Fund's net assets) |
|
* Includes Short-Term investments and Net Other Assets (Liabilities). Percentages are adjusted for the effect of derivatives, if applicable. |
| |
Showing Percentage of Net Assets
| Common Stocks - 97.9% |
| | | Shares | Value ($) |
| COMMUNICATION SERVICES - 9.7% | | | |
| Entertainment - 4.6% | | | |
| Netflix, Inc. (a) | | 345,600 | 152,233,344 |
| Universal Music Group NV (b) | | 6,371,121 | 141,476,603 |
| Warner Music Group Corp. Class A | | 3,044,075 | 79,419,917 |
| | | | 373,129,864 |
| Interactive Media & Services - 5.1% | | | |
| Alphabet, Inc. Class A (a) | | 3,437,063 | 411,416,441 |
| Epic Games, Inc. (a)(c)(d) | | 5,869 | 4,131,541 |
| | | | 415,547,982 |
| Media - 0.0% | | | |
| Innovid Corp. (a) | | 432,557 | 471,487 |
TOTAL COMMUNICATION SERVICES | | | 789,149,333 |
| CONSUMER DISCRETIONARY - 10.5% | | | |
| Automobile Components - 0.0% | | | |
| Mobileye Global, Inc. | | 44,426 | 1,706,847 |
| Automobiles - 0.9% | | | |
| BYD Co. Ltd. (H Shares) | | 1,072,000 | 34,373,315 |
| Ferrari NV | | 113,989 | 37,070,363 |
| | | | 71,443,678 |
| Broadline Retail - 4.2% | | | |
| Amazon.com, Inc. (a) | | 2,085,618 | 271,881,162 |
| Dollarama, Inc. | | 69,800 | 4,727,274 |
| MercadoLibre, Inc. (a) | | 58,900 | 69,772,940 |
| | | | 346,381,376 |
| Diversified Consumer Services - 0.1% | | | |
| Laureate Education, Inc. Class A | | 741,184 | 8,960,915 |
| Hotels, Restaurants & Leisure - 2.3% | | | |
| Airbnb, Inc. Class A (a) | | 455,500 | 58,376,880 |
| Booking Holdings, Inc. (a) | | 15,500 | 41,855,115 |
| Flutter Entertainment PLC (a) | | 376,600 | 75,568,556 |
| Kura Sushi U.S.A., Inc. Class A (a) | | 134,700 | 12,520,365 |
| | | | 188,320,916 |
| Household Durables - 0.0% | | | |
| Blu Investments LLC (a)(c)(d) | | 14,533,890 | 4,506 |
| Specialty Retail - 1.8% | | | |
| Five Below, Inc. (a) | | 305,500 | 60,042,970 |
| TJX Companies, Inc. | | 987,900 | 83,764,041 |
| | | | 143,807,011 |
| Textiles, Apparel & Luxury Goods - 1.2% | | | |
| Compagnie Financiere Richemont SA Series A | | 13,580 | 2,306,808 |
| LVMH Moet Hennessy Louis Vuitton SE | | 57,358 | 54,083,564 |
| On Holding AG (a) | | 20,300 | 669,900 |
| Samsonite International SA (a)(e) | | 13,712,700 | 38,674,154 |
| | | | 95,734,426 |
TOTAL CONSUMER DISCRETIONARY | | | 856,359,675 |
| CONSUMER STAPLES - 1.5% | | | |
| Beverages - 1.2% | | | |
| Boston Beer Co., Inc. Class A (a) | | 73,900 | 22,793,716 |
| Monster Beverage Corp. | | 1,311,294 | 75,320,727 |
| | | | 98,114,443 |
| Personal Care Products - 0.3% | | | |
| Estee Lauder Companies, Inc. Class A | | 121,700 | 23,899,446 |
TOTAL CONSUMER STAPLES | | | 122,013,889 |
| ENERGY - 4.0% | | | |
| Energy Equipment & Services - 0.4% | | | |
| Baker Hughes Co. Class A | | 1,209,800 | 38,241,778 |
| Oil, Gas & Consumable Fuels - 3.6% | | | |
| Cheniere Energy, Inc. | | 752,326 | 114,624,389 |
| Denbury, Inc. (a) | | 158,900 | 13,706,714 |
| New Fortress Energy, Inc. | | 547,900 | 14,672,762 |
| Range Resources Corp. | | 1,409,200 | 41,430,480 |
| Reliance Industries Ltd. | | 3,437,252 | 107,118,401 |
| | | | 291,552,746 |
TOTAL ENERGY | | | 329,794,524 |
| FINANCIALS - 5.9% | | | |
| Banks - 0.0% | | | |
| HDFC Bank Ltd. | | 196,906 | 4,085,420 |
| Capital Markets - 1.8% | | | |
| CME Group, Inc. | | 787,522 | 145,919,951 |
| Financial Services - 2.6% | | | |
| Block, Inc. Class A (a) | | 690,600 | 45,973,242 |
| MasterCard, Inc. Class A | | 371,232 | 146,005,546 |
| One97 Communications Ltd. (a) | | 688,100 | 7,293,356 |
| Rocket Companies, Inc. (a)(b) | | 1,102,154 | 9,875,300 |
| | | | 209,147,444 |
| Insurance - 1.5% | | | |
| Arthur J. Gallagher & Co. | | 315,755 | 69,330,325 |
| BRP Group, Inc. (a) | | 584,268 | 14,478,161 |
| Marsh & McLennan Companies, Inc. | | 194,400 | 36,562,752 |
| | | | 120,371,238 |
TOTAL FINANCIALS | | | 479,524,053 |
| HEALTH CARE - 16.4% | | | |
| Biotechnology - 6.4% | | | |
| 2seventy bio, Inc. (a) | | 87,100 | 881,452 |
| Adamas Pharmaceuticals, Inc.: | | | |
| rights (a)(d) | | 1,781,700 | 445,425 |
| rights (a)(d) | | 1,781,700 | 195,987 |
| Affimed NV (a) | | 594,887 | 355,861 |
| Alnylam Pharmaceuticals, Inc. (a) | | 228,000 | 43,306,320 |
| Arcellx, Inc. (a) | | 46,857 | 1,481,618 |
| Beam Therapeutics, Inc. (a) | | 60,870 | 1,943,579 |
| Biogen, Inc. (a) | | 153,600 | 43,752,960 |
| Cytokinetics, Inc. (a) | | 176,031 | 5,742,131 |
| Evelo Biosciences, Inc. (a)(b) | | 23,345 | 75,871 |
| Galapagos NV sponsored ADR (a) | | 453,500 | 18,439,310 |
| Gamida Cell Ltd. (a)(b) | | 2,824,068 | 5,450,451 |
| Gamida Cell Ltd. warrants 4/21/28 (a) | | 441,000 | 488,673 |
| Genmab A/S (a) | | 33,400 | 12,657,187 |
| Hookipa Pharma, Inc. (a) | | 1,014,485 | 892,747 |
| Immunocore Holdings PLC ADR (a) | | 157,653 | 9,452,874 |
| Insmed, Inc. (a)(b) | | 743,216 | 15,681,858 |
| Legend Biotech Corp. ADR (a) | | 209,500 | 14,461,785 |
| Regeneron Pharmaceuticals, Inc. (a) | | 88,231 | 63,397,503 |
| Repligen Corp. (a) | | 137,900 | 19,507,334 |
| Rubius Therapeutics, Inc. (a)(b) | | 134,856 | 2,825 |
| Seagen, Inc. (a) | | 349,600 | 67,284,016 |
| Seres Therapeutics, Inc. (a) | | 405,600 | 1,942,824 |
| Synlogic, Inc. (a) | | 1,152,500 | 495,575 |
| Vertex Pharmaceuticals, Inc. (a) | | 535,765 | 188,541,061 |
| Vor Biopharma, Inc. (a) | | 618,395 | 1,910,841 |
| XOMA Corp. (a) | | 339,812 | 6,419,049 |
| | | | 525,207,117 |
| Health Care Equipment & Supplies - 1.6% | | | |
| Boston Scientific Corp. (a) | | 1,965,300 | 106,303,077 |
| Insulet Corp. (a) | | 4,869 | 1,403,927 |
| Penumbra, Inc. (a) | | 57,727 | 19,861,552 |
| | | | 127,568,556 |
| Health Care Providers & Services - 3.2% | | | |
| HealthEquity, Inc. (a) | | 1,152,896 | 72,793,853 |
| Option Care Health, Inc. (a) | | 58,800 | 1,910,412 |
| UnitedHealth Group, Inc. | | 389,393 | 187,157,852 |
| | | | 261,862,117 |
| Health Care Technology - 0.2% | | | |
| Evolent Health, Inc. (c) | | 387,300 | 11,148,431 |
| Simulations Plus, Inc. (b) | | 111,870 | 4,847,327 |
| | | | 15,995,758 |
| Life Sciences Tools & Services - 2.2% | | | |
| Bio-Techne Corp. | | 224,400 | 18,317,772 |
| Bruker Corp. | | 524,520 | 38,772,518 |
| Charles River Laboratories International, Inc. (a) | | 126,965 | 26,694,391 |
| Codexis, Inc. (a) | | 525,700 | 1,471,960 |
| Danaher Corp. | | 162,450 | 38,988,000 |
| Sartorius Stedim Biotech | | 81,300 | 20,289,020 |
| Thermo Fisher Scientific, Inc. | | 70,100 | 36,574,675 |
| | | | 181,108,336 |
| Pharmaceuticals - 2.8% | | | |
| Aclaris Therapeutics, Inc. (a) | | 220,007 | 2,281,473 |
| AstraZeneca PLC sponsored ADR | | 642,000 | 45,947,940 |
| Eli Lilly & Co. | | 346,646 | 162,570,041 |
| Nuvation Bio, Inc. (a) | | 326,843 | 588,317 |
| Revance Therapeutics, Inc. (a)(b) | | 608,681 | 15,405,716 |
| | | | 226,793,487 |
TOTAL HEALTH CARE | | | 1,338,535,371 |
| INDUSTRIALS - 12.3% | | | |
| Aerospace & Defense - 0.4% | | | |
| Spirit AeroSystems Holdings, Inc. Class A | | 1,173,000 | 34,239,870 |
| The Boeing Co. (a) | | 2,537 | 535,713 |
| | | | 34,775,583 |
| Electrical Equipment - 1.4% | | | |
| Bloom Energy Corp. Class A (a)(b) | | 119,000 | 1,945,650 |
| Eaton Corp. PLC | | 461,206 | 92,748,527 |
| Hubbell, Inc. Class B | | 63,599 | 21,086,884 |
| | | | 115,781,061 |
| Ground Transportation - 3.4% | | | |
| Uber Technologies, Inc. (a) | | 6,492,005 | 280,259,856 |
| Industrial Conglomerates - 1.5% | | | |
| General Electric Co. | | 1,083,500 | 119,022,475 |
| Machinery - 2.0% | | | |
| Energy Recovery, Inc. (a) | | 250,900 | 7,012,655 |
| Ingersoll Rand, Inc. | | 1,232,275 | 80,541,494 |
| Parker Hannifin Corp. | | 132,500 | 51,680,300 |
| Westinghouse Air Brake Tech Co. | | 199,300 | 21,857,231 |
| | | | 161,091,680 |
| Passenger Airlines - 0.5% | | | |
| Ryanair Holdings PLC sponsored ADR (a) | | 388,700 | 42,990,220 |
| Professional Services - 2.2% | | | |
| Equifax, Inc. | | 197,800 | 46,542,340 |
| KBR, Inc. | | 1,464,955 | 95,309,972 |
| TransUnion Holding Co., Inc. | | 435,900 | 34,144,047 |
| | | | 175,996,359 |
| Trading Companies & Distributors - 0.9% | | | |
| Ferguson PLC | | 441,849 | 69,638,496 |
TOTAL INDUSTRIALS | | | 999,555,730 |
| INFORMATION TECHNOLOGY - 37.5% | | | |
| Electronic Equipment, Instruments & Components - 1.2% | | | |
| Flex Ltd. (a) | | 2,096,183 | 57,938,498 |
| Jabil, Inc. | | 401,900 | 43,377,067 |
| | | | 101,315,565 |
| IT Services - 1.9% | | | |
| Gartner, Inc. (a) | | 71,800 | 25,152,258 |
| MongoDB, Inc. Class A (a) | | 235,418 | 96,754,444 |
| Shopify, Inc. Class A (a) | | 514,800 | 33,256,080 |
| | | | 155,162,782 |
| Semiconductors & Semiconductor Equipment - 13.3% | | | |
| Aixtron AG | | 789,100 | 26,770,539 |
| Allegro MicroSystems LLC (a) | | 298,641 | 13,480,655 |
| ASML Holding NV (depository receipt) | | 60,238 | 43,657,491 |
| BE Semiconductor Industries NV | | 387,700 | 42,009,683 |
| eMemory Technology, Inc. | | 45,000 | 3,192,411 |
| KLA Corp. | | 100,500 | 48,744,510 |
| Marvell Technology, Inc. | | 320,176 | 19,140,121 |
| Monolithic Power Systems, Inc. | | 48,500 | 26,201,155 |
| NVIDIA Corp. | | 1,384,086 | 585,496,060 |
| NXP Semiconductors NV | | 308,124 | 63,066,820 |
| Silicon Laboratories, Inc. (a) | | 12,500 | 1,971,750 |
| SiTime Corp. (a) | | 317,200 | 37,420,084 |
| Taiwan Semiconductor Manufacturing Co. Ltd. sponsored ADR | | 1,314,300 | 132,639,156 |
| Universal Display Corp. | | 284,600 | 41,019,398 |
| | | | 1,084,809,833 |
| Software - 16.7% | | | |
| Confluent, Inc. (a)(b) | | 1,345,214 | 47,499,506 |
| HashiCorp, Inc. (a) | | 580,404 | 15,194,977 |
| HubSpot, Inc. (a) | | 115,300 | 61,349,977 |
| Manhattan Associates, Inc. (a) | | 271,700 | 54,307,396 |
| Microsoft Corp. | | 2,916,007 | 993,017,026 |
| NICE Ltd. sponsored ADR (a) | | 116,700 | 24,098,550 |
| Oracle Corp. | | 1,106,091 | 131,724,377 |
| ServiceNow, Inc. (a) | | 48,300 | 27,143,151 |
| Volue A/S (a) | | 1,565,800 | 2,634,563 |
| | | | 1,356,969,523 |
| Technology Hardware, Storage & Peripherals - 4.4% | | | |
| Apple, Inc. | | 1,831,988 | 355,350,712 |
TOTAL INFORMATION TECHNOLOGY | | | 3,053,608,415 |
| MATERIALS - 0.1% | | | |
| Chemicals - 0.1% | | | |
| Aspen Aerogels, Inc. (a)(b) | | 564,802 | 4,456,288 |
| UTILITIES - 0.0% | | | |
| Independent Power and Renewable Electricity Producers - 0.0% | | | |
| Brookfield Renewable Partners LP | | 99,009 | 2,919,775 |
| TOTAL COMMON STOCKS (Cost $4,883,924,536) | | | 7,975,917,053 |
| | | | |
| Convertible Preferred Stocks - 0.3% |
| | | Shares | Value ($) |
| HEALTH CARE - 0.0% | | | |
| Biotechnology - 0.0% | | | |
| ElevateBio LLC Series C (a)(c)(d) | | 198,400 | 841,216 |
| INFORMATION TECHNOLOGY - 0.1% | | | |
| Software - 0.1% | | | |
| ASAPP, Inc. Series C (a)(c)(d) | | 654,971 | 2,010,761 |
| MATERIALS - 0.2% | | | |
| Metals & Mining - 0.2% | | | |
| Illuminated Holdings, Inc.: | | | |
| Series C2 (a)(c)(d) | | 137,249 | 5,024,686 |
| Series C3 (a)(c)(d) | | 171,560 | 6,280,812 |
| Series C4 (a)(c)(d) | | 48,240 | 1,766,066 |
| Series C5 (a)(c)(d) | | 96,064 | 3,516,903 |
| | | | 16,588,467 |
| TOTAL CONVERTIBLE PREFERRED STOCKS (Cost $19,617,827) | | | 19,440,444 |
| | | | |
| Convertible Bonds - 0.0% |
| | | Principal Amount (f) | Value ($) |
| MATERIALS - 0.0% | | | |
| Metals & Mining - 0.0% | | | |
Illuminated Holdings, Inc. 0% (c)(d)(g) (Cost $1,940,200) | | 1,940,200 | 1,940,200 |
| | | | |
| Money Market Funds - 1.7% |
| | | Shares | Value ($) |
| Fidelity Cash Central Fund 5.14% (h) | | 100,203,485 | 100,223,526 |
| Fidelity Securities Lending Cash Central Fund 5.14% (h)(i) | | 40,104,528 | 40,108,538 |
| TOTAL MONEY MARKET FUNDS (Cost $140,332,064) | | | 140,332,064 |
| | | | |
| TOTAL INVESTMENT IN SECURITIES - 99.9% (Cost $5,045,814,627) | 8,137,629,761 |
NET OTHER ASSETS (LIABILITIES) - 0.1% | 7,800,715 |
| NET ASSETS - 100.0% | 8,145,430,476 |
| | |
Legend
| (b) | Security or a portion of the security is on loan at period end. |
| (c) | Restricted securities (including private placements) - Investment in securities not registered under the Securities Act of 1933 (excluding 144A issues). At the end of the period, the value of restricted securities (excluding 144A issues) amounted to $36,665,122 or 0.5% of net assets. |
| (e) | Security exempt from registration under Rule 144A of the Securities Act of 1933. These securities may be resold in transactions exempt from registration, normally to qualified institutional buyers. At the end of the period, the value of these securities amounted to $38,674,154 or 0.5% of net assets. |
| (f) | Amount is stated in United States dollars unless otherwise noted. |
| (g) | Security is perpetual in nature with no stated maturity date. |
| (h) | Affiliated fund that is generally available only to investment companies and other accounts managed by Fidelity Investments. The rate quoted is the annualized seven-day yield of the fund at period end. A complete unaudited listing of the fund's holdings as of its most recent quarter end is available upon request. In addition, each Fidelity Central Fund's financial statements are available on the SEC's website or upon request. |
| (i) | Investment made with cash collateral received from securities on loan. |
| Additional information on each restricted holding is as follows: |
| Security | Acquisition Date | Acquisition Cost ($) |
| ASAPP, Inc. Series C | 4/30/21 | 4,320,909 |
| | | |
| Blu Investments LLC | 5/21/20 | 25,138 |
| | | |
| ElevateBio LLC Series C | 3/09/21 | 832,288 |
| | | |
| Epic Games, Inc. | 3/29/21 | 5,194,065 |
| | | |
| Evolent Health, Inc. | 3/28/23 | 11,231,700 |
| | | |
| Illuminated Holdings, Inc. Series C2 | 7/07/20 | 3,431,225 |
| | | |
| Illuminated Holdings, Inc. Series C3 | 7/07/20 | 5,146,800 |
| | | |
| Illuminated Holdings, Inc. Series C4 | 1/08/21 | 1,736,640 |
| | | |
| Illuminated Holdings, Inc. Series C5 | 6/16/21 | 4,149,965 |
| | | |
| Illuminated Holdings, Inc. 0% | 6/14/23 | 1,940,200 |
| | | |
Affiliated Central Funds
Fiscal year to date information regarding the Fund's investments in Fidelity Central Funds, including the ownership percentage, is presented below.
| Affiliate | Value, beginning of period ($) | Purchases ($) | Sales Proceeds ($) | Dividend Income ($) | Realized Gain (loss) ($) | Change in Unrealized appreciation (depreciation) ($) | Value, end of period ($) | % ownership, end of period |
| Fidelity Cash Central Fund 5.14% | 78,582,650 | 863,472,286 | 841,831,410 | 1,554,720 | - | - | 100,223,526 | 0.3% |
| Fidelity Securities Lending Cash Central Fund 5.14% | 39,142,221 | 248,801,636 | 247,835,319 | 625,409 | - | - | 40,108,538 | 0.1% |
| Total | 117,724,871 | 1,112,273,922 | 1,089,666,729 | 2,180,129 | - | - | 140,332,064 | |
| | | | | | | | | |
Amounts in the dividend income column in the above table include any capital gain distributions from underlying funds, which are presented in the corresponding line item in the Statement of Operations, if applicable.
Amounts in the dividend income column for Fidelity Securities Lending Cash Central Fund represents the income earned on investing cash collateral, less rebates paid to borrowers and any lending agent fees associated with the loan, plus any premium payments received for lending certain types of securities.
Amounts included in the purchases and sales proceeds columns may include in-kind transactions, if applicable.
Investment Valuation
The following is a summary of the inputs used, as of June 30, 2023, involving the Fund's assets and liabilities carried at fair value. The inputs or methodology used for valuing securities may not be an indication of the risk associated with investing in those securities. For more information on valuation inputs, and their aggregation into the levels used below, please refer to the Investment Valuation section in the accompanying Notes to Financial Statements.
| Valuation Inputs at Reporting Date: |
| Description | Total ($) | Level 1 ($) | Level 2 ($) | Level 3 ($) |
Investments in Securities: | | | | |
|
| Equities: | | | | |
Communication Services | 789,149,333 | 785,017,792 | - | 4,131,541 |
Consumer Discretionary | 856,359,675 | 765,591,482 | 90,763,687 | 4,506 |
Consumer Staples | 122,013,889 | 122,013,889 | - | - |
Energy | 329,794,524 | 222,676,123 | 107,118,401 | - |
Financials | 479,524,053 | 468,145,277 | 11,378,776 | - |
Health Care | 1,339,376,587 | 1,313,599,668 | 24,294,291 | 1,482,628 |
Industrials | 999,555,730 | 999,555,730 | - | - |
Information Technology | 3,055,619,176 | 3,053,608,415 | - | 2,010,761 |
Materials | 21,044,755 | 4,456,288 | - | 16,588,467 |
Utilities | 2,919,775 | 2,919,775 | - | - |
|
| Corporate Bonds | 1,940,200 | - | - | 1,940,200 |
|
| Money Market Funds | 140,332,064 | 140,332,064 | - | - |
| Total Investments in Securities: | 8,137,629,761 | 7,877,916,503 | 233,555,155 | 26,158,103 |
| Statement of Assets and Liabilities |
| | | | June 30, 2023 (Unaudited) |
| | | | | |
| Assets | | | | |
| Investment in securities, at value (including securities loaned of $39,400,232) - See accompanying schedule: | | | | |
Unaffiliated issuers (cost $4,905,482,563) | $ | 7,997,297,697 | | |
Fidelity Central Funds (cost $140,332,064) | | 140,332,064 | | |
| | | | | |
| | | | | |
| Total Investment in Securities (cost $5,045,814,627) | | | $ | 8,137,629,761 |
| Foreign currency held at value (cost $1,108) | | | | 1,108 |
| Receivable for investments sold | | | | 65,053,372 |
| Receivable for fund shares sold | | | | 6,144,526 |
| Dividends receivable | | | | 1,698,077 |
| Distributions receivable from Fidelity Central Funds | | | | 436,000 |
| Other receivables | | | | 30,448 |
Total assets | | | | 8,210,993,292 |
| Liabilities | | | | |
| Payable to custodian bank | $ | 85,641 | | |
| Payable for investments purchased | | 3,238,077 | | |
| Payable for fund shares redeemed | | 11,165,143 | | |
| Accrued management fee | | 3,491,389 | | |
| Distribution and service plan fees payable | | 439,776 | | |
| Other affiliated payables | | 569,445 | | |
| Deferred taxes | | 6,363,150 | | |
| Other payables and accrued expenses | | 122,398 | | |
| Collateral on securities loaned | | 40,087,797 | | |
| Total Liabilities | | | | 65,562,816 |
| Net Assets | | | $ | 8,145,430,476 |
| Net Assets consist of: | | | | |
| Paid in capital | | | $ | 4,780,425,689 |
| Total accumulated earnings (loss) | | | | 3,365,004,787 |
| Net Assets | | | $ | 8,145,430,476 |
| | | | | |
| Net Asset Value and Maximum Offering Price | | | | |
| Initial Class : | | | | |
Net Asset Value , offering price and redemption price per share ($4,341,950,179 ÷ 49,600,845 shares) | | | $ | 87.54 |
| Service Class : | | | | |
Net Asset Value , offering price and redemption price per share ($1,113,650,069 ÷ 12,824,548 shares) | | | $ | 86.84 |
| Service Class 2 : | | | | |
Net Asset Value , offering price and redemption price per share ($1,712,952,715 ÷ 20,230,911 shares) | | | $ | 84.67 |
| Investor Class : | | | | |
Net Asset Value , offering price and redemption price per share ($976,877,513 ÷ 11,255,069 shares) | | | $ | 86.79 |
| Statement of Operations |
| | | | Six months ended June 30, 2023 (Unaudited) |
| Investment Income | | | | |
| Dividends | | | $ | 28,405,640 |
| Income from Fidelity Central Funds (including $625,409 from security lending) | | | | 2,180,129 |
| Total Income | | | | 30,585,769 |
| Expenses | | | | |
| Management fee | $ | 19,173,963 | | |
| Transfer agent fees | | 2,623,020 | | |
| Distribution and service plan fees | | 2,417,658 | | |
| Accounting fees | | 526,445 | | |
| Custodian fees and expenses | | 25,002 | | |
| Independent trustees' fees and expenses | | 23,601 | | |
| Audit | | 37,717 | | |
| Legal | | 12,062 | | |
| Interest | | 13,209 | | |
| Miscellaneous | | 99,415 | | |
| Total expenses before reductions | | 24,952,092 | | |
| Expense reductions | | (168,310) | | |
| Total expenses after reductions | | | | 24,783,782 |
| Net Investment income (loss) | | | | 5,801,987 |
| Realized and Unrealized Gain (Loss) | | | | |
| Net realized gain (loss) on: | | | | |
| Investment Securities: | | | | |
| Unaffiliated issuers | | 282,783,814 | | |
| Foreign currency transactions | | (31,255) | | |
| Total net realized gain (loss) | | | | 282,752,559 |
| Change in net unrealized appreciation (depreciation) on: | | | | |
| Investment Securities: | | | | |
| Unaffiliated issuers(net of increase in deferred foreign taxes of $309,280) | | 1,250,041,013 | | |
| Assets and liabilities in foreign currencies | | 6,314 | | |
| Total change in net unrealized appreciation (depreciation) | | | | 1,250,047,327 |
| Net gain (loss) | | | | 1,532,799,886 |
| Net increase (decrease) in net assets resulting from operations | | | $ | 1,538,601,873 |
| Statement of Changes in Net Assets |
| |
| | Six months ended June 30, 2023 (Unaudited) | | Year ended December 31, 2022 |
| Increase (Decrease) in Net Assets | | | | |
| Operations | | | | |
| Net investment income (loss) | $ | 5,801,987 | $ | 12,939,725 |
| Net realized gain (loss) | | 282,752,559 | | 290,195,869 |
| Change in net unrealized appreciation (depreciation) | | 1,250,047,327 | | (2,524,849,915) |
| Net increase (decrease) in net assets resulting from operations | | 1,538,601,873 | | (2,221,714,321) |
| Distributions to shareholders | | (46,318,112) | | (593,948,127) |
| | | | | |
| Share transactions - net increase (decrease) | | (1,452,825) | | 238,529,974 |
| Total increase (decrease) in net assets | | 1,490,830,936 | | (2,577,132,474) |
| | | | | |
| Net Assets | | | | |
| Beginning of period | | 6,654,599,540 | | 9,231,732,014 |
| End of period | $ | 8,145,430,476 | $ | 6,654,599,540 |
| | | | | |
| | | | | |
| VIP Growth Portfolio Initial Class |
| |
| | Six months ended (Unaudited) June 30, 2023 | | Years ended December 31, 2022 | | 2021 | | 2020 | | 2019 | | 2018 |
Selected Per-Share Data | | | | | | | | | | | | |
| Net asset value, beginning of period | $ | 71.51 | $ | 102.43 | $ | 103.00 | $ | 79.09 | $ | 63.12 | $ | 74.05 |
| Income from Investment Operations | | | | | | | | | | | | |
Net investment income (loss) A,B | | .09 | | .20 | | .37 C | | .01 | | .18 | | .21 |
| Net realized and unrealized gain (loss) | | 16.43 | | (24.46) | | 21.52 | | 32.21 | | 20.42 | | (.25) D |
| Total from investment operations | | 16.52 | | (24.26) | | 21.89 | | 32.22 | | 20.60 | | (.04) |
| Distributions from net investment income | | - E | | (.51) | | - | | (.07) | | (.19) | | (.18) |
| Distributions from net realized gain | | (.49) | | (6.15) | | (22.46) | | (8.25) | | (4.44) | | (10.72) |
| Total distributions | | (.49) | | (6.66) | | (22.46) | | (8.31) F | | (4.63) | | (10.89) F |
| Net asset value, end of period | $ | 87.54 | $ | 71.51 | $ | 102.43 | $ | 103.00 | $ | 79.09 | $ | 63.12 |
Total Return G,H,I | | 23.21% | | (24.46)% | | 23.21% | | 43.89% | | 34.31% | | (.17)% D |
Ratios to Average Net Assets B,J,K | | | | | | | | | | | | |
| Expenses before reductions | | .61% L | | .61% | | .61% | | .62% | | .63% | | .63% |
| Expenses net of fee waivers, if any | | .60% L | | .60% | | .60% | | .62% | | .62% | | .63% |
| Expenses net of all reductions | | .60% L | | .60% | | .60% | | .61% | | .62% | | .62% |
| Net investment income (loss) | | .23% L | | .25% | | .36% C | | .02% | | .25% | | .30% |
| Supplemental Data | | | | | | | | | | | | |
| Net assets, end of period (000 omitted) | $ | 4,341,950 | $ | 3,612,472 | $ | 5,103,811 | $ | 4,533,075 | $ | 3,441,605 | $ | 2,869,484 |
Portfolio turnover rate M | | 62% L | | 36% | | 45% | | 53% | | 47% | | 34% |
A Calculated based on average shares outstanding during the period.
B Net investment income (loss) is affected by the timing of the declaration of dividends by any underlying mutual funds or exchange-traded funds (ETFs). Net investment income (loss) of any mutual funds or ETFs is not included in the Fund's net investment income (loss) ratio.
C Net investment income per share reflects one or more large, non-recurring dividend(s) which amounted to $.30 per share. Excluding such non-recurring dividend(s), the ratio of net investment income (loss) to average net assets would have been .07%.
D Net realized and unrealized gain (loss) per share reflects proceeds received from litigation which amounted to $.02 per share. Excluding these litigation proceeds, the total return would have been (.20)%.
E Amount represents less than $.005 per share.
F Total distributions per share do not sum due to rounding.
G Total returns for periods of less than one year are not annualized.
H Total returns do not reflect charges attributable to your insurance company's separate account. Inclusion of these charges would reduce the total returns shown.
I Total returns would have been lower if certain expenses had not been reduced during the applicable periods shown.
J Fees and expenses of any underlying mutual funds or exchange-traded funds (ETFs) are not included in the Fund's expense ratio. The Fund indirectly bears its proportionate share of these expenses. For additional expense information related to investments in Fidelity Central Funds, please refer to the "Investments in Fidelity Central Funds" note found in the Notes to Financial Statements section of the most recent Annual or Semi-Annual report.
K Expense ratios reflect operating expenses of the class. Expenses before reductions do not reflect amounts reimbursed, waived, or reduced through arrangements with the investment adviser, brokerage services, or other offset arrangements, if applicable, and do not represent the amount paid by the class during periods when reimbursements, waivers or reductions occur.
L Annualized.
M Amount does not include the portfolio activity of any underlying mutual funds or exchange-traded funds (ETFs).
| VIP Growth Portfolio Service Class |
| |
| | Six months ended (Unaudited) June 30, 2023 | | Years ended December 31, 2022 | | 2021 | | 2020 | | 2019 | | 2018 |
Selected Per-Share Data | | | | | | | | | | | | |
| Net asset value, beginning of period | $ | 70.98 | $ | 101.70 | $ | 102.42 | $ | 78.69 | $ | 62.83 | $ | 73.76 |
| Income from Investment Operations | | | | | | | | | | | | |
Net investment income (loss) A,B | | .05 | | .12 | | .27 C | | (.07) | | .11 | | .14 |
| Net realized and unrealized gain (loss) | | 16.30 | | (24.28) | | 21.37 | | 32.03 | | 20.31 | | (.25) D |
| Total from investment operations | | 16.35 | | (24.16) | | 21.64 | | 31.96 | | 20.42 | | (.11) |
| Distributions from net investment income | | - E | | (.42) | | - | | (.05) | | (.12) | | (.11) |
| Distributions from net realized gain | | (.49) | | (6.15) | | (22.36) | | (8.18) | | (4.44) | | (10.72) |
| Total distributions | | (.49) | | (6.56) F | | (22.36) | | (8.23) | | (4.56) | | (10.82) F |
| Net asset value, end of period | $ | 86.84 | $ | 70.98 | $ | 101.70 | $ | 102.42 | $ | 78.69 | $ | 62.83 |
Total Return G,H,I | | 23.14% | | (24.52)% | | 23.08% | | 43.77% | | 34.17% | | (.27)% D |
Ratios to Average Net Assets B,J,K | | | | | | | | | | | | |
| Expenses before reductions | | .71% L | | .71% | | .71% | | .72% | | .73% | | .73% |
| Expenses net of fee waivers, if any | | .70% L | | .70% | | .70% | | .72% | | .72% | | .73% |
| Expenses net of all reductions | | .70% L | | .70% | | .70% | | .71% | | .72% | | .72% |
| Net investment income (loss) | | .13% L | | .15% | | .26% C | | (.08)% | | .15% | | .20% |
| Supplemental Data | | | | | | | | | | | | |
| Net assets, end of period (000 omitted) | $ | 1,113,650 | $ | 878,031 | $ | 1,176,735 | $ | 1,018,192 | $ | 745,767 | $ | 600,590 |
Portfolio turnover rate M | | 62% L | | 36% | | 45% | | 53% | | 47% | | 34% |
A Calculated based on average shares outstanding during the period.
B Net investment income (loss) is affected by the timing of the declaration of dividends by any underlying mutual funds or exchange-traded funds (ETFs). Net investment income (loss) of any mutual funds or ETFs is not included in the Fund's net investment income (loss) ratio.
C Net investment income per share reflects one or more large, non-recurring dividend(s) which amounted to $.30 per share. Excluding such non-recurring dividend(s), the ratio of net investment income (loss) to average net assets would have been (.03)%.
D Net realized and unrealized gain (loss) per share reflects proceeds received from litigation which amounted to $.02 per share. Excluding these litigation proceeds, the total return would have been (.30)%.
E Amount represents less than $.005 per share.
F Total distributions per share do not sum due to rounding.
G Total returns for periods of less than one year are not annualized.
H Total returns do not reflect charges attributable to your insurance company's separate account. Inclusion of these charges would reduce the total returns shown.
I Total returns would have been lower if certain expenses had not been reduced during the applicable periods shown.
J Fees and expenses of any underlying mutual funds or exchange-traded funds (ETFs) are not included in the Fund's expense ratio. The Fund indirectly bears its proportionate share of these expenses. For additional expense information related to investments in Fidelity Central Funds, please refer to the "Investments in Fidelity Central Funds" note found in the Notes to Financial Statements section of the most recent Annual or Semi-Annual report.
K Expense ratios reflect operating expenses of the class. Expenses before reductions do not reflect amounts reimbursed, waived, or reduced through arrangements with the investment adviser, brokerage services, or other offset arrangements, if applicable, and do not represent the amount paid by the class during periods when reimbursements, waivers or reductions occur.
L Annualized.
M Amount does not include the portfolio activity of any underlying mutual funds or exchange-traded funds (ETFs).
| VIP Growth Portfolio Service Class 2 |
| |
| | Six months ended (Unaudited) June 30, 2023 | | Years ended December 31, 2022 | | 2021 | | 2020 | | 2019 | | 2018 |
Selected Per-Share Data | | | | | | | | | | | | |
| Net asset value, beginning of period | $ | 69.27 | $ | 99.42 | $ | 100.58 | $ | 77.43 | $ | 61.91 | $ | 72.86 |
| Income from Investment Operations | | | | | | | | | | | | |
Net investment income (loss) A,B | | (.01) | | - C | | .11 D | | (.19) | | - C | | .03 |
| Net realized and unrealized gain (loss) | | 15.90 | | (23.72) | | 20.95 | | 31.46 | | 20.00 | | (.23) E |
| Total from investment operations | | 15.89 | | (23.72) | | 21.06 | | 31.27 | | 20.00 | | (.20) |
| Distributions from net investment income | | - C | | (.28) | | - | | (.04) | | (.04) | | (.03) |
| Distributions from net realized gain | | (.49) | | (6.15) | | (22.22) | | (8.08) | | (4.44) | | (10.72) |
| Total distributions | | (.49) | | (6.43) | | (22.22) | | (8.12) | | (4.48) | | (10.75) |
| Net asset value, end of period | $ | 84.67 | $ | 69.27 | $ | 99.42 | $ | 100.58 | $ | 77.43 | $ | 61.91 |
Total Return F,G,H | | 23.05% | | (24.64)% | | 22.90% | | 43.55% | | 33.98% | | (.43)% E |
Ratios to Average Net Assets B,I,J | | | | | | | | | | | | |
| Expenses before reductions | | .86% K | | .86% | | .85% | | .87% | | .88% | | .88% |
| Expenses net of fee waivers, if any | | .85% K | | .85% | | .85% | | .87% | | .87% | | .88% |
| Expenses net of all reductions | | .85% K | | .85% | | .85% | | .86% | | .87% | | .87% |
| Net investment income (loss) | | (.02)% K | | -% L | | .11% D | | (.23)% | | -% L | | .05% |
| Supplemental Data | | | | | | | | | | | | |
| Net assets, end of period (000 omitted) | $ | 1,712,953 | $ | 1,410,220 | $ | 1,941,161 | $ | 1,587,581 | $ | 1,182,162 | $ | 971,010 |
Portfolio turnover rate M | | 62% K | | 36% | | 45% | | 53% | | 47% | | 34% |
A Calculated based on average shares outstanding during the period.
B Net investment income (loss) is affected by the timing of the declaration of dividends by any underlying mutual funds or exchange-traded funds (ETFs). Net investment income (loss) of any mutual funds or ETFs is not included in the Fund's net investment income (loss) ratio.
C Amount represents less than $.005 per share.
D Net investment income per share reflects one or more large, non-recurring dividend(s) which amounted to $.29 per share. Excluding such non-recurring dividend(s), the ratio of net investment income (loss) to average net assets would have been (.18)%.
E Net realized and unrealized gain (loss) per share reflects proceeds received from litigation which amounted to $.02 per share. Excluding these litigation proceeds, the total return would have been (.46)%.
F Total returns for periods of less than one year are not annualized.
G Total returns do not reflect charges attributable to your insurance company's separate account. Inclusion of these charges would reduce the total returns shown.
H Total returns would have been lower if certain expenses had not been reduced during the applicable periods shown.
I Fees and expenses of any underlying mutual funds or exchange-traded funds (ETFs) are not included in the Fund's expense ratio. The Fund indirectly bears its proportionate share of these expenses. For additional expense information related to investments in Fidelity Central Funds, please refer to the "Investments in Fidelity Central Funds" note found in the Notes to Financial Statements section of the most recent Annual or Semi-Annual report.
J Expense ratios reflect operating expenses of the class. Expenses before reductions do not reflect amounts reimbursed, waived, or reduced through arrangements with the investment adviser, brokerage services, or other offset arrangements, if applicable, and do not represent the amount paid by the class during periods when reimbursements, waivers or reductions occur.
K Annualized.
L Amount represents less than .005%.
M Amount does not include the portfolio activity of any underlying mutual funds or exchange-traded funds (ETFs).
| VIP Growth Portfolio Investor Class |
| |
| | Six months ended (Unaudited) June 30, 2023 | | Years ended December 31, 2022 | | 2021 | | 2020 | | 2019 | | 2018 |
Selected Per-Share Data | | | | | | | | | | | | |
| Net asset value, beginning of period | $ | 70.94 | $ | 101.65 | $ | 102.38 | $ | 78.66 | $ | 62.81 | $ | 73.73 |
| Income from Investment Operations | | | | | | | | | | | | |
Net investment income (loss) A,B | | .06 | | .14 | | .29 C | | (.05) | | .12 | | .15 |
| Net realized and unrealized gain (loss) | | 16.28 | | (24.26) | | 21.37 | | 32.02 | | 20.30 | | (.23) D |
| Total from investment operations | | 16.34 | | (24.12) | | 21.66 | | 31.97 | | 20.42 | | (.08) |
| Distributions from net investment income | | - E | | (.44) | | - | | (.06) | | (.13) | | (.12) |
| Distributions from net realized gain | | (.49) | | (6.15) | | (22.39) | | (8.20) | | (4.44) | | (10.72) |
| Total distributions | | (.49) | | (6.59) | | (22.39) | | (8.25) F | | (4.57) | | (10.84) |
| Net asset value, end of period | $ | 86.79 | $ | 70.94 | $ | 101.65 | $ | 102.38 | $ | 78.66 | $ | 62.81 |
Total Return G,H,I | | 23.14% | | (24.50)% | | 23.12% | | 43.80% | | 34.18% | | (.24)% D |
Ratios to Average Net Assets B,J,K | | | | | | | | | | | | |
| Expenses before reductions | | .68% L | | .68% | | .68% | | .70% | | .70% | | .71% |
| Expenses net of fee waivers, if any | | .68% L | | .68% | | .68% | | .70% | | .70% | | .71% |
| Expenses net of all reductions | | .68% L | | .68% | | .68% | | .69% | | .70% | | .70% |
| Net investment income (loss) | | .16% L | | .17% | | .28% C | | (.06)% | | .17% | | .22% |
| Supplemental Data | | | | | | | | | | | | |
| Net assets, end of period (000 omitted) | $ | 976,878 | $ | 753,877 | $ | 1,010,025 | $ | 792,875 | $ | 547,920 | $ | 457,395 |
Portfolio turnover rate M | | 62% L | | 36% | | 45% | | 53% | | 47% | | 34% |
A Calculated based on average shares outstanding during the period.
B Net investment income (loss) is affected by the timing of the declaration of dividends by any underlying mutual funds or exchange-traded funds (ETFs). Net investment income (loss) of any mutual funds or ETFs is not included in the Fund's net investment income (loss) ratio.
C Net investment income per share reflects one or more large, non-recurring dividend(s) which amounted to $.30 per share. Excluding such non-recurring dividend(s), the ratio of net investment income (loss) to average net assets would have been (.01)%.
D Net realized and unrealized gain (loss) per share reflects proceeds received from litigation which amounted to $.02 per share. Excluding these litigation proceeds, the total return would have been (.27)%.
E Amount represents less than $.005 per share.
F Total distributions per share do not sum due to rounding.
G Total returns for periods of less than one year are not annualized.
H Total returns do not reflect charges attributable to your insurance company's separate account. Inclusion of these charges would reduce the total returns shown.
I Total returns would have been lower if certain expenses had not been reduced during the applicable periods shown.
J Fees and expenses of any underlying mutual funds or exchange-traded funds (ETFs) are not included in the Fund's expense ratio. The Fund indirectly bears its proportionate share of these expenses. For additional expense information related to investments in Fidelity Central Funds, please refer to the "Investments in Fidelity Central Funds" note found in the Notes to Financial Statements section of the most recent Annual or Semi-Annual report.
K Expense ratios reflect operating expenses of the class. Expenses before reductions do not reflect amounts reimbursed, waived, or reduced through arrangements with the investment adviser, brokerage services, or other offset arrangements, if applicable, and do not represent the amount paid by the class during periods when reimbursements, waivers or reductions occur.
L Annualized.
M Amount does not include the portfolio activity of any underlying mutual funds or exchange-traded funds (ETFs).
For the period ended June 30, 2023
1. Organization.
VIP Growth Portfolio (the Fund) is a non-diversified fund of Variable Insurance Products Fund (the Trust) and is authorized to issue an unlimited number of shares. The Trust is registered under the Investment Company Act of 1940, as amended (the 1940 Act), as an open-end management investment company organized as a Massachusetts business trust. Shares of the Fund may only be purchased by insurance companies for the purpose of funding variable annuity or variable life insurance contracts. The Fund offers the following classes of shares: Initial Class shares, Service Class shares, Service Class 2 shares and Investor Class shares. All classes have equal rights and voting privileges, except for matters affecting a single class.
2. Investments in Fidelity Central Funds.
Funds may invest in Fidelity Central Funds, which are open-end investment companies generally available only to other investment companies and accounts managed by the investment adviser and its affiliates. The Schedule of Investments lists any Fidelity Central Funds held as an investment as of period end, but does not include the underlying holdings of each Fidelity Central Fund. An investing fund indirectly bears its proportionate share of the expenses of the underlying Fidelity Central Funds.
Based on its investment objective, each Fidelity Central Fund may invest or participate in various investment vehicles or strategies that are similar to those of the investing fund. These strategies are consistent with the investment objectives of the investing fund and may involve certain economic risks which may cause a decline in value of each of the Fidelity Central Funds and thus a decline in the value of the investing fund.
| Fidelity Central Fund | Investment Manager | Investment Objective | Investment Practices | Expense Ratio A |
| Fidelity Money Market Central Funds | Fidelity Management & Research Company LLC (FMR) | Each fund seeks to obtain a high level of current income consistent with the preservation of capital and liquidity. | Short-term Investments | Less than .005% |
A Expenses expressed as a percentage of average net assets and are as of each underlying Central Fund's most recent annual or semi-annual shareholder report.
A complete unaudited list of holdings for each Fidelity Central Fund is available upon request or at the Securities and Exchange Commission website at www.sec.gov. In addition, the financial statements of the Fidelity Central Funds which contain the significant accounting policies (including investment valuation policies) of those funds, and are not covered by the Report of Independent Registered Public Accounting Firm, are available on the Securities and Exchange Commission website or upon request.
3. Significant Accounting Policies.
The Fund is an investment company and applies the accounting and reporting guidance of the Financial Accounting Standards Board (FASB) Accounting Standards Codification Topic 946 Financial Services - Investment Companies . The financial statements have been prepared in conformity with accounting principles generally accepted in the United States of America (GAAP), which require management to make certain estimates and assumptions at the date of the financial statements. Actual results could differ from those estimates. Subsequent events, if any, through the date that the financial statements were issued have been evaluated in the preparation of the financial statements. The Fund's Schedule of Investments lists any underlying mutual funds or exchange-traded funds (ETFs) but does not include the underlying holdings of these funds. The following summarizes the significant accounting policies of the Fund:
Investment Valuation. Investments are valued as of 4:00 p.m. Eastern time on the last calendar day of the period. The Board of Trustees (the Board) has designated the Fund's investment adviser as the valuation designee responsible for the fair valuation function and performing fair value determinations as needed. The investment adviser has established a Fair Value Committee (the Committee) to carry out the day-to-day fair valuation responsibilities and has adopted policies and procedures to govern the fair valuation process and the activities of the Committee. In accordance with these fair valuation policies and procedures, which have been approved by the Board, the Fund attempts to obtain prices from one or more third party pricing services or brokers to value its investments. When current market prices, quotations or currency exchange rates are not readily available or reliable, investments will be fair valued in good faith by the Committee, in accordance with the policies and procedures. Factors used in determining fair value vary by investment type and may include market or investment specific events, transaction data, estimated cash flows, and market observations of comparable investments. The frequency that the fair valuation procedures are used cannot be predicted and they may be utilized to a significant extent. The Committee manages the Fund's fair valuation practices and maintains the fair valuation policies and procedures. The Fund's investment adviser reports to the Board information regarding the fair valuation process and related material matters.
The Fund categorizes the inputs to valuation techniques used to value its investments into a disclosure hierarchy consisting of three levels as shown below:
Level 1 - unadjusted quoted prices in active markets for identical investments
Level 2 - other significant observable inputs (including quoted prices for similar investments, interest rates, prepayment speeds, etc.)
Level 3 - unobservable inputs (including the Fund's own assumptions based on the best information available)
Valuation techniques used to value the Fund's investments by major category are as follows:
Equity securities, including restricted securities, for which market quotations are readily available, are valued at the last reported sale price or official closing price as reported by a third party pricing service on the primary market or exchange on which they are traded and are categorized as Level 1 in the hierarchy. In the event there were no sales during the day or closing prices are not available, securities are valued at the last quoted bid price or may be valued using the last available price and are generally categorized as Level 2 in the hierarchy. For foreign equity securities, when market or security specific events arise, comparisons to the valuation of American Depositary Receipts (ADRs), futures contracts, ETFs and certain indexes as well as quoted prices for similar securities may be used and would be categorized as Level 2 in the hierarchy. For equity securities, including restricted securities, where observable inputs are limited, assumptions about market activity and risk are used and these securities may be categorized as Level 3 in the hierarchy.
Debt securities, including restricted securities, are valued based on evaluated prices received from third party pricing services or from brokers who make markets in such securities. Corporate bonds are valued by pricing services who utilize matrix pricing which considers yield or price of bonds of comparable quality, coupon, maturity and type or by broker-supplied prices. When independent prices are unavailable or unreliable, debt securities may be valued utilizing pricing methodologies which consider similar factors that would be used by third party pricing services. Debt securities are generally categorized as Level 2 in the hierarchy but may be Level 3 depending on the circumstances.
Investments in open-end mutual funds, including the Fidelity Central Funds, are valued at their closing net asset value (NAV) each business day and are categorized as Level 1 in the hierarchy.
Changes in valuation techniques may result in transfers in or out of an assigned level within the disclosure hierarchy. The aggregate value of investments by input level as of June 30, 2023 is included at the end of the Fund's Schedule of Investments.
Foreign Currency. Certain Funds may use foreign currency contracts to facilitate transactions in foreign-denominated securities. Gains and losses from these transactions may arise from changes in the value of the foreign currency or if the counterparties do not perform under the contracts' terms.
Foreign-denominated assets, including investment securities, and liabilities are translated into U.S. dollars at the exchange rates at period end. Purchases and sales of investment securities, income and dividends received, and expenses denominated in foreign currencies are translated into U.S. dollars at the exchange rate in effect on the transaction date.
The effects of exchange rate fluctuations on investments are included with the net realized and unrealized gain (loss) on investment securities. Other foreign currency transactions resulting in realized and unrealized gain (loss) are disclosed separately.
Investment Transactions and Income. For financial reporting purposes, the Fund's investment holdings and NAV include trades executed through the end of the last business day of the period. The NAV per share for processing shareholder transactions is calculated as of the close of business of the New York Stock Exchange (NYSE), normally 4:00 p.m. Eastern time and includes trades executed through the end of the prior business day. Gains and losses on securities sold are determined on the basis of identified cost and include proceeds received from litigation. Commissions paid to certain brokers with whom the investment adviser, or its affiliates, places trades on behalf of a fund include an amount in addition to trade execution, which may be rebated back to a fund. Any such rebates are included in net realized gain (loss) on investments in the Statement of Operations. Dividend income is recorded on the ex-dividend date, except for certain dividends from foreign securities where the ex-dividend date may have passed, which are recorded as soon as the Fund is informed of the ex-dividend date. Non-cash dividends included in dividend income, if any, are recorded at the fair market value of the securities received. Income and capital gain distributions from Fidelity Central Funds, if any, are recorded on the ex-dividend date. Certain distributions received by the Fund represent a return of capital or capital gain. The Fund determines the components of these distributions subsequent to the ex-dividend date, based upon receipt of tax filings or other correspondence relating to the underlying investment. These distributions are recorded as a reduction of cost of investments and/or as a realized gain. Investment income is recorded net of foreign taxes withheld where recovery of such taxes is uncertain. Funds may file withholding tax reclaims in certain jurisdictions to recover a portion of amounts previously withheld. Any withholding tax reclaims income is included in the Statement of Operations in dividends. Any receivables for withholding tax reclaims are included in the Statement of Assets and Liabilities in dividends receivable.
Class Allocations and Expenses. Investment income, realized and unrealized capital gains and losses, common expenses of a fund, and certain fund-level expense reductions, if any, are allocated daily on a pro-rata basis to each class based on the relative net assets of each class to the total net assets of a fund. Each class differs with respect to transfer agent and distribution and service plan fees incurred, as applicable. Certain expense reductions may also differ by class, if applicable. For the reporting period, the allocated portion of income and expenses to each class as a percent of its average net assets may vary due to the timing of recording these transactions in relation to fluctuating net assets of the classes. Expenses directly attributable to a fund are charged to that fund. Expenses attributable to more than one fund are allocated among the respective funds on the basis of relative net assets or other appropriate methods. Expenses included in the accompanying financial statements reflect the expenses of that fund and do not include any expenses associated with any underlying mutual funds or ETFs. Although not included in a fund's expenses, a fund indirectly bears its proportionate share of these expenses through the net asset value of each underlying mutual fund or ETF. Expense estimates are accrued in the period to which they relate and adjustments are made when actual amounts are known.
Deferred Trustee Compensation. Under a Deferred Compensation Plan (the Plan) for certain Funds, certain independent Trustees have elected to defer receipt of a portion of their annual compensation. Deferred amounts are invested in affiliated mutual funds, are marked-to-market and remain in a fund until distributed in accordance with the Plan. The investment of deferred amounts and the offsetting payable to the Trustees presented below are included in the accompanying Statement of Assets and Liabilities in other receivables and other payables and accrued expenses, as applicable.
| VIP Growth Portfolio | $26,733 |
Income Tax Information and Distributions to Shareholders. Each year, the Fund intends to qualify as a regulated investment company under Subchapter M of the Internal Revenue Code, including distributing substantially all of its taxable income and realized gains. As a result, no provision for U.S. Federal income taxes is required. The Fund files a U.S. federal tax return, in addition to state and local tax returns as required. The Fund's federal income tax returns are subject to examination by the Internal Revenue Service (IRS) for a period of three fiscal years after they are filed. State and local tax returns may be subject to examination for an additional fiscal year depending on the jurisdiction. Foreign taxes are provided for based on the Fund's understanding of the tax rules and rates that exist in the foreign markets in which it invests. The Fund is subject to a tax imposed on capital gains by certain countries in which it invests. An estimated deferred tax liability for net unrealized appreciation on the applicable securities is included in Deferred taxes on the Statement of Assets & Liabilities.
Distributions are declared and recorded on the ex-dividend date. Income and capital gain distributions are declared separately for each class. Income and capital gain distributions are determined in accordance with income tax regulations, which may differ from GAAP.
Capital accounts within the financial statements are adjusted for permanent book-tax differences. These adjustments have no impact on net assets or the results of operations. Capital accounts are not adjusted for temporary book-tax differences which will reverse in a subsequent period.
Book-tax differences are primarily due to foreign currency transactions, certain foreign taxes, passive foreign investment companies (PFIC), partnerships and losses deferred due to wash sales and excise tax regulations.
As of period end, the cost and unrealized appreciation (depreciation) in securities, and derivatives if applicable, for federal income tax purposes were as follows:
| Gross unrealized appreciation | $3,284,697,230 |
| Gross unrealized depreciation | (200,380,433) |
| Net unrealized appreciation (depreciation) | $3,084,316,797 |
| Tax cost | $5,053,312,964 |
Restricted Securities (including Private Placements). Funds may invest in securities that are subject to legal or contractual restrictions on resale. These securities generally may be resold in transactions exempt from registration or to the public if the securities are registered. Disposal of these securities may involve time-consuming negotiations and expense, and prompt sale at an acceptable price may be difficult. Information regarding restricted securities held at period end is included at the end of the Schedule of Investments, if applicable.
4. Purchases and Sales of Investments.
Purchases and sales of securities, other than short-term securities and in-kind transactions, as applicable, are noted in the table below.
| | Purchases ($) | Sales ($) |
| VIP Growth Portfolio | 2,242,090,834 | 2,332,237,480 |
5. Fees and Other Transactions with Affiliates.
Management Fee. Fidelity Management & Research Company LLC (the investment adviser) and its affiliates provide the Fund with investment management related services for which the Fund pays a monthly management fee. The management fee is the sum of an individual fund fee rate that is based on an annual rate of .30% of the Fund's average net assets and an annualized group fee rate that averaged .23% during the period. The group fee rate is based upon the monthly average net assets of a group of registered investment companies with which the investment adviser has management contracts. The group fee rate decreases as assets under management increase and increases as assets under management decrease. For the reporting period, the total annualized management fee rate was .52% of the Fund's average net assets.
Distribution and Service Plan Fees. In accordance with Rule 12b-1 of the 1940 Act, the Fund has adopted separate 12b-1 Plans for each Service Class of shares. Each Service Class pays Fidelity Distributors Company LLC (FDC), an affiliate of the investment adviser, a service fee. For the period, the service fee is based on an annual rate of .10% of Service Class' average net assets and .25% of Service Class 2's average net assets.
For the period, total fees, all of which were re-allowed to insurance companies for the distribution of shares and providing shareholder support services, were as follows:
| Service Class | $492,306 |
| Service Class 2 | 1,925,352 |
| | $2,417,658 |
Transfer Agent Fees. Fidelity Investments Institutional Operations Company LLC (FIIOC), an affiliate of the investment adviser, is the Fund's transfer, dividend disbursing, and shareholder servicing agent. FIIOC receives an asset-based fee with respect to each class. Each class pays a fee for transfer agent services, typesetting and printing and mailing of shareholder reports, excluding mailing of proxy statements. For the period, transfer agent fees for each class were as follows:
| | Amount | % of Class-Level Average Net Assets A |
| Initial Class | $1,237,240 | .06 |
| Service Class | 310,152 | .06 |
| Service Class 2 | 485,189 | .06 |
| Investor Class | 590,439 | .14 |
| | $2,623,020 | |
A Annualized
Accounting Fees. Fidelity Service Company, Inc. (FSC), an affiliate of the investment adviser, maintains the Fund's accounting records. The accounting fee is based on the level of average net assets for each month. For the period, the fees were equivalent to the following annualized rates:
| | % of Average Net Assets |
| VIP Growth Portfolio | .01 |
Brokerage Commissions. A portion of portfolio transactions were placed with brokerage firms which are affiliates of the investment adviser. Brokerage commissions are included in net realized gain (loss) and change in net unrealized appreciation (depreciation) in the Statement of Operations. The commissions paid to these affiliated firms were as follows:
| | Amount |
| VIP Growth Portfolio | $29,789 |
Interfund Lending Program. Pursuant to an Exemptive Order issued by the Securities and Exchange Commission (the SEC), the Fund, along with other registered investment companies having management contracts with Fidelity Management & Research Company LLC (FMR), or other affiliated entities of FMR, may participate in an interfund lending program. This program provides an alternative credit facility allowing the Fund to borrow from, or lend money to, other participating affiliated funds. At period end, there were no interfund loans outstanding. Activity in this program during the period for which loans were outstanding was as follows:
| | Borrower or Lender | Average Loan Balance | Weighted Average Interest Rate | Interest Expense |
| VIP Growth Portfolio | Borrower | $ 22,359,000 | 5.32% | $13,209 |
Interfund Trades. Funds may purchase from or sell securities to other Fidelity Funds under procedures adopted by the Board. The procedures have been designed to ensure these interfund trades are executed in accordance with Rule 17a-7 of the 1940 Act. Any interfund trades are included within the respective purchases and sales amounts shown in the Purchases and Sales of Investments note. Interfund trades during the period are noted in the table below.
| | Purchases ($) | Sales ($) | Realized Gain (Loss) ($) |
| VIP Growth Portfolio | 69,553,519 | 186,736,677 | 26,742,252 |
6. Committed Line of Credit.
Certain Funds participate with other funds managed by the investment adviser or an affiliate in a $4.25 billion credit facility (the "line of credit") to be utilized for temporary or emergency purposes to fund shareholder redemptions or for other short-term liquidity purposes. The participating funds have agreed to pay commitment fees on their pro-rata portion of the line of credit, which are reflected in Miscellaneous expenses on the Statement of Operations, and are listed below. During the period, there were no borrowings on this line of credit.
| | Amount |
| VIP Growth Portfolio | $6,801 |
7. Security Lending.
Funds lend portfolio securities from time to time in order to earn additional income. Lending agents are used, including National Financial Services (NFS), an affiliate of the investment adviser. Pursuant to a securities lending agreement, NFS will receive a fee, which is capped at 9.9% of a fund's daily lending revenue, for its services as lending agent. A fund may lend securities to certain qualified borrowers, including NFS. On the settlement date of the loan, a fund receives collateral (in the form of U.S. Treasury obligations, letters of credit and/or cash) against the loaned securities and maintains collateral in an amount not less than 100% of the market value of the loaned securities during the period of the loan. The market value of the loaned securities is determined at the close of business of a fund and any additional required collateral is delivered to a fund on the next business day. A fund or borrower may terminate the loan at any time, and if the borrower defaults on its obligation to return the securities loaned because of insolvency or other reasons, a fund may apply collateral received from the borrower against the obligation. A fund may experience delays and costs in recovering the securities loaned. Any cash collateral received is invested in the Fidelity Securities Lending Cash Central Fund. Any loaned securities are identified as such in the Schedule of Investments, and the value of loaned securities and cash collateral at period end, as applicable, are presented in the Statement of Assets and Liabilities. Security lending income represents the income earned on investing cash collateral, less rebates paid to borrowers and any lending agent fees associated with the loan, plus any premium payments received for lending certain types of securities. Security lending income is presented in the Statement of Operations as a component of income from Fidelity Central Funds. Affiliated security lending activity, if any, was as follows:
| | Total Security Lending Fees Paid to NFS | Security Lending Income From Securities Loaned to NFS | Value of Securities Loaned to NFS at Period End |
| VIP Growth Portfolio | $66,431 | $489 | $- |
8. Expense Reductions.
Through arrangements with the Fund's custodian, credits realized as a result of certain uninvested cash balances were used to reduce the Fund's expenses. During the period, custodian credits reduced the Fund's expenses by $7,298.
In addition, during the period the investment adviser or an affiliate reimbursed and/or waived a portion of fund-level operating expenses in the amount of $161,012.
9. Distributions to Shareholders.
Distributions to shareholders of each class were as follows:
| | Six months ended June 30, 2023 | Year ended December 31, 2022 |
| VIP Growth Portfolio | | |
| Distributions to shareholders | | |
| Initial Class | $24,668,030 | $327,242,195 |
| Service Class | 6,215,665 | 76,304,030 |
| Service Class 2 | 10,087,981 | 124,813,908 |
| Investor Class | 5,346,436 | 65,587,994 |
Total | $46,318,112 | $593,948,127 |
10. Share Transactions.
Transactions for each class of shares were as follows and may contain in-kind transactions:
| | Shares | Shares | Dollars | Dollars |
| | Six months ended June 30, 2023 | Year ended December 31, 2022 | Six months ended June 30, 2023 | Year ended December 31, 2022 |
| VIP Growth Portfolio | | | | |
| Initial Class | | | | |
| Shares sold | 2,171,147 | 3,357,698 | $170,761,248 | $269,447,445 |
| Reinvestment of distributions | 324,964 | 3,960,831 | 24,668,031 | 327,242,195 |
| Shares redeemed | (3,409,925) | (6,632,085) | (271,130,504) | (539,302,844) |
| Net increase (decrease) | (913,814) | 686,444 | $(75,701,225) | $57,386,796 |
| Service Class | | | | |
| Shares sold | 1,073,190 | 1,422,893 | $83,034,696 | $111,903,088 |
| Reinvestment of distributions | 82,512 | 931,059 | 6,215,665 | 76,304,030 |
| Shares redeemed | (701,244) | (1,554,017) | (54,419,867) | (126,719,809) |
| Net increase (decrease) | 454,458 | 799,935 | $34,830,494 | $61,487,309 |
| Service Class 2 | | | | |
| Shares sold | 1,603,661 | 2,016,536 | $121,762,286 | $158,300,940 |
| Reinvestment of distributions | 137,270 | 1,556,899 | 10,087,981 | 124,813,908 |
| Shares redeemed | (1,867,579) | (2,741,205) | (141,748,482) | (219,822,709) |
| Net increase (decrease) | (126,648) | 832,230 | $(9,898,215) | $63,292,139 |
| Investor Class | | | | |
| Shares sold | 966,758 | 1,313,073 | $75,792,647 | $104,900,921 |
| Reinvestment of distributions | 71,011 | 801,097 | 5,346,436 | 65,587,994 |
| Shares redeemed | (410,164) | (1,422,870) | (31,822,962) | (114,125,185) |
| Net increase (decrease) | 627,605 | 691,300 | $49,316,121 | $56,363,730 |
11. Other.
A fund's organizational documents provide former and current trustees and officers with a limited indemnification against liabilities arising in connection with the performance of their duties to the fund. In the normal course of business, a fund may also enter into contracts that provide general indemnifications. A fund's maximum exposure under these arrangements is unknown as this would be dependent on future claims that may be made against a fund. The risk of material loss from such claims is considered remote.
At the end of the period, the investment adviser or its affiliates were owners of record of more than 10% and certain otherwise unaffiliated shareholders each were owners of record of more than 10% of the outstanding shares as follows:
| Fund | % of shares held | Number of Unaffiliated Shareholders | Unaffiliated Shareholders % |
| VIP Overseas Portfolio | 20% | 2 | 38% |
12. Risk and Uncertainties.
Many factors affect a fund's performance. Developments that disrupt global economies and financial markets, such as pandemics, epidemics, outbreaks of infectious diseases, war, terrorism, and environmental disasters, may significantly affect a fund's investment performance. The effects of these developments to a fund will be impacted by the types of securities in which a fund invests, the financial condition, industry, economic sector, and geographic location of an issuer, and a fund's level of investment in the securities of that issuer. Significant concentrations in security types, issuers, industries, sectors, and geographic locations may magnify the factors that affect a fund's performance.
As a shareholder, you incur two types of costs: (1) transaction costs, which may include sales charges (loads) on purchase payments or redemption proceeds, as applicable and (2) ongoing costs, which generally include management fees, distribution and/or service (12b-1) fees and other Fund expenses. This Example is intended to help you understand your ongoing costs (in dollars) of investing in a fund and to compare these costs with the ongoing costs of investing in other mutual funds.
| The Example is based on an investment of $1,000 invested at the beginning of the period and held for the entire period (January 1, 2023 to June 30, 2023). |
Actual Expenses
The first line of the accompanying table provides information about actual account values and actual expenses. You may use the information in this line, together with the amount you invested, to estimate the expenses that you paid over the period. Simply divide your account value by $1,000.00 (for example, an $8,600 account value divided by $1,000.00 = 8.6), then multiply the result by the number in the first line for a class/Fund under the heading entitled "Expenses Paid During Period" to estimate the expenses you paid on your account during this period. If any fund is a shareholder of any underlying mutual funds or exchange-traded funds (ETFs) (the Underlying Funds), such fund indirectly bears its proportional share of the expenses of the Underlying Funds in addition to the direct expenses incurred presented in the table. These fees and expenses are not included in the annualized expense ratio used to calculate the expense estimate in the table below. The estimate of expenses does not include any fees or other expenses of any variable annuity or variable life insurance product. If they were, the estimate of expenses you paid during the period would be higher, and your ending account value would be lower.
Hypothetical Example for Comparison Purposes
The second line of the accompanying table provides information about hypothetical account values and hypothetical expenses based on the actual expense ratio and an assumed rate of return of 5% per year before expenses, which is not the actual return. The hypothetical account values and expenses may not be used to estimate the actual ending account balance or expenses you paid for the period. You may use this information to compare the ongoing costs of investing in the Fund and other funds. To do so, compare this 5% hypothetical example with the 5% hypothetical examples that appear in the shareholder reports of the other funds. If any fund is a shareholder of any Underlying Funds, such fund indirectly bears its proportional share of the expenses of the Underlying Funds in addition to the direct expenses as presented in the table. These fees and expenses are not included in the annualized expense ratio used to calculate the expense estimate in the table below. The estimate of expenses does not include any fees or other expenses of any variable annuity or variable life insurance product. If they were, the estimate of expenses you paid during the period would be higher, and your ending account value would be lower.
Please note that the expenses shown in the table are meant to highlight your ongoing costs only and do not reflect any transaction costs. Therefore, the second line of the table is useful in comparing ongoing costs only, and will not help you determine the relative total costs of owning different funds. In addition, if these transactional costs were included, your costs would have been higher.
| | | | | Annualized Expense Ratio- A | | Beginning Account Value January 1, 2023 | | Ending Account Value June 30, 2023 | | Expenses Paid During Period- C January 1, 2023 to June 30, 2023 |
| VIP Growth Portfolio | | | | | | | | | | |
| Initial Class | | | | .60% | | | | | | |
| Actual | | | | | | $ 1,000 | | $ 1,232.10 | | $ 3.32 |
Hypothetical- B | | | | | | $ 1,000 | | $ 1,021.82 | | $ 3.01 |
| Service Class | | | | .70% | | | | | | |
| Actual | | | | | | $ 1,000 | | $ 1,231.40 | | $ 3.87 |
Hypothetical- B | | | | | | $ 1,000 | | $ 1,021.32 | | $ 3.51 |
| Service Class 2 | | | | .85% | | | | | | |
| Actual | | | | | | $ 1,000 | | $ 1,230.50 | | $ 4.70 |
Hypothetical- B | | | | | | $ 1,000 | | $ 1,020.58 | | $ 4.26 |
| Investor Class | | | | .68% | | | | | | |
| Actual | | | | | | $ 1,000 | | $ 1,231.40 | | $ 3.76 |
Hypothetical- B | | | | | | $ 1,000 | | $ 1,021.42 | | $ 3.41 |
| |
A Annualized expense ratio reflects expenses net of applicable fee waivers.
B 5% return per year before expenses
C Expenses are equal to the annualized expense ratio, multiplied by the average account value over the period, multiplied by 181/ 365 (to reflect the one-half year period). The fees and expenses of any Underlying Funds are not included in each annualized expense ratio.
Board Approval of Investment Advisory Contracts
VIP Growth Portfolio
At its May 2023 meeting, the Board of Trustees, including the Independent Trustees (together, the Board), voted to continue the management contract with Fidelity Management & Research Company LLC (FMR), and the sub-advisory agreements and sub-subadvisory agreements, in each case, where applicable (together, the Advisory Contracts) for the fund for two months from June 1, 2023 through July 31, 2023. The Board determined that it will consider the annual renewal of the fund's Advisory Contracts for a full one year period in July 2023, following its review of additional materials provided by FMR.
The Board considered that the approval of the fund's Advisory Contracts will not result in any changes in (i) the investment process or strategies employed in the management of the fund's assets; (ii) the fees and expenses paid by shareholders; (iii) the nature, extent or quality of services provided under the fund's Advisory Contracts; or (iv) the day-to-day management of the fund or the persons primarily responsible for such management. The Board also considered that since its last approval of the fund's Advisory Contracts, FMR had provided additional information on the fund in support of the annual contract renewal process, including competitive analyses on total expenses and management fees and in-depth reviews of fund performance and fund profitability information. The Board concluded that the fund's Advisory Contracts are fair and reasonable, and that the fund's Advisory Contracts should be renewed, without modification, through July 31, 2023, with the understanding that the Board will consider the annual renewal for a full one year period in July 2023.
In connection with its consideration of future renewals of the fund's Advisory Contracts, the Board will consider: (i) the nature, extent and quality of services provided to the fund, including shareholder and administrative services and investment performance; (ii) the competitiveness of the management fee and total expenses for the fund; (iii) the costs of the services and profitability, including the revenues earned and the expenses incurred in conducting the business of developing, marketing, distributing, managing, administering, and servicing the fund and its shareholders, to the extent applicable; and (iv) whether there have been economies of scale in respect of the Fidelity funds, whether the Fidelity funds (including the fund) have appropriately benefited from any such economies of scale, and whether there is the potential for realization of any further economies.
Based on its evaluation of all of the conclusions noted above, and after considering all factors it believed relevant, the Board ultimately concluded that the fund's management fee structure is fair and reasonable, and that the continuation of the fund's Advisory Contracts should be approved for two months from June 1, 2023 through July 31, 2023.
The Securities and Exchange Commission adopted Rule 22e-4 under the Investment Company Act of 1940 (the Liquidity Rule) to promote effective liquidity risk management throughout the open-end investment company industry, thereby reducing the risk that funds will be unable to meet their redemption obligations and mitigating dilution of the interests of fund shareholders.
The Fund has adopted and implemented a liquidity risk management program (the Program) reasonably designed to assess and manage the Fund's liquidity risk and to comply with the requirements of the Liquidity Rule. The Fund's Board of Trustees (the Board) has designated the Fund's investment adviser as administrator of the Program. The Fidelity advisers have established a Liquidity Risk Management Committee (the LRM Committee) to manage the Program for each of the Fidelity Funds. The LRM Committee monitors the adequacy and effectiveness of implementation of the Program and on a periodic basis assesses each Fund's liquidity risk based on a variety of factors including (1) the Fund's investment strategy, (2) portfolio liquidity and cash flow projections during normal and reasonably foreseeable stressed conditions, (3) shareholder redemptions, (4) borrowings and other funding sources and (5) certain factors specific to ETFs including the effect of the Fund's prices and spreads, market participants, and basket compositions on the overall liquidity of the Fund's portfolio, as applicable.
In accordance with the Program, each of the Fund's portfolio investments is classified into one of four defined liquidity categories based on a determination of a reasonable expectation for how long it would take to convert the investment to cash (or sell or dispose of the investment) without significantly changing its market value.
- Highly liquid investments - cash or convertible to cash within three business days or less
- Moderately liquid investments - convertible to cash in three to seven calendar days
- Less liquid investments - can be sold or disposed of, but not settled, within seven calendar days
- Illiquid investments - cannot be sold or disposed of within seven calendar days
Liquidity classification determinations take into account a variety of factors including various market, trading and investment-specific considerations, as well as market depth, and generally utilize analysis from a third-party liquidity metrics service.
The Liquidity Rule places a 15% limit on a fund's illiquid investments and requires funds that do not primarily hold assets that are highly liquid investments to determine and maintain a minimum percentage of the fund's net assets to be invested in highly liquid investments (highly liquid investment minimum or HLIM). The Program includes provisions reasonably designed to comply with the 15% limit on illiquid investments and for determining, periodically reviewing and complying with the HLIM requirement as applicable.
At a recent meeting of the Fund's Board of Trustees, the LRM Committee provided a written report to the Board pertaining to the operation, adequacy, and effectiveness of the Program for the period December 1, 2021 through November 30, 2022. The report concluded that the Program is operating effectively and is reasonably designed to assess and manage the Fund's liquidity risk.
1.705692.125
VIPGRWT-SANN-0823
Fidelity® Variable Insurance Products:
VIP Floating Rate High Income Portfolio
Semi-Annual Report
June 30, 2023
Contents
To view a fund's proxy voting guidelines and proxy voting record for the 12-month period ended June 30, visit http://www.fidelity.com/proxyvotingresults or visit the Securities and Exchange Commission's (SEC) web site at http://www.sec.gov.
You may also call 1-877-208-0098 to request a free copy of the proxy voting guidelines.
Fidelity® Variable Insurance Products are separate account options which are purchased through a variable insurance contract.
Standard & Poor's, S&P and S&P 500 are registered service marks of The McGraw-Hill Companies, Inc. and have been licensed for use by Fidelity Distributors Corporation.
Other third-party marks appearing herein are the property of their respective owners.
All other marks appearing herein are registered or unregistered trademarks or service marks of FMR LLC or an affiliated company. © 2023 FMR LLC. All rights reserved.
This report and the financial statements contained herein are submitted for the general information of the shareholders of the Fund. This report is not authorized for distribution to prospective investors in the Fund unless preceded or accompanied by an effective prospectus.
A fund files its complete schedule of portfolio holdings with the SEC for the first and third quarters of each fiscal year on Form N-PORT. Forms N-PORT are available on the SEC's web site at http://www.sec.gov. A fund's Forms N-PORT may be reviewed and copied at the SEC's Public Reference Room in Washington, DC. Information regarding the operation of the SEC's Public Reference Room may be obtained by calling 1-800-SEC-0330.
For a complete list of a fund's portfolio holdings, view the most recent holdings listing, semiannual report, or annual report on Fidelity's web site at http://www.fidelity.com, http://www.institutional.fidelity.com, or http://www.401k.com, as applicable.
NOT FDIC INSURED •MAY LOSE VALUE •NO BANK GUARANTEE
Neither the Fund nor Fidelity Distributors Corporation is a bank.
This report and the financial statements contained herein are submitted for the general information of the shareholders of the Fund. This report is not authorized for distribution to prospective investors in the Fund unless preceded or accompanied by an effective prospectus.
A fund files its complete schedule of portfolio holdings with the SEC for the first and third quarters of each fiscal year on Form N-PORT. Forms N-PORT are available on the SEC's web site at http://www.sec.gov. A fund's Forms N-PORT may be reviewed and copied at the SEC's Public Reference Room in Washington, DC. Information regarding the operation of the SEC's Public Reference Room may be obtained by calling 1-800-SEC-0330.
For a complete list of a fund's portfolio holdings, view the most recent holdings listing, semiannual report, or annual report on Fidelity's web site at http://www.fidelity.com, http://www.institutional.fidelity.com, or http://www.401k.com, as applicable.
NOT FDIC INSURED •MAY LOSE VALUE •NO BANK GUARANTEE
Neither the Fund nor Fidelity Distributors Corporation is a bank.
| Top Bond Issuers (% of Fund's net assets) |
(with maturities greater than one year) |
| Bass Pro Group LLC | 2.6 | |
| Asurion LLC | 2.0 | |
| Intelsat Jackson Holdings SA | 1.2 | |
| Fertitta Entertainment LLC NV | 1.1 | |
| Acrisure LLC | 1.1 | |
| ABG Intermediate Holdings 2 LLC | 1.0 | |
| Caesars Entertainment, Inc. | 1.0 | |
| TransDigm, Inc. | 0.9 | |
| Ultimate Software Group, Inc. | 0.8 | |
| MH Sub I LLC | 0.8 | |
| | 12.5 | |
| |
| Market Sectors (% of Fund's net assets) |
| |
| Technology | 15.8 | |
| Services | 10.5 | |
| Telecommunications | 5.3 | |
| Healthcare | 5.1 | |
| Insurance | 5.0 | |
| |
Quality Diversification (% of Fund's net assets) |
|
| |
| We have used ratings from Moody's Investors Service, Inc. Where Moody's® ratings are not available, we have used S&P® ratings. All ratings are as of the date indicated and do not reflect subsequent changes. |
Asset Allocation (% of Fund's net assets) |
|
|
Geographic Diversification (% of Fund's net assets) |
|
* Includes Short-Term investments and Net Other Assets (Liabilities). Percentages are adjusted for the effect of derivatives, if applicable. |
| |
Showing Percentage of Net Assets
| Bank Loan Obligations - 87.1% |
| | | Principal Amount (a) | Value ($) |
| Aerospace - 0.9% | | | |
| ADS Tactical, Inc. Tranche B 1LN, term loan 1 month U.S. LIBOR + 5.750% 10.943% 3/19/26 (b)(c)(d) | | 310,625 | 293,541 |
| Gemini HDPE LLC Tranche B 1LN, term loan 3 month U.S. LIBOR + 3.000% 8.307% 12/31/27 (b)(c)(d) | | 144,872 | 144,601 |
| TransDigm, Inc.: | | | |
| 1LN, term loan CME Term SOFR 1 Month Index + 3.250% 8.4919% 8/24/28 (b)(c)(d) | | 1,730,874 | 1,729,212 |
| Tranche H 1LN, term loan CME Term SOFR 1 Month Index + 3.250% 8.4919% 2/22/27 (b)(c)(d) | | 124,375 | 124,375 |
TOTAL AEROSPACE | | | 2,291,729 |
| Air Transportation - 1.6% | | | |
| AAdvantage Loyalty IP Ltd. Tranche B 1LN, term loan 3 month U.S. LIBOR + 4.750% 10.0004% 4/20/28 (b)(c)(d) | | 780,000 | 795,600 |
| Air Canada Tranche B 1LN, term loan 3 month U.S. LIBOR + 3.500% 8.8391% 8/11/28 (b)(c)(d) | | 277,200 | 276,804 |
| Dynasty Acquisition Co., Inc.: | | | |
| Tranche B 1LN, term loan 1 month U.S. LIBOR + 3.500% 8.7025% 4/8/26 (b)(c)(d) | | 250,758 | 248,356 |
| Tranche B2 1LN, term loan 1 month U.S. LIBOR + 3.500% 8.7025% 4/4/26 (b)(c)(d) | | 134,816 | 133,525 |
| Echo Global Logistics, Inc.: | | | |
| 1LN, term loan 3 month U.S. LIBOR + 4.750% 9.9037% 11/23/28 (b)(c)(d)(e) | | 401,963 | 387,090 |
| 2LN, term loan CME Term SOFR 3 Month Index + 7.000% 12.193% 11/23/29 (b)(c)(d)(e) | | 175,000 | 174,125 |
| Mileage Plus Holdings LLC Tranche B 1LN, term loan 3 month U.S. LIBOR + 5.250% 10.7637% 7/2/27 (b)(c)(d) | | 456,000 | 473,196 |
| Rand Parent LLC Tranche B 1LN, term loan CME Term SOFR 1 Month Index + 4.250% 9.4919% 3/17/30 (b)(c)(d) | | 114,713 | 107,543 |
| SkyMiles IP Ltd. Tranche B 1LN, term loan CME Term SOFR 3 Month Index + 3.750% 8.7985% 10/20/27 (b)(c)(d) | | 445,500 | 462,309 |
| STG Logistics, Inc. 1LN, term loan CME Term SOFR 1 Month Index + 6.000% 11.3919% 3/24/28 (b)(c)(d)(e) | | 251,813 | 242,999 |
| United Airlines, Inc. Tranche B 1LN, term loan 3 month U.S. LIBOR + 3.750% 9.2919% 4/21/28 (b)(c)(d) | | 750,780 | 749,323 |
TOTAL AIR TRANSPORTATION | | | 4,050,870 |
| Automotive & Auto Parts - 1.5% | | | |
| American Trailer World Corp. Tranche B 1LN, term loan CME Term SOFR 1 Month Index + 3.750% 8.9525% 3/5/28 (b)(c)(d) | | 454,171 | 407,478 |
| Belron Finance U.S. LLC Tranche B 1LN, term loan CME Term SOFR 1 Month Index + 2.750% 7.8319% 4/13/29 (b)(c)(d) | | 115,000 | 114,929 |
| Clarios Global LP Tranche B 1LN, term loan CME Term SOFR 1 Month Index + 3.750% 8.8525% 4/20/30 (b)(c)(d) | | 600,000 | 597,936 |
| CWGS Group LLC Tranche B 1LN, term loan 1 month U.S. LIBOR + 2.500% 7.66% 6/3/28 (b)(c)(d) | | 749,893 | 714,085 |
| Driven Holdings LLC Tranche B 1LN, term loan 1 month U.S. LIBOR + 3.000% 8.1541% 12/17/28 (b)(c)(d) | | 103,688 | 101,355 |
| Ls Group Opco Acquistion LLC Tranche B 1LN, term loan 1 month U.S. LIBOR + 3.250% 8.443% 11/2/27 (b)(c)(d) | | 459,432 | 455,986 |
| PECF USS Intermediate Holding III Corp. Tranche B 1LN, term loan 1 month U.S. LIBOR + 4.250% 9.5227% 12/17/28 (b)(c)(d) | | 512,464 | 417,658 |
| Power Stop LLC 1LN, term loan 3 month U.S. LIBOR + 4.750% 9.943% 1/26/29 (b)(c)(d) | | 414,469 | 305,671 |
| Rough Country LLC: | | | |
| 2LN, term loan 3 month U.S. LIBOR + 6.500% 11.8419% 7/28/29 (b)(c)(d) | | 100,000 | 92,125 |
| Tranche B 1LN, term loan 3 month U.S. LIBOR + 3.500% 9.0035% 7/28/28 (b)(c)(d) | | 108,958 | 105,327 |
| Truck Hero, Inc. Tranche B 1LN, term loan 1 month U.S. LIBOR + 3.750% 8.967% 1/29/28 (b)(c)(d) | | 503,582 | 473,141 |
TOTAL AUTOMOTIVE & AUTO PARTS | | | 3,785,691 |
| Banks & Thrifts - 0.7% | | | |
| Citadel Securities LP Tranche B 1LN, term loan CME Term SOFR 1 Month Index + 2.500% 7.717% 2/2/28 (b)(c)(d) | | 763,004 | 761,455 |
| Deerfield Dakota Holding LLC Tranche B 1LN, term loan CME Term SOFR 1 Month Index + 3.750% 8.9919% 4/9/27 (b)(c)(d) | | 415,881 | 402,810 |
| Novae LLC 1LN, term loan CME Term SOFR 3 Month Index + 5.000% 10.3383% 12/22/28 (b)(c)(d) | | 390,063 | 346,180 |
| Superannuation & Investments U.S. LLC 1LN, term loan 1 month U.S. LIBOR + 3.750% 8.967% 12/1/28 (b)(c)(d) | | 142,825 | 141,902 |
| Walker & Dunlop, Inc. Tranche B2 1LN, term loan CME Term SOFR 1 Month Index + 3.000% 8.2025% 12/16/28 (b)(c)(d) | | 104,738 | 104,476 |
TOTAL BANKS & THRIFTS | | | 1,756,823 |
| Broadcasting - 1.5% | | | |
| AppLovin Corp.: | | | |
| Tranche B 1LN, term loan CME Term SOFR 3 Month Index + 3.000% 8.2025% 10/25/28 (b)(c)(d) | | 147,554 | 147,054 |
| Tranche B, term loan CME Term SOFR 1 Month Index + 3.350% 8.4525% 8/15/25 (b)(c)(d) | | 580,723 | 580,090 |
| Diamond Sports Group LLC: | | | |
| 1LN, term loan CME Term SOFR 1 Month Index + 8.000% 15.2534% 8/24/26 (b)(c)(d) | | 198,680 | 151,619 |
| 2LN, term loan CME Term SOFR 1 Month Index + 3.250% 8.0255% 8/24/26 (b)(c)(d) | | 1,616,944 | 51,645 |
| Dotdash Meredith, Inc. Tranche B 1LN, term loan CME Term SOFR 1 Month Index + 4.000% 9.2603% 12/1/28 (b)(c)(d) | | 1,018,967 | 927,260 |
| Nexstar Media, Inc. Tranche B, term loan 1 month U.S. LIBOR + 2.500% 7.717% 9/19/26 (b)(c)(d) | | 351,322 | 350,693 |
| Sinclair Television Group, Inc. Tranche B4 1LN, term loan CME Term SOFR 1 Month Index + 2.750% 9.0034% 4/21/29 (b)(c)(d) | | 271,365 | 204,202 |
| Univision Communications, Inc.: | | | |
| Tranche B 1LN, term loan 1 month U.S. LIBOR + 3.250% 8.443% 1/31/29 (b)(c)(d) | | 1,348,246 | 1,318,922 |
| Tranche C 5LN, term loan 3 month U.S. LIBOR + 2.750% 7.943% 3/15/24 (b)(c)(d) | | 71,418 | 71,468 |
TOTAL BROADCASTING | | | 3,802,953 |
| Building Materials - 3.1% | | | |
| Acproducts Holdings, Inc. Tranche B 1LN, term loan 1 month U.S. LIBOR + 4.250% 9.7535% 5/17/28 (b)(c)(d) | | 1,115,617 | 935,166 |
| APi Group DE, Inc. Tranche B 1LN, term loan: | | | |
| 1 month U.S. LIBOR + 2.500% 7.717% 10/1/26 (b)(c)(d) | | 397,522 | 397,744 |
| 1 month U.S. LIBOR + 2.750% 7.967% 12/16/28 (b)(c)(d) | | 295,753 | 295,983 |
| Emerson Climate Technologies Tranche B 1LN, term loan CME Term SOFR 1 Month Index + 3.000% 8.2637% 5/31/30 (b)(c)(d) | | 617,798 | 617,217 |
| Foley Products Co. LLC 1LN, term loan CME Term SOFR 3 Month Index + 4.750% 10.1419% 12/29/28 (b)(c)(d) | | 234,917 | 231,981 |
| Hunter Douglas, Inc. Tranche B 1LN, term loan CME Term SOFR 3 Month Index + 3.500% 8.6662% 2/25/29 (b)(c)(d) | | 1,885,750 | 1,783,806 |
| Ingersoll-Rand Services Co. Tranche B 1LN, term loan CME Term SOFR 1 Month Index + 1.750% 6.9525% 2/28/27 (b)(c)(d) | | 343,463 | 342,820 |
| Oscar AcquisitionCo LLC 1LN, term loan CME Term SOFR 3 Month Index + 4.500% 9.8419% 4/29/29 (b)(c)(d) | | 704,675 | 687,643 |
| Smyrna Ready Mix LLC Tranche B 1lN, term loan CME Term SOFR 1 Month Index + 4.250% 9.4525% 4/1/29 (b)(c)(d) | | 412,193 | 411,678 |
| Specialty Building Products Holdings LLC Tranche B 1LN, term loan 1 month U.S. LIBOR + 3.250% 8.4525% 10/15/28 (b)(c)(d) | | 198,000 | 188,843 |
| SRS Distribution, Inc. Tranche B 1LN, term loan: | | | |
| 1 month U.S. LIBOR + 3.500% 8.693% 6/4/28 (b)(c)(d) | | 730,213 | 708,124 |
| CME Term SOFR 3 Month Index + 3.500% 8.7025% 6/2/28 (b)(c)(d) | | 237,000 | 230,928 |
| Standard Industries, Inc./New Jersey Tranche B 1LN, term loan CME Term SOFR 1 Month Index + 2.250% 7.6916% 9/22/28 (b)(c)(d) | | 221,964 | 221,655 |
| Traverse Midstream Partners Ll Tranche B, term loan CME TERM SOFR 6 MONTH INDEX + 4.250% 8.9373% 2/16/28 (b)(c)(d) | | 266,201 | 263,539 |
| USIC Holdings, Inc. Tranche B 1LN, term loan 1 month U.S. LIBOR + 3.500% 8.693% 5/14/28 (b)(c)(d) | | 255,450 | 241,400 |
| White Capital Buyer LLC Tranche B 1LN, term loan 1 month U.S. LIBOR + 4.000% 8.8525% 10/19/27 (b)(c)(d) | | 377,755 | 373,872 |
TOTAL BUILDING MATERIALS | | | 7,932,399 |
| Cable/Satellite TV - 1.8% | | | |
| Charter Communication Operating LLC Tranche B2 1LN, term loan CME Term SOFR 3 Month Index + 1.750% 6.7954% 2/1/27 (b)(c)(d) | | 1,194,379 | 1,186,413 |
| Coral-U.S. Co.-Borrower LLC Tranche B, term loan 1 month U.S. LIBOR + 2.250% 7.4433% 1/31/28 (b)(c)(d) | | 985,000 | 969,979 |
| CSC Holdings LLC Tranche B6 LN, term loan CME Term SOFR 1 Month Index + 4.500% 9.647% 1/18/28 (b)(c)(d) | | 1,389,783 | 1,278,600 |
| DIRECTV Financing LLC 1LN, term loan 1 month U.S. LIBOR + 5.000% 10.217% 8/2/27 (b)(c)(d) | | 451,848 | 441,244 |
| Virgin Media Bristol LLC: | | | |
| Tranche N, term loan 1 month U.S. LIBOR + 2.500% 7.6933% 1/31/28 (b)(c)(d) | | 568,534 | 562,991 |
| Tranche Y 1LN, term loan CME Term SOFR 1 Month Index + 3.250% 8.3106% 3/6/31 (b)(c)(d) | | 270,000 | 267,251 |
TOTAL CABLE/SATELLITE TV | | | 4,706,478 |
| Capital Goods - 0.8% | | | |
| Ali Group North America Corp. Tranche B 1LN, term loan CME Term SOFR 1 Month Index + 2.000% 7.217% 7/22/29 (b)(c)(d) | | 379,000 | 378,716 |
| Chart Industries, Inc. 1LN, term loan CME Term SOFR 1 Month Index + 3.750% 8.9406% 3/17/30 (b)(c)(d) | | 584,063 | 582,357 |
| CPM Holdings, Inc.: | | | |
| 2LN, term loan 1 month U.S. LIBOR + 8.250% 13.4204% 11/15/26 (b)(c)(d) | | 67,828 | 67,086 |
| Tranche B 1LN, term loan 1 month U.S. LIBOR + 3.500% 8.6704% 11/15/25 (b)(c)(d) | | 276,948 | 275,979 |
| Griffon Corp. Tranche B 1LN, term loan CME Term SOFR 1 Month Index + 2.750% 7.6387% 1/24/29 (b)(c)(d) | | 373,625 | 371,914 |
| TNT Crane & Rigging LLC 2LN, term loan 3 month U.S. LIBOR + 8.750% 13.9266% 4/16/25 (b)(c)(d)(e) | | 40,928 | 38,833 |
| Vertical U.S. Newco, Inc. Tranche B 1LN, term loan 6 month U.S. LIBOR + 3.500% 8.6023% 7/31/27 (b)(c)(d) | | 259,695 | 257,132 |
TOTAL CAPITAL GOODS | | | 1,972,017 |
| Chemicals - 3.1% | | | |
| ARC Falcon I, Inc. Tranche B 1LN, term loan 1 month U.S. LIBOR + 3.750% 8.9525% 9/30/28 (b)(c)(d) | | 722,219 | 672,870 |
| Aruba Investment Holdings LLC: | | | |
| 2LN, term loan 1 month U.S. LIBOR + 7.750% 12.943% 11/24/28 (b)(c)(d) | | 410,000 | 360,800 |
| Tranche B 1LN, term loan 1 month U.S. LIBOR + 4.000% 9.2025% 11/24/27 (b)(c)(d) | | 333,092 | 320,878 |
| Avient Corp. Tranche B 1LN, term loan CME Term SOFR 1 Month Index + 3.250% 8.2954% 8/29/29 (b)(c)(d) | | 119,644 | 119,969 |
| Bakelite U.S. Holding Ltd. 1LN, term loan CME Term SOFR 3 Month Index + 4.000% 9.3919% 5/27/29 (b)(c)(d) | | 336,600 | 330,147 |
| Consolidated Energy Finance SA: | | | |
| Tranche B 1LN, term loan 3 month U.S. LIBOR + 3.500% 9.0379% 5/7/25 (b)(c)(d)(e) | | 259,700 | 251,909 |
| Tranche B, term loan 3 month U.S. LIBOR + 2.500% 8.0379% 5/7/25 (b)(c)(d) | | 224,260 | 218,485 |
| Cyanco Intermediate 2 Corp. term loan CME Term SOFR 1 Month Index + 4.750% 6/29/28 (c)(d)(f) | | 125,000 | 121,563 |
| Discovery Purchaser Corp. 1LN, term loan CME Term SOFR 3 Month Index + 4.370% 9.6169% 10/4/29 (b)(c)(d) | | 681,799 | 650,907 |
| Groupe Solmax, Inc. Tranche B 1LN, term loan 3 month U.S. LIBOR + 4.750% 10.121% 5/27/28 (b)(c)(d) | | 333,718 | 313,071 |
| Herens U.S. Holdco Corp. Tranche B 1LN, term loan 3 month U.S. LIBOR + 4.000% 9.2669% 7/3/28 (b)(c)(d) | | 215,637 | 181,735 |
| Hexion Holdings Corp. 1LN, term loan CME Term SOFR 3 Month Index + 4.500% 9.7794% 3/15/29 (b)(c)(d) | | 852,934 | 802,687 |
| Hexion, Inc. 2LN, term loan CME Term SOFR 1 Month Index + 7.430% 12.6267% 3/15/30 (b)(c)(d) | | 170,000 | 138,834 |
| ICP Group Tranche B 1LN, term loan 3 month U.S. LIBOR + 3.750% 9.2535% 12/29/27 (b)(c)(d) | | 147,791 | 111,508 |
| INEOS U.S. Finance LLC Tranche B 1LN, term loan CME Term SOFR 1 Month Index + 3.500% 8.7025% 2/10/30 (b)(c)(d) | | 160,000 | 158,942 |
| INEOS U.S. Petrochem LLC: | | | |
| 1LN, term loan CME Term SOFR 1 Month Index + 3.750% 8.9525% 3/1/30 (b)(c)(d) | | 170,000 | 169,575 |
| Tranche B 1LN, term loan CME Term SOFR 1 Month Index + 2.750% 7.967% 1/20/26 (b)(c)(d) | | 537,862 | 536,114 |
| Koppers, Inc. Tranche B 1LN, term loan CME Term SOFR 1 Month Index + 4.000% 9.2% 4/10/30 (b)(c)(d)(e) | | 399,000 | 398,003 |
| Manchester Acquisition Sub LLC Tranche B 1LN, term loan CME Term SOFR 3 Month Index + 5.750% 11.1767% 12/1/26 (b)(c)(d) | | 251,188 | 226,069 |
| Olympus Water U.S. Holding Corp. Tranche B 1LN, term loan: | | | |
| 3 month U.S. LIBOR + 3.750% 9.2535% 11/9/28 (b)(c)(d) | | 512,200 | 491,072 |
| CME Term SOFR 1 Month Index + 5.000% 11/9/28 (c)(d)(f) | | 205,000 | 197,782 |
| Starfruit U.S. Holdco LLC Tranche B 1LN, term loan: | | | |
| CME Term SOFR 1 Month Index + 4.000% 8.9901% 4/3/28 (b)(c)(d) | | 215,000 | 212,760 |
| CME Term SOFR 1 Month Index + 4.000% 9.3181% 4/3/28 (b)(c)(d) | | 472,785 | 467,613 |
| The Chemours Co. LLC Tranche B 1LN, term loan CME Term SOFR 1 Month Index + 1.750% 6.9525% 4/3/25 (b)(c)(d) | | 460,791 | 456,377 |
TOTAL CHEMICALS | | | 7,909,670 |
| Consumer Products - 2.6% | | | |
| 19Th Holdings Golf LLC Tranche B 1LN, term loan CME Term SOFR 1 Month Index + 3.250% 8.5242% 2/7/29 (b)(c)(d) | | 648,450 | 630,618 |
| Aip Rd Buyer Corp.: | | | |
| 1LN, term loan CME Term SOFR 1 Month Index + 4.250% 9.3525% 12/22/28 (b)(c)(d) | | 385,125 | 374,534 |
| Tranche B 1LN, term loan CME Term SOFR 1 Month Index + 5.000% 10.1025% 12/23/28 (b)(c)(d) | | 165,000 | 162,731 |
| BCPE Empire Holdings, Inc. Tranche B 1LN, term loan CME Term SOFR 1 Month Index + 4.750% 9.8325% 12/10/28 (b)(c)(d) | | 715,998 | 713,427 |
| Bombardier Recreational Products, Inc. Tranche B 1LN, term loan: | | | |
| 1 month U.S. LIBOR + 2.000% 7.2025% 5/23/27 (b)(c)(d) | | 122,159 | 121,052 |
| CME Term SOFR 1 Month Index + 3.500% 8.6025% 12/13/29 (b)(c)(d) | | 442,775 | 442,359 |
| CNT Holdings I Corp. Tranche B 1LN, term loan CME Term SOFR 1 Month Index + 3.500% 8.4587% 11/8/27 (b)(c)(d) | | 508,300 | 506,013 |
| Diamond BC BV Tranche B 1LN, term loan 3 month U.S. LIBOR + 2.750% 8.0569% 9/29/28 (b)(c)(d) | | 320,125 | 319,610 |
| Gloves Buyer, Inc. Tranche B 1LN, term loan 1 month U.S. LIBOR + 4.000% 9.217% 1/6/28 (b)(c)(d) | | 117,600 | 111,720 |
| Knowlton Development Corp., Inc. Tranche B 1LN, term loan 1 month U.S. LIBOR + 3.750% 8.967% 12/21/25 (b)(c)(d) | | 386,996 | 376,063 |
| Kronos Acquisition Holdings, Inc. Tranche B 1LN, term loan 3 month U.S. LIBOR + 3.750% 9.2535% 12/22/26 (b)(c)(d) | | 550,980 | 535,999 |
| Mattress Firm, Inc. Tranche B 1LN, term loan 6 month U.S. LIBOR + 4.250% 9.95% 9/24/28 (b)(c)(d) | | 511,359 | 499,429 |
| Petco Health & Wellness Co., Inc. Tranche B 1LN, term loan CME Term SOFR 3 Month Index + 3.250% 8.7535% 3/4/28 (b)(c)(d) | | 194,177 | 192,566 |
| Runner Buyer, Inc. Tranche B 1LN, term loan 3 month U.S. LIBOR + 5.500% 10.693% 10/21/28 (b)(c)(d) | | 335,750 | 257,060 |
| Sweetwater Borrower LLC Tranche B 1LN, term loan 1 month U.S. LIBOR + 4.250% 9.467% 8/5/28 (b)(c)(d) | | 541,138 | 511,376 |
| TGP Holdings III LLC Tranche B 1LN, term loan 1 month U.S. LIBOR + 3.250% 8.4525% 6/29/28 (b)(c)(d) | | 308,973 | 257,149 |
| Windsor Holdings III, LLC Tranche B 1LN, term loan CME Term SOFR 3 Month Index + 4.500% 6/22/30 (c)(d)(f) | | 480,000 | 471,120 |
| Woof Holdings LLC Tranche B 1LN, term loan 3 month U.S. LIBOR + 3.750% 8.9537% 12/21/27 (b)(c)(d) | | 293,250 | 286,652 |
TOTAL CONSUMER PRODUCTS | | | 6,769,478 |
| Containers - 1.8% | | | |
| AOT Packaging Products AcquisitionCo LLC 1LN, term loan 1 month U.S. LIBOR + 3.250% 8.467% 3/3/28 (b)(c)(d) | | 466,014 | 453,040 |
| Berlin Packaging, LLC Tranche B 1LN, term loan: | | | |
| 1 month U.S. LIBOR + 3.250% 8.43% 3/11/28 (b)(c)(d) | | 195,501 | 190,083 |
| 1 month U.S. LIBOR + 3.750% 8.9474% 3/11/28 (b)(c)(d) | | 663,188 | 651,171 |
| Berry Global, Inc. Tranche Z 1LN, term loan 1 month U.S. LIBOR + 1.750% 6.9724% 7/1/26 (b)(c)(d) | | 574,985 | 574,105 |
| Canister International Group, Inc. 1LN, term loan 1 month U.S. LIBOR + 4.750% 9.9525% 12/21/26 (b)(c)(d) | | 120,938 | 120,817 |
| Charter NEX U.S., Inc. 1LN, term loan CME Term SOFR 1 Month Index + 3.750% 8.967% 12/1/27 (b)(c)(d) | | 331,610 | 328,708 |
| Graham Packaging Co., Inc. Tranche B 1LN, term loan 1 month U.S. LIBOR + 3.000% 8.217% 8/4/27 (b)(c)(d) | | 425,742 | 422,749 |
| Kloeckner Pentaplast of America, Inc. Tranche B 1LN, term loan CME TERM SOFR 6 MONTH INDEX + 4.750% 10.1043% 2/9/26 (b)(c)(d) | | 191,100 | 181,067 |
| Pregis TopCo Corp. 1LN, term loan: | | | |
| 3 month U.S. LIBOR + 3.750% 8.943% 8/1/26 (b)(c)(d) | | 98,250 | 97,114 |
| 3 month U.S. LIBOR + 4.000% 8.967% 7/31/26 (b)(c)(d) | | 241,250 | 239,412 |
| Reynolds Consumer Products LLC Tranche B 1LN, term loan CME Term SOFR 1 Month Index + 1.750% 6.9525% 1/30/27 (b)(c)(d) | | 588,170 | 587,370 |
| Reynolds Group Holdings, Inc. Tranche B 1LN, term loan: | | | |
| 1 month U.S. LIBOR + 3.250% 8.467% 2/5/26 (b)(c)(d) | | 157,208 | 157,065 |
| 1 month U.S. LIBOR + 3.250% 8.467% 9/24/28 (b)(c)(d) | | 319,313 | 318,042 |
| Ring Container Technologies Group LLC Tranche B 1LN, term loan 1 month U.S. LIBOR + 3.500% 8.717% 8/12/28 (b)(c)(d) | | 265,950 | 264,554 |
TOTAL CONTAINERS | | | 4,585,297 |
| Diversified Financial Services - 2.2% | | | |
| AlixPartners LLP Tranche B 1LN, term loan 1 month U.S. LIBOR + 2.500% 7.717% 2/4/28 (b)(c)(d) | | 244,375 | 243,642 |
| AVSC Holding Corp. Tranche B2 1LN, term loan 3 month U.S. LIBOR + 5.500% 10.6817% 10/15/26 (b)(c)(d) | | 371,418 | 366,868 |
| BCP Renaissance Parent LLC Tranche B3 1LN, term loan CME Term SOFR 3 Month Index + 3.500% 8.7419% 10/31/26 (b)(c)(d) | | 89,012 | 88,583 |
| Broadstreet Partners, Inc.: | | | |
| Tranche B 1LN, term loan 1 month U.S. LIBOR + 3.250% 8.467% 1/27/27 (b)(c)(d) | | 221,063 | 218,852 |
| Tranche B3 1LN, term loan CME Term SOFR 1 Month Index + 4.000% 9.1603% 1/26/29 (b)(c)(d) | | 235,000 | 233,296 |
| Eagle 4 Ltd. Tranche B 1LN, term loan 1 month U.S. LIBOR + 3.250% 8.7535% 7/12/28 (b)(c)(d) | | 142,827 | 141,577 |
| Finco I LLC Tranche B 1LN, term loan 1 month U.S. LIBOR + 2.500% 8.081% 6/27/25 (b)(c)(d) | | 92,105 | 91,990 |
| Focus Financial Partners LLC: | | | |
| Tranche B 1LN, term loan CME Term SOFR 1 Month Index + 2.500% 7.6025% 6/24/28 (b)(c)(d) | | 392,184 | 387,011 |
| Tranche B5 1LN, term loan CME Term SOFR 1 Month Index + 3.250% 8.3525% 6/30/28 (b)(c)(d) | | 228,275 | 226,246 |
| Fugue Finance LLC Tranche B 1LN, term loan CME Term SOFR 1 Month Index + 4.500% 9.7637% 1/25/28 (b)(c)(d) | | 270,000 | 268,988 |
| GT Polaris, Inc. Tranche B 1LN, term loan 1 month U.S. LIBOR + 3.750% 9.0227% 9/24/27 (b)(c)(d) | | 121,882 | 112,563 |
| HarbourVest Partners LLC Tranche B 1LN, term loan CME Term SOFR 1 Month Index + 2.750% 8.2419% 4/20/30 (b)(c)(d) | | 567,878 | 566,458 |
| Hightower Holding LLC Tranche B 1LN, term loan 3 month U.S. LIBOR + 4.000% 9.1504% 4/21/28 (b)(c)(d) | | 360,127 | 349,774 |
| LSF11 Trinity Bidco, Inc. Tranche B 1LN, term loan CME Term SOFR 1 Month Index + 4.500% 9.647% 4/27/30 (b)(c)(d) | | 100,000 | 99,500 |
| Nexus Buyer LLC: | | | |
| 2LN, term loan 1 month U.S. LIBOR + 6.250% 11.4525% 11/1/29 (b)(c)(d) | | 335,000 | 298,569 |
| Tranche B 1LN, term loan 1 month U.S. LIBOR + 3.750% 8.9525% 11/8/26 (b)(c)(d) | | 260,944 | 251,344 |
| RCS Capital Corp. 1LN, term loan CME Term SOFR 1 Month Index + 4.500% 3/8/30 (c)(d)(f) | | 125,000 | 124,610 |
| TransUnion LLC: | | | |
| Tranche B5 1LN, term loan CME Term SOFR 1 Month Index + 1.750% 7.0034% 11/16/26 (b)(c)(d) | | 166,029 | 165,430 |
| Tranche B6 1LN, term loan CME Term SOFR 1 Month Index + 2.250% 7.467% 12/1/28 (b)(c)(d) | | 575,108 | 573,251 |
| UFC Holdings LLC Tranche B 1LN, term loan 3 month U.S. LIBOR + 2.750% 8.05% 4/29/26 (b)(c)(d) | | 266,294 | 265,812 |
| WH Borrower LLC Tranche B 1LN, term loan: | | | |
| CME Term SOFR 1 Month Index + 5.500% 10.4863% 2/9/27 (b)(c)(d) | | 475,200 | 465,696 |
| CME Term SOFR 1 Month Index + 5.500% 10.4863% 2/15/27 (b)(c)(d) | | 249,375 | 245,011 |
TOTAL DIVERSIFIED FINANCIAL SERVICES | | | 5,785,071 |
| Diversified Media - 0.8% | | | |
| Advantage Sales & Marketing, Inc. Tranche B 1LN, term loan 1 month U.S. LIBOR + 4.500% 9.7189% 10/28/27 (b)(c)(d) | | 343,722 | 322,456 |
| Allen Media LLC Tranche B 1LN, term loan CME Term SOFR 3 Month Index + 5.500% 10.8919% 2/10/27 (b)(c)(d) | | 967,342 | 832,950 |
| Cmg Media Corp. Tranche B 1LN, term loan 1 month U.S. LIBOR + 3.500% 8.8419% 12/17/26 (b)(c)(d) | | 1,070,083 | 956,387 |
TOTAL DIVERSIFIED MEDIA | | | 2,111,793 |
| Energy - 2.7% | | | |
| American Consolidated Natural term loan 21.2681% 9/16/25 (b)(d) | | 19,668 | 19,668 |
| Apro LLC Tranche B 1LN, term loan 3 month U.S. LIBOR + 3.750% 9.2463% 11/14/26 (b)(c)(d) | | 394,478 | 391,125 |
| Array Technologies, Inc. Tranche B 1LN, term loan 3 month U.S. LIBOR + 3.250% 8.6751% 10/14/27 (b)(c)(d) | | 557,520 | 551,248 |
| BW Gas & Convenience Holdings LLC Tranche B 1LN, term loan 1 month U.S. LIBOR + 3.500% 8.693% 3/17/28 (b)(c)(d) | | 176,400 | 170,667 |
| CQP Holdco LP / BIP-V Chinook Holdco LLC Tranche B 1LN, term loan 1 month U.S. LIBOR + 3.500% 8.693% 6/4/28 (b)(c)(d) | | 1,367,902 | 1,364,482 |
| Delek U.S. Holdings, Inc. Tranche B 1LN, term loan CME Term SOFR 1 Month Index + 3.500% 8.7025% 11/19/29 (b)(c)(d) | | 656,825 | 647,110 |
| EG America LLC Tranche B 1LN, term loan: | | | |
| 3 month U.S. LIBOR + 4.000% 9.1645% 2/6/25 (b)(c)(d) | | 402,840 | 395,456 |
| CME Term SOFR 1 Month Index + 5.500% 2/7/28 (c)(d)(f) | | 150,000 | 143,625 |
| EG Finco Ltd. Tranche B, term loan 3 month U.S. LIBOR + 4.000% 9.1645% 2/6/25 (b)(c)(d) | | 370,565 | 363,772 |
| Esdec Solar Group BV Tranche B 1LN, term loan 6 month U.S. LIBOR + 4.750% 9.9596% 8/27/28 (b)(c)(d) | | 383,875 | 380,036 |
| GIP II Blue Holding LP Tranche B 1LN, term loan 3 month U.S. LIBOR + 4.500% 9.717% 9/29/28 (b)(c)(d) | | 1,139,077 | 1,140,706 |
| GIP III Stetson I LP Tranche B, term loan 1 month U.S. LIBOR + 4.250% 9.4525% 7/18/25 (b)(c)(d) | | 471,015 | 469,837 |
| Natgasoline LLC Tranche B, term loan 1 month U.S. LIBOR + 3.500% 8.717% 11/14/25 (b)(c)(d) | | 300,983 | 296,468 |
| Par Petroleum LLC Tranche B 1LN, term loan CME Term SOFR 1 Month Index + 4.250% 9.6137% 2/14/30 (b)(c)(d) | | 185,000 | 181,609 |
| Rockwood Service Corp. Tranche B 1LN, term loan 1 month U.S. LIBOR + 4.000% 9.217% 1/23/27 (b)(c)(d) | | 294,560 | 294,045 |
| Win Waste Innovations Holdings Tranche B 1LN, term loan 3 month U.S. LIBOR + 2.750% 7.967% 3/25/28 (b)(c)(d) | | 264,600 | 225,902 |
TOTAL ENERGY | | | 7,035,756 |
| Entertainment/Film - 0.2% | | | |
| AP Core Holdings II LLC: | | | |
| Tranche B1 1LN, term loan 1 month U.S. LIBOR + 5.500% 10.717% 9/1/27 (b)(c)(d) | | 334,449 | 321,281 |
| Tranche B2 1LN, term loan 1 month U.S. LIBOR + 5.500% 10.717% 9/1/27 (b)(c)(d) | | 105,000 | 101,325 |
TOTAL ENTERTAINMENT/FILM | | | 422,606 |
| Environmental - 0.4% | | | |
| Clean Harbors, Inc. Tranche B 1LN, term loan 1 month U.S. LIBOR + 2.000% 7.193% 10/8/28 (b)(c)(d) | | 225,054 | 224,716 |
| Covanta Holding Corp.: | | | |
| Tranche B 1LN, term loan CME Term SOFR 1 Month Index + 2.500% 7.6025% 11/30/28 (b)(c)(d) | | 242,675 | 240,287 |
| Tranche C 1LN, term loan CME Term SOFR 1 Month Index + 2.500% 7.6025% 11/30/28 (b)(c)(d) | | 18,408 | 18,227 |
| Madison IAQ LLC Tranche B 1LN, term loan 3 month U.S. LIBOR + 3.250% 8.3023% 6/21/28 (b)(c)(d) | | 632,100 | 618,352 |
TOTAL ENVIRONMENTAL | | | 1,101,582 |
| Food & Drug Retail - 0.4% | | | |
| Cardenas Merger Sub, LLC 1LN, term loan CME TERM SOFR 6 MONTH INDEX + 6.750% 12.0919% 8/1/29 (b)(c)(d) | | 452,834 | 447,645 |
| Froneri U.S., Inc. Tranche B 1LN, term loan 1 month U.S. LIBOR + 2.250% 7.4525% 1/29/27 (b)(c)(d) | | 281,488 | 279,588 |
| JP Intermediate B LLC Tranche B, term loan 3 month U.S. LIBOR + 5.500% 10.7727% 11/20/25 (b)(c)(d) | | 316,052 | 142,224 |
| Primary Products Finance LLC 1LN, term loan CME Term SOFR 3 Month Index + 4.000% 9.0401% 4/1/29 (b)(c)(d) | | 247,500 | 246,468 |
TOTAL FOOD & DRUG RETAIL | | | 1,115,925 |
| Food/Beverage/Tobacco - 1.4% | | | |
| 8th Avenue Food & Provisions, Inc. Tranche B 1LN, term loan 1 month U.S. LIBOR + 3.750% 8.967% 10/1/25 (b)(c)(d) | | 118,511 | 108,564 |
| Bengal Debt Merger Sub LLC: | | | |
| 1LN, term loan CME Term SOFR 3 Month Index + 3.250% 8.59% 1/24/29 (b)(c)(d) | | 668,250 | 620,336 |
| 2LN, term loan CME Term SOFR 3 Month Index + 6.000% 11.3419% 1/24/30 (b)(c)(d) | | 170,000 | 133,875 |
| Chobani LLC Tranche B 1LN, term loan 1 month U.S. LIBOR + 3.500% 8.717% 10/23/27 (b)(c)(d) | | 445,169 | 442,199 |
| Del Monte Foods, Inc. Tranche B 1LN, term loan CME Term SOFR 1 Month Index + 4.250% 9.4392% 5/16/29 (b)(c)(d) | | 915,695 | 884,790 |
| Shearer's Foods, Inc. Tranche B 1LN, term loan 1 month U.S. LIBOR + 3.500% 8.717% 9/23/27 (b)(c)(d) | | 446,453 | 440,314 |
| Triton Water Holdings, Inc. Tranche B 1LN, term loan 3 month U.S. LIBOR + 3.500% 8.4919% 3/31/28 (b)(c)(d) | | 886,902 | 856,002 |
TOTAL FOOD/BEVERAGE/TOBACCO | | | 3,486,080 |
| Gaming - 3.9% | | | |
| Caesars Entertainment, Inc. Tranche B 1LN, term loan CME Term SOFR 1 Month Index + 3.250% 8.4525% 1/26/30 (b)(c)(d) | | 2,364,075 | 2,361,924 |
| Fertitta Entertainment LLC NV Tranche B 1LN, term loan CME Term SOFR 1 Month Index + 4.000% 9.1025% 1/27/29 (b)(c)(d) | | 2,905,397 | 2,863,646 |
| Flutter Financing B.V. Tranche B 1LN, term loan CME Term SOFR 1 Month Index + 3.250% 8.7535% 7/4/28 (b)(c)(d) | | 366,230 | 366,479 |
| Golden Entertainment, Inc.: | | | |
| Tranche B 1LN, term loan CME Term SOFR 1 Month Index + 2.750% 7.9392% 5/26/30 (b)(c)(d) | | 565,000 | 563,588 |
| Tranche B, term loan 3 month U.S. LIBOR + 3.000% 8.18% 10/20/24 (b)(c)(d) | | 216,404 | 216,066 |
| GVC Holdings Gibraltar Ltd.: | | | |
| Tranche B2 1LN, term loan CME Term SOFR 1 Month Index + 3.500% 8.4368% 10/31/29 (b)(c)(d) | | 420,550 | 418,552 |
| Tranche B4 1LN, term loan 3 month U.S. LIBOR + 2.250% 7.4368% 3/16/27 (b)(c)(d) | | 196,000 | 195,102 |
| J&J Ventures Gaming LLC 1LN, term loan 3 month U.S. LIBOR + 4.000% 9.5379% 4/26/28 (b)(c)(d) | | 324,225 | 320,273 |
| PCI Gaming Authority 1LN, term loan 1 month U.S. LIBOR + 2.500% 7.717% 5/29/26 (b)(c)(d) | | 138,389 | 138,414 |
| Scientific Games Corp. 1LN, term loan CME Term SOFR 1 Month Index + 3.000% 8.2476% 4/14/29 (b)(c)(d) | | 643,500 | 641,788 |
| Scientific Games Holdings LP term loan CME Term SOFR 3 Month Index + 3.500% 8.4206% 4/4/29 (b)(c)(d) | | 635,200 | 626,784 |
| Stars Group Holdings BV Tranche B 1LN, term loan 3 month U.S. LIBOR + 2.250% 7.7535% 7/21/26 (b)(c)(d) | | 466,312 | 465,906 |
| Station Casinos LLC Tranche B 1LN, term loan 1 month U.S. LIBOR + 2.250% 7.45% 2/7/27 (b)(c)(d) | | 967,219 | 963,321 |
TOTAL GAMING | | | 10,141,843 |
| Healthcare - 5.1% | | | |
| Accelerated Health Systems LLC Tranche B1 LN, term loan CME Term SOFR 3 Month Index + 4.250% 9.6419% 2/15/29 (b)(c)(d) | | 336,600 | 272,141 |
| AHP Health Partners, Inc. Tranche B 1LN, term loan 1 month U.S. LIBOR + 3.500% 8.693% 8/24/28 (b)(c)(d) | | 251,280 | 250,400 |
| Avantor Funding, Inc. Tranche B5 1LN, term loan CME Term SOFR 1 Month Index + 2.250% 7.4525% 11/6/27 (b)(c)(d) | | 351,018 | 350,628 |
| Charlotte Buyer, Inc. Tranche B 1LN, term loan CME Term SOFR 3 Month Index + 5.250% 10.3964% 2/12/28 (b)(c)(d) | | 184,075 | 179,979 |
| Da Vinci Purchaser Corp. Tranche B 1LN, term loan 1 month U.S. LIBOR + 4.000% 9.217% 1/8/27 (b)(c)(d) | | 403,096 | 395,034 |
| Elanco Animal Health, Inc. Tranche B 1LN, term loan 1 month U.S. LIBOR + 1.750% 7.0103% 8/1/27 (b)(c)(d) | | 874,520 | 857,851 |
| Electron BidCo, Inc. Tranche B 1LN, term loan 1 month U.S. LIBOR + 3.000% 8.217% 11/1/28 (b)(c)(d) | | 261,688 | 260,269 |
| Embecta Corp. Tranche B 1LN, term loan CME Term SOFR 1 Month Index + 3.000% 8.2419% 3/31/29 (b)(c)(d) | | 382,016 | 379,789 |
| Gainwell Acquisition Corp. Tranche B 1LN, term loan 3 month U.S. LIBOR + 4.000% 9.3419% 10/1/27 (b)(c)(d) | | 1,782,207 | 1,753,246 |
| HAH Group Holding Co. LLC 1LN, term loan CME Term SOFR 3 Month Index + 5.000% 10.21% 10/29/27 (b)(c)(d) | | 139,785 | 136,115 |
| Horizon Pharma U.S.A., Inc. Tranche B 1LN, term loan 1 month U.S. LIBOR + 1.750% 6.9537% 3/15/28 (b)(c)(d) | | 420,916 | 419,489 |
| ICU Medical, Inc. Tranche B 1LN, term loan CME Term SOFR 1 Month Index + 2.500% 7.8919% 1/6/29 (b)(c)(d) | | 281,438 | 278,007 |
| Insulet Corp. Tranche B 1LN, term loan CME Term SOFR 1 Month Index + 3.250% 8.467% 5/4/28 (b)(c)(d) | | 754,873 | 753,930 |
| Jazz Financing Lux SARL Tranche B 1LN, term loan 1 month U.S. LIBOR + 3.500% 8.693% 5/5/28 (b)(c)(d) | | 1,011,839 | 1,010,209 |
| Maravai Intermediate Holdings LLC Tranche B 1LN, term loan CME Term SOFR 3 Month Index + 3.000% 8.0279% 10/19/27 (b)(c)(d) | | 359,662 | 359,213 |
| MED ParentCo LP: | | | |
| 1LN, term loan 1 month U.S. LIBOR + 4.250% 9.467% 8/31/26 (b)(c)(d) | | 274,547 | 254,079 |
| 2LN, term loan 1 month U.S. LIBOR + 8.250% 13.467% 8/30/27 (b)(c)(d) | | 180,000 | 146,700 |
| Mozart Borrower LP Tranche B 1LN, term loan 1 month U.S. LIBOR + 3.250% 8.467% 10/23/28 (b)(c)(d) | | 691,015 | 682,591 |
| Organon & Co. Tranche B 1LN, term loan 3 month U.S. LIBOR + 3.000% 8.25% 6/2/28 (b)(c)(d) | | 742,454 | 741,296 |
| Packaging Coordinators Midco, Inc. Tranche B 1LN, term loan 3 month U.S. LIBOR + 3.500% 9.0035% 11/30/27 (b)(c)(d) | | 224,825 | 221,277 |
| Pathway Vet Alliance LLC Tranche B 1LN, term loan 3 month U.S. LIBOR + 3.750% 8.943% 3/31/27 (b)(c)(d) | | 711,849 | 626,427 |
| Perrigo Investments LLC Tranche B 1LN, term loan CME Term SOFR 1 Month Index + 2.500% 7.4525% 4/20/29 (b)(c)(d) | | 252,450 | 250,241 |
| Phoenix Newco, Inc. Tranche B 1LN, term loan 1 month U.S. LIBOR + 3.250% 8.467% 11/15/28 (b)(c)(d) | | 960,300 | 951,657 |
| Pluto Acquisition I, Inc. term loan 6 month U.S. LIBOR + 4.000% 9.4757% 6/20/26 (b)(c)(d) | | 343,147 | 279,236 |
| PRA Health Sciences, Inc. Tranche B 1LN, term loan CME Term SOFR 3 Month Index + 2.250% 7.7535% 7/3/28 (b)(c)(d) | | 308,680 | 308,504 |
| Surgery Center Holdings, Inc. 1LN, term loan 1 month U.S. LIBOR + 3.750% 8.8963% 8/31/26 (b)(c)(d) | | 387,621 | 386,873 |
| U.S. Anesthesia Partners, Inc. Tranche B 1LN, term loan 1 month U.S. LIBOR + 4.250% 9.4204% 10/1/28 (b)(c)(d) | | 272,532 | 255,498 |
| U.S. Radiology Specialists, Inc. Tranche B 1LN, term loan 3 month U.S. LIBOR + 5.250% 10.4525% 12/15/27 (b)(c)(d) | | 338,532 | 329,223 |
| Upstream Newco, Inc. 1LN, term loan 1 month U.S. LIBOR + 4.250% 9.7535% 11/20/26 (b)(c)(d) | | 111,357 | 98,829 |
TOTAL HEALTHCARE | | | 13,188,731 |
| Homebuilders/Real Estate - 0.8% | | | |
| Breakwater Energy Tranche B 1LN, term loan 11% 9/1/26 (b)(d)(e) | | 558,469 | 530,546 |
| DTZ U.S. Borrower LLC Tranche B 1LN, term loan: | | | |
| 1 month U.S. LIBOR + 2.750% 7.967% 8/21/25 (b)(c)(d) | | 341,303 | 337,890 |
| CME Term SOFR 1 Month Index + 3.250% 8.4525% 1/24/30 (b)(c)(d) | | 430,504 | 416,513 |
| Fluidra Finco SL Tranche B 1LN, term loan CME Term SOFR 1 Month Index + 2.000% 7.2025% 1/27/29 (b)(c)(d) | | 264,204 | 262,498 |
| Ryan Specialty Group LLC Tranche B 1LN, term loan CME Term SOFR 1 Month Index + 3.000% 8.2025% 9/1/27 (b)(c)(d) | | 442,634 | 441,664 |
TOTAL HOMEBUILDERS/REAL ESTATE | | | 1,989,111 |
| Hotels - 2.1% | | | |
| ASP LS Acquisition Corp. Tranche B 1LN, term loan 6 month U.S. LIBOR + 4.500% 9.693% 5/7/28 (b)(c)(d) | | 393,000 | 322,260 |
| Carnival Finance LLC Tranche B 1LN, term loan 6 month U.S. LIBOR + 3.250% 8.467% 10/18/28 (b)(c)(d) | | 1,002,696 | 992,669 |
| Four Seasons Hotels Ltd. Tranche B 1LN, term loan CME Term SOFR 1 Month Index + 3.250% 8.4525% 11/30/29 (b)(c)(d) | | 623,842 | 624,622 |
| Hilton Grand Vacations Borrower LLC Tranche B 1LN, term loan 1 month U.S. LIBOR + 3.000% 8.217% 8/2/28 (b)(c)(d) | | 1,655,455 | 1,649,247 |
| Marriott Ownership Resorts, Inc. Tranche B 1LN, term loan 1 month U.S. LIBOR + 1.750% 6.943% 8/31/25 (b)(c)(d) | | 635,145 | 632,922 |
| Oravel Stays Singapore Pte Ltd. Tranche B 1LN, term loan 3 month U.S. LIBOR + 8.250% 13.79% 6/23/26 (b)(c)(d) | | 176,400 | 148,838 |
| Playa Resorts Holding BV Tranche B 1LN, term loan CME Term SOFR 1 Month Index + 4.250% 9.3406% 1/5/29 (b)(c)(d) | | 278,600 | 277,583 |
| Travelport Finance Luxembourg SARL 1LN, term loan: | | | |
| 3 month U.S. LIBOR + 8.750% 13.4525% 2/28/25 (b)(c)(d) | | 456,752 | 447,905 |
| U.S. Secured Overnight Fin. Rate (SOFR) Index + 6.750% 13.3646% 5/29/26 (b)(c)(d)(e) | | 471,240 | 292,169 |
| Wyndham Hotels & Resorts, Inc. Tranche B 1LN, term loan CME Term SOFR 1 Month Index + 2.250% 7.4525% 5/25/30 (b)(c)(d) | | 142,668 | 142,591 |
TOTAL HOTELS | | | 5,530,806 |
| Insurance - 4.9% | | | |
| Acrisure LLC Tranche B 1LN, term loan: | | | |
| 1 month U.S. LIBOR + 3.500% 8.693% 2/15/27 (b)(c)(d) | | 1,646,514 | 1,595,357 |
| 1 month U.S. LIBOR + 4.250% 9.443% 2/15/27 (b)(c)(d) | | 513,452 | 502,115 |
| CME Term SOFR 1 Month Index + 5.750% 10.8227% 2/15/27 (b)(c)(d) | | 733,800 | 735,635 |
| Alliant Holdings Intermediate LLC: | | | |
| Tranche B3 1LN, term loan 1 month U.S. LIBOR + 3.500% 8.6504% 11/12/27 (b)(c)(d) | | 491,250 | 487,914 |
| Tranche B5 1LN, term loan CME Term SOFR 1 Month Index + 3.500% 8.647% 11/6/27 (b)(c)(d) | | 403,908 | 401,048 |
| AmWINS Group, Inc. Tranche B 1LN, term loan: | | | |
| 1 month U.S. LIBOR + 2.250% 7.443% 2/19/28 (b)(c)(d) | | 537,457 | 532,018 |
| CME Term SOFR 1 Month Index + 2.750% 7.9525% 2/19/28 (b)(c)(d) | | 169,150 | 168,551 |
| Amynta Agency Borrower, Inc. Tranche B 1LN, term loan CME Term SOFR 1 Month Index + 5.000% 10.2025% 2/28/28 (b)(c)(d) | | 270,000 | 262,070 |
| AssuredPartners, Inc.: | | | |
| 1 LN, term loan CME Term SOFR 1 Month Index + 3.500% 8.6025% 2/13/27 (b)(c)(d) | | 256,750 | 254,183 |
| Tranche B 1LN, term loan: | | | |
1 month U.S. LIBOR + 3.500% 8.717% 2/13/27 (b)(c)(d) | | 14,700 | 14,541 |
1 month U.S. LIBOR + 3.500% 8.717% 2/13/27 (b)(c)(d) | | 361,875 | 358,557 |
| Asurion LLC: | | | |
| Tranche B11 1LN, term loan CME Term SOFR 1 Month Index + 4.250% 9.4525% 8/19/28 (b)(c)(d) | | 139,650 | 132,581 |
| Tranche B3 2LN, term loan 1 month U.S. LIBOR + 5.250% 10.5053% 1/31/28 (b)(c)(d) | | 835,000 | 708,189 |
| Tranche B4 2LN, term loan 1 month U.S. LIBOR + 5.250% 10.467% 1/20/29 (b)(c)(d) | | 1,390,000 | 1,162,388 |
| Tranche B8 1LN, term loan 1 month U.S. LIBOR + 3.250% 8.7879% 12/23/26 (b)(c)(d) | | 1,474,509 | 1,417,741 |
| Tranche B9 1LN, term loan 1 month U.S. LIBOR + 3.250% 8.7879% 7/31/27 (b)(c)(d) | | 562,553 | 531,303 |
| HUB International Ltd. Tranche B 1LN, term loan: | | | |
| CME Term SOFR 1 Month Index + 4.000% 9.0722% 11/10/29 (b)(c)(d) | | 209,475 | 209,152 |
| CME Term SOFR 1 Month Index + 4.250% 6/8/30 (c)(d)(f) | | 1,836,517 | 1,839,841 |
| USI, Inc. 1LN, term loan: | | | |
| 1 month U.S. LIBOR + 3.250% 8.7879% 12/2/26 (b)(c)(d) | | 459,495 | 458,847 |
| CME Term SOFR 1 Month Index + 3.750% 8.9919% 11/22/29 (b)(c)(d) | | 901,463 | 899,209 |
TOTAL INSURANCE | | | 12,671,240 |
| Leisure - 2.3% | | | |
| Alterra Mountain Co. Tranche B 1LN, term loan: | | | |
| 1 month U.S. LIBOR + 3.500% 8.693% 8/17/28 (b)(c)(d) | | 126,128 | 125,655 |
| CME Term SOFR 1 Month Index + 3.750% 9.0034% 5/9/30 (b)(c)(d) | | 390,000 | 389,025 |
| Arcis Golf LLC: | | | |
| Tranche B 1LN, term loan 1 month U.S. LIBOR + 4.250% 9.467% 11/24/28 (b)(c)(d) | | 247,374 | 247,683 |
| Tranche DD 1LN, term loan CME Term SOFR 1 Month Index + 4.250% 11/24/28 (c)(d)(f) | | 62,000 | 62,078 |
| City Football Group Ltd. Tranche B 1LN, term loan 1 month U.S. LIBOR + 3.000% 8.2727% 7/21/28 (b)(c)(d) | | 793,629 | 777,756 |
| ClubCorp Holdings, Inc. Tranche B 1LN, term loan 3 month U.S. LIBOR + 2.750% 8.2879% 9/18/24 (b)(c)(d) | | 189,497 | 181,375 |
| Crown Finance U.S., Inc.: | | | |
| 1LN, term loan CME Term SOFR 1 Month Index + 10.000% 15.1943% 9/9/23 (b)(c)(d) | | 285,112 | 287,667 |
| Tranche B 1LN, term loan 3 month U.S. LIBOR + 2.500% 3.9997% 2/28/25 (b)(c)(d) | | 514,179 | 153,889 |
| Delta 2 SARL Tranche B 1LN, term loan CME Term SOFR 1 Month Index + 3.000% 8.1025% 1/15/30 (b)(c)(d) | | 765,000 | 764,618 |
| Equinox Holdings, Inc.: | | | |
| Tranche 2LN, term loan 3 month U.S. LIBOR + 7.000% 12.731% 9/8/24 (b)(c)(d) | | 115,000 | 85,770 |
| Tranche B-1, term loan 3 month U.S. LIBOR + 3.000% 8.73% 3/8/24 (b)(c)(d) | | 594,601 | 550,678 |
| Herschend Entertainment Co. LLC Tranche B 1LN, term loan 1 month U.S. LIBOR + 3.750% 8.967% 8/27/28 (b)(c)(d) | | 142,463 | 142,581 |
| Lids Holdings, Inc. 1LN, term loan CME Term SOFR 3 Month Index + 5.500% 10.8681% 12/14/26 (b)(c)(d)(e) | | 296,563 | 275,803 |
| SeaWorld Parks & Entertainment, Inc. Tranche B 1LN, term loan 1 month U.S. LIBOR + 3.000% 8.25% 8/25/28 (b)(c)(d) | | 221,063 | 220,165 |
| SP PF Buyer LLC Tranche B 1LN, term loan 1 month U.S. LIBOR + 4.500% 9.717% 12/21/25 (b)(c)(d) | | 220,730 | 158,926 |
| Topgolf Callaway Brands Corp. Tranche B 1LN, term loan CME Term SOFR 1 Month Index + 3.500% 8.7025% 3/9/30 (b)(c)(d) | | 668,325 | 667,209 |
| United PF Holdings LLC: | | | |
| 1LN, term loan 3 month U.S. LIBOR + 4.000% 9.217% 12/30/26 (b)(c)(d) | | 820,067 | 607,670 |
| 2LN, term loan 3 month U.S. LIBOR + 8.500% 13.6139% 12/30/27 (b)(c)(d) | | 100,000 | 70,000 |
| Tranche B 1LN, term loan 1 month U.S. LIBOR + 8.500% 12.717% 12/30/26 (b)(c)(d) | | 82,663 | 61,584 |
TOTAL LEISURE | | | 5,830,132 |
| Metals/Mining - 0.1% | | | |
| U.S. Silica Co. Tranche B 1LN, term loan CME Term SOFR 1 Month Index + 4.750% 9.9525% 3/23/30 (b)(c)(d) | | 271,932 | 269,552 |
| Paper - 0.7% | | | |
| Ahlstrom-Munksjo OYJ 1LN, term loan 3 month U.S. LIBOR + 3.750% 9.2879% 2/4/28 (b)(c)(d) | | 164,235 | 153,149 |
| Clydesdale Acquisition Holdings, Inc. 1LN, term loan CME Term SOFR 1 Month Index + 4.170% 9.3775% 4/13/29 (b)(c)(d) | | 1,623,600 | 1,595,723 |
TOTAL PAPER | | | 1,748,872 |
| Publishing/Printing - 0.5% | | | |
| Harland Clarke Holdings Corp. 1LN, term loan CME Term SOFR 1 Month Index + 7.750% 13.2535% 6/16/26 (b)(c)(d) | | 171,276 | 149,928 |
| Learning Care Group (U.S.) No 2, Inc. Tranche B 1LN, term loan: | | | |
| 1 month U.S. LIBOR + 8.500% 13.925% 3/13/25 (b)(c)(d) | | 204,225 | 203,970 |
| 3 month U.S. LIBOR + 3.250% 8.55% 3/13/25 (b)(c)(d) | | 257,423 | 256,859 |
| MJH Healthcare Holdings LLC Tranche B 1LN, term loan CME Term SOFR 1 Month Index + 3.500% 8.7025% 1/28/29 (b)(c)(d) | | 385,125 | 381,274 |
| RLG Holdings LLC Tranche B 1LN, term loan 1 month U.S. LIBOR + 4.250% 9.467% 7/8/28 (b)(c)(d) | | 201,925 | 191,526 |
TOTAL PUBLISHING/PRINTING | | | 1,183,557 |
| Railroad - 0.7% | | | |
| AIT Worldwide Logistics Holdings, Inc. 1LN, term loan 3 month U.S. LIBOR + 4.750% 9.9317% 4/6/28 (b)(c)(d) | | 348,788 | 337,103 |
| Echo Global Logistics, Inc. 1LN, term loan 1 month U.S. LIBOR + 3.500% 8.7025% 11/23/28 (b)(c)(d) | | 495,746 | 479,426 |
| Genesee & Wyoming, Inc. 1LN, term loan CME Term SOFR 3 Month Index + 2.000% 7.3419% 12/30/26 (b)(c)(d) | | 462,061 | 461,340 |
| Wwex Unified Topco Holdings LLC 1LN, term loan CME Term SOFR 1 Month Index + 4.250% 9.5035% 7/26/28 (b)(c)(d) | | 553,829 | 524,986 |
TOTAL RAILROAD | | | 1,802,855 |
| Restaurants - 1.1% | | | |
| Burger King Worldwide, Inc. Tranche B 1LN, term loan 1 month U.S. LIBOR + 1.750% 6.943% 11/19/26 (b)(c)(d) | | 482,500 | 478,679 |
| Dave & Buster's, Inc. Tranche B 1LN, term loan: | | | |
| CME Term SOFR 1 Month Index + 3.750% 6/29/29 (c)(d)(f) | | 135,000 | 134,325 |
| CME Term SOFR 1 Month Index + 5.000% 10.3125% 6/29/29 (b)(c)(d) | | 248,125 | 247,971 |
| Flynn Restaurant Group LP Tranche B 1LN, term loan 1 month U.S. LIBOR + 4.250% 9.467% 11/22/28 (b)(c)(d) | | 128,050 | 126,321 |
| Pacific Bells LLC Tranche B 1LN, term loan CME Term SOFR 3 Month Index + 4.500% 10.0035% 10/20/28 (b)(c)(d) | | 264,358 | 258,659 |
| PFC Acquisition Corp. Tranche B 1LN, term loan 3 month U.S. LIBOR + 6.250% 11.443% 3/1/26 (b)(c)(d) | | 359,063 | 341,468 |
| Restaurant Technologies, Inc. Tranche B 1LN, term loan CME Term SOFR 3 Month Index + 4.250% 9.4919% 4/1/29 (b)(c)(d) | | 506,156 | 492,657 |
| Whatabrands LLC Tranche B 1LN, term loan 1 month U.S. LIBOR + 3.250% 8.467% 8/3/28 (b)(c)(d) | | 873,572 | 867,291 |
TOTAL RESTAURANTS | | | 2,947,371 |
| Services - 10.2% | | | |
| ABG Intermediate Holdings 2 LLC: | | | |
| Tranche B 2LN, term loan CME Term SOFR 1 Month Index + 6.000% 11.2025% 12/20/29 (b)(c)(d) | | 180,000 | 166,500 |
| Tranche B1 LN, term loan CME Term SOFR 1 Month Index + 3.500% 8.7025% 12/21/28 (b)(c)(d) | | 1,008,066 | 1,002,269 |
| Tranche B2 1LN, term loan CME Term SOFR 1 Month Index + 4.000% 9.2025% 12/21/28 (b)(c)(d) | | 1,039,259 | 1,035,102 |
| Tranche DD 1LN, term loan CME Term SOFR 1 Month Index + 4.000% 12/21/28 (c)(d)(g) | | 340,741 | 339,378 |
| AEA International Holdings Luxembourg SARL Tranche B 1LN, term loan 3 month U.S. LIBOR + 3.750% 9.2535% 9/7/28 (b)(c)(d) | | 157,600 | 157,009 |
| All-Star Bidco AB: | | | |
| Tranche B 1LN, term loan 3 month U.S. LIBOR + 3.900% 8.95% 11/16/28 (b)(c)(d) | | 133,313 | 132,646 |
| Tranche B1 1LN, term loan 3 month U.S. LIBOR + 3.500% 8.55% 11/16/28 (b)(c)(d) | | 427,048 | 420,378 |
| Allied Universal Holdco LLC Tranche B 1LN, term loan: | | | |
| CME Term SOFR 1 Month Index + 3.750% 8.9525% 5/14/28 (b)(c)(d) | | 733,600 | 712,003 |
| CME Term SOFR 1 Month Index + 4.750% 9.8805% 5/14/28 (b)(c)(d) | | 210,000 | 204,838 |
| APX Group, Inc. Tranche B 1LN, term loan 1 month U.S. LIBOR + 3.250% 8.46% 7/9/28 (b)(c)(d) | | 546,286 | 545,515 |
| ARAMARK Corp. Tranche B 1LN, term loan CME Term SOFR 1 Month Index + 2.750% 7.9138% 6/13/30 (b)(c)(d) | | 121,550 | 121,398 |
| Aramark Services, Inc.: | | | |
| Tranche B 1LN, term loan 1 month U.S. LIBOR + 2.500% 7.9138% 4/6/28 (b)(c)(d) | | 90,000 | 89,775 |
| Tranche B-4 1LN, term loan 1 month U.S. LIBOR + 1.750% 6.967% 1/15/27 (b)(c)(d) | | 116,563 | 115,215 |
| Archkey Holdings, Inc. Tranche B 1LN, term loan CME Term SOFR 1 Month Index + 5.250% 10.6075% 6/30/28 (b)(c)(d) | | 157,200 | 155,235 |
| Ascend Learning LLC: | | | |
| 2LN, term loan 1 month U.S. LIBOR + 5.750% 10.9525% 12/10/29 (b)(c)(d) | | 85,000 | 71,896 |
| Tranche B 1LN, term loan 1 month U.S. LIBOR + 3.500% 8.7025% 12/10/28 (b)(c)(d) | | 1,056,645 | 991,102 |
| Asurion LLC 1LN, term loan CME Term SOFR 3 Month Index + 4.000% 9.2025% 8/19/28 (b)(c)(d) | | 1,458,402 | 1,378,642 |
| Avis Budget Group, Inc. 1LN, term loan CME Term SOFR 1 Month Index + 3.500% 8.7025% 3/16/29 (b)(c)(d) | | 202,438 | 202,606 |
| Brand Energy & Infrastructure Services, Inc. Tranche B, term loan 3 month U.S. LIBOR + 4.250% 9.42% 6/21/24 (b)(c)(d) | | 1,256,683 | 1,239,140 |
| Cast & Crew Payroll LLC Tranche B 1LN, term loan: | | | |
| 1 month U.S. LIBOR + 3.500% 8.693% 2/7/26 (b)(c)(d) | | 680,087 | 667,764 |
| CME Term SOFR 1 Month Index + 3.750% 8.967% 12/30/28 (b)(c)(d) | | 329,975 | 321,808 |
| CHG Healthcare Services, Inc. 1LN, term loan 1 month U.S. LIBOR + 3.250% 8.443% 9/30/28 (b)(c)(d) | | 156,928 | 156,026 |
| Congruex Group LLC Tranche B 1LN, term loan CME Term SOFR 3 Month Index + 5.750% 10.9435% 5/3/29 (b)(c)(d)(e) | | 371,250 | 359,184 |
| CoreLogic, Inc. Tranche B 1LN, term loan 1 month U.S. LIBOR + 3.500% 8.75% 6/2/28 (b)(c)(d) | | 1,039,784 | 937,365 |
| EAB Global, Inc. Tranche B 1LN, term loan 3 month U.S. LIBOR + 3.500% 8.87% 8/16/28 (b)(c)(d) | | 207,375 | 204,719 |
| EmployBridge LLC Tranche B 1LN, term loan 3 month U.S. LIBOR + 4.750% 9.93% 7/19/28 (b)(c)(d) | | 540,375 | 434,035 |
| Ensemble RCM LLC 1LN, term loan CME Term SOFR 1 Month Index + 3.750% 8.8954% 8/1/26 (b)(c)(d) | | 532,492 | 531,826 |
| Filtration Group Corp.: | | | |
| 1LN, term loan CME Term SOFR 1 Month Index + 4.250% 9.4537% 10/19/28 (b)(c)(d) | | 322,154 | 321,751 |
| Tranche B 1LN, term loan 1 month U.S. LIBOR + 3.500% 8.717% 10/21/28 (b)(c)(d) | | 260,363 | 259,154 |
| Finastra U.S.A., Inc.: | | | |
| Tranche 2LN, term loan 3 month U.S. LIBOR + 7.250% 12.981% 6/13/25 (b)(c)(d) | | 340,000 | 306,469 |
| Tranche B 1LN, term loan 3 month U.S. LIBOR + 3.500% 9.231% 6/13/24 (b)(c)(d) | | 1,088,541 | 1,044,433 |
| Flexera Software LLC Tranche B 1LN, term loan 1 month U.S. LIBOR + 3.750% 8.967% 3/3/28 (b)(c)(d) | | 252,513 | 248,488 |
| Franchise Group, Inc. Tranche B 1LN, term loan: | | | |
| CME Term SOFR 3 Month Index + 4.750% 9.9703% 3/10/26 (b)(c)(d) | | 600,004 | 549,003 |
| CME Term SOFR 3 Month Index + 4.750% 10.0929% 3/10/26 (b)(c)(d) | | 195,000 | 179,888 |
| Galaxy U.S. Opco, Inc. 1LN, term loan CME Term SOFR 1 Month Index + 4.750% 9.8525% 4/29/29 (b)(c)(d) | | 406,925 | 381,492 |
| GEMS MENASA Cayman Ltd. Tranche B 1LN, term loan 6 month U.S. LIBOR + 5.000% 10.5254% 7/30/26 (b)(c)(d) | | 262,878 | 262,933 |
| Greeneden U.S. Holdings II LLC Tranche B 1LN, term loan 1 month U.S. LIBOR + 4.000% 9.193% 12/1/27 (b)(c)(d) | | 402,355 | 400,918 |
| Indy U.S. Bidco LLC Tranche B 1LN, term loan 1 month U.S. LIBOR + 3.750% 8.8525% 3/5/28 (b)(c)(d) | | 200,405 | 185,375 |
| Ion Trading Finance Ltd. Tranche B 1LN, term loan 3 month U.S. LIBOR + 4.750% 10.0919% 3/26/28 (b)(c)(d) | | 786,000 | 769,439 |
| KNS Acquisitions, Inc. Tranche B 1LN, term loan 6 month U.S. LIBOR + 6.250% 11.467% 4/21/27 (b)(c)(d) | | 350,694 | 284,648 |
| KUEHG Corp. 1LN, term loan CME Term SOFR 1 Month Index + 5.000% 10.2419% 6/12/30 (b)(c)(d) | | 1,165,000 | 1,151,894 |
| Maverick Purchaser Sub LLC: | | | |
| Tranche B 1LN, term loan: | | | |
1 month U.S. LIBOR + 4.000% 9.217% 1/23/27 (b)(c)(d) | | 455,900 | 447,922 |
CME Term SOFR 1 Month Index + 4.000% 9.147% 2/15/29 (b)(c)(d) | | 638,550 | 622,586 |
| Tranche B 2LN, term loan 1 month U.S. LIBOR + 8.750% 13.967% 1/31/28 (b)(c)(d) | | 290,000 | 261,725 |
| Neptune BidCo U.S., Inc. Tranche B 1LN, term loan CME Term SOFR 1 Month Index + 5.000% 10.0044% 4/11/29 (b)(c)(d) | | 1,475,000 | 1,295,050 |
| Optiv Security, Inc. Tranche B 1LN, term loan CME Term SOFR 1 Month Index + 5.250% 10.3384% 8/14/26 (b)(c)(d) | | 230,000 | 218,597 |
| Pilot Travel Centers LLC Tranche B 1LN, term loan CME Term SOFR 1 Month Index + 2.000% 7.2025% 8/4/28 (b)(c)(d) | | 635,375 | 633,787 |
| PowerTeam Services LLC Tranche B 1LN, term loan 3 month U.S. LIBOR + 3.500% 8.8419% 3/6/25 (b)(c)(d) | | 348,182 | 303,615 |
| Sabert Corp. Tranche B 1LN, term loan 1 month U.S. LIBOR + 4.500% 9.717% 12/10/26 (b)(c)(d) | | 362,208 | 361,303 |
| Sedgwick Claims Management Services, Inc. Tranche B 1LN, term loan CME Term SOFR 1 Month Index + 3.750% 8.8525% 2/24/28 (b)(c)(d) | | 164,588 | 163,430 |
| Sitel Worldwide Corp. Tranche B 1LN, term loan 1 month U.S. LIBOR + 3.750% 8.95% 8/27/28 (b)(c)(d) | | 169,569 | 165,470 |
| Spin Holdco, Inc. Tranche B 1LN, term loan 3 month U.S. LIBOR + 4.000% 9.2303% 3/4/28 (b)(c)(d) | | 1,790,533 | 1,528,346 |
| SuperMoose Borrower LLC Tranche B 1LN, term loan 3 month U.S. LIBOR + 3.750% 9.1419% 8/29/25 (b)(c)(d) | | 278,824 | 259,585 |
| Uber Technologies, Inc. Tranche B 1LN, term loan CME Term SOFR 1 Month Index + 3.000% 8.02% 3/3/30 (b)(c)(d) | | 577,100 | 576,638 |
| Vaco Holdings LLC 1LN, term loan CME Term SOFR 1 Month Index + 5.000% 10.5867% 1/21/29 (b)(c)(d) | | 91,455 | 83,282 |
| WMB Holdings, Inc. Tranche B 1LN, term loan CME Term SOFR 1 Month Index + 3.250% 8.4525% 11/3/29 (b)(c)(d) | | 219,650 | 219,870 |
TOTAL SERVICES | | | 26,180,465 |
| Specialty Retailing - 0.1% | | | |
| New SK Holdco Sub LLC 1LN, term loan CME Term SOFR 1 Month Index + 8.350% 13.4271% 6/30/27 (b)(c)(d) | | 312,211 | 270,063 |
| Steel - 0.1% | | | |
| JMC Steel Group, Inc. 1LN, term loan 1 month U.S. LIBOR + 2.000% 7.197% 1/24/27 (b)(c)(d) | | 383,100 | 379,909 |
| Super Retail - 3.9% | | | |
| Academy Ltd. Tranche B 1LN, term loan 1 month U.S. LIBOR + 3.750% 8.943% 11/6/27 (b)(c)(d) | | 350,351 | 350,789 |
| At Home Group, Inc. Tranche B 1LN, term loan 3 month U.S. LIBOR + 4.250% 9.4266% 7/24/28 (b)(c)(d) | | 429,193 | 269,451 |
| Bass Pro Group LLC Tranche B 1LN, term loan 1 month U.S. LIBOR + 3.750% 8.943% 3/5/28 (b)(c)(d) | | 6,876,263 | 6,816,081 |
| BJ's Wholesale Club, Inc. Tranche B 1LN, term loan CME Term SOFR 1 Month Index + 2.750% 7.8907% 2/3/27 (b)(c)(d) | | 245,000 | 245,034 |
| Empire Today LLC Tranche B 1LN, term loan 1 month U.S. LIBOR + 5.000% 10.1463% 4/1/28 (b)(c)(d) | | 535,439 | 423,334 |
| Hanesbrands, Inc. Tranche B 1LN, term loan CME Term SOFR 1 Month Index + 3.750% 8.8525% 3/8/30 (b)(c)(d) | | 189,525 | 189,999 |
| Harbor Freight Tools U.S.A., Inc. Tranche B 1LN, term loan 1 month U.S. LIBOR + 2.750% 7.967% 10/19/27 (b)(c)(d) | | 258,922 | 255,074 |
| LBM Acquisition LLC Tranche B 1LN, term loan 1 month U.S. LIBOR + 3.750% 8.9525% 12/18/27 (b)(c)(d) | | 303,174 | 290,574 |
| Michaels Companies, Inc. 1LN, term loan 3 month U.S. LIBOR + 4.250% 9.7535% 4/15/28 (b)(c)(d) | | 534,268 | 471,893 |
| Red Ventures LLC Tranche B 1LN, term loan CME Term SOFR 1 Month Index + 3.000% 8.1025% 3/3/30 (b)(c)(d) | | 375,024 | 371,607 |
| RH Tranche B2 1LN, term loan CME Term SOFR 1 Month Index + 3.250% 8.4525% 10/20/28 (b)(c)(d) | | 496,250 | 478,261 |
TOTAL SUPER RETAIL | | | 10,162,097 |
| Technology - 15.7% | | | |
| A&V Holdings Midco LLC Tranche B 1LN, term loan 3 month U.S. LIBOR + 5.370% 10.2611% 3/10/27 (b)(c)(d) | | 213,946 | 209,667 |
| Acuris Finance U.S., Inc. 1LN, term loan CME Term SOFR 3 Month Index + 4.000% 9.3919% 2/16/28 (b)(c)(d) | | 270,573 | 266,804 |
| AI Aqua Merger Sub, Inc. Tranche B 1LN, term loan CME Term SOFR 1 Month Index + 3.750% 8.8964% 7/30/28 (b)(c)(d) | | 532,589 | 522,204 |
| Alliance Laundry Systems LLC Tranche B 1LN, term loan 3 month U.S. LIBOR + 3.500% 8.5587% 10/8/27 (b)(c)(d) | | 199,970 | 199,220 |
| Anastasia Parent LLC Tranche B, term loan 3 month U.S. LIBOR + 3.750% 9.2535% 8/10/25 (b)(c)(d) | | 952,500 | 727,739 |
| Applied Systems, Inc. Tranche B 1LN, term loan CME Term SOFR 1 Month Index + 4.500% 9.7419% 9/19/26 (b)(c)(d) | | 503,738 | 504,211 |
| Aptean, Inc. 1LN, term loan 3 month U.S. LIBOR + 4.250% 9.4525% 4/23/26 (b)(c)(d) | | 373,498 | 365,935 |
| Athenahealth Group, Inc.: | | | |
| Tranche B 1LN, term loan CME Term SOFR 1 Month Index + 3.500% 8.5892% 2/15/29 (b)(c)(d) | | 1,673,059 | 1,608,228 |
| Tranche DD 1LN, term loan CME Term SOFR 1 Month Index + 3.500% 2/15/29 (c)(d)(g) | | 205,531 | 197,567 |
| AZZ, Inc. Tranche B 1LN, term loan CME Term SOFR 1 Month Index + 4.250% 9.4525% 5/13/29 (b)(c)(d) | | 372,475 | 372,360 |
| Byju's Alpha, Inc. Tranche B 1LN, term loan 3 month U.S. LIBOR + 8.000% 15.25% 11/24/26 (b)(c)(d) | | 438,921 | 273,592 |
| Camelot Finance SA: | | | |
| Tranche B 1LN, term loan 1 month U.S. LIBOR + 3.000% 8.217% 10/31/26 (b)(c)(d) | | 618,328 | 617,042 |
| Tranche B, term loan 1 month U.S. LIBOR + 3.000% 8.217% 10/31/26 (b)(c)(d) | | 630,152 | 628,892 |
| Central Parent, Inc. 1LN, term loan CME Term SOFR 3 Month Index + 4.250% 9.4919% 7/6/29 (b)(c)(d) | | 645,266 | 643,034 |
| Ceridian HCM Holding, Inc. Tranche B, term loan 1 month U.S. LIBOR + 2.500% 7.9757% 4/30/25 (b)(c)(d) | | 412,859 | 412,343 |
| Cloud Software Group, Inc. Tranche B 1LN, term loan CME Term SOFR 3 Month Index + 4.500% 9.8419% 3/30/29 (b)(c)(d) | | 917,700 | 856,902 |
| Coherent Corp. Tranche B 1LN, term loan CME Term SOFR 1 Month Index + 2.750% 7.967% 7/1/29 (b)(c)(d) | | 999,150 | 995,404 |
| CommScope, Inc. Tranche B 1LN, term loan 1 month U.S. LIBOR + 3.250% 8.467% 4/4/26 (b)(c)(d) | | 971,290 | 928,553 |
| ConnectWise LLC Tranche B 1LN, term loan 3 month U.S. LIBOR + 3.500% 8.693% 9/30/28 (b)(c)(d) | | 679,650 | 660,538 |
| Constant Contact, Inc. Tranche B 1LN, term loan 1 month U.S. LIBOR + 4.000% 9.1979% 2/10/28 (b)(c)(d) | | 305,113 | 290,431 |
| DCert Buyer, Inc.: | | | |
| 1LN, term loan CME Term SOFR 1 Month Index + 4.000% 9.2637% 10/16/26 (b)(c)(d) | | 938,633 | 928,956 |
| Tranche B 2LN, term loan 1 month U.S. LIBOR + 7.000% 12.2637% 2/19/29 (b)(c)(d) | | 595,000 | 542,444 |
| DG Investment Intermediate Holdings, Inc.: | | | |
| 2LN, term loan 1 month U.S. LIBOR + 6.750% 11.967% 3/31/29 (b)(c)(d) | | 60,000 | 52,925 |
| Tranche B 1LN, term loan 1 month U.S. LIBOR + 3.750% 8.967% 3/31/28 (b)(c)(d) | | 259,709 | 254,450 |
| Entegris, Inc. Tranche B 1LN, term loan CME Term SOFR 1 Month Index + 2.750% 7.95% 7/6/29 (b)(c)(d) | | 762,078 | 762,558 |
| Eos U.S. Finco LLC 1LN, term loan CME Term SOFR 3 Month Index + 6.000% 10.9086% 10/6/29 (b)(c)(d) | | 248,438 | 246,159 |
| Epicor Software Corp. Tranche B 1LN, term loan 1 month U.S. LIBOR + 3.250% 8.467% 7/31/27 (b)(c)(d) | | 580,687 | 572,778 |
| Gen Digital, Inc. Tranche B 1LN, term loan CME Term SOFR 1 Month Index + 2.000% 7.2025% 9/12/29 (b)(c)(d) | | 1,179,861 | 1,173,231 |
| Global IID Parent LLC Tranche B 1LN, term loan 1 month U.S. LIBOR + 4.500% 10.0035% 12/16/28 (b)(c)(d) | | 157,600 | 147,356 |
| Go Daddy Operating Co. LLC Tranche B 1LN, term loan CME Term SOFR 1 Month Index + 2.000% 7.1537% 8/10/27 (b)(c)(d) | | 121,250 | 121,016 |
| GoDaddy, Inc. Tranche B 1LN, term loan CME Term SOFR 1 Month Index + 3.250% 8.1025% 11/9/29 (b)(c)(d) | | 464,617 | 465,244 |
| Hunter U.S. Bidco, Inc. Tranche B 1LN, term loan 3 month U.S. LIBOR + 4.250% 9.5919% 8/19/28 (b)(c)(d) | | 486,156 | 480,891 |
| Icon Luxembourg Sarl Tranche B 1LN, term loan CME Term SOFR 3 Month Index + 2.250% 7.7535% 7/3/28 (b)(c)(d) | | 1,238,929 | 1,238,223 |
| Imprivata, Inc. Tranche B 1LN, term loan 1 month U.S. LIBOR + 3.750% 8.967% 12/1/27 (b)(c)(d) | | 283,475 | 277,309 |
| McAfee Corp. Tranche B 1LN, term loan CME Term SOFR 1 Month Index + 3.750% 9.0103% 3/1/29 (b)(c)(d) | | 693,702 | 662,194 |
| MH Sub I LLC: | | | |
| Tranche B 1LN, term loan CME Term SOFR 1 Month Index + 4.250% 9.3525% 4/25/28 (b)(c)(d) | | 1,976,848 | 1,893,820 |
| Tranche B 2LN, term loan CME Term SOFR 1 Month Index + 6.250% 11.3525% 2/23/29 (b)(c)(d) | | 225,000 | 195,048 |
| MKS Instruments, Inc. Tranche B 1LN, term loan CME Term SOFR 1 Month Index + 2.750% 7.9392% 8/17/29 (b)(c)(d) | | 699,713 | 699,713 |
| NAVEX TopCo, Inc. Tranche B 1LN, term loan 1 month U.S. LIBOR + 3.250% 8.4525% 9/5/25 (b)(c)(d) | | 155,396 | 154,930 |
| Open Text Corp. 1LN, term loan CME Term SOFR 1 Month Index + 3.500% 8.7025% 1/31/30 (b)(c)(d) | | 1,021,283 | 1,025,542 |
| Park Place Technologies LLC 1LN, term loan CME Term SOFR 1 Month Index + 5.000% 10.2025% 11/10/27 (b)(c)(d) | | 656,729 | 636,823 |
| Peraton Corp. Tranche B 1LN, term loan CME Term SOFR 1 Month Index + 3.750% 8.9525% 2/1/28 (b)(c)(d) | | 1,851,212 | 1,815,188 |
| Polaris Newco LLC Tranche B 1LN, term loan 3 month U.S. LIBOR + 4.000% 9.5379% 6/2/28 (b)(c)(d) | | 1,618,084 | 1,485,935 |
| Project Boost Purchaser LLC 1LN, term loan 1 month U.S. LIBOR + 3.500% 8.717% 5/30/26 (b)(c)(d) | | 417,325 | 411,641 |
| Proofpoint, Inc. Tranche B 1LN, term loan 3 month U.S. LIBOR + 3.250% 8.467% 8/31/28 (b)(c)(d) | | 846,021 | 826,985 |
| Rackspace Technology Global, Inc. Tranche B 1LN, term loan 3 month U.S. LIBOR + 2.750% 7.9957% 2/15/28 (b)(c)(d) | | 767,348 | 347,624 |
| RealPage, Inc. Tranche B 1LN, term loan 1 month U.S. LIBOR + 3.000% 8.217% 4/22/28 (b)(c)(d) | | 853,866 | 834,441 |
| Red Planet Borrower LLC Tranche B 1LN, term loan 1 month U.S. LIBOR + 3.750% 8.9525% 9/30/28 (b)(c)(d) | | 284,653 | 239,109 |
| Renaissance Holdings Corp.: | | | |
| 1LN, term loan CME Term SOFR 1 Month Index + 4.750% 9.9919% 4/7/30 (b)(c)(d) | | 815,000 | 803,794 |
| Tranche B 2LN, term loan 1 month U.S. LIBOR + 7.000% 12.193% 5/31/26 (b)(c)(d) | | 115,000 | 112,494 |
| Roper Industrial Products Investment Tranche B 1LN, term loan CME Term SOFR 1 Month Index + 4.500% 9.7419% 11/22/29 (b)(c)(d) | | 189,525 | 188,577 |
| Sophia LP Tranche B 1LN, term loan 3 month U.S. LIBOR + 3.500% 9.0379% 10/7/27 (b)(c)(d) | | 565,576 | 558,863 |
| Sovos Compliance LLC Tranche B 1LN, term loan 1 month U.S. LIBOR + 4.500% 9.717% 8/11/28 (b)(c)(d) | | 218,043 | 209,945 |
| SS&C Technologies, Inc.: | | | |
| Tranche B 3LN, term loan 1 month U.S. LIBOR + 1.750% 6.967% 4/16/25 (b)(c)(d) | | 208,393 | 208,152 |
| Tranche B 4LN, term loan 1 month U.S. LIBOR + 1.750% 6.967% 4/16/25 (b)(c)(d) | | 186,121 | 185,905 |
| Tranche B 5LN, term loan 1 month U.S. LIBOR + 1.750% 6.967% 4/16/25 (b)(c)(d) | | 813,869 | 812,713 |
| STG-Fairway Holdings LLC Tranche B 1LN, term loan 1 month U.S. LIBOR + 2.750% 7.967% 1/31/27 (b)(c)(d) | | 180,416 | 179,909 |
| Tempo Acquisition LLC 1LN, term loan U.S. Secured Overnight Fin. Rate (SOFR) Index + 3.000% 8.1025% 8/31/28 (b)(c)(d) | | 888,277 | 888,277 |
| TTM Technologies, Inc. Tranche B 1LN, term loan CME Term SOFR 1 Month Index + 2.750% 7.8858% 5/30/30 (b)(c)(d) | | 279,427 | 278,728 |
| UKG, Inc. 1LN, term loan CME Term SOFR 3 Month Index + 3.750% 8.8954% 5/4/26 (b)(c)(d) | | 789,250 | 777,711 |
| Ultimate Software Group, Inc.: | | | |
| 1LN, term loan: | | | |
1 month U.S. LIBOR + 3.250% 8.2706% 5/3/26 (b)(c)(d) | | 1,399,112 | 1,371,563 |
CME Term SOFR 1 Month Index + 4.500% 9.8767% 5/4/26 (b)(c)(d) | | 240,000 | 239,201 |
| 2LN, term loan CME Term SOFR 3 Month Index + 5.250% 10.2706% 5/3/27 (b)(c)(d) | | 600,000 | 580,284 |
| Veritas U.S., Inc. Tranche B 1LN, term loan 3 month U.S. LIBOR + 5.000% 10.217% 9/1/25 (b)(c)(d) | | 557,474 | 453,382 |
| Verscend Holding Corp. Tranche B 1LN, term loan 1 month U.S. LIBOR + 4.000% 9.217% 8/27/25 (b)(c)(d) | | 520,497 | 519,737 |
| VFH Parent LLC Tranche B 1LN, term loan CME Term SOFR 1 Month Index + 3.000% 8.1892% 1/13/29 (b)(c)(d) | | 361,350 | 359,431 |
| Virgin Pulse, Inc.: | | | |
| 2LN, term loan 1 month U.S. LIBOR + 7.250% 12.5179% 4/6/29 (b)(c)(d) | | 115,000 | 94,372 |
| Tranche B 1LN, term loan 1 month U.S. LIBOR + 4.000% 8.967% 4/6/28 (b)(c)(d) | | 273,438 | 257,972 |
| VM Consolidated, Inc. Tranche B 1LN, term loan CME Term SOFR 1 Month Index + 3.250% 8.467% 3/27/28 (b)(c)(d) | | 444,245 | 444,245 |
| VS Buyer LLC Tranche B 1LN, term loan CME Term SOFR 1 Month Index + 3.000% 8.5242% 2/28/27 (b)(c)(d) | | 251,550 | 247,777 |
| Weber-Stephen Products LLC Tranche B 1LN, term loan: | | | |
| 1 month U.S. LIBOR + 3.250% 8.467% 10/30/27 (b)(c)(d) | | 203,725 | 178,404 |
| CME Term SOFR 1 Month Index + 4.250% 9.4525% 10/30/27 (b)(c)(d) | | 118,500 | 104,182 |
| Zelis Payments Buyer, Inc. Tranche B 1LN, term loan 1 month U.S. LIBOR + 3.500% 8.693% 9/30/26 (b)(c)(d) | | 535,815 | 535,006 |
TOTAL TECHNOLOGY | | | 40,363,823 |
| Telecommunications - 4.8% | | | |
| Altice Financing SA Tranche B 1LN, term loan CME Term SOFR 1 Month Index + 5.000% 9.9863% 10/31/27 (b)(c)(d) | | 471,614 | 455,108 |
| Altice France SA Tranche B14 1LN, term loan CME Term SOFR 1 Month Index + 5.500% 10.4863% 8/15/28 (b)(c)(d) | | 1,700,000 | 1,507,339 |
| Aventiv Technologies LLC Tranche B, term loan: | | | |
| 3 month U.S. LIBOR + 4.500% 10.0379% 11/1/24 (b)(c)(d) | | 475,707 | 423,246 |
| 3 month U.S. LIBOR + 8.250% 13.981% 11/1/25 (b)(c)(d) | | 685,000 | 529,163 |
| Cablevision Lightpath LLC Tranche B 1LN, term loan 1 month U.S. LIBOR + 3.250% 8.4433% 11/30/27 (b)(c)(d) | | 126,173 | 121,245 |
| Ciena Corp. Tranche B 1LN, term loan CME Term SOFR 1 Month Index + 2.500% 7.5906% 1/18/30 (b)(c)(d) | | 134,663 | 134,663 |
| Connect U.S. Finco LLC Tranche B 1LN, term loan 1 month U.S. LIBOR + 3.500% 8.7% 12/12/26 (b)(c)(d) | | 241,875 | 241,498 |
| Consolidated Communications, Inc. Tranche B 1LN, term loan CME Term SOFR 1 Month Index + 3.500% 8.717% 10/2/27 (b)(c)(d) | | 318,651 | 280,528 |
| Crown Subsea Communications Holding, Inc.: | | | |
| 1LN, term loan CME Term SOFR 1 Month Index + 5.250% 10.5247% 4/27/27 (b)(c)(d) | | 355,000 | 354,780 |
| Tranche B 1LN, term loan CME Term SOFR 1 Month Index + 5.000% 10.2747% 4/27/27 (b)(c)(d) | | 140,240 | 139,948 |
| Frontier Communications Holdings LLC Tranche B 1LN, term loan 3 month U.S. LIBOR + 3.750% 9% 5/1/28 (b)(c)(d) | | 1,126,640 | 1,088,459 |
| GTT Communications, Inc. 1LN, term loan CME Term SOFR 3 Month Index + 9.000% 14.3419% 6/30/28 (b)(c)(d) | | 94,837 | 52,793 |
| Gtt Remainco LLC 1LN, term loan CME Term SOFR 1 Month Index + 7.000% 12.2025% 12/30/27 (b)(c)(d) | | 120,220 | 99,782 |
| Intelsat Jackson Holdings SA 1LN, term loan CME TERM SOFR 6 MONTH INDEX + 4.250% 9.4435% 2/1/29 (b)(c)(d) | | 2,595,151 | 2,582,175 |
| Level 3 Financing, Inc. Tranche B 1LN, term loan CME Term SOFR 1 Month Index + 1.750% 6.967% 3/1/27 (b)(c)(d) | | 246,166 | 228,782 |
| Northwest Fiber LLC Tranche B 1LN, term loan CME Term SOFR 1 Month Index + 3.750% 8.9416% 4/30/27 (b)(c)(d) | | 631,412 | 616,814 |
| Patagonia Holdco LLC Tranche B 1LN, term loan CME Term SOFR 3 Month Index + 5.750% 10.7887% 8/1/29 (b)(c)(d) | | 518,840 | 438,851 |
| Radiate Holdco LLC Tranche B 1LN, term loan 1 month U.S. LIBOR + 3.250% 8.467% 9/25/26 (b)(c)(d) | | 924,466 | 768,851 |
| SBA Senior Finance II, LLC Tranche B, term loan 1 month U.S. LIBOR + 1.750% 6.95% 4/11/25 (b)(c)(d) | | 450,132 | 449,929 |
| Windstream Services LLC Tranche B 1LN, term loan CME Term SOFR 1 Month Index + 6.250% 11.4525% 9/21/27 (b)(c)(d) | | 487,583 | 453,760 |
| Zayo Group Holdings, Inc. 1LN, term loan: | | | |
| 1 month U.S. LIBOR + 3.000% 8.217% 3/9/27 (b)(c)(d) | | 1,260,347 | 986,436 |
| CME Term SOFR 1 Month Index + 4.250% 9.3525% 3/9/27 (b)(c)(d) | | 582,625 | 459,755 |
TOTAL TELECOMMUNICATIONS | | | 12,413,905 |
| Textiles/Apparel - 0.6% | | | |
| Crocs, Inc. Tranche B1 LN, term loan CME Term SOFR 1 Month Index + 3.500% 8.86% 2/17/29 (b)(c)(d) | | 730,520 | 731,601 |
| Jo-Ann Stores LLC Tranche B 1LN, term loan 3 month U.S. LIBOR + 4.750% 10.0181% 7/7/28 (b)(c)(d) | | 231,035 | 117,442 |
| Tory Burch LLC Tranche B 1LN, term loan 1 month U.S. LIBOR + 3.500% 8.717% 4/16/28 (b)(c)(d) | | 402,726 | 387,185 |
| Victoria's Secret & Co. Tranche B 1LN, term loan 3 month U.S. LIBOR + 3.250% 8.5052% 8/2/28 (b)(c)(d) | | 196,301 | 193,356 |
TOTAL TEXTILES/APPAREL | | | 1,429,584 |
| Transportation Ex Air/Rail - 0.1% | | | |
| ASP LS Acquisition Corp. 2LN, term loan 6 month U.S. LIBOR + 7.500% 12.693% 5/7/29 (b)(c)(d) | | 230,000 | 161,000 |
| Utilities - 1.9% | | | |
| Brookfield WEC Holdings, Inc.: | | | |
| 1LN, term loan CME Term SOFR 1 Month Index + 3.750% 8.8525% 8/1/25 (b)(c)(d) | | 163,763 | 163,722 |
| Tranche B 1LN, term loan 1 month U.S. LIBOR + 2.750% 7.943% 8/1/25 (b)(c)(d) | | 1,405,712 | 1,401,804 |
| ExGen Renewables IV, LLC Tranche B 1LN, term loan 3 month U.S. LIBOR + 2.500% 8.0254% 12/15/27 (b)(c)(d) | | 160,940 | 159,754 |
| Limetree Bay Terminals LLC Tranche B 1LN, term loan 3 month U.S. LIBOR + 4.000% 10.5035% 2/15/24 (b)(c)(d) | | 216,083 | 183,850 |
| Luxembourg Investment Co. 428 SARL Tranche B 1LN, term loan CME Term SOFR 3 Month Index + 5.000% 10.3919% 1/3/29 (b)(c)(d) | | 329,136 | 239,446 |
| Osmose Utilities Services, Inc. Tranche B 1LN, term loan 1 month U.S. LIBOR + 3.250% 8.467% 6/23/28 (b)(c)(d) | | 324,225 | 317,254 |
| PG&E Corp. Tranche B 1LN, term loan 1 month U.S. LIBOR + 3.000% 8.217% 6/23/25 (b)(c)(d) | | 606,250 | 604,844 |
| Pike Corp. Tranche B 1LN, term loan 1 month U.S. LIBOR + 3.000% 8.217% 1/21/28 (b)(c)(d) | | 239,726 | 238,482 |
| Vertiv Group Corp. Tranche B 1LN, term loan CME Term SOFR 1 Month Index + 2.750% 7.943% 3/2/27 (b)(c)(d) | | 837,495 | 833,568 |
| Vistra Operations Co. LLC Tranche B 3LN, term loan 1 month U.S. LIBOR + 1.750% 6.93% 12/31/25 (b)(c)(d) | | 637,699 | 635,945 |
TOTAL UTILITIES | | | 4,778,669 |
| TOTAL BANK LOAN OBLIGATIONS (Cost $232,812,966) | | | 224,065,803 |
| | | | |
| Nonconvertible Bonds - 4.0% |
| | | Principal Amount (a) | Value ($) |
| Aerospace - 0.2% | | | |
| TransDigm, Inc. 6.25% 3/15/26 (h) | | 500,000 | 497,556 |
| Air Transportation - 0.1% | | | |
| American Airlines, Inc. / AAdvantage Loyalty IP Ltd. 5.5% 4/20/26 (h) | | 105,000 | 104,022 |
| Delta Air Lines, Inc. / SkyMiles IP Ltd. 4.5% 10/20/25 (h) | | 58,333 | 57,061 |
TOTAL AIR TRANSPORTATION | | | 161,083 |
| Automotive & Auto Parts - 0.7% | | | |
| Clarios Global LP / Clarios U.S. Finance Co. 6.75% 5/15/28 (h) | | 175,000 | 174,388 |
| Rivian Holdco & Rivian LLC & Rivian Automotive LLC 6 month U.S. LIBOR + 5.620% 10.9311% 10/15/26 (b)(c)(h) | | 1,535,000 | 1,487,961 |
TOTAL AUTOMOTIVE & AUTO PARTS | | | 1,662,349 |
| Broadcasting - 0.2% | | | |
| DISH Network Corp. 11.75% 11/15/27 (h) | | 415,000 | 405,003 |
| Univision Communications, Inc. 6.625% 6/1/27 (h) | | 105,000 | 101,488 |
TOTAL BROADCASTING | | | 506,491 |
| Cable/Satellite TV - 0.3% | | | |
| CCO Holdings LLC/CCO Holdings Capital Corp.: | | | |
| 5% 2/1/28 (h) | | 170,000 | 154,885 |
| 5.375% 6/1/29 (h) | | 330,000 | 298,351 |
| Charter Communications Operating LLC/Charter Communications Operating Capital Corp. 3 month U.S. LIBOR + 1.650% 6.9491% 2/1/24 (b)(c) | | 250,000 | 251,060 |
| Radiate Holdco LLC/Radiate Financial Service Ltd. 4.5% 9/15/26 (h) | | 189,000 | 150,683 |
TOTAL CABLE/SATELLITE TV | | | 854,979 |
| Capital Goods - 0.0% | | | |
| Chart Industries, Inc. 7.5% 1/1/30 (h) | | 35,000 | 35,709 |
| Chemicals - 0.1% | | | |
| Kronos Acquisition Holdings, Inc. / KIK Custom Products, Inc. 5% 12/31/26 (h) | | 5,000 | 4,575 |
| Olympus Water U.S. Holding Corp. 9.75% 11/15/28 (h) | | 200,000 | 195,060 |
TOTAL CHEMICALS | | | 199,635 |
| Containers - 0.1% | | | |
| Ardagh Packaging Finance PLC/Ardagh MP Holdings U.S.A., Inc. 4.125% 8/15/26 (h) | | 260,000 | 242,162 |
| Energy - 0.2% | | | |
| Citgo Petroleum Corp.: | | | |
| 6.375% 6/15/26 (h) | | 45,000 | 43,313 |
| 7% 6/15/25 (h) | | 130,000 | 127,563 |
| New Fortress Energy, Inc.: | | | |
| 6.5% 9/30/26 (h) | | 430,000 | 384,719 |
| 6.75% 9/15/25 (h) | | 45,000 | 42,212 |
TOTAL ENERGY | | | 597,807 |
| Gaming - 0.5% | | | |
| Affinity Gaming LLC 6.875% 12/15/27 (h) | | 150,000 | 132,000 |
| Caesars Entertainment, Inc. 7% 2/15/30 (h) | | 160,000 | 160,678 |
| Fertitta Entertainment LLC / Fertitta Entertainment Finance Co., Inc. 4.625% 1/15/29 (h) | | 795,000 | 697,613 |
| Golden Entertainment, Inc. 7.625% 4/15/26 (h) | | 145,000 | 145,619 |
| VICI Properties LP / VICI Note Co.: | | | |
| 3.5% 2/15/25 (h) | | 30,000 | 28,665 |
| 4.25% 12/1/26 (h) | | 45,000 | 42,097 |
| 4.625% 12/1/29 (h) | | 25,000 | 22,697 |
TOTAL GAMING | | | 1,229,369 |
| Homebuilders/Real Estate - 0.3% | | | |
| MPT Operating Partnership LP/MPT Finance Corp. 5% 10/15/27 | | 335,000 | 281,842 |
| Uniti Group LP / Uniti Group Finance, Inc. 10.5% 2/15/28 (h) | | 400,000 | 396,825 |
TOTAL HOMEBUILDERS/REAL ESTATE | | | 678,667 |
| Insurance - 0.1% | | | |
| Alliant Holdings Intermediate LLC 6.75% 4/15/28 (h) | | 355,000 | 352,067 |
| Leisure - 0.2% | | | |
| Carnival Corp. 7.625% 3/1/26 (h) | | 95,000 | 93,043 |
| Royal Caribbean Cruises Ltd.: | | | |
| 8.25% 1/15/29 (h) | | 160,000 | 167,992 |
| 11.625% 8/15/27 (h) | | 105,000 | 114,193 |
TOTAL LEISURE | | | 375,228 |
| Paper - 0.0% | | | |
| Ardagh Metal Packaging Finance U.S.A. LLC/Ardagh Metal Packaging Finance PLC 3.25% 9/1/28 (h) | | 80,000 | 68,727 |
| Restaurants - 0.0% | | | |
| CEC Entertainment LLC 6.75% 5/1/26 (h) | | 95,000 | 90,635 |
| Services - 0.3% | | | |
| Aramark Services, Inc. 6.375% 5/1/25 (h) | | 60,000 | 59,945 |
| GEMS MENASA Cayman Ltd. 7.125% 7/31/26 (h) | | 115,000 | 111,345 |
| Neptune BidCo U.S., Inc. 9.29% 4/15/29 (h) | | 145,000 | 133,112 |
| PowerTeam Services LLC 9.033% 12/4/25 (h) | | 390,000 | 341,250 |
TOTAL SERVICES | | | 645,652 |
| Super Retail - 0.1% | | | |
| EG Global Finance PLC: | | | |
| 6.75% 2/7/25 (h) | | 125,000 | 121,406 |
| 8.5% 10/30/25 (h) | | 250,000 | 242,567 |
TOTAL SUPER RETAIL | | | 363,973 |
| Technology - 0.1% | | | |
| Cloud Software Group, Inc. 9% 9/30/29 (h) | | 190,000 | 165,953 |
| CommScope, Inc. 6% 3/1/26 (h) | | 125,000 | 116,497 |
TOTAL TECHNOLOGY | | | 282,450 |
| Telecommunications - 0.5% | | | |
| Altice Financing SA 5.75% 8/15/29 (h) | | 225,000 | 174,312 |
| Altice France SA: | | | |
| 5.125% 1/15/29 (h) | | 170,000 | 121,183 |
| 5.125% 7/15/29 (h) | | 155,000 | 110,030 |
| 5.5% 1/15/28 (h) | | 95,000 | 71,751 |
| Frontier Communications Holdings LLC 5% 5/1/28 (h) | | 100,000 | 86,281 |
| Intelsat Jackson Holdings SA 6.5% 3/15/30 (h) | | 465,000 | 423,316 |
| LCPR Senior Secured Financing DAC 6.75% 10/15/27 (h) | | 170,000 | 159,287 |
| Northwest Fiber LLC/Northwest Fiber Finance Sub, Inc. 4.75% 4/30/27 (h) | | 15,000 | 13,248 |
| Windstream Escrow LLC 7.75% 8/15/28 (h) | | 250,000 | 207,476 |
TOTAL TELECOMMUNICATIONS | | | 1,366,884 |
| Textiles/Apparel - 0.0% | | | |
| Victoria's Secret & Co. 4.625% 7/15/29 (h) | | 80,000 | 58,471 |
| TOTAL NONCONVERTIBLE BONDS (Cost $10,770,881) | | | 10,269,894 |
| | | | |
| Common Stocks - 1.1% |
| | | Shares | Value ($) |
| Capital Goods - 0.0% | | | |
| TNT Crane & Rigging LLC (e)(i) | | 5,338 | 55,675 |
| TNT Crane & Rigging LLC warrants 10/31/25 (e)(i) | | 1,797 | 521 |
TOTAL CAPITAL GOODS | | | 56,196 |
| Diversified Financial Services - 0.1% | | | |
| ACNR Holdings, Inc. (e)(i) | | 1,374 | 124,278 |
| Carnelian Point Holdings LP warrants (e)(i) | | 329 | 961 |
| Lime Tree Bay Ltd. (e)(i) | | 38 | 1,500 |
TOTAL DIVERSIFIED FINANCIAL SERVICES | | | 126,739 |
| Energy - 0.9% | | | |
| California Resources Corp. (j) | | 19,196 | 869,387 |
| California Resources Corp. warrants 10/27/24 (i) | | 885 | 10,496 |
| Chesapeake Energy Corp. | | 11,625 | 972,780 |
| Chesapeake Energy Corp. (i)(k) | | 103 | 8,619 |
| Denbury, Inc. (i) | | 5,885 | 507,640 |
TOTAL ENERGY | | | 2,368,922 |
| Entertainment/Film - 0.0% | | | |
| Cineworld Group PLC warrants 11/23/25 (i) | | 22,063 | 0 |
| Restaurants - 0.1% | | | |
| CEC Entertainment, Inc. (e)(i) | | 15,069 | 264,160 |
| Super Retail - 0.0% | | | |
| David's Bridal, Inc. rights (e)(i) | | 347 | 0 |
| Telecommunications - 0.0% | | | |
| GTT Communications, Inc. (e) | | 2,417 | 29,851 |
| TOTAL COMMON STOCKS (Cost $1,216,108) | | | 2,845,868 |
| | | | |
| Nonconvertible Preferred Stocks - 0.2% |
| | | Shares | Value ($) |
| Diversified Financial Services - 0.2% | | | |
ACNR Holdings, Inc. (e)(i) (Cost $98,250) | | 786 | 425,776 |
| | | | |
| Preferred Securities - 0.7% |
| | | Principal Amount (a) | Value ($) |
| Banks & Thrifts - 0.4% | | | |
| Bank of America Corp.: | | | |
| 6.25% (b)(l) | | 360,000 | 362,654 |
| 8.631% (b)(c)(l) | | 45,000 | 45,322 |
| JPMorgan Chase & Co.: | | | |
| 6% (b)(l) | | 155,000 | 158,965 |
| 6.1% (b)(l) | | 179,000 | 181,303 |
| 6.75% (b)(l) | | 201,000 | 207,144 |
TOTAL BANKS & THRIFTS | | | 955,388 |
| Energy - 0.3% | | | |
| Energy Transfer LP 3 month U.S. LIBOR + 4.020% 9.3487% (b)(c)(l) | | 945,000 | 859,671 |
| TOTAL PREFERRED SECURITIES (Cost $1,813,585) | | | 1,815,059 |
| | | | |
| Other - 0.7% |
| | | Shares | Value ($) |
| Other - 0.7% | | | |
Fidelity Private Credit Central Fund LLC (k)(m) (Cost $1,802,387) | | 181,233 | 1,812,329 |
| | | | |
| Money Market Funds - 5.9% |
| | | Shares | Value ($) |
| Fidelity Cash Central Fund 5.14% (n) | | 14,357,015 | 14,359,887 |
| Fidelity Securities Lending Cash Central Fund 5.14% (n)(o) | | 892,836 | 892,925 |
| TOTAL MONEY MARKET FUNDS (Cost $15,252,812) | | | 15,252,812 |
| | | | |
| TOTAL INVESTMENT IN SECURITIES - 99.7% (Cost $263,766,989) | 256,487,541 |
NET OTHER ASSETS (LIABILITIES) - 0.3% | 648,522 |
| NET ASSETS - 100.0% | 257,136,063 |
| | |
Legend
| (a) | Amount is stated in United States dollars unless otherwise noted. |
| (b) | Coupon rates for floating and adjustable rate securities reflect the rates in effect at period end. |
| (c) | Coupon is indexed to a floating interest rate which may be multiplied by a specified factor and/or subject to caps or floors. |
| (d) | Remaining maturities of bank loan obligations may be less than the stated maturities shown as a result of contractual or optional prepayments by the borrower. Such prepayments cannot be predicted with certainty. |
| (f) | The coupon rate will be determined upon settlement of the loan after period end. |
| (g) | Position or a portion of the position represents an unfunded loan commitment. At period end, the total principal amount and market value of unfunded commitments totaled $448,741 and $439,804, respectively. |
| (h) | Security exempt from registration under Rule 144A of the Securities Act of 1933. These securities may be resold in transactions exempt from registration, normally to qualified institutional buyers. At the end of the period, the value of these securities amounted to $9,736,992 or 3.8% of net assets. |
| (j) | Security or a portion of the security is on loan at period end. |
| (k) | Restricted securities (including private placements) - Investment in securities not registered under the Securities Act of 1933 (excluding 144A issues). At the end of the period, the value of restricted securities (excluding 144A issues) amounted to $1,820,948 or 0.7% of net assets. |
| (l) | Security is perpetual in nature with no stated maturity date. |
| (m) | Affiliated fund that is generally available only to investment companies and other accounts managed by Fidelity Investments. |
| (n) | Affiliated fund that is generally available only to investment companies and other accounts managed by Fidelity Investments. The rate quoted is the annualized seven-day yield of the fund at period end. A complete unaudited listing of the fund's holdings as of its most recent quarter end is available upon request. In addition, each Fidelity Central Fund's financial statements are available on the SEC's website or upon request. |
| (o) | Investment made with cash collateral received from securities on loan. |
| Additional information on each restricted holding is as follows: |
| Security | Acquisition Date | Acquisition Cost ($) |
| Chesapeake Energy Corp. | 2/10/21 | 975 |
| | | |
| Fidelity Private Credit Central Fund LLC | 6/06/22 | 1,802,387 |
| | | |
Affiliated Central Funds
Fiscal year to date information regarding the Fund's investments in Fidelity Central Funds, including the ownership percentage, is presented below.
| Affiliate | Value, beginning of period ($) | Purchases ($) | Sales Proceeds ($) | Dividend Income ($) | Realized Gain (loss) ($) | Change in Unrealized appreciation (depreciation) ($) | Value, end of period ($) | % ownership, end of period |
| Fidelity Cash Central Fund 5.14% | 13,650,593 | 45,018,808 | 44,309,514 | 372,493 | - | - | 14,359,887 | 0.0% |
| Fidelity Private Credit Central Fund LLC | 1,344,405 | 450,131 | - | 94,122 | 2,345 | 15,448 | 1,812,329 | 0.3% |
| Fidelity Securities Lending Cash Central Fund 5.14% | - | 3,570,082 | 2,677,157 | 27 | - | - | 892,925 | 0.0% |
| Total | 14,994,998 | 49,039,021 | 46,986,671 | 466,642 | 2,345 | 15,448 | 17,065,141 | |
| | | | | | | | | |
Amounts in the dividend income column in the above table include any capital gain distributions from underlying funds, which are presented in the corresponding line item in the Statement of Operations, if applicable.
Amounts in the dividend income column for Fidelity Securities Lending Cash Central Fund represents the income earned on investing cash collateral, less rebates paid to borrowers and any lending agent fees associated with the loan, plus any premium payments received for lending certain types of securities.
Amounts included in the purchases and sales proceeds columns may include in-kind transactions, if applicable.
Investment Valuation
The following is a summary of the inputs used, as of June 30, 2023, involving the Fund's assets and liabilities carried at fair value. The inputs or methodology used for valuing securities may not be an indication of the risk associated with investing in those securities. For more information on valuation inputs, and their aggregation into the levels used below, please refer to the Investment Valuation section in the accompanying Notes to Financial Statements.
| Valuation Inputs at Reporting Date: |
| Description | Total ($) | Level 1 ($) | Level 2 ($) | Level 3 ($) |
Investments in Securities: | | | | |
|
| Equities: | | | | |
Communication Services | - | - | - | - |
Consumer Discretionary | 264,160 | - | - | 264,160 |
Energy | 2,368,922 | 2,368,922 | - | - |
Financials | 552,515 | - | - | 552,515 |
Industrials | 56,196 | - | - | 56,196 |
Information Technology | 29,851 | - | - | 29,851 |
|
| Bank Loan Obligations | 224,065,803 | - | 221,115,142 | 2,950,661 |
|
| Corporate Bonds | 10,269,894 | - | 10,269,894 | - |
|
| Preferred Securities | 1,815,059 | - | 1,815,059 | - |
|
| Other | 1,812,329 | - | 1,812,329 | - |
|
| Money Market Funds | 15,252,812 | 15,252,812 | - | - |
| Total Investments in Securities: | 256,487,541 | 17,621,734 | 235,012,424 | 3,853,383 |
The following is a reconciliation of Investments in Securities for which Level 3 inputs were used in determining value:
| |
| Investments in Securities: | |
| Bank Loan Obligations | | | |
| Beginning Balance | $ | 4,120,090 | |
| Net Realized Gain (Loss) on Investment Securities | | 1,663 | |
| Net Unrealized Gain (Loss) on Investment Securities | | (150,759) | |
| Cost of Purchases | | 1,381,937 | |
| Proceeds of Sales | | (560,888) | |
| Amortization/Accretion | | 11,675 | |
| Transfers into Level 3 | | 605,507 | |
| Transfers out of Level 3 | | (2,458,564) | |
| Ending Balance | $ | 2,950,661 | |
| The change in unrealized gain (loss) for the period attributable to Level 3 securities held at June 30, 2023 | $ | (159,261) | |
| Other Investments in Securities | | | |
| Beginning Balance | $ | 950,906 | |
| Net Realized Gain (Loss) on Investment Securities | | - | |
| Net Unrealized Gain (Loss) on Investment Securities | | (55,775) | |
| Cost of Purchases | | 7,591 | |
| Proceeds of Sales | | - | |
| Amortization/Accretion | | - | |
| Transfers into Level 3 | | - | |
| Transfers out of Level 3 | | - | |
| Ending Balance | $ | 902,722 | |
| The change in unrealized gain (loss) for the period attributable to Level 3 securities held at June 30, 2023 | $ | (55,775) | |
| The information used in the above reconciliation represents fiscal year to date activity for any Investments in Securities identified as using Level 3 inputs at either the beginning or the end of the current fiscal period. Cost of purchases and proceeds of sales may include securities received and/or delivered through in-kind transactions, corporate actions or exchanges. Transfers into Level 3 were attributable to a lack of observable market data resulting from decreases in market activity, decreases in liquidity, security restructurings or corporate actions. Transfers out of Level 3 were attributable to observable market data becoming available for those securities. Transfers in or out of Level 3 represent the beginning value of any Security or Instrument where a change in the pricing level occurred from the beginning to the end of the period. Realized and unrealized gains (losses) disclosed in the reconciliation are included in Net Gain (Loss) on the Fund's Statement of Operations. | |
| Statement of Assets and Liabilities |
| | | | June 30, 2023 (Unaudited) |
| | | | | |
| Assets | | | | |
| Investment in securities, at value (including securities loaned of $865,039) - See accompanying schedule: | | | | |
Unaffiliated issuers (cost $246,711,790) | $ | 239,422,400 | | |
Fidelity Central Funds (cost $17,055,199) | | 17,065,141 | | |
| | | | | |
| | | | | |
| Total Investment in Securities (cost $263,766,989) | | | $ | 256,487,541 |
| Cash | | | | 452,010 |
| Receivable for investments sold | | | | 2,739,873 |
| Receivable for fund shares sold | | | | 358,282 |
| Dividends receivable | | | | 123 |
| Interest receivable | | | | 2,253,630 |
| Distributions receivable from Fidelity Central Funds | | | | 45,368 |
Total assets | | | | 262,336,827 |
| Liabilities | | | | |
| Payable for investments purchased | $ | 4,107,825 | | |
| Payable for fund shares redeemed | | 3,560 | | |
| Accrued management fee | | 114,747 | | |
| Other affiliated payables | | 31,067 | | |
| Other payables and accrued expenses | | 50,640 | | |
| Collateral on securities loaned | | 892,925 | | |
| Total Liabilities | | | | 5,200,764 |
| Commitments and contingent liabilities (see Commitments note) | | | | |
| Net Assets | | | $ | 257,136,063 |
| Net Assets consist of: | | | | |
| Paid in capital | | | $ | 272,406,935 |
| Total accumulated earnings (loss) | | | | (15,270,872) |
| Net Assets | | | $ | 257,136,063 |
| | | | | |
| Net Asset Value and Maximum Offering Price | | | | |
| Initial Class : | | | | |
Net Asset Value , offering price and redemption price per share ($14,945,474 ÷ 1,509,196 shares) | | | $ | 9.90 |
| Investor Class : | | | | |
Net Asset Value , offering price and redemption price per share ($242,190,589 ÷ 24,472,508 shares) | | | $ | 9.90 |
| Statement of Operations |
| | | | Six months ended June 30, 2023 (Unaudited) |
| Investment Income | | | | |
| Dividends | | | $ | 68,437 |
| Interest | | | | 10,762,226 |
| Income from Fidelity Central Funds (including $27 from security lending) | | | | 466,642 |
| Total Income | | | | 11,297,305 |
| Expenses | | | | |
| Management fee | $ | 701,155 | | |
| Transfer agent fees | | 128,146 | | |
| Accounting fees | | 60,434 | | |
| Custodian fees and expenses | | 34,070 | | |
| Independent trustees' fees and expenses | | 831 | | |
| Audit | | 37,442 | | |
| Legal | | 1,803 | | |
| Miscellaneous | | 544 | | |
| Total expenses before reductions | | 964,425 | | |
| Expense reductions | | (9,631) | | |
| Total expenses after reductions | | | | 954,794 |
| Net Investment income (loss) | | | | 10,342,511 |
| Realized and Unrealized Gain (Loss) | | | | |
| Net realized gain (loss) on: | | | | |
| Investment Securities: | | | | |
| Unaffiliated issuers | | (984,662) | | |
| Affiliated issuers | | 2,345 | | |
| Total net realized gain (loss) | | | | (982,317) |
| Change in net unrealized appreciation (depreciation) on: | | | | |
| Investment Securities: | | | | |
| Unaffiliated issuers | | 5,734,771 | | |
| Fidelity Central Funds | | 15,448 | | |
| Total change in net unrealized appreciation (depreciation) | | | | 5,750,219 |
| Net gain (loss) | | | | 4,767,902 |
| Net increase (decrease) in net assets resulting from operations | | | $ | 15,110,413 |
| Statement of Changes in Net Assets |
| |
| | Six months ended June 30, 2023 (Unaudited) | | Year ended December 31, 2022 |
| Increase (Decrease) in Net Assets | | | | |
| Operations | | | | |
| Net investment income (loss) | $ | 10,342,511 | $ | 12,584,563 |
| Net realized gain (loss) | | (982,317) | | (1,096,547) |
| Change in net unrealized appreciation (depreciation) | | 5,750,219 | | (13,697,792) |
| Net increase (decrease) in net assets resulting from operations | | 15,110,413 | | (2,209,776) |
| Distributions to shareholders | | (2,886,479) | | (10,589,026) |
| | | | | |
| Share transactions - net increase (decrease) | | (1,653,322) | | 15,559,097 |
| Total increase (decrease) in net assets | | 10,570,612 | | 2,760,295 |
| | | | | |
| Net Assets | | | | |
| Beginning of period | | 246,565,451 | | 243,805,156 |
| End of period | $ | 257,136,063 | $ | 246,565,451 |
| | | | | |
| | | | | |
| VIP Floating Rate High Income Portfolio Initial Class |
| |
| | Six months ended (Unaudited) June 30, 2023 | | Years ended December 31, 2022 | | 2021 | | 2020 | | 2019 | | 2018 |
Selected Per-Share Data | | | | | | | | | | | | |
| Net asset value, beginning of period | $ | 9.43 | $ | 9.90 | $ | 9.66 | $ | 9.85 | $ | 9.55 | $ | 9.93 |
| Income from Investment Operations | | | | | | | | | | | | |
Net investment income (loss) A,B | | .391 | | .477 | | .323 | | .376 | | .505 | | .438 |
| Net realized and unrealized gain (loss) | | .189 | | (.529) | | .177 | | (.104) | | .325 | | (.452) |
| Total from investment operations | | .580 | | (.052) | | .500 | | .272 | | .830 | | (.014) |
| Distributions from net investment income | | (.110) | | (.418) | | (.260) | | (.462) | | (.530) | | (.366) |
| Total distributions | | (.110) | | (.418) | | (.260) | | (.462) | | (.530) | | (.366) |
| Net asset value, end of period | $ | 9.90 | $ | 9.43 | $ | 9.90 | $ | 9.66 | $ | 9.85 | $ | 9.55 |
Total Return C,D,E | | 6.19% | | (.52)% | | 5.21% | | 2.82% | | 8.79% | | (.16)% |
Ratios to Average Net Assets B,F,G | | | | | | | | | | | | |
| Expenses before reductions | | .73% H | | .72% | | .72% | | .73% | | .71% | | .71% |
| Expenses net of fee waivers, if any | | .72% H | | .72% | | .72% | | .73% | | .71% | | .71% |
| Expenses net of all reductions | | .72% H | | .72% | | .72% | | .73% | | .70% | | .71% |
| Net investment income (loss) | | 8.18% H | | 4.93% | | 3.26% | | 3.95% | | 5.06% | | 4.37% |
| Supplemental Data | | | | | | | | | | | | |
| Net assets, end of period (000 omitted) | $ | 14,945 | $ | 12,480 | $ | 9,840 | $ | 7,689 | $ | 12,292 | $ | 12,905 |
Portfolio turnover rate I | | 39% H | | 26% | | 37% | | 40% | | 29% | | 45% |
A Calculated based on average shares outstanding during the period.
B Net investment income (loss) is affected by the timing of the declaration of dividends by any underlying mutual funds or exchange-traded funds (ETFs). Net investment income (loss) of any mutual funds or ETFs is not included in the Fund's net investment income (loss) ratio.
C Total returns for periods of less than one year are not annualized.
D Total returns do not reflect charges attributable to your insurance company's separate account. Inclusion of these charges would reduce the total returns shown.
E Total returns would have been lower if certain expenses had not been reduced during the applicable periods shown.
F Fees and expenses of any underlying mutual funds or exchange-traded funds (ETFs) are not included in the Fund's expense ratio. The Fund indirectly bears its proportionate share of these expenses. For additional expense information related to investments in Fidelity Central Funds, please refer to the "Investments in Fidelity Central Funds" note found in the Notes to Financial Statements section of the most recent Annual or Semi-Annual report. For additional expense information related to investments in Fidelity Private Credit Central Fund LLC, please refer to the Investment in Fidelity Private Credit Central Fund LLC note found in the Notes to Financial Statements section of the most recent Annual or Semi-Annual report.
G Expense ratios reflect operating expenses of the class. Expenses before reductions do not reflect amounts reimbursed, waived, or reduced through arrangements with the investment adviser, brokerage services, or other offset arrangements, if applicable, and do not represent the amount paid by the class during periods when reimbursements, waivers or reductions occur.
H Annualized.
I Amount does not include the portfolio activity of any underlying mutual funds or exchange-traded funds (ETFs).
| VIP Floating Rate High Income Portfolio Investor Class |
| |
| | Six months ended (Unaudited) June 30, 2023 | | Years ended December 31, 2022 | | 2021 | | 2020 | | 2019 | | 2018 |
Selected Per-Share Data | | | | | | | | | | | | |
| Net asset value, beginning of period | $ | 9.43 | $ | 9.89 | $ | 9.66 | $ | 9.85 | $ | 9.54 | $ | 9.93 |
| Income from Investment Operations | | | | | | | | | | | | |
Net investment income (loss) A,B | | .390 | | .474 | | .319 | | .373 | | .502 | | .434 |
| Net realized and unrealized gain (loss) | | .189 | | (.520) | | .169 | | (.105) | | .335 | | (.461) |
| Total from investment operations | | .579 | | (.046) | | .488 | | .268 | | .837 | | (.027) |
| Distributions from net investment income | | (.109) | | (.414) | | (.258) | | (.458) | | (.527) | | (.363) |
| Total distributions | | (.109) | | (.414) | | (.258) | | (.458) | | (.527) | | (.363) |
| Net asset value, end of period | $ | 9.90 | $ | 9.43 | $ | 9.89 | $ | 9.66 | $ | 9.85 | $ | 9.54 |
Total Return C,D,E | | 6.18% | | (.46)% | | 5.08% | | 2.78% | | 8.88% | | (.30)% |
Ratios to Average Net Assets B,F,G | | | | | | | | | | | | |
| Expenses before reductions | | .76% H | | .75% | | .76% | | .76% | | .74% | | .74% |
| Expenses net of fee waivers, if any | | .76% H | | .75% | | .76% | | .76% | | .74% | | .74% |
| Expenses net of all reductions | | .75% H | | .75% | | .76% | | .76% | | .74% | | .74% |
| Net investment income (loss) | | 8.15% H | | 4.90% | | 3.23% | | 3.91% | | 5.03% | | 4.33% |
| Supplemental Data | | | | | | | | | | | | |
| Net assets, end of period (000 omitted) | $ | 242,191 | $ | 234,086 | $ | 233,965 | $ | 160,929 | $ | 253,710 | $ | 253,242 |
Portfolio turnover rate I | | 39% H | | 26% | | 37% | | 40% | | 29% | | 45% |
A Calculated based on average shares outstanding during the period.
B Net investment income (loss) is affected by the timing of the declaration of dividends by any underlying mutual funds or exchange-traded funds (ETFs). Net investment income (loss) of any mutual funds or ETFs is not included in the Fund's net investment income (loss) ratio.
C Total returns for periods of less than one year are not annualized.
D Total returns do not reflect charges attributable to your insurance company's separate account. Inclusion of these charges would reduce the total returns shown.
E Total returns would have been lower if certain expenses had not been reduced during the applicable periods shown.
F Fees and expenses of any underlying mutual funds or exchange-traded funds (ETFs) are not included in the Fund's expense ratio. The Fund indirectly bears its proportionate share of these expenses. For additional expense information related to investments in Fidelity Central Funds, please refer to the "Investments in Fidelity Central Funds" note found in the Notes to Financial Statements section of the most recent Annual or Semi-Annual report. For additional expense information related to investments in Fidelity Private Credit Central Fund LLC, please refer to the Investment in Fidelity Private Credit Central Fund LLC note found in the Notes to Financial Statements section of the most recent Annual or Semi-Annual report.
G Expense ratios reflect operating expenses of the class. Expenses before reductions do not reflect amounts reimbursed, waived, or reduced through arrangements with the investment adviser, brokerage services, or other offset arrangements, if applicable, and do not represent the amount paid by the class during periods when reimbursements, waivers or reductions occur.
H Annualized.
I Amount does not include the portfolio activity of any underlying mutual funds or exchange-traded funds (ETFs).
For the period ended June 30, 2023
1. Organization.
VIP Floating Rate High Income Portfolio (the Fund) is a fund of Variable Insurance Products Fund (the Trust) and is authorized to issue an unlimited number of shares. The Trust is registered under the Investment Company Act of 1940, as amended (the 1940 Act), as an open-end management investment company organized as a Massachusetts business trust. Shares of the Fund may only be purchased by insurance companies for the purpose of funding variable annuity or variable life insurance contracts. The Fund offers the following classes of shares: Initial Class shares and Investor Class shares. All classes have equal rights and voting privileges, except for matters affecting a single class.
2. Investments in Fidelity Central Funds.
Funds may invest in Fidelity Central Funds, which are open-end investment companies generally available only to other investment companies and accounts managed by the investment adviser and its affiliates. The Schedule of Investments lists any Fidelity Central Funds held as an investment as of period end, but does not include the underlying holdings of each Fidelity Central Fund. An investing fund indirectly bears its proportionate share of the expenses of the underlying Fidelity Central Funds.
Based on its investment objective, each Fidelity Central Fund may invest or participate in various investment vehicles or strategies that are similar to those of the investing fund. These strategies are consistent with the investment objectives of the investing fund and may involve certain economic risks which may cause a decline in value of each of the Fidelity Central Funds and thus a decline in the value of the investing fund.
| Fidelity Central Fund | Investment Manager | Investment Objective | Investment Practices | Expense Ratio A |
| Fidelity Money Market Central Funds | Fidelity Management & Research Company LLC (FMR) | Each fund seeks to obtain a high level of current income consistent with the preservation of capital and liquidity. | Short-term Investments | Less than .005% |
A Expenses expressed as a percentage of average net assets and are as of each underlying Central Fund's most recent annual or semi-annual shareholder report.
A complete unaudited list of holdings for each Fidelity Central Fund is available upon request or at the Securities and Exchange Commission website at www.sec.gov. In addition, the financial statements of the Fidelity Central Funds which contain the significant accounting policies (including investment valuation policies) of those funds, and are not covered by the Report of Independent Registered Public Accounting Firm, are available on the Securities and Exchange Commission website or upon request.
3. Investment in Fidelity Private Credit Central Fund LLC.
The Fund invests in Fidelity Private Credit Central Fund LLC (formerly Fidelity Direct Lending Fund, LP), which is a limited liability company available only to certain investment companies managed by the investment adviser and its affiliates. On June 1, 2023, Fidelity Private Credit Central Fund elected to be regulated as a business development company (BDC). Fidelity Private Credit Central Fund LLC's units are not registered under the Securities Act of 1933 and are subject to substantial restrictions on transfer. The Fund has no redemption rights under Fidelity Private Credit Central Fund LLC's limited liability company agreement. There will be no trading market for the units.
Based on its investment objective, Fidelity Private Credit Central Fund LLC may invest or participate in various investments or strategies that are similar to those in which the Fund may invest or participate. These strategies are consistent with the investment objectives of the Fund and may involve certain economic risks which may cause a decline in value of Fidelity Private Credit Central Fund LLC and thus a decline in the value of the Fund. Fidelity Private Credit Central Fund LLC intends to invest primarily in directly originated loans to private companies but also with liquid credit investments, like broadly syndicated loans, and other select private credit investments.
The Schedule of Investments lists Fidelity Private Credit Central Fund LLC as an investment as of period end, but does not include the underlying holdings of Fidelity Private Credit Central Fund LLC. Fidelity Private Credit Central Fund LLC represented less than 5% of the Fund's net assets at period end. The Fund indirectly bears its proportionate share of the expenses of Fidelity Private Credit Central Fund LLC. The annualized expense ratio for Fidelity Private Credit Central Fund LLC for the sixth month period ended June 30, 2023 was 8.51%.
4. Significant Accounting Policies.
The Fund is an investment company and applies the accounting and reporting guidance of the Financial Accounting Standards Board (FASB) Accounting Standards Codification Topic 946 Financial Services - Investment Companies . The financial statements have been prepared in conformity with accounting principles generally accepted in the United States of America (GAAP), which require management to make certain estimates and assumptions at the date of the financial statements. Actual results could differ from those estimates. Subsequent events, if any, through the date that the financial statements were issued have been evaluated in the preparation of the financial statements. The Fund's Schedule of Investments lists any underlying mutual funds or exchange-traded funds (ETFs) but does not include the underlying holdings of these funds. The following summarizes the significant accounting policies of the Fund:
Investment Valuation. Investments are valued as of 4:00 p.m. Eastern time on the last calendar day of the period. The Board of Trustees (the Board) has designated the Fund's investment adviser as the valuation designee responsible for the fair valuation function and performing fair value determinations as needed. The investment adviser has established a Fair Value Committee (the Committee) to carry out the day-to-day fair valuation responsibilities and has adopted policies and procedures to govern the fair valuation process and the activities of the Committee. In accordance with these fair valuation policies and procedures, which have been approved by the Board, the Fund attempts to obtain prices from one or more third party pricing services or brokers to value its investments. When current market prices, quotations or currency exchange rates are not readily available or reliable, investments will be fair valued in good faith by the Committee, in accordance with the policies and procedures. Factors used in determining fair value vary by investment type and may include market or investment specific events, transaction data, estimated cash flows, and market observations of comparable investments. The frequency that the fair valuation procedures are used cannot be predicted and they may be utilized to a significant extent. The Committee manages the Fund's fair valuation practices and maintains the fair valuation policies and procedures. The Fund's investment adviser reports to the Board information regarding the fair valuation process and related material matters.
The Fund categorizes the inputs to valuation techniques used to value its investments into a disclosure hierarchy consisting of three levels as shown below:
Level 1 - unadjusted quoted prices in active markets for identical investments
Level 2 - other significant observable inputs (including quoted prices for similar investments, interest rates, prepayment speeds, etc.)
Level 3 - unobservable inputs (including the Fund's own assumptions based on the best information available)
Valuation techniques used to value the Fund's investments by major category are as follows:
Debt securities, including restricted securities, are valued based on evaluated prices received from third party pricing services or from brokers who make markets in such securities. Corporate bonds, bank loan obligations and preferred securities are valued by pricing services who utilize matrix pricing which considers yield or price of bonds of comparable quality, coupon, maturity and type or by broker-supplied prices. When independent prices are unavailable or unreliable, debt securities may be valued utilizing pricing methodologies which consider similar factors that would be used by third party pricing services. Debt securities are generally categorized as Level 2 in the hierarchy but may be Level 3 depending on the circumstances. The Fund invests a significant portion of its assets in below investment grade securities. The value of these securities can be more volatile due to changes in the credit quality of the issuer and is sensitive to changes in economic, market and regulatory conditions.
Equity securities, including restricted securities, for which market quotations are readily available, are valued at the last reported sale price or official closing price as reported by a third party pricing service on the primary market or exchange on which they are traded and are categorized as Level 1 in the hierarchy. In the event there were no sales during the day or closing prices are not available, securities are valued at the last quoted bid price or may be valued using the last available price and are generally categorized as Level 2 in the hierarchy. For equity securities, including restricted securities, where observable inputs are limited, assumptions about market activity and risk are used and these securities may be categorized as Level 3 in the hierarchy.
Investments in open-end mutual funds, including the Fidelity Central Funds, are valued at their closing net asset value (NAV) each business day and are categorized as Level 1 in the hierarchy.
Fidelity Private Credit Central Fund LLC is valued at its net asset value (NAV) each month end and is categorized as Level 2 in the hierarchy.
The following provides information on Level 3 securities held by the Fund that were valued at period end based on unobservable inputs. These amounts exclude valuations provided by a broker and valuations using NAV as a practical expedient.
| Asset Type | Fair Value | Valuation Technique(s) | Unobservable Input | Amount or Range/Weighted Average | Impact to Valuation from an Increase in Input A |
| Equities | $902,722 | Market comparable | Enterprise value/EBITDA multiple(EV/EBITDA) | 1.9 - 8.5 / 3.8 | Increase |
| | | Recovery value | Recovery value | $0.00 | Increase |
| | | Market approach | Parity price | $12.35 | Increase |
| | | Black scholes | Discount rate | 4.6% - 5.1% / 5.0% | Increase |
| | | | Volatility | 20.0% - 42.5% / 25.8% | Increase |
| | | | Term | 1.5 - 2.3 / 1.7 | Increase |
| Bank Loan Obligations | $2,950,661 | Market approach | Transaction price | $95.00 - $99.50 / $96.11 | Increase |
| | | Discounted cash flow | Discount rate | 10.5% - 11.8% / 11.0% | Decrease |
| | | | Yield | 14.4% | Decrease |
| | | Indicative market price | Evaluated bid | $62.00 - $99.75 / $90.45 | Increase |
A Represents the directional change in the fair value of the Level 3 investments that could have resulted from an increase in the corresponding input as of period end. A decrease to the unobservable input would have had the opposite effect. Significant changes in these inputs may have resulted in a significantly higher or lower fair value measurement at period end.
Changes in valuation techniques may result in transfers in or out of an assigned level within the disclosure hierarchy. The aggregate value of investments by input level as of June 30, 2023, as well as a roll forward of Level 3 investments, is included at the end of the Fund's Schedule of Investments.
Investment Transactions and Income. For financial reporting purposes, the Fund's investment holdings and NAV include trades executed through the end of the last business day of the period. The NAV per share for processing shareholder transactions is calculated as of the close of business of the New York Stock Exchange (NYSE), normally 4:00 p.m. Eastern time and includes trades executed through the end of the prior business day. Gains and losses on securities sold are determined on the basis of identified cost. Commissions paid to certain brokers with whom the investment adviser, or its affiliates, places trades on behalf of a fund include an amount in addition to trade execution, which may be rebated back to a fund. Any such rebates are included in net realized gain (loss) on investments in the Statement of Operations. Dividend income is recorded on the ex-dividend date, except for certain dividends from foreign securities where the ex-dividend date may have passed, which are recorded as soon as the Fund is informed of the ex-dividend date. Non-cash dividends included in dividend income, if any, are recorded at the fair market value of the securities received. Income and capital gain distributions from Fidelity Central Funds, if any, are recorded on the ex-dividend date. Certain distributions received by the Fund represent a return of capital or capital gain. The Fund determines the components of these distributions subsequent to the ex-dividend date, based upon receipt of tax filings or other correspondence relating to the underlying investment. These distributions are recorded as a reduction of cost of investments and/or as a realized gain. Interest income is accrued as earned and includes coupon interest and amortization of premium and accretion of discount on debt securities as applicable. Debt obligations may be placed on non-accrual status and related interest income may be reduced by ceasing current accruals and writing off interest receivables when the collection of all or a portion of interest has become doubtful based on consistently applied procedures. A debt obligation is removed from non-accrual status when the issuer resumes interest payments or when collectability of interest is reasonably assured. The Fund earns certain fees in connection with its floating rate loan purchasing activities. These fees are in addition to interest payments earned and may include amendment fees, consent fees and prepayment fees. These fees are recorded as Interest in the accompanying financial statements.
Class Allocations and Expenses. Investment income, realized and unrealized capital gains and losses, common expenses of a fund, and certain fund-level expense reductions, if any, are allocated daily on a pro-rata basis to each class based on the relative net assets of each class to the total net assets of a fund. Each class differs with respect to transfer agent and distribution and service plan fees incurred, as applicable. Certain expense reductions may also differ by class, if applicable. For the reporting period, the allocated portion of income and expenses to each class as a percent of its average net assets may vary due to the timing of recording these transactions in relation to fluctuating net assets of the classes. Expenses directly attributable to a fund are charged to that fund. Expenses attributable to more than one fund are allocated among the respective funds on the basis of relative net assets or other appropriate methods. Expenses included in the accompanying financial statements reflect the expenses of that fund and do not include any expenses associated with any underlying mutual funds or exchange-traded funds (ETFs). Although not included in a fund's expenses, a fund indirectly bears its proportionate share of these expenses through the net asset value of each underlying mutual fund or exchange-traded fund (ETF). Expense estimates are accrued in the period to which they relate and adjustments are made when actual amounts are known.
Income Tax Information and Distributions to Shareholders. Each year, the Fund intends to qualify as a regulated investment company under Subchapter M of the Internal Revenue Code, including distributing substantially all of its taxable income and realized gains. As a result, no provision for U.S. Federal income taxes is required. The Fund files a U.S. federal tax return, in addition to state and local tax returns as required. The Fund's federal income tax returns are subject to examination by the Internal Revenue Service (IRS) for a period of three fiscal years after they are filed. State and local tax returns may be subject to examination for an additional fiscal year depending on the jurisdiction.
Distributions are declared and recorded on the ex-dividend date. Income and capital gain distributions are declared separately for each class. Income and capital gain distributions are determined in accordance with income tax regulations, which may differ from GAAP.
Capital accounts within the financial statements are adjusted for permanent book-tax differences. These adjustments have no impact on net assets or the results of operations. Capital accounts are not adjusted for temporary book-tax differences which will reverse in a subsequent period.
Book-tax differences are primarily due to market discount, partnerships, capital loss carryforwards and losses deferred due to wash sales.
As of period end, the cost and unrealized appreciation (depreciation) in securities, and derivatives if applicable, for federal income tax purposes were as follows:
| Gross unrealized appreciation | $3,798,261 |
| Gross unrealized depreciation | (10,389,879) |
| Net unrealized appreciation (depreciation) | $(6,591,618) |
| Tax cost | $263,079,159 |
Capital loss carryforwards are only available to offset future capital gains of the Fund to the extent provided by regulations and may be limited. The capital loss carryforward information presented below, including any applicable limitation, is estimated as of prior fiscal period end and is subject to adjustment.
Short-term | $(3,589,397) |
Long-term | (14,295,824) |
| Total capital loss carryforward | $(17,885,221) |
Restricted Securities (including Private Placements). Funds may invest in securities that are subject to legal or contractual restrictions on resale. These securities generally may be resold in transactions exempt from registration or to the public if the securities are registered. Disposal of these securities may involve time-consuming negotiations and expense, and prompt sale at an acceptable price may be difficult. Information regarding restricted securities held at period end is included at the end of the Schedule of Investments, if applicable.
Loans and Other Direct Debt Instruments. Direct debt instruments are interests in amounts owed to lenders by corporate or other borrowers. These instruments may be in the form of loans, trade claims or other receivables and may include standby financing commitments such as revolving credit facilities that obligate a fund to supply additional cash to the borrower on demand. Loans may be acquired through assignment, participation, or may be made directly to a borrower. Such instruments are presented in the Bank Loan Obligations section in the Schedule of Investments. Certain funds may also invest in unfunded loan commitments, which are contractual obligations for future funding. Information regarding unfunded commitments is included at the end of the Schedule of Investments, if applicable.
Commitments. A commitment is an agreement to acquire an investment at a future date (subject to conditions) in connection with a potential public or non-public offering. The amount of commitments outstanding at period end are presented in the table below. These commitments are not included in the net assets of the Fund at period end.
| | Investment to be Acquired | Commitment Amount |
| VIP Floating Rate High Income Portfolio | Fidelity Private Credit Central Fund LLC | $455,985 |
LIBOR Accounting Pronouncement. In March 2020, the Financial Accounting Standards Board (FASB) issued an Accounting Standards Update (ASU), ASU 2020-04, which provides optional, temporary relief with respect to the financial reporting of contracts subject to certain types of modifications due to the planned discontinuation of the London Interbank Offered Rate (LIBOR) and other IBOR-based reference rates. The temporary relief provided by ASU 2020-04 is effective for certain reference rate-related contract modifications that occur during the period March 12, 2020 through December 31, 2024. Management does not expect the adoption of ASU 2020-04 to have a material impact on the Fund's financial statements.
5. Purchases and Sales of Investments.
Purchases and sales of securities, other than short-term securities and in-kind transactions, as applicable, are noted in the table below.
| | Purchases ($) | Sales ($) |
| VIP Floating Rate High Income Portfolio | 51,422,756 | 46,999,327 |
6. Fees and Other Transactions with Affiliates.
Management Fee. Fidelity Management & Research Company LLC (the investment adviser) and its affiliates provide the Fund with investment management related services for which the Fund pays a monthly management fee. The management fee is the sum of an individual fund fee rate that is based on an annual rate of .45% of the Fund's average net assets and an annualized group fee rate that averaged .10% during the period. The group fee rate is based upon the monthly average net assets of a group of registered investment companies with which the investment adviser has management contracts. The group fee rate decreases as assets under management increase and increases as assets under management decrease. For the reporting period, the total annualized management fee rate was .55% of the Fund's average net assets.
Transfer Agent Fees. Fidelity Investments Institutional Operations Company LLC (FIIOC), an affiliate of the investment adviser, is the Fund's transfer, dividend disbursing, and shareholder servicing agent. FIIOC receives an asset-based fee with respect to each class. Each class pays a fee for transfer agent services, typesetting and printing and mailing of shareholder reports, excluding mailing of proxy statements. For the period, transfer agent fees for each class were as follows:
| | Amount | % of Class-Level Average Net Assets A |
| Initial Class | $4,907 | .07 |
| Investor Class | 123,239 | .10 |
| | $128,146 | |
A Annualized
Accounting Fees. Fidelity Service Company, Inc. (FSC), an affiliate of the investment adviser, maintains the Fund's accounting records. The accounting fee is based on the level of average net assets for each month. For the period, the fees were equivalent to the following annualized rates:
| | % of Average Net Assets |
| VIP Floating Rate High Income Portfolio | .05 |
Interfund Trades. Funds may purchase from or sell securities to other Fidelity Funds under procedures adopted by the Board. The procedures have been designed to ensure these interfund trades are executed in accordance with Rule 17a-7 of the 1940 Act. Any interfund trades are included within the respective purchases and sales amounts shown in the Purchases and Sales of Investments note. During the period, there were no interfund trades.
7. Committed Line of Credit.
Certain Funds participate with other funds managed by the investment adviser or an affiliate in a $4.25 billion credit facility (the "line of credit") to be utilized for temporary or emergency purposes to fund shareholder redemptions or for other short-term liquidity purposes. The participating funds have agreed to pay commitment fees on their pro-rata portion of the line of credit, which are reflected in Miscellaneous expenses on the Statement of Operations, and are listed below. During the period, there were no borrowings on this line of credit.
| | Amount |
| VIP Floating Rate High Income Portfolio | $250 |
8. Security Lending.
Funds lend portfolio securities from time to time in order to earn additional income. Lending agents are used, including National Financial Services (NFS), an affiliate of the investment adviser. Pursuant to a securities lending agreement, NFS will receive a fee, which is capped at 9.9% of a fund's daily lending revenue, for its services as lending agent. A fund may lend securities to certain qualified borrowers, including NFS. On the settlement date of the loan, a fund receives collateral (in the form of U.S. Treasury obligations, letters of credit and/or cash) against the loaned securities and maintains collateral in an amount not less than 100% of the market value of the loaned securities during the period of the loan. The market value of the loaned securities is determined at the close of business of a fund and any additional required collateral is delivered to a fund on the next business day. A fund or borrower may terminate the loan at any time, and if the borrower defaults on its obligation to return the securities loaned because of insolvency or other reasons, a fund may apply collateral received from the borrower against the obligation. A fund may experience delays and costs in recovering the securities loaned. Any cash collateral received is invested in the Fidelity Securities Lending Cash Central Fund. Any loaned securities are identified as such in the Schedule of Investments, and the value of loaned securities and cash collateral at period end, as applicable, are presented in the Statement of Assets and Liabilities. Security lending income represents the income earned on investing cash collateral, less rebates paid to borrowers and any lending agent fees associated with the loan, plus any premium payments received for lending certain types of securities. Security lending income is presented in the Statement of Operations as a component of income from Fidelity Central Funds. Affiliated security lending activity, if any, was as follows:
| | Total Security Lending Fees Paid to NFS | Security Lending Income From Securities Loaned to NFS | Value of Securities Loaned to NFS at Period End |
| VIP Floating Rate High Income Portfolio | $3 | $- | $- |
9. Expense Reductions.
The investment adviser has contractually agreed to waive the Fund's management fee with respect to the portion of the Fund's assets invested in Fidelity Private Credit Central Fund LLC until April 30, 2024. During the period, this waiver reduced the Fund's management fee by $589.
Through arrangements with the Fund's custodian, credits realized as a result of certain uninvested cash balances were used to reduce the Fund's expenses. During the period, custodian credits reduced the Fund's expenses by $5,349.
In addition, during the period the investment adviser or an affiliate reimbursed and/or waived a portion of fund-level operating expenses in the amount of $3,693.
10. Distributions to Shareholders.
Distributions to shareholders of each class were as follows:
| | Six months ended June 30, 2023 | Year ended December 31, 2022 |
| VIP Floating Rate High Income Portfolio | | |
| Distributions to shareholders | | |
| Initial Class | $148,381 | $532,009 |
| Investor Class | 2,738,098 | 10,057,017 |
Total | $2,886,479 | $10,589,026 |
11. Share Transactions.
Transactions for each class of shares were as follows and may contain in-kind transactions:
| | Shares | Shares | Dollars | Dollars |
| | Six months ended June 30, 2023 | Year ended December 31, 2022 | Six months ended June 30, 2023 | Year ended December 31, 2022 |
| VIP Floating Rate High Income Portfolio | | | | |
| Initial Class | | | | |
| Shares sold | 715,233 | 919,892 | $6,903,739 | $8,982,533 |
| Reinvestment of distributions | 15,456 | 56,333 | 148,381 | 532,009 |
| Shares redeemed | (544,279) | (647,612) | (5,269,015) | (6,279,623) |
| Net increase (decrease) | 186,410 | 328,613 | $1,783,105 | $3,234,919 |
| Investor Class | | | | |
| Shares sold | 2,439,994 | 6,591,415 | $23,513,631 | $64,685,388 |
| Reinvestment of distributions | 285,427 | 1,064,107 | 2,737,242 | 10,053,763 |
| Shares redeemed | (3,081,660) | (6,482,331) | (29,687,300) | (62,414,973) |
| Net increase (decrease) | (356,239) | 1,173,191 | $(3,436,427) | $12,324,178 |
12. Other.
A fund's organizational documents provide former and current trustees and officers with a limited indemnification against liabilities arising in connection with the performance of their duties to the fund. In the normal course of business, a fund may also enter into contracts that provide general indemnifications. A fund's maximum exposure under these arrangements is unknown as this would be dependent on future claims that may be made against a fund. The risk of material loss from such claims is considered remote.
At the end of the period, the investment adviser or its affiliates were owners of record of more than 10% of the outstanding shares as follows:
| Fund | Affiliated % |
| VIP Floating Rate High Income Portfolio | 99% |
13. Risk and Uncertainties.
Many factors affect a fund's performance. Developments that disrupt global economies and financial markets, such as pandemics, epidemics, outbreaks of infectious diseases, war, terrorism, and environmental disasters, may significantly affect a fund's investment performance. The effects of these developments to a fund will be impacted by the types of securities in which a fund invests, the financial condition, industry, economic sector, and geographic location of an issuer, and a fund's level of investment in the securities of that issuer. Significant concentrations in security types, issuers, industries, sectors, and geographic locations may magnify the factors that affect a fund's performance.
As a shareholder, you incur two types of costs: (1) transaction costs, which may include sales charges (loads) on purchase payments or redemption proceeds, as applicable and (2) ongoing costs, which generally include management fees, distribution and/or service (12b-1) fees and other Fund expenses. This Example is intended to help you understand your ongoing costs (in dollars) of investing in a fund and to compare these costs with the ongoing costs of investing in other mutual funds.
| The Example is based on an investment of $1,000 invested at the beginning of the period and held for the entire period (January 1, 2023 to June 30, 2023). |
Actual Expenses
The first line of the accompanying table provides information about actual account values and actual expenses. You may use the information in this line, together with the amount you invested, to estimate the expenses that you paid over the period. Simply divide your account value by $1,000.00 (for example, an $8,600 account value divided by $1,000.00 = 8.6), then multiply the result by the number in the first line for a class/Fund under the heading entitled "Expenses Paid During Period" to estimate the expenses you paid on your account during this period. If any fund is a shareholder of any underlying mutual funds or exchange-traded funds (ETFs) (the Underlying Funds), such fund indirectly bears its proportional share of the expenses of the Underlying Funds in addition to the direct expenses incurred presented in the table. These fees and expenses are not included in the annualized expense ratio used to calculate the expense estimate in the table below. The estimate of expenses does not include any fees or other expenses of any variable annuity or variable life insurance product. If they were, the estimate of expenses you paid during the period would be higher, and your ending account value would be lower.
Hypothetical Example for Comparison Purposes
The second line of the accompanying table provides information about hypothetical account values and hypothetical expenses based on the actual expense ratio and an assumed rate of return of 5% per year before expenses, which is not the actual return. The hypothetical account values and expenses may not be used to estimate the actual ending account balance or expenses you paid for the period. You may use this information to compare the ongoing costs of investing in the Fund and other funds. To do so, compare this 5% hypothetical example with the 5% hypothetical examples that appear in the shareholder reports of the other funds. If any fund is a shareholder of any Underlying Funds, such fund indirectly bears its proportional share of the expenses of the Underlying Funds in addition to the direct expenses as presented in the table. These fees and expenses are not included in the annualized expense ratio used to calculate the expense estimate in the table below. The estimate of expenses does not include any fees or other expenses of any variable annuity or variable life insurance product. If they were, the estimate of expenses you paid during the period would be higher, and your ending account value would be lower.
Please note that the expenses shown in the table are meant to highlight your ongoing costs only and do not reflect any transaction costs. Therefore, the second line of the table is useful in comparing ongoing costs only, and will not help you determine the relative total costs of owning different funds. In addition, if these transactional costs were included, your costs would have been higher.
| | | | | Annualized Expense Ratio- A | | Beginning Account Value January 1, 2023 | | Ending Account Value June 30, 2023 | | Expenses Paid During Period- C January 1, 2023 to June 30, 2023 |
| VIP Floating Rate High Income Portfolio | | | | | | | | | | |
| Initial Class | | | | .72% | | | | | | |
| Actual | | | | | | $ 1,000 | | $ 1,061.90 | | $ 3.68 |
Hypothetical- B | | | | | | $ 1,000 | | $ 1,021.22 | | $ 3.61 |
| Investor Class | | | | .76% | | | | | | |
| Actual | | | | | | $ 1,000 | | $ 1,061.80 | | $ 3.89 |
Hypothetical- B | | | | | | $ 1,000 | | $ 1,021.03 | | $ 3.81 |
| |
A Annualized expense ratio reflects expenses net of applicable fee waivers.
B 5% return per year before expenses
C Expenses are equal to the annualized expense ratio, multiplied by the average account value over the period, multiplied by 181/ 365 (to reflect the one-half year period). The fees and expenses of any Underlying Funds are not included in each annualized expense ratio.
Board Approval of Investment Advisory Contracts
VIP Floating Rate High Income Portfolio
At its May 2023 meeting, the Board of Trustees, including the Independent Trustees (together, the Board), voted to continue the management contract with Fidelity Management & Research Company LLC (FMR), and the sub-advisory agreements and sub-subadvisory agreements, in each case, where applicable (together, the Advisory Contracts) for the fund for two months from June 1, 2023 through July 31, 2023. The Board determined that it will consider the annual renewal of the fund's Advisory Contracts for a full one year period in July 2023, following its review of additional materials provided by FMR.
The Board considered that the approval of the fund's Advisory Contracts will not result in any changes in (i) the investment process or strategies employed in the management of the fund's assets; (ii) the fees and expenses paid by shareholders; (iii) the nature, extent or quality of services provided under the fund's Advisory Contracts; or (iv) the day-to-day management of the fund or the persons primarily responsible for such management. The Board also considered that since its last approval of the fund's Advisory Contracts, FMR had provided additional information on the fund in support of the annual contract renewal process, including competitive analyses on total expenses and management fees and in-depth reviews of fund performance and fund profitability information. The Board concluded that the fund's Advisory Contracts are fair and reasonable, and that the fund's Advisory Contracts should be renewed, without modification, through July 31, 2023, with the understanding that the Board will consider the annual renewal for a full one year period in July 2023.
In connection with its consideration of future renewals of the fund's Advisory Contracts, the Board will consider: (i) the nature, extent and quality of services provided to the fund, including shareholder and administrative services and investment performance; (ii) the competitiveness of the management fee and total expenses for the fund; (iii) the costs of the services and profitability, including the revenues earned and the expenses incurred in conducting the business of developing, marketing, distributing, managing, administering, and servicing the fund and its shareholders, to the extent applicable; and (iv) whether there have been economies of scale in respect of the Fidelity funds, whether the Fidelity funds (including the fund) have appropriately benefited from any such economies of scale, and whether there is the potential for realization of any further economies.
Based on its evaluation of all of the conclusions noted above, and after considering all factors it believed relevant, the Board ultimately concluded that the fund's management fee structure is fair and reasonable, and that the continuation of the fund's Advisory Contracts should be approved for two months from June 1, 2023 through July 31, 2023.
The Securities and Exchange Commission adopted Rule 22e-4 under the Investment Company Act of 1940 (the Liquidity Rule) to promote effective liquidity risk management throughout the open-end investment company industry, thereby reducing the risk that funds will be unable to meet their redemption obligations and mitigating dilution of the interests of fund shareholders.
The Fund has adopted and implemented a liquidity risk management program (the Program) reasonably designed to assess and manage the Fund's liquidity risk and to comply with the requirements of the Liquidity Rule. The Fund's Board of Trustees (the Board) has designated the Fund's investment adviser as administrator of the Program. The Fidelity advisers have established a Liquidity Risk Management Committee (the LRM Committee) to manage the Program for each of the Fidelity Funds. The LRM Committee monitors the adequacy and effectiveness of implementation of the Program and on a periodic basis assesses each Fund's liquidity risk based on a variety of factors including (1) the Fund's investment strategy, (2) portfolio liquidity and cash flow projections during normal and reasonably foreseeable stressed conditions, (3) shareholder redemptions, (4) borrowings and other funding sources and (5) certain factors specific to ETFs including the effect of the Fund's prices and spreads, market participants, and basket compositions on the overall liquidity of the Fund's portfolio, as applicable.
In accordance with the Program, each of the Fund's portfolio investments is classified into one of four defined liquidity categories based on a determination of a reasonable expectation for how long it would take to convert the investment to cash (or sell or dispose of the investment) without significantly changing its market value.
- Highly liquid investments - cash or convertible to cash within three business days or less
- Moderately liquid investments - convertible to cash in three to seven calendar days
- Less liquid investments - can be sold or disposed of, but not settled, within seven calendar days
- Illiquid investments - cannot be sold or disposed of within seven calendar days
Liquidity classification determinations take into account a variety of factors including various market, trading and investment-specific considerations, as well as market depth, and generally utilize analysis from a third-party liquidity metrics service.
The Liquidity Rule places a 15% limit on a fund's illiquid investments and requires funds that do not primarily hold assets that are highly liquid investments to determine and maintain a minimum percentage of the fund's net assets to be invested in highly liquid investments (highly liquid investment minimum or HLIM). The Program includes provisions reasonably designed to comply with the 15% limit on illiquid investments and for determining, periodically reviewing and complying with the HLIM requirement as applicable.
At a recent meeting of the Fund's Board of Trustees, the LRM Committee provided a written report to the Board pertaining to the operation, adequacy, and effectiveness of the Program for the period December 1, 2021 through November 30, 2022. The report concluded that the Program is operating effectively and is reasonably designed to assess and manage the Fund's liquidity risk.
1.9859332.109
VIPFHI-SANN-0823
Fidelity® Variable Insurance Products:
VIP Stock Selector All Cap Portfolio
Semi-Annual Report
June 30, 2023
Contents
To view a fund's proxy voting guidelines and proxy voting record for the 12-month period ended June 30, visit http://www.fidelity.com/proxyvotingresults or visit the Securities and Exchange Commission's (SEC) web site at http://www.sec.gov.
You may also call 1-877-208-0098 to request a free copy of the proxy voting guidelines.
Fidelity® Variable Insurance Products are separate account options which are purchased through a variable insurance contract.
Standard & Poor's, S&P and S&P 500 are registered service marks of The McGraw-Hill Companies, Inc. and have been licensed for use by Fidelity Distributors Corporation.
Other third-party marks appearing herein are the property of their respective owners.
All other marks appearing herein are registered or unregistered trademarks or service marks of FMR LLC or an affiliated company. © 2023 FMR LLC. All rights reserved.
This report and the financial statements contained herein are submitted for the general information of the shareholders of the Fund. This report is not authorized for distribution to prospective investors in the Fund unless preceded or accompanied by an effective prospectus.
A fund files its complete schedule of portfolio holdings with the SEC for the first and third quarters of each fiscal year on Form N-PORT. Forms N-PORT are available on the SEC's web site at http://www.sec.gov. A fund's Forms N-PORT may be reviewed and copied at the SEC's Public Reference Room in Washington, DC. Information regarding the operation of the SEC's Public Reference Room may be obtained by calling 1-800-SEC-0330.
For a complete list of a fund's portfolio holdings, view the most recent holdings listing, semiannual report, or annual report on Fidelity's web site at http://www.fidelity.com, http://www.institutional.fidelity.com, or http://www.401k.com, as applicable.
NOT FDIC INSURED •MAY LOSE VALUE •NO BANK GUARANTEE
Neither the Fund nor Fidelity Distributors Corporation is a bank.
This report and the financial statements contained herein are submitted for the general information of the shareholders of the Fund. This report is not authorized for distribution to prospective investors in the Fund unless preceded or accompanied by an effective prospectus.
A fund files its complete schedule of portfolio holdings with the SEC for the first and third quarters of each fiscal year on Form N-PORT. Forms N-PORT are available on the SEC's web site at http://www.sec.gov. A fund's Forms N-PORT may be reviewed and copied at the SEC's Public Reference Room in Washington, DC. Information regarding the operation of the SEC's Public Reference Room may be obtained by calling 1-800-SEC-0330.
For a complete list of a fund's portfolio holdings, view the most recent holdings listing, semiannual report, or annual report on Fidelity's web site at http://www.fidelity.com, http://www.institutional.fidelity.com, or http://www.401k.com, as applicable.
NOT FDIC INSURED •MAY LOSE VALUE •NO BANK GUARANTEE
Neither the Fund nor Fidelity Distributors Corporation is a bank.
Top Holdings (% of Fund's net assets) |
| |
| Microsoft Corp. | 6.9 | |
| Apple, Inc. | 5.8 | |
| Alphabet, Inc. Class A | 3.5 | |
| Amazon.com, Inc. | 3.1 | |
| Exxon Mobil Corp. | 1.8 | |
| Meta Platforms, Inc. Class A | 1.7 | |
| JPMorgan Chase & Co. | 1.5 | |
| NVIDIA Corp. | 1.5 | |
| Tesla, Inc. | 1.4 | |
| UnitedHealth Group, Inc. | 1.3 | |
| | 28.5 | |
| |
| Market Sectors (% of Fund's net assets) |
| |
| Information Technology | 25.1 | |
| Health Care | 13.1 | |
| Financials | 12.4 | |
| Consumer Discretionary | 10.3 | |
| Industrials | 10.2 | |
| Communication Services | 8.4 | |
| Consumer Staples | 6.7 | |
| Energy | 4.2 | |
| Real Estate | 2.8 | |
| Materials | 2.7 | |
| Utilities | 2.5 | |
| |
Asset Allocation (% of Fund's net assets) |
|
Futures - 0.5% |
|
Showing Percentage of Net Assets
| Common Stocks - 98.4% |
| | | Shares | Value ($) |
| COMMUNICATION SERVICES - 8.4% | | | |
| Diversified Telecommunication Services - 0.1% | | | |
| AT&T, Inc. | | 21,900 | 349,305 |
| Liberty Global PLC Class C (a) | | 147,900 | 2,628,183 |
| | | | 2,977,488 |
| Entertainment - 1.8% | | | |
| Activision Blizzard, Inc. | | 88,300 | 7,443,690 |
| Cinemark Holdings, Inc. (a)(b) | | 109,900 | 1,813,350 |
| Electronic Arts, Inc. | | 75,700 | 9,818,290 |
| Endeavor Group Holdings, Inc. (a) | | 31,400 | 751,088 |
| Lions Gate Entertainment Corp.: | | | |
| Class A (a) | | 20,900 | 184,547 |
| Class B (a) | | 120,700 | 1,007,845 |
| Marcus Corp. (b) | | 84,800 | 1,257,584 |
| Netflix, Inc. (a) | | 65,100 | 28,675,899 |
| Sea Ltd. ADR (a) | | 35,800 | 2,077,832 |
| Take-Two Interactive Software, Inc. (a) | | 35,900 | 5,283,044 |
| The Walt Disney Co. (a) | | 122,600 | 10,945,728 |
| Warner Music Group Corp. Class A | | 46,300 | 1,207,967 |
| World Wrestling Entertainment, Inc. Class A | | 51,823 | 5,621,241 |
| | | | 76,088,105 |
| Interactive Media & Services - 5.4% | | | |
| Alphabet, Inc. Class A (a) | | 1,233,700 | 147,673,890 |
| Angi, Inc. (a) | | 284,200 | 937,860 |
| IAC, Inc. (a) | | 3,400 | 213,520 |
| Meta Platforms, Inc. Class A (a) | | 241,000 | 69,162,180 |
| Pinterest, Inc. Class A (a) | | 114,900 | 3,141,366 |
| Shutterstock, Inc. | | 2,000 | 97,340 |
| Snap, Inc. Class A (a) | | 386,600 | 4,577,344 |
| Zoominfo Technologies, Inc. (a) | | 29,600 | 751,544 |
| | | | 226,555,044 |
| Media - 0.7% | | | |
| Advantage Solutions, Inc. Class A (a) | | 99,588 | 233,036 |
| Altice U.S.A., Inc. Class A (a) | | 172,900 | 522,158 |
| Comcast Corp. Class A | | 371,600 | 15,439,980 |
| DISH Network Corp. Class A (a) | | 18,000 | 118,620 |
| Liberty Broadband Corp.: | | | |
| Class A (a) | | 73,600 | 5,868,128 |
| Class C (a) | | 60,400 | 4,838,644 |
| S4 Capital PLC (a) | | 176,500 | 282,435 |
| TechTarget, Inc. (a) | | 6,000 | 186,780 |
| | | | 27,489,781 |
| Wireless Telecommunication Services - 0.4% | | | |
| T-Mobile U.S., Inc. (a) | | 115,700 | 16,070,730 |
TOTAL COMMUNICATION SERVICES | | | 349,181,148 |
| CONSUMER DISCRETIONARY - 10.3% | | | |
| Automobile Components - 0.1% | | | |
| Adient PLC (a) | | 70,550 | 2,703,476 |
| Aptiv PLC (a) | | 33,800 | 3,450,642 |
| | | | 6,154,118 |
| Automobiles - 1.4% | | | |
| Ferrari NV | | 10,300 | 3,349,663 |
| Tesla, Inc. (a) | | 221,663 | 58,024,724 |
| | | | 61,374,387 |
| Broadline Retail - 3.4% | | | |
| Amazon.com, Inc. (a) | | 989,536 | 128,995,913 |
| eBay, Inc. | | 191,739 | 8,568,816 |
| Ollie's Bargain Outlet Holdings, Inc. (a) | | 59,200 | 3,429,456 |
| | | | 140,994,185 |
| Hotels, Restaurants & Leisure - 2.3% | | | |
| ARAMARK Holdings Corp. | | 158,400 | 6,819,120 |
| Booking Holdings, Inc. (a) | | 5,962 | 16,099,367 |
| Caesars Entertainment, Inc. (a) | | 105,300 | 5,367,141 |
| Churchill Downs, Inc. | | 70,830 | 9,857,411 |
| Domino's Pizza, Inc. | | 20,754 | 6,993,890 |
| Hilton Worldwide Holdings, Inc. | | 72,178 | 10,505,508 |
| Marriott International, Inc. Class A | | 65,695 | 12,067,515 |
| McDonald's Corp. | | 28,580 | 8,528,558 |
| Penn Entertainment, Inc. (a) | | 73,900 | 1,775,817 |
| Planet Fitness, Inc. (a) | | 44,900 | 3,028,056 |
| Red Rock Resorts, Inc. | | 57,100 | 2,671,138 |
| Yum! Brands, Inc. | | 83,900 | 11,624,345 |
| | | | 95,337,866 |
| Household Durables - 0.2% | | | |
| D.R. Horton, Inc. | | 33,300 | 4,052,277 |
| Helen of Troy Ltd. (a) | | 8,200 | 885,764 |
| Mohawk Industries, Inc. (a) | | 25,483 | 2,628,826 |
| Newell Brands, Inc. | | 9,800 | 85,260 |
| | | | 7,652,127 |
| Specialty Retail - 1.9% | | | |
| Fast Retailing Co. Ltd. | | 9,900 | 2,539,101 |
| Five Below, Inc. (a) | | 27,872 | 5,477,963 |
| Lowe's Companies, Inc. | | 121,689 | 27,465,207 |
| The Home Depot, Inc. | | 39,224 | 12,184,543 |
| TJX Companies, Inc. | | 312,020 | 26,456,176 |
| Valvoline, Inc. | | 123,219 | 4,621,945 |
| | | | 78,744,935 |
| Textiles, Apparel & Luxury Goods - 1.0% | | | |
| Capri Holdings Ltd. (a) | | 83,168 | 2,984,900 |
| lululemon athletica, Inc. (a) | | 31,800 | 12,036,300 |
| LVMH Moet Hennessy Louis Vuitton SE | | 3,300 | 3,111,611 |
| NIKE, Inc. Class B | | 84,569 | 9,333,881 |
| PVH Corp. | | 94,040 | 7,990,579 |
| Tapestry, Inc. | | 151,997 | 6,505,472 |
| | | | 41,962,743 |
TOTAL CONSUMER DISCRETIONARY | | | 432,220,361 |
| CONSUMER STAPLES - 6.7% | | | |
| Beverages - 2.2% | | | |
| Boston Beer Co., Inc. Class A (a) | | 24,300 | 7,495,092 |
| Brown-Forman Corp. Class B (non-vtg.) | | 2,800 | 186,984 |
| Constellation Brands, Inc. Class A (sub. vtg.) | | 34,385 | 8,463,180 |
| Diageo PLC | | 58,030 | 2,494,768 |
| Keurig Dr. Pepper, Inc. | | 508,100 | 15,888,287 |
| Monster Beverage Corp. | | 156,400 | 8,983,616 |
| PepsiCo, Inc. | | 51,800 | 9,594,396 |
| Primo Water Corp. | | 81,100 | 1,016,994 |
| The Coca-Cola Co. | | 611,800 | 36,842,596 |
| | | | 90,965,913 |
| Consumer Staples Distribution & Retail - 1.5% | | | |
| Albertsons Companies, Inc. | | 87,600 | 1,911,432 |
| Alimentation Couche-Tard, Inc. Class A (multi-vtg.) | | 75,600 | 3,876,587 |
| BJ's Wholesale Club Holdings, Inc. (a) | | 51,400 | 3,238,714 |
| Costco Wholesale Corp. | | 300 | 161,514 |
| Dollar General Corp. | | 41,230 | 7,000,029 |
| Dollar Tree, Inc. (a) | | 37,300 | 5,352,550 |
| Grocery Outlet Holding Corp. (a) | | 5,200 | 159,172 |
| Kroger Co. | | 7,200 | 338,400 |
| Performance Food Group Co. (a) | | 152,346 | 9,177,323 |
| Sysco Corp. | | 37,400 | 2,775,080 |
| Target Corp. | | 52,535 | 6,929,367 |
| U.S. Foods Holding Corp. (a) | | 19,800 | 871,200 |
| United Natural Foods, Inc. (a) | | 900 | 17,595 |
| Walgreens Boots Alliance, Inc. | | 9,500 | 270,655 |
| Walmart, Inc. | | 128,100 | 20,134,758 |
| | | | 62,214,376 |
| Food Products - 0.9% | | | |
| Archer Daniels Midland Co. | | 26,899 | 2,032,488 |
| Bunge Ltd. | | 39,050 | 3,684,368 |
| Conagra Brands, Inc. | | 49,400 | 1,665,768 |
| Darling Ingredients, Inc. (a) | | 26,997 | 1,722,139 |
| Freshpet, Inc. (a) | | 44,500 | 2,928,545 |
| General Mills, Inc. | | 9,100 | 697,970 |
| Ingredion, Inc. | | 1,200 | 127,140 |
| Laird Superfood, Inc. (a) | | 35,100 | 27,906 |
| Mondelez International, Inc. | | 193,400 | 14,106,596 |
| Nomad Foods Ltd. (a) | | 278,700 | 4,882,824 |
| Pilgrim's Pride Corp. (a) | | 2,300 | 49,427 |
| The Hain Celestial Group, Inc. (a) | | 9,600 | 120,096 |
| The J.M. Smucker Co. | | 2,200 | 324,874 |
| The Kraft Heinz Co. | | 1,600 | 56,800 |
| The Simply Good Foods Co. (a) | | 20,400 | 746,436 |
| TreeHouse Foods, Inc. (a) | | 10,226 | 515,186 |
| Tyson Foods, Inc. Class A | | 54,800 | 2,796,992 |
| | | | 36,485,555 |
| Household Products - 1.3% | | | |
| Colgate-Palmolive Co. | | 14,400 | 1,109,376 |
| Energizer Holdings, Inc. | | 161,400 | 5,419,812 |
| Kimberly-Clark Corp. | | 29,300 | 4,045,158 |
| Procter & Gamble Co. | | 264,800 | 40,180,752 |
| Reynolds Consumer Products, Inc. | | 70,748 | 1,998,631 |
| Spectrum Brands Holdings, Inc. | | 14,200 | 1,108,310 |
| The Clorox Co. | | 5,800 | 922,432 |
| | | | 54,784,471 |
| Personal Care Products - 0.2% | | | |
| Estee Lauder Companies, Inc. Class A | | 16,400 | 3,220,632 |
| Herbalife Ltd. (a) | | 105,800 | 1,400,792 |
| Olaplex Holdings, Inc. (a) | | 501,500 | 1,865,580 |
| The Beauty Health Co. (a)(b) | | 149,304 | 1,249,674 |
| | | | 7,736,678 |
| Tobacco - 0.6% | | | |
| Altria Group, Inc. | | 263,300 | 11,927,490 |
| Philip Morris International, Inc. | | 148,800 | 14,525,856 |
| | | | 26,453,346 |
TOTAL CONSUMER STAPLES | | | 278,640,339 |
| ENERGY - 4.2% | | | |
| Energy Equipment & Services - 0.6% | | | |
| Core Laboratories, Inc. | | 19,800 | 460,350 |
| Diamond Offshore Drilling, Inc. (a) | | 42,000 | 598,080 |
| Expro Group Holdings NV (a) | | 271,100 | 4,803,892 |
| Noble Corp. PLC | | 14,900 | 615,519 |
| Schlumberger Ltd. | | 126,900 | 6,233,328 |
| TechnipFMC PLC (a) | | 218,000 | 3,623,160 |
| Valaris Ltd. (a) | | 18,300 | 1,151,619 |
| Weatherford International PLC (a) | | 120,900 | 8,030,178 |
| | | | 25,516,126 |
| Oil, Gas & Consumable Fuels - 3.6% | | | |
| Africa Oil Corp. | | 1,641,500 | 3,494,267 |
| Athabasca Oil Corp. (a) | | 95,100 | 206,029 |
| Canadian Natural Resources Ltd. | | 136,200 | 7,657,427 |
| Cheniere Energy, Inc. | | 7,500 | 1,142,700 |
| Eco Atlantic Oil & Gas Ltd. (a) | | 1,238,500 | 210,351 |
| Exxon Mobil Corp. | | 682,700 | 73,219,575 |
| Hess Corp. | | 112,600 | 15,307,970 |
| Imperial Oil Ltd. | | 261,000 | 13,353,901 |
| Kosmos Energy Ltd. (a) | | 685,377 | 4,105,408 |
| MEG Energy Corp. (a) | | 609,600 | 9,663,408 |
| PBF Energy, Inc. Class A | | 28,000 | 1,146,320 |
| Phillips 66 Co. | | 81,000 | 7,725,780 |
| Tourmaline Oil Corp. | | 30,800 | 1,451,244 |
| Valero Energy Corp. | | 82,700 | 9,700,710 |
| | | | 148,385,090 |
TOTAL ENERGY | | | 173,901,216 |
| FINANCIALS - 12.4% | | | |
| Banks - 5.0% | | | |
| AIB Group PLC | | 364,080 | 1,529,544 |
| Bank of America Corp. | | 1,196,413 | 34,325,089 |
| Bank of Ireland Group PLC | | 551,900 | 5,262,314 |
| BNP Paribas SA | | 105,844 | 6,679,387 |
| Citigroup, Inc. | | 202,880 | 9,340,595 |
| DNB Bank ASA | | 198,200 | 3,706,481 |
| JPMorgan Chase & Co. | | 438,889 | 63,832,016 |
| KBC Group NV | | 46,500 | 3,243,352 |
| KeyCorp | | 462,300 | 4,271,652 |
| M&T Bank Corp. | | 51,918 | 6,425,372 |
| NatWest Group PLC | | 1,116,234 | 3,411,760 |
| Piraeus Financial Holdings SA (a) | | 887,300 | 2,910,475 |
| PNC Financial Services Group, Inc. | | 52,700 | 6,637,565 |
| Popular, Inc. | | 110,000 | 6,657,200 |
| Sumitomo Mitsui Financial Group, Inc. | | 95,200 | 4,080,219 |
| U.S. Bancorp | | 139,707 | 4,615,919 |
| UniCredit SpA | | 291,146 | 6,770,185 |
| Wells Fargo & Co. | | 753,772 | 32,170,989 |
| Zions Bancorp NA | | 101,300 | 2,720,918 |
| | | | 208,591,032 |
| Capital Markets - 1.3% | | | |
| Bank of New York Mellon Corp. | | 454,237 | 20,222,631 |
| BlackRock, Inc. Class A | | 4,270 | 2,951,168 |
| Brookfield Corp. Class A | | 74,296 | 2,500,060 |
| Cboe Global Markets, Inc. | | 43,179 | 5,959,134 |
| Patria Investments Ltd. | | 238,500 | 3,410,550 |
| State Street Corp. | | 93,030 | 6,807,935 |
| StepStone Group, Inc. Class A | | 126,923 | 3,148,960 |
| UBS Group AG | | 290,700 | 5,892,489 |
| Virtu Financial, Inc. Class A | | 105,447 | 1,802,089 |
| | | | 52,695,016 |
| Consumer Finance - 0.2% | | | |
| Capital One Financial Corp. | | 15,592 | 1,705,297 |
| NerdWallet, Inc. (a) | | 48,400 | 455,444 |
| OneMain Holdings, Inc. | | 147,156 | 6,429,246 |
| | | | 8,589,987 |
| Financial Services - 2.8% | | | |
| Apollo Global Management, Inc. | | 132,287 | 10,160,964 |
| Block, Inc. Class A (a) | | 95,400 | 6,350,778 |
| Essent Group Ltd. | | 140,900 | 6,594,120 |
| Fiserv, Inc. (a) | | 131,200 | 16,550,880 |
| Global Payments, Inc. | | 55,300 | 5,448,156 |
| MGIC Investment Corp. | | 196,571 | 3,103,856 |
| Repay Holdings Corp. (a) | | 256,038 | 2,004,778 |
| Shift4 Payments, Inc. (a) | | 50,454 | 3,426,331 |
| UWM Holdings Corp. Class A (b) | | 412,174 | 2,308,174 |
| Visa, Inc. Class A | | 227,900 | 54,121,692 |
| Voya Financial, Inc. | | 82,800 | 5,937,588 |
| Worldline SA (a)(c) | | 76,253 | 2,787,444 |
| | | | 118,794,761 |
| Insurance - 3.1% | | | |
| Arthur J. Gallagher & Co. | | 32,996 | 7,244,932 |
| Beazley PLC | | 536,944 | 4,016,502 |
| Chubb Ltd. | | 132,108 | 25,438,716 |
| Direct Line Insurance Group PLC | | 1,118,215 | 1,930,671 |
| Fairfax Financial Holdings Ltd. (sub. vtg.) | | 5,826 | 4,363,904 |
| Globe Life, Inc. | | 52,363 | 5,740,032 |
| Hartford Financial Services Group, Inc. | | 163,728 | 11,791,691 |
| Marsh & McLennan Companies, Inc. | | 63,704 | 11,981,448 |
| Progressive Corp. | | 103,624 | 13,716,709 |
| Prudential PLC | | 195,671 | 2,763,539 |
| Reinsurance Group of America, Inc. | | 39,300 | 5,450,517 |
| The Travelers Companies, Inc. | | 151,060 | 26,233,080 |
| Unum Group | | 186,412 | 8,891,852 |
| | | | 129,563,593 |
TOTAL FINANCIALS | | | 518,234,389 |
| HEALTH CARE - 13.1% | | | |
| Biotechnology - 2.4% | | | |
| Acelyrin, Inc. | | 75,000 | 1,567,500 |
| Akero Therapeutics, Inc. (a) | | 69,000 | 3,221,610 |
| Allogene Therapeutics, Inc. (a) | | 275,000 | 1,366,750 |
| Alnylam Pharmaceuticals, Inc. (a) | | 8,400 | 1,595,496 |
| Ambrx Biopharma, Inc. ADR (a) | | 50,000 | 823,000 |
| Apellis Pharmaceuticals, Inc. (a) | | 40,000 | 3,644,000 |
| Arcellx, Inc. (a) | | 32,000 | 1,011,840 |
| Arcus Biosciences, Inc. (a) | | 34,000 | 690,540 |
| Arcutis Biotherapeutics, Inc. (a) | | 75,000 | 714,750 |
| Argenx SE ADR (a) | | 30,000 | 11,691,900 |
| Ascendis Pharma A/S sponsored ADR (a) | | 60,000 | 5,355,000 |
| Avidity Biosciences, Inc. (a) | | 100,000 | 1,109,000 |
| Beam Therapeutics, Inc. (a) | | 30,000 | 957,900 |
| Blueprint Medicines Corp. (a) | | 41,500 | 2,622,800 |
| Celldex Therapeutics, Inc. (a) | | 50,000 | 1,696,500 |
| Cerevel Therapeutics Holdings (a) | | 110,000 | 3,496,900 |
| Cytokinetics, Inc. (a) | | 100,000 | 3,262,000 |
| Generation Bio Co. (a) | | 70,000 | 385,000 |
| Janux Therapeutics, Inc. (a) | | 45,000 | 534,150 |
| Karuna Therapeutics, Inc. (a) | | 20,000 | 4,337,000 |
| Keros Therapeutics, Inc. (a) | | 45,000 | 1,808,100 |
| Legend Biotech Corp. ADR (a) | | 110,000 | 7,593,300 |
| Morphic Holding, Inc. (a) | | 28,000 | 1,605,240 |
| Nuvalent, Inc. Class A (a) | | 50,000 | 2,108,500 |
| Poseida Therapeutics, Inc. (a) | | 230,000 | 404,800 |
| PTC Therapeutics, Inc. (a) | | 37,000 | 1,504,790 |
| Regeneron Pharmaceuticals, Inc. (a) | | 22,100 | 15,879,734 |
| Repligen Corp. (a) | | 28,900 | 4,088,194 |
| Sarepta Therapeutics, Inc. (a) | | 16,000 | 1,832,320 |
| Shattuck Labs, Inc. (a) | | 68,600 | 214,032 |
| uniQure B.V. (a) | | 50,000 | 573,000 |
| Vaxcyte, Inc. (a) | | 82,000 | 4,095,080 |
| Vera Therapeutics, Inc. (a) | | 75,000 | 1,203,750 |
| Vertex Pharmaceuticals, Inc. (a) | | 6,000 | 2,111,460 |
| Xencor, Inc. (a) | | 90,000 | 2,247,300 |
| Xenon Pharmaceuticals, Inc. (a) | | 50,000 | 1,925,000 |
| Zentalis Pharmaceuticals, Inc. (a) | | 90,000 | 2,538,900 |
| | | | 101,817,136 |
| Health Care Equipment & Supplies - 2.8% | | | |
| Boston Scientific Corp. (a) | | 700,000 | 37,863,000 |
| Insulet Corp. (a) | | 40,800 | 11,764,272 |
| Intuitive Surgical, Inc. (a) | | 12,800 | 4,376,832 |
| iRhythm Technologies, Inc. (a) | | 27,500 | 2,868,800 |
| Masimo Corp. (a) | | 90,800 | 14,941,140 |
| Nevro Corp. (a) | | 20,000 | 508,400 |
| Novocure Ltd. (a) | | 38,500 | 1,597,750 |
| Outset Medical, Inc. (a) | | 67,000 | 1,465,290 |
| Penumbra, Inc. (a) | | 73,500 | 25,288,410 |
| PROCEPT BioRobotics Corp. (a) | | 42,500 | 1,502,375 |
| ResMed, Inc. | | 36,000 | 7,866,000 |
| Stryker Corp. | | 17,500 | 5,339,075 |
| Tandem Diabetes Care, Inc. (a) | | 40,000 | 981,600 |
| | | | 116,362,944 |
| Health Care Providers & Services - 3.6% | | | |
| Acadia Healthcare Co., Inc. (a) | | 64,000 | 5,096,960 |
| agilon health, Inc. (a) | | 700,000 | 12,138,000 |
| Alignment Healthcare, Inc. (a) | | 260,000 | 1,495,000 |
| Centene Corp. (a) | | 208,000 | 14,029,600 |
| Cigna Group | | 59,500 | 16,695,700 |
| CVS Health Corp. | | 92,000 | 6,359,960 |
| Elevance Health, Inc. | | 9,000 | 3,998,610 |
| Humana, Inc. | | 26,000 | 11,625,380 |
| LifeStance Health Group, Inc. (a) | | 360,000 | 3,286,800 |
| Molina Healthcare, Inc. (a) | | 8,500 | 2,560,540 |
| Privia Health Group, Inc. (a) | | 220,000 | 5,744,200 |
| Surgery Partners, Inc. (a) | | 250,000 | 11,247,500 |
| UnitedHealth Group, Inc. | | 114,500 | 55,033,280 |
| | | | 149,311,530 |
| Health Care Technology - 0.3% | | | |
| Doximity, Inc. (a)(b) | | 45,000 | 1,530,900 |
| Evolent Health, Inc. (a) | | 18,500 | 560,550 |
| Evolent Health, Inc. (d) | | 120,000 | 3,454,200 |
| Phreesia, Inc. (a) | | 70,000 | 2,170,700 |
| Veeva Systems, Inc. Class A (a) | | 15,000 | 2,965,950 |
| | | | 10,682,300 |
| Life Sciences Tools & Services - 2.2% | | | |
| 10X Genomics, Inc. (a) | | 112,000 | 6,254,080 |
| Bruker Corp. | | 72,000 | 5,322,240 |
| Danaher Corp. | | 136,500 | 32,760,000 |
| IQVIA Holdings, Inc. (a) | | 38,000 | 8,541,260 |
| Lonza Group AG | | 4,500 | 2,681,750 |
| Olink Holding AB ADR (a) | | 82,600 | 1,548,750 |
| Sartorius Stedim Biotech | | 11,000 | 2,745,132 |
| Thermo Fisher Scientific, Inc. | | 50,000 | 26,087,500 |
| West Pharmaceutical Services, Inc. | | 12,100 | 4,627,887 |
| | | | 90,568,599 |
| Pharmaceuticals - 1.8% | | | |
| Arvinas Holding Co. LLC (a) | | 45,000 | 1,116,900 |
| AstraZeneca PLC (United Kingdom) | | 95,000 | 13,618,656 |
| Eli Lilly & Co. | | 67,500 | 31,656,150 |
| Enliven Therapeutics, Inc. (a) | | 28,000 | 571,480 |
| Merck & Co., Inc. | | 94,000 | 10,846,660 |
| Novo Nordisk A/S Series B | | 34,000 | 5,492,355 |
| Pharvaris BV (a) | | 60,000 | 942,600 |
| Royalty Pharma PLC | | 228,000 | 7,008,720 |
| UCB SA | | 38,500 | 3,411,309 |
| Ventyx Biosciences, Inc. (a) | | 50,200 | 1,646,560 |
| Verona Pharma PLC ADR (a) | | 40,000 | 845,600 |
| | | | 77,156,990 |
TOTAL HEALTH CARE | | | 545,899,499 |
| INDUSTRIALS - 10.2% | | | |
| Aerospace & Defense - 2.2% | | | |
| Axon Enterprise, Inc. (a) | | 17,900 | 3,492,648 |
| HEICO Corp. Class A | | 25,300 | 3,557,180 |
| Howmet Aerospace, Inc. | | 131,700 | 6,527,052 |
| L3Harris Technologies, Inc. | | 46,000 | 9,005,420 |
| Lockheed Martin Corp. | | 40,900 | 18,829,542 |
| Northrop Grumman Corp. | | 15,800 | 7,201,640 |
| Raytheon Technologies Corp. | | 158,300 | 15,507,068 |
| The Boeing Co. (a) | | 124,100 | 26,204,956 |
| | | | 90,325,506 |
| Building Products - 0.7% | | | |
| Carlisle Companies, Inc. | | 43,100 | 11,056,443 |
| Trane Technologies PLC | | 99,800 | 19,087,748 |
| | | | 30,144,191 |
| Commercial Services & Supplies - 0.7% | | | |
| Cintas Corp. | | 32,100 | 15,956,268 |
| The GEO Group, Inc. (a) | | 121,715 | 871,479 |
| Waste Connections, Inc. (United States) | | 97,300 | 13,907,089 |
| | | | 30,734,836 |
| Construction & Engineering - 0.5% | | | |
| Willscot Mobile Mini Holdings (a) | | 414,500 | 19,808,955 |
| Electrical Equipment - 1.0% | | | |
| AMETEK, Inc. | | 181,500 | 29,381,220 |
| Eaton Corp. PLC | | 23,700 | 4,766,070 |
| Nextracker, Inc. Class A (b) | | 16,800 | 668,808 |
| Regal Rexnord Corp. | | 39,400 | 6,063,660 |
| | | | 40,879,758 |
| Ground Transportation - 1.4% | | | |
| CSX Corp. | | 544,300 | 18,560,630 |
| Landstar System, Inc. | | 67,300 | 12,957,942 |
| Old Dominion Freight Lines, Inc. | | 20,100 | 7,431,975 |
| Uber Technologies, Inc. (a) | | 178,800 | 7,718,796 |
| Union Pacific Corp. | | 61,200 | 12,522,744 |
| | | | 59,192,087 |
| Industrial Conglomerates - 0.2% | | | |
| Honeywell International, Inc. | | 33,500 | 6,951,250 |
| Machinery - 2.7% | | | |
| AGCO Corp. | | 76,700 | 10,079,914 |
| Caterpillar, Inc. | | 107,900 | 26,548,795 |
| Chart Industries, Inc. (a) | | 27,400 | 4,378,246 |
| Deere & Co. | | 43,400 | 17,585,246 |
| Flowserve Corp. | | 316,400 | 11,754,260 |
| Fortive Corp. | | 345,700 | 25,847,989 |
| IDEX Corp. | | 50,300 | 10,827,578 |
| ITT, Inc. | | 68,700 | 6,403,527 |
| | | | 113,425,555 |
| Marine Transportation - 0.1% | | | |
| Eagle Bulk Shipping, Inc. (b) | | 30,200 | 1,450,808 |
| Genco Shipping & Trading Ltd. (b) | | 63,900 | 896,517 |
| | | | 2,347,325 |
| Passenger Airlines - 0.4% | | | |
| Delta Air Lines, Inc. | | 242,000 | 11,504,680 |
| JetBlue Airways Corp. (a) | | 526,100 | 4,661,246 |
| | | | 16,165,926 |
| Professional Services - 0.3% | | | |
| Ceridian HCM Holding, Inc. (a) | | 90,300 | 6,047,391 |
| ExlService Holdings, Inc. (a) | | 8,800 | 1,329,328 |
| TransUnion Holding Co., Inc. | | 84,400 | 6,611,052 |
| | | | 13,987,771 |
| Trading Companies & Distributors - 0.0% | | | |
| Air Lease Corp. Class A | | 32,400 | 1,355,940 |
TOTAL INDUSTRIALS | | | 425,319,100 |
| INFORMATION TECHNOLOGY - 25.1% | | | |
| Electronic Equipment, Instruments & Components - 0.5% | | | |
| Cognex Corp. | | 49,500 | 2,772,990 |
| Corning, Inc. | | 235,200 | 8,241,408 |
| TE Connectivity Ltd. | | 63,100 | 8,844,096 |
| | | | 19,858,494 |
| IT Services - 2.2% | | | |
| Akamai Technologies, Inc. (a) | | 95,500 | 8,582,585 |
| Capgemini SA | | 75,200 | 14,238,560 |
| Cognizant Technology Solutions Corp. Class A | | 249,400 | 16,280,832 |
| EPAM Systems, Inc. (a) | | 27,100 | 6,090,725 |
| GoDaddy, Inc. (a) | | 127,700 | 9,594,101 |
| MongoDB, Inc. Class A (a) | | 32,900 | 13,521,571 |
| Shopify, Inc. Class A (a) | | 23,400 | 1,511,640 |
| Snowflake, Inc. (a) | | 55,000 | 9,678,900 |
| Twilio, Inc. Class A (a) | | 148,400 | 9,441,208 |
| Wix.com Ltd. (a) | | 21,500 | 1,682,160 |
| | | | 90,622,282 |
| Semiconductors & Semiconductor Equipment - 4.1% | | | |
| Advanced Micro Devices, Inc. (a) | | 87,910 | 10,013,828 |
| Analog Devices, Inc. | | 196,900 | 38,358,089 |
| Intel Corp. | | 263,000 | 8,794,720 |
| Marvell Technology, Inc. | | 87,200 | 5,212,816 |
| Microchip Technology, Inc. | | 112,000 | 10,034,080 |
| Micron Technology, Inc. | | 376,300 | 23,748,293 |
| NVIDIA Corp. | | 142,200 | 60,153,444 |
| ON Semiconductor Corp. (a) | | 44,200 | 4,180,436 |
| Skyworks Solutions, Inc. | | 35,900 | 3,973,771 |
| SolarEdge Technologies, Inc. (a) | | 24,000 | 6,457,200 |
| | | | 170,926,677 |
| Software - 12.5% | | | |
| Adobe, Inc. (a) | | 104,200 | 50,952,758 |
| Aspen Technology, Inc. (a) | | 15,816 | 2,650,920 |
| Atlassian Corp. PLC (a) | | 54,100 | 9,078,521 |
| Autodesk, Inc. (a) | | 84,600 | 17,310,006 |
| Blackbaud, Inc. (a) | | 54,700 | 3,893,546 |
| Constellation Software, Inc. | | 2,600 | 5,386,961 |
| Elastic NV (a) | | 104,500 | 6,700,540 |
| Five9, Inc. (a) | | 99,144 | 8,174,423 |
| Gen Digital, Inc. | | 369,542 | 6,855,004 |
| HubSpot, Inc. (a) | | 24,500 | 13,036,205 |
| Lumine Group, Inc. | | 9,001 | 123,456 |
| Microsoft Corp. | | 843,300 | 287,177,378 |
| New Relic, Inc. (a) | | 22,400 | 1,465,856 |
| Palo Alto Networks, Inc. (a) | | 55,200 | 14,104,152 |
| PTC, Inc. (a) | | 71,200 | 10,131,760 |
| Roper Technologies, Inc. | | 7,200 | 3,461,760 |
| Salesforce, Inc. (a) | | 235,100 | 49,667,226 |
| Tenable Holdings, Inc. (a) | | 240,100 | 10,456,355 |
| Workday, Inc. Class A (a) | | 77,900 | 17,596,831 |
| Workiva, Inc. (a) | | 39,076 | 3,972,466 |
| | | | 522,196,124 |
| Technology Hardware, Storage & Peripherals - 5.8% | | | |
| Apple, Inc. | | 1,245,700 | 241,628,429 |
| Western Digital Corp. (a) | | 81,800 | 3,102,674 |
| | | | 244,731,103 |
TOTAL INFORMATION TECHNOLOGY | | | 1,048,334,680 |
| MATERIALS - 2.7% | | | |
| Chemicals - 1.7% | | | |
| Air Products & Chemicals, Inc. | | 20,100 | 6,020,553 |
| Ashland, Inc. | | 17,800 | 1,546,998 |
| Cabot Corp. | | 37,300 | 2,494,997 |
| Celanese Corp. Class A | | 42,700 | 4,944,660 |
| Chemtrade Logistics Income Fund | | 225,200 | 1,392,254 |
| Corteva, Inc. | | 106,800 | 6,119,640 |
| Dow, Inc. | | 22,200 | 1,182,372 |
| DuPont de Nemours, Inc. | | 62,300 | 4,450,712 |
| Eastman Chemical Co. | | 7,700 | 644,644 |
| Element Solutions, Inc. | | 41,500 | 796,800 |
| Huntsman Corp. | | 27,900 | 753,858 |
| Linde PLC | | 60,900 | 23,207,772 |
| LyondellBasell Industries NV Class A | | 62,500 | 5,739,375 |
| Olin Corp. | | 55,900 | 2,872,701 |
| Orion SA | | 21,200 | 449,864 |
| RPM International, Inc. | | 6,000 | 538,380 |
| The Chemours Co. LLC | | 106,000 | 3,910,340 |
| Tronox Holdings PLC | | 198,400 | 2,521,664 |
| Westlake Corp. | | 14,900 | 1,780,103 |
| | | | 71,367,687 |
| Construction Materials - 0.2% | | | |
| Martin Marietta Materials, Inc. | | 6,600 | 3,047,154 |
| Vulcan Materials Co. | | 14,000 | 3,156,160 |
| | | | 6,203,314 |
| Containers & Packaging - 0.2% | | | |
| Aptargroup, Inc. | | 27,100 | 3,139,806 |
| Avery Dennison Corp. | | 10,900 | 1,872,620 |
| Crown Holdings, Inc. | | 20,000 | 1,737,400 |
| Greif, Inc. Class A | | 38,000 | 2,617,820 |
| | | | 9,367,646 |
| Metals & Mining - 0.6% | | | |
| Alcoa Corp. | | 14,100 | 478,413 |
| Commercial Metals Co. | | 35,200 | 1,853,632 |
| First Quantum Minerals Ltd. | | 243,700 | 5,765,283 |
| Franco-Nevada Corp. | | 12,700 | 1,810,068 |
| Freeport-McMoRan, Inc. | | 201,500 | 8,060,000 |
| Glencore PLC | | 211,700 | 1,200,315 |
| Horizonte Minerals PLC (a) | | 399,600 | 730,788 |
| Ivanhoe Mines Ltd. (a) | | 129,600 | 1,183,740 |
| Major Drilling Group International, Inc. (a) | | 84,100 | 580,241 |
| Reliance Steel & Aluminum Co. | | 10,300 | 2,797,377 |
| Steel Dynamics, Inc. | | 11,400 | 1,241,802 |
| Wheaton Precious Metals Corp. | | 17,700 | 765,452 |
| | | | 26,467,111 |
TOTAL MATERIALS | | | 113,405,758 |
| REAL ESTATE - 2.8% | | | |
| Equity Real Estate Investment Trusts (REITs) - 2.7% | | | |
| Alexandria Real Estate Equities, Inc. | | 22,800 | 2,587,572 |
| American Tower Corp. | | 40,700 | 7,893,358 |
| Crown Castle International Corp. | | 83,600 | 9,525,384 |
| CubeSmart | | 180,600 | 8,065,596 |
| Digital Realty Trust, Inc. | | 29,500 | 3,359,165 |
| EastGroup Properties, Inc. | | 12,800 | 2,222,080 |
| Equinix, Inc. | | 14,050 | 11,014,357 |
| Equity Lifestyle Properties, Inc. | | 63,200 | 4,227,448 |
| Essex Property Trust, Inc. | | 20,800 | 4,873,440 |
| Extra Space Storage, Inc. | | 10,900 | 1,622,465 |
| Four Corners Property Trust, Inc. | | 149,600 | 3,799,840 |
| Invitation Homes, Inc. | | 108,500 | 3,732,400 |
| Lamar Advertising Co. Class A | | 28,300 | 2,808,775 |
| Mid-America Apartment Communities, Inc. | | 36,900 | 5,603,634 |
| Outfront Media, Inc. | | 52,500 | 825,300 |
| Prologis (REIT), Inc. | | 109,465 | 13,423,693 |
| Ryman Hospitality Properties, Inc. | | 37,800 | 3,512,376 |
| SITE Centers Corp. | | 190,800 | 2,522,376 |
| Spirit Realty Capital, Inc. | | 48,000 | 1,890,240 |
| Tanger Factory Outlet Centers, Inc. | | 17,000 | 375,190 |
| Terreno Realty Corp. | | 27,800 | 1,670,780 |
| UDR, Inc. | | 59,000 | 2,534,640 |
| Urban Edge Properties | | 153,100 | 2,362,333 |
| Ventas, Inc. | | 138,600 | 6,551,622 |
| VICI Properties, Inc. | | 43,100 | 1,354,633 |
| Welltower, Inc. | | 53,200 | 4,303,348 |
| | | | 112,662,045 |
| Real Estate Management & Development - 0.1% | | | |
| CBRE Group, Inc. (a) | | 60,400 | 4,874,884 |
| Doma Holdings, Inc. Class A (a)(b) | | 44,408 | 219,376 |
| Jones Lang LaSalle, Inc. (a) | | 9,600 | 1,495,680 |
| WeWork, Inc. (a) | | 334,800 | 85,508 |
| | | | 6,675,448 |
TOTAL REAL ESTATE | | | 119,337,493 |
| UTILITIES - 2.5% | | | |
| Electric Utilities - 1.6% | | | |
| Constellation Energy Corp. | | 84,373 | 7,724,348 |
| Duke Energy Corp. | | 23,600 | 2,117,864 |
| Edison International | | 85,000 | 5,903,250 |
| FirstEnergy Corp. | | 73,800 | 2,869,344 |
| NextEra Energy, Inc. | | 201,565 | 14,956,123 |
| NRG Energy, Inc. | | 44,600 | 1,667,594 |
| PG&E Corp. (a) | | 556,357 | 9,613,849 |
| Pinnacle West Capital Corp. | | 28,200 | 2,297,172 |
| PPL Corp. | | 91,400 | 2,418,444 |
| Southern Co. | | 214,200 | 15,047,550 |
| | | | 64,615,538 |
| Independent Power and Renewable Electricity Producers - 0.2% | | | |
| Clearway Energy, Inc. Class A | | 11,800 | 318,600 |
| Energy Harbor Corp. (a) | | 18,700 | 1,444,575 |
| NextEra Energy Partners LP | | 20,400 | 1,196,256 |
| Sunnova Energy International, Inc. (a)(b) | | 28,000 | 512,680 |
| The AES Corp. | | 66,500 | 1,378,545 |
| Vistra Corp. | | 141,200 | 3,706,500 |
| | | | 8,557,156 |
| Multi-Utilities - 0.6% | | | |
| Dominion Energy, Inc. | | 110,500 | 5,722,795 |
| DTE Energy Co. | | 29,000 | 3,190,580 |
| NiSource, Inc. | | 159,500 | 4,362,325 |
| Public Service Enterprise Group, Inc. | | 78,600 | 4,921,146 |
| Sempra Energy | | 53,600 | 7,803,624 |
| | | | 26,000,470 |
| Water Utilities - 0.1% | | | |
| American Water Works Co., Inc. | | 27,100 | 3,868,525 |
TOTAL UTILITIES | | | 103,041,689 |
| TOTAL COMMON STOCKS (Cost $4,050,486,318) | | | 4,107,515,672 |
| | | | |
| Convertible Preferred Stocks - 0.0% |
| | | Shares | Value ($) |
| FINANCIALS - 0.0% | | | |
| Financial Services - 0.0% | | | |
Saluda Medical, Inc. Series E (d)(e) (Cost $607,788) | | 75,279 | 605,996 |
| | | | |
| Convertible Bonds - 0.0% |
| | | Principal Amount (f) | Value ($) |
| FINANCIALS - 0.0% | | | |
| Financial Services - 0.0% | | | |
Affirm Holdings, Inc. 0% 11/15/26 (Cost $1,693,594) | | 2,525,000 | 1,863,703 |
| | | | |
| U.S. Treasury Obligations - 0.0% |
| | | Principal Amount (f) | Value ($) |
U.S. Treasury Bills, yield at date of purchase 5.23% to 5.29% 8/31/23 to 9/28/23 (g) (Cost $941,368) | | 950,000 | 941,723 |
| | | | |
| Money Market Funds - 1.6% |
| | | Shares | Value ($) |
| Fidelity Cash Central Fund 5.14% (h) | | 54,420,421 | 54,431,305 |
| Fidelity Securities Lending Cash Central Fund 5.14% (h)(i) | | 10,836,760 | 10,837,844 |
| TOTAL MONEY MARKET FUNDS (Cost $65,269,149) | | | 65,269,149 |
| | | | |
| TOTAL INVESTMENT IN SECURITIES - 100.0% (Cost $4,118,998,217) | 4,176,196,243 |
NET OTHER ASSETS (LIABILITIES) - 0.0% | (1,399,896) |
| NET ASSETS - 100.0% | 4,174,796,347 |
| | |
| Futures Contracts |
| | Number of contracts | Expiration Date | Notional Amount ($) | Value ($) | Unrealized Appreciation/ (Depreciation) ($) |
| Purchased | | | | | |
| | | | | | |
| Equity Index Contracts | | | | | |
| CME E-mini S&P 500 Index Contracts (United States) | 99 | Sep 2023 | 22,216,838 | 243,429 | 243,429 |
| | | | | | |
| The notional amount of futures purchased as a percentage of Net Assets is 0.5% |
Legend
| (b) | Security or a portion of the security is on loan at period end. |
| (c) | Security exempt from registration under Rule 144A of the Securities Act of 1933. These securities may be resold in transactions exempt from registration, normally to qualified institutional buyers. At the end of the period, the value of these securities amounted to $2,787,444 or 0.1% of net assets. |
| (d) | Restricted securities (including private placements) - Investment in securities not registered under the Securities Act of 1933 (excluding 144A issues). At the end of the period, the value of restricted securities (excluding 144A issues) amounted to $4,060,196 or 0.1% of net assets. |
| (f) | Amount is stated in United States dollars unless otherwise noted. |
| (g) | Security or a portion of the security was pledged to cover margin requirements for futures contracts. At period end, the value of securities pledged amounted to $941,723. |
| (h) | Affiliated fund that is generally available only to investment companies and other accounts managed by Fidelity Investments. The rate quoted is the annualized seven-day yield of the fund at period end. A complete unaudited listing of the fund's holdings as of its most recent quarter end is available upon request. In addition, each Fidelity Central Fund's financial statements are available on the SEC's website or upon request. |
| (i) | Investment made with cash collateral received from securities on loan. |
| Additional information on each restricted holding is as follows: |
| Security | Acquisition Date | Acquisition Cost ($) |
| Evolent Health, Inc. | 3/28/23 | 3,480,000 |
| | | |
| Saluda Medical, Inc. Series E | 4/06/23 | 607,788 |
| | | |
Affiliated Central Funds
Fiscal year to date information regarding the Fund's investments in Fidelity Central Funds, including the ownership percentage, is presented below.
| Affiliate | Value, beginning of period ($) | Purchases ($) | Sales Proceeds ($) | Dividend Income ($) | Realized Gain (loss) ($) | Change in Unrealized appreciation (depreciation) ($) | Value, end of period ($) | % ownership, end of period |
| Fidelity Cash Central Fund 5.14% | 29,677,895 | 550,452,744 | 525,699,334 | 1,050,932 | - | - | 54,431,305 | 0.1% |
| Fidelity Securities Lending Cash Central Fund 5.14% | 6,805,625 | 66,149,530 | 62,117,311 | 69,536 | - | - | 10,837,844 | 0.0% |
| Total | 36,483,520 | 616,602,274 | 587,816,645 | 1,120,468 | - | - | 65,269,149 | |
| | | | | | | | | |
Amounts in the dividend income column in the above table include any capital gain distributions from underlying funds, which are presented in the corresponding line item in the Statement of Operations, if applicable.
Amounts in the dividend income column for Fidelity Securities Lending Cash Central Fund represents the income earned on investing cash collateral, less rebates paid to borrowers and any lending agent fees associated with the loan, plus any premium payments received for lending certain types of securities.
Amounts included in the purchases and sales proceeds columns may include in-kind transactions, if applicable.
Investment Valuation
The following is a summary of the inputs used, as of June 30, 2023, involving the Fund's assets and liabilities carried at fair value. The inputs or methodology used for valuing securities may not be an indication of the risk associated with investing in those securities. For more information on valuation inputs, and their aggregation into the levels used below, please refer to the Investment Valuation section in the accompanying Notes to Financial Statements.
| Valuation Inputs at Reporting Date: |
| Description | Total ($) | Level 1 ($) | Level 2 ($) | Level 3 ($) |
Investments in Securities: | | | | |
|
| Equities: | | | | |
Communication Services | 349,181,148 | 349,181,148 | - | - |
Consumer Discretionary | 432,220,361 | 426,569,649 | 5,650,712 | - |
Consumer Staples | 278,640,339 | 276,145,571 | 2,494,768 | - |
Energy | 173,901,216 | 173,901,216 | - | - |
Financials | 518,840,385 | 490,822,818 | 27,411,571 | 605,996 |
Health Care | 545,899,499 | 523,334,288 | 22,565,211 | - |
Industrials | 425,319,100 | 425,319,100 | - | - |
Information Technology | 1,048,334,680 | 1,034,096,120 | 14,238,560 | - |
Materials | 113,405,758 | 112,205,443 | 1,200,315 | - |
Real Estate | 119,337,493 | 119,337,493 | - | - |
Utilities | 103,041,689 | 103,041,689 | - | - |
|
| Corporate Bonds | 1,863,703 | - | 1,863,703 | - |
|
| U.S. Government and Government Agency Obligations | 941,723 | - | 941,723 | - |
|
| Money Market Funds | 65,269,149 | 65,269,149 | - | - |
| Total Investments in Securities: | 4,176,196,243 | 4,099,223,684 | 76,366,563 | 605,996 |
Derivative Instruments: | | | | |
|
| Assets | | | | |
Futures Contracts | 243,429 | 243,429 | - | - |
| Total Assets | 243,429 | 243,429 | - | - |
| Total Derivative Instruments: | 243,429 | 243,429 | - | - |
Value of Derivative Instruments
The following table is a summary of the Fund's value of derivative instruments by primary risk exposure as of June 30, 2023. For additional information on derivative instruments, please refer to the Derivative Instruments section in the accompanying Notes to Financial Statements.
Primary Risk Exposure / Derivative Type | Value |
| Asset ($) | Liability ($) |
| Equity Risk | | |
Futures Contracts (a) | 243,429 | 0 |
| Total Equity Risk | 243,429 | 0 |
| Total Value of Derivatives | 243,429 | 0 |
(a)Reflects gross cumulative appreciation (depreciation) on futures contracts as presented in the Schedule of Investments. In the Statement of Assets and Liabilities, the period end daily variation margin is included in receivable or payable for daily variation margin on futures contracts, and the net cumulative appreciation (depreciation) is included in Total accumulated earnings (loss).
| Statement of Assets and Liabilities |
| | | | June 30, 2023 (Unaudited) |
| | | | | |
| Assets | | | | |
| Investment in securities, at value (including securities loaned of $9,830,352) - See accompanying schedule: | | | | |
Unaffiliated issuers (cost $4,053,729,068) | $ | 4,110,927,094 | | |
Fidelity Central Funds (cost $65,269,149) | | 65,269,149 | | |
| | | | | |
| | | | | |
| Total Investment in Securities (cost $4,118,998,217) | | | $ | 4,176,196,243 |
| Foreign currency held at value (cost $117,328) | | | | 117,328 |
| Receivable for investments sold | | | | 20,709,044 |
| Receivable for fund shares sold | | | | 468,529 |
| Dividends receivable | | | | 2,660,980 |
| Distributions receivable from Fidelity Central Funds | | | | 239,608 |
| Receivable for daily variation margin on futures contracts | | | | 218,614 |
Total assets | | | | 4,200,610,346 |
| Liabilities | | | | |
| Payable to custodian bank | $ | 2,797,003 | | |
| Payable for investments purchased | | 8,849,822 | | |
| Payable for fund shares redeemed | | 1,030,652 | | |
| Accrued management fee | | 1,690,141 | | |
| Distribution and service plan fees payable | | 27 | | |
| Other affiliated payables | | 550,047 | | |
| Other payables and accrued expenses | | 58,463 | | |
| Collateral on securities loaned | | 10,837,844 | | |
| Total Liabilities | | | | 25,813,999 |
| Net Assets | | | $ | 4,174,796,347 |
| Net Assets consist of: | | | | |
| Paid in capital | | | $ | 4,645,583,330 |
| Total accumulated earnings (loss) | | | | (470,786,983) |
| Net Assets | | | $ | 4,174,796,347 |
| | | | | |
| Net Asset Value and Maximum Offering Price | | | | |
| Initial Class : | | | | |
Net Asset Value , offering price and redemption price per share ($94,789 ÷ 10,000 shares) | | | $ | 9.48 |
| Service Class : | | | | |
Net Asset Value , offering price and redemption price per share ($94,747 ÷ 10,000 shares) | | | $ | 9.47 |
| Service Class 2 : | | | | |
Net Asset Value , offering price and redemption price per share ($94,681 ÷ 10,000 shares) | | | $ | 9.47 |
| Investor Class : | | | | |
Net Asset Value , offering price and redemption price per share ($4,174,512,130 ÷ 440,447,579 shares) | | | $ | 9.48 |
| Statement of Operations |
| | | | Six months ended June 30, 2023 (Unaudited) |
| Investment Income | | | | |
| Dividends | | | $ | 27,026,946 |
| Interest | | | | 123,581 |
| Income from Fidelity Central Funds (including $69,536 from security lending) | | | | 1,120,468 |
| Total Income | | | | 28,270,995 |
| Expenses | | | | |
| Management fee | | | | |
| Basic fee | $ | 10,543,534 | | |
| Performance adjustment | | (311,892) | | |
| Transfer agent fees | | 2,790,421 | | |
| Distribution and service plan fees | | 154 | | |
| Accounting fees | | 459,060 | | |
| Custodian fees and expenses | | 112,225 | | |
| Independent trustees' fees and expenses | | 14,214 | | |
| Audit | | 22,568 | | |
| Legal | | 5,816 | | |
| Interest | | 28,969 | | |
| Miscellaneous | | 12,545 | | |
| Total expenses before reductions | | 13,677,614 | | |
| Expense reductions | | (92,054) | | |
| Total expenses after reductions | | | | 13,585,560 |
| Net Investment income (loss) | | | | 14,685,435 |
| Realized and Unrealized Gain (Loss) | | | | |
| Net realized gain (loss) on: | | | | |
| Investment Securities: | | | | |
| Unaffiliated issuers | | (152,030,609) | | |
| Foreign currency transactions | | (35,895) | | |
| Futures contracts | | 823,380 | | |
| Total net realized gain (loss) | | | | (151,243,124) |
| Change in net unrealized appreciation (depreciation) on: | | | | |
| Investment Securities: | | | | |
| Unaffiliated issuers | | 758,163,359 | | |
| Assets and liabilities in foreign currencies | | 4,054 | | |
| Futures contracts | | 276,735 | | |
| Total change in net unrealized appreciation (depreciation) | | | | 758,444,148 |
| Net gain (loss) | | | | 607,201,024 |
| Net increase (decrease) in net assets resulting from operations | | | $ | 621,886,459 |
| Statement of Changes in Net Assets |
| |
| | Six months ended June 30, 2023 (Unaudited) | | Year ended December 31, 2022 |
| Increase (Decrease) in Net Assets | | | | |
| Operations | | | | |
| Net investment income (loss) | $ | 14,685,435 | $ | 26,908,621 |
| Net realized gain (loss) | | (151,243,124) | | (372,818,816) |
| Change in net unrealized appreciation (depreciation) | | 758,444,148 | | (813,339,493) |
| Net increase (decrease) in net assets resulting from operations | | 621,886,459 | | (1,159,249,688) |
| Distributions to shareholders | | - | | (29,166,377) |
| | | | | |
| Share transactions - net increase (decrease) | | (409,159,548) | | (942,758,718) |
| Total increase (decrease) in net assets | | 212,726,911 | | (2,131,174,783) |
| | | | | |
| Net Assets | | | | |
| Beginning of period | | 3,962,069,436 | | 6,093,244,219 |
| End of period | $ | 4,174,796,347 | $ | 3,962,069,436 |
| | | | | |
| | | | | |
| VIP Stock Selector All Cap Portfolio Initial Class |
| |
| | Six months ended (Unaudited) June 30, 2023 | | Years ended December 31, 2022 | | 2021 A |
Selected Per-Share Data | | | | | | |
| Net asset value, beginning of period | $ | 8.12 | $ | 10.16 | $ | 10.00 |
| Income from Investment Operations | | | | | | |
Net investment income (loss) B,C | | .04 | | .05 | | .01 |
| Net realized and unrealized gain (loss) | | 1.32 | | (2.02) | | .16 |
| Total from investment operations | | 1.36 | | (1.97) | | .17 |
| Distributions from net investment income | | - | | (.07) | | (.01) |
| Total distributions | | - | | (.07) | | (.01) |
| Net asset value, end of period | $ | 9.48 | $ | 8.12 | $ | 10.16 |
Total Return D,E,F | | 16.75% | | (19.42)% | | 1.73% |
Ratios to Average Net Assets C,G,H | | | | | | |
| Expenses before reductions | | .61% I | | .61% | | .61% I,J |
| Expenses net of fee waivers, if any | | .60% I | | .61% | | .61% I,J |
| Expenses net of all reductions | | .60% I | | .61% | | .61% I,J |
| Net investment income (loss) | | .81% I | | .63% | | .52% I,J |
| Supplemental Data | | | | | | |
| Net assets, end of period (000 omitted) | $ | 95 | $ | 81 | $ | 102 |
Portfolio turnover rate K | | 40% I | | 29% | | 159% L,M |
A For the period October 21, 2021 (commencement of operations) through December 31, 2021
B Calculated based on average shares outstanding during the period.
C Net investment income (loss) is affected by the timing of the declaration of dividends by any underlying mutual funds or exchange-traded funds (ETFs). Net investment income (loss) of any mutual funds or ETFs is not included in the Fund's net investment income (loss) ratio.
D Total returns for periods of less than one year are not annualized.
E Total returns do not reflect charges attributable to your insurance company's separate account. Inclusion of these charges would reduce the total returns shown.
F Total returns would have been lower if certain expenses had not been reduced during the applicable periods shown.
G Fees and expenses of any underlying mutual funds or exchange-traded funds (ETFs) are not included in the Fund's expense ratio. The Fund indirectly bears its proportionate share of these expenses. For additional expense information related to investments in Fidelity Central Funds, please refer to the "Investments in Fidelity Central Funds" note found in the Notes to Financial Statements section of the most recent Annual or Semi-Annual report.
H Expense ratios reflect operating expenses of the class. Expenses before reductions do not reflect amounts reimbursed, waived, or reduced through arrangements with the investment adviser, brokerage services, or other offset arrangements, if applicable, and do not represent the amount paid by the class during periods when reimbursements, waivers or reductions occur.
I Annualized.
J Audit fees are not annualized.
K Amount does not include the portfolio activity of any underlying mutual funds or exchange-traded funds (ETFs).
L Amount not annualized.
M Portfolio turnover rate excludes securities received or delivered in-kind.
| VIP Stock Selector All Cap Portfolio Service Class |
| |
| | Six months ended (Unaudited) June 30, 2023 | | Years ended December 31, 2022 | | 2021 A |
Selected Per-Share Data | | | | | | |
| Net asset value, beginning of period | $ | 8.12 | $ | 10.16 | $ | 10.00 |
| Income from Investment Operations | | | | | | |
Net investment income (loss) B,C | | .03 | | .05 | | .01 |
| Net realized and unrealized gain (loss) | | 1.32 | | (2.03) | | .16 |
| Total from investment operations | | 1.35 | | (1.98) | | .17 |
| Distributions from net investment income | | - | | (.06) | | (.01) |
| Total distributions | | - | | (.06) | | (.01) |
| Net asset value, end of period | $ | 9.47 | $ | 8.12 | $ | 10.16 |
Total Return D,E,F | | 16.63% | | (19.51)% | | 1.71% |
Ratios to Average Net Assets C,G,H | | | | | | |
| Expenses before reductions | | .71% I | | .71% | | .71% I,J |
| Expenses net of fee waivers, if any | | .70% I | | .71% | | .71% I,J |
| Expenses net of all reductions | | .70% I | | .71% | | .71% I,J |
| Net investment income (loss) | | .71% I | | .53% | | .41% I,J |
| Supplemental Data | | | | | | |
| Net assets, end of period (000 omitted) | $ | 95 | $ | 81 | $ | 102 |
Portfolio turnover rate K | | 40% I | | 29% | | 159% L,M |
A For the period October 21, 2021 (commencement of operations) through December 31, 2021
B Calculated based on average shares outstanding during the period.
C Net investment income (loss) is affected by the timing of the declaration of dividends by any underlying mutual funds or exchange-traded funds (ETFs). Net investment income (loss) of any mutual funds or ETFs is not included in the Fund's net investment income (loss) ratio.
D Total returns for periods of less than one year are not annualized.
E Total returns do not reflect charges attributable to your insurance company's separate account. Inclusion of these charges would reduce the total returns shown.
F Total returns would have been lower if certain expenses had not been reduced during the applicable periods shown.
G Fees and expenses of any underlying mutual funds or exchange-traded funds (ETFs) are not included in the Fund's expense ratio. The Fund indirectly bears its proportionate share of these expenses. For additional expense information related to investments in Fidelity Central Funds, please refer to the "Investments in Fidelity Central Funds" note found in the Notes to Financial Statements section of the most recent Annual or Semi-Annual report.
H Expense ratios reflect operating expenses of the class. Expenses before reductions do not reflect amounts reimbursed, waived, or reduced through arrangements with the investment adviser, brokerage services, or other offset arrangements, if applicable, and do not represent the amount paid by the class during periods when reimbursements, waivers or reductions occur.
I Annualized.
J Audit fees are not annualized.
K Amount does not include the portfolio activity of any underlying mutual funds or exchange-traded funds (ETFs).
L Portfolio turnover rate excludes securities received or delivered in-kind.
M Amount not annualized.
| VIP Stock Selector All Cap Portfolio Service Class 2 |
| |
| | Six months ended (Unaudited) June 30, 2023 | | Years ended December 31, 2022 | | 2021 A |
Selected Per-Share Data | | | | | | |
| Net asset value, beginning of period | $ | 8.12 | $ | 10.16 | $ | 10.00 |
| Income from Investment Operations | | | | | | |
Net investment income (loss) B,C | | .02 | | .03 | | .01 |
| Net realized and unrealized gain (loss) | | 1.33 | | (2.02) | | .16 |
| Total from investment operations | | 1.35 | | (1.99) | | .17 |
| Distributions from net investment income | | - | | (.05) | | (.01) |
| Total distributions | | - | | (.05) | | (.01) |
| Net asset value, end of period | $ | 9.47 | $ | 8.12 | $ | 10.16 |
Total Return D,E,F | | 16.63% | | (19.63)% | | 1.68% |
Ratios to Average Net Assets C,G,H | | | | | | |
| Expenses before reductions | | .86% I | | .86% | | .86% I,J |
| Expenses net of fee waivers, if any | | .85% I | | .86% | | .86% I,J |
| Expenses net of all reductions | | .85% I | | .86% | | .86% I,J |
| Net investment income (loss) | | .56% I | | .38% | | .26% I,J |
| Supplemental Data | | | | | | |
| Net assets, end of period (000 omitted) | $ | 95 | $ | 81 | $ | 102 |
Portfolio turnover rate K | | 40% I | | 29% | | 159% L,M |
A For the period October 21, 2021 (commencement of operations) through December 31, 2021
B Calculated based on average shares outstanding during the period.
C Net investment income (loss) is affected by the timing of the declaration of dividends by any underlying mutual funds or exchange-traded funds (ETFs). Net investment income (loss) of any mutual funds or ETFs is not included in the Fund's net investment income (loss) ratio.
D Total returns for periods of less than one year are not annualized.
E Total returns do not reflect charges attributable to your insurance company's separate account. Inclusion of these charges would reduce the total returns shown.
F Total returns would have been lower if certain expenses had not been reduced during the applicable periods shown.
G Fees and expenses of any underlying mutual funds or exchange-traded funds (ETFs) are not included in the Fund's expense ratio. The Fund indirectly bears its proportionate share of these expenses. For additional expense information related to investments in Fidelity Central Funds, please refer to the "Investments in Fidelity Central Funds" note found in the Notes to Financial Statements section of the most recent Annual or Semi-Annual report.
H Expense ratios reflect operating expenses of the class. Expenses before reductions do not reflect amounts reimbursed, waived, or reduced through arrangements with the investment adviser, brokerage services, or other offset arrangements, if applicable, and do not represent the amount paid by the class during periods when reimbursements, waivers or reductions occur.
I Annualized.
J Audit fees are not annualized.
K Amount does not include the portfolio activity of any underlying mutual funds or exchange-traded funds (ETFs).
L Portfolio turnover rate excludes securities received or delivered in-kind.
M Amount not annualized.
| VIP Stock Selector All Cap Portfolio Investor Class |
| |
| | Six months ended (Unaudited) June 30, 2023 | | Years ended December 31, 2022 | | 2021 A |
Selected Per-Share Data | | | | | | |
| Net asset value, beginning of period | $ | 8.12 | $ | 10.16 | $ | 10.00 |
| Income from Investment Operations | | | | | | |
Net investment income (loss) B,C | | .03 | | .05 | | .01 |
| Net realized and unrealized gain (loss) | | 1.33 | | (2.03) | | .16 |
| Total from investment operations | | 1.36 | | (1.98) | | .17 |
| Distributions from net investment income | | - | | (.06) | | (.01) |
| Total distributions | | - | | (.06) | | (.01) |
| Net asset value, end of period | $ | 9.48 | $ | 8.12 | $ | 10.16 |
Total Return D,E,F | | 16.75% | | (19.51)% | | 1.72% |
Ratios to Average Net Assets B,G,H | | | | | | |
| Expenses before reductions | | .68% I | | .68% | | .68% I,J |
| Expenses net of fee waivers, if any | | .68% I | | .68% | | .68% I,J |
| Expenses net of all reductions | | .68% I | | .68% | | .68% I,J |
| Net investment income (loss) | | .73% I | | .56% | | .44% I,J |
| Supplemental Data | | | | | | |
| Net assets, end of period (000 omitted) | $ | 4,174,512 | $ | 3,961,826 | $ | 6,092,940 |
Portfolio turnover rate K | | 40% I | | 29% | | 159% L,M |
A For the period October 21, 2021 (commencement of operations) through December 31, 2021
B Net investment income (loss) is affected by the timing of the declaration of dividends by any underlying mutual funds or exchange-traded funds (ETFs). Net investment income (loss) of any mutual funds or ETFs is not included in the Fund's net investment income (loss) ratio.
C Calculated based on average shares outstanding during the period.
D Total returns for periods of less than one year are not annualized.
E Total returns do not reflect charges attributable to your insurance company's separate account. Inclusion of these charges would reduce the total returns shown.
F Total returns would have been lower if certain expenses had not been reduced during the applicable periods shown.
G Fees and expenses of any underlying mutual funds or exchange-traded funds (ETFs) are not included in the Fund's expense ratio. The Fund indirectly bears its proportionate share of these expenses. For additional expense information related to investments in Fidelity Central Funds, please refer to the "Investments in Fidelity Central Funds" note found in the Notes to Financial Statements section of the most recent Annual or Semi-Annual report.
H Expense ratios reflect operating expenses of the class. Expenses before reductions do not reflect amounts reimbursed, waived, or reduced through arrangements with the investment adviser, brokerage services, or other offset arrangements, if applicable, and do not represent the amount paid by the class during periods when reimbursements, waivers or reductions occur.
I Annualized.
J Audit fees are not annualized.
K Amount does not include the portfolio activity of any underlying mutual funds or exchange-traded funds (ETFs).
L Amount not annualized.
M Portfolio turnover rate excludes securities received or delivered in-kind.
For the period ended June 30, 2023
1. Organization.
VIP Stock Selector All Cap Portfolio (the Fund) is a fund of Variable Insurance Products Fund (the Trust) and is authorized to issue an unlimited number of shares. The Trust is registered under the Investment Company Act of 1940, as amended (the 1940 Act), as an open-end management investment company organized as a Massachusetts business trust. Shares of the Fund may only be purchased by insurance companies for the purpose of funding variable annuity or variable life insurance contracts. The Fund offers the following classes of shares: Initial Class shares, Service Class shares, Service Class 2 shares and Investor Class shares. All classes have equal rights and voting privileges, except for matters affecting a single class.
2. Investments in Fidelity Central Funds.
Funds may invest in Fidelity Central Funds, which are open-end investment companies generally available only to other investment companies and accounts managed by the investment adviser and its affiliates. The Schedule of Investments lists any Fidelity Central Funds held as an investment as of period end, but does not include the underlying holdings of each Fidelity Central Fund. An investing fund indirectly bears its proportionate share of the expenses of the underlying Fidelity Central Funds.
Based on its investment objective, each Fidelity Central Fund may invest or participate in various investment vehicles or strategies that are similar to those of the investing fund. These strategies are consistent with the investment objectives of the investing fund and may involve certain economic risks which may cause a decline in value of each of the Fidelity Central Funds and thus a decline in the value of the investing fund.
| Fidelity Central Fund | Investment Manager | Investment Objective | Investment Practices | Expense Ratio A |
| Fidelity Money Market Central Funds | Fidelity Management & Research Company LLC (FMR) | Each fund seeks to obtain a high level of current income consistent with the preservation of capital and liquidity. | Short-term Investments | Less than .005% |
A Expenses expressed as a percentage of average net assets and are as of each underlying Central Fund's most recent annual or semi-annual shareholder report.
A complete unaudited list of holdings for each Fidelity Central Fund is available upon request or at the Securities and Exchange Commission website at www.sec.gov. In addition, the financial statements of the Fidelity Central Funds which contain the significant accounting policies (including investment valuation policies) of those funds, and are not covered by the Report of Independent Registered Public Accounting Firm, are available on the Securities and Exchange Commission website or upon request.
3. Significant Accounting Policies.
The Fund is an investment company and applies the accounting and reporting guidance of the Financial Accounting Standards Board (FASB) Accounting Standards Codification Topic 946 Financial Services - Investment Companies . The financial statements have been prepared in conformity with accounting principles generally accepted in the United States of America (GAAP), which require management to make certain estimates and assumptions at the date of the financial statements. Actual results could differ from those estimates. Subsequent events, if any, through the date that the financial statements were issued have been evaluated in the preparation of the financial statements. The Fund's Schedule of Investments lists any underlying mutual funds or exchange-traded funds (ETFs) but does not include the underlying holdings of these funds. The following summarizes the significant accounting policies of the Fund:
Investment Valuation. Investments are valued as of 4:00 p.m. Eastern time on the last calendar day of the period. The Board of Trustees (the Board) has designated the Fund's investment adviser as the valuation designee responsible for the fair valuation function and performing fair value determinations as needed. The investment adviser has established a Fair Value Committee (the Committee) to carry out the day-to-day fair valuation responsibilities and has adopted policies and procedures to govern the fair valuation process and the activities of the Committee. In accordance with these fair valuation policies and procedures, which have been approved by the Board, the Fund attempts to obtain prices from one or more third party pricing services or brokers to value its investments. When current market prices, quotations or currency exchange rates are not readily available or reliable, investments will be fair valued in good faith by the Committee, in accordance with the policies and procedures. Factors used in determining fair value vary by investment type and may include market or investment specific events, transaction data, estimated cash flows, and market observations of comparable investments. The frequency that the fair valuation procedures are used cannot be predicted and they may be utilized to a significant extent. The Committee manages the Fund's fair valuation practices and maintains the fair valuation policies and procedures. The Fund's investment adviser reports to the Board information regarding the fair valuation process and related material matters.
The Fund categorizes the inputs to valuation techniques used to value its investments into a disclosure hierarchy consisting of three levels as shown below:
Level 1 - unadjusted quoted prices in active markets for identical investments
Level 2 - other significant observable inputs (including quoted prices for similar investments, interest rates, prepayment speeds, etc.)
Level 3 - unobservable inputs (including the Fund's own assumptions based on the best information available)
Valuation techniques used to value the Fund's investments by major category are as follows:
Equity securities, including restricted securities, for which market quotations are readily available, are valued at the last reported sale price or official closing price as reported by a third party pricing service on the primary market or exchange on which they are traded and are categorized as Level 1 in the hierarchy. In the event there were no sales during the day or closing prices are not available, securities are valued at the last quoted bid price or may be valued using the last available price and are generally categorized as Level 2 in the hierarchy. For foreign equity securities, when market or security specific events arise, comparisons to the valuation of American Depositary Receipts (ADRs), futures contracts, ETFs and certain indexes as well as quoted prices for similar securities may be used and would be categorized as Level 2 in the hierarchy. For equity securities, including restricted securities, where observable inputs are limited, assumptions about market activity and risk are used and these securities may be categorized as Level 3 in the hierarchy.
Debt securities, including restricted securities, are valued based on evaluated prices received from third party pricing services or from brokers who make markets in such securities. Corporate bonds and U.S. government and government agency obligations are valued by pricing services who utilize matrix pricing which considers yield or price of bonds of comparable quality, coupon, maturity and type or by broker-supplied prices. When independent prices are unavailable or unreliable, debt securities may be valued utilizing pricing methodologies which consider similar factors that would be used by third party pricing services. Debt securities are generally categorized as Level 2 in the hierarchy but may be Level 3 depending on the circumstances.
Futures contracts are valued at the settlement price established each day by the board of trade or exchange on which they are traded and are categorized as Level 1 in the hierarchy. Investments in open-end mutual funds, including the Fidelity Central Funds, are valued at their closing net asset value (NAV) each business day and are categorized as Level 1 in the hierarchy.
Changes in valuation techniques may result in transfers in or out of an assigned level within the disclosure hierarchy. The aggregate value of investments by input level as of June 30, 2023 is included at the end of the Fund's Schedule of Investments.
Foreign Currency. Certain Funds may use foreign currency contracts to facilitate transactions in foreign-denominated securities. Gains and losses from these transactions may arise from changes in the value of the foreign currency or if the counterparties do not perform under the contracts' terms.
Foreign-denominated assets, including investment securities, and liabilities are translated into U.S. dollars at the exchange rates at period end. Purchases and sales of investment securities, income and dividends received, and expenses denominated in foreign currencies are translated into U.S. dollars at the exchange rate in effect on the transaction date.
The effects of exchange rate fluctuations on investments are included with the net realized and unrealized gain (loss) on investment securities. Other foreign currency transactions resulting in realized and unrealized gain (loss) are disclosed separately.
Investment Transactions and Income. For financial reporting purposes, the Fund's investment holdings and NAV include trades executed through the end of the last business day of the period. The NAV per share for processing shareholder transactions is calculated as of the close of business of the New York Stock Exchange (NYSE), normally 4:00 p.m. Eastern time and includes trades executed through the end of the prior business day. Gains and losses on securities sold are determined on the basis of identified cost. Commissions paid to certain brokers with whom the investment adviser, or its affiliates, places trades on behalf of a fund include an amount in addition to trade execution, which may be rebated back to a fund. Any such rebates are included in net realized gain (loss) on investments in the Statement of Operations. Dividend income is recorded on the ex-dividend date, except for certain dividends from foreign securities where the ex-dividend date may have passed, which are recorded as soon as the Fund is informed of the ex-dividend date. Non-cash dividends included in dividend income, if any, are recorded at the fair market value of the securities received. Income and capital gain distributions from Fidelity Central Funds, if any, are recorded on the ex-dividend date. Certain distributions received by the Fund represent a return of capital or capital gain. The Fund determines the components of these distributions subsequent to the ex-dividend date, based upon receipt of tax filings or other correspondence relating to the underlying investment. These distributions are recorded as a reduction of cost of investments and/or as a realized gain. Interest income is accrued as earned and includes coupon interest and amortization of premium and accretion of discount on debt securities as applicable. Investment income is recorded net of foreign taxes withheld where recovery of such taxes is uncertain. Funds may file withholding tax reclaims in certain jurisdictions to recover a portion of amounts previously withheld. Any withholding tax reclaims income is included in the Statement of Operations in dividends. Any receivables for withholding tax reclaims are included in the Statement of Assets and Liabilities in dividends receivable.
Class Allocations and Expenses. Investment income, realized and unrealized capital gains and losses, common expenses of a fund, and certain fund-level expense reductions, if any, are allocated daily on a pro-rata basis to each class based on the relative net assets of each class to the total net assets of a fund. Each class differs with respect to transfer agent and distribution and service plan fees incurred, as applicable. Certain expense reductions may also differ by class, if applicable. For the reporting period, the allocated portion of income and expenses to each class as a percent of its average net assets may vary due to the timing of recording these transactions in relation to fluctuating net assets of the classes. Expenses directly attributable to a fund are charged to that fund. Expenses attributable to more than one fund are allocated among the respective funds on the basis of relative net assets or other appropriate methods. Expenses included in the accompanying financial statements reflect the expenses of that fund and do not include any expenses associated with any underlying mutual funds or exchange-traded funds (ETFs). Although not included in a fund's expenses, a fund indirectly bears its proportionate share of these expenses through the net asset value of each underlying mutual fund or exchange-traded fund (ETF). Expense estimates are accrued in the period to which they relate and adjustments are made when actual amounts are known.
Income Tax Information and Distributions to Shareholders. Each year, the Fund intends to qualify as a regulated investment company under Subchapter M of the Internal Revenue Code, including distributing substantially all of its taxable income and realized gains. As a result, no provision for U.S. Federal income taxes is required. The Fund files a U.S. federal tax return, in addition to state and local tax returns as required. The Fund's federal income tax returns are subject to examination by the Internal Revenue Service (IRS) for a period of three fiscal years after they are filed. State and local tax returns may be subject to examination for an additional fiscal year depending on the jurisdiction. Foreign taxes are provided for based on the Fund's understanding of the tax rules and rates that exist in the foreign markets in which it invests.
Distributions are declared and recorded on the ex-dividend date. Income and capital gain distributions are declared separately for each class. Income and capital gain distributions are determined in accordance with income tax regulations, which may differ from GAAP.
Capital accounts within the financial statements are adjusted for permanent book-tax differences. These adjustments have no impact on net assets or the results of operations. Capital accounts are not adjusted for temporary book-tax differences which will reverse in a subsequent period.
Book-tax differences are primarily due to futures contracts, foreign currency transactions, passive foreign investment companies (PFIC), partnerships, capital loss carryforwards and losses deferred due to wash sales and excise tax regulations.
As of period end, the cost and unrealized appreciation (depreciation) in securities, and derivatives if applicable, for federal income tax purposes were as follows:
| Gross unrealized appreciation | $430,908,242 |
| Gross unrealized depreciation | (398,858,813) |
| Net unrealized appreciation (depreciation) | $32,049,429 |
| Tax cost | $4,144,390,243 |
Capital loss carryforwards are only available to offset future capital gains of the Fund to the extent provided by regulations and may be limited. The capital loss carryforward information presented below, including any applicable limitation, is estimated as of prior fiscal period end and is subject to adjustment.
Short-term | $(304,970,952) |
Long-term | (62,235,747) |
| Total capital loss carryforward | $(367,206,699) |
The Fund elected to defer to its next fiscal year approximately $551,724 of ordinary losses recognized during the period November 1, 2022 to December 31, 2022.
Restricted Securities (including Private Placements). Funds may invest in securities that are subject to legal or contractual restrictions on resale. These securities generally may be resold in transactions exempt from registration or to the public if the securities are registered. Disposal of these securities may involve time-consuming negotiations and expense, and prompt sale at an acceptable price may be difficult. Information regarding restricted securities held at period end is included at the end of the Schedule of Investments, if applicable.
4. Derivative Instruments.
Risk Exposures and the Use of Derivative Instruments. The Fund's investment objectives allow for various types of derivative instruments, including futures contracts. Derivatives are investments whose value is primarily derived from underlying assets, indices or reference rates and may be transacted on an exchange or over-the-counter (OTC). Derivatives may involve a future commitment to buy or sell a specified asset based on specified terms, to exchange future cash flows at periodic intervals based on a notional principal amount, or for one party to make one or more payments upon the occurrence of specified events in exchange for periodic payments from the other party.
Derivatives were used to increase returns and to manage exposure to certain risks as defined below. The success of any strategy involving derivatives depends on analysis of numerous economic factors, and if the strategies for investment do not work as intended, the objectives may not be achieved.
Derivatives were used to increase or decrease exposure to the following risk(s):
| Equity Risk | Equity risk relates to the fluctuations in the value of financial instruments as a result of changes in market prices (other than those arising from interest rate risk or foreign exchange risk), whether caused by factors specific to an individual investment, its issuer, or all factors affecting all instruments traded in a market or market segment. |
Funds are also exposed to additional risks from investing in derivatives, such as liquidity risk and counterparty credit risk. Liquidity risk is the risk that a fund will be unable to close out the derivative in the open market in a timely manner. Counterparty credit risk is the risk that the counterparty will not be able to fulfill its obligation to a fund. Counterparty credit risk related to exchange-traded contracts may be mitigated by the protection provided by the exchange on which they trade.
Investing in derivatives may involve greater risks than investing in the underlying assets directly and, to varying degrees, may involve risk of loss in excess of any initial investment and collateral received and amounts recognized in the Statement of Assets and Liabilities. In addition, there may be the risk that the change in value of the derivative contract does not correspond to the change in value of the underlying instrument.
Futures Contracts. A futures contract is an agreement between two parties to buy or sell a specified underlying instrument for a fixed price at a specified future date. Futures contracts were used to manage exposure to the stock market.
Upon entering into a futures contract, a fund is required to deposit either cash or securities (initial margin) with a clearing broker in an amount equal to a certain percentage of the face value of the contract. Futures contracts are marked-to-market daily and subsequent daily payments are made or received by a fund depending on the daily fluctuations in the value of the futures contracts and are recorded as unrealized appreciation or (depreciation). This receivable and/or payable, if any, is included in daily variation margin on futures contracts in the Statement of Assets and Liabilities. Realized gain or (loss) is recorded upon the expiration or closing of a futures contract. The net realized gain (loss) and change in net unrealized appreciation (depreciation) on futures contracts during the period is presented in the Statement of Operations.
Any open futures contracts at period end are presented in the Schedule of Investments under the caption "Futures Contracts". The notional amount at value reflects each contract's exposure to the underlying instrument or index at period end, and is representative of volume of activity during the period unless an average notional amount is presented. Any securities deposited to meet initial margin requirements are identified in the Schedule of Investments. Any cash deposited to meet initial margin requirements is presented as segregated cash with brokers for derivative instruments in the Statement of Assets and Liabilities.
5. Purchases and Sales of Investments.
Purchases and sales of securities, other than short-term securities and in-kind transactions, as applicable, are noted in the table below.
| | Purchases ($) | Sales ($) |
| VIP Stock Selector All Cap Portfolio | 788,536,419 | 1,199,100,885 |
6. Fees and Other Transactions with Affiliates.
Management Fee. Fidelity Management & Research Company LLC (the investment adviser) and its affiliates provide the Fund with investment management related services for which the Fund pays a monthly management fee. The management fee is the sum of an individual fund fee rate that is based on an annual rate of .30% of the Fund's average net assets and an annualized group fee rate that averaged .23% during the period. The group fee rate is based upon the monthly average net assets of a group of registered investment companies with which the investment adviser has management contracts. The group fee rate decreases as assets under management increase and increases as assets under management decrease. In addition, the management fee is subject to a performance adjustment (up to a maximum of +/- .20% of the Fund's average net assets over a 36 month performance period). The upward or downward adjustment to the management fee is based on the relative investment performance of Investor Class as compared to its benchmark index, the MSCI U.S. Investable Market 2500 Index, over the same 36 month performance period. For the reporting period, the total annualized management fee rate, including the performance adjustment, was .51% of the Fund's average net assets. The performance adjustment included in the management fee rate may be higher or lower than the maximum performance adjustment rate due to the difference between the average net assets for the reporting and performance periods.
Distribution and Service Plan Fees. In accordance with Rule 12b-1 of the 1940 Act, the Fund has adopted separate 12b-1 Plans for each Service Class of shares. Each Service Class pays Fidelity Distributors Company LLC (FDC), an affiliate of the investment adviser, a service fee. For the period, the service fee is based on an annual rate of .10% of Service Class' average net assets and .25% of Service Class 2's average net assets.
For the period, total fees, all of which were re-allowed to insurance companies for the distribution of shares and providing shareholder support services, were as follows:
| Service Class | $44 |
| Service Class 2 | 110 |
| | $154 |
Transfer Agent Fees. Fidelity Investments Institutional Operations Company LLC (FIIOC), an affiliate of the investment adviser, is the Fund's transfer, dividend disbursing, and shareholder servicing agent. FIIOC receives an asset-based fee with respect to each class. Each class pays a fee for transfer agent services, typesetting and printing and mailing of shareholder reports, excluding mailing of proxy statements. For the period, transfer agent fees for each class were as follows:
| | Amount | % of Class-Level Average Net Assets A |
| Initial Class | $28 | .06 |
| Service Class | 28 | .06 |
| Service Class 2 | 28 | .06 |
| Investor Class | 2,790,337 | .14 |
| | $2,790,421 | |
A Annualized
Accounting Fees. Fidelity Service Company, Inc. (FSC), an affiliate of the investment adviser, maintains the Fund's accounting records. The accounting fee is based on the level of average net assets for each month. For the period, the fees were equivalent to the following annualized rates:
| | % of Average Net Assets |
| VIP Stock Selector All Cap Portfolio | .02 |
Brokerage Commissions. A portion of portfolio transactions were placed with brokerage firms which are affiliates of the investment adviser. Brokerage commissions are included in net realized gain (loss) and change in net unrealized appreciation (depreciation) in the Statement of Operations. The commissions paid to these affiliated firms were as follows:
| | Amount |
| VIP Stock Selector All Cap Portfolio | $15,379 |
Interfund Lending Program. Pursuant to an Exemptive Order issued by the Securities and Exchange Commission (the SEC), the Fund, along with other registered investment companies having management contracts with Fidelity Management & Research Company LLC (FMR), or other affiliated entities of FMR, may participate in an interfund lending program. This program provides an alternative credit facility allowing the Fund to borrow from, or lend money to, other participating affiliated funds. At period end, there were no interfund loans outstanding. Activity in this program during the period for which loans were outstanding was as follows:
| | Borrower or Lender | Average Loan Balance | Weighted Average Interest Rate | Interest Expense |
| VIP Stock Selector All Cap Portfolio | Borrower | $27,101,625 | 4.81% | $28,969 |
Interfund Trades. Funds may purchase from or sell securities to other Fidelity Funds under procedures adopted by the Board. The procedures have been designed to ensure these interfund trades are executed in accordance with Rule 17a-7 of the 1940 Act. Any interfund trades are included within the respective purchases and sales amounts shown in the Purchases and Sales of Investments note. Interfund trades during the period are noted in the table below.
| | Purchases ($) | Sales ($) | Realized Gain (Loss) ($) |
| VIP Stock Selector All Cap Portfolio | 50,860,913 | 70,161,329 | (5,375,617) |
7. Committed Line of Credit.
Certain Funds participate with other funds managed by the investment adviser or an affiliate in a $4.25 billion credit facility (the "line of credit") to be utilized for temporary or emergency purposes to fund shareholder redemptions or for other short-term liquidity purposes. The participating funds have agreed to pay commitment fees on their pro-rata portion of the line of credit, which are reflected in Miscellaneous expenses on the Statement of Operations, and are listed below. During the period, there were no borrowings on this line of credit.
| | Amount |
| VIP Stock Selector All Cap Portfolio | $4,058 |
8. Security Lending.
Funds lend portfolio securities from time to time in order to earn additional income. Lending agents are used, including National Financial Services (NFS), an affiliate of the investment adviser. Pursuant to a securities lending agreement, NFS will receive a fee, which is capped at 9.9% of a fund's daily lending revenue, for its services as lending agent. A fund may lend securities to certain qualified borrowers, including NFS. On the settlement date of the loan, a fund receives collateral (in the form of U.S. Treasury obligations, letters of credit and/or cash) against the loaned securities and maintains collateral in an amount not less than 100% of the market value of the loaned securities during the period of the loan. The market value of the loaned securities is determined at the close of business of a fund and any additional required collateral is delivered to a fund on the next business day. A fund or borrower may terminate the loan at any time, and if the borrower defaults on its obligation to return the securities loaned because of insolvency or other reasons, a fund may apply collateral received from the borrower against the obligation. A fund may experience delays and costs in recovering the securities loaned. Any cash collateral received is invested in the Fidelity Securities Lending Cash Central Fund. Any loaned securities are identified as such in the Schedule of Investments, and the value of loaned securities and cash collateral at period end, as applicable, are presented in the Statement of Assets and Liabilities. Security lending income represents the income earned on investing cash collateral, less rebates paid to borrowers and any lending agent fees associated with the loan, plus any premium payments received for lending certain types of securities. Security lending income is presented in the Statement of Operations as a component of income from Fidelity Central Funds. Affiliated security lending activity, if any, was as follows:
| | Total Security Lending Fees Paid to NFS | Security Lending Income From Securities Loaned to NFS | Value of Securities Loaned to NFS at Period End |
| VIP Stock Selector All Cap Portfolio | $7,552 | $26,929 | $267,363 |
9. Expense Reductions.
During the period the investment adviser or an affiliate reimbursed and/or waived a portion of fund-level operating expenses in the amount of $92,054.
10. Distributions to Shareholders.
Distributions to shareholders of each class were as follows:
| | Six months ended June 30, 2023 | Year ended December 31, 2022 |
| VIP Stock Selector All Cap Portfolio | | |
| Distributions to shareholders | | |
| Initial Class | $- | $690 |
| Service Class | - | 600 |
| Service Class 2 | - | 470 |
| Investor Class | - | 29,164,617 |
Total | $- | $29,166,377 |
11. Share Transactions.
Transactions for each class of shares were as follows and may contain in-kind transactions:
| | Shares | Shares | Dollars | Dollars |
| | Six months ended June 30, 2023 | Year ended December 31, 2022 | Six months ended June 30, 2023 | Year ended December 31, 2022 |
| VIP Stock Selector All Cap Portfolio | | | | |
| Investor Class | | | | |
| Shares sold | 10,377,605 | 10,559,446 | $91,044,978 | $94,934,938 |
| Reinvestment of distributions | - | 3,467,850 | - | 29,164,617 |
| Shares redeemed | (57,700,090) | (126,156,690) | (500,204,526) | (1,066,858,273) |
| Net increase (decrease) | (47,322,485) | (112,129,394) | $(409,159,548) | $(942,758,718) |
12. Other.
A fund's organizational documents provide former and current trustees and officers with a limited indemnification against liabilities arising in connection with the performance of their duties to the fund. In the normal course of business, a fund may also enter into contracts that provide general indemnifications. A fund's maximum exposure under these arrangements is unknown as this would be dependent on future claims that may be made against a fund. The risk of material loss from such claims is considered remote.
At the end of the period, the following mutual funds managed by the investment adviser or its affiliates were the owners of record of 10% or more of the total outstanding shares.
| | VIP FundsManager 50% Portfolio | VIP FundsManager 60% Portfolio | VIP FundsManager 70% Portfolio |
| VIP Stock Selector All Cap Portfolio | 31% | 43% | 16% |
Mutual funds managed by the investment adviser or its affiliates, in aggregate, were the owners of record of more than 20% of the total outstanding shares.
| Fund | % of shares held |
| VIP Stock Selector All Cap Portfolio | 100% |
13. Risk and Uncertainties.
Many factors affect a fund's performance. Developments that disrupt global economies and financial markets, such as pandemics, epidemics, outbreaks of infectious diseases, war, terrorism, and environmental disasters, may significantly affect a fund's investment performance. The effects of these developments to a fund will be impacted by the types of securities in which a fund invests, the financial condition, industry, economic sector, and geographic location of an issuer, and a fund's level of investment in the securities of that issuer. Significant concentrations in security types, issuers, industries, sectors, and geographic locations may magnify the factors that affect a fund's performance.
As a shareholder, you incur two types of costs: (1) transaction costs, which may include sales charges (loads) on purchase payments or redemption proceeds, as applicable and (2) ongoing costs, which generally include management fees, distribution and/or service (12b-1) fees and other Fund expenses. This Example is intended to help you understand your ongoing costs (in dollars) of investing in a fund and to compare these costs with the ongoing costs of investing in other mutual funds.
| The Example is based on an investment of $1,000 invested at the beginning of the period and held for the entire period (January 1, 2023 to June 30, 2023). |
Actual Expenses
The first line of the accompanying table provides information about actual account values and actual expenses. You may use the information in this line, together with the amount you invested, to estimate the expenses that you paid over the period. Simply divide your account value by $1,000.00 (for example, an $8,600 account value divided by $1,000.00 = 8.6), then multiply the result by the number in the first line for a class/Fund under the heading entitled "Expenses Paid During Period" to estimate the expenses you paid on your account during this period. If any fund is a shareholder of any underlying mutual funds or exchange-traded funds (ETFs) (the Underlying Funds), such fund indirectly bears its proportional share of the expenses of the Underlying Funds in addition to the direct expenses incurred presented in the table. These fees and expenses are not included in the annualized expense ratio used to calculate the expense estimate in the table below. The estimate of expenses does not include any fees or other expenses of any variable annuity or variable life insurance product. If they were, the estimate of expenses you paid during the period would be higher, and your ending account value would be lower.
Hypothetical Example for Comparison Purposes
The second line of the accompanying table provides information about hypothetical account values and hypothetical expenses based on the actual expense ratio and an assumed rate of return of 5% per year before expenses, which is not the actual return. The hypothetical account values and expenses may not be used to estimate the actual ending account balance or expenses you paid for the period. You may use this information to compare the ongoing costs of investing in the Fund and other funds. To do so, compare this 5% hypothetical example with the 5% hypothetical examples that appear in the shareholder reports of the other funds. If any fund is a shareholder of any Underlying Funds, such fund indirectly bears its proportional share of the expenses of the Underlying Funds in addition to the direct expenses as presented in the table. These fees and expenses are not included in the annualized expense ratio used to calculate the expense estimate in the table below. The estimate of expenses does not include any fees or other expenses of any variable annuity or variable life insurance product. If they were, the estimate of expenses you paid during the period would be higher, and your ending account value would be lower.
Please note that the expenses shown in the table are meant to highlight your ongoing costs only and do not reflect any transaction costs. Therefore, the second line of the table is useful in comparing ongoing costs only, and will not help you determine the relative total costs of owning different funds. In addition, if these transactional costs were included, your costs would have been higher.
| | | | | Annualized Expense Ratio- A | | Beginning Account Value January 1, 2023 | | Ending Account Value June 30, 2023 | | Expenses Paid During Period- C January 1, 2023 to June 30, 2023 |
| VIP Stock Selector All Cap Portfolio | | | | | | | | | | |
| Initial Class | | | | .60% | | | | | | |
| Actual | | | | | | $ 1,000 | | $ 1,167.50 | | $ 3.22 |
Hypothetical- B | | | | | | $ 1,000 | | $ 1,021.82 | | $ 3.01 |
| Service Class | | | | .70% | | | | | | |
| Actual | | | | | | $ 1,000 | | $ 1,166.30 | | $ 3.76 |
Hypothetical- B | | | | | | $ 1,000 | | $ 1,021.32 | | $ 3.51 |
| Service Class 2 | | | | .85% | | | | | | |
| Actual | | | | | | $ 1,000 | | $ 1,166.30 | | $ 4.57 |
Hypothetical- B | | | | | | $ 1,000 | | $ 1,020.58 | | $ 4.26 |
| Investor Class | | | | .68% | | | | | | |
| Actual | | | | | | $ 1,000 | | $ 1,167.50 | | $ 3.65 |
Hypothetical- B | | | | | | $ 1,000 | | $ 1,021.42 | | $ 3.41 |
| |
A Annualized expense ratio reflects expenses net of applicable fee waivers.
B 5% return per year before expenses
C Expenses are equal to the annualized expense ratio, multiplied by the average account value over the period, multiplied by 181/ 365 (to reflect the one-half year period). The fees and expenses of any Underlying Funds are not included in each annualized expense ratio.
Board Approval of Investment Advisory Contracts
VIP Stock Selector All Cap Portfolio
At its May 2023 meeting, the Board of Trustees, including the Independent Trustees (together, the Board), voted to continue the management contract with Fidelity Management & Research Company LLC (FMR), and the sub-advisory agreements and sub-subadvisory agreements, in each case, where applicable (together, the Advisory Contracts) for the fund for two months from June 1, 2023 through July 31, 2023. The Board determined that it will consider the annual renewal of the fund's Advisory Contracts for a full one year period in July 2023, following its review of additional materials provided by FMR.
The Board considered that the approval of the fund's Advisory Contracts will not result in any changes in (i) the investment process or strategies employed in the management of the fund's assets; (ii) the fees and expenses paid by shareholders; (iii) the nature, extent or quality of services provided under the fund's Advisory Contracts; or (iv) the day-to-day management of the fund or the persons primarily responsible for such management. The Board also considered that since its last approval of the fund's Advisory Contracts, FMR had provided additional information on the fund in support of the annual contract renewal process, including competitive analyses on total expenses and management fees and in-depth reviews of fund performance and fund profitability information. The Board concluded that the fund's Advisory Contracts are fair and reasonable, and that the fund's Advisory Contracts should be renewed, without modification, through July 31, 2023, with the understanding that the Board will consider the annual renewal for a full one year period in July 2023.
In connection with its consideration of future renewals of the fund's Advisory Contracts, the Board will consider: (i) the nature, extent and quality of services provided to the fund, including shareholder and administrative services and investment performance; (ii) the competitiveness of the management fee and total expenses for the fund; (iii) the costs of the services and profitability, including the revenues earned and the expenses incurred in conducting the business of developing, marketing, distributing, managing, administering, and servicing the fund and its shareholders, to the extent applicable; and (iv) whether there have been economies of scale in respect of the Fidelity funds, whether the Fidelity funds (including the fund) have appropriately benefited from any such economies of scale, and whether there is the potential for realization of any further economies.
Based on its evaluation of all of the conclusions noted above, and after considering all factors it believed relevant, the Board ultimately concluded that the fund's management fee structure is fair and reasonable, and that the continuation of the fund's Advisory Contracts should be approved for two months from June 1, 2023 through July 31, 2023.
The Securities and Exchange Commission adopted Rule 22e-4 under the Investment Company Act of 1940 (the Liquidity Rule) to promote effective liquidity risk management throughout the open-end investment company industry, thereby reducing the risk that funds will be unable to meet their redemption obligations and mitigating dilution of the interests of fund shareholders.
The Fund has adopted and implemented a liquidity risk management program (the Program) reasonably designed to assess and manage the Fund's liquidity risk and to comply with the requirements of the Liquidity Rule. The Fund's Board of Trustees (the Board) has designated the Fund's investment adviser as administrator of the Program. The Fidelity advisers have established a Liquidity Risk Management Committee (the LRM Committee) to manage the Program for each of the Fidelity Funds. The LRM Committee monitors the adequacy and effectiveness of implementation of the Program and on a periodic basis assesses each Fund's liquidity risk based on a variety of factors including (1) the Fund's investment strategy, (2) portfolio liquidity and cash flow projections during normal and reasonably foreseeable stressed conditions, (3) shareholder redemptions, (4) borrowings and other funding sources and (5) certain factors specific to ETFs including the effect of the Fund's prices and spreads, market participants, and basket compositions on the overall liquidity of the Fund's portfolio, as applicable.
In accordance with the Program, each of the Fund's portfolio investments is classified into one of four defined liquidity categories based on a determination of a reasonable expectation for how long it would take to convert the investment to cash (or sell or dispose of the investment) without significantly changing its market value.
- Highly liquid investments - cash or convertible to cash within three business days or less
- Moderately liquid investments - convertible to cash in three to seven calendar days
- Less liquid investments - can be sold or disposed of, but not settled, within seven calendar days
- Illiquid investments - cannot be sold or disposed of within seven calendar days
Liquidity classification determinations take into account a variety of factors including various market, trading and investment-specific considerations, as well as market depth, and generally utilize analysis from a third-party liquidity metrics service.
The Liquidity Rule places a 15% limit on a fund's illiquid investments and requires funds that do not primarily hold assets that are highly liquid investments to determine and maintain a minimum percentage of the fund's net assets to be invested in highly liquid investments (highly liquid investment minimum or HLIM). The Program includes provisions reasonably designed to comply with the 15% limit on illiquid investments and for determining, periodically reviewing and complying with the HLIM requirement as applicable.
At a recent meeting of the Fund's Board of Trustees, the LRM Committee provided a written report to the Board pertaining to the operation, adequacy, and effectiveness of the Program for the period December 1, 2021 through November 30, 2022. The report concluded that the Program is operating effectively and is reasonably designed to assess and manage the Fund's liquidity risk.
1.9904321.101
VSACI-SANN-0823
Item 2.
Code of Ethics
Not applicable.
Item 3.
Audit Committee Financial Expert
Not applicable.
Item 4.
Principal Accountant Fees and Services
Not applicable.
Item 5.
Audit Committee of Listed Registrants
Not applicable.
Item 6.
Investments
(a)
Not applicable.
(b)
Not applicable
Item 7.
Disclosure of Proxy Voting Policies and Procedures for Closed-End Management Investment Companies
Not applicable.
Item 8.
Portfolio Managers of Closed-End Management Investment Companies
Not applicable.
Item 9.
Purchase of Equity Securities by Closed-End Management Investment Company and Affiliated Purchasers
Not applicable.
Item 10.
Submission of Matters to a Vote of Security Holders
There were no material changes to the procedures by which shareholders may recommend nominees to the Variable Insurance Products Fund’s Board of Trustees.
Item 11.
Controls and Procedures
(a)(i) The President and Treasurer and the Chief Financial Officer have concluded that the Variable Insurance Products Fund’s (the “Trust”) disclosure controls and procedures
(as defined in Rule 30a-3(c) under the Investment Company Act) provide reasonable assurances that material information relating to the Trust is made known to them by the appropriate persons, based on their evaluation of these controls and procedures as of a date within 90 days of the filing date of this report.
(a)(ii) There was no change in the Trust’s internal control over financial reporting (as defined in Rule 30a-3(d) under the Investment Company Act) that occurred during the period covered by this report that has materially affected, or is reasonably likely to materially affect, the Trust’s internal control over financial reporting.
Item 12.
Disclosure of Securities Lending Activities for Closed-End Management
Investment Companies
Not applicable.
Item 13.
Exhibits
SIGNATURES
Pursuant to the requirements of the Securities Exchange Act of 1934 and the Investment Company Act of 1940, the registrant has duly caused this report to be signed on its behalf by the undersigned, thereunto duly authorized.
Variable Insurance Products Fund
| |
By: | /s/Stacie M. Smith |
| Stacie M. Smith |
| President and Treasurer |
|
|
Date: | August 22, 2023 |
Pursuant to the requirements of the Securities Exchange Act of 1934 and the Investment Company Act of 1940, this report has been signed below by the following persons on behalf of the registrant and in the capacities and on the dates indicated.
| |
By: | /s/Stacie M. Smith |
| Stacie M. Smith |
| President and Treasurer |
|
|
Date: | August 22, 2023 |
| |
By: | /s/John J. Burke III |
| John J. Burke III |
| Chief Financial Officer |
|
|
Date: | August 22, 2023 |