UNITED STATES
SECURITIES AND EXCHANGE COMMISSION
Washington, D.C. 20549
FORM N-CSR
CERTIFIED SHAREHOLDER REPORT OF REGISTERED
MANAGEMENT INVESTMENT COMPANIES
Investment Company Act file number 811-03329
Variable Insurance Products Fund
(Exact name of registrant as specified in charter)
245 Summer St., Boston, MA 02210
(Address of principal executive offices) (Zip code)
Cynthia Lo Bessette, Secretary
245 Summer St.
Boston, Massachusetts 02210
(Name and address of agent for service)
Registrant's telephone number, including area code:
617-563-7000
| |
Date of fiscal year end: | December 31 |
|
|
Date of reporting period: | June 30, 2021 |
Item 1.
Reports to Stockholders
Fidelity® Variable Insurance Products:
Equity-Income Portfolio
Semi-Annual Report
June 30, 2021


Contents
To view a fund's proxy voting guidelines and proxy voting record for the 12-month period ended June 30, visit http://www.fidelity.com/proxyvotingresults or visit the Securities and Exchange Commission's (SEC) web site at http://www.sec.gov.
You may also call 1-877-208-0098 to request a free copy of the proxy voting guidelines.
Fidelity® Variable Insurance Products are separate account options which are purchased through a variable insurance contract.
Standard & Poor's, S&P and S&P 500 are registered service marks of The McGraw-Hill Companies, Inc. and have been licensed for use by Fidelity Distributors Corporation.
Other third-party marks appearing herein are the property of their respective owners.
All other marks appearing herein are registered or unregistered trademarks or service marks of FMR LLC or an affiliated company. © 2021 FMR LLC. All rights reserved.
This report and the financial statements contained herein are submitted for the general information of the shareholders of the Fund. This report is not authorized for distribution to prospective investors in the Fund unless preceded or accompanied by an effective prospectus.
A fund files its complete schedule of portfolio holdings with the SEC for the first and third quarters of each fiscal year on Form N-PORT. Forms N-PORT are available on the SEC’s web site at http://www.sec.gov. A fund's Forms N-PORT may be reviewed and copied at the SEC’s Public Reference Room in Washington, DC. Information regarding the operation of the SEC's Public Reference Room may be obtained by calling 1-800-SEC-0330.
For a complete list of a fund's portfolio holdings, view the most recent holdings listing, semiannual report, or annual report on Fidelity's web site at http://www.fidelity.com, http://www.institutional.fidelity.com, or http://www.401k.com, as applicable.
NOT FDIC INSURED •MAY LOSE VALUE •NO BANK GUARANTEE
Neither the Fund nor Fidelity Distributors Corporation is a bank.
Note to Shareholders:
Early in 2020, the outbreak and spread of a new coronavirus emerged as a public health emergency that had a major influence on financial markets, primarily based on its impact on the global economy and the outlook for corporate earnings. The virus causes a respiratory disease known as COVID-19. On March 11, 2020 the World Health Organization declared the COVID-19 outbreak a pandemic, citing sustained risk of further global spread.
In the weeks following, as the crisis worsened, we witnessed an escalating human tragedy with wide-scale social and economic consequences from coronavirus-containment measures. The outbreak of COVID-19 prompted a number of measures to limit the spread, including travel and border restrictions, quarantines, and restrictions on large gatherings. In turn, these resulted in lower consumer activity, diminished demand for a wide range of products and services, disruption in manufacturing and supply chains, and – given the wide variability in outcomes regarding the outbreak – significant market uncertainty and volatility. Amid the turmoil, global governments and central banks took unprecedented action to help support consumers, businesses, and the broader economies, and to limit disruption to financial systems.
The situation continues to unfold, and the extent and duration of its impact on financial markets and the economy remain highly uncertain. Extreme events such as the coronavirus crisis are “exogenous shocks” that can have significant adverse effects on mutual funds and their investments. Although multiple asset classes may be affected by market disruption, the duration and impact may not be the same for all types of assets.
Fidelity is committed to helping you stay informed amid news about COVID-19 and during increased market volatility, and we’re taking extra steps to be responsive to customer needs. We encourage you to visit our websites, where we offer ongoing updates, commentary, and analysis on the markets and our funds.
Investment Summary (Unaudited)
Top Ten Stocks as of June 30, 2021
| | % of fund's net assets |
| JPMorgan Chase & Co. | 3.4 |
| Bank of America Corp. | 2.6 |
| Wells Fargo & Co. | 2.2 |
| Johnson & Johnson | 2.2 |
| UnitedHealth Group, Inc. | 2.1 |
| Danaher Corp. | 2.0 |
| Exxon Mobil Corp. | 1.9 |
| The Walt Disney Co. | 1.9 |
| Comcast Corp. Class A | 1.8 |
| Procter & Gamble Co. | 1.8 |
| | 21.9 |
Top Five Market Sectors as of June 30, 2021
| | % of fund's net assets |
| Financials | 19.6 |
| Health Care | 17.9 |
| Industrials | 11.2 |
| Information Technology | 10.1 |
| Communication Services | 8.4 |
Asset Allocation (% of fund's net assets)
| As of June 30, 2021 * |
| | Stocks | 97.4% |
| | Short-Term Investments and Net Other Assets (Liabilities) | 2.6% |

* Foreign investments - 17.4%
Schedule of Investments June 30, 2021 (Unaudited)
Showing Percentage of Net Assets
| Common Stocks - 97.4% | | | |
| | | Shares | Value |
| COMMUNICATION SERVICES - 8.4% | | | |
| Diversified Telecommunication Services - 0.8% | | | |
| AT&T, Inc. | | 558,670 | $16,078,523 |
| Verizon Communications, Inc. | | 616,760 | 34,557,063 |
| | | | 50,635,586 |
| Entertainment - 1.9% | | | |
| The Walt Disney Co. (a) | | 671,597 | 118,046,605 |
| Interactive Media & Services - 1.2% | | | |
| Alphabet, Inc. Class A (a) | | 30,788 | 75,177,831 |
| Media - 3.2% | | | |
| Comcast Corp. Class A | | 1,927,833 | 109,925,038 |
| Interpublic Group of Companies, Inc. | | 1,417,273 | 46,047,200 |
| Shaw Communications, Inc. Class B | | 543,900 | 15,756,251 |
| WPP PLC | | 2,261,200 | 30,566,598 |
| | | | 202,295,087 |
| Wireless Telecommunication Services - 1.3% | | | |
| Rogers Communications, Inc. Class B (non-vtg.) | | 116,700 | 6,204,042 |
| T-Mobile U.S., Inc. | | 495,818 | 71,809,321 |
| | | | 78,013,363 |
|
| TOTAL COMMUNICATION SERVICES | | | 524,168,472 |
|
| CONSUMER DISCRETIONARY - 6.4% | | | |
| Hotels, Restaurants & Leisure - 1.1% | | | |
| McDonald's Corp. | | 303,880 | 70,193,241 |
| Household Durables - 0.5% | | | |
| Tempur Sealy International, Inc. | | 824,100 | 32,296,479 |
| Internet & Direct Marketing Retail - 0.3% | | | |
| eBay, Inc. | | 234,698 | 16,478,147 |
| Leisure Products - 0.3% | | | |
| Allstar Co-Invest Blocker LP (a)(b) | | 59,309 | 15,390,092 |
| Multiline Retail - 1.5% | | | |
| Kohl's Corp. | | 594,600 | 32,768,406 |
| Nordstrom, Inc. (a) | | 367,500 | 13,439,475 |
| Target Corp. | | 208,608 | 50,428,898 |
| | | | 96,636,779 |
| Specialty Retail - 1.9% | | | |
| Best Buy Co., Inc. | | 169,900 | 19,535,102 |
| Burlington Stores, Inc. (a) | | 97,878 | 31,515,737 |
| Dick's Sporting Goods, Inc. | | 175,700 | 17,603,383 |
| Lowe's Companies, Inc. | | 84,872 | 16,462,622 |
| The Home Depot, Inc. | | 50,107 | 15,978,621 |
| TJX Companies, Inc. | | 233,274 | 15,727,333 |
| | | | 116,822,798 |
| Textiles, Apparel & Luxury Goods - 0.8% | | | |
| PVH Corp. (a) | | 171,500 | 18,451,685 |
| Tapestry, Inc. (a) | | 740,900 | 32,214,332 |
| | | | 50,666,017 |
|
| TOTAL CONSUMER DISCRETIONARY | | | 398,483,553 |
|
| CONSUMER STAPLES - 7.8% | | | |
| Beverages - 2.2% | | | |
| Diageo PLC | | 649,000 | 31,105,615 |
| Keurig Dr. Pepper, Inc. | | 1,154,948 | 40,700,368 |
| The Coca-Cola Co. | | 1,180,846 | 63,895,577 |
| | | | 135,701,560 |
| Food & Staples Retailing - 1.9% | | | |
| BJ's Wholesale Club Holdings, Inc. (a) | | 399,405 | 19,003,690 |
| Costco Wholesale Corp. | | 64,100 | 25,362,447 |
| Walmart, Inc. | | 534,845 | 75,423,842 |
| | | | 119,789,979 |
| Food Products - 1.9% | | | |
| Bunge Ltd. | | 211,900 | 16,559,985 |
| Lamb Weston Holdings, Inc. | | 367,000 | 29,602,220 |
| Mondelez International, Inc. | | 909,571 | 56,793,613 |
| Nestle SA (Reg. S) | | 134,007 | 16,703,582 |
| | | | 119,659,400 |
| Household Products - 1.8% | | | |
| Procter & Gamble Co. | | 811,744 | 109,528,618 |
|
| TOTAL CONSUMER STAPLES | | | 484,679,557 |
|
| ENERGY - 6.1% | | | |
| Oil, Gas & Consumable Fuels - 6.1% | | | |
| Canadian Natural Resources Ltd. | | 857,400 | 31,125,363 |
| Chevron Corp. | | 39,549 | 4,142,362 |
| ConocoPhillips Co. | | 528,404 | 32,179,804 |
| Enterprise Products Partners LP | | 1,297,144 | 31,300,085 |
| Exxon Mobil Corp. | | 1,904,066 | 120,108,483 |
| Hess Corp. | | 249,600 | 21,795,072 |
| Imperial Oil Ltd. | | 963,135 | 29,354,018 |
| Phillips 66 Co. | | 400,700 | 34,388,074 |
| Suncor Energy, Inc. | | 1,883,300 | 45,107,435 |
| Thungela Resources Ltd. (a)(c) | | 50,370 | 138,657 |
| Valero Energy Corp. | | 416,734 | 32,538,591 |
| | | | 382,177,944 |
| FINANCIALS - 19.6% | | | |
| Banks - 12.9% | | | |
| Bank of America Corp. | | 4,042,009 | 166,652,031 |
| Citigroup, Inc. | | 1,239,199 | 87,673,329 |
| Huntington Bancshares, Inc. | | 2,603,370 | 37,150,090 |
| JPMorgan Chase & Co. | | 1,378,675 | 214,439,106 |
| M&T Bank Corp. | | 501,867 | 72,926,294 |
| PNC Financial Services Group, Inc. | | 482,200 | 91,984,472 |
| Wells Fargo & Co. | | 3,002,968 | 136,004,421 |
| | | | 806,829,743 |
| Capital Markets - 1.6% | | | |
| BlackRock, Inc. Class A | | 66,354 | 58,057,759 |
| KKR & Co. LP | | 724,636 | 42,927,437 |
| | | | 100,985,196 |
| Consumer Finance - 1.6% | | | |
| Capital One Financial Corp. | | 622,516 | 96,297,000 |
| Insurance - 3.5% | | | |
| American Financial Group, Inc. | | 265,600 | 33,125,632 |
| American International Group, Inc. | | 442,100 | 21,043,960 |
| Chubb Ltd. | | 322,482 | 51,255,289 |
| Hartford Financial Services Group, Inc. | | 455,200 | 28,208,744 |
| Old Republic International Corp. | | 1,065,000 | 26,529,150 |
| The Travelers Companies, Inc. | | 387,725 | 58,046,310 |
| | | | 218,209,085 |
|
| TOTAL FINANCIALS | | | 1,222,321,024 |
|
| HEALTH CARE - 17.9% | | | |
| Biotechnology - 2.6% | | | |
| AbbVie, Inc. | | 680,939 | 76,700,969 |
| Amgen, Inc. | | 354,175 | 86,330,156 |
| | | | 163,031,125 |
| Health Care Equipment & Supplies - 2.0% | | | |
| Danaher Corp. | | 463,768 | 124,456,780 |
| Health Care Providers & Services - 3.0% | | | |
| Cigna Corp. | | 233,209 | 55,286,858 |
| UnitedHealth Group, Inc. | | 332,312 | 133,071,017 |
| | | | 188,357,875 |
| Pharmaceuticals - 10.3% | | | |
| AstraZeneca PLC (United Kingdom) | | 535,236 | 64,305,514 |
| Bristol-Myers Squibb Co. | | 1,618,837 | 108,170,688 |
| Eli Lilly & Co. | | 411,758 | 94,506,696 |
| Johnson & Johnson | | 814,196 | 134,130,649 |
| Merck & Co., Inc. | | 1,164,200 | 90,539,834 |
| Roche Holding AG (participation certificate) | | 167,171 | 62,996,408 |
| Sanofi SA | | 817,655 | 85,904,959 |
| | | | 640,554,748 |
|
| TOTAL HEALTH CARE | | | 1,116,400,528 |
|
| INDUSTRIALS - 11.2% | | | |
| Aerospace & Defense - 2.1% | | | |
| Huntington Ingalls Industries, Inc. | | 70,700 | 14,900,025 |
| Northrop Grumman Corp. | | 142,801 | 51,898,167 |
| The Boeing Co. (a) | | 275,400 | 65,974,824 |
| | | | 132,773,016 |
| Air Freight & Logistics - 1.5% | | | |
| Deutsche Post AG | | 452,669 | 30,828,895 |
| United Parcel Service, Inc. Class B | | 303,214 | 63,059,416 |
| | | | 93,888,311 |
| Building Products - 0.7% | | | |
| Johnson Controls International PLC | | 675,000 | 46,325,250 |
| Commercial Services & Supplies - 0.1% | | | |
| Waste Connection, Inc. (Canada) | | 63,303 | 7,563,064 |
| Electrical Equipment - 0.8% | | | |
| AMETEK, Inc. | | 370,852 | 49,508,742 |
| Industrial Conglomerates - 2.9% | | | |
| General Electric Co. | | 5,724,962 | 77,057,989 |
| Hitachi Ltd. | | 251,100 | 14,377,309 |
| Roper Technologies, Inc. | | 118,294 | 55,621,839 |
| Siemens AG | | 192,929 | 30,633,033 |
| | | | 177,690,170 |
| Machinery - 2.1% | | | |
| Crane Co. | | 149,600 | 13,818,552 |
| Fortive Corp. | | 411,016 | 28,664,256 |
| ITT, Inc. | | 370,852 | 33,966,335 |
| Nordson Corp. | | 114,400 | 25,111,944 |
| Otis Worldwide Corp. | | 334,176 | 27,325,572 |
| | | | 128,886,659 |
| Marine - 0.3% | | | |
| A.P. Moller - Maersk A/S Series B | | 5,345 | 15,387,773 |
| Road & Rail - 0.1% | | | |
| Norfolk Southern Corp. | | 31,532 | 8,368,908 |
| Trading Companies & Distributors - 0.3% | | | |
| Watsco, Inc. | | 64,358 | 18,447,577 |
| Transportation Infrastructure - 0.3% | | | |
| Aena SME SA (a)(d) | | 124,300 | 20,383,861 |
|
| TOTAL INDUSTRIALS | | | 699,223,331 |
|
| INFORMATION TECHNOLOGY - 10.1% | | | |
| Communications Equipment - 1.7% | | | |
| Cisco Systems, Inc. | | 2,008,054 | 106,426,862 |
| IT Services - 2.3% | | | |
| Accenture PLC Class A | | 142,900 | 42,125,491 |
| Amdocs Ltd. | | 682,533 | 52,800,753 |
| Genpact Ltd. | | 705,700 | 32,059,951 |
| Visa, Inc. Class A | | 67,442 | 15,769,288 |
| | | | 142,755,483 |
| Semiconductors & Semiconductor Equipment - 2.7% | | | |
| NXP Semiconductors NV | | 360,300 | 74,120,916 |
| Qualcomm, Inc. | | 204,040 | 29,163,437 |
| Taiwan Semiconductor Manufacturing Co. Ltd. sponsored ADR | | 533,142 | 64,062,343 |
| | | | 167,346,696 |
| Software - 1.9% | | | |
| Microsoft Corp. | | 292,950 | 79,360,155 |
| NortonLifeLock, Inc. | | 688,500 | 18,740,970 |
| Open Text Corp. | | 498,001 | 25,289,741 |
| | | | 123,390,866 |
| Technology Hardware, Storage & Peripherals - 1.5% | | | |
| Apple, Inc. | | 222,829 | 30,518,660 |
| Samsung Electronics Co. Ltd. | | 863,616 | 61,675,939 |
| | | | 92,194,599 |
|
| TOTAL INFORMATION TECHNOLOGY | | | 632,114,506 |
|
| MATERIALS - 2.6% | | | |
| Chemicals - 1.1% | | | |
| Linde PLC | | 219,189 | 63,367,540 |
| Nutrien Ltd. | | 102,600 | 6,216,752 |
| | | | 69,584,292 |
| Containers & Packaging - 1.1% | | | |
| Crown Holdings, Inc. | | 431,759 | 44,130,087 |
| Packaging Corp. of America | | 166,895 | 22,600,921 |
| WestRock Co. | | 93,728 | 4,988,204 |
| | | | 71,719,212 |
| Metals & Mining - 0.4% | | | |
| Anglo American PLC (United Kingdom) | | 452,900 | 17,996,114 |
| Lundin Mining Corp. | | 696,400 | 6,280,858 |
| | | | 24,276,972 |
|
| TOTAL MATERIALS | | | 165,580,476 |
|
| REAL ESTATE - 2.2% | | | |
| Equity Real Estate Investment Trusts (REITs) - 2.2% | | | |
| American Tower Corp. | | 148,773 | 40,189,538 |
| Lamar Advertising Co. Class A | | 608,500 | 63,539,570 |
| Public Storage | | 116,696 | 35,089,320 |
| | | | 138,818,428 |
| UTILITIES - 5.1% | | | |
| Electric Utilities - 2.6% | | | |
| Exelon Corp. | | 786,349 | 34,843,124 |
| NextEra Energy, Inc. | | 1,100,216 | 80,623,828 |
| NRG Energy, Inc. | | 871,329 | 35,114,559 |
| PG&E Corp. (a) | | 1,081,900 | 11,002,923 |
| | | | 161,584,434 |
| Independent Power and Renewable Electricity Producers - 0.4% | | | |
| Vistra Corp. | | 1,506,001 | 27,936,319 |
| Multi-Utilities - 2.1% | | | |
| Ameren Corp. | | 345,558 | 27,658,462 |
| CenterPoint Energy, Inc. | | 1,065,668 | 26,130,179 |
| Dominion Energy, Inc. | | 658,800 | 48,467,916 |
| WEC Energy Group, Inc. | | 339,625 | 30,209,644 |
| | | | 132,466,201 |
|
| TOTAL UTILITIES | | | 321,986,954 |
|
| TOTAL COMMON STOCKS | | | |
| (Cost $4,120,272,772) | | | 6,085,954,773 |
|
| Money Market Funds - 2.4% | | | |
| Fidelity Cash Central Fund 0.06% (e) | | 150,783,190 | 150,813,346 |
| Fidelity Securities Lending Cash Central Fund 0.06% (e)(f) | | 149,385 | 149,400 |
| TOTAL MONEY MARKET FUNDS | | | |
| (Cost $150,959,621) | | | 150,962,746 |
| TOTAL INVESTMENT IN SECURITIES - 99.8% | | | |
| (Cost $4,271,232,393) | | | 6,236,917,519 |
| NET OTHER ASSETS (LIABILITIES) - 0.2% | | | 12,909,879 |
| NET ASSETS - 100% | | | $6,249,827,398 |
Legend
(a) Non-income producing
(b) Restricted securities (including private placements) - Investment in securities not registered under the Securities Act of 1933 (excluding 144A issues). At the end of the period, the value of restricted securities (excluding 144A issues) amounted to $15,390,092 or 0.2% of net assets.
(c) Security or a portion of the security is on loan at period end.
(d) Security exempt from registration under Rule 144A of the Securities Act of 1933. These securities may be resold in transactions exempt from registration, normally to qualified institutional buyers. At the end of the period, the value of these securities amounted to $20,383,861 or 0.3% of net assets.
(e) Affiliated fund that is generally available only to investment companies and other accounts managed by Fidelity Investments. The rate quoted is the annualized seven-day yield of the fund at period end. A complete unaudited listing of the fund's holdings as of its most recent quarter end is available upon request. In addition, each Fidelity Central Fund's financial statements are available on the SEC's website or upon request.
(f) Investment made with cash collateral received from securities on loan.
Additional information on each restricted holding is as follows:
| Security | Acquisition Date | Acquisition Cost |
| Allstar Co-Invest Blocker LP | 8/1/11 | $4,922,126 |
Affiliated Central Funds
Information regarding fiscal year to date income earned by the Fund from investments in Fidelity Central Funds is as follows:
| Fund | Income earned |
| Fidelity Cash Central Fund | $30,649 |
| Fidelity Securities Lending Cash Central Fund | 35,176 |
| Total | $65,825 |
Amounts in the income column in the above table include any capital gain distributions from underlying funds, which are presented in the corresponding line-item in the Statement of Operations, if applicable. Amount for Fidelity Securities Lending Cash Central Fund represents the income earned on investing cash collateral, less rebates paid to borrowers and any lending agent fees associated with the loan, plus any premium payments received for lending certain types of securities.
Fiscal year to date information regarding the Fund's investments in Fidelity Central Funds, including the ownership percentage, is presented below.
| Fund | Value, beginning of period | Purchases | Sales Proceeds | Realized Gain/Loss | Change in Unrealized appreciation (depreciation) | Value, end of period | % ownership, end of period |
| Fidelity Cash Central Fund 0.06% | $102,597,532 | $312,676,251 | $264,460,569 | $132 | $-- | $150,813,346 | 0.2% |
| Fidelity Securities Lending Cash Central Fund 0.06% | 32,151,844 | 254,122,193 | 286,124,637 | -- | -- | 149,400 | 0.0% |
| Total | $134,749,376 | $566,798,444 | $550,585,206 | $132 | $-- | $150,962,746 | |
Investment Valuation
The following is a summary of the inputs used, as of June 30, 2021, involving the Fund's assets and liabilities carried at fair value. The inputs or methodology used for valuing securities may not be an indication of the risk associated with investing in those securities. For more information on valuation inputs, and their aggregation into the levels used below, please refer to the Investment Valuation section in the accompanying Notes to Financial Statements.
| | Valuation Inputs at Reporting Date: |
| Description | Total | Level 1 | Level 2 | Level 3 |
| Investments in Securities: | | | | |
| Equities: | | | | |
| Communication Services | $524,168,472 | $493,601,874 | $30,566,598 | $-- |
| Consumer Discretionary | 398,483,553 | 383,093,461 | 15,390,092 | -- |
| Consumer Staples | 484,679,557 | 436,870,360 | 47,809,197 | -- |
| Energy | 382,177,944 | 382,177,944 | -- | -- |
| Financials | 1,222,321,024 | 1,222,321,024 | -- | -- |
| Health Care | 1,116,400,528 | 903,193,647 | 213,206,881 | -- |
| Industrials | 699,223,331 | 622,373,630 | 76,849,701 | -- |
| Information Technology | 632,114,506 | 632,114,506 | -- | -- |
| Materials | 165,580,476 | 165,580,476 | -- | -- |
| Real Estate | 138,818,428 | 138,818,428 | -- | -- |
| Utilities | 321,986,954 | 321,986,954 | -- | -- |
| Money Market Funds | 150,962,746 | 150,962,746 | -- | -- |
| Total Investments in Securities: | $6,236,917,519 | $5,853,095,050 | $383,822,469 | $-- |
Other Information
Distribution of investments by country or territory of incorporation, as a percentage of Total Net Assets, is as follows (Unaudited):
| United States of America | 82.6% |
| Canada | 2.7% |
| Ireland | 2.4% |
| Switzerland | 2.1% |
| United Kingdom | 1.8% |
| France | 1.4% |
| Netherlands | 1.2% |
| Taiwan | 1.0% |
| Korea (South) | 1.0% |
| Germany | 1.0% |
| Others (Individually Less Than 1%) | 2.8% |
| | 100.0% |
See accompanying notes which are an integral part of the financial statements.
Financial Statements
Statement of Assets and Liabilities
| | | June 30, 2021 (Unaudited) |
| Assets | | |
Investment in securities, at value (including securities loaned of $136,904) — See accompanying schedule:
Unaffiliated issuers (cost $4,120,272,772) | $6,085,954,773 | |
| Fidelity Central Funds (cost $150,959,621) | 150,962,746 | |
| Total Investment in Securities (cost $4,271,232,393) | | $6,236,917,519 |
| Cash | | 1,617,031 |
| Foreign currency held at value (cost $8,281,089) | | 8,184,862 |
| Receivable for investments sold | | 75,461,472 |
| Receivable for fund shares sold | | 1,880,379 |
| Dividends receivable | | 6,278,322 |
| Distributions receivable from Fidelity Central Funds | | 13,299 |
| Other receivables | | 84,814 |
| Total assets | | 6,330,437,698 |
| Liabilities | | |
| Payable for investments purchased | $73,581,121 | |
| Payable for fund shares redeemed | 3,707,843 | |
| Accrued management fee | 2,223,971 | |
| Distribution and service plan fees payable | 389,279 | |
| Other affiliated payables | 466,426 | |
| Other payables and accrued expenses | 92,260 | |
| Collateral on securities loaned | 149,400 | |
| Total liabilities | | 80,610,300 |
| Net Assets | | $6,249,827,398 |
| Net Assets consist of: | | |
| Paid in capital | | $3,784,551,318 |
| Total accumulated earnings (loss) | | 2,465,276,080 |
| Net Assets | | $6,249,827,398 |
| Net Asset Value and Maximum Offering Price | | |
| Initial Class: | | |
| Net Asset Value, offering price and redemption price per share ($3,608,096,162 ÷ 133,760,371 shares) | | $26.97 |
| Service Class: | | |
| Net Asset Value, offering price and redemption price per share ($320,832,867 ÷ 11,977,215 shares) | | $26.79 |
| Service Class 2: | | |
| Net Asset Value, offering price and redemption price per share ($1,734,414,343 ÷ 66,422,233 shares) | | $26.11 |
| Investor Class: | | |
| Net Asset Value, offering price and redemption price per share ($586,484,026 ÷ 21,892,983 shares) | | $26.79 |
See accompanying notes which are an integral part of the financial statements.
Statement of Operations
| | | Six months ended June 30, 2021 (Unaudited) |
| Investment Income | | |
| Dividends | | $63,425,275 |
| Income from Fidelity Central Funds (including $35,176 from security lending) | | 65,825 |
| Total income | | 63,491,100 |
| Expenses | | |
| Management fee | $12,682,724 | |
| Transfer agent fees | 2,096,637 | |
| Distribution and service plan fees | 2,234,112 | |
| Accounting fees | 560,061 | |
| Custodian fees and expenses | 52,079 | |
| Independent trustees' fees and expenses | 9,744 | |
| Audit | 35,523 | |
| Legal | 6,447 | |
| Miscellaneous | 14,921 | |
| Total expenses before reductions | 17,692,248 | |
| Expense reductions | (166,050) | |
| Total expenses after reductions | | 17,526,198 |
| Net investment income (loss) | | 45,964,902 |
| Realized and Unrealized Gain (Loss) | | |
| Net realized gain (loss) on: | | |
| Investment securities: | | |
| Unaffiliated issuers | 501,360,648 | |
| Fidelity Central Funds | 132 | |
| Foreign currency transactions | 620,082 | |
| Total net realized gain (loss) | | 501,980,862 |
| Change in net unrealized appreciation (depreciation) on: | | |
| Investment securities: | | |
| Unaffiliated issuers | 350,806,947 | |
| Assets and liabilities in foreign currencies | (129,998) | |
| Total change in net unrealized appreciation (depreciation) | | 350,676,949 |
| Net gain (loss) | | 852,657,811 |
| Net increase (decrease) in net assets resulting from operations | | $898,622,713 |
See accompanying notes which are an integral part of the financial statements.
Statement of Changes in Net Assets
| | Six months ended June 30, 2021 (Unaudited) | Year ended December 31, 2020 |
| Increase (Decrease) in Net Assets | | |
| Operations | | |
| Net investment income (loss) | $45,964,902 | $87,086,238 |
| Net realized gain (loss) | 501,980,862 | 133,856,127 |
| Change in net unrealized appreciation (depreciation) | 350,676,949 | 109,124,601 |
| Net increase (decrease) in net assets resulting from operations | 898,622,713 | 330,066,966 |
| Distributions to shareholders | (181,615,600) | (310,505,982) |
| Share transactions - net increase (decrease) | 34,716,721 | 95,361,239 |
| Total increase (decrease) in net assets | 751,723,834 | 114,922,223 |
| Net Assets | | |
| Beginning of period | 5,498,103,564 | 5,383,181,341 |
| End of period | $6,249,827,398 | $5,498,103,564 |
See accompanying notes which are an integral part of the financial statements.
Financial Highlights
VIP Equity-Income Portfolio Initial Class
| | Six months ended (Unaudited) June 30, | Years endedDecember 31, | | | | |
| | 2021 | 2020 | 2019 | 2018 | 2017 | 2016 |
| Selected Per–Share Data | | | | | | |
| Net asset value, beginning of period | $23.90 | $23.77 | $20.37 | $23.89 | $21.97 | $20.46 |
| Income from Investment Operations | | | | | | |
| Net investment income (loss)A | .21 | .39 | .46 | .58 | .50 | .49 |
| Net realized and unrealized gain (loss) | 3.65 | 1.12 | 4.84 | (2.50) | 2.29 | 2.85 |
| Total from investment operations | 3.86 | 1.51 | 5.30 | (1.92) | 2.79 | 3.34 |
| Distributions from net investment income | (.07) | (.39) | (.45) | (.52) | (.40) | (.48) |
| Distributions from net realized gain | (.72) | (.99) | (1.45) | (1.07) | (.47) | (1.34) |
| Total distributions | (.79) | (1.38) | (1.90) | (1.60)B | (.87) | (1.83)B |
| Net asset value, end of period | $26.97 | $23.90 | $23.77 | $20.37 | $23.89 | $21.97 |
| Total ReturnC,D,E | 16.57% | 6.69% | 27.44% | (8.29)% | 12.89% | 18.02% |
| Ratios to Average Net AssetsF,G | | | | | | |
| Expenses before reductions | .51%H | .53% | .53% | .53% | .53% | .54% |
| Expenses net of fee waivers, if any | .51%H | .53% | .53% | .53% | .53% | .54% |
| Expenses net of all reductions | .51%H | .52% | .52% | .52% | .53% | .54% |
| Net investment income (loss) | 1.62%H | 1.87% | 2.11% | 2.53% | 2.19% | 2.39% |
| Supplemental Data | | | | | | |
| Net assets, end of period (000 omitted) | $3,608,096 | $3,185,391 | $3,202,982 | $2,804,988 | $3,440,095 | $3,550,158 |
| Portfolio turnover rateI | 53%H | 57% | 32% | 39% | 36% | 38% |
A Calculated based on average shares outstanding during the period.
B Total distributions per share do not sum due to rounding.
C Total returns for periods of less than one year are not annualized.
D Total returns do not reflect charges attributable to your insurance company's separate account. Inclusion of these charges would reduce the total returns shown.
E Total returns would have been lower if certain expenses had not been reduced during the applicable periods shown.
F Fees and expenses of any underlying mutual funds or exchange-traded funds (ETFs) are not included in the Fund's expense ratio. The Fund indirectly bears its proportionate share of these expenses. For additional expense information related to investments in Fidelity Central Funds, please refer to the "Investments in Fidelity Central Funds" note found in the Notes to Financial Statements section of the most recent Annual or Semi-Annual report.
G Expense ratios reflect operating expenses of the class. Expenses before reductions do not reflect amounts reimbursed, waived, or reduced through arrangements with the investment adviser, brokerage services, or other offset arrangements, if applicable, and do not represent the amount paid by the class during periods when reimbursements, waivers or reductions occur.
H Annualized
I Amount does not include the portfolio activity of any underlying mutual funds or exchange-traded funds (ETFs).
See accompanying notes which are an integral part of the financial statements.
VIP Equity-Income Portfolio Service Class
| | Six months ended (Unaudited) June 30, | Years endedDecember 31, | | | | |
| | 2021 | 2020 | 2019 | 2018 | 2017 | 2016 |
| Selected Per–Share Data | | | | | | |
| Net asset value, beginning of period | $23.74 | $23.63 | $20.26 | $23.77 | $21.86 | $20.37 |
| Income from Investment Operations | | | | | | |
| Net investment income (loss)A | .19 | .37 | .44 | .55 | .47 | .46 |
| Net realized and unrealized gain (loss) | 3.65 | 1.10 | 4.81 | (2.49) | 2.29 | 2.84 |
| Total from investment operations | 3.84 | 1.47 | 5.25 | (1.94) | 2.76 | 3.30 |
| Distributions from net investment income | (.06) | (.37) | (.43) | (.50) | (.38) | (.47) |
| Distributions from net realized gain | (.72) | (.99) | (1.45) | (1.07) | (.47) | (1.34) |
| Total distributions | (.79)B | (1.36) | (1.88) | (1.57) | (.85) | (1.81) |
| Net asset value, end of period | $26.79 | $23.74 | $23.63 | $20.26 | $23.77 | $21.86 |
| Total ReturnC,D,E | 16.58% | 6.55% | 27.32% | (8.40)% | 12.80% | 17.90% |
| Ratios to Average Net AssetsF,G | | | | | | |
| Expenses before reductions | .61%H | .63% | .63% | .63% | .63% | .64% |
| Expenses net of fee waivers, if any | .61%H | .63% | .63% | .63% | .63% | .64% |
| Expenses net of all reductions | .61%H | .62% | .62% | .62% | .63% | .64% |
| Net investment income (loss) | 1.52%H | 1.77% | 2.01% | 2.43% | 2.09% | 2.29% |
| Supplemental Data | | | | | | |
| Net assets, end of period (000 omitted) | $320,833 | $284,767 | $299,079 | $264,055 | $326,565 | $325,602 |
| Portfolio turnover rateI | 53%H | 57% | 32% | 39% | 36% | 38% |
A Calculated based on average shares outstanding during the period.
B Total distributions per share do not sum due to rounding.
C Total returns for periods of less than one year are not annualized.
D Total returns do not reflect charges attributable to your insurance company's separate account. Inclusion of these charges would reduce the total returns shown.
E Total returns would have been lower if certain expenses had not been reduced during the applicable periods shown.
F Fees and expenses of any underlying mutual funds or exchange-traded funds (ETFs) are not included in the Fund's expense ratio. The Fund indirectly bears its proportionate share of these expenses. For additional expense information related to investments in Fidelity Central Funds, please refer to the "Investments in Fidelity Central Funds" note found in the Notes to Financial Statements section of the most recent Annual or Semi-Annual report.
G Expense ratios reflect operating expenses of the class. Expenses before reductions do not reflect amounts reimbursed, waived, or reduced through arrangements with the investment adviser, brokerage services, or other offset arrangements, if applicable, and do not represent the amount paid by the class during periods when reimbursements, waivers or reductions occur.
H Annualized
I Amount does not include the portfolio activity of any underlying mutual funds or exchange-traded funds (ETFs).
See accompanying notes which are an integral part of the financial statements.
VIP Equity-Income Portfolio Service Class 2
| | Six months ended (Unaudited) June 30, | Years endedDecember 31, | | | | |
| | 2021 | 2020 | 2019 | 2018 | 2017 | 2016 |
| Selected Per–Share Data | | | | | | |
| Net asset value, beginning of period | $23.18 | $23.10 | $19.85 | $23.32 | $21.46 | $20.04 |
| Income from Investment Operations | | | | | | |
| Net investment income (loss)A | .17 | .33 | .40 | .51 | .43 | .42 |
| Net realized and unrealized gain (loss) | 3.54 | 1.09 | 4.70 | (2.44) | 2.24 | 2.78 |
| Total from investment operations | 3.71 | 1.42 | 5.10 | (1.93) | 2.67 | 3.20 |
| Distributions from net investment income | (.06) | (.34) | (.40) | (.47) | (.34) | (.44) |
| Distributions from net realized gain | (.72) | (.99) | (1.45) | (1.07) | (.47) | (1.34) |
| Total distributions | (.78) | (1.34)B | (1.85) | (1.54) | (.81) | (1.78) |
| Net asset value, end of period | $26.11 | $23.18 | $23.10 | $19.85 | $23.32 | $21.46 |
| Total ReturnC,D,E | 16.43% | 6.44% | 27.11% | (8.54)% | 12.65% | 17.71% |
| Ratios to Average Net AssetsF,G | | | | | | |
| Expenses before reductions | .76%H | .78% | .78% | .78% | .78% | .79% |
| Expenses net of fee waivers, if any | .76%H | .78% | .78% | .78% | .78% | .79% |
| Expenses net of all reductions | .76%H | .77% | .77% | .77% | .78% | .79% |
| Net investment income (loss) | 1.37%H | 1.62% | 1.86% | 2.28% | 1.94% | 2.14% |
| Supplemental Data | | | | | | |
| Net assets, end of period (000 omitted) | $1,734,414 | $1,563,662 | $1,431,212 | $1,200,026 | $1,452,633 | $1,397,762 |
| Portfolio turnover rateI | 53%H | 57% | 32% | 39% | 36% | 38% |
A Calculated based on average shares outstanding during the period.
B Total distributions per share do not sum due to rounding.
C Total returns for periods of less than one year are not annualized.
D Total returns do not reflect charges attributable to your insurance company's separate account. Inclusion of these charges would reduce the total returns shown.
E Total returns would have been lower if certain expenses had not been reduced during the applicable periods shown.
F Fees and expenses of any underlying mutual funds or exchange-traded funds (ETFs) are not included in the Fund's expense ratio. The Fund indirectly bears its proportionate share of these expenses. For additional expense information related to investments in Fidelity Central Funds, please refer to the "Investments in Fidelity Central Funds" note found in the Notes to Financial Statements section of the most recent Annual or Semi-Annual report.
G Expense ratios reflect operating expenses of the class. Expenses before reductions do not reflect amounts reimbursed, waived, or reduced through arrangements with the investment adviser, brokerage services, or other offset arrangements, if applicable, and do not represent the amount paid by the class during periods when reimbursements, waivers or reductions occur.
H Annualized
I Amount does not include the portfolio activity of any underlying mutual funds or exchange-traded funds (ETFs).
See accompanying notes which are an integral part of the financial statements.
VIP Equity-Income Portfolio Investor Class
| | Six months ended (Unaudited) June 30, | Years endedDecember 31, | | | | |
| | 2021 | 2020 | 2019 | 2018 | 2017 | 2016 |
| Selected Per–Share Data | | | | | | |
| Net asset value, beginning of period | $23.74 | $23.63 | $20.26 | $23.77 | $21.86 | $20.37 |
| Income from Investment Operations | | | | | | |
| Net investment income (loss)A | .20 | .38 | .44 | .55 | .48 | .47 |
| Net realized and unrealized gain (loss) | 3.64 | 1.10 | 4.81 | (2.48) | 2.28 | 2.83 |
| Total from investment operations | 3.84 | 1.48 | 5.25 | (1.93) | 2.76 | 3.30 |
| Distributions from net investment income | (.06) | (.38) | (.44) | (.51) | (.38) | (.47) |
| Distributions from net realized gain | (.72) | (.99) | (1.45) | (1.07) | (.47) | (1.34) |
| Total distributions | (.79)B | (1.37) | (1.88)B | (1.58) | (.85) | (1.81) |
| Net asset value, end of period | $26.79 | $23.74 | $23.63 | $20.26 | $23.77 | $21.86 |
| Total ReturnC,D,E | 16.58% | 6.57% | 27.35% | (8.37)% | 12.83% | 17.93% |
| Ratios to Average Net AssetsF,G | | | | | | |
| Expenses before reductions | .59%H | .60% | .61% | .61% | .62% | .62% |
| Expenses net of fee waivers, if any | .59%H | .60% | .61% | .61% | .61% | .62% |
| Expenses net of all reductions | .58%H | .60% | .60% | .60% | .61% | .62% |
| Net investment income (loss) | 1.55%H | 1.80% | 2.03% | 2.45% | 2.11% | 2.31% |
| Supplemental Data | | | | | | |
| Net assets, end of period (000 omitted) | $586,484 | $464,283 | $449,909 | $382,041 | $457,011 | $428,682 |
| Portfolio turnover rateI | 53%H | 57% | 32% | 39% | 36% | 38% |
A Calculated based on average shares outstanding during the period.
B Total distributions per share do not sum due to rounding.
C Total returns for periods of less than one year are not annualized.
D Total returns do not reflect charges attributable to your insurance company's separate account. Inclusion of these charges would reduce the total returns shown.
E Total returns would have been lower if certain expenses had not been reduced during the applicable periods shown.
F Fees and expenses of any underlying mutual funds or exchange-traded funds (ETFs) are not included in the Fund's expense ratio. The Fund indirectly bears its proportionate share of these expenses. For additional expense information related to investments in Fidelity Central Funds, please refer to the "Investments in Fidelity Central Funds" note found in the Notes to Financial Statements section of the most recent Annual or Semi-Annual report.
G Expense ratios reflect operating expenses of the class. Expenses before reductions do not reflect amounts reimbursed, waived, or reduced through arrangements with the investment adviser, brokerage services, or other offset arrangements, if applicable, and do not represent the amount paid by the class during periods when reimbursements, waivers or reductions occur.
H Annualized
I Amount does not include the portfolio activity of any underlying mutual funds or exchange-traded funds (ETFs).
See accompanying notes which are an integral part of the financial statements.
Notes to Financial Statements (Unaudited)
For the period ended June 30, 2021
1. Organization.
VIP Equity-Income Portfolio (the Fund) is a fund of Variable Insurance Products Fund (the Trust) and is authorized to issue an unlimited number of shares. The Trust is registered under the Investment Company Act of 1940, as amended (the 1940 Act), as an open-end management investment company organized as a Massachusetts business trust. Shares of the Fund may only be purchased by insurance companies for the purpose of funding variable annuity or variable life insurance contracts. The Fund offers the following classes of shares: Initial Class shares, Service Class shares, Service Class 2 shares and Investor Class shares. All classes have equal rights and voting privileges, except for matters affecting a single class.
2. Investments in Fidelity Central Funds.
Funds may invest in Fidelity Central Funds, which are open-end investment companies generally available only to other investment companies and accounts managed by the investment adviser and its affiliates. The Schedule of Investments lists any Fidelity Central Funds held as an investment as of period end, but does not include the underlying holdings of each Fidelity Central Fund. An investing fund indirectly bears its proportionate share of the expenses of the underlying Fidelity Central Funds.
Based on its investment objective, each Fidelity Central Fund may invest or participate in various investment vehicles or strategies that are similar to those of the investing fund. These strategies are consistent with the investment objectives of the investing fund and may involve certain economic risks which may cause a decline in value of each of the Fidelity Central Funds and thus a decline in the value of the investing fund.
| Fidelity Central Fund | Investment Manager | Investment Objective | Investment Practices | Expense Ratio(a) |
| Fidelity Money Market Central Funds | Fidelity Management & Research Company LLC (FMR) | Each fund seeks to obtain a high level of current income consistent with the preservation of capital and liquidity. | Short-term Investments | Less than .005% to .01% |
(a) Expenses expressed as a percentage of average net assets and are as of each underlying Central Fund's most recent annual or semi-annual shareholder report.
A complete unaudited list of holdings for each Fidelity Central Fund is available upon request or at the Securities and Exchange Commission website at www.sec.gov. In addition, the financial statements of the Fidelity Central Funds which contain the significant accounting policies (including investment valuation policies) of those funds, and are not covered by the Report of Independent Registered Public Accounting Firm, are available on the Securities and Exchange Commission website or upon request.
3. Significant Accounting Policies.
The Fund is an investment company and applies the accounting and reporting guidance of the Financial Accounting Standards Board (FASB) Accounting Standards Codification Topic 946 Financial Services - Investment Companies. The financial statements have been prepared in conformity with accounting principles generally accepted in the United States of America (GAAP), which require management to make certain estimates and assumptions at the date of the financial statements. Actual results could differ from those estimates. Subsequent events, if any, through the date that the financial statements were issued have been evaluated in the preparation of the financial statements. The Fund's Schedule of Investments lists any underlying mutual funds or exchange-traded funds (ETFs) but does not include the underlying holdings of these funds. The following summarizes the significant accounting policies of the Fund:
Investment Valuation. Investments are valued as of 4:00 p.m. Eastern time on the last calendar day of the period. The Board of Trustees (the Board) has delegated the day to day responsibility for the valuation of the Fund's investments to the Fair Value Committee (the Committee) established by the Fund's investment adviser. In accordance with valuation policies and procedures approved by the Board, the Fund attempts to obtain prices from one or more third party pricing vendors or brokers to value its investments. When current market prices, quotations or currency exchange rates are not readily available or reliable, investments will be fair valued in good faith by the Committee, in accordance with procedures adopted by the Board. Factors used in determining fair value vary by investment type and may include market or investment specific events. The frequency with which these procedures are used cannot be predicted and they may be utilized to a significant extent. The Committee oversees the Fund's valuation policies and procedures and reports to the Board on the Committee's activities and fair value determinations. The Board monitors the appropriateness of the procedures used in valuing the Fund's investments and ratifies the fair value determinations of the Committee.
The Fund categorizes the inputs to valuation techniques used to value its investments into a disclosure hierarchy consisting of three levels as shown below:
- Level 1 – quoted prices in active markets for identical investments
- Level 2 – other significant observable inputs (including quoted prices for similar investments, interest rates, prepayment speeds, etc.)
- Level 3 – unobservable inputs (including the Fund's own assumptions based on the best information available)
Valuation techniques used to value the Fund's investments by major category are as follows:
Equity securities, including restricted securities, for which market quotations are readily available, are valued at the last reported sale price or official closing price as reported by a third party pricing vendor on the primary market or exchange on which they are traded and are categorized as Level 1 in the hierarchy. In the event there were no sales during the day or closing prices are not available, securities are valued at the last quoted bid price or may be valued using the last available price and are generally categorized as Level 2 in the hierarchy. For foreign equity securities, when market or security specific events arise, comparisons to the valuation of American Depositary Receipts (ADRs), futures contracts, Exchange-Traded Funds (ETFs) and certain indexes as well as quoted prices for similar securities may be used and would be categorized as Level 2 in the hierarchy. For equity securities, including restricted securities, where observable inputs are limited, assumptions about market activity and risk are used and these securities may be categorized as Level 3 in the hierarchy.
Investments in open-end mutual funds, including the Fidelity Central Funds, are valued at their closing net asset value (NAV) each business day and are categorized as Level 1 in the hierarchy.
Changes in valuation techniques may result in transfers in or out of an assigned level within the disclosure hierarchy. The aggregate value of investments by input level as of June 30, 2021 is included at the end of the Fund's Schedule of Investments.
Foreign Currency. Certain Funds may use foreign currency contracts to facilitate transactions in foreign-denominated securities. Gains and losses from these transactions may arise from changes in the value of the foreign currency or if the counterparties do not perform under the contracts' terms.
Foreign-denominated assets, including investment securities, and liabilities are translated into U.S. dollars at the exchange rates at period end. Purchases and sales of investment securities, income and dividends received, and expenses denominated in foreign currencies are translated into U.S. dollars at the exchange rate in effect on the transaction date.
The effects of exchange rate fluctuations on investments are included with the net realized and unrealized gain (loss) on investment securities. Other foreign currency transactions resulting in realized and unrealized gain (loss) are disclosed separately.
Investment Transactions and Income. For financial reporting purposes, the Fund's investment holdings and NAV include trades executed through the end of the last business day of the period. The NAV per share for processing shareholder transactions is calculated as of the close of business of the New York Stock Exchange (NYSE), normally 4:00 p.m. Eastern time and includes trades executed through the end of the prior business day. Gains and losses on securities sold are determined on the basis of identified cost and include proceeds received from litigation. Dividend income is recorded on the ex-dividend date, except for certain dividends from foreign securities where the ex-dividend date may have passed, which are recorded as soon as the Fund is informed of the ex-dividend date. Non-cash dividends included in dividend income, if any, are recorded at the fair market value of the securities received. Income and capital gain distributions from Fidelity Central Funds, if any, are recorded on the ex-dividend date. Certain distributions received by the Fund represent a return of capital or capital gain. The Fund determines the components of these distributions subsequent to the ex-dividend date, based upon receipt of tax filings or other correspondence relating to the underlying investment. These distributions are recorded as a reduction of cost of investments and/or as a realized gain. Investment income is recorded net of foreign taxes withheld where recovery of such taxes is uncertain.
Class Allocations and Expenses. Investment income, realized and unrealized capital gains and losses, common expenses of a fund, and certain fund-level expense reductions, if any, are allocated daily on a pro-rata basis to each class based on the relative net assets of each class to the total net assets of a fund. Each class differs with respect to transfer agent and distribution and service plan fees incurred, as applicable. Certain expense reductions may also differ by class, if applicable. For the reporting period, the allocated portion of income and expenses to each class as a percent of its average net assets may vary due to the timing of recording these transactions in relation to fluctuating net assets of the classes. Expenses directly attributable to a fund are charged to that fund. Expenses attributable to more than one fund are allocated among the respective funds on the basis of relative net assets or other appropriate methods. Expenses included in the accompanying financial statements reflect the expenses of that fund and do not include any expenses associated with any underlying mutual funds or exchange-traded funds. Although not included in a fund's expenses, a fund indirectly bears its proportionate share of these expenses through the net asset value of each underlying mutual fund or exchange-traded fund. Expense estimates are accrued in the period to which they relate and adjustments are made when actual amounts are known.
Deferred Trustee Compensation. Under a Deferred Compensation Plan (the Plan) for certain Funds, certain independent Trustees have elected to defer receipt of a portion of their annual compensation. Deferred amounts are invested in affiliated mutual funds, are marked-to-market and remain in a fund until distributed in accordance with the Plan. The investment of deferred amounts and the offsetting payable to the Trustees presented below are included in the accompanying Statement of Assets and Liabilities in other receivables and other payables and accrued expenses, as applicable.
| VIP Equity-Income Portfolio | $24,444 |
Income Tax Information and Distributions to Shareholders. Each year, the Fund intends to qualify as a regulated investment company under Subchapter M of the Internal Revenue Code, including distributing substantially all of its taxable income and realized gains. As a result, no provision for U.S. Federal income taxes is required. The Fund files a U.S. federal tax return, in addition to state and local tax returns as required. The Fund's federal income tax returns are subject to examination by the Internal Revenue Service (IRS) for a period of three fiscal years after they are filed. State and local tax returns may be subject to examination for an additional fiscal year depending on the jurisdiction. Foreign taxes are provided for based on the Fund's understanding of the tax rules and rates that exist in the foreign markets in which it invests.
Distributions are declared and recorded on the ex-dividend date. Income and capital gain distributions are declared separately for each class. Income and capital gain distributions are determined in accordance with income tax regulations, which may differ from GAAP.
Capital accounts within the financial statements are adjusted for permanent book-tax differences. These adjustments have no impact on net assets or the results of operations. Capital accounts are not adjusted for temporary book-tax differences which will reverse in a subsequent period.
Book-tax differences are primarily due to foreign currency transactions, passive foreign investment companies (PFIC), deferred trustees compensation, partnerships and losses deferred due to wash sales.
As of period end, the cost and unrealized appreciation (depreciation) in securities, and derivatives if applicable, for federal income tax purposes were as follows:
| Gross unrealized appreciation | $1,988,659,704 |
| Gross unrealized depreciation | (48,303,263) |
| Net unrealized appreciation (depreciation) | $1,940,356,441 |
| Tax cost | $4,296,561,078 |
Restricted Securities (including Private Placements). Funds may invest in securities that are subject to legal or contractual restrictions on resale. These securities generally may be resold in transactions exempt from registration or to the public if the securities are registered. Disposal of these securities may involve time-consuming negotiations and expense, and prompt sale at an acceptable price may be difficult. Information regarding restricted securities held at period end is included at the end of the Schedule of Investments, if applicable.
4. Purchases and Sales of Investments.
Purchases and sales of securities, other than short-term securities, and in-kind transactions, as applicable, are noted in the table below.
| | Purchases ($) | Sales ($) |
| VIP Equity-Income Portfolio | 1,517,757,140 | 1,678,244,024 |
5. Fees and Other Transactions with Affiliates.
Management Fee. Fidelity Management & Research Company LLC (the investment adviser) and its affiliates provide the Fund with investment management related services for which the Fund pays a monthly management fee. The management fee is the sum of an individual fund fee rate that is based on an annual rate of .20% of the Fund's average net assets and an annualized group fee rate that averaged .23% during the period. The group fee rate is based upon the monthly average net assets of a group of registered investment companies with which the investment adviser has management contracts. The group fee rate decreases as assets under management increase and increases as assets under management decrease. For the reporting period, the total annualized management fee rate was .43% of the Fund's average net assets.
Distribution and Service Plan Fees. In accordance with Rule 12b-1 of the 1940 Act, the Fund has adopted separate 12b-1 Plans for each Service Class of shares. Each Service Class pays Fidelity Distributors Company LLC (FDC), an affiliate of the investment adviser, a service fee. For the period, the service fee is based on an annual rate of .10% of Service Class' average net assets and .25% of Service Class 2's average net assets.
For the period, total fees, all of which were re-allowed to insurance companies for the distribution of shares and providing shareholder support services, were as follows:
| Service Class | $153,319 |
| Service Class 2 | 2,080,793 |
| | $2,234,112 |
Transfer Agent Fees. Fidelity Investments Institutional Operations Company LLC (FIIOC), an affiliate of the investment adviser, is the Fund's transfer, dividend disbursing, and shareholder servicing agent. FIIOC receives an asset-based fee with respect to each class. Each class pays a fee for transfer agent services, typesetting and printing and mailing of shareholder reports, excluding mailing of proxy statements. For the period, transfer agent fees for each class were as follows:
| | Amount | % of Class-Level Average Net Assets(a) |
| Initial Class | $1,097,100 | .06 |
| Service Class | 97,475 | .06 |
| Service Class 2 | 529,125 | .06 |
| Investor Class | 372,937 | .14 |
| | $2,096,637 | |
(a) Annualized
Accounting Fees. Fidelity Service Company, Inc. (FSC), an affiliate of the investment adviser, maintains the Fund's accounting records. The accounting fee is based on the level of average net assets for each month. For the period, the fees were equivalent to the following annualized rates:
| | % of Average Net Assets |
| VIP Equity-Income Portfolio | .02 |
Brokerage Commissions. A portion of portfolio transactions were placed with brokerage firms which are affiliates of the investment adviser. Brokerage commissions are included in net realized gain (loss) and change in net unrealized appreciation (depreciation) in the Statement of Operations. The commissions paid to these affiliated firms were as follows:
| | Amount |
| VIP Equity-Income Portfolio | $39,076 |
Interfund Trades. Funds may purchase from or sell securities to other Fidelity Funds under procedures adopted by the Board. The procedures have been designed to ensure these interfund trades are executed in accordance with Rule 17a-7 of the 1940 Act. Any interfund trades are included within the respective purchases and sales amounts shown in the Purchases and Sales of Investments note and are noted in the table below.
| | Purchases ($) | Sales ($) |
| VIP Equity-Income Portfolio | 113,675,609 | 101,552,099 |
6. Committed Line of Credit.
Certain Funds participate with other funds managed by the investment adviser or an affiliate in a $4.25 billion credit facility (the "line of credit") to be utilized for temporary or emergency purposes to fund shareholder redemptions or for other short-term liquidity purposes. The participating funds have agreed to pay commitment fees on their pro-rata portion of the line of credit, which are reflected in Miscellaneous expenses on the Statement of Operations, and are listed below. During the period, there were no borrowings on this line of credit.
| | Amount |
| VIP Equity-Income Portfolio | $5,457 |
7. Security Lending.
Funds lend portfolio securities from time to time in order to earn additional income. Lending agents are used, including National Financial Services (NFS), an affiliate of the investment adviser. Pursuant to a securities lending agreement, NFS will receive a fee, which is capped at 9.9% of a fund's daily lending revenue, for its services as lending agent. A fund may lend securities to certain qualified borrowers, including NFS. On the settlement date of the loan, a fund receives collateral (in the form of U.S. Treasury obligations, letters of credit and/or cash) against the loaned securities and maintains collateral in an amount not less than 100% of the market value of the loaned securities during the period of the loan. The market value of the loaned securities is determined at the close of business of a fund and any additional required collateral is delivered to a fund on the next business day. A fund or borrower may terminate the loan at any time, and if the borrower defaults on its obligation to return the securities loaned because of insolvency or other reasons, a fund may apply collateral received from the borrower against the obligation. A fund may experience delays and costs in recovering the securities loaned. Any cash collateral received is invested in the Fidelity Securities Lending Cash Central Fund. Any loaned securities are identified as such in the Schedule of Investments, and the value of loaned securities and cash collateral at period end, as applicable, are presented in the Statement of Assets and Liabilities. Security lending income represents the income earned on investing cash collateral, less rebates paid to borrowers and any lending agent fees associated with the loan, plus any premium payments received for lending certain types of securities. Security lending income is presented in the Statement of Operations as a component of income from Fidelity Central Funds. Affiliated security lending activity, if any, was as follows:
| | Total Security Lending Fees Paid to NFS | Security Lending Income From Securities Loaned to NFS | Value of Securities Loaned to NFS at Period End |
| VIP Equity-Income Portfolio | $2,210 | $– | $– |
8. Expense Reductions.
Commissions paid to certain brokers with whom the investment adviser, or its affiliates, places trades on behalf of the Fund include an amount in addition to trade execution, which may be rebated back to the Fund to offset expenses. This amount totaled $157,900 for the period. In addition, through arrangements with the Fund's custodian, credits realized as a result of certain uninvested cash balances were used to reduce the Fund's expenses. During the period, custodian credits reduced the Fund's expenses by $29.
In addition, during the period the investment adviser or an affiliate reimbursed and/or waived a portion of fund-level operating expenses in the amount of $8,121.
9. Distributions to Shareholders.
Distributions to shareholders of each class were as follows:
| | Six months ended
June 30, 2021 | Year ended
December 31, 2020 |
| VIP Equity-Income Portfolio | | |
| Distributions to shareholders | | |
| Initial Class | $104,848,595 | $183,966,364 |
| Service Class | 9,325,937 | 16,791,567 |
| Service Class 2 | 51,912,925 | 83,630,899 |
| Investor Class | 15,528,143 | 26,117,152 |
| Total | $181,615,600 | $310,505,982 |
10. Share Transactions.
Transactions for each class of shares were as follows and may contain in-kind transactions:
| | Shares | Shares | Dollars | Dollars |
| | Six months ended June 30, 2021 | Year ended December 31, 2020 | Six months ended June 30, 2021 | Year ended December 31, 2020 |
| VIP Equity-Income Portfolio | | | | |
| Initial Class | | | | |
| Shares sold | 4,654,679 | 8,721,428 | $119,456,561 | $182,159,954 |
| Reinvestment of distributions | 4,375,985 | 8,041,682 | 104,848,595 | 183,966,364 |
| Shares redeemed | (8,567,661) | (18,228,223) | (219,496,272) | (383,592,543) |
| Net increase (decrease) | 463,003 | (1,465,113) | $4,808,884 | $(17,466,225) |
| Service Class | | | | |
| Shares sold | 263,539 | 392,690 | $6,718,259 | $8,161,348 |
| Reinvestment of distributions | 391,682 | 738,646 | 9,325,937 | 16,791,567 |
| Shares redeemed | (671,287) | (1,797,283) | (16,962,048) | (37,396,052) |
| Net increase (decrease) | (16,066) | (665,947) | $(917,852) | $(12,443,137) |
| Service Class 2 | | | | |
| Shares sold | 2,730,547 | 11,639,815 | $68,173,974 | $230,966,893 |
| Reinvestment of distributions | 2,235,699 | 3,766,962 | 51,912,925 | 83,630,899 |
| Shares redeemed | (6,010,668) | (9,896,829) | (147,943,019) | (203,737,296) |
| Net increase (decrease) | (1,044,422) | 5,509,948 | $(27,856,120) | $110,860,496 |
| Investor Class | | | | |
| Shares sold | 2,579,589 | 2,667,918 | $65,395,427 | $55,485,142 |
| Reinvestment of distributions | 652,169 | 1,148,723 | 15,528,143 | 26,117,152 |
| Shares redeemed | (892,788) | (3,305,655) | (22,241,761) | (67,192,189) |
| Net increase (decrease) | 2,338,970 | 510,986 | $58,681,809 | $14,410,105 |
11. Other.
Fund's organizational documents provide former and current trustees and officers with a limited indemnification against liabilities arising in connection with the performance of their duties to the fund. In the normal course of business, the fund may also enter into contracts that provide general indemnifications. The fund's maximum exposure under these arrangements is unknown as this would be dependent on future claims that may be made against the fund. The risk of material loss from such claims is considered remote.
At the end of the period, the investment adviser or its affiliates were owners of record of more than 10% and certain otherwise unaffiliated shareholders were owners of record of more than 10% of the outstanding shares as follows:
| Fund | Affiliated % | Number of
Unaffiliated Shareholders | Unaffiliated Shareholders % |
| VIP: Equity-Income Portfolio | 16% | 1 | 18% |
12. Coronavirus (COVID-19) Pandemic.
An outbreak of COVID-19 first detected in China during December 2019 has since spread globally and was declared a pandemic by the World Health Organization during March 2020. Developments that disrupt global economies and financial markets, such as the COVID-19 pandemic, may magnify factors that affect the Fund's performance.
Shareholder Expense Example
As a shareholder, you incur two types of costs: (1) transaction costs, which may include sales charges (loads) on purchase payments or redemption proceeds, as applicable and (2) ongoing costs, which generally include management fees, distribution and/or service (12b-1) fees and other Fund expenses. This Example is intended to help you understand your ongoing costs (in dollars) of investing in a fund and to compare these costs with the ongoing costs of investing in other mutual funds.
The Example is based on an investment of $1,000 invested at the beginning of the period and held for the entire period (January 1, 2021 to June 30, 2021).
Actual Expenses
The first line of the accompanying table provides information about actual account values and actual expenses. You may use the information in this line, together with the amount you invested, to estimate the expenses that you paid over the period. Simply divide your account value by $1,000.00 (for example, an $8,600 account value divided by $1,000.00 = 8.6), then multiply the result by the number in the first line for a class/Fund under the heading entitled "Expenses Paid During Period" to estimate the expenses you paid on your account during this period. If any fund is a shareholder of any underlying mutual funds or exchange-traded funds (ETFs) (the Underlying Funds), such fund indirectly bears its proportional share of the expenses of the Underlying Funds in addition to the direct expenses incurred presented in the table. These fees and expenses are not included in the annualized expense ratio used to calculate the expense estimate in the table below. The estimate of expenses does not include any fees or other expenses of any variable annuity or variable life insurance product. If they were, the estimate of expenses you paid during the period would be higher, and your ending account value would be lower.
Hypothetical Example for Comparison Purposes
The second line of the accompanying table provides information about hypothetical account values and hypothetical expenses based on the actual expense ratio and an assumed rate of return of 5% per year before expenses, which is not the actual return. The hypothetical account values and expenses may not be used to estimate the actual ending account balance or expenses you paid for the period. You may use this information to compare the ongoing costs of investing in the Fund and other funds. To do so, compare this 5% hypothetical example with the 5% hypothetical examples that appear in the shareholder reports of the other funds. If any fund is a shareholder of any Underlying Funds, such fund indirectly bears its proportional share of the expenses of the Underlying Funds in addition to the direct expenses as presented in the table. These fees and expenses are not included in the annualized expense ratio used to calculate the expense estimate in the table below. The estimate of expenses does not include any fees or other expenses of any variable annuity or variable life insurance product. If they were, the estimate of expenses you paid during the period would be higher, and your ending account value would be lower.
Please note that the expenses shown in the table are meant to highlight your ongoing costs only and do not reflect any transaction costs. Therefore, the second line of the table is useful in comparing ongoing costs only, and will not help you determine the relative total costs of owning different funds.
| | Annualized Expense Ratio-A | Beginning
Account Value
January 1, 2021 | Ending
Account Value
June 30, 2021 | Expenses Paid
During Period-B
January 1, 2021
to June 30, 2021 |
| VIP Equity-Income Portfolio | | | | |
| Initial Class | .51% | | | |
| Actual | | $1,000.00 | $1,165.70 | $2.74 |
| Hypothetical-C | | $1,000.00 | $1,022.27 | $2.56 |
| Service Class | .61% | | | |
| Actual | | $1,000.00 | $1,165.80 | $3.28 |
| Hypothetical-C | | $1,000.00 | $1,021.77 | $3.06 |
| Service Class 2 | .76% | | | |
| Actual | | $1,000.00 | $1,164.30 | $4.08 |
| Hypothetical-C | | $1,000.00 | $1,021.03 | $3.81 |
| Investor Class | .59% | | | |
| Actual | | $1,000.00 | $1,165.80 | $3.17 |
| Hypothetical-C | | $1,000.00 | $1,021.87 | $2.96 |
A Annualized expense ratio reflects expenses net of applicable fee waivers.
B Expenses are equal to the annualized expense ratio, multiplied by the average account value over the period, multiplied by 181/ 365 (to reflect the one-half year period). The fees and expenses of any Underlying Funds are not included in each annualized expense ratio.
C 5% return per year before expenses
Board Approval of Investment Advisory Contracts and Management Fees
VIP Equity-Income Portfolio
Each year, the Board of Trustees, including the Independent Trustees (together, the Board), votes on the renewal of the management contract with Fidelity Management & Research Company LLC (FMR) and the sub-advisory agreements (together, the Advisory Contracts) for the fund. FMR and the sub-advisers are referred to herein as the Investment Advisers. The Board, assisted by the advice of fund counsel and Independent Trustees' counsel, requests and considers a broad range of information relevant to the renewal of the Advisory Contracts throughout the year.
The Board meets regularly and, at each of its meetings, covers an extensive agenda of topics and materials and considers factors that are relevant to its annual consideration of the renewal of the fund's Advisory Contracts, including the services and support provided to the fund and its shareholders. The Board has established various standing committees (Committees), each composed of and chaired by Independent Trustees with varying backgrounds, to which the Board has assigned specific subject matter responsibilities in order to enhance effective decision-making by the Board. The Board, acting directly and through its Committees, requests and receives information concerning the annual consideration of the renewal of the fund's Advisory Contracts. The Board also meets as needed to review matters specifically related to the Board's annual consideration of the renewal of the Advisory Contracts. Members of the Board may also meet with trustees of other Fidelity funds through joint ad hoc committees to discuss certain matters relevant to all of the Fidelity funds.
Approval of Stub Period Continuation. At its January 2021 meeting, the Board of Trustees voted to continue the fund's management contract with FMR, and the sub-advisory agreements and sub-subadvisory agreements, in each case, where applicable (together, the Advisory Contracts), without modification, for four months from February 1, 2021 through May 31, 2021, in connection with changes to the Board's meeting calendar. The Board considered that the approval of the fund's Advisory Contracts will not result in any changes in (i) the investment process or strategies employed in the management of the fund's assets; (ii) the fees and expenses paid by shareholders; (iii) the nature, extent or quality of services provided under the fund's Advisory Contracts; or (iv) the day-to-day management of the fund or the persons primarily responsible for such management. The Board also considered that since its last approval of the fund's Advisory Contracts, FMR had provided additional information on the fund in support of the annual contract renewal process, including competitive analyses on total expenses and management fees and in-depth reviews of fund performance and fund profitability information. The Board also considered the findings of certain ad hoc committees that had been previously formed to discuss matters relevant to all of the Fidelity funds, including economies of scale, fall-out benefits and retail vs. institutional funds. The Board concluded that the fund's Advisory Contracts are fair and reasonable, and that the fund's Advisory Contracts should be renewed, without modification, through May 31, 2021, with the understanding that the Board will consider the annual renewal for a full one year period in May 2021.
At its May 2021 meeting, the Board unanimously determined to renew the fund's Advisory Contracts. In reaching its determination, the Board considered all factors it believed relevant, including (i) the nature, extent, and quality of the services provided to the fund and its shareholders (including the investment performance of the fund); (ii) the competitiveness of the fund's management fee and total expense ratio relative to peer funds; (iii) the total costs of the services provided by and the profits realized by Fidelity from its relationships with the fund; and (iv) the extent to which, if any, economies of scale exist and are realized as the fund grows, and whether any economies of scale are appropriately shared with fund shareholders.
In considering whether to renew the Advisory Contracts for the fund, the Board reached a determination, with the assistance of fund counsel and Independent Trustees' counsel and through the exercise of its business judgment, that the renewal of the Advisory Contracts was in the best interests of the fund and its shareholders and that the compensation payable under the Advisory Contracts was fair and reasonable. The Board's decision to renew the Advisory Contracts was not based on any single factor, but rather was based on a comprehensive consideration of all the information provided to the Board at its meetings throughout the year. The Board, in reaching its determination to renew the Advisory Contracts, was aware that shareholders of the fund have a broad range of investment choices available to them, including a wide choice among funds offered by Fidelity's competitors, and that the fund's shareholders, who have the opportunity to review and weigh the disclosure provided by the fund in its prospectus and other public disclosures, have chosen to invest in this fund, which is part of the Fidelity family of funds.
Nature, Extent, and Quality of Services Provided. The Board considered Fidelity's staffing as it relates to the fund, including the backgrounds of investment personnel of Fidelity, and also considered the fund's investment objective, strategies, and related investment philosophy. The Independent Trustees also had discussions with senior management of Fidelity's investment operations and investment groups. The Board considered the structure of the investment personnel compensation program and whether this structure provides appropriate incentives to act in the best interests of the fund. Additionally, the Board considered the portfolio managers' investments, if any, in the funds that they manage.
Resources Dedicated to Investment Management and Support Services. The Board and the Fund Oversight and Research Committees reviewed the general qualifications and capabilities of Fidelity's investment staff, including its size, education, experience, and resources, as well as Fidelity's approach to recruiting, training, managing, and compensating investment personnel. The Board noted that Fidelity has continued to increase the resources devoted to non-U.S. offices, including expansion of Fidelity's global investment organization. The Board also noted that Fidelity's analysts have extensive resources, tools and capabilities that allow them to conduct sophisticated quantitative and fundamental analysis, as well as credit analysis of issuers, counterparties and guarantors. Further, the Board considered that Fidelity's investment professionals have sufficient access to global information and data so as to provide competitive investment results over time, and that those professionals also have access to sophisticated tools that permit them to assess portfolio construction and risk and performance attribution characteristics continuously, as well as to transmit new information and research conclusions rapidly around the world. Additionally, in its deliberations, the Board considered Fidelity's trading, risk management, compliance, and technology and operations capabilities and resources, which are integral parts of the investment management process. The Board also considered Fidelity's investments in business continuity planning, and its success in continuously providing services to the fund notwithstanding the severe disruptions caused by the COVID-19 pandemic.
Shareholder and Administrative Services. The Board considered (i) the nature, extent, quality, and cost of advisory, administrative, and shareholder services performed by the Investment Advisers and their affiliates under the Advisory Contracts and under separate agreements covering transfer agency, pricing and bookkeeping, and securities lending services for the fund; (ii) the nature and extent of the supervision of third party service providers, principally custodians, subcustodians, and pricing vendors; and (iii) the resources devoted to, and the record of compliance with, the fund's compliance policies and procedures. The Board also reviewed the allocation of fund brokerage, including allocations to brokers affiliated with the Investment Advisers, the use of brokerage commissions to pay fund expenses, and the use of "soft" commission dollars to pay for research services.
The Board noted that the growth of fund assets over time across the complex allows Fidelity to reinvest in the development of services designed to enhance the value and convenience of the Fidelity funds as investment vehicles. These services include 24-hour access to account information and market information over the Internet and through telephone representatives, investor education materials and asset allocation tools, and the expanded availability of Fidelity Investor Centers.
The Board noted that, in the past, it and the boards of certain other Fidelity funds had formed an ad hoc Committee on Transfer Agency Fees to review the variety of transfer agency fee structures throughout the industry and Fidelity's competitive positioning with respect to industry participants.
Investment in a Large Fund Family. The Board considered the benefits to shareholders of investing in a Fidelity fund, including the benefits of investing in a fund that is part of a large family of funds offering a variety of investment disciplines and providing a large variety of mutual fund investor services. The Board noted that Fidelity had taken, or had made recommendations that resulted in the Fidelity funds taking, a number of actions over the previous year that benefited particular funds, including: (i) continuing to dedicate additional resources to Fidelity's investment research process, which includes meetings with management of issuers of securities in which the funds invest, and to the support of the senior management team that oversees asset management; (ii) continuing efforts to enhance Fidelity's global research capabilities; (iii) launching new funds and ETFs with innovative structures, strategies and pricing and making other enhancements to meet client needs; (iv) launching new share classes of existing funds; (v) eliminating purchase minimums and broadening eligibility requirements for certain funds and share classes; (vi) approving the reduction in the holding period for the Class C to Class A conversion policy; (vii) reducing management fees and total expenses for certain target date funds and classes and index funds; (viii) lowering expenses for certain existing funds and classes by implementing or lowering expense caps; (ix) rationalizing product lines and gaining increased efficiencies from fund mergers, liquidations, and share class consolidations; (x) continuing to develop, acquire and implement systems and technology to improve services to the funds and shareholders, strengthen information security, and increase efficiency; and (xi) continuing to implement enhancements to further strengthen Fidelity's product line to increase investors' probability of success in achieving their investment goals, including retirement income goals.
Investment Performance. The Board considered whether the fund has operated in accordance with its investment objective, as well as its record of compliance with its investment restrictions and its performance history. The Board noted that there were portfolio management changes for the fund in January 2018 and May 2019. The Board will continue to monitor closely the fund's performance, taking into account the portfolio management changes.
The Board took into account discussions that occur at Board meetings throughout the year with representatives of the Investment Advisers about fund investment performance. In this regard the Board noted that as part of regularly scheduled fund reviews and other reports to the Board on fund performance, the Board considers annualized return information for the fund for different time periods, measured against an appropriate securities market index (benchmark index) and an appropriate peer group of funds with similar objectives (peer group). In its evaluation of fund investment performance, the Board gave particular attention to information indicating changes in performance of certain Fidelity funds for specific time periods and discussed with the Investment Advisers the reasons for any overperformance or underperformance.
In addition to reviewing absolute and relative fund performance, the Independent Trustees periodically consider the appropriateness of fund performance metrics in evaluating the results achieved. In general, the Independent Trustees believe that fund performance should be evaluated based on net performance (after fees and expenses) of both the highest performing and lowest performing fund share classes, where applicable, compared to appropriate benchmark indices, over appropriate time periods that may include full market cycles, and compared to peer groups, as applicable, over the same periods, taking into account relevant factors including the following: general market conditions; issuer-specific information; and fund cash flows and other factors.
The Independent Trustees recognize that shareholders evaluate performance on a net basis over their own holding periods, for which one-, three-, and five-year periods are often used as a proxy. For this reason, the performance information reviewed by the Board also included net cumulative total return information for the fund and an appropriate benchmark index and peer group for the most recent one-, three-, and five-year periods ended September 30, 2020, as shown below. Returns are shown compared to the 25th percentile (top of box, 75% beaten) and 75th percentile (bottom of box, 25% beaten) of the peer universe.
VIP Equity-Income Portfolio
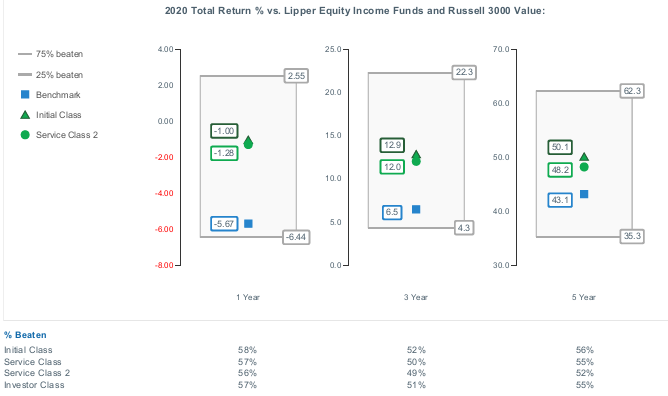
Based on its review, the Board concluded that the nature, extent, and quality of services provided to the fund under the Advisory Contracts should continue to benefit the shareholders of the fund.
Competitiveness of Management Fee and Total Expense Ratio. The Board considered the fund's management fee and total expense ratio compared to "mapped groups" of competitive funds and classes created for the purpose of facilitating the Trustees' competitive analysis of management fees and total expenses. Fidelity creates "mapped groups" by combining similar Lipper investment objective categories that have comparable investment mandates. Combining Lipper investment objective categories aids the Board's management fee and total expense ratio comparisons by broadening the competitive group used for comparison.
Management Fee. The Board considered two proprietary management fee comparisons for the 12-month periods ended September 30 (June 30 for periods ended 2019 and 2018 and December 31 for periods prior to 2018) shown in basis points (BP) in the chart below. The group of Lipper funds used by the Board for management fee comparisons is referred to below as the "Total Mapped Group." The Total Mapped Group is broader than the Lipper peer group used by the Board for performance comparisons because the Total Mapped Group combines several Lipper investment objective categories while the Lipper peer group does not. The Total Mapped Group comparison focuses on a fund's standing in terms of gross management fees before expense reimbursements or caps relative to the total universe of funds with comparable investment mandates, regardless of whether their management fee structures also are comparable. Funds with comparable investment mandates offer exposure to similar types of securities. Funds with comparable management fee structures have similar management fee contractual arrangements (
e.g., flat rate charged for advisory services, all-inclusive fee rate,
etc.). "TMG %" represents the percentage of funds in the Total Mapped Group that had management fees that were lower than the fund's. For example, a hypothetical TMG % of 20% would mean that 80% of the funds in the Total Mapped Group had higher, and 20% had lower, management fees than the fund. The fund's actual TMG %s and the number of funds in the Total Mapped Group are in the chart below. The "Asset-Sized Peer Group" (ASPG) comparison focuses on a fund's standing relative to a subset of non-Fidelity funds within the Total Mapped Group that are similar in size and management fee structure. For example, if a fund is in the first quartile of the ASPG, the fund's management fee ranks in the least expensive or lowest 25% of funds in the ASPG. The ASPG represents at least 15% of the funds in the Total Mapped Group with comparable asset size and management fee structures, subject to a minimum of 50 funds (or all funds in the Total Mapped Group if fewer than 50). Additional information, such as the ASPG quartile in which the fund's management fee rate ranked, is also included in the chart and was considered by the Board.
VIP Equity-Income Portfolio
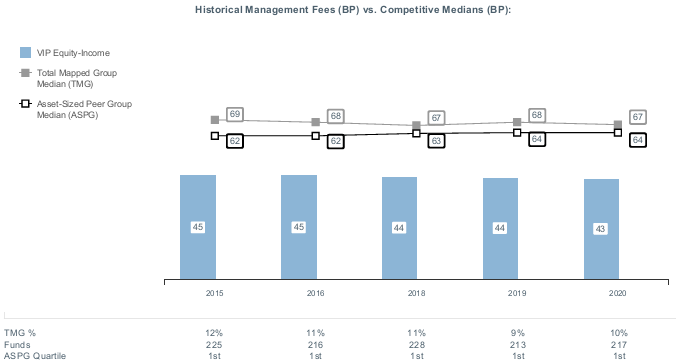
The Board noted that the fund's management fee rate ranked below the median of its Total Mapped Group and below the median of its ASPG for the 12-month period ended September 30, 2020.
The Board noted that, in the past, it and the boards of other Fidelity funds had formed an ad hoc Committee on Group Fee to conduct an in-depth review of the "group fee" component of the management fee of funds with such management fee structures. The Committee's focus included the mechanics of the group fee, the competitive landscape of group fee structures, Fidelity funds with no group fee component and investment products not included in group fee assets. The Board also considered that, for funds subject to the group fee, FMR agreed to voluntarily waive fees over a specified period of time in amounts designed to account for assets converted from certain funds to certain collective investment trusts.
The Board also noted that, in 2013, the ad hoc Committee on Management Fees was formed to conduct an in-depth review of the management fee rates of Fidelity's active equity mutual funds. The Committee focused on the following areas: (i) standard fee structures; (ii) research consumption and trading evolution; (iii) management fee competitiveness/profitability by category; and (iv) factors that drive institutional pricing.
Based on its review, the Board concluded that the fund's management fee is fair and reasonable in light of the services that the fund receives and the other factors considered.
Total Expense Ratio. In its review of each class's total expense ratio, the Board considered the fund's management fee rate as well as other fund or class expenses, as applicable, such as transfer agent fees, pricing and bookkeeping fees, fund-paid 12b-1 fees, and custodial, legal, and audit fees. The Board also noted that Fidelity may agree to waive fees or reimburse expenses from time to time, and the extent to which, if any, it has done so for the fund. As part of its review, the Board also considered the current and historical total expense ratios of each class of the fund compared to competitive fund median expenses. The fund's representative class is compared to those funds and classes in the Total Mapped Group (used by the Board for management fee comparisons) that have a similar sales load structure (SLTG). The Board also considered a total expense ASPG comparison for the representative class, which focuses on the total expenses of the representative class relative to a subset of non-Fidelity funds within the total expense SLTG. The total expense ASPG is limited to 15 larger and 15 smaller classes in fund average assets for a total of 30 classes, where possible. The total expense ASPG comparison excludes performance adjustments and fund-paid 12b-1 fees to eliminate variability in fee structures.
The Board noted that the total expense ratio of Initial Class ranked below the SLTG competitive median and below the ASPG competitive median for the 12-month period ended September 30, 2020.
Fees Charged to Other Fidelity Clients. The Board also considered Fidelity fee structures and other information with respect to clients of Fidelity, such as other funds advised or subadvised by Fidelity, pension plan clients, and other institutional clients with similar mandates. The Board noted that a joint ad hoc committee created by it and the boards of other Fidelity funds periodically reviews and compares Fidelity's institutional investment advisory business with its business of providing services to the Fidelity funds and also noted the most recent findings of the committee. The Board noted that the committee's review included a consideration of the differences in services provided, fees charged, and costs incurred, as well as competition in the markets serving the different categories of clients.
Based on its review of total expense ratios and fees charged to other Fidelity clients, the Board concluded that the total expense ratio of each class of the fund was reasonable in light of the services that the fund and its shareholders receive and the other factors considered.
Costs of the Services and Profitability. The Board considered the revenues earned and the expenses incurred by Fidelity in conducting the business of developing, marketing, distributing, managing, administering and servicing the fund and servicing the fund's shareholders. The Board also considered the level of Fidelity's profits in respect of all the Fidelity funds.
On an annual basis, Fidelity presents to the Board information about the profitability of its relationships with the fund. Fidelity calculates profitability information for each fund, as well as aggregate profitability information for groups of Fidelity funds and all Fidelity funds, using a series of detailed revenue and cost allocation methodologies which originate with the books and records of Fidelity on which Fidelity's audited financial statements are based. The Audit Committee of the Board reviews any significant changes from the prior year's methodologies and the full Board approves such changes.
A public accounting firm has been engaged annually by the Board as part of the Board's assessment of Fidelity's profitability analysis. The engagement includes the review and assessment of the methodologies used by Fidelity in determining the revenues and expenses attributable to Fidelity's mutual fund business, and completion of agreed-upon procedures in respect of the mathematical accuracy of certain fund profitability information and its conformity to established allocation methodologies. After considering the reports issued under the engagement and information provided by Fidelity, the Board concluded that while other allocation methods may also be reasonable, Fidelity's profitability methodologies are reasonable in all material respects.
The Board also reviewed Fidelity's non-fund businesses and potential indirect benefits such businesses may have received as a result of their association with Fidelity's mutual fund business (i.e., fall-out benefits) as well as cases where Fidelity's affiliates may benefit from the funds' business. The Board considered areas where potential indirect benefits to the Fidelity funds from their relationships with Fidelity may exist. The Board also considered that in 2019 a joint ad hoc committee created by it and the boards of other Fidelity funds evaluated potential fall-out benefits (PFOB Committee). The Board noted that it considered the PFOB Committee's findings in connection with its consideration of the renewal of the Advisory Contracts.
The Board considered the costs of the services provided by and the profits realized by Fidelity in connection with the operation of the fund, including the conclusions of the PFOB Committee, and was satisfied that the profitability was not excessive.
Economies of Scale. The Board considered whether there have been economies of scale in respect of the management of the Fidelity funds, whether the Fidelity funds (including the fund) have appropriately benefited from any such economies of scale, and whether there is potential for realization of any further economies of scale. The Board considered the extent to which the fund will benefit from economies of scale as assets grow through increased services to the fund, through waivers or reimbursements, or through fee or expense ratio reductions. The Board also noted that a committee (the Economies of Scale Committee) created by it and the boards of other Fidelity funds periodically analyzes whether Fidelity attains economies of scale in respect of the management and servicing of the Fidelity funds, whether the Fidelity funds have appropriately benefited from such economies of scale, and whether there is potential for realization of any further economies of scale.
The Board recognized that the fund's management contract incorporates a "group fee" structure, which provides for lower group fee rates as total "group assets" increase, and for higher group fee rates as total "group assets" decrease ("group assets" as defined in the management contract). FMR calculates the group fee rates based on a tiered asset "breakpoint" schedule that varies based on asset class. The Board considered that the group fee is designed to deliver the benefits of economies of scale to fund shareholders when total Fidelity fund assets increase, even if assets of any particular fund are unchanged or have declined, because some portion of Fidelity's costs are attributable to services provided to all Fidelity funds, and all funds benefit if those costs can be allocated among more assets. The Board further considered that Fidelity agreed to impose a temporary fee waiver in the form of additional breakpoints to the current breakpoint schedule. The Board concluded that, given the group fee structure, fund shareholders will benefit from lower management fees as "group assets" increase at the fund complex level, regardless of whether Fidelity achieves any such economies of scale.
The Board concluded, taking into account the analysis of the Economies of Scale Committee, that economies of scale, if any, are being appropriately shared between fund shareholders and Fidelity.
Additional Information Requested by the Board. In order to develop fully the factual basis for consideration of the Fidelity funds' advisory contracts, the Board requested and received additional information on certain topics, including: (i) fund flow and performance trends, in particular the underperformance of certain funds and strategies, and Fidelity's long-term strategies for certain funds; (ii) consideration of expanding the use of performance fees for additional funds; (iii) Fidelity's pricing philosophy compared to competitors; (iv) metrics for evaluating index fund and ETF performance and information about ETF trading characteristics; (v) the methodology with respect to evaluating competitive fund data and peer group classifications and fee and expense comparisons; (vi) the expense structures for different funds and classes and information about the differences between various expense structures; (vii) group fee breakpoints; (viii) information regarding other accounts managed by Fidelity and sub-advisory arrangements; and (ix) Fidelity's philosophies and strategies for evaluating funds and classes with lower or declining asset levels.
Based on its evaluation of all of the conclusions noted above, and after considering all factors it believed relevant, the Board concluded that the advisory fee arrangements are fair and reasonable, and that the fund's Advisory Contracts should be renewed.
Liquidity Risk Management Program
The Securities and Exchange Commission adopted Rule 22e-4 under the Investment Company Act of 1940 (the Liquidity Rule) to promote effective liquidity risk management throughout the open-end investment company industry, thereby reducing the risk that funds will be unable to meet their redemption obligations and mitigating dilution of the interests of fund shareholders.
The Fund has adopted and implemented a liquidity risk management program pursuant to the Liquidity Rule (the Program) effective December 1, 2018. The Program is reasonably designed to assess and manage the Fund’s liquidity risk and to comply with the requirements of the Liquidity Rule. The Fund’s Board of Trustees (the Board) has designated the Fund’s investment adviser as administrator of the Program. The Fidelity advisers have established a Liquidity Risk Management Committee (the LRM Committee) to manage the Program for each of the Fidelity Funds. The LRM Committee monitors the adequacy and effectiveness of implementation of the Program and on a periodic basis assesses each Fund’s liquidity risk based on a variety of factors including (1) the Fund’s investment strategy, (2) portfolio liquidity and cash flow projections during normal and reasonably foreseeable stressed conditions, (3) shareholder redemptions, (4) borrowings and other funding sources and (5) in the case of exchange-traded funds, certain additional factors including the effect of the Fund’s prices and spreads, market participants, and basket compositions on the overall liquidity of the Fund’s portfolio, as applicable.
In accordance with the Program, each of the Fund’s portfolio investments is classified into one of four liquidity categories described below based on a determination of a reasonable expectation for how long it would take to convert the investment to cash (or sell or dispose of the investment) without significantly changing its market value.
- Highly liquid investments – cash or convertible to cash within three business days or less
- Moderately liquid investments – convertible to cash in three to seven calendar days
- Less liquid investments – can be sold or disposed of, but not settled, within seven calendar days
- Illiquid investments – cannot be sold or disposed of within seven calendar days
Liquidity classification determinations take into account a variety of factors including various market, trading and investment-specific considerations, as well as market depth, and generally utilize analysis from a third-party liquidity metrics service.
The Liquidity Rule places a 15% limit on a fund’s illiquid investments and requires funds that do not primarily hold assets that are highly liquid investments to determine and maintain a minimum percentage of the fund’s net assets to be invested in highly liquid investments (highly liquid investment minimum or HLIM). The Program includes provisions reasonably designed to comply with the 15% limit on illiquid investments and for determining, periodically reviewing and complying with the HLIM requirement as applicable.
At a recent meeting of the Fund’s Board of Trustees, the LRM Committee provided a written report to the Board pertaining to the operation, adequacy, and effectiveness of implementation of the Program for the annual period from December 1, 2019 through November 30, 2020. The report concluded that the Program has been implemented and is operating effectively and is reasonably designed to assess and manage the Fund’s liquidity risk.

VIPEI-SANN-0821
1.705693.123
Fidelity® Variable Insurance Products:
Floating Rate High Income Portfolio
Semi-Annual Report
June 30, 2021
Contents
To view a fund's proxy voting guidelines and proxy voting record for the 12-month period ended June 30, visit http://www.fidelity.com/proxyvotingresults or visit the Securities and Exchange Commission's (SEC) web site at http://www.sec.gov.
You may also call 1-877-208-0098 to request a free copy of the proxy voting guidelines.
Fidelity® Variable Insurance Products are separate account options which are purchased through a variable insurance contract.
Standard & Poor's, S&P and S&P 500 are registered service marks of The McGraw-Hill Companies, Inc. and have been licensed for use by Fidelity Distributors Corporation.
Other third-party marks appearing herein are the property of their respective owners.
All other marks appearing herein are registered or unregistered trademarks or service marks of FMR LLC or an affiliated company. © 2021 FMR LLC. All rights reserved.
This report and the financial statements contained herein are submitted for the general information of the shareholders of the Fund. This report is not authorized for distribution to prospective investors in the Fund unless preceded or accompanied by an effective prospectus.
A fund files its complete schedule of portfolio holdings with the SEC for the first and third quarters of each fiscal year on Form N-PORT. Forms N-PORT are available on the SEC’s web site at http://www.sec.gov. A fund's Forms N-PORT may be reviewed and copied at the SEC’s Public Reference Room in Washington, DC. Information regarding the operation of the SEC's Public Reference Room may be obtained by calling 1-800-SEC-0330.
For a complete list of a fund's portfolio holdings, view the most recent holdings listing, semiannual report, or annual report on Fidelity's web site at http://www.fidelity.com, http://www.institutional.fidelity.com, or http://www.401k.com, as applicable.
NOT FDIC INSURED •MAY LOSE VALUE •NO BANK GUARANTEE
Neither the Fund nor Fidelity Distributors Corporation is a bank.
Note to Shareholders:
Early in 2020, the outbreak and spread of a new coronavirus emerged as a public health emergency that had a major influence on financial markets, primarily based on its impact on the global economy and the outlook for corporate earnings. The virus causes a respiratory disease known as COVID-19. On March 11, 2020 the World Health Organization declared the COVID-19 outbreak a pandemic, citing sustained risk of further global spread.
In the weeks following, as the crisis worsened, we witnessed an escalating human tragedy with wide-scale social and economic consequences from coronavirus-containment measures. The outbreak of COVID-19 prompted a number of measures to limit the spread, including travel and border restrictions, quarantines, and restrictions on large gatherings. In turn, these resulted in lower consumer activity, diminished demand for a wide range of products and services, disruption in manufacturing and supply chains, and – given the wide variability in outcomes regarding the outbreak – significant market uncertainty and volatility. Amid the turmoil, global governments and central banks took unprecedented action to help support consumers, businesses, and the broader economies, and to limit disruption to financial systems.
The situation continues to unfold, and the extent and duration of its impact on financial markets and the economy remain highly uncertain. Extreme events such as the coronavirus crisis are “exogenous shocks” that can have significant adverse effects on mutual funds and their investments. Although multiple asset classes may be affected by market disruption, the duration and impact may not be the same for all types of assets.
Fidelity is committed to helping you stay informed amid news about COVID-19 and during increased market volatility, and we’re taking extra steps to be responsive to customer needs. We encourage you to visit our websites, where we offer ongoing updates, commentary, and analysis on the markets and our funds.
Investment Summary (Unaudited)
Top Five Holdings as of June 30, 2021
| (by issuer, excluding cash equivalents) | % of fund's net assets |
| Bass Pro Group LLC | 2.3 |
| Intelsat Jackson Holdings SA | 2.2 |
| Asurion LLC | 1.6 |
| Caesars Resort Collection LLC | 1.2 |
| UKG, Inc. | 1.1 |
| | 8.4 |
Top Five Market Sectors as of June 30, 2021
| | % of fund's net assets |
| Technology | 15.0 |
| Services | 7.6 |
| Telecommunications | 6.7 |
| Healthcare | 6.5 |
| Energy | 5.1 |
Quality Diversification (% of fund's net assets)
| As of June 30, 2021 |
| | BBB | 2.8% |
| | BB | 24.1% |
| | B | 57.4% |
| | CCC,CC,C | 3.9% |
| | Not Rated | 5.3% |
| | Equities | 1.2% |
| | Short-Term Investments and Net Other Assets | 5.3% |
We have used ratings from Moody's Investors Service, Inc. Where Moody's® ratings are not available, we have used S&P® ratings. All ratings are as of the date indicated and do not reflect subsequent changes.
Asset Allocation (% of fund's net assets)
| As of June 30, 2021* |
| | Bank Loan Obligations | 89.9% |
| | Nonconvertible Bonds | 3.5% |
| | Common Stocks | 1.2% |
| | Short-Term Investments and Net Other Assets (Liabilities) | 5.3% |

* Foreign investments - 11.5%
Schedule of Investments June 30, 2021 (Unaudited)
Showing Percentage of Net Assets
| Bank Loan Obligations - 89.9% | | | |
| | | Principal Amount | Value |
| Aerospace - 1.4% | | | |
| ADS Tactical, Inc. Tranche B 1LN, term loan 3 month U.S. LIBOR + 5.750% 6.75% 3/19/26 (a)(b)(c) | | $345,625 | $346,489 |
| Gemini HDPE LLC Tranche B 1LN, term loan 3 month U.S. LIBOR + 3.000% 3.5% 12/31/27 (a)(b)(c) | | 157,916 | 157,587 |
| Jazz Acquisition, Inc. 1LN, term loan 3 month U.S. LIBOR + 4.250% 4.35% 6/19/26 (a)(b)(c) | | 245,625 | 237,387 |
| TransDigm, Inc.: | | | |
| Tranche E 1LN, term loan 3 month U.S. LIBOR + 2.250% 2.3543% 5/30/25 (a)(b)(c) | | 587,747 | 579,037 |
| Tranche F 1LN, term loan 3 month U.S. LIBOR + 2.250% 2.3543% 12/9/25 (a)(b)(c) | | 951,217 | 936,435 |
| WP CPP Holdings LLC: | | | |
| Tranche B 1LN, term loan 3 month U.S. LIBOR + 3.750% 4.75% 4/30/25 (a)(b)(c) | | 407,467 | 398,910 |
| Tranche B 2LN, term loan 3 month U.S. LIBOR + 7.750% 8.75% 4/30/26 (a)(b)(c) | | 120,000 | 116,500 |
|
| TOTAL AEROSPACE | | | 2,772,345 |
|
| Air Transportation - 1.9% | | | |
| AAdvantage Loyalty IP Ltd. Tranche B 1LN, term loan 3 month U.S. LIBOR + 4.750% 5.5% 3/24/28 (a)(b)(c) | | 605,000 | 630,259 |
| Dynasty Acquisition Co., Inc.: | | | |
| Tranche B 1LN, term loan 3 month U.S. LIBOR + 3.500% 3.6473% 4/8/26 (a)(b)(c) | | 325,874 | 317,183 |
| Tranche B2 1LN, term loan 3 month U.S. LIBOR + 3.500% 3.6473% 4/4/26 (a)(b)(c) | | 175,201 | 170,528 |
| JetBlue Airways Corp. Tranche B 1LN, term loan 3 month U.S. LIBOR + 5.250% 6.25% 6/17/24 (a)(b)(c) | | 2,375 | 2,422 |
| Mileage Plus Holdings LLC Tranche B 1LN, term loan 3 month U.S. LIBOR + 5.250% 6.25% 7/2/27 (a)(b)(c) | | 570,000 | 608,281 |
| SkyMiles IP Ltd. Tranche B 1LN, term loan 3 month U.S. LIBOR + 3.750% 4.75% 10/20/27 (a)(b)(c) | | 495,000 | 522,567 |
| Transplace Holding, Inc. Tranche B 1LN, term loan 3 month U.S. LIBOR + 3.750% 4.75% 10/5/24 (a)(b)(c) | | 116,025 | 116,170 |
| United Airlines, Inc. Tranche B 1LN, term loan 3 month U.S. LIBOR + 3.750% 4.5% 4/14/28 (a)(b)(c) | | 962,588 | 974,350 |
| WestJet Airlines Ltd. 1LN, term loan 3 month U.S. LIBOR + 2.750% 4% 12/11/26 (a)(b)(c) | | 437,461 | 428,712 |
|
| TOTAL AIR TRANSPORTATION | | | 3,770,472 |
|
| Automotive & Auto Parts - 1.2% | | | |
| Adient U.S. LLC Tranche B 1LN, term loan 3 month U.S. LIBOR + 3.500% 3.6043% 4/8/28 (a)(b)(c) | | 135,000 | 134,958 |
| American Trailer World Corp. Tranche B 1LN, term loan 3 month U.S. LIBOR + 3.750% 4.5% 2/17/28 (a)(b)(c) | | 215,000 | 214,598 |
| Clarios Global LP Tranche B 1LN, term loan 3 month U.S. LIBOR + 3.250% 3.3543% 4/30/26 (a)(b)(c) | | 281,131 | 278,319 |
| CWGS Group LLC Tranche B 1LN, term loan 1 month U.S. LIBOR + 2.500% 3.25% 6/3/28 (a)(b)(c) | | 478,800 | 474,314 |
| Les Schwab Tire Centers Tranche B 1LN, term loan 3 month U.S. LIBOR + 3.500% 4% 11/2/27 (a)(b)(c) | | 348,250 | 347,815 |
| Midas Intermediate Holdco II LLC Tranche B 1LN, term loan 3 month U.S. LIBOR + 6.750% 7.5% 12/16/25 (a)(b)(c) | | 303,849 | 295,873 |
| Thor Industries, Inc. Tranche B 1LN, term loan 3 month U.S. LIBOR + 3.000% 3.125% 2/1/26 (a)(b)(c) | | 359,171 | 358,722 |
| Truck Hero, Inc. Tranche B 1LN, term loan 3 month U.S. LIBOR + 3.750% 4.5% 1/29/28 (a)(b)(c) | | 384,038 | 383,845 |
|
| TOTAL AUTOMOTIVE & AUTO PARTS | | | 2,488,444 |
|
| Banks & Thrifts - 0.7% | | | |
| Citadel Securities LP Tranche B 1LN, term loan 3 month U.S. LIBOR + 2.500% 2.6043% 2/27/28 (a)(b)(c) | | 703,238 | 695,474 |
| Deerfield Dakota Holding LLC Tranche B 1LN, term loan 3 month U.S. LIBOR + 3.750% 4.75% 4/9/27 (a)(b)(c) | | 248,120 | 249,051 |
| eResearchTechnology, Inc. Tranche B 1LN, term loan 3 month U.S. LIBOR + 4.500% 5.5% 2/4/27 (a)(b)(c) | | 204,484 | 205,283 |
| Russell Investments U.S. Institutional Holdco, Inc. Tranche B 1LN, term loan 3 month U.S. LIBOR + 3.000% 4.5% 5/30/25 (a)(b)(c) | | 245,000 | 243,393 |
| Victory Capital Holdings, Inc. Tranche B 1LN, term loan 3 month U.S. LIBOR + 2.250% 2.4443% 7/1/26 (a)(b)(c) | | 112,208 | 111,297 |
|
| TOTAL BANKS & THRIFTS | | | 1,504,498 |
|
| Broadcasting - 1.6% | | | |
| AppLovin Corp. Tranche B, term loan 3 month U.S. LIBOR + 3.250% 3.3543% 8/15/25 (a)(b)(c) | | 815,742 | 814,266 |
| Diamond Sports Group LLC Tranche B 1LN, term loan 3 month U.S. LIBOR + 3.250% 3.36% 8/24/26 (a)(b)(c) | | 1,375,276 | 823,625 |
| iHeartCommunications, Inc. Tranche B 1LN, term loan 3 month U.S. LIBOR + 4.000% 4.75% 5/1/26 (a)(b)(c) | | 138,600 | 138,600 |
| Nexstar Broadcasting, Inc. Tranche B, term loan 3 month U.S. LIBOR + 2.750% 2.5921% 9/19/26 (a)(b)(c) | | 595,021 | 593,366 |
| Univision Communications, Inc.: | | | |
| Tranche B 1LN, term loan 1 month U.S. LIBOR + 3.250% 5/6/28 (b)(c)(d) | | 545,000 | 542,504 |
| Tranche C 5LN, term loan 3 month U.S. LIBOR + 2.750% 3.75% 3/15/24 (a)(b)(c) | | 375,000 | 374,344 |
|
| TOTAL BROADCASTING | | | 3,286,705 |
|
| Building Materials - 2.3% | | | |
| Acproducts Holdings, Inc. Tranche B 1LN, term loan 1 month U.S. LIBOR + 4.250% 4.75% 5/17/28 (a)(b)(c) | | 610,000 | 606,517 |
| APi Group DE, Inc. Tranche B 1LN, term loan 3 month U.S. LIBOR + 2.500% 2.6043% 10/1/26 (a)(b)(c) | | 441,142 | 440,405 |
| Beacon Roofing Supply, Inc. Tranche B 1LN, term loan 1 month U.S. LIBOR + 2.500% 2.6042% 4/23/28 (a)(b)(c) | | 250,000 | 248,473 |
| Core & Main LP Tranche B 1LN, term loan 1 month U.S. LIBOR + 2.500% 6/10/28 (b)(c)(d) | | 350,000 | 347,596 |
| Gypsum Management & Supply, Inc. Tranche B 1LN, term loan 3 month U.S. LIBOR + 2.500% 2.6043% 6/1/25 (a)(b)(c) | | 137,231 | 136,803 |
| Hamilton Holdco LLC Tranche B 1LN, term loan 3 month U.S. LIBOR + 2.000% 2.15% 1/4/27 (a)(b)(c) | | 300,980 | 299,851 |
| Ingersoll-Rand Services Co. Tranche B 1LN, term loan 3 month U.S. LIBOR + 1.750% 1.8543% 2/28/27 (a)(b)(c) | | 350,563 | 346,279 |
| LEB Holdings U.S.A., Inc. Tranche B 1LN, term loan 3 month U.S. LIBOR + 3.750% 4.5% 11/2/27 (a)(b)(c) | | 154,225 | 154,466 |
| SRS Distribution, Inc. Tranche B 1LN, term loan 1 month U.S. LIBOR + 3.750% 4.25% 5/20/28 (a)(b)(c) | | 845,000 | 844,062 |
| Traverse Midstream Partners Ll Tranche B, term loan 3 month U.S. LIBOR + 5.500% 6.5% 9/27/24 (a)(b)(c) | | 181,106 | 181,673 |
| USIC Holdings, Inc. Tranche B 1LN, term loan 1 month U.S. LIBOR + 3.500% 4.25% 5/7/28 (a)(b)(c) | | 260,000 | 259,350 |
| Ventia Deco LLC Tranche B, term loan 3 month U.S. LIBOR + 4.000% 5% 5/21/26 (a)(b)(c) | | 434,656 | 435,200 |
| White Capital Buyer LLC Tranche B 1LN, term loan 3 month U.S. LIBOR + 4.000% 4.5% 10/19/27 (a)(b)(c) | | 248,750 | 249,061 |
|
| TOTAL BUILDING MATERIALS | | | 4,549,736 |
|
| Cable/Satellite TV - 3.0% | | | |
| Charter Communication Operating LLC Tranche B2 1LN, term loan 3 month U.S. LIBOR + 1.750% 1.86% 2/1/27 (a)(b)(c) | | 1,432,579 | 1,421,835 |
| Coral-U.S. Co.-Borrower LLC Tranche B, term loan 3 month U.S. LIBOR + 2.250% 2.3543% 1/31/28 (a)(b)(c) | | 985,000 | 968,994 |
| CSC Holdings LLC Tranche B3 1LN, term loan 3 month U.S. LIBOR + 2.250% 2.3229% 1/15/26 (a)(b)(c) | | 977,500 | 962,486 |
| LCPR Loan Financing LLC 1LN, term loan 3 month U.S. LIBOR + 3.750% 3.8229% 9/25/28 (a)(b)(c) | | 195,000 | 195,123 |
| Neptune Finco Corp. Tranche B, term loan 3 month U.S. LIBOR + 2.250% 2.3229% 7/17/25 (a)(b)(c) | | 913,827 | 900,120 |
| Virgin Media Bristol LLC Tranche N, term loan 3 month U.S. LIBOR + 2.500% 2.5729% 1/31/28 (a)(b)(c) | | 375,000 | 371,460 |
| WideOpenWest Finance LLC Tranche B, term loan 3 month U.S. LIBOR + 3.250% 4.25% 8/19/23 (a)(b)(c) | | 1,305,106 | 1,300,760 |
|
| TOTAL CABLE/SATELLITE TV | | | 6,120,778 |
|
| Capital Goods - 0.7% | | | |
| Altra Industrial Motion Corp. Tranche B 1LN, term loan 3 month U.S. LIBOR + 2.000% 2.1043% 10/1/25 (a)(b)(c) | | 291,178 | 289,268 |
| CPM Holdings, Inc.: | | | |
| 2LN, term loan 3 month U.S. LIBOR + 8.250% 8.3421% 11/15/26 (a)(b)(c) | | 67,828 | 66,924 |
| Tranche B 1LN, term loan 3 month U.S. LIBOR + 3.500% 3.5921% 11/15/25 (a)(b)(c) | | 282,750 | 280,346 |
| MHI Holdings LLC Tranche B 1LN, term loan 3 month U.S. LIBOR + 5.000% 5.095% 9/20/26 (a)(b)(c) | | 297,732 | 298,476 |
| TNT Crane & Rigging LLC: | | | |
| 1LN, term loan 3 month U.S. LIBOR + 6.500% 7.5% 10/16/24 (a)(b)(c) | | 125,473 | 130,492 |
| Tranche B 1LN, term loan 3 month U.S. LIBOR + 11.000% 12% 4/16/25 (a)(b)(c) | | 32,886 | 31,447 |
| Vertical U.S. Newco, Inc. Tranche B 1LN, term loan: | | | |
| 1 month U.S. LIBOR + 3.500% 7/31/27 (b)(c)(d) | | 35,000 | 35,015 |
| 3 month U.S. LIBOR + 4.250% 4.4776% 7/31/27 (a)(b)(c) | | 189,051 | 189,131 |
|
| TOTAL CAPITAL GOODS | | | 1,321,099 |
|
| Chemicals - 2.8% | | | |
| Aruba Investment Holdings LLC Tranche B 1LN, term loan 3 month U.S. LIBOR + 4.000% 4.75% 11/24/27 (a)(b)(c) | | 194,513 | 194,999 |
| Cimpress U.S.A., Inc. Tranche B 1LN, term loan 1 month U.S. LIBOR + 3.500% 4% 4/29/28 (a)(b)(c) | | 250,000 | 248,958 |
| Consolidated Energy Finance SA: | | | |
| Tranche B 1LN, term loan 3 month U.S. LIBOR + 3.500% 5/7/25 (b)(c)(d) | | 265,000 | 256,939 |
| Tranche B, term loan 3 month U.S. LIBOR + 2.500% 2.595% 5/7/25 (a)(b)(c) | | 346,094 | 335,565 |
| Element Solutions, Inc. Tranche B 1LN, term loan: | | | |
| 1 month U.S. LIBOR + 2.000% 1/31/26 (b)(c)(d) | | 140,000 | 139,738 |
| 3 month U.S. LIBOR + 2.000% 2.1043% 1/31/26 (a)(b)(c) | | 207,192 | 206,805 |
| Groupe Solmax, Inc. Tranche B 1LN, term loan 3 month U.S. LIBOR + 4.750% 6/24/28 (b)(c)(d) | | 270,000 | 268,650 |
| Herens U.S. Holdco Corp. Tranche B 1LN, term loan 3 month U.S. LIBOR + 4.000% 4/30/28 (b)(c)(d) | | 220,000 | 220,119 |
| Hexion, Inc. Tranche B 1LN, term loan 3 month U.S. LIBOR + 3.500% 3.71% 7/1/26 (a)(b)(c) | | 259,700 | 259,266 |
| ICP Group Tranche B 1LN, term loan 3 month U.S. LIBOR + 3.750% 4.5% 12/29/27 (a)(b)(c) | | 170,000 | 169,522 |
| INEOS U.S. Petrochem LLC Tranche B 1LN, term loan 3 month U.S. LIBOR + 2.750% 3.25% 1/20/26 (a)(b)(c) | | 665,000 | 662,712 |
| LSF11 Skyscraper HoldCo SARL Tranche B 1LN, term loan 3 month U.S. LIBOR + 3.500% 4.25% 9/30/27 (a)(b)(c) | | 284,288 | 284,998 |
| Messer Industries U.S.A., Inc. Tranche B 1LN, term loan 3 month U.S. LIBOR + 2.500% 2.6473% 3/1/26 (a)(b)(c) | | 239,005 | 237,205 |
| Oxea Corp. Tranche B2, term loan 3 month U.S. LIBOR + 3.500% 3.625% 10/11/24 (a)(b)(c) | | 323,893 | 321,869 |
| PQ Group Holdings, Inc. Tranche B 1LN, term loan 3 month U.S. LIBOR + 3.500% 4/30/28 (b)(c)(d) | | 155,000 | 155,048 |
| SCIH Salt Holdings, Inc. Tranche B 1LN, term loan 3 month U.S. LIBOR + 4.000% 4.75% 3/16/27 (a)(b)(c) | | 247,505 | 247,918 |
| Starfruit U.S. Holdco LLC Tranche B, term loan 3 month U.S. LIBOR + 2.750% 3.133% 10/1/25 (a)(b)(c) | | 922,637 | 915,145 |
| The Chemours Co. LLC Tranche B 1LN, term loan 3 month U.S. LIBOR + 1.750% 1.86% 4/3/25 (a)(b)(c) | | 368,700 | 364,475 |
| W. R. Grace & Co.-Conn. Tranche B3 1LN, term loan 3 month U.S. LIBOR + 2.000% 2.1473% 3/30/28 (a)(b)(c) | | 125,000 | 124,375 |
|
| TOTAL CHEMICALS | | | 5,614,306 |
|
| Conglomerates - 0.0% | | | |
| TGP Holdings III LLC Tranche DD 1LN, term loan 1 month U.S. LIBOR + 3.500% 6/25/28 (b)(c)(d) | | 17,857 | 17,879 |
| Consumer Products - 2.1% | | | |
| BCPE Empire Holdings, Inc. 1LN, term loan 3 month U.S. LIBOR + 4.000% 4.1043% 6/11/26 (a)(b)(c) | | 245,778 | 246,086 |
| Bombardier Recreational Products, Inc. Tranche B 1LN, term loan 3 month U.S. LIBOR + 2.000% 2.1043% 5/23/27 (a)(b)(c) | | 124,684 | 123,142 |
| CNT Holdings I Corp. Tranche B 1LN, term loan 3 month U.S. LIBOR + 3.750% 4.5% 11/8/27 (a)(b)(c) | | 518,700 | 518,700 |
| Energizer Holdings, Inc. Tranche B 1LN, term loan 3 month U.S. LIBOR + 2.250% 2.75% 12/16/27 (a)(b)(c) | | 229,425 | 228,679 |
| Gannett Holdings LLC Tranche B 1LN, term loan 3 month U.S. LIBOR + 7.000% 7.75% 1/29/26 (a)(b)(c) | | 128,435 | 129,238 |
| Gloves Buyer, Inc. Tranche B 1LN, term loan 3 month U.S. LIBOR + 4.000% 4.75% 1/6/28 (a)(b)(c) | | 120,000 | 120,000 |
| Hunter Fan Co. 1LN, term loan 3 month U.S. LIBOR + 5.000% 5.75% 5/7/28 (a)(b)(c) | | 195,000 | 195,082 |
| Knowlton Development Corp., Inc. Tranche B 1LN, term loan 3 month U.S. LIBOR + 3.750% 3.8543% 12/21/25 (a)(b)(c) | | 199,490 | 198,243 |
| Kronos Acquisition Holdings, Inc. Tranche B 1LN, term loan 3 month U.S. LIBOR + 3.750% 4.25% 12/22/26 (a)(b)(c) | | 293,525 | 291,200 |
| Mattress Firm, Inc. Tranche B 1LN, term loan 3 month U.S. LIBOR + 5.250% 6.25% 11/25/27 (a)(b)(c) | | 175,750 | 178,058 |
| Michaels Companies, Inc. 1LN, term loan 3 month U.S. LIBOR + 4.250% 5% 4/15/28 (a)(b)(c) | | 895,000 | 898,258 |
| Petco Health & Wellness Co., Inc. Tranche B 1LN, term loan 3 month U.S. LIBOR + 3.250% 4% 3/4/28 (a)(b)(c) | | 204,488 | 204,013 |
| Rodan & Fields LLC Tranche B, term loan 3 month U.S. LIBOR + 4.000% 4.0729% 6/15/25 (a)(b)(c) | | 279,843 | 222,008 |
| TGP Holdings III LLC Tranche B 1LN, term loan 1 month U.S. LIBOR + 3.500% 6/25/28 (b)(c)(d) | | 182,143 | 182,371 |
| TKC Holdings, Inc. 1LN, term loan 1 month U.S. LIBOR + 5.500% 6.5% 5/3/28 (a)(b)(c) | | 230,000 | 225,545 |
| Woof Holdings LLC Tranche B 1LN, term loan 3 month U.S. LIBOR + 3.750% 4.5% 12/21/27 (a)(b)(c) | | 300,000 | 299,751 |
|
| TOTAL CONSUMER PRODUCTS | | | 4,260,374 |
|
| Containers - 3.4% | | | |
| AOT Packaging Products AcquisitionCo LLC: | | | |
| 1LN, term loan 3 month U.S. LIBOR + 3.250% 3.75% 3/3/28 (a)(b)(c) | | 297,976 | 295,631 |
| Tranche DD 1LN, term loan 3 month U.S. LIBOR + 3.250% 3.2667% 3/3/28 (a)(b)(c)(e) | | 67,024 | 66,496 |
| Ball Metalpack Finco LLC Tranche B 1LN, term loan 3 month U.S. LIBOR + 4.500% 4.635% 7/31/25 (a)(b)(c) | | 354,050 | 351,101 |
| Berlin Packaging, LLC Tranche B 1LN, term loan: | | | |
| 3 month U.S. LIBOR + 3.000% 3.1004% 11/7/25 (a)(b)(c) | | 393,911 | 390,094 |
| 3 month U.S. LIBOR + 3.250% 3.75% 3/11/28 (a)(b)(c) | | 200,000 | 199,000 |
| Berry Global, Inc. Tranche Z 1LN, term loan 3 month U.S. LIBOR + 1.750% 1.827% 7/1/26 (a)(b)(c) | | 601,197 | 596,249 |
| BWAY Holding Co. Tranche B, term loan 3 month U.S. LIBOR + 3.250% 3.3543% 4/3/24 (a)(b)(c) | | 480,000 | 468,077 |
| Canister International Group, Inc. 1LN, term loan 3 month U.S. LIBOR + 4.750% 4.8543% 12/21/26 (a)(b)(c) | | 123,438 | 123,489 |
| Charter NEX U.S., Inc. 1LN, term loan 3 month U.S. LIBOR + 4.250% 5% 12/1/27 (a)(b)(c) | | 339,263 | 339,687 |
| Flex Acquisition Co., Inc. Tranche B 1LN, term loan: | | | |
| 3 month U.S. LIBOR + 3.000% 3.4516% 6/29/25 (a)(b)(c) | | 846,181 | 837,431 |
| 3 month U.S. LIBOR + 3.500% 4% 3/2/28 (a)(b)(c) | | 605,576 | 602,675 |
| Graham Packaging Co., Inc. Tranche B 1LN, term loan 3 month U.S. LIBOR + 3.000% 3.75% 2/26/28 (a)(b)(c) | | 439,745 | 439,095 |
| Kloeckner Pentaplast of America, Inc. Tranche B 1LN, term loan 3 month U.S. LIBOR + 4.750% 5.25% 2/4/26 (a)(b)(c) | | 194,513 | 195,485 |
| Pixelle Specialty Solutions LLC Tranche B 1LN, term loan 3 month U.S. LIBOR + 6.500% 7.5% 10/31/24 (a)(b)(c) | | 222,633 | 222,495 |
| Pregis TopCo Corp. 1LN, term loan: | | | |
| 1 month U.S. LIBOR + 4.000% 4.5% 8/1/26 (a)(b)(c) | | 100,000 | 100,000 |
| 3 month U.S. LIBOR + 4.000% 4.1043% 7/31/26 (a)(b)(c) | | 246,250 | 246,004 |
| Printpack Holdings, Inc. Tranche B, term loan 3 month U.S. LIBOR + 3.000% 4% 7/26/23 (a)(b)(c) | | 124,347 | 123,570 |
| Reynolds Consumer Products LLC Tranche B 1LN, term loan 3 month U.S. LIBOR + 1.750% 1.8543% 1/30/27 (a)(b)(c) | | 602,070 | 596,952 |
| Reynolds Group Holdings, Inc.: | | | |
| Tranche B 1LN, term loan 3 month U.S. LIBOR + 3.250% 3.3543% 2/5/26 (a)(b)(c) | | 208,950 | 207,458 |
| Tranche B, term loan 3 month U.S. LIBOR + 2.750% 2.8543% 2/5/23 (a)(b)(c) | | 507,003 | 505,735 |
|
| TOTAL CONTAINERS | | | 6,906,724 |
|
| Diversified Financial Services - 1.9% | | | |
| ACNR Holdings, Inc. term loan 17% 9/21/27 (a)(c)(f) | | 241,195 | 240,592 |
| AlixPartners LLP Tranche B 1LN, term loan 3 month U.S. LIBOR + 2.750% 3.25% 2/4/28 (a)(b)(c) | | 249,375 | 248,233 |
| AVSC Holding Corp. Tranche B2 1LN, term loan 3 month U.S. LIBOR + 5.500% 6.5% 10/15/26 (a)(b)(c) | | 371,274 | 350,060 |
| BCP Renaissance Parent LLC Tranche B, term loan 3 month U.S. LIBOR + 3.500% 4.5% 10/31/24 (a)(b)(c) | | 100,494 | 98,573 |
| Finco I LLC Tranche B 1LN, term loan 3 month U.S. LIBOR + 2.500% 2.6043% 6/27/25 (a)(b)(c) | | 124,063 | 123,597 |
| Focus Financial Partners LLC: | | | |
| Tranche B 1LN, term loan 1 month U.S. LIBOR + 2.500% 6/24/28 (b)(c)(d) | | 325,000 | 323,781 |
| Tranche B-DD 1LN, term loan 1 month U.S. LIBOR + 2.500% 6/24/28 (b)(c)(d) | | 75,000 | 74,719 |
| Tranche B3 1LN, term loan 3 month U.S. LIBOR + 2.000% 2.1043% 7/3/24 (a)(b)(c) | | 124,359 | 123,043 |
| GT Polaris, Inc. Tranche B 1LN, term loan 3 month U.S. LIBOR + 3.750% 4.5% 9/24/27 (a)(b)(c) | | 124,376 | 124,438 |
| HarbourVest Partners LLC Tranche B 1LN, term loan 3 month U.S. LIBOR + 2.250% 2.4338% 3/1/25 (a)(b)(c) | | 641,815 | 638,073 |
| Hightower Holding LLC: | | | |
| Tranche B 1LN, term loan 3 month U.S. LIBOR + 4.000% 4.75% 4/21/28 (a)(b)(c) | | 164,000 | 164,205 |
| Tranche DD 1LN, term loan 3 month U.S. LIBOR + 4.000% 3.75% 4/21/28 (a)(b)(c)(e) | | 41,000 | 41,051 |
| IG Investments Holdings LLC Tranche B 1LN, term loan 3 month U.S. LIBOR + 3.750% 4.75% 5/23/25 (a)(b)(c) | | 14,963 | 14,975 |
| Kingpin Intermediate Holdings LLC Tranche B 1LN, term loan 3 month U.S. LIBOR + 3.500% 4.5% 7/3/24 (a)(b)(c) | | 288,833 | 287,117 |
| KREF Holdings X LLC Tranche B 1LN, term loan 3 month U.S. LIBOR + 4.750% 5.75% 9/1/27 (a)(b)(c) | | 124,375 | 124,997 |
| RPI Intermediate Finance Trust Tranche B 1LN, term loan 3 month U.S. LIBOR + 1.750% 1.8543% 2/11/27 (a)(b)(c) | | 742,465 | 738,441 |
| TransUnion LLC Tranche B5 1LN, term loan 3 month U.S. LIBOR + 1.750% 1.8543% 11/16/26 (a)(b)(c) | | 169,955 | 168,705 |
|
| TOTAL DIVERSIFIED FINANCIAL SERVICES | | | 3,884,600 |
|
| Diversified Media - 1.4% | | | |
| Advantage Sales & Marketing, Inc. Tranche B 1LN, term loan 3 month U.S. LIBOR + 5.250% 6% 10/28/27 (a)(b)(c) | | 517,400 | 522,667 |
| Allen Media LLC Tranche B 1LN, term loan 3 month U.S. LIBOR + 5.500% 5.6473% 2/10/27 (a)(b)(c) | | 987,342 | 987,648 |
| Terrier Media Buyer, Inc. Tranche B 1LN, term loan 3 month U.S. LIBOR + 3.500% 3.6043% 12/17/26 (a)(b)(c) | | 1,354,444 | 1,346,913 |
|
| TOTAL DIVERSIFIED MEDIA | | | 2,857,228 |
|
| Energy - 4.0% | | | |
| Apro LLC Tranche B 1LN, term loan 1 month U.S. LIBOR + 3.750% 4.5% 11/14/26 (a)(b)(c) | | 295,674 | 294,935 |
| Array Technologies, Inc. Tranche B 1LN, term loan 3 month U.S. LIBOR + 3.250% 3.75% 10/14/27 (a)(b)(c) | | 534,906 | 521,758 |
| BCP Raptor II LLC Tranche B, term loan 3 month U.S. LIBOR + 4.750% 4.8543% 11/3/25 (a)(b)(c) | | 449,494 | 440,392 |
| BCP Raptor LLC Tranche B, term loan 3 month U.S. LIBOR + 4.250% 5.25% 6/24/24 (a)(b)(c) | | 486,658 | 481,655 |
| Brazos Delaware II LLC Tranche B, term loan 3 month U.S. LIBOR + 4.000% 4.0934% 5/21/25 (a)(b)(c) | | 117,069 | 114,079 |
| BW Gas & Convenience Holdings LLC Tranche B 1LN, term loan 3 month U.S. LIBOR + 3.500% 4% 3/17/28 (a)(b)(c)(f) | | 180,000 | 179,775 |
| ChampionX Holding, Inc. Tranche B 1LN, term loan 3 month U.S. LIBOR + 5.000% 6% 6/3/27 (a)(b)(c) | | 190,000 | 193,563 |
| Citgo Holding, Inc. Tranche B 1LN, term loan 3 month U.S. LIBOR + 7.000% 8% 8/1/23 (a)(b)(c) | | 309,488 | 306,702 |
| Citgo Petroleum Corp. Tranche B 1LN, term loan 3 month U.S. LIBOR + 6.250% 7.25% 3/28/24 (a)(b)(c) | | 417,625 | 419,454 |
| CQP Holdco LP / BIP-V Chinook Holdco LLC Tranche B 1LN, term loan 1 month U.S. LIBOR + 3.750% 4.25% 6/4/28 (a)(b)(c) | | 1,160,000 | 1,154,780 |
| DT Midstream, Inc. Tranche B 1LN, term loan 1 month U.S. LIBOR + 2.000% 6/12/28 (b)(c)(d) | | 250,000 | 250,223 |
| EG America LLC Tranche B 1LN, term loan 3 month U.S. LIBOR + 4.000% 4.1473% 2/6/25 (a)(b)(c) | | 225,378 | 223,528 |
| Epic Crude Services LP Tranche B 1LN, term loan 3 month U.S. LIBOR + 5.000% 5.14% 3/1/26 (a)(b)(c) | | 411,888 | 325,391 |
| GIP III Stetson I LP Tranche B, term loan 3 month U.S. LIBOR + 4.250% 4.3543% 7/18/25 (a)(b)(c) | | 548,536 | 527,736 |
| Granite Acquisition, Inc. Tranche B 1LN, term loan 3 month U.S. LIBOR + 2.750% 3.25% 3/25/28 (a)(b)(c) | | 270,000 | 269,325 |
| Gulf Finance LLC Tranche B 1LN, term loan 3 month U.S. LIBOR + 5.250% 6.25% 8/25/23 (a)(b)(c) | | 190,278 | 161,126 |
| Hamilton Projs. Acquiror LLC Tranche B 1LN, term loan 3 month U.S. LIBOR + 4.750% 5.75% 6/17/27 (a)(b)(c) | | 251,216 | 248,452 |
| ITT Holdings LLC Tranche B 1LN, term loan 1 month U.S. LIBOR + 2.750% 7/30/28 (b)(c)(d) | | 255,000 | 254,363 |
| Lower Cadence Holdings LLC Tranche B 1LN, term loan 3 month U.S. LIBOR + 4.000% 4.1043% 5/22/26 (a)(b)(c) | | 197,883 | 196,399 |
| Matador Bidco SARL Tranche B 1LN, term loan 3 month U.S. LIBOR + 4.750% 4.8543% 10/15/26 (a)(b)(c) | | 82,719 | 82,684 |
| Murphy U.S.A., Inc. Tranche B 1LN, term loan 3 month U.S. LIBOR + 1.750% 2.25% 1/29/28 (a)(b)(c) | | 280,000 | 280,176 |
| Natgasoline LLC Tranche B, term loan 3 month U.S. LIBOR + 3.500% 3.625% 11/14/25 (a)(b)(c) | | 313,089 | 312,306 |
| Oregon Clean Energy LLC Tranche B 1LN, term loan 3 month U.S. LIBOR + 3.750% 4.75% 3/1/26 (a)(b)(c) | | 79,678 | 72,279 |
| Rockwood Service Corp. Tranche B 1LN, term loan 3 month U.S. LIBOR + 4.250% 4.1043% 1/23/27 (a)(b)(c) | | 240,609 | 240,910 |
| Terra-Gen Finance Co. LLC Tranche B, term loan 3 month U.S. LIBOR + 4.250% 5.25% 12/9/21 (a)(b)(c) | | 245,168 | 242,792 |
| WaterBridge Operating LLC Tranche B 1LN, term loan 3 month U.S. LIBOR + 5.750% 6.75% 6/21/26 (a)(b)(c) | | 234,516 | 224,634 |
|
| TOTAL ENERGY | | | 8,019,417 |
|
| Entertainment/Film - 0.1% | | | |
| SMG U.S. Midco 2, Inc. 1LN, term loan 3 month U.S. LIBOR + 2.500% 2.662% 1/23/25 (a)(b)(c) | | 151,450 | 146,149 |
| Environmental - 0.3% | | | |
| Madison IAQ LLC Tranche B 1LN, term loan 1 month U.S. LIBOR + 3.250% 3.75% 6/15/28 (a)(b)(c) | | 400,000 | 400,000 |
| WTG Holdings III Corp. Tranche B 1LN, term loan 3 month U.S. LIBOR + 2.500% 2.625% 4/1/28 (a)(b)(c) | | 115,000 | 114,233 |
|
| TOTAL ENVIRONMENTAL | | | 514,233 |
|
| Food & Drug Retail - 0.8% | | | |
| Froneri U.S., Inc. Tranche B 1LN, term loan 3 month U.S. LIBOR + 2.250% 2.3543% 1/29/27 (a)(b)(c) | | 485,100 | 477,460 |
| JBS U.S.A. Lux SA Tranche B 1LN, term loan 3 month U.S. LIBOR + 2.000% 2.1043% 5/1/26 (a)(b)(c) | | 641,457 | 639,115 |
| JP Intermediate B LLC Tranche B, term loan 3 month U.S. LIBOR + 5.500% 6.5% 11/20/25 (a)(b)(c) | | 213,464 | 206,847 |
| PetIQ, Inc. Tranche B 1LN, term loan 3 month U.S. LIBOR + 4.250% 4.75% 4/7/28 (a)(b)(c) | | 290,000 | 287,100 |
|
| TOTAL FOOD & DRUG RETAIL | | | 1,610,522 |
|
| Food/Beverage/Tobacco - 1.8% | | | |
| 8th Avenue Food & Provisions, Inc. Tranche B 1LN, term loan 3 month U.S. LIBOR + 3.500% 3.5908% 10/1/25 (a)(b)(c) | | 146,250 | 145,611 |
| Atkins Nutritional Holdings II, Inc. Tranche B 1LN, term loan 3 month U.S. LIBOR + 3.750% 4.75% 7/7/24 (a)(b)(c) | | 193,173 | 193,938 |
| BellRing Brands LLC Tranche B 1LN, term loan 3 month U.S. LIBOR + 4.000% 4.75% 10/21/24 (a)(b)(c) | | 331,446 | 333,478 |
| Chobani LLC Tranche B 1LN, term loan 3 month U.S. LIBOR + 3.500% 4.5% 10/23/27 (a)(b)(c) | | 411,888 | 412,575 |
| City Brewing Co. LLC Tranche B 1LN, term loan 3 month U.S. LIBOR + 3.500% 4.25% 4/5/28 (a)(b)(c) | | 440,000 | 441,650 |
| EG Finco Ltd. Tranche B, term loan 3 month U.S. LIBOR + 4.000% 4.1473% 2/6/25 (a)(b)(c) | | 242,686 | 240,693 |
| Saffron Borrowco LLC Tranche B 1LN, term loan 3 month U.S. LIBOR + 6.750% 6.8543% 6/20/25 (a)(b)(c) | | 241,250 | 241,250 |
| Shearer's Foods, Inc. Tranche B 1LN, term loan 3 month U.S. LIBOR + 3.500% 4.25% 9/23/27 (a)(b)(c) | | 455,611 | 455,752 |
| Triton Water Holdings, Inc. Tranche B 1LN, term loan 3 month U.S. LIBOR + 3.500% 4% 3/31/28 (a)(b)(c) | | 905,000 | 903,742 |
| U.S. Foods, Inc. 1LN, term loan 3 month U.S. LIBOR + 2.000% 2.1043% 9/13/26 (a)(b)(c) | | 121,581 | 119,660 |
| Utz Quality Foods LLC Tranche B 1LN, term loan 3 month U.S. LIBOR + 3.000% 3.1043% 1/20/28 (a)(b)(c) | | 209,187 | 208,850 |
|
| TOTAL FOOD/BEVERAGE/TOBACCO | | | 3,697,199 |
|
| Gaming - 4.8% | | | |
| AP Gaming I LLC Tranche B, term loan 3 month U.S. LIBOR + 3.500% 4.5% 2/15/24 (a)(b)(c) | | 192,008 | 190,048 |
| Aristocrat International Pty Ltd. Tranche B 1LN, term loan 3 month U.S. LIBOR + 3.750% 4.75% 10/19/24 (a)(b)(c) | | 94,050 | 94,134 |
| Bally's Corp. Tranche B 1LN, term loan 3 month U.S. LIBOR + 8.000% 9% 5/10/26 (a)(b)(c) | | 277,200 | 292,100 |
| Boyd Gaming Corp. Tranche B 1LN, term loan 3 month U.S. LIBOR + 2.250% 2.3383% 9/15/23 (a)(b)(c) | | 327,209 | 326,675 |
| Caesars Resort Collection LLC: | | | |
| Tranche B 1LN, term loan 3 month U.S. LIBOR + 2.750% 2.8543% 12/22/24 (a)(b)(c) | | 1,215,651 | 1,204,576 |
| Tranche B 1LN, term loan 3 month U.S. LIBOR + 4.500% 4.6043% 7/20/25 (a)(b)(c) | | 1,210,850 | 1,213,877 |
| CCM Merger, Inc. Tranche B 1LN, term loan 3 month U.S. LIBOR + 3.750% 4.5% 11/4/25 (a)(b)(c) | | 143,400 | 143,221 |
| Churchill Downs, Inc. Tranche B 1LN, term loan 3 month U.S. LIBOR + 2.000% 2.11% 3/17/28 (a)(b)(c) | | 299,250 | 296,258 |
| CityCenter Holdings LLC Tranche B, term loan 3 month U.S. LIBOR + 2.250% 3% 4/18/24 (a)(b)(c) | | 803,214 | 796,186 |
| Entain PLC Tranche B3 1LN, term loan 3 month U.S. LIBOR + 2.250% 3% 3/16/24 (a)(b)(c) | | 194,389 | 193,296 |
| Golden Entertainment, Inc. Tranche B, term loan 3 month U.S. LIBOR + 3.000% 3.75% 10/20/24 (a)(b)(c) | | 725,487 | 720,046 |
| Golden Nugget LLC Tranche B 1LN, term loan 3 month U.S. LIBOR + 2.500% 3.25% 10/4/23 (a)(b)(c) | | 1,335,960 | 1,325,165 |
| J&J Ventures Gaming LLC 1LN, term loan 3 month U.S. LIBOR + 4.000% 4.75% 4/26/28 (a)(b)(c) | | 265,000 | 265,663 |
| PCI Gaming Authority 1LN, term loan 3 month U.S. LIBOR + 2.500% 2.6043% 5/29/26 (a)(b)(c) | | 320,697 | 319,139 |
| Penn National Gaming, Inc. Tranche B, term loan 3 month U.S. LIBOR + 2.250% 3% 10/15/25 (a)(b)(c) | | 440,420 | 438,825 |
| Playtika Holding Corp. Tranche B 1LN, term loan 3 month U.S. LIBOR + 2.750% 2.8543% 3/11/28 (a)(b)(c) | | 433,913 | 431,695 |
| Stars Group Holdings BV Tranche B, term loan 3 month U.S. LIBOR + 3.500% 3.6473% 7/10/25 (a)(b)(c) | | 474,618 | 474,679 |
| Station Casinos LLC Tranche B 1LN, term loan 3 month U.S. LIBOR + 2.250% 2.5% 2/7/27 (a)(b)(c) | | 987,455 | 975,319 |
|
| TOTAL GAMING | | | 9,700,902 |
|
| Healthcare - 6.2% | | | |
| Aldevron LLC Tranche B 1LN, term loan 3 month U.S. LIBOR + 3.250% 4.25% 10/11/26 (a)(b)(c) | | 483,875 | 483,725 |
| Alkermes, Inc. Tranche B 1LN, term loan 3 month U.S. LIBOR + 2.500% 3% 3/12/26 (a)(b)(c) | | 139,650 | 138,603 |
| Avantor Funding, Inc. Tranche B 1LN, term loan 3 month U.S. LIBOR + 2.250% 3.25% 11/6/27 (a)(b)(c) | | 283,575 | 283,456 |
| Aveanna Healthcare LLC: | | | |
| Tranche B 1LN, term loan 1 month U.S. LIBOR + 3.750% 6/30/28 (b)(c)(d)(f) | | 133,868 | 133,868 |
| Tranche B-DD 1LN, term loan 1 month U.S. LIBOR + 3.750% 6/30/28 (b)(c)(d)(f) | | 31,132 | 31,015 |
| Da Vinci Purchaser Corp. Tranche B 1LN, term loan 3 month U.S. LIBOR + 4.000% 5% 12/13/26 (a)(b)(c) | | 619,610 | 621,159 |
| Elanco Animal Health, Inc. Tranche B 1LN, term loan 3 month U.S. LIBOR + 1.750% 1.8421% 8/1/27 (a)(b)(c) | | 1,210,499 | 1,191,337 |
| Gainwell Acquisition Corp. Tranche B 1LN, term loan 3 month U.S. LIBOR + 4.000% 4.75% 10/1/27 (a)(b)(c) | | 1,309,522 | 1,312,469 |
| Horizon Pharma U.S.A., Inc. Tranche B 1LN, term loan 3 month U.S. LIBOR + 2.000% 2.5% 3/15/28 (a)(b)(c) | | 349,125 | 346,615 |
| Indigo Merger Sub, Inc. Tranche B 1LN, term loan 1 month U.S. LIBOR + 2.500% 7/1/28 (b)(c)(d) | | 282,230 | 282,628 |
| Insulet Corp. Tranche B 1LN, term loan 1 month U.S. LIBOR + 3.250% 3.75% 5/4/28 (a)(b)(c) | | 350,000 | 350,221 |
| Jazz Financing Lux SARL Tranche B 1LN, term loan 1 month U.S. LIBOR + 3.500% 4% 5/5/28 (a)(b)(c) | | 895,000 | 897,515 |
| Maravai Intermediate Holdings LLC Tranche B 1LN, term loan 3 month U.S. LIBOR + 3.750% 4.75% 10/19/27 (a)(b)(c) | | 367,153 | 368,530 |
| MED ParentCo LP: | | | |
| 1LN, term loan 3 month U.S. LIBOR + 4.250% 4.3543% 8/31/26 (a)(b)(c) | | 280,252 | 280,061 |
| 2LN, term loan 3 month U.S. LIBOR + 8.250% 8.3543% 8/30/27 (a)(b)(c) | | 180,000 | 178,538 |
| Milk Specialties Co. Tranche B 1LN, term loan 1 month U.S. LIBOR + 4.000% 8/23/25 (b)(c)(d)(f) | | 200,000 | 199,500 |
| MPH Acquisition Holdings LLC Tranche B, term loan 3 month U.S. LIBOR + 2.750% 3.75% 6/7/23 (a)(b)(c) | | 557,380 | 555,736 |
| Organon & Co. Tranche B 1LN, term loan 3 month U.S. LIBOR + 3.000% 3.5% 6/2/28 (a)(b)(c) | | 1,150,000 | 1,150,725 |
| Packaging Coordinators Midco, Inc. Tranche B 1LN, term loan 3 month U.S. LIBOR + 3.500% 4.25% 11/30/27 (a)(b)(c) | | 229,425 | 229,540 |
| Pathway Vet Alliance LLC Tranche B 1LN, term loan 3 month U.S. LIBOR + 3.750% 3.8543% 3/31/27 (a)(b)(c) | | 495,872 | 494,355 |
| Pluto Acquisition I, Inc. term loan 1 month U.S. LIBOR + 4.000% 6/20/26 (b)(c)(d) | | 290,000 | 290,000 |
| PPD, Inc. Tranche B 1LN, term loan 3 month U.S. LIBOR + 2.250% 2.75% 1/13/28 (a)(b)(c) | | 508,725 | 507,850 |
| RadNet Management, Inc. Tranche B 1LN, term loan 3 month U.S. LIBOR + 3.000% 3.75% 4/23/28 (a)(b)(c) | | 150,000 | 149,937 |
| RegionalCare Hospital Partners Holdings, Inc. Tranche B, term loan 3 month U.S. LIBOR + 3.750% 3.8543% 11/16/25 (a)(b)(c) | | 299,993 | 299,129 |
| U.S. Anesthesia Partners, Inc. Tranche B, term loan 3 month U.S. LIBOR + 3.000% 4% 6/23/24 (a)(b)(c) | | 524,003 | 520,236 |
| U.S. Radiology Specialists, Inc. Tranche B 1LN, term loan 3 month U.S. LIBOR + 5.500% 6.25% 12/15/27 (a)(b)(c) | | 174,125 | 175,032 |
| U.S. Renal Care, Inc. Tranche B 1LN, term loan 3 month U.S. LIBOR + 5.000% 5.125% 6/13/26 (a)(b)(c) | | 981,327 | 984,801 |
| Valeant Pharmaceuticals International, Inc. Tranche B, term loan 3 month U.S. LIBOR + 3.000% 3.1043% 6/1/25 (a)(b)(c) | | 93,204 | 92,773 |
|
| TOTAL HEALTHCARE | | | 12,549,354 |
|
| Homebuilders/Real Estate - 1.0% | | | |
| DTZ U.S. Borrower LLC Tranche B 1LN, term loan 3 month U.S. LIBOR + 2.750% 2.8543% 8/21/25 (a)(b)(c) | | 469,380 | 464,771 |
| Landry's Finance Acquisition Co. Tranche B 1LN, term loan 3 month U.S. LIBOR + 12.000% 13% 10/4/23 (a)(b)(c) | | 120,000 | 133,200 |
| Lightstone Holdco LLC: | | | |
| Tranche B 1LN, term loan 3 month U.S. LIBOR + 3.750% 4.75% 1/30/24 (a)(b)(c) | | 438,873 | 337,282 |
| Tranche C 1LN, term loan 3 month U.S. LIBOR + 3.750% 4.75% 1/30/24 (a)(b)(c) | | 24,753 | 19,023 |
| RE/MAX LLC Tranche B, term loan 3 month U.S. LIBOR + 2.750% 4.0464% 12/15/23 (a)(b)(c) | | 115,000 | 114,856 |
| RS Ivy Holdco, Inc. Tranche B 1LN, term loan 3 month U.S. LIBOR + 5.500% 6.5% 12/23/27 (a)(b)(c) | | 144,275 | 144,275 |
| Ryan Specialty Group LLC Tranche B 1LN, term loan 3 month U.S. LIBOR + 3.000% 3.75% 9/1/27 (a)(b)(c) | | 451,737 | 451,312 |
| VICI Properties, LLC Tranche B 1LN, term loan 3 month U.S. LIBOR + 1.750% 1.841% 12/22/24 (a)(b)(c) | | 443,182 | 439,255 |
|
| TOTAL HOMEBUILDERS/REAL ESTATE | | | 2,103,974 |
|
| Hotels - 2.1% | | | |
| Aimbridge Acquisition Co., Inc.: | | | |
| Tranche B 1LN, term loan 3 month U.S. LIBOR + 4.750% 5.5% 10/1/27 (a)(b)(c) | | 104,214 | 104,127 |
| Tranche B, term loan 3 month U.S. LIBOR + 3.750% 3.8543% 2/1/26 (a)(b)(c) | | 170,045 | 165,794 |
| ASP LS Acquisition Corp. Tranche B 1LN, term loan 3 month U.S. LIBOR + 4.500% 5.25% 4/30/28 (a)(b)(c) | | 150,000 | 149,813 |
| Four Seasons Holdings, Inc. Tranche B, term loan 3 month U.S. LIBOR + 2.000% 2.1043% 11/30/23 (a)(b)(c) | | 485,473 | 483,653 |
| Hilton Grand Vacations Borrower LLC Tranche B 1LN, term loan 1 month U.S. LIBOR + 3.000% 5/20/28 (b)(c)(d) | | 750,000 | 750,233 |
| Marriott Ownership Resorts, Inc. Tranche B 1LN, term loan 3 month U.S. LIBOR + 1.750% 1.8543% 8/31/25 (a)(b)(c) | | 635,145 | 624,824 |
| Oravel Stays Singapore Pte Ltd. Tranche B 1LN, term loan 1 month U.S. LIBOR + 8.250% 6/23/26 (b)(c)(d) | | 180,000 | 182,250 |
| Raptor Acquisition Corp. Tranche B 1LN, term loan 1 month U.S. LIBOR + 4.000% 11/1/26 (b)(c)(d) | | 280,000 | 280,350 |
| Travel+Leisure Co. Tranche B, term loan 3 month U.S. LIBOR + 2.250% 2.3543% 5/31/25 (a)(b)(c) | | 486,250 | 478,348 |
| Travelport Finance Luxembourg SARL 1LN, term loan: | | | |
| 3 month U.S. LIBOR + 5.000% 5.1473% 5/30/26 (a)(b)(c) | | 339,148 | 308,839 |
| 3 month U.S. LIBOR + 5.000% 5.2025% 5/29/26 (a)(b)(c) | | 185,611 | 169,023 |
| 3 month U.S. LIBOR + 8.000% 9% 2/28/25 (a)(b)(c) | | 351,407 | 368,162 |
| Wyndham Hotels & Resorts, Inc. Tranche B, term loan 3 month U.S. LIBOR + 1.750% 1.8543% 5/30/25 (a)(b)(c) | | 200,849 | 199,091 |
|
| TOTAL HOTELS | | | 4,264,507 |
|
| Insurance - 4.1% | | | |
| Acrisure LLC Tranche B 1LN, term loan 3 month U.S. LIBOR + 3.500% 3.6043% 2/13/27 (a)(b)(c) | | 497,481 | 491,676 |
| Alliant Holdings Intermediate LLC: | | | |
| Tranche B, term loan 3 month U.S. LIBOR + 3.250% 3.3543% 5/10/25 (a)(b)(c) | | 203,556 | 201,244 |
| Tranche B-2 1LN, term loan 3 month U.S. LIBOR + 3.250% 3.3543% 5/9/25 (a)(b)(c) | | 490,000 | 484,365 |
| Tranche B3 1LN, term loan 3 month U.S. LIBOR + 3.750% 4.25% 11/5/27 (a)(b)(c) | | 438,424 | 438,788 |
| AmeriLife Holdings LLC Tranche B 1LN, term loan 3 month U.S. LIBOR + 4.000% 4.1043% 3/18/27 (a)(b)(c) | | 415,853 | 415,205 |
| AmWINS Group, Inc. Tranche B 1LN, term loan 3 month U.S. LIBOR + 2.250% 3% 2/19/28 (a)(b)(c) | | 303,475 | 301,451 |
| AssuredPartners, Inc. Tranche B 1LN, term loan: | | | |
| 1 month U.S. LIBOR + 3.500% 2/13/27 (b)(c)(d) | | 15,000 | 15,008 |
| 3 month U.S. LIBOR + 3.500% 3.6043% 2/13/27 (a)(b)(c) | | 369,375 | 367,273 |
| Asurion LLC: | | | |
| Tranche B 6LN, term loan 3 month U.S. LIBOR + 3.000% 3.1043% 11/3/23 (a)(b)(c) | | 747,325 | 743,125 |
| Tranche B3 2LN, term loan 3 month U.S. LIBOR + 5.250% 5.3543% 1/31/28 (a)(b)(c) | | 835,000 | 840,912 |
| Tranche B8 1LN, term loan 3 month U.S. LIBOR + 3.250% 3.3543% 12/23/26 (a)(b)(c) | | 1,220,470 | 1,205,983 |
| Tranche B9 1LN, term loan 3 month U.S. LIBOR + 3.250% 3.3543% 7/31/27 (a)(b)(c) | | 374,063 | 369,697 |
| HUB International Ltd. Tranche B, term loan 3 month U.S. LIBOR + 2.750% 2.9257% 4/25/25 (a)(b)(c) | | 1,648,312 | 1,629,176 |
| USI, Inc.: | | | |
| 1LN, term loan 3 month U.S. LIBOR + 3.250% 3.3973% 12/2/26 (a)(b)(c) | | 123,126 | 121,917 |
| Tranche B, term loan 3 month U.S. LIBOR + 3.000% 3.1473% 5/16/24 (a)(b)(c) | | 587,709 | 581,926 |
|
| TOTAL INSURANCE | | | 8,207,746 |
|
| Leisure - 2.0% | | | |
| Alterra Mountain Co. Tranche B 1LN, term loan 3 month U.S. LIBOR + 4.500% 5.5% 8/3/26 (a)(b)(c) | | 128,375 | 128,616 |
| Callaway Golf Co. Tranche B, term loan 3 month U.S. LIBOR + 3.500% 4.5908% 1/4/26 (a)(b)(c) | | 174,286 | 175,211 |
| Carnival Corp. Tranche B 1LN, term loan 3 month U.S. LIBOR + 7.500% 3.75% 6/30/25 (a)(b)(c) | | 252,450 | 258,236 |
| Crown Finance U.S., Inc. Tranche B 1LN, term loan: | | | |
| 3 month U.S. LIBOR + 2.500% 3.5% 2/28/25 (a)(b)(c) | | 517,025 | 454,553 |
| 15.25% 5/23/24 (c) | | 70,830 | 89,069 |
| Delta 2 SARL Tranche B, term loan 3 month U.S. LIBOR + 2.500% 3.5% 2/1/24 (a)(b)(c) | | 930,522 | 924,855 |
| Equinox Holdings, Inc.: | | | |
| Tranche 2LN, term loan 3 month U.S. LIBOR + 7.000% 8% 9/8/24 (a)(b)(c) | | 115,000 | 103,213 |
| Tranche B-1, term loan 3 month U.S. LIBOR + 3.000% 4% 3/8/24 (a)(b)(c) | | 301,672 | 288,600 |
| Herschend Entertainment Co. LLC Tranche B 1LN, term loan 3 month U.S. LIBOR + 5.750% 6.75% 8/18/25 (a)(b)(c) | | 124,063 | 124,683 |
| MajorDrive Holdings IV LLC 1LN, term loan 3 month U.S. LIBOR + 4.000% 4.5% 5/12/28 (a)(b)(c) | | 230,000 | 230,071 |
| PlayPower, Inc. Tranche B 1LN, term loan 3 month U.S. LIBOR + 5.500% 5.6473% 5/10/26 (a)(b)(c) | | 227,139 | 225,152 |
| Seminole Tribe of Florida Tranche B, term loan 3 month U.S. LIBOR + 1.750% 1.8543% 7/6/24 (a)(b)(c) | | 406,402 | 405,703 |
| SP PF Buyer LLC Tranche B 1LN, term loan 3 month U.S. LIBOR + 4.500% 4.6043% 12/21/25 (a)(b)(c) | | 120,341 | 118,295 |
| United PF Holdings LLC: | | | |
| 1LN, term loan 3 month U.S. LIBOR + 4.000% 4.1473% 12/30/26 (a)(b)(c) | | 364,907 | 353,777 |
| 2LN, term loan 3 month U.S. LIBOR + 8.500% 8.6473% 12/30/27 (a)(b)(c)(f) | | 100,000 | 93,000 |
| Tranche B 1LN, term loan 3 month U.S. LIBOR + 8.500% 9.5% 12/30/26 (a)(b)(c)(f) | | 84,363 | 84,573 |
|
| TOTAL LEISURE | | | 4,057,607 |
|
| Metals/Mining - 0.1% | | | |
| American Rock Salt Co. LLC 1LN, term loan 1 month U.S. LIBOR + 4.000% 4.75% 6/4/28 (a)(b)(c) | | 275,000 | 275,116 |
| Paper - 0.2% | | | |
| Ahlstrom-Munksjo OYJ 1LN, term loan 3 month U.S. LIBOR + 4.000% 4.75% 3/18/28 (a)(b)(c) | | 270,000 | 270,845 |
| Neenah, Inc. Tranche B 1LN, term loan 3 month U.S. LIBOR + 3.000% 3.5% 4/6/28 (a)(b)(c)(f) | | 169,250 | 169,038 |
|
| TOTAL PAPER | | | 439,883 |
|
| Publishing/Printing - 1.1% | | | |
| Cengage Learning, Inc.: | | | |
| Tranche B 1LN, term loan 1 month U.S. LIBOR + 4.750% 6/29/26 (b)(c)(d) | | 480,000 | 480,302 |
| Tranche B, term loan 3 month U.S. LIBOR + 4.250% 5.25% 6/7/23 (a)(b)(c) | | 210,820 | 210,934 |
| Harland Clarke Holdings Corp. Tranche B 7LN, term loan 3 month U.S. LIBOR + 4.750% 5.75% 11/3/23 (a)(b)(c) | | 449,151 | 401,150 |
| Learning Care Group (U.S.) No 2, Inc. Tranche B 1LN, term loan: | | | |
| 3 month U.S. LIBOR + 3.250% 4.25% 3/13/25 (a)(b)(c) | | 122,494 | 120,350 |
| 3 month U.S. LIBOR + 8.500% 9.5% 3/13/25 (a)(b)(c) | | 207,900 | 208,940 |
| Proquest LLC Tranche B 1LN, term loan 3 month U.S. LIBOR + 3.250% 3.3543% 10/17/26 (a)(b)(c) | | 148,784 | 148,613 |
| Recorded Books, Inc. Tranche B 1LN, term loan 1 month U.S. LIBOR + 4.000% 8/31/25 (b)(c)(d) | | 65,000 | 65,027 |
| Scripps (E.W.) Co.: | | | |
| Tranche B 1LN, term loan 3 month U.S. LIBOR + 3.000% 3.75% 1/7/28 (a)(b)(c) | | 251,775 | 251,460 |
| Tranche B, term loan 3 month U.S. LIBOR + 2.000% 2.1043% 10/2/24 (a)(b)(c) | | 240,625 | 239,164 |
|
| TOTAL PUBLISHING/PRINTING | | | 2,125,940 |
|
| Railroad - 0.3% | | | |
| AIT Worldwide Logistics Holdings, Inc. 1LN, term loan 3 month U.S. LIBOR + 4.750% 5.5% 4/1/28 (a)(b)(c) | | 190,000 | 189,704 |
| Genesee & Wyoming, Inc. 1LN, term loan 3 month U.S. LIBOR + 2.000% 2.1473% 12/30/26 (a)(b)(c) | | 325,875 | 323,522 |
|
| TOTAL RAILROAD | | | 513,226 |
|
| Restaurants - 0.8% | | | |
| Burger King Worldwide, Inc. Tranche B 1LN, term loan 3 month U.S. LIBOR + 1.750% 1.8543% 11/19/26 (a)(b)(c) | | 492,500 | 485,344 |
| KFC Holding Co. Tranche B 1LN, term loan 3 month U.S. LIBOR + 1.750% 1.8325% 3/15/28 (a)(b)(c) | | 288,028 | 287,924 |
| PFC Acquisition Corp. Tranche B 1LN, term loan 3 month U.S. LIBOR + 6.250% 6.3543% 3/1/26 (a)(b)(c) | | 366,563 | 361,522 |
| Whatabrands LLC Tranche B 1LN, term loan 3 month U.S. LIBOR + 2.750% 2.8318% 8/2/26 (a)(b)(c) | | 464,736 | 462,519 |
|
| TOTAL RESTAURANTS | | | 1,597,309 |
|
| Services - 7.4% | | | |
| ABG Intermediate Holdings 2 LLC Tranche B 1LN, term loan: | | | |
| 3 month U.S. LIBOR + 3.250% 4% 9/27/24 (a)(b)(c) | | 246,618 | 246,310 |
| 3 month U.S. LIBOR + 5.250% 6.25% 9/29/24 (a)(b)(c) | | 79,400 | 79,400 |
| Adtalem Global Education, Inc. Tranche B 1LN, term loan 3 month U.S. LIBOR + 4.500% 2/12/28 (b)(c)(d) | | 455,000 | 453,749 |
| APX Group, Inc. Tranche B 1LN, term loan 3 month U.S. LIBOR + 5.000% 5.0939% 12/31/25 (a)(b)(c) | | 89,306 | 89,432 |
| Aramark Services, Inc.: | | | |
| Tranche B 3LN, term loan 3 month U.S. LIBOR + 1.750% 1.8543% 3/11/25 (a)(b)(c) | | 699,497 | 691,334 |
| Tranche B-4 1LN, term loan 3 month U.S. LIBOR + 1.750% 1.8543% 1/15/27 (a)(b)(c) | | 123,438 | 121,843 |
| Ascend Learning LLC: | | | |
| Tranche B 1LN, term loan 3 month U.S. LIBOR + 3.750% 4.75% 7/12/24 (a)(b)(c) | | 238,200 | 238,200 |
| Tranche B, term loan 3 month U.S. LIBOR + 3.000% 4% 7/12/24 (a)(b)(c) | | 44,030 | 43,985 |
| Brand Energy & Infrastructure Services, Inc. Tranche B, term loan 3 month U.S. LIBOR + 4.250% 5.25% 6/21/24 (a)(b)(c) | | 721,206 | 708,924 |
| Cast & Crew Payroll LLC Tranche B 1LN, term loan 3 month U.S. LIBOR + 3.750% 3.8543% 2/7/26 (a)(b)(c) | | 538,496 | 535,130 |
| CoreCivic, Inc. Tranche B 1LN, term loan 3 month U.S. LIBOR + 4.500% 5.5% 12/18/24 (a)(b)(c) | | 296,563 | 287,559 |
| CoreLogic, Inc. Tranche B 1LN, term loan 3 month U.S. LIBOR + 3.500% 4% 4/14/28 (a)(b)(c) | | 765,000 | 762,323 |
| Creative Artists Agency LLC Tranche B 1LN, term loan 3 month U.S. LIBOR + 3.750% 3.8543% 11/26/26 (a)(b)(c) | | 246,250 | 245,174 |
| EAB Global, Inc. Tranche B 1LN, term loan 1 month U.S. LIBOR + 3.500% 6/28/28 (b)(c)(d) | | 210,000 | 209,475 |
| Ensemble RCM LLC 1LN, term loan 3 month U.S. LIBOR + 3.750% 3.9355% 8/1/26 (a)(b)(c) | | 368,438 | 368,515 |
| Filtration Group Corp. Tranche B, term loan 3 month U.S. LIBOR + 3.000% 3.1043% 3/29/25 (a)(b)(c) | | 329,153 | 326,204 |
| Finastra U.S.A., Inc.: | | | |
| Tranche 2LN, term loan 3 month U.S. LIBOR + 7.250% 8.25% 6/13/25 (a)(b)(c) | | 465,000 | 469,478 |
| Tranche B 1LN, term loan 3 month U.S. LIBOR + 3.500% 4.5% 6/13/24 (a)(b)(c) | | 1,483,570 | 1,459,313 |
| Flexera Software LLC Tranche B 1LN, term loan 3 month U.S. LIBOR + 3.750% 4.5% 3/3/28 (a)(b)(c) | | 172,859 | 173,106 |
| Franchise Group, Inc. Tranche B 1LN, term loan 3 month U.S. LIBOR + 4.750% 5.5% 3/10/26 (a)(b)(c) | | 394,013 | 395,738 |
| Gateway Merger Sub 2021, Inc. Tranche B 1LN, term loan 1 month U.S. LIBOR + 5.250% 6/25/28 (b)(c)(d)(f) | | 160,000 | 158,901 |
| GEMS MENASA Cayman Ltd. Tranche B 1LN, term loan 3 month U.S. LIBOR + 5.000% 6% 7/30/26 (a)(b)(c) | | 268,195 | 269,067 |
| Greeneden U.S. Holdings II LLC Tranche B 1LN, term loan 3 month U.S. LIBOR + 4.000% 4.75% 12/1/27 (a)(b)(c) | | 249,375 | 249,821 |
| Ion Trading Finance Ltd. Tranche B 1LN, term loan 3 month U.S. LIBOR + 4.750% 4.9166% 3/26/28 (a)(b)(c) | | 800,000 | 802,432 |
| KNS Acquisitions, Inc. Tranche B 1LN, term loan 3 month U.S. LIBOR + 6.250% 7% 4/21/27 (a)(b)(c) | | 175,000 | 174,344 |
| KUEHG Corp. Tranche B, term loan 3 month U.S. LIBOR + 3.750% 4.75% 2/21/25 (a)(b)(c) | | 486,102 | 477,950 |
| Life Time, Inc. Tranche B 1LN, term loan 3 month U.S. LIBOR + 4.750% 5.75% 12/15/24 (a)(b)(c) | | 517,400 | 518,694 |
| Maverick Purchaser Sub LLC: | | | |
| Tranche B 1LN, term loan: | | | |
| 3 month U.S. LIBOR + 3.500% 3.6043% 1/23/27 (a)(b)(c) | | 465,300 | 463,788 |
| 3 month U.S. LIBOR + 4.750% 5.5% 2/3/27 (a)(b)(c) | | 74,813 | 75,350 |
| Tranche B 2LN, term loan 1 month U.S. LIBOR + 8.750% 1/31/28 (b)(c)(d) | | 290,000 | 290,725 |
| McKissock LLC Tranche B 1LN, term loan 1 month U.S. LIBOR + 5.000% 6/17/28 (b)(c)(d)(f) | | 200,000 | 198,500 |
| Nielsen Holdings PLC Tranche B 1LN, term loan 3 month U.S. LIBOR + 4.000% 4.08% 3/5/28 (a)(b)(c) | | 204,488 | 204,706 |
| PowerTeam Services LLC Tranche B 1LN, term loan 1 month U.S. LIBOR + 3.500% 3/6/25 (b)(c)(d) | | 240,000 | 238,800 |
| Sabert Corp. Tranche B 1LN, term loan 3 month U.S. LIBOR + 4.500% 5.5% 12/10/26 (a)(b)(c) | | 481,063 | 480,163 |
| Signal Parent, Inc. Tranche B 1LN, term loan 3 month U.S. LIBOR + 3.500% 4.25% 4/1/28 (a)(b)(c) | | 380,000 | 372,875 |
| Sotheby's Tranche B 1LN, term loan 3 month U.S. LIBOR + 4.750% 5.5% 1/15/27 (a)(b)(c) | | 221,189 | 222,202 |
| Spin Holdco, Inc. Tranche B 1LN, term loan 3 month U.S. LIBOR + 4.000% 4.75% 3/4/28 (a)(b)(c) | | 798,000 | 798,104 |
| Staples, Inc.: | | | |
| Tranche B 1LN, term loan 3 month U.S. LIBOR + 5.000% 5.1756% 4/16/26 (a)(b)(c) | | 141,938 | 138,124 |
| Tranche B 2LN, term loan 3 month U.S. LIBOR + 4.500% 4.6756% 9/12/24 (a)(b)(c) | | 28,532 | 28,022 |
| SuperMoose Borrower LLC Tranche B 1LN, term loan 3 month U.S. LIBOR + 3.750% 3.8973% 8/29/25 (a)(b)(c) | | 284,663 | 265,181 |
| Uber Technologies, Inc. Tranche B 1LN, term loan 3 month U.S. LIBOR + 3.500% 3.6043% 4/4/25 (a)(b)(c) | | 726,256 | 725,610 |
|
| TOTAL SERVICES | | | 15,058,551 |
|
| Steel - 0.2% | | | |
| JMC Steel Group, Inc. 1LN, term loan 3 month U.S. LIBOR + 2.000% 2.0915% 1/24/27 (a)(b)(c) | | 388,310 | 383,701 |
| Super Retail - 3.8% | | | |
| Academy Ltd. Tranche B 1LN, term loan 1 month U.S. LIBOR + 2.750% 4.5% 11/6/27 (a)(b)(c) | | 284,288 | 285,265 |
| Ambience Merger Sub, Inc. Tranche B 1LN, term loan 1 month U.S. LIBOR + 4.250% 6/24/28 (b)(c)(d) | | 180,000 | 180,000 |
| Bass Pro Group LLC Tranche B 1LN, term loan 3 month U.S. LIBOR + 4.250% 5% 3/5/28 (a)(b)(c) | | 4,577,000 | 4,588,426 |
| Harbor Freight Tools U.S.A., Inc. Tranche B 1LN, term loan 3 month U.S. LIBOR + 3.000% 3.75% 10/19/27 (a)(b)(c) | | 621,875 | 621,458 |
| LBM Acquisition LLC Tranche B 1LN, term loan: | | | |
| 3 month U.S. LIBOR + 3.750% 2.25% 12/18/27 (a)(b)(c)(e) | | 56,364 | 55,929 |
| 3 month U.S. LIBOR + 3.750% 4.5% 12/18/27 (a)(b)(c) | | 253,002 | 251,052 |
| Red Ventures LLC Tranche B 1LN, term loan 3 month U.S. LIBOR + 2.500% 2.6043% 11/8/24 (a)(b)(c) | | 571,899 | 564,196 |
| Rent-A-Center, Inc. Tranche B 1LN, term loan 3 month U.S. LIBOR + 4.000% 4.75% 2/17/28 (a)(b)(c) | | 254,363 | 254,363 |
| Sports Authority, Inc. Tranche B, term loan 3 month U.S. LIBOR + 6.000% 0% 11/16/17 (b)(c)(f)(g) | | 180,849 | 0 |
| The Hillman Group, Inc. Tranche B, term loan 3 month U.S. LIBOR + 4.000% 4.1043% 5/31/25 (a)(b)(c) | | 603,788 | 602,279 |
| WW International, Inc. Tranche B 1LN, term loan 3 month U.S. LIBOR + 3.500% 4% 4/13/28 (a)(b)(c) | | 335,000 | 335,838 |
|
| TOTAL SUPER RETAIL | | | 7,738,806 |
|
| Technology - 14.8% | | | |
| A&V Holdings Midco LLC Tranche B 1LN, term loan 3 month U.S. LIBOR + 5.370% 6.375% 3/10/27 (a)(b)(c) | | 92,532 | 91,723 |
| Acuris Finance U.S., Inc. 1LN, term loan 3 month U.S. LIBOR + 4.000% 4.5% 2/16/28 (a)(b)(c) | | 145,573 | 145,937 |
| Alliance Laundry Systems LLC Tranche B 1LN, term loan 3 month U.S. LIBOR + 3.500% 4.25% 10/8/27 (a)(b)(c) | | 103,350 | 103,431 |
| Anastasia Parent LLC Tranche B, term loan 3 month U.S. LIBOR + 3.750% 3.8973% 8/10/25 (a)(b)(c) | | 972,500 | 773,410 |
| Aptean, Inc. 1LN, term loan 3 month U.S. LIBOR + 4.250% 4.3543% 4/23/26 (a)(b)(c) | | 244,375 | 243,334 |
| Arches Buyer, Inc. Tranche B 1LN, term loan 3 month U.S. LIBOR + 3.250% 3.75% 12/4/27 (a)(b)(c) | | 462,675 | 461,199 |
| athenahealth, Inc. Tranche B 1LN, term loan 3 month U.S. LIBOR + 4.250% 4.4099% 2/11/26 (a)(b)(c) | | 1,341,368 | 1,344,306 |
| Big Ass Fans LLC 1LN, term loan 3 month U.S. LIBOR + 3.750% 4.75% 5/21/24 (a)(b)(c) | | 64,494 | 64,534 |
| Boxer Parent Co., Inc. Tranche B 1LN, term loan 3 month U.S. LIBOR + 3.750% 3.8543% 10/2/25 (a)(b)(c) | | 578,183 | 574,570 |
| Camelot Finance SA: | | | |
| Tranche B 1LN, term loan 3 month U.S. LIBOR + 3.000% 4% 10/31/26 (a)(b)(c) | | 746,250 | 746,250 |
| Tranche B, term loan 3 month U.S. LIBOR + 3.000% 3.1043% 10/31/26 (a)(b)(c) | | 478,913 | 476,518 |
| Ceridian HCM Holding, Inc. Tranche B, term loan 3 month U.S. LIBOR + 2.500% 2.5944% 4/30/25 (a)(b)(c) | | 421,528 | 414,889 |
| CMC Materials, Inc. Tranche B 1LN, term loan 3 month U.S. LIBOR + 2.000% 2.125% 11/15/25 (a)(b)(c) | | 185,105 | 184,411 |
| CMI Marketing, Inc. Tranche B 1LN, term loan 3 month U.S. LIBOR + 4.750% 5.5% 3/23/28 (a)(b)(c) | | 175,000 | 174,017 |
| Cologix Holdings, Inc. Tranche B 1LN, term loan 3 month U.S. LIBOR + 3.750% 4.5% 4/30/28 (a)(b)(c) | | 325,000 | 325,676 |
| CommerceHub, Inc. Tranche B 1LN, term loan 3 month U.S. LIBOR + 4.000% 4.75% 12/29/27 (a)(b)(c) | | 248,750 | 249,372 |
| CommScope, Inc. Tranche B 1LN, term loan 3 month U.S. LIBOR + 3.250% 3.3543% 4/4/26 (a)(b)(c) | | 202,986 | 201,827 |
| Constant Contact, Inc.: | | | |
| Tranche B 1LN, term loan 3 month U.S. LIBOR + 4.000% 4.75% 2/10/28 (a)(b)(c) | | 244,353 | 243,742 |
| Tranche DD 1LN, term loan 3 month U.S. LIBOR + 4.000% 4.75% 2/10/28 (a)(b)(c)(e) | | 65,647 | 65,483 |
| Cvent, Inc. Tranche B, term loan 3 month U.S. LIBOR + 3.750% 3.8543% 11/29/24 (a)(b)(c) | | 362,813 | 357,552 |
| DCert Buyer, Inc.: | | | |
| 1LN, term loan 3 month U.S. LIBOR + 4.000% 4.1043% 10/16/26 (a)(b)(c) | | 742,491 | 742,802 |
| Tranche B 2LN, term loan 3 month U.S. LIBOR + 7.000% 7.1043% 2/19/29 (a)(b)(c) | | 155,000 | 156,066 |
| DG Investment Intermediate Holdings, Inc.: | | | |
| 2LN, term loan 3 month U.S. LIBOR + 6.750% 7.5% 3/31/29 (a)(b)(c) | | 60,000 | 59,775 |
| Tranche B 1LN, term loan 3 month U.S. LIBOR + 3.750% 4.5% 3/31/28 (a)(b)(c) | | 219,113 | 219,752 |
| Tranche DD 1LN, term loan 3 month U.S. LIBOR + 3.750% 4.32% 3/31/28 (a)(b)(c)(e) | | 45,887 | 46,021 |
| ECL Entertainment LLC 1LN, term loan 3 month U.S. LIBOR + 7.500% 8.25% 4/30/28 (a)(b)(c) | | 200,000 | 204,000 |
| Emerald TopCo, Inc. 1LN, term loan 3 month U.S. LIBOR + 3.500% 3.6855% 7/22/26 (a)(b)(c) | | 439,955 | 437,205 |
| Epicor Software Corp. Tranche B 1LN, term loan 3 month U.S. LIBOR + 3.250% 4% 7/31/27 (a)(b)(c) | | 367,225 | 366,659 |
| EPV Merger Sub, Inc. Tranche B 1LN, term loan 3 month U.S. LIBOR + 3.250% 3.3543% 3/8/25 (a)(b)(c) | | 367,690 | 363,936 |
| EXC Holdings III Corp. Tranche B, term loan 3 month U.S. LIBOR + 3.500% 4.5% 12/2/24 (a)(b)(c) | | 154,400 | 154,014 |
| Go Daddy Operating Co. LLC: | | | |
| Tranche B 1LN, term loan 3 month U.S. LIBOR + 2.000% 2.1043% 8/10/27 (a)(b)(c) | | 123,750 | 122,918 |
| Tranche B, term loan 3 month U.S. LIBOR + 1.750% 1.8543% 2/15/24 (a)(b)(c) | | 475,217 | 471,240 |
| Grab Holdings, Inc. Tranche B 1LN, term loan 3 month U.S. LIBOR + 4.500% 5.5% 1/29/26 (a)(b)(c) | | 179,550 | 182,094 |
| Hyland Software, Inc. Tranche B 1LN, term loan 3 month U.S. LIBOR + 3.500% 4.25% 7/1/24 (a)(b)(c) | | 397,552 | 397,882 |
| Icon Luxembourg Sarl Tranche B 1LN, term loan 1 month U.S. LIBOR + 2.500% 7/1/28 (b)(c)(d) | | 1,132,770 | 1,134,367 |
| Imprivata, Inc. Tranche B 1LN, term loan 3 month U.S. LIBOR + 3.750% 4% 12/1/27 (a)(b)(c) | | 289,275 | 289,547 |
| Liftoff Mobile, Inc. Tranche B 1LN, term loan 3 month U.S. LIBOR + 3.500% 4.25% 3/17/28 (a)(b)(c) | | 134,325 | 134,046 |
| MA FinanceCo. LLC: | | | |
| Tranche B 1LN, term loan 3 month U.S. LIBOR + 4.250% 5.25% 6/5/25 (a)(b)(c) | | 147,188 | 148,905 |
| Tranche B 3LN, term loan 3 month U.S. LIBOR + 2.750% 2.8423% 6/21/24 (a)(b)(c) | | 268,776 | 265,417 |
| McAfee LLC Tranche B, term loan 3 month U.S. LIBOR + 3.750% 3.8461% 9/29/24 (a)(b)(c) | | 745,279 | 745,093 |
| MH Sub I LLC: | | | |
| 1LN, term loan 3 month U.S. LIBOR + 3.750% 4.75% 9/15/24 (a)(b)(c) | | 129,023 | 129,211 |
| Tranche B 2LN, term loan 3 month U.S. LIBOR + 6.250% 6.345% 2/23/29 (a)(b)(c) | | 50,000 | 50,719 |
| Tranche B, term loan 3 month U.S. LIBOR + 3.500% 3.6043% 9/15/24 (a)(b)(c) | | 281,870 | 280,382 |
| NAVEX TopCo, Inc. Tranche B 1LN, term loan 3 month U.S. LIBOR + 3.250% 3.36% 9/4/25 (a)(b)(c) | | 158,659 | 156,974 |
| Northwest Fiber LLC Tranche B 1LN, term loan 3 month U.S. LIBOR + 3.750% 3.8226% 4/30/27 (a)(b)(c) | | 394,331 | 394,134 |
| Osmosis Debt Merger Sub, Inc.: | | | |
| Tranche B 1LN, term loan 1 month U.S. LIBOR + 4.000% 6/17/28 (b)(c)(d) | | 191,111 | 191,589 |
| Tranche DD 1LN, term loan 1 month U.S. LIBOR + 4.000% 6/17/28 (b)(c)(d) | | 23,889 | 23,949 |
| Park Place Technologies LLC 1LN, term loan 3 month U.S. LIBOR + 5.000% 6% 11/10/27 (a)(b)(c) | | 174,563 | 174,824 |
| Peraton Corp. Tranche B 1LN, term loan: | | | |
| 3 month U.S. LIBOR + 3.750% 4.5% 2/1/28 (a)(b)(c) | | 574,295 | 575,489 |
| 3 month U.S. LIBOR + 3.750% 4.5% 2/1/28 (a)(b)(c) | | 1,010,705 | 1,012,808 |
| Pitney Bowes, Inc. Tranche B 1LN, term loan 3 month U.S. LIBOR + 4.000% 4.11% 3/19/28 (a)(b)(c) | | 124,688 | 124,493 |
| PointClickCare Technologies, Inc. Tranche B 1LN, term loan 3 month U.S. LIBOR + 3.000% 3.75% 12/29/27 (a)(b)(c) | | 144,638 | 144,186 |
| Polaris Newco LLC Tranche B 1LN, term loan 1 month U.S. LIBOR + 4.000% 4.5% 6/2/28 (a)(b)(c) | | 890,000 | 892,118 |
| Project Boost Purchaser LLC Tranche B 1LN, term loan: | | | |
| 1 month U.S. LIBOR + 3.500% 5/30/26 (b)(c)(d) | | 175,000 | 174,673 |
| 3 month U.S. LIBOR + 4.250% 5% 5/30/26 (a)(b)(c) | | 124,063 | 123,907 |
| Proofpoint, Inc. Tranche B 1LN, term loan 1 month U.S. LIBOR + 3.250% 6/9/28 (b)(c)(d) | | 870,000 | 864,676 |
| Rackspace Technology Global, Inc. Tranche B 1LN, term loan 3 month U.S. LIBOR + 2.750% 3.5% 2/15/28 (a)(b)(c) | | 645,900 | 642,050 |
| RealPage, Inc. Tranche B 1LN, term loan 3 month U.S. LIBOR + 3.250% 3.75% 4/24/28 (a)(b)(c) | | 635,000 | 632,778 |
| Renaissance Holding Corp. Tranche B 1LN, term loan 3 month U.S. LIBOR + 3.250% 3.3543% 5/31/25 (a)(b)(c) | | 264,355 | 261,381 |
| Seattle Spinco, Inc. Tranche B 3LN, term loan 3 month U.S. LIBOR + 2.750% 2.8543% 6/21/24 (a)(b)(c) | | 1,702,273 | 1,680,995 |
| Sophia LP 1LN, term loan 3 month U.S. LIBOR + 3.750% 4.5% 10/7/27 (a)(b)(c) | | 577,100 | 577,221 |
| SS&C Technologies, Inc.: | | | |
| Tranche B 3LN, term loan 3 month U.S. LIBOR + 1.750% 1.8543% 4/16/25 (a)(b)(c) | | 283,451 | 279,908 |
| Tranche B 4LN, term loan 3 month U.S. LIBOR + 1.750% 1.8543% 4/16/25 (a)(b)(c) | | 215,355 | 212,663 |
| Tranche B 5LN, term loan 3 month U.S. LIBOR + 1.750% 1.8543% 4/16/25 (a)(b)(c) | | 867,975 | 857,533 |
| STG-Fairway Holdings LLC Tranche B 1LN, term loan 3 month U.S. LIBOR + 3.250% 2.8543% 1/31/27 (a)(b)(c) | | 180,416 | 179,458 |
| Sybil Software LLC. Tranche B 1LN, term loan 3 month U.S. LIBOR + 2.000% 2.1473% 3/22/28 (a)(b)(c) | | 192,563 | 191,881 |
| Tempo Acquisition LLC: | | | |
| Tranche B 1LN, term loan 3 month U.S. LIBOR + 3.250% 3.75% 10/31/26 (a)(b)(c) | | 253,083 | 253,346 |
| Tranche B, term loan 3 month U.S. LIBOR + 2.750% 5% 5/1/24 (a)(b)(c) | | 353,219 | 352,558 |
| TTM Technologies, Inc. Tranche B, term loan 3 month U.S. LIBOR + 2.500% 2.5921% 9/28/24 (a)(b)(c) | | 318,685 | 317,092 |
| UKG, Inc.: | | | |
| 1LN, term loan 3 month U.S. LIBOR + 3.750% 3.8543% 5/4/26 (a)(b)(c) | | 805,650 | 805,731 |
| 2LN, term loan 3 month U.S. LIBOR + 6.750% 7.5% 5/3/27 (a)(b)(c) | | 350,000 | 355,541 |
| Tranche B 1LN, term loan 3 month U.S. LIBOR + 3.250% 4% 5/4/26 (a)(b)(c) | | 952,812 | 953,365 |
| Verscend Holding Corp. Tranche B 1LN, term loan 3 month U.S. LIBOR + 4.000% 4.1043% 8/27/25 (a)(b)(c) | | 125,000 | 125,201 |
| VFH Parent LLC Tranche B 1LN, term loan 3 month U.S. LIBOR + 3.000% 3.0934% 3/1/26 (a)(b)(c) | | 205,737 | 204,838 |
| Virgin Pulse, Inc. Tranche B 1LN, term loan 3 month U.S. LIBOR + 4.000% 4.75% 4/6/28 (a)(b)(c) | | 180,000 | 179,775 |
| VM Consolidated, Inc. Tranche B 1LN, term loan 3 month U.S. LIBOR + 3.250% 3.4166% 3/19/28 (a)(b)(c) | | 493,956 | 492,192 |
| VS Buyer LLC Tranche B 1LN, term loan 3 month U.S. LIBOR + 3.000% 3.1043% 2/28/27 (a)(b)(c) | | 256,750 | 255,628 |
| Weber-Stephen Products LLC Tranche B 1LN, term loan 3 month U.S. LIBOR + 3.250% 4% 10/30/27 (a)(b)(c) | | 253,725 | 254,042 |
| WEX, Inc. Tranche B 1LN, term loan 3 month U.S. LIBOR + 2.250% 2.3543% 4/1/28 (a)(b)(c) | | 169,575 | 168,198 |
| Xperi Holding Corp. Tranche B 1LN, term loan 1 month U.S. LIBOR + 3.500% 3.5813% 6/8/28 (a)(b)(c) | | 319,661 | 318,782 |
| Zelis Payments Buyer, Inc. Tranche B 1LN, term loan 3 month U.S. LIBOR + 3.500% 3.5921% 9/30/26 (a)(b)(c) | | 123,131 | 122,700 |
|
| TOTAL TECHNOLOGY | | | 29,872,909 |
|
| Telecommunications - 6.4% | | | |
| Altice Financing SA Tranche B, term loan 3 month U.S. LIBOR + 2.750% 2.9338% 7/15/25 (a)(b)(c) | | 480,301 | 471,679 |
| Altice France SA: | | | |
| Tranche B 11LN, term loan 3 month U.S. LIBOR + 2.750% 2.9355% 7/31/25 (a)(b)(c) | | 566,231 | 556,084 |
| Tranche B 12LN, term loan 3 month U.S. LIBOR + 3.680% 3.8713% 1/31/26 (a)(b)(c) | | 484,925 | 480,439 |
| Tranche B 13LN, term loan 3 month U.S. LIBOR + 4.000% 4.1548% 8/14/26 (a)(b)(c) | | 121,875 | 121,548 |
| Blucora, Inc. Tranche B, term loan 3 month U.S. LIBOR + 4.000% 5% 5/22/24 (a)(b)(c) | | 300,274 | 300,274 |
| Cablevision Lightpath LLC Tranche B 1LN, term loan 3 month U.S. LIBOR + 3.250% 3.75% 11/30/27 (a)(b)(c) | | 223,875 | 223,875 |
| Connect Finco SARL Tranche B 1LN, term loan 3 month U.S. LIBOR + 3.500% 4.5% 12/12/26 (a)(b)(c) | | 246,875 | 247,031 |
| Consolidated Communications, Inc. Tranche B 1LN, term loan 3 month U.S. LIBOR + 3.500% 4.25% 10/2/27 (a)(b)(c) | | 160,651 | 160,852 |
| Crown Subsea Communications Holding, Inc. Tranche B 1LN, term loan 1 month U.S. LIBOR + 5.000% 5.75% 4/20/27 (a)(b)(c) | | 167,808 | 168,787 |
| Evo Payments International LLC Tranche B, term loan 3 month U.S. LIBOR + 3.250% 3.36% 12/22/23 (a)(b)(c) | | 286,067 | 285,292 |
| Frontier Communications Corp.: | | | |
| Tranche B 1LN, term loan 3 month U.S. LIBOR + 3.750% 4.5% 5/1/28 (a)(b)(c) | | 730,000 | 730,000 |
| Tranche DD 1LN, term loan 3 month U.S. LIBOR + 3.750% 4.5% 4/14/28 (a)(b)(c) | | 95,000 | 95,000 |
| GTT Communications, Inc.: | | | |
| 1LN, term loan 3 month U.S. LIBOR + 5.000% 8.5% 5/31/25 (a)(b)(c) | | 31,082 | 31,337 |
| Tranche B, term loan 3 month U.S. LIBOR + 2.750% 2.9% 5/31/25 (a)(b)(c) | | 485,000 | 380,968 |
| Tranche DD 1LN, term loan 3 month U.S. LIBOR + 5.000% 8.5% 12/31/21 (a)(b)(c) | | 38,270 | 38,585 |
| Intelsat Jackson Holdings SA: | | | |
| Tranche B, term loan 3 month U.S. LIBOR + 3.750% 8% 11/27/23 (a)(b)(c) | | 1,685,000 | 1,708,876 |
| Tranche B-4, term loan 3 month U.S. LIBOR + 5.500% 8.75% 1/2/24 (a)(b)(c) | | 200,000 | 203,376 |
| Tranche B-5, term loan 8.625% 1/2/24 (c) | | 1,635,000 | 1,661,274 |
| Tranche DD 1LN, term loan 3 month U.S. LIBOR + 5.500% 6.5% 7/13/22 (a)(b)(c) | | 943,786 | 949,099 |
| Iridium Satellite LLC Tranche B 1LN, term loan 3 month U.S. LIBOR + 2.750% 3.75% 11/4/26 (a)(b)(c) | | 346,500 | 346,836 |
| Level 3 Financing, Inc. Tranche B 1LN, term loan 3 month U.S. LIBOR + 1.750% 1.8543% 3/1/27 (a)(b)(c) | | 317,652 | 312,588 |
| Lumen Technologies, Inc. Tranche B 1LN, term loan 3 month U.S. LIBOR + 2.250% 2.3543% 3/15/27 (a)(b)(c) | | 108,622 | 107,074 |
| Radiate Holdco LLC Tranche B 1LN, term loan 3 month U.S. LIBOR + 3.500% 4.25% 9/10/26 (a)(b)(c) | | 800,975 | 801,271 |
| SBA Senior Finance II, LLC Tranche B, term loan 3 month U.S. LIBOR + 1.750% 1.86% 4/11/25 (a)(b)(c) | | 333,961 | 330,831 |
| Securus Technologies Holdings Tranche B, term loan: | | | |
| 3 month U.S. LIBOR + 4.500% 5.5% 11/1/24 (a)(b)(c) | | 485,774 | 454,505 |
| 3 month U.S. LIBOR + 8.250% 9.25% 11/1/25 (a)(b)(c) | | 685,000 | 595,950 |
| Windstream Services LLC Tranche B 1LN, term loan 3 month U.S. LIBOR + 6.250% 7.25% 9/21/27 (a)(b)(c) | | 341,605 | 342,203 |
| Zayo Group Holdings, Inc. 1LN, term loan 3 month U.S. LIBOR + 3.000% 3.1043% 3/9/27 (a)(b)(c) | | 948,133 | 937,542 |
|
| TOTAL TELECOMMUNICATIONS | | | 13,043,176 |
|
| Textiles/Apparel - 0.6% | | | |
| Birkenstock GmbH & Co. KG Tranche B 1LN, term loan 3 month U.S. LIBOR + 3.750% 4.25% 4/26/28 (a)(b)(c) | | 405,000 | 404,830 |
| Jo-Ann Stores LLC Tranche B 1LN, term loan 1 month U.S. LIBOR + 4.750% 6/30/28 (b)(c)(d)(f) | | 175,000 | 174,563 |
| Samsonite IP Holdings SARL Tranche B2 1LN, term loan 3 month U.S. LIBOR + 4.500% 5.1354% 4/25/25 (a)(b)(c) | | 149,248 | 149,030 |
| Tory Burch LLC Tranche B 1LN, term loan 3 month U.S. LIBOR + 3.500% 4% 4/14/28 (a)(b)(c) | | 285,000 | 283,931 |
| Victoria's Secret & Co. Tranche B 1LN, term loan 1 month U.S. LIBOR + 3.250% 6/30/28 (b)(c)(d)(f) | | 195,000 | 193,538 |
|
| TOTAL TEXTILES/APPAREL | | | 1,205,892 |
|
| Utilities - 2.6% | | | |
| Brookfield WEC Holdings, Inc. Tranche B 1LN, term loan 3 month U.S. LIBOR + 2.750% 3.25% 8/1/25 (a)(b)(c) | | 1,163,738 | 1,151,774 |
| ExGen Renewables IV, LLC Tranche B 1LN, term loan 3 month U.S. LIBOR + 2.500% 3.5% 12/15/27 (a)(b)(c) | | 180,837 | 180,687 |
| Granite Generation LLC 1LN, term loan 3 month U.S. LIBOR + 3.750% 4.75% 11/1/26 (a)(b)(c) | | 345,589 | 336,517 |
| Green Energy Partners/Stonewall LLC Tranche B 1LN, term loan 3 month U.S. LIBOR + 5.500% 6.5% 11/13/21 (a)(b)(c) | | 255,063 | 237,315 |
| Herman Miller, Inc. Tranche B 1LN, term loan 1 month U.S. LIBOR + 2.000% 0% 6/29/28 (a)(c) | | 210,000 | 209,738 |
| Limetree Bay Terminals LLC term loan 3 month U.S. LIBOR + 4.000% 5% 2/15/24 (a)(b)(c) | | 188,036 | 132,684 |
| LMBE-MC HoldCo II LLC Tranche B, term loan 3 month U.S. LIBOR + 4.000% 5% 12/3/25 (a)(b)(c) | | 365,569 | 352,774 |
| Osmose Utilities Services, Inc. Tranche B 1LN, term loan 1 month U.S. LIBOR + 3.250% 6/17/28 (b)(c)(d) | | 330,000 | 328,350 |
| PG&E Corp. Tranche B 1LN, term loan 3 month U.S. LIBOR + 3.000% 3.5% 6/23/25 (a)(b)(c) | | 618,750 | 609,859 |
| Pike Corp. Tranche B 1LN, term loan 3 month U.S. LIBOR + 3.000% 3.11% 1/21/28 (a)(b)(c) | | 239,726 | 239,093 |
| UGI Energy Services LLC Tranche B 1LN, term loan 3 month U.S. LIBOR + 3.750% 3.8542% 8/13/26 (a)(b)(c) | | 245,000 | 244,694 |
| Vertiv Group Corp. Tranche B 1LN, term loan 3 month U.S. LIBOR + 2.750% 2.8359% 3/2/27 (a)(b)(c) | | 740,653 | 735,624 |
| Vistra Operations Co. LLC Tranche B 3LN, term loan 3 month U.S. LIBOR + 1.750% 1.8498% 12/31/25 (a)(b)(c) | | 556,698 | 552,522 |
|
| TOTAL UTILITIES | | | 5,311,631 |
|
| TOTAL BANK LOAN OBLIGATIONS | | | |
| (Cost $182,721,090) | | | 181,792,938 |
|
| Nonconvertible Bonds - 3.5% | | | |
| Aerospace - 0.3% | | | |
| TransDigm, Inc.: | | | |
| 6.25% 3/15/26 (h) | | 500,000 | 527,500 |
| 8% 12/15/25 (h) | | 40,000 | 43,220 |
|
| TOTAL AEROSPACE | | | 570,720 |
|
| Air Transportation - 0.1% | | | |
| American Airlines, Inc. / AAdvantage Loyalty IP Ltd. 5.5% 4/20/26 (h) | | 105,000 | 111,169 |
| Delta Air Lines, Inc. / SkyMiles IP Ltd. 4.5% 10/20/25 (h) | | 70,000 | 75,223 |
|
| TOTAL AIR TRANSPORTATION | | | 186,392 |
|
| Broadcasting - 0.1% | | | |
| Univision Communications, Inc.: | | | |
| 6.625% 6/1/27 (h) | | 105,000 | 113,773 |
| 9.5% 5/1/25 (h) | | 115,000 | 126,788 |
|
| TOTAL BROADCASTING | | | 240,561 |
|
| Cable/Satellite TV - 0.1% | | | |
| Charter Communications Operating LLC/Charter Communications Operating Capital Corp. 3 month U.S. LIBOR + 1.650% 1.8256% 2/1/24 (a)(b) | | 250,000 | 256,980 |
| Chemicals - 0.4% | | | |
| Consolidated Energy Finance SA 3 month U.S. LIBOR + 3.750% 3.8689% 6/15/22 (a)(b)(h) | | 735,000 | 727,102 |
| Kronos Acquisition Holdings, Inc. / KIK Custom Products, Inc. 5% 12/31/26 (h) | | 5,000 | 5,075 |
|
| TOTAL CHEMICALS | | | 732,177 |
|
| Containers - 0.5% | | | |
| Ardagh Packaging Finance PLC/Ardagh MP Holdings U.S.A., Inc. 4.125% 8/15/26 (h) | | 260,000 | 268,450 |
| Berry Global, Inc. 4.875% 7/15/26 (h) | | 500,000 | 529,080 |
| Trivium Packaging Finance BV 5.5% 8/15/26 (h) | | 150,000 | 157,605 |
|
| TOTAL CONTAINERS | | | 955,135 |
|
| Diversified Financial Services - 0.0% | | | |
| Park Aerospace Holdings Ltd. 5.25% 8/15/22 (h) | | 7,000 | 7,324 |
| Energy - 0.1% | | | |
| Citgo Petroleum Corp. 7% 6/15/25 (h) | | 95,000 | 98,997 |
| New Fortress Energy, Inc. 6.75% 9/15/25 (h) | | 45,000 | 46,069 |
| PBF Holding Co. LLC/PBF Finance Corp. 9.25% 5/15/25 (h) | | 105,000 | 105,525 |
|
| TOTAL ENERGY | | | 250,591 |
|
| Gaming - 0.2% | | | |
| Golden Entertainment, Inc. 7.625% 4/15/26 (h) | | 145,000 | 154,063 |
| Scientific Games Corp. 5% 10/15/25 (h) | | 200,000 | 206,500 |
| VICI Properties, Inc.: | | | |
| 3.5% 2/15/25 (h) | | 30,000 | 30,592 |
| 4.25% 12/1/26 (h) | | 45,000 | 46,810 |
| 4.625% 12/1/29 (h) | | 25,000 | 26,563 |
|
| TOTAL GAMING | | | 464,528 |
|
| Healthcare - 0.3% | | | |
| Bausch Health Companies, Inc.: | | | |
| 5.5% 11/1/25 (h) | | 125,000 | 128,250 |
| 9% 12/15/25 (h) | | 180,000 | 193,014 |
| Tenet Healthcare Corp. 4.625% 7/15/24 | | 375,000 | 380,513 |
|
| TOTAL HEALTHCARE | | | 701,777 |
|
| Homebuilders/Real Estate - 0.0% | | | |
| Uniti Group LP / Uniti Group Finance, Inc. 4.75% 4/15/28 (h) | | 15,000 | 14,963 |
| Hotels - 0.1% | | | |
| Marriott Ownership Resorts, Inc. 6.125% 9/15/25 (h) | | 170,000 | 180,787 |
| Leisure - 0.1% | | | |
| Royal Caribbean Cruises Ltd.: | | | |
| 9.125% 6/15/23 (h) | | 25,000 | 27,438 |
| 10.875% 6/1/23 (h) | | 120,000 | 136,650 |
|
| TOTAL LEISURE | | | 164,088 |
|
| Paper - 0.0% | | | |
| Ardagh Metal Packaging Finance U.S.A. LLC/Ardagh Metal Packaging Finance PLC 3.25% 9/1/28 (h) | | 80,000 | 79,768 |
| Restaurants - 0.1% | | | |
| 1011778 BC Unlimited Liability Co./New Red Finance, Inc. 4.25% 5/15/24 (h) | | 129,000 | 130,419 |
| CEC Entertainment LLC 6.75% 5/1/26 (h) | | 95,000 | 97,494 |
|
| TOTAL RESTAURANTS | | | 227,913 |
|
| Services - 0.2% | | | |
| Adtalem Global Education, Inc. 5.5% 3/1/28 (h) | | 105,000 | 106,633 |
| APX Group, Inc. 7.625% 9/1/23 | | 85,000 | 87,338 |
| Aramark Services, Inc. 6.375% 5/1/25 (h) | | 60,000 | 63,750 |
| GEMS MENASA Cayman Ltd. 7.125% 7/31/26 (h) | | 115,000 | 118,795 |
|
| TOTAL SERVICES | | | 376,516 |
|
| Super Retail - 0.2% | | | |
| EG Global Finance PLC: | | | |
| 6.75% 2/7/25 (h) | | 125,000 | 129,246 |
| 8.5% 10/30/25 (h) | | 250,000 | 264,375 |
|
| TOTAL SUPER RETAIL | | | 393,621 |
|
| Technology - 0.2% | | | |
| CommScope, Inc.: | | | |
| 5.5% 3/1/24 (h) | | 125,000 | 128,594 |
| 6% 3/1/26 (h) | | 125,000 | 131,963 |
| SSL Robotics LLC 9.75% 12/31/23 (h) | | 88,000 | 97,111 |
|
| TOTAL TECHNOLOGY | | | 357,668 |
|
| Telecommunications - 0.3% | | | |
| Altice Financing SA 7.5% 5/15/26 (h) | | 225,000 | 234,293 |
| Altice France SA: | | | |
| 5.125% 1/15/29 (h) | | 15,000 | 15,075 |
| 7.375% 5/1/26 (h) | | 223,000 | 231,904 |
| Frontier Communications Holdings LLC 5% 5/1/28 (h) | | 100,000 | 103,383 |
|
| TOTAL TELECOMMUNICATIONS | | | 584,655 |
|
| Transportation Ex Air/Rail - 0.2% | | | |
| Avolon Holdings Funding Ltd.: | | | |
| 5.125% 10/1/23 (h) | | 150,000 | 162,166 |
| 5.25% 5/15/24 (h) | | 200,000 | 219,966 |
|
| TOTAL TRANSPORTATION EX AIR/RAIL | | | 382,132 |
|
| TOTAL NONCONVERTIBLE BONDS | | | |
| (Cost $6,818,620) | | | 7,128,296 |
| | | Shares | Value |
|
| Common Stocks - 1.2% | | | |
| Capital Goods - 0.1% | | | |
| TNT Crane & Rigging LLC (f) | | 4,832 | 102,728 |
| TNT Crane & Rigging LLC warrants 10/31/25 (f)(i) | | 1,797 | 5,930 |
|
| TOTAL CAPITAL GOODS | | | 108,658 |
|
| Diversified Financial Services - 0.0% | | | |
| ACNR Holdings, Inc. (f) | | 1,374 | 22,671 |
| Energy - 1.0% | | | |
| California Resources Corp. (i) | | 25,296 | 762,421 |
| California Resources Corp. warrants 10/27/24 (i) | | 885 | 6,797 |
| Chesapeake Energy Corp. | | 14,325 | 743,754 |
| Chesapeake Energy Corp. (j) | | 103 | 5,348 |
| Denbury, Inc. (i) | | 7,285 | 559,342 |
|
| TOTAL ENERGY | | | 2,077,662 |
|
| Entertainment/Film - 0.0% | | | |
| Cineworld Group PLC warrants 11/23/25 (i) | | 22,063 | 12,114 |
| Restaurants - 0.1% | | | |
| CEC Entertainment, Inc. (f) | | 15,069 | 271,242 |
| Super Retail - 0.0% | | | |
| David's Bridal, Inc. rights (f)(i) | | 347 | 0 |
| TOTAL COMMON STOCKS | | | |
| (Cost $1,375,515) | | | 2,492,347 |
|
| Nonconvertible Preferred Stocks - 0.0% | | | |
| Diversified Financial Services - 0.0% | | | |
| ACNR Holdings, Inc. (f) | | | |
| (Cost $98,250) | | 786 | 76,242 |
| | | Principal Amount | Value |
|
| Preferred Securities - 0.1% | | | |
| Banks & Thrifts - 0.1% | | | |
| JPMorgan Chase & Co.: | | | |
| 3 month U.S. LIBOR + 3.320% 3.5216% (a)(b)(k) | | 80,000 | 80,904 |
| 3 month U.S. LIBOR + 3.470% 3.6555% (a)(b)(k) | | 80,000 | 80,704 |
| TOTAL PREFERRED SECURITIES | | | |
| (Cost $146,935) | | | 161,608 |
| | | Shares | Value |
|
| Money Market Funds - 10.6% | | | |
| Fidelity Cash Central Fund 0.06% (l) | | | |
| (Cost $21,322,648) | | 21,318,385 | 21,322,648 |
| TOTAL INVESTMENT IN SECURITIES - 105.3% | | | |
| (Cost $212,483,058) | | | 212,974,079 |
| NET OTHER ASSETS (LIABILITIES) - (5.3)% | | | (10,729,172) |
| NET ASSETS - 100% | | | $202,244,907 |
Legend
(a) Coupon rates for floating and adjustable rate securities reflect the rates in effect at period end.
(b) Coupon is indexed to a floating interest rate which may be multiplied by a specified factor and/or subject to caps or floors.
(c) Remaining maturities of bank loan obligations may be less than the stated maturities shown as a result of contractual or optional prepayments by the borrower. Such prepayments cannot be predicted with certainty.
(d) The coupon rate will be determined upon settlement of the loan after period end.
(e) Position or a portion of the position represents an unfunded loan commitment. At period end, the total principal amount and market value of unfunded commitments totaled $201,238 and $200,502, respectively.
(f) Level 3 security
(g) Non-income producing - Security is in default.
(h) Security exempt from registration under Rule 144A of the Securities Act of 1933. These securities may be resold in transactions exempt from registration, normally to qualified institutional buyers. At the end of the period, the value of these securities amounted to $6,403,465 or 3.2% of net assets.
(i) Non-income producing
(j) Restricted securities (including private placements) - Investment in securities not registered under the Securities Act of 1933 (excluding 144A issues). At the end of the period, the value of restricted securities (excluding 144A issues) amounted to $5,348 or 0.0% of net assets.
(k) Security is perpetual in nature with no stated maturity date.
(l) Affiliated fund that is generally available only to investment companies and other accounts managed by Fidelity Investments. The rate quoted is the annualized seven-day yield of the fund at period end. A complete unaudited listing of the fund's holdings as of its most recent quarter end is available upon request. In addition, each Fidelity Central Fund's financial statements are available on the SEC's website or upon request.
Additional information on each restricted holding is as follows:
| Security | Acquisition Date | Acquisition Cost |
| Chesapeake Energy Corp. | 2/10/21 | $975 |
Affiliated Central Funds
Information regarding fiscal year to date income earned by the Fund from investments in Fidelity Central Funds is as follows:
| Fund | Income earned |
| Fidelity Cash Central Fund | $5,030 |
| Total | $5,030 |
Amounts in the income column in the above table include any capital gain distributions from underlying funds, which are presented in the corresponding line-item in the Statement of Operations, if applicable.
Fiscal year to date information regarding the Fund's investments in Fidelity Central Funds, including the ownership percentage, is presented below.
| Fund | Value, beginning of period | Purchases | Sales Proceeds | Realized Gain/Loss | Change in Unrealized appreciation (depreciation) | Value, end of period | % ownership, end of period |
| Fidelity Cash Central Fund 0.06% | $10,580,936 | $42,477,879 | $31,736,106 | $(61) | $-- | $21,322,648 | 0.0% |
| Total | $10,580,936 | $42,477,879 | $31,736,106 | $(61) | $-- | $21,322,648 | |
Investment Valuation
The following is a summary of the inputs used, as of June 30, 2021, involving the Fund's assets and liabilities carried at fair value. The inputs or methodology used for valuing securities may not be an indication of the risk associated with investing in those securities. For more information on valuation inputs, and their aggregation into the levels used below, please refer to the Investment Valuation section in the accompanying Notes to Financial Statements.
| | Valuation Inputs at Reporting Date: |
| Description | Total | Level 1 | Level 2 | Level 3 |
| Investments in Securities: | | | | |
| Equities: | | | | |
| Communication Services | $12,114 | $-- | $12,114 | $-- |
| Consumer Discretionary | 271,242 | -- | -- | 271,242 |
| Energy | 2,077,662 | 2,077,662 | -- | -- |
| Financials | 98,913 | -- | -- | 98,913 |
| Industrials | 108,658 | -- | -- | 108,658 |
| Bank Loan Obligations | 181,792,938 | -- | 179,936,075 | 1,856,863 |
| Corporate Bonds | 7,128,296 | -- | 7,128,296 | -- |
| Preferred Securities | 161,608 | -- | 161,608 | -- |
| Money Market Funds | 21,322,648 | 21,322,648 | -- | -- |
| Total Investments in Securities: | $212,974,079 | $23,400,310 | $187,238,093 | $2,335,676 |
The following is a reconciliation of Investments in Securities for which Level 3 inputs were used in determining value:
| Investments in Securities: | |
| Beginning Balance | $1,391,815 |
| Net Realized Gain (Loss) on Investment Securities | (1,315,132) |
| Net Unrealized Gain (Loss) on Investment Securities | 1,603,261 |
| Cost of Purchases | 1,432,049 |
| Proceeds of Sales | (240,152) |
| Amortization/Accretion | (11,496) |
| Transfers into Level 3 | -- |
| Transfers out of Level 3 | (524,669) |
| Ending Balance | $2,335,676 |
| The change in unrealized gain (loss) for the period attributable to Level 3 securities held at June 30, 2021 | $264,215 |
The information used in the above reconciliation represents fiscal year to date activity for any Investments in Securities identified as using Level 3 inputs at either the beginning or the end of the current fiscal period. Cost of purchases and proceeds of sales may include securities received and/or delivered through in-kind transactions. Transfers in or out of Level 3 represent the beginning value of any Security or Instrument where a change in the pricing level occurred from the beginning to the end of the period. The cost of purchases and the proceeds of sales may include securities received or delivered through corporate actions or exchanges. Realized and unrealized gains (losses) disclosed in the reconciliation are included in Net Gain (Loss) on the Fund's Statement of Operations.
Other Information
Distribution of investments by country or territory of incorporation, as a percentage of Total Net Assets, is as follows (Unaudited):
| United States of America | 88.5% |
| Luxembourg | 6.4% |
| Canada | 1.3% |
| Cayman Islands | 1.0% |
| Others (Individually Less Than 1%) | 2.8% |
| | 100.0% |
See accompanying notes which are an integral part of the financial statements.
Financial Statements
Statement of Assets and Liabilities
| | | June 30, 2021 (Unaudited) |
| Assets | | |
Investment in securities, at value — See accompanying schedule:
Unaffiliated issuers (cost $191,160,410) | $191,651,431 | |
| Fidelity Central Funds (cost $21,322,648) | 21,322,648 | |
| Total Investment in Securities (cost $212,483,058) | | $212,974,079 |
| Cash | | 254,176 |
| Receivable for investments sold | | 1,526,040 |
| Receivable for fund shares sold | | 132,201 |
| Dividends receivable | | 35 |
| Interest receivable | | 761,582 |
| Distributions receivable from Fidelity Central Funds | | 746 |
| Other receivables | | 208 |
| Total assets | | 215,649,067 |
| Liabilities | | |
| Payable for investments purchased | $13,248,504 | |
| Payable for fund shares redeemed | 208 | |
| Accrued management fee | 90,502 | |
| Other affiliated payables | 24,762 | |
| Other payables and accrued expenses | 40,184 | |
| Total liabilities | | 13,404,160 |
| Net Assets | | $202,244,907 |
| Net Assets consist of: | | |
| Paid in capital | | $215,610,247 |
| Total accumulated earnings (loss) | | (13,365,340) |
| Net Assets | | $202,244,907 |
| Net Asset Value and Maximum Offering Price | | |
| Initial Class: | | |
| Net Asset Value, offering price and redemption price per share ($8,191,521 ÷ 823,560 shares) | | $9.95 |
| Investor Class: | | |
| Net Asset Value, offering price and redemption price per share ($194,053,386 ÷ 19,524,414 shares) | | $9.94 |
See accompanying notes which are an integral part of the financial statements.
Statement of Operations
| | | Six months ended June 30, 2021 (Unaudited) |
| Investment Income | | |
| Dividends | | $9,467 |
| Interest | | 3,658,884 |
| Income from Fidelity Central Funds | | 5,030 |
| Total income | | 3,673,381 |
| Expenses | | |
| Management fee | $501,393 | |
| Transfer agent fees | 91,986 | |
| Accounting fees and expenses | 45,042 | |
| Custodian fees and expenses | 8,957 | |
| Independent trustees' fees and expenses | 300 | |
| Audit | 35,273 | |
| Legal | 484 | |
| Miscellaneous | 575 | |
| Total expenses before reductions | 684,010 | |
| Expense reductions | (335) | |
| Total expenses after reductions | | 683,675 |
| Net investment income (loss) | | 2,989,706 |
| Realized and Unrealized Gain (Loss) | | |
| Net realized gain (loss) on: | | |
| Investment securities: | | |
| Unaffiliated issuers | (2,772,104) | |
| Fidelity Central Funds | (61) | |
| Foreign currency transactions | (41) | |
| Total net realized gain (loss) | | (2,772,206) |
| Change in net unrealized appreciation (depreciation) on: | | |
| Investment securities: | | |
| Unaffiliated issuers | 5,581,915 | |
| Assets and liabilities in foreign currencies | 202 | |
| Total change in net unrealized appreciation (depreciation) | | 5,582,117 |
| Net gain (loss) | | 2,809,911 |
| Net increase (decrease) in net assets resulting from operations | | $5,799,617 |
See accompanying notes which are an integral part of the financial statements.
Statement of Changes in Net Assets
| | Six months ended June 30, 2021 (Unaudited) | Year ended December 31, 2020 |
| Increase (Decrease) in Net Assets | | |
| Operations | | |
| Net investment income (loss) | $2,989,706 | $7,255,162 |
| Net realized gain (loss) | (2,772,206) | (10,101,006) |
| Change in net unrealized appreciation (depreciation) | 5,582,117 | (2,145,391) |
| Net increase (decrease) in net assets resulting from operations | 5,799,617 | (4,991,235) |
| Distributions to shareholders | (593,618) | (8,416,335) |
| Share transactions - net increase (decrease) | 28,420,753 | (83,976,072) |
| Total increase (decrease) in net assets | 33,626,752 | (97,383,642) |
| Net Assets | | |
| Beginning of period | 168,618,155 | 266,001,797 |
| End of period | $202,244,907 | $168,618,155 |
See accompanying notes which are an integral part of the financial statements.
Financial Highlights
VIP Floating Rate High Income Portfolio Initial Class
| | Six months ended (Unaudited) June 30, | Years endedDecember 31, | | | | |
| | 2021 | 2020 | 2019 | 2018 | 2017 | 2016 |
| Selected Per–Share Data | | | | | | |
| Net asset value, beginning of period | $9.66 | $9.85 | $9.55 | $9.93 | $9.86 | $9.34 |
| Income from Investment Operations | | | | | | |
| Net investment income (loss)A | .162 | .376 | .505 | .438 | .402 | .412 |
| Net realized and unrealized gain (loss) | .162 | (.104) | .325 | (.452) | (.027) | .445 |
| Total from investment operations | .324 | .272 | .830 | (.014) | .375 | .857 |
| Distributions from net investment income | (.034) | (.462) | (.530) | (.366) | (.305) | (.337) |
| Total distributions | (.034) | (.462) | (.530) | (.366) | (.305) | (.337) |
| Net asset value, end of period | $9.95 | $9.66 | $9.85 | $9.55 | $9.93 | $9.86 |
| Total ReturnB,C,D | 3.36% | 2.82% | 8.79% | (.16)% | 3.81% | 9.18% |
| Ratios to Average Net AssetsE,F | | | | | | |
| Expenses before reductions | .72%G | .73% | .71% | .71% | .73% | .76% |
| Expenses net of fee waivers, if any | .72%G | .73% | .71% | .71% | .73% | .76% |
| Expenses net of all reductions | .72%G | .73% | .70% | .71% | .72% | .76% |
| Net investment income (loss) | 3.32%G | 3.95% | 5.06% | 4.37% | 4.01% | 4.23% |
| Supplemental Data | | | | | | |
| Net assets, end of period (000 omitted) | $8,192 | $7,689 | $12,292 | $12,905 | $6,602 | $6,810 |
| Portfolio turnover rateH | 39%G | 40% | 29% | 45% | 68% | 54% |
A Calculated based on average shares outstanding during the period.
B Total returns for periods of less than one year are not annualized.
C Total returns do not reflect charges attributable to your insurance company's separate account. Inclusion of these charges would reduce the total returns shown.
D Total returns would have been lower if certain expenses had not been reduced during the applicable periods shown.
E Fees and expenses of any underlying mutual funds or exchange-traded funds (ETFs) are not included in the Fund's expense ratio. The Fund indirectly bears its proportionate share of these expenses. For additional expense information related to investments in Fidelity Central Funds, please refer to the "Investments in Fidelity Central Funds" note found in the Notes to Financial Statements section of the most recent Annual or Semi-Annual report.
F Expense ratios reflect operating expenses of the class. Expenses before reductions do not reflect amounts reimbursed, waived, or reduced through arrangements with the investment adviser, brokerage services, or other offset arrangements, if applicable, and do not represent the amount paid by the class during periods when reimbursements, waivers or reductions occur.
G Annualized
H Amount does not include the portfolio activity of any underlying mutual funds or exchange-traded funds (ETFs).
See accompanying notes which are an integral part of the financial statements.
VIP Floating Rate High Income Portfolio Investor Class
| | Six months ended (Unaudited) June 30, | Years endedDecember 31, | | | | |
| | 2021 | 2020 | 2019 | 2018 | 2017 | 2016 |
| Selected Per–Share Data | | | | | | |
| Net asset value, beginning of period | $9.66 | $9.85 | $9.54 | $9.93 | $9.86 | $9.34 |
| Income from Investment Operations | | | | | | |
| Net investment income (loss)A | .160 | .373 | .502 | .434 | .398 | .409 |
| Net realized and unrealized gain (loss) | .154 | (.105) | .335 | (.461) | (.025) | .446 |
| Total from investment operations | .314 | .268 | .837 | (.027) | .373 | .855 |
| Distributions from net investment income | (.034) | (.458) | (.527) | (.363) | (.303) | (.335) |
| Total distributions | (.034) | (.458) | (.527) | (.363) | (.303) | (.335) |
| Net asset value, end of period | $9.94 | $9.66 | $9.85 | $9.54 | $9.93 | $9.86 |
| Total ReturnB,C,D | 3.26% | 2.78% | 8.88% | (.30)% | 3.79% | 9.16% |
| Ratios to Average Net AssetsE,F | | | | | | |
| Expenses before reductions | .75%G | .76% | .74% | .74% | .76% | .79% |
| Expenses net of fee waivers, if any | .75%G | .76% | .74% | .74% | .76% | .79% |
| Expenses net of all reductions | .75%G | .76% | .74% | .74% | .76% | .79% |
| Net investment income (loss) | 3.29%G | 3.91% | 5.03% | 4.33% | 3.97% | 4.20% |
| Supplemental Data | | | | | | |
| Net assets, end of period (000 omitted) | $194,053 | $160,929 | $253,710 | $253,242 | $180,482 | $145,821 |
| Portfolio turnover rateH | 39%G | 40% | 29% | 45% | 68% | 54% |
A Calculated based on average shares outstanding during the period.
B Total returns for periods of less than one year are not annualized.
C Total returns do not reflect charges attributable to your insurance company's separate account. Inclusion of these charges would reduce the total returns shown.
D Total returns would have been lower if certain expenses had not been reduced during the applicable periods shown.
E Fees and expenses of any underlying mutual funds or exchange-traded funds (ETFs) are not included in the Fund's expense ratio. The Fund indirectly bears its proportionate share of these expenses. For additional expense information related to investments in Fidelity Central Funds, please refer to the "Investments in Fidelity Central Funds" note found in the Notes to Financial Statements section of the most recent Annual or Semi-Annual report.
F Expense ratios reflect operating expenses of the class. Expenses before reductions do not reflect amounts reimbursed, waived, or reduced through arrangements with the investment adviser, brokerage services, or other offset arrangements, if applicable, and do not represent the amount paid by the class during periods when reimbursements, waivers or reductions occur.
G Annualized
H Amount does not include the portfolio activity of any underlying mutual funds or exchange-traded funds (ETFs).
See accompanying notes which are an integral part of the financial statements.
Notes to Financial Statements (Unaudited)
For the period ended June 30, 2021
1. Organization.
VIP Floating Rate High Income Portfolio (the Fund) is a fund of Variable Insurance Products Fund (the Trust) and is authorized to issue an unlimited number of shares. The Trust is registered under the Investment Company Act of 1940, as amended (the 1940 Act), as an open-end management investment company organized as a Massachusetts business trust. Shares of the Fund may only be purchased by insurance companies for the purpose of funding variable annuity or variable life insurance contracts. The Fund offers the following classes of shares: Initial Class shares and Investor Class shares. All classes have equal rights and voting privileges, except for matters affecting a single class.
2. Investments in Fidelity Central Funds.
Funds may invest in Fidelity Central Funds, which are open-end investment companies generally available only to other investment companies and accounts managed by the investment adviser and its affiliates. The Schedule of Investments lists any Fidelity Central Funds held as an investment as of period end, but does not include the underlying holdings of each Fidelity Central Fund. An investing fund indirectly bears its proportionate share of the expenses of the underlying Fidelity Central Funds.
Based on its investment objective, each Fidelity Central Fund may invest or participate in various investment vehicles or strategies that are similar to those of the investing fund. These strategies are consistent with the investment objectives of the investing fund and may involve certain economic risks which may cause a decline in value of each of the Fidelity Central Funds and thus a decline in the value of the investing fund.
| Fidelity Central Fund | Investment Manager | Investment Objective | Investment Practices | Expense Ratio(a) |
| Fidelity Money Market Central Funds | Fidelity Management & Research Company LLC (FMR) | Each fund seeks to obtain a high level of current income consistent with the preservation of capital and liquidity. | Short-term Investments | Less than .005% to .01% |
(a) Expenses expressed as a percentage of average net assets and are as of each underlying Central Fund's most recent annual or semi-annual shareholder report.
A complete unaudited list of holdings for each Fidelity Central Fund is available upon request or at the Securities and Exchange Commission website at www.sec.gov. In addition, the financial statements of the Fidelity Central Funds which contain the significant accounting policies (including investment valuation policies) of those funds, and are not covered by the Report of Independent Registered Public Accounting Firm, are available on the Securities and Exchange Commission website or upon request.
3. Significant Accounting Policies.
The Fund is an investment company and applies the accounting and reporting guidance of the Financial Accounting Standards Board (FASB) Accounting Standards Codification Topic 946 Financial Services - Investment Companies. The financial statements have been prepared in conformity with accounting principles generally accepted in the United States of America (GAAP), which require management to make certain estimates and assumptions at the date of the financial statements. Actual results could differ from those estimates. Subsequent events, if any, through the date that the financial statements were issued have been evaluated in the preparation of the financial statements. The Fund's Schedule of Investments lists any underlying mutual funds or exchange-traded funds (ETFs) but does not include the underlying holdings of these funds. The following summarizes the significant accounting policies of the Fund:
Investment Valuation. Investments are valued as of 4:00 p.m. Eastern time on the last calendar day of the period. The Board of Trustees (the Board) has delegated the day to day responsibility for the valuation of the Fund's investments to the Fair Value Committee (the Committee) established by the Fund's investment adviser. In accordance with valuation policies and procedures approved by the Board, the Fund attempts to obtain prices from one or more third party pricing vendors or brokers to value its investments. When current market prices, quotations or currency exchange rates are not readily available or reliable, investments will be fair valued in good faith by the Committee, in accordance with procedures adopted by the Board. Factors used in determining fair value vary by investment type and may include market or investment specific events, changes in interest rates and credit quality. The frequency with which these procedures are used cannot be predicted and they may be utilized to a significant extent. The Committee oversees the Fund's valuation policies and procedures and reports to the Board on the Committee's activities and fair value determinations. The Board monitors the appropriateness of the procedures used in valuing the Fund's investments and ratifies the fair value determinations of the Committee.
The Fund categorizes the inputs to valuation techniques used to value its investments into a disclosure hierarchy consisting of three levels as shown below:
- Level 1 – quoted prices in active markets for identical investments
- Level 2 – other significant observable inputs (including quoted prices for similar investments, interest rates, prepayment speeds, etc.)
- Level 3 – unobservable inputs (including the Fund's own assumptions based on the best information available)
Valuation techniques used to value the Fund's investments by major category are as follows:
Debt securities, including restricted securities, are valued based on evaluated prices received from third party pricing vendors or from brokers who make markets in such securities. Corporate bonds, bank loan obligations and preferred securities are valued by pricing vendors who utilize matrix pricing which considers yield or price of bonds of comparable quality, coupon, maturity and type or by broker-supplied prices. When independent prices are unavailable or unreliable, debt securities may be valued utilizing pricing methodologies which consider similar factors that would be used by third party pricing vendors. Debt securities are generally categorized as Level 2 in the hierarchy but may be Level 3 depending on the circumstances. The Fund invests a significant portion of its assets in below investment grade securities. The value of these securities can be more volatile due to changes in the credit quality of the issuer and is sensitive to changes in economic, market and regulatory conditions.
Equity securities, including restricted securities, for which market quotations are readily available, are valued at the last reported sale price or official closing price as reported by a third party pricing vendor on the primary market or exchange on which they are traded and are categorized as Level 1 in the hierarchy. In the event there were no sales during the day or closing prices are not available, securities are valued at the last quoted bid price or may be valued using the last available price and are generally categorized as Level 2 in the hierarchy. For equity securities, including restricted securities, where observable inputs are limited, assumptions about market activity and risk are used and these securities may be categorized as Level 3 in the hierarchy.
Investments in open-end mutual funds, including the Fidelity Central Funds, are valued at their closing net asset value (NAV) each business day and are categorized as Level 1 in the hierarchy.
Changes in valuation techniques may result in transfers in or out of an assigned level within the disclosure hierarchy. The aggregate value of investments by input level as of June 30, 2021, as well as a roll forward of Level 3 investments, is included at the end of the Fund's Schedule of Investments.
Foreign Currency. Certain Funds may use foreign currency contracts to facilitate transactions in foreign-denominated securities. Gains and losses from these transactions may arise from changes in the value of the foreign currency or if the counterparties do not perform under the contracts' terms.
Foreign-denominated assets, including investment securities, and liabilities are translated into U.S. dollars at the exchange rates at period end. Purchases and sales of investment securities, income and dividends received, and expenses denominated in foreign currencies are translated into U.S. dollars at the exchange rate in effect on the transaction date.
The effects of exchange rate fluctuations on investments are included with the net realized and unrealized gain (loss) on investment securities. Other foreign currency transactions resulting in realized and unrealized gain (loss) are disclosed separately.
Investment Transactions and Income. For financial reporting purposes, the Fund's investment holdings and NAV include trades executed through the end of the last business day of the period. The NAV per share for processing shareholder transactions is calculated as of the close of business of the New York Stock Exchange (NYSE), normally 4:00 p.m. Eastern time and includes trades executed through the end of the prior business day. Gains and losses on securities sold are determined on the basis of identified cost. Dividend income is recorded on the ex-dividend date, except for certain dividends from foreign securities where the ex-dividend date may have passed, which are recorded as soon as the Fund is informed of the ex-dividend date. Non-cash dividends included in dividend income, if any, are recorded at the fair market value of the securities received. Income and capital gain distributions from Fidelity Central Funds, if any, are recorded on the ex-dividend date. Interest income is accrued as earned and includes coupon interest and amortization of premium and accretion of discount on debt securities as applicable. Investment income is recorded net of foreign taxes withheld where recovery of such taxes is uncertain. Debt obligations may be placed on non-accrual status and related interest income may be reduced by ceasing current accruals and writing off interest receivables when the collection of all or a portion of interest has become doubtful based on consistently applied procedures. A debt obligation is removed from non-accrual status when the issuer resumes interest payments or when collectability of interest is reasonably assured. The Fund earns certain fees in connection with its floating rate loan purchasing activities. These fees are in addition to interest payments earned and may include amendment fees, consent fees and prepayment fees. These fees are recorded as Interest in the accompanying financial statements.
Class Allocations and Expenses. Investment income, realized and unrealized capital gains and losses, common expenses of a fund, and certain fund-level expense reductions, if any, are allocated daily on a pro-rata basis to each class based on the relative net assets of each class to the total net assets of a fund. Each class differs with respect to transfer agent and distribution and service plan fees incurred, as applicable. Certain expense reductions may also differ by class, if applicable. For the reporting period, the allocated portion of income and expenses to each class as a percent of its average net assets may vary due to the timing of recording these transactions in relation to fluctuating net assets of the classes. Expenses directly attributable to a fund are charged to that fund. Expenses attributable to more than one fund are allocated among the respective funds on the basis of relative net assets or other appropriate methods. Expenses included in the accompanying financial statements reflect the expenses of that fund and do not include any expenses associated with any underlying mutual funds or exchange-traded funds. Although not included in a fund's expenses, a fund indirectly bears its proportionate share of these expenses through the net asset value of each underlying mutual fund or exchange-traded fund. Expense estimates are accrued in the period to which they relate and adjustments are made when actual amounts are known.
Income Tax Information and Distributions to Shareholders. Each year, the Fund intends to qualify as a regulated investment company under Subchapter M of the Internal Revenue Code, including distributing substantially all of its taxable income and realized gains. As a result, no provision for U.S. Federal income taxes is required. The Fund files a U.S. federal tax return, in addition to state and local tax returns as required. The Fund's federal income tax returns are subject to examination by the Internal Revenue Service (IRS) for a period of three fiscal years after they are filed. State and local tax returns may be subject to examination for an additional fiscal year depending on the jurisdiction. Foreign taxes are provided for based on the Fund's understanding of the tax rules and rates that exist in the foreign markets in which it invests.
Distributions are declared and recorded on the ex-dividend date. Income and capital gain distributions are declared separately for each class. Income and capital gain distributions are determined in accordance with income tax regulations, which may differ from GAAP.
Capital accounts within the financial statements are adjusted for permanent book-tax differences. These adjustments have no impact on net assets or the results of operations. Capital accounts are not adjusted for temporary book-tax differences which will reverse in a subsequent period.
Book-tax differences are primarily due to market discount, capital loss carryforwards and losses deferred due to wash sales.
As of period end, the cost and unrealized appreciation (depreciation) in securities, and derivatives if applicable, for federal income tax purposes were as follows:
| Gross unrealized appreciation | $3,507,324 |
| Gross unrealized depreciation | (2,690,556) |
| Net unrealized appreciation (depreciation) | $816,768 |
| Tax cost | $212,157,311 |
Capital loss carryforwards are only available to offset future capital gains of the Fund to the extent provided by regulations and may be limited. The capital loss carryforward information presented below, including any applicable limitation, is estimated as of prior fiscal period end and is subject to adjustment.
| No expiration | |
| Short-term | $(3,559,118) |
| Long-term | (10,776,600) |
| Total capital loss carryforward | $(14,335,718) |
Restricted Securities (including Private Placements). Funds may invest in securities that are subject to legal or contractual restrictions on resale. These securities generally may be resold in transactions exempt from registration or to the public if the securities are registered. Disposal of these securities may involve time-consuming negotiations and expense, and prompt sale at an acceptable price may be difficult. Information regarding restricted securities held at period end is included at the end of the Schedule of Investments, if applicable.
Loans and Other Direct Debt Instruments. Direct debt instruments are interests in amounts owed to lenders by corporate or other borrowers. These instruments may be in the form of loans, trade claims or other receivables and may include standby financing commitments such as revolving credit facilities that obligate a fund to supply additional cash to the borrower on demand. Loans may be acquired through assignment, participation, or may be made directly to a borrower. Such instruments are presented in the Bank Loan Obligations section in the Schedule of Investments. Certain funds may also invest in unfunded loan commitments, which are contractual obligations for future funding. Information regarding unfunded commitments is included at the end of the Schedule of Investments, if applicable.
New Accounting Pronouncement. In March 2020, the Financial Accounting Standards Board (FASB) issued an Accounting Standards Update (ASU), ASU 2020-04, which provides optional, temporary relief with respect to the financial reporting of contracts subject to certain types of modifications due to the planned discontinuation of the London Interbank Offered Rate (LIBOR) and other IBOR-based reference rates. The temporary relief provided by ASU 2020-04 is effective for certain reference rate-related contract modifications that occur during the period March 12, 2020 through December 31, 2022. Management is currently evaluating the potential impact of ASU 2020-04 to the financial statements.
4. Purchases and Sales of Investments.
Purchases and sales of securities, other than short-term securities and in-kind transactions, as applicable, are noted in the table below.
| | Purchases ($) | Sales ($) |
| VIP Floating Rate High Income Portfolio | 64,753,619 | 33,726,252 |
5. Fees and Other Transactions with Affiliates.
Management Fee. Fidelity Management & Research Company LLC (the investment adviser) and its affiliates provide the Fund with investment management related services for which the Fund pays a monthly management fee. The management fee is the sum of an individual fund fee rate that is based on an annual rate of .45% of the Fund's average net assets and an annualized group fee rate that averaged .10% during the period. The group fee rate is based upon the monthly average net assets of a group of registered investment companies with which the investment adviser has management contracts. The group fee rate decreases as assets under management increase and increases as assets under management decrease. For the reporting period, the total annualized management fee rate was .55% of the Fund's average net assets.
Transfer Agent Fees. Fidelity Investments Institutional Operations Company LLC (FIIOC), an affiliate of the investment adviser, is the Fund's transfer, dividend disbursing, and shareholder servicing agent. FIIOC receives an asset-based fee with respect to each class. Each class pays a fee for transfer agent services, typesetting and printing and mailing of shareholder reports, excluding mailing of proxy statements. For the period, transfer agent fees for each class were as follows:
| | Amount | % of Class-Level Average Net Assets(a) |
| Initial Class | $2,787 | .07 |
| Investor Class | 89,199 | .10 |
| | $91,986 | |
(a) Annualized
Accounting Fees. Fidelity Service Company, Inc. (FSC), an affiliate of the investment adviser, maintains the Fund's accounting records. The accounting fee is based on the level of average net assets for each month. For the period, the fees were equivalent to the following annualized rates:
| | % of Average Net Assets |
| VIP Floating Rate High Income Portfolio | .05 |
Brokerage Commissions. A portion of portfolio transactions were placed with brokerage firms which are affiliates of the investment adviser. Brokerage commissions are included in net realized gain (loss) and change in net unrealized appreciation (depreciation) in the Statement of Operations. The commissions paid to these affiliated firms were as follows:
| | Amount |
| VIP Floating Rate High Income Portfolio | $28 |
Interfund Trades. Funds may purchase from or sell securities to other Fidelity Funds under procedures adopted by the Board. The procedures have been designed to ensure these interfund trades are executed in accordance with Rule 17a-7 of the 1940 Act. Any interfund trades are included within the respective purchases and sales amounts shown in the Purchases and Sales of Investments note and are noted in the table below.
| | Purchases ($) | Sales ($) |
| VIP Floating Rate High Income Portfolio | – | 14,415 |
6. Committed Line of Credit.
Certain Funds participate with other funds managed by the investment adviser or an affiliate in a $4.25 billion credit facility (the "line of credit") to be utilized for temporary or emergency purposes to fund shareholder redemptions or for other short-term liquidity purposes. The participating funds have agreed to pay commitment fees on their pro-rata portion of the line of credit, which are reflected in Miscellaneous expenses on the Statement of Operations, and are listed below. During the period, there were no borrowings on this line of credit.
| | Amount |
| VIP Floating Rate High Income Portfolio | $171 |
7. Expense Reductions.
Commissions paid to certain brokers with whom the investment adviser, or its affiliates, places trades on behalf of the Fund include an amount in addition to trade execution, which may be rebated back to the Fund to offset expenses. This amount totaled $54 for the period. In addition, through arrangements with the Fund's custodian, credits realized as a result of certain uninvested cash balances were used to reduce the Fund's expenses. During the period, custodian credits reduced the Fund's expenses by $112.
In addition, during the period the investment adviser or an affiliate reimbursed and/or waived a portion of fund-level operating expenses in the amount of $169.
8. Distributions to Shareholders.
Distributions to shareholders of each class were as follows:
| | Six months ended
June 30, 2021 | Year ended
December 31, 2020 |
| VIP Floating Rate High Income Portfolio | | |
| Distributions to shareholders | | |
| Initial Class | $27,646 | $390,895 |
| Investor Class | 565,972 | 8,025,440 |
| Total | $593,618 | $8,416,335 |
9. Share Transactions.
Transactions for each class of shares were as follows and may contain in-kind transactions:
| | Shares | Shares | Dollars | Dollars |
| | Six months ended June 30, 2021 | Year ended December 31, 2020 | Six months ended June 30, 2021 | Year ended December 31, 2020 |
| VIP Floating Rate High Income Portfolio | | | | |
| Initial Class | | | | |
| Shares sold | 372,639 | 250,158 | $3,655,300 | $2,383,482 |
| Reinvestment of distributions | 2,833 | 40,656 | 27,646 | 390,895 |
| Shares redeemed | (347,725) | (742,517) | (3,415,423) | (6,787,110) |
| Net increase (decrease) | 27,747 | (451,703) | $267,523 | $(4,012,733) |
| Investor Class | | | | |
| Shares sold | 3,743,895 | 1,995,709 | $36,845,386 | $19,338,394 |
| Reinvestment of distributions | 57,962 | 835,197 | 565,704 | 8,021,841 |
| Shares redeemed | (942,752) | (11,929,851) | (9,257,860) | (107,323,574) |
| Net increase (decrease) | 2,859,105 | (9,098,945) | $28,153,230 | $(79,963,339) |
10. Other.
Fund's organizational documents provide former and current trustees and officers with a limited indemnification against liabilities arising in connection with the performance of their duties to the fund. In the normal course of business, the fund may also enter into contracts that provide general indemnifications. The fund's maximum exposure under these arrangements is unknown as this would be dependent on future claims that may be made against the fund. The risk of material loss from such claims is considered remote.
At the end of the period, the investment adviser or its affiliates were owners of record of more than 10% of the outstanding shares as follows:
| Fund | Affiliated % |
| VIP: Floating Rate High Income Portfolio | 100% |
11. Coronavirus (COVID-19) Pandemic.
An outbreak of COVID-19 first detected in China during December 2019 has since spread globally and was declared a pandemic by the World Health Organization during March 2020. Developments that disrupt global economies and financial markets, such as the COVID-19 pandemic, may magnify factors that affect the Fund's performance.
Shareholder Expense Example
As a shareholder, you incur two types of costs: (1) transaction costs, which may include sales charges (loads) on purchase payments or redemption proceeds, as applicable and (2) ongoing costs, which generally include management fees, distribution and/or service (12b-1) fees and other Fund expenses. This Example is intended to help you understand your ongoing costs (in dollars) of investing in a fund and to compare these costs with the ongoing costs of investing in other mutual funds.
The Example is based on an investment of $1,000 invested at the beginning of the period and held for the entire period (January 1, 2021 to June 30, 2021).
Actual Expenses
The first line of the accompanying table provides information about actual account values and actual expenses. You may use the information in this line, together with the amount you invested, to estimate the expenses that you paid over the period. Simply divide your account value by $1,000.00 (for example, an $8,600 account value divided by $1,000.00 = 8.6), then multiply the result by the number in the first line for a class/Fund under the heading entitled "Expenses Paid During Period" to estimate the expenses you paid on your account during this period. If any fund is a shareholder of any underlying mutual funds or exchange-traded funds (ETFs) (the Underlying Funds), such fund indirectly bears its proportional share of the expenses of the Underlying Funds in addition to the direct expenses incurred presented in the table. These fees and expenses are not included in the annualized expense ratio used to calculate the expense estimate in the table below. The estimate of expenses does not include any fees or other expenses of any variable annuity or variable life insurance product. If they were, the estimate of expenses you paid during the period would be higher, and your ending account value would be lower.
Hypothetical Example for Comparison Purposes
The second line of the accompanying table provides information about hypothetical account values and hypothetical expenses based on the actual expense ratio and an assumed rate of return of 5% per year before expenses, which is not the actual return. The hypothetical account values and expenses may not be used to estimate the actual ending account balance or expenses you paid for the period. You may use this information to compare the ongoing costs of investing in the Fund and other funds. To do so, compare this 5% hypothetical example with the 5% hypothetical examples that appear in the shareholder reports of the other funds. If any fund is a shareholder of any Underlying Funds, such fund indirectly bears its proportional share of the expenses of the Underlying Funds in addition to the direct expenses as presented in the table. These fees and expenses are not included in the annualized expense ratio used to calculate the expense estimate in the table below. The estimate of expenses does not include any fees or other expenses of any variable annuity or variable life insurance product. If they were, the estimate of expenses you paid during the period would be higher, and your ending account value would be lower.
Please note that the expenses shown in the table are meant to highlight your ongoing costs only and do not reflect any transaction costs. Therefore, the second line of the table is useful in comparing ongoing costs only, and will not help you determine the relative total costs of owning different funds.
| | Annualized Expense Ratio-A | Beginning
Account Value
January 1, 2021 | Ending
Account Value
June 30, 2021 | Expenses Paid
During Period-B
January 1, 2021
to June 30, 2021 |
| VIP Floating Rate High Income Portfolio | | | | |
| Initial Class | .72% | | | |
| Actual | | $1,000.00 | $1,033.60 | $3.63 |
| Hypothetical-C | | $1,000.00 | $1,021.22 | $3.61 |
| Investor Class | .75% | | | |
| Actual | | $1,000.00 | $1,032.60 | $3.78 |
| Hypothetical-C | | $1,000.00 | $1,021.08 | $3.76 |
A Annualized expense ratio reflects expenses net of applicable fee waivers.
B Expenses are equal to the annualized expense ratio, multiplied by the average account value over the period, multiplied by 181/ 365 (to reflect the one-half year period). The fees and expenses of any Underlying Funds are not included in each annualized expense ratio.
C 5% return per year before expenses
Board Approval of Investment Advisory Contracts and Management Fees
VIP Floating Rate High Income Portfolio
Each year, the Board of Trustees, including the Independent Trustees (together, the Board), votes on the renewal of the management contract with Fidelity Management & Research Company LLC (FMR) and the sub-advisory agreements (together, the Advisory Contracts) for the fund. FMR and the sub-advisers are referred to herein as the Investment Advisers. The Board, assisted by the advice of fund counsel and Independent Trustees' counsel, requests and considers a broad range of information relevant to the renewal of the Advisory Contracts throughout the year.
The Board meets regularly and, at each of its meetings, covers an extensive agenda of topics and materials and considers factors that are relevant to its annual consideration of the renewal of the fund's Advisory Contracts, including the services and support provided to the fund and its shareholders. The Board has established various standing committees (Committees), each composed of and chaired by Independent Trustees with varying backgrounds, to which the Board has assigned specific subject matter responsibilities in order to enhance effective decision-making by the Board. The Board, acting directly and through its Committees, requests and receives information concerning the annual consideration of the renewal of the fund's Advisory Contracts. The Board also meets as needed to review matters specifically related to the Board's annual consideration of the renewal of the Advisory Contracts. Members of the Board may also meet with trustees of other Fidelity funds through joint ad hoc committees to discuss certain matters relevant to all of the Fidelity funds.
Approval of Stub Period Continuation. At its January 2021 meeting, the Board of Trustees voted to continue the fund's management contract with FMR, and the sub-advisory agreements and sub-subadvisory agreements, in each case, where applicable (together, the Advisory Contracts), without modification, for four months from February 1, 2021 through May 31, 2021, in connection with changes to the Board's meeting calendar. The Board considered that the approval of the fund's Advisory Contracts will not result in any changes in (i) the investment process or strategies employed in the management of the fund's assets; (ii) the fees and expenses paid by shareholders; (iii) the nature, extent or quality of services provided under the fund's Advisory Contracts; or (iv) the day-to-day management of the fund or the persons primarily responsible for such management. The Board also considered that since its last approval of the fund's Advisory Contracts, FMR had provided additional information on the fund in support of the annual contract renewal process, including competitive analyses on total expenses and management fees and in-depth reviews of fund performance and fund profitability information. The Board also considered the findings of certain ad hoc committees that had been previously formed to discuss matters relevant to all of the Fidelity funds, including economies of scale, fall-out benefits and retail vs. institutional funds. The Board concluded that the fund's Advisory Contracts are fair and reasonable, and that the fund's Advisory Contracts should be renewed, without modification, through May 31, 2021, with the understanding that the Board will consider the annual renewal for a full one year period in May 2021.
At its May 2021 meeting, the Board unanimously determined to renew the fund's Advisory Contracts. In reaching its determination, the Board considered all factors it believed relevant, including (i) the nature, extent, and quality of the services provided to the fund and its shareholders (including the investment performance of the fund); (ii) the competitiveness of the fund's management fee and total expense ratio relative to peer funds; (iii) the total costs of the services provided by and the profits realized by Fidelity from its relationships with the fund; and (iv) the extent to which, if any, economies of scale exist and are realized as the fund grows, and whether any economies of scale are appropriately shared with fund shareholders.
In considering whether to renew the Advisory Contracts for the fund, the Board reached a determination, with the assistance of fund counsel and Independent Trustees' counsel and through the exercise of its business judgment, that the renewal of the Advisory Contracts was in the best interests of the fund and its shareholders and that the compensation payable under the Advisory Contracts was fair and reasonable. The Board's decision to renew the Advisory Contracts was not based on any single factor, but rather was based on a comprehensive consideration of all the information provided to the Board at its meetings throughout the year. The Board, in reaching its determination to renew the Advisory Contracts, was aware that shareholders of the fund have a broad range of investment choices available to them, including a wide choice among funds offered by Fidelity's competitors, and that the fund's shareholders, who have the opportunity to review and weigh the disclosure provided by the fund in its prospectus and other public disclosures, have chosen to invest in this fund, which is part of the Fidelity family of funds.
Nature, Extent, and Quality of Services Provided. The Board considered Fidelity's staffing as it relates to the fund, including the backgrounds of investment personnel of Fidelity, and also considered the fund's investment objective, strategies, and related investment philosophy. The Independent Trustees also had discussions with senior management of Fidelity's investment operations and investment groups. The Board considered the structure of the investment personnel compensation program and whether this structure provides appropriate incentives to act in the best interests of the fund. Additionally, the Board considered the portfolio managers' investments, if any, in the funds that they manage.
Resources Dedicated to Investment Management and Support Services. The Board and the Fund Oversight and Research Committees reviewed the general qualifications and capabilities of Fidelity's investment staff, including its size, education, experience, and resources, as well as Fidelity's approach to recruiting, training, managing, and compensating investment personnel. The Board noted that Fidelity has continued to increase the resources devoted to non-U.S. offices, including expansion of Fidelity's global investment organization. The Board also noted that Fidelity's analysts have extensive resources, tools and capabilities that allow them to conduct sophisticated quantitative and fundamental analysis, as well as credit analysis of issuers, counterparties and guarantors. Further, the Board considered that Fidelity's investment professionals have sufficient access to global information and data so as to provide competitive investment results over time, and that those professionals also have access to sophisticated tools that permit them to assess portfolio construction and risk and performance attribution characteristics continuously, as well as to transmit new information and research conclusions rapidly around the world. Additionally, in its deliberations, the Board considered Fidelity's trading, risk management, compliance, and technology and operations capabilities and resources, which are integral parts of the investment management process. The Board also considered Fidelity's investments in business continuity planning, and its success in continuously providing services to the fund notwithstanding the severe disruptions caused by the COVID-19 pandemic.
Shareholder and Administrative Services. The Board considered (i) the nature, extent, quality, and cost of advisory, administrative, and shareholder services performed by the Investment Advisers and their affiliates under the Advisory Contracts and under separate agreements covering transfer agency, pricing and bookkeeping, and securities lending services for the fund; (ii) the nature and extent of the supervision of third party service providers, principally custodians, subcustodians, and pricing vendors; and (iii) the resources devoted to, and the record of compliance with, the fund's compliance policies and procedures. The Board also reviewed the allocation of fund brokerage, including allocations to brokers affiliated with the Investment Advisers, the use of brokerage commissions to pay fund expenses, and the use of "soft" commission dollars to pay for research services.
The Board noted that the growth of fund assets over time across the complex allows Fidelity to reinvest in the development of services designed to enhance the value and convenience of the Fidelity funds as investment vehicles. These services include 24-hour access to account information and market information over the Internet and through telephone representatives, investor education materials and asset allocation tools, and the expanded availability of Fidelity Investor Centers.
The Board noted that, in the past, it and the boards of certain other Fidelity funds had formed an ad hoc Committee on Transfer Agency Fees to review the variety of transfer agency fee structures throughout the industry and Fidelity's competitive positioning with respect to industry participants.
Investment in a Large Fund Family. The Board considered the benefits to shareholders of investing in a Fidelity fund, including the benefits of investing in a fund that is part of a large family of funds offering a variety of investment disciplines and providing a large variety of mutual fund investor services. The Board noted that Fidelity had taken, or had made recommendations that resulted in the Fidelity funds taking, a number of actions over the previous year that benefited particular funds, including: (i) continuing to dedicate additional resources to Fidelity's investment research process, which includes meetings with management of issuers of securities in which the funds invest, and to the support of the senior management team that oversees asset management; (ii) continuing efforts to enhance Fidelity's global research capabilities; (iii) launching new funds and ETFs with innovative structures, strategies and pricing and making other enhancements to meet client needs; (iv) launching new share classes of existing funds; (v) eliminating purchase minimums and broadening eligibility requirements for certain funds and share classes; (vi) approving the reduction in the holding period for the Class C to Class A conversion policy; (vii) reducing management fees and total expenses for certain target date funds and classes and index funds; (viii) lowering expenses for certain existing funds and classes by implementing or lowering expense caps; (ix) rationalizing product lines and gaining increased efficiencies from fund mergers, liquidations, and share class consolidations; (x) continuing to develop, acquire and implement systems and technology to improve services to the funds and shareholders, strengthen information security, and increase efficiency; and (xi) continuing to implement enhancements to further strengthen Fidelity's product line to increase investors' probability of success in achieving their investment goals, including retirement income goals.
Investment Performance. The Board considered whether the fund has operated in accordance with its investment objective, as well as its record of compliance with its investment restrictions and its performance history.
The Board took into account discussions that occur at Board meetings throughout the year with representatives of the Investment Advisers about fund investment performance. In this regard the Board noted that as part of regularly scheduled fund reviews and other reports to the Board on fund performance, the Board considers annualized return information for the fund for different time periods, measured against an appropriate securities market index (benchmark index) and an appropriate peer group of funds with similar objectives (peer group). In its evaluation of fund investment performance, the Board gave particular attention to information indicating changes in performance of certain Fidelity funds for specific time periods and discussed with the Investment Advisers the reasons for any overperformance or underperformance.
In addition to reviewing absolute and relative fund performance, the Independent Trustees periodically consider the appropriateness of fund performance metrics in evaluating the results achieved. In general, the Independent Trustees believe that fund performance should be evaluated based on net performance (after fees and expenses) of both the highest performing and lowest performing fund share classes, where applicable, compared to appropriate benchmark indices, over appropriate time periods that may include full market cycles, and compared to peer groups, as applicable, over the same periods, taking into account relevant factors including the following: general market conditions; issuer-specific information; and fund cash flows and other factors.
The Independent Trustees recognize that shareholders evaluate performance on a net basis over their own holding periods, for which one-, three-, and five-year periods are often used as a proxy. For this reason, the performance information reviewed by the Board also included net cumulative total return information for the fund and an appropriate benchmark index and peer group for the most recent one-, three-, and five-year periods ended September 30, 2020, as shown below. Returns are shown compared to the 25th percentile (top of box, 75% beaten) and 75th percentile (bottom of box, 25% beaten) of the peer universe.
VIP Floating Rate High Income Portfolio
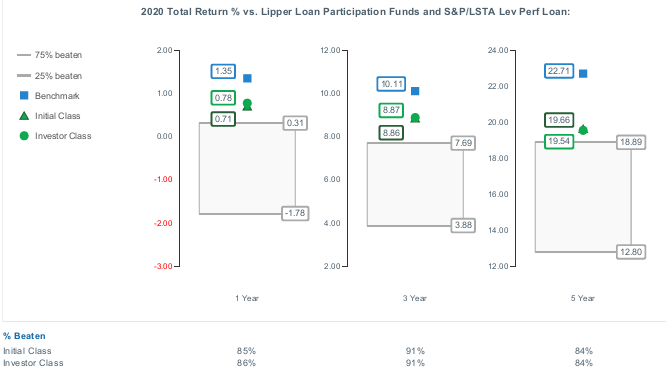
Based on its review, the Board concluded that the nature, extent, and quality of services provided to the fund under the Advisory Contracts should continue to benefit the shareholders of the fund.
Competitiveness of Management Fee and Total Expense Ratio. The Board considered the fund's management fee and total expense ratio compared to "mapped groups" of competitive funds and classes created for the purpose of facilitating the Trustees' competitive analysis of management fees and total expenses. Fidelity creates "mapped groups" by combining similar Lipper investment objective categories that have comparable investment mandates. Combining Lipper investment objective categories aids the Board's management fee and total expense ratio comparisons by broadening the competitive group used for comparison.
Management Fee. The Board considered two proprietary management fee comparisons for the 12-month (or shorter) periods ended September 30 (June 30 for periods ended 2019 and 2018 and December 31 for periods prior to 2018) shown in basis points (BP) in the chart below. The group of Lipper funds used by the Board for management fee comparisons is referred to below as the "Total Mapped Group." The Total Mapped Group is broader than the Lipper peer group used by the Board for performance comparisons because the Total Mapped Group combines several Lipper investment objective categories while the Lipper peer group does not. The Total Mapped Group comparison focuses on a fund's standing in terms of gross management fees before expense reimbursements or caps relative to the total universe of funds with comparable investment mandates, regardless of whether their management fee structures also are comparable. Funds with comparable investment mandates offer exposure to similar types of securities. Funds with comparable management fee structures have similar management fee contractual arrangements (
e.g., flat rate charged for advisory services, all-inclusive fee rate,
etc.). "TMG %" represents the percentage of funds in the Total Mapped Group that had management fees that were lower than the fund's. For example, a hypothetical TMG % of 20% would mean that 80% of the funds in the Total Mapped Group had higher, and 20% had lower, management fees than the fund. The fund's actual TMG %s and the number of funds in the Total Mapped Group are in the chart below. The "Asset-Sized Peer Group" (ASPG) comparison focuses on a fund's standing relative to a subset of non-Fidelity funds within the Total Mapped Group that are similar in size and management fee structure. For example, if a fund is in the first quartile of the ASPG, the fund's management fee ranks in the least expensive or lowest 25% of funds in the ASPG. The ASPG represents at least 15% of the funds in the Total Mapped Group with comparable asset size and management fee structures, subject to a minimum of 50 funds (or all funds in the Total Mapped Group if fewer than 50). Additional information, such as the ASPG quartile in which the fund's management fee rate ranked, is also included in the chart and was considered by the Board.
VIP Floating Rate High Income Portfolio
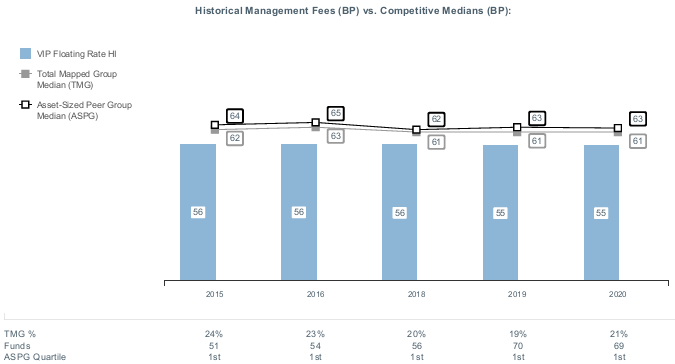
The Board noted that the fund's management fee rate ranked below the median of its Total Mapped Group and below the median of its ASPG for the 12-month period ending September 30, 2020.
The Board noted that, in the past, it and the boards of other Fidelity funds had formed an ad hoc Committee on Group Fee to conduct an in-depth review of the "group fee" component of the management fee of funds with such management fee structures. The Committee's focus included the mechanics of the group fee, the competitive landscape of group fee structures, Fidelity funds with no group fee component and investment products not included in group fee assets. The Board also considered that, for funds subject to the group fee, FMR agreed to voluntarily waive fees over a specified period of time in amounts designed to account for assets converted from certain funds to certain collective investment trusts.
The Board also noted that, in 2013, the ad hoc Committee on Management Fees was formed to conduct an in-depth review of the management fee rates of Fidelity's active equity mutual funds. The Committee focused on the following areas: (i) standard fee structures; (ii) research consumption and trading evolution; (iii) management fee competitiveness/profitability by category; and (iv) factors that drive institutional pricing.
Based on its review, the Board concluded that the fund's management fee is fair and reasonable in light of the services that the fund receives and the other factors considered.
Total Expense Ratio. In its review of each class's total expense ratio, the Board considered the fund's management fee rate as well as other fund or class expenses, as applicable, such as transfer agent fees, pricing and bookkeeping fees, and custodial, legal, and audit fees. The Board also noted that Fidelity may agree to waive fees or reimburse expenses from time to time, and the extent to which, if any, it has done so for the fund. As part of its review, the Board also considered the current and historical total expense ratios of each class of the fund compared to competitive fund median expenses. The fund's representative class is compared to those funds and classes in the Total Mapped Group (used by the Board for management fee comparisons) that have a similar sales load structure (SLTG). The Board also considered a total expense ASPG comparison for the representative class, which focuses on the total expenses of the representative class relative to a subset of non-Fidelity funds within the total expense SLTG. The total expense ASPG is limited to 15 larger and 15 smaller classes in fund average assets for a total of 30 classes, where possible. The total expense ASPG comparison excludes performance adjustments and fund-paid 12b-1 fees to eliminate variability in fee structures.
The Board noted that the total expense ratio of the Initial Class ranked below the SLTG competitive median and above the ASPG competitive median for the 12-month period ended September 30, 2020. The Board considered that, in general, various factors can affect total expense ratios. The Board also considered that the servicing component of the VIP universe differs by class for both VIP Fidelity and competitor classes and that the servicing component of Initial Class is split between the class-level and the annuity level whereas other competitor classes provide all servicing at the annuity level. The Board noted that the fund offers multiple classes and that the multiple structures are intended to offer pricing options for the intermediary market. The Board also noted that the total expense ratios of the classes vary primarily due to transfer agent fees.
The Board further considered that FMR has contractually agreed to reimburse Initial Class and Investor Class of the fund to the extent that total operating expenses, with certain exceptions, as a percentage of their respective average net assets, exceed 0.77% and 0.80% through April 30, 2022.
Fees Charged to Other Fidelity Clients. The Board also considered Fidelity fee structures and other information with respect to clients of Fidelity, such as other funds advised or subadvised by Fidelity, pension plan clients, and other institutional clients with similar mandates. The Board noted that a joint ad hoc committee created by it and the boards of other Fidelity funds periodically reviews and compares Fidelity's institutional investment advisory business with its business of providing services to the Fidelity funds and also noted the most recent findings of the committee. The Board noted that the committee's review included a consideration of the differences in services provided, fees charged, and costs incurred, as well as competition in the markets serving the different categories of clients.
Based on its review of total expense ratios and fees charged to other Fidelity clients, the Board concluded that the total expense ratio of each class of the fund was reasonable in light of the services that the fund and its shareholders receive and the other factors considered.
Costs of the Services and Profitability. The Board considered the revenues earned and the expenses incurred by Fidelity in conducting the business of developing, marketing, distributing, managing, administering and servicing the fund and servicing the fund's shareholders. The Board also considered the level of Fidelity's profits in respect of all the Fidelity funds.
On an annual basis, Fidelity presents to the Board information about the profitability of its relationships with the fund. Fidelity calculates profitability information for each fund, as well as aggregate profitability information for groups of Fidelity funds and all Fidelity funds, using a series of detailed revenue and cost allocation methodologies which originate with the books and records of Fidelity on which Fidelity's audited financial statements are based. The Audit Committee of the Board reviews any significant changes from the prior year's methodologies and the full Board approves such changes.
A public accounting firm has been engaged annually by the Board as part of the Board's assessment of Fidelity's profitability analysis. The engagement includes the review and assessment of the methodologies used by Fidelity in determining the revenues and expenses attributable to Fidelity's mutual fund business, and completion of agreed-upon procedures in respect of the mathematical accuracy of certain fund profitability information and its conformity to established allocation methodologies. After considering the reports issued under the engagement and information provided by Fidelity, the Board concluded that while other allocation methods may also be reasonable, Fidelity's profitability methodologies are reasonable in all material respects.
The Board also reviewed Fidelity's non-fund businesses and potential indirect benefits such businesses may have received as a result of their association with Fidelity's mutual fund business (i.e., fall-out benefits) as well as cases where Fidelity's affiliates may benefit from the funds' business. The Board considered areas where potential indirect benefits to the Fidelity funds from their relationships with Fidelity may exist. The Board also considered that in 2019 a joint ad hoc committee created by it and the boards of other Fidelity funds evaluated potential fall-out benefits (PFOB Committee). The Board noted that it considered the PFOB Committee's findings in connection with its consideration of the renewal of the Advisory Contracts.
The Board considered the costs of the services provided by and the profits realized by Fidelity in connection with the operation of the fund, including the conclusions of the PFOB Committee, and was satisfied that the profitability was not excessive.
Economies of Scale. The Board considered whether there have been economies of scale in respect of the management of the Fidelity funds, whether the Fidelity funds (including the fund) have appropriately benefited from any such economies of scale, and whether there is potential for realization of any further economies of scale. The Board considered the extent to which the fund will benefit from economies of scale as assets grow through increased services to the fund, through waivers or reimbursements, or through fee or expense ratio reductions. The Board also noted that a committee (the Economies of Scale Committee) created by it and the boards of other Fidelity funds periodically analyzes whether Fidelity attains economies of scale in respect of the management and servicing of the Fidelity funds, whether the Fidelity funds have appropriately benefited from such economies of scale, and whether there is potential for realization of any further economies of scale.
The Board recognized that the fund's management contract incorporates a "group fee" structure, which provides for lower group fee rates as total "group assets" increase, and for higher group fee rates as total "group assets" decrease ("group assets" as defined in the management contract). FMR calculates the group fee rates based on a tiered asset "breakpoint" schedule that varies based on asset class. The Board considered that the group fee is designed to deliver the benefits of economies of scale to fund shareholders when total Fidelity fund assets increase, even if assets of any particular fund are unchanged or have declined, because some portion of Fidelity's costs are attributable to services provided to all Fidelity funds, and all funds benefit if those costs can be allocated among more assets. The Board further considered that Fidelity agreed to impose a temporary fee waiver in the form of additional breakpoints to the current breakpoint schedule. The Board concluded that, given the group fee structure, fund shareholders will benefit from lower management fees as "group assets" increase at the fund complex level, regardless of whether Fidelity achieves any such economies of scale.
The Board concluded, taking into account the analysis of the Economies of Scale Committee, that economies of scale, if any, are being appropriately shared between fund shareholders and Fidelity.
Additional Information Requested by the Board. In order to develop fully the factual basis for consideration of the Fidelity funds' advisory contracts, the Board requested and received additional information on certain topics, including: (i) fund flow and performance trends, in particular the underperformance of certain funds and strategies, and Fidelity's long-term strategies for certain funds; (ii) consideration of expanding the use of performance fees for additional funds; (iii) Fidelity's pricing philosophy compared to competitors; (iv) metrics for evaluating index fund and ETF performance and information about ETF trading characteristics; (v) the methodology with respect to evaluating competitive fund data and peer group classifications and fee and expense comparisons; (vi) the expense structures for different funds and classes and information about the differences between various expense structures; (vii) group fee breakpoints; (viii) information regarding other accounts managed by Fidelity and sub-advisory arrangements; and (ix) Fidelity's philosophies and strategies for evaluating funds and classes with lower or declining asset levels.
Based on its evaluation of all of the conclusions noted above, and after considering all factors it believed relevant, the Board concluded that the advisory fee arrangements are fair and reasonable, and that the fund's Advisory Contracts should be renewed.
Liquidity Risk Management Program
The Securities and Exchange Commission adopted Rule 22e-4 under the Investment Company Act of 1940 (the Liquidity Rule) to promote effective liquidity risk management throughout the open-end investment company industry, thereby reducing the risk that funds will be unable to meet their redemption obligations and mitigating dilution of the interests of fund shareholders.
The Fund has adopted and implemented a liquidity risk management program pursuant to the Liquidity Rule (the Program) effective December 1, 2018. The Program is reasonably designed to assess and manage the Fund’s liquidity risk and to comply with the requirements of the Liquidity Rule. The Fund’s Board of Trustees (the Board) has designated the Fund’s investment adviser as administrator of the Program. The Fidelity advisers have established a Liquidity Risk Management Committee (the LRM Committee) to manage the Program for each of the Fidelity Funds. The LRM Committee monitors the adequacy and effectiveness of implementation of the Program and on a periodic basis assesses each Fund’s liquidity risk based on a variety of factors including (1) the Fund’s investment strategy, (2) portfolio liquidity and cash flow projections during normal and reasonably foreseeable stressed conditions, (3) shareholder redemptions, (4) borrowings and other funding sources and (5) in the case of exchange-traded funds, certain additional factors including the effect of the Fund’s prices and spreads, market participants, and basket compositions on the overall liquidity of the Fund’s portfolio, as applicable.
In accordance with the Program, each of the Fund’s portfolio investments is classified into one of four liquidity categories described below based on a determination of a reasonable expectation for how long it would take to convert the investment to cash (or sell or dispose of the investment) without significantly changing its market value.
- Highly liquid investments – cash or convertible to cash within three business days or less
- Moderately liquid investments – convertible to cash in three to seven calendar days
- Less liquid investments – can be sold or disposed of, but not settled, within seven calendar days
- Illiquid investments – cannot be sold or disposed of within seven calendar days
Liquidity classification determinations take into account a variety of factors including various market, trading and investment-specific considerations, as well as market depth, and generally utilize analysis from a third-party liquidity metrics service.
The Liquidity Rule places a 15% limit on a fund’s illiquid investments and requires funds that do not primarily hold assets that are highly liquid investments to determine and maintain a minimum percentage of the fund’s net assets to be invested in highly liquid investments (highly liquid investment minimum or HLIM). The Program includes provisions reasonably designed to comply with the 15% limit on illiquid investments and for determining, periodically reviewing and complying with the HLIM requirement as applicable.
At a recent meeting of the Fund’s Board of Trustees, the LRM Committee provided a written report to the Board pertaining to the operation, adequacy, and effectiveness of implementation of the Program for the annual period from December 1, 2019 through November 30, 2020. The report concluded that the Program has been implemented and is operating effectively and is reasonably designed to assess and manage the Fund’s liquidity risk.
VIPFHI-SANN-0821
1.9859332.107
Fidelity® Variable Insurance Products:
Growth Portfolio
Semi-Annual Report
June 30, 2021
Contents
To view a fund's proxy voting guidelines and proxy voting record for the 12-month period ended June 30, visit http://www.fidelity.com/proxyvotingresults or visit the Securities and Exchange Commission's (SEC) web site at http://www.sec.gov.
You may also call 1-877-208-0098 to request a free copy of the proxy voting guidelines.
Fidelity® Variable Insurance Products are separate account options which are purchased through a variable insurance contract.
Standard & Poor's, S&P and S&P 500 are registered service marks of The McGraw-Hill Companies, Inc. and have been licensed for use by Fidelity Distributors Corporation.
Other third-party marks appearing herein are the property of their respective owners.
All other marks appearing herein are registered or unregistered trademarks or service marks of FMR LLC or an affiliated company. © 2021 FMR LLC. All rights reserved.
This report and the financial statements contained herein are submitted for the general information of the shareholders of the Fund. This report is not authorized for distribution to prospective investors in the Fund unless preceded or accompanied by an effective prospectus.
A fund files its complete schedule of portfolio holdings with the SEC for the first and third quarters of each fiscal year on Form N-PORT. Forms N-PORT are available on the SEC’s web site at http://www.sec.gov. A fund's Forms N-PORT may be reviewed and copied at the SEC’s Public Reference Room in Washington, DC. Information regarding the operation of the SEC's Public Reference Room may be obtained by calling 1-800-SEC-0330.
For a complete list of a fund's portfolio holdings, view the most recent holdings listing, semiannual report, or annual report on Fidelity's web site at http://www.fidelity.com, http://www.institutional.fidelity.com, or http://www.401k.com, as applicable.
NOT FDIC INSURED •MAY LOSE VALUE •NO BANK GUARANTEE
Neither the Fund nor Fidelity Distributors Corporation is a bank.
Note to Shareholders:
Early in 2020, the outbreak and spread of a new coronavirus emerged as a public health emergency that had a major influence on financial markets, primarily based on its impact on the global economy and the outlook for corporate earnings. The virus causes a respiratory disease known as COVID-19. On March 11, 2020 the World Health Organization declared the COVID-19 outbreak a pandemic, citing sustained risk of further global spread.
In the weeks following, as the crisis worsened, we witnessed an escalating human tragedy with wide-scale social and economic consequences from coronavirus-containment measures. The outbreak of COVID-19 prompted a number of measures to limit the spread, including travel and border restrictions, quarantines, and restrictions on large gatherings. In turn, these resulted in lower consumer activity, diminished demand for a wide range of products and services, disruption in manufacturing and supply chains, and – given the wide variability in outcomes regarding the outbreak – significant market uncertainty and volatility. Amid the turmoil, global governments and central banks took unprecedented action to help support consumers, businesses, and the broader economies, and to limit disruption to financial systems.
The situation continues to unfold, and the extent and duration of its impact on financial markets and the economy remain highly uncertain. Extreme events such as the coronavirus crisis are “exogenous shocks” that can have significant adverse effects on mutual funds and their investments. Although multiple asset classes may be affected by market disruption, the duration and impact may not be the same for all types of assets.
Fidelity is committed to helping you stay informed amid news about COVID-19 and during increased market volatility, and we’re taking extra steps to be responsive to customer needs. We encourage you to visit our websites, where we offer ongoing updates, commentary, and analysis on the markets and our funds.
Investment Summary (Unaudited)
Top Ten Stocks as of June 30, 2021
| | % of fund's net assets |
| Microsoft Corp. | 9.5 |
| Alphabet, Inc. Class A | 9.0 |
| Amazon.com, Inc. | 5.6 |
| Apple, Inc. | 4.1 |
| UnitedHealth Group, Inc. | 3.8 |
| NVIDIA Corp. | 3.7 |
| Facebook, Inc. Class A | 3.4 |
| Adobe, Inc. | 3.2 |
| Qualcomm, Inc. | 2.2 |
| Tencent Holdings Ltd. | 1.8 |
| | 46.3 |
Top Five Market Sectors as of June 30, 2021
| | % of fund's net assets |
| Information Technology | 34.0 |
| Communication Services | 17.5 |
| Health Care | 14.8 |
| Industrials | 11.1 |
| Consumer Discretionary | 10.5 |
Asset Allocation (% of fund's net assets)
| As of June 30, 2021* |
| | Stocks | 99.7% |
| | Short-Term Investments and Net Other Assets (Liabilities) | 0.3% |

* Foreign investments - 18.4%
Schedule of Investments June 30, 2021 (Unaudited)
Showing Percentage of Net Assets
| Common Stocks - 99.4% | | | |
| | | Shares | Value |
| COMMUNICATION SERVICES - 17.5% | | | |
| Diversified Telecommunication Services - 0.9% | | | |
| Cellnex Telecom SA (a) | | 1,208,466 | $76,977,460 |
| Entertainment - 1.4% | | | |
| Take-Two Interactive Software, Inc. (b) | | 273,000 | 48,326,460 |
| Warner Music Group Corp. Class A | | 2,008,900 | 72,400,756 |
| | | | 120,727,216 |
| Interactive Media & Services - 14.7% | | | |
| Alphabet, Inc. Class A (b) | | 322,098 | 786,495,675 |
| Facebook, Inc. Class A (b) | | 863,809 | 300,355,027 |
| Snap, Inc. Class A (b) | | 191,700 | 13,062,438 |
| Tencent Holdings Ltd. | | 2,113,200 | 159,108,132 |
| Tongdao Liepin Group (b) | | 3,280,200 | 7,579,149 |
| Zoominfo Technologies, Inc. | | 399,300 | 20,831,481 |
| | | | 1,287,431,902 |
| Media - 0.5% | | | |
| Cable One, Inc. | | 26,300 | 50,306,903 |
|
| TOTAL COMMUNICATION SERVICES | | | 1,535,443,481 |
|
| CONSUMER DISCRETIONARY - 10.5% | | | |
| Automobiles - 0.5% | | | |
| Ferrari NV | | 210,900 | 43,455,945 |
| Diversified Consumer Services - 0.6% | | | |
| Laureate Education, Inc. Class A (b) | | 3,744,100 | 54,326,891 |
| Hotels, Restaurants & Leisure - 0.6% | | | |
| Airbnb, Inc. Class A | | 134,800 | 20,643,272 |
| Dalata Hotel Group PLC (b) | | 786,300 | 3,575,582 |
| Flutter Entertainment PLC (b) | | 152,600 | 27,747,988 |
| | | | 51,966,842 |
| Household Durables - 0.1% | | | |
| Blu Investments LLC (c)(d) | | 14,533,890 | 4,506 |
| D.R. Horton, Inc. | | 124,700 | 11,269,139 |
| | | | 11,273,645 |
| Internet & Direct Marketing Retail - 6.9% | | | |
| Alibaba Group Holding Ltd. sponsored ADR (b) | | 484,300 | 109,829,554 |
| Amazon.com, Inc. (b) | | 142,200 | 489,190,752 |
| Coupang, Inc. Class A (b)(e) | | 68,200 | 2,852,124 |
| Pinduoduo, Inc. ADR (b) | | 26,000 | 3,302,520 |
| | | | 605,174,950 |
| Multiline Retail - 0.1% | | | |
| Dollarama, Inc. | | 188,600 | 8,632,756 |
| Specialty Retail - 0.1% | | | |
| Aritzia LP (b) | | 157,900 | 4,723,243 |
| Mister Car Wash, Inc. | | 255,300 | 5,496,609 |
| | | | 10,219,852 |
| Textiles, Apparel & Luxury Goods - 1.6% | | | |
| LVMH Moet Hennessy Louis Vuitton SE | | 107,715 | 84,734,759 |
| Prada SpA | | 4,818,100 | 36,581,146 |
| Samsonite International SA (a)(b) | | 7,436,700 | 15,209,973 |
| | | | 136,525,878 |
|
| TOTAL CONSUMER DISCRETIONARY | | | 921,576,759 |
|
| CONSUMER STAPLES - 3.1% | | | |
| Beverages - 1.4% | | | |
| Fever-Tree Drinks PLC | | 1,059 | 37,692 |
| Kweichow Moutai Co. Ltd. (A Shares) | | 178,070 | 56,717,551 |
| Monster Beverage Corp. (b) | | 731,000 | 66,776,850 |
| | | | 123,532,093 |
| Household Products - 1.2% | | | |
| Energizer Holdings, Inc. | | 1,009,400 | 43,384,012 |
| Reckitt Benckiser Group PLC | | 475,526 | 42,012,824 |
| The Clorox Co. | | 116,100 | 20,887,551 |
| | | | 106,284,387 |
| Tobacco - 0.5% | | | |
| Swedish Match Co. AB | | 4,503,000 | 38,399,755 |
|
| TOTAL CONSUMER STAPLES | | | 268,216,235 |
|
| ENERGY - 1.3% | | | |
| Oil, Gas & Consumable Fuels - 1.3% | | | |
| Reliance Industries Ltd. | | 3,791,588 | 107,614,001 |
| Reliance Industries Ltd. | | 235,605 | 4,710,991 |
| | | | 112,324,992 |
| FINANCIALS - 4.1% | | | |
| Banks - 0.4% | | | |
| HDFC Bank Ltd. | | 234,578 | 4,724,997 |
| HDFC Bank Ltd. sponsored ADR (b) | | 431,200 | 31,529,344 |
| Metro Bank PLC (b)(e) | | 85,000 | 117,816 |
| | | | 36,372,157 |
| Capital Markets - 2.1% | | | |
| BlackRock, Inc. Class A | | 29,800 | 26,074,106 |
| CME Group, Inc. | | 348,497 | 74,118,342 |
| Franklin Resources, Inc. (e) | | 979,300 | 31,327,807 |
| JMP Group, Inc. (b) | | 238,900 | 1,464,457 |
| MSCI, Inc. | | 34,700 | 18,497,876 |
| S&P Global, Inc. | | 11,200 | 4,597,040 |
| T. Rowe Price Group, Inc. | | 130,900 | 25,914,273 |
| | | | 181,993,901 |
| Consumer Finance - 0.4% | | | |
| Capital One Financial Corp. | | 224,200 | 34,681,498 |
| Insurance - 1.2% | | | |
| American Financial Group, Inc. | | 318,000 | 39,660,960 |
| Arthur J. Gallagher & Co. | | 422,300 | 59,155,784 |
| BRP Group, Inc. (b) | | 140,900 | 3,754,985 |
| | | | 102,571,729 |
|
| TOTAL FINANCIALS | | | 355,619,285 |
|
| HEALTH CARE - 14.8% | | | |
| Biotechnology - 3.8% | | | |
| Adamas Pharmaceuticals, Inc. (b) | | 1,837,191 | 9,700,368 |
| Affimed NV (b) | | 594,887 | 5,056,540 |
| Alnylam Pharmaceuticals, Inc. (b) | | 84,700 | 14,358,344 |
| Applied Therapeutics, Inc. (b) | | 435,900 | 9,058,002 |
| Atara Biotherapeutics, Inc. (b) | | 410,500 | 6,383,275 |
| BioNTech SE ADR (b) | | 149,430 | 33,454,388 |
| CRISPR Therapeutics AG (b) | | 91,100 | 14,748,179 |
| Evelo Biosciences, Inc. (b) | | 60,600 | 832,644 |
| Exelixis, Inc. (b) | | 346,700 | 6,316,874 |
| Gamida Cell Ltd. (b) | | 1,674,200 | 10,731,622 |
| Hookipa Pharma, Inc. (b) | | 306,100 | 2,803,876 |
| Innovent Biologics, Inc. (a)(b) | | 1,085,000 | 12,653,652 |
| Insmed, Inc. (b) | | 953,283 | 27,130,434 |
| Prelude Therapeutics, Inc. | | 30,200 | 864,626 |
| Regeneron Pharmaceuticals, Inc. (b) | | 185,800 | 103,776,732 |
| Rubius Therapeutics, Inc. (b) | | 134,856 | 3,291,835 |
| Seres Therapeutics, Inc. (b) | | 170,000 | 4,054,500 |
| Synlogic, Inc. (b) | | 1,064,100 | 4,139,349 |
| Vertex Pharmaceuticals, Inc. (b) | | 237,698 | 47,927,048 |
| Vor Biopharma, Inc. (b) | | 500 | 9,325 |
| Vor Biopharma, Inc. | | 454,995 | 8,061,374 |
| XOMA Corp. (b) | | 234,200 | 7,962,800 |
| | | | 333,315,787 |
| Health Care Equipment & Supplies - 2.7% | | | |
| Axonics Modulation Technologies, Inc. (b) | | 222,500 | 14,108,725 |
| Danaher Corp. | | 262,326 | 70,397,805 |
| Edwards Lifesciences Corp. (b) | | 384,800 | 39,853,736 |
| Insulet Corp. (b) | | 3,200 | 878,432 |
| Intuitive Surgical, Inc. (b) | | 82,500 | 75,870,300 |
| Medacta Group SA (a)(b) | | 14,350 | 1,882,832 |
| Nevro Corp. (b) | | 53,500 | 8,869,765 |
| Outset Medical, Inc. | | 56,000 | 2,798,880 |
| Penumbra, Inc. (b) | | 61,200 | 16,772,472 |
| | | | 231,432,947 |
| Health Care Providers & Services - 4.3% | | | |
| Guardant Health, Inc. (b) | | 71,200 | 8,842,328 |
| HealthEquity, Inc. (b) | | 412,800 | 33,222,144 |
| UnitedHealth Group, Inc. | | 838,900 | 335,929,116 |
| | | | 377,993,588 |
| Health Care Technology - 0.9% | | | |
| agilon health, Inc. (b) | | 180,400 | 7,318,828 |
| Certara, Inc. | | 183,400 | 5,195,722 |
| Doximity, Inc. | | 14,500 | 843,900 |
| MultiPlan Corp. (c) | | 1,325,724 | 12,620,892 |
| MultiPlan Corp.: | | | |
| warrants (b)(c) | | 65,630 | 202,946 |
| Class A (b)(e) | | 315,200 | 3,000,704 |
| Schrodinger, Inc. (b) | | 93,100 | 7,039,291 |
| Simulations Plus, Inc. (e) | | 100,700 | 5,529,437 |
| Veeva Systems, Inc. Class A (b) | | 116,200 | 36,132,390 |
| | | | 77,884,110 |
| Life Sciences Tools & Services - 1.0% | | | |
| 10X Genomics, Inc. (b) | | 55,714 | 10,909,915 |
| Berkeley Lights, Inc. (b)(e) | | 174,400 | 7,814,864 |
| Bio-Techne Corp. | | 16,200 | 7,294,212 |
| Bruker Corp. | | 598,200 | 45,451,236 |
| Codexis, Inc. (b)(e) | | 505,700 | 11,459,162 |
| Nanostring Technologies, Inc. (b) | | 111,500 | 7,224,085 |
| Olink Holding AB ADR (b) | | 29,000 | 998,180 |
| | | | 91,151,654 |
| Pharmaceuticals - 2.1% | | | |
| Aclaris Therapeutics, Inc. (b) | | 257,100 | 4,514,676 |
| Eli Lilly & Co. | | 604,300 | 138,698,936 |
| Endo International PLC (b) | | 2,632,100 | 12,318,228 |
| Nuvation Bio, Inc. | | 326,843 | 2,890,763 |
| Revance Therapeutics, Inc. (b) | | 442,900 | 13,127,556 |
| Zoetis, Inc. Class A | | 46,500 | 8,665,740 |
| | | | 180,215,899 |
|
| TOTAL HEALTH CARE | | | 1,291,993,985 |
|
| INDUSTRIALS - 11.1% | | | |
| Aerospace & Defense - 1.7% | | | |
| Airbus Group NV (b) | | 557,300 | 71,809,690 |
| Axon Enterprise, Inc. (b) | | 98,300 | 17,379,440 |
| Northrop Grumman Corp. | | 57,800 | 21,006,254 |
| TransDigm Group, Inc. (b) | | 62,796 | 40,647,223 |
| | | | 150,842,607 |
| Airlines - 0.8% | | | |
| Ryanair Holdings PLC sponsored ADR (b) | | 617,600 | 66,830,496 |
| Building Products - 0.2% | | | |
| Builders FirstSource, Inc. (b) | | 349,475 | 14,908,604 |
| Fortune Brands Home & Security, Inc. | | 49,110 | 4,891,847 |
| | | | 19,800,451 |
| Construction & Engineering - 0.5% | | | |
| Fluor Corp. (b) | | 2,120,200 | 37,527,540 |
| Willscot Mobile Mini Holdings (b) | | 291,100 | 8,112,957 |
| | | | 45,640,497 |
| Electrical Equipment - 1.1% | | | |
| AMETEK, Inc. | | 3,420 | 456,570 |
| Ballard Power Systems, Inc. (b)(e) | | 30,600 | 554,472 |
| Bloom Energy Corp. Class A (b)(e) | | 153,100 | 4,113,797 |
| Ceres Power Holdings PLC (b) | | 572,100 | 8,364,949 |
| Eaton Corp. PLC | | 57,500 | 8,520,350 |
| Encore Wire Corp. | | 158,300 | 11,997,557 |
| Generac Holdings, Inc. (b) | | 153,200 | 63,600,980 |
| | | | 97,608,675 |
| Industrial Conglomerates - 1.5% | | | |
| General Electric Co. | | 9,697,600 | 130,529,696 |
| Machinery - 0.9% | | | |
| Ingersoll Rand, Inc. (b) | | 1,063,100 | 51,889,911 |
| Otis Worldwide Corp. | | 110,487 | 9,034,522 |
| Woodward, Inc. | | 184,200 | 22,634,496 |
| | | | 83,558,929 |
| Professional Services - 2.4% | | | |
| CACI International, Inc. Class A (b) | | 82,500 | 21,047,400 |
| Clarivate Analytics PLC (b) | | 799,800 | 22,018,494 |
| Equifax, Inc. | | 347,600 | 83,253,676 |
| KBR, Inc. | | 861,400 | 32,862,410 |
| Upwork, Inc. (b) | | 847,174 | 49,381,772 |
| | | | 208,563,752 |
| Road & Rail - 1.5% | | | |
| Canadian Pacific Railway Ltd. | | 329,900 | 25,372,609 |
| CSX Corp. | | 969,300 | 31,095,144 |
| Uber Technologies, Inc. (b) | | 1,446,740 | 72,510,609 |
| | | | 128,978,362 |
| Trading Companies & Distributors - 0.5% | | | |
| Ferguson PLC | | 293,500 | 40,802,854 |
|
| TOTAL INDUSTRIALS | | | 973,156,319 |
|
| INFORMATION TECHNOLOGY - 33.9% | | | |
| Electronic Equipment & Components - 0.4% | | | |
| Dolby Laboratories, Inc. Class A | | 185,300 | 18,213,137 |
| Hon Hai Precision Industry Co. Ltd. (Foxconn) | | 3,109,000 | 12,472,750 |
| Jabil, Inc. | | 52,709 | 3,063,447 |
| | | | 33,749,334 |
| IT Services - 3.1% | | | |
| Adyen BV (a)(b) | | 10,000 | 24,523,311 |
| Amadeus IT Holding SA Class A (b) | | 366,400 | 25,772,096 |
| Black Knight, Inc. (b) | | 339,434 | 26,469,063 |
| Edenred SA | | 2,710 | 154,403 |
| MasterCard, Inc. Class A | | 73,500 | 26,834,115 |
| MongoDB, Inc. Class A (b) | | 201,900 | 72,990,888 |
| Shopify, Inc. Class A (b) | | 27,400 | 40,071,505 |
| Square, Inc. (b) | | 175,700 | 42,835,660 |
| VeriSign, Inc. (b) | | 72,500 | 16,507,525 |
| | | | 276,158,566 |
| Semiconductors & Semiconductor Equipment - 8.3% | | | |
| Aixtron AG | | 732,900 | 19,857,477 |
| ASML Holding NV | | 103,100 | 71,225,604 |
| eMemory Technology, Inc. | | 64,000 | 3,060,446 |
| Enphase Energy, Inc. (b) | | 164,700 | 30,243,861 |
| MediaTek, Inc. | | 148,000 | 5,099,884 |
| NVIDIA Corp. | | 408,800 | 327,080,880 |
| Qualcomm, Inc. | | 1,358,700 | 194,198,991 |
| SiTime Corp. (b) | | 61,500 | 7,785,285 |
| SolarEdge Technologies, Inc. (b) | | 62,500 | 17,273,125 |
| Universal Display Corp. | | 214,300 | 47,645,319 |
| | | | 723,470,872 |
| Software - 17.2% | | | |
| Adobe, Inc. (b) | | 483,500 | 283,156,940 |
| Anaplan, Inc. (b) | | 114,500 | 6,102,850 |
| Autodesk, Inc. (b) | | 88,900 | 25,949,910 |
| Cloudflare, Inc. (b) | | 106,300 | 11,250,792 |
| Coupa Software, Inc. (b) | | 97,900 | 25,660,569 |
| CyberArk Software Ltd. (b) | | 310,200 | 40,409,754 |
| Datadog, Inc. Class A (b) | | 13,400 | 1,394,672 |
| Duck Creek Technologies, Inc. (b) | | 7,400 | 321,974 |
| Elastic NV (b) | | 5,300 | 772,528 |
| Epic Games, Inc. (c)(d) | | 5,869 | 5,194,065 |
| FireEye, Inc. (b) | | 4,607,300 | 93,159,606 |
| Intuit, Inc. | | 59,200 | 29,018,064 |
| Manhattan Associates, Inc. (b) | | 330,800 | 47,913,072 |
| Microsoft Corp. | | 3,080,500 | 834,507,453 |
| Palo Alto Networks, Inc. (b) | | 254,800 | 94,543,540 |
| SentinelOne, Inc. | | 38,600 | 1,640,500 |
| Volue A/S | | 862,200 | 4,976,840 |
| | | | 1,505,973,129 |
| Technology Hardware, Storage & Peripherals - 4.9% | | | |
| Apple, Inc. | | 2,629,500 | 360,136,320 |
| Samsung Electronics Co. Ltd. | | 944,270 | 67,435,919 |
| | | | 427,572,239 |
|
| TOTAL INFORMATION TECHNOLOGY | | | 2,966,924,140 |
|
| MATERIALS - 2.7% | | | |
| Chemicals - 2.5% | | | |
| Albemarle Corp. U.S. | | 365,600 | 61,588,976 |
| Axalta Coating Systems Ltd. (b) | | 375,800 | 11,458,142 |
| Corbion NV | | 117,600 | 6,721,210 |
| LG Chemical Ltd. | | 60,990 | 45,877,434 |
| Sherwin-Williams Co. | | 243,900 | 66,450,555 |
| The Chemours Co. LLC | | 760,100 | 26,451,480 |
| | | | 218,547,797 |
| Metals & Mining - 0.2% | | | |
| First Quantum Minerals Ltd. | | 406,900 | 9,378,132 |
| Lynas Rare Earths Ltd. (b) | | 402,708 | 1,724,482 |
| MP Materials Corp. (b)(e) | | 129,700 | 4,780,742 |
| | | | 15,883,356 |
|
| TOTAL MATERIALS | | | 234,431,153 |
|
| REAL ESTATE - 0.4% | | | |
| Equity Real Estate Investment Trusts (REITs) - 0.4% | | | |
| Equity Residential (SBI) | | 178,600 | 13,752,200 |
| Prologis (REIT), Inc. | | 147,200 | 17,594,816 |
| | | | 31,347,016 |
| UTILITIES - 0.0% | | | |
| Independent Power and Renewable Electricity Producers - 0.0% | | | |
| Brookfield Renewable Partners LP | | 107,000 | 4,126,990 |
| TOTAL COMMON STOCKS | | | |
| (Cost $4,652,753,065) | | | 8,695,160,355 |
|
| Convertible Preferred Stocks - 0.3% | | | |
| HEALTH CARE - 0.0% | | | |
| Biotechnology - 0.0% | | | |
| ElevateBio LLC Series C (c)(d) | | 198,400 | 832,288 |
| INFORMATION TECHNOLOGY - 0.1% | | | |
| IT Services - 0.0% | | | |
| AppNexus, Inc. Series E (Escrow) (b)(c)(d) | | 181,657 | 5,690 |
| Software - 0.1% | | | |
| ASAPP, Inc. Series C (c)(d) | | 654,971 | 4,320,909 |
|
| TOTAL INFORMATION TECHNOLOGY | | | 4,326,599 |
|
| MATERIALS - 0.2% | | | |
| Metals & Mining - 0.2% | | | |
| Illuminated Holdings, Inc.: | | | |
| Series C2 (c)(d) | | 137,249 | 5,929,157 |
| Series C3 (c)(d) | | 171,560 | 7,411,392 |
| Series C4 (c)(d) | | 48,240 | 2,083,968 |
| Series C5 (c)(d) | | 96,064 | 4,149,965 |
| | | | 19,574,482 |
| TOTAL CONVERTIBLE PREFERRED STOCKS | | | |
| (Cost $19,617,827) | | | 24,733,369 |
|
| Money Market Funds - 1.0% | | | |
| Fidelity Cash Central Fund 0.06% (f) | | 67,152,358 | 67,165,788 |
| Fidelity Securities Lending Cash Central Fund 0.06% (f)(g) | | 19,001,178 | 19,003,078 |
| TOTAL MONEY MARKET FUNDS | | | |
| (Cost $86,168,866) | | | 86,168,866 |
| TOTAL INVESTMENT IN SECURITIES - 100.7% | | | |
| (Cost $4,758,539,758) | | | 8,806,062,590 |
| NET OTHER ASSETS (LIABILITIES) - (0.7)% | | | (56,961,976) |
| NET ASSETS - 100% | | | $8,749,100,614 |
Legend
(a) Security exempt from registration under Rule 144A of the Securities Act of 1933. These securities may be resold in transactions exempt from registration, normally to qualified institutional buyers. At the end of the period, the value of these securities amounted to $131,247,228 or 1.5% of net assets.
(b) Non-income producing
(c) Restricted securities (including private placements) - Investment in securities not registered under the Securities Act of 1933 (excluding 144A issues). At the end of the period, the value of restricted securities (excluding 144A issues) amounted to $42,755,778 or 0.5% of net assets.
(d) Level 3 security
(e) Security or a portion of the security is on loan at period end.
(f) Affiliated fund that is generally available only to investment companies and other accounts managed by Fidelity Investments. The rate quoted is the annualized seven-day yield of the fund at period end. A complete unaudited listing of the fund's holdings as of its most recent quarter end is available upon request. In addition, each Fidelity Central Fund's financial statements are available on the SEC's website or upon request.
(g) Investment made with cash collateral received from securities on loan.
Additional information on each restricted holding is as follows:
| Security | Acquisition Date | Acquisition Cost |
| AppNexus, Inc. Series E (Escrow) | 8/1/14 | $0 |
| ASAPP, Inc. Series C | 4/30/21 | $4,320,909 |
| Blu Investments LLC | 5/21/20 | $25,138 |
| ElevateBio LLC Series C | 3/9/21 | $832,288 |
| Epic Games, Inc. | 3/29/21 | $5,194,065 |
| Illuminated Holdings, Inc. Series C2 | 7/7/20 | $3,431,225 |
| Illuminated Holdings, Inc. Series C3 | 7/7/20 | $5,146,800 |
| Illuminated Holdings, Inc. Series C4 | 1/8/21 | $1,736,640 |
| Illuminated Holdings, Inc. Series C5 | 6/16/21 | $4,149,965 |
| MultiPlan Corp. | 10/8/20 | $13,125,980 |
| MultiPlan Corp. warrants | 10/8/20 | $0 |
Affiliated Central Funds
Information regarding fiscal year to date income earned by the Fund from investments in Fidelity Central Funds is as follows:
| Fund | Income earned |
| Fidelity Cash Central Fund | $4,791 |
| Fidelity Securities Lending Cash Central Fund | 289,554 |
| Total | $294,345 |
Amounts in the income column in the above table include any capital gain distributions from underlying funds, which are presented in the corresponding line-item in the Statement of Operations, if applicable. Amount for Fidelity Securities Lending Cash Central Fund represents the income earned on investing cash collateral, less rebates paid to borrowers and any lending agent fees associated with the loan, plus any premium payments received for lending certain types of securities.
Fiscal year to date information regarding the Fund's investments in Fidelity Central Funds, including the ownership percentage, is presented below.
| Fund | Value, beginning of period | Purchases | Sales Proceeds | Realized Gain/Loss | Change in Unrealized appreciation (depreciation) | Value, end of period | % ownership, end of period |
| Fidelity Cash Central Fund 0.06% | $20,523,967 | $536,578,358 | $489,937,130 | $593 | $-- | $67,165,788 | 0.1% |
| Fidelity Securities Lending Cash Central Fund 0.06% | 54,822,440 | 172,188,916 | 208,008,278 | -- | -- | 19,003,078 | 0.1% |
| Total | $75,346,407 | $708,767,274 | $697,945,408 | $593 | $-- | $86,168,866 | |
Investment Valuation
The following is a summary of the inputs used, as of June 30, 2021, involving the Fund's assets and liabilities carried at fair value. The inputs or methodology used for valuing securities may not be an indication of the risk associated with investing in those securities. For more information on valuation inputs, and their aggregation into the levels used below, please refer to the Investment Valuation section in the accompanying Notes to Financial Statements.
| | Valuation Inputs at Reporting Date: |
| Description | Total | Level 1 | Level 2 | Level 3 |
| Investments in Securities: | | | | |
| Equities: | | | | |
| Communication Services | $1,535,443,481 | $1,376,335,349 | $159,108,132 | $-- |
| Consumer Discretionary | 921,576,759 | 836,837,494 | 84,734,759 | 4,506 |
| Consumer Staples | 268,216,235 | 226,203,411 | 42,012,824 | -- |
| Energy | 112,324,992 | 112,324,992 | -- | -- |
| Financials | 355,619,285 | 355,619,285 | -- | -- |
| Health Care | 1,292,826,273 | 1,280,838,902 | 11,155,083 | 832,288 |
| Industrials | 973,156,319 | 901,346,629 | 71,809,690 | -- |
| Information Technology | 2,971,250,739 | 2,937,206,764 | 24,523,311 | 9,520,664 |
| Materials | 254,005,635 | 234,431,153 | -- | 19,574,482 |
| Real Estate | 31,347,016 | 31,347,016 | -- | -- |
| Utilities | 4,126,990 | 4,126,990 | -- | -- |
| Money Market Funds | 86,168,866 | 86,168,866 | -- | -- |
| Total Investments in Securities: | $8,806,062,590 | $8,382,786,851 | $393,343,799 | $29,931,940 |
| Net unrealized depreciation on unfunded commitments | $( 1,844,019) | $-- | $(1,844,019) | $-- |
Other Information
Distribution of investments by country or territory of incorporation, as a percentage of Total Net Assets, is as follows (Unaudited):
| United States of America | 81.6% |
| Cayman Islands | 3.3% |
| Netherlands | 2.6% |
| India | 1.7% |
| Ireland | 1.4% |
| Korea (South) | 1.3% |
| Spain | 1.2% |
| France | 1.0% |
| Others (Individually Less Than 1%) | 5.9% |
| | 100.0% |
See accompanying notes which are an integral part of the financial statements.
Financial Statements
Statement of Assets and Liabilities
| | | June 30, 2021 (Unaudited) |
| Assets | | |
Investment in securities, at value (including securities loaned of $18,573,841) — See accompanying schedule:
Unaffiliated issuers (cost $4,672,370,892) | $8,719,893,724 | |
| Fidelity Central Funds (cost $86,168,866) | 86,168,866 | |
| Total Investment in Securities (cost $4,758,539,758) | | $8,806,062,590 |
| Foreign currency held at value (cost $151,654) | | 151,614 |
| Receivable for investments sold | | 14,931,711 |
| Receivable for fund shares sold | | 1,490,893 |
| Dividends receivable | | 2,566,615 |
| Distributions receivable from Fidelity Central Funds | | 8,920 |
| Other receivables | | 157,273 |
| Total assets | | 8,825,369,616 |
| Liabilities | | |
| Payable to custodian bank | $661,602 | |
| Payable for investments purchased | 32,077,148 | |
| Unrealized depreciation on unfunded commitments | 1,844,019 | |
| Payable for fund shares redeemed | 12,718,002 | |
| Accrued management fee | 3,762,236 | |
| Distribution and service plan fees payable | 460,232 | |
| Other affiliated payables | 617,149 | |
| Other payables and accrued expenses | 5,146,277 | |
| Collateral on securities loaned | 18,982,337 | |
| Total liabilities | | 76,269,002 |
| Net Assets | | $8,749,100,614 |
| Net Assets consist of: | | |
| Paid in capital | | $3,956,573,864 |
| Total accumulated earnings (loss) | | 4,792,526,750 |
| Net Assets | | $8,749,100,614 |
| Net Asset Value and Maximum Offering Price | | |
| Initial Class: | | |
| Net Asset Value, offering price and redemption price per share ($4,914,469,233 ÷ 47,408,783 shares) | | $103.66 |
| Service Class: | | |
| Net Asset Value, offering price and redemption price per share ($1,118,411,114 ÷ 10,862,001 shares) | | $102.97 |
| Service Class 2: | | |
| Net Asset Value, offering price and redemption price per share ($1,813,124,855 ÷ 17,983,912 shares) | | $100.82 |
| Investor Class: | | |
| Net Asset Value, offering price and redemption price per share ($903,095,412 ÷ 8,774,054 shares) | | $102.93 |
See accompanying notes which are an integral part of the financial statements.
Statement of Operations
| | | Six months ended June 30, 2021 (Unaudited) |
| Investment Income | | |
| Dividends | | $31,250,210 |
| Income from Fidelity Central Funds (including $289,554 from security lending) | | 294,345 |
| Total income | | 31,544,555 |
| Expenses | | |
| Management fee | $21,765,285 | |
| Transfer agent fees | 2,952,873 | |
| Distribution and service plan fees | 2,630,534 | |
| Accounting fees | 607,648 | |
| Custodian fees and expenses | 85,400 | |
| Independent trustees' fees and expenses | 13,713 | |
| Audit | 34,602 | |
| Legal | 9,405 | |
| Interest | 5,781 | |
| Miscellaneous | 20,709 | |
| Total expenses before reductions | 28,125,950 | |
| Expense reductions | (273,121) | |
| Total expenses after reductions | | 27,852,829 |
| Net investment income (loss) | | 3,691,726 |
| Realized and Unrealized Gain (Loss) | | |
| Net realized gain (loss) on: | | |
| Investment securities: | | |
| Unaffiliated issuers | 758,465,313 | |
| Fidelity Central Funds | 593 | |
| Foreign currency transactions | (173,727) | |
| Total net realized gain (loss) | | 758,292,179 |
| Change in net unrealized appreciation (depreciation) on: | | |
| Investment securities: | | |
| Unaffiliated issuers (net of increase in deferred foreign taxes of $47,392) | 295,163,381 | |
| Unfunded commitments | (1,844,019) | |
| Assets and liabilities in foreign currencies | (19,182) | |
| Total change in net unrealized appreciation (depreciation) | | 293,300,180 |
| Net gain (loss) | | 1,051,592,359 |
| Net increase (decrease) in net assets resulting from operations | | $1,055,284,085 |
See accompanying notes which are an integral part of the financial statements.
Statement of Changes in Net Assets
| | Six months ended June 30, 2021 (Unaudited) | Year ended December 31, 2020 |
| Increase (Decrease) in Net Assets | | |
| Operations | | |
| Net investment income (loss) | $3,691,726 | $(3,388,838) |
| Net realized gain (loss) | 758,292,179 | 1,050,340,232 |
| Change in net unrealized appreciation (depreciation) | 293,300,180 | 1,407,937,314 |
| Net increase (decrease) in net assets resulting from operations | 1,055,284,085 | 2,454,888,708 |
| Distributions to shareholders | (961,386,968) | (617,512,979) |
| Share transactions - net increase (decrease) | 723,480,826 | 176,892,682 |
| Total increase (decrease) in net assets | 817,377,943 | 2,014,268,411 |
| Net Assets | | |
| Beginning of period | 7,931,722,671 | 5,917,454,260 |
| End of period | $8,749,100,614 | $7,931,722,671 |
See accompanying notes which are an integral part of the financial statements.
Financial Highlights
VIP Growth Portfolio Initial Class
| | Six months ended (Unaudited) June 30, | Years endedDecember 31, | | | | |
| | 2021 | 2020 | 2019 | 2018 | 2017 | 2016 |
| Selected Per–Share Data | | | | | | |
| Net asset value, beginning of period | $103.00 | $79.09 | $63.12 | $74.05 | $59.31 | $65.75 |
| Income from Investment Operations | | | | | | |
| Net investment income (loss)A | .08 | .01 | .18 | .21 | .15 | .12 |
| Net realized and unrealized gain (loss) | 13.09 | 32.21 | 20.42 | (.25)B | 19.66 | (.48) |
| Total from investment operations | 13.17 | 32.22 | 20.60 | (.04) | 19.81 | (.36) |
| Distributions from net investment income | – | (.07) | (.19) | (.18) | (.15) | (.02) |
| Distributions from net realized gain | (12.51) | (8.25) | (4.44) | (10.72) | (4.92) | (6.06) |
| Total distributions | (12.51) | (8.31)C | (4.63) | (10.89)C | (5.07) | (6.08) |
| Net asset value, end of period | $103.66 | $103.00 | $79.09 | $63.12 | $74.05 | $59.31 |
| Total ReturnD,E,F | 13.60% | 43.89% | 34.31% | (.17)%B | 35.13% | .80% |
| Ratios to Average Net AssetsG,H | | | | | | |
| Expenses before reductions | .61%I | .62% | .63% | .63% | .64% | .64% |
| Expenses net of fee waivers, if any | .61%I | .62% | .62% | .63% | .64% | .64% |
| Expenses net of all reductions | .60%I | .61% | .62% | .62% | .63% | .64% |
| Net investment income (loss) | .16%I | .02% | .25% | .30% | .22% | .21% |
| Supplemental Data | | | | | | |
| Net assets, end of period (000 omitted) | $4,914,469 | $4,533,075 | $3,441,605 | $2,869,484 | $3,165,086 | $2,736,295 |
| Portfolio turnover rateJ | 51%I | 53% | 47% | 34% | 50% | 61% |
A Calculated based on average shares outstanding during the period.
B Net realized and unrealized gain (loss) per share reflects proceeds received from litigation which amounted to $.02 per share. Excluding these litigation proceeds, the total return would have been (.20) %
C Total distributions per share do not sum due to rounding.
D Total returns for periods of less than one year are not annualized.
E Total returns do not reflect charges attributable to your insurance company's separate account. Inclusion of these charges would reduce the total returns shown.
F Total returns would have been lower if certain expenses had not been reduced during the applicable periods shown.
G Fees and expenses of any underlying mutual funds or exchange-traded funds (ETFs) are not included in the Fund's expense ratio. The Fund indirectly bears its proportionate share of these expenses. For additional expense information related to investments in Fidelity Central Funds, please refer to the "Investments in Fidelity Central Funds" note found in the Notes to Financial Statements section of the most recent Annual or Semi-Annual report.
H Expense ratios reflect operating expenses of the class. Expenses before reductions do not reflect amounts reimbursed, waived, or reduced through arrangements with the investment adviser, brokerage services, or other offset arrangements, if applicable, and do not represent the amount paid by the class during periods when reimbursements, waivers or reductions occur.
I Annualized
J Amount does not include the portfolio activity of any underlying mutual funds or exchange-traded funds (ETFs).
See accompanying notes which are an integral part of the financial statements.
VIP Growth Portfolio Service Class
| | Six months ended (Unaudited) June 30, | Years endedDecember 31, | | | | |
| | 2021 | 2020 | 2019 | 2018 | 2017 | 2016 |
| Selected Per–Share Data | | | | | | |
| Net asset value, beginning of period | $102.42 | $78.69 | $62.83 | $73.76 | $59.10 | $65.57 |
| Income from Investment Operations | | | | | | |
| Net investment income (loss)A | .03 | (.07) | .11 | .14 | .08 | .06 |
| Net realized and unrealized gain (loss) | 13.02 | 32.03 | 20.31 | (.25)B | 19.59 | (.47) |
| Total from investment operations | 13.05 | 31.96 | 20.42 | (.11) | 19.67 | (.41) |
| Distributions from net investment income | – | (.05) | (.12) | (.11) | (.09) | – |
| Distributions from net realized gain | (12.50) | (8.18) | (4.44) | (10.72) | (4.92) | (6.06) |
| Total distributions | (12.50) | (8.23) | (4.56) | (10.82)C | (5.01) | (6.06) |
| Net asset value, end of period | $102.97 | $102.42 | $78.69 | $62.83 | $73.76 | $59.10 |
| Total ReturnD,E,F | 13.54% | 43.77% | 34.17% | (.27)%B | 35.00% | .71% |
| Ratios to Average Net AssetsG,H | | | | | | |
| Expenses before reductions | .71%I | .72% | .73% | .73% | .74% | .74% |
| Expenses net of fee waivers, if any | .71%I | .72% | .72% | .73% | .74% | .74% |
| Expenses net of all reductions | .70%I | .71% | .72% | .72% | .73% | .74% |
| Net investment income (loss) | .06%I | (.08)% | .15% | .20% | .12% | .11% |
| Supplemental Data | | | | | | |
| Net assets, end of period (000 omitted) | $1,118,411 | $1,018,192 | $745,767 | $600,590 | $624,381 | $482,603 |
| Portfolio turnover rateJ | 51%I | 53% | 47% | 34% | 50% | 61% |
A Calculated based on average shares outstanding during the period.
B Net realized and unrealized gain (loss) per share reflects proceeds received from litigation which amounted to $.02 per share. Excluding these litigation proceeds, the total return would have been (.30) %
C Total distributions per share do not sum due to rounding.
D Total returns for periods of less than one year are not annualized.
E Total returns do not reflect charges attributable to your insurance company's separate account. Inclusion of these charges would reduce the total returns shown.
F Total returns would have been lower if certain expenses had not been reduced during the applicable periods shown.
G Fees and expenses of any underlying mutual funds or exchange-traded funds (ETFs) are not included in the Fund's expense ratio. The Fund indirectly bears its proportionate share of these expenses. For additional expense information related to investments in Fidelity Central Funds, please refer to the "Investments in Fidelity Central Funds" note found in the Notes to Financial Statements section of the most recent Annual or Semi-Annual report.
H Expense ratios reflect operating expenses of the class. Expenses before reductions do not reflect amounts reimbursed, waived, or reduced through arrangements with the investment adviser, brokerage services, or other offset arrangements, if applicable, and do not represent the amount paid by the class during periods when reimbursements, waivers or reductions occur.
I Annualized
J Amount does not include the portfolio activity of any underlying mutual funds or exchange-traded funds (ETFs).
See accompanying notes which are an integral part of the financial statements.
VIP Growth Portfolio Service Class 2
| | Six months ended (Unaudited) June 30, | Years endedDecember 31, | | | | |
| | 2021 | 2020 | 2019 | 2018 | 2017 | 2016 |
| Selected Per–Share Data | | | | | | |
| Net asset value, beginning of period | $100.58 | $77.43 | $61.91 | $72.86 | $58.44 | $65.01 |
| Income from Investment Operations | | | | | | |
| Net investment income (loss)A | (.04) | (.19) | –B | .03 | (.02) | (.03) |
| Net realized and unrealized gain (loss) | 12.76 | 31.46 | 20.00 | (.23)C | 19.36 | (.48) |
| Total from investment operations | 12.72 | 31.27 | 20.00 | (.20) | 19.34 | (.51) |
| Distributions from net investment income | – | (.04) | (.04) | (.03) | (.06) | – |
| Distributions from net realized gain | (12.48) | (8.08) | (4.44) | (10.72) | (4.86) | (6.06) |
| Total distributions | (12.48) | (8.12) | (4.48) | (10.75) | (4.92) | (6.06) |
| Net asset value, end of period | $100.82 | $100.58 | $77.43 | $61.91 | $72.86 | $58.44 |
| Total ReturnD,E,F | 13.45% | 43.55% | 33.98% | (.43)%C | 34.81% | .55% |
| Ratios to Average Net AssetsG,H | | | | | | |
| Expenses before reductions | .86%I | .87% | .88% | .88% | .89% | .89% |
| Expenses net of fee waivers, if any | .86%I | .87% | .87% | .88% | .89% | .89% |
| Expenses net of all reductions | .85%I | .86% | .87% | .87% | .88% | .89% |
| Net investment income (loss) | (.09)%I | (.23)% | - %J | .05% | (.03)% | (.04)% |
| Supplemental Data | | | | | | |
| Net assets, end of period (000 omitted) | $1,813,125 | $1,587,581 | $1,182,162 | $971,010 | $1,069,117 | $783,297 |
| Portfolio turnover rateK | 51%I | 53% | 47% | 34% | 50% | 61% |
A Calculated based on average shares outstanding during the period.
B Amount represents less than $.005 per share.
C Net realized and unrealized gain (loss) per share reflects proceeds received from litigation which amounted to $.02 per share. Excluding these litigation proceeds, the total return would have been (.46) %
D Total returns for periods of less than one year are not annualized.
E Total returns do not reflect charges attributable to your insurance company's separate account. Inclusion of these charges would reduce the total returns shown.
F Total returns would have been lower if certain expenses had not been reduced during the applicable periods shown.
G Fees and expenses of any underlying mutual funds or exchange-traded funds (ETFs) are not included in the Fund's expense ratio. The Fund indirectly bears its proportionate share of these expenses. For additional expense information related to investments in Fidelity Central Funds, please refer to the "Investments in Fidelity Central Funds" note found in the Notes to Financial Statements section of the most recent Annual or Semi-Annual report.
H Expense ratios reflect operating expenses of the class. Expenses before reductions do not reflect amounts reimbursed, waived, or reduced through arrangements with the investment adviser, brokerage services, or other offset arrangements, if applicable, and do not represent the amount paid by the class during periods when reimbursements, waivers or reductions occur.
I Annualized
J Amount represents less than .005%.
K Amount does not include the portfolio activity of any underlying mutual funds or exchange-traded funds (ETFs).
See accompanying notes which are an integral part of the financial statements.
VIP Growth Portfolio Investor Class
| | Six months ended (Unaudited) June 30, | Years endedDecember 31, | | | | |
| | 2021 | 2020 | 2019 | 2018 | 2017 | 2016 |
| Selected Per–Share Data | | | | | | |
| Net asset value, beginning of period | $102.38 | $78.66 | $62.81 | $73.73 | $59.08 | $65.55 |
| Income from Investment Operations | | | | | | |
| Net investment income (loss)A | .04 | (.05) | .12 | .15 | .10 | .07 |
| Net realized and unrealized gain (loss) | 13.01 | 32.02 | 20.30 | (.23)B | 19.58 | (.48) |
| Total from investment operations | 13.05 | 31.97 | 20.42 | (.08) | 19.68 | (.41) |
| Distributions from net investment income | – | (.06) | (.13) | (.12) | (.10) | – |
| Distributions from net realized gain | (12.50) | (8.20) | (4.44) | (10.72) | (4.92) | (6.06) |
| Total distributions | (12.50) | (8.25)C | (4.57) | (10.84) | (5.03)C | (6.06) |
| Net asset value, end of period | $102.93 | $102.38 | $78.66 | $62.81 | $73.73 | $59.08 |
| Total ReturnD,E,F | 13.55% | 43.80% | 34.18% | (.24)%B | 35.03% | .71% |
| Ratios to Average Net AssetsG,H | | | | | | |
| Expenses before reductions | .68%I | .70% | .70% | .71% | .72% | .73% |
| Expenses net of fee waivers, if any | .68%I | .70% | .70% | .71% | .72% | .72% |
| Expenses net of all reductions | .68%I | .69% | .70% | .70% | .71% | .72% |
| Net investment income (loss) | .08%I | (.06)% | .17% | .22% | .14% | .12% |
| Supplemental Data | | | | | | |
| Net assets, end of period (000 omitted) | $903,095 | $792,875 | $547,920 | $457,395 | $448,392 | $291,497 |
| Portfolio turnover rateJ | 51%I | 53% | 47% | 34% | 50% | 61% |
A Calculated based on average shares outstanding during the period.
B Net realized and unrealized gain (loss) per share reflects proceeds received from litigation which amounted to $.02 per share. Excluding these litigation proceeds, the total return would have been (.27) %
C Total distributions per share do not sum due to rounding.
D Total returns for periods of less than one year are not annualized.
E Total returns do not reflect charges attributable to your insurance company's separate account. Inclusion of these charges would reduce the total returns shown.
F Total returns would have been lower if certain expenses had not been reduced during the applicable periods shown.
G Fees and expenses of any underlying mutual funds or exchange-traded funds (ETFs) are not included in the Fund's expense ratio. The Fund indirectly bears its proportionate share of these expenses. For additional expense information related to investments in Fidelity Central Funds, please refer to the "Investments in Fidelity Central Funds" note found in the Notes to Financial Statements section of the most recent Annual or Semi-Annual report.
H Expense ratios reflect operating expenses of the class. Expenses before reductions do not reflect amounts reimbursed, waived, or reduced through arrangements with the investment adviser, brokerage services, or other offset arrangements, if applicable, and do not represent the amount paid by the class during periods when reimbursements, waivers or reductions occur.
I Annualized
J Amount does not include the portfolio activity of any underlying mutual funds or exchange-traded funds (ETFs).
See accompanying notes which are an integral part of the financial statements.
Notes to Financial Statements (Unaudited)
For the period ended June 30, 2021
1. Organization.
VIP Growth Portfolio (the Fund) is a fund of Variable Insurance Products Fund (the Trust) and is authorized to issue an unlimited number of shares. The Trust is registered under the Investment Company Act of 1940, as amended (the 1940 Act), as an open-end management investment company organized as a Massachusetts business trust. Shares of the Fund may only be purchased by insurance companies for the purpose of funding variable annuity or variable life insurance contracts. The Fund offers the following classes of shares: Initial Class shares, Service Class shares, Service Class 2 shares and Investor Class shares. All classes have equal rights and voting privileges, except for matters affecting a single class.
2. Investments in Fidelity Central Funds.
Funds may invest in Fidelity Central Funds, which are open-end investment companies generally available only to other investment companies and accounts managed by the investment adviser and its affiliates. The Schedule of Investments lists any Fidelity Central Funds held as an investment as of period end, but does not include the underlying holdings of each Fidelity Central Fund. An investing fund indirectly bears its proportionate share of the expenses of the underlying Fidelity Central Funds.
Based on its investment objective, each Fidelity Central Fund may invest or participate in various investment vehicles or strategies that are similar to those of the investing fund. These strategies are consistent with the investment objectives of the investing fund and may involve certain economic risks which may cause a decline in value of each of the Fidelity Central Funds and thus a decline in the value of the investing fund.
| Fidelity Central Fund | Investment Manager | Investment Objective | Investment Practices | Expense Ratio(a) |
| Fidelity Money Market Central Funds | Fidelity Management & Research Company LLC (FMR) | Each fund seeks to obtain a high level of current income consistent with the preservation of capital and liquidity. | Short-term Investments | Less than .005% to .01% |
(a) Expenses expressed as a percentage of average net assets and are as of each underlying Central Fund's most recent annual or semi-annual shareholder report.
A complete unaudited list of holdings for each Fidelity Central Fund is available upon request or at the Securities and Exchange Commission website at www.sec.gov. In addition, the financial statements of the Fidelity Central Funds which contain the significant accounting policies (including investment valuation policies) of those funds, and are not covered by the Report of Independent Registered Public Accounting Firm, are available on the Securities and Exchange Commission website or upon request.
3. Significant Accounting Policies.
The Fund is an investment company and applies the accounting and reporting guidance of the Financial Accounting Standards Board (FASB) Accounting Standards Codification Topic 946 Financial Services - Investment Companies. The financial statements have been prepared in conformity with accounting principles generally accepted in the United States of America (GAAP), which require management to make certain estimates and assumptions at the date of the financial statements. Actual results could differ from those estimates. Subsequent events, if any, through the date that the financial statements were issued have been evaluated in the preparation of the financial statements. The Fund's Schedule of Investments lists any underlying mutual funds or exchange-traded funds (ETFs) but does not include the underlying holdings of these funds. The following summarizes the significant accounting policies of the Fund:
Investment Valuation. Investments are valued as of 4:00 p.m. Eastern time on the last calendar day of the period. The Board of Trustees (the Board) has delegated the day to day responsibility for the valuation of the Fund's investments to the Fair Value Committee (the Committee) established by the Fund's investment adviser. In accordance with valuation policies and procedures approved by the Board, the Fund attempts to obtain prices from one or more third party pricing vendors or brokers to value its investments. When current market prices, quotations or currency exchange rates are not readily available or reliable, investments will be fair valued in good faith by the Committee, in accordance with procedures adopted by the Board. Factors used in determining fair value vary by investment type and may include market or investment specific events. The frequency with which these procedures are used cannot be predicted and they may be utilized to a significant extent. The Committee oversees the Fund's valuation policies and procedures and reports to the Board on the Committee's activities and fair value determinations. The Board monitors the appropriateness of the procedures used in valuing the Fund's investments and ratifies the fair value determinations of the Committee.
The Fund categorizes the inputs to valuation techniques used to value its investments into a disclosure hierarchy consisting of three levels as shown below:
- Level 1 – quoted prices in active markets for identical investments
- Level 2 – other significant observable inputs (including quoted prices for similar investments, interest rates, prepayment speeds, etc.)
- Level 3 – unobservable inputs (including the Fund's own assumptions based on the best information available)
Valuation techniques used to value the Fund's investments by major category are as follows:
Equity securities, including restricted securities, for which market quotations are readily available, are valued at the last reported sale price or official closing price as reported by a third party pricing vendor on the primary market or exchange on which they are traded and are categorized as Level 1 in the hierarchy. In the event there were no sales during the day or closing prices are not available, securities are valued at the last quoted bid price or may be valued using the last available price and are generally categorized as Level 2 in the hierarchy. For foreign equity securities, when market or security specific events arise, comparisons to the valuation of American Depositary Receipts (ADRs), futures contracts, Exchange-Traded Funds (ETFs) and certain indexes as well as quoted prices for similar securities may be used and would be categorized as Level 2 in the hierarchy. For equity securities, including restricted securities, where observable inputs are limited, assumptions about market activity and risk are used and these securities may be categorized as Level 3 in the hierarchy.
Investments in open-end mutual funds, including the Fidelity Central Funds, are valued at their closing net asset value (NAV) each business day and are categorized as Level 1 in the hierarchy.
Changes in valuation techniques may result in transfers in or out of an assigned level within the disclosure hierarchy. The aggregate value of investments by input level as of June 30, 2021 is included at the end of the Fund's Schedule of Investments.
Foreign Currency. Certain Funds may use foreign currency contracts to facilitate transactions in foreign-denominated securities. Gains and losses from these transactions may arise from changes in the value of the foreign currency or if the counterparties do not perform under the contracts' terms.
Foreign-denominated assets, including investment securities, and liabilities are translated into U.S. dollars at the exchange rates at period end. Purchases and sales of investment securities, income and dividends received, and expenses denominated in foreign currencies are translated into U.S. dollars at the exchange rate in effect on the transaction date.
The effects of exchange rate fluctuations on investments are included with the net realized and unrealized gain (loss) on investment securities. Other foreign currency transactions resulting in realized and unrealized gain (loss) are disclosed separately.
Investment Transactions and Income. For financial reporting purposes, the Fund's investment holdings and NAV include trades executed through the end of the last business day of the period. The NAV per share for processing shareholder transactions is calculated as of the close of business of the New York Stock Exchange (NYSE), normally 4:00 p.m. Eastern time and includes trades executed through the end of the prior business day. Gains and losses on securities sold are determined on the basis of identified cost and include proceeds received from litigation. Dividend income is recorded on the ex-dividend date, except for certain dividends from foreign securities where the ex-dividend date may have passed, which are recorded as soon as the Fund is informed of the ex-dividend date. Non-cash dividends included in dividend income, if any, are recorded at the fair market value of the securities received. Income and capital gain distributions from Fidelity Central Funds, if any, are recorded on the ex-dividend date. Certain distributions received by the Fund represent a return of capital or capital gain. The Fund determines the components of these distributions subsequent to the ex-dividend date, based upon receipt of tax filings or other correspondence relating to the underlying investment. These distributions are recorded as a reduction of cost of investments and/or as a realized gain. Investment income is recorded net of foreign taxes withheld where recovery of such taxes is uncertain.
Class Allocations and Expenses. Investment income, realized and unrealized capital gains and losses, common expenses of a fund, and certain fund-level expense reductions, if any, are allocated daily on a pro-rata basis to each class based on the relative net assets of each class to the total net assets of a fund. Each class differs with respect to transfer agent and distribution and service plan fees incurred, as applicable. Certain expense reductions may also differ by class, if applicable. For the reporting period, the allocated portion of income and expenses to each class as a percent of its average net assets may vary due to the timing of recording these transactions in relation to fluctuating net assets of the classes. Expenses directly attributable to a fund are charged to that fund. Expenses attributable to more than one fund are allocated among the respective funds on the basis of relative net assets or other appropriate methods. Expenses included in the accompanying financial statements reflect the expenses of that fund and do not include any expenses associated with any underlying mutual funds or exchange-traded funds. Although not included in a fund's expenses, a fund indirectly bears its proportionate share of these expenses through the net asset value of each underlying mutual fund or exchange-traded fund. Expense estimates are accrued in the period to which they relate and adjustments are made when actual amounts are known.
Deferred Trustee Compensation. Under a Deferred Compensation Plan (the Plan) for certain Funds, certain independent Trustees have elected to defer receipt of a portion of their annual compensation. Deferred amounts are invested in affiliated mutual funds, are marked-to-market and remain in a fund until distributed in accordance with the Plan. The investment of deferred amounts and the offsetting payable to the Trustees presented below are included in the accompanying Statement of Assets and Liabilities in other receivables and other payables and accrued expenses, as applicable.
| VIP Growth Portfolio | $58,703 |
Income Tax Information and Distributions to Shareholders. Each year, the Fund intends to qualify as a regulated investment company under Subchapter M of the Internal Revenue Code, including distributing substantially all of its taxable income and realized gains. As a result, no provision for U.S. Federal income taxes is required. The Fund files a U.S. federal tax return, in addition to state and local tax returns as required. The Fund's federal income tax returns are subject to examination by the Internal Revenue Service (IRS) for a period of three fiscal years after they are filed. State and local tax returns may be subject to examination for an additional fiscal year depending on the jurisdiction. Foreign taxes are provided for based on the Fund's understanding of the tax rules and rates that exist in the foreign markets in which it invests. The Fund is subject to a tax imposed on capital gains by certain countries in which it invests. An estimated deferred tax liability for net unrealized appreciation on the applicable securities is included in Other payables and accrued expenses on the Statement of Assets & Liabilities.
Distributions are declared and recorded on the ex-dividend date. Income and capital gain distributions are declared separately for each class. Income and capital gain distributions are determined in accordance with income tax regulations, which may differ from GAAP.
Capital accounts within the financial statements are adjusted for permanent book-tax differences. These adjustments have no impact on net assets or the results of operations. Capital accounts are not adjusted for temporary book-tax differences which will reverse in a subsequent period.
Book-tax differences are primarily due to foreign currency transactions, passive foreign investment companies (PFIC), partnerships (including allocations from Fidelity Central Funds), deferred Trustees compensation, net operating losses and losses deferred due to wash sales.
As of period end, the cost and unrealized appreciation (depreciation) in securities, and derivatives if applicable, for federal income tax purposes were as follows:
| Gross unrealized appreciation | $4,118,324,183 |
| Gross unrealized depreciation | (77,624,813) |
| Net unrealized appreciation (depreciation) | $4,040,699,370 |
| Tax cost | $4,763,519,201 |
Restricted Securities (including Private Placements). Funds may invest in securities that are subject to legal or contractual restrictions on resale. These securities generally may be resold in transactions exempt from registration or to the public if the securities are registered. Disposal of these securities may involve time-consuming negotiations and expense, and prompt sale at an acceptable price may be difficult. Information regarding restricted securities held at period end is included at the end of the Schedule of Investments, if applicable.
Special Purpose Acquisition Companies. Funds may invest in stock, warrants, and other securities of special purpose acquisition companies (SPACs) or similar special purpose entities. A SPAC is a publicly traded company that raises investment capital via an initial public offering (IPO) for the purpose of acquiring the equity securities of one or more existing companies via merger, business combination, acquisition or other similar transactions within a designated time frame.
Private Investment in Public Equity. Funds may acquire equity securities of an issuer through a private investment in a public equity (PIPE) transaction, including through commitments to purchase securities on a when-issued basis. A PIPE typically involves the purchase of securities directly from a publicly traded company in a private placement transaction. Securities purchased through PIPE transactions will be restricted from trading and considered illiquid until a resale registration statement for the shares is filed and declared effective.
At period end, the Fund had commitments to purchase when-issued securities through PIPE transactions with SPACs. The commitments are contingent upon the SPACs acquiring the securities of target companies. Unrealized appreciation (depreciation) on these commitments is separately presented in the Statements of Assets and Liabilities as Unrealized appreciation (depreciation) on unfunded commitments, and in the Statement of Operations as Change in unrealized appreciation (depreciation) on unfunded commitments.
4. Purchases and Sales of Investments.
Purchases and sales of securities, other than short-term securities and in-kind transactions, as applicable, are noted in the table below.
| | Purchases ($) | Sales ($) |
| VIP Growth Portfolio | 2,090,654,191 | 2,344,474,926 |
5. Fees and Other Transactions with Affiliates.
Management Fee. Fidelity Management & Research Company LLC (the investment adviser) and its affiliates provide the Fund with investment management related services for which the Fund pays a monthly management fee. The management fee is the sum of an individual fund fee rate that is based on an annual rate of .30% of the Fund's average net assets and an annualized group fee rate that averaged .23% during the period. The group fee rate is based upon the monthly average net assets of a group of registered investment companies with which the investment adviser has management contracts. The group fee rate decreases as assets under management increase and increases as assets under management decrease. For the reporting period, the total annualized management fee rate was .53% of the Fund's average net assets.
Distribution and Service Plan Fees. In accordance with Rule 12b-1 of the 1940 Act, the Fund has adopted separate 12b-1 Plans for each Service Class of shares. Each Service Class pays Fidelity Distributors Company LLC (FDC), an affiliate of the investment adviser, a service fee. For the period, the service fee is based on an annual rate of .10% of Service Class' average net assets and .25% of Service Class 2's average net assets.
For the period, total fees, all of which were re-allowed to insurance companies for the distribution of shares and providing shareholder support services, were as follows:
| Service Class | $530,302 |
| Service Class 2 | 2,100,232 |
| | $2,630,534 |
Transfer Agent Fees. Fidelity Investments Institutional Operations Company LLC (FIIOC), an affiliate of the investment adviser, is the Fund's transfer, dividend disbursing, and shareholder servicing agent. FIIOC receives an asset-based fee with respect to each class. Each class pays a fee for transfer agent services, typesetting and printing and mailing of shareholder reports, excluding mailing of proxy statements. For the period, transfer agent fees for each class were as follows:
| | Amount | % of Class-Level Average Net Assets(a) |
| Initial Class | $1,491,188 | .06 |
| Service Class | 337,070 | .06 |
| Service Class 2 | 534,038 | .06 |
| Investor Class | 590,577 | .14 |
| | $2,952,873 | |
(a) Annualized
Accounting Fees. Fidelity Service Company, Inc. (FSC), an affiliate of the investment adviser, maintains the Fund's accounting records. The accounting fee is based on the level of average net assets for each month. For the period, the fees were equivalent to the following annualized rates:
| | % of Average Net Assets |
| VIP Growth Portfolio | .01 |
Brokerage Commissions. A portion of portfolio transactions were placed with brokerage firms which are affiliates of the investment adviser. Brokerage commissions are included in net realized gain (loss) and change in net unrealized appreciation (depreciation) in the Statement of Operations. The commissions paid to these affiliated firms were as follows:
| | Amount |
| VIP Growth Portfolio | $36,798 |
Interfund Lending Program. Pursuant to an Exemptive Order issued by the Securities and Exchange Commission (the SEC), the Fund, along with other registered investment companies having management contracts with Fidelity Management & Research Company LLC (FMR), or other affiliated entities of FMR, may participate in an interfund lending program. This program provides an alternative credit facility allowing the Fund to borrow from, or lend money to, other participating affiliated funds. At period end, there were no interfund loans outstanding. Activity in this program during the period for which loans were outstanding was as follows:
| | Borrower or Lender | Average Loan Balance | Weighted Average Interest Rate | Interest Expense |
| VIP Growth Portfolio | Borrower | $13,628,980 | .31% | $5,781 |
Interfund Trades. Funds may purchase from or sell securities to other Fidelity Funds under procedures adopted by the Board. The procedures have been designed to ensure these interfund trades are executed in accordance with Rule 17a-7 of the 1940 Act. Any interfund trades are included within the respective purchases and sales amounts shown in the Purchases and Sales of Investments note and are noted in the table below.
| | Purchases ($) | Sales ($) |
| VIP Growth Portfolio | 95,551,025 | 140,271,502 |
6. Committed Line of Credit.
Certain Funds participate with other funds managed by the investment adviser or an affiliate in a $4.25 billion credit facility (the "line of credit") to be utilized for temporary or emergency purposes to fund shareholder redemptions or for other short-term liquidity purposes. During the period, there were no borrowings on this line of credit.
| | Amount |
| VIP Growth Portfolio | $7,893 |
7. Security Lending.
Funds lend portfolio securities from time to time in order to earn additional income. Lending agents are used, including National Financial Services (NFS), an affiliate of the investment adviser. Pursuant to a securities lending agreement, NFS will receive a fee, which is capped at 9.9% of a fund's daily lending revenue, for its services as lending agent. A fund may lend securities to certain qualified borrowers, including NFS. On the settlement date of the loan, a fund receives collateral (in the form of U.S. Treasury obligations, letters of credit and/or cash) against the loaned securities and maintains collateral in an amount not less than 100% of the market value of the loaned securities during the period of the loan. The market value of the loaned securities is determined at the close of business of a fund and any additional required collateral is delivered to a fund on the next business day. A fund or borrower may terminate the loan at any time, and if the borrower defaults on its obligation to return the securities loaned because of insolvency or other reasons, a fund may apply collateral received from the borrower against the obligation. A fund may experience delays and costs in recovering the securities loaned. Any cash collateral received is invested in the Fidelity Securities Lending Cash Central Fund. Any loaned securities are identified as such in the Schedule of Investments, and the value of loaned securities and cash collateral at period end, as applicable, are presented in the Statement of Assets and Liabilities. Security lending income represents the income earned on investing cash collateral, less rebates paid to borrowers and any lending agent fees associated with the loan, plus any premium payments received for lending certain types of securities. Security lending income is presented in the Statement of Operations as a component of income from Fidelity Central Funds. Affiliated security lending activity, if any, was as follows:
| | Total Security Lending Fees Paid to NFS | Security Lending Income From Securities Loaned to NFS | Value of Securities Loaned to NFS at Period End |
| VIP Growth Portfolio | $30,085 | $1,115 | $1,113,172 |
8. Expense Reductions.
Commissions paid to certain brokers with whom the investment adviser, or its affiliates, places trades on behalf of the Fund include an amount in addition to trade execution, which may be rebated back to the Fund to offset expenses. This amount totaled $261,370 for the period.
In addition, during the period the investment adviser or an affiliate reimbursed and/or waived a portion of fund-level operating expenses in the amount of $11,751.
9. Distributions to Shareholders.
Distributions to shareholders of each class were as follows:
| | Six months ended
June 30, 2021 | Year ended
December 31, 2020 |
| VIP Growth Portfolio | | |
| Distributions to shareholders | | |
| Initial Class | $544,157,194 | $358,011,706 |
| Service Class | 123,350,584 | 77,881,583 |
| Service Class 2 | 196,839,721 | 123,304,387 |
| Investor Class | 97,039,469 | 58,315,303 |
| Total | $961,386,968 | $617,512,979 |
10. Share Transactions.
Transactions for each class of shares were as follows and may contain in-kind transactions:
| | Shares | Shares | Dollars | Dollars |
| | Six months ended June 30, 2021 | Year ended December 31, 2020 | Six months ended June 30, 2021 | Year ended December 31, 2020 |
| VIP Growth Portfolio | | | | |
| Initial Class | | | | |
| Shares sold | 810,670 | 2,421,748 | $79,768,816 | $197,372,757 |
| Reinvestment of distributions | 5,597,749 | 4,467,092 | 544,157,194 | 358,011,706 |
| Shares redeemed | (3,010,440) | (6,395,612) | (298,664,193) | (527,253,371) |
| Net increase (decrease) | 3,397,979 | 493,228 | $325,261,817 | $28,131,092 |
| Service Class | | | | |
| Shares sold | 354,630 | 1,238,658 | $35,153,609 | $102,304,855 |
| Reinvestment of distributions | 1,276,921 | 977,801 | 123,350,584 | 77,881,583 |
| Shares redeemed | (711,110) | (1,751,676) | (69,662,795) | (144,513,037) |
| Net increase (decrease) | 920,441 | 464,783 | $88,841,398 | $35,673,401 |
| Service Class 2 | | | | |
| Shares sold | 1,425,000 | 2,657,391 | $137,577,915 | $218,698,194 |
| Reinvestment of distributions | 2,079,879 | 1,580,689 | 196,839,721 | 123,304,387 |
| Shares redeemed | (1,305,931) | (3,720,391) | (124,704,761) | (293,491,865) |
| Net increase (decrease) | 2,198,948 | 517,689 | $209,712,875 | $48,510,716 |
| Investor Class | | | | |
| Shares sold | 475,352 | 1,145,918 | $46,669,416 | $92,937,912 |
| Reinvestment of distributions | 1,005,070 | 731,173 | 97,039,469 | 58,315,303 |
| Shares redeemed | (450,983) | (1,097,743) | (44,044,149) | (86,675,742) |
| Net increase (decrease) | 1,029,439 | 779,348 | $99,664,736 | $64,577,473 |
11. Other.
Fund's organizational documents provide former and current trustees and officers with a limited indemnification against liabilities arising in connection with the performance of their duties to the fund. In the normal course of business, the fund may also enter into contracts that provide general indemnifications. The fund's maximum exposure under these arrangements is unknown as this would be dependent on future claims that may be made against the fund. The risk of material loss from such claims is considered remote.
At the end of the period, the investment adviser or its affiliates were owners of record of more than 10% and certain otherwise unaffiliated shareholders each were owners of record of more than 10% of the outstanding shares as follows:
| Fund | Affiliated % | Number of
Unaffiliated Shareholders | Unaffiliated Shareholders % |
| VIP: Growth Portfolio | 19% | 2 | 38% |
12. Coronavirus (COVID-19) Pandemic.
An outbreak of COVID-19 first detected in China during December 2019 has since spread globally and was declared a pandemic by the World Health Organization during March 2020. Developments that disrupt global economies and financial markets, such as the COVID-19 pandemic, may magnify factors that affect the Fund's performance.
Shareholder Expense Example
As a shareholder, you incur two types of costs: (1) transaction costs, which may include sales charges (loads) on purchase payments or redemption proceeds, as applicable and (2) ongoing costs, which generally include management fees, distribution and/or service (12b-1) fees and other Fund expenses. This Example is intended to help you understand your ongoing costs (in dollars) of investing in a fund and to compare these costs with the ongoing costs of investing in other mutual funds.
The Example is based on an investment of $1,000 invested at the beginning of the period and held for the entire period (January 1, 2021 to June 30, 2021).
Actual Expenses
The first line of the accompanying table provides information about actual account values and actual expenses. You may use the information in this line, together with the amount you invested, to estimate the expenses that you paid over the period. Simply divide your account value by $1,000.00 (for example, an $8,600 account value divided by $1,000.00 = 8.6), then multiply the result by the number in the first line for a class/Fund under the heading entitled "Expenses Paid During Period" to estimate the expenses you paid on your account during this period. If any fund is a shareholder of any underlying mutual funds or exchange-traded funds (ETFs) (the Underlying Funds), such fund indirectly bears its proportional share of the expenses of the Underlying Funds in addition to the direct expenses incurred presented in the table. These fees and expenses are not included in the annualized expense ratio used to calculate the expense estimate in the table below. The estimate of expenses does not include any fees or other expenses of any variable annuity or variable life insurance product. If they were, the estimate of expenses you paid during the period would be higher, and your ending account value would be lower.
Hypothetical Example for Comparison Purposes
The second line of the accompanying table provides information about hypothetical account values and hypothetical expenses based on the actual expense ratio and an assumed rate of return of 5% per year before expenses, which is not the actual return. The hypothetical account values and expenses may not be used to estimate the actual ending account balance or expenses you paid for the period. You may use this information to compare the ongoing costs of investing in the Fund and other funds. To do so, compare this 5% hypothetical example with the 5% hypothetical examples that appear in the shareholder reports of the other funds. If any fund is a shareholder of any Underlying Funds, such fund indirectly bears its proportional share of the expenses of the Underlying Funds in addition to the direct expenses as presented in the table. These fees and expenses are not included in the annualized expense ratio used to calculate the expense estimate in the table below. The estimate of expenses does not include any fees or other expenses of any variable annuity or variable life insurance product. If they were, the estimate of expenses you paid during the period would be higher, and your ending account value would be lower.
Please note that the expenses shown in the table are meant to highlight your ongoing costs only and do not reflect any transaction costs. Therefore, the second line of the table is useful in comparing ongoing costs only, and will not help you determine the relative total costs of owning different funds.
| | Annualized Expense Ratio-A | Beginning
Account Value
January 1, 2021 | Ending
Account Value
June 30, 2021 | Expenses Paid
During Period-B
January 1, 2021
to June 30, 2021 |
| VIP Growth Portfolio | | | | |
| Initial Class | .61% | | | |
| Actual | | $1,000.00 | $1,136.00 | $3.23 |
| Hypothetical-C | | $1,000.00 | $1,021.77 | $3.06 |
| Service Class | .71% | | | |
| Actual | | $1,000.00 | $1,135.40 | $3.76 |
| Hypothetical-C | | $1,000.00 | $1,021.27 | $3.56 |
| Service Class 2 | .86% | | | |
| Actual | | $1,000.00 | $1,134.50 | $4.55 |
| Hypothetical-C | | $1,000.00 | $1,020.53 | $4.31 |
| Investor Class | .68% | | | |
| Actual | | $1,000.00 | $1,135.50 | $3.60 |
| Hypothetical-C | | $1,000.00 | $1,021.42 | $3.41 |
A Annualized expense ratio reflects expenses net of applicable fee waivers.
B Expenses are equal to the annualized expense ratio, multiplied by the average account value over the period, multiplied by 181/ 365 (to reflect the one-half year period). The fees and expenses of any Underlying Funds are not included in each annualized expense ratio.
C 5% return per year before expenses
Board Approval of Investment Advisory Contracts and Management Fees
VIP Growth Portfolio
Each year, the Board of Trustees, including the Independent Trustees (together, the Board), votes on the renewal of the management contract with Fidelity Management & Research Company LLC (FMR) and the sub-advisory agreements (together, the Advisory Contracts) for the fund. FMR and the sub-advisers are referred to herein as the Investment Advisers. The Board, assisted by the advice of fund counsel and Independent Trustees' counsel, requests and considers a broad range of information relevant to the renewal of the Advisory Contracts throughout the year.
The Board meets regularly and, at each of its meetings, covers an extensive agenda of topics and materials and considers factors that are relevant to its annual consideration of the renewal of the fund's Advisory Contracts, including the services and support provided to the fund and its shareholders. The Board has established various standing committees (Committees), each composed of and chaired by Independent Trustees with varying backgrounds, to which the Board has assigned specific subject matter responsibilities in order to enhance effective decision-making by the Board. The Board, acting directly and through its Committees, requests and receives information concerning the annual consideration of the renewal of the fund's Advisory Contracts. The Board also meets as needed to review matters specifically related to the Board's annual consideration of the renewal of the Advisory Contracts. Members of the Board may also meet with trustees of other Fidelity funds through joint ad hoc committees to discuss certain matters relevant to all of the Fidelity funds.
Approval of Stub Period Continuation. At its January 2021 meeting, the Board of Trustees voted to continue the fund's management contract with FMR, and the sub-advisory agreements and sub-subadvisory agreements, in each case, where applicable (together, the Advisory Contracts), without modification, for four months from February 1, 2021 through May 31, 2021, in connection with changes to the Board's meeting calendar. The Board considered that the approval of the fund's Advisory Contracts will not result in any changes in (i) the investment process or strategies employed in the management of the fund's assets; (ii) the fees and expenses paid by shareholders; (iii) the nature, extent or quality of services provided under the fund's Advisory Contracts; or (iv) the day-to-day management of the fund or the persons primarily responsible for such management. The Board also considered that since its last approval of the fund's Advisory Contracts, FMR had provided additional information on the fund in support of the annual contract renewal process, including competitive analyses on total expenses and management fees and in-depth reviews of fund performance and fund profitability information. The Board also considered the findings of certain ad hoc committees that had been previously formed to discuss matters relevant to all of the Fidelity funds, including economies of scale, fall-out benefits and retail vs. institutional funds. The Board concluded that the fund's Advisory Contracts are fair and reasonable, and that the fund's Advisory Contracts should be renewed, without modification, through May 31, 2021, with the understanding that the Board will consider the annual renewal for a full one year period in May 2021.
At its May 2021 meeting, the Board unanimously determined to renew the fund's Advisory Contracts. In reaching its determination, the Board considered all factors it believed relevant, including (i) the nature, extent, and quality of the services provided to the fund and its shareholders (including the investment performance of the fund); (ii) the competitiveness of the fund's management fee and total expense ratio relative to peer funds; (iii) the total costs of the services provided by and the profits realized by Fidelity from its relationships with the fund; and (iv) the extent to which, if any, economies of scale exist and are realized as the fund grows, and whether any economies of scale are appropriately shared with fund shareholders.
In considering whether to renew the Advisory Contracts for the fund, the Board reached a determination, with the assistance of fund counsel and Independent Trustees' counsel and through the exercise of its business judgment, that the renewal of the Advisory Contracts was in the best interests of the fund and its shareholders and that the compensation payable under the Advisory Contracts was fair and reasonable. The Board's decision to renew the Advisory Contracts was not based on any single factor, but rather was based on a comprehensive consideration of all the information provided to the Board at its meetings throughout the year. The Board, in reaching its determination to renew the Advisory Contracts, was aware that shareholders of the fund have a broad range of investment choices available to them, including a wide choice among funds offered by Fidelity's competitors, and that the fund's shareholders, who have the opportunity to review and weigh the disclosure provided by the fund in its prospectus and other public disclosures, have chosen to invest in this fund, which is part of the Fidelity family of funds.
Nature, Extent, and Quality of Services Provided. The Board considered Fidelity's staffing as it relates to the fund, including the backgrounds of investment personnel of Fidelity, and also considered the fund's investment objective, strategies, and related investment philosophy. The Independent Trustees also had discussions with senior management of Fidelity's investment operations and investment groups. The Board considered the structure of the investment personnel compensation program and whether this structure provides appropriate incentives to act in the best interests of the fund. Additionally, the Board considered the portfolio managers' investments, if any, in the funds that they manage.
Resources Dedicated to Investment Management and Support Services. The Board and the Fund Oversight and Research Committees reviewed the general qualifications and capabilities of Fidelity's investment staff, including its size, education, experience, and resources, as well as Fidelity's approach to recruiting, training, managing, and compensating investment personnel. The Board noted that Fidelity has continued to increase the resources devoted to non-U.S. offices, including expansion of Fidelity's global investment organization. The Board also noted that Fidelity's analysts have extensive resources, tools and capabilities that allow them to conduct sophisticated quantitative and fundamental analysis, as well as credit analysis of issuers, counterparties and guarantors. Further, the Board considered that Fidelity's investment professionals have sufficient access to global information and data so as to provide competitive investment results over time, and that those professionals also have access to sophisticated tools that permit them to assess portfolio construction and risk and performance attribution characteristics continuously, as well as to transmit new information and research conclusions rapidly around the world. Additionally, in its deliberations, the Board considered Fidelity's trading, risk management, compliance, and technology and operations capabilities and resources, which are integral parts of the investment management process. The Board also considered Fidelity's investments in business continuity planning, and its success in continuously providing services to the fund notwithstanding the severe disruptions caused by the COVID-19 pandemic.
Shareholder and Administrative Services. The Board considered (i) the nature, extent, quality, and cost of advisory, administrative, and shareholder services performed by the Investment Advisers and their affiliates under the Advisory Contracts and under separate agreements covering transfer agency, pricing and bookkeeping, and securities lending services for the fund; (ii) the nature and extent of the supervision of third party service providers, principally custodians, subcustodians, and pricing vendors; and (iii) the resources devoted to, and the record of compliance with, the fund's compliance policies and procedures. The Board also reviewed the allocation of fund brokerage, including allocations to brokers affiliated with the Investment Advisers, the use of brokerage commissions to pay fund expenses, and the use of "soft" commission dollars to pay for research services.
The Board noted that the growth of fund assets over time across the complex allows Fidelity to reinvest in the development of services designed to enhance the value and convenience of the Fidelity funds as investment vehicles. These services include 24-hour access to account information and market information over the Internet and through telephone representatives, investor education materials and asset allocation tools, and the expanded availability of Fidelity Investor Centers.
The Board noted that, in the past, it and the boards of certain other Fidelity funds had formed an ad hoc Committee on Transfer Agency Fees to review the variety of transfer agency fee structures throughout the industry and Fidelity's competitive positioning with respect to industry participants.
Investment in a Large Fund Family. The Board considered the benefits to shareholders of investing in a Fidelity fund, including the benefits of investing in a fund that is part of a large family of funds offering a variety of investment disciplines and providing a large variety of mutual fund investor services. The Board noted that Fidelity had taken, or had made recommendations that resulted in the Fidelity funds taking, a number of actions over the previous year that benefited particular funds, including: (i) continuing to dedicate additional resources to Fidelity's investment research process, which includes meetings with management of issuers of securities in which the funds invest, and to the support of the senior management team that oversees asset management; (ii) continuing efforts to enhance Fidelity's global research capabilities; (iii) launching new funds and ETFs with innovative structures, strategies and pricing and making other enhancements to meet client needs; (iv) launching new share classes of existing funds; (v) eliminating purchase minimums and broadening eligibility requirements for certain funds and share classes; (vi) approving the reduction in the holding period for the Class C to Class A conversion policy; (vii) reducing management fees and total expenses for certain target date funds and classes and index funds; (viii) lowering expenses for certain existing funds and classes by implementing or lowering expense caps; (ix) rationalizing product lines and gaining increased efficiencies from fund mergers, liquidations, and share class consolidations; (x) continuing to develop, acquire and implement systems and technology to improve services to the funds and shareholders, strengthen information security, and increase efficiency; and (xi) continuing to implement enhancements to further strengthen Fidelity's product line to increase investors' probability of success in achieving their investment goals, including retirement income goals.
Investment Performance. The Board considered whether the fund has operated in accordance with its investment objective, as well as its record of compliance with its investment restrictions and its performance history.
The Board took into account discussions that occur at Board meetings throughout the year with representatives of the Investment Advisers about fund investment performance. In this regard the Board noted that as part of regularly scheduled fund reviews and other reports to the Board on fund performance, the Board considers annualized return information for the fund for different time periods, measured against an appropriate securities market index (benchmark index) and an appropriate peer group of funds with similar objectives (peer group). In its evaluation of fund investment performance, the Board gave particular attention to information indicating changes in performance of certain Fidelity funds for specific time periods and discussed with the Investment Advisers the reasons for any overperformance or underperformance.
In addition to reviewing absolute and relative fund performance, the Independent Trustees periodically consider the appropriateness of fund performance metrics in evaluating the results achieved. In general, the Independent Trustees believe that fund performance should be evaluated based on net performance (after fees and expenses) of both the highest performing and lowest performing fund share classes, where applicable, compared to appropriate benchmark indices, over appropriate time periods that may include full market cycles, and compared to peer groups, as applicable, over the same periods, taking into account relevant factors including the following: general market conditions; issuer-specific information; and fund cash flows and other factors.
The Independent Trustees recognize that shareholders evaluate performance on a net basis over their own holding periods, for which one-, three-, and five-year periods are often used as a proxy. For this reason, the performance information reviewed by the Board also included net cumulative total return information for the fund and an appropriate benchmark index and peer group for the most recent one-, three-, and five-year periods ended September 30, 2020, as shown below. Returns are shown compared to the 25th percentile (top of box, 75% beaten) and 75th percentile (bottom of box, 25% beaten) of the peer universe.
VIP Growth Portfolio

Based on its review, the Board concluded that the nature, extent, and quality of services provided to the fund under the Advisory Contracts should continue to benefit the shareholders of the fund.
Competitiveness of Management Fee and Total Expense Ratio. The Board considered the fund's management fee and total expense ratio compared to "mapped groups" of competitive funds and classes created for the purpose of facilitating the Trustees' competitive analysis of management fees and total expenses. Fidelity creates "mapped groups" by combining similar Lipper investment objective categories that have comparable investment mandates. Combining Lipper investment objective categories aids the Board's management fee and total expense ratio comparisons by broadening the competitive group used for comparison.
Management Fee. The Board considered two proprietary management fee comparisons for the 12-month periods ended September 30 (June 30 for periods ended 2019 and 2018 and December 31 for periods prior to 2018) shown in basis points (BP) in the chart below. The group of Lipper funds used by the Board for management fee comparisons is referred to below as the "Total Mapped Group." The Total Mapped Group comparison focuses on a fund's standing in terms of gross management fees before expense reimbursements or caps relative to the total universe of funds with comparable investment mandates, regardless of whether their management fee structures also are comparable. Funds with comparable investment mandates offer exposure to similar types of securities. Funds with comparable management fee structures have similar management fee contractual arrangements (
e.g., flat rate charged for advisory services, all-inclusive fee rate,
etc.). "TMG %" represents the percentage of funds in the Total Mapped Group that had management fees that were lower than the fund's. For example, a hypothetical TMG % of 20% would mean that 80% of the funds in the Total Mapped Group had higher, and 20% had lower, management fees than the fund. The fund's actual TMG %s and the number of funds in the Total Mapped Group are in the chart below. The "Asset-Sized Peer Group" (ASPG) comparison focuses on a fund's standing relative to a subset of non-Fidelity funds within the Total Mapped Group that are similar in size and management fee structure. For example, if a fund is in the first quartile of the ASPG, the fund's management fee ranks in the least expensive or lowest 25% of funds in the ASPG. The ASPG represents at least 15% of the funds in the Total Mapped Group with comparable asset size and management fee structures, subject to a minimum of 50 funds (or all funds in the Total Mapped Group if fewer than 50). Additional information, such as the ASPG quartile in which the fund's management fee rate ranked, is also included in the chart and was considered by the Board.
VIP Growth Portfolio

The Board noted that the fund's management fee rate ranked below the median of its Total Mapped Group and below the median of its ASPG for the 12-month period ended September 30, 2020.
The Board noted that, in the past, it and the boards of other Fidelity funds had formed an ad hoc Committee on Group Fee to conduct an in-depth review of the "group fee" component of the management fee of funds with such management fee structures. The Committee's focus included the mechanics of the group fee, the competitive landscape of group fee structures, Fidelity funds with no group fee component and investment products not included in group fee assets. The Board also considered that, for funds subject to the group fee, FMR agreed to voluntarily waive fees over a specified period of time in amounts designed to account for assets converted from certain funds to certain collective investment trusts.
The Board also noted that, in 2013, the ad hoc Committee on Management Fees was formed to conduct an in-depth review of the management fee rates of Fidelity's active equity mutual funds. The Committee focused on the following areas: (i) standard fee structures; (ii) research consumption and trading evolution; (iii) management fee competitiveness/profitability by category; and (iv) factors that drive institutional pricing.
Based on its review, the Board concluded that the fund's management fee is fair and reasonable in light of the services that the fund receives and the other factors considered.
Total Expense Ratio. In its review of each class's total expense ratio, the Board considered the fund's management fee rate as well as other fund or class expenses, as applicable, such as transfer agent fees, pricing and bookkeeping fees, fund-paid 12b-1 fees, and custodial, legal, and audit fees. The Board also noted that Fidelity may agree to waive fees or reimburse expenses from time to time, and the extent to which, if any, it has done so for the fund. As part of its review, the Board also considered the current and historical total expense ratios of each class of the fund compared to competitive fund median expenses. The fund's representative class is compared to those funds and classes in the Total Mapped Group (used by the Board for management fee comparisons) that have a similar sales load structure (SLTG). The Board also considered a total expense ASPG comparison for the representative class, which focuses on the total expenses of the representative class relative to a subset of non-Fidelity funds within the total expense SLTG. The total expense ASPG is limited to 15 larger and 15 smaller classes in fund average assets for a total of 30 classes, where possible. The total expense ASPG comparison excludes performance adjustments and fund-paid 12b-1 fees to eliminate variability in fee structures.
The Board noted that the total expense ratio of Initial Class ranked below the SLTG competitive median and above the ASPG competitive median for the 12-month period ended September 30, 2020. The Board considered that, in general, various factors can affect total expense ratios. The Board also considered that the servicing component of the VIP universe differs by class for both VIP Fidelity and competitor classes and that the servicing component of Initial Class is split between the class-level and the annuity level whereas other competitor classes provide all servicing at the annuity level. The Board noted that the fund offers multiple classes, each of which has a different 12b-1 fee structure, and that the multiple structures are intended to offer a range of pricing options for the intermediary market. The Board also noted that the total expense ratios of the classes vary primarily by the level of their 12b-1 fees, although differences in transfer agent fees may also cause expenses to vary from class to class.
Fees Charged to Other Fidelity Clients. The Board also considered Fidelity fee structures and other information with respect to clients of Fidelity, such as other funds advised or subadvised by Fidelity, pension plan clients, and other institutional clients with similar mandates. The Board noted that a joint ad hoc committee created by it and the boards of other Fidelity funds periodically reviews and compares Fidelity's institutional investment advisory business with its business of providing services to the Fidelity funds and also noted the most recent findings of the committee. The Board noted that the committee's review included a consideration of the differences in services provided, fees charged, and costs incurred, as well as competition in the markets serving the different categories of clients.
Based on its review of total expense ratios and fees charged to other Fidelity clients, the Board concluded that the total expense ratio of each class of the fund was reasonable in light of the services that the fund and its shareholders receive and the other factors considered.
Costs of the Services and Profitability. The Board considered the revenues earned and the expenses incurred by Fidelity in conducting the business of developing, marketing, distributing, managing, administering and servicing the fund and servicing the fund's shareholders. The Board also considered the level of Fidelity's profits in respect of all the Fidelity funds.
On an annual basis, Fidelity presents to the Board information about the profitability of its relationships with the fund. Fidelity calculates profitability information for each fund, as well as aggregate profitability information for groups of Fidelity funds and all Fidelity funds, using a series of detailed revenue and cost allocation methodologies which originate with the books and records of Fidelity on which Fidelity's audited financial statements are based. The Audit Committee of the Board reviews any significant changes from the prior year's methodologies and the full Board approves such changes.
A public accounting firm has been engaged annually by the Board as part of the Board's assessment of Fidelity's profitability analysis. The engagement includes the review and assessment of the methodologies used by Fidelity in determining the revenues and expenses attributable to Fidelity's mutual fund business, and completion of agreed-upon procedures in respect of the mathematical accuracy of certain fund profitability information and its conformity to established allocation methodologies. After considering the reports issued under the engagement and information provided by Fidelity, the Board concluded that while other allocation methods may also be reasonable, Fidelity's profitability methodologies are reasonable in all material respects.
The Board also reviewed Fidelity's non-fund businesses and potential indirect benefits such businesses may have received as a result of their association with Fidelity's mutual fund business (i.e., fall-out benefits) as well as cases where Fidelity's affiliates may benefit from the funds' business. The Board considered areas where potential indirect benefits to the Fidelity funds from their relationships with Fidelity may exist. The Board also considered that in 2019 a joint ad hoc committee created by it and the boards of other Fidelity funds evaluated potential fall-out benefits (PFOB Committee). The Board noted that it considered the PFOB Committee's findings in connection with its consideration of the renewal of the Advisory Contracts.
The Board considered the costs of the services provided by and the profits realized by Fidelity in connection with the operation of the fund, including the conclusions of the PFOB Committee, and was satisfied that the profitability was not excessive.
Economies of Scale. The Board considered whether there have been economies of scale in respect of the management of the Fidelity funds, whether the Fidelity funds (including the fund) have appropriately benefited from any such economies of scale, and whether there is potential for realization of any further economies of scale. The Board considered the extent to which the fund will benefit from economies of scale as assets grow through increased services to the fund, through waivers or reimbursements, or through fee or expense ratio reductions. The Board also noted that a committee (the Economies of Scale Committee) created by it and the boards of other Fidelity funds periodically analyzes whether Fidelity attains economies of scale in respect of the management and servicing of the Fidelity funds, whether the Fidelity funds have appropriately benefited from such economies of scale, and whether there is potential for realization of any further economies of scale.
The Board recognized that the fund's management contract incorporates a "group fee" structure, which provides for lower group fee rates as total "group assets" increase, and for higher group fee rates as total "group assets" decrease ("group assets" as defined in the management contract). FMR calculates the group fee rates based on a tiered asset "breakpoint" schedule that varies based on asset class. The Board considered that the group fee is designed to deliver the benefits of economies of scale to fund shareholders when total Fidelity fund assets increase, even if assets of any particular fund are unchanged or have declined, because some portion of Fidelity's costs are attributable to services provided to all Fidelity funds, and all funds benefit if those costs can be allocated among more assets. The Board further considered that Fidelity agreed to impose a temporary fee waiver in the form of additional breakpoints to the current breakpoint schedule. The Board concluded that, given the group fee structure, fund shareholders will benefit from lower management fees as "group assets" increase at the fund complex level, regardless of whether Fidelity achieves any such economies of scale.
The Board concluded, taking into account the analysis of the Economies of Scale Committee, that economies of scale, if any, are being appropriately shared between fund shareholders and Fidelity.
Additional Information Requested by the Board. In order to develop fully the factual basis for consideration of the Fidelity funds' advisory contracts, the Board requested and received additional information on certain topics, including: (i) fund flow and performance trends, in particular the underperformance of certain funds and strategies, and Fidelity's long-term strategies for certain funds; (ii) consideration of expanding the use of performance fees for additional funds; (iii) Fidelity's pricing philosophy compared to competitors; (iv) metrics for evaluating index fund and ETF performance and information about ETF trading characteristics; (v) the methodology with respect to evaluating competitive fund data and peer group classifications and fee and expense comparisons; (vi) the expense structures for different funds and classes and information about the differences between various expense structures; (vii) group fee breakpoints; (viii) information regarding other accounts managed by Fidelity and sub-advisory arrangements; and (ix) Fidelity's philosophies and strategies for evaluating funds and classes with lower or declining asset levels.
Based on its evaluation of all of the conclusions noted above, and after considering all factors it believed relevant, the Board concluded that the advisory fee arrangements are fair and reasonable, and that the fund's Advisory Contracts should be renewed.
Liquidity Risk Management Program
The Securities and Exchange Commission adopted Rule 22e-4 under the Investment Company Act of 1940 (the Liquidity Rule) to promote effective liquidity risk management throughout the open-end investment company industry, thereby reducing the risk that funds will be unable to meet their redemption obligations and mitigating dilution of the interests of fund shareholders.
The Fund has adopted and implemented a liquidity risk management program pursuant to the Liquidity Rule (the Program) effective December 1, 2018. The Program is reasonably designed to assess and manage the Fund’s liquidity risk and to comply with the requirements of the Liquidity Rule. The Fund’s Board of Trustees (the Board) has designated the Fund’s investment adviser as administrator of the Program. The Fidelity advisers have established a Liquidity Risk Management Committee (the LRM Committee) to manage the Program for each of the Fidelity Funds. The LRM Committee monitors the adequacy and effectiveness of implementation of the Program and on a periodic basis assesses each Fund’s liquidity risk based on a variety of factors including (1) the Fund’s investment strategy, (2) portfolio liquidity and cash flow projections during normal and reasonably foreseeable stressed conditions, (3) shareholder redemptions, (4) borrowings and other funding sources and (5) in the case of exchange-traded funds, certain additional factors including the effect of the Fund’s prices and spreads, market participants, and basket compositions on the overall liquidity of the Fund’s portfolio, as applicable.
In accordance with the Program, each of the Fund’s portfolio investments is classified into one of four liquidity categories described below based on a determination of a reasonable expectation for how long it would take to convert the investment to cash (or sell or dispose of the investment) without significantly changing its market value.
- Highly liquid investments – cash or convertible to cash within three business days or less
- Moderately liquid investments – convertible to cash in three to seven calendar days
- Less liquid investments – can be sold or disposed of, but not settled, within seven calendar days
- Illiquid investments – cannot be sold or disposed of within seven calendar days
Liquidity classification determinations take into account a variety of factors including various market, trading and investment-specific considerations, as well as market depth, and generally utilize analysis from a third-party liquidity metrics service.
The Liquidity Rule places a 15% limit on a fund’s illiquid investments and requires funds that do not primarily hold assets that are highly liquid investments to determine and maintain a minimum percentage of the fund’s net assets to be invested in highly liquid investments (highly liquid investment minimum or HLIM). The Program includes provisions reasonably designed to comply with the 15% limit on illiquid investments and for determining, periodically reviewing and complying with the HLIM requirement as applicable.
At a recent meeting of the Fund’s Board of Trustees, the LRM Committee provided a written report to the Board pertaining to the operation, adequacy, and effectiveness of implementation of the Program for the annual period from December 1, 2019 through November 30, 2020. The report concluded that the Program has been implemented and is operating effectively and is reasonably designed to assess and manage the Fund’s liquidity risk.
VIPGRWT-SANN-0821
1.705692.123
Fidelity® Variable Insurance Products:
High Income Portfolio
Semi-Annual Report
June 30, 2021
Contents
To view a fund's proxy voting guidelines and proxy voting record for the 12-month period ended June 30, visit http://www.fidelity.com/proxyvotingresults or visit the Securities and Exchange Commission's (SEC) web site at http://www.sec.gov.
You may also call 1-877-208-0098 to request a free copy of the proxy voting guidelines.
Fidelity® Variable Insurance Products are separate account options which are purchased through a variable insurance contract.
Standard & Poor's, S&P and S&P 500 are registered service marks of The McGraw-Hill Companies, Inc. and have been licensed for use by Fidelity Distributors Corporation.
Other third-party marks appearing herein are the property of their respective owners.
All other marks appearing herein are registered or unregistered trademarks or service marks of FMR LLC or an affiliated company. © 2021 FMR LLC. All rights reserved.
This report and the financial statements contained herein are submitted for the general information of the shareholders of the Fund. This report is not authorized for distribution to prospective investors in the Fund unless preceded or accompanied by an effective prospectus.
A fund files its complete schedule of portfolio holdings with the SEC for the first and third quarters of each fiscal year on Form N-PORT. Forms N-PORT are available on the SEC’s web site at http://www.sec.gov. A fund's Forms N-PORT may be reviewed and copied at the SEC’s Public Reference Room in Washington, DC. Information regarding the operation of the SEC's Public Reference Room may be obtained by calling 1-800-SEC-0330.
For a complete list of a fund's portfolio holdings, view the most recent holdings listing, semiannual report, or annual report on Fidelity's web site at http://www.fidelity.com, http://www.institutional.fidelity.com, or http://www.401k.com, as applicable.
NOT FDIC INSURED •MAY LOSE VALUE •NO BANK GUARANTEE
Neither the Fund nor Fidelity Distributors Corporation is a bank.
Note to Shareholders:
Early in 2020, the outbreak and spread of a new coronavirus emerged as a public health emergency that had a major influence on financial markets, primarily based on its impact on the global economy and the outlook for corporate earnings. The virus causes a respiratory disease known as COVID-19. On March 11, 2020 the World Health Organization declared the COVID-19 outbreak a pandemic, citing sustained risk of further global spread.
In the weeks following, as the crisis worsened, we witnessed an escalating human tragedy with wide-scale social and economic consequences from coronavirus-containment measures. The outbreak of COVID-19 prompted a number of measures to limit the spread, including travel and border restrictions, quarantines, and restrictions on large gatherings. In turn, these resulted in lower consumer activity, diminished demand for a wide range of products and services, disruption in manufacturing and supply chains, and – given the wide variability in outcomes regarding the outbreak – significant market uncertainty and volatility. Amid the turmoil, global governments and central banks took unprecedented action to help support consumers, businesses, and the broader economies, and to limit disruption to financial systems.
The situation continues to unfold, and the extent and duration of its impact on financial markets and the economy remain highly uncertain. Extreme events such as the coronavirus crisis are “exogenous shocks” that can have significant adverse effects on mutual funds and their investments. Although multiple asset classes may be affected by market disruption, the duration and impact may not be the same for all types of assets.
Fidelity is committed to helping you stay informed amid news about COVID-19 and during increased market volatility, and we’re taking extra steps to be responsive to customer needs. We encourage you to visit our websites, where we offer ongoing updates, commentary, and analysis on the markets and our funds.
Investment Summary (Unaudited)
Top Five Holdings as of June 30, 2021
| (by issuer, excluding cash equivalents) | % of fund's net assets |
| Altice France SA | 2.4 |
| TransDigm, Inc. | 2.2 |
| Bombardier, Inc. | 2.1 |
| C&W Senior Financing Designated Activity Co. | 2.1 |
| Occidental Petroleum Corp. | 2.0 |
| | 10.8 |
Top Five Market Sectors as of June 30, 2021
| | % of fund's net assets |
| Energy | 16.4 |
| Telecommunications | 12.0 |
| Healthcare | 7.1 |
| Services | 6.2 |
| Aerospace | 5.9 |
Quality Diversification (% of fund's net assets)
| As of June 30, 2021 |
| | BBB | 0.7% |
| | BB | 25.4% |
| | B | 53.4% |
| | CCC,CC,C | 15.2% |
| | Not Rated | 1.0% |
| | Equities | 0.6% |
| | Short-Term Investments and Net Other Assets | 3.7% |
We have used ratings from Moody's Investors Service, Inc. Where Moody's® ratings are not available, we have used S&P® ratings. All ratings are as of the date indicated and do not reflect subsequent changes.
Asset Allocation (% of fund's net assets)
| As of June 30, 2021* |
| | Nonconvertible Bonds | 90.1% |
| | Convertible Bonds, Preferred Stocks | 1.3% |
| | Common Stocks | 0.6% |
| | Bank Loan Obligations | 4.3% |
| | Short-Term Investments and Net Other Assets (Liabilities) | 3.7% |

* Foreign investments - 23.4%
Schedule of Investments June 30, 2021 (Unaudited)
Showing Percentage of Net Assets
| Corporate Bonds - 91.4% | | | |
| | | Principal Amount | Value |
| Convertible Bonds - 1.3% | | | |
| Broadcasting - 0.7% | | | |
| DISH Network Corp. 2.375% 3/15/24 | | $7,126,000 | $6,907,766 |
| Energy - 0.6% | | | |
| Mesquite Energy, Inc.: | | | |
| 15% 7/15/23 (a)(b) | | 580,578 | 2,177,168 |
| 15% 7/15/23 (a)(b) | | 1,002,320 | 3,407,888 |
| | | | 5,585,056 |
|
| TOTAL CONVERTIBLE BONDS | | | 12,492,822 |
|
| Nonconvertible Bonds - 90.1% | | | |
| Aerospace - 5.9% | | | |
| Allegheny Technologies, Inc. 5.875% 12/1/27 | | 6,785,000 | 7,107,288 |
| Bombardier, Inc.: | | | |
| 7.125% 6/15/26 (c) | | 5,885,000 | 6,135,113 |
| 7.5% 12/1/24 (c) | | 1,950,000 | 2,037,750 |
| 7.5% 3/15/25 (c) | | 6,300,000 | 6,478,605 |
| 7.875% 4/15/27 (c) | | 6,425,000 | 6,665,938 |
| BWX Technologies, Inc. 4.125% 6/30/28 (c) | | 1,785,000 | 1,818,469 |
| Howmet Aerospace, Inc. 6.75% 1/15/28 | | 110,000 | 132,550 |
| Kaiser Aluminum Corp.: | | | |
| 4.5% 6/1/31 (c) | | 1,760,000 | 1,804,950 |
| 4.625% 3/1/28 (c) | | 2,735,000 | 2,825,600 |
| Moog, Inc. 4.25% 12/15/27 (c) | | 2,140,000 | 2,214,900 |
| TransDigm, Inc.: | | | |
| 4.625% 1/15/29 (c) | | 3,185,000 | 3,186,115 |
| 5.5% 11/15/27 | | 9,785,000 | 10,213,094 |
| 6.25% 3/15/26 (c) | | 2,860,000 | 3,017,300 |
| 7.5% 3/15/27 | | 850,000 | 904,188 |
| 8% 12/15/25 (c) | | 4,020,000 | 4,343,610 |
| | | | 58,885,470 |
| Automotive & Auto Parts - 0.0% | | | |
| Real Hero Merger Sub 2 6.25% 2/1/29 (c) | | 280,000 | 290,416 |
| Broadcasting - 1.2% | | | |
| Diamond Sports Group LLC/Diamond Sports Finance Co. 5.375% 8/15/26 (c) | | 2,045,000 | 1,324,138 |
| Gray Television, Inc. 4.75% 10/15/30 (c) | | 895,000 | 891,894 |
| Sinclair Television Group, Inc.: | | | |
| 5.125% 2/15/27 (c) | | 2,290,000 | 2,298,588 |
| 5.5% 3/1/30 (c) | | 1,010,000 | 1,029,786 |
| Sirius XM Radio, Inc.: | | | |
| 4% 7/15/28 (c) | | 1,595,000 | 1,642,850 |
| 4.125% 7/1/30 (c) | | 575,000 | 580,106 |
| Tegna, Inc.: | | | |
| 4.625% 3/15/28 | | 1,100,000 | 1,141,250 |
| 5% 9/15/29 | | 425,000 | 444,754 |
| Univision Communications, Inc.: | | | |
| 4.5% 5/1/29 (c) | | 1,265,000 | 1,274,488 |
| 6.625% 6/1/27 (c) | | 1,815,000 | 1,966,643 |
| | | | 12,594,497 |
| Building Materials - 0.3% | | | |
| Advanced Drain Systems, Inc. 5% 9/30/27 (c) | | 2,180,000 | 2,262,884 |
| SRS Distribution, Inc. 4.625% 7/1/28 (c) | | 780,000 | 797,550 |
| | | | 3,060,434 |
| Cable/Satellite TV - 4.9% | | | |
| CCO Holdings LLC/CCO Holdings Capital Corp.: | | | |
| 4.25% 2/1/31 (c) | | 2,925,000 | 2,979,844 |
| 4.5% 8/15/30 (c) | | 1,750,000 | 1,822,124 |
| 4.5% 5/1/32 | | 2,190,000 | 2,269,388 |
| 4.5% 6/1/33 (c) | | 1,870,000 | 1,913,496 |
| 5% 2/1/28 (c) | | 8,430,000 | 8,840,963 |
| CSC Holdings LLC: | | | |
| 4.125% 12/1/30 (c) | | 1,195,000 | 1,187,531 |
| 4.625% 12/1/30 (c) | | 5,090,000 | 4,993,850 |
| 5.75% 1/15/30 (c) | | 2,510,000 | 2,607,263 |
| Dolya Holdco 18 DAC 5% 7/15/28 (c) | | 2,285,000 | 2,330,700 |
| Radiate Holdco LLC/Radiate Financial Service Ltd.: | | | |
| 4.5% 9/15/26 (c) | | 3,595,000 | 3,720,825 |
| 6.5% 9/15/28 (c) | | 4,775,000 | 5,016,854 |
| Telenet Finance Luxembourg Notes SARL 5.5% 3/1/28 (c) | | 3,000,000 | 3,156,000 |
| Virgin Media Finance PLC 5% 7/15/30 (c) | | 2,395,000 | 2,406,975 |
| Virgin Media Secured Finance PLC: | | | |
| 4.5% 8/15/30 (c) | | 690,000 | 695,175 |
| 5.5% 5/15/29 (c) | | 1,555,000 | 1,671,159 |
| Ziggo Bond Co. BV 5.125% 2/28/30 (c) | | 185,000 | 189,346 |
| Ziggo BV: | | | |
| 4.875% 1/15/30 (c) | | 990,000 | 1,014,750 |
| 5.5% 1/15/27 (c) | | 2,457,000 | 2,552,209 |
| | | | 49,368,452 |
| Capital Goods - 0.6% | | | |
| Mueller Water Products, Inc. 4% 6/15/29 (c) | | 1,110,000 | 1,140,658 |
| Vertical U.S. Newco, Inc. 5.25% 7/15/27 (c) | | 4,830,000 | 5,089,613 |
| | | | 6,230,271 |
| Chemicals - 4.9% | | | |
| Axalta Coating Systems/Dutch Holding BV 4.75% 6/15/27 (c) | | 2,155,000 | 2,257,363 |
| Bausch Health Companies, Inc. 6.25% 2/15/29 (c) | | 3,160,000 | 3,125,398 |
| CF Industries Holdings, Inc.: | | | |
| 4.95% 6/1/43 | | 1,823,000 | 2,154,950 |
| 5.15% 3/15/34 | | 170,000 | 205,689 |
| Consolidated Energy Finance SA: | | | |
| 3 month U.S. LIBOR + 3.750% 3.8689% 6/15/22 (c)(d)(e) | | 4,410,000 | 4,362,615 |
| 6.5% 5/15/26 (c) | | 3,425,000 | 3,513,571 |
| 6.875% 6/15/25 (c) | | 645,000 | 657,042 |
| Kronos Acquisition Holdings, Inc. / KIK Custom Products, Inc.: | | | |
| 5% 12/31/26 (c) | | 2,645,000 | 2,684,675 |
| 7% 12/31/27 (c) | | 260,000 | 260,588 |
| Methanex Corp.: | | | |
| 5.125% 10/15/27 | | 2,855,000 | 3,083,400 |
| 5.25% 12/15/29 | | 320,000 | 344,800 |
| 5.65% 12/1/44 | | 1,917,000 | 1,983,175 |
| NOVA Chemicals Corp.: | | | |
| 4.25% 5/15/29 (c) | | 1,135,000 | 1,148,887 |
| 5.25% 6/1/27 (c) | | 2,090,000 | 2,252,602 |
| Olin Corp.: | | | |
| 5% 2/1/30 | | 1,830,000 | 1,951,238 |
| 5.625% 8/1/29 | | 1,715,000 | 1,897,529 |
| The Chemours Co. LLC: | | | |
| 5.375% 5/15/27 | | 6,542,000 | 7,095,257 |
| 5.75% 11/15/28 (c) | | 7,500,000 | 8,023,275 |
| Valvoline, Inc. 4.25% 2/15/30 (c) | | 660,000 | 681,437 |
| W. R. Grace & Co.-Conn. 4.875% 6/15/27 (c) | | 1,140,000 | 1,208,742 |
| | | | 48,892,233 |
| Consumer Products - 0.6% | | | |
| Mattel, Inc.: | | | |
| 3.75% 4/1/29 (c) | | 1,555,000 | 1,617,200 |
| 5.45% 11/1/41 | | 250,000 | 288,125 |
| 6.2% 10/1/40 | | 1,945,000 | 2,397,213 |
| Prestige Brands, Inc. 3.75% 4/1/31 (c) | | 1,255,000 | 1,209,977 |
| Spectrum Brands Holdings, Inc. 3.875% 3/15/31 (c) | | 600,000 | 589,578 |
| | | | 6,102,093 |
| Containers - 1.2% | | | |
| Ardagh Packaging Finance PLC/Ardagh MP Holdings U.S.A., Inc. 4.125% 8/15/26 (c) | | 95,000 | 98,088 |
| Flex Acquisition Co., Inc.: | | | |
| 6.875% 1/15/25 (c) | | 2,965,000 | 3,009,475 |
| 7.875% 7/15/26 (c) | | 2,805,000 | 2,917,200 |
| Trivium Packaging Finance BV: | | | |
| 5.5% 8/15/26 (c) | | 3,555,000 | 3,735,239 |
| 8.5% 8/15/27 (c) | | 2,470,000 | 2,685,384 |
| | | | 12,445,386 |
| Diversified Financial Services - 2.3% | | | |
| Icahn Enterprises LP/Icahn Enterprises Finance Corp.: | | | |
| 4.375% 2/1/29 (c) | | 1,860,000 | 1,850,700 |
| 5.25% 5/15/27 (c) | | 6,975,000 | 7,184,250 |
| 5.25% 5/15/27 | | 3,780,000 | 3,893,400 |
| 6.25% 5/15/26 | | 4,405,000 | 4,673,705 |
| Ladder Capital Finance Holdings LLLP/Ladder Capital Finance Corp.: | | | |
| 4.25% 2/1/27 (c) | | 900,000 | 898,727 |
| 4.75% 6/15/29 (c) | | 1,695,000 | 1,695,000 |
| VMED O2 UK Financing I PLC 4.25% 1/31/31 (c) | | 2,690,000 | 2,642,602 |
| | | | 22,838,384 |
| Diversified Media - 1.2% | | | |
| Advantage Sales & Marketing, Inc. 6.5% 11/15/28 (c) | | 4,725,000 | 4,973,063 |
| Nielsen Finance LLC/Nielsen Finance Co.: | | | |
| 4.5% 7/15/29 (c) | | 1,110,000 | 1,113,108 |
| 5.625% 10/1/28 (c) | | 1,850,000 | 1,953,767 |
| 5.875% 10/1/30 (c) | | 1,840,000 | 2,002,699 |
| Terrier Media Buyer, Inc. 8.875% 12/15/27 (c) | | 2,105,000 | 2,276,031 |
| | | | 12,318,668 |
| Energy - 15.1% | | | |
| Apache Corp.: | | | |
| 4.25% 1/15/30 | | 435,000 | 458,925 |
| 5.1% 9/1/40 | | 2,085,000 | 2,184,038 |
| Atlantica Sustainable Infrastructure PLC 4.125% 6/15/28 (c) | | 530,000 | 539,964 |
| California Resources Corp. 7.125% 2/1/26 (c) | | 1,465,000 | 1,541,649 |
| Cheniere Energy, Inc. 4.625% 10/15/28 (c) | | 2,905,000 | 3,064,775 |
| Citgo Petroleum Corp.: | | | |
| 6.375% 6/15/26 (c) | | 6,680,000 | 6,963,900 |
| 7% 6/15/25 (c) | | 4,677,000 | 4,873,761 |
| CNX Resources Corp. 6% 1/15/29 (c) | | 430,000 | 464,925 |
| Comstock Resources, Inc.: | | | |
| 5.875% 1/15/30 (c) | | 2,660,000 | 2,713,200 |
| 6.75% 3/1/29 (c) | | 3,065,000 | 3,264,930 |
| 7.5% 5/15/25 (c) | | 434,000 | 450,275 |
| Crestwood Midstream Partners LP/Crestwood Midstream Finance Corp.: | | | |
| 5.625% 5/1/27 (c) | | 5,473,000 | 5,616,666 |
| 5.75% 4/1/25 | | 5,907,000 | 6,073,577 |
| 6% 2/1/29 (c) | | 5,200,000 | 5,447,000 |
| CVR Energy, Inc.: | | | |
| 5.25% 2/15/25 (c) | | 5,536,000 | 5,538,823 |
| 5.75% 2/15/28 (c) | | 4,164,000 | 4,196,063 |
| DCP Midstream Operating LP 8.125% 8/16/30 | | 55,000 | 73,013 |
| Delek Logistics Partners LP 7.125% 6/1/28 (c) | | 2,780,000 | 2,932,900 |
| Endeavor Energy Resources LP/EER Finance, Inc.: | | | |
| 5.5% 1/30/26 (c) | | 450,000 | 467,438 |
| 5.75% 1/30/28 (c) | | 1,635,000 | 1,743,319 |
| 6.625% 7/15/25 (c) | | 395,000 | 422,650 |
| EnLink Midstream LLC 5.625% 1/15/28 (c) | | 395,000 | 417,274 |
| EnLink Midstream Partners LP: | | | |
| 5.05% 4/1/45 | | 515,000 | 442,900 |
| 5.45% 6/1/47 | | 1,080,000 | 958,500 |
| 5.6% 4/1/44 | | 185,000 | 167,425 |
| EQM Midstream Partners LP: | | | |
| 4.75% 1/15/31 (c) | | 960,000 | 989,222 |
| 6.5% 7/1/27 (c) | | 1,705,000 | 1,901,075 |
| Global Partners LP/GLP Finance Corp. 6.875% 1/15/29 | | 2,060,000 | 2,209,350 |
| Harvest Midstream I LP 7.5% 9/1/28 (c) | | 1,790,000 | 1,943,940 |
| Hess Midstream Partners LP: | | | |
| 5.125% 6/15/28 (c) | | 2,465,000 | 2,585,169 |
| 5.625% 2/15/26 (c) | | 3,785,000 | 3,947,755 |
| Hilcorp Energy I LP/Hilcorp Finance Co. 6.25% 11/1/28 (c) | | 670,000 | 711,875 |
| Holly Energy Partners LP/Holly Energy Finance Corp. 5% 2/1/28 (c) | | 2,885,000 | 2,949,913 |
| MEG Energy Corp.: | | | |
| 5.875% 2/1/29 (c) | | 1,090,000 | 1,136,325 |
| 7.125% 2/1/27 (c) | | 1,090,000 | 1,161,204 |
| Mesquite Energy, Inc. 7.25% 2/15/23 (b)(c)(f) | | 5,722,000 | 1 |
| New Fortress Energy, Inc.: | | | |
| 6.5% 9/30/26 (c) | | 6,955,000 | 7,106,619 |
| 6.75% 9/15/25 (c) | | 8,015,000 | 8,205,356 |
| NGL Energy Operating LLC/NGL Energy Finance Corp. 7.5% 2/1/26 (c) | | 6,690,000 | 7,024,500 |
| Occidental Petroleum Corp.: | | | |
| 3.5% 8/15/29 | | 1,715,000 | 1,721,174 |
| 4.3% 8/15/39 | | 590,000 | 563,450 |
| 5.55% 3/15/26 | | 2,880,000 | 3,182,400 |
| 6.125% 1/1/31 | | 1,365,000 | 1,605,963 |
| 6.2% 3/15/40 | | 575,000 | 650,164 |
| 6.45% 9/15/36 | | 3,050,000 | 3,646,580 |
| 7.5% 5/1/31 | | 3,730,000 | 4,699,800 |
| 7.875% 9/15/31 | | 375,000 | 481,875 |
| 8.875% 7/15/30 | | 1,270,000 | 1,698,485 |
| PBF Holding Co. LLC/PBF Finance Corp. 9.25% 5/15/25 (c) | | 5,490,000 | 5,517,450 |
| Rockies Express Pipeline LLC: | | | |
| 4.8% 5/15/30 (c) | | 85,000 | 84,819 |
| 4.95% 7/15/29 (c) | | 1,010,000 | 1,041,613 |
| 6.875% 4/15/40 (c) | | 385,000 | 407,138 |
| SM Energy Co. 6.5% 7/15/28 | | 390,000 | 400,733 |
| Sunoco LP/Sunoco Finance Corp.: | | | |
| 4.5% 5/15/29 (c) | | 1,120,000 | 1,139,600 |
| 5.875% 3/15/28 | | 500,000 | 531,250 |
| 6% 4/15/27 | | 65,000 | 67,974 |
| Superior Plus LP / Superior General Partner, Inc. 4.5% 3/15/29 (c) | | 670,000 | 690,113 |
| Tallgrass Energy Partners LP / Tallgrass Energy Finance Corp.: | | | |
| 5.5% 1/15/28 (c) | | 1,652,000 | 1,680,910 |
| 6% 3/1/27 (c) | | 3,850,000 | 3,965,500 |
| 6% 12/31/30 (c) | | 2,070,000 | 2,152,013 |
| 7.5% 10/1/25 (c) | | 210,000 | 229,950 |
| Targa Resources Partners LP/Targa Resources Partners Finance Corp.: | | | |
| 4% 1/15/32 (c) | | 1,800,000 | 1,851,570 |
| 4.875% 2/1/31 (c) | | 2,567,000 | 2,778,778 |
| Transocean Guardian Ltd. 5.875% 1/15/24 (c) | | 862,750 | 839,025 |
| Transocean Phoenix 2 Ltd. 7.75% 10/15/24 (c) | | 165,000 | 170,775 |
| Transocean Pontus Ltd. 6.125% 8/1/25 (c) | | 431,375 | 436,429 |
| Transocean Poseidon Ltd. 6.875% 2/1/27 (c) | | 595,000 | 595,000 |
| Transocean Proteus Ltd. 6.25% 12/1/24 (c) | | 181,500 | 183,315 |
| Transocean Sentry Ltd. 5.375% 5/15/23 (c) | | 877,618 | 857,872 |
| Western Gas Partners LP: | | | |
| 4.35% 2/1/25 | | 1,750,000 | 1,849,033 |
| 4.65% 7/1/26 | | 660,000 | 704,339 |
| 5.3% 2/1/30 | | 2,170,000 | 2,430,411 |
| | | | 151,745,695 |
| Environmental - 1.1% | | | |
| LBC Tank Terminals Holding Netherlands BV 6.875% 5/15/23 (c) | | 3,630,000 | 3,620,925 |
| Madison IAQ LLC: | | | |
| 4.125% 6/30/28 (c) | | 2,380,000 | 2,403,800 |
| 5.875% 6/30/29 (c) | | 2,975,000 | 3,027,063 |
| Stericycle, Inc. 3.875% 1/15/29 (c) | | 1,625,000 | 1,621,799 |
| | | | 10,673,587 |
| Food & Drug Retail - 0.6% | | | |
| Albertsons Companies LLC/Safeway, Inc./New Albertson's, Inc./Albertson's LLC: | | | |
| 3.5% 3/15/29 (c) | | 3,997,000 | 3,952,034 |
| 4.875% 2/15/30 (c) | | 1,430,000 | 1,525,109 |
| Murphy Oil U.S.A., Inc. 3.75% 2/15/31 (c) | | 395,000 | 390,442 |
| | | | 5,867,585 |
| Food/Beverage/Tobacco - 3.3% | | | |
| C&S Group Enterprises LLC 5% 12/15/28 (c) | | 3,210,000 | 3,181,913 |
| JBS Finance Luxembourg SARL 3.625% 1/15/32 (c) | | 1,605,000 | 1,604,502 |
| JBS U.S.A. LLC/JBS U.S.A. Finance, Inc. 6.75% 2/15/28 (c) | | 940,000 | 1,032,825 |
| JBS U.S.A. Lux SA / JBS Food Co.: | | | |
| 3.75% 12/1/31 (c) | | 2,195,000 | 2,246,034 |
| 5.5% 1/15/30 (c) | | 2,735,000 | 3,058,769 |
| 6.5% 4/15/29 (c) | | 5,495,000 | 6,202,481 |
| Performance Food Group, Inc.: | | | |
| 5.5% 10/15/27 (c) | | 1,830,000 | 1,923,239 |
| 6.875% 5/1/25 (c) | | 2,480,000 | 2,641,498 |
| Post Holdings, Inc.: | | | |
| 4.5% 9/15/31 (c) | | 2,295,000 | 2,291,213 |
| 4.625% 4/15/30 (c) | | 1,125,000 | 1,143,934 |
| Primo Water Holdings, Inc. 4.375% 4/30/29 (c) | | 2,945,000 | 2,945,000 |
| TreeHouse Foods, Inc. 4% 9/1/28 | | 1,465,000 | 1,454,013 |
| Triton Water Holdings, Inc. 6.25% 4/1/29 (c) | | 2,235,000 | 2,240,588 |
| U.S. Foods, Inc. 4.75% 2/15/29 (c) | | 1,285,000 | 1,310,700 |
| | | | 33,276,709 |
| Gaming - 4.5% | | | |
| Affinity Gaming LLC 6.875% 12/15/27 (c) | | 2,425,000 | 2,573,531 |
| Boyd Gaming Corp. 4.75% 12/1/27 | | 1,090,000 | 1,128,150 |
| Caesars Entertainment, Inc.: | | | |
| 6.25% 7/1/25 (c) | | 3,365,000 | 3,566,900 |
| 8.125% 7/1/27 (c) | | 6,135,000 | 6,823,347 |
| Caesars Resort Collection LLC 5.25% 10/15/25 (c) | | 4,330,000 | 4,384,125 |
| Golden Entertainment, Inc. 7.625% 4/15/26 (c) | | 3,070,000 | 3,261,875 |
| Golden Nugget, Inc. 6.75% 10/15/24 (c) | | 4,845,000 | 4,894,516 |
| MCE Finance Ltd.: | | | |
| 5.375% 12/4/29 (c) | | 940,000 | 991,700 |
| 5.75% 7/21/28 (c) | | 1,420,000 | 1,498,100 |
| MGM Growth Properties Operating Partnership LP: | | | |
| 4.5% 1/15/28 | | 2,895,000 | 3,061,463 |
| 5.75% 2/1/27 | | 870,000 | 967,979 |
| Raptor Acquisition Corp. / Raptor Co-Issuer LLC 4.875% 11/1/26 (c) | | 795,000 | 806,114 |
| Station Casinos LLC: | | | |
| 4.5% 2/15/28 (c) | | 2,835,000 | 2,883,323 |
| 5% 10/1/25 (c) | | 1,860,000 | 1,887,900 |
| Wynn Las Vegas LLC/Wynn Las Vegas Capital Corp. 5.25% 5/15/27 (c) | | 1,935,000 | 2,078,384 |
| Wynn Macau Ltd.: | | | |
| 4.875% 10/1/24 (c) | | 1,845,000 | 1,870,715 |
| 5.5% 10/1/27 (c) | | 2,950,000 | 3,062,100 |
| | | | 45,740,222 |
| Healthcare - 6.5% | | | |
| Avantor Funding, Inc. 4.625% 7/15/28 (c) | | 2,795,000 | 2,950,877 |
| Bausch Health Companies, Inc.: | | | |
| 4.875% 6/1/28 (c) | | 1,335,000 | 1,366,373 |
| 5% 1/30/28 (c) | | 1,420,000 | 1,347,225 |
| 5% 2/15/29 (c) | | 595,000 | 554,838 |
| 7% 1/15/28 (c) | | 2,335,000 | 2,405,050 |
| Centene Corp. 4.625% 12/15/29 | | 3,100,000 | 3,409,287 |
| Charles River Laboratories International, Inc.: | | | |
| 3.75% 3/15/29 (c) | | 660,000 | 669,075 |
| 4.25% 5/1/28 (c) | | 290,000 | 299,788 |
| Community Health Systems, Inc.: | | | |
| 4.75% 2/15/31 (c) | | 2,065,000 | 2,072,744 |
| 5.625% 3/15/27 (c) | | 2,145,000 | 2,289,788 |
| 6% 1/15/29 (c) | | 1,190,000 | 1,273,300 |
| 6.125% 4/1/30 (c) | | 1,680,000 | 1,705,200 |
| 6.875% 4/15/29 (c) | | 1,160,000 | 1,213,905 |
| 8% 3/15/26 (c) | | 2,480,000 | 2,672,200 |
| CTR Partnership LP/CareTrust Capital Corp.: | | | |
| 3.875% 6/30/28 (c) | | 1,200,000 | 1,225,344 |
| 5.25% 6/1/25 | | 3,145,000 | 3,227,556 |
| DaVita HealthCare Partners, Inc. 4.625% 6/1/30 (c) | | 5,075,000 | 5,218,217 |
| Hologic, Inc.: | | | |
| 3.25% 2/15/29 (c) | | 2,030,000 | 2,012,238 |
| 4.625% 2/1/28 (c) | | 395,000 | 414,750 |
| IQVIA, Inc. 5% 5/15/27 (c) | | 2,745,000 | 2,875,388 |
| Jazz Securities DAC 4.375% 1/15/29 (c) | | 1,485,000 | 1,539,648 |
| Molina Healthcare, Inc. 3.875% 11/15/30 (c) | | 855,000 | 890,269 |
| Organon & Co. / Organon Foreign Debt Co-Issuer BV: | | | |
| 4.125% 4/30/28 (c) | | 1,930,000 | 1,968,214 |
| 5.125% 4/30/31 (c) | | 1,230,000 | 1,267,146 |
| Owens & Minor, Inc. 4.5% 3/31/29 (c) | | 585,000 | 601,088 |
| Radiology Partners, Inc. 9.25% 2/1/28 (c) | | 2,216,000 | 2,448,680 |
| RP Escrow Issuer LLC 5.25% 12/15/25 (c) | | 3,120,000 | 3,256,500 |
| Teleflex, Inc. 4.25% 6/1/28 (c) | | 535,000 | 557,738 |
| Tenet Healthcare Corp.: | | | |
| 4.25% 6/1/29 (c) | | 2,345,000 | 2,374,313 |
| 4.625% 6/15/28 (c) | | 2,470,000 | 2,542,124 |
| 4.875% 1/1/26 (c) | | 1,550,000 | 1,607,660 |
| 6.125% 10/1/28 (c) | | 4,680,000 | 4,987,195 |
| 6.25% 2/1/27 (c) | | 1,195,000 | 1,247,281 |
| Valeant Pharmaceuticals International, Inc. 8.5% 1/31/27 (c) | | 670,000 | 728,223 |
| Vizient, Inc. 6.25% 5/15/27 (c) | | 240,000 | 253,800 |
| | | | 65,473,022 |
| Homebuilders/Real Estate - 2.3% | | | |
| Howard Hughes Corp.: | | | |
| 4.125% 2/1/29 (c) | | 775,000 | 775,016 |
| 4.375% 2/1/31 (c) | | 775,000 | 772,195 |
| Realogy Group LLC/Realogy Co-Issuer Corp. 5.75% 1/15/29 (c) | | 2,735,000 | 2,859,142 |
| Service Properties Trust: | | | |
| 4.95% 2/15/27 | | 920,000 | 915,400 |
| 4.95% 10/1/29 | | 905,000 | 892,556 |
| 5.5% 12/15/27 | | 845,000 | 901,810 |
| Uniti Group LP / Uniti Group Finance, Inc.: | | | |
| 4.75% 4/15/28 (c) | | 4,155,000 | 4,144,613 |
| 6.5% 2/15/29 (c) | | 11,885,000 | 11,914,713 |
| | | | 23,175,445 |
| Hotels - 0.5% | | | |
| Hilton Domestic Operating Co., Inc.: | | | |
| 3.625% 2/15/32 (c) | | 2,175,000 | 2,147,813 |
| 3.75% 5/1/29 (c) | | 295,000 | 297,950 |
| 4% 5/1/31 (c) | | 1,055,000 | 1,064,358 |
| NCL Finance Ltd. 6.125% 3/15/28 (c) | | 370,000 | 387,742 |
| Viking Ocean Cruises Ship VII Ltd. 5.625% 2/15/29 (c) | | 370,000 | 373,700 |
| Wyndham Hotels & Resorts, Inc. 4.375% 8/15/28 (c) | | 1,060,000 | 1,100,503 |
| | | | 5,372,066 |
| Insurance - 1.7% | | | |
| Alliant Holdings Intermediate LLC: | | | |
| 4.25% 10/15/27 (c) | | 260,000 | 263,897 |
| 6.75% 10/15/27 (c) | | 8,742,000 | 9,187,492 |
| AmWINS Group, Inc. 7.75% 7/1/26 (c) | | 1,795,000 | 1,903,867 |
| AssuredPartners, Inc. 5.625% 1/15/29 (c) | | 795,000 | 795,000 |
| HUB International Ltd. 7% 5/1/26 (c) | | 2,155,000 | 2,234,929 |
| USI, Inc. 6.875% 5/1/25 (c) | | 2,235,000 | 2,263,005 |
| | | | 16,648,190 |
| Leisure - 2.0% | | | |
| Carnival Corp.: | | | |
| 5.75% 3/1/27 (c) | | 4,050,000 | 4,242,375 |
| 6.65% 1/15/28 | | 175,000 | 189,438 |
| 7.625% 3/1/26 (c) | | 4,445,000 | 4,828,381 |
| NCL Corp. Ltd. 5.875% 3/15/26 (c) | | 525,000 | 549,938 |
| Royal Caribbean Cruises Ltd.: | | | |
| 4.25% 7/1/26 (c) | | 2,390,000 | 2,387,013 |
| 5.5% 4/1/28 (c) | | 2,785,000 | 2,916,731 |
| 9.125% 6/15/23 (c) | | 470,000 | 515,825 |
| 11.5% 6/1/25 (c) | | 2,005,000 | 2,310,763 |
| Viking Cruises Ltd. 13% 5/15/25 (c) | | 635,000 | 747,039 |
| Voc Escrow Ltd. 5% 2/15/28 (c) | | 1,150,000 | 1,162,650 |
| | | | 19,850,153 |
| Metals/Mining - 0.9% | | | |
| First Quantum Minerals Ltd.: | | | |
| 6.875% 10/15/27 (c) | | 2,238,000 | 2,427,559 |
| 7.25% 4/1/23 (c) | | 4,195,000 | 4,268,413 |
| FMG Resources (August 2006) Pty Ltd.: | | | |
| 4.375% 4/1/31 (c) | | 1,800,000 | 1,921,500 |
| 4.5% 9/15/27 (c) | | 40,000 | 43,500 |
| Howmet Aerospace, Inc. 5.95% 2/1/37 | | 95,000 | 114,964 |
| HudBay Minerals, Inc. 4.5% 4/1/26 (c) | | 500,000 | 500,625 |
| | | | 9,276,561 |
| Paper - 0.7% | | | |
| Ardagh Metal Packaging Finance U.S.A. LLC/Ardagh Metal Packaging Finance PLC 4% 9/1/29 (c) | | 2,295,000 | 2,275,665 |
| Intertape Polymer Group, Inc. 4.375% 6/15/29 (c) | | 2,020,000 | 2,048,371 |
| SPA Holdings 3 OY 4.875% 2/4/28 (c) | | 2,600,000 | 2,619,500 |
| | | | 6,943,536 |
| Restaurants - 0.6% | | | |
| 1011778 BC Unlimited Liability Co./New Red Finance, Inc. 4% 10/15/30 (c) | | 3,815,000 | 3,691,013 |
| Yum! Brands, Inc. 4.625% 1/31/32 | | 1,985,000 | 2,084,250 |
| | | | 5,775,263 |
| Services - 5.8% | | | |
| Adtalem Global Education, Inc. 5.5% 3/1/28 (c) | | 4,200,000 | 4,265,310 |
| AECOM 5.125% 3/15/27 | | 2,775,000 | 3,095,175 |
| Allied Universal Holdco LLC / Allied Universal Finance Corp. 6% 6/1/29 (c) | | 450,000 | 456,206 |
| APX Group, Inc. 6.75% 2/15/27 (c) | | 2,032,000 | 2,166,518 |
| Aramark Services, Inc. 5% 2/1/28 (c) | | 3,815,000 | 3,995,068 |
| Ascend Learning LLC: | | | |
| 6.875% 8/1/25 (c) | | 335,000 | 341,281 |
| 6.875% 8/1/25 (c) | | 2,470,000 | 2,516,313 |
| ASGN, Inc. 4.625% 5/15/28 (c) | | 1,020,000 | 1,068,419 |
| Atlas Luxco 4 SARL / Allied Universal Holdco LLC / Allied Universal Finance Corp.: | | | |
| 4.625% 6/1/28 (c) | | 849,000 | 849,665 |
| 4.625% 6/1/28 (c) | | 2,326,000 | 2,334,397 |
| Booz Allen Hamilton, Inc.: | | | |
| 3.875% 9/1/28 (c) | | 2,865,000 | 2,922,300 |
| 4% 7/1/29 (c) | | 400,000 | 409,000 |
| Brand Energy & Infrastructure Services, Inc. 8.5% 7/15/25 (c) | | 5,105,000 | 5,190,407 |
| CoreCivic, Inc.: | | | |
| 4.75% 10/15/27 | | 1,155,000 | 1,053,591 |
| 8.25% 4/15/26 | | 1,780,000 | 1,847,106 |
| Gartner, Inc.: | | | |
| 3.625% 6/15/29 (c) | | 575,000 | 583,625 |
| 3.75% 10/1/30 (c) | | 955,000 | 977,070 |
| GEMS MENASA Cayman Ltd. 7.125% 7/31/26(c) | | 5,635,000 | 5,820,955 |
| Legends Hospitality Holding Co. LLC/Legends Hospitality Co-Issuer, Inc. 5% 2/1/26 (c) | | 3,035,000 | 3,163,988 |
| PowerTeam Services LLC 9.033% 12/4/25 (c) | | 1,170,000 | 1,287,000 |
| Service Corp. International: | | | |
| 4% 5/15/31 | | 1,460,000 | 1,490,186 |
| 5.125% 6/1/29 | | 1,420,000 | 1,540,700 |
| Sotheby's 7.375% 10/15/27 (c) | | 5,185,000 | 5,593,319 |
| The GEO Group, Inc. 6% 4/15/26 | | 1,315,000 | 1,065,150 |
| TriNet Group, Inc. 3.5% 3/1/29 (c) | | 2,295,000 | 2,262,870 |
| WASH Multifamily Acquisition, Inc. 5.75% 4/15/26 (c) | | 2,393,000 | 2,498,531 |
| | | | 58,794,150 |
| Super Retail - 1.5% | | | |
| EG Global Finance PLC: | | | |
| 6.75% 2/7/25 (c) | | 2,170,000 | 2,243,704 |
| 8.5% 10/30/25 (c) | | 3,690,000 | 3,902,175 |
| L Brands, Inc.: | | | |
| 5.25% 2/1/28 | | 235,000 | 262,906 |
| 6.625% 10/1/30 (c) | | 360,000 | 416,700 |
| 6.694% 1/15/27 | | 850,000 | 1,000,051 |
| 6.75% 7/1/36 | | 1,210,000 | 1,515,525 |
| LBM Acquisition LLC 6.25% 1/15/29 (c) | | 360,000 | 362,772 |
| Levi Strauss & Co. 3.5% 3/1/31 (c) | | 1,310,000 | 1,302,402 |
| The William Carter Co. 5.625% 3/15/27 (c) | | 1,575,000 | 1,657,215 |
| Wolverine World Wide, Inc. 6.375% 5/15/25 (c) | | 2,335,000 | 2,484,136 |
| | | | 15,147,586 |
| Technology - 4.2% | | | |
| Acuris Finance U.S. 5% 5/1/28 (c) | | 3,535,000 | 3,523,900 |
| Arches Buyer, Inc.: | | | |
| 4.25% 6/1/28 (c) | | 1,905,000 | 1,883,569 |
| 6.125% 12/1/28 (c) | | 3,405,000 | 3,507,150 |
| Black Knight InfoServ LLC 3.625% 9/1/28 (c) | | 2,525,000 | 2,512,274 |
| CDK Global, Inc. 5.25% 5/15/29 (c) | | 465,000 | 507,506 |
| Clarivate Science Holdings Corp.: | | | |
| 3.875% 6/30/28 (c) | | 715,000 | 721,514 |
| 4.875% 6/30/29 (c) | | 675,000 | 692,719 |
| Crowdstrike Holdings, Inc. 3% 2/15/29 | | 1,080,000 | 1,081,026 |
| Elastic NV 0% 6/30/29 (c) | | 540,000 | 540,000 |
| Gartner, Inc. 4.5% 7/1/28 (c) | | 1,470,000 | 1,552,496 |
| ION Trading Technologies Ltd. 5.75% 5/15/28 (c) | | 3,323,000 | 3,450,055 |
| Northwest Fiber LLC/Northwest Fiber Finance Sub, Inc. 10.75% 6/1/28 (c) | | 2,260,000 | 2,542,500 |
| ON Semiconductor Corp. 3.875% 9/1/28 (c) | | 1,115,000 | 1,148,606 |
| Rackspace Hosting, Inc. 5.375% 12/1/28 (c) | | 12,272,000 | 12,578,800 |
| Sensata Technologies BV 4% 4/15/29 (c) | | 995,000 | 1,010,008 |
| TTM Technologies, Inc. 4% 3/1/29 (c) | | 4,080,000 | 4,104,725 |
| Twilio, Inc. 3.875% 3/15/31 | | 730,000 | 749,163 |
| | | | 42,106,011 |
| Telecommunications - 11.5% | | | |
| Altice Financing SA: | | | |
| 5% 1/15/28 (c) | | 3,230,000 | 3,165,949 |
| 7.5% 5/15/26 (c) | | 2,260,000 | 2,353,338 |
| Altice France Holding SA 6% 2/15/28 (c) | | 4,250,000 | 4,218,125 |
| Altice France SA: | | | |
| 5.125% 1/15/29 (c) | | 5,570,000 | 5,597,850 |
| 5.125% 7/15/29 (c) | | 3,525,000 | 3,542,273 |
| 5.5% 1/15/28 (c) | | 6,850,000 | 7,108,245 |
| 8.125% 2/1/27 (c) | | 6,580,000 | 7,168,910 |
| C&W Senior Financing Designated Activity Co.: | | | |
| 6.875% 9/15/27 (c) | | 13,430,000 | 14,353,277 |
| 7.5% 10/15/26 (c) | | 6,270,000 | 6,583,500 |
| Cablevision Lightpath LLC: | | | |
| 3.875% 9/15/27 (c) | | 455,000 | 449,695 |
| 5.625% 9/15/28 (c) | | 360,000 | 366,660 |
| Consolidated Communications, Inc. 5% 10/1/28 (c) | | 535,000 | 542,356 |
| Frontier Communications Holdings LLC: | | | |
| 5% 5/1/28 (c) | | 4,695,000 | 4,853,832 |
| 5.875% 10/15/27 (c) | | 1,820,000 | 1,949,675 |
| 6.75% 5/1/29 (c) | | 2,335,000 | 2,482,735 |
| Level 3 Financing, Inc.: | | | |
| 3.625% 1/15/29 (c) | | 340,000 | 328,100 |
| 4.25% 7/1/28 (c) | | 2,320,000 | 2,354,243 |
| 4.625% 9/15/27 (c) | | 1,979,000 | 2,054,044 |
| Lumen Technologies, Inc.: | | | |
| 4.5% 1/15/29 (c) | | 4,950,000 | 4,830,953 |
| 5.125% 12/15/26 (c) | | 4,130,000 | 4,290,038 |
| 6.875% 1/15/28 | | 162,000 | 181,135 |
| Millicom International Cellular SA 4.5% 4/27/31 (c) | | 200,000 | 208,038 |
| Northwest Fiber LLC/Northwest Fiber Finance Sub, Inc. 6% 2/15/28 (c) | | 325,000 | 325,712 |
| Sable International Finance Ltd. 5.75% 9/7/27 (c) | | 515,000 | 540,596 |
| Sprint Capital Corp.: | | | |
| 6.875% 11/15/28 | | 6,978,000 | 8,949,285 |
| 8.75% 3/15/32 | | 3,865,000 | 5,874,800 |
| Telecom Italia Capital SA: | | | |
| 6% 9/30/34 | | 1,185,000 | 1,367,194 |
| 7.2% 7/18/36 | | 845,000 | 1,092,965 |
| 7.721% 6/4/38 | | 235,000 | 320,368 |
| Uniti Group, Inc.: | | | |
| 7.125% 12/15/24 (c) | | 2,325,000 | 2,403,469 |
| 7.875% 2/15/25 (c) | | 8,450,000 | 9,052,063 |
| Windstream Escrow LLC 7.75% 8/15/28 (c) | | 3,450,000 | 3,553,500 |
| Zayo Group Holdings, Inc.: | | | |
| 4% 3/1/27 (c) | | 1,600,000 | 1,588,992 |
| 6.125% 3/1/28 (c) | | 1,810,000 | 1,848,463 |
| | | | 115,900,378 |
| Transportation Ex Air/Rail - 0.1% | | | |
| Great Lakes Dredge & Dock Corp. 5.25% 6/1/29 (c) | | 595,000 | 612,910 |
| Utilities - 4.1% | | | |
| Clearway Energy Operating LLC: | | | |
| 3.75% 2/15/31 (c) | | 2,350,000 | 2,338,250 |
| 4.75% 3/15/28 (c) | | 585,000 | 613,519 |
| DCP Midstream Operating LP: | | | |
| 5.125% 5/15/29 | | 1,645,000 | 1,817,725 |
| 5.625% 7/15/27 | | 2,305,000 | 2,621,938 |
| Global Partners LP/GLP Finance Corp. 7% 8/1/27 | | 1,282,000 | 1,358,920 |
| InterGen NV 7% 6/30/23 (c) | | 4,960,000 | 4,922,800 |
| NRG Energy, Inc.: | | | |
| 3.375% 2/15/29 (c) | | 2,705,000 | 2,647,573 |
| 3.625% 2/15/31 (c) | | 820,000 | 805,814 |
| 5.25% 6/15/29 (c) | | 2,105,000 | 2,239,194 |
| NSG Holdings II LLC/NSG Holdings, Inc. 7.75% 12/15/25 (c) | | 6,783,626 | 7,224,561 |
| PG&E Corp.: | | | |
| 5% 7/1/28 | | 1,170,000 | 1,183,010 |
| 5.25% 7/1/30 | | 4,705,000 | 4,749,698 |
| Pike Corp. 5.5% 9/1/28 (c) | | 4,280,000 | 4,451,200 |
| Vistra Operations Co. LLC: | | | |
| 5% 7/31/27 (c) | | 1,948,000 | 1,999,875 |
| 5.625% 2/15/27 (c) | | 2,175,000 | 2,256,563 |
| | | | 41,230,640 |
|
| TOTAL NONCONVERTIBLE BONDS | | | 906,636,013 |
|
| TOTAL CORPORATE BONDS | | | |
| (Cost $887,493,774) | | | 919,128,835 |
| | | Shares | Value |
|
| Common Stocks - 0.6% | | | |
| Energy - 0.6% | | | |
| California Resources Corp. (g) | | 10,167 | 306,433 |
| California Resources Corp. warrants 10/27/24 (g) | | 1,768 | 13,578 |
| Jonah Energy Parent LLC (b) | | 58,499 | 2,738,338 |
| Mesquite Energy, Inc. (b) | | 82,533 | 2,989,337 |
|
| TOTAL ENERGY | | | 6,047,686 |
|
| Telecommunications - 0.0% | | | |
| CUI Acquisition Corp. Class E (b)(g) | | 1 | 35,011 |
| TOTAL COMMON STOCKS | | | |
| (Cost $5,297,179) | | | 6,082,697 |
| | | Principal Amount | Value |
|
| Bank Loan Obligations - 4.3% | | | |
| Cable/Satellite TV - 0.1% | | | |
| WideOpenWest Finance LLC Tranche B, term loan 3 month U.S. LIBOR + 3.250% 4.25% 8/19/23 (d)(e)(h) | | 1,290,543 | 1,286,245 |
| Chemicals - 0.2% | | | |
| Consolidated Energy Finance SA Tranche B 1LN, term loan 3 month U.S. LIBOR + 3.500% 5/7/25 (e)(h)(i) | | 2,395,000 | 2,322,144 |
| Energy - 0.1% | | | |
| EG America LLC Tranche B 1LN, term loan 3 month U.S. LIBOR + 4.000% 4.1473% 2/6/25 (d)(e)(h) | | 1,406,368 | 1,394,822 |
| Mesquite Energy, Inc.: | | | |
| 1LN, term loan 3 month U.S. LIBOR + 8.000% 0% (b)(e)(f)(h)(j) | | 1,525,908 | 0 |
| term loan 3 month U.S. LIBOR + 0.000% 0% (b)(e)(f)(h)(j) | | 658,000 | 0 |
|
| TOTAL ENERGY | | | 1,394,822 |
|
| Food/Beverage/Tobacco - 0.1% | | | |
| EG Finco Ltd. Tranche B, term loan 3 month U.S. LIBOR + 4.000% 4.1473% 2/6/25 (d)(e)(h) | | 947,552 | 939,772 |
| Gaming - 1.0% | | | |
| Golden Entertainment, Inc. Tranche B, term loan 3 month U.S. LIBOR + 3.000% 3.75% 10/20/24 (d)(e)(h) | | 4,091,766 | 4,061,077 |
| Golden Nugget LLC Tranche B 1LN, term loan 3 month U.S. LIBOR + 2.500% 3.25% 10/4/23 (d)(e)(h) | | 5,529,608 | 5,484,929 |
|
| TOTAL GAMING | | | 9,546,006 |
|
| Healthcare - 0.6% | | | |
| Gainwell Acquisition Corp. Tranche B 1LN, term loan 3 month U.S. LIBOR + 4.000% 4.75% 10/1/27 (d)(e)(h) | | 4,054,812 | 4,063,935 |
| Insulet Corp. Tranche B 1LN, term loan 1 month U.S. LIBOR + 3.250% 3.75% 5/4/28 (d)(e)(h) | | 185,000 | 185,117 |
| Jazz Financing Lux SARL Tranche B 1LN, term loan 1 month U.S. LIBOR + 3.500% 4% 5/5/28 (d)(e)(h) | | 475,000 | 476,335 |
| U.S. Renal Care, Inc. Tranche B 1LN, term loan 3 month U.S. LIBOR + 5.000% 5.125% 6/13/26 (d)(e)(h) | | 1,015,598 | 1,019,193 |
|
| TOTAL HEALTHCARE | | | 5,744,580 |
|
| Insurance - 0.5% | | | |
| Alliant Holdings Intermediate LLC Tranche B3 1LN, term loan 3 month U.S. LIBOR + 3.750% 4.25% 11/5/27 (d)(e)(h) | | 2,200,372 | 2,202,198 |
| HUB International Ltd. Tranche B, term loan 3 month U.S. LIBOR + 2.750% 2.9257% 4/25/25 (d)(e)(h) | | 2,543,445 | 2,513,915 |
|
| TOTAL INSURANCE | | | 4,716,113 |
|
| Services - 0.4% | | | |
| Allied Universal Holdco LLC Tranche B 1LN, term loan 1 month U.S. LIBOR + 3.750% 4.25% 5/14/28 (d)(e)(h) | | 815,000 | 817,038 |
| Brand Energy & Infrastructure Services, Inc. Tranche B, term loan 3 month U.S. LIBOR + 4.250% 5.25% 6/21/24 (d)(e)(h) | | 3,230,400 | 3,175,386 |
| CoreCivic, Inc. Tranche B 1LN, term loan 3 month U.S. LIBOR + 4.500% 5.5% 12/18/24 (d)(e)(h) | | 259,664 | 251,781 |
|
| TOTAL SERVICES | | | 4,244,205 |
|
| Super Retail - 0.2% | | | |
| LBM Acquisition LLC Tranche B 1LN, term loan: | | | |
| 3 month U.S. LIBOR + 3.750% 2.25% 12/18/27(d)(e)(h) | | 1,942,405 | 1,927,429 |
| 3 month U.S. LIBOR + 3.750% 4.5% 12/18/27 (d)(e)(h)(k) | | 432,727 | 429,391 |
|
| TOTAL SUPER RETAIL | | | 2,356,820 |
|
| Technology - 0.6% | | | |
| Acuris Finance U.S., Inc. 1LN, term loan 3 month U.S. LIBOR + 4.000% 4.5% 2/16/28 (d)(e)(h) | | 589,062 | 590,535 |
| Northwest Fiber LLC Tranche B 1LN, term loan 3 month U.S. LIBOR + 3.750% 3.8226% 4/30/27 (d)(e)(h) | | 1,443,630 | 1,442,909 |
| Tempo Acquisition LLC Tranche B 1LN, term loan 3 month U.S. LIBOR + 3.250% 3.75% 10/31/26 (d)(e)(h) | | 2,431,578 | 2,434,107 |
| UKG, Inc. Tranche B 1LN, term loan 3 month U.S. LIBOR + 3.250% 4% 5/4/26 (d)(e)(h) | | 1,235,678 | 1,236,395 |
|
| TOTAL TECHNOLOGY | | | 5,703,946 |
|
| Telecommunications - 0.5% | | | |
| GTT Communications, Inc. Tranche B, term loan 3 month U.S. LIBOR + 2.750% 2.9% 5/31/25 (d)(e)(h) | | 3,392,939 | 2,665,153 |
| Intelsat Jackson Holdings SA: | | | |
| Tranche B-4, term loan 3 month U.S. LIBOR + 5.500% 8.75% 1/2/24 (d)(e)(h) | | 280,000 | 284,726 |
| Tranche DD 1LN, term loan 3 month U.S. LIBOR + 5.500% 6.5% 7/13/22 (d)(e)(h) | | 2,116,460 | 2,128,376 |
|
| TOTAL TELECOMMUNICATIONS | | | 5,078,255 |
|
| TOTAL BANK LOAN OBLIGATIONS | | | |
| (Cost $44,497,270) | | | 43,332,908 |
| | | Shares | Value |
|
| Money Market Funds - 4.0% | | | |
| Fidelity Cash Central Fund 0.06% (l) | | | |
| (Cost $40,832,060) | | 40,824,222 | 40,832,386 |
| TOTAL INVESTMENT IN SECURITIES - 100.3% | | | |
| (Cost $978,120,283) | | | 1,009,376,826 |
| NET OTHER ASSETS (LIABILITIES) - (0.3)% | | | (3,461,107) |
| NET ASSETS - 100% | | | $1,005,915,719 |
Legend
(a) Restricted securities (including private placements) - Investment in securities not registered under the Securities Act of 1933 (excluding 144A issues). At the end of the period, the value of restricted securities (excluding 144A issues) amounted to $5,585,056 or 0.6% of net assets.
(b) Level 3 security
(c) Security exempt from registration under Rule 144A of the Securities Act of 1933. These securities may be resold in transactions exempt from registration, normally to qualified institutional buyers. At the end of the period, the value of these securities amounted to $755,089,178 or 75.1% of net assets.
(d) Coupon rates for floating and adjustable rate securities reflect the rates in effect at period end.
(e) Coupon is indexed to a floating interest rate which may be multiplied by a specified factor and/or subject to caps or floors.
(f) Non-income producing - Security is in default.
(g) Non-income producing
(h) Remaining maturities of bank loan obligations may be less than the stated maturities shown as a result of contractual or optional prepayments by the borrower. Such prepayments cannot be predicted with certainty.
(i) The coupon rate will be determined upon settlement of the loan after period end.
(j) Security is perpetual in nature with no stated maturity date.
(k) Position or a portion of the position represents an unfunded loan commitment. At period end, the total principal amount and market value of unfunded commitments totaled $10,606 and $10,524, respectively.
(l) Affiliated fund that is generally available only to investment companies and other accounts managed by Fidelity Investments. The rate quoted is the annualized seven-day yield of the fund at period end. A complete unaudited listing of the fund's holdings as of its most recent quarter end is available upon request. In addition, each Fidelity Central Fund's financial statements are available on the SEC's website or upon request.
Additional information on each restricted holding is as follows:
| Security | Acquisition Date | Acquisition Cost |
| Mesquite Energy, Inc. 15% 7/15/23 | 7/10/20 - 4/15/21 | $580,578 |
| Mesquite Energy, Inc. 15% 7/15/23 | 11/05/20 - 4/15/21 | 1,002,320 |
Affiliated Central Funds
Information regarding fiscal year to date income earned by the Fund from investments in Fidelity Central Funds is as follows:
| Fund | Income earned |
| Fidelity Cash Central Fund | $7,245 |
| Total | $7,245 |
Amounts in the income column in the above table include any capital gain distributions from underlying funds, which are presented in the corresponding line-item in the Statement of Operations, if applicable.
Fiscal year to date information regarding the Fund's investments in Fidelity Central Funds, including the ownership percentage, is presented below.
| Fund | Value, beginning of period | Purchases | Sales Proceeds | Realized Gain/Loss | Change in Unrealized appreciation (depreciation) | Value, end of period | % ownership, end of period |
| Fidelity Cash Central Fund 0.06% | $15,871,226 | $215,182,561 | $190,221,248 | $(152) | $(1) | $40,832,386 | 0.1% |
| Total | $15,871,226 | $215,182,561 | $190,221,248 | $(152) | $(1) | $40,832,386 | |
Investment Valuation
The following is a summary of the inputs used, as of June 30, 2021, involving the Fund's assets and liabilities carried at fair value. The inputs or methodology used for valuing securities may not be an indication of the risk associated with investing in those securities. For more information on valuation inputs, and their aggregation into the levels used below, please refer to the Investment Valuation section in the accompanying Notes to Financial Statements.
| | Valuation Inputs at Reporting Date: |
| Description | Total | Level 1 | Level 2 | Level 3 |
| Investments in Securities: | | | | |
| Equities: | | | | |
| Communication Services | $35,011 | $-- | $-- | $35,011 |
| Energy | 6,047,686 | 320,011 | -- | 5,727,675 |
| Corporate Bonds | 919,128,835 | -- | 913,543,778 | 5,585,057 |
| Bank Loan Obligations | 43,332,908 | -- | 43,332,908 | -- |
| Money Market Funds | 40,832,386 | 40,832,386 | -- | -- |
| Total Investments in Securities: | $1,009,376,826 | $41,152,397 | $956,876,686 | $11,347,743 |
The following is a reconciliation of Investments in Securities for which Level 3 inputs were used in determining value:
| Investments in Securities: | |
| Beginning Balance | $3,711,900 |
| Net Realized Gain (Loss) on Investment Securities | (2,119,144) |
| Net Unrealized Gain (Loss) on Investment Securities | 9,841,295 |
| Cost of Purchases | 104,519 |
| Proceeds of Sales | -- |
| Amortization/Accretion | (190,827) |
| Transfers into Level 3 | -- |
| Transfers out of Level 3 | -- |
| Ending Balance | $11,347,743 |
| The change in unrealized gain (loss) for the period attributable to Level 3 securities held at June 30, 2021 | $7,531,824 |
The information used in the above reconciliation represents fiscal year to date activity for any Investments in Securities identified as using Level 3 inputs at either the beginning or the end of the current fiscal period. Cost of purchases and proceeds of sales may include securities received and/or delivered through in-kind transactions. Transfers in or out of Level 3 represent the beginning value of any Security or Instrument where a change in the pricing level occurred from the beginning to the end of the period. The cost of purchases and the proceeds of sales may include securities received or delivered through corporate actions or exchanges. Realized and unrealized gains (losses) disclosed in the reconciliation are included in Net Gain (Loss) on the Fund's Statement of Operations.
Other Information
Distribution of investments by country or territory of incorporation, as a percentage of Total Net Assets, is as follows (Unaudited):
| United States of America | 76.6% |
| Canada | 5.5% |
| Luxembourg | 3.3% |
| Ireland | 2.5% |
| France | 2.4% |
| Netherlands | 2.0% |
| Multi-National | 1.9% |
| Cayman Islands | 1.7% |
| United Kingdom | 1.5% |
| Others (Individually Less Than 1%) | 2.6% |
| | 100.0% |
See accompanying notes which are an integral part of the financial statements.
Financial Statements
Statement of Assets and Liabilities
| | | June 30, 2021 (Unaudited) |
| Assets | | |
Investment in securities, at value — See accompanying schedule:
Unaffiliated issuers (cost $937,288,223) | $968,544,440 | |
| Fidelity Central Funds (cost $40,832,060) | 40,832,386 | |
| Total Investment in Securities (cost $978,120,283) | | $1,009,376,826 |
| Cash | | 12,603 |
| Receivable for investments sold | | 3,219,207 |
| Receivable for fund shares sold | | 229,384 |
| Dividends receivable | | 11,463 |
| Interest receivable | | 13,773,345 |
| Distributions receivable from Fidelity Central Funds | | 1,526 |
| Other receivables | | 99 |
| Total assets | | 1,026,624,453 |
| Liabilities | | |
| Payable for investments purchased | $19,669,840 | |
| Payable for fund shares redeemed | 400,645 | |
| Accrued management fee | 454,745 | |
| Distribution and service plan fees payable | 41,148 | |
| Other affiliated payables | 98,700 | |
| Other payables and accrued expenses | 43,656 | |
| Total liabilities | | 20,708,734 |
| Net Assets | | $1,005,915,719 |
| Net Assets consist of: | | |
| Paid in capital | | $1,045,832,872 |
| Total accumulated earnings (loss) | | (39,917,153) |
| Net Assets | | $1,005,915,719 |
| Net Asset Value and Maximum Offering Price | | |
| Initial Class: | | |
| Net Asset Value, offering price and redemption price per share ($314,524,455 ÷ 57,889,166 shares) | | $5.43 |
| Service Class: | | |
| Net Asset Value, offering price and redemption price per share ($79,295,698 ÷ 14,720,986 shares) | | $5.39 |
| Service Class 2: | | |
| Net Asset Value, offering price and redemption price per share ($167,448,057 ÷ 32,173,036 shares) | | $5.20 |
| Investor Class: | | |
| Net Asset Value, offering price and redemption price per share ($444,647,509 ÷ 82,354,956 shares) | | $5.40 |
See accompanying notes which are an integral part of the financial statements.
Statement of Operations
| | | Six months ended June 30, 2021 (Unaudited) |
| Investment Income | | |
| Interest | | $25,329,000 |
| Income from Fidelity Central Funds | | 7,245 |
| Total income | | 25,336,245 |
| Expenses | | |
| Management fee | $2,674,017 | |
| Transfer agent fees | 405,721 | |
| Distribution and service plan fees | 240,276 | |
| Accounting fees and expenses | 175,461 | |
| Custodian fees and expenses | 8,388 | |
| Independent trustees' fees and expenses | 1,640 | |
| Audit | 40,388 | |
| Legal | 2,040 | |
| Miscellaneous | 2,785 | |
| Total expenses before reductions | 3,550,716 | |
| Expense reductions | (1,689) | |
| Total expenses after reductions | | 3,549,027 |
| Net investment income (loss) | | 21,787,218 |
| Realized and Unrealized Gain (Loss) | | |
| Net realized gain (loss) on: | | |
| Investment securities: | | |
| Unaffiliated issuers | 12,194,560 | |
| Fidelity Central Funds | (152) | |
| Total net realized gain (loss) | | 12,194,408 |
| Change in net unrealized appreciation (depreciation) on: | | |
| Investment securities: | | |
| Unaffiliated issuers | (2,834,411) | |
| Fidelity Central Funds | (1) | |
| Total change in net unrealized appreciation (depreciation) | | (2,834,412) |
| Net gain (loss) | | 9,359,996 |
| Net increase (decrease) in net assets resulting from operations | | $31,147,214 |
See accompanying notes which are an integral part of the financial statements.
Statement of Changes in Net Assets
| | Six months ended June 30, 2021 (Unaudited) | Year ended December 31, 2020 |
| Increase (Decrease) in Net Assets | | |
| Operations | | |
| Net investment income (loss) | $21,787,218 | $47,269,542 |
| Net realized gain (loss) | 12,194,408 | (36,758,696) |
| Change in net unrealized appreciation (depreciation) | (2,834,412) | 10,013,121 |
| Net increase (decrease) in net assets resulting from operations | 31,147,214 | 20,523,967 |
| Distributions to shareholders | (8,022,280) | (47,004,184) |
| Share transactions - net increase (decrease) | 13,677,798 | (48,310,959) |
| Total increase (decrease) in net assets | 36,802,732 | (74,791,176) |
| Net Assets | | |
| Beginning of period | 969,112,987 | 1,043,904,163 |
| End of period | $1,005,915,719 | $969,112,987 |
See accompanying notes which are an integral part of the financial statements.
Financial Highlights
VIP High Income Portfolio Initial Class
| | Six months ended (Unaudited) June 30, | Years endedDecember 31, | | | | |
| | 2021 | 2020 | 2019 | 2018 | 2017 | 2016 |
| Selected Per–Share Data | | | | | | |
| Net asset value, beginning of period | $5.31 | $5.43 | $4.97 | $5.46 | $5.38 | $4.95 |
| Income from Investment Operations | | | | | | |
| Net investment income (loss)A | .120 | .266 | .286 | .288 | .290 | .320 |
| Net realized and unrealized gain (loss) | .044 | (.121) | .457 | (.473) | .091 | .402 |
| Total from investment operations | .164 | .145 | .743 | (.185) | .381 | .722 |
| Distributions from net investment income | (.044) | (.265) | (.283) | (.305) | (.301) | (.292) |
| Total distributions | (.044) | (.265) | (.283) | (.305) | (.301) | (.292) |
| Net asset value, end of period | $5.43 | $5.31 | $5.43 | $4.97 | $5.46 | $5.38 |
| Total ReturnB,C,D | 3.11% | 2.75% | 15.11% | (3.46)% | 7.13% | 14.61% |
| Ratios to Average Net AssetsE,F | | | | | | |
| Expenses before reductions | .67%G | .67% | .67% | .67% | .67% | .68% |
| Expenses net of fee waivers, if any | .67%G | .67% | .67% | .67% | .67% | .68% |
| Expenses net of all reductions | .67%G | .67% | .67% | .67% | .67% | .68% |
| Net investment income (loss) | 4.57%G | 5.14% | 5.31% | 5.33% | 5.22% | 6.05% |
| Supplemental Data | | | | | | |
| Net assets, end of period (000 omitted) | $314,524 | $313,973 | $327,442 | $299,239 | $355,469 | $457,620 |
| Portfolio turnover rateH | 73%G | 72% | 30% | 69% | 70% | 73% |
A Calculated based on average shares outstanding during the period.
B Total returns for periods of less than one year are not annualized.
C Total returns do not reflect charges attributable to your insurance company's separate account. Inclusion of these charges would reduce the total returns shown.
D Total returns would have been lower if certain expenses had not been reduced during the applicable periods shown.
E Fees and expenses of any underlying mutual funds or exchange-traded funds (ETFs) are not included in the Fund's expense ratio. The Fund indirectly bears its proportionate share of these expenses. For additional expense information related to investments in Fidelity Central Funds, please refer to the "Investments in Fidelity Central Funds" note found in the Notes to Financial Statements section of the most recent Annual or Semi-Annual report.
F Expense ratios reflect operating expenses of the class. Expenses before reductions do not reflect amounts reimbursed, waived, or reduced through arrangements with the investment adviser, brokerage services, or other offset arrangements, if applicable, and do not represent the amount paid by the class during periods when reimbursements, waivers or reductions occur.
G Annualized
H Amount does not include the portfolio activity of any underlying mutual funds or exchange-traded funds (ETFs).
See accompanying notes which are an integral part of the financial statements.
VIP High Income Portfolio Service Class
| | Six months ended (Unaudited) June 30, | Years endedDecember 31, | | | | |
| | 2021 | 2020 | 2019 | 2018 | 2017 | 2016 |
| Selected Per–Share Data | | | | | | |
| Net asset value, beginning of period | $5.26 | $5.38 | $4.93 | $5.42 | $5.34 | $4.92 |
| Income from Investment Operations | | | | | | |
| Net investment income (loss)A | .116 | .259 | .279 | .280 | .283 | .311 |
| Net realized and unrealized gain (loss) | .057 | (.120) | .449 | (.471) | .092 | .395 |
| Total from investment operations | .173 | .139 | .728 | (.191) | .375 | .706 |
| Distributions from net investment income | (.043) | (.259) | (.278) | (.299) | (.295) | (.286) |
| Total distributions | (.043) | (.259) | (.278) | (.299) | (.295) | (.286) |
| Net asset value, end of period | $5.39 | $5.26 | $5.38 | $4.93 | $5.42 | $5.34 |
| Total ReturnB,C,D | 3.31% | 2.65% | 14.92% | (3.60)% | 7.07% | 14.37% |
| Ratios to Average Net AssetsE,F | | | | | | |
| Expenses before reductions | .77%G | .77% | .77% | .77% | .77% | .78% |
| Expenses net of fee waivers, if any | .77%G | .77% | .77% | .77% | .77% | .78% |
| Expenses net of all reductions | .77%G | .77% | .77% | .77% | .77% | .78% |
| Net investment income (loss) | 4.46%G | 5.04% | 5.21% | 5.23% | 5.12% | 5.95% |
| Supplemental Data | | | | | | |
| Net assets, end of period (000 omitted) | $79,296 | $53,326 | $66,123 | $58,231 | $68,104 | $84,945 |
| Portfolio turnover rateH | 73%G | 72% | 30% | 69% | 70% | 73% |
A Calculated based on average shares outstanding during the period.
B Total returns for periods of less than one year are not annualized.
C Total returns do not reflect charges attributable to your insurance company's separate account. Inclusion of these charges would reduce the total returns shown.
D Total returns would have been lower if certain expenses had not been reduced during the applicable periods shown.
E Fees and expenses of any underlying mutual funds or exchange-traded funds (ETFs) are not included in the Fund's expense ratio. The Fund indirectly bears its proportionate share of these expenses. For additional expense information related to investments in Fidelity Central Funds, please refer to the "Investments in Fidelity Central Funds" note found in the Notes to Financial Statements section of the most recent Annual or Semi-Annual report.
F Expense ratios reflect operating expenses of the class. Expenses before reductions do not reflect amounts reimbursed, waived, or reduced through arrangements with the investment adviser, brokerage services, or other offset arrangements, if applicable, and do not represent the amount paid by the class during periods when reimbursements, waivers or reductions occur.
G Annualized
H Amount does not include the portfolio activity of any underlying mutual funds or exchange-traded funds (ETFs).
See accompanying notes which are an integral part of the financial statements.
VIP High Income Portfolio Service Class 2
| | Six months ended (Unaudited) June 30, | Years endedDecember 31, | | | | |
| | 2021 | 2020 | 2019 | 2018 | 2017 | 2016 |
| Selected Per–Share Data | | | | | | |
| Net asset value, beginning of period | $5.09 | $5.22 | $4.79 | $5.27 | $5.20 | $4.80 |
| Income from Investment Operations | | | | | | |
| Net investment income (loss)A | .109 | .244 | .262 | .264 | .267 | .296 |
| Net realized and unrealized gain (loss) | .043 | (.121) | .438 | (.451) | .090 | .383 |
| Total from investment operations | .152 | .123 | .700 | (.187) | .357 | .679 |
| Distributions from net investment income | (.042) | (.253) | (.270) | (.293) | (.287) | (.279) |
| Total distributions | (.042) | (.253) | (.270) | (.293) | (.287) | (.279) |
| Net asset value, end of period | $5.20 | $5.09 | $5.22 | $4.79 | $5.27 | $5.20 |
| Total ReturnB,C,D | 3.01% | 2.42% | 14.77% | (3.63)% | 6.91% | 14.17% |
| Ratios to Average Net AssetsE,F | | | | | | |
| Expenses before reductions | .92%G | .92% | .92% | .92% | .92% | .93% |
| Expenses net of fee waivers, if any | .92%G | .92% | .92% | .92% | .92% | .93% |
| Expenses net of all reductions | .92%G | .92% | .92% | .92% | .92% | .93% |
| Net investment income (loss) | 4.31%G | 4.89% | 5.06% | 5.08% | 4.97% | 5.80% |
| Supplemental Data | | | | | | |
| Net assets, end of period (000 omitted) | $167,448 | $170,257 | $187,747 | $139,564 | $166,993 | $189,179 |
| Portfolio turnover rateH | 73%G | 72% | 30% | 69% | 70% | 73% |
A Calculated based on average shares outstanding during the period.
B Total returns for periods of less than one year are not annualized.
C Total returns do not reflect charges attributable to your insurance company's separate account. Inclusion of these charges would reduce the total returns shown.
D Total returns would have been lower if certain expenses had not been reduced during the applicable periods shown.
E Fees and expenses of any underlying mutual funds or exchange-traded funds (ETFs) are not included in the Fund's expense ratio. The Fund indirectly bears its proportionate share of these expenses. For additional expense information related to investments in Fidelity Central Funds, please refer to the "Investments in Fidelity Central Funds" note found in the Notes to Financial Statements section of the most recent Annual or Semi-Annual report.
F Expense ratios reflect operating expenses of the class. Expenses before reductions do not reflect amounts reimbursed, waived, or reduced through arrangements with the investment adviser, brokerage services, or other offset arrangements, if applicable, and do not represent the amount paid by the class during periods when reimbursements, waivers or reductions occur.
G Annualized
H Amount does not include the portfolio activity of any underlying mutual funds or exchange-traded funds (ETFs).
See accompanying notes which are an integral part of the financial statements.
VIP High Income Portfolio Investor Class
| | Six months ended (Unaudited) June 30, | Years endedDecember 31, | | | | |
| | 2021 | 2020 | 2019 | 2018 | 2017 | 2016 |
| Selected Per–Share Data | | | | | | |
| Net asset value, beginning of period | $5.27 | $5.39 | $4.94 | $5.43 | $5.36 | $4.93 |
| Income from Investment Operations | | | | | | |
| Net investment income (loss)A | .119 | .263 | .283 | .284 | .287 | .317 |
| Net realized and unrealized gain (loss) | .055 | (.119) | .448 | (.470) | .083 | .403 |
| Total from investment operations | .174 | .144 | .731 | (.186) | .370 | .720 |
| Distributions from net investment income | (.044) | (.264) | (.281) | (.304) | (.300) | (.290) |
| Total distributions | (.044) | (.264) | (.281) | (.304) | (.300) | (.290) |
| Net asset value, end of period | $5.40 | $5.27 | $5.39 | $4.94 | $5.43 | $5.36 |
| Total ReturnB,C,D | 3.33% | 2.74% | 14.94% | (3.50)% | 6.95% | 14.64% |
| Ratios to Average Net AssetsE,F | | | | | | |
| Expenses before reductions | .70%G | .71% | .70% | .71% | .71% | .71% |
| Expenses net of fee waivers, if any | .70%G | .71% | .70% | .71% | .71% | .71% |
| Expenses net of all reductions | .70%G | .71% | .70% | .71% | .71% | .71% |
| Net investment income (loss) | 4.53%G | 5.11% | 5.28% | 5.30% | 5.18% | 6.02% |
| Supplemental Data | | | | | | |
| Net assets, end of period (000 omitted) | $444,648 | $431,557 | $462,593 | $391,173 | $456,983 | $469,732 |
| Portfolio turnover rateH | 73%G | 72% | 30% | 69% | 70% | 73% |
A Calculated based on average shares outstanding during the period.
B Total returns for periods of less than one year are not annualized.
C Total returns do not reflect charges attributable to your insurance company's separate account. Inclusion of these charges would reduce the total returns shown.
D Total returns would have been lower if certain expenses had not been reduced during the applicable periods shown.
E Fees and expenses of any underlying mutual funds or exchange-traded funds (ETFs) are not included in the Fund's expense ratio. The Fund indirectly bears its proportionate share of these expenses. For additional expense information related to investments in Fidelity Central Funds, please refer to the "Investments in Fidelity Central Funds" note found in the Notes to Financial Statements section of the most recent Annual or Semi-Annual report.
F Expense ratios reflect operating expenses of the class. Expenses before reductions do not reflect amounts reimbursed, waived, or reduced through arrangements with the investment adviser, brokerage services, or other offset arrangements, if applicable, and do not represent the amount paid by the class during periods when reimbursements, waivers or reductions occur.
G Annualized
H Amount does not include the portfolio activity of any underlying mutual funds or exchange-traded funds (ETFs).
See accompanying notes which are an integral part of the financial statements.
Notes to Financial Statements (Unaudited)
For the period ended June 30, 2021
1. Organization.
VIP High Income Portfolio (the Fund) is a fund of Variable Insurance Products Fund (the Trust) and is authorized to issue an unlimited number of shares. The Trust is registered under the Investment Company Act of 1940, as amended (the 1940 Act), as an open-end management investment company organized as a Massachusetts business trust. Shares of the Fund may only be purchased by insurance companies for the purpose of funding variable annuity or variable life insurance contracts. The Fund offers the following classes of shares: Initial Class shares, Service Class shares, Service Class 2 shares and Investor Class shares. All classes have equal rights and voting privileges, except for matters affecting a single class.
2. Investments in Fidelity Central Funds.
Funds may invest in Fidelity Central Funds, which are open-end investment companies generally available only to other investment companies and accounts managed by the investment adviser and its affiliates. The Schedule of Investments lists any Fidelity Central Funds held as an investment as of period end, but does not include the underlying holdings of each Fidelity Central Fund. An investing fund indirectly bears its proportionate share of the expenses of the underlying Fidelity Central Funds.
Based on its investment objective, each Fidelity Central Fund may invest or participate in various investment vehicles or strategies that are similar to those of the investing fund. These strategies are consistent with the investment objectives of the investing fund and may involve certain economic risks which may cause a decline in value of each of the Fidelity Central Funds and thus a decline in the value of the investing fund.
| Fidelity Central Fund | Investment Manager | Investment Objective | Investment Practices | Expense Ratio(a) |
| Fidelity Money Market Central Funds | Fidelity Management & Research Company LLC (FMR) | Each fund seeks to obtain a high level of current income consistent with the preservation of capital and liquidity. | Short-term Investments | Less than .005% to .01% |
(a) Expenses expressed as a percentage of average net assets and are as of each underlying Central Fund's most recent annual or semi-annual shareholder report.
A complete unaudited list of holdings for each Fidelity Central Fund is available upon request or at the Securities and Exchange Commission website at www.sec.gov. In addition, the financial statements of the Fidelity Central Funds which contain the significant accounting policies (including investment valuation policies) of those funds, and are not covered by the Report of Independent Registered Public Accounting Firm, are available on the Securities and Exchange Commission website or upon request.
3. Significant Accounting Policies.
The Fund is an investment company and applies the accounting and reporting guidance of the Financial Accounting Standards Board (FASB) Accounting Standards Codification Topic 946 Financial Services - Investment Companies. The financial statements have been prepared in conformity with accounting principles generally accepted in the United States of America (GAAP), which require management to make certain estimates and assumptions at the date of the financial statements. Actual results could differ from those estimates. Subsequent events, if any, through the date that the financial statements were issued have been evaluated in the preparation of the financial statements. The Fund's Schedule of Investments lists any underlying mutual funds or exchange-traded funds (ETFs) but does not include the underlying holdings of these funds. The following summarizes the significant accounting policies of the Fund:
Investment Valuation. Investments are valued as of 4:00 p.m. Eastern time on the last calendar day of the period. The Board of Trustees (the Board) has delegated the day to day responsibility for the valuation of the Fund's investments to the Fair Value Committee (the Committee) established by the Fund's investment adviser. In accordance with valuation policies and procedures approved by the Board, the Fund attempts to obtain prices from one or more third party pricing vendors or brokers to value its investments. When current market prices, quotations or currency exchange rates are not readily available or reliable, investments will be fair valued in good faith by the Committee, in accordance with procedures adopted by the Board. Factors used in determining fair value vary by investment type and may include market or investment specific events, changes in interest rates and credit quality. The frequency with which these procedures are used cannot be predicted and they may be utilized to a significant extent. The Committee oversees the Fund's valuation policies and procedures and reports to the Board on the Committee's activities and fair value determinations. The Board monitors the appropriateness of the procedures used in valuing the Fund's investments and ratifies the fair value determinations of the Committee.
The Fund categorizes the inputs to valuation techniques used to value its investments into a disclosure hierarchy consisting of three levels as shown below:
- Level 1 – quoted prices in active markets for identical investments
- Level 2 – other significant observable inputs (including quoted prices for similar investments, interest rates, prepayment speeds, etc.)
- Level 3 – unobservable inputs (including the Fund's own assumptions based on the best information available)
Valuation techniques used to value the Fund's investments by major category are as follows:
Debt securities, including restricted securities, are valued based on evaluated prices received from third party pricing vendors or from brokers who make markets in such securities. Corporate bonds and bank loan obligations are valued by pricing vendors who utilize matrix pricing which considers yield or price of bonds of comparable quality, coupon, maturity and type or by broker-supplied prices. When independent prices are unavailable or unreliable, debt securities may be valued utilizing pricing methodologies which consider similar factors that would be used by third party pricing vendors. For foreign debt securities, when significant market or security specific events arise, valuations may be determined in good faith in accordance with procedures adopted by the Board. Debt securities are generally categorized as Level 2 in the hierarchy but may be Level 3 depending on the circumstances. The Fund invests a significant portion of its assets in below investment grade securities. The value of these securities can be more volatile due to changes in the credit quality of the issuer and is sensitive to changes in economic, market and regulatory conditions.
Equity securities, including restricted securities, for which market quotations are readily available, are valued at the last reported sale price or official closing price as reported by a third party pricing vendor on the primary market or exchange on which they are traded and are categorized as Level 1 in the hierarchy. In the event there were no sales during the day or closing prices are not available, securities are valued at the last quoted bid price or may be valued using the last available price and are generally categorized as Level 2 in the hierarchy. For equity securities, including restricted securities, where observable inputs are limited, assumptions about market activity and risk are used and these securities may be categorized as Level 3 in the hierarchy. Securities, including private placements or other restricted securities, for which observable inputs are not available are valued using alternate valuation approaches, including the market approach, the income approach and cost approach are categorized as Level 3 in the hierarchy. The market approach considers factors including the price of recent investments in the same or a similar security or financial metrics of comparable securities. The income approach considers factors including expected future cash flows, security specific risks and corresponding discount rates. The cost approach considers factors including the value of the security's underlying assets and liabilities.
Investments in open-end mutual funds, including the Fidelity Central Funds, are valued at their closing net asset value (NAV) each business day and are categorized as Level 1 in the hierarchy.
The following provides information on Level 3 securities held by the Fund that were valued at period end based on unobservable inputs. These amounts exclude valuations provided by a broker.
| Asset Type | Fair Value | Valuation Technique(s) | Unobservable Input | Amount or Range/Weighted Average | Impact to Valuation from an Increase in Input(a) |
| Equities | $5,762,686 | Market comparable | Transaction price | $29.35 | Increase |
| | | | Discount rate | 10.0% - 20.0% / 14.8% | Decrease |
| | | | Discount for lack of marketability | 10.0% | Decrease |
| | | | Enterprise Value/EBITDA multiple (EV/EBITDA) | 3.8 – 4.0 / 3.9 | Increase |
| | | Recovery value | Recovery value | 45228.20% | Increase |
| | | Book value | Book value multiple | 1.0 | Increase |
| Corporate Bonds | $5,585,057 | Market comparable | Discount rate | 10.0% | Decrease |
| | | | Discount for lack of marketability | 10.0% | Decrease |
| | | | Enterprise Value/EBITDA multiple (EV/EBITDA) | 3.8 | Increase |
| | | Recovery value | Recovery value | 0.0% | Increase |
| | | Book value | Book value multiple | 1.0 | Increase |
| Bank Loan Obligations | $ - | Recovery value | Recovery value | 0.0% | Increase |
(a) Represents the directional change in the fair value of the Level 3 investments that could have resulted from an increase in the corresponding input as of period end. A decrease to the unobservable input would have had the opposite effect. Significant changes in these inputs may have resulted in a significantly higher or lower fair value measurement at period end.
Changes in valuation techniques may result in transfers in or out of an assigned level within the disclosure hierarchy. The aggregate value of investments by input level as of June 30, 2021, as well as a roll forward of Level 3 investments, is included at the end of the Fund's Schedule of Investments.
Investment Transactions and Income. For financial reporting purposes, the Fund's investment holdings and NAV include trades executed through the end of the last business day of the period. The NAV per share for processing shareholder transactions is calculated as of the close of business of the New York Stock Exchange (NYSE), normally 4:00 p.m. Eastern time and includes trades executed through the end of the prior business day. Gains and losses on securities sold are determined on the basis of identified cost and include proceeds received from litigation. Income and capital gain distributions from Fidelity Central Funds, if any, are recorded on the ex-dividend date. Interest income is accrued as earned and includes coupon interest and amortization of premium and accretion of discount on debt securities as applicable. Debt obligations may be placed on non-accrual status and related interest income may be reduced by ceasing current accruals and writing off interest receivables when the collection of all or a portion of interest has become doubtful based on consistently applied procedures. A debt obligation is removed from non-accrual status when the issuer resumes interest payments or when collectability of interest is reasonably assured.
Class Allocations and Expenses. Investment income, realized and unrealized capital gains and losses, common expenses of a fund, and certain fund-level expense reductions, if any, are allocated daily on a pro-rata basis to each class based on the relative net assets of each class to the total net assets of a fund. Each class differs with respect to transfer agent and distribution and service plan fees incurred, as applicable. Certain expense reductions may also differ by class, if applicable. For the reporting period, the allocated portion of income and expenses to each class as a percent of its average net assets may vary due to the timing of recording these transactions in relation to fluctuating net assets of the classes. Expenses directly attributable to a fund are charged to that fund. Expenses attributable to more than one fund are allocated among the respective funds on the basis of relative net assets or other appropriate methods. Expenses included in the accompanying financial statements reflect the expenses of that fund and do not include any expenses associated with any underlying mutual funds or exchange-traded funds. Although not included in a fund's expenses, a fund indirectly bears its proportionate share of these expenses through the net asset value of each underlying mutual fund or exchange-traded fund. Expense estimates are accrued in the period to which they relate and adjustments are made when actual amounts are known.
Income Tax Information and Distributions to Shareholders. Each year, the Fund intends to qualify as a regulated investment company under Subchapter M of the Internal Revenue Code, including distributing substantially all of its taxable income and realized gains. As a result, no provision for U.S. Federal income taxes is required. The Fund files a U.S. federal tax return, in addition to state and local tax returns as required. The Fund's federal income tax returns are subject to examination by the Internal Revenue Service (IRS) for a period of three fiscal years after they are filed. State and local tax returns may be subject to examination for an additional fiscal year depending on the jurisdiction.
Distributions are declared and recorded on the ex-dividend date. Income and capital gain distributions are declared separately for each class. Income and capital gain distributions are determined in accordance with income tax regulations, which may differ from GAAP.
Capital accounts within the financial statements are adjusted for permanent book-tax differences. These adjustments have no impact on net assets or the results of operations. Capital accounts are not adjusted for temporary book-tax differences which will reverse in a subsequent period.
Book-tax differences are primarily due to market discount, capital loss carryforwards, partnerships and losses deferred due to wash sales.
As of period end, the cost and unrealized appreciation (depreciation) in securities, and derivatives if applicable, for federal income tax purposes were as follows:
| Gross unrealized appreciation | $45,681,119 |
| Gross unrealized depreciation | (12,502,476) |
| Net unrealized appreciation (depreciation) | $33,178,643 |
| Tax cost | $976,198,183 |
Capital loss carryforwards are only available to offset future capital gains of the Fund to the extent provided by regulations and may be limited. The capital loss carryforward information presented below, including any applicable limitation, is estimated as of prior fiscal period end and is subject to adjustment.
| No expiration | |
| Short-term | $(42,982,296) |
| Long-term | (64,089,941) |
| Total capital loss carryforward | $(107,072,237) |
Restricted Securities (including Private Placements). Funds may invest in securities that are subject to legal or contractual restrictions on resale. These securities generally may be resold in transactions exempt from registration or to the public if the securities are registered. Disposal of these securities may involve time-consuming negotiations and expense, and prompt sale at an acceptable price may be difficult. Information regarding restricted securities held at period end is included at the end of the Schedule of Investments, if applicable.
Loans and Other Direct Debt Instruments. Direct debt instruments are interests in amounts owed to lenders by corporate or other borrowers. These instruments may be in the form of loans, trade claims or other receivables and may include standby financing commitments such as revolving credit facilities that obligate a fund to supply additional cash to the borrower on demand. Loans may be acquired through assignment, participation, or may be made directly to a borrower. Such instruments are presented in the Bank Loan Obligations section in the Schedule of Investments. Certain funds may also invest in unfunded loan commitments, which are contractual obligations for future funding. Information regarding unfunded commitments is included at the end of the Schedule of Investments, if applicable.
4. Purchases and Sales of Investments.
Purchases and sales of securities, other than short-term securities and in-kind transactions, as applicable, are noted in the table below.
| | Purchases ($) | Sales ($) |
| VIP High Income Portfolio | 361,404,166 | 342,763,282 |
5. Fees and Other Transactions with Affiliates.
Management Fee. Fidelity Management & Research Company LLC (the investment adviser) and its affiliates provide the Fund with investment management related services for which the Fund pays a monthly management fee. The management fee is the sum of an individual fund fee rate that is based on an annual rate of .45% of the Fund's average net assets and an annualized group fee rate that averaged .10% during the period. The group fee rate is based upon the monthly average net assets of a group of registered investment companies with which the investment adviser has management contracts. The group fee rate decreases as assets under management increase and increases as assets under management decrease. For the reporting period, the total annualized management fee rate was .55% of the Fund's average net assets.
Distribution and Service Plan Fees. In accordance with Rule 12b-1 of the 1940 Act, the Fund has adopted separate 12b-1 Plans for each Service Class of shares. Each Service Class pays Fidelity Distributors Company LLC (FDC), an affiliate of the investment adviser, a service fee. For the period, the service fee is based on an annual rate of .10% of Service Class' average net assets and .25% of Service Class 2's average net assets.
For the period, total fees, all of which were re-allowed to insurance companies for the distribution of shares and providing shareholder support services, were as follows:
| Service Class | $33,112 |
| Service Class 2 | 207,164 |
| | $240,276 |
Transfer Agent Fees. Fidelity Investments Institutional Operations Company LLC (FIIOC), an affiliate of the investment adviser, is the Fund's transfer, dividend disbursing, and shareholder servicing agent. FIIOC receives an asset-based fee with respect to each class. Each class pays a fee for transfer agent services, typesetting and printing and mailing of shareholder reports, excluding mailing of proxy statements. For the period, transfer agent fees for each class were as follows:
| | Amount | % of Class-Level Average Net Assets(a) |
| Initial Class | $105,709 | .07 |
| Service Class | 22,516 | .07 |
| Service Class 2 | 56,349 | .07 |
| Investor Class | 221,147 | .10 |
| | $405,721 | |
(a) Annualized
Accounting Fees. Fidelity Service Company, Inc. (FSC), an affiliate of the investment adviser, maintains the Fund's accounting records. The accounting fee is based on the level of average net assets for each month. For the period, the fees were equivalent to the following annualized rates:
| | % of Average Net Assets |
| VIP High Income Portfolio | .04 |
Brokerage Commissions. A portion of portfolio transactions were placed with brokerage firms which are affiliates of the investment adviser. Brokerage commissions are included in net realized gain (loss) and change in net unrealized appreciation (depreciation) in the Statement of Operations. The commissions paid to these affiliated firms were as follows:
| | Amount |
| VIP High Income Portfolio | $143 |
Interfund Trades. Funds may purchase from or sell securities to other Fidelity Funds under procedures adopted by the Board. The procedures have been designed to ensure these interfund trades are executed in accordance with Rule 17a-7 of the 1940 Act. Any interfund trades are included within the respective purchases and sales amounts shown in the Purchases and Sales of Investments note.
6. Committed Line of Credit.
Certain Funds participate with other funds managed by the investment adviser or an affiliate in a $4.25 billion credit facility (the "line of credit") to be utilized for temporary or emergency purposes to fund shareholder redemptions or for other short-term liquidity purposes. The participating funds have agreed to pay commitment fees on their pro-rata portion of the line of credit, which are reflected in Miscellaneous expenses on the Statement of Operations, and are listed below. During the period, there were no borrowings on this line of credit.
| | Amount |
| VIP High Income Portfolio | $960 |
7. Expense Reductions.
Commissions paid to certain brokers with whom the investment adviser, or its affiliates, places trades on behalf of the Fund include an amount in addition to trade execution, which may be rebated back to the Fund to offset expenses. This amount totaled $475 for the period. In addition, through arrangements with the Fund's custodian, credits realized as a result of certain uninvested cash balances were used to reduce the Fund's expenses. During the period, custodian credits reduced the Fund's expenses by $252.
In addition, during the period the investment adviser or an affiliate reimbursed and/or waived a portion of fund-level operating expenses in the amount of $962.
8. Distributions to Shareholders.
Distributions to shareholders of each class were as follows:
| | Six months ended
June 30, 2021 | Year ended
December 31, 2020 |
| VIP High Income Portfolio | | |
| Distributions to shareholders | | |
| Initial Class | $2,567,266 | $15,186,395 |
| Service Class | 454,189 | 2,588,287 |
| Service Class 2 | 1,399,937 | 8,136,361 |
| Investor Class | 3,600,888 | 21,093,141 |
| Total | $8,022,280 | $47,004,184 |
9. Share Transactions.
Transactions for each class of shares were as follows and may contain in-kind transactions:
| | Shares | Shares | Dollars | Dollars |
| | Six months ended June 30, 2021 | Year ended December 31, 2020 | Six months ended June 30, 2021 | Year ended December 31, 2020 |
| VIP High Income Portfolio | | | | |
| Initial Class | | | | |
| Shares sold | 3,701,815 | 7,828,791 | $19,688,912 | $40,541,734 |
| Reinvestment of distributions | 485,306 | 2,885,195 | 2,567,266 | 15,186,395 |
| Shares redeemed | (5,479,247) | (11,887,391) | (29,131,058) | (61,018,472) |
| Net increase (decrease) | (1,292,126) | (1,173,405) | $(6,874,880) | $(5,290,343) |
| Service Class | | | | |
| Shares sold | 5,548,172 | 3,385,369 | $29,289,003 | $17,308,661 |
| Reinvestment of distributions | 86,677 | 495,370 | 454,189 | 2,588,287 |
| Shares redeemed | (1,048,580) | (6,031,210) | (5,536,519) | (31,043,815) |
| Net increase (decrease) | 4,586,269 | (2,150,471) | $24,206,673 | $(11,146,867) |
| Service Class 2 | | | | |
| Shares sold | 6,454,406 | 20,817,025 | $32,842,064 | $102,995,226 |
| Reinvestment of distributions | 276,122 | 1,610,356 | 1,399,937 | 8,136,361 |
| Shares redeemed | (8,018,789) | (24,966,605) | (40,632,546) | (124,070,315) |
| Net increase (decrease) | (1,288,261) | (2,539,224) | $(6,390,545) | $(12,938,728) |
| Investor Class | | | | |
| Shares sold | 4,055,314 | 17,448,094 | $21,446,156 | $87,498,777 |
| Reinvestment of distributions | 685,884 | 4,029,639 | 3,600,888 | 21,093,141 |
| Shares redeemed | (4,226,334) | (25,383,687) | (22,310,494) | (127,526,939) |
| Net increase (decrease) | 514,864 | (3,905,954) | $2,736,550 | $(18,935,021) |
10. Other.
Fund's organizational documents provide former and current trustees and officers with a limited indemnification against liabilities arising in connection with the performance of their duties to the fund. In the normal course of business, the fund may also enter into contracts that provide general indemnifications. The fund's maximum exposure under these arrangements is unknown as this would be dependent on future claims that may be made against the fund. The risk of material loss from such claims is considered remote.
At the end of the period, the investment adviser or its affiliates and certain otherwise unaffiliated shareholders were owners of record of more than 10% of the outstanding shares as follows:
| Fund | Affiliated % | Number of
Unaffiliated Shareholders | Unaffiliated Shareholders % |
| VIP: High Income Portfolio | 49% | 1 | 14% |
11. Coronavirus (COVID-19) Pandemic.
An outbreak of COVID-19 first detected in China during December 2019 has since spread globally and was declared a pandemic by the World Health Organization during March 2020. Developments that disrupt global economies and financial markets, such as the COVID-19 pandemic, may magnify factors that affect the Fund's performance.
Shareholder Expense Example
As a shareholder, you incur two types of costs: (1) transaction costs, which may include sales charges (loads) on purchase payments or redemption proceeds, as applicable and (2) ongoing costs, which generally include management fees, distribution and/or service (12b-1) fees and other Fund expenses. This Example is intended to help you understand your ongoing costs (in dollars) of investing in a fund and to compare these costs with the ongoing costs of investing in other mutual funds.
The Example is based on an investment of $1,000 invested at the beginning of the period and held for the entire period (January 1, 2021 to June 30, 2021).
Actual Expenses
The first line of the accompanying table provides information about actual account values and actual expenses. You may use the information in this line, together with the amount you invested, to estimate the expenses that you paid over the period. Simply divide your account value by $1,000.00 (for example, an $8,600 account value divided by $1,000.00 = 8.6), then multiply the result by the number in the first line for a class/Fund under the heading entitled "Expenses Paid During Period" to estimate the expenses you paid on your account during this period. If any fund is a shareholder of any underlying mutual funds or exchange-traded funds (ETFs) (the Underlying Funds), such fund indirectly bears its proportional share of the expenses of the Underlying Funds in addition to the direct expenses incurred presented in the table. These fees and expenses are not included in the annualized expense ratio used to calculate the expense estimate in the table below. The estimate of expenses does not include any fees or other expenses of any variable annuity or variable life insurance product. If they were, the estimate of expenses you paid during the period would be higher, and your ending account value would be lower.
Hypothetical Example for Comparison Purposes
The second line of the accompanying table provides information about hypothetical account values and hypothetical expenses based on the actual expense ratio and an assumed rate of return of 5% per year before expenses, which is not the actual return. The hypothetical account values and expenses may not be used to estimate the actual ending account balance or expenses you paid for the period. You may use this information to compare the ongoing costs of investing in the Fund and other funds. To do so, compare this 5% hypothetical example with the 5% hypothetical examples that appear in the shareholder reports of the other funds. If any fund is a shareholder of any Underlying Funds, such fund indirectly bears its proportional share of the expenses of the Underlying Funds in addition to the direct expenses as presented in the table. These fees and expenses are not included in the annualized expense ratio used to calculate the expense estimate in the table below. The estimate of expenses does not include any fees or other expenses of any variable annuity or variable life insurance product. If they were, the estimate of expenses you paid during the period would be higher, and your ending account value would be lower.
Please note that the expenses shown in the table are meant to highlight your ongoing costs only and do not reflect any transaction costs. Therefore, the second line of the table is useful in comparing ongoing costs only, and will not help you determine the relative total costs of owning different funds.
| | Annualized Expense Ratio-A | Beginning
Account Value
January 1, 2021 | Ending
Account Value
June 30, 2021 | Expenses Paid
During Period-B
January 1, 2021
to June 30, 2021 |
| VIP High Income Portfolio | | | | |
| Initial Class | .67% | | | |
| Actual | | $1,000.00 | $1,031.10 | $3.37 |
| Hypothetical-C | | $1,000.00 | $1,021.47 | $3.36 |
| Service Class | .77% | | | |
| Actual | | $1,000.00 | $1,033.10 | $3.88 |
| Hypothetical-C | | $1,000.00 | $1,020.98 | $3.86 |
| Service Class 2 | .92%�� | | | |
| Actual | | $1,000.00 | $1,030.10 | $4.63 |
| Hypothetical-C | | $1,000.00 | $1,020.23 | $4.61 |
| Investor Class | .70% | | | |
| Actual | | $1,000.00 | $1,033.30 | $3.53 |
| Hypothetical-C | | $1,000.00 | $1,021.32 | $3.51 |
A Annualized expense ratio reflects expenses net of applicable fee waivers.
B Expenses are equal to the annualized expense ratio, multiplied by the average account value over the period, multiplied by 181/ 365 (to reflect the one-half year period). The fees and expenses of any Underlying Funds are not included in each annualized expense ratio.
C 5% return per year before expenses
Board Approval of Investment Advisory Contracts and Management Fees
VIP High Income Portfolio
Each year, the Board of Trustees, including the Independent Trustees (together, the Board), votes on the renewal of the management contract with Fidelity Management & Research Company LLC (FMR) and the sub-advisory agreements (together, the Advisory Contracts) for the fund. FMR and the sub-advisers are referred to herein as the Investment Advisers. The Board, assisted by the advice of fund counsel and Independent Trustees' counsel, requests and considers a broad range of information relevant to the renewal of the Advisory Contracts throughout the year.
The Board meets regularly and, at each of its meetings, covers an extensive agenda of topics and materials and considers factors that are relevant to its annual consideration of the renewal of the fund's Advisory Contracts, including the services and support provided to the fund and its shareholders. The Board has established various standing committees (Committees), each composed of and chaired by Independent Trustees with varying backgrounds, to which the Board has assigned specific subject matter responsibilities in order to enhance effective decision-making by the Board. The Board, acting directly and through its Committees, requests and receives information concerning the annual consideration of the renewal of the fund's Advisory Contracts. The Board also meets as needed to review matters specifically related to the Board's annual consideration of the renewal of the Advisory Contracts. Members of the Board may also meet with trustees of other Fidelity funds through joint ad hoc committees to discuss certain matters relevant to all of the Fidelity funds.
Approval of Stub Period Continuation. At its January 2021 meeting, the Board of Trustees voted to continue the fund's management contract with FMR, and the sub-advisory agreements and sub-subadvisory agreements, in each case, where applicable (together, the Advisory Contracts), without modification, for four months from February 1, 2021 through May 31, 2021, in connection with changes to the Board's meeting calendar. The Board considered that the approval of the fund's Advisory Contracts will not result in any changes in (i) the investment process or strategies employed in the management of the fund's assets; (ii) the fees and expenses paid by shareholders; (iii) the nature, extent or quality of services provided under the fund's Advisory Contracts; or (iv) the day-to-day management of the fund or the persons primarily responsible for such management. The Board also considered that since its last approval of the fund's Advisory Contracts, FMR had provided additional information on the fund in support of the annual contract renewal process, including competitive analyses on total expenses and management fees and in-depth reviews of fund performance and fund profitability information. The Board also considered the findings of certain ad hoc committees that had been previously formed to discuss matters relevant to all of the Fidelity funds, including economies of scale, fall-out benefits and retail vs. institutional funds. The Board concluded that the fund's Advisory Contracts are fair and reasonable, and that the fund's Advisory Contracts should be renewed, without modification, through May 31, 2021, with the understanding that the Board will consider the annual renewal for a full one year period in May 2021.
At its May 2021 meeting, the Board unanimously determined to renew the fund's Advisory Contracts. In reaching its determination, the Board considered all factors it believed relevant, including (i) the nature, extent, and quality of the services provided to the fund and its shareholders (including the investment performance of the fund); (ii) the competitiveness of the fund's management fee and total expense ratio relative to peer funds; (iii) the total costs of the services provided by and the profits realized by Fidelity from its relationships with the fund; and (iv) the extent to which, if any, economies of scale exist and are realized as the fund grows, and whether any economies of scale are appropriately shared with fund shareholders.
In considering whether to renew the Advisory Contracts for the fund, the Board reached a determination, with the assistance of fund counsel and Independent Trustees' counsel and through the exercise of its business judgment, that the renewal of the Advisory Contracts was in the best interests of the fund and its shareholders and that the compensation payable under the Advisory Contracts was fair and reasonable. The Board's decision to renew the Advisory Contracts was not based on any single factor, but rather was based on a comprehensive consideration of all the information provided to the Board at its meetings throughout the year. The Board, in reaching its determination to renew the Advisory Contracts, was aware that shareholders of the fund have a broad range of investment choices available to them, including a wide choice among funds offered by Fidelity's competitors, and that the fund's shareholders, who have the opportunity to review and weigh the disclosure provided by the fund in its prospectus and other public disclosures, have chosen to invest in this fund, which is part of the Fidelity family of funds.
Nature, Extent, and Quality of Services Provided. The Board considered Fidelity's staffing as it relates to the fund, including the backgrounds of investment personnel of Fidelity, and also considered the fund's investment objective, strategies, and related investment philosophy. The Independent Trustees also had discussions with senior management of Fidelity's investment operations and investment groups. The Board considered the structure of the investment personnel compensation program and whether this structure provides appropriate incentives to act in the best interests of the fund. Additionally, the Board considered the portfolio managers' investments, if any, in the funds that they manage.
Resources Dedicated to Investment Management and Support Services. The Board and the Fund Oversight and Research Committees reviewed the general qualifications and capabilities of Fidelity's investment staff, including its size, education, experience, and resources, as well as Fidelity's approach to recruiting, training, managing, and compensating investment personnel. The Board noted that Fidelity has continued to increase the resources devoted to non-U.S. offices, including expansion of Fidelity's global investment organization. The Board also noted that Fidelity's analysts have extensive resources, tools and capabilities that allow them to conduct sophisticated quantitative and fundamental analysis, as well as credit analysis of issuers, counterparties and guarantors. Further, the Board considered that Fidelity's investment professionals have sufficient access to global information and data so as to provide competitive investment results over time, and that those professionals also have access to sophisticated tools that permit them to assess portfolio construction and risk and performance attribution characteristics continuously, as well as to transmit new information and research conclusions rapidly around the world. Additionally, in its deliberations, the Board considered Fidelity's trading, risk management, compliance, and technology and operations capabilities and resources, which are integral parts of the investment management process. The Board also considered Fidelity's investments in business continuity planning, and its success in continuously providing services to the fund notwithstanding the severe disruptions caused by the COVID-19 pandemic.
Shareholder and Administrative Services. The Board considered (i) the nature, extent, quality, and cost of advisory, administrative, and shareholder services performed by the Investment Advisers and their affiliates under the Advisory Contracts and under separate agreements covering transfer agency, pricing and bookkeeping, and securities lending services for the fund; (ii) the nature and extent of the supervision of third party service providers, principally custodians, subcustodians, and pricing vendors; and (iii) the resources devoted to, and the record of compliance with, the fund's compliance policies and procedures. The Board also reviewed the allocation of fund brokerage, including allocations to brokers affiliated with the Investment Advisers, the use of brokerage commissions to pay fund expenses, and the use of "soft" commission dollars to pay for research services.
The Board noted that the growth of fund assets over time across the complex allows Fidelity to reinvest in the development of services designed to enhance the value and convenience of the Fidelity funds as investment vehicles. These services include 24-hour access to account information and market information over the Internet and through telephone representatives, investor education materials and asset allocation tools, and the expanded availability of Fidelity Investor Centers.
The Board noted that, in the past, it and the boards of certain other Fidelity funds had formed an ad hoc Committee on Transfer Agency Fees to review the variety of transfer agency fee structures throughout the industry and Fidelity's competitive positioning with respect to industry participants.
Investment in a Large Fund Family. The Board considered the benefits to shareholders of investing in a Fidelity fund, including the benefits of investing in a fund that is part of a large family of funds offering a variety of investment disciplines and providing a large variety of mutual fund investor services. The Board noted that Fidelity had taken, or had made recommendations that resulted in the Fidelity funds taking, a number of actions over the previous year that benefited particular funds, including: (i) continuing to dedicate additional resources to Fidelity's investment research process, which includes meetings with management of issuers of securities in which the funds invest, and to the support of the senior management team that oversees asset management; (ii) continuing efforts to enhance Fidelity's global research capabilities; (iii) launching new funds and ETFs with innovative structures, strategies and pricing and making other enhancements to meet client needs; (iv) launching new share classes of existing funds; (v) eliminating purchase minimums and broadening eligibility requirements for certain funds and share classes; (vi) approving the reduction in the holding period for the Class C to Class A conversion policy; (vii) reducing management fees and total expenses for certain target date funds and classes and index funds; (viii) lowering expenses for certain existing funds and classes by implementing or lowering expense caps; (ix) rationalizing product lines and gaining increased efficiencies from fund mergers, liquidations, and share class consolidations; (x) continuing to develop, acquire and implement systems and technology to improve services to the funds and shareholders, strengthen information security, and increase efficiency; and (xi) continuing to implement enhancements to further strengthen Fidelity's product line to increase investors' probability of success in achieving their investment goals, including retirement income goals.
Investment Performance. The Board considered whether the fund has operated in accordance with its investment objective, as well as its record of compliance with its investment restrictions and its performance history. The Board noted that there was a portfolio management change for the fund in December 2018. The Board will continue to monitor closely the fund's performance, taking into account the portfolio management change.
The Board took into account discussions that occur at Board meetings throughout the year with representatives of the Investment Advisers about fund investment performance. In this regard the Board noted that as part of regularly scheduled fund reviews and other reports to the Board on fund performance, the Board considers annualized return information for the fund for different time periods, measured against an appropriate securities market index (benchmark index) and an appropriate peer group of funds with similar objectives (peer group). In its evaluation of fund investment performance, the Board gave particular attention to information indicating changes in performance of certain Fidelity funds for specific time periods and discussed with the Investment Advisers the reasons for any overperformance or underperformance.
In addition to reviewing absolute and relative fund performance, the Independent Trustees periodically consider the appropriateness of fund performance metrics in evaluating the results achieved. In general, the Independent Trustees believe that fund performance should be evaluated based on net performance (after fees and expenses) of both the highest performing and lowest performing fund share classes, where applicable, compared to appropriate benchmark indices, over appropriate time periods that may include full market cycles, and compared to peer groups, as applicable, over the same periods, taking into account relevant factors including the following: general market conditions; issuer-specific information; and fund cash flows and other factors.
The Independent Trustees recognize that shareholders evaluate performance on a net basis over their own holding periods, for which one-, three-, and five-year periods are often used as a proxy. For this reason, the performance information reviewed by the Board also included net cumulative total return information for the fund and an appropriate benchmark index and peer group for the most recent one-, three-, and five-year periods ended September 30, 2020, as shown below. Returns are shown compared to the 25th percentile (top of box, 75% beaten) and 75th percentile (bottom of box, 25% beaten) of the peer universe.
VIP High Income Portfolio
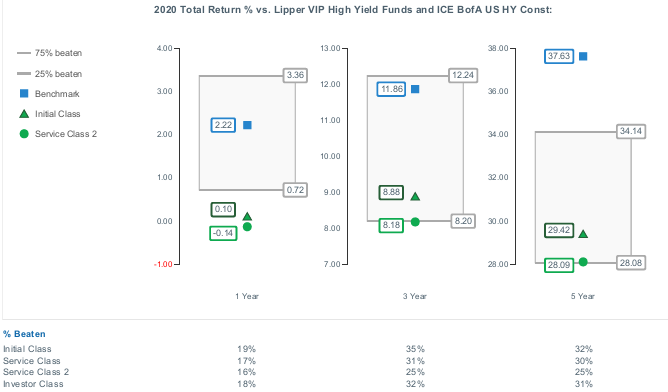
The Board considered the fund's underperformance for different time periods ended September 30, 2020 and for different time periods ended December 31, 2020 (which periods are not reflected in the charts above). The Board's discussions with FMR regarding underperformance cover topics including, but not limited to: the longer-term track record of a fund's portfolio manager(s); broader trends in the market that may adversely impact a fund's performance; and attribution reports on contributors to the fund's underperformance. The Board engages with FMR on steps that might be taken to address a fund's underperformance.
Based on its review, the Board concluded that the nature, extent, and quality of services provided to the fund under the Advisory Contracts should continue to benefit the shareholders of the fund.
Competitiveness of Management Fee and Total Expense Ratio. The Board considered the fund's management fee and total expense ratio compared to "mapped groups" of competitive funds and classes created for the purpose of facilitating the Trustees' competitive analysis of management fees and total expenses. Fidelity creates "mapped groups" by combining similar Lipper investment objective categories that have comparable investment mandates. Combining Lipper investment objective categories aids the Board's management fee and total expense ratio comparisons by broadening the competitive group used for comparison.
Management Fee. The Board considered two proprietary management fee comparisons for the 12-month periods ended September 30 (June 30 for periods ended 2019 and 2018 and December 31 for periods prior to 2018) shown in basis points (BP) in the chart below. The group of Lipper funds used by the Board for management fee comparisons is referred to below as the "Total Mapped Group." The Total Mapped Group is broader than the Lipper peer group used by the Board for performance comparisons because the Total Mapped Group combines several Lipper investment objective categories while the Lipper peer group does not. The Total Mapped Group comparison focuses on a fund's standing in terms of gross management fees before expense reimbursements or caps relative to the total universe of funds with comparable investment mandates, regardless of whether their management fee structures also are comparable. Funds with comparable investment mandates offer exposure to similar types of securities. Funds with comparable management fee structures have similar management fee contractual arrangements (
e.g., flat rate charged for advisory services, all-inclusive fee rate,
etc.). "TMG %" represents the percentage of funds in the Total Mapped Group that had management fees that were lower than the fund's. For example, a hypothetical TMG % of 20% would mean that 80% of the funds in the Total Mapped Group had higher, and 20% had lower, management fees than the fund. The fund's actual TMG %s and the number of funds in the Total Mapped Group are in the chart below. The "Asset-Sized Peer Group" (ASPG) comparison focuses on a fund's standing relative to a subset of non-Fidelity funds within the Total Mapped Group that are similar in size and management fee structure. For example, if a fund is in the first quartile of the ASPG, the fund's management fee ranks in the least expensive or lowest 25% of funds in the ASPG. The ASPG represents at least 15% of the funds in the Total Mapped Group with comparable asset size and management fee structures, subject to a minimum of 50 funds (or all funds in the Total Mapped Group if fewer than 50). Additional information, such as the ASPG quartile in which the fund's management fee rate ranked, is also included in the chart and was considered by the Board.
VIP High Income Portfolio

The Board noted that the fund's management fee rate ranked below the median of its Total Mapped Group and below the median of its ASPG for the 12-month period ended September 30, 2020.
The Board noted that, in the past, it and the boards of other Fidelity funds had formed an ad hoc Committee on Group Fee to conduct an in-depth review of the "group fee" component of the management fee of funds with such management fee structures. The Committee's focus included the mechanics of the group fee, the competitive landscape of group fee structures, Fidelity funds with no group fee component and investment products not included in group fee assets. The Board also considered that, for funds subject to the group fee, FMR agreed to voluntarily waive fees over a specified period of time in amounts designed to account for assets converted from certain funds to certain collective investment trusts.
The Board also noted that, in 2013, the ad hoc Committee on Management Fees was formed to conduct an in-depth review of the management fee rates of Fidelity's active equity mutual funds. The Committee focused on the following areas: (i) standard fee structures; (ii) research consumption and trading evolution; (iii) management fee competitiveness/profitability by category; and (iv) factors that drive institutional pricing.
Based on its review, the Board concluded that the fund's management fee is fair and reasonable in light of the services that the fund receives and the other factors considered.
Total Expense Ratio. In its review of each class's total expense ratio, the Board considered the fund's management fee rate as well as other fund or class expenses, as applicable, such as transfer agent fees, pricing and bookkeeping fees, fund-paid 12b-1 fees, and custodial, legal, and audit fees. The Board also noted that Fidelity may agree to waive fees or reimburse expenses from time to time, and the extent to which, if any, it has done so for the fund. As part of its review, the Board also considered the current and historical total expense ratios of a representative class of the fund compared to competitive fund median expenses. The fund's representative class is compared to those funds and classes in the Total Mapped Group (used by the Board for management fee comparisons) that have a similar sales load structure (SLTG). The Board also considered a total expense ASPG comparison for the representative class, which focuses on the total expenses of the representative class relative to a subset of non-Fidelity funds within the total expense SLTG. The total expense ASPG is limited to 15 larger and 15 smaller classes in fund average assets for a total of 30 classes, where possible. The total expense ASPG comparison excludes performance adjustments and fund-paid 12b-1 fees to eliminate variability in fee structures.
The Board noted that the total expense ratio of the Initial Class ranked above the SLTG competitive median and equal to the ASPG competitive median for the 12-month period ended September 30, 2020. The Board considered that, in general, various factors can affect total expense ratios. The Board noted that the fund offers multiple classes and that the multiple structures are intended to offer pricing options for the intermediary market. The Board also noted that the total expense ratios of the classes vary primarily due to differences in transfer agent fees.
Fees Charged to Other Fidelity Clients. The Board also considered Fidelity fee structures and other information with respect to clients of Fidelity, such as other funds advised or subadvised by Fidelity, pension plan clients, and other institutional clients with similar mandates. The Board noted that a joint ad hoc committee created by it and the boards of other Fidelity funds periodically reviews and compares Fidelity's institutional investment advisory business with its business of providing services to the Fidelity funds and also noted the most recent findings of the committee. The Board noted that the committee's review included a consideration of the differences in services provided, fees charged, and costs incurred, as well as competition in the markets serving the different categories of clients.
Based on its review of total expense ratios and fees charged to other Fidelity clients, the Board concluded that the total expense ratio of each class of the fund was reasonable in light of the services that the fund and its shareholders receive and the other factors considered.
Costs of the Services and Profitability. The Board considered the revenues earned and the expenses incurred by Fidelity in conducting the business of developing, marketing, distributing, managing, administering and servicing the fund and servicing the fund's shareholders. The Board also considered the level of Fidelity's profits in respect of all the Fidelity funds.
On an annual basis, Fidelity presents to the Board information about the profitability of its relationships with the fund. Fidelity calculates profitability information for each fund, as well as aggregate profitability information for groups of Fidelity funds and all Fidelity funds, using a series of detailed revenue and cost allocation methodologies which originate with the books and records of Fidelity on which Fidelity's audited financial statements are based. The Audit Committee of the Board reviews any significant changes from the prior year's methodologies and the full Board approves such changes.
A public accounting firm has been engaged annually by the Board as part of the Board's assessment of Fidelity's profitability analysis. The engagement includes the review and assessment of the methodologies used by Fidelity in determining the revenues and expenses attributable to Fidelity's mutual fund business, and completion of agreed-upon procedures in respect of the mathematical accuracy of certain fund profitability information and its conformity to established allocation methodologies. After considering the reports issued under the engagement and information provided by Fidelity, the Board concluded that while other allocation methods may also be reasonable, Fidelity's profitability methodologies are reasonable in all material respects.
The Board also reviewed Fidelity's non-fund businesses and potential indirect benefits such businesses may have received as a result of their association with Fidelity's mutual fund business (i.e., fall-out benefits) as well as cases where Fidelity's affiliates may benefit from the funds' business. The Board considered areas where potential indirect benefits to the Fidelity funds from their relationships with Fidelity may exist. The Board also considered that in 2019 a joint ad hoc committee created by it and the boards of other Fidelity funds evaluated potential fall-out benefits (PFOB Committee). The Board noted that it considered the PFOB Committee's findings in connection with its consideration of the renewal of the Advisory Contracts.
The Board considered the costs of the services provided by and the profits realized by Fidelity in connection with the operation of the fund, including the conclusions of the PFOB Committee, and was satisfied that the profitability was not excessive.
Economies of Scale. The Board considered whether there have been economies of scale in respect of the management of the Fidelity funds, whether the Fidelity funds (including the fund) have appropriately benefited from any such economies of scale, and whether there is potential for realization of any further economies of scale. The Board considered the extent to which the fund will benefit from economies of scale as assets grow through increased services to the fund, through waivers or reimbursements, or through fee or expense ratio reductions. The Board also noted that a committee (the Economies of Scale Committee) created by it and the boards of other Fidelity funds periodically analyzes whether Fidelity attains economies of scale in respect of the management and servicing of the Fidelity funds, whether the Fidelity funds have appropriately benefited from such economies of scale, and whether there is potential for realization of any further economies of scale.
The Board recognized that the fund's management contract incorporates a "group fee" structure, which provides for lower group fee rates as total "group assets" increase, and for higher group fee rates as total "group assets" decrease ("group assets" as defined in the management contract). FMR calculates the group fee rates based on a tiered asset "breakpoint" schedule that varies based on asset class. The Board considered that the group fee is designed to deliver the benefits of economies of scale to fund shareholders when total Fidelity fund assets increase, even if assets of any particular fund are unchanged or have declined, because some portion of Fidelity's costs are attributable to services provided to all Fidelity funds, and all funds benefit if those costs can be allocated among more assets. The Board further considered that Fidelity agreed to impose a temporary fee waiver in the form of additional breakpoints to the current breakpoint schedule. The Board concluded that, given the group fee structure, fund shareholders will benefit from lower management fees as "group assets" increase at the fund complex level, regardless of whether Fidelity achieves any such economies of scale.
The Board concluded, taking into account the analysis of the Economies of Scale Committee, that economies of scale, if any, are being appropriately shared between fund shareholders and Fidelity.
Additional Information Requested by the Board. In order to develop fully the factual basis for consideration of the Fidelity funds' advisory contracts, the Board requested and received additional information on certain topics, including: (i) fund flow and performance trends, in particular the underperformance of certain funds and strategies, and Fidelity's long-term strategies for certain funds; (ii) consideration of expanding the use of performance fees for additional funds; (iii) Fidelity's pricing philosophy compared to competitors; (iv) metrics for evaluating index fund and ETF performance and information about ETF trading characteristics; (v) the methodology with respect to evaluating competitive fund data and peer group classifications and fee and expense comparisons; (vi) the expense structures for different funds and classes and information about the differences between various expense structures; (vii) group fee breakpoints; (viii) information regarding other accounts managed by Fidelity and sub-advisory arrangements; and (ix) Fidelity's philosophies and strategies for evaluating funds and classes with lower or declining asset levels.
Based on its evaluation of all of the conclusions noted above, and after considering all factors it believed relevant, the Board concluded that the advisory fee arrangements are fair and reasonable, and that the fund's Advisory Contracts should be renewed.
Liquidity Risk Management Program
The Securities and Exchange Commission adopted Rule 22e-4 under the Investment Company Act of 1940 (the Liquidity Rule) to promote effective liquidity risk management throughout the open-end investment company industry, thereby reducing the risk that funds will be unable to meet their redemption obligations and mitigating dilution of the interests of fund shareholders.
The Fund has adopted and implemented a liquidity risk management program pursuant to the Liquidity Rule (the Program) effective December 1, 2018. The Program is reasonably designed to assess and manage the Fund’s liquidity risk and to comply with the requirements of the Liquidity Rule. The Fund’s Board of Trustees (the Board) has designated the Fund’s investment adviser as administrator of the Program. The Fidelity advisers have established a Liquidity Risk Management Committee (the LRM Committee) to manage the Program for each of the Fidelity Funds. The LRM Committee monitors the adequacy and effectiveness of implementation of the Program and on a periodic basis assesses each Fund’s liquidity risk based on a variety of factors including (1) the Fund’s investment strategy, (2) portfolio liquidity and cash flow projections during normal and reasonably foreseeable stressed conditions, (3) shareholder redemptions, (4) borrowings and other funding sources and (5) in the case of exchange-traded funds, certain additional factors including the effect of the Fund’s prices and spreads, market participants, and basket compositions on the overall liquidity of the Fund’s portfolio, as applicable.
In accordance with the Program, each of the Fund’s portfolio investments is classified into one of four liquidity categories described below based on a determination of a reasonable expectation for how long it would take to convert the investment to cash (or sell or dispose of the investment) without significantly changing its market value.
- Highly liquid investments – cash or convertible to cash within three business days or less
- Moderately liquid investments – convertible to cash in three to seven calendar days
- Less liquid investments – can be sold or disposed of, but not settled, within seven calendar days
- Illiquid investments – cannot be sold or disposed of within seven calendar days
Liquidity classification determinations take into account a variety of factors including various market, trading and investment-specific considerations, as well as market depth, and generally utilize analysis from a third-party liquidity metrics service.
The Liquidity Rule places a 15% limit on a fund’s illiquid investments and requires funds that do not primarily hold assets that are highly liquid investments to determine and maintain a minimum percentage of the fund’s net assets to be invested in highly liquid investments (highly liquid investment minimum or HLIM). The Program includes provisions reasonably designed to comply with the 15% limit on illiquid investments and for determining, periodically reviewing and complying with the HLIM requirement as applicable.
At a recent meeting of the Fund’s Board of Trustees, the LRM Committee provided a written report to the Board pertaining to the operation, adequacy, and effectiveness of implementation of the Program for the annual period from December 1, 2019 through November 30, 2020. The report concluded that the Program has been implemented and is operating effectively and is reasonably designed to assess and manage the Fund’s liquidity risk.
VIPHI-SANN-0821
1.705694.123
Fidelity® Variable Insurance Products:
Overseas Portfolio
Semi-Annual Report
June 30, 2021
Contents
To view a fund's proxy voting guidelines and proxy voting record for the 12-month period ended June 30, visit http://www.fidelity.com/proxyvotingresults or visit the Securities and Exchange Commission's (SEC) web site at http://www.sec.gov.
You may also call 1-877-208-0098 to request a free copy of the proxy voting guidelines.
Fidelity® Variable Insurance Products are separate account options which are purchased through a variable insurance contract.
Standard & Poor's, S&P and S&P 500 are registered service marks of The McGraw-Hill Companies, Inc. and have been licensed for use by Fidelity Distributors Corporation.
Other third-party marks appearing herein are the property of their respective owners.
All other marks appearing herein are registered or unregistered trademarks or service marks of FMR LLC or an affiliated company. © 2021 FMR LLC. All rights reserved.
This report and the financial statements contained herein are submitted for the general information of the shareholders of the Fund. This report is not authorized for distribution to prospective investors in the Fund unless preceded or accompanied by an effective prospectus.
A fund files its complete schedule of portfolio holdings with the SEC for the first and third quarters of each fiscal year on Form N-PORT. Forms N-PORT are available on the SEC’s web site at http://www.sec.gov. A fund's Forms N-PORT may be reviewed and copied at the SEC’s Public Reference Room in Washington, DC. Information regarding the operation of the SEC's Public Reference Room may be obtained by calling 1-800-SEC-0330.
For a complete list of a fund's portfolio holdings, view the most recent holdings listing, semiannual report, or annual report on Fidelity's web site at http://www.fidelity.com, http://www.institutional.fidelity.com, or http://www.401k.com, as applicable.
NOT FDIC INSURED •MAY LOSE VALUE •NO BANK GUARANTEE
Neither the Fund nor Fidelity Distributors Corporation is a bank.
Note to Shareholders:
Early in 2020, the outbreak and spread of a new coronavirus emerged as a public health emergency that had a major influence on financial markets, primarily based on its impact on the global economy and the outlook for corporate earnings. The virus causes a respiratory disease known as COVID-19. On March 11, 2020 the World Health Organization declared the COVID-19 outbreak a pandemic, citing sustained risk of further global spread.
In the weeks following, as the crisis worsened, we witnessed an escalating human tragedy with wide-scale social and economic consequences from coronavirus-containment measures. The outbreak of COVID-19 prompted a number of measures to limit the spread, including travel and border restrictions, quarantines, and restrictions on large gatherings. In turn, these resulted in lower consumer activity, diminished demand for a wide range of products and services, disruption in manufacturing and supply chains, and – given the wide variability in outcomes regarding the outbreak – significant market uncertainty and volatility. Amid the turmoil, global governments and central banks took unprecedented action to help support consumers, businesses, and the broader economies, and to limit disruption to financial systems.
The situation continues to unfold, and the extent and duration of its impact on financial markets and the economy remain highly uncertain. Extreme events such as the coronavirus crisis are “exogenous shocks” that can have significant adverse effects on mutual funds and their investments. Although multiple asset classes may be affected by market disruption, the duration and impact may not be the same for all types of assets.
Fidelity is committed to helping you stay informed amid news about COVID-19 and during increased market volatility, and we’re taking extra steps to be responsive to customer needs. We encourage you to visit our websites, where we offer ongoing updates, commentary, and analysis on the markets and our funds.
Investment Summary (Unaudited)
Geographic Diversification (% of fund's net assets)
| As of June 30, 2021 |
| | Japan | 13.1% |
| | France | 12.2% |
| | Switzerland | 10.2% |
| | United Kingdom | 10.0% |
| | Netherlands | 8.9% |
| | United States of America* | 7.7% |
| | Sweden | 7.5% |
| | Germany | 6.7% |
| | Spain | 3.7% |
| | Other | 20.0% |

* Includes Short-Term investments and Net Other Assets (Liabilities).
Percentages are based on country or territory of incorporation and are adjusted for the effect of futures contracts, if applicable.
Asset Allocation as of June 30, 2021
| | % of fund's net assets |
| Stocks | 98.4 |
| Short-Term Investments and Net Other Assets (Liabilities) | 1.6 |
Top Ten Stocks as of June 30, 2021
| | % of fund's net assets |
| ASML Holding NV (Netherlands) (Netherlands, Semiconductors & Semiconductor Equipment) | 2.7 |
| Nestle SA (Reg. S) (Switzerland, Food Products) | 2.5 |
| LVMH Moet Hennessy Louis Vuitton SE (France, Textiles, Apparel & Luxury Goods) | 2.3 |
| Roche Holding AG (participation certificate) (Switzerland, Pharmaceuticals) | 2.1 |
| AIA Group Ltd. (Hong Kong, Insurance) | 1.6 |
| DSV Panalpina A/S (Denmark, Air Freight & Logistics) | 1.5 |
| Diageo PLC (United Kingdom, Beverages) | 1.4 |
| Addlife AB (Sweden, Life Sciences Tools & Services) | 1.4 |
| Sony Group Corp. (Japan, Household Durables) | 1.4 |
| Hoya Corp. (Japan, Health Care Equipment & Supplies) | 1.3 |
| | 18.2 |
Top Market Sectors as of June 30, 2021
| | % of fund's net assets |
| Industrials | 22.0 |
| Information Technology | 18.5 |
| Financials | 17.2 |
| Health Care | 13.0 |
| Consumer Discretionary | 9.7 |
| Consumer Staples | 7.7 |
| Materials | 4.9 |
| Communication Services | 2.6 |
| Utilities | 1.2 |
| Real Estate | 1.0 |
Schedule of Investments June 30, 2021 (Unaudited)
Showing Percentage of Net Assets
| Common Stocks - 98.3% | | | |
| | | Shares | Value |
| Australia - 0.1% | | | |
| Lynas Rare Earths Ltd. (a) | | 621,134 | $2,659,829 |
| Austria - 0.4% | | | |
| Erste Group Bank AG | | 208,600 | 7,652,930 |
| Bailiwick of Jersey - 1.0% | | | |
| Ferguson PLC | | 108,700 | 15,111,653 |
| Sanne Group PLC | | 469,925 | 5,408,393 |
|
| TOTAL BAILIWICK OF JERSEY | | | 20,520,046 |
|
| Belgium - 0.8% | | | |
| KBC Groep NV | | 199,999 | 15,248,669 |
| Bermuda - 1.8% | | | |
| Genpact Ltd. | | 223,133 | 10,136,932 |
| Hiscox Ltd. (a) | | 566,945 | 6,521,865 |
| IHS Markit Ltd. | | 166,805 | 18,792,251 |
|
| TOTAL BERMUDA | | | 35,451,048 |
|
| Canada - 1.1% | | | |
| Constellation Software, Inc. | | 13,695 | 20,741,473 |
| Topicus.Com, Inc. | | 26,214 | 1,904,300 |
|
| TOTAL CANADA | | | 22,645,773 |
|
| Cayman Islands - 1.6% | | | |
| Alibaba Group Holding Ltd. sponsored ADR (a) | | 54,484 | 12,355,882 |
| NetEase, Inc. ADR | | 83,700 | 9,646,425 |
| Parade Technologies Ltd. | | 190,000 | 9,425,987 |
|
| TOTAL CAYMAN ISLANDS | | | 31,428,294 |
|
| China - 0.4% | | | |
| Gree Electric Appliances, Inc. of Zhuhai (A Shares) | | 940,700 | 7,590,050 |
| Denmark - 1.5% | | | |
| DSV Panalpina A/S | | 128,872 | 30,053,865 |
| Finland - 0.8% | | | |
| Nordea Bank ABP (Stockholm Stock Exchange) | | 1,359,803 | 15,142,652 |
| France - 12.2% | | | |
| Air Liquide SA | | 110,400 | 19,358,644 |
| ALTEN | | 96,481 | 12,790,182 |
| BNP Paribas SA | | 341,700 | 21,444,970 |
| Capgemini SA | | 130,365 | 25,042,008 |
| Dassault Systemes SA | | 75,816 | 18,384,309 |
| Edenred SA | | 276,642 | 15,761,758 |
| Legrand SA | | 200,000 | 21,168,009 |
| LVMH Moet Hennessy Louis Vuitton SE | | 57,430 | 45,177,712 |
| Pernod Ricard SA | | 84,842 | 18,832,582 |
| Safran SA | | 122,300 | 16,973,153 |
| SR Teleperformance SA | | 62,124 | 25,215,027 |
|
| TOTAL FRANCE | | | 240,148,354 |
|
| Germany - 6.7% | | | |
| adidas AG | | 49,456 | 18,454,896 |
| Allianz SE | | 95,486 | 23,810,697 |
| Auto1 Group SE (b) | | 21,200 | 931,359 |
| Brenntag AG | | 130,200 | 12,106,844 |
| Deutsche Borse AG | | 94,672 | 16,524,278 |
| Hannover Reuck SE | | 90,025 | 15,062,022 |
| Merck KGaA | | 92,700 | 17,773,906 |
| SAP SE | | 68,715 | 9,651,692 |
| Siemens Healthineers AG (b) | | 245,200 | 15,025,748 |
| SUSE SA (a) | | 66,600 | 2,609,990 |
|
| TOTAL GERMANY | | | 131,951,432 |
|
| Hong Kong - 1.6% | | | |
| AIA Group Ltd. | | 2,534,400 | 31,440,699 |
| India - 1.3% | | | |
| HDFC Bank Ltd. | | 699,791 | 14,095,568 |
| Reliance Industries Ltd. | | 29,840 | 596,660 |
| Reliance Industries Ltd. | | 369,400 | 10,484,423 |
|
| TOTAL INDIA | | | 25,176,651 |
|
| Ireland - 2.3% | | | |
| Flutter Entertainment PLC (a) | | 48,790 | 8,871,719 |
| Kerry Group PLC Class A | | 71,700 | 10,015,153 |
| Kingspan Group PLC (Ireland) | | 153,800 | 14,523,815 |
| Linde PLC | | 40,168 | 11,612,569 |
|
| TOTAL IRELAND | | | 45,023,256 |
|
| Italy - 2.3% | | | |
| FinecoBank SpA (a) | | 780,899 | 13,611,480 |
| GVS SpA (b) | | 109,736 | 1,796,950 |
| Moncler SpA | | 199,100 | 13,470,886 |
| Recordati SpA | | 298,319 | 17,049,871 |
|
| TOTAL ITALY | | | 45,929,187 |
|
| Japan - 13.1% | | | |
| Daikin Industries Ltd. | | 76,281 | 14,214,948 |
| Elecom Co. Ltd. | | 259,116 | 4,856,020 |
| Fujifilm Holdings Corp. | | 195,200 | 14,476,374 |
| Hoya Corp. | | 195,611 | 25,935,911 |
| Iriso Electronics Co. Ltd. | | 105,829 | 5,105,931 |
| Kao Corp. | | 173,074 | 10,648,191 |
| Keyence Corp. | | 35,161 | 17,745,869 |
| KH Neochem Co. Ltd. | | 40,301 | 936,288 |
| Nitori Holdings Co. Ltd. | | 53,573 | 9,460,839 |
| NOF Corp. | | 195,511 | 10,189,556 |
| Olympus Corp. | | 563,988 | 11,209,195 |
| Persol Holdings Co. Ltd. | | 467,803 | 9,242,788 |
| Recruit Holdings Co. Ltd. | | 421,771 | 20,683,143 |
| Relo Group, Inc. | | 333,674 | 7,628,894 |
| S Foods, Inc. | | 140,737 | 4,167,827 |
| SMC Corp. | | 26,985 | 15,946,399 |
| Sony Group Corp. | | 274,633 | 26,630,411 |
| Suzuki Motor Corp. | | 198,876 | 8,415,465 |
| TIS, Inc. | | 303,274 | 7,744,618 |
| Tokyo Electron Ltd. | | 54,232 | 23,470,674 |
| Tsuruha Holdings, Inc. | | 91,467 | 10,629,092 |
|
| TOTAL JAPAN | | | 259,338,433 |
|
| Kenya - 0.4% | | | |
| Safaricom Ltd. | | 20,584,900 | 7,907,730 |
| Korea (South) - 0.7% | | | |
| Samsung Electronics Co. Ltd. | | 192,755 | 13,765,777 |
| Netherlands - 8.9% | | | |
| Akzo Nobel NV | | 105,800 | 13,072,135 |
| ASM International NV (Netherlands) | | 49,400 | 16,225,566 |
| ASML Holding NV (Netherlands) | | 76,339 | 52,698,280 |
| Corbion NV | | 28,600 | 1,634,580 |
| Euronext NV (b) | | 120,589 | 13,112,037 |
| IMCD NV | | 149,926 | 23,839,595 |
| Koninklijke Philips Electronics NV | | 365,244 | 18,128,586 |
| Prosus NV | | 154,200 | 15,106,604 |
| Wolters Kluwer NV | | 227,617 | 22,865,662 |
|
| TOTAL NETHERLANDS | | | 176,683,045 |
|
| New Zealand - 0.4% | | | |
| EBOS Group Ltd. | | 344,879 | 7,786,575 |
| Norway - 0.7% | | | |
| Schibsted ASA: | | | |
| (A Shares) | | 269,600 | 13,013,218 |
| (B Shares) | | 22 | 916 |
|
| TOTAL NORWAY | | | 13,014,134 |
|
| Spain - 3.7% | | | |
| Aena SME SA (a)(b) | | 67,600 | 11,085,672 |
| Amadeus IT Holding SA Class A (a) | | 252,007 | 17,725,842 |
| Cellnex Telecom SA (b) | | 301,055 | 19,176,749 |
| Iberdrola SA | | 1,985,866 | 24,216,956 |
|
| TOTAL SPAIN | | | 72,205,219 |
|
| Sweden - 7.4% | | | |
| Addlife AB | | 887,324 | 27,268,461 |
| AddTech AB (B Shares) | | 889,009 | 14,750,853 |
| ASSA ABLOY AB (B Shares) | | 587,556 | 17,713,592 |
| Atlas Copco AB (A Shares) | | 286,919 | 17,567,633 |
| Hexagon AB (B Shares) | | 1,532,494 | 22,706,002 |
| Indutrade AB | | 970,041 | 24,823,148 |
| Kry International AB (c) | | 587 | 248,923 |
| Nordnet AB | | 361,600 | 6,103,355 |
| Swedish Match Co. AB | | 1,792,120 | 15,282,471 |
|
| TOTAL SWEDEN | | | 146,464,438 |
|
| Switzerland - 10.2% | | | |
| Julius Baer Group Ltd. | | 280,176 | 18,299,201 |
| Lonza Group AG | | 26,894 | 19,066,683 |
| Nestle SA (Reg. S) | | 402,355 | 50,152,377 |
| Roche Holding AG (participation certificate) | | 110,211 | 41,531,708 |
| Sika AG | | 76,324 | 24,953,267 |
| Sonova Holding AG Class B | | 54,454 | 20,480,942 |
| Temenos Group AG | | 56,110 | 9,011,560 |
| Zurich Insurance Group Ltd. | | 44,550 | 17,894,195 |
|
| TOTAL SWITZERLAND | | | 201,389,933 |
|
| Taiwan - 0.8% | | | |
| Taiwan Semiconductor Manufacturing Co. Ltd. | | 774,600 | 16,650,492 |
| United Kingdom - 10.0% | | | |
| Beazley PLC (a) | | 1,500,192 | 6,898,017 |
| Compass Group PLC (a) | | 958,039 | 20,183,884 |
| Cranswick PLC | | 150,352 | 8,256,882 |
| Dechra Pharmaceuticals PLC | | 184,435 | 11,149,134 |
| Diageo PLC | | 594,022 | 28,470,600 |
| Diploma PLC | | 325,835 | 13,089,128 |
| Dr. Martens Ltd. (a) | | 166,800 | 1,026,768 |
| JTC PLC (b) | | 514,500 | 4,377,003 |
| London Stock Exchange Group PLC | | 195,572 | 21,612,757 |
| Mondi PLC | | 556,382 | 14,630,918 |
| RELX PLC (London Stock Exchange) | | 777,348 | 20,635,112 |
| Rentokil Initial PLC | | 2,408,289 | 16,490,361 |
| Smith & Nephew PLC | | 612,736 | 13,288,552 |
| St. James's Place Capital PLC | | 384,063 | 7,846,922 |
| Volution Group PLC | | 1,474,697 | 8,537,184 |
|
| TOTAL UNITED KINGDOM | | | 196,493,222 |
|
| United States of America - 6.1% | | | |
| Ares Management Corp. | | 198,465 | 12,620,389 |
| Boston Scientific Corp. (a) | | 207,955 | 8,892,156 |
| CBRE Group, Inc. (a) | | 131,900 | 11,307,787 |
| Equifax, Inc. | | 49,100 | 11,759,941 |
| Fidelity National Information Services, Inc. | | 54,395 | 7,706,140 |
| Global Payments, Inc. | | 54,587 | 10,237,246 |
| Intercontinental Exchange, Inc. | | 108,851 | 12,920,614 |
| Marsh & McLennan Companies, Inc. | | 119,976 | 16,878,224 |
| Moody's Corp. | | 32,500 | 11,777,025 |
| Roper Technologies, Inc. | | 33,409 | 15,708,912 |
|
| TOTAL UNITED STATES OF AMERICA | | | 119,808,434 |
|
| TOTAL COMMON STOCKS | | | |
| (Cost $1,254,350,564) | | | 1,939,570,167 |
|
| Nonconvertible Preferred Stocks - 0.1% | | | |
| Sweden - 0.1% | | | |
| Kry International AB Series E (c) | | | |
| (Cost $1,550,731) | | 3,392 | 1,514,146 |
|
| Money Market Funds - 1.2% | | | |
| Fidelity Cash Central Fund 0.06% (d) | | | |
| (Cost $25,109,366) | | 25,104,345 | 25,109,366 |
| TOTAL INVESTMENT IN SECURITIES - 99.6% | | | |
| (Cost $1,281,010,661) | | | 1,966,193,679 |
| NET OTHER ASSETS (LIABILITIES) - 0.4% | | | 6,944,466 |
| NET ASSETS - 100% | | | $1,973,138,145 |
Categorizations in the Schedule of Investments are based on country or territory of incorporation.
Legend
(a) Non-income producing
(b) Security exempt from registration under Rule 144A of the Securities Act of 1933. These securities may be resold in transactions exempt from registration, normally to qualified institutional buyers. At the end of the period, the value of these securities amounted to $65,505,518 or 3.3% of net assets.
(c) Level 3 security
(d) Affiliated fund that is generally available only to investment companies and other accounts managed by Fidelity Investments. The rate quoted is the annualized seven-day yield of the fund at period end. A complete unaudited listing of the fund's holdings as of its most recent quarter end is available upon request. In addition, each Fidelity Central Fund's financial statements are available on the SEC's website or upon request.
Affiliated Central Funds
Information regarding fiscal year to date income earned by the Fund from investments in Fidelity Central Funds is as follows:
| Fund | Income earned |
| Fidelity Cash Central Fund | $4,499 |
| Fidelity Securities Lending Cash Central Fund | 20,534 |
| Total | $25,033 |
Amounts in the income column in the above table include any capital gain distributions from underlying funds, which are presented in the corresponding line-item in the Statement of Operations, if applicable. Amount for Fidelity Securities Lending Cash Central Fund represents the income earned on investing cash collateral, less rebates paid to borrowers and any lending agent fees associated with the loan, plus any premium payments received for lending certain types of securities.
Fiscal year to date information regarding the Fund's investments in Fidelity Central Funds, including the ownership percentage, is presented below.
| Fund | Value, beginning of period | Purchases | Sales Proceeds | Realized Gain/Loss | Change in Unrealized appreciation (depreciation) | Value, end of period | % ownership, end of period |
| Fidelity Cash Central Fund 0.06% | $15,666,388 | $200,410,209 | $190,967,231 | $81 | $(81) | $25,109,366 | 0.0% |
| Fidelity Securities Lending Cash Central Fund 0.06% | -- | 29,165,756 | 29,165,756 | -- | -- | -- | 0.0% |
| Total | $15,666,388 | $229,575,965 | $220,132,987 | $81 | $(81) | $25,109,366 | |
Investment Valuation
The following is a summary of the inputs used, as of June 30, 2021, involving the Fund's assets and liabilities carried at fair value. The inputs or methodology used for valuing securities may not be an indication of the risk associated with investing in those securities. For more information on valuation inputs, and their aggregation into the levels used below, please refer to the Investment Valuation section in the accompanying Notes to Financial Statements.
| | Valuation Inputs at Reporting Date: |
| Description | Total | Level 1 | Level 2 | Level 3 |
| Investments in Securities: | | | | |
| Equities: | | | | |
| Communication Services | $49,745,038 | $49,745,038 | $-- | $-- |
| Consumer Discretionary | 187,676,475 | 52,662,129 | 135,014,346 | -- |
| Consumer Staples | 156,455,175 | 77,832,198 | 78,622,977 | -- |
| Energy | 11,081,083 | 11,081,083 | -- | -- |
| Financials | 336,303,962 | 210,469,488 | 125,834,474 | -- |
| Health Care | 256,384,378 | 164,368,849 | 92,015,529 | -- |
| Industrials | 432,898,688 | 363,313,852 | 69,584,836 | -- |
| Information Technology | 368,338,091 | 287,574,558 | 79,000,464 | 1,763,069 |
| Materials | 99,047,786 | 79,689,142 | 19,358,644 | -- |
| Real Estate | 18,936,681 | 18,936,681 | -- | -- |
| Utilities | 24,216,956 | -- | 24,216,956 | -- |
| Money Market Funds | 25,109,366 | 25,109,366 | -- | -- |
| Total Investments in Securities: | $1,966,193,679 | $1,340,782,384 | $623,648,226 | $1,763,069 |
See accompanying notes which are an integral part of the financial statements.
Financial Statements
Statement of Assets and Liabilities
| | | June 30, 2021 (Unaudited) |
| Assets | | |
Investment in securities, at value — See accompanying schedule:
Unaffiliated issuers (cost $1,255,901,295) | $1,941,084,313 | |
| Fidelity Central Funds (cost $25,109,366) | 25,109,366 | |
| Total Investment in Securities (cost $1,281,010,661) | | $1,966,193,679 |
| Foreign currency held at value (cost $1,031,193) | | 1,025,083 |
| Receivable for investments sold | | 2,305,805 |
| Receivable for fund shares sold | | 4,923,537 |
| Dividends receivable | | 4,487,053 |
| Distributions receivable from Fidelity Central Funds | | 534 |
| Other receivables | | 236,359 |
| Total assets | | 1,979,172,050 |
| Liabilities | | |
| Payable for investments purchased | $2,935,608 | |
| Payable for fund shares redeemed | 843,870 | |
| Accrued management fee | 1,060,453 | |
| Distribution and service plan fees payable | 92,729 | |
| Other affiliated payables | 206,381 | |
| Other payables and accrued expenses | 894,864 | |
| Total liabilities | | 6,033,905 |
| Net Assets | | $1,973,138,145 |
| Net Assets consist of: | | |
| Paid in capital | | $1,221,224,225 |
| Total accumulated earnings (loss) | | 751,913,920 |
| Net Assets | | $1,973,138,145 |
| Net Asset Value and Maximum Offering Price | | |
| Initial Class: | | |
| Net Asset Value, offering price and redemption price per share ($961,930,677 ÷ 33,929,532 shares) | | $28.35 |
| Service Class: | | |
| Net Asset Value, offering price and redemption price per share ($161,559,453 ÷ 5,729,467 shares) | | $28.20 |
| Service Class 2: | | |
| Net Asset Value, offering price and redemption price per share ($376,826,292 ÷ 13,452,717 shares) | | $28.01 |
| Investor Class: | | |
| Net Asset Value, offering price and redemption price per share ($472,821,723 ÷ 16,747,972 shares) | | $28.23 |
See accompanying notes which are an integral part of the financial statements.
Statement of Operations
| | | Six months ended June 30, 2021 (Unaudited) |
| Investment Income | | |
| Dividends | | $19,610,101 |
| Income from Fidelity Central Funds (including $20,534 from security lending) | | 25,033 |
| Income before foreign taxes withheld | | 19,635,134 |
| Less foreign taxes withheld | | (2,472,379) |
| Total income | | 17,162,755 |
| Expenses | | |
| Management fee | $6,054,588 | |
| Transfer agent fees | 760,309 | |
| Distribution and service plan fees | 530,607 | |
| Accounting fees | 412,307 | |
| Custodian fees and expenses | 114,936 | |
| Independent trustees' fees and expenses | 3,082 | |
| Audit | 33,366 | |
| Legal | 2,906 | |
| Interest | 265 | |
| Miscellaneous | 4,886 | |
| Total expenses before reductions | 7,917,252 | |
| Expense reductions | (186,892) | |
| Total expenses after reductions | | 7,730,360 |
| Net investment income (loss) | | 9,432,395 |
| Realized and Unrealized Gain (Loss) | | |
| Net realized gain (loss) on: | | |
| Investment securities: | | |
| Unaffiliated issuers | 62,224,862 | |
| Fidelity Central Funds | 81 | |
| Foreign currency transactions | 61,921 | |
| Total net realized gain (loss) | | 62,286,864 |
| Change in net unrealized appreciation (depreciation) on: | | |
| Investment securities: | | |
| Unaffiliated issuers (net of decrease in deferred foreign taxes of $104,780) | 108,867,351 | |
| Fidelity Central Funds | (81) | |
| Assets and liabilities in foreign currencies | (191,870) | |
| Total change in net unrealized appreciation (depreciation) | | 108,675,400 |
| Net gain (loss) | | 170,962,264 |
| Net increase (decrease) in net assets resulting from operations | | $180,394,659 |
See accompanying notes which are an integral part of the financial statements.
Statement of Changes in Net Assets
| | Six months ended June 30, 2021 (Unaudited) | Year ended December 31, 2020 |
| Increase (Decrease) in Net Assets | | |
| Operations | | |
| Net investment income (loss) | $9,432,395 | $8,258,294 |
| Net realized gain (loss) | 62,286,864 | 56,354,927 |
| Change in net unrealized appreciation (depreciation) | 108,675,400 | 171,589,930 |
| Net increase (decrease) in net assets resulting from operations | 180,394,659 | 236,203,151 |
| Distributions to shareholders | (54,413,450) | (13,279,212) |
| Share transactions - net increase (decrease) | 50,905,236 | (140,128,077) |
| Total increase (decrease) in net assets | 176,886,445 | 82,795,862 |
| Net Assets | | |
| Beginning of period | 1,796,251,700 | 1,713,455,838 |
| End of period | $1,973,138,145 | $1,796,251,700 |
See accompanying notes which are an integral part of the financial statements.
Financial Highlights
VIP Overseas Portfolio Initial Class
| | Six months ended (Unaudited) June 30, | Years endedDecember 31, | | | | |
| | 2021 | 2020 | 2019 | 2018 | 2017 | 2016 |
| Selected Per–Share Data | | | | | | |
| Net asset value, beginning of period | $26.52 | $23.13 | $19.13 | $22.87 | $17.81 | $19.08 |
| Income from Investment Operations | | | | | | |
| Net investment income (loss)A | .15 | .13 | .40 | .36 | .31 | .28 |
| Net realized and unrealized gain (loss) | 2.49 | 3.46 | 4.74 | (3.75) | 5.08 | (1.25) |
| Total from investment operations | 2.64 | 3.59 | 5.14 | (3.39) | 5.39 | (.97) |
| Distributions from net investment income | – | (.10) | (.38) | (.35) | (.31) | (.27) |
| Distributions from net realized gain | (.81) | (.10) | (.77) | – | (.02) | (.03) |
| Total distributions | (.81) | (.20) | (1.14)B | (.35) | (.33) | (.30) |
| Net asset value, end of period | $28.35 | $26.52 | $23.13 | $19.13 | $22.87 | $17.81 |
| Total ReturnC,D,E | 10.21% | 15.61% | 27.77% | (14.81)% | 30.28% | (5.06)% |
| Ratios to Average Net AssetsF,G | | | | | | |
| Expenses before reductions | .77%H | .79% | .79% | .79% | .80% | .80% |
| Expenses net of fee waivers, if any | .77%H | .79% | .79% | .79% | .80% | .80% |
| Expenses net of all reductions | .75%H | .77% | .78% | .78% | .78% | .80% |
| Net investment income (loss) | 1.09%H | .59% | 1.87% | 1.59% | 1.46% | 1.56% |
| Supplemental Data | | | | | | |
| Net assets, end of period (000 omitted) | $961,931 | $872,019 | $826,554 | $662,011 | $822,994 | $702,946 |
| Portfolio turnover rateI | 30%H | 47% | 38% | 40% | 35% | 102% |
A Calculated based on average shares outstanding during the period.
B Total distributions per share do not sum due to rounding.
C Total returns for periods of less than one year are not annualized.
D Total returns do not reflect charges attributable to your insurance company's separate account. Inclusion of these charges would reduce the total returns shown.
E Total returns would have been lower if certain expenses had not been reduced during the applicable periods shown.
F Fees and expenses of any underlying mutual funds or exchange-traded funds (ETFs) are not included in the Fund's expense ratio. The Fund indirectly bears its proportionate share of these expenses. For additional expense information related to investments in Fidelity Central Funds, please refer to the "Investments in Fidelity Central Funds" note found in the Notes to Financial Statements section of the most recent Annual or Semi-Annual report.
G Expense ratios reflect operating expenses of the class. Expenses before reductions do not reflect amounts reimbursed, waived, or reduced through arrangements with the investment adviser, brokerage services, or other offset arrangements, if applicable, and do not represent the amount paid by the class during periods when reimbursements, waivers or reductions occur.
H Annualized
I Amount does not include the portfolio activity of any underlying mutual funds or exchange-traded funds (ETFs).
See accompanying notes which are an integral part of the financial statements.
VIP Overseas Portfolio Service Class
| | Six months ended (Unaudited) June 30, | Years endedDecember 31, | | | | |
| | 2021 | 2020 | 2019 | 2018 | 2017 | 2016 |
| Selected Per–Share Data | | | | | | |
| Net asset value, beginning of period | $26.40 | $23.03 | $19.05 | $22.77 | $17.74 | $19.00 |
| Income from Investment Operations | | | | | | |
| Net investment income (loss)A | .13 | .11 | .37 | .33 | .28 | .27 |
| Net realized and unrealized gain (loss) | 2.48 | 3.44 | 4.73 | (3.72) | 5.05 | (1.24) |
| Total from investment operations | 2.61 | 3.55 | 5.10 | (3.39) | 5.33 | (.97) |
| Distributions from net investment income | – | (.08) | (.36) | (.33) | (.28) | (.25) |
| Distributions from net realized gain | (.81) | (.10) | (.77) | – | (.02) | (.03) |
| Total distributions | (.81) | (.18) | (1.12)B | (.33) | (.30) | (.29)B |
| Net asset value, end of period | $28.20 | $26.40 | $23.03 | $19.05 | $22.77 | $17.74 |
| Total ReturnC,D,E | 10.14% | 15.49% | 27.67% | (14.88)% | 30.10% | (5.12)% |
| Ratios to Average Net AssetsF,G | | | | | | |
| Expenses before reductions | .87%H | .89% | .89% | .89% | .90% | .90% |
| Expenses net of fee waivers, if any | .87%H | .89% | .89% | .89% | .90% | .90% |
| Expenses net of all reductions | .85%H | .87% | .88% | .88% | .88% | .90% |
| Net investment income (loss) | .99%H | .49% | 1.77% | 1.49% | 1.36% | 1.46% |
| Supplemental Data | | | | | | |
| Net assets, end of period (000 omitted) | $161,559 | $151,886 | $134,648 | $114,094 | $141,047 | $118,444 |
| Portfolio turnover rateI | 30%H | 47% | 38% | 40% | 35% | 102% |
A Calculated based on average shares outstanding during the period.
B Total distributions per share do not sum due to rounding.
C Total returns for periods of less than one year are not annualized.
D Total returns do not reflect charges attributable to your insurance company's separate account. Inclusion of these charges would reduce the total returns shown.
E Total returns would have been lower if certain expenses had not been reduced during the applicable periods shown.
F Fees and expenses of any underlying mutual funds or exchange-traded funds (ETFs) are not included in the Fund's expense ratio. The Fund indirectly bears its proportionate share of these expenses. For additional expense information related to investments in Fidelity Central Funds, please refer to the "Investments in Fidelity Central Funds" note found in the Notes to Financial Statements section of the most recent Annual or Semi-Annual report.
G Expense ratios reflect operating expenses of the class. Expenses before reductions do not reflect amounts reimbursed, waived, or reduced through arrangements with the investment adviser, brokerage services, or other offset arrangements, if applicable, and do not represent the amount paid by the class during periods when reimbursements, waivers or reductions occur.
H Annualized
I Amount does not include the portfolio activity of any underlying mutual funds or exchange-traded funds (ETFs).
See accompanying notes which are an integral part of the financial statements.
VIP Overseas Portfolio Service Class 2
| | Six months ended (Unaudited) June 30, | Years endedDecember 31, | | | | |
| | 2021 | 2020 | 2019 | 2018 | 2017 | 2016 |
| Selected Per–Share Data | | | | | | |
| Net asset value, beginning of period | $26.25 | $22.90 | $18.95 | $22.66 | $17.65 | $18.92 |
| Income from Investment Operations | | | | | | |
| Net investment income (loss)A | .11 | .08 | .34 | .30 | .25 | .24 |
| Net realized and unrealized gain (loss) | 2.46 | 3.42 | 4.71 | (3.71) | 5.04 | (1.25) |
| Total from investment operations | 2.57 | 3.50 | 5.05 | (3.41) | 5.29 | (1.01) |
| Distributions from net investment income | – | (.05) | (.33) | (.30) | (.26) | (.23) |
| Distributions from net realized gain | (.81) | (.10) | (.77) | – | (.02) | (.03) |
| Total distributions | (.81) | (.15) | (1.10) | (.30) | (.28) | (.26) |
| Net asset value, end of period | $28.01 | $26.25 | $22.90 | $18.95 | $22.66 | $17.65 |
| Total ReturnB,C,D | 10.05% | 15.33% | 27.50% | (15.06)% | 29.99% | (5.32)% |
| Ratios to Average Net AssetsE,F | | | | | | |
| Expenses before reductions | 1.02%G | 1.04% | 1.04% | 1.04% | 1.05% | 1.05% |
| Expenses net of fee waivers, if any | 1.02%G | 1.04% | 1.04% | 1.04% | 1.05% | 1.05% |
| Expenses net of all reductions | 1.00%G | 1.02% | 1.03% | 1.03% | 1.03% | 1.05% |
| Net investment income (loss) | .84%G | .34% | 1.62% | 1.34% | 1.21% | 1.31% |
| Supplemental Data | | | | | | |
| Net assets, end of period (000 omitted) | $376,826 | $352,459 | $331,113 | $291,392 | $361,446 | $302,443 |
| Portfolio turnover rateH | 30%G | 47% | 38% | 40% | 35% | 102% |
A Calculated based on average shares outstanding during the period.
B Total returns for periods of less than one year are not annualized.
C Total returns do not reflect charges attributable to your insurance company's separate account. Inclusion of these charges would reduce the total returns shown.
D Total returns would have been lower if certain expenses had not been reduced during the applicable periods shown.
E Fees and expenses of any underlying mutual funds or exchange-traded funds (ETFs) are not included in the Fund's expense ratio. The Fund indirectly bears its proportionate share of these expenses. For additional expense information related to investments in Fidelity Central Funds, please refer to the "Investments in Fidelity Central Funds" note found in the Notes to Financial Statements section of the most recent Annual or Semi-Annual report.
F Expense ratios reflect operating expenses of the class. Expenses before reductions do not reflect amounts reimbursed, waived, or reduced through arrangements with the investment adviser, brokerage services, or other offset arrangements, if applicable, and do not represent the amount paid by the class during periods when reimbursements, waivers or reductions occur.
G Annualized
H Amount does not include the portfolio activity of any underlying mutual funds or exchange-traded funds (ETFs).
See accompanying notes which are an integral part of the financial statements.
VIP Overseas Portfolio Investor Class
| | Six months ended (Unaudited) June 30, | Years endedDecember 31, | | | | |
| | 2021 | 2020 | 2019 | 2018 | 2017 | 2016 |
| Selected Per–Share Data | | | | | | |
| Net asset value, beginning of period | $26.42 | $23.05 | $19.06 | $22.79 | $17.75 | $19.02 |
| Income from Investment Operations | | | | | | |
| Net investment income (loss)A | .14 | .11 | .38 | .34 | .29 | .27 |
| Net realized and unrealized gain (loss) | 2.48 | 3.44 | 4.74 | (3.74) | 5.06 | (1.25) |
| Total from investment operations | 2.62 | 3.55 | 5.12 | (3.40) | 5.35 | (.98) |
| Distributions from net investment income | – | (.08) | (.36) | (.33) | (.29) | (.26) |
| Distributions from net realized gain | (.81) | (.10) | (.77) | – | (.02) | (.03) |
| Total distributions | (.81) | (.18) | (1.13) | (.33) | (.31) | (.29) |
| Net asset value, end of period | $28.23 | $26.42 | $23.05 | $19.06 | $22.79 | $17.75 |
| Total ReturnB,C,D | 10.17% | 15.49% | 27.74% | (14.90)% | 30.18% | (5.14)% |
| Ratios to Average Net AssetsE,F | | | | | | |
| Expenses before reductions | .85%G | .87% | .87% | .87% | .88% | .88% |
| Expenses net of fee waivers, if any | .85%G | .86% | .87% | .87% | .88% | .88% |
| Expenses net of all reductions | .83%G | .85% | .86% | .86% | .86% | .88% |
| Net investment income (loss) | 1.01%G | .51% | 1.79% | 1.51% | 1.38% | 1.48% |
| Supplemental Data | | | | | | |
| Net assets, end of period (000 omitted) | $472,822 | $419,888 | $421,140 | $340,705 | $445,429 | $303,787 |
| Portfolio turnover rateH | 30%G | 47% | 38% | 40% | 35% | 102% |
A Calculated based on average shares outstanding during the period.
B Total returns for periods of less than one year are not annualized.
C Total returns do not reflect charges attributable to your insurance company's separate account. Inclusion of these charges would reduce the total returns shown.
D Total returns would have been lower if certain expenses had not been reduced during the applicable periods shown.
E Fees and expenses of any underlying mutual funds or exchange-traded funds (ETFs) are not included in the Fund's expense ratio. The Fund indirectly bears its proportionate share of these expenses. For additional expense information related to investments in Fidelity Central Funds, please refer to the "Investments in Fidelity Central Funds" note found in the Notes to Financial Statements section of the most recent Annual or Semi-Annual report.
F Expense ratios reflect operating expenses of the class. Expenses before reductions do not reflect amounts reimbursed, waived, or reduced through arrangements with the investment adviser, brokerage services, or other offset arrangements, if applicable, and do not represent the amount paid by the class during periods when reimbursements, waivers or reductions occur.
G Annualized
H Amount does not include the portfolio activity of any underlying mutual funds or exchange-traded funds (ETFs).
See accompanying notes which are an integral part of the financial statements.
Notes to Financial Statements (Unaudited)
For the period ended June 30, 2021
1. Organization.
VIP Overseas Portfolio (the Fund) is a fund of Variable Insurance Products Fund (the Trust) and is authorized to issue an unlimited number of shares. The Trust is registered under the Investment Company Act of 1940, as amended (the 1940 Act), as an open-end management investment company organized as a Massachusetts business trust. Shares of the Fund may only be purchased by insurance companies for the purpose of funding variable annuity or variable life insurance contracts. The Fund offers the following classes of shares: Initial Class shares, Service Class shares, Service Class 2 shares and Investor Class shares. All classes have equal rights and voting privileges, except for matters affecting a single class.
2. Investments in Fidelity Central Funds.
Funds may invest in Fidelity Central Funds, which are open-end investment companies generally available only to other investment companies and accounts managed by the investment adviser and its affiliates. The Schedule of Investments lists any Fidelity Central Funds held as an investment as of period end, but does not include the underlying holdings of each Fidelity Central Fund. An investing fund indirectly bears its proportionate share of the expenses of the underlying Fidelity Central Funds.
Based on its investment objective, each Fidelity Central Fund may invest or participate in various investment vehicles or strategies that are similar to those of the investing fund. These strategies are consistent with the investment objectives of the investing fund and may involve certain economic risks which may cause a decline in value of each of the Fidelity Central Funds and thus a decline in the value of the investing fund.
| Fidelity Central Fund | Investment Manager | Investment Objective | Investment Practices | Expense Ratio(a) |
| Fidelity Money Market Central Funds | Fidelity Management & Research Company LLC (FMR) | Each fund seeks to obtain a high level of current income consistent with the preservation of capital and liquidity. | Short-term Investments | Less than .005% to .01% |
(a) Expenses expressed as a percentage of average net assets and are as of each underlying Central Fund's most recent annual or semi-annual shareholder report.
A complete unaudited list of holdings for each Fidelity Central Fund is available upon request or at the Securities and Exchange Commission website at www.sec.gov. In addition, the financial statements of the Fidelity Central Funds which contain the significant accounting policies (including investment valuation policies) of those funds, and are not covered by the Report of Independent Registered Public Accounting Firm, are available on the Securities and Exchange Commission website or upon request.
3. Significant Accounting Policies.
The Fund is an investment company and applies the accounting and reporting guidance of the Financial Accounting Standards Board (FASB) Accounting Standards Codification Topic 946 Financial Services - Investment Companies. The financial statements have been prepared in conformity with accounting principles generally accepted in the United States of America (GAAP), which require management to make certain estimates and assumptions at the date of the financial statements. Actual results could differ from those estimates. Subsequent events, if any, through the date that the financial statements were issued have been evaluated in the preparation of the financial statements. The Fund's Schedule of Investments lists any underlying mutual funds or exchange-traded funds (ETFs) but does not include the underlying holdings of these funds. The following summarizes the significant accounting policies of the Fund:
Investment Valuation. Investments are valued as of 4:00 p.m. Eastern time on the last calendar day of the period. The Board of Trustees (the Board) has delegated the day to day responsibility for the valuation of the Fund's investments to the Fair Value Committee (the Committee) established by the Fund's investment adviser. In accordance with valuation policies and procedures approved by the Board, the Fund attempts to obtain prices from one or more third party pricing vendors or brokers to value its investments. When current market prices, quotations or currency exchange rates are not readily available or reliable, investments will be fair valued in good faith by the Committee, in accordance with procedures adopted by the Board. Factors used in determining fair value vary by investment type and may include market or investment specific events. The frequency with which these procedures are used cannot be predicted and they may be utilized to a significant extent. The Committee oversees the Fund's valuation policies and procedures and reports to the Board on the Committee's activities and fair value determinations. The Board monitors the appropriateness of the procedures used in valuing the Fund's investments and ratifies the fair value determinations of the Committee.
The Fund categorizes the inputs to valuation techniques used to value its investments into a disclosure hierarchy consisting of three levels as shown below:
- Level 1 – quoted prices in active markets for identical investments
- Level 2 – other significant observable inputs (including quoted prices for similar investments, interest rates, prepayment speeds, etc.)
- Level 3 – unobservable inputs (including the Fund's own assumptions based on the best information available)
Valuation techniques used to value the Fund's investments by major category are as follows:
Equity securities, including restricted securities, for which market quotations are readily available, are valued at the last reported sale price or official closing price as reported by a third party pricing vendor on the primary market or exchange on which they are traded and are categorized as Level 1 in the hierarchy. In the event there were no sales during the day or closing prices are not available, securities are valued at the last quoted bid price or may be valued using the last available price and are generally categorized as Level 2 in the hierarchy. For foreign equity securities, when market or security specific events arise, comparisons to the valuation of American Depositary Receipts (ADRs), futures contracts, Exchange-Traded Funds (ETFs) and certain indexes as well as quoted prices for similar securities may be used and would be categorized as Level 2 in the hierarchy. For equity securities, including restricted securities, where observable inputs are limited, assumptions about market activity and risk are used and these securities may be categorized as Level 3 in the hierarchy.
Investments in open-end mutual funds, including the Fidelity Central Funds, are valued at their closing net asset value (NAV) each business day and are categorized as Level 1 in the hierarchy.
Changes in valuation techniques may result in transfers in or out of an assigned level within the disclosure hierarchy. The aggregate value of investments by input level as of June 30, 2021 is included at the end of the Fund's Schedule of Investments.
Foreign Currency. Certain Funds may use foreign currency contracts to facilitate transactions in foreign-denominated securities. Gains and losses from these transactions may arise from changes in the value of the foreign currency or if the counterparties do not perform under the contracts' terms.
Foreign-denominated assets, including investment securities, and liabilities are translated into U.S. dollars at the exchange rates at period end. Purchases and sales of investment securities, income and dividends received, and expenses denominated in foreign currencies are translated into U.S. dollars at the exchange rate in effect on the transaction date.
The effects of exchange rate fluctuations on investments are included with the net realized and unrealized gain (loss) on investment securities. Other foreign currency transactions resulting in realized and unrealized gain (loss) are disclosed separately.
Investment Transactions and Income. For financial reporting purposes, the Fund's investment holdings and NAV include trades executed through the end of the last business day of the period. The NAV per share for processing shareholder transactions is calculated as of the close of business of the New York Stock Exchange (NYSE), normally 4:00 p.m. Eastern time and includes trades executed through the end of the prior business day. Gains and losses on securities sold are determined on the basis of identified cost and include proceeds received from litigation. Dividend income is recorded on the ex-dividend date, except for certain dividends from foreign securities where the ex-dividend date may have passed, which are recorded as soon as the Fund is informed of the ex-dividend date. Non-cash dividends included in dividend income, if any, are recorded at the fair market value of the securities received. Income and capital gain distributions from Fidelity Central Funds, if any, are recorded on the ex-dividend date. Certain distributions received by the Fund represent a return of capital or capital gain. The Fund determines the components of these distributions subsequent to the ex-dividend date, based upon receipt of tax filings or other correspondence relating to the underlying investment. These distributions are recorded as a reduction of cost of investments and/or as a realized gain. Investment income is recorded net of foreign taxes withheld where recovery of such taxes is uncertain.
Class Allocations and Expenses. Investment income, realized and unrealized capital gains and losses, common expenses of a fund, and certain fund-level expense reductions, if any, are allocated daily on a pro-rata basis to each class based on the relative net assets of each class to the total net assets of a fund. Each class differs with respect to transfer agent and distribution and service plan fees incurred, as applicable. Certain expense reductions may also differ by class, if applicable. For the reporting period, the allocated portion of income and expenses to each class as a percent of its average net assets may vary due to the timing of recording these transactions in relation to fluctuating net assets of the classes. Expenses directly attributable to a fund are charged to that fund. Expenses attributable to more than one fund are allocated among the respective funds on the basis of relative net assets or other appropriate methods. Expenses included in the accompanying financial statements reflect the expenses of that fund and do not include any expenses associated with any underlying mutual funds or exchange-traded funds. Although not included in a fund's expenses, a fund indirectly bears its proportionate share of these expenses through the net asset value of each underlying mutual fund or exchange-traded fund. Expense estimates are accrued in the period to which they relate and adjustments are made when actual amounts are known.
Deferred Trustee Compensation. Under a Deferred Compensation Plan (the Plan) for certain Funds, certain independent Trustees have elected to defer receipt of a portion of their annual compensation. Deferred amounts are invested in affiliated mutual funds, are marked-to-market and remain in a fund until distributed in accordance with the Plan. The investment of deferred amounts and the offsetting payable to the Trustees presented below are included in the accompanying Statement of Assets and Liabilities in other receivables and other payables and accrued expenses, as applicable.
| VIP Overseas Portfolio | $22,051 |
Income Tax Information and Distributions to Shareholders. Each year, the Fund intends to qualify as a regulated investment company under Subchapter M of the Internal Revenue Code, including distributing substantially all of its taxable income and realized gains. As a result, no provision for U.S. Federal income taxes is required. The Fund files a U.S. federal tax return, in addition to state and local tax returns as required. The Fund's federal income tax returns are subject to examination by the Internal Revenue Service (IRS) for a period of three fiscal years after they are filed. State and local tax returns may be subject to examination for an additional fiscal year depending on the jurisdiction. Foreign taxes are provided for based on the Fund's understanding of the tax rules and rates that exist in the foreign markets in which it invests. The Fund is subject to a tax imposed on capital gains by certain countries in which it invests. An estimated deferred tax liability for net unrealized appreciation on the applicable securities is included in Other payables and accrued expenses on the Statement of Assets & Liabilities.
Distributions are declared and recorded on the ex-dividend date. Income and capital gain distributions are declared separately for each class. Income and capital gain distributions are determined in accordance with income tax regulations, which may differ from GAAP.
Capital accounts within the financial statements are adjusted for permanent book-tax differences. These adjustments have no impact on net assets or the results of operations. Capital accounts are not adjusted for temporary book-tax differences which will reverse in a subsequent period.
Book-tax differences are primarily due to foreign currency transactions, certain foreign taxes, passive foreign investment companies (PFIC), deferred trustees compensation and losses deferred due to wash sales.
As of period end, the cost and unrealized appreciation (depreciation) in securities, and derivatives if applicable, for federal income tax purposes were as follows:
| Gross unrealized appreciation | $705,095,095 |
| Gross unrealized depreciation | (22,987,524) |
| Net unrealized appreciation (depreciation) | $682,107,571 |
| Tax cost | $1,284,086,108 |
Restricted Securities (including Private Placements). Funds may invest in securities that are subject to legal or contractual restrictions on resale. These securities generally may be resold in transactions exempt from registration or to the public if the securities are registered. Disposal of these securities may involve time-consuming negotiations and expense, and prompt sale at an acceptable price may be difficult. Information regarding restricted securities held at period end is included at the end of the Schedule of Investments, if applicable.
4. Purchases and Sales of Investments.
Purchases and sales of securities, other than short-term securities and in-kind transactions, as applicable, are noted in the table below.
| | Purchases ($) | Sales ($) |
| VIP Overseas Portfolio | 276,791,778 | 293,368,016 |
5. Fees and Other Transactions with Affiliates.
Management Fee. Fidelity Management & Research Company LLC (the investment adviser) and its affiliates provide the Fund with investment management related services for which the Fund pays a monthly management fee. The management fee is the sum of an individual fund fee rate that is based on an annual rate of .424% of the Fund's average net assets and an annualized group fee rate that averaged .23% during the period. The group fee rate is based upon the monthly average net assets of a group of registered investment companies with which the investment adviser has management contracts. The group fee rate decreases as assets under management increase and increases as assets under management decrease. For the reporting period, the total annualized management fee rate was .65% of the Fund's average net assets.
Distribution and Service Plan Fees. In accordance with Rule 12b-1 of the 1940 Act, the Fund has adopted separate 12b-1 Plans for each Service Class of shares. Each Service Class pays Fidelity Distributors Company LLC (FDC), an affiliate of the investment adviser, a service fee. For the period, the service fee is based on an annual rate of .10% of Service Class' average net assets and .25% of Service Class 2's average net assets.
For the period, total fees, all of which were re-allowed to insurance companies for the distribution of shares and providing shareholder support services, were as follows:
| Service Class | $78,372 |
| Service Class 2 | 452,235 |
| | $530,607 |
Transfer Agent Fees. Fidelity Investments Institutional Operations Company LLC (FIIOC), an affiliate of the investment adviser, is the Fund's transfer, dividend disbursing, and shareholder servicing agent. FIIOC receives an asset-based fee with respect to each class. Each class pays a fee for transfer agent services, typesetting and printing and mailing of shareholder reports, excluding mailing of proxy statements. For the period, transfer agent fees for each class were as follows:
| | Amount | % of Class-Level Average Net Assets(a) |
| Initial Class | $287,718 | .06 |
| Service Class | 49,815 | .06 |
| Service Class 2 | 114,980 | .06 |
| Investor Class | 307,796 | .14 |
| | $760,309 | |
(a) Annualized
Accounting Fees. Fidelity Service Company, Inc. (FSC), an affiliate of the investment adviser, maintains the Fund's accounting records. The accounting fee is based on the level of average net assets for each month. For the period, the fees were equivalent to the following annualized rates:
| | % of Average Net Assets |
| VIP Overseas Portfolio | .04 |
Brokerage Commissions. A portion of portfolio transactions were placed with brokerage firms which are affiliates of the investment adviser. Brokerage commissions are included in net realized gain (loss) and change in net unrealized appreciation (depreciation) in the Statement of Operations. The commissions paid to these affiliated firms were as follows:
| | Amount |
| VIP Overseas Portfolio | $366 |
Interfund Lending Program. Pursuant to an Exemptive Order issued by the Securities and Exchange Commission (the SEC), the Fund, along with other registered investment companies having management contracts with Fidelity Management & Research Company LLC (FMR), or other affiliated entities of FMR, may participate in an interfund lending program. This program provides an alternative credit facility allowing the Fund to borrow from, or lend money to, other participating affiliated funds. At period end, there were no interfund loans outstanding. Activity in this program during the period for which loans were outstanding was as follows:
| | Borrower or Lender | Average Loan Balance | Weighted Average Interest Rate | Interest Expense |
| VIP Overseas Portfolio | Borrower | $6,342,400 | .30% | $265 |
Interfund Trades. Funds may purchase from or sell securities to other Fidelity Funds under procedures adopted by the Board. The procedures have been designed to ensure these interfund trades are executed in accordance with Rule 17a-7 of the 1940 Act. Any interfund trades are included within the respective purchases and sales amounts shown in the Purchases and Sales of Investments note and are noted in the table below.
| | Purchases ($) | Sales ($) |
| VIP Overseas Portfolio | 6,854,801 | 27,083,998 |
6. Committed Line of Credit.
Certain Funds participate with other funds managed by the investment adviser or an affiliate in a $4.25 billion credit facility (the "line of credit") to be utilized for temporary or emergency purposes to fund shareholder redemptions or for other short-term liquidity purposes. During the period, there were no borrowings on this line of credit.
| | Amount |
| VIP Overseas Portfolio | $1,764 |
7. Security Lending.
Funds lend portfolio securities from time to time in order to earn additional income. Lending agents are used, including National Financial Services (NFS), an affiliate of the investment adviser. Pursuant to a securities lending agreement, NFS will receive a fee, which is capped at 9.9% of a fund's daily lending revenue, for its services as lending agent. A fund may lend securities to certain qualified borrowers, including NFS. On the settlement date of the loan, a fund receives collateral (in the form of U.S. Treasury obligations, letters of credit and/or cash) against the loaned securities and maintains collateral in an amount not less than 100% of the market value of the loaned securities during the period of the loan. The market value of the loaned securities is determined at the close of business of a fund and any additional required collateral is delivered to a fund on the next business day. A fund or borrower may terminate the loan at any time, and if the borrower defaults on its obligation to return the securities loaned because of insolvency or other reasons, a fund may apply collateral received from the borrower against the obligation. A fund may experience delays and costs in recovering the securities loaned. Any cash collateral received is invested in the Fidelity Securities Lending Cash Central Fund. Any loaned securities are identified as such in the Schedule of Investments, and the value of loaned securities and cash collateral at period end, as applicable, are presented in the Statement of Assets and Liabilities. Security lending income represents the income earned on investing cash collateral, less rebates paid to borrowers and any lending agent fees associated with the loan, plus any premium payments received for lending certain types of securities. Security lending income is presented in the Statement of Operations as a component of income from Fidelity Central Funds. Affiliated security lending activity, if any, was as follows:
| | Total Security Lending Fees Paid to NFS | Security Lending Income From Securities Loaned to NFS | Value of Securities Loaned to NFS at Period End |
| VIP Overseas Portfolio | $2,204 | $– | $– |
8. Expense Reductions.
Commissions paid to certain brokers with whom the investment adviser, or its affiliates, places trades on behalf of the Fund include an amount in addition to trade execution, which may be rebated back to the Fund to offset expenses. This amount totaled $184,592 for the period.
In addition, during the period the investment adviser or an affiliate reimbursed and/or waived a portion of fund-level operating expenses in the amount of $2,300.
9. Distributions to Shareholders.
Distributions to shareholders of each class were as follows:
| | Six months ended
June 30, 2021 | Year ended
December 31, 2020 |
| VIP Overseas Portfolio | | |
| Distributions to shareholders | | |
| Initial Class | $26,294,128 | $7,003,268 |
| Service Class | 4,635,902 | 1,056,975 |
| Service Class 2 | 10,673,166 | 2,052,603 |
| Investor Class | 12,810,254 | 3,166,366 |
| Total | $54,413,450 | $13,279,212 |
10. Share Transactions.
Transactions for each class of shares were as follows and may contain in-kind transactions:
| | Shares | Shares | Dollars | Dollars |
| | Six months ended June 30, 2021 | Year ended December 31, 2020 | Six months ended June 30, 2021 | Year ended December 31, 2020 |
| VIP Overseas Portfolio | | | | |
| Initial Class | | | | |
| Shares sold | 4,040,911 | 8,718,934 | $110,274,499 | $193,650,308 |
| Reinvestment of distributions | 1,007,824 | 288,231 | 26,294,128 | 7,003,268 |
| Shares redeemed | (3,998,576) | (11,859,183) | (108,362,329) | (264,785,465) |
| Net increase (decrease) | 1,050,159 | (2,852,018) | $28,206,298 | $(64,131,889) |
| Service Class | | | | |
| Shares sold | 234,575 | 1,102,068 | $6,252,206 | $25,655,019 |
| Reinvestment of distributions | 178,579 | 43,826 | 4,635,902 | 1,056,975 |
| Shares redeemed | (437,834) | (1,239,298) | (11,804,964) | (27,816,457) |
| Net increase (decrease) | (24,680) | (93,404) | $(916,856) | $(1,104,463) |
| Service Class 2 | | | | |
| Shares sold | 479,182 | 1,038,522 | $12,791,207 | $22,307,744 |
| Reinvestment of distributions | 413,528 | 86,431 | 10,673,166 | 2,052,604 |
| Shares redeemed | (869,260) | (2,155,681) | (23,225,196) | (47,995,578) |
| Net increase (decrease) | 23,450 | (1,030,728) | $239,177 | $(23,635,230) |
| Investor Class | | | | |
| Shares sold | 1,725,307 | 3,078,543 | $47,223,570 | $66,853,744 |
| Reinvestment of distributions | 492,892 | 131,397 | 12,810,254 | 3,166,366 |
| Shares redeemed | (1,360,926) | (5,591,632) | (36,657,207) | (121,276,605) |
| Net increase (decrease) | 857,273 | (2,381,692) | $23,376,617 | $(51,256,495) |
11. Other.
Fund's organizational documents provide former and current trustees and officers with a limited indemnification against liabilities arising in connection with the performance of their duties to the fund. In the normal course of business, the fund may also enter into contracts that provide general indemnifications. The fund's maximum exposure under these arrangements is unknown as this would be dependent on future claims that may be made against the fund. The risk of material loss from such claims is considered remote.
At the end of the period, the investment adviser or its affiliates were owners of record of more than 10% and certain otherwise unaffiliated shareholders were owners of record of more than 10% of the outstanding shares as follows:
| Fund | Affiliated % | Number of
Unaffiliated Shareholders | Unaffiliated Shareholders % |
| VIP: Overseas Portfolio | 19% | 1 | 15% |
Mutual funds managed by the investment adviser or its affiliates, in aggregate, were the owners of record of more than 20% of the total outstanding shares.
| Fund | % of shares held |
| VIP: Overseas Portfolio | 35% |
12. Coronavirus (COVID-19) Pandemic.
An outbreak of COVID-19 first detected in China during December 2019 has since spread globally and was declared a pandemic by the World Health Organization during March 2020. Developments that disrupt global economies and financial markets, such as the COVID-19 pandemic, may magnify factors that affect the Fund's performance.
Shareholder Expense Example
As a shareholder, you incur two types of costs: (1) transaction costs, which may include sales charges (loads) on purchase payments or redemption proceeds, as applicable and (2) ongoing costs, which generally include management fees, distribution and/or service (12b-1) fees and other Fund expenses. This Example is intended to help you understand your ongoing costs (in dollars) of investing in a fund and to compare these costs with the ongoing costs of investing in other mutual funds.
The Example is based on an investment of $1,000 invested at the beginning of the period and held for the entire period (January 1, 2021 to June 30, 2021).
Actual Expenses
The first line of the accompanying table provides information about actual account values and actual expenses. You may use the information in this line, together with the amount you invested, to estimate the expenses that you paid over the period. Simply divide your account value by $1,000.00 (for example, an $8,600 account value divided by $1,000.00 = 8.6), then multiply the result by the number in the first line for a class/Fund under the heading entitled "Expenses Paid During Period" to estimate the expenses you paid on your account during this period. If any fund is a shareholder of any underlying mutual funds or exchange-traded funds (ETFs) (the Underlying Funds), such fund indirectly bears its proportional share of the expenses of the Underlying Funds in addition to the direct expenses incurred presented in the table. These fees and expenses are not included in the annualized expense ratio used to calculate the expense estimate in the table below. The estimate of expenses does not include any fees or other expenses of any variable annuity or variable life insurance product. If they were, the estimate of expenses you paid during the period would be higher, and your ending account value would be lower.
Hypothetical Example for Comparison Purposes
The second line of the accompanying table provides information about hypothetical account values and hypothetical expenses based on the actual expense ratio and an assumed rate of return of 5% per year before expenses, which is not the actual return. The hypothetical account values and expenses may not be used to estimate the actual ending account balance or expenses you paid for the period. You may use this information to compare the ongoing costs of investing in the Fund and other funds. To do so, compare this 5% hypothetical example with the 5% hypothetical examples that appear in the shareholder reports of the other funds. If any fund is a shareholder of any Underlying Funds, such fund indirectly bears its proportional share of the expenses of the Underlying Funds in addition to the direct expenses as presented in the table. These fees and expenses are not included in the annualized expense ratio used to calculate the expense estimate in the table below. The estimate of expenses does not include any fees or other expenses of any variable annuity or variable life insurance product. If they were, the estimate of expenses you paid during the period would be higher, and your ending account value would be lower.
Please note that the expenses shown in the table are meant to highlight your ongoing costs only and do not reflect any transaction costs. Therefore, the second line of the table is useful in comparing ongoing costs only, and will not help you determine the relative total costs of owning different funds.
| | Annualized Expense Ratio-A | Beginning
Account Value
January 1, 2021 | Ending
Account Value
June 30, 2021 | Expenses Paid
During Period-B
January 1, 2021
to June 30, 2021 |
| VIP Overseas Portfolio | | | | |
| Initial Class | .77% | | | |
| Actual | | $1,000.00 | $1,102.10 | $4.01 |
| Hypothetical-C | | $1,000.00 | $1,020.98 | $3.86 |
| Service Class | .87% | | | |
| Actual | | $1,000.00 | $1,101.40 | $4.53 |
| Hypothetical-C | | $1,000.00 | $1,020.48 | $4.36 |
| Service Class 2 | 1.02% | | | |
| Actual | | $1,000.00 | $1,100.50 | $5.31 |
| Hypothetical-C | | $1,000.00 | $1,019.74 | $5.11 |
| Investor Class | .85% | | | |
| Actual | | $1,000.00 | $1,101.70 | $4.43 |
| Hypothetical-C | | $1,000.00 | $1,020.58 | $4.26 |
A Annualized expense ratio reflects expenses net of applicable fee waivers.
B Expenses are equal to the annualized expense ratio, multiplied by the average account value over the period, multiplied by 181/ 365 (to reflect the one-half year period). The fees and expenses of any Underlying Funds are not included in each annualized expense ratio.
C 5% return per year before expenses
Board Approval of Investment Advisory Contracts and Management Fees
VIP Overseas Portfolio
Each year, the Board of Trustees, including the Independent Trustees (together, the Board), votes on the renewal of the management contract with Fidelity Management & Research Company LLC (FMR) and the sub-advisory agreements (together, the Advisory Contracts) for the fund. FMR and the sub-advisers are referred to herein as the Investment Advisers. The Board, assisted by the advice of fund counsel and Independent Trustees' counsel, requests and considers a broad range of information relevant to the renewal of the Advisory Contracts throughout the year.
The Board meets regularly and, at each of its meetings, covers an extensive agenda of topics and materials and considers factors that are relevant to its annual consideration of the renewal of the fund's Advisory Contracts, including the services and support provided to the fund and its shareholders. The Board has established various standing committees (Committees), each composed of and chaired by Independent Trustees with varying backgrounds, to which the Board has assigned specific subject matter responsibilities in order to enhance effective decision-making by the Board. The Board, acting directly and through its Committees, requests and receives information concerning the annual consideration of the renewal of the fund's Advisory Contracts. The Board also meets as needed to review matters specifically related to the Board's annual consideration of the renewal of the Advisory Contracts. Members of the Board may also meet with trustees of other Fidelity funds through joint ad hoc committees to discuss certain matters relevant to all of the Fidelity funds.
Approval of Stub Period Continuation. At its January 2021 meeting, the Board of Trustees voted to continue the fund's management contract with FMR, and the sub-advisory agreements and sub-subadvisory agreements, in each case, where applicable (together, the Advisory Contracts), without modification, for four months from February 1, 2021 through May 31, 2021, in connection with changes to the Board's meeting calendar. The Board considered that the approval of the fund's Advisory Contracts will not result in any changes in (i) the investment process or strategies employed in the management of the fund's assets; (ii) the fees and expenses paid by shareholders; (iii) the nature, extent or quality of services provided under the fund's Advisory Contracts; or (iv) the day-to-day management of the fund or the persons primarily responsible for such management. The Board also considered that since its last approval of the fund's Advisory Contracts, FMR had provided additional information on the fund in support of the annual contract renewal process, including competitive analyses on total expenses and management fees and in-depth reviews of fund performance and fund profitability information. The Board also considered the findings of certain ad hoc committees that had been previously formed to discuss matters relevant to all of the Fidelity funds, including economies of scale, fall-out benefits and retail vs. institutional funds. The Board concluded that the fund's Advisory Contracts are fair and reasonable, and that the fund's Advisory Contracts should be renewed, without modification, through May 31, 2021, with the understanding that the Board will consider the annual renewal for a full one year period in May 2021.
At its May 2021 meeting, the Board unanimously determined to renew the fund's Advisory Contracts. In reaching its determination, the Board considered all factors it believed relevant, including (i) the nature, extent, and quality of the services provided to the fund and its shareholders (including the investment performance of the fund); (ii) the competitiveness of the fund's management fee and total expense ratio relative to peer funds; (iii) the total costs of the services provided by and the profits realized by Fidelity from its relationships with the fund; and (iv) the extent to which, if any, economies of scale exist and are realized as the fund grows, and whether any economies of scale are appropriately shared with fund shareholders.
In considering whether to renew the Advisory Contracts for the fund, the Board reached a determination, with the assistance of fund counsel and Independent Trustees' counsel and through the exercise of its business judgment, that the renewal of the Advisory Contracts was in the best interests of the fund and its shareholders and that the compensation payable under the Advisory Contracts was fair and reasonable. The Board's decision to renew the Advisory Contracts was not based on any single factor, but rather was based on a comprehensive consideration of all the information provided to the Board at its meetings throughout the year. The Board, in reaching its determination to renew the Advisory Contracts, was aware that shareholders of the fund have a broad range of investment choices available to them, including a wide choice among funds offered by Fidelity's competitors, and that the fund's shareholders, who have the opportunity to review and weigh the disclosure provided by the fund in its prospectus and other public disclosures, have chosen to invest in this fund, which is part of the Fidelity family of funds.
Nature, Extent, and Quality of Services Provided. The Board considered Fidelity's staffing as it relates to the fund, including the backgrounds of investment personnel of Fidelity, and also considered the fund's investment objective, strategies, and related investment philosophy. The Independent Trustees also had discussions with senior management of Fidelity's investment operations and investment groups. The Board considered the structure of the investment personnel compensation program and whether this structure provides appropriate incentives to act in the best interests of the fund. Additionally, the Board considered the portfolio managers' investments, if any, in the funds that they manage.
Resources Dedicated to Investment Management and Support Services. The Board and the Fund Oversight and Research Committees reviewed the general qualifications and capabilities of Fidelity's investment staff, including its size, education, experience, and resources, as well as Fidelity's approach to recruiting, training, managing, and compensating investment personnel. The Board noted that Fidelity has continued to increase the resources devoted to non-U.S. offices, including expansion of Fidelity's global investment organization. The Board also noted that Fidelity's analysts have extensive resources, tools and capabilities that allow them to conduct sophisticated quantitative and fundamental analysis, as well as credit analysis of issuers, counterparties and guarantors. Further, the Board considered that Fidelity's investment professionals have sufficient access to global information and data so as to provide competitive investment results over time, and that those professionals also have access to sophisticated tools that permit them to assess portfolio construction and risk and performance attribution characteristics continuously, as well as to transmit new information and research conclusions rapidly around the world. Additionally, in its deliberations, the Board considered Fidelity's trading, risk management, compliance, and technology and operations capabilities and resources, which are integral parts of the investment management process. The Board also considered Fidelity's investments in business continuity planning, and its success in continuously providing services to the fund notwithstanding the severe disruptions caused by the COVID-19 pandemic.
Shareholder and Administrative Services. The Board considered (i) the nature, extent, quality, and cost of advisory, administrative, and shareholder services performed by the Investment Advisers and their affiliates under the Advisory Contracts and under separate agreements covering transfer agency, pricing and bookkeeping, and securities lending services for the fund; (ii) the nature and extent of the supervision of third party service providers, principally custodians, subcustodians, and pricing vendors; and (iii) the resources devoted to, and the record of compliance with, the fund's compliance policies and procedures. The Board also reviewed the allocation of fund brokerage, including allocations to brokers affiliated with the Investment Advisers, the use of brokerage commissions to pay fund expenses, and the use of "soft" commission dollars to pay for research services.
The Board noted that the growth of fund assets over time across the complex allows Fidelity to reinvest in the development of services designed to enhance the value and convenience of the Fidelity funds as investment vehicles. These services include 24-hour access to account information and market information over the Internet and through telephone representatives, investor education materials and asset allocation tools, and the expanded availability of Fidelity Investor Centers.
The Board noted that, in the past, it and the boards of certain other Fidelity funds had formed an ad hoc Committee on Transfer Agency Fees to review the variety of transfer agency fee structures throughout the industry and Fidelity's competitive positioning with respect to industry participants.
Investment in a Large Fund Family. The Board considered the benefits to shareholders of investing in a Fidelity fund, including the benefits of investing in a fund that is part of a large family of funds offering a variety of investment disciplines and providing a large variety of mutual fund investor services. The Board noted that Fidelity had taken, or had made recommendations that resulted in the Fidelity funds taking, a number of actions over the previous year that benefited particular funds, including: (i) continuing to dedicate additional resources to Fidelity's investment research process, which includes meetings with management of issuers of securities in which the funds invest, and to the support of the senior management team that oversees asset management; (ii) continuing efforts to enhance Fidelity's global research capabilities; (iii) launching new funds and ETFs with innovative structures, strategies and pricing and making other enhancements to meet client needs; (iv) launching new share classes of existing funds; (v) eliminating purchase minimums and broadening eligibility requirements for certain funds and share classes; (vi) approving the reduction in the holding period for the Class C to Class A conversion policy; (vii) reducing management fees and total expenses for certain target date funds and classes and index funds; (viii) lowering expenses for certain existing funds and classes by implementing or lowering expense caps; (ix) rationalizing product lines and gaining increased efficiencies from fund mergers, liquidations, and share class consolidations; (x) continuing to develop, acquire and implement systems and technology to improve services to the funds and shareholders, strengthen information security, and increase efficiency; and (xi) continuing to implement enhancements to further strengthen Fidelity's product line to increase investors' probability of success in achieving their investment goals, including retirement income goals.
Investment Performance. The Board considered whether the fund has operated in accordance with its investment objective, as well as its record of compliance with its investment restrictions and its performance history. The Board noted that there was a portfolio management change for
the fund in October 2020. The Board will continue to monitor closely the fund's performance, taking into account the portfolio management change.
The Board took into account discussions that occur at Board meetings throughout the year with representatives of the Investment Advisers about fund investment performance. In this regard the Board noted that as part of regularly scheduled fund reviews and other reports to the Board on fund performance, the Board considers annualized return information for the fund for different time periods, measured against an appropriate securities market index (benchmark index) and an appropriate peer group of funds with similar objectives (peer group). In its evaluation of fund investment performance, the Board gave particular attention to information indicating changes in performance of certain Fidelity funds for specific time periods and discussed with the Investment Advisers the reasons for any overperformance or underperformance.
In addition to reviewing absolute and relative fund performance, the Independent Trustees periodically consider the appropriateness of fund performance metrics in evaluating the results achieved. In general, the Independent Trustees believe that fund performance should be evaluated based on net performance (after fees and expenses) of both the highest performing and lowest performing fund share classes, where applicable, compared to appropriate benchmark indices, over appropriate time periods that may include full market cycles, and compared to peer groups, as applicable, over the same periods, taking into account relevant factors including the following: general market conditions; issuer-specific information; and fund cash flows and other factors.
The Independent Trustees recognize that shareholders evaluate performance on a net basis over their own holding periods, for which one-, three-, and five-year periods are often used as a proxy. For this reason, the performance information reviewed by the Board also included net cumulative total return information for the fund and an appropriate benchmark index and peer group for the most recent
one-, three-, and five-year periods ended September 30, 2020, as shown below. Returns are shown compared to the 25th percentile (top of box, 75% beaten) and 75th percentile (bottom of box, 25% beaten) of the peer universe. Returns of the benchmark index are "net MA," i.e., adjusted for tax withholding rates applicable to U.S.-based funds organized as Massachusetts business trusts.VIP Overseas Portfolio

Based on its review, the Board concluded that the nature, extent, and quality of services provided to the fund under the Advisory Contracts should continue to benefit the shareholders of the fund.
Competitiveness of Management Fee and Total Expense Ratio. The Board considered the fund's management fee and total expense ratio compared to "mapped groups" of competitive funds and classes created for the purpose of facilitating the Trustees' competitive analysis of management fees and total expenses. Fidelity creates "mapped groups" by combining similar Lipper investment objective categories that have comparable investment mandates. Combining Lipper investment objective categories aids the Board's management fee and total expense ratio comparisons by broadening the competitive group used for comparison.
Management Fee. The Board considered two proprietary management fee comparisons for the 12-month periods ended September 30 (June 30 for periods ended 2019 and 2018 and December 31 for periods prior to 2018) shown in basis points (BP) in the chart below. The group of Lipper funds used by the Board for management fee comparisons is referred to below as the "Total Mapped Group." The Total Mapped Group comparison focuses on a fund's standing in terms of gross management fees before expense reimbursements or caps relative to the total universe of funds with comparable investment mandates, regardless of whether their management fee structures also are comparable. Funds with comparable investment mandates offer exposure to similar types of securities. Funds with comparable management fee structures have similar management fee contractual arrangements (
e.g., flat rate charged for advisory services, all-inclusive fee rate,
etc.). "TMG %" represents the percentage of funds in the Total Mapped Group that had management fees that were lower than the fund's. For example, a hypothetical TMG % of 20% would mean that 80% of the funds in the Total Mapped Group had higher, and 20% had lower, management fees than the fund. The fund's actual TMG %s and the number of funds in the Total Mapped Group are in the chart below. The "Asset-Sized Peer Group" (ASPG) comparison focuses on a fund's standing relative to a subset of non-Fidelity funds within the Total Mapped Group that are similar in size and management fee structure. For example, if a fund is in the first quartile of the ASPG, the fund's management fee ranks in the least expensive or lowest 25% of funds in the ASPG. The ASPG represents at least 15% of the funds in the Total Mapped Group with comparable asset size and management fee structures, subject to a minimum of 50 funds (or all funds in the Total Mapped Group if fewer than 50). Additional information, such as the ASPG quartile in which the fund's management fee rate ranked, is also included in the chart and was considered by the Board.
VIP Overseas Portfolio
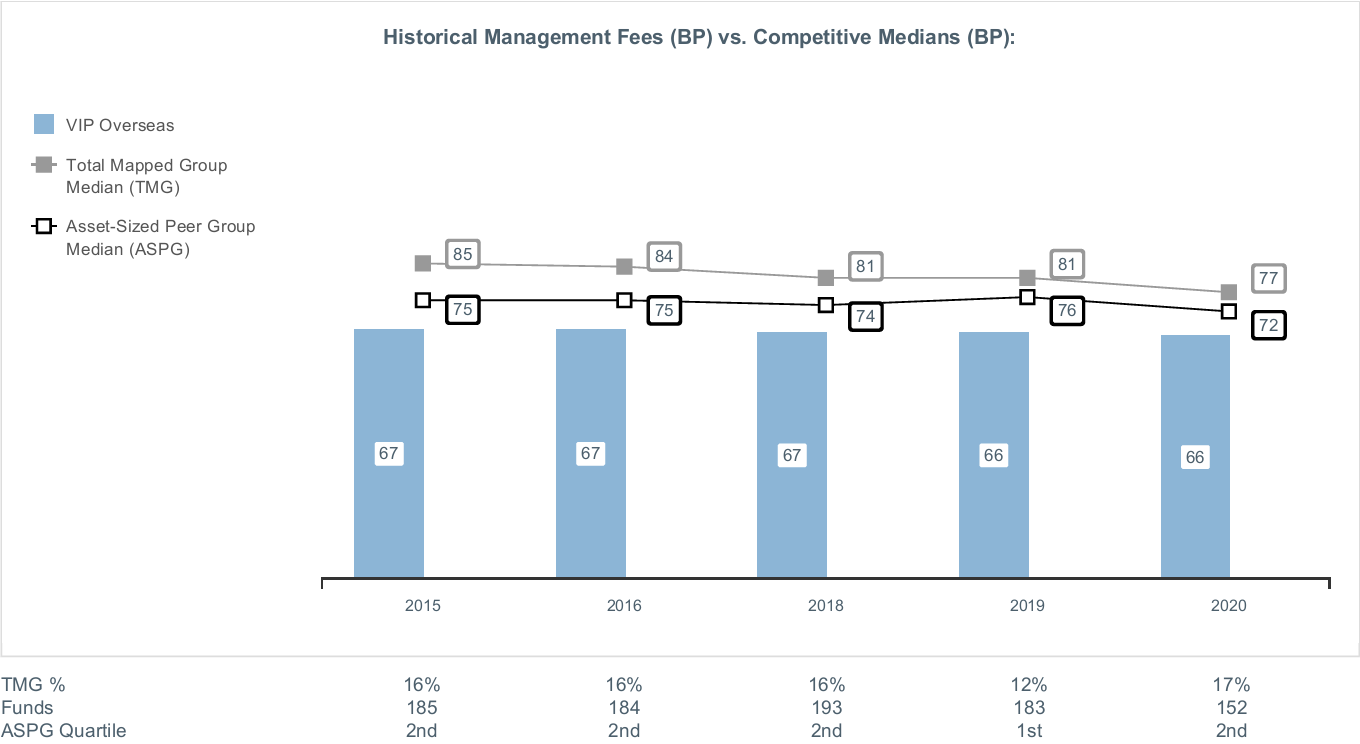
The Board noted that the fund's management fee rate ranked below the median of its Total Mapped Group and below the median of its ASPG for the 12-month period ended September 30, 2020.
The Board noted that, in the past, it and the boards of other Fidelity funds had formed an ad hoc Committee on Group Fee to conduct an in-depth review of the "group fee" component of the management fee of funds with such management fee structures. The Committee's focus included the mechanics of the group fee, the competitive landscape of group fee structures, Fidelity funds with no group fee component and investment products not included in group fee assets. The Board also considered that, for funds subject to the group fee, FMR agreed to voluntarily waive fees over a specified period of time in amounts designed to account for assets converted from certain funds to certain collective investment trusts.
The Board also noted that, in 2013, the ad hoc Committee on Management Fees was formed to conduct an in-depth review of the management fee rates of Fidelity's active equity mutual funds. The Committee focused on the following areas: (i) standard fee structures; (ii) research consumption and trading evolution; (iii) management fee competitiveness/profitability by category; and (iv) factors that drive institutional pricing.
Based on its review, the Board concluded that the fund's management fee is fair and reasonable in light of the services that the fund receives and the other factors considered.
Total Expense Ratio. In its review of each class's total expense ratio, the Board considered the fund's management fee rate as well as other fund or class expenses, as applicable, such as transfer agent fees, pricing and bookkeeping fees, fund-paid 12b-1 fees, and custodial, legal, and audit fees. The Board also noted that Fidelity may agree to waive fees or reimburse expenses from time to time, and the extent to which, if any, it has done so for the fund. As part of its review, the Board also considered the current and historical total expense ratios of a representative class of the fund compared to competitive fund median expenses. The fund's representative class is compared to those funds and classes in the Total Mapped Group (used by the Board for management fee comparisons) that have a similar sales load structure (SLTG). The Board also considered a total expense ASPG comparison for the representative class, which focuses on the total expenses of the representative class relative to a subset of non-Fidelity funds within the total expense SLTG. The total expense ASPG is limited to 15 larger and 15 smaller classes in fund average assets for a total of 30 classes, where possible. The total expense ASPG comparison excludes performance adjustments and fund-paid 12b-1 fees to eliminate variability in fee structures.
The Board noted that the total expense ratio of the Initial Class ranked below the SLTG competitive median and above the ASPG competitive median for the 12-month period ended September 30, 2020. The Board considered that, in general, various factors can affect total expense ratios. The Board also considered that the servicing component of the VIP universe differs by class for both VIP Fidelity and competitor classes and that the servicing component of Initial Class is split between the class-level and the annuity level whereas other competitor classes provide all servicing at the annuity level. The Board noted that the fund offers multiple classes, each of which has a different 12b-1 fee structure, and that the multiple structures are intended to offer a range of pricing options for the intermediary market. The Board also noted that the total expense ratios of the classes vary primarily by the level of their 12b-1 fees, although differences in transfer agent fees may also cause expenses to vary from class to class.
Fees Charged to Other Fidelity Clients. The Board also considered Fidelity fee structures and other information with respect to clients of Fidelity, such as other funds advised or subadvised by Fidelity, pension plan clients, and other institutional clients with similar mandates. The Board noted that a joint ad hoc committee created by it and the boards of other Fidelity funds periodically reviews and compares Fidelity's institutional investment advisory business with its business of providing services to the Fidelity funds and also noted the most recent findings of the committee. The Board noted that the committee's review included a consideration of the differences in services provided, fees charged, and costs incurred, as well as competition in the markets serving the different categories of clients.
Based on its review of total expense ratios and fees charged to other Fidelity clients, the Board concluded that the total expense ratio of each class of the fund was reasonable in light of the services that the fund and its shareholders receive and the other factors considered.
Costs of the Services and Profitability. The Board considered the revenues earned and the expenses incurred by Fidelity in conducting the business of developing, marketing, distributing, managing, administering and servicing the fund and servicing the fund's shareholders. The Board also considered the level of Fidelity's profits in respect of all the Fidelity funds.
On an annual basis, Fidelity presents to the Board information about the profitability of its relationships with the fund. Fidelity calculates profitability information for each fund, as well as aggregate profitability information for groups of Fidelity funds and all Fidelity funds, using a series of detailed revenue and cost allocation methodologies which originate with the books and records of Fidelity on which Fidelity's audited financial statements are based. The Audit Committee of the Board reviews any significant changes from the prior year's methodologies and the full Board approves such changes.
A public accounting firm has been engaged annually by the Board as part of the Board's assessment of Fidelity's profitability analysis. The engagement includes the review and assessment of the methodologies used by Fidelity in determining the revenues and expenses attributable to Fidelity's mutual fund business, and completion of agreed-upon procedures in respect of the mathematical accuracy of certain fund profitability information and its conformity to established allocation methodologies. After considering the reports issued under the engagement and information provided by Fidelity, the Board concluded that while other allocation methods may also be reasonable, Fidelity's profitability methodologies are reasonable in all material respects.
The Board also reviewed Fidelity's non-fund businesses and potential indirect benefits such businesses may have received as a result of their association with Fidelity's mutual fund business (i.e., fall-out benefits) as well as cases where Fidelity's affiliates may benefit from the funds' business. The Board considered areas where potential indirect benefits to the Fidelity funds from their relationships with Fidelity may exist. The Board also considered that in 2019 a joint ad hoc committee created by it and the boards of other Fidelity funds evaluated potential fall-out benefits (PFOB Committee). The Board noted that it considered the PFOB Committee's findings in connection with its consideration of the renewal of the Advisory Contracts.
The Board considered the costs of the services provided by and the profits realized by Fidelity in connection with the operation of the fund, including the conclusions of the PFOB Committee, and was satisfied that the profitability was not excessive.
Economies of Scale. The Board considered whether there have been economies of scale in respect of the management of the Fidelity funds, whether the Fidelity funds (including the fund) have appropriately benefited from any such economies of scale, and whether there is potential for realization of any further economies of scale. The Board considered the extent to which the fund will benefit from economies of scale as assets grow through increased services to the fund, through waivers or reimbursements, or through fee or expense ratio reductions. The Board also noted that a committee (the Economies of Scale Committee) created by it and the boards of other Fidelity funds periodically analyzes whether Fidelity attains economies of scale in respect of the management and servicing of the Fidelity funds, whether the Fidelity funds have appropriately benefited from such economies of scale, and whether there is potential for realization of any further economies of scale.
The Board recognized that the fund's management contract incorporates a "group fee" structure, which provides for lower group fee rates as total "group assets" increase, and for higher group fee rates as total "group assets" decrease ("group assets" as defined in the management contract). FMR calculates the group fee rates based on a tiered asset "breakpoint" schedule that varies based on asset class. The Board considered that the group fee is designed to deliver the benefits of economies of scale to fund shareholders when total Fidelity fund assets increase, even if assets of any particular fund are unchanged or have declined, because some portion of Fidelity's costs are attributable to services provided to all Fidelity funds, and all funds benefit if those costs can be allocated among more assets. The Board further considered that Fidelity agreed to impose a temporary fee waiver in the form of additional breakpoints to the current breakpoint schedule. The Board concluded that, given the group fee structure, fund shareholders will benefit from lower management fees as "group assets" increase at the fund complex level, regardless of whether Fidelity achieves any such economies of scale.
The Board concluded, taking into account the analysis of the Economies of Scale Committee, that economies of scale, if any, are being appropriately shared between fund shareholders and Fidelity.
Additional Information Requested by the Board. In order to develop fully the factual basis for consideration of the Fidelity funds' advisory contracts, the Board requested and received additional information on certain topics, including: (i) fund flow and performance trends, in particular the underperformance of certain funds and strategies, and Fidelity's long-term strategies for certain funds; (ii) consideration of expanding the use of performance fees for additional funds; (iii) Fidelity's pricing philosophy compared to competitors; (iv) metrics for evaluating index fund and ETF performance and information about ETF trading characteristics; (v) the methodology with respect to evaluating competitive fund data and peer group classifications and fee and expense comparisons; (vi) the expense structures for different funds and classes and information about the differences between various expense structures; (vii) group fee breakpoints; (viii) information regarding other accounts managed by Fidelity and sub-advisory arrangements; and (ix) Fidelity's philosophies and strategies for evaluating funds and classes with lower or declining asset levels.
Based on its evaluation of all of the conclusions noted above, and after considering all factors it believed relevant, the Board concluded that the advisory fee arrangements are fair and reasonable, and that the fund's Advisory Contracts should be renewed.
Liquidity Risk Management Program
The Securities and Exchange Commission adopted Rule 22e-4 under the Investment Company Act of 1940 (the Liquidity Rule) to promote effective liquidity risk management throughout the open-end investment company industry, thereby reducing the risk that funds will be unable to meet their redemption obligations and mitigating dilution of the interests of fund shareholders.
The Fund has adopted and implemented a liquidity risk management program pursuant to the Liquidity Rule (the Program) effective December 1, 2018. The Program is reasonably designed to assess and manage the Fund’s liquidity risk and to comply with the requirements of the Liquidity Rule. The Fund’s Board of Trustees (the Board) has designated the Fund’s investment adviser as administrator of the Program. The Fidelity advisers have established a Liquidity Risk Management Committee (the LRM Committee) to manage the Program for each of the Fidelity Funds. The LRM Committee monitors the adequacy and effectiveness of implementation of the Program and on a periodic basis assesses each Fund’s liquidity risk based on a variety of factors including (1) the Fund’s investment strategy, (2) portfolio liquidity and cash flow projections during normal and reasonably foreseeable stressed conditions, (3) shareholder redemptions, (4) borrowings and other funding sources and (5) in the case of exchange-traded funds, certain additional factors including the effect of the Fund’s prices and spreads, market participants, and basket compositions on the overall liquidity of the Fund’s portfolio, as applicable.
In accordance with the Program, each of the Fund’s portfolio investments is classified into one of four liquidity categories described below based on a determination of a reasonable expectation for how long it would take to convert the investment to cash (or sell or dispose of the investment) without significantly changing its market value.
- Highly liquid investments – cash or convertible to cash within three business days or less
- Moderately liquid investments – convertible to cash in three to seven calendar days
- Less liquid investments – can be sold or disposed of, but not settled, within seven calendar days
- Illiquid investments – cannot be sold or disposed of within seven calendar days
Liquidity classification determinations take into account a variety of factors including various market, trading and investment-specific considerations, as well as market depth, and generally utilize analysis from a third-party liquidity metrics service.
The Liquidity Rule places a 15% limit on a fund’s illiquid investments and requires funds that do not primarily hold assets that are highly liquid investments to determine and maintain a minimum percentage of the fund’s net assets to be invested in highly liquid investments (highly liquid investment minimum or HLIM). The Program includes provisions reasonably designed to comply with the 15% limit on illiquid investments and for determining, periodically reviewing and complying with the HLIM requirement as applicable.
At a recent meeting of the Fund’s Board of Trustees, the LRM Committee provided a written report to the Board pertaining to the operation, adequacy, and effectiveness of implementation of the Program for the annual period from December 1, 2019 through November 30, 2020. The report concluded that the Program has been implemented and is operating effectively and is reasonably designed to assess and manage the Fund’s liquidity risk.
VIPOVRS-SANN-0821
1.705696.123
Fidelity® Variable Insurance Products:
Value Portfolio
Semi-Annual Report
June 30, 2021
Contents
To view a fund's proxy voting guidelines and proxy voting record for the 12-month period ended June 30, visit http://www.fidelity.com/proxyvotingresults or visit the Securities and Exchange Commission's (SEC) web site at http://www.sec.gov.
You may also call 1-877-208-0098 to request a free copy of the proxy voting guidelines.
Fidelity® Variable Insurance Products are separate account options which are purchased through a variable insurance contract.
Standard & Poor's, S&P and S&P 500 are registered service marks of The McGraw-Hill Companies, Inc. and have been licensed for use by Fidelity Distributors Corporation.
Other third-party marks appearing herein are the property of their respective owners.
All other marks appearing herein are registered or unregistered trademarks or service marks of FMR LLC or an affiliated company. © 2021 FMR LLC. All rights reserved.
This report and the financial statements contained herein are submitted for the general information of the shareholders of the Fund. This report is not authorized for distribution to prospective investors in the Fund unless preceded or accompanied by an effective prospectus.
A fund files its complete schedule of portfolio holdings with the SEC for the first and third quarters of each fiscal year on Form N-PORT. Forms N-PORT are available on the SEC’s web site at http://www.sec.gov. A fund's Forms N-PORT may be reviewed and copied at the SEC’s Public Reference Room in Washington, DC. Information regarding the operation of the SEC's Public Reference Room may be obtained by calling 1-800-SEC-0330.
For a complete list of a fund's portfolio holdings, view the most recent holdings listing, semiannual report, or annual report on Fidelity's web site at http://www.fidelity.com, http://www.institutional.fidelity.com, or http://www.401k.com, as applicable.
NOT FDIC INSURED •MAY LOSE VALUE •NO BANK GUARANTEE
Neither the Fund nor Fidelity Distributors Corporation is a bank.
Note to Shareholders:
Early in 2020, the outbreak and spread of a new coronavirus emerged as a public health emergency that had a major influence on financial markets, primarily based on its impact on the global economy and the outlook for corporate earnings. The virus causes a respiratory disease known as COVID-19. On March 11, 2020 the World Health Organization declared the COVID-19 outbreak a pandemic, citing sustained risk of further global spread.
In the weeks following, as the crisis worsened, we witnessed an escalating human tragedy with wide-scale social and economic consequences from coronavirus-containment measures. The outbreak of COVID-19 prompted a number of measures to limit the spread, including travel and border restrictions, quarantines, and restrictions on large gatherings. In turn, these resulted in lower consumer activity, diminished demand for a wide range of products and services, disruption in manufacturing and supply chains, and – given the wide variability in outcomes regarding the outbreak – significant market uncertainty and volatility. Amid the turmoil, global governments and central banks took unprecedented action to help support consumers, businesses, and the broader economies, and to limit disruption to financial systems.
The situation continues to unfold, and the extent and duration of its impact on financial markets and the economy remain highly uncertain. Extreme events such as the coronavirus crisis are “exogenous shocks” that can have significant adverse effects on mutual funds and their investments. Although multiple asset classes may be affected by market disruption, the duration and impact may not be the same for all types of assets.
Fidelity is committed to helping you stay informed amid news about COVID-19 and during increased market volatility, and we’re taking extra steps to be responsive to customer needs. We encourage you to visit our websites, where we offer ongoing updates, commentary, and analysis on the markets and our funds.
Investment Summary (Unaudited)
Top Ten Stocks as of June 30, 2021
| | % of fund's net assets |
| The Travelers Companies, Inc. | 2.2 |
| Cigna Corp. | 2.0 |
| Exxon Mobil Corp. | 1.9 |
| Bristol-Myers Squibb Co. | 1.9 |
| Comcast Corp. Class A | 1.9 |
| AstraZeneca PLC sponsored ADR | 1.9 |
| Roche Holding AG (participation certificate) | 1.9 |
| Centene Corp. | 1.9 |
| Alphabet, Inc. Class A | 1.7 |
| Wells Fargo & Co. | 1.5 |
| | 18.8 |
Top Five Market Sectors as of June 30, 2021
| | % of fund's net assets |
| Financials | 21.6 |
| Health Care | 14.0 |
| Industrials | 13.6 |
| Communication Services | 7.8 |
| Consumer Discretionary | 7.3 |
Asset Allocation (% of fund's net assets)
| As of June 30, 2021 * |
| | Stocks | 99.3% |
| | Short-Term Investments and Net Other Assets (Liabilities) | 0.7% |

* Foreign investments - 17.7%
Schedule of Investments June 30, 2021 (Unaudited)
Showing Percentage of Net Assets
| Common Stocks - 99.3% | | | |
| | | Shares | Value |
| COMMUNICATION SERVICES - 7.8% | | | |
| Diversified Telecommunication Services - 0.5% | | | |
| Liberty Global PLC Class C (a) | | 96,600 | $2,612,064 |
| Interactive Media & Services - 1.7% | | | |
| Alphabet, Inc. Class A (a) | | 3,200 | 7,813,728 |
| Media - 4.2% | | | |
| Comcast Corp. Class A | | 154,600 | 8,815,292 |
| Interpublic Group of Companies, Inc. | | 200,300 | 6,507,747 |
| Nexstar Broadcasting Group, Inc. Class A | | 28,400 | 4,199,792 |
| | | | 19,522,831 |
| Wireless Telecommunication Services - 1.4% | | | |
| T-Mobile U.S., Inc. | | 44,590 | 6,457,970 |
|
| TOTAL COMMUNICATION SERVICES | | | 36,406,593 |
|
| CONSUMER DISCRETIONARY - 7.3% | | | |
| Distributors - 0.8% | | | |
| LKQ Corp. (a) | | 75,200 | 3,701,344 |
| Diversified Consumer Services - 0.5% | | | |
| Laureate Education, Inc. Class A (a) | | 161,400 | 2,341,914 |
| Hotels, Restaurants & Leisure - 1.2% | | | |
| Caesars Entertainment, Inc. (a) | | 53,100 | 5,509,125 |
| Household Durables - 2.1% | | | |
| Mohawk Industries, Inc. (a) | | 27,000 | 5,189,130 |
| PulteGroup, Inc. | | 86,800 | 4,736,676 |
| | | | 9,925,806 |
| Internet & Direct Marketing Retail - 1.3% | | | |
| eBay, Inc. | | 83,500 | 5,862,535 |
| Specialty Retail - 1.4% | | | |
| Gap, Inc. | | 126,000 | 4,239,900 |
| Sally Beauty Holdings, Inc. (a) | | 100,400 | 2,215,828 |
| | | | 6,455,728 |
|
| TOTAL CONSUMER DISCRETIONARY | | | 33,796,452 |
|
| CONSUMER STAPLES - 6.1% | | | |
| Beverages - 1.0% | | | |
| Primo Water Corp. | | 271,631 | 4,544,387 |
| Food & Staples Retailing - 1.2% | | | |
| BJ's Wholesale Club Holdings, Inc. (a) | | 114,300 | 5,438,394 |
| Food Products - 2.9% | | | |
| Bunge Ltd. | | 46,200 | 3,610,530 |
| Darling Ingredients, Inc. (a) | | 92,400 | 6,237,000 |
| Nomad Foods Ltd. (a) | | 122,100 | 3,451,767 |
| | | | 13,299,297 |
| Tobacco - 1.0% | | | |
| Altria Group, Inc. | | 101,900 | 4,858,592 |
|
| TOTAL CONSUMER STAPLES | | | 28,140,670 |
|
| ENERGY - 5.8% | | | |
| Oil, Gas & Consumable Fuels - 5.8% | | | |
| Canadian Natural Resources Ltd. | | 150,000 | 5,445,305 |
| Cenovus Energy, Inc. (Canada) | | 271,618 | 2,598,733 |
| Cheniere Energy, Inc. (a) | | 58,300 | 5,056,942 |
| Exxon Mobil Corp. | | 143,100 | 9,026,748 |
| Hess Corp. | | 56,300 | 4,916,116 |
| | | | 27,043,844 |
| FINANCIALS - 21.6% | | | |
| Banks - 2.8% | | | |
| First Citizens Bancshares, Inc. | | 7,200 | 5,995,728 |
| Wells Fargo & Co. | | 155,400 | 7,038,066 |
| | | | 13,033,794 |
| Capital Markets - 5.2% | | | |
| Ameriprise Financial, Inc. | | 23,600 | 5,873,568 |
| Apollo Global Management LLC Class A | | 39,200 | 2,438,240 |
| Bank of New York Mellon Corp. | | 92,200 | 4,723,406 |
| Lazard Ltd. Class A | | 118,500 | 5,362,125 |
| LPL Financial | | 41,600 | 5,615,168 |
| | | | 24,012,507 |
| Consumer Finance - 5.0% | | | |
| Capital One Financial Corp. | | 39,700 | 6,141,193 |
| OneMain Holdings, Inc. | | 110,800 | 6,638,028 |
| SLM Corp. | | 283,500 | 5,936,490 |
| Synchrony Financial | | 94,600 | 4,589,992 |
| | | | 23,305,703 |
| Diversified Financial Services - 1.9% | | | |
| Berkshire Hathaway, Inc. Class B (a) | | 14,200 | 3,946,464 |
| Voya Financial, Inc. | | 75,800 | 4,661,700 |
| | | | 8,608,164 |
| Insurance - 6.7% | | | |
| American Financial Group, Inc. | | 46,500 | 5,799,480 |
| Assurant, Inc. | | 43,200 | 6,746,976 |
| Fairfax Financial Holdings Ltd. (sub. vtg.) | | 9,100 | 3,990,610 |
| Reinsurance Group of America, Inc. | | 35,600 | 4,058,400 |
| The Travelers Companies, Inc. | | 69,500 | 10,404,844 |
| | | | 31,000,310 |
|
| TOTAL FINANCIALS | | | 99,960,478 |
|
| HEALTH CARE - 14.0% | | | |
| Biotechnology - 1.0% | | | |
| AbbVie, Inc. | | 40,400 | 4,550,656 |
| Health Care Providers & Services - 5.2% | | | |
| Centene Corp. (a) | | 117,800 | 8,591,154 |
| Cigna Corp. | | 39,500 | 9,364,265 |
| Laboratory Corp. of America Holdings (a) | | 21,900 | 6,041,115 |
| | | | 23,996,534 |
| Pharmaceuticals - 7.8% | | | |
| AstraZeneca PLC sponsored ADR (b) | | 146,800 | 8,793,320 |
| Bristol-Myers Squibb Co. | | 133,700 | 8,933,834 |
| Jazz Pharmaceuticals PLC (a) | | 24,574 | 4,365,325 |
| Roche Holding AG (participation certificate) | | 22,964 | 8,653,711 |
| Sanofi SA sponsored ADR | | 106,300 | 5,597,758 |
| | | | 36,343,948 |
|
| TOTAL HEALTH CARE | | | 64,891,138 |
|
| INDUSTRIALS - 13.6% | | | |
| Aerospace & Defense - 0.7% | | | |
| Curtiss-Wright Corp. | | 28,900 | 3,432,164 |
| Air Freight & Logistics - 1.7% | | | |
| FedEx Corp. | | 15,300 | 4,564,449 |
| XPO Logistics, Inc. (a) | | 23,100 | 3,231,459 |
| | | | 7,795,908 |
| Building Products - 1.9% | | | |
| Builders FirstSource, Inc. (a) | | 103,393 | 4,410,745 |
| Jeld-Wen Holding, Inc. (a) | | 163,800 | 4,301,388 |
| | | | 8,712,133 |
| Commercial Services & Supplies - 0.8% | | | |
| The Brink's Co. | | 48,500 | 3,726,740 |
| Construction & Engineering - 0.9% | | | |
| Willscot Mobile Mini Holdings (a) | | 153,000 | 4,264,110 |
| Machinery - 1.5% | | | |
| Allison Transmission Holdings, Inc. | | 70,600 | 2,805,644 |
| Crane Co. | | 3,000 | 277,110 |
| Stanley Black & Decker, Inc. | | 19,300 | 3,956,307 |
| | | | 7,039,061 |
| Marine - 0.8% | | | |
| Kirby Corp. (a) | | 57,764 | 3,502,809 |
| Professional Services - 2.3% | | | |
| KBR, Inc. | | 77,100 | 2,941,365 |
| Manpower, Inc. | | 28,900 | 3,436,499 |
| Nielsen Holdings PLC | | 167,100 | 4,122,357 |
| | | | 10,500,221 |
| Road & Rail - 0.7% | | | |
| Ryder System, Inc. | | 44,800 | 3,329,984 |
| Trading Companies & Distributors - 2.3% | | | |
| AerCap Holdings NV (a) | | 56,700 | 2,903,607 |
| Beacon Roofing Supply, Inc. (a) | | 68,300 | 3,636,975 |
| Univar, Inc. (a) | | 171,000 | 4,168,980 |
| | | | 10,709,562 |
|
| TOTAL INDUSTRIALS | | | 63,012,692 |
|
| INFORMATION TECHNOLOGY - 5.8% | | | |
| Communications Equipment - 0.5% | | | |
| Plantronics, Inc. (a) | | 58,475 | 2,440,162 |
| Electronic Equipment & Components - 1.2% | | | |
| Flex Ltd. (a) | | 316,700 | 5,659,429 |
| IT Services - 2.6% | | | |
| Concentrix Corp. (a) | | 27,400 | 4,405,920 |
| DXC Technology Co. (a) | | 115,100 | 4,481,994 |
| Rackspace Technology, Inc. (a)(b) | | 164,100 | 3,218,001 |
| | | | 12,105,915 |
| Software - 1.5% | | | |
| SS&C Technologies Holdings, Inc. | | 95,500 | 6,881,730 |
|
| TOTAL INFORMATION TECHNOLOGY | | | 27,087,236 |
|
| MATERIALS - 5.0% | | | |
| Chemicals - 1.9% | | | |
| Olin Corp. | | 134,261 | 6,210,914 |
| Tronox Holdings PLC | | 127,000 | 2,844,800 |
| | | | 9,055,714 |
| Containers & Packaging - 1.8% | | | |
| Berry Global Group, Inc. (a) | | 53,800 | 3,508,836 |
| Crown Holdings, Inc. | | 37,809 | 3,864,458 |
| WestRock Co. | | 15,101 | 803,675 |
| | | | 8,176,969 |
| Metals & Mining - 1.3% | | | |
| Arconic Corp. (a) | | 75,700 | 2,696,434 |
| BHP Group Ltd. sponsored ADR (b) | | 47,700 | 3,473,991 |
| | | | 6,170,425 |
|
| TOTAL MATERIALS | | | 23,403,108 |
|
| REAL ESTATE - 6.3% | | | |
| Equity Real Estate Investment Trusts (REITs) - 5.4% | | | |
| Alexandria Real Estate Equities, Inc. | | 21,400 | 3,893,516 |
| American Tower Corp. | | 10,000 | 2,701,400 |
| Americold Realty Trust | | 113,600 | 4,299,760 |
| CubeSmart | | 93,918 | 4,350,282 |
| Digital Realty Trust, Inc. | | 27,300 | 4,107,558 |
| Equity Lifestyle Properties, Inc. | | 76,900 | 5,714,439 |
| | | | 25,066,955 |
| Real Estate Management & Development - 0.9% | | | |
| Cushman & Wakefield PLC (a) | | 240,500 | 4,201,535 |
|
| TOTAL REAL ESTATE | | | 29,268,490 |
|
| UTILITIES - 6.0% | | | |
| Electric Utilities - 2.7% | | | |
| Edison International | | 83,800 | 4,845,316 |
| NRG Energy, Inc. | | 67,900 | 2,736,370 |
| PG&E Corp. (a) | | 463,400 | 4,712,778 |
| | | | 12,294,464 |
| Independent Power and Renewable Electricity Producers - 1.4% | | | |
| The AES Corp. | | 160,600 | 4,186,842 |
| Vistra Corp. | | 127,000 | 2,355,850 |
| | | | 6,542,692 |
| Multi-Utilities - 1.9% | | | |
| CenterPoint Energy, Inc. | | 151,600 | 3,717,232 |
| MDU Resources Group, Inc. | | 161,300 | 5,055,142 |
| | | | 8,772,374 |
|
| TOTAL UTILITIES | | | 27,609,530 |
|
| TOTAL COMMON STOCKS | | | |
| (Cost $358,461,410) | | | 460,620,231 |
|
| Money Market Funds - 2.5% | | | |
| Fidelity Cash Central Fund 0.06% (c) | | 2,955,999 | 2,956,590 |
| Fidelity Securities Lending Cash Central Fund 0.06% (c)(d) | | 8,560,000 | 8,560,856 |
| TOTAL MONEY MARKET FUNDS | | | |
| (Cost $11,517,446) | | | 11,517,446 |
| TOTAL INVESTMENT IN SECURITIES - 101.8% | | | |
| (Cost $369,978,856) | | | 472,137,677 |
| NET OTHER ASSETS (LIABILITIES) - (1.8)% | | | (8,326,702) |
| NET ASSETS - 100% | | | $463,810,975 |
Legend
(a) Non-income producing
(b) Security or a portion of the security is on loan at period end.
(c) Affiliated fund that is generally available only to investment companies and other accounts managed by Fidelity Investments. The rate quoted is the annualized seven-day yield of the fund at period end. A complete unaudited listing of the fund's holdings as of its most recent quarter end is available upon request. In addition, each Fidelity Central Fund's financial statements are available on the SEC's website or upon request.
(d) Investment made with cash collateral received from securities on loan.
Affiliated Central Funds
Information regarding fiscal year to date income earned by the Fund from investments in Fidelity Central Funds is as follows:
| Fund | Income earned |
| Fidelity Cash Central Fund | $2,189 |
| Fidelity Securities Lending Cash Central Fund | 10,948 |
| Total | $13,137 |
Amounts in the income column in the above table include any capital gain distributions from underlying funds, which are presented in the corresponding line-item in the Statement of Operations, if applicable. Amount for Fidelity Securities Lending Cash Central Fund represents the income earned on investing cash collateral, less rebates paid to borrowers and any lending agent fees associated with the loan, plus any premium payments received for lending certain types of securities.
Fiscal year to date information regarding the Fund's investments in Fidelity Central Funds, including the ownership percentage, is presented below.
| Fund | Value, beginning of period | Purchases | Sales Proceeds | Realized Gain/Loss | Change in Unrealized appreciation (depreciation) | Value, end of period | % ownership, end of period |
| Fidelity Cash Central Fund 0.06% | $4,757,819 | $82,469,419 | $84,270,695 | $47 | $-- | $2,956,590 | 0.0% |
| Fidelity Securities Lending Cash Central Fund 0.06% | 4,261,756 | 27,791,091 | 23,491,991 | -- | -- | 8,560,856 | 0.0% |
| Total | $9,019,575 | $110,260,510 | $107,762,686 | $47 | $-- | $11,517,446 | |
Investment Valuation
The following is a summary of the inputs used, as of June 30, 2021, involving the Fund's assets and liabilities carried at fair value. The inputs or methodology used for valuing securities may not be an indication of the risk associated with investing in those securities. For more information on valuation inputs, and their aggregation into the levels used below, please refer to the Investment Valuation section in the accompanying Notes to Financial Statements.
| | Valuation Inputs at Reporting Date: |
| Description | Total | Level 1 | Level 2 | Level 3 |
| Investments in Securities: | | | | |
| Equities: | | | | |
| Communication Services | $36,406,593 | $36,406,593 | $-- | $-- |
| Consumer Discretionary | 33,796,452 | 33,796,452 | -- | -- |
| Consumer Staples | 28,140,670 | 28,140,670 | -- | -- |
| Energy | 27,043,844 | 27,043,844 | -- | -- |
| Financials | 99,960,478 | 99,960,478 | -- | -- |
| Health Care | 64,891,138 | 56,237,427 | 8,653,711 | -- |
| Industrials | 63,012,692 | 63,012,692 | -- | -- |
| Information Technology | 27,087,236 | 27,087,236 | -- | -- |
| Materials | 23,403,108 | 23,403,108 | -- | -- |
| Real Estate | 29,268,490 | 29,268,490 | -- | -- |
| Utilities | 27,609,530 | 27,609,530 | -- | -- |
| Money Market Funds | 11,517,446 | 11,517,446 | -- | -- |
| Total Investments in Securities: | $472,137,677 | $463,483,966 | $8,653,711 | $-- |
Other Information
Distribution of investments by country or territory of incorporation, as a percentage of Total Net Assets, is as follows (Unaudited):
| United States of America | 82.3% |
| United Kingdom | 4.8% |
| Canada | 3.7% |
| Bermuda | 2.0% |
| Switzerland | 1.9% |
| Singapore | 1.2% |
| France | 1.2% |
| Others (Individually Less Than 1%) | 2.9% |
| | 100.0% |
See accompanying notes which are an integral part of the financial statements.
Financial Statements
Statement of Assets and Liabilities
| | | June 30, 2021 (Unaudited) |
| Assets | | |
Investment in securities, at value (including securities loaned of $8,338,628) — See accompanying schedule:
Unaffiliated issuers (cost $358,461,410) | $460,620,231 | |
| Fidelity Central Funds (cost $11,517,446) | 11,517,446 | |
| Total Investment in Securities (cost $369,978,856) | | $472,137,677 |
| Cash | | 138,408 |
| Foreign currency held at value (cost $3,280) | | 3,276 |
| Receivable for investments sold | | 4,691,000 |
| Receivable for fund shares sold | | 649,096 |
| Dividends receivable | | 495,989 |
| Distributions receivable from Fidelity Central Funds | | 3,614 |
| Other receivables | | 13,391 |
| Total assets | | 478,132,451 |
| Liabilities | | |
| Payable for investments purchased | $4,851,130 | |
| Payable for fund shares redeemed | 608,870 | |
| Accrued management fee | 203,755 | |
| Distribution and service plan fees payable | 4,788 | |
| Other affiliated payables | 58,331 | |
| Other payables and accrued expenses | 33,902 | |
| Collateral on securities loaned | 8,560,700 | |
| Total liabilities | | 14,321,476 |
| Net Assets | | $463,810,975 |
| Net Assets consist of: | | |
| Paid in capital | | $323,158,579 |
| Total accumulated earnings (loss) | | 140,652,396 |
| Net Assets | | $463,810,975 |
| Net Asset Value and Maximum Offering Price | | |
| Initial Class: | | |
| Net Asset Value, offering price and redemption price per share ($154,751,188 ÷ 7,933,833 shares) | | $19.51 |
| Service Class: | | |
| Net Asset Value, offering price and redemption price per share ($335,695 ÷ 17,216 shares) | | $19.50 |
| Service Class 2: | | |
| Net Asset Value, offering price and redemption price per share ($23,521,340 ÷ 1,227,105 shares) | | $19.17 |
| Investor Class: | | |
| Net Asset Value, offering price and redemption price per share ($285,202,752 ÷ 14,658,904 shares) | | $19.46 |
See accompanying notes which are an integral part of the financial statements.
Statement of Operations
| | | Six months ended June 30, 2021 (Unaudited) |
| Investment Income | | |
| Dividends | | $3,981,456 |
| Income from Fidelity Central Funds (including $10,948 from security lending) | | 13,137 |
| Total income | | 3,994,593 |
| Expenses | | |
| Management fee | $1,058,912 | |
| Transfer agent fees | 219,816 | |
| Distribution and service plan fees | 21,288 | |
| Accounting fees | 78,312 | |
| Custodian fees and expenses | 8,886 | |
| Independent trustees' fees and expenses | 631 | |
| Audit | 26,658 | |
| Legal | 2,627 | |
| Interest | 63 | |
| Miscellaneous | 698 | |
| Total expenses before reductions | 1,417,891 | |
| Expense reductions | (29,448) | |
| Total expenses after reductions | | 1,388,443 |
| Net investment income (loss) | | 2,606,150 |
| Realized and Unrealized Gain (Loss) | | |
| Net realized gain (loss) on: | | |
| Investment securities: | | |
| Unaffiliated issuers | 43,400,972 | |
| Fidelity Central Funds | 47 | |
| Foreign currency transactions | (8,678) | |
| Total net realized gain (loss) | | 43,392,341 |
| Change in net unrealized appreciation (depreciation) on: | | |
| Investment securities: | | |
| Unaffiliated issuers | 30,058,822 | |
| Assets and liabilities in foreign currencies | (5,097) | |
| Total change in net unrealized appreciation (depreciation) | | 30,053,725 |
| Net gain (loss) | | 73,446,066 |
| Net increase (decrease) in net assets resulting from operations | | $76,052,216 |
See accompanying notes which are an integral part of the financial statements.
Statement of Changes in Net Assets
| | Six months ended June 30, 2021 (Unaudited) | Year ended December 31, 2020 |
| Increase (Decrease) in Net Assets | | |
| Operations | | |
| Net investment income (loss) | $2,606,150 | $3,991,075 |
| Net realized gain (loss) | 43,392,341 | (7,235,446) |
| Change in net unrealized appreciation (depreciation) | 30,053,725 | 23,899,052 |
| Net increase (decrease) in net assets resulting from operations | 76,052,216 | 20,654,681 |
| Distributions to shareholders | (810,201) | (15,636,335) |
| Share transactions - net increase (decrease) | 56,823,268 | 2,891,924 |
| Total increase (decrease) in net assets | 132,065,283 | 7,910,270 |
| Net Assets | | |
| Beginning of period | 331,745,692 | 323,835,422 |
| End of period | $463,810,975 | $331,745,692 |
See accompanying notes which are an integral part of the financial statements.
Financial Highlights
VIP Value Portfolio Initial Class
| | Six months ended (Unaudited) June 30, | Years endedDecember 31, | | | | |
| | 2021 | 2020 | 2019 | 2018 | 2017 | 2016 |
| Selected Per–Share Data | | | | | | |
| Net asset value, beginning of period | $15.96 | $15.78 | $13.08 | $16.36 | $14.74 | $13.36 |
| Income from Investment Operations | | | | | | |
| Net investment income (loss)A | .12 | .19 | .26 | .21 | .21B | .18 |
| Net realized and unrealized gain (loss) | 3.47 | .75 | 3.74 | (2.41) | 2.07 | 1.43 |
| Total from investment operations | 3.59 | .94 | 4.00 | (2.20) | 2.28 | 1.61 |
| Distributions from net investment income | (.04) | (.20) | (.27) | (.18) | (.21) | (.15) |
| Distributions from net realized gain | – | (.56) | (1.03) | (.90) | (.45) | (.07) |
| Total distributions | (.04) | (.76) | (1.30) | (1.08) | (.66) | (.23)C |
| Net asset value, end of period | $19.51 | $15.96 | $15.78 | $13.08 | $16.36 | $14.74 |
| Total ReturnD,E,F | 22.53% | 6.33% | 32.13% | (13.84)% | 15.58% | 12.08% |
| Ratios to Average Net AssetsG,H | | | | | | |
| Expenses before reductions | .65%I | .67% | .67% | .67% | .68% | .69% |
| Expenses net of fee waivers, if any | .65%I | .67% | .67% | .67% | .68% | .69% |
| Expenses net of all reductions | .63%I | .65% | .66% | .66% | .67% | .69% |
| Net investment income (loss) | 1.35%I | 1.48% | 1.78% | 1.36% | 1.34%B | 1.33% |
| Supplemental Data | | | | | | |
| Net assets, end of period (000 omitted) | $154,751 | $131,037 | $116,401 | $110,203 | $130,365 | $126,526 |
| Portfolio turnover rateJ | 94%I | 81% | 67% | 64% | 55% | 63% |
A Calculated based on average shares outstanding during the period.
B Net investment income per share reflects one or more large, non-recurring dividend(s) which amounted to $.04 per share. Excluding such non-recurring dividend(s), the ratio of net investment income (loss) to average net assets would have been 1.09%.
C Total distributions per share do not sum due to rounding.
D Total returns for periods of less than one year are not annualized.
E Total returns do not reflect charges attributable to your insurance company's separate account. Inclusion of these charges would reduce the total returns shown.
F Total returns would have been lower if certain expenses had not been reduced during the applicable periods shown.
G Fees and expenses of any underlying mutual funds or exchange-traded funds (ETFs) are not included in the Fund's expense ratio. The Fund indirectly bears its proportionate share of these expenses. For additional expense information related to investments in Fidelity Central Funds, please refer to the "Investments in Fidelity Central Funds" note found in the Notes to Financial Statements section of the most recent Annual or Semi-Annual report.
H Expense ratios reflect operating expenses of the class. Expenses before reductions do not reflect amounts reimbursed, waived, or reduced through arrangements with the investment adviser, brokerage services, or other offset arrangements, if applicable, and do not represent the amount paid by the class during periods when reimbursements, waivers or reductions occur.
I Annualized
J Amount does not include the portfolio activity of any underlying mutual funds or exchange-traded funds (ETFs).
See accompanying notes which are an integral part of the financial statements.
VIP Value Portfolio Service Class
| | Six months ended (Unaudited) June 30, | Years endedDecember 31, | | | | |
| | 2021 | 2020 | 2019 | 2018 | 2017 | 2016 |
| Selected Per–Share Data | | | | | | |
| Net asset value, beginning of period | $15.96 | $15.78 | $13.08 | $16.36 | $14.73 | $13.36 |
| Income from Investment Operations | | | | | | |
| Net investment income (loss)A | .11 | .18 | .24 | .20 | .19B | .17 |
| Net realized and unrealized gain (loss) | 3.47 | .75 | 3.75 | (2.42) | 2.08 | 1.41 |
| Total from investment operations | 3.58 | .93 | 3.99 | (2.22) | 2.27 | 1.58 |
| Distributions from net investment income | (.04) | (.19) | (.25) | (.15) | (.20) | (.14) |
| Distributions from net realized gain | – | (.56) | (1.03) | (.90) | (.45) | (.07) |
| Total distributions | (.04) | (.75) | (1.29)C | (1.06)C | (.64)C | (.21) |
| Net asset value, end of period | $19.50 | $15.96 | $15.78 | $13.08 | $16.36 | $14.73 |
| Total ReturnD,E,F | 22.45% | 6.23% | 32.01% | (13.97)% | 15.53% | 11.90% |
| Ratios to Average Net AssetsG,H | | | | | | |
| Expenses before reductions | .75%I | .77% | .77% | .77% | .78% | .79% |
| Expenses net of fee waivers, if any | .75%I | .77% | .77% | .77% | .78% | .79% |
| Expenses net of all reductions | .73%I | .75% | .76% | .76% | .77% | .79% |
| Net investment income (loss) | 1.25%I | 1.38% | 1.68% | 1.26% | 1.24%B | 1.23% |
| Supplemental Data | | | | | | |
| Net assets, end of period (000 omitted) | $336 | $275 | $270 | $233 | $368 | $400 |
| Portfolio turnover rateJ | 94%I | 81% | 67% | 64% | 55% | 63% |
A Calculated based on average shares outstanding during the period.
B Net investment income per share reflects one or more large, non-recurring dividend(s) which amounted to $.04 per share. Excluding such non-recurring dividend(s), the ratio of net investment income (loss) to average net assets would have been .99%.
C Total distributions per share do not sum due to rounding.
D Total returns for periods of less than one year are not annualized.
E Total returns do not reflect charges attributable to your insurance company's separate account. Inclusion of these charges would reduce the total returns shown.
F Total returns would have been lower if certain expenses had not been reduced during the applicable periods shown.
G Fees and expenses of any underlying mutual funds or exchange-traded funds (ETFs) are not included in the Fund's expense ratio. The Fund indirectly bears its proportionate share of these expenses. For additional expense information related to investments in Fidelity Central Funds, please refer to the "Investments in Fidelity Central Funds" note found in the Notes to Financial Statements section of the most recent Annual or Semi-Annual report.
H Expense ratios reflect operating expenses of the class. Expenses before reductions do not reflect amounts reimbursed, waived, or reduced through arrangements with the investment adviser, brokerage services, or other offset arrangements, if applicable, and do not represent the amount paid by the class during periods when reimbursements, waivers or reductions occur.
I Annualized
J Amount does not include the portfolio activity of any underlying mutual funds or exchange-traded funds (ETFs).
See accompanying notes which are an integral part of the financial statements.
VIP Value Portfolio Service Class 2
| | Six months ended (Unaudited) June 30, | Years endedDecember 31, | | | | |
| | 2021 | 2020 | 2019 | 2018 | 2017 | 2016 |
| Selected Per–Share Data | | | | | | |
| Net asset value, beginning of period | $15.70 | $15.55 | $12.91 | $16.15 | $14.55 | $13.21 |
| Income from Investment Operations | | | | | | |
| Net investment income (loss)A | .10 | .16 | .22 | .17 | .17B | .15 |
| Net realized and unrealized gain (loss) | 3.41 | .72 | 3.68 | (2.37) | 2.05 | 1.39 |
| Total from investment operations | 3.51 | .88 | 3.90 | (2.20) | 2.22 | 1.54 |
| Distributions from net investment income | (.04) | (.17) | (.23) | (.14) | (.17) | (.13) |
| Distributions from net realized gain | – | (.56) | (1.03) | (.90) | (.45) | (.07) |
| Total distributions | (.04) | (.73) | (1.26) | (1.04) | (.62) | (.20) |
| Net asset value, end of period | $19.17 | $15.70 | $15.55 | $12.91 | $16.15 | $14.55 |
| Total ReturnC,D,E | 22.36% | 6.02% | 31.77% | (14.02)% | 15.36% | 11.71% |
| Ratios to Average Net AssetsF,G | | | | | | |
| Expenses before reductions | .89%H | .92% | .92% | .92% | .93% | .94% |
| Expenses net of fee waivers, if any | .89%H | .92% | .92% | .92% | .93% | .94% |
| Expenses net of all reductions | .88%H | .91% | .91% | .91% | .92% | .94% |
| Net investment income (loss) | 1.10%H | 1.22% | 1.53% | 1.11% | 1.09%B | 1.08% |
| Supplemental Data | | | | | | |
| Net assets, end of period (000 omitted) | $23,521 | $10,204 | $9,262 | $7,764 | $9,474 | $9,050 |
| Portfolio turnover rateI | 94%H | 81% | 67% | 64% | 55% | 63% |
A Calculated based on average shares outstanding during the period.
B Net investment income per share reflects one or more large, non-recurring dividend(s) which amounted to $.04 per share. Excluding such non-recurring dividend(s), the ratio of net investment income (loss) to average net assets would have been .84%.
C Total returns for periods of less than one year are not annualized.
D Total returns do not reflect charges attributable to your insurance company's separate account. Inclusion of these charges would reduce the total returns shown.
E Total returns would have been lower if certain expenses had not been reduced during the applicable periods shown.
F Fees and expenses of any underlying mutual funds or exchange-traded funds (ETFs) are not included in the Fund's expense ratio. The Fund indirectly bears its proportionate share of these expenses. For additional expense information related to investments in Fidelity Central Funds, please refer to the "Investments in Fidelity Central Funds" note found in the Notes to Financial Statements section of the most recent Annual or Semi-Annual report.
G Expense ratios reflect operating expenses of the class. Expenses before reductions do not reflect amounts reimbursed, waived, or reduced through arrangements with the investment adviser, brokerage services, or other offset arrangements, if applicable, and do not represent the amount paid by the class during periods when reimbursements, waivers or reductions occur.
H Annualized
I Amount does not include the portfolio activity of any underlying mutual funds or exchange-traded funds (ETFs).
See accompanying notes which are an integral part of the financial statements.
VIP Value Portfolio Investor Class
| | Six months ended (Unaudited) June 30, | Years endedDecember 31, | | | | |
| | 2021 | 2020 | 2019 | 2018 | 2017 | 2016 |
| Selected Per–Share Data | | | | | | |
| Net asset value, beginning of period | $15.92 | $15.75 | $13.06 | $16.33 | $14.71 | $13.35 |
| Income from Investment Operations | | | | | | |
| Net investment income (loss)A | .12 | .18 | .25 | .20 | .20B | .17 |
| Net realized and unrealized gain (loss) | 3.46 | .74 | 3.73 | (2.40) | 2.07 | 1.41 |
| Total from investment operations | 3.58 | .92 | 3.98 | (2.20) | 2.27 | 1.58 |
| Distributions from net investment income | (.04) | (.19) | (.26) | (.16) | (.20) | (.14) |
| Distributions from net realized gain | – | (.56) | (1.03) | (.90) | (.45) | (.07) |
| Total distributions | (.04) | (.75) | (1.29) | (1.07)C | (.65) | (.22)C |
| Net asset value, end of period | $19.46 | $15.92 | $15.75 | $13.06 | $16.33 | $14.71 |
| Total ReturnD,E,F | 22.51% | 6.20% | 32.01% | (13.88)% | 15.52% | 11.88% |
| Ratios to Average Net AssetsG,H | | | | | | |
| Expenses before reductions | .72%I | .74% | .75% | .75% | .76% | .77% |
| Expenses net of fee waivers, if any | .72%I | .74% | .75% | .75% | .76% | .77% |
| Expenses net of all reductions | .71%I | .73% | .74% | .74% | .75% | .77% |
| Net investment income (loss) | 1.27%I | 1.40% | 1.70% | 1.28% | 1.26%B | 1.25% |
| Supplemental Data | | | | | | |
| Net assets, end of period (000 omitted) | $285,203 | $190,229 | $197,903 | $170,228 | $204,443 | $194,723 |
| Portfolio turnover rateJ | 94%I | 81% | 67% | 64% | 55% | 63% |
A Calculated based on average shares outstanding during the period.
B Net investment income per share reflects one or more large, non-recurring dividend(s) which amounted to $.04 per share. Excluding such non-recurring dividend(s), the ratio of net investment income (loss) to average net assets would have been 1.01%.
C Total distributions per share do not sum due to rounding.
D Total returns for periods of less than one year are not annualized.
E Total returns do not reflect charges attributable to your insurance company's separate account. Inclusion of these charges would reduce the total returns shown.
F Total returns would have been lower if certain expenses had not been reduced during the applicable periods shown.
G Fees and expenses of any underlying mutual funds or exchange-traded funds (ETFs) are not included in the Fund's expense ratio. The Fund indirectly bears its proportionate share of these expenses. For additional expense information related to investments in Fidelity Central Funds, please refer to the "Investments in Fidelity Central Funds" note found in the Notes to Financial Statements section of the most recent Annual or Semi-Annual report.
H Expense ratios reflect operating expenses of the class. Expenses before reductions do not reflect amounts reimbursed, waived, or reduced through arrangements with the investment adviser, brokerage services, or other offset arrangements, if applicable, and do not represent the amount paid by the class during periods when reimbursements, waivers or reductions occur.
I Annualized
J Amount does not include the portfolio activity of any underlying mutual funds or exchange-traded funds (ETFs).
See accompanying notes which are an integral part of the financial statements.
Notes to Financial Statements (Unaudited)
For the period ended June 30, 2021
1. Organization.
VIP Value Portfolio (the Fund) is a fund of Variable Insurance Products Fund (the Trust) and is authorized to issue an unlimited number of shares. The Trust is registered under the Investment Company Act of 1940, as amended (the 1940 Act), as an open-end management investment company organized as a Massachusetts business trust. Shares of the Fund may only be purchased by insurance companies for the purpose of funding variable annuity or variable life insurance contracts. The Fund offers the following classes of shares: Initial Class shares, Service Class shares, Service Class 2 shares and Investor Class shares. All classes have equal rights and voting privileges, except for matters affecting a single class.
2. Investments in Fidelity Central Funds.
Funds may invest in Fidelity Central Funds, which are open-end investment companies generally available only to other investment companies and accounts managed by the investment adviser and its affiliates. The Schedule of Investments lists any Fidelity Central Funds held as an investment as of period end, but does not include the underlying holdings of each Fidelity Central Fund. An investing fund indirectly bears its proportionate share of the expenses of the underlying Fidelity Central Funds.
Based on its investment objective, each Fidelity Central Fund may invest or participate in various investment vehicles or strategies that are similar to those of the investing fund. These strategies are consistent with the investment objectives of the investing fund and may involve certain economic risks which may cause a decline in value of each of the Fidelity Central Funds and thus a decline in the value of the investing fund.
| Fidelity Central Fund | Investment Manager | Investment Objective | Investment Practices | Expense Ratio(a) |
| Fidelity Money Market Central Funds | Fidelity Management & Research Company LLC (FMR) | Each fund seeks to obtain a high level of current income consistent with the preservation of capital and liquidity. | Short-term Investments | Less than .005% to .01% |
(a) Expenses expressed as a percentage of average net assets and are as of each underlying Central Fund's most recent annual or semi-annual shareholder report.
A complete unaudited list of holdings for each Fidelity Central Fund is available upon request or at the Securities and Exchange Commission website at www.sec.gov. In addition, the financial statements of the Fidelity Central Funds which contain the significant accounting policies (including investment valuation policies) of those funds, and are not covered by the Report of Independent Registered Public Accounting Firm, are available on the Securities and Exchange Commission website or upon request.
3. Significant Accounting Policies.
The Fund is an investment company and applies the accounting and reporting guidance of the Financial Accounting Standards Board (FASB) Accounting Standards Codification Topic 946 Financial Services - Investment Companies. The financial statements have been prepared in conformity with accounting principles generally accepted in the United States of America (GAAP), which require management to make certain estimates and assumptions at the date of the financial statements. Actual results could differ from those estimates. Subsequent events, if any, through the date that the financial statements were issued have been evaluated in the preparation of the financial statements. The Fund's Schedule of Investments lists any underlying mutual funds or exchange-traded funds (ETFs) but does not include the underlying holdings of these funds. The following summarizes the significant accounting policies of the Fund:
Investment Valuation. Investments are valued as of 4:00 p.m. Eastern time on the last calendar day of the period. The Board of Trustees (the Board) has delegated the day to day responsibility for the valuation of the Fund's investments to the Fair Value Committee (the Committee) established by the Fund's investment adviser. In accordance with valuation policies and procedures approved by the Board, the Fund attempts to obtain prices from one or more third party pricing vendors or brokers to value its investments. When current market prices, quotations or currency exchange rates are not readily available or reliable, investments will be fair valued in good faith by the Committee, in accordance with procedures adopted by the Board. Factors used in determining fair value vary by investment type and may include market or investment specific events. The frequency with which these procedures are used cannot be predicted and they may be utilized to a significant extent. The Committee oversees the Fund's valuation policies and procedures and reports to the Board on the Committee's activities and fair value determinations. The Board monitors the appropriateness of the procedures used in valuing the Fund's investments and ratifies the fair value determinations of the Committee.
The Fund categorizes the inputs to valuation techniques used to value its investments into a disclosure hierarchy consisting of three levels as shown below:
- Level 1 – quoted prices in active markets for identical investments
- Level 2 – other significant observable inputs (including quoted prices for similar investments, interest rates, prepayment speeds, etc.)
- Level 3 – unobservable inputs (including the Fund's own assumptions based on the best information available)
Valuation techniques used to value the Fund's investments by major category are as follows:
Equity securities, including restricted securities, for which market quotations are readily available, are valued at the last reported sale price or official closing price as reported by a third party pricing vendor on the primary market or exchange on which they are traded and are categorized as Level 1 in the hierarchy. In the event there were no sales during the day or closing prices are not available, securities are valued at the last quoted bid price or may be valued using the last available price and are generally categorized as Level 2 in the hierarchy. For foreign equity securities, when market or security specific events arise, comparisons to the valuation of American Depositary Receipts (ADRs), futures contracts, Exchange-Traded Funds (ETFs) and certain indexes as well as quoted prices for similar securities may be used and would be categorized as Level 2 in the hierarchy. For equity securities, including restricted securities, where observable inputs are limited, assumptions about market activity and risk are used and these securities may be categorized as Level 3 in the hierarchy.
Investments in open-end mutual funds, including the Fidelity Central Funds, are valued at their closing net asset value (NAV) each business day and are categorized as Level 1 in the hierarchy.
Changes in valuation techniques may result in transfers in or out of an assigned level within the disclosure hierarchy. The aggregate value of investments by input level as of June 30, 2021 is included at the end of the Fund's Schedule of Investments.
Foreign Currency. Certain Funds may use foreign currency contracts to facilitate transactions in foreign-denominated securities. Gains and losses from these transactions may arise from changes in the value of the foreign currency or if the counterparties do not perform under the contracts' terms.
Foreign-denominated assets, including investment securities, and liabilities are translated into U.S. dollars at the exchange rates at period end. Purchases and sales of investment securities, income and dividends received, and expenses denominated in foreign currencies are translated into U.S. dollars at the exchange rate in effect on the transaction date.
The effects of exchange rate fluctuations on investments are included with the net realized and unrealized gain (loss) on investment securities. Other foreign currency transactions resulting in realized and unrealized gain (loss) are disclosed separately.
Investment Transactions and Income. For financial reporting purposes, the Fund's investment holdings and NAV include trades executed through the end of the last business day of the period. The NAV per share for processing shareholder transactions is calculated as of the close of business of the New York Stock Exchange (NYSE), normally 4:00 p.m. Eastern time and includes trades executed through the end of the prior business day. Gains and losses on securities sold are determined on the basis of identified cost and include proceeds received from litigation. Dividend income is recorded on the ex-dividend date, except for certain dividends from foreign securities where the ex-dividend date may have passed, which are recorded as soon as the Fund is informed of the ex-dividend date. Non-cash dividends included in dividend income, if any, are recorded at the fair market value of the securities received. Income and capital gain distributions from Fidelity Central Funds, if any, are recorded on the ex-dividend date. Certain distributions received by the Fund represent a return of capital or capital gain. The Fund determines the components of these distributions subsequent to the ex-dividend date, based upon receipt of tax filings or other correspondence relating to the underlying investment. These distributions are recorded as a reduction of cost of investments and/or as a realized gain. Investment income is recorded net of foreign taxes withheld where recovery of such taxes is uncertain.
Class Allocations and Expenses. Investment income, realized and unrealized capital gains and losses, common expenses of a fund, and certain fund-level expense reductions, if any, are allocated daily on a pro-rata basis to each class based on the relative net assets of each class to the total net assets of a fund. Each class differs with respect to transfer agent and distribution and service plan fees incurred, as applicable. Certain expense reductions may also differ by class, if applicable. For the reporting period, the allocated portion of income and expenses to each class as a percent of its average net assets may vary due to the timing of recording these transactions in relation to fluctuating net assets of the classes. Expenses directly attributable to a fund are charged to that fund. Expenses attributable to more than one fund are allocated among the respective funds on the basis of relative net assets or other appropriate methods. Expenses included in the accompanying financial statements reflect the expenses of that fund and do not include any expenses associated with any underlying mutual funds or exchange-traded funds. Although not included in a fund's expenses, a fund indirectly bears its proportionate share of these expenses through the net asset value of each underlying mutual fund or exchange-traded fund. Expense estimates are accrued in the period to which they relate and adjustments are made when actual amounts are known.
Income Tax Information and Distributions to Shareholders. Each year, the Fund intends to qualify as a regulated investment company under Subchapter M of the Internal Revenue Code, including distributing substantially all of its taxable income and realized gains. As a result, no provision for U.S. Federal income taxes is required. The Fund files a U.S. federal tax return, in addition to state and local tax returns as required. The Fund's federal income tax returns are subject to examination by the Internal Revenue Service (IRS) for a period of three fiscal years after they are filed. State and local tax returns may be subject to examination for an additional fiscal year depending on the jurisdiction. Foreign taxes are provided for based on the Fund's understanding of the tax rules and rates that exist in the foreign markets in which it invests.
Distributions are declared and recorded on the ex-dividend date. Income and capital gain distributions are declared separately for each class. Income and capital gain distributions are determined in accordance with income tax regulations, which may differ from GAAP.
Capital accounts within the financial statements are adjusted for permanent book-tax differences. These adjustments have no impact on net assets or the results of operations. Capital accounts are not adjusted for temporary book-tax differences which will reverse in a subsequent period.
Book-tax differences are primarily due to foreign currency transactions, partnerships, capital loss carryforwards and losses deferred due to wash sales.
As of period end, the cost and unrealized appreciation (depreciation) in securities, and derivatives if applicable, for federal income tax purposes were as follows:
| Gross unrealized appreciation | $106,081,958 |
| Gross unrealized depreciation | (4,896,796) |
| Net unrealized appreciation (depreciation) | $101,185,162 |
| Tax cost | $370,952,515 |
Capital loss carryforwards are only available to offset future capital gains of the Fund to the extent provided by regulations and may be limited. The capital loss carryforward information presented below, including any applicable limitation, is estimated as of prior fiscal period end and is subject to adjustment.
| No expiration | |
| Short-term | $(5,257,157) |
| Total capital loss carryforward | $(5,257,157) |
4. Purchases and Sales of Investments.
Purchases and sales of securities, other than short-term securities, and in-kind transactions, as applicable, are noted in the table below.
| | Purchases ($) | Sales ($) |
| VIP Value Portfolio | 240,993,210 | 182,467,500 |
5. Fees and Other Transactions with Affiliates.
Management Fee. Fidelity Management & Research Company LLC (the investment adviser) and its affiliates provide the Fund with investment management related services for which the Fund pays a monthly management fee. The management fee is the sum of an individual fund fee rate that is based on an annual rate of .30% of the Fund's average net assets and an annualized group fee rate that averaged .23% during the period. The group fee rate is based upon the monthly average net assets of a group of registered investment companies with which the investment adviser has management contracts. The group fee rate decreases as assets under management increase and increases as assets under management decrease. For the reporting period, the total annualized management fee rate was .52% of the Fund's average net assets.
Distribution and Service Plan Fees. In accordance with Rule 12b-1 of the 1940 Act, the Fund has adopted separate 12b-1 Plans for each Service Class of shares. Each Service Class pays Fidelity Distributors Company LLC (FDC), an affiliate of the investment adviser, a service fee. For the period, the service fee is based on an annual rate of .10% of Service Class' average net assets and .25% of Service Class 2's average net assets.
For the period, total fees, all of which were re-allowed to insurance companies for the distribution of shares and providing shareholder support services, were as follows:
| Service Class | $157 |
| Service Class 2 | 21,131 |
| | $21,288 |
Transfer Agent Fees. Fidelity Investments Institutional Operations Company LLC (FIIOC), an affiliate of the investment adviser, is the Fund's transfer, dividend disbursing, and shareholder servicing agent. FIIOC receives an asset-based fee with respect to each class. Each class pays a fee for transfer agent services, typesetting and printing and mailing of shareholder reports, excluding mailing of proxy statements. For the period, transfer agent fees for each class were as follows:
| | Amount | % of Class-Level Average Net Assets(a) |
| Initial Class | $46,471 | .06 |
| Service Class | 100 | .06 |
| Service Class 2 | 5,384 | .06 |
| Investor Class | 167,861 | .14 |
| | $219,816 | |
(a) Annualized
Accounting Fees. Fidelity Service Company, Inc. (FSC), an affiliate of the investment adviser, maintains the Fund's accounting records. The accounting fee is based on the level of average net assets for each month. For the period, the fees were equivalent to the following annualized rates:
| | % of Average Net Assets |
| VIP Value Portfolio | .04 |
Brokerage Commissions. A portion of portfolio transactions were placed with brokerage firms which are affiliates of the investment adviser. Brokerage commissions are included in net realized gain (loss) and change in net unrealized appreciation (depreciation) in the Statement of Operations. The commissions paid to these affiliated firms were as follows:
| | Amount |
| VIP Value Portfolio | $3,223 |
Interfund Lending Program. Pursuant to an Exemptive Order issued by the Securities and Exchange Commission (the SEC), the Fund, along with other registered investment companies having management contracts with Fidelity Management & Research Company LLC (FMR), or other affiliated entities of FMR, may participate in an interfund lending program. This program provides an alternative credit facility allowing the Fund to borrow from, or lend money to, other participating affiliated funds. At period end, there were no interfund loans outstanding. Activity in this program during the period for which loans were outstanding was as follows:
| | Borrower or Lender | Average Loan Balance | Weighted Average Interest Rate | Interest Expense |
| VIP Value Portfolio | Borrower | $7,030,000 | .33% | $63 |
Interfund Trades. Funds may purchase from or sell securities to other Fidelity Funds under procedures adopted by the Board. The procedures have been designed to ensure these interfund trades are executed in accordance with Rule 17a-7 of the 1940 Act. Any interfund trades are included within the respective purchases and sales amounts shown in the Purchases and Sales of Investments note and are noted in the table below.
| | Purchases ($) | Sales ($) |
| VIP Value Portfolio | 29,730,506 | 21,992,332 |
6. Committed Line of Credit.
Certain Funds participate with other funds managed by the investment adviser or an affiliate in a $4.25 billion credit facility (the "line of credit") to be utilized for temporary or emergency purposes to fund shareholder redemptions or for other short-term liquidity purposes. The participating funds have agreed to pay commitment fees on their pro-rata portion of the line of credit, which are reflected in Miscellaneous expenses on the Statement of Operations, and are listed below. During the period, there were no borrowings on this line of credit.
| | Amount |
| VIP Value Portfolio | $335 |
7. Security Lending.
Funds lend portfolio securities from time to time in order to earn additional income. Lending agents are used, including National Financial Services (NFS), an affiliate of the investment adviser. Pursuant to a securities lending agreement, NFS will receive a fee, which is capped at 9.9% of a fund's daily lending revenue, for its services as lending agent. A fund may lend securities to certain qualified borrowers, including NFS. On the settlement date of the loan, a fund receives collateral (in the form of U.S. Treasury obligations, letters of credit and/or cash) against the loaned securities and maintains collateral in an amount not less than 100% of the market value of the loaned securities during the period of the loan. The market value of the loaned securities is determined at the close of business of a fund and any additional required collateral is delivered to a fund on the next business day. A fund or borrower may terminate the loan at any time, and if the borrower defaults on its obligation to return the securities loaned because of insolvency or other reasons, a fund may apply collateral received from the borrower against the obligation. A fund may experience delays and costs in recovering the securities loaned. Any cash collateral received is invested in the Fidelity Securities Lending Cash Central Fund. Any loaned securities are identified as such in the Schedule of Investments, and the value of loaned securities and cash collateral at period end, as applicable, are presented in the Statement of Assets and Liabilities. Security lending income represents the income earned on investing cash collateral, less rebates paid to borrowers and any lending agent fees associated with the loan, plus any premium payments received for lending certain types of securities. Security lending income is presented in the Statement of Operations as a component of income from Fidelity Central Funds. Affiliated security lending activity, if any, was as follows:
| | Total Security Lending Fees Paid to NFS | Security Lending Income From Securities Loaned to NFS | Value of Securities Loaned to NFS at Period End |
| VIP Value Portfolio | $1,183 | $– | $– |
8. Expense Reductions.
Commissions paid to certain brokers with whom the investment adviser, or its affiliates, places trades on behalf of the Fund include an amount in addition to trade execution, which may be rebated back to the Fund to offset expenses. This amount totaled $28,960 for the period.
In addition, during the period the investment adviser or an affiliate reimbursed and/or waived a portion of fund-level operating expenses in the amount of $488.
9. Distributions to Shareholders.
Distributions to shareholders of each class were as follows:
| | Six months ended
June 30, 2021 | Year ended
December 31, 2020 |
| VIP Value Portfolio | | |
| Distributions to shareholders | | |
| Initial Class | $326,101 | $5,859,642 |
| Service Class | 638 | 12,774 |
| Service Class 2 | 27,235 | 470,255 |
| Investor Class | 456,227 | 9,293,664 |
| Total | $810,201 | $15,636,335 |
10. Share Transactions.
Transactions for each class of shares were as follows and may contain in-kind transactions:
| | Shares | Shares | Dollars | Dollars |
| | Six months ended June 30, 2021 | Year ended December 31, 2020 | Six months ended June 30, 2021 | Year ended December 31, 2020 |
| VIP Value Portfolio | | | | |
| Initial Class | | | | |
| Shares sold | 1,553,885 | 4,872,716 | $28,198,153 | $60,054,538 |
| Reinvestment of distributions | 19,469 | 392,086 | 326,101 | 5,859,642 |
| Shares redeemed | (1,852,433) | (4,427,348) | (33,302,445) | (58,181,101) |
| Net increase (decrease) | (279,079) | 837,454 | $(4,778,191) | $7,733,079 |
| Service Class | | | | |
| Shares sold | – | – | $– | $4 |
| Reinvestment of distributions | 28 | 626 | 468 | 9,347 |
| Shares redeemed | (63) | (507) | (1,141) | (7,216) |
| Net increase (decrease) | (35) | 119 | $(673) | $2,135 |
| Service Class 2 | | | | |
| Shares sold | 713,645 | 383,884 | $12,900,262 | $5,144,631 |
| Reinvestment of distributions | 1,653 | 31,997 | 27,235 | 470,255 |
| Shares redeemed | (138,298) | (361,517) | (2,451,465) | (4,497,700) |
| Net increase (decrease) | 577,000 | 54,364 | $10,476,032 | $1,117,186 |
| Investor Class | | | | |
| Shares sold | 3,799,321 | 3,064,439 | $70,722,091 | $38,637,975 |
| Reinvestment of distributions | 27,303 | 623,605 | 456,227 | 9,293,664 |
| Shares redeemed | (1,116,820) | (4,304,233) | (20,052,218) | (53,892,115) |
| Net increase (decrease) | 2,709,804 | (616,189) | $51,126,100 | $(5,960,476) |
11. Other.
Fund's organizational documents provide former and current trustees and officers with a limited indemnification against liabilities arising in connection with the performance of their duties to the fund. In the normal course of business, the fund may also enter into contracts that provide general indemnifications. The fund's maximum exposure under these arrangements is unknown as this would be dependent on future claims that may be made against the fund. The risk of material loss from such claims is considered remote.
At the end of the period, the investment adviser or its affiliates were owners of record of more than 10% of the outstanding shares as follows:
| Fund | Affiliated % |
| VIP: Value Portfolio | 58% |
Mutual funds managed by the investment adviser or its affiliates, in aggregate, were the owners of record of more than 20% of the total outstanding shares.
| Fund | % of shares held |
| VIP: Value Portfolio | 35% |
12. Coronavirus (COVID-19) Pandemic.
An outbreak of COVID-19 first detected in China during December 2019 has since spread globally and was declared a pandemic by the World Health Organization during March 2020. Developments that disrupt global economies and financial markets, such as the COVID-19 pandemic, may magnify factors that affect the Fund's performance.
Shareholder Expense Example
As a shareholder, you incur two types of costs: (1) transaction costs, which may include sales charges (loads) on purchase payments or redemption proceeds, as applicable and (2) ongoing costs, which generally include management fees, distribution and/or service (12b-1) fees and other Fund expenses. This Example is intended to help you understand your ongoing costs (in dollars) of investing in a fund and to compare these costs with the ongoing costs of investing in other mutual funds.
The Example is based on an investment of $1,000 invested at the beginning of the period and held for the entire period (January 1, 2021 to June 30, 2021).
Actual Expenses
The first line of the accompanying table provides information about actual account values and actual expenses. You may use the information in this line, together with the amount you invested, to estimate the expenses that you paid over the period. Simply divide your account value by $1,000.00 (for example, an $8,600 account value divided by $1,000.00 = 8.6), then multiply the result by the number in the first line for a class/Fund under the heading entitled "Expenses Paid During Period" to estimate the expenses you paid on your account during this period. If any fund is a shareholder of any underlying mutual funds or exchange-traded funds (ETFs) (the Underlying Funds), such fund indirectly bears its proportional share of the expenses of the Underlying Funds in addition to the direct expenses incurred presented in the table. These fees and expenses are not included in the annualized expense ratio used to calculate the expense estimate in the table below. The estimate of expenses does not include any fees or other expenses of any variable annuity or variable life insurance product. If they were, the estimate of expenses you paid during the period would be higher, and your ending account value would be lower.
Hypothetical Example for Comparison Purposes
The second line of the accompanying table provides information about hypothetical account values and hypothetical expenses based on the actual expense ratio and an assumed rate of return of 5% per year before expenses, which is not the actual return. The hypothetical account values and expenses may not be used to estimate the actual ending account balance or expenses you paid for the period. You may use this information to compare the ongoing costs of investing in the Fund and other funds. To do so, compare this 5% hypothetical example with the 5% hypothetical examples that appear in the shareholder reports of the other funds. If any fund is a shareholder of any Underlying Funds, such fund indirectly bears its proportional share of the expenses of the Underlying Funds in addition to the direct expenses as presented in the table. These fees and expenses are not included in the annualized expense ratio used to calculate the expense estimate in the table below. The estimate of expenses does not include any fees or other expenses of any variable annuity or variable life insurance product. If they were, the estimate of expenses you paid during the period would be higher, and your ending account value would be lower.
Please note that the expenses shown in the table are meant to highlight your ongoing costs only and do not reflect any transaction costs. Therefore, the second line of the table is useful in comparing ongoing costs only, and will not help you determine the relative total costs of owning different funds.
| | Annualized Expense Ratio-A | Beginning
Account Value
January 1, 2021 | Ending
Account Value
June 30, 2021 | Expenses Paid
During Period-B
January 1, 2021
to June 30, 2021 |
| VIP Value Portfolio | | | | |
| Initial Class | .65% | | | |
| Actual | | $1,000.00 | $1,225.30 | $3.59 |
| Hypothetical-C | | $1,000.00 | $1,021.57 | $3.26 |
| Service Class | .75% | | | |
| Actual | | $1,000.00 | $1,224.50 | $4.14 |
| Hypothetical-C | | $1,000.00 | $1,021.08 | $3.76 |
| Service Class 2 | .89% | | | |
| Actual | | $1,000.00 | $1,223.60 | $4.91 |
| Hypothetical-C | | $1,000.00 | $1,020.38 | $4.46 |
| Investor Class | .72% | | | |
| Actual | | $1,000.00 | $1,225.10 | $3.97 |
| Hypothetical-C | | $1,000.00 | $1,021.22 | $3.61 |
A Annualized expense ratio reflects expenses net of applicable fee waivers.
B Expenses are equal to the annualized expense ratio, multiplied by the average account value over the period, multiplied by 181/ 365 (to reflect the one-half year period). The fees and expenses of any Underlying Funds are not included in each annualized expense ratio.
C 5% return per year before expenses
Board Approval of Investment Advisory Contracts and Management Fees
VIP Value Portfolio
Each year, the Board of Trustees, including the Independent Trustees (together, the Board), votes on the renewal of the management contract with Fidelity Management & Research Company LLC (FMR) and the sub-advisory agreements (together, the Advisory Contracts) for the fund. FMR and the sub-advisers are referred to herein as the Investment Advisers. The Board, assisted by the advice of fund counsel and Independent Trustees' counsel, requests and considers a broad range of information relevant to the renewal of the Advisory Contracts throughout the year.
The Board meets regularly and, at each of its meetings, covers an extensive agenda of topics and materials and considers factors that are relevant to its annual consideration of the renewal of the fund's Advisory Contracts, including the services and support provided to the fund and its shareholders. The Board has established various standing committees (Committees), each composed of and chaired by Independent Trustees with varying backgrounds, to which the Board has assigned specific subject matter responsibilities in order to enhance effective decision-making by the Board. The Board, acting directly and through its Committees, requests and receives information concerning the annual consideration of the renewal of the fund's Advisory Contracts. The Board also meets as needed to review matters specifically related to the Board's annual consideration of the renewal of the Advisory Contracts. Members of the Board may also meet with trustees of other Fidelity funds through joint ad hoc committees to discuss certain matters relevant to all of the Fidelity funds.
Approval of Stub Period Continuation. At its January 2021 meeting, the Board of Trustees voted to continue the fund's management contract with FMR, and the sub-advisory agreements and sub-subadvisory agreements, in each case, where applicable (together, the Advisory Contracts), without modification, for four months from February 1, 2021 through May 31, 2021, in connection with changes to the Board's meeting calendar. The Board considered that the approval of the fund's Advisory Contracts will not result in any changes in (i) the investment process or strategies employed in the management of the fund's assets; (ii) the fees and expenses paid by shareholders; (iii) the nature, extent or quality of services provided under the fund's Advisory Contracts; or (iv) the day-to-day management of the fund or the persons primarily responsible for such management. The Board also considered that since its last approval of the fund's Advisory Contracts, FMR had provided additional information on the fund in support of the annual contract renewal process, including competitive analyses on total expenses and management fees and in-depth reviews of fund performance and fund profitability information. The Board also considered the findings of certain ad hoc committees that had been previously formed to discuss matters relevant to all of the Fidelity funds, including economies of scale, fall-out benefits and retail vs. institutional funds. The Board concluded that the fund's Advisory Contracts are fair and reasonable, and that the fund's Advisory Contracts should be renewed, without modification, through May 31, 2021, with the understanding that the Board will consider the annual renewal for a full one year period in May 2021.
At its May 2021 meeting, the Board unanimously determined to renew the fund's Advisory Contracts. In reaching its determination, the Board considered all factors it believed relevant, including (i) the nature, extent, and quality of the services provided to the fund and its shareholders (including the investment performance of the fund); (ii) the competitiveness of the fund's management fee and total expense ratio relative to peer funds; (iii) the total costs of the services provided by and the profits realized by Fidelity from its relationships with the fund; and (iv) the extent to which, if any, economies of scale exist and are realized as the fund grows, and whether any economies of scale are appropriately shared with fund shareholders.
In considering whether to renew the Advisory Contracts for the fund, the Board reached a determination, with the assistance of fund counsel and Independent Trustees' counsel and through the exercise of its business judgment, that the renewal of the Advisory Contracts was in the best interests of the fund and its shareholders and that the compensation payable under the Advisory Contracts was fair and reasonable. The Board's decision to renew the Advisory Contracts was not based on any single factor, but rather was based on a comprehensive consideration of all the information provided to the Board at its meetings throughout the year. The Board, in reaching its determination to renew the Advisory Contracts, was aware that shareholders of the fund have a broad range of investment choices available to them, including a wide choice among funds offered by Fidelity's competitors, and that the fund's shareholders, who have the opportunity to review and weigh the disclosure provided by the fund in its prospectus and other public disclosures, have chosen to invest in this fund, which is part of the Fidelity family of funds.
Nature, Extent, and Quality of Services Provided. The Board considered Fidelity's staffing as it relates to the fund, including the backgrounds of investment personnel of Fidelity, and also considered the fund's investment objective, strategies, and related investment philosophy. The Independent Trustees also had discussions with senior management of Fidelity's investment operations and investment groups. The Board considered the structure of the investment personnel compensation program and whether this structure provides appropriate incentives to act in the best interests of the fund. Additionally, the Board considered the portfolio managers' investments, if any, in the funds that they manage.
Resources Dedicated to Investment Management and Support Services. The Board and the Fund Oversight and Research Committees reviewed the general qualifications and capabilities of Fidelity's investment staff, including its size, education, experience, and resources, as well as Fidelity's approach to recruiting, training, managing, and compensating investment personnel. The Board noted that Fidelity has continued to increase the resources devoted to non-U.S. offices, including expansion of Fidelity's global investment organization. The Board also noted that Fidelity's analysts have extensive resources, tools and capabilities that allow them to conduct sophisticated quantitative and fundamental analysis, as well as credit analysis of issuers, counterparties and guarantors. Further, the Board considered that Fidelity's investment professionals have sufficient access to global information and data so as to provide competitive investment results over time, and that those professionals also have access to sophisticated tools that permit them to assess portfolio construction and risk and performance attribution characteristics continuously, as well as to transmit new information and research conclusions rapidly around the world. Additionally, in its deliberations, the Board considered Fidelity's trading, risk management, compliance, and technology and operations capabilities and resources, which are integral parts of the investment management process. The Board also considered Fidelity's investments in business continuity planning, and its success in continuously providing services to the fund notwithstanding the severe disruptions caused by the COVID-19 pandemic.
Shareholder and Administrative Services. The Board considered (i) the nature, extent, quality, and cost of advisory, administrative, and shareholder services performed by the Investment Advisers and their affiliates under the Advisory Contracts and under separate agreements covering transfer agency, pricing and bookkeeping, and securities lending services for the fund; (ii) the nature and extent of the supervision of third party service providers, principally custodians, subcustodians, and pricing vendors; and (iii) the resources devoted to, and the record of compliance with, the fund's compliance policies and procedures. The Board also reviewed the allocation of fund brokerage, including allocations to brokers affiliated with the Investment Advisers, the use of brokerage commissions to pay fund expenses, and the use of "soft" commission dollars to pay for research services.
The Board noted that the growth of fund assets over time across the complex allows Fidelity to reinvest in the development of services designed to enhance the value and convenience of the Fidelity funds as investment vehicles. These services include 24-hour access to account information and market information over the Internet and through telephone representatives, investor education materials and asset allocation tools, and the expanded availability of Fidelity Investor Centers.
The Board noted that, in the past, it and the boards of certain other Fidelity funds had formed an ad hoc Committee on Transfer Agency Fees to review the variety of transfer agency fee structures throughout the industry and Fidelity's competitive positioning with respect to industry participants.
Investment in a Large Fund Family. The Board considered the benefits to shareholders of investing in a Fidelity fund, including the benefits of investing in a fund that is part of a large family of funds offering a variety of investment disciplines and providing a large variety of mutual fund investor services. The Board noted that Fidelity had taken, or had made recommendations that resulted in the Fidelity funds taking, a number of actions over the previous year that benefited particular funds, including: (i) continuing to dedicate additional resources to Fidelity's investment research process, which includes meetings with management of issuers of securities in which the funds invest, and to the support of the senior management team that oversees asset management; (ii) continuing efforts to enhance Fidelity's global research capabilities; (iii) launching new funds and ETFs with innovative structures, strategies and pricing and making other enhancements to meet client needs; (iv) launching new share classes of existing funds; (v) eliminating purchase minimums and broadening eligibility requirements for certain funds and share classes; (vi) approving the reduction in the holding period for the Class C to Class A conversion policy; (vii) reducing management fees and total expenses for certain target date funds and classes and index funds; (viii) lowering expenses for certain existing funds and classes by implementing or lowering expense caps; (ix) rationalizing product lines and gaining increased efficiencies from fund mergers, liquidations, and share class consolidations; (x) continuing to develop, acquire and implement systems and technology to improve services to the funds and shareholders, strengthen information security, and increase efficiency; and (xi) continuing to implement enhancements to further strengthen Fidelity's product line to increase investors' probability of success in achieving their investment goals, including retirement income goals.
Investment Performance. The Board considered whether the fund has operated in accordance with its investment objective, as well as its record of compliance with its investment restrictions and its performance history.
The Board took into account discussions that occur at Board meetings throughout the year with representatives of the Investment Advisers about fund investment performance. In this regard the Board noted that as part of regularly scheduled fund reviews and other reports to the Board on fund performance, the Board considers annualized return information for the fund for different time periods, measured against an appropriate securities market index (benchmark index) and an appropriate peer group of funds with similar objectives (peer group). In its evaluation of fund investment performance, the Board gave particular attention to information indicating changes in performance of certain Fidelity funds for specific time periods and discussed with the Investment Advisers the reasons for any overperformance or underperformance.
In addition to reviewing absolute and relative fund performance, the Independent Trustees periodically consider the appropriateness of fund performance metrics in evaluating the results achieved. In general, the Independent Trustees believe that fund performance should be evaluated based on net performance (after fees and expenses) of both the highest performing and lowest performing fund share classes, where applicable, compared to appropriate benchmark indices, over appropriate time periods that may include full market cycles, and compared to peer groups, as applicable, over the same periods, taking into account relevant factors including the following: general market conditions; issuer-specific information; and fund cash flows and other factors.
The Independent Trustees recognize that shareholders evaluate performance on a net basis over their own holding periods, for which one-, three-, and five-year periods are often used as a proxy. For this reason, the performance information reviewed by the Board also included net cumulative total return information for the fund and an appropriate benchmark index and peer group for the most recent one-, three-, and five-year periods ended September 30, 2020, as shown below. Returns are shown compared to the 25th percentile (top of box, 75% beaten) and 75th percentile (bottom of box, 25% beaten) of the peer universe.
VIP Value Portfolio

The Board considered the fund's underperformance for different time periods ended September 30, 2020 (which periods are reflected in the chart above). The Board noted that the fund's underperformance has continued since the Board approved the management contract in January 2019 and January 2020. The Board's discussions with FMR regarding underperformance cover topics including, but not limited to: the longer-term track record of a fund's portfolio manager(s); broader trends in the market that may adversely impact a fund's performance; and attribution reports on contributors to the fund's underperformance. The Board engages with FMR on steps that might be taken to address a fund's underperformance. For a fund with underperformance over longer periods of time, the Board typically monitors the fund's performance more closely.
Based on its review, the Board concluded that the nature, extent, and quality of services provided to the fund under the Advisory Contracts should continue to benefit the shareholders of the fund.
Competitiveness of Management Fee and Total Expense Ratio. The Board considered the fund's management fee and total expense ratio compared to "mapped groups" of competitive funds and classes created for the purpose of facilitating the Trustees' competitive analysis of management fees and total expenses. Fidelity creates "mapped groups" by combining similar Lipper investment objective categories that have comparable investment mandates. Combining Lipper investment objective categories aids the Board's management fee and total expense ratio comparisons by broadening the competitive group used for comparison.
Management Fee. The Board considered two proprietary management fee comparisons for the 12-month periods ended September 30 (June 30 for periods ended 2019 and 2018 and December 31 for periods prior to 2018) shown in basis points (BP) in the chart below. The group of Lipper funds used by the Board for management fee comparisons is referred to below as the "Total Mapped Group." The Total Mapped Group comparison focuses on a fund's standing in terms of gross management fees before expense reimbursements or caps relative to the total universe of funds with comparable investment mandates, regardless of whether their management fee structures also are comparable. Funds with comparable investment mandates offer exposure to similar types of securities. Funds with comparable management fee structures have similar management fee contractual arrangements (
e.g., flat rate charged for advisory services, all-inclusive fee rate,
etc.). "TMG %" represents the percentage of funds in the Total Mapped Group that had management fees that were lower than the fund's. For example, a hypothetical TMG % of 20% would mean that 80% of the funds in the Total Mapped Group had higher, and 20% had lower, management fees than the fund. The fund's actual TMG %s and the number of funds in the Total Mapped Group are in the chart below. The "Asset-Sized Peer Group" (ASPG) comparison focuses on a fund's standing relative to a subset of non-Fidelity funds within the Total Mapped Group that are similar in size and management fee structure. For example, if a fund is in the first quartile of the ASPG, the fund's management fee ranks in the least expensive or lowest 25% of funds in the ASPG. The ASPG represents at least 15% of the funds in the Total Mapped Group with comparable asset size and management fee structures, subject to a minimum of 50 funds (or all funds in the Total Mapped Group if fewer than 50). Additional information, such as the ASPG quartile in which the fund's management fee rate ranked, is also included in the chart and was considered by the Board.
VIP Value Portfolio
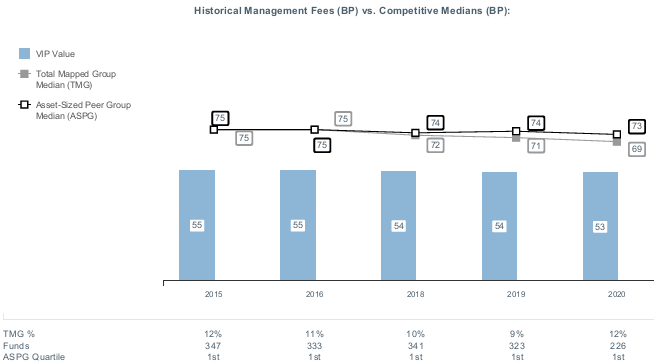
The Board noted that the fund's management fee rate ranked below the median of its Total Mapped Group and below the median of its ASPG for the 12-month period ended September 30, 2020.
The Board noted that, in the past, it and the boards of other Fidelity funds had formed an ad hoc Committee on Group Fee to conduct an in-depth review of the "group fee" component of the management fee of funds with such management fee structures. The Committee's focus included the mechanics of the group fee, the competitive landscape of group fee structures, Fidelity funds with no group fee component and investment products not included in group fee assets. The Board also considered that, for funds subject to the group fee, FMR agreed to voluntarily waive fees over a specified period of time in amounts designed to account for assets converted from certain funds to certain collective investment trusts.
The Board also noted that, in 2013, the ad hoc Committee on Management Fees was formed to conduct an in-depth review of the management fee rates of Fidelity's active equity mutual funds. The Committee focused on the following areas: (i) standard fee structures; (ii) research consumption and trading evolution; (iii) management fee competitiveness/profitability by category; and (iv) factors that drive institutional pricing.
Based on its review, the Board concluded that the fund's management fee is fair and reasonable in light of the services that the fund receives and the other factors considered.
Total Expense Ratio. In its review of each class's total expense ratio, the Board considered the fund's management fee rate as well as other fund or class expenses, as applicable, such as transfer agent fees, pricing and bookkeeping fees, fund-paid 12b-1 fees, and custodial, legal, and audit fees. The Board also noted that Fidelity may agree to waive fees or reimburse expenses from time to time, and the extent to which, if any, it has done so for the fund. As part of its review, the Board also considered the current and historical total expense ratios of each class of the fund compared to competitive fund median expenses. The fund's representative class is compared to those funds and classes in the Total Mapped Group (used by the Board for management fee comparisons) that have a similar sales load structure (SLTG). The Board also considered a total expense ASPG comparison for the representative class, which focuses on the total expenses of the representative class relative to a subset of non-Fidelity funds within the total expense SLTG. The total expense ASPG is limited to 15 larger and 15 smaller classes in fund average assets for a total of 30 classes, where possible. The total expense ASPG comparison excludes performance adjustments and fund-paid 12b-1 fees to eliminate variability in fee structures.
The Board noted that the total expense ratio of Initial Class ranked below the SLTG competitive median and below the ASPG competitive median for the 12-month period ended September 30, 2020.
Fees Charged to Other Fidelity Clients. The Board also considered Fidelity fee structures and other information with respect to clients of Fidelity, such as other funds advised or subadvised by Fidelity, pension plan clients, and other institutional clients with similar mandates. The Board noted that a joint ad hoc committee created by it and the boards of other Fidelity funds periodically reviews and compares Fidelity's institutional investment advisory business with its business of providing services to the Fidelity funds and also noted the most recent findings of the committee. The Board noted that the committee's review included a consideration of the differences in services provided, fees charged, and costs incurred, as well as competition in the markets serving the different categories of clients.
Based on its review of total expense ratios and fees charged to other Fidelity clients, the Board concluded that the total expense ratio of each class of the fund was reasonable in light of the services that the fund and its shareholders receive and the other factors considered.
Costs of the Services and Profitability. The Board considered the revenues earned and the expenses incurred by Fidelity in conducting the business of developing, marketing, distributing, managing, administering and servicing the fund and servicing the fund's shareholders. The Board also considered the level of Fidelity's profits in respect of all the Fidelity funds.
On an annual basis, Fidelity presents to the Board information about the profitability of its relationships with the fund. Fidelity calculates profitability information for each fund, as well as aggregate profitability information for groups of Fidelity funds and all Fidelity funds, using a series of detailed revenue and cost allocation methodologies which originate with the books and records of Fidelity on which Fidelity's audited financial statements are based. The Audit Committee of the Board reviews any significant changes from the prior year's methodologies and the full Board approves such changes.
A public accounting firm has been engaged annually by the Board as part of the Board's assessment of Fidelity's profitability analysis. The engagement includes the review and assessment of the methodologies used by Fidelity in determining the revenues and expenses attributable to Fidelity's mutual fund business, and completion of agreed-upon procedures in respect of the mathematical accuracy of certain fund profitability information and its conformity to established allocation methodologies. After considering the reports issued under the engagement and information provided by Fidelity, the Board concluded that while other allocation methods may also be reasonable, Fidelity's profitability methodologies are reasonable in all material respects.
The Board also reviewed Fidelity's non-fund businesses and potential indirect benefits such businesses may have received as a result of their association with Fidelity's mutual fund business (i.e., fall-out benefits) as well as cases where Fidelity's affiliates may benefit from the funds' business. The Board considered areas where potential indirect benefits to the Fidelity funds from their relationships with Fidelity may exist. The Board also considered that in 2019 a joint ad hoc committee created by it and the boards of other Fidelity funds evaluated potential fall-out benefits (PFOB Committee). The Board noted that it considered the PFOB Committee's findings in connection with its consideration of the renewal of the Advisory Contracts.
The Board considered the costs of the services provided by and the profits realized by Fidelity in connection with the operation of the fund, including the conclusions of the PFOB Committee, and was satisfied that the profitability was not excessive.
Economies of Scale. The Board considered whether there have been economies of scale in respect of the management of the Fidelity funds, whether the Fidelity funds (including the fund) have appropriately benefited from any such economies of scale, and whether there is potential for realization of any further economies of scale. The Board considered the extent to which the fund will benefit from economies of scale as assets grow through increased services to the fund, through waivers or reimbursements, or through fee or expense ratio reductions. The Board also noted that a committee (the Economies of Scale Committee) created by it and the boards of other Fidelity funds periodically analyzes whether Fidelity attains economies of scale in respect of the management and servicing of the Fidelity funds, whether the Fidelity funds have appropriately benefited from such economies of scale, and whether there is potential for realization of any further economies of scale.
The Board recognized that the fund's management contract incorporates a "group fee" structure, which provides for lower group fee rates as total "group assets" increase, and for higher group fee rates as total "group assets" decrease ("group assets" as defined in the management contract). FMR calculates the group fee rates based on a tiered asset "breakpoint" schedule that varies based on asset class. The Board considered that the group fee is designed to deliver the benefits of economies of scale to fund shareholders when total Fidelity fund assets increase, even if assets of any particular fund are unchanged or have declined, because some portion of Fidelity's costs are attributable to services provided to all Fidelity funds, and all funds benefit if those costs can be allocated among more assets. The Board further considered that Fidelity agreed to impose a temporary fee waiver in the form of additional breakpoints to the current breakpoint schedule. The Board concluded that, given the group fee structure, fund shareholders will benefit from lower management fees as "group assets" increase at the fund complex level, regardless of whether Fidelity achieves any such economies of scale.
The Board concluded, taking into account the analysis of the Economies of Scale Committee, that economies of scale, if any, are being appropriately shared between fund shareholders and Fidelity.
Additional Information Requested by the Board. In order to develop fully the factual basis for consideration of the Fidelity funds' advisory contracts, the Board requested and received additional information on certain topics, including: (i) fund flow and performance trends, in particular the underperformance of certain funds and strategies, and Fidelity's long-term strategies for certain funds; (ii) consideration of expanding the use of performance fees for additional funds; (iii) Fidelity's pricing philosophy compared to competitors; (iv) metrics for evaluating index fund and ETF performance and information about ETF trading characteristics; (v) the methodology with respect to evaluating competitive fund data and peer group classifications and fee and expense comparisons; (vi) the expense structures for different funds and classes and information about the differences between various expense structures; (vii) group fee breakpoints; (viii) information regarding other accounts managed by Fidelity and sub-advisory arrangements; and (ix) Fidelity's philosophies and strategies for evaluating funds and classes with lower or declining asset levels.
Based on its evaluation of all of the conclusions noted above, and after considering all factors it believed relevant, the Board concluded that the advisory fee arrangements are fair and reasonable, and that the fund's Advisory Contracts should be renewed.
Liquidity Risk Management Program
The Securities and Exchange Commission adopted Rule 22e-4 under the Investment Company Act of 1940 (the Liquidity Rule) to promote effective liquidity risk management throughout the open-end investment company industry, thereby reducing the risk that funds will be unable to meet their redemption obligations and mitigating dilution of the interests of fund shareholders.
The Fund has adopted and implemented a liquidity risk management program pursuant to the Liquidity Rule (the Program) effective December 1, 2018. The Program is reasonably designed to assess and manage the Fund’s liquidity risk and to comply with the requirements of the Liquidity Rule. The Fund’s Board of Trustees (the Board) has designated the Fund’s investment adviser as administrator of the Program. The Fidelity advisers have established a Liquidity Risk Management Committee (the LRM Committee) to manage the Program for each of the Fidelity Funds. The LRM Committee monitors the adequacy and effectiveness of implementation of the Program and on a periodic basis assesses each Fund’s liquidity risk based on a variety of factors including (1) the Fund’s investment strategy, (2) portfolio liquidity and cash flow projections during normal and reasonably foreseeable stressed conditions, (3) shareholder redemptions, (4) borrowings and other funding sources and (5) in the case of exchange-traded funds, certain additional factors including the effect of the Fund’s prices and spreads, market participants, and basket compositions on the overall liquidity of the Fund’s portfolio, as applicable.
In accordance with the Program, each of the Fund’s portfolio investments is classified into one of four liquidity categories described below based on a determination of a reasonable expectation for how long it would take to convert the investment to cash (or sell or dispose of the investment) without significantly changing its market value.
- Highly liquid investments – cash or convertible to cash within three business days or less
- Moderately liquid investments – convertible to cash in three to seven calendar days
- Less liquid investments – can be sold or disposed of, but not settled, within seven calendar days
- Illiquid investments – cannot be sold or disposed of within seven calendar days
Liquidity classification determinations take into account a variety of factors including various market, trading and investment-specific considerations, as well as market depth, and generally utilize analysis from a third-party liquidity metrics service.
The Liquidity Rule places a 15% limit on a fund’s illiquid investments and requires funds that do not primarily hold assets that are highly liquid investments to determine and maintain a minimum percentage of the fund’s net assets to be invested in highly liquid investments (highly liquid investment minimum or HLIM). The Program includes provisions reasonably designed to comply with the 15% limit on illiquid investments and for determining, periodically reviewing and complying with the HLIM requirement as applicable.
At a recent meeting of the Fund’s Board of Trustees, the LRM Committee provided a written report to the Board pertaining to the operation, adequacy, and effectiveness of implementation of the Program for the annual period from December 1, 2019 through November 30, 2020. The report concluded that the Program has been implemented and is operating effectively and is reasonably designed to assess and manage the Fund’s liquidity risk.
VIPVAL-SANN-0821
1.761034.120
Item 2.
Code of Ethics
Not applicable.
Item 3.
Audit Committee Financial Expert
Not applicable.
Item 4.
Principal Accountant Fees and Services
Not applicable.
Item 5.
Audit Committee of Listed Registrants
Not applicable.
Item 6.
Investments
(a)
Not applicable.
(b)
Not applicable
Item 7.
Disclosure of Proxy Voting Policies and Procedures for Closed-End Management Investment Companies
Not applicable.
Item 8.
Portfolio Managers of Closed-End Management Investment Companies
Not applicable.
Item 9.
Purchase of Equity Securities by Closed-End Management Investment Company and Affiliated Purchasers
Not applicable.
Item 10.
Submission of Matters to a Vote of Security Holders
There were no material changes to the procedures by which shareholders may recommend nominees to the Variable Insurance Products Fund’s Board of Trustees.
Item 11.
Controls and Procedures
(a)(i) The President and Treasurer and the Chief Financial Officer have concluded that the Variable Insurance Products Fund’s (the “Trust”) disclosure controls and procedures (as defined in Rule 30a-3(c) under the Investment Company Act) provide reasonable
assurances that material information relating to the Trust is made known to them by the appropriate persons, based on their evaluation of these controls and procedures as of a date within 90 days of the filing date of this report.
(a)(ii) There was no change in the Trust’s internal control over financial reporting (as defined in Rule 30a-3(d) under the Investment Company Act) that occurred during the period covered by this report that has materially affected, or is reasonably likely to materially affect, the Trust’s internal control over financial reporting.
Item 12.
Disclosure of Securities Lending Activities for Closed-End Management
Investment Companies
Not applicable.
Item 13.
Exhibits
SIGNATURES
Pursuant to the requirements of the Securities Exchange Act of 1934 and the Investment Company Act of 1940, the registrant has duly caused this report to be signed on its behalf by the undersigned, thereunto duly authorized.
Variable Insurance Products Fund
| |
By: | /s/Stacie M. Smith |
| Stacie M. Smith |
| President and Treasurer |
|
|
Date: | August 19, 2021 |
Pursuant to the requirements of the Securities Exchange Act of 1934 and the Investment Company Act of 1940, this report has been signed below by the following persons on behalf of the registrant and in the capacities and on the dates indicated.
| |
By: | /s/Stacie M. Smith |
| Stacie M. Smith |
| President and Treasurer |
|
|
Date: | August 19, 2021 |
| |
By: | /s/John J. Burke III |
| John J. Burke III |
| Chief Financial Officer |
|
|
Date: | August 19, 2021 |