UNITED STATES
SECURITIES AND EXCHANGE COMMISSION
Washington, D.C. 20549
FORM N-CSR
CERTIFIED SHAREHOLDER REPORT OF REGISTERED MANAGEMENT INVESTMENT COMPANIES
Investment Company Act file number
Delaware Group® Limited-Term Government Funds
(Exact name of registrant as specified in charter)
610 Market Street
Philadelphia, PA 19106
Registrant's telephone number, including area code:
Date of reporting period:
Item 1. Report to Stockholders.
(a) The registrant’s annual report transmitted to shareholders pursuant to Rule 30e-1 under the Investment Company Act of 1940 is as follows:
Macquarie Limited-Term Diversified Income Fund
(formerly, Delaware Limited-Term Diversified Income Fund)
Class A : DTRIX
Annual shareholder report | December 31, 2024
This annual shareholder report contains important information about Macquarie Limited-Term Diversified Income Fund (Fund) for the period of January 1, 2024, to December 31, 2024. You can find additional information about the Fund at macquarie.com/mam/literature. You can also request this information by contacting us at 800 523-1918, weekdays from 8:30am to 6:00pm ET.
This report describes changes to the Fund that occurred during the reporting period.
What were the Fund's costs for the last 12 months ?
(Based on a hypothetical $10,000 investment)
| Class | Costs of a $10,000 investment | Costs paid as a percentage of a $10,000 investment |
| Class A | $66 | 0.65% |
Management's discussion of Fund performance
Performance highlights
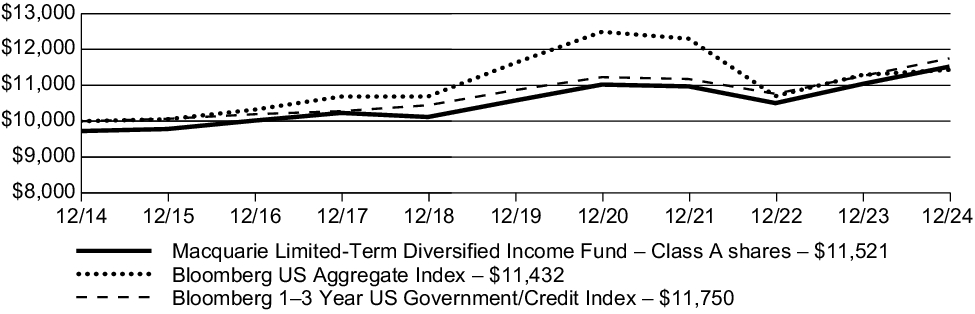
Macquarie Limited-Term Diversified Income Fund (Class A) returned 4.39% (excluding sales charge) for the 12 months ended December 31, 2024. During the same period, the Bloomberg US Aggregate Index, the Fund's broad-based securities market index, returned 1.25%, while the Bloomberg 1-3 Year US Government/Credit Index, the Fund's narrowly based securities market index, returned 4.36%.
Top contributors to performance:
Allocations to structured finance sector, especially asset backed securities (ABS), commercial mortgage-backed securities (CMBS), residential mortgage-backed securities (RMBS), and collateralized loan obligations (CLO), contributed to the Fund’s performance as positive economic data, bolstered by US Federal Reserve easing and expectations of tax cuts and deregulation under a Trump administration, provided a tailwind for risk markets.
Security selection within investment grade corporates was also a contributor to the Fund’s performance.
Top detractors from performance:
An underweight allocation to the government-related sector relative to the Fund's benchmark detracted from performance.
The Fund had a curve flattening exposure relative to its benchmark that detracted from performance as the Treasury yield curve steepened in 2024.
Fund performance
The following graph compares the initial and subsequent account values at the end of each of the most recently completed 10 fiscal years of the Class. It also assumes a $10,000 initial investment at the beginning of the first full fiscal year in a broad-based securities market index and an additional narrowly based securities market index for the same period and the deduction of the maximum applicable sales charge for Class A shares.
Growth of $10,000 investment
For the period December 31, 2014, through December 31, 2024
| Average annual total returns (as of December 31, 2024) | 1 year | 5 year | 10 year |
| Macquarie Limited-Term Diversified Income Fund (Class A) – including sales charge | 1.53 | % | 1.16 | % | 1.43 | % |
| Macquarie Limited-Term Diversified Income Fund (Class A) – excluding sales charge | 4.39 | % | 1.72 | % | 1.71 | % |
| Bloomberg US Aggregate Index | 1.25 | % | -0.33 | % | 1.35 | % |
| Bloomberg 1-3 Year US Government/Credit Index | 4.36 | % | 1.58 | % | 1.63 | % |
Keep in mind that the Fund's past performance is not a good predictor of how the Fund will perform in the future.
Visit macquarie.com/mam/performance for the most recent performance information. The graph and table do not reflect the deduction of taxes that a shareholder would pay on Fund distributions or redemption of Fund shares. Performance results reflect any expense caps in effect during these periods. All results shown assume reinvestment of distributions.
In connection with new regulatory requirements, effective the date of this report, the Fund changed its broad-based securities market benchmark index to the Bloomberg US Aggregate Index. Although the Bloomberg US Aggregate Index can be considered broadly representative of the overall securities market applicable to the Fund, the Fund will continue to show the performance of the Bloomberg 1-3 Year US Government/Credit Index for comparative purposes because Delaware Management Company, the Fund's manager, believes it is more representative of the Fund's investment universe.
Fund statistics (as of December 31, 2024)
| Fund net assets | $736,717,822 |
| Total number of portfolio holdings | 316 |
| Total advisory fees paid | $1,470,625 |
| Portfolio turnover rate | 157% |
Fund holdings (as of December 31, 2024)
The table below shows the investment makeup of the Fund, with each category representing a percentage of the total net assets of the Fund.
| Corporate Bonds | 29.99% |
| US Treasury Obligations | 28.78% |
| Non-Agency Asset-Backed Securities | 21.38% |
| Agency Mortgage-Backed Securities | 8.79% |
| Collateralized Debt Obligations | 5.61% |
| Non-Agency Collateralized Mortgage Obligations | 1.76% |
| Short-Term Investments | 1.72% |
| Agency Commercial Mortgage-Backed Securities | 1.71% |
| Agency Collateralized Mortgage Obligations | 0.74% |
| Government Agency Obligations | 0.38% |
| Supranational Banks | 0.03% |
Effective December 31, 2024, the Fund changed its name from Delaware Limited-Term Diversified Income Fund to Macquarie Limited-Term Diversified Income Fund.
This is a summary of certain changes to the Fund that occurred during the reporting period. For more complete information, you may review the Fund's next prospectus, which we expect to be available by May 1, 2025, at macquarie.com/mam/literature or upon request at 800 523-1918, weekdays from 8:30am to 6:00pm ET.
Availability of additional information
You can access additional information about the Fund, such as the prospectus, financial information, holdings, and proxy voting information, at macquarie.com/mam/literature. You can also request this information by contacting us at 800 523-1918, weekdays from 8:30am to 6:00pm ET, or by contacting your financial intermediary.
Householding
In order to reduce expenses, we will deliver a single copy of prospectuses, proxies, financial reports, and other communication to shareholders with the same residential address, provided they have the same last name or we reasonably believe them to be members of the same family. Unless we are notified otherwise, we will continue to send recipients only one copy of these materials for as long as they remain shareholders of the Fund. If you would like to receive individual mailings, please call 800 523-1918 or contact your financial intermediary. Your instructions will typically be effective within 30 days after we receive them from you or your financial intermediary. If you choose, you may receive these documents through electronic delivery.
For more information, please scan the QR code at left to navigate to additional hosted material at macquarie.com/mam/literature.
Macquarie Limited-Term Diversified Income Fund
(formerly, Delaware Limited-Term Diversified Income Fund)
Class C : DTICX
Annual shareholder report | December 31, 2024
This annual shareholder report contains important information about Macquarie Limited-Term Diversified Income Fund (Fund) for the period of January 1, 2024, to December 31, 2024. You can find additional information about the Fund at macquarie.com/mam/literature. You can also request this information by contacting us at 800 523-1918, weekdays from 8:30am to 6:00pm ET.
This report describes changes to the Fund that occurred during the reporting period.
What were the Fund's costs for the last 12 months ?
(Based on a hypothetical $10,000 investment)
| Class | Costs of a $10,000 investment | Costs paid as a percentage of a $10,000 investment |
| Class C | $143 | 1.40% |
Management's discussion of Fund performance
Performance highlights
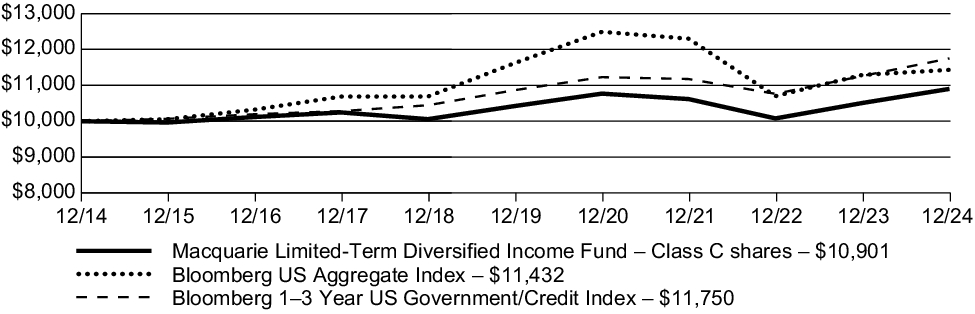
Macquarie Limited-Term Diversified Income Fund (Class C) returned 3.74% (excluding sales charge) for the 12 months ended December 31, 2024. During the same period, the Bloomberg US Aggregate Index, the Fund's broad-based securities market index, returned 1.25%, while the Bloomberg 1-3 Year US Government/Credit Index, the Fund's narrowly based securities market index, returned 4.36%.
Top contributors to performance:
Allocations to structured finance sector, especially asset backed securities (ABS), commercial mortgage-backed securities (CMBS), residential mortgage-backed securities (RMBS), and collateralized loan obligations (CLO), contributed to the Fund’s performance as positive economic data, bolstered by US Federal Reserve easing and expectations of tax cuts and deregulation under a Trump administration, provided a tailwind for risk markets.
Security selection within investment grade corporates was also a contributor to the Fund’s performance.
Top detractors from performance:
An underweight allocation to the government-related sector relative to the Fund's benchmark detracted from performance.
The Fund had a curve flattening exposure relative to its benchmark that detracted from performance as the Treasury yield curve steepened in 2024.
Fund performance
The following graph compares the initial and subsequent account values at the end of each of the most recently completed 10 fiscal years of the Class. It also assumes a $10,000 initial investment at the beginning of the first full fiscal year in a broad-based securities market index and an additional narrowly based securities market index for the same period.
Growth of $10,000 investment
For the period December 31, 2014, through December 31, 2024
| Average annual total returns (as of December 31, 2024) | 1 year | 5 year | 10 year |
| Macquarie Limited-Term Diversified Income Fund (Class C) – including sales charge | 2.74 | % | 0.89 | % | 0.87 | % |
| Macquarie Limited-Term Diversified Income Fund (Class C) – excluding sales charge | 3.74 | % | 0.89 | % | 0.87 | % |
| Bloomberg US Aggregate Index | 1.25 | % | -0.33 | % | 1.35 | % |
| Bloomberg 1-3 Year US Government/Credit Index | 4.36 | % | 1.58 | % | 1.63 | % |
Keep in mind that the Fund's past performance is not a good predictor of how the Fund will perform in the future.
Visit macquarie.com/mam/performance for the most recent performance information. The graph and table do not reflect the deduction of taxes that a shareholder would pay on Fund distributions or redemption of Fund shares. Performance results reflect any expense caps in effect during these periods. All results shown assume reinvestment of distributions.
In connection with new regulatory requirements, effective the date of this report, the Fund changed its broad-based securities market benchmark index to the Bloomberg US Aggregate Index. Although the Bloomberg US Aggregate Index can be considered broadly representative of the overall securities market applicable to the Fund, the Fund will continue to show the performance of the Bloomberg 1-3 Year US Government/Credit Index for comparative purposes because Delaware Management Company, the Fund's manager, believes it is more representative of the Fund's investment universe.
Fund statistics (as of December 31, 2024)
| Fund net assets | $736,717,822 |
| Total number of portfolio holdings | 316 |
| Total advisory fees paid | $1,470,625 |
| Portfolio turnover rate | 157% |
Fund holdings (as of December 31, 2024)
The table below shows the investment makeup of the Fund, with each category representing a percentage of the total net assets of the Fund.
| Corporate Bonds | 29.99% |
| US Treasury Obligations | 28.78% |
| Non-Agency Asset-Backed Securities | 21.38% |
| Agency Mortgage-Backed Securities | 8.79% |
| Collateralized Debt Obligations | 5.61% |
| Non-Agency Collateralized Mortgage Obligations | 1.76% |
| Short-Term Investments | 1.72% |
| Agency Commercial Mortgage-Backed Securities | 1.71% |
| Agency Collateralized Mortgage Obligations | 0.74% |
| Government Agency Obligations | 0.38% |
| Supranational Banks | 0.03% |
Effective December 31, 2024, the Fund changed its name from Delaware Limited-Term Diversified Income Fund to Macquarie Limited-Term Diversified Income Fund.
This is a summary of certain changes to the Fund that occurred during the reporting period. For more complete information, you may review the Fund's next prospectus, which we expect to be available by May 1, 2025, at macquarie.com/mam/literature or upon request at 800 523-1918, weekdays from 8:30am to 6:00pm ET.
Availability of additional information
You can access additional information about the Fund, such as the prospectus, financial information, holdings, and proxy voting information, at macquarie.com/mam/literature. You can also request this information by contacting us at 800 523-1918, weekdays from 8:30am to 6:00pm ET, or by contacting your financial intermediary.
Householding
In order to reduce expenses, we will deliver a single copy of prospectuses, proxies, financial reports, and other communication to shareholders with the same residential address, provided they have the same last name or we reasonably believe them to be members of the same family. Unless we are notified otherwise, we will continue to send recipients only one copy of these materials for as long as they remain shareholders of the Fund. If you would like to receive individual mailings, please call 800 523-1918 or contact your financial intermediary. Your instructions will typically be effective within 30 days after we receive them from you or your financial intermediary. If you choose, you may receive these documents through electronic delivery.
For more information, please scan the QR code at left to navigate to additional hosted material at macquarie.com/mam/literature.
Macquarie Limited-Term Diversified Income Fund
(formerly, Delaware Limited-Term Diversified Income Fund)
Class R : DLTRX
Annual shareholder report | December 31, 2024
This annual shareholder report contains important information about Macquarie Limited-Term Diversified Income Fund (Fund) for the period of January 1, 2024, to December 31, 2024. You can find additional information about the Fund at macquarie.com/mam/literature. You can also request this information by contacting us at 800 523-1918, weekdays from 8:30am to 6:00pm ET.
This report describes changes to the Fund that occurred during the reporting period.
What were the Fund's costs for the last 12 months ?
(Based on a hypothetical $10,000 investment)
| Class | Costs of a $10,000 investment | Costs paid as a percentage of a $10,000 investment |
| Class R | $92 | 0.90% |
Management's discussion of Fund performance
Performance highlights
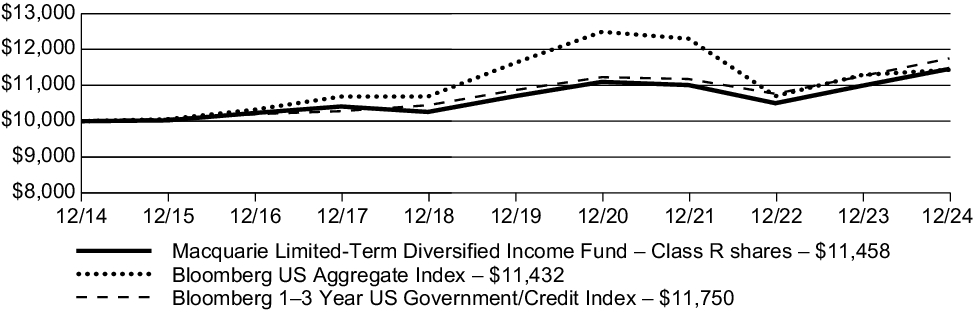
Macquarie Limited-Term Diversified Income Fund (Class R) returned 4.26% (excluding sales charge) for the 12 months ended December 31, 2024. During the same period, the Bloomberg US Aggregate Index, the Fund's broad-based securities market index, returned 1.25%, while the Bloomberg 1-3 Year US Government/Credit Index, the Fund's narrowly based securities market index, returned 4.36%.
Top contributors to performance:
Allocations to structured finance sector, especially asset backed securities (ABS), commercial mortgage-backed securities (CMBS), residential mortgage-backed securities (RMBS), and collateralized loan obligations (CLO), contributed to the Fund’s performance as positive economic data, bolstered by US Federal Reserve easing and expectations of tax cuts and deregulation under a Trump administration, provided a tailwind for risk markets.
Security selection within investment grade corporates was also a contributor to the Fund’s performance.
Top detractors from performance:
An underweight allocation to the government-related sector relative to the Fund's benchmark detracted from performance.
The Fund had a curve flattening exposure relative to its benchmark that detracted from performance as the Treasury yield curve steepened in 2024.
Fund performance
The following graph compares the initial and subsequent account values at the end of each of the most recently completed 10 fiscal years of the Class. It also assumes a $10,000 initial investment at the beginning of the first full fiscal year in a broad-based securities market index and an additional narrowly based securities market index for the same period.
Growth of $10,000 investment
For the period December 31, 2014, through December 31, 2024
| Average annual total returns (as of December 31, 2024) | 1 year | 5 year | 10 year |
| Macquarie Limited-Term Diversified Income Fund (Class R) – including sales charge | 4.26 | % | 1.37 | % | 1.37 | % |
| Macquarie Limited-Term Diversified Income Fund (Class R) – excluding sales charge | 4.26 | % | 1.37 | % | 1.37 | % |
| Bloomberg US Aggregate Index | 1.25 | % | -0.33 | % | 1.35 | % |
| Bloomberg 1-3 Year US Government/Credit Index | 4.36 | % | 1.58 | % | 1.63 | % |
Keep in mind that the Fund's past performance is not a good predictor of how the Fund will perform in the future.
Visit macquarie.com/mam/performance for the most recent performance information. The graph and table do not reflect the deduction of taxes that a shareholder would pay on Fund distributions or redemption of Fund shares. Performance results reflect any expense caps in effect during these periods. All results shown assume reinvestment of distributions.
In connection with new regulatory requirements, effective the date of this report, the Fund changed its broad-based securities market benchmark index to the Bloomberg US Aggregate Index. Although the Bloomberg US Aggregate Index can be considered broadly representative of the overall securities market applicable to the Fund, the Fund will continue to show the performance of the Bloomberg 1-3 Year US Government/Credit Index for comparative purposes because Delaware Management Company, the Fund's manager, believes it is more representative of the Fund's investment universe.
Fund statistics (as of December 31, 2024)
| Fund net assets | $736,717,822 |
| Total number of portfolio holdings | 316 |
| Total advisory fees paid | $1,470,625 |
| Portfolio turnover rate | 157% |
Fund holdings (as of December 31, 2024)
The table below shows the investment makeup of the Fund, with each category representing a percentage of the total net assets of the Fund.
| Corporate Bonds | 29.99% |
| US Treasury Obligations | 28.78% |
| Non-Agency Asset-Backed Securities | 21.38% |
| Agency Mortgage-Backed Securities | 8.79% |
| Collateralized Debt Obligations | 5.61% |
| Non-Agency Collateralized Mortgage Obligations | 1.76% |
| Short-Term Investments | 1.72% |
| Agency Commercial Mortgage-Backed Securities | 1.71% |
| Agency Collateralized Mortgage Obligations | 0.74% |
| Government Agency Obligations | 0.38% |
| Supranational Banks | 0.03% |
Effective December 31, 2024, the Fund changed its name from Delaware Limited-Term Diversified Income Fund to Macquarie Limited-Term Diversified Income Fund.
This is a summary of certain changes to the Fund that occurred during the reporting period. For more complete information, you may review the Fund's next prospectus, which we expect to be available by May 1, 2025, at macquarie.com/mam/literature or upon request at 800 523-1918, weekdays from 8:30am to 6:00pm ET.
Availability of additional information
You can access additional information about the Fund, such as the prospectus, financial information, holdings, and proxy voting information, at macquarie.com/mam/literature. You can also request this information by contacting us at 800 523-1918, weekdays from 8:30am to 6:00pm ET, or by contacting your financial intermediary.
Householding
In order to reduce expenses, we will deliver a single copy of prospectuses, proxies, financial reports, and other communication to shareholders with the same residential address, provided they have the same last name or we reasonably believe them to be members of the same family. Unless we are notified otherwise, we will continue to send recipients only one copy of these materials for as long as they remain shareholders of the Fund. If you would like to receive individual mailings, please call 800 523-1918 or contact your financial intermediary. Your instructions will typically be effective within 30 days after we receive them from you or your financial intermediary. If you choose, you may receive these documents through electronic delivery.
For more information, please scan the QR code at left to navigate to additional hosted material at macquarie.com/mam/literature.
Macquarie Limited-Term Diversified Income Fund
(formerly, Delaware Limited-Term Diversified Income Fund)
Institutional Class : DTINX
Annual shareholder report | December 31, 2024
This annual shareholder report contains important information about Macquarie Limited-Term Diversified Income Fund (Fund) for the period of January 1, 2024, to December 31, 2024. You can find additional information about the Fund at macquarie.com/mam/literature. You can also request this information by contacting us at 800 523-1918, weekdays from 8:30am to 6:00pm ET.
This report describes changes to the Fund that occurred during the reporting period.
What were the Fund's costs for the last 12 months ?
(Based on a hypothetical $10,000 investment)
| Class | Costs of a $10,000 investment | Costs paid as a percentage of a $10,000 investment |
| Institutional Class | $41 | 0.40% |
Management's discussion of Fund performance
Performance highlights
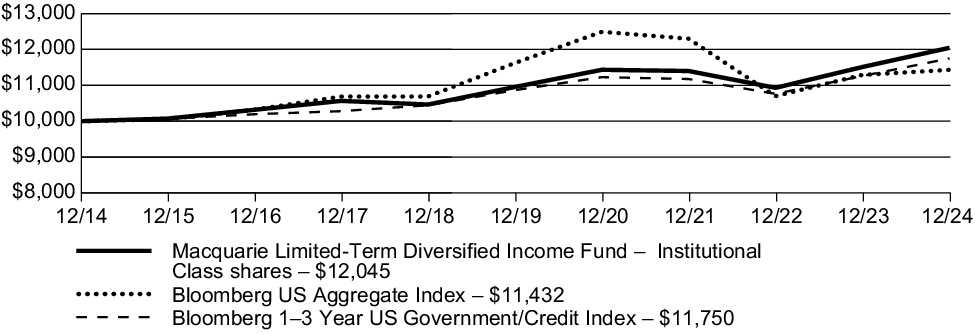
Macquarie Limited-Term Diversified Income Fund (Institutional Class) returned 4.65% (excluding sales charge) for the 12 months ended December 31, 2024. During the same period, the Bloomberg US Aggregate Index, the Fund's broad-based securities market index, returned 1.25%, while the Bloomberg 1-3 Year US Government/Credit Index, the Fund's narrowly based securities market index, returned 4.36%.
Top contributors to performance:
Allocations to structured finance sector, especially asset backed securities (ABS), commercial mortgage-backed securities (CMBS), residential mortgage-backed securities (RMBS), and collateralized loan obligations (CLO), contributed to the Fund’s performance as positive economic data, bolstered by US Federal Reserve easing and expectations of tax cuts and deregulation under a Trump administration, provided a tailwind for risk markets.
Security selection within investment grade corporates was also a contributor to the Fund’s performance.
Top detractors from performance:
An underweight allocation to the government-related sector relative to the Fund's benchmark detracted from performance.
The Fund had a curve flattening exposure relative to its benchmark that detracted from performance as the Treasury yield curve steepened in 2024.
Fund performance
The following graph compares the initial and subsequent account values at the end of each of the most recently completed 10 fiscal years of the Class. It also assumes a $10,000 initial investment at the beginning of the first full fiscal year in a broad-based securities market index and an additional narrowly based securities market index for the same period.
Growth of $10,000 investment
For the period December 31, 2014, through December 31, 2024
| Average annual total returns (as of December 31, 2024) | 1 year | 5 year | 10 year |
| Macquarie Limited-Term Diversified Income Fund (Institutional Class) – including sales charge | 4.65 | % | 1.90 | % | 1.88 | % |
| Macquarie Limited-Term Diversified Income Fund (Institutional Class) – excluding sales charge | 4.65 | % | 1.90 | % | 1.88 | % |
| Bloomberg US Aggregate Index | 1.25 | % | -0.33 | % | 1.35 | % |
| Bloomberg 1-3 Year US Government/Credit Index | 4.36 | % | 1.58 | % | 1.63 | % |
Keep in mind that the Fund's past performance is not a good predictor of how the Fund will perform in the future.
Visit macquarie.com/mam/performance for the most recent performance information. The graph and table do not reflect the deduction of taxes that a shareholder would pay on Fund distributions or redemption of Fund shares. Performance results reflect any expense caps in effect during these periods. All results shown assume reinvestment of distributions.
In connection with new regulatory requirements, effective the date of this report, the Fund changed its broad-based securities market benchmark index to the Bloomberg US Aggregate Index. Although the Bloomberg US Aggregate Index can be considered broadly representative of the overall securities market applicable to the Fund, the Fund will continue to show the performance of the Bloomberg 1-3 Year US Government/Credit Index for comparative purposes because Delaware Management Company, the Fund's manager, believes it is more representative of the Fund's investment universe.
Fund statistics (as of December 31, 2024)
| Fund net assets | $736,717,822 |
| Total number of portfolio holdings | 316 |
| Total advisory fees paid | $1,470,625 |
| Portfolio turnover rate | 157% |
Fund holdings (as of December 31, 2024)
The table below shows the investment makeup of the Fund, with each category representing a percentage of the total net assets of the Fund.
| Corporate Bonds | 29.99% |
| US Treasury Obligations | 28.78% |
| Non-Agency Asset-Backed Securities | 21.38% |
| Agency Mortgage-Backed Securities | 8.79% |
| Collateralized Debt Obligations | 5.61% |
| Non-Agency Collateralized Mortgage Obligations | 1.76% |
| Short-Term Investments | 1.72% |
| Agency Commercial Mortgage-Backed Securities | 1.71% |
| Agency Collateralized Mortgage Obligations | 0.74% |
| Government Agency Obligations | 0.38% |
| Supranational Banks | 0.03% |
Effective December 31, 2024, the Fund changed its name from Delaware Limited-Term Diversified Income Fund to Macquarie Limited-Term Diversified Income Fund.
This is a summary of certain changes to the Fund that occurred during the reporting period. For more complete information, you may review the Fund's next prospectus, which we expect to be available by May 1, 2025, at macquarie.com/mam/literature or upon request at 800 523-1918, weekdays from 8:30am to 6:00pm ET.
Availability of additional information
You can access additional information about the Fund, such as the prospectus, financial information, holdings, and proxy voting information, at macquarie.com/mam/literature. You can also request this information by contacting us at 800 523-1918, weekdays from 8:30am to 6:00pm ET, or by contacting your financial intermediary.
Householding
In order to reduce expenses, we will deliver a single copy of prospectuses, proxies, financial reports, and other communication to shareholders with the same residential address, provided they have the same last name or we reasonably believe them to be members of the same family. Unless we are notified otherwise, we will continue to send recipients only one copy of these materials for as long as they remain shareholders of the Fund. If you would like to receive individual mailings, please call 800 523-1918 or contact your financial intermediary. Your instructions will typically be effective within 30 days after we receive them from you or your financial intermediary. If you choose, you may receive these documents through electronic delivery.
For more information, please scan the QR code at left to navigate to additional hosted material at macquarie.com/mam/literature.
Macquarie Limited-Term Diversified Income Fund
(formerly, Delaware Limited-Term Diversified Income Fund)
Class R6 : DLTZX
Annual shareholder report | December 31, 2024
This annual shareholder report contains important information about Macquarie Limited-Term Diversified Income Fund (Fund) for the period of January 1, 2024, to December 31, 2024. You can find additional information about the Fund at macquarie.com/mam/literature. You can also request this information by contacting us at 800 523-1918, weekdays from 8:30am to 6:00pm ET.
This report describes changes to the Fund that occurred during the reporting period.
What were the Fund's costs for the last 12 months ?
(Based on a hypothetical $10,000 investment)
| Class | Costs of a $10,000 investment | Costs paid as a percentage of a $10,000 investment |
| Class R6 | $34 | 0.33% |
Management's discussion of Fund performance
Performance highlights
Macquarie Limited-Term Diversified Income Fund (Class R6) returned 4.86% (excluding sales charge) for the 12 months ended December 31, 2024. During the same period, the Bloomberg US Aggregate Index, the Fund's broad-based securities market index, returned 1.25%, while the Bloomberg 1-3 Year US Government/Credit Index, the Fund's narrowly based securities market index, returned 4.36%.
Top contributors to performance:
Allocations to structured finance sector, especially asset backed securities (ABS), commercial mortgage-backed securities (CMBS), residential mortgage-backed securities (RMBS), and collateralized loan obligations (CLO), contributed to the Fund’s performance as positive economic data, bolstered by US Federal Reserve easing and expectations of tax cuts and deregulation under a Trump administration, provided a tailwind for risk markets.
Security selection within investment grade corporates was also a contributor to the Fund’s performance.
Top detractors from performance:
An underweight allocation to the government-related sector relative to the Fund's benchmark detracted from performance.
The Fund had a curve flattening exposure relative to its benchmark that detracted from performance as the Treasury yield curve steepened in 2024.
Fund performance
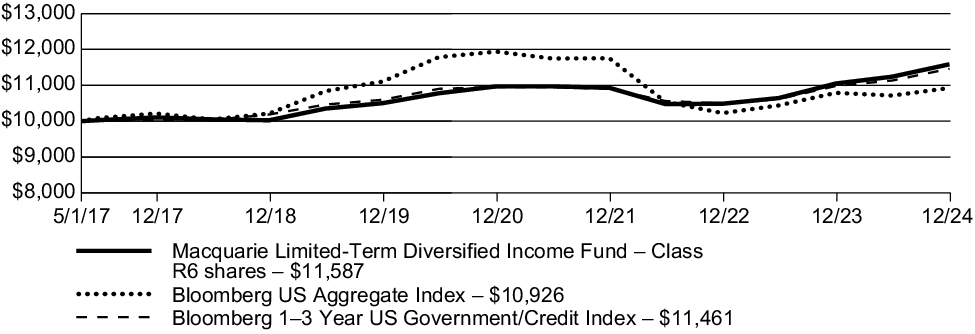
The following graph compares the initial and subsequent account values at the end of each of the most recently completed fiscal years (or period) of the Class for the life of the Class. It also assumes a $10,000 initial investment at the Class's inception date in a broad-based securities market index and an additional narrowly based securities market index for the same period.
Growth of $10,000 investment
For the period May 1, 2017 (Class R6's inception), through December 31, 2024
| Average annual total returns (as of December 31, 2024) | 1 year | 5 year | Since inception
(5/1/17) |
| Macquarie Limited-Term Diversified Income Fund (Class R6) – including sales charge | 4.86 | % | 1.97 | % | 1.94 | % |
| Macquarie Limited-Term Diversified Income Fund (Class R6) – excluding sales charge | 4.86 | % | 1.97 | % | 1.94 | % |
| Bloomberg US Aggregate Index | 1.25 | % | -0.33 | % | 1.16 | % |
| Bloomberg 1-3 Year US Government/Credit Index | 4.36 | % | 1.58 | % | 1.79 | % |
Keep in mind that the Fund's past performance is not a good predictor of how the Fund will perform in the future.
Visit macquarie.com/mam/performance for the most recent performance information. The graph and table do not reflect the deduction of taxes that a shareholder would pay on Fund distributions or redemption of Fund shares. Performance results reflect any expense caps in effect during these periods. All results shown assume reinvestment of distributions.
In connection with new regulatory requirements, effective the date of this report, the Fund changed its broad-based securities market benchmark index to the Bloomberg US Aggregate Index. Although the Bloomberg US Aggregate Index can be considered broadly representative of the overall securities market applicable to the Fund, the Fund will continue to show the performance of the Bloomberg 1-3 Year US Government/Credit Index for comparative purposes because Delaware Management Company, the Fund's manager, believes it is more representative of the Fund's investment universe.
Fund statistics (as of December 31, 2024)
| Fund net assets | $736,717,822 |
| Total number of portfolio holdings | 316 |
| Total advisory fees paid | $1,470,625 |
| Portfolio turnover rate | 157% |
Fund holdings (as of December 31, 2024)
The table below shows the investment makeup of the Fund, with each category representing a percentage of the total net assets of the Fund.
| Corporate Bonds | 29.99% |
| US Treasury Obligations | 28.78% |
| Non-Agency Asset-Backed Securities | 21.38% |
| Agency Mortgage-Backed Securities | 8.79% |
| Collateralized Debt Obligations | 5.61% |
| Non-Agency Collateralized Mortgage Obligations | 1.76% |
| Short-Term Investments | 1.72% |
| Agency Commercial Mortgage-Backed Securities | 1.71% |
| Agency Collateralized Mortgage Obligations | 0.74% |
| Government Agency Obligations | 0.38% |
| Supranational Banks | 0.03% |
Effective December 31, 2024, the Fund changed its name from Delaware Limited-Term Diversified Income Fund to Macquarie Limited-Term Diversified Income Fund.
This is a summary of certain changes to the Fund that occurred during the reporting period. For more complete information, you may review the Fund's next prospectus, which we expect to be available by May 1, 2025, at macquarie.com/mam/literature or upon request at 800 523-1918, weekdays from 8:30am to 6:00pm ET.
Availability of additional information
You can access additional information about the Fund, such as the prospectus, financial information, holdings, and proxy voting information, at macquarie.com/mam/literature. You can also request this information by contacting us at 800 523-1918, weekdays from 8:30am to 6:00pm ET, or by contacting your financial intermediary.
Householding
In order to reduce expenses, we will deliver a single copy of prospectuses, proxies, financial reports, and other communication to shareholders with the same residential address, provided they have the same last name or we reasonably believe them to be members of the same family. Unless we are notified otherwise, we will continue to send recipients only one copy of these materials for as long as they remain shareholders of the Fund. If you would like to receive individual mailings, please call 800 523-1918 or contact your financial intermediary. Your instructions will typically be effective within 30 days after we receive them from you or your financial intermediary. If you choose, you may receive these documents through electronic delivery.
For more information, please scan the QR code at left to navigate to additional hosted material at macquarie.com/mam/literature.
Macquarie Tax-Free Oregon Fund
(formerly, Delaware Tax-Free Oregon Fund)
Class A : FTORX
Annual shareholder report | December 31, 2024
This annual shareholder report contains important information about Macquarie Tax-Free Oregon Fund (Fund) for the period of January 1, 2024, to December 31, 2024. You can find additional information about the Fund at macquarie.com/mam/literature. You can also request this information by contacting us at 800 523-1918, weekdays from 8:30am to 6:00pm ET.
This report describes changes to the Fund that occurred during the reporting period.
What were the Fund's costs for the last 12 months ?
(Based on a hypothetical $10,000 investment)
| Class | Costs of a $10,000 investment | Costs paid as a percentage of a $10,000 investment |
| Class A | $90 | 0.89% |
Management's discussion of Fund performance
Performance highlights
Macquarie Tax-Free Oregon Fund (Class A) returned 2.61% (excluding sales charge) for the 12 months ended December 31, 2024. During the same period, the Bloomberg Municipal Bond Index (benchmark), the Fund's broad-based securities market index, returned 1.05%.
Top contributors to performance:
Municipal yields rose, primarily in the fourth quarter, as markets contended with the US Presidential Election and the US Federal reserve tempering their 2025 rate cut forecast. The front and longer end of the curve outperformed relative to the Fund's index. Additionally, BBB-rated and below investment grade outperformed from a credit perspective.
Lower investment grade and below investment grade were drivers of performance. The catalyst was a strong technical backdrop of diminutive high yield issuance coupled with inflows into municipal mutual funds, particularly high yield funds.
Relative to the Fund’s broad-based index (benchmark):
Strong out-of-benchmark allocation to below investment grade
Overweight to BBB-rated credit
Overweight to the long bond (22+ years) segment of the curve
Top detractors from performance:
The front end of the curve, which is by nature shorter in duration, was the best performing credit segment in the index.
Key detractors to performance relative to the Fund's index include:
An underweight to the front end of the curve was a modest detractor.
Fund performance
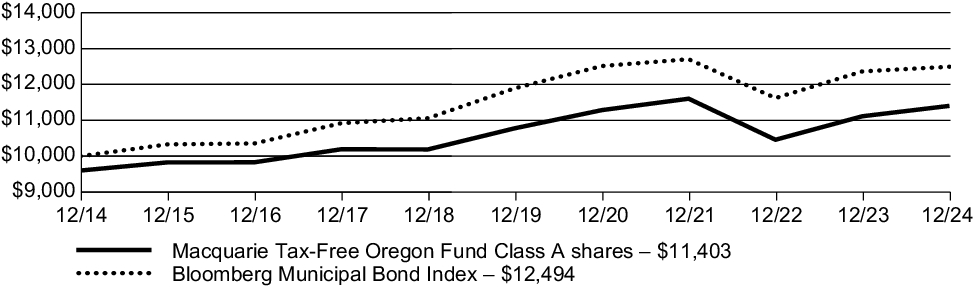
The following graph compares the initial and subsequent account values at the end of each of the most recently completed 10 fiscal years of the Class. It also assumes a $10,000 initial investment at the beginning of the first full fiscal year in a broad-based securities market index for the same period and the deduction of the maximum applicable sales charge for Class A shares.
Growth of $10,000 investment
For the period December 31, 2014, through December 31, 2024
| Average annual total returns (as of December 31, 2024) | 1 year | 5 year | 10 year |
| Macquarie Tax-Free Oregon Fund (Class A) – including sales charge | -1.98 | % | 0.21 | % | 1.32 | % |
| Macquarie Tax-Free Oregon Fund (Class A) – excluding sales charge | 2.61 | % | 1.13 | % | 1.74 | % |
| Bloomberg Municipal Bond Index | 1.05 | % | 0.99 | % | 2.25 | % |
Keep in mind that the Fund's past performance is not a good predictor of how the Fund will perform in the future.
Visit macquarie.com/mam/performance for the most recent performance information. The graph and table do not reflect the deduction of taxes that a shareholder would pay on Fund distributions or redemption of Fund shares. Performance results reflect any expense caps in effect during these periods. All results shown assume reinvestment of distributions.
Fund statistics (as of December 31, 2024)
| Fund net assets | $54,955,282 |
| Total number of portfolio holdings | 85 |
| Total advisory fees paid | $153,380 |
| Portfolio turnover rate | 26% |
Fund holdings (as of December 31, 2024)
The tables below show the investment makeup of the Fund, with each category representing a percentage of the total net assets of the Fund.
| Local General Obligation Bonds | 21.00% |
| Healthcare Revenue Bonds | 17.05% |
| Special Tax Revenue Bonds | 15.97% |
| Transportation Revenue Bonds | 13.53% |
| Water & Sewer Revenue Bonds | 8.45% |
| Housing Revenue Bonds | 5.89% |
| Education Revenue Bonds | 5.43% |
| State General Obligation Bonds | 5.13% |
| Electric Revenue Bonds | 3.57% |
| Industrial Development Revenue/Pollution Control Revenue Bond | 1.45% |
| |
| |
| |
State and territory allocation
| Oregon | 82.07% |
| Puerto Rico | 14.93% |
| Guam | 0.47% |
Effective December 31, 2024, the Fund changed its name from Delaware Tax-Free Oregon Fund to Macquarie Tax-Free Oregon Fund.
Effective May 1, 2024, the Fund introduced a revised fee waiver for Class A shares of 0.63% (excluding certain items, such as distribution and service (12b-1) fees).
This is a summary of certain changes to the Fund that occurred during the reporting period. For more complete information, you may review the Fund's next prospectus, which we expect to be available by May 1, 2025, at macquarie.com/mam/literature or upon request at 800 523-1918, weekdays from 8:30am to 6:00pm ET.
Availability of additional information
You can access additional information about the Fund, such as the prospectus, financial information, holdings, and proxy voting information, at macquarie.com/mam/literature. You can also request this information by contacting us at 800 523-1918, weekdays from 8:30am to 6:00pm ET, or by contacting your financial intermediary.
Householding
In order to reduce expenses, we will deliver a single copy of prospectuses, proxies, financial reports, and other communication to shareholders with the same residential address, provided they have the same last name or we reasonably believe them to be members of the same family. Unless we are notified otherwise, we will continue to send recipients only one copy of these materials for as long as they remain shareholders of the Fund. If you would like to receive individual mailings, please call 800 523-1918 or contact your financial intermediary. Your instructions will typically be effective within 30 days after we receive them from you or your financial intermediary. If you choose, you may receive these documents through electronic delivery.
For more information, please scan the QR code at left to navigate to additional hosted material at macquarie.com/mam/literature.
Macquarie Tax-Free Oregon Fund
(formerly, Delaware Tax-Free Oregon Fund)
Institutional Class : FTOTX
Annual shareholder report | December 31, 2024
This annual shareholder report contains important information about Macquarie Tax-Free Oregon Fund (Fund) for the period of January 1, 2024, to December 31, 2024. You can find additional information about the Fund at macquarie.com/mam/literature. You can also request this information by contacting us at 800 523-1918, weekdays from 8:30am to 6:00pm ET.
This report describes changes to the Fund that occurred during the reporting period.
What were the Fund's costs for the last 12 months ?
(Based on a hypothetical $10,000 investment)
| Class | Costs of a $10,000 investment | Costs paid as a percentage of a $10,000 investment |
| Institutional Class | $65 | 0.64% |
Management's discussion of Fund performance
Performance highlights
Macquarie Tax-Free Oregon Fund (Institutional Class) returned 2.87% (excluding sales charge) for the 12 months ended December 31, 2024. During the same period, the Bloomberg Municipal Bond Index (benchmark), the Fund's broad-based securities market index, returned 1.05%.
Top contributors to performance:
Municipal yields rose, primarily in the fourth quarter, as markets contended with the US Presidential Election and the US Federal reserve tempering their 2025 rate cut forecast. The front and longer end of the curve outperformed relative to the Fund's index. Additionally, BBB-rated and below investment grade outperformed from a credit perspective.
Lower investment grade and below investment grade were drivers of performance. The catalyst was a strong technical backdrop of diminutive high yield issuance coupled with inflows into municipal mutual funds, particularly high yield funds.
Relative to the Fund’s broad-based index (benchmark):
Strong out-of-benchmark allocation to below investment grade
Overweight to BBB-rated credit
Overweight to the long bond (22+ years) segment of the curve
Top detractors from performance:
The front end of the curve, which is by nature shorter in duration, was the best performing credit segment in the index.
Key detractors to performance relative to the Fund's index include:
An underweight to the front end of the curve was a modest detractor.
Fund performance
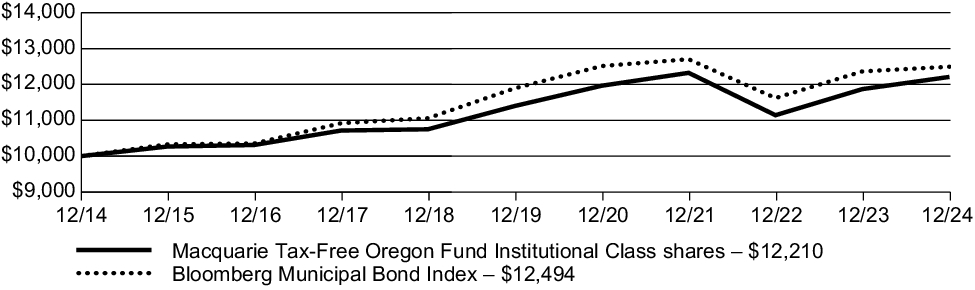
The following graph compares the initial and subsequent account values at the end of each of the most recently completed 10 fiscal years of the Class. It also assumes a $10,000 initial investment at the beginning of the first full fiscal year in a broad-based securities market index for the same period.
Growth of $10,000 investment
For the period December 31, 2014, through December 31, 2024
| Average annual total returns (as of December 31, 2024) | 1 year | 5 year | 10 year |
| Macquarie Tax-Free Oregon Fund (Institutional Class) – including sales charge | 2.87 | % | 1.38 | % | 2.02 | % |
| Macquarie Tax-Free Oregon Fund (Institutional Class) – excluding sales charge | 2.87 | % | 1.38 | % | 2.02 | % |
| Bloomberg Municipal Bond Index | 1.05 | % | 0.99 | % | 2.25 | % |
Keep in mind that the Fund's past performance is not a good predictor of how the Fund will perform in the future.
Visit macquarie.com/mam/performance for the most recent performance information. The graph and table do not reflect the deduction of taxes that a shareholder would pay on Fund distributions or redemption of Fund shares. Performance results reflect any expense caps in effect during these periods. All results shown assume reinvestment of distributions.
Fund statistics (as of December 31, 2024)
| Fund net assets | $54,955,282 |
| Total number of portfolio holdings | 85 |
| Total advisory fees paid | $153,380 |
| Portfolio turnover rate | 26% |
Fund holdings (as of December 31, 2024)
The tables below show the investment makeup of the Fund, with each category representing a percentage of the total net assets of the Fund.
| Local General Obligation Bonds | 21.00% |
| Healthcare Revenue Bonds | 17.05% |
| Special Tax Revenue Bonds | 15.97% |
| Transportation Revenue Bonds | 13.53% |
| Water & Sewer Revenue Bonds | 8.45% |
| Housing Revenue Bonds | 5.89% |
| Education Revenue Bonds | 5.43% |
| State General Obligation Bonds | 5.13% |
| Electric Revenue Bonds | 3.57% |
| Industrial Development Revenue/Pollution Control Revenue Bond | 1.45% |
| |
| |
| |
State and territory allocation
| Oregon | 82.07% |
| Puerto Rico | 14.93% |
| Guam | 0.47% |
Effective December 31, 2024, the Fund changed its name from Delaware Tax-Free Oregon Fund to Macquarie Tax-Free Oregon Fund.
Effective May 1, 2024, the Fund introduced a revised fee waiver for Institutional Class shares of 0.63% (excluding certain items, such as distribution and service (12b-1) fees).
This is a summary of certain changes to the Fund that occurred during the reporting period. For more complete information, you may review the Fund's next prospectus, which we expect to be available by May 1, 2025, at macquarie.com/mam/literature or upon request at 800 523-1918, weekdays from 8:30am to 6:00pm ET.
Availability of additional information
You can access additional information about the Fund, such as the prospectus, financial information, holdings, and proxy voting information, at macquarie.com/mam/literature. You can also request this information by contacting us at 800 523-1918, weekdays from 8:30am to 6:00pm ET, or by contacting your financial intermediary.
Householding
In order to reduce expenses, we will deliver a single copy of prospectuses, proxies, financial reports, and other communication to shareholders with the same residential address, provided they have the same last name or we reasonably believe them to be members of the same family. Unless we are notified otherwise, we will continue to send recipients only one copy of these materials for as long as they remain shareholders of the Fund. If you would like to receive individual mailings, please call 800 523-1918 or contact your financial intermediary. Your instructions will typically be effective within 30 days after we receive them from you or your financial intermediary. If you choose, you may receive these documents through electronic delivery.
For more information, please scan the QR code at left to navigate to additional hosted material at macquarie.com/mam/literature.
Item 2. Code of Ethics.
| | (a) | The registrant has adopted a code of ethics that applies to the registrant’s principal executive officer, principal financial officer, principal accounting officer or controller, or persons performing similar functions, regardless of whether these individuals are employed by the registrant or a third party. A copy of the registrant’s Code of Business Ethics has been posted on the Macquarie Funds Internet Web site at www.macquarie.com/USfunds. Any amendments to the Code of Business Ethics, and information on any waiver from its provisions granted by the registrant, will also be posted on this Web site within five business days of such amendment or waiver and will remain on the Web site for at least 12 months. |
Item 3. Audit Committee Financial Expert.
The registrant’s Board of Trustees has determined that certain members of the registrant’s Audit Committee are audit committee financial experts, as defined below. For purposes of this item, an “audit committee financial expert” is a person who has the following attributes:
a. An understanding of generally accepted accounting principles and financial statements;
b. The ability to assess the general application of such principles in connection with the accounting for estimates, accruals, and reserves;
c. Experience preparing, auditing, analyzing, or evaluating financial statements that present a breadth and level of complexity of accounting issues that are generally comparable to the breadth and complexity of issues that can reasonably be expected to be raised by the registrant’s financial statements, or experience actively supervising one or more persons engaged in such activities;
d. An understanding of internal controls and procedures for financial reporting; and
e. An understanding of audit committee functions.
An “audit committee financial expert” shall have acquired such attributes through:
a. Education and experience as a principal financial officer, principal accounting officer, controller, public accountant, or auditor or experience in one or more positions that involve the performance of similar functions;
b. Experience actively supervising a principal financial officer, principal accounting officer, controller, public accountant, auditor, or person performing similar functions;
c. Experience overseeing or assessing the performance of companies or public accountants with respect to the preparation, auditing, or evaluation of financial statements; or
d. Other relevant experience.
The registrant’s Board of Trustees has also determined that each member of the registrant’s Audit Committee is independent. In order to be “independent” for purposes of this item, the Audit Committee member may not, other than in his or her capacity as a member of the Board of Trustees or any committee thereof, (i) accept directly or indirectly any consulting, advisory or other compensatory fee from the issuer; or (ii) be an “interested person” of the registrant as defined in Section 2(a)(19) of the Investment Company Act of 1940.
The names of the audit committee financial experts on the registrant’s Audit Committee are set forth below:
Ann Borowiec
H. Jeffrey Dobbs
Frances Sevilla-Sacasa, Chair
Christianna Wood
Item 4. Principal Accountant Fees and Services.
Audit Fees
| (a) | The aggregate fees billed for each of the last two fiscal years for professional services rendered by the principal accountant for the audit of the registrant’s annual financial statements or services that are normally provided by the accountant in connection with statutory and regulatory filings or engagements for those fiscal years are $82,700 for 2024 and $85,053 for 2023. |
Audit-Related Fees
| (b) | The aggregate fees billed in each of the last two fiscal years for assurance and related services by the principal accountant that are reasonably related to the performance of the audit of the registrant’s financial statements and are not reported under paragraph (a) of this Item are $1,374,878 for 2024 and $1,362,878 for 2023. These audit-related services were as follows: year end audit procedures; group reporting and subsidiary statutory audits. |
Tax Fees
| (c) | The aggregate fees billed in each of the last two fiscal years for professional services rendered by the principal accountant for tax compliance, tax advice, and tax planning are $12,557 for 2024 and $16,854 for 2023. These tax-related services were as follows: review of income tax returns and review of annual excise distribution calculations. |
All Other Fees
| (d) | The aggregate fees billed in each of the last two fiscal years for products and services provided by the principal accountant, other than the services reported in paragraphs (a) through (c) of this Item are $0 for 2024 and $0 for 2023. |
| (e)(1) | The registrant’s Audit Committee has established pre-approval policies and procedures as permitted by Rule 2-01(c)(7)(i)(B) of Regulation S-X (the “Pre-Approval Policy”) with respect to services provided by the registrant’s independent auditors. Pursuant to the Pre-Approval Policy, the Audit Committee has pre-approved the services set forth in the table below with respect to the registrant up to the specified fee limits. Certain fee limits are based on aggregate fees to the registrant and other registrants within the Macquarie Funds. |
| | |
Service | | Range of Fees |
Audit Services | | |
| |
| Statutory audits or financial audits for new Funds | | up to $50,000 per Fund |
| |
| Services associated with SEC registration statements (e.g., Form N-1A, Form N-14, etc.), periodic reports and other documents filed with the SEC or other documents issued in connection with securities offerings (e.g., comfort letters for closed-end Fund offerings, consents), and assistance in responding to SEC comment letters | | up to $10,000 per Fund |
| |
| Consultations by Fund management as to the accounting or disclosure treatment of transactions or events and/or the actual or potential impact of final or proposed rules, standards or interpretations by the SEC, FASB, or other regulatory or standard-setting bodies (Note: Under SEC rules, some consultations may be considered “audit-related services” rather than “audit services”) | | up to $25,000 in the aggregate |
| |
| Audit-Related Services | | |
| |
| Consultations by Fund management as to the accounting or disclosure treatment of transactions or events and /or the actual or potential impact of final or proposed rules, standards or interpretations by the SEC, FASB, or other regulatory or standard-setting bodies (Note: Under SEC rules, some consultations may be considered “audit services” rather than “audit-related services”) | | up to $25,000 in the aggregate |
| |
| Tax Services | | |
| |
| U.S. federal, state and local and international tax planning and advice (e.g., consulting on statutory, regulatory or administrative developments, evaluation of Funds’ tax compliance function, etc.) | | up to $25,000 in the aggregate |
| |
| U.S. federal, state and local tax compliance (e.g., excise distribution reviews, etc.) | | up to $5,000 per Fund |
| |
| Review of federal, state, local and international income, franchise and other tax returns | | up to $5,000 per Fund |
Under the Pre-Approval Policy, the Audit Committee has also pre-approved the services set forth in the table below with respect to the registrant’s investment adviser and other entities controlling, controlled by or under common control with the investment adviser that provide ongoing services to the registrant (the “Control Affiliates”) up to the specified fee limit. This fee limit is based on aggregate fees to the investment adviser and its Control Affiliates.
| | |
Service | | Range of Fees |
| |
Non-Audit Services | | |
| Services associated with periodic reports and other documents filed with the SEC and assistance in responding to SEC comment letters | | up to $10,000 in the aggregate |
The Pre-Approval Policy requires the registrant’s independent auditors to report to the Audit Committee at each of its regular meetings regarding all services initiated since the last such report was rendered, including those services authorized by the Pre-Approval Policy.
| (e)(2) | The percentage of services described in each of paragraphs (b) through (d) of this Item that were approved by the audit committee pursuant to paragraph (c)(7)(i)(C) of Rule 2-01 of Regulation S-X are as follows: |
| (g) | The aggregate non-audit fees billed by the registrant’s accountant for services rendered to the registrant, and rendered to the registrant’s investment adviser (not including any sub-adviser whose role is primarily portfolio management and is subcontracted with or overseen by another investment adviser), and any entity controlling, controlled by, or under common control with the adviser that provides ongoing services to the registrant for each of the last two fiscal years of the registrant was $9,688,403 for 2024 and $24,428,000 for 2023. |
| (h) | The audit committee of the registrant’s board of trustees has considered whether the provision of non-audit services that were rendered to the registrant’s investment adviser (not including any sub-adviser whose role is primarily portfolio management and is subcontracted with or overseen by another investment adviser), and any entity controlling, controlled by, or under common control with the investment adviser that provides ongoing services to the registrant that were not pre-approved pursuant to paragraph (c)(7)(ii) of Rule 2-01 of Regulation S-X is compatible with maintaining the principal accountant’s independence. |
Item 5. Audit Committee of Listed Registrants.
Not applicable.
Item 6. Investments.
| (a) | Schedule of Investments in securities of unaffiliated issuers as of the close of the reporting period is included as part of the Financial Statements filed under Item 7 of this form. |
Item 7. Financial Statements and Financial Highlights for Open-End Management Investment Companies.
| | (a) | An open-end management investment company registered on Form N-1A [17 CFR 239.15A and 17 CFR 274.11A] must file its most recent annual or semi-annual financial statements required, and for the periods specified, by Regulation S-X. |
The annual financial statements are attached herewith.
| | (b) | An open-end management investment company registered on Form N-1A [17 CFR 239.15A and 17 CFR 274.11A] must file the information required by Item 13 of Form N-1A. |
The Financial Highlights are attached herewith.
Fixed income mutual fund
Macquarie Limited-Term Diversified Income Fund
(formerly, Delaware Limited-Term Diversified Income Fund)
Financial statements and other information
For the year ended December 31, 2024
This report and the financial statements contained herein are submitted for the general information of the shareholders of the Fund. This report is not authorized for distribution to prospective investors in the Fund unless preceded or accompanied by an effective prospectus.
Form N-PORT and proxy voting information
The Fund files its complete schedule of portfolio holdings with the Securities and Exchange Commission (SEC) for the first and third quarters of each fiscal year on Form N-PORT. The Fund’s Form N-PORT, as well as a description of the policies and procedures that the Fund uses to determine how to vote proxies (if any) relating to portfolio securities, is available without charge (i) upon request, by calling 800 523-1918; and (ii) on the SEC’s website at sec.gov. In addition, a description of the policies and procedures that the Fund uses to determine how to vote proxies (if any) relating to portfolio securities and the Schedule of Investments included in the Fund’s most recent Form N-PORT are available without charge on the Fund’s website at macquarie.com/mam/literature.
Information (if any) regarding how the Fund voted proxies relating to portfolio securities during the most recently disclosed 12-month period ended June 30 is available without charge (i) through the Fund’s website at macquarie.com/mam/proxy; and (ii) on the SEC’s website at sec.gov.
Schedule of investments
| Macquarie Limited-Term Diversified Income Fund | December 31, 2024 |
| | | Principal
amount° | Value (US $) |
| Agency Collateralized Mortgage Obligations — 0.74% |
| Fannie Mae Grantor Trust Series 2001-T5 A2 7.00% 6/19/41 • | | 11,417 | $ 11,648 |
| Freddie Mac REMICs | | | |
| Series 4764 PA 3.00% 10/15/45 | | 241,684 | 234,217 |
| Series 5092 WG 1.00% 4/25/31 | | 3,388,828 | 3,117,628 |
| Freddie Mac Structured Pass Through Certificates | | | |
| Series T-30 A5 8.61% 12/25/30 ♦, ~ | | 2,030 | 1,904 |
| Series T-54 2A 6.50% 2/25/43 ♦ | | 439 | 435 |
| Series T-58 2A 6.50% 9/25/43 ♦ | | 188,955 | 189,718 |
| GNMA | | | |
| Series 2004-31 ZB 5.00% 4/20/34 | | 672,778 | 669,035 |
| Series 2012-39 PA 2.00% 3/16/42 | | 1,014,560 | 935,630 |
| Series 2015-151 KC 3.50% 4/20/34 | | 323,400 | 310,790 |
Total Agency Collateralized Mortgage Obligations
(cost $5,919,490) | 5,471,005 |
|
|
|
| Agency Commercial Mortgage-Backed Securities — 1.71% |
| FREMF Mortgage Trust | | | |
| Series 2015-KF12 B 144A 11.88% (SOFR + 7.21%, Floor 7.10%) 9/25/22 #, • | | 2,284,182 | 2,268,849 |
| Series 2017-KF33 B 144A 7.33% (SOFR + 2.66%, Floor 2.55%) 6/25/27 #, • | | 968,036 | 918,588 |
| Series 2017-KF40 B 144A 7.48% (SOFR + 2.81%, Floor 2.70%) 11/25/27 #, • | | 1,447,006 | 1,368,087 |
| Series 2018-K732 B 144A 4.096% 5/25/25 #, • | | 985,000 | 978,625 |
| Series 2018-KF49 B 144A 6.68% (SOFR + 2.01%, Floor 1.90%) 6/25/25 #, • | | 837,687 | 828,314 |
| Series 2019-KF60 B 144A 7.13% (SOFR + 2.46%, Floor 2.35%) 2/25/26 #, • | | 1,671,635 | 1,641,210 |
| Series 2019-KF61 B 144A 6.98% (SOFR + 2.31%, Floor 2.20%) 4/25/29 #, • | | 765,393 | 697,721 |
| Series 2019-KF68 B 144A 6.98% (SOFR + 2.31%, Floor 2.20%) 7/25/26 #, • | | 1,403,492 | 1,361,335 |
| Series 2019-KF70 B 144A 7.08% (SOFR + 2.41%, Floor 2.30%) 9/25/29 #, • | | 838,158 | 789,055 |
| Series 2020-KF74 B 144A 6.93% (SOFR + 2.26%, Floor 2.15%) 1/25/27 #, • | | 872,290 | 845,407 |
| Series 2020-KF75 B 144A 7.03% (SOFR + 2.36%, Floor 2.25%) 12/25/29 #, • | | 996,668 | 922,056 |
Total Agency Commercial Mortgage-Backed Securities
(cost $13,032,291) | 12,619,247 |
|
|
Schedule of investments
Macquarie Limited-Term Diversified Income Fund
| | | Principal
amount° | Value (US $) |
|
|
| Agency Mortgage-Backed Securities — 8.79% |
Fannie Mae
3.50% 10/1/42 | | 502,744 | $ 455,583 |
Fannie Mae S.F. 15 yr
4.50% 9/1/37 | | 51,582 | 50,525 |
| Fannie Mae S.F. 20 yr | | | |
| 4.00% 12/1/31 | | 322,598 | 315,327 |
| 4.00% 8/1/42 | | 151,852 | 142,329 |
| 4.00% 9/1/42 | | 462,697 | 433,681 |
| 5.50% 8/1/43 | | 640,175 | 641,433 |
| Fannie Mae S.F. 30 yr | | | |
| 3.00% 8/1/49 | | 1,493,399 | 1,294,426 |
| 3.00% 10/1/49 | | 510,933 | 439,221 |
| 3.50% 7/1/47 | | 90,394 | 82,349 |
| 3.50% 2/1/48 | | 135,310 | 121,079 |
| 3.50% 11/1/48 | | 185,923 | 166,864 |
| 3.50% 3/1/50 | | 23,196 | 20,860 |
| 3.50% 8/1/50 | | 39,885 | 35,797 |
| 3.50% 9/1/50 | | 504,473 | 454,990 |
| 3.50% 6/1/51 | | 392,750 | 350,194 |
| 3.50% 9/1/52 | | 1,253,928 | 1,122,809 |
| 4.00% 6/1/48 | | 91,188 | 84,680 |
| 4.00% 10/1/48 | | 602,699 | 562,179 |
| 4.00% 9/1/52 | | 372,349 | 341,071 |
| 4.50% 1/1/50 | | 2,805,570 | 2,717,234 |
| 4.50% 4/1/50 | | 1,470,731 | 1,403,511 |
| 4.50% 2/1/53 | | 257,614 | 242,724 |
| 5.00% 7/1/47 | | 2,271,872 | 2,263,786 |
| 5.00% 5/1/48 | | 185,058 | 182,793 |
| 5.00% 8/1/49 | | 885,110 | 871,211 |
| 5.50% 5/1/44 | | 1,521,805 | 1,538,158 |
| 5.50% 10/1/52 | | 1,112,275 | 1,103,341 |
| 5.50% 11/1/52 | | 946,757 | 941,357 |
| 5.50% 12/1/52 | | 209,751 | 207,544 |
| 5.50% 3/1/53 | | 1,806,414 | 1,783,224 |
| 6.00% 1/1/42 | | 1,077,898 | 1,117,467 |
| 6.00% 12/1/52 | | 1,323,942 | 1,332,334 |
| Fannie Mae S.F. 30 yr TBA | | | |
| 5.50% 1/1/55 | | 9,051,000 | 8,931,061 |
| 6.00% 1/1/55 | | 7,983,000 | 8,019,797 |
| Federal Home Loan Mortgage | | | |
| 4.00% 2/28/25 | | 980,000 | 979,370 |
| 4.20% 8/28/25 | | 980,000 | 979,472 |
| | | Principal
amount° | Value (US $) |
|
| Agency Mortgage-Backed Securities (continued) |
| Freddie Mac S.F. 15 yr | | | |
| 3.00% 3/1/35 | | 288,135 | $ 270,647 |
| 3.50% 1/1/29 | | 336,522 | 330,143 |
|
|
Freddie Mac S.F. 20 yr
3.00% 9/1/40 | | 186,445 | 167,161 |
| Freddie Mac S.F. 30 yr | | | |
| 3.50% 6/1/47 | | 814,167 | 730,725 |
| 3.50% 4/1/52 | | 1,605,335 | 1,427,885 |
| 4.00% 8/1/52 | | 405,326 | 372,430 |
| 4.00% 9/1/52 | | 749,793 | 688,751 |
| 4.50% 8/1/48 | | 414,988 | 396,684 |
| 4.50% 9/1/52 | | 2,049,062 | 1,938,059 |
| 4.50% 11/1/52 | | 1,304,318 | 1,228,552 |
| 5.00% 6/1/53 | | 3,408,178 | 3,297,143 |
| 5.50% 9/1/52 | | 2,314,629 | 2,299,271 |
| 5.50% 11/1/52 | | 923,178 | 917,778 |
| 5.50% 3/1/53 | | 1,667,622 | 1,665,070 |
| 6.00% 1/1/53 | | 954,781 | 972,741 |
| 6.00% 3/1/53 | | 3,122,809 | 3,138,213 |
| GNMA II S.F. 30 yr | | | |
| 3.00% 1/20/52 | | 502,501 | 436,170 |
| 5.50% 5/20/53 | | 1,503,535 | 1,495,404 |
| 6.00% 5/20/53 | | 1,198,890 | 1,215,151 |
Total Agency Mortgage-Backed Securities
(cost $67,093,395) | 64,717,759 |
|
|
|
| Collateralized Debt Obligations — 5.61% |
| Ballyrock CLO | | | |
| Series 2018-1A A1 144A 5.879% (TSFR03M + 1.26%) 4/20/31 #, • | | 896,353 | 897,501 |
| Series 2024-27A A1A 144A 6.212% (TSFR03M + 1.35%, Floor 1.35%) 10/25/37 #, • | | 1,150,000 | 1,152,134 |
|
|
| BlueMountain CLO XXX Series 2020-30A AR 144A 6.026% (TSFR03M + 1.37%, Floor 1.37%) 4/15/35 #, • | | 3,000,000 | 3,003,102 |
| Canyon Capital CLO Series 2019-2A AR 144A 6.098% (TSFR03M + 1.44%, Floor 1.18%) 10/15/34 #, • | | 2,800,000 | 2,801,907 |
| Carlyle Global Market Strategies CLO Series 2014-2RA A1 144A 5.835% (TSFR03M + 1.31%) 5/15/31 #, • | | 388,299 | 388,591 |
| CBAM Series 2020-13A A 144A 6.309% (TSFR03M + 1.69%, Floor 1.43%) 1/20/34 #, • | | 3,000,000 | 2,999,463 |
Schedule of investments
Macquarie Limited-Term Diversified Income Fund
| | | Principal
amount° | Value (US $) |
|
| Collateralized Debt Obligations (continued) |
|
| Dryden 77 CLO Series 2020-77A AR 144A 5.903% (TSFR03M + 1.38%, Floor 1.38%) 5/20/34 #, • | | 2,600,000 | $ 2,603,515 |
| Golub Capital Partners CLO 50B-R Series 2020-50A A1R 144A 5.987% (TSFR03M + 1.37%, Floor 1.37%) 4/20/35 #, • | | 5,000,000 | 4,998,920 |
| KKR CLO 41 Series 2022-41A A1 144A 5.977% (TSFR03M + 1.33%, Floor 1.33%) 4/15/35 #, • | | 5,000,000 | 5,008,625 |
| Magnetite XL Series 2024-40A A1 144A 6.782% (TSFR03M + 1.45%, Floor 1.45%) 7/15/37 #, • | | 3,500,000 | 3,523,366 |
| PPM CLO 3 Series 2019-3A AR 144A 5.999% (TSFR03M + 1.35%, Floor 1.09%) 4/17/34 #, • | | 3,750,000 | 3,748,980 |
| Sound Point CLO XXV Series 2019-4A A1R 144A 5.906% (TSFR03M + 1.28%, Floor 1.28%) 4/25/33 #, • | | 5,000,000 | 5,004,600 |
| TRESTLES CLO V Series 2021-5A A1 144A 6.049% (TSFR03M + 1.43%, Floor 1.17%) 10/20/34 #, • | | 2,500,000 | 2,503,068 |
| Venture 34 CLO Series 2018-34A AR 144A 5.936% (TSFR03M + 1.28%, Floor 1.28%) 10/15/31 #, • | | 685,719 | 686,838 |
| Zais CLO 16 Series 2020-16A A1R 144A 6.299% (TSFR03M + 1.68%, Floor 1.68%) 10/20/34 #, • | | 2,000,000 | 1,999,632 |
Total Collateralized Debt Obligations
(cost $41,201,408) | 41,320,242 |
| | | | |
| Corporate Bonds — 29.99% |
| Banking — 9.22% |
| Akbank TAS 144A 7.498% 1/20/30 # | | 200,000 | 202,537 |
| Banco Continental 144A 2.75% 12/10/25 # | | 200,000 | 193,504 |
| Banco de Credito del Peru 144A 3.125% 7/1/30 #, μ | | 200,000 | 196,241 |
| Banco de Credito e Inversiones 144A 3.50% 10/12/27 # | | 300,000 | 287,503 |
| Banco Internacional del Peru 144A 3.25% 10/4/26 # | | 200,000 | 192,883 |
| Banco Santander Mexico 144A 5.621% 12/10/29 # | | 200,000 | 199,500 |
| Bank of America | | | |
| 5.819% 9/15/29 μ | | 1,750,000 | 1,793,679 |
| 6.204% 11/10/28 μ | | 75,000 | 77,660 |
|
|
| Bank of Montreal 7.70% 5/26/84 μ | | 935,000 | 972,405 |
| Bank of New York Mellon 5.802% 10/25/28 μ | | 2,064,000 | 2,119,129 |
| BBVA Bancomer 144A 1.875% 9/18/25 # | | 200,000 | 195,328 |
| Citibank | | | |
| 5.438% 4/30/26 | | 915,000 | 923,721 |
| 5.488% 12/4/26 | | 825,000 | 837,542 |
| | | Principalamount° | Value (US $) |
| Corporate Bonds (continued) |
| Banking (continued) |
| Citigroup | | | |
| 2.014% 1/25/26 μ | | 1,600,000 | $ 1,596,491 |
| 5.50% 9/13/25 | | 1,900,000 | 1,909,108 |
|
|
| Credicorp 144A 2.75% 6/17/25 # | | 200,000 | 197,640 |
| Deutsche Bank | | | |
| 6.72% 1/18/29 μ | | 724,000 | 751,953 |
| 6.819% 11/20/29 μ | | 1,170,000 | 1,224,730 |
| 7.146% 7/13/27 μ | | 925,000 | 953,497 |
| Goldman Sachs Group | | | |
| 4.25% 10/21/25 | | 3,234,000 | 3,217,417 |
| 5.223% (SOFR + 0.79%) 12/9/26 • | | 3,700,000 | 3,709,137 |
| 5.243% (SOFR + 0.81%) 3/9/27 • | | 4,905,000 | 4,909,590 |
|
|
| ICICI Bank 144A 4.00% 3/18/26 # | | 200,000 | 197,751 |
| JPMorgan Chase & Co. | | | |
| 4.08% 4/26/26 μ | | 6,515,000 | 6,499,005 |
| 5.491% (SOFR + 0.885%) 4/22/27 • | | 955,000 | 959,480 |
| 5.571% 4/22/28 μ | | 1,315,000 | 1,337,525 |
|
|
| KeyBank 5.85% 11/15/27 | | 465,000 | 476,648 |
| KeyCorp 5.716% (SOFR03M + 1.25%) 5/23/25 • | | 2,895,000 | 2,897,647 |
| Metropolitan Bank & Trust 5.375% 3/6/29 ■ | | 200,000 | 201,492 |
| Morgan Stanley | | | |
| 6.138% 10/16/26 μ | | 10,465,000 | 10,573,861 |
| 6.296% 10/18/28 μ | | 1,534,000 | 1,590,644 |
| 6.407% 11/1/29 μ | | 488,000 | 509,897 |
|
|
| Morgan Stanley Bank 5.504% 5/26/28 μ | | 1,380,000 | 1,399,465 |
| NBK SPC 144A 1.625% 9/15/27 #, μ | | 200,000 | 188,068 |
| Oversea-Chinese Banking 144A 1.832% 9/10/30 #, μ | | 200,000 | 195,365 |
| PNC Financial Services Group 5.30% 1/21/28 μ | | 1,635,000 | 1,649,253 |
| Popular 7.25% 3/13/28 | | 675,000 | 695,713 |
| Shinhan Bank 3.875% 3/24/26 ■ | | 300,000 | 295,483 |
| State Street 4.993% 3/18/27 | | 1,405,000 | 1,416,891 |
| Truist Bank 4.632% 9/17/29 μ | | 2,480,000 | 2,419,926 |
| UBS Group 144A 6.85% 9/10/29 #, μ, ψ | | 780,000 | 773,429 |
| US Bancorp | | | |
| 4.653% 2/1/29 μ | | 84,000 | 83,168 |
| 5.384% 1/23/30 μ | | 460,000 | 463,935 |
| 5.727% 10/21/26 μ | | 107,000 | 107,755 |
| 6.787% 10/26/27 μ | | 1,330,000 | 1,375,252 |
|
|
| Wells Fargo & Co. 3.908% 4/25/26 μ | | 3,515,000 | 3,504,783 |
Schedule of investments
Macquarie Limited-Term Diversified Income Fund
| | | Principalamount° | Value (US $) |
| Corporate Bonds (continued) |
| Banking (continued) |
|
| Wells Fargo Bank 5.254% 12/11/26 | | 1,410,000 | $ 1,427,409 |
| | 67,901,040 |
| Basic Industry — 0.36% |
| Anglo American Capital 144A 4.00% 9/11/27 # | | 200,000 | 194,680 |
| Novelis 144A 3.25% 11/15/26 # | | 2,180,000 | 2,078,402 |
| Sasol Financing USA 4.375% 9/18/26 | | 200,000 | 192,104 |
| Suzano Austria 144A 5.75% 7/14/26 # | | 200,000 | 201,134 |
| | 2,666,320 |
| Brokerage — 0.04% |
| Jefferies Financial Group 5.875% 7/21/28 | | 315,000 | 322,218 |
| | 322,218 |
| Capital Goods — 2.07% |
| Amphenol 5.05% 4/5/27 | | 670,000 | 675,933 |
| Boeing 2.196% 2/4/26 | | 1,490,000 | 1,445,838 |
| Lennox International 1.35% 8/1/25 | | 3,925,000 | 3,842,549 |
| Mauser Packaging Solutions Holding 144A 7.875% 4/15/27 # | | 1,930,000 | 1,971,418 |
| Parker-Hannifin 4.25% 9/15/27 | | 3,875,000 | 3,834,775 |
| Republic Services 0.875% 11/15/25 | | 2,200,000 | 2,129,260 |
| RTX 5.75% 11/8/26 | | 1,298,000 | 1,322,167 |
| | 15,221,940 |
| Communications — 2.72% |
| American Tower 5.20% 2/15/29 | | 920,000 | 925,873 |
| AT&T 1.70% 3/25/26 | | 2,640,000 | 2,546,433 |
| Charter Communications Operating 6.15% 11/10/26 | | 5,530,000 | 5,639,552 |
| Meta Platforms 4.30% 8/15/29 | | 850,000 | 839,504 |
| Netflix 5.875% 2/15/25 | | 3,750,000 | 3,753,973 |
| Prosus 144A 3.257% 1/19/27 # | | 200,000 | 191,314 |
| Sirius XM Radio 144A 5.00% 8/1/27 # | | 2,090,000 | 2,034,442 |
| Sitios Latinoamerica 144A 6.00% 11/25/29 # | | 200,000 | 199,330 |
| Sprint Spectrum 144A 4.738% 9/20/29 # | | 28,125 | 28,112 |
| T-Mobile USA 3.75% 4/15/27 | | 4,010,000 | 3,918,751 |
| | 20,077,284 |
| Consumer Cyclical — 2.12% |
| Alsea 144A 7.75% 12/14/26 # | | 200,000 | 203,599 |
| Carnival 144A 7.625% 3/1/26 # | | 662,000 | 663,471 |
| | | Principalamount° | Value (US $) |
| Corporate Bonds (continued) |
| Consumer Cyclical (continued) |
| Ford Motor Credit | | | |
| 2.30% 2/10/25 | | 435,000 | $ 433,574 |
| 2.70% 8/10/26 | | 1,700,000 | 1,633,842 |
| 3.375% 11/13/25 | | 4,130,000 | 4,067,052 |
| 5.80% 3/8/29 | | 980,000 | 980,819 |
| 6.798% 11/7/28 | | 525,000 | 544,227 |
| 6.80% 5/12/28 | | 1,350,000 | 1,395,562 |
|
|
| Home Depot 4.875% 6/25/27 | | 535,000 | 540,192 |
| Hyundai Capital America 144A 5.275% 6/24/27 # | | 755,000 | 761,281 |
| Meituan 144A 4.625% 10/2/29 # | | 200,000 | 193,558 |
| Prime Security Services Borrower | | | |
| 144A 3.375% 8/31/27 # | | 1,340,000 | 1,254,471 |
| 144A 5.75% 4/15/26 # | | 820,000 | 820,278 |
|
|
| VICI Properties 4.95% 2/15/30 | | 2,140,000 | 2,099,217 |
| | 15,591,143 |
| Consumer Non-Cyclical — 2.85% |
| AbbVie 4.80% 3/15/29 | | 3,955,000 | 3,953,066 |
| Bimbo Bakeries USA 144A 6.05% 1/15/29 # | | 200,000 | 204,509 |
| Biocon Biologics Global 144A 6.67% 10/9/29 # | | 200,000 | 191,921 |
| Bunge Limited Finance 4.20% 9/17/29 | | 2,400,000 | 2,329,875 |
| Cencosud 144A 4.375% 7/17/27 # | | 200,000 | 195,562 |
| Central American Bottling 144A 5.25% 4/27/29 # | | 200,000 | 189,789 |
| Coca-Cola Consolidated 5.25% 6/1/29 | | 2,135,000 | 2,165,668 |
| McCormick & Co. 0.90% 2/15/26 | | 2,975,000 | 2,851,066 |
| Mondelez International 1.50% 5/4/25 | | 1,210,000 | 1,196,421 |
| Royalty Pharma 1.20% 9/2/25 | | 7,630,000 | 7,443,494 |
| Teva Pharmaceutical Finance Netherlands III 4.75% 5/9/27 | | 250,000 | 244,268 |
| | 20,965,639 |
| Electric — 2.33% |
| AEP Texas 5.45% 5/15/29 | | 1,240,000 | 1,256,599 |
| Avangrid 3.20% 4/15/25 | | 885,000 | 880,640 |
| Colbun 144A 3.95% 10/11/27 # | | 200,000 | 192,827 |
| Duke Energy Carolinas 3.95% 11/15/28 | | 1,785,000 | 1,735,795 |
| FirstEnergy Pennsylvania Electric 144A 5.20% 4/1/28 # | | 2,300,000 | 2,311,570 |
| Korea Hydro & Nuclear Power 144A 5.00% 7/18/28 # | | 200,000 | 199,977 |
| National Rural Utilities Cooperative Finance | | | |
| 1.875% 2/7/25 | | 4,350,000 | 4,337,105 |
| 4.45% 3/13/26 | | 1,080,000 | 1,078,230 |
|
|
| NextEra Energy Capital Holdings 5.749% 9/1/25 | | 245,000 | 246,581 |
Schedule of investments
Macquarie Limited-Term Diversified Income Fund
| | | Principalamount° | Value (US $) |
| Corporate Bonds (continued) |
| Electric (continued) |
|
| Pacific Gas & Electric 5.55% 5/15/29 | | 760,000 | $ 772,758 |
| PacifiCorp 5.10% 2/15/29 | | 335,000 | 337,531 |
| Southern 4.85% 6/15/28 | | 3,210,000 | 3,216,184 |
| Vistra Operations 144A 5.125% 5/13/25 # | | 574,000 | 573,820 |
| | 17,139,617 |
| Energy — 3.02% |
| 3R Lux 144A 9.75% 2/5/31 # | | 200,000 | 206,949 |
| Diamondback Energy 5.20% 4/18/27 | | 640,000 | 646,243 |
| Enbridge | | | |
| 2.50% 2/14/25 | | 1,040,000 | 1,036,985 |
| 5.25% 4/5/27 | | 795,000 | 804,618 |
|
|
| Energy Transfer 5.55% 2/15/28 | | 4,440,000 | 4,510,328 |
| Expand Energy 5.70% 1/23/25 | | 188,000 | 188,143 |
| Galaxy Pipeline Assets Bidco 144A 1.75% 9/30/27 # | | 2,025,996 | 1,924,861 |
| Kinder Morgan 5.10% 8/1/29 | | 1,555,000 | 1,555,588 |
| Medco Maple Tree 144A 8.96% 4/27/29 # | | 250,000 | 263,898 |
| NuStar Logistics 5.75% 10/1/25 | | 1,077,000 | 1,080,351 |
| Occidental Petroleum | | | |
| 5.20% 8/1/29 | | 2,355,000 | 2,338,123 |
| 5.50% 12/1/25 | | 1,247,000 | 1,251,337 |
| 5.875% 9/1/25 | | 4,034,000 | 4,049,142 |
|
|
| Targa Resources Partners 5.00% 1/15/28 | | 2,445,000 | 2,420,028 |
| | 22,276,594 |
| Finance Companies — 1.55% |
| AerCap Ireland Capital DAC | | | |
| 3.00% 10/29/28 | | 1,100,000 | 1,019,047 |
| 5.10% 1/19/29 | | 3,160,000 | 3,159,027 |
|
|
| Air Lease 2.875% 1/15/26 | | 875,000 | 856,794 |
| Aviation Capital Group | | | |
| 144A 1.95% 1/30/26 # | | 3,235,000 | 3,133,879 |
| 144A 5.375% 7/15/29 # | | 1,315,000 | 1,316,595 |
|
|
| Avolon Holdings Funding 144A 4.95% 1/15/28 # | | 960,000 | 951,661 |
| Blackstone Private Credit Fund 144A 5.60% 11/22/29 # | | 870,000 | 859,485 |
| Castlelake Aviation Finance DAC 144A 5.00% 4/15/27 # | | 124,000 | 125,037 |
| | 11,421,525 |
| Insurance — 1.35% |
| Aon North America 5.125% 3/1/27 | | 1,070,000 | 1,077,662 |
| Arthur J Gallagher & Co. 4.85% 12/15/29 | | 2,150,000 | 2,141,105 |
| Elevance Health 5.15% 6/15/29 | | 515,000 | 517,996 |
| | | Principalamount° | Value (US $) |
| Corporate Bonds (continued) |
| Insurance (continued) |
| Met Tower Global Funding 144A 3.70% 6/13/25 # | | 4,380,000 | $ 4,363,042 |
| New York Life Global Funding 144A 5.45% 9/18/26 # | | 1,850,000 | 1,878,973 |
| | 9,978,778 |
| Natural Gas — 0.20% |
| Sempra 3.30% 4/1/25 | | 1,475,000 | 1,469,135 |
| | 1,469,135 |
| Real Estate Investment Trusts — 0.02% |
| Trust Fibra Uno 144A 4.869% 1/15/30 # | | 200,000 | 181,347 |
| | 181,347 |
| Technology — 1.62% |
| Accenture Capital 4.05% 10/4/29 | | 2,615,000 | 2,538,726 |
| Baidu 1.72% 4/9/26 | | 1,250,000 | 1,202,455 |
| Broadcom 5.05% 7/12/29 | | 1,230,000 | 1,235,073 |
| Oracle | | | |
| 4.20% 9/27/29 | | 840,000 | 811,621 |
| 5.80% 11/10/25 | | 2,355,000 | 2,379,201 |
|
|
| Roper Technologies 1.00% 9/15/25 | | 3,600,000 | 3,513,379 |
| SK Hynix 144A 1.50% 1/19/26 # | | 300,000 | 289,395 |
| | 11,969,850 |
| Transportation — 0.49% |
| ERAC USA Finance 144A 4.60% 5/1/28 # | | 3,225,000 | 3,206,118 |
| TAV Havalimanlari Holding 144A 8.50% 12/7/28 # | | 200,000 | 207,343 |
| United Airlines 144A 4.375% 4/15/26 # | | 175,000 | 172,205 |
| | 3,585,666 |
| Utilities — 0.03% |
| Georgia Global Utilities JSC 144A 8.875% 7/25/29 # | | 200,000 | 201,857 |
| | 201,857 |
Total Corporate Bonds
(cost $221,354,947) | 220,969,953 |
|
|
|
| Government Agency Obligations — 0.38% |
| BOC Aviation USA 144A 5.25% 1/14/30 # | | 200,000 | 202,239 |
| CIMB Bank 144A 2.125% 7/20/27 # | | 200,000 | 187,405 |
| Comision Federal de Electricidad 144A 4.75% 2/23/27 # | | 200,000 | 196,119 |
| DAE Sukuk DIFC 144A 3.75% 2/15/26 # | | 200,000 | 196,400 |
| Freeport Indonesia 144A 4.763% 4/14/27 # | | 200,000 | 198,282 |
| Georgian Railway JSC 4.00% 6/17/28 ■ | | 200,000 | 175,264 |
| MEGlobal Canada 144A 5.00% 5/18/25 # | | 200,000 | 199,682 |
Schedule of investments
Macquarie Limited-Term Diversified Income Fund
| | | Principalamount° | Value (US $) |
|
| Government Agency Obligations (continued) |
| Mersin Uluslararasi Liman Isletmeciligi 144A 8.25% 11/15/28 # | | 200,000 | $ 207,411 |
| MISC Capital Two Labuan 144A 3.75% 4/6/27 # | | 200,000 | 194,705 |
| OCP 144A 4.50% 10/22/25 # | | 200,000 | 197,799 |
| QNB Finance 2.625% 5/12/25 ■ | | 250,000 | 247,830 |
| Saudi Arabian Oil 144A 1.625% 11/24/25 # | | 200,000 | 194,491 |
| Telecommunications Telekom Srbija AD Belgrade 144A 7.00% 10/28/29 # | | 200,000 | 200,607 |
| Turk Telekomunikasyon 144A 7.375% 5/20/29 # | | 200,000 | 204,015 |
Total Government Agency Obligations
(cost $2,863,919) | 2,802,249 |
|
|
|
| Non-Agency Asset-Backed Securities — 21.38% |
| American Express Credit Account Master Trust Series 2023-1 A 4.87% 5/15/28 | | 2,500,000 | 2,513,261 |
| ARI Fleet Lease Trust Series 2024-B A2 144A 5.54% 4/15/33 # | | 4,000,000 | 4,033,038 |
| Chase Issuance Trust Series 2024-A1 A 4.60% 1/16/29 | | 6,000,000 | 6,015,541 |
| CNH Equipment Trust Series 2024-A A2 5.19% 7/15/27 | | 2,612,321 | 2,617,957 |
| Crown Castle Towers 144A 3.663% 5/15/25 # | | 2,050,000 | 2,039,386 |
| Discover Card Execution Note Trust Series 2022-A4 A 5.03% 10/15/27 | | 10,050,000 | 10,101,256 |
| Enterprise Fleet Financing | | | |
| Series 2022-2 A2 144A 4.65% 5/21/29 # | | 652,604 | 652,295 |
| Series 2023-3 A2 144A 6.40% 3/20/30 # | | 3,262,606 | 3,324,159 |
|
|
| Ford Credit Auto Lease Trust Series 2024-A A3 5.06% 5/15/27 | | 3,500,000 | 3,517,241 |
| Ford Credit Auto Owner Trust | | | |
| Series 2021-A B 0.70% 10/15/26 | | 180,000 | 178,504 |
| Series 2022-A B 1.91% 7/15/27 | | 5,215,000 | 5,086,327 |
| Series 2023-1 A 144A 4.85% 8/15/35 # | | 4,000,000 | 4,015,942 |
| Series 2024-B A3 5.10% 4/15/29 | | 10,500,000 | 10,622,690 |
| Ford Credit Floorplan Master Owner Trust | | | |
| Series 2020-2 A 1.06% 9/15/27 | | 7,600,000 | 7,414,505 |
| Series 2024-1 A1 144A 5.29% 4/15/29 # | | 10,000,000 | 10,136,870 |
|
|
| GM Financial Consumer Automobile Receivables Trust Series 2024-2 A2B 4.988% (SOFR + 0.39%) 3/16/27 • | | 1,535,574 | 1,536,752 |
| GMF Floorplan Owner Revolving Trust Series 2024-1A A1 144A 5.13% 3/15/29 # | | 4,000,000 | 4,039,911 |
| | | Principalamount° | Value (US $) |
|
| Non-Agency Asset-Backed Securities (continued) |
|
| GreatAmerica Leasing Receivables Funding Series 2024-1 A3 144A 4.98% 1/18/28 # | | 2,700,000 | $ 2,713,556 |
| GTE Auto Receivables Trust Series 2023-1 A2 144A 5.65% 8/17/26 # | | 385,178 | 385,361 |
| Hyundai Auto Lease Securitization Trust | | | |
| Series 2023-A A3 144A 5.05% 1/15/26 # | | 1,498,090 | 1,498,765 |
| Series 2024-A A3 144A 5.02% 3/15/27 # | | 4,500,000 | 4,523,341 |
| Series 2024-C A3 144A 4.62% 4/17/28 # | | 2,000,000 | 2,001,130 |
|
|
| Mercedes-Benz Auto Lease Trust Series 2024-A A2B 5.018% (SOFR + 0.42%) 2/16/27 • | | 2,439,697 | 2,439,688 |
| NextGear Floorplan Master Owner Trust Series 2024-1A A1 144A 5.498% (SOFR + 0.90%, Floor 0.90%) 3/15/29 #, • | | 3,000,000 | 3,018,968 |
| Nissan Master Owner Trust Receivables Series 2024-B A 144A 5.05% 2/15/29 # | | 4,000,000 | 4,026,083 |
| OCCU Auto Receivables Trust Series 2023-1A A2 144A 6.23% 4/15/27 # | | 956,218 | 959,894 |
| Porsche Financial Auto Securitization Trust Series 2023-2A A2B 144A 5.185% (SOFR + 0.58%) 11/23/26 #, • | | 678,717 | 679,100 |
| SBA Tower Trust | | | |
| 144A 1.884% 1/15/26 # | | 3,222,000 | 3,121,946 |
| 144A 2.836% 1/15/25 # | | 5,840,000 | 5,834,008 |
|
|
| Toyota Auto Loan Extended Note Trust Series 2022-1A A 144A 3.82% 4/25/35 # | | 8,000,000 | 7,861,370 |
| Toyota Auto Receivables Owner Trust | | | |
| Series 2024-A A3 4.83% 10/16/28 | | 1,000,000 | 1,005,145 |
| Series 2024-B A3 5.33% 1/16/29 | | 3,500,000 | 3,547,756 |
| Series 2024-C A4 4.83% 11/15/29 | | 5,000,000 | 5,019,099 |
| Verizon Master Trust | | | |
| Series 2022-2 A 1.53% 7/20/28 | | 6,707,000 | 6,696,493 |
| Series 2022-2 B 1.83% 7/20/28 | | 5,215,000 | 5,206,238 |
| Series 2024-3 A1A 5.34% 4/22/30 | | 4,000,000 | 4,067,374 |
|
|
| Volkswagen Auto Lease Trust Series 2024-A A3 5.21% 6/21/27 | | 4,000,000 | 4,037,599 |
| Volkswagen Auto Loan Enhanced Trust Series 2023-2 A2B 5.235% (SOFR + 0.63%) 3/22/27 • | | 3,710,748 | 3,717,456 |
| Wheels Fleet Lease Funding 1Series 2024-3A A1 144A 4.80% 9/19/39 # | | 4,000,000 | 3,995,636 |
Schedule of investments
Macquarie Limited-Term Diversified Income Fund
| | | Principalamount° | Value (US $) |
|
| Non-Agency Asset-Backed Securities (continued) |
|
| World Omni Auto Receivables Trust Series 2022-D A3 5.61% 2/15/28 | | 3,284,750 | $ 3,304,395 |
Total Non-Agency Asset-Backed Securities
(cost $156,564,726) | 157,506,036 |
|
|
|
| Non-Agency Collateralized Mortgage Obligations — 1.76% |
| COLT Mortgage Loan Trust Series 2023-3 A1 144A 7.18% 9/25/68 #, ~ | | 1,710,053 | 1,734,419 |
| Connecticut Avenue Securities Trust Series 2023-R08 1M1 144A 6.069% (SOFR + 1.50%) 10/25/43 #, • | | 1,328,364 | 1,334,724 |
| Freddie Mac Structured Agency Credit Risk REMIC Trust | | | |
| Series 2023-HQA3 A1 144A 6.419% (SOFR + 1.85%) 11/25/43 #, • | | 1,596,922 | 1,614,561 |
| Series 2024-DNA3 M1 144A 5.569% (SOFR + 1.00%) 10/25/44 #, • | | 1,607,015 | 1,607,121 |
|
|
| OBX Trust Series 2023-NQM8 A1 144A 7.045% 9/25/63 #, ~ | | 1,726,777 | 1,750,725 |
| Radnor Re Series 2024-1 M1A 144A 6.56% (SOFR + 2.00%, Floor 2.00%) 9/25/34 #, • | | 876,290 | 877,239 |
| Verus Securitization Trust Series 2023-6 A1 144A 6.665% 9/25/68 #, ~ | | 3,970,491 | 4,011,177 |
Total Non-Agency Collateralized Mortgage Obligations
(cost $12,815,815) | 12,929,966 |
|
|
|
| Supranational Banks — 0.03% |
Africa Finance
144A 5.55% 10/8/29 # | | 200,000 | 198,375 |
Total Supranational Banks
(cost $200,000) | 198,375 |
|
|
|
| US Treasury Obligations — 28.78% |
| US Treasury Notes | | | |
| 1.125% 2/15/31 | | 2,385,000 | 1,968,775 |
| 3.50% 9/30/26 | | 21,360,000 | 21,094,286 |
| 3.75% 12/31/28 | | 3,215,000 | 3,143,581 |
| 3.875% 12/31/29 | | 1,700,000 | 1,661,126 |
| 4.00% 12/15/27 | | 79,350,000 | 78,742,853 |
| 4.125% 3/31/29 | | 7,270,000 | 7,200,232 |
| 4.25% 11/30/26 | | 51,310,000 | 51,303,807 |
| | | Principalamount° | Value (US $) |
|
| US Treasury Obligations (continued) |
| US Treasury Notes | | | |
| 4.375% 7/31/26 | | 46,840,000 | $ 46,924,602 |
Total US Treasury Obligations
(cost $212,676,943) | 212,039,262 |
| | | Number of
shares | |
| Short-Term Investments — 1.72% |
| Money Market Mutual Funds — 1.72% |
| BlackRock Liquidity FedFund – Institutional Shares (seven-day effective yield 4.37%) | | 3,168,450 | 3,168,450 |
| Fidelity Investments Money Market Government Portfolio – Class I (seven-day effective yield 4.38%) | | 3,168,450 | 3,168,450 |
| Goldman Sachs Financial Square Government Fund – Institutional Shares (seven-day effective yield 4.46%) | | 3,168,450 | 3,168,450 |
| Morgan Stanley Institutional Liquidity Funds Government Portfolio – Institutional Class (seven-day effective yield 4.43%) | | 3,168,450 | 3,168,450 |
Total Short-Term Investments
(cost $12,673,800) | 12,673,800 |
Total Value of Securities—100.89%
(cost $746,396,734) | | | $743,247,894 |
| ° | Principal amount shown is stated in USD unless noted that the security is denominated in another currency. |
| • | Variable rate investment. Rates reset periodically. Rate shown reflects the rate in effect at December 31, 2024. For securities based on a published reference rate and spread, the reference rate and spread are indicated in their descriptions. The reference rate descriptions (i.e. SOFR01M, SOFR03M, etc.) used in this report are identical for different securities, but the underlying reference rates may differ due to the timing of the reset period. Certain variable rate securities are not based on a published reference rate and spread but are determined by the issuer or agent and are based on current market conditions, or for mortgage-backed securities, are impacted by the individual mortgages which are paying off over time. These securities do not indicate a reference rate and spread in their descriptions. |
| ♦ | Pass Through Agreement. Security represents the contractual right to receive a proportionate amount of underlying payments due to the counterparty pursuant to various agreements related to the rescheduling of obligations and the exchange of certain notes. |
| ~ | Step-up bond that pays an initial coupon rate for the first period and then a higher coupon rate for the following periods. Stated rate in effect at December 31, 2024. |
Schedule of investments
Macquarie Limited-Term Diversified Income Fund
| # | Security exempt from registration under Rule 144A of the Securities Act of 1933, as amended. At December 31, 2024, the aggregate value of Rule 144A securities was $175,465,603, which represents 23.82% of the Fund’s net assets. See Note 11 in “Notes to financial statements.” |
| μ | Fixed to variable rate investment. The rate shown reflects the fixed rate in effect at December 31, 2024. Rate will reset at a future date. |
| ■ | Regulation S security. Security is offered and sold outside of the United States; therefore, it is exempt from registration with the SEC under Rules 903 and 904 of the Securities Act of 1933, as amended. |
| ψ | Perpetual security. Maturity date represents next call date. |
The following futures contracts were outstanding at December 31, 2024:1
Futures Contracts
Exchange-Traded |
Contracts to
Buy (Sell) | | Notional
Amount | | Notional
Cost
(Proceeds) | | Expiration
Date | | Value/
Unrealized
Depreciation | | Variation
Margin
Due from
(Due to)
Brokers |
| 130 | US Treasury 2 yr Notes | | $26,729,219 | | $26,742,730 | | 3/31/25 | | $(13,511) | | $— |
The use of futures contracts involves elements of market risk and risks in excess of the amounts disclosed in the financial statements. The notional amounts presented above represent the Fund’s total exposure in such contracts, whereas only the variation margin is reflected in the Fund’s net assets.
| 1 | See Note 9 in “Notes to financial statements.” |
| Summary of abbreviations: |
| CLO – Collateralized Loan Obligation |
| DAC – Designated Activity Company |
| DIFC – Dubai International Financial Centre |
| FREMF – Freddie Mac Multifamily |
| GNMA – Government National Mortgage Association |
| JSC – Joint Stock Company |
| REMIC – Real Estate Mortgage Investment Conduit |
| S.F. – Single Family |
| SOFR – Secured Overnight Financing Rate |
| SOFR01M – Secured Overnight Financing Rate 1 Month |
| SOFR03M – Secured Overnight Financing Rate 3 Month |
| Summary of abbreviations: (continued) |
| TBA – To be announced |
| TSFR03M – 3 Month Term Secured Overnight Financing Rate |
| USD – US Dollar |
| yr – Year |
See accompanying notes, which are an integral part of the financial statements.
Statement of assets and liabilities
| Macquarie Limited-Term Diversified Income Fund | December 31, 2024 |
| Assets: | |
| Investments, at value* | $743,247,894 |
| Cash | 5,060,301 |
| Cash collateral due from brokers | 287,919 |
| Dividends and interest receivable | 5,098,593 |
| Receivable for fund shares sold | 2,685,237 |
| Prepaid expenses | 39,187 |
| Other assets | 13,529 |
| Total Assets | 756,432,660 |
| Liabilities: | |
| Payable for securities purchased | 17,185,484 |
| Payable for fund shares redeemed | 1,996,546 |
| Other accrued expenses | 362,263 |
| Distribution fees payable to affiliates | 92,483 |
| Distribution payable | 45,857 |
| Investment management fees payable to affiliates | 32,205 |
| Total Liabilities | 19,714,838 |
| Total Net Assets | $736,717,822 |
|
| Net Assets Consist of: | |
| Paid-in capital | $929,871,477 |
| Total distributable earnings (loss) | (193,153,655) |
| Total Net Assets | $736,717,822 |
|
| Net Asset Value | |
|
| Class A: | |
| Net assets | $398,428,617 |
| Shares of beneficial interest outstanding, unlimited authorization, no par | 50,672,449 |
| Net asset value per share | $7.86 |
| Sales charge | 2.75% |
| Offering price per share, equal to net asset value per share / (1 - sales charge) | $8.08 |
|
| Class C: | |
| Net assets | $8,286,115 |
| Shares of beneficial interest outstanding, unlimited authorization, no par | 1,054,675 |
| Net asset value per share | $7.86 |
|
| Class R: | |
| Net assets | $974,955 |
| Shares of beneficial interest outstanding, unlimited authorization, no par | 123,996 |
| Net asset value per share | $7.86 |
|
| Institutional Class: | |
| Net assets | $307,248,530 |
| Shares of beneficial interest outstanding, unlimited authorization, no par | 39,082,861 |
| Net asset value per share | $7.86 |
|
| Class R6: | |
| Net assets | $21,779,605 |
| Shares of beneficial interest outstanding, unlimited authorization, no par | 2,771,174 |
| Net asset value per share | $7.86 |
*Investments, at cost | $746,396,734 |
See accompanying notes, which are an integral part of the financial statements.
Statement of operations
| Macquarie Limited-Term Diversified Income Fund | Year ended December 31, 2024 |
| Investment Income: | |
| Interest | $34,881,328 |
| Dividends | 1,047,545 |
| | 35,928,873 |
|
| Expenses: | |
| Management fees | 3,973,181 |
| Distribution expenses — Class A | 1,051,384 |
| Distribution expenses — Class C | 96,839 |
| Distribution expenses — Class R | 5,315 |
| Dividend disbursing and transfer agent fees and expenses | 912,626 |
| Accounting and administration expenses | 181,099 |
| Reports and statements to shareholders expenses | 160,263 |
| Registration fees | 106,660 |
| Legal fees | 104,633 |
| Audit and tax fees | 78,802 |
| Trustees’ fees | 36,451 |
| Custodian fees | 25,037 |
| Other | 166,199 |
| | 6,898,489 |
| Less expenses waived | (2,502,556) |
| Less expenses paid indirectly | (14,574) |
| Total operating expenses | 4,381,359 |
| Net Investment Income (Loss) | 31,547,514 |
| Net Realized and Unrealized Gain (Loss): | |
| Net realized gain (loss) on: | |
| Investments | $2,048,371 |
| Futures contracts | (1,165,052) |
| Swap contracts | 91,587 |
| Net increase from payment by affiliates1 | 582,695 |
| Net realized gain (loss) | 1,557,601 |
|
| Net change in unrealized appreciation (depreciation) on: | |
| Investments | 5,383,717 |
| Foreign currencies | (3,693) |
| Futures contracts | (1,585,612) |
| Net change in unrealized appreciation (depreciation) | 3,794,412 |
| Net Realized and Unrealized Gain (Loss) | 5,352,013 |
| Net Increase (Decrease) in Net Assets Resulting from Operations | $36,899,527 |
| 1 | See Note 2 in "Notes to financial statements." |
See accompanying notes, which are an integral part of the financial statements.
Statements of changes in net assets
Macquarie Limited-Term Diversified Income Fund
| | Year ended |
| | 12/31/24 | | 12/31/23 |
| Increase (Decrease) in Net Assets from Operations: | | | |
| Net investment income (loss) | $31,547,514 | | $17,747,980 |
| Net realized gain (loss) | 974,9061 | | (8,828,556) |
| Net increase from payment by affiliates | 582,6952 | | — |
| Net change in unrealized appreciation (depreciation) | 3,794,412 | | 22,796,440 |
| Net increase (decrease) in net assets resulting from operations | 36,899,527 | | 31,715,864 |
|
| Dividends and Distributions to Shareholders from: | | | |
| Distributable earnings: | | | |
| Class A | (16,478,280) | | (9,324,334) |
| Class C | (306,187) | | (262,952) |
| Class R | (38,968) | | (26,278) |
| Institutional Class | (14,858,716) | | (8,277,385) |
| Class R6 | (967,293) | | (677,743) |
| | (32,649,444) | | (18,568,692) |
|
| Capital Share Transactions (See Note 6): | | | |
| Proceeds from shares sold: | | | |
| Class A | 66,163,5103 | | 49,646,562 |
| Class C | 948,1113 | | 2,066,279 |
| Class R | 80,1773 | | 59,451 |
| Institutional Class | 137,644,9103 | | 84,358,626 |
| Class R6 | 6,391,3963 | | 24,337,430 |
|
| Net assets from reorganization:4 | | | |
| Class A | 41,291,534 | | 248,424,336 |
| Class C | 418,852 | | 6,020,079 |
| Class R | — | | 333,903 |
| Institutional Class | 38,761,886 | | 191,309,290 |
| Class R6 | 374,627 | | 3,657,465 |
| | Year ended |
| | 12/31/24 | | 12/31/23 |
| Capital Share Transactions (continued): | | | |
| Net asset value of shares issued upon reinvestment of dividends and distributions: | | | |
| Class A | $15,945,513 | | $9,581,740 |
| Class C | 299,284 | | 267,381 |
| Class R | 38,518 | | 26,648 |
| Institutional Class | 14,249,098 | | 7,875,509 |
| Class R6 | 966,760 | | 682,560 |
| | 323,574,176 | | 628,647,259 |
| Cost of shares redeemed: | | | |
| Class A | (157,439,211) | | (100,801,563) |
| Class C | (5,108,519) | | (6,199,415) |
| Class R | (242,453) | | (86,937) |
| Institutional Class | (218,456,348) | | (155,536,333) |
| Class R6 | (8,494,869) | | (11,313,172) |
| | (389,741,400) | | (273,937,420) |
| Increase (decrease) in net assets derived from capital share transactions | (66,167,224) | | 354,709,839 |
| Net Increase (Decrease) in Net Assets | (61,917,141) | | 367,857,011 |
|
| Net Assets: | | | |
| Beginning of year | 798,634,963 | | 430,777,952 |
| End of year | $736,717,822 | | $798,634,963 |
| 1 | Excludes net increase from payment by affiliates. |
| 2 | See Note 2 in "Notes to financial statements." |
| 3 | Amount includes capital contribution by affiliates. See Note 2 in “Notes to financial statements.” |
| 4 | See Note 7 in "Notes to financial statements." |
See accompanying notes, which are an integral part of the financial statements.
Financial highlights
Macquarie Limited-Term Diversified Income Fund Class A
Selected data for each share of the Fund outstanding throughout each period were as follows:
| |
| |
Net asset value, beginning of period
|
| |
| Income (loss) from investment operations: |
Net investment income1
|
Net realized and unrealized gain (loss)
|
Payment by affiliates
|
Total from investment operations
|
| |
| Less dividends and distributions from: |
Net investment income
|
Return of capital
|
Total dividends and distributions
|
| |
Capital contribution by affiliates
|
| |
Net asset value, end of period
|
| |
Total return5
|
| |
| Ratios and supplemental data: |
Net assets, end of period (000 omitted)
|
Ratio of expenses to average net assets6
|
Ratio of expenses to average net assets prior to fees waived6
|
Ratio of net investment income to average net assets
|
Ratio of net investment income to average net assets prior to fees waived
|
Portfolio turnover
|
| 1 | Calculated using average shares outstanding. |
| 2 | Includes payment by affiliates and capital contribution by affiliates, which impact the total return by 0.13%. See Note 2 in "Notes to financial statements." |
| 3 | Amount is less than $(0.005) per share. |
| 4 | Amount is less than $0.005 per share. |
| 5 | Total return is based on the change in net asset value of a share during the period and assumes reinvestment of dividends and distributions at net asset value and does not reflect the impact of a sales charge. Total return during the period presented reflects waivers by the manager and/or distributor (as applicable). Performance would have been lower had the waivers not been in effect. |
| 6 | Expense ratios do not include expenses of any investment companies in which the Fund invests. |
| 7 | Includes non-recurring expenses of 0.01% for the year ended December 31, 2024. |
See accompanying notes, which are an integral part of the financial statements.
| Year ended |
| 12/31/24 | | 12/31/23 | | 12/31/22 | | 12/31/21 | | 12/31/20 |
| $7.83 | | $7.71 | | $8.25 | | $8.44 | | $8.27 |
| |
| | | | | | | | | |
| 0.30 | | 0.26 | | 0.13 | | 0.07 | | 0.11 |
| 0.03 | | 0.12 | | (0.48) | | (0.11) | | 0.23 |
| 0.012 | | — | | — | | — | | — |
| 0.34 | | 0.38 | | (0.35) | | (0.04) | | 0.34 |
| |
| | | | | | | | | |
| (0.31) | | (0.26) | | (0.19) | | (0.15) | | (0.14) |
| — | | — | | — | | —3 | | (0.03) |
| (0.31) | | (0.26) | | (0.19) | | (0.15) | | (0.17) |
| |
| —2,4 | | — | | — | | — | | — |
| |
| $7.86 | | $7.83 | | $7.71 | | $8.25 | | $8.44 |
| |
| 4.39%2 | | 5.08% | | (4.26%) | | (0.45%) | | 4.16% |
| |
| | | | | | | | | |
| $398,429 | | $430,219 | | $216,299 | | $260,162 | | $148,185 |
| 0.65%7 | | 0.61% | | 0.53% | | 0.54% | | 0.54% |
| 0.96%7 | | 0.95% | | 0.96% | | 0.95% | | 0.96% |
| 3.78% | | 3.31% | | 1.71% | | 0.89% | | 1.32% |
| 3.47% | | 2.97% | | 1.28% | | 0.48% | | 0.90% |
| 157% | | 116% | | 110% | | 205% | | 224% |
Financial highlights
Macquarie Limited-Term Diversified Income Fund Class C
Selected data for each share of the Fund outstanding throughout each period were as follows:
| |
| |
Net asset value, beginning of period
|
| |
| Income (loss) from investment operations: |
Net investment income1
|
Net realized and unrealized gain (loss)
|
Payment by affiliates
|
Total from investment operations
|
| |
| Less dividends and distributions from: |
Net investment income
|
Return of capital
|
Total dividends and distributions
|
| |
Capital contribution by affiliates
|
| |
Net asset value, end of period
|
| |
Total return5
|
| |
| Ratios and supplemental data: |
Net assets, end of period (000 omitted)
|
Ratio of expenses to average net assets6
|
Ratio of expenses to average net assets prior to fees waived6
|
Ratio of net investment income to average net assets
|
Ratio of net investment income (loss) to average net assets prior to fees waived
|
Portfolio turnover
|
| 1 | Calculated using average shares outstanding. |
| 2 | Includes payment by affiliates and capital contribution by affiliates, which impact the total return by 0.13%. See Note 2 in "Notes to financial statements." |
| 3 | Amount is less than $(0.005) per share. |
| 4 | Amount is less than $0.005 per share. |
| 5 | Total return is based on the change in net asset value of a share during the period and assumes reinvestment of dividends and distributions at net asset value and does not reflect the impact of a sales charge. Total return during the period presented reflects waivers by the manager and/or distributor (as applicable). Performance would have been lower had the waivers not been in effect. |
| 6 | Expense ratios do not include expenses of any investment companies in which the Fund invests. |
| 7 | Includes non-recurring expenses of 0.01% for the year ended December 31, 2024. |
See accompanying notes, which are an integral part of the financial statements.
| Year ended |
| 12/31/24 | | 12/31/23 | | 12/31/22 | | 12/31/21 | | 12/31/20 |
| $7.82 | | $7.70 | | $8.24 | | $8.44 | | $8.27 |
| |
| | | | | | | | | |
| 0.24 | | 0.19 | | 0.07 | | — | | 0.04 |
| 0.04 | | 0.13 | | (0.49) | | (0.12) | | 0.23 |
| 0.012 | | — | | — | | — | | — |
| 0.29 | | 0.32 | | (0.42) | | (0.12) | | 0.27 |
| |
| | | | | | | | | |
| (0.25) | | (0.20) | | (0.12) | | (0.08) | | (0.07) |
| — | | — | | — | | —3 | | (0.03) |
| (0.25) | | (0.20) | | (0.12) | | (0.08) | | (0.10) |
| |
| —2,4 | | — | | — | | — | | — |
| |
| $7.86 | | $7.82 | | $7.70 | | $8.24 | | $8.44 |
| |
| 3.74%2 | | 4.27% | | (5.08%) | | (1.41%) | | 3.28% |
| |
| | | | | | | | | |
| $8,286 | | $11,692 | | $9,339 | | $11,355 | | $22,565 |
| 1.40%7 | | 1.39% | | 1.38% | | 1.39% | | 1.39% |
| 1.71%7 | | 1.70% | | 1.71% | | 1.70% | | 1.71% |
| 3.03% | | 2.53% | | 0.86% | | 0.04% | | 0.47% |
| 2.72% | | 2.22% | | 0.53% | | (0.27%) | | 0.15% |
| 157% | | 116% | | 110% | | 205% | | 224% |
Financial highlights
Macquarie Limited-Term Diversified Income Fund Class R
Selected data for each share of the Fund outstanding throughout each period were as follows:
| |
| |
Net asset value, beginning of period
|
| |
| Income (loss) from investment operations: |
Net investment income1
|
Net realized and unrealized gain (loss)
|
Payment by affiliates
|
Total from investment operations
|
| |
| Less dividends and distributions from: |
Net investment income
|
Return of capital
|
Total dividends and distributions
|
| |
Capital contribution by affiliates
|
| |
Net asset value, end of period
|
| |
Total return5
|
| |
| Ratios and supplemental data: |
Net assets, end of period (000 omitted)
|
Ratio of expenses to average net assets6
|
Ratio of expenses to average net assets prior to fees waived6
|
Ratio of net investment income to average net assets
|
Ratio of net investment income to average net assets prior to fees waived
|
Portfolio turnover
|
| 1 | Calculated using average shares outstanding. |
| 2 | Includes payment by affiliates and capital contribution by affiliates, which impact the total return by 0.13%. See Note 2 in "Notes to financial statements." |
| 3 | Amount is less than $(0.005) per share. |
| 4 | Amount is less than $0.005 per share. |
| 5 | Total return is based on the change in net asset value of a share during the period and assumes reinvestment of dividends and distributions at net asset value. Total return during the period presented reflects waivers by the manager and/or distributor (as applicable). Performance would have been lower had the waivers not been in effect. |
| 6 | Expense ratios do not include expenses of any investment companies in which the Fund invests. |
| 7 | Includes non-recurring expenses of 0.01% for the year ended December 31, 2024. |
See accompanying notes, which are an integral part of the financial statements.
| Year ended |
| 12/31/24 | | 12/31/23 | | 12/31/22 | | 12/31/21 | | 12/31/20 |
| $7.82 | | $7.71 | | $8.25 | | $8.44 | | $8.28 |
| |
| | | | | | | | | |
| 0.28 | | 0.23 | | 0.11 | | 0.04 | | 0.08 |
| 0.04 | | 0.12 | | (0.49) | | (0.11) | | 0.22 |
| 0.012 | | — | | — | | — | | — |
| 0.33 | | 0.35 | | (0.38) | | (0.07) | | 0.30 |
| |
| | | | | | | | | |
| (0.29) | | (0.24) | | (0.16) | | (0.12) | | (0.11) |
| — | | — | | — | | —3 | | (0.03) |
| (0.29) | | (0.24) | | (0.16) | | (0.12) | | (0.14) |
| |
| —2,4 | | — | | — | | — | | — |
| |
| $7.86 | | $7.82 | | $7.71 | | $8.25 | | $8.44 |
| |
| 4.26%2 | | 4.65% | | (4.59%) | | (0.80%) | | 3.66% |
| |
| | | | | | | | | |
| $975 | | $1,093 | | $743 | | $843 | | $946 |
| 0.90%7 | | 0.89% | | 0.88% | | 0.89% | | 0.89% |
| 1.21%7 | | 1.20% | | 1.21% | | 1.20% | | 1.21% |
| 3.53% | | 3.03% | | 1.36% | | 0.54% | | 0.97% |
| 3.22% | | 2.72% | | 1.03% | | 0.23% | | 0.65% |
| 157% | | 116% | | 110% | | 205% | | 224% |
Financial highlights
Macquarie Limited-Term Diversified Income Fund Institutional Class
Selected data for each share of the Fund outstanding throughout each period were as follows:
| |
| |
Net asset value, beginning of period
|
| |
| Income (loss) from investment operations: |
Net investment income1
|
Net realized and unrealized gain (loss)
|
Payment by affiliates
|
Total from investment operations
|
| |
| Less dividends and distributions from: |
Net investment income
|
Return of capital
|
Total dividends and distributions
|
| |
Capital contribution by affiliates
|
| |
Net asset value, end of period
|
| |
Total return5
|
| |
| Ratios and supplemental data: |
Net assets, end of period (000 omitted)
|
Ratio of expenses to average net assets6
|
Ratio of expenses to average net assets prior to fees waived6
|
Ratio of net investment income to average net assets
|
Ratio of net investment income to average net assets prior to fees waived
|
Portfolio turnover
|
| 1 | Calculated using average shares outstanding. |
| 2 | Includes payment by affiliates and capital contribution by affiliates, which impact the total return by 0.13%. See Note 2 in "Notes to financial statements." |
| 3 | Amount is less than $(0.005) per share. |
| 4 | Amount is less than $0.005 per share. |
| 5 | Total return is based on the change in net asset value of a share during the period and assumes reinvestment of dividends and distributions at net asset value. Total return during the period presented reflects waivers by the manager. Performance would have been lower had the waivers not been in effect. |
| 6 | Expense ratios do not include expenses of any investment companies in which the Fund invests. |
| 7 | Includes non-recurring expenses of 0.01% for the year ended December 31, 2024. |
See accompanying notes, which are an integral part of the financial statements.
| Year ended |
| 12/31/24 | | 12/31/23 | | 12/31/22 | | 12/31/21 | | 12/31/20 |
| $7.83 | | $7.71 | | $8.25 | | $8.44 | | $8.27 |
| |
| | | | | | | | | |
| 0.32 | | 0.27 | | 0.15 | | 0.09 | | 0.12 |
| 0.03 | | 0.13 | | (0.49) | | (0.12) | | 0.23 |
| 0.012 | | — | | — | | — | | — |
| 0.36 | | 0.40 | | (0.34) | | (0.03) | | 0.35 |
| |
| | | | | | | | | |
| (0.33) | | (0.28) | | (0.20) | | (0.16) | | (0.15) |
| — | | — | | — | | —3 | | (0.03) |
| (0.33) | | (0.28) | | (0.20) | | (0.16) | | (0.18) |
| |
| —2,4 | | — | | — | | — | | — |
| |
| $7.86 | | $7.83 | | $7.71 | | $8.25 | | $8.44 |
| |
| 4.65%2 | | 5.31% | | (4.12%) | | (0.30%) | | 4.31% |
| |
| | | | | | | | | |
| $307,248 | | $333,210 | | $199,497 | | $213,457 | | $262,775 |
| 0.40%7 | | 0.39% | | 0.38% | | 0.39% | | 0.39% |
| 0.71%7 | | 0.70% | | 0.71% | | 0.70% | | 0.71% |
| 4.03% | | 3.53% | | 1.86% | | 1.04% | | 1.47% |
| 3.72% | | 3.22% | | 1.53% | | 0.73% | | 1.15% |
| 157% | | 116% | | 110% | | 205% | | 224% |
Financial highlights
Macquarie Limited-Term Diversified Income Fund Class R6
Selected data for each share of the Fund outstanding throughout each period were as follows:
| |
| |
Net asset value, beginning of period
|
| |
| Income (loss) from investment operations: |
Net investment income1
|
Net realized and unrealized gain (loss)
|
Payment by affiliates
|
Total from investment operations
|
| |
| Less dividends and distributions from: |
Net investment income
|
Return of capital
|
Total dividends and distributions
|
| |
Capital contribution by affiliates
|
| |
Net asset value, end of period
|
| |
Total return5
|
| |
| Ratios and supplemental data: |
Net assets, end of period (000 omitted)
|
Ratio of expenses to average net assets6
|
Ratio of expenses to average net assets prior to fees waived6
|
Ratio of net investment income to average net assets
|
Ratio of net investment income to average net assets prior to fees waived
|
Portfolio turnover
|
| 1 | Calculated using average shares outstanding. |
| 2 | Includes payment by affiliates and capital contribution by affiliates, which impact the total return by 0.13%. See Note 2 in "Notes to financial statements." |
| 3 | Amount is less than $(0.005) per share. |
| 4 | Amount is less than $0.005 per share. |
| 5 | Total return is based on the change in net asset value of a share during the period and assumes reinvestment of dividends and distributions at net asset value. Total return during the period presented reflects waivers by the manager. Performance would have been lower had the waivers not been in effect. |
| 6 | Expense ratios do not include expenses of any investment companies in which the Fund invests. |
| 7 | Includes non-recurring expenses of 0.01% for the year ended December 31, 2024. |
See accompanying notes, which are an integral part of the financial statements.
| Year ended |
| 12/31/24 | | 12/31/23 | | 12/31/22 | | 12/31/21 | | 12/31/20 |
| $7.82 | | $7.70 | | $8.24 | | $8.44 | | $8.27 |
| |
| | | | | | | | | |
| 0.32 | | 0.28 | | 0.15 | | 0.09 | | 0.13 |
| 0.04 | | 0.13 | | (0.48) | | (0.12) | | 0.23 |
| 0.012 | | — | | — | | — | | — |
| 0.37 | | 0.41 | | (0.33) | | (0.03) | | 0.36 |
| |
| | | | | | | | | |
| (0.33) | | (0.29) | | (0.21) | | (0.17) | | (0.16) |
| — | | — | | — | | —3 | | (0.03) |
| (0.33) | | (0.29) | | (0.21) | | (0.17) | | (0.19) |
| |
| —2,4 | | — | | — | | — | | — |
| |
| $7.86 | | $7.82 | | $7.70 | | $8.24 | | $8.44 |
| |
| 4.86%2 | | 5.37% | | (4.06%) | | (0.36%) | | 4.38% |
| |
| | | | | | | | | |
| $21,780 | | $22,421 | | $4,900 | | $5,923 | | $4,646 |
| 0.33%7 | | 0.32% | | 0.32% | | 0.32% | | 0.32% |
| 0.62%7 | | 0.65% | | 0.65% | | 0.63% | | 0.63% |
| 4.10% | | 3.60% | | 1.92% | | 1.10% | | 1.54% |
| 3.81% | | 3.27% | | 1.59% | | 0.79% | | 1.23% |
| 157% | | 116% | | 110% | | 205% | | 224% |
Notes to financial statements
| Macquarie Limited-Term Diversified Income Fund | December 31, 2024 |
Delaware Group® Limited-Term Government Funds (Trust) is organized as a Delaware statutory trust and offers two series: Macquarie Limited-Term Diversified Income Fund (formerly, Delaware Limited-Term Diversified Income Fund through December 30, 2024) and Macquarie Tax-Free Oregon Fund (formerly, Delaware Tax-Free Oregon Fund through December 30, 2024). These financial statements and the related notes pertain to Macquarie Limited-Term Diversified Income Fund (Fund). The Trust is an open-end investment company. The Fund is considered diversified under the Investment Company Act of 1940, as amended (1940 Act), and offers Class A, Class C, Class R, Institutional Class, and Class R6 shares. Class A shares are sold with a maximum front-end sales charge of 2.75%. There is no front-end sales charge when you purchase $1 million or more of Class A shares. However, if Delaware Distributors, L.P. (DDLP) paid your financial intermediary a commission on your purchase of $1 million or more of Class A shares, you will have to pay a limited contingent deferred sales charge (Limited CDSC) of 1.00% if you redeem these shares within the first 18 months after your purchase, unless a specific waiver of the Limited CDSC applies. Class C shares have no upfront sales charge, but are sold with a contingent deferred sales charge (CDSC) of 1.00%, which will be incurred if redeemed during the first 12 months. Class R, Institutional Class, and Class R6 shares are not subject to a sales charge and are offered for sale exclusively to certain eligible investors. In addition, Class R6 shares do not pay any service fees, sub-accounting fees, and/or sub-transfer agency fees to any brokers, dealers, or other financial intermediaries.
1. Significant Accounting Policies
The Fund follows accounting and reporting guidance under Financial Accounting Standards Board (FASB) Accounting Standards Codification Topic 946, Financial Services — Investment Companies. The following accounting policies are in accordance with US generally accepted accounting principles (US GAAP) and are consistently followed by the Fund.
Security Valuation — Fixed income securities and credit default swap (CDS) contracts are generally priced based upon valuations provided by an independent pricing service or broker/counterparty in accordance with methodologies included within Delaware Management Company (DMC)’s Pricing Policy (the Policy). Fixed income security and CDS contracts valuations are then reviewed by DMC as part of its duties as the Fund’s valuation designee (Valuation Designee) and, to the extent required by the Policy and applicable regulation, fair valued consistent with the Policy. To the extent current market prices are not available, the pricing service may take into account developments related to the specific security, as well as transactions in comparable securities. US government and agency securities are valued at the mean between the bid and the ask prices, which approximates fair value. Valuations for fixed income securities utilize matrix systems, which reflect such factors as security prices, yields, maturities, and ratings, and are supplemented by dealer and exchange quotations. Open-end investment companies, other than exchange-traded funds (ETFs), are valued at their published net asset value (NAV). For asset-backed securities, collateralized mortgage obligations (CMOs), commercial mortgage securities, and US government agency mortgage securities, pricing vendors utilize matrix pricing which considers prepayment speed, attributes of the collateral, yield
or price of bonds of comparable quality, coupon, maturity, and type as well as broker/dealer-supplied prices. An adjustment factor may be applied to the daily vendor provided price for certain security/instrument types to arrive at a fair value for the applicable positions. The adjustment factor is determined by comparing the prices of trades with vendor prices over a time period deemed reasonable by DMC, calculating the weighted average differences, and using that difference to adjust vendor prices. Swap prices are derived using daily swap curves and models that incorporate a number of market data factors, such as discounted cash flows, trades, and values of the underlying reference instruments. Futures contracts are valued at the daily quoted settlement prices. Investments for which market quotations are not readily available are valued at fair value as determined in good faith pursuant to Rule 2a-5 under the 1940 Act (Rule 2a-5). As a general principle, the fair value of a security or other asset is the price that would be received to sell an asset or paid to transfer a liability in an orderly transaction between market participants at the measurement date. Pursuant to Rule 2a-5, the Board of Trustees (Board) has designated DMC as the Valuation Designee for the Fund to perform the fair value determination relating to all applicable Fund investments. DMC has established a Pricing Committee to assist with its designated responsibilities as Valuation Designee, and DMC may carry out its designated responsibilities as Valuation Designee through the Pricing Committee and other teams and committees, which operate under policies and procedures approved by the Board and subject to the Board's oversight. Fair value pricing may be used more frequently for securities traded primarily in non-US markets. In considering whether fair valuation is required and in determining fair values, the Valuation Designee may, among other things, consider significant events (which may be considered to include changes in the value of US securities or securities indexes) that occur after the close of the relevant market and before the close of the New York Stock Exchange. The Valuation Designee may utilize modeling tools provided by third-party vendors to determine fair values of non-US securities.
Federal Income Taxes — No provision for federal income taxes has been made as the Fund intends to continue to qualify for federal income tax purposes as a Regulated Investment Company (RIC) under Subchapter M of the Internal Revenue Code of 1986, as amended, and make the requisite distributions to shareholders. The Fund evaluates tax positions taken or expected to be taken in the course of preparing the Fund’s tax returns to determine whether the tax positions are “more-likely-than-not” of being sustained by the applicable tax authority. Tax positions not deemed to meet the “more-likely-than-not” threshold are recorded as a tax benefit or expense in the current year. Management has analyzed the Fund’s tax positions taken or expected to be taken on the Fund’s federal income tax returns through the year ended December 31, 2024, and for all open tax years (years ended December 31, 2021–
December 31, 2023), and has concluded that no provision for federal income tax is required in the Fund’s financial statements. If applicable, the Fund recognizes interest and tax penalties on unrecognized tax benefits in “Interest and tax penalties” on the “Statement of operations.” During the year ended December 31, 2024, the Fund did not incur any interest or tax penalties.
Class Accounting — Investment income and common expenses are allocated to the various classes of the Fund on the basis of “settled shares” of each class in relation to the net assets of
Notes to financial statements
Macquarie Limited-Term Diversified Income Fund
1. Significant Accounting Policies (continued)
the Fund. Realized and unrealized gain (loss) on investments are allocated to the various classes of the Fund on the basis of daily net assets of each class. Distribution expenses relating to a specific class are charged directly to that class. Class R6 shares will not be allocated any expenses related to service fees, sub-accounting fees, and/or sub-transfer agency fees paid to brokers, dealers, or other financial intermediaries.
To Be Announced Trades (TBA) — The Fund may contract to purchase or sell securities for a fixed price at a transaction date beyond the customary settlement period (examples: when issued, delayed delivery, forward commitment, or TBA transactions) consistent with the Fund’s ability to manage its investment portfolio and meet redemption requests. These transactions involve a commitment by the Fund to purchase or sell securities for a predetermined price or yield with payment and delivery taking place more than three days in the future, or after a period longer than the customary settlement period for that type of security. No interest will be earned by the Fund on such purchases until the securities are delivered or the transaction is completed; however, the market value may change prior to delivery. At December 31, 2024, the Fund posted $116,319 cash collateral for TBA trades, which is included in "Cash collateral due from brokers" on the "Statement of assets and liabilities."
Foreign Currency Transactions — Transactions denominated in foreign currencies are recorded at the prevailing exchange rates on the valuation date. The value of all assets and liabilities denominated in foreign currencies is translated daily into US dollars at the exchange rate of such currencies against the US dollar. Transaction gains or losses resulting from changes in exchange rates during the reporting period or upon settlement of the foreign currency transaction are reported in operations for the current period. The Fund generally bifurcates that portion of realized gains and losses on investments in debt securities which is due to changes in foreign exchange rates from that which is due to changes in market prices of debt securities. That portion of realized gains (losses), attributable to changes in foreign exchange rates, is included on the “Statement of operations” under “Net realized gain (loss) on foreign currencies.” The Fund reports certain foreign currency related transactions as components of realized gains (losses) for financial reporting purposes, whereas such components are treated as ordinary income (loss) for federal income tax purposes.
Derivative Financial Instruments — The Fund may invest in various derivative financial instruments. These instruments are used to obtain exposure to a security, commodity, index, market, and/or other assets without owning or taking physical custody of securities, commodities and/or other referenced assets or to manage market, equity, credit, interest rate, forward foreign currency exchange rate, commodity and/or other risks. Derivative financial instruments may give rise to a form of economic leverage and involve risks, including the imperfect correlation between the value of a derivative financial instrument and the underlying asset, possible default of the counterparty to the transaction or illiquidity of the instrument. Pursuant to Rule 18f-4 under the
1940 Act, among other things, the Fund intends to either use derivative financial instruments with embedded leverage in a limited manner or comply with an outer limit on fund leverage risk based on value-at-risk.
Segregation and Collateralization — In certain cases, based on requirements and agreements with certain exchanges and third-party broker-dealers, the Fund may deliver or receive collateral in connection with certain investments (e.g., futures contracts, forward foreign currency exchange contracts, options written, securities with extended settlement periods, and swaps). Certain countries require that cash reserves be held while investing in companies incorporated in that country. Cash collateral that has been pledged/received to cover obligations of the Fund under derivative contracts, if any, will be reported separately on the “Statement of assets and liabilities” as cash collateral due to/from broker. Securities collateral pledged for the same purpose, if any, is noted on the “Schedule of investments.”
Use of Estimates — The preparation of financial statements in conformity with US GAAP requires management to make estimates and assumptions that affect the fair value of investments, the reported amounts of assets and liabilities and disclosure of contingent assets and liabilities at the date of the financial statements, and the reported amounts of revenues and expenses during the reporting period. Actual results could differ from those estimates and the differences could be material.
Other — Expenses directly attributable to the Fund are charged directly to the Fund. Other expenses common to various funds within the Macquarie Funds (formerly, Delaware Funds by Macquarie®) are generally allocated among such funds on the basis of average net assets. Management fees and certain other expenses are paid monthly. Security transactions are recorded on the date the securities are purchased or sold (trade date) for financial reporting purposes. Costs used in calculating realized gains and losses on the sale of investment securities are those of the specific securities sold. Interest income is recorded on an accrual basis. Income and capital gain distributions from any investment companies (Underlying Funds), in which the Fund invests are recorded on the ex-dividend date. Discounts and premiums on debt securities are accreted or amortized to interest income, respectively, over the lives of the respective securities using the effective interest method. Premiums on callable debt securities are amortized to interest income to the earliest call date using the effective interest method. Realized gains (losses) on paydowns of asset- and mortgage-backed securities are classified as interest income. The Fund declares dividends daily from net investment income and pays the dividends monthly and declares and pays distributions from net realized gain on investments, if any, at least annually. The Fund may distribute more frequently, if necessary for tax purposes. Dividends and distributions, if any, are recorded on the ex-dividend date.
In November 2023, FASB issued Accounting Standards Update 2023-07, Segment Reporting (Topic 280): Improvements to Reportable Segment Disclosures, with the intent of improving reportable segment disclosure requirements, primarily through enhanced disclosures about significant segment expenses, allowing financial statement users to better understand the components of a segment’s profit or loss and assess potential future cash flows for each
Notes to financial statements
Macquarie Limited-Term Diversified Income Fund
1. Significant Accounting Policies (continued)
reportable segment and the entity as a whole thereby enabling better understanding of how an entity’s segments impact overall performance. DMC, the Fund’s investment adviser, acts as the Fund’s chief operating decision maker (CODM), assessing performance and making decisions about resource allocation. The CODM has determined that the Fund has a single operating segment since the Fund has a single investment strategy disclosed in the prospectus against which the CODM assesses performance. When assessing segment performance and making decisions about segment resources, the CODM relies on the Fund’s portfolio composition, total returns, expense ratios and changes in net assets which are consistent with the information contained in the Fund’s financial statements. Adoption of the new standard impacted the Fund’s financial statements note disclosures only, and did not affect the Fund’s financial position or the results of its operations.
The Fund receives earnings credits from its custodian when positive cash balances are maintained, which may be used to offset custody fees. The expenses paid under this arrangement are included on the “Statement of operations” under “Custodian fees” with the corresponding expenses offset included under “Less expenses paid indirectly.” For the year ended December 31, 2024, the Fund earned $12,974 under this arrangement.
The Fund receives earnings credits from its transfer agent when positive cash balances are maintained, which may be used to offset transfer agent fees. If the amount earned is greater than $1, the expenses paid under this arrangement are included on the “Statement of operations” under “Dividend disbursing and transfer agent fees and expenses” with the corresponding expenses offset included under “Less expenses paid indirectly.” For the year ended December 31, 2024, the Fund earned $1,600 under this arrangement.
2. Investment Management, Administration Agreements, and Other Transactions with Affiliates
In accordance with the terms of its investment management agreement, the Fund pays DMC, a series of Macquarie Investment Management Business Trust (MIMBT) and the investment manager, an annual fee which is calculated daily and paid monthly at the rates of 0.50% on the first $500 million of average daily net assets of the Fund, 0.475% on the next $500 million, 0.45% on the next $1.5 billion, and 0.425% on average daily net assets in excess of $2.5 billion.
DMC has contractually agreed to waive all or a portion of its investment advisory fees and/or pay/reimburse expenses (excluding any distribution and service (12b-1) fees, acquired fund fees and expenses, taxes, interest, short sale dividend and interest expenses, brokerage fees, certain insurance costs, and nonroutine expenses or costs, including, but not limited to, those relating to reorganizations, litigation, conducting shareholder meetings, and liquidations), in order to prevent total annual fund operating expenses from exceeding 0.39% of the Fund’s Class A, Class C, Class R, and Institutional Class shares’ average daily net assets and 0.32% of the Fund’s Class R6 shares’ average daily net assets from January 1, 2024 through April 30, 2025. These
waivers and reimbursements may only be terminated by agreement of DMC and the Fund. The waivers and reimbursements are accrued daily and received monthly.
After consideration of class specific expenses, including 12b-1 fees, the class level operating expense limitation as a percentage of average daily net assets from January 1, 2024 through April 30, 2025, unless terminated by agreement of DMC and the Fund, is as follows:
| | Operating expense limitation as a percentage of average daily net assets |
| | Class A | | Class C | | Class R | | Institutional Class | | Class R6 |
| | 0.64% | | 1.39% | | 0.89% | | 0.39% | | 0.32% |
DMC has also entered into Sub-Advisory Agreements on behalf of the Fund with Macquarie Investment Management Austria Kapitalanlage AG, Macquarie Investment Management Europe Limited and Macquarie Investment Management Global Limited, each of which is an affiliate of DMC (Affiliated Sub-Advisor). Pursuant to the terms of the relevant Sub-Advisory Agreement, the investment sub-advisory fee is paid by DMC to each Affiliated Sub-Advisor based on the extent to which an Affiliated Sub-Advisor provides services to the Fund.
Delaware Investments Fund Services Company (DIFSC), an affiliate of DMC, provides fund accounting and financial administrative oversight services to the Fund. For these services, DIFSC’s fees are calculated daily and paid monthly, based on the aggregate daily net assets of all funds within the Macquarie Funds at the following annual rates: 0.0050% of the first $60 billion; 0.00475% of the next $30 billion; and 0.0015% of aggregate average daily net assets in excess of $90 billion (Total Fee). Each fund in the Macquarie Funds pays a minimum of $4,000, which, in aggregate, is subtracted from the Total Fee. Each fund then pays its portion of the remainder of the Total Fee on a relative NAV basis. This amount is included on the “Statement of operations” under “Accounting and administration expenses.” For the year ended December 31, 2024, the Fund paid $40,498 for these services.
DIFSC is also the transfer agent and dividend disbursing agent of the Fund. For these services, DIFSC’s fees are calculated daily and paid monthly, based on the aggregate daily net assets of the retail funds within the Macquarie Funds at the following annual rates: 0.014% of the first $20 billion; 0.011% of the next $5 billion; 0.007% of the next $5 billion; 0.004% of the next $20 billion; 0.002% of the next $25 billion; and 0.0015% of average daily net assets in excess of $75 billion. The fees payable to DIFSC under the shareholder services agreement described above are allocated among all retail funds in the Macquarie Funds on a relative NAV basis. This amount is included on the “Statement of operations” under “Dividend disbursing and transfer agent fees and expenses.” For the year ended December 31, 2024, the Fund paid $52,400 for these services. Pursuant to a sub-transfer agency agreement between DIFSC and BNY Mellon Investment Servicing (US) Inc. (BNYIS), BNYIS provides certain sub-transfer agency services to the Fund. Sub-transfer agency fees are paid by the Fund and are also included on the “Statement of operations” under “Dividend disbursing and transfer agent fees and expenses.” The fees are calculated daily and paid as invoices on a monthly or quarterly basis.
Notes to financial statements
Macquarie Limited-Term Diversified Income Fund
2. Investment Management, Administration Agreements, and Other Transactions with Affiliates (continued)
Pursuant to a distribution agreement and distribution plan, the Fund pays DDLP, the distributor and an affiliate of DMC, an annual 12b-1 fee of 0.25%, 1.00%, and 0.50% of the average daily net assets of the Class A, Class C, and Class R shares, respectively. The fees are calculated daily and paid monthly. Institutional Class and Class R6 shares do not pay 12b-1 fees.
As provided in the investment management agreement, the Fund bears a portion of the cost of certain resources shared with DMC, including the cost of internal personnel of DMC and/or its affiliates that provide legal and regulatory reporting services to the Fund. For the year ended December 31, 2024, the Fund paid $22,288 for internal legal and regulatory reporting services provided by DMC and/or its affiliates’ employees. This amount is included on the “Statement of operations” under “Legal fees.”
For the year ended December 31, 2024, DDLP earned $27,394 for commissions on sales of the Fund’s Class A shares. For the year ended December 31, 2024, DDLP received gross CDSC commissions of $1,638 and $1,024 on redemptions of the Fund’s Class A and Class C shares, respectively, and these commissions were entirely used to offset upfront commissions previously paid by DDLP to broker/dealers on sales of those shares.
Trustees’ fees include expenses accrued by the Fund for each Trustee’s retainer and meeting fees. Certain officers of DMC, DIFSC, and DDLP are officers and/or Trustees of the Trust. These officers and Trustees are paid no compensation by the Fund.
In addition to the management fees and other expenses of the Fund, the Fund indirectly bears the investment management fees and other expenses of any Underlying Funds, including ETFs, in which it invests. The amount of these fees and expenses incurred indirectly by the Fund will vary based upon the expense and fee levels of any Underlying Funds and the number of shares that are owned of any Underlying Funds at different times.
MIMBT, of which DMC is a series, entered into a settlement agreement on September 19, 2024 with the US Securities and Exchange Commission (SEC) consenting to an order (Settlement Order) relating to a legacy investment strategy, the Absolute Return Mortgage-Backed Securities Strategy (ARMBS Strategy). MIMBT no longer offers the ARMBS Strategy. MIMBT agreed to the Settlement Order without admitting or denying the SEC’s findings. The Settlement Order does not impact MIMBT’s ability to continue to provide services to the Fund. In connection with the findings in the Settlement Order, MIMBT made a payment to the Fund on October 25, 2024, in the amount of $1,089,375. An amount of $582,695 is included on the “Statement of operations” under “Net increase from payment by affiliates” and an amount of $506,680 is included on the “Statements of changes in net assets” under “Proceeds from shares sold.”
3. Investments
For the year ended December 31, 2024, the Fund made purchases and sales of investment securities other than short-term investments as follows:
| Purchases other than US government securities | $198,548,902 |
| Purchases of US government securities | 1,044,936,124 |
| Sales other than US government securities | 303,119,202 |
| Sales of US government securities | 1,076,414,431 |
The tax cost of investments and derivatives includes adjustments to net unrealized appreciation (depreciation) which may not necessarily be the final tax cost basis adjustments but which approximate the tax basis unrealized gains and losses that may be realized and distributed to shareholders. At December 31, 2024, the cost and unrealized appreciation (depreciation) of investments and derivatives for federal income tax purposes for the Fund were as follows:
| Cost of investments and derivatives | $748,070,545 |
| Aggregate unrealized appreciation of investments and derivatives | $5,494,241 |
| Aggregate unrealized depreciation of investments and derivatives | (10,330,403) |
| Net unrealized depreciation of investments and derivatives | $(4,836,162) |
US GAAP defines fair value as the price that the Fund would receive to sell an asset or pay to transfer a liability in an orderly transaction between market participants at the measurement date under current market conditions. A three-level hierarchy for fair value measurements has been established based upon the transparency of inputs to the valuation of an asset or liability. Inputs may be observable or unobservable and refer broadly to the assumptions that market participants would use in pricing the asset or liability. Observable inputs reflect the assumptions market participants would use in pricing the asset or liability based on market data obtained from sources independent of the reporting entity. Unobservable inputs reflect the reporting entity’s own assumptions about the assumptions that market participants would use in pricing the asset or liability based on the best information available under the circumstances. The Fund’s investment in its entirety is assigned a level based upon the observability of the inputs which are significant to the overall valuation. The three-level hierarchy of inputs is summarized as follows:
Level 1 − Inputs are quoted prices in active markets for identical investments. (Examples: equity securities, open-end investment companies, futures contracts, and exchange-traded options contracts)
Level 2 − Other observable inputs, including, but not limited to: quoted prices for similar assets or liabilities in markets that are active, quoted prices for identical or similar assets or liabilities in markets that are not active, inputs other than quoted prices that are observable for the assets or liabilities (such as interest rates, yield curves, volatilities, prepayment speeds, loss severities, credit risks, and default rates) or other market-corroborated inputs. (Examples: debt securities, government securities, swap contracts, forward foreign currency exchange contracts, foreign securities utilizing international fair value pricing, broker-quoted securities, and fair valued securities)
Notes to financial statements
Macquarie Limited-Term Diversified Income Fund
3. Investments (continued)
Level 3 − Significant unobservable inputs, including the Fund’s own assumptions used to determine the fair value of investments. (Examples: broker-quoted securities and fair valued securities)
Level 3 investments are valued using significant unobservable inputs. The Fund may also use an income-based valuation approach in which the anticipated future cash flows of the investment are discounted to calculate fair value. Discounts may also be applied due to the nature or duration of any restrictions on the disposition of the investments. Valuations may also be based upon current market prices of securities that are comparable in coupon, rating, maturity, and industry. The derived value of a Level 3 investment may not represent the value which is received upon disposition and this could impact the results of operations.
The following table summarizes the valuation of the Fund’s investments by fair value hierarchy levels as of December 31, 2024:
| | | Level 1 | Level 2 | | Total | |
| Securities | | | | | | |
| Assets: | | | | | | |
| Agency Collateralized Mortgage Obligations | | $— | $5,471,005 | | $5,471,005 | |
| Agency Commercial Mortgage-Backed Securities | | — | 12,619,247 | | 12,619,247 | |
| Agency Mortgage-Backed Securities | | — | 64,717,759 | | 64,717,759 | |
| Collateralized Debt Obligations | | — | 41,320,242 | | 41,320,242 | |
| Corporate Bonds | | — | 220,969,953 | | 220,969,953 | |
| Government Agency Obligations | | — | 2,802,249 | | 2,802,249 | |
| Non-Agency Asset-Backed Securities | | — | 157,506,036 | | 157,506,036 | |
| Non-Agency Collateralized Mortgage Obligations | | — | 12,929,966 | | 12,929,966 | |
| Supranational Banks | | — | 198,375 | | 198,375 | |
| US Treasury Obligations | | — | 212,039,262 | | 212,039,262 | |
| Short-Term Investments | | 12,673,800 | — | | 12,673,800 | |
| Total Value of Securities | | $12,673,800 | $730,574,094 | | $743,247,894 | |
| |
| Derivatives1 | | | | | | |
| Liabilities: | | | | | | |
| Futures Contracts | | $(13,511) | $— | | $(13,511) | |
| |
| 1Futures contracts are valued at the unrealized appreciation (depreciation) on the instrument at the year end. |
During the year ended December 31, 2024, there were no transfers into or out of Level 3 investments. The Fund’s policy is to recognize transfers into or out of Level 3 investments based on fair value at the beginning of the reporting year.
A reconciliation of Level 3 investments is presented when the Fund has a significant amount of Level 3 investments at the beginning or end of the year in relation to the Fund’s net assets. As of December 31, 2024, there were no Level 3 investments.
4. Dividend and Distribution Information
Income and long-term capital gain distributions are determined in accordance with federal income tax regulations, which may differ from US GAAP. Additionally, distributions from net gains on foreign currency transactions and net short-term gains on sales of investment securities are treated as ordinary income for federal income tax purposes. The tax character of dividends and distributions paid during the years ended December 31, 2024 and 2023 were as follows:
| | Year ended |
| | 12/31/24 | | 12/31/23 |
| Ordinary income | $32,501,108 | | $18,568,692 |
In conjunction with the Reorganization described in Note 7, the Delaware Ivy Limited-Term Bond Fund inadvertently failed to distribute to its respective shareholders sufficient net capital gains for the taxable year ending on the Reorganization date as required by the Subchapter M of the Internal Revenue Code. In order to meet the distribution requirements under Subchapter M to maintain “RIC” status, the Fund paid a “deficiency dividend” as described in Section 860(f) of the Internal Revenue Code, in the amount of $148,336.
5. Components of Net Assets on a Tax Basis
As of December 31, 2024, the components of net assets on a tax basis were as follows:
| Shares of beneficial interest | $929,871,477 |
| Undistributed ordinary income | 1,582,748 |
| Distributions payable | (45,857) |
| Capital loss carryforwards | (189,789,897) |
| Deferred directors fees | (61,774) |
| Unrealized depreciation of investments, foreign currencies and derivatives | (4,838,875) |
| Net assets | $736,717,822 |
Differences between components of net assets unrealized and tax cost unrealized may arise due to unrealized appreciation/depreciation on foreign currency.
The differences between book basis and tax basis components of net assets are primarily attributable to tax deferral of losses on wash sales, mark-to-market of futures contracts, and tax treatment of market discount and premium on debt instruments.
For financial reporting purposes, capital accounts are adjusted to reflect the tax character of permanent book/tax differences. Reclassifications are primarily due to reorganization-related adjustments, deficiency dividend paid on behalf of Delaware Ivy Limited-Term Bond Fund, amortization on fixed income securities, payment by advisor tax treatment, and paydown gains
Notes to financial statements
Macquarie Limited-Term Diversified Income Fund
5. Components of Net Assets on a Tax Basis (continued)
(loss) of asset- and mortgage-back securities. Results of operations and net assets were not affected by these reclassifications. For the year ended December 31, 2024, the adjustments were to decrease total distributable earnings (loss) and increase paid-in capital by $41,818,484.
For federal income tax purposes, capital loss carryforwards may be carried forward and applied against future capital gains. At December 31, 2024, the Fund has capital loss carryforwards available to offset future realized capital gains as follows:
| | Loss carryforward character* | | |
| | Short-term | | Long-term | | Total |
| | $ (62,462,708) | | $(127,327,189) | | $ (189,789,897) |
* A portion of the Fund's capital loss carryforward is subject to limitations under the Internal Revenue Code and related regulations.
6. Capital Shares
Transactions in capital shares were as follows:
| | Year ended |
| | 12/31/24 | | 12/31/23 |
| Shares sold: |
| Class A | 8,428,483 | | 6,400,453 |
| Class C | 120,164 | | 268,208 |
| Class R | 10,174 | | 7,679 |
| Institutional Class | 17,562,965 | | 10,931,906 |
| Class R6 | 817,216 | | 3,136,214 |
|
| Shares from reorganization:1 |
| Class A | 5,334,824 | | 32,346,919 |
| Class C | 54,115 | | 784,886 |
| Class R | — | | 43,477 |
| Institutional Class | 5,007,996 | | 24,910,064 |
| Class R6 | 48,401 | | 476,853 |
|
| Shares issued upon reinvestment of dividends and distributions: |
| Class A | 2,034,662 | | 1,240,119 |
| Class C | 38,240 | | 34,645 |
| Class R | 4,917 | | 3,449 |
| Institutional Class | 1,819,088 | | 1,019,577 |
| Class R6 | 123,470 | | 88,507 |
| | 41,404,715 | | 81,692,956 |
| | Year ended |
| | 12/31/24 | | 12/31/23 |
|
| Shares redeemed: |
| Class A | (20,100,284) | | (13,062,921) |
| Class C | (653,120) | | (804,856) |
| Class R | (30,770) | | (11,275) |
| Institutional Class | (27,888,199) | | (20,168,147) |
| Class R6 | (1,085,388) | | (1,470,275) |
| | (49,757,761) | | (35,517,474) |
| Net increase (decrease) | (8,353,046) | | 46,175,482 |
Certain shareholders may exchange shares of one class for shares of another class in the same Fund. These exchange transactions are included as in shares sold and shares redeemed in the table on the previous page and on the “Statements of changes in net assets.” For the years ended December 31, 2024 and December 31, 2023, the Fund had the following exchange transactions:
| | | Exchange Redemptions | | Exchange Subscriptions | | | |
| | | Class A
Shares | | Class C
Shares | | Institutional
Class
Shares | | Class A
Shares | | Institutional
Class
Shares | | Class R6
Shares | | Value |
| Year ended | |
| 12/31/24 | | 57,272 | | 5,863 | | 15,119 | | 15,265 | | 57,289 | | 5,728 | | $610,898 |
| 12/31/23 | | 72,819 | | 7,353 | | 52,393 | | 15,631 | | 74,278 | | 42,754 | | 1,027,038 |
7. Reorganizations
On February 15-16, 2023, the Board approved a proposal to reorganize Delaware Ivy Limited-Term Bond Fund (the "Acquired Fund I"), a series of Ivy Funds, with and into the Fund (the “Acquiring Fund”), a series of the Trust (the “Reorganization I”). Pursuant to an Agreement and Plan of Reorganization (the “Plan I”): (i) all of the property, and assets of Acquired Fund I were acquired by the Acquiring Fund and (ii) the Trust, on behalf of Acquiring Fund, assumed the liabilities of Acquired Fund I, in exchange for shares of Acquiring Fund. In accordance with the Plan I, the Acquired Fund I liquidated and dissolved following the Reorganization I. In approving the Reorganization I, the Board considered various factors, including that the Acquiring Fund and the Acquired Fund I share similar investment objectives, principal investment strategies and principal risks, and materially identical fundamental investment restrictions and that the Acquiring Fund's overall total expense ratio is expected to be equal to or lower than the corresponding Acquired Fund I's total expense ratio following the Reorganization I taking into account applicable expense limitation arrangements. The Reorganization I was accomplished by a tax-free exchange of shares on September 15, 2023. For financial reporting purposes, assets received and shares issued by Acquiring Fund were recorded at fair value; however, the cost basis of the investments received from the Acquired Fund I was carried forward to align ongoing
Notes to financial statements
Macquarie Limited-Term Diversified Income Fund
7. Reorganizations (continued)
reporting of the Acquiring Fund’s realized and unrealized gains and losses with amounts distributable to shareholders for tax purposes.
The share transactions associated with September 15, 2023 for the Reorganization I were as follows:
| | Acquired
Fund I
Net Assets | | Acquired
Fund I
Shares
Outstanding | | Shares
Converted
to Acquiring
Fund | | Acquiring
Fund
Net Assets | | Conversion
Ratio |
| Class A | $246,784,159 | | 24,006,241 | | 32,346,919 | | $192,294,852 | | 1.3385 |
| Class C | 6,020,079 | | 585,611 | | 784,886 | | 7,917,537 | | 1.3403 |
| Class R | 333,903 | | 32,481 | | 43,477 | | 731,310 | | 1.3385 |
Class I/
Institutional Class | 191,309,290 | | 18,609,853 | | 24,910,064 | | 151,854,344 | | 1.3385 |
| Class R6 | 3,657,465 | | 355,785 | | 476,853 | | 20,905,819 | | 1.3403 |
| Class Y* | 1,640,177 | | 159,550 | | — | | — | | — |
* Class Y shares of the Acquired Fund I were converted into Class A shares of the Acquiring Fund.
The net assets of the Acquired Fund I before the Reorganization I were $450,538,440. The Acquired Fund I net assets and shares outstanding presented on the table above do not include the shareholders that did not participate in the Reorganization I. The net assets of the Acquiring Fund immediately following the Reorganization I were $824,242,301.
Assuming the Reorganization I had been completed on January 1, 2023, the Acquiring Fund's pro forma results of operations for the year ended December 31, 2023, would have been as follows:
| Net investment income | $25,039,362 |
| Net realized loss on investments | (16,493,714) |
| Net change in unrealized appreciation (depreciation) | 26,268,228 |
| Net increase in net assets resulting from operations | $34,813,876 |
On January 16, 2024, the Board approved a proposal to reorganize Delaware Ivy Government Securities Fund (the "Acquired Fund II"), a series of Ivy Funds, with and into the Fund (the “Acquiring Fund”), a series of the Trust (the “Reorganization II”). Pursuant to an Agreement and Plan of Reorganization (the “Plan II”): (i) all of the property, and assets of Acquired Fund II were acquired by the Acquiring Fund and (ii) the Trust, on behalf of Acquiring Fund, assumed the liabilities of Acquired Fund II, in exchange for shares of the Acquiring Fund. In accordance with the Plan II, the Acquired Fund II liquidated and dissolved following the Reorganization II. In approving the Reorganization II, the Board considered various factors, including that the Acquiring Fund and the Acquired Fund II share similar investment objectives, principal
investment strategies and principal risks, and materially identical fundamental investment restrictions and that the Acquiring Fund's overall total expense ratio is expected to be equal to or lower than the corresponding Acquired Fund II's total expense ratio following the Reorganization II taking into account applicable expense limitation arrangements. The Reorganization II was accomplished by a tax-free exchange of shares on April 26, 2024 for Reorganization II. For financial reporting purposes, assets received and shares issued by Acquiring Fund were recorded at fair value; however, the cost basis of the investments received from the Acquired Fund II was carried forward to align ongoing reporting of the Acquiring Fund’s realized and unrealized gains and losses with amounts distributable to shareholders for tax purposes.
The share transactions associated with April 26, 2024 for Reorganization II were as follows:
| | Acquired
Fund II
Net Assets | | Acquired
Fund II
Shares
Outstanding | | Shares
Converted
to Acquiring
Fund | | Acquiring
Fund
Net Assets | | Conversion
Ratio |
| Class A | $41,291,534 | | 8,956,949 | | 5,334,824 | | $393,285,953 | | 0.5956 |
| Class C | 418,852 | | 90,857 | | 54,115 | | 9,755,573 | | 0.5956 |
| Class R | — | | — | | — | | 1,092,828 | | — |
Class I/
Institutional Class | 38,761,886 | | 8,408,218 | | 5,007,996 | | 356,847,243 | | 0.5956 |
| Class R6 | 374,627 | | 81,264 | | 48,401 | | 23,042,422 | | 0.5956 |
The net assets of the Acquired Fund II before the Reorganization II were $81,016,171. The Acquired Fund II net assets and shares outstanding presented on the table above do not include the shareholders that did not participate in the Reorganization II. The net assets of the Acquiring Fund immediately following the Reorganization II were $864,870,918.
Assuming the Reorganization II had been completed on January 1, 2024, the Acquiring Fund’s pro forma results of operations for the year ended December 31, 2024, would have been as follows:
| Net investment income | $32,950,025 |
| Net realized loss on investments | (2,768,501) |
| Net change in unrealized appreciation (depreciation) | 2,225,117 |
| Net increase in net assets resulting from operations | $32,406,641 |
Because the combined investment portfolios have been managed as a single integrated portfolio since the acquisition was completed, it is not practical to separate the amounts of revenue and earnings of the Acquired Fund II that have been included in the Acquiring Fund II's “Statement of operations” since the Reorganization II was consummated on April 26, 2024 for Acquired Fund II.
Notes to financial statements
Macquarie Limited-Term Diversified Income Fund
8. Line of Credit
The Fund, along with certain other funds in the Macquarie Funds (Participants), is a participant in a $335,000,000 revolving line of credit (Agreement) intended to be used for temporary or emergency purposes as an additional source of liquidity to fund redemptions of investor shares. Under the Agreement, the Participants are charged an annual commitment fee of 0.15%, which is allocated across the Participants based on a weighted average of the respective net assets of each Participant. The Participants are permitted to borrow up to a maximum of one-third of their net assets under the Agreement. Each Participant is individually, and not jointly, liable for its particular advances, if any, under the line of credit. The line of credit available under the Agreement expired on October 28, 2024. This Agreement was extended to October 27, 2025.
The Fund had no amounts outstanding as of December 31, 2024, or at any time during the year then ended.
9. Derivatives
US GAAP requires disclosures that enable investors to understand: (1) how and why an entity uses derivatives; (2) how they are accounted for; and (3) how they affect an entity’s results of operations and financial position.
Futures Contracts — A futures contract is an agreement in which the writer (or seller) of the contract agrees to deliver to the buyer an amount of cash or securities equal to a specific dollar amount times the difference between the value of a specific security or index at the close of the last trading day of the contract and the price at which the agreement is made. The Fund may use futures contracts in the normal course of pursuing its investment objective. The Fund may invest in futures contracts to hedge its existing portfolio securities against fluctuations in value caused by changes in interest rates or market conditions. Upon entering into a futures contract, the Fund deposits cash or pledges US government securities to a broker, equal to the minimum “initial margin” requirements of the exchange on which the contract is traded. Subsequent payments are received from the broker or paid to the broker each day, based on the daily fluctuation in the value of the contract. These receipts or payments are known as “variation margin” and are recorded daily by the Fund as unrealized gains or losses until the contracts are closed. When the contracts are closed, the Fund records a realized gain or loss equal to the difference between the value of the contract at the time it was opened and the value at the time it was closed. Risks of entering into futures contracts include potential imperfect correlation between the futures contracts and the underlying securities and the possibility of an illiquid secondary market for these instruments. When investing in futures, there is reduced counterparty credit risk to the Fund because futures are exchange-traded and the exchange’s clearinghouse, as counterparty to all exchange-traded futures, guarantees against default. At December 31, 2024, the Fund posted $171,600 in cash as collateral for open futures contracts, which is included in “Cash collateral due from brokers” on the “Statement of assets and liabilities.” Open futures contracts, if any, are disclosed on the “Schedule of investments.”
During the year ended December 31, 2024, the Fund entered into futures contracts to hedge the Fund’s existing portfolio securities against fluctuations in value caused by changes in interest rates or market conditions.
Swap Contracts — The Fund may enter into CDS contracts in the normal course of pursuing its investment objective. The Fund may enter into CDS contracts in order to hedge against a credit event, to enhance total return or to gain exposure to certain securities or markets. Swap agreements are bilaterally negotiated agreements between a Fund and counterparty to exchange or swap investment cash flows, assets, foreign currencies or market-linked returns at specified, future intervals. Swap agreements are privately negotiated in the over-the-counter market (OTC swaps). If the OTC swap entered is one of the swaps identified by a relevant regulator as a swap that is required to be cleared, then it will be cleared through a third party, known as a central counterparty or derivatives clearing organization (centrally cleared swaps).
Credit Default Swaps. A CDS contract is a risk-transfer instrument through which one party (purchaser of protection) transfers to another party (seller of protection) the financial risk of a credit event (as defined in the CDS agreement), as it relates to a particular reference security or basket of securities (such as an index). In exchange for the protection offered by the seller of protection, the purchaser of protection agrees to pay the seller of protection a periodic amount at a stated rate that is applied to the notional amount of the CDS contract. In addition, an upfront payment may be made or received by the Fund in connection with an unwinding or assignment of a CDS contract. Upon the occurrence of a credit event, the seller of protection would pay the par (or other agreed-upon) value of the reference security (or basket of securities) to the counterparty. Credit events generally include, among others, bankruptcy, failure to pay, and obligation default.
During the year ended December 31, 2024, the Fund entered into CDS contracts as a seller of protection, as a hedge against credit events. Periodic payments (receipts) on such contracts are accrued daily and recorded as unrealized losses (gains) on swap contracts. Upon payment (receipt), such amounts are recorded as realized losses (gains) on swap contracts. Upfront payments made or received in connection with CDS contracts are amortized over the expected life of the CDS contracts as unrealized losses (gains) on swap contracts. The change in value of CDS contracts is recorded daily as unrealized appreciation or depreciation. A realized gain or loss is recorded upon a credit event (as defined in the CDS agreement) or the maturity or termination of the agreement. Initial margin and variation margin are posted to central counterparties for centrally cleared CDS basket trades, as determined by the applicable central counterparty. During the year ended December 31, 2024, the Fund did not enter into any CDS contracts as a purchaser of protection.
CDS contracts may involve greater risks than if the Fund had invested in the reference obligation directly. CDS contracts are subject to general market risk, liquidity risk, counterparty risk, and credit risk. The Fund’s maximum risk of loss from counterparty credit risk, either as the seller of protection or the buyer of protection, is the fair value of the contract. This risk is mitigated by (1) for bilateral swap contracts, having a netting arrangement between the Fund and the
Notes to financial statements
Macquarie Limited-Term Diversified Income Fund
9. Derivatives (continued)
counterparty and by the posting of collateral by the counterparty to the Fund to cover the Fund’s exposure to the counterparty, or (2) for cleared swaps, trading these instruments through a central counterparty. No CDS contracts were outstanding at December 31, 2024.
During the year ended December 31, 2024, the Fund entered into CDS contracts to gain exposure to certain securities or markets.
Fair values of derivative instruments as of December 31, 2024 were as follows:
| | | Liability Derivatives Fair Value |
Statement of assets and
liabilities location | | Interest
Rate
Contracts |
| Variation margin due to broker on futures contracts* | | $(13,511) |
*Includes cumulative appreciation (depreciation) of futures contracts from the date the contracts were opened through December 31, 2024. Only current day variation margin is reported on the Fund’s “Statement of assets and liabilities.”
The effect of derivative instruments on the “Statement of operations” for the year ended December 31, 2024 was as follows:
| | Net Realized Gain (Loss) on: |
| | Futures
Contracts | | Swap
Contracts | | Total |
| Interest rate contracts | $(1,165,052) | | $— | | $(1,165,052) |
| Credit contracts | — | | 91,587 | | 91,587 |
| Total | $(1,165,052) | | $91,587 | | $(1,073,465) |
| | Net Change in Unrealized Appreciation (Depreciation) on: |
| | Futures
Contracts |
| Interest rate contracts | $(1,585,612) |
The table below summarizes the average daily balance of derivative holdings by the Fund during the year ended December 31, 2024:
| | Long Derivative
Volume | Short Derivative
Volume |
| Futures contracts (average notional amount) | | 65,172,687 | | 20,935 |
| CDS contracts (average notional amount)* | | — | | 200,397 |
* Long represents buying protection and short represents selling protection.
10. Securities Lending
The Fund, along with other funds in the Macquarie Funds, may lend its securities pursuant to a security lending agreement (Lending Agreement) with The Bank of New York Mellon (BNY). At the time a security is loaned, the borrower must post collateral equal to the required percentage of the market value of the loaned security, including any accrued interest. The required percentage is: (1) 102% with respect to US securities and foreign securities that are denominated and payable in US dollars; and (2) 105% with respect to foreign securities. With respect to each loan, if on any business day the aggregate market value of securities collateral plus cash collateral held is less than the aggregate market value of the securities which are the subject of such loan, the borrower will be notified to provide additional collateral by the end of the following business day, which, together with the collateral already held, will be not less than the applicable initial collateral requirements for such security loan. If the aggregate market value of securities collateral and cash collateral held with respect to a security loan exceeds the applicable initial collateral requirement, upon the request of the borrower, BNY must return enough collateral to the borrower by the end of the following business day to reduce the value of the remaining collateral to the applicable initial collateral requirement for such security loan. As a result of the foregoing, the value of the collateral held with respect to a loaned security on any particular day, may be more or less than the value of the security on loan. The collateral percentage with respect to the market value of the loaned security is determined by the security lending agent.
Cash collateral received by the Fund is generally invested in an individual separate account. The investment guidelines permit each separate account to hold certain securities that would be considered eligible securities for a money market fund. Cash collateral received is generally invested in government securities; certain obligations issued by government sponsored enterprises; repurchase agreements collateralized by US Treasury securities; obligations issued by the central government of any Organization for Economic Cooperation and Development (OECD) country or its agencies, instrumentalities, or establishments; obligations of supranational organizations; commercial paper, notes, bonds, and other debt obligations; certificates of deposit, time deposits, and other bank obligations; certain money market funds; and asset-backed securities. The Fund can also accept US government securities and letters of credit (non-cash collateral) in connection with securities loans.
In the event of default or bankruptcy by the lending agent, realization and/or retention of the collateral may be subject to legal proceedings. In the event the borrower fails to return loaned securities and the collateral received is insufficient to cover the value of the loaned securities and provided such collateral shortfall is not the result of investment losses, the lending agent has agreed to pay the amount of the shortfall to the Fund or, at the discretion of the lending agent, replace the loaned securities. The Fund continues to record dividends or interest, as applicable, on the securities loaned and is subject to changes in value of the securities loaned that may occur during the term of the loan. The Fund has the right under the Lending Agreement to recover the securities from the borrower on demand. With respect to security loans collateralized by non-cash collateral, the Fund receives loan premiums paid by the borrower. With respect to
Notes to financial statements
Macquarie Limited-Term Diversified Income Fund
10. Securities Lending (continued)
security loans collateralized by cash collateral, the earnings from the collateral investments are shared among the Fund, the security lending agent, and the borrower. The Fund records security lending income net of allocations to the security lending agent and the borrower.
The Fund may incur investment losses as a result of investing securities lending collateral. This could occur if an investment in the collateral investment account defaulted or became impaired. Under those circumstances, the value of the Fund’s cash collateral account may be less than the amount the Fund would be required to return to the borrowers of the securities and the Fund would be required to make up for this shortfall.
During the year ended December 31, 2024, the Fund had no securities out on loan.
11. Credit and Market Risks
Investments in equity securities in general are subject to market risks that may cause their prices to fluctuate over time. Fluctuations in the value of equity securities in which the Fund invests will cause the NAV of the Fund to fluctuate.
When interest rates rise, fixed income securities (i.e. debt obligations) generally will decline in value. These declines in value are greater for fixed income securities with longer maturities or durations. Interest rate changes are influenced by a number of factors, such as government policy, monetary policy, inflation expectations, and the supply and demand of bonds. A fund may be subject to a greater risk of rising interest rates when interest rates are low or inflation rates are high or rising.
Some countries in which the Fund may invest require governmental approval for the repatriation of investment income, capital, or the proceeds of sales of securities by foreign investors. In addition, if there is deterioration in a country’s balance of payments or for other reasons, a country may impose temporary restrictions on foreign capital remittances abroad.
The securities exchanges of certain foreign markets are substantially smaller, less liquid, and more volatile than the major securities markets in the US. Consequently, acquisition and disposition of securities by the Fund may be inhibited. In addition, a significant portion of the aggregate market value of equity securities listed on the major securities exchanges in emerging markets is held by a smaller number of investors. This may limit the number of shares available for acquisition or disposition by the Fund.
The Fund invests a portion of its assets in high yield fixed income securities, which are securities rated lower than BBB- by Standard & Poor’s Financial Services LLC or Baa3 by Moody’s Investors Service, Inc., or similarly rated by another nationally recognized statistical rating organization. Investments in these higher yielding securities are generally accompanied by a greater degree of credit risk than higher rated securities. Additionally, lower rated securities may be more susceptible to adverse economic and competitive industry conditions than investment grade securities.
The Fund may invest in mortgage-backed and asset-backed securities. Mortgage-backed and asset-backed securities, like other fixed income securities, are subject to credit risk and interest rate risk, and may also be subject to prepayment risk and extension risk. Mortgage-backed and asset-backed securities can be highly sensitive to interest rate changes. As a result, small movements in interest rates can substantially impact the value and liquidity of these securities. Prepayment risk is the risk that the principal on mortgage-backed or asset-backed securities may be prepaid at any time, which will reduce the yield and market value of the securities and may cause the Fund to reinvest the proceeds in lower yielding securities. Extension risk is the risk that principal on mortgage-backed or asset-backed securities will be repaid more slowly than expected, which may reduce the proceeds available for reinvestment in higher yielding securities and may cause the security to experience greater volatility due to the extended maturity of the security. When interest rates rise, the value of mortgage-backed and asset-backed securities can be expected to decline. When interest rates go down, however, the value of these securities may not increase as much as other fixed income securities due to borrowers refinancing their loans at lower interest rates or prepaying their loans. In addition, mortgage-backed and asset-backed securities may decline in value, become more volatile, face difficulties in valuation, or experience reduced liquidity due to changes in general economic conditions. During periods of economic downturn, for example, underlying borrowers may not make timely payments on their loans and the value of property that secures the loans may decline in value such that it is worth less than the amount of the associated loans. If the collateral securing a mortgage-backed or asset-backed security is insufficient to repay the loan, the Fund could sustain a loss. Such risks generally will be heightened where a mortgage-backed or asset-backed security includes “subprime” loans. Although mortgage-backed securities are often supported by government guarantees or private insurance, there can be no guarantee that those obligations will be met. Furthermore, in certain economic conditions, loan servicers, loan originators and other participants in the market for mortgage-backed and other asset-backed securities may be unable to receive sufficient funding, impairing their ability to perform their obligations on the loans. Certain mortgage-backed or asset-backed securities may be more susceptible to these risks than other mortgage-backed, asset-backed, or fixed-income securities. For example, the Fund’s investments in CMOs, real estate mortgage investment conduits (REMICs), and stripped mortgage-backed securities are generally highly susceptible to interest rate risk, prepayment risk, and extension risk. At times, these investments may be difficult to value and/or illiquid. Some classes of CMOs and REMICs may have preference in receiving principal or interest payments relative to more junior classes. The market prices and yields of these junior classes will generally be more volatile than more senior classes and will be more susceptible to interest rate risk, prepayment risk, and extension risk than more senior classes. Stripped mortgage-backed securities that receive only payments of interest (IOs) will generally decrease in value if interest rates decline or prepayment rates increase. Stripped mortgage-backed securities that receive only payments of principal (POs) will generally decrease in value if interest rates increase or prepayment rates decrease.
Derivatives contracts, such as futures, forward foreign currency contracts, options, and swaps, may involve additional expenses (such as the payment of premiums) and are subject to significant loss, which may exceed amounts disclosed on the “Statement of assets and
Notes to financial statements
Macquarie Limited-Term Diversified Income Fund
11. Credit and Market Risks (continued)
liabilities”, if a security, index, reference rate, or other asset or market factor to which a derivatives contract is associated, moves in the opposite direction from what the portfolio manager anticipated. When used for hedging, the change in value of the derivatives instrument may also not correlate specifically with the currency, rate, or other risk being hedged, in which case a Fund may not realize the intended benefits. Derivatives contracts are also subject to the risk that the counterparty may fail to perform its obligations under the contract due to, among other reasons, financial difficulties (such as a bankruptcy or reorganization).
The Fund may invest up to 15% of its net assets in illiquid securities, which may include securities with contractual restrictions on resale, securities exempt from registration under Rule 144A promulgated under the Securities Act of 1933, as amended, and other securities which may not be readily marketable. The relative illiquidity of these securities may impair the Fund from disposing of them in a timely manner and at a fair price when it is necessary or desirable to do so. While maintaining oversight, the Board has delegated to DMC the day-to-day functions of determining whether individual securities are liquid for purposes of the Fund’s limitation on investments in illiquid securities. Securities eligible for resale pursuant to Rule 144A, which are determined to be liquid, are not subject to the Fund’s 15% limit on investments in illiquid securities. Rule 144A securities have been identified on the “Schedule of investments.”
12. Contractual Obligations
The Fund enters into contracts in the normal course of business that contain a variety of indemnifications. The Fund’s maximum exposure under these arrangements is unknown. However, the Fund has not had prior claims or losses pursuant to these contracts. Management has reviewed the Fund’s existing contracts and expects the risk of loss to be remote.
13. Subsequent Events
Management has determined that no material events or transactions occurred subsequent to December 31, 2024, that would require recognition or disclosure in the Fund’s financial statements.
Report of independent registered public accounting firm
To the Board of Trustees of Delaware Group Limited-Term Government Funds and Shareholders of Macquarie Limited-Term Diversified Income Fund
Opinion on the Financial Statements
We have audited the accompanying statement of assets and liabilities, including the schedule of investments, of Macquarie Limited-Term Diversified Income Fund (one of the funds constituting Delaware Group Limited-Term Government Funds, referred to hereafter as the “Fund”) as of December 31, 2024, the related statement of operations for the year ended December 31, 2024, the statement of changes in net assets for each of the two years in the period ended December 31, 2024, including the related notes, and the financial highlights for each of the five years in the period ended December 31, 2024 (collectively referred to as the “financial statements”). In our opinion, the financial statements present fairly, in all material respects, the financial position of the Fund as of December 31, 2024, the results of its operations for the year then ended, the changes in its net assets for each of the two years in the period ended December 31, 2024 and the financial highlights for each of the five years in the period ended December 31, 2024 in conformity with accounting principles generally accepted in the United States of America.
Basis for Opinion
These financial statements are the responsibility of the Fund’s management. Our responsibility is to express an opinion on the Fund’s financial statements based on our audits. We are a public accounting firm registered with the Public Company Accounting Oversight Board (United States) (PCAOB) and are required to be independent with respect to the Fund in accordance with the U.S. federal securities laws and the applicable rules and regulations of the Securities and Exchange Commission and the PCAOB.
We conducted our audits of these financial statements in accordance with the standards of the PCAOB. Those standards require that we plan and perform the audit to obtain reasonable assurance about whether the financial statements are free of material misstatement, whether due to error or fraud.
Our audits included performing procedures to assess the risks of material misstatement of the financial statements, whether due to error or fraud, and performing procedures that respond to those risks. Such procedures included examining, on a test basis, evidence regarding the amounts and disclosures in the financial statements. Our audits also included evaluating the accounting principles used and significant estimates made by management, as well as evaluating the overall presentation of the financial statements. Our procedures included confirmation of securities owned as of December 31, 2024 by correspondence with the custodian, transfer agents and brokers. We believe that our audits provide a reasonable basis for our opinion.
/s/PricewaterhouseCoopers LLP
Philadelphia, Pennsylvania
February 28, 2025
We have served as the auditor of one or more Macquarie investment companies since 2010.
Other Fund information (Unaudited)
Macquarie Limited-Term Diversified Income Fund
Tax Information
The information set forth below is for the Fund’s fiscal year as required by federal income tax laws. Shareholders, however, must report distributions on a calendar year basis for income tax purposes, which may include distributions for portions of two fiscal years of the Fund. Accordingly, the information needed by shareholders for income tax purposes will be sent to them in January of each year. Please consult your tax advisor for proper treatment of this information.
All disclosures are based on financial information available as of the date of this report and, accordingly are subject to change. For any and all items requiring reporting, it is the intention of the Fund to report the maximum amount permitted under the Internal Revenue Code and the regulations thereunder.
For the fiscal year ended December 31, 2024, the Fund reports distributions paid during the year as follows:
| (A) Ordinary Income Distributions (Tax Basis) | 100.00% |
(A) is based on a percentage of the Fund’s total distributions.
Changes in and Disagreements with Accountants for Open-End Management Investment Companies
Not applicable.
Proxy Disclosures for Open-End Management Investment Companies
Not applicable.
Remuneration Paid to Directors, Officers, and Others of Open-End Management Investment Companies
The aggregate remuneration paid to directors, officers, and others is disclosed within the financial statements.
Statement Regarding Basis of Approval for Investment Advisory Contract
Board Consideration of Investment Management Agreement and Sub-Advisory Agreements at a Meeting Held on August 13-15, 2024
At a meeting held on August 13-15, 2024 (the “Annual Contract Renewal Meeting”), the Board of Trustees (the “Board”), including a majority of Trustees each of whom is not an “interested person” as defined under the Investment Company Act of 1940 (the “Independent Trustees”), approved the renewal of the Delaware Limited-Term Diversified Income Fund (the “Fund”) Investment Management Agreement with Delaware Management Company (DMC) and the Sub-Advisory Agreements with Macquarie Investment Management Global Limited (MIMGL),
Macquarie Investment Management Austria Kapitalanlage AG (MIMAK) and Macquarie Investment Management Europe Limited (MIMEL) (together, the “Affiliated Sub-Advisers”).
Prior to the Annual Contract Renewal Meeting, including at a Board meeting held in May 2024, the Trustees conferred extensively among themselves and with representatives of DMC about these matters. Also, the Board was assisted by the Equity Investments Committee and the Fixed Income Multi-Asset Sub-Advised Funds Investments Committee (each an “Investment Committee” and together, the “Investment Committees”), with each Investment Committee assisting the full Board in reviewing investment performance and other matters throughout the year. The Independent Trustees were also assisted in their evaluation of the Investment Management Agreement and the Sub-Advisory Agreements by independent legal counsel, from whom they received separate legal advice and with whom they met separately.
In providing information to the Board, DMC was guided by a detailed set of requests for information submitted to them by independent legal counsel on behalf of the Independent Trustees at the start of the Board’s annual contract renewal process earlier in 2024. Prior to the Annual Contract Renewal Meeting, and in response to the requests, the Board received and reviewed materials specifically relating to the renewal of the Investment Management Agreement and the Sub-Advisory Agreements. In considering and approving the Investment Management Agreement and the Sub-Advisory Agreements, the Trustees considered the information they believed relevant, including but not limited to the information discussed below. The Board considered not only the specific information presented in connection with the Annual Contract Renewal Meeting and the review process for the Investment Management Agreement and the Sub-Advisory Agreements, but also the knowledge gained over time through interaction with DMC about various topics. In this regard, the Board reviewed reports of DMC at each of its quarterly meetings, which included information about, among other things, Fund performance, investment strategies, and expenses. In addition, the Investment Committees confer with portfolio managers at various times throughout the year. In considering information relating to the approval of the Fund’s Investment Management Agreement and the Sub-Advisory Agreements, the Independent Trustees also received information from an independent fund consultant, JDL Consultants, LLC (JDL).
The Board did not identify any particular information or consideration that was all-important or controlling, and each individual Trustee may have attributed different weights to various factors.
After its deliberations, the Board, including the Independent Trustees, unanimously approved the continuation of the Investment Management Agreement and the Sub-Advisory Agreements for a one-year term. The following summarizes a number of important, but not necessarily all of the, factors considered by the Board in support of its approval.
Nature, extent, and quality of services. The Board received and considered various information regarding the nature, extent, and quality of the advisory services provided to the Fund by DMC under its Investment Management Agreement and the experience of the officers and employees of DMC who provide these services, including the Fund’s portfolio managers. The Board met with DMC’s senior management and investment personnel. The Board reviewed the materials provided by the Fund’s portfolio management team discussing its performance, investment strategies and outlook, as well as DMC with respect to comparing Fund performance
Other Fund information (Unaudited)
Macquarie Limited-Term Diversified Income Fund
Statement Regarding Basis of Approval for Investment Advisory Contract (continued)
Board Consideration of Investment Management Agreement and Sub-Advisory Agreements at a Meeting Held on August 13-15, 2024 (continued)
to the performance of a comparable group of mutual funds, relevant benchmarks, and performance metrics, as applicable. The Board’s review included consideration of DMC’s investment oversight and research and analysis capabilities, and its ability to attract and retain skilled investment professionals. The Board also considered information regarding DMC’s programs for risk management, including investment, operational, liquidity, derivatives (as applicable), valuation and compliance risks and its plans for enhancing those programs (including through the allocation of additional resources and enhancements to existing processes and testing). The Board received information with respect to the cybersecurity program and business continuity plans of DMC and its affiliates, as well as information from Macquarie Group Ltd. (Macquarie), the parent company of DMC, regarding Macquarie’s commitment to the US mutual fund business.
In addition, the Board considered certain non-advisory services that DMC and its affiliates provide to the fund complex. Among other things, these services include third party service provider oversight, transfer agency, internal audit, pricing and valuation, portfolio trading, and legal and compliance functions. The Board noted DMC’s responsibility for overseeing: the preparation of the Fund’s prospectus, summary prospectus, statement of additional information, and shareholder reports; responsibility for other periodic filings with regulators; organizing Board meetings and preparing materials for such Board meetings; and furnishing analytical and other support to assist the Board.
The Board took into account the benefits to shareholders of investing in a Fund that is part of a family of funds managed by an affiliate of Macquarie, and the resources available to DMC as part of Macquarie’s global asset management business.
The Board received and considered various information with respect to the services provided by the Affiliated Sub-Advisers under the Sub-Advisory Agreements and the credentials and experience of the officers and employees of the Affiliated Sub-Advisers who provide these services. The Board considered the division of responsibilities between DMC and the Affiliated Sub-Advisers and the oversight provided by DMC. The Board also considered the expertise of the Affiliated Sub-Advisers with respect to certain asset classes and/or investment styles. The Board noted that the Affiliated Sub-Advisers are part of Macquarie’s global investment platform that has offices and personnel that are located around the world. These Affiliated Sub-Advisers provide research, investment and trading analysis on the markets and economies of various countries in which the Fund may invest, make recommendations regarding securities, provide portfolio management services and assist with security trades, as applicable. The Board took into account that the Sub-Advisory Agreements may benefit the Fund and its shareholders by permitting DMC to use the resources and talents of the Affiliated Sub-Advisers in managing the Fund.
The Board also received and considered information about the nature and extent of services offered and fee rates charged by DMC to other types of clients with investment strategies similar
to those of the Fund. In this regard, the Board received information about the significantly greater scope of services, and compliance, reporting and other legal and regulatory obligations and risks of managing registered investment companies compared with those associated with managing assets of other types of clients, including third-party sub-advised fund clients, unregistered funds and separately managed accounts.
The Board concluded that, overall, it was satisfied with the nature, extent and quality of services provided (and expected to be provided) to the Fund by DMC and the Affiliated Sub-Advisers.
Investment performance. The Board received and considered information with respect to the investment performance of the Fund, including performance reports and discussions with portfolio managers at meetings of the Board’s Investment Committees throughout the year as well as reports provided by Broadridge Financial Solutions, Inc., an independent investment company data provider (Broadridge), furnished for the Annual Contract Renewal Meeting. The Broadridge reports prepared for the Fund’s institutional share class showed its investment performance in comparison to the institutional share class of a group of similar funds (the “Performance Universe”). The Board received a description of the methodology used to select the peer funds in the Performance Universe. Comparative annualized performance for the Fund was shown for the past 1-, 3-, 5-, and 10-year or since inception periods, as applicable, ended December 31, 2023.
The Performance Universe for the Fund consisted of the Fund and all retail and institutional short-intermediate investment-grade debt funds, regardless of asset size or primary channel of distribution. The Board noted that the Broadridge report comparison showed that the Fund’s total return for the 1- year period was in the third quartile of its Performance Universe, for the 3-year period was in the first quartile of its Performance Universe, and for the 5- and 10-year periods was in the second quartile of its Performance Universe. The Broadridge report comparison showed that the Fund’s total return for the 1-year period was below the median of its Performance Universe and for the 3-, 5-, and 10-year periods was above the median of its Performance Universe. The Board also noted that the Fund outperformed its benchmark index for the 1-, 3-, 5-, and 10-year periods. The Board noted that the Fund was generally performing in line with its Performance Universe and benchmark index during the periods under review. The Board noted that subsequent to the periods under review, the Fund’s portfolio management team changed as of May 2024 and that it would continue to evaluate the Fund’s performance.
Comparative expenses. The Board received and considered expense data for the Fund. DMC provided the Board with information on pricing levels and fee structures for the Fund as of its most recently completed fiscal year. The Broadridge total expenses (reflecting any applicable fee waivers and/or expense reimbursements), for comparative consistency, were shown by Broadridge for Institutional Class shares, including 12b-1 and non-12b-1service fees (as applicable). The Board also considered the comparative analysis of contractual management fees and actual total expense ratios of the Fund versus contractual management fees and actual total expense ratios of a group of peer funds as selected by Broadridge (the “Expense Group”). The Fund’s total expenses were also compared with those of its Expense Universe, which is comprised of the Fund, its Expense Group and all other similar with an institutional share class (i.e., funds without 12b-1 fees and non-12b-1 service fees) with assets equal to or greater than
Other Fund information (Unaudited)
Macquarie Limited-Term Diversified Income Fund
Statement Regarding Basis of Approval for Investment Advisory Contract (continued)
Board Consideration of Investment Management Agreement and Sub-Advisory Agreements at a Meeting Held on August 13-15, 2024 (continued)
$100 million, excluding outliers (the “Expense Universe”). In reviewing comparative costs, the Fund’s contractual management fee and the actual management fee incurred by the Fund were compared with the contractual management fees (assuming all funds in the Expense Group were similar in size to the Fund) and actual management fees, taking into account any applicable breakpoints and fee waivers and/or expense reimbursements, with the Fund’s Expense Universe.
The Board also received and considered information regarding the Fund’s net operating expense ratios and their various components, including actual management fees, custodian and other non-management fees, and Rule 12b-1 and non-Rule 12b-1 shareholder service fees.
The expense comparisons for the Fund showed that its actual management fee was below the median of its Expense Universe and its actual total expenses were below its Expense Group average. It was noted that consistent with DMC’s waiver methodology, its advisory fee waivers, if any, were at the fund level and not class level.
The Board noted that DMC, and not the Fund, pays the sub-advisory fees to the Affiliated Sub-Advisers and, accordingly, that the retention of the Affiliated Sub-Advisers does not increase the fees and expenses incurred by the Fund.
Based on its consideration of the factors and information it deemed relevant, including those described here, the Board determined that the compensation payable to DMC under the Investment Management Agreement and to the Affiliated Sub-Advisers under the Sub-Advisory Agreements was reasonable.
Economies of scale. The Board received and considered information about the potential for DMC to realize economies of scale in the provision of management services to the Fund, the difficulties of calculating economies of scale at an individual Fund level, and the extent to which potential scale benefits are shared with shareholders, including the extent to which any economies of scale are reflected in the level of management fees charged. DMC discussed its advisory fee pricing and structure for the complex, including the current breakpoints. The Board considered the continuation and/or implementation of contractual fee waivers and/or expense reimbursements, as applicable. The Board noted that, as of March 31, 2024, the Fund’s net assets exceeded its first breakpoint level and that breakpoints result in a lower advisory fee than would otherwise be the case in the absence of breakpoints, when the asset levels specified in the breakpoints schedule are exceeded. The Board noted that the Fund may also benefit from economies of scale through initial fee setting, fee waivers and expense reimbursements, as well as DMC’s investment in its business, including investments in business infrastructure, technology and cybersecurity.
Management profitability. The Board received and considered the Investment Management Profitability Analysis that addressed the overall profitability of DMC’s business in providing management and other services to the Fund and the complex as a whole, including the
methodology used by DMC in allocating costs for the purpose of determining profitability. The Board also reviewed a report prepared by JDL regarding DMC’s profitability as compared to certain peer fund complexes and the Independent Trustees discussed DMC’s profitability in such context with representatives from JDL. The Board recognized that calculating and comparing profitability at the individual fund level is difficult; that DMC’s profit, if any, can vary significantly depending on the particular fund; and that DMC’s support for, and commitment to, a fund is not solely dependent on the profits realized as to that fund.
The Board also received and considered information about the portion of the total management fee that was retained by DMC after payment of the fee to the Affiliated Sub-Advisers for sub-advisory services. In assessing the reasonableness of this amount, the Board received and evaluated information about the nature and extent of the responsibilities retained and risk assumed by DMC and not delegated to or assumed by the Affiliated Sub-Advisers. Given the affiliation between DMC and the Affiliated Sub-Advisers, the Board ascribed limited relevance to the allocation of fees between them.
Based on its review, the Board determined that DMC’s profitability was not excessive in light of the nature, extent and quality of the services provided to the Fund.
Ancillary benefits. The Board received and considered information regarding the extent to which DMC and its affiliates might derive ancillary benefits from fund operations, including the potential for procuring additional business as a result of the prestige and visibility associated with its role as investment manager to the complex; the benefits from allocation of fund brokerage to improve trading efficiencies; the portfolio transactions executed through “soft dollar” arrangements; and the fees that various affiliates received for serving as transfer agent and for overseeing fund accounting and financial administration services to the complex. The Board considered that it receives periodic reports from DMC that include a representation that any soft dollar arrangements are consistent with regulatory requirements. The Board received information from DMC regarding its view of the performance of its affiliates in providing transfer agent and fund accounting and financial administration oversight services and the organizational structure employed to provide these services pursuant to their contracts with the Fund.
Based on its consideration of the factors and information it deemed relevant, including the costs of providing investment management and other services to the Fund and the ongoing commitment of DMC and its affiliates to the Fund, the Board did not find that any ancillary benefits received by DMC and its affiliates, including the Affiliated Sub-Advisers, were unreasonable.
Conclusion. Based on its review, consideration and evaluation of all factors it believed relevant, including the above-described factors and conclusions, the Board, including all of the Independent Trustees, unanimously approved the continuation of DMC’s Investment Management Agreement and of the Affiliated Sub-Advisers’ Sub-Advisory Agreements for an additional one-year period.
Contact information
Shareholder assistance by phone
800 523-1918, weekdays from 8:30am to
6:00pm ET
For securities dealers and financial
institutions representatives only
800 362-7500
Regular mail
Macquarie Funds
P.O. Box 534437
Pittsburgh, PA 15253-4437
Overnight courier service
Macquarie Funds
Attention: 534437
500 Ross Street, 154-0520
Pittsburgh, PA 15262
Macquarie Asset Management • 610 Market Street • Philadelphia, PA 19106-2354
Macquarie Asset Management (MAM) is the asset management division of Macquarie Group. MAM is an integrated asset manager across public and private markets offering a diverse range of capabilities, including real assets, real estate, credit, equities, and multi-asset solutions.
The Fund is advised by Delaware Management Company, a series of MIMBT, a US registered investment adviser, and distributed by Delaware Distributors, L.P. (DDLP), an affiliate of MIMBT and Macquarie Group Limited.
Other than Macquarie Bank Limited ABN 46 008 583 542 (“Macquarie Bank”), any Macquarie Group entity noted in this document is not an authorized deposit-taking institution for the purposes of the Banking Act 1959 (Commonwealth of Australia). The obligations of these other Macquarie Group entities do not represent deposits or other liabilities of Macquarie Bank. Macquarie Bank does not guarantee or otherwise provide assurance in respect of the obligations of these other Macquarie Group entities. In addition, if this document relates to an investment, (a) the investor is subject to investment risk including possible delays in repayment and loss of income and principal invested and (b) none of Macquarie Bank or any other Macquarie Group entity guarantees any particular rate of return on or the performance of the investment, nor do they guarantee repayment of capital in respect of the investment.
The Fund is governed by US laws and regulations.
This page is not part of the Financial statements and other information.
Fixed income mutual fund
Macquarie Tax-Free Oregon Fund
(formerly, Delaware Tax-Free Oregon Fund)
Financial statements and other information
For the year ended December 31, 2024
This report and the financial statements contained herein are submitted for the general information of the shareholders of the Fund. This report is not authorized for distribution to prospective investors in the Fund unless preceded or accompanied by an effective prospectus.
Form N-PORT and proxy voting information
The Fund files its complete schedule of portfolio holdings with the Securities and Exchange Commission (SEC) for the first and third quarters of each fiscal year on Form N-PORT. The Fund’s Form N-PORT, as well as a description of the policies and procedures that the Fund uses to determine how to vote proxies (if any) relating to portfolio securities, is available without charge (i) upon request, by calling 800 523-1918; and (ii) on the SEC’s website at sec.gov. In addition, a description of the policies and procedures that the Fund uses to determine how to vote proxies (if any) relating to portfolio securities and the Schedule of Investments included in the Fund’s most recent Form N-PORT are available without charge on the Fund’s website at macquarie.com/mam/literature.
Information (if any) regarding how the Fund voted proxies relating to portfolio securities during the most recently disclosed 12-month period ended June 30 is available without charge (i) through the Fund’s website at macquarie.com/mam/proxy; and (ii) on the SEC’s website at sec.gov.
Schedule of investments
| Macquarie Tax-Free Oregon Fund | December 31, 2024 |
| | | Principal
amount° | Value (US $) |
| Municipal Bonds — 97.47% |
| Education Revenue Bonds — 5.43% |
| Oregon State Facilities Authority Revenue | | | |
| (Metro East Web Academy Project) | | | |
| Series A 144A 5.00% 6/15/39 # | | 500,000 | $ 488,420 |
| Series A 144A 5.00% 6/15/49 # | | 500,000 | 463,425 |
(Willamette University Projects)
Series A 4.00% 10/1/51 | | 500,000 | 418,405 |
| Oregon State University Revenue | | | |
| Series A 4.25% 4/1/52 | | 750,000 | 751,687 |
| University of Oregon General Revenue | | | |
| Series A 3.50% 4/1/52 (BAM) | | 1,000,000 | 861,360 |
| | 2,983,297 |
| Electric Revenue Bonds — 3.57% |
| City of Eugene, Oregon Electric Utility System Revenue | | | |
| 5.00% 8/1/49 | | 1,000,000 | 1,075,320 |
| Guam Power Authority Revenue | | | |
(Tax-Exempt Forward Delivery)
Series A 5.00% 10/1/44 | | 250,000 | 260,140 |
| Puerto Rico Electric Power Authority Revenue | | | |
| Series A 6.75% 7/1/36 ‡ | | 240,000 | 130,200 |
| Series TT 5.00% 7/1/32 ‡ | | 380,000 | 206,150 |
| Series XX 5.25% 7/1/40 ‡ | | 535,000 | 290,238 |
| | 1,962,048 |
| Healthcare Revenue Bonds — 17.05% |
| Astoria Hospital Facilities Authority Revenue | | | |
(Columbia Memorial Hospital Project)
5.25% 8/1/54 | | 1,000,000 | 1,051,460 |
City of Medford, Oregon Hospital Facility Authority
Revenue | | | |
(Asante Projects)
Series A 3.00% 8/15/50 (AGM) | | 1,000,000 | 763,830 |
| Clackamas County Hospital Facility Authority Revenue | | | |
(Rose Villa Project)
Series A 5.375% 11/15/55 | | 500,000 | 492,190 |
| Medford Hospital Facilities Authority Revenue | | | |
(Asante Projects)
Series A 5.00% 8/15/37 | | 500,000 | 529,985 |
| Oregon Health & Science University Revenue | | | |
(Green Bonds)
Series A 4.00% 7/1/51 | | 1,175,000 | 1,134,157 |
Schedule of investments
Macquarie Tax-Free Oregon Fund
| | | Principal
amount° | Value (US $) |
| Municipal Bonds (continued) |
| Healthcare Revenue Bonds (continued) |
| Oregon State Facilities Authority Revenue | | | |
| (Samaritan Health Services Project) | | | |
| Series A 5.00% 10/1/40 | | 500,000 | $ 514,540 |
| Series A 5.00% 10/1/46 | | 500,000 | 496,770 |
| Salem, Oregon Hospital Facility Authority Revenue | | | |
(Capital Manor Project)
4.00% 5/15/47 | | 865,000 | 733,727 |
| (Salem Health Projects) | | | |
| Series A 4.00% 5/15/41 | | 960,000 | 923,270 |
| Series A 4.00% 5/15/49 | | 310,000 | 291,453 |
| Series A 5.00% 5/15/39 | | 555,000 | 583,605 |
| Union County, Oregon Hospital Facility Authority Revenue | | | |
| (Grande Ronde Hospital Project) | | | |
| 5.00% 7/1/40 | | 100,000 | 102,703 |
| 5.00% 7/1/41 | | 535,000 | 547,471 |
| 5.00% 7/1/47 | | 500,000 | 505,795 |
| Yamhill County, Oregon Hospital Authority Revenue | | | |
(Friendsview)
Series A 5.00% 11/15/56 | | 840,000 | 699,569 |
| | 9,370,525 |
| Housing Revenue Bonds — 5.89% |
| Home Forward Multifamily Housing Revenue | | | |
(Gretchen Kafoury Commons)
5.00% 1/1/29 | | 300,000 | 300,354 |
Oregon State Housing & Community Services Department
Revenue | | | |
| (Single-Family Mortgage Program) | | | |
| Series A 4.60% 7/1/44 | | 1,175,000 | 1,179,947 |
| Series A 4.75% 1/1/49 | | 1,000,000 | 1,007,400 |
| Series C 4.55% 1/1/46 (GNMA) | | 750,000 | 748,522 |
| | 3,236,223 |
| Industrial Development Revenue/Pollution Control Revenue Bond — 1.45% |
Children's Trust Fund Revenue, Commonwealth of Puerto
Rico | | | |
(Tobacco Settlement Asset-Backed)
Series A 0.564% 5/15/57 ^ | | 12,000,000 | 795,600 |
| | 795,600 |
| Local General Obligation Bonds — 21.00% |
| City of Bend, Oregon | | | |
| 5.00% 6/1/54 | | 500,000 | 537,615 |
| | | Principal
amount° | Value (US $) |
| Municipal Bonds (continued) |
| Local General Obligation Bonds (continued) |
| City of Boardman, Oregon | | | |
(Green Bonds)
2.125% 6/15/45 (BAM) | | 500,000 | $ 310,235 |
| City of Cannon Beach, Oregon | | | |
| 5.00% 6/1/49 | | 500,000 | 531,080 |
| City of Eugene, Oregon | | | |
(Parks & Recreation Facility Projects)
Series A 5.00% 6/1/42 | | 335,000 | 365,478 |
| City of Medford, Oregon | | | |
| Series A 2.00% 6/1/33 | | 350,000 | 292,492 |
| City of Newport, Oregon | | | |
| Series B 12.101% 6/1/29 (AGC) ^ | | 1,225,000 | 1,049,470 |
| City of Portland, Oregon | | | |
(Transportation Projects)
Series A 3.00% 10/1/33 | | 300,000 | 287,289 |
| Clackamas & Washington Counties School District No 3 | | | |
| Series A 1.779% 6/15/35 ^ | | 1,250,000 | 814,462 |
Clackamas County School District No. 35 Molalla River,
Oregon | | | |
| 5.25% 6/15/54 | | 1,000,000 | 1,094,990 |
Deschutes County Administrative School District No. 1
Bend-La Pine, Oregon | | | |
| 4.00% 6/15/45 | | 250,000 | 245,728 |
| Hillsboro School District No. 1J | | | |
| 4.00% 6/15/40 | | 775,000 | 779,627 |
| Jackson County School District No. 5 Ashland, Oregon | | | |
| 4.00% 6/15/37 | | 350,000 | 356,318 |
Linn County Community School District No. 9 Lebanon,
Oregon | | | |
| 5.50% 6/15/27 (NATL) | | 1,000,000 | 1,059,890 |
Multnomah County, Oregon School District No. 1 Portland,
Oregon | | | |
| 3.00% 6/15/34 | | 500,000 | 472,280 |
| Multnomah County, Oregon School District No. 40 | | | |
| Series A 5.157% 6/15/51 ^ | | 5,000,000 | 1,311,600 |
Multnomah-Clackamas Counties Centennial School District
No. 28JT | | | |
| 4.00% 6/15/38 | | 1,050,000 | 1,063,954 |
Washington & Multnomah Counties Beaverton School
District No. 48J | | | |
| Series A 4.478% 6/15/40 ^ | | 750,000 | 374,137 |
Schedule of investments
Macquarie Tax-Free Oregon Fund
| | | Principal
amount° | Value (US $) |
| Municipal Bonds (continued) |
| Local General Obligation Bonds (continued) |
Washington & Multnomah Counties Beaverton School
District No. 48J | | | |
(Current Interest Bonds)
Series B 5.00% 6/15/52 | | 560,000 | $ 594,804 |
| | 11,541,449 |
| Special Tax Revenue Bonds — 15.97% |
| Commonwealth of Puerto Rico Revenue | | | |
| 1.711% 11/1/51 ^ | | 83,673 | 51,982 |
| 3.391% 11/1/43 ^ | | 990,097 | 607,672 |
(Subordinate)
2.202% 11/1/51 ^ | | 976,576 | 522,468 |
| GDB Debt Recovery Authority of Puerto Rico Revenue | | | |
(Taxable)
7.50% 8/20/40 | | 1,167,115 | 1,145,514 |
| Oregon State Bond Bank Revenue | | | |
| Series A 5.00% 1/1/32 | | 250,000 | 254,640 |
Oregon State Department of Administrative Services
Lottery Revenue | | | |
(Tax-exempt Projects)
Series A 5.00% 4/1/44 | | 1,000,000 | 1,094,740 |
| Puerto Rico Sales Tax Financing Revenue | | | |
| (Restructured) | | | |
| Series A-1 4.75% 7/1/53 | | 2,325,000 | 2,294,519 |
| Series A-1 5.563% 7/1/46 ^ | | 1,255,000 | 405,892 |
| Series A-1 6.263% 7/1/51 ^ | | 1,939,000 | 455,258 |
Tri-County Metropolitan Transportation District of Oregon
Revenue | | | |
| Series A 5.00% 9/1/38 | | 500,000 | 533,855 |
| (Sustainability Bonds) | | | |
| Series A 3.00% 9/1/37 | | 405,000 | 364,982 |
| Series A 4.00% 9/1/41 | | 795,000 | 799,476 |
(Unrefunded)
Series A 4.00% 9/1/40 | | 245,000 | 244,603 |
| | 8,775,601 |
| State General Obligation Bonds — 5.13% |
| Commonwealth of Puerto Rico | | | |
| (Restructured) | | | |
| Series A-1 4.00% 7/1/41 | | 250,000 | 236,685 |
| Series A-1 4.00% 7/1/46 | | 500,000 | 465,035 |
| | | Principal
amount° | Value (US $) |
| Municipal Bonds (continued) |
| State General Obligation Bonds (continued) |
| Oregon State | | | |
(Article XI-M and XI-N Seismic Grant Programs)
Series C 5.00% 6/1/41 | | 650,000 | $ 710,554 |
(Article XI-Q State Projects)
Series A 5.25% 5/1/45 | | 1,000,000 | 1,109,120 |
(Higher Education)
Series F 5.00% 8/1/43 | | 275,000 | 296,252 |
| | 2,817,646 |
| Transportation Revenue Bonds — 13.53% |
| Oregon State Department of Transportation Revenue | | | |
| 5.00% 5/15/39 | | 500,000 | 561,135 |
(Senior Lien)
Series A 5.25% 11/15/47 | | 1,000,000 | 1,092,120 |
| (Subordinate) | | | |
| Series A 4.00% 11/15/38 | | 800,000 | 811,848 |
| Series A 5.00% 11/15/39 | | 110,000 | 118,909 |
| Port of Portland Oregon Airport Revenue | | | |
| Series 28 4.00% 7/1/47 (AMT) | | 555,000 | 517,937 |
| Series 28 5.00% 7/1/52 (AMT) | | 250,000 | 258,750 |
| (Green Bonds) | | | |
| 5.25% 7/1/41 (AMT) | | 750,000 | 806,985 |
| Series 29 5.50% 7/1/53 (AMT) | | 1,500,000 | 1,615,440 |
| Series 30A 5.25% 7/1/54 (AMT) | | 1,000,000 | 1,058,930 |
Puerto Rico Industrial, Tourist, Educational, Medical &
Environmental Control Facilities Financing Authority Revenue | | | |
(San Juan Cruise Terminal Project)
Series A-3 6.75% 1/1/46 (AMT) | | 500,000 | 594,935 |
| | 7,436,989 |
| Water & Sewer Revenue Bonds — 8.45% |
| City of Eugene, Oregon Water Utility System Revenue | | | |
| 5.00% 8/1/41 | | 300,000 | 327,783 |
| 5.00% 8/1/52 | | 500,000 | 532,410 |
City of Hermiston, Oregon Water & Sewer System
Revenue | | | |
| 5.00% 11/1/34 (AGM) | | 500,000 | 500,365 |
| City of Portland, Oregon Sewer System Revenue | | | |
| (Second Lien) | | | |
| Series A 5.00% 12/1/42 | | 1,000,000 | 1,090,980 |
| Series A 5.00% 12/1/47 | | 550,000 | 591,635 |
Schedule of investments
Macquarie Tax-Free Oregon Fund
| | | Principal
amount° | Value (US $) |
| Municipal Bonds (continued) |
| Water & Sewer Revenue Bonds (continued) |
| Medford Water Commission Revenue | | | |
| 5.00% 7/15/54 | | 500,000 | $ 537,210 |
| Tualatin Valley Water District Revenue | | | |
| 5.00% 6/1/54 | | 1,000,000 | 1,067,150 |
| | 4,647,533 |
| Total Municipal Bonds (cost $53,769,529) | 53,566,911 |
|
|
|
| Short-Term Investments — 1.28% |
| Variable Rate Demand Note — 1.28%¤ |
| Oregon State Facilities Authority Refunding Revenue | | | |
(PeaceHealth) Series B 3.80% 8/1/34
(LOC - TD Bank, N.A.) | | 700,000 | 700,000 |
| Total Short-Term Investments (cost $700,000) | 700,000 |
Total Value of Securities—98.75%
(cost $54,469,529) | | | $54,266,911 |
| ° | Principal amount shown is stated in USD unless noted that the security is denominated in another currency. |
| # | Security exempt from registration under Rule 144A of the Securities Act of 1933, as amended. At December 31, 2024, the aggregate value of Rule 144A securities was $951,845, which represents 1.73% of the Fund’s net assets. See Note 9 in “Notes to financial statements.” |
| ‡ | Non-income producing security. Security is currently in default. |
| ^ | Zero-coupon security. The rate shown is the effective yield at the time of purchase. |
| ¤ | Tax-exempt obligations that contain a floating or variable interest rate adjustment formula and an unconditional right of demand to receive payment of the unpaid principal balance plus accrued interest upon a short notice period (generally up to 30 days) prior to specified dates either from the issuer or by drawing on a bank letter of credit, a guarantee, or insurance issued with respect to such instrument. Each rate shown is as of December 31, 2024. |
| Summary of abbreviations: |
| AGC – Insured by Assured Guaranty Corporation |
| AGM – Insured by Assured Guaranty Municipal Corporation |
| AMT – Subject to Alternative Minimum Tax |
| BAM – Insured by Build America Mutual Assurance |
| GNMA – Government National Mortgage Association |
| LOC – Letter of Credit |
| N.A. – National Association |
| Summary of abbreviations: (continued) |
| NATL – Insured by National Public Finance Guarantee Corporation |
| SOFR – Secured Overnight Financing Rate |
| SOFR01M – Secured Overnight Financing Rate 1 Month |
| SOFR03M – Secured Overnight Financing Rate 3 Month |
| USD – US Dollar |
See accompanying notes, which are an integral part of the financial statements.
Statement of assets and liabilities
| Macquarie Tax–Free Oregon Fund | December 31, 2024 |
| Assets: | |
| Investments, at value* | $54,266,911 |
| Cash | 215,633 |
| Interest receivable | 604,249 |
| Receivable for fund shares sold | 38,661 |
| Prepaid expenses | 6,177 |
| Other assets | 279 |
| Total Assets | 55,131,910 |
| Liabilities: | |
| Payable for fund shares redeemed | 115,995 |
| Investment management fees payable to affiliates | 20,599 |
| Other accrued expenses | 20,206 |
| Accounting and administration expenses payable to affiliates | 11,227 |
| Distribution fees payable to affiliates | 5,692 |
| Distribution payable | 2,909 |
| Total Liabilities | 176,628 |
| Total Net Assets | $54,955,282 |
|
| Net Assets Consist of: | |
| Paid-in capital | $56,269,377 |
| Total distributable earnings (loss) | (1,314,095) |
| Total Net Assets | $54,955,282 |
|
| Net Asset Value | |
|
| Class A: | |
| Net assets | $26,652,500 |
| Shares of beneficial interest outstanding, unlimited authorization, no par | 2,167,239 |
| Net asset value per share | $12.30 |
| Sales charge | 4.50% |
| Offering price per share, equal to net asset value per share / (1 - sales charge) | $12.88 |
|
| Institutional Class: | |
| Net assets | $28,302,782 |
| Shares of beneficial interest outstanding, unlimited authorization, no par | 2,304,869 |
| Net asset value per share | $12.28 |
*Investments, at cost | $54,469,529 |
See accompanying notes, which are an integral part of the financial statements.
Statement of operations
| Macquarie Tax–Free Oregon Fund | Year ended December 31, 2024 |
| Investment Income: | |
| Interest | $2,169,794 |
|
| Expenses: | |
| Management fees | 284,013 |
| Distribution expenses — Class A | 76,291 |
| Audit and tax fees | 47,474 |
| Accounting and administration expenses | 43,996 |
| Dividend disbursing and transfer agent fees and expenses | 34,030 |
| Reports and statements to shareholders expenses | 18,424 |
| Registration fees | 15,199 |
| Legal fees | 3,413 |
| Trustees’ fees | 2,295 |
| Custodian fees | 909 |
| Other | 14,921 |
| | 540,965 |
| Less expenses waived | (130,633) |
| Less expenses paid indirectly | (993) |
| Total operating expenses | 409,339 |
| Net Investment Income (Loss) | 1,760,455 |
|
| Net Realized and Unrealized Gain (Loss): | |
| Net realized gain (loss) on investments | (124,007) |
| Net change in unrealized appreciation (depreciation) on investments | (307,234) |
| Net Realized and Unrealized Gain (Loss) | (431,241) |
| Net Increase (Decrease) in Net Assets Resulting from Operations | $1,329,214 |
See accompanying notes, which are an integral part of the financial statements.
Statements of changes in net assets
Macquarie Tax-Free Oregon Fund
| | Year ended |
| | 12/31/24 | | 12/31/23 |
| Increase (Decrease) in Net Assets from Operations: | | | |
| Net investment income (loss) | $1,760,455 | | $1,553,536 |
| Net realized gain (loss) | (124,007) | | (1,676) |
| Net change in unrealized appreciation (depreciation) | (307,234) | | 1,207,928 |
| Net increase (decrease) in net assets resulting from operations | 1,329,214 | | 2,759,788 |
|
| Dividends and Distributions to Shareholders from: | | | |
| Distributable earnings: | | | |
| Class A | (1,008,967) | | (1,076,666) |
| Institutional Class | (751,488) | | (476,870) |
| | (1,760,455) | | (1,553,536) |
|
| Capital Share Transactions (See Note 6): | | | |
| Proceeds from shares sold: | | | |
| Class A | 1,555,114 | | 2,478,290 |
| Institutional Class | 17,418,510 | | 9,809,945 |
|
| Net asset value of shares issued upon reinvestment of dividends and distributions: | | | |
| Class A | 947,170 | | 993,490 |
| Institutional Class | 751,488 | | 476,870 |
| | 20,672,282 | | 13,758,595 |
| Cost of shares redeemed: | | | |
| Class A | (8,610,659) | | (4,514,681) |
| Institutional Class | (4,747,741) | | (6,034,942) |
| | (13,358,400) | | (10,549,623) |
| Increase in net assets derived from capital share transactions | 7,313,882 | | 3,208,972 |
| Net Increase in Net Assets | 6,882,641 | | 4,415,224 |
|
| Net Assets: | | | |
| Beginning of year | 48,072,641 | | 43,657,417 |
| End of year | $54,955,282 | | $48,072,641 |
See accompanying notes, which are an integral part of the financial statements.
Financial highlights
Macquarie Tax-Free Oregon Fund Class A
Selected data for each share of the Fund outstanding throughout each period were as follows:
| |
| |
Net asset value, beginning of period
|
| |
| Income (loss) from investment operations: |
Net investment income1
|
Net realized and unrealized gain (loss)
|
Total from investment operations
|
| |
| Less dividends and distributions from: |
Net investment income
|
Total dividends and distributions
|
| |
Net asset value, end of period
|
| |
Total return2
|
| |
| Ratios and supplemental data: |
Net assets, end of period (000 omitted)
|
Ratio of expenses to average net assets
|
Ratio of expenses to average net assets prior to fees waived
|
Ratio of net investment income to average net assets
|
Ratio of net investment income to average net assets prior to fees waived
|
Portfolio turnover
|
| 1 | Calculated using average shares outstanding. |
| 2 | Total return is based on the change in net asset value of a share during the period and assumes reinvestment of dividends and distributions at net asset value and does not reflect the impact of a sales charge. Total return during the period presented reflects waivers by the manager and/or distributor (as applicable). Performance would have been lower had the waivers not been in effect. |
See accompanying notes, which are an integral part of the financial statements.
| Year ended |
| 12/31/24 | | 12/31/23 | | 12/31/22 | | 12/31/21 | | 12/31/20 |
| $12.39 | | $12.05 | | $13.76 | | $13.71 | | $13.42 |
| |
| | | | | | | | | |
| 0.41 | | 0.39 | | 0.36 | | 0.33 | | 0.33 |
| (0.09) | | 0.34 | | (1.71) | | 0.05 | | 0.29 |
| 0.32 | | 0.73 | | (1.35) | | 0.38 | | 0.62 |
| |
| | | | | | | | | |
| (0.41) | | (0.39) | | (0.36) | | (0.33) | | (0.33) |
| (0.41) | | (0.39) | | (0.36) | | (0.33) | | (0.33) |
| |
| $12.30 | | $12.39 | | $12.05 | | $13.76 | | $13.71 |
| |
| 2.61% | | 6.26% | | (9.86%) | | 2.82% | | 4.70% |
| |
| | | | | | | | | |
| $26,652 | | $32,933 | | $33,102 | | $36,216 | | $38,295 |
| 0.89% | | 0.90% | | 0.90% | | 0.90% | | 0.91% |
| 1.15% | | 1.19% | | 1.19% | | 1.18% | | 1.19% |
| 3.31% | | 3.29% | | 2.86% | | 2.40% | | 2.46% |
| 3.05% | | 3.00% | | 2.57% | | 2.12% | | 2.18% |
| 26% | | 25% | | 44% | | 12% | | 25% |
Financial highlights
Macquarie Tax-Free Oregon Fund Institutional Class
Selected data for each share of the Fund outstanding throughout each period were as follows:
| |
| |
Net asset value, beginning of period
|
| |
| Income (loss) from investment operations: |
Net investment income1
|
Net realized and unrealized gain (loss)
|
Total from investment operations
|
| |
| Less dividends and distributions from: |
Net investment income
|
Total dividends and distributions
|
| |
Net asset value, end of period
|
| |
Total return2
|
| |
| Ratios and supplemental data: |
Net assets, end of period (000 omitted)
|
Ratio of expenses to average net assets
|
Ratio of expenses to average net assets prior to fees waived
|
Ratio of net investment income to average net assets
|
Ratio of net investment income to average net assets prior to fees waived
|
Portfolio turnover
|
| 1 | Calculated using average shares outstanding. |
| 2 | Total return is based on the change in net asset value of a share during the period and assumes reinvestment of dividends and distributions at net asset value. Total return during the period presented reflects waivers by the manager. Performance would have been lower had the waivers not been in effect. |
See accompanying notes, which are an integral part of the financial statements.
| Year ended |
| 12/31/24 | | 12/31/23 | | 12/31/22 | | 12/31/21 | | 12/31/20 |
| $12.37 | | $12.03 | | $13.73 | | $13.69 | | $13.40 |
| |
| | | | | | | | | |
| 0.44 | | 0.42 | | 0.39 | | 0.36 | | 0.37 |
| (0.09) | | 0.34 | | (1.70) | | 0.04 | | 0.29 |
| 0.35 | | 0.76 | | (1.31) | | 0.40 | | 0.66 |
| |
| | | | | | | | | |
| (0.44) | | (0.42) | | (0.39) | | (0.36) | | (0.37) |
| (0.44) | | (0.42) | | (0.39) | | (0.36) | | (0.37) |
| |
| $12.28 | | $12.37 | | $12.03 | | $13.73 | | $13.69 |
| |
| 2.87% | | 6.53% | | (9.58%) | | 3.00% | | 4.96% |
| |
| | | | | | | | | |
| $28,303 | | $15,140 | | $10,555 | | $4,949 | | $3,559 |
| 0.64% | | 0.65% | | 0.65% | | 0.65% | | 0.66% |
| 0.90% | | 0.94% | | 0.94% | | 0.93% | | 0.94% |
| 3.56% | | 3.54% | | 3.14% | | 2.65% | | 2.71% |
| 3.30% | | 3.25% | | 2.85% | | 2.37% | | 2.43% |
| 26% | | 25% | | 44% | | 12% | | 25% |
Notes to financial statements
| Macquarie Tax-Free Oregon Fund | December 31, 2024 |
Delaware Group® Limited-Term Government Funds (Trust) is organized as a Delaware statutory trust and offers two series: Macquarie Limited-Term Diversified Income Fund (formerly, Delaware Limited-Term Diversified Income Fund through December 30, 2024) and Macquarie Tax-Free Oregon Fund (formerly, Delaware Tax-Free Oregon Fund through December 30, 2024). These financial statements and the related notes pertain to Macquarie Tax-Free Oregon Fund (Fund). The Trust is an open-end investment company. The Fund is considered diversified under the Investment Company Act of 1940, as amended (1940 Act), and offers Class A and Institutional Class shares. Class A shares are sold with a maximum front-end sales charge of 4.50%. There is no front-end sales charge when you purchase $250,000 or more of Class A shares. However, if Delaware Distributors, L.P. (DDLP) paid your financial intermediary a commission on your purchase of $250,000 or more of Class A shares, you will have to pay a limited contingent deferred sales charge (Limited CDSC) of 1.00% if you redeem these shares within the first 18 months after your purchase, unless a specific waiver of the Limited CDSC applies. Institutional Class shares are not subject to a sales charge and are offered for sale exclusively to certain eligible investors.
1. Significant Accounting Policies
The Fund follows accounting and reporting guidance under Financial Accounting Standards Board (FASB) Accounting Standards Codification Topic 946, Financial Services — Investment Companies. The following accounting policies are in accordance with US generally accepted accounting principles (US GAAP) and are consistently followed by the Fund.
Security Valuation — Fixed income securities are generally priced based upon valuations provided by an independent pricing service or broker in accordance with methodologies included within Delaware Management Company (DMC)’s Pricing Policy (the Policy). Fixed income security valuations are then reviewed by DMC as part of its duties as the Fund’s valuation designee (Valuation Designee) and, to the extent required by the Policy and applicable regulation, fair valued consistent with the Policy. To the extent current market prices are not available, the pricing service may take into account developments related to the specific security, as well as transactions in comparable securities. Valuations for fixed income securities utilize matrix systems, which reflect such factors as security prices, yields, maturities, and ratings, and are supplemented by dealer and exchange quotations. Investments for which market quotations are not readily available are valued at fair value as determined in good faith pursuant to Rule 2a-5 under the 1940 Act (Rule 2a-5). As a general principle, the fair value of a security or other asset is the price that would be received to sell an asset or paid to transfer a liability in an orderly transaction between market participants at the measurement date. Pursuant to Rule 2a-5, the Board of Trustees (Board) has designated DMC as the Valuation Designee for the Fund to perform the fair value determination relating to all applicable Fund investments. DMC has established a Pricing Committee to assist with its designated responsibilities as Valuation Designee, and DMC may carry out its designated responsibilities as Valuation Designee through the Pricing Committee and other teams and committees, which operate under policies and procedures approved by the Board and subject to the Board’s oversight. Fair value pricing may
be used more frequently for securities traded primarily in non-US markets. In considering whether fair valuation is required and in determining fair values, the Valuation Designee may, among other things, consider significant events (which may be considered to include changes in the value of US securities or securities indexes) that occur after the close of the relevant market and before the close of the New York Stock Exchange. The Valuation Designee may utilize modeling tools provided by third-party vendors to determine fair values of non-US securities.
Federal Income Taxes — No provision for federal income taxes has been made as the Fund intends to continue to qualify for federal income tax purposes as a regulated investment company under Subchapter M of the Internal Revenue Code of 1986, as amended, and make the requisite distributions to shareholders. The Fund evaluates tax positions taken or expected to be taken in the course of preparing the Fund’s tax returns to determine whether the tax positions are “more-likely-than-not” of being sustained by the applicable tax authority. Tax positions not deemed to meet the “more-likely-than-not” threshold are recorded as a tax benefit or expense in the current year. Management has analyzed the Fund’s tax positions taken or expected to be taken on the Fund’s federal income tax returns through the year ended December 31, 2024, and for all open tax years (years ended December 31, 2021–December 31, 2023), and has concluded that no provision for federal income tax is required in the Fund’s financial statements. If applicable, the Fund recognizes interest and tax penalties on unrecognized tax benefits in “Interest and tax penalties” on the “Statement of operations.” During the year ended December 31, 2024, the Fund did not incur any interest or tax penalties.
Class Accounting — Investment income and common expenses are allocated to the various classes of the Fund on the basis of “settled shares” of each class in relation to the net assets of the Fund. Realized and unrealized gain (loss) on investments are allocated to the various classes of the Fund on the basis of daily net assets of each class. Distribution expenses relating to a specific class are charged directly to that class.
Use of Estimates — The preparation of financial statements in conformity with US GAAP requires management to make estimates and assumptions that affect the fair value of investments, the reported amounts of assets and liabilities and disclosure of contingent assets and liabilities at the date of the financial statements, and the reported amounts of revenues and expenses during the reporting period. Actual results could differ from those estimates and the differences could be material.
Other — Expenses directly attributable to the Fund are charged directly to the Fund. Other expenses common to various funds within the Macquarie Funds (formerly, Delaware Funds by Macquarie®) are generally allocated among such funds on the basis of average net assets. Management fees and certain other expenses are paid monthly. Security transactions are recorded on the date the securities are purchased or sold (trade date) for financial reporting purposes. Costs used in calculating realized gains and losses on the sale of investment securities are those of the specific securities sold. Interest income is recorded on an accrual basis. Discounts and premiums on debt securities are accreted or amortized to interest income, respectively, over the lives of the respective securities using the effective interest method.
Notes to financial statements
Macquarie Tax-Free Oregon Fund
1. Significant Accounting Policies (continued)
Premiums on callable debt securities are amortized to interest income to the earliest call date using the effective interest method. The Fund declares dividends daily from net investment income and pays the dividends monthly and declares and pays distributions from net realized gain on investments, if any, at least annually. The Fund may distribute more frequently, if necessary for tax purposes. Dividends and distributions, if any, are recorded on the ex-dividend date.
In November 2023, FASB issued Accounting Standards Update 2023-07, Segment Reporting (Topic 280): Improvements to Reportable Segment Disclosures, with the intent of improving reportable segment disclosure requirements, primarily through enhanced disclosures about significant segment expenses, allowing financial statement users to better understand the components of a segment’s profit or loss and assess potential future cash flows for each reportable segment and the entity as a whole thereby enabling better understanding of how an entity’s segments impact overall performance. DMC, the Fund’s investment adviser, acts as the Fund’s chief operating decision maker (CODM), assessing performance and making decisions about resource allocation. The CODM has determined that the Fund has a single operating segment since the Fund has a single investment strategy disclosed in the prospectus against which the CODM assesses performance. When assessing segment performance and making decisions about segment resources, the CODM relies on the Fund’s portfolio composition, total returns, expense ratios and changes in net assets which are consistent with the information contained in the Fund’s financial statements. Adoption of the new standard impacted the Fund’s financial statements note disclosures only, and did not affect the Fund’s financial position or the results of its operations.
The Fund receives earnings credits from its custodian when positive cash balances are maintained, which may be used to offset custody fees. The expenses paid under this arrangement are included on the “Statement of operations” under “Custodian fees” with the corresponding expenses offset included under “Less expenses paid indirectly.” For the year ended December 31, 2024, the Fund earned $888 under this arrangement.
The Fund receives earnings credits from its transfer agent when positive cash balances are maintained, which may be used to offset transfer agent fees. If the amount earned is greater than $1, the expenses paid under this arrangement are included on the “Statement of operations” under “Dividend disbursing and transfer agent fees and expenses” with the corresponding expenses offset included under “Less expenses paid indirectly.” For the year ended December 31, 2024, the Fund earned $105 under this arrangement.
2. Investment Management, Administration Agreements, and Other Transactions with Affiliates
In accordance with the terms of its investment management agreement, the Fund pays DMC, a series of Macquarie Investment Management Business Trust (MIMBT) and the investment manager, an annual fee which is calculated daily and paid monthly at the rates of 0.55% on the
first $500 million of average daily net assets of the Fund, 0.50% on the next $500 million, 0.45% on the next $1.5 billion, and 0.425% on average daily net assets in excess of $2.5 billion.
Effective May 1, 2024, DMC has contractually agreed to waive all or a portion of its investment advisory fee and/or pay/reimburse expenses (excluding any distribution and service (12b-1) fees, acquired fund fees and expenses, taxes, interest, short sale dividend and interest expenses, brokerage fees, certain insurance costs, and nonroutine expenses or costs, including, but not limited to, those relating to reorganizations, litigation, conducting shareholder meetings, and liquidations), in order to prevent total annual fund operating expenses from exceeding 0.63% of the Fund’s average daily net assets. Prior to May 1, 2024, DMC contractually agreed to waive all or portion of its investment advisory fees and/or pay/reimburse expenses to 0.65% of the Fund’s average daily net assets. These waivers and reimbursements may only be terminated by agreement of DMC and the Fund. The waivers and reimbursements are accrued daily and received monthly.
After consideration of class specific expenses, including 12b-1 fees, the class level operating expense limitation as a percentage of average daily net assets from May 1, 2024 through April 30, 2025, unless terminated by agreement of DMC and the Fund, is as follows:
| | Operating expense limitation as a percentage of average daily net assets |
| | Class A | | Institutional Class |
| | 0.88%* | | 0.63%* |
| * | Prior to May 1, 2024, these amounts for Class A and Institutional Class shares were 0.90% and 0.65%, respectively. |
Delaware Investments Fund Services Company (DIFSC), an affiliate of DMC, provides fund accounting and financial administrative oversight services to the Fund. For these services, DIFSC’s fees are calculated daily and paid monthly, based on the aggregate daily net assets of all funds within the Macquarie Funds at the following annual rates: 0.0050% of the first $60 billion; 0.00475% of the next $30 billion; and 0.0015% of aggregate average daily net assets in excess of $90 billion (Total Fee). Each fund in the Macquarie Funds pays a minimum of $4,000, which, in aggregate, is subtracted from the Total Fee. Each fund then pays its portion of the remainder of the Total Fee on a relative net asset value (NAV) basis. This amount is included on the “Statement of operations” under “Accounting and administration expenses.” For the year ended December 31, 2024, the Fund paid $6,328 for these services.
DIFSC is also the transfer agent and dividend disbursing agent of the Fund. For these services, DIFSC’s fees are calculated daily and paid monthly, based on the aggregate daily net assets of the retail funds within the Macquarie Funds at the following annual rates: 0.014% of the first $20 billion; 0.011% of the next $5 billion; 0.007% of the next $5 billion; 0.004% of the next $20 billion; 0.002% of the next $25 billion; and 0.0015% of average daily net assets in excess of $75 billion. The fees payable to DIFSC under the shareholder services agreement described above are allocated among all retail funds in the Macquarie Funds on a relative NAV basis. This amount is included on the “Statement of operations” under “Dividend disbursing and transfer
Notes to financial statements
Macquarie Tax-Free Oregon Fund
2. Investment Management, Administration Agreements, and Other Transactions with Affiliates (continued)
agent fees and expenses.” For the year ended December 31, 2024, the Fund paid $3,340 for these services. Pursuant to a sub-transfer agency agreement between DIFSC and BNY Mellon Investment Servicing (US) Inc. (BNYIS), BNYIS provides certain sub-transfer agency services to the Fund. Sub-transfer agency fees are paid by the Fund and are also included on the “Statement of operations” under “Dividend disbursing and transfer agent fees and expenses.” The fees are calculated daily and paid as invoices on a monthly or quarterly basis.
Pursuant to a distribution agreement and distribution plan, the Fund pays DDLP, the distributor and an affiliate of DMC, an annual 12b-1 fee of 0.25% of the average daily net assets of the Class A shares. The fees are calculated daily and paid monthly. Institutional Class shares do not pay 12b-1 fees.
As provided in the investment management agreement, the Fund bears a portion of the cost of certain resources shared with DMC, including the cost of internal personnel of DMC and/or its affiliates that provide legal and regulatory reporting services to the Fund. For the year ended December 31, 2024, the Fund paid $1,921 for internal legal and regulatory reporting services provided by DMC and/or its affiliates’ employees. This amount is included on the “Statement of operations” under “Legal fees.”
For the year ended December 31, 2024, DDLP earned $1,003 commissions on sales of the Fund's Class A shares.
Trustees’ fees include expenses accrued by the Fund for each Trustee’s retainer and meeting fees. Certain officers of DMC, DIFSC, and DDLP are officers and/or Trustees of the Trust. These officers and Trustees are paid no compensation by the Fund.
MIMBT, of which DMC is a series, entered into a settlement agreement on September 19, 2024 with the US Securities and Exchange Commission (SEC) consenting to an order (Settlement Order) relating to a legacy investment strategy, the Absolute Return Mortgage-Backed Securities Strategy (ARMBS Strategy). MIMBT no longer offers the ARMBS Strategy. MIMBT agreed to the Settlement Order without admitting or denying the SEC’s findings. The Settlement Order does not impact MIMBT’s ability to continue to provide services to the Fund.
3. Investments
For the year ended December 31, 2024, the Fund made purchases and sales of investment securities other than short-term investments and US government securities as follows:
| Purchases | $20,989,351 |
| Sales | 13,196,226 |
The tax cost of investments includes adjustments to net unrealized appreciation (depreciation) which may not necessarily be the final tax cost basis adjustments but which approximate the tax basis unrealized gains and losses that may be realized and distributed to shareholders. At
December 31, 2024, the cost and unrealized appreciation (depreciation) of investments for federal income tax purposes for the Fund were as follows:
| Cost of investments | $54,491,320 |
| Aggregate unrealized appreciation of investments | $1,069,193 |
| Aggregate unrealized depreciation of investments | (1,293,602) |
| Net unrealized depreciation of investments | $(224,409) |
US GAAP defines fair value as the price that the Fund would receive to sell an asset or pay to transfer a liability in an orderly transaction between market participants at the measurement date under current market conditions. A three-level hierarchy for fair value measurements has been established based upon the transparency of inputs to the valuation of an asset or liability. Inputs may be observable or unobservable and refer broadly to the assumptions that market participants would use in pricing the asset or liability. Observable inputs reflect the assumptions market participants would use in pricing the asset or liability based on market data obtained from sources independent of the reporting entity. Unobservable inputs reflect the reporting entity’s own assumptions about the assumptions that market participants would use in pricing the asset or liability based on the best information available under the circumstances. The Fund’s investment in its entirety is assigned a level based upon the observability of the inputs which are significant to the overall valuation. The three-level hierarchy of inputs is summarized as follows:
Level 1 − Inputs are quoted prices in active markets for identical investments. (Examples: equity securities, open-end investment companies, futures contracts, and exchange-traded options contracts)
Level 2 − Other observable inputs, including, but not limited to: quoted prices for similar assets or liabilities in markets that are active, quoted prices for identical or similar assets or liabilities in markets that are not active, inputs other than quoted prices that are observable for the assets or liabilities (such as interest rates, yield curves, volatilities, prepayment speeds, loss severities, credit risks, and default rates) or other market-corroborated inputs. (Examples: debt securities, government securities, swap contracts, forward foreign currency exchange contracts, foreign securities utilizing international fair value pricing, broker-quoted securities, and fair valued securities)
Level 3 − Significant unobservable inputs, including the Fund’s own assumptions used to determine the fair value of investments. (Examples: broker-quoted securities and fair valued securities)
Level 3 investments are valued using significant unobservable inputs. The Fund may also use an income-based valuation approach in which the anticipated future cash flows of the investment are discounted to calculate fair value. Discounts may also be applied due to the nature or duration of any restrictions on the disposition of the investments. Valuations may also be based upon current market prices of securities that are comparable in coupon, rating, maturity, and industry. The derived value of a Level 3 investment may not represent the value which is received upon disposition and this could impact the results of operations.
Notes to financial statements
Macquarie Tax-Free Oregon Fund
3. Investments (continued)
The following table summarizes the valuation of the Fund’s investments by fair value hierarchy levels as of December 31, 2024:
| | Level 2 |
| Securities | |
| Assets: | |
| Municipal Bonds | $53,566,911 |
| Short-Term Investments | 700,000 |
| Total Value of Securities | $54,266,911 |
During the year ended December 31, 2024, there were no transfers into or out of Level 3 investments. The Fund’s policy is to recognize transfers into or out of Level 3 investments based on fair value at the beginning of the reporting year.
A reconciliation of Level 3 investments is presented when the Fund has a significant amount of Level 3 investments at the beginning or end of the year in relation to the Fund’s net assets. As of December 31, 2024, there were no Level 3 investments.
4. Dividend and Distribution Information
Income and long-term capital gain distributions are determined in accordance with federal income tax regulations, which may differ from US GAAP. Additionally, distributions from net short-term gains on sales of investment securities are treated as ordinary income for federal income tax purposes. The tax character of dividends and distributions paid during the years ended December 31, 2024 and 2023 were as follows:
| | Year ended |
| | 12/31/24 | | 12/31/23 |
| Tax-exempt income | $1,703,538 | | $1,514,196 |
| Ordinary income | 56,917 | | 39,340 |
| Total | $1,760,455 | | $1,553,536 |
5. Components of Net Assets on a Tax Basis
As of December 31, 2024, the components of net assets on a tax basis were as follows:
| Shares of beneficial interest | $56,269,377 |
| Undistributed tax-exempt income | 3,082 |
| Capital loss carryforwards | (1,089,859) |
| Other temporary differences | (2,909) |
| Unrealized appreciation of investments | (224,409) |
| Net assets | $54,955,282 |
|
The differences between book basis and tax basis components of net assets are primarily attributable to tax deferral of losses on wash sales.
For financial reporting purposes, capital accounts are adjusted to reflect the tax character of permanent book/tax differences. Results of operations and net assets were not affected by these reclassifications. For the year ended December 31, 2024, the Fund had no reclassifications.
For federal income tax purposes, capital loss carryforwards may be carried forward and applied against future capital gains. At December 31, 2024, the the Fund has capital loss carryforwards available to offset future realized capital gains are as follows:
| | Loss carryforward character | | |
| | Short-term | | Long-term | | Total |
| | $ (612,924) | | $(476,935) | | $ (1,089,859) |
6. Capital Shares
Transactions in capital shares were as follows:
| | Year ended |
| | 12/31/24 | | 12/31/23 |
| Shares sold: |
| Class A | 126,423 | | 203,347 |
| Institutional Class | 1,405,929 | | 810,793 |
|
| Shares issued upon reinvestment of dividends and distributions: |
| Class A | 76,631 | | 82,879 |
| Institutional Class | 60,823 | | 39,881 |
| | 1,669,806 | | 1,136,900 |
|
| Shares redeemed: |
| Class A | (693,396) | | (376,627) |
| Institutional Class | (385,451) | | (504,611) |
| | (1,078,847) | | (881,238) |
| Net increase | 590,959 | | 255,662 |
Certain shareholders may exchange shares of one class for shares of another class in the same Fund. These exchange transactions are included in shares sold and shares redeemed in the table above and on the “Statements of changes in net assets.” For the years ended December 31, 2024 and 2023, the Fund had the following exchange transactions:
| | | Exchange Redemptions | | Exchange Subscriptions | | |
| | | Class A
Shares | | Institutional
Class
Shares | | Value |
| Year ended | |
| 12/31/24 | | 1,469 | | 1,472 | | $18,471 |
| 12/31/23 | | 1,535 | | 1,538 | | 17,377 |
Notes to financial statements
Macquarie Tax-Free Oregon Fund
7. Line of Credit
The Fund, along with certain other funds in the Macquarie Funds (Participants), is a participant in a $335,000,000 revolving line of credit (Agreement) intended to be used for temporary or emergency purposes as an additional source of liquidity to fund redemptions of investor shares. Under the Agreement, the Participants are charged an annual commitment fee of 0.15%, which is allocated across the Participants based on a weighted average of the respective net assets of each Participant. The Participants are permitted to borrow up to a maximum of one-third of their net assets under the Agreement. Each Participant is individually, and not jointly, liable for its particular advances, if any, under the line of credit. The line of credit available under the Agreement expired on October 28, 2024. This Agreement was extended to October 27, 2025.
The Fund had no amounts outstanding as of December 31, 2024, or at any time during the year then ended.
8. Securities Lending
The Fund, along with other funds in the Macquarie Funds, may lend its securities pursuant to a security lending agreement (Lending Agreement) with The Bank of New York Mellon (BNY). At the time a security is loaned, the borrower must post collateral equal to the required percentage of the market value of the loaned security, including any accrued interest. The required percentage is: (1) 102% with respect to US securities and foreign securities that are denominated and payable in US dollars; and (2) 105% with respect to foreign securities. With respect to each loan, if on any business day the aggregate market value of securities collateral plus cash collateral held is less than the aggregate market value of the securities which are the subject of such loan, the borrower will be notified to provide additional collateral by the end of the following business day, which, together with the collateral already held, will be not less than the applicable initial collateral requirements for such security loan. If the aggregate market value of securities collateral and cash collateral held with respect to a security loan exceeds the applicable initial collateral requirement, upon the request of the borrower, BNY must return enough collateral to the borrower by the end of the following business day to reduce the value of the remaining collateral to the applicable initial collateral requirement for such security loan. As a result of the foregoing, the value of the collateral held with respect to a loaned security on any particular day, may be more or less than the value of the security on loan. The collateral percentage with respect to the market value of the loaned security is determined by the security lending agent.
Cash collateral received by the Fund is generally invested in an individual separate account. The investment guidelines permit each separate account to hold certain securities that would be considered eligible securities for a money market fund. Cash collateral received is generally invested in government securities; certain obligations issued by government sponsored enterprises; repurchase agreements collateralized by US Treasury securities; obligations issued by the central government of any Organization for Economic Cooperation and Development (OECD) country or its agencies, instrumentalities, or establishments; obligations of supranational
organizations; commercial paper, notes, bonds, and other debt obligations; certificates of deposit, time deposits, and other bank obligations; certain money market funds; and asset-backed securities. The Fund can also accept US government securities and letters of credit (non-cash collateral) in connection with securities loans.
In the event of default or bankruptcy by the lending agent, realization and/or retention of the collateral may be subject to legal proceedings. In the event the borrower fails to return loaned securities and the collateral received is insufficient to cover the value of the loaned securities and provided such collateral shortfall is not the result of investment losses, the lending agent has agreed to pay the amount of the shortfall to the Fund or, at the discretion of the lending agent, replace the loaned securities. The Fund continues to record dividends or interest, as applicable, on the securities loaned and is subject to changes in value of the securities loaned that may occur during the term of the loan. The Fund has the right under the Lending Agreement to recover the securities from the borrower on demand. With respect to security loans collateralized by non-cash collateral, the Fund receives loan premiums paid by the borrower. With respect to security loans collateralized by cash collateral, the earnings from the collateral investments are shared among the Fund, the security lending agent, and the borrower. The Fund records security lending income net of allocations to the security lending agent and the borrower.
The Fund may incur investment losses as a result of investing securities lending collateral. This could occur if an investment in the collateral investment account defaulted or became impaired. Under those circumstances, the value of the Fund’s cash collateral account may be less than the amount the Fund would be required to return to the borrowers of the securities and the Fund would be required to make up for this shortfall.
During the year ended December 31, 2024, the Fund had no securities out on loan.
9. Credit and Market Risks
When interest rates rise, fixed income securities (i.e. debt obligations) generally will decline in value. These declines in value are greater for fixed income securities with longer maturities or durations. Interest rate changes are influenced by a number of factors, such as government policy, monetary policy, inflation expectations, and the supply and demand of bonds. A fund may be subject to a greater risk of rising interest rates when interest rates are low or inflation rates are high or rising.
The Fund concentrates its investments in securities issued by municipalities, mainly in Oregon. The Fund invests primarily in a specific state and may be subject to geographic concentration risk. In addition, the Fund has the flexibility to invest in issuers in US territories and possessions such as the Commonwealth of Puerto Rico, the US Virgin Islands, and Guam, whose bonds are also free of federal and individual state income taxes. The value of the Fund’s investments may be adversely affected by new legislation within the states or US territories, regional or local economic conditions, and differing levels of supply and demand for municipal bonds. Many municipalities insure repayment for their obligations. Although bond insurance reduces the risk of loss due to default by an issuer, such bonds remain subject to the risk that value may fluctuate
Notes to financial statements
Macquarie Tax-Free Oregon Fund
9. Credit and Market Risks (continued)
for other reasons and there is no certainty that the insurance company will meet its obligations. A real or perceived decline in credit worthiness of a bond insurer can have an adverse impact on the value of insured bonds held in the Fund.
The Fund invests a portion of its assets in high yield municipal fixed income securities, which are securities rated lower than BBB- by Standard & Poor’s Financial Services LLC (S&P), lower than Baa3 by Moody’s Investors Service, Inc. (Moody’s), or similarly rated by another nationally recognized statistical rating organization. Investments in these higher yielding securities are generally accompanied by a greater degree of credit risk than higher rated securities. Additionally, lower rated securities may be more susceptible to adverse economic and competitive industry conditions than investment grade securities.
The Fund invests in certain obligations that may have liquidity protection designed to ensure that the receipt of payments due on the underlying security is timely. Such protection may be provided through guarantees, insurance policies, or letters of credit obtained by the issuer or sponsor through third parties, through various means of structuring the transaction, or through a combination of such approaches. The Fund will not pay any additional fees for such credit support, although the existence of credit support may increase the price of the security.
The Fund may invest in advance refunded bonds, escrow secured bonds, or defeased bonds. Under current federal tax laws and regulations, state and local government borrowers are permitted to refinance outstanding bonds by issuing new bonds. The issuer refinances the outstanding debt to either reduce interest costs or to remove or alter restrictive covenants imposed by the bonds being refinanced. A refunding transaction where the municipal securities are being refunded within 90 days from the issuance of the refunding issue is known as a “current refunding.” “Advance refunded bonds” are bonds in which the refunded bond issue remains outstanding for more than 90 days following the issuance of the refunding issue. In an advance refunding, the issuer will use the proceeds of a new bond issue to purchase high grade interest-bearing debt securities, which are then deposited in an irrevocable escrow account held by an escrow agent to secure all future payments of principal and interest and bond premium of the advance refunded bond. Bonds are “escrowed to maturity” when the proceeds of there funding issue are deposited in an escrow account for investment sufficient to pay all of the principal and interest on the original interest payment and maturity dates.
Bonds are considered “pre-refunded” when the refunding issuer’s proceeds are escrowed only until a permitted call date or dates on the refunded issue with the refunded issue being redeemed at the time, including any required premium. Bonds become “defeased” when the rights and interests of the bondholders and of their lien on the pledged revenues or other security under the terms of the bond contract are substituted with an alternative source of revenues (the escrow securities) sufficient to meet payments of principal and interest to maturity or to the first call dates. Escrowed secured bonds will often receive a rating of AAA from Moody’s, S&P, and/or Fitch Ratings due to the strong credit quality of the escrow securities and the irrevocable nature of the escrow deposit agreement.
The Fund may invest up to 15% of its net assets in illiquid securities, which may include securities with contractual restrictions on resale, securities exempt from registration under Rule 144A promulgated under the Securities Act of 1933, as amended, and other securities which may not be readily marketable. The relative illiquidity of these securities may impair the Fund from disposing of them in a timely manner and at a fair price when it is necessary or desirable to do so. While maintaining oversight, the Board has delegated to DMC the day-to-day functions of determining whether individual securities are liquid for purposes of the Fund’s limitation on investments in illiquid securities. Securities eligible for resale pursuant to Rule 144A, which are determined to be liquid, are not subject to the Fund’s 15% limit on investments in illiquid securities. Rule 144A securities have been identified on the “Schedule of investments.”
10. Contractual Obligations
The Fund enters into contracts in the normal course of business that contain a variety of indemnifications. The Fund's maximum exposure under these arrangements is unknown. However, the Fund has not had prior claims or losses pursuant to these contracts. Management has reviewed the Fund’s existing contracts and expects the risk of loss to be remote.
11. Subsequent Events
Management has determined that no material events or transactions occurred subsequent to December 31, 2024, that would require recognition or disclosure in the Fund’s financial statements.
Report of independent registered public accounting firm
To the Board of Trustees of Delaware Group Limited-Term Government Funds and Shareholders of Macquarie Tax-Free Oregon Fund
Opinion on the Financial Statements
We have audited the accompanying statement of assets and liabilities, including the schedule of investments, of Macquarie Tax-Free Oregon Fund (one of the funds constituting Delaware Group Limited-Term Government Funds, referred to hereafter as the “Fund”) as of December 31, 2024, the related statement of operations for the year ended December 31, 2024, the statement of changes in net assets for each of the two years in the period ended December 31, 2024, including the related notes, and the financial highlights for each of the five years in the period ended December 31, 2024 (collectively referred to as the “financial statements”). In our opinion, the financial statements present fairly, in all material respects, the financial position of the Fund as of December 31, 2024, the results of its operations for the year then ended, the changes in its net assets for each of the two years in the period ended December 31, 2024 and the financial highlights for each of the five years in the period ended December 31, 2024 in conformity with accounting principles generally accepted in the United States of America.
Basis for Opinion
These financial statements are the responsibility of the Fund’s management. Our responsibility is to express an opinion on the Fund’s financial statements based on our audits. We are a public accounting firm registered with the Public Company Accounting Oversight Board (United States) (PCAOB) and are required to be independent with respect to the Fund in accordance with the U.S. federal securities laws and the applicable rules and regulations of the Securities and Exchange Commission and the PCAOB.
We conducted our audits of these financial statements in accordance with the standards of the PCAOB. Those standards require that we plan and perform the audit to obtain reasonable assurance about whether the financial statements are free of material misstatement, whether due to error or fraud.
Our audits included performing procedures to assess the risks of material misstatement of the financial statements, whether due to error or fraud, and performing procedures that respond to those risks. Such procedures included examining, on a test basis, evidence regarding the amounts and disclosures in the financial statements. Our audits also included evaluating the accounting principles used and significant estimates made by management, as well as evaluating the overall presentation of the financial statements. Our procedures included confirmation of securities owned as of December 31, 2024 by correspondence with the custodian. We believe that our audits provide a reasonable basis for our opinion.
/s/PricewaterhouseCoopers LLP
Philadelphia, Pennsylvania
February 28, 2025
We have served as the auditor of one or more Macquarie investment companies since 2010.
Other Fund information (Unaudited)
Macquarie Tax-Free Oregon Fund
Tax Information
The information set forth below is for the Fund’s fiscal year as required by federal income tax laws. Shareholders, however, must report distributions on a calendar year basis for income tax purposes, which may include distributions for portions of two fiscal years of the Fund. Accordingly, the information needed by shareholders for income tax purposes will be sent to them in January of each year. Please consult your tax advisor for proper treatment of this information.
All disclosures are based on financial information available as of the date of this report and, accordingly are subject to change. For any and all items requiring reporting, it is the intention of the Fund to report the maximum amount permitted under the Internal Revenue Code and the regulations thereunder.
For the fiscal year ended December 31, 2024, the Fund reports distributions paid during the year as follows:
| (A) Ordinary Income Distributions (Tax Basis) | 3.23% |
| (B) Tax Exempt Distributions (Tax Basis) | 96.77% |
| Total Distributions (Tax Basis) | 100.00% |
(A) and (B) are based on a percentage of the Fund’s total distributions.
Changes in and Disagreements with Accountants for Open-End Management Investment Companies
Not applicable.
Proxy Disclosures for Open-End Management Investment Companies
Not applicable.
Remuneration Paid to Directors, Officers, and Others of Open-End Management Investment Companies
The aggregate remuneration paid to directors, officers, and others is disclosed within the financial statements.
Statement Regarding Basis of Approval for Investment Advisory Contract
Board Consideration of Investment Management Agreements and Sub-Advisory Agreements at a Meeting Held on August 13-15, 2024
At a meeting held on August 13-15, 2024 (the “Annual Contract Renewal Meeting”), the Board of Trustees (the “Board”), including a majority of Trustees each of whom is not an “interested person” as defined under the Investment Company Act of 1940 (the “Independent Trustees”),
Other Fund information (Unaudited)
Macquarie Tax-Free Oregon Fund
Statement Regarding Basis of Approval for Investment Advisory Contract (continued)
Board Consideration of Investment Management Agreements and Sub-Advisory Agreements at a Meeting Held on August 13-15, 2024 (continued)
approved the renewal of the Delaware Tax-Free Oregon Fund (the “Fund”) Investment Management Agreement with Delaware Management Company (DMC).
Prior to the Annual Contract Renewal Meeting, including at a Board meeting held in May 2024, the Trustees conferred extensively among themselves and with representatives of DMC about these matters. Also, the Board was assisted by the Equity Investments Committee and the Fixed Income Multi-Asset Sub-Advised Funds Investments Committee (each an “Investment Committee” and together, the “Investment Committees”), with each Investment Committee assisting the full Board in reviewing investment performance and other matters throughout the year. The Independent Trustees were also assisted in their evaluation of the Investment Management Agreement by independent legal counsel, from whom they received separate legal advice and with whom they met separately.
In providing information to the Board, DMC was guided by a detailed set of requests for information submitted to them by independent legal counsel on behalf of the Independent Trustees at the start of the Board’s annual contract renewal process earlier in 2024. Prior to the Annual Contract Renewal Meeting, and in response to the requests, the Board received and reviewed materials specifically relating to the renewal of the Investment Management Agreement. In considering and approving the Investment Management Agreement, the Trustees considered the information they believed relevant, including but not limited to the information discussed below. The Board considered not only the specific information presented in connection with the Annual Contract Renewal Meeting and the review process for the Investment Management Agreement, but also the knowledge gained over time through interaction with DMC about various topics. In this regard, the Board reviewed reports of DMC at each of its quarterly meetings, which included information about, among other things, Fund performance, investment strategies, and expenses. In addition, the Investment Committees confer with portfolio managers at various times throughout the year. In considering information relating to the approval of the Fund’s Investment Management Agreement, the Independent Trustees also received information from an independent fund consultant, JDL Consultants, LLC (JDL).
The Board did not identify any particular information or consideration that was all-important or controlling, and each individual Trustee may have attributed different weights to various factors.
After its deliberations, the Board, including the Independent Trustees, unanimously approved the continuation of the Investment Management Agreement for a one-year term. The following summarizes a number of important, but not necessarily all of the, factors considered by the Board in support of its approval.
Nature, extent, and quality of services. The Board received and considered various information regarding the nature, extent, and quality of the advisory services provided to the Fund by DMC under its Investment Management Agreement and the experience of the officers and employees of DMC who provide these services, including the Fund’s portfolio managers.
The Board met with DMC’s senior management and investment personnel. The Board reviewed the materials provided by the Fund’s portfolio management team discussing its performance, investment strategies and outlook, as well as DMC with respect to comparing Fund performance to the performance of a comparable group of mutual funds, relevant benchmarks, and performance metrics, as applicable. The Board’s review included consideration of DMC’s investment oversight and research and analysis capabilities, and its ability to attract and retain skilled investment professionals. The Board also considered information regarding DMC’s programs for risk management, including investment, operational, liquidity, derivatives (as applicable), valuation and compliance risks and its plans for enhancing those programs (including through the allocation of additional resources and enhancements to existing processes and testing). The Board received information with respect to the cybersecurity program and business continuity plans of DMC and its affiliates, as well as information from Macquarie Group Ltd. (Macquarie), the parent company of DMC, regarding Macquarie’s commitment to the US mutual fund business.
In addition, the Board considered certain non-advisory services that DMC and its affiliates provide to the fund complex. Among other things, these services include third party service provider oversight, transfer agency, internal audit, pricing and valuation, portfolio trading, and legal and compliance functions. The Board noted DMC’s responsibility for overseeing: the preparation of the Fund’s prospectus, summary prospectus, statement of additional information, and shareholder reports; responsibility for other periodic filings with regulators; organizing Board meetings and preparing materials for such Board meetings; and furnishing analytical and other support to assist the Board.
The Board took into account the benefits to shareholders of investing in a Fund that is part of a family of funds managed by an affiliate of Macquarie, and the resources available to DMC as part of Macquarie’s global asset management business.
The Board also received and considered information about the nature and extent of services offered and fee rates charged by DMC to other types of clients with investment strategies similar to those of the Fund. In this regard, the Board received information about the significantly greater scope of services, and compliance, reporting and other legal and regulatory obligations and risks of managing registered investment companies compared with those associated with managing assets of other types of clients, including third-party sub-advised fund clients, unregistered funds and separately managed accounts.
The Board concluded that, overall, it was satisfied with the nature, extent and quality of services provided (and expected to be provided) to the Fund by DMC.
Investment performance. The Board received and considered information with respect to the investment performance of the Fund, including performance reports and discussions with portfolio managers at meetings of the Board’s Investment Committees throughout the year as well as reports provided by Broadridge Financial Solutions, Inc., an independent investment company data provider (Broadridge), furnished for the Annual Contract Renewal Meeting. The Broadridge reports prepared for the Fund’s institutional share class showed its investment performance in comparison to the institutional share class of a group of similar funds (the “Performance Universe”). The Board received a description of the methodology used to select
Other Fund information (Unaudited)
Macquarie Tax-Free Oregon Fund
Statement Regarding Basis of Approval for Investment Advisory Contract (continued)
Board Consideration of Investment Management Agreements and Sub-Advisory Agreements at a Meeting Held on August 13-15, 2024 (continued)
the peer funds in the Performance Universe. Comparative annualized performance for the Fund was shown for the past 1-, 3-, 5-, and 10-year or since inception periods, as applicable, ended December 31, 2023.
The Performance Universe for the Fund consisted of the Fund all retail and institutional “other states” municipal debt funds, regardless of asset size or primary channel of distribution. The Board noted that the Broadridge report comparison showed that the Fund’s total return for the 1-, 3- and 5-year periods was in the first quartile of its Performance Universe and for the 10-year period was in the second quartile of its Performance Universe. The Broadridge report comparison showed that the Fund’s total return for the 1-, 3-, 5-, and 10-year periods was above the median of its Performance Universe. The Board also noted that the Fund outperformed its benchmark index for the 1- and 3-year periods and underperformed its benchmark index for the 5- and 10-year periods. The Board also noted that the Fund adopted the performance of its predecessor fund (“Predecessor Fund”) prior to October 5, 2019 as the result of a reorganization of the Predecessor Fund into the Fund and that the investment performance of the current portfolio management team began as of October 2019. The Board noted that the Fund was generally outperforming its Performance Universe during the periods under review. The Board also noted the explanations from DMC concerning the reasons for the Fund’s relative performance versus its benchmark index for the various periods and any actions that DMC has taken to address performance concerns.
Comparative expenses. The Board received and considered expense data for the Fund. DMC provided the Board with information on pricing levels and fee structures for the Fund as of its most recently completed fiscal year. The Broadridge total expenses (reflecting any applicable fee waivers and/or expense reimbursements), for comparative consistency, were shown by Broadridge for Institutional Class shares, including 12b-1 and non-12b-1 service fees (as applicable). The Board also considered the comparative analysis of contractual management fees and actual total expense ratios of the Fund versus contractual management fees and actual total expense ratios of a group of peer funds as selected by Broadridge (the “Expense Group”). The Fund’s total expenses were also compared with those of its Expense Universe, which is comprised of the Fund, its Expense Group and all other similar with an institutional share class (i.e., funds without 12b-1 fees and non-12b-1 service fees) with assets equal to or greater than $100 million, excluding outliers (the “Expense Universe”). In reviewing comparative costs, the Fund’s contractual management fee and the actual management fee incurred by the Fund were compared with the contractual management fees (assuming all funds in the Expense Group were similar in size to the Fund) and actual management fees, taking into account any applicable breakpoints and fee waivers and/or expense reimbursements, with the Fund’s Expense Universe.
The Board also received and considered information regarding the Fund’s net operating expense ratios and their various components, including actual management fees, custodian and other non-management fees, and Rule 12b-1 and non-Rule 12b-1 shareholder service fees.
The expense comparisons for the Fund showed that its actual management fee was below the median of its Expense Universe and its actual total expenses were above its Expense Group average. It was noted that consistent with DMC’s waiver methodology, its advisory fee waivers, if any, were at the fund level and not class level.
Based on its consideration of the factors and information it deemed relevant, including those described here, the Board determined that the compensation payable to DMC under the Investment Management Agreement was reasonable.
Economies of scale. The Board received and considered information about the potential for DMC to realize economies of scale in the provision of management services to the Fund, the difficulties of calculating economies of scale at an individual Fund level, and the extent to which potential scale benefits are shared with shareholders, including the extent to which any economies of scale are reflected in the level of management fees charged. DMC discussed its advisory fee pricing and structure for the complex. The Board considered the continuation and/or implementation of contractual fee waivers and/or expense reimbursements, as applicable. The Board noted that the Fund may also benefit from economies of scale through initial fee setting, fee waivers and expense reimbursements, as well as DMC’s investment in its business, including investments in business infrastructure, technology and cybersecurity.
Management profitability. The Board received and considered the Investment Management Profitability Analysis that addressed the overall profitability of DMC’s business in providing management and other services to the Fund and the complex as a whole, including the methodology used by DMC in allocating costs for the purpose of determining profitability. The Board also reviewed a report prepared by JDL regarding DMC’s profitability as compared to certain peer fund complexes and the Independent Trustees discussed DMC’s profitability in such context with representatives from JDL. The Board recognized that calculating and comparing profitability at the individual fund level is difficult; that DMC’s profit, if any, can vary significantly depending on the particular fund; and that DMC’s support for, and commitment to, a fund are not solely dependent on the profits realized as to that fund.
Based on its review, the Board determined that DMC’s profitability was not excessive in light of the nature, extent and quality of the services provided to the Fund.
Ancillary benefits. The Board received and considered information regarding the extent to which DMC and its affiliates might derive ancillary benefits from fund operations, including the potential for procuring additional business as a result of the prestige and visibility associated with its role as investment manager to the complex; the benefits from allocation of fund brokerage to improve trading efficiencies; the portfolio transactions executed through “soft dollar” arrangements; and the fees that various affiliates received for serving as transfer agent and for overseeing fund accounting and financial administration services to the complex. The Board considered that it receives periodic reports from DMC that include a representation that any soft dollar arrangements are consistent with regulatory requirements. The Board received information
Other Fund information (Unaudited)
Macquarie Tax-Free Oregon Fund
Statement Regarding Basis of Approval for Investment Advisory Contract (continued)
Board Consideration of Investment Management Agreements and Sub-Advisory Agreements at a Meeting Held on August 13-15, 2024 (continued)
from DMC regarding its view of the performance of its affiliates in providing transfer agent and fund accounting and financial administration oversight services and the organizational structure employed to provide these services pursuant to their contracts with the Fund.
Based on its consideration of the factors and information it deemed relevant, including the costs of providing investment management and other services to the Fund and the ongoing commitment of DMC and its affiliates to the Fund, the Board did not find that any ancillary benefits received by DMC and its affiliates, were unreasonable.
Conclusion. Based on its review, consideration and evaluation of all factors it believed relevant, including the above-described factors and conclusions, the Board, including all of the Independent Trustees, unanimously approved the continuation of DMC’s Investment Management Agreement for an additional one-year period.
Contact information
Shareholder assistance by phone
800 523-1918, weekdays from 8:30am to
6:00pm ET
For securities dealers and financial
institutions representatives only
800 362-7500
Regular mail
Macquarie Funds
P.O. Box 534437
Pittsburgh, PA 15253-4437
Overnight courier service
Macquarie Funds
Attention: 534437
500 Ross Street, 154-0520
Pittsburgh, PA 15262
Macquarie Asset Management • 610 Market Street • Philadelphia, PA 19106-2354
Macquarie Asset Management (MAM) is the asset management division of Macquarie Group. MAM is an integrated asset manager across public and private markets offering a diverse range of capabilities, including real assets, real estate, credit, equities, and multi-asset solutions.
The Fund is advised by Delaware Management Company, a series of MIMBT, a US registered investment adviser, and distributed by Delaware Distributors, L.P. (DDLP), an affiliate of MIMBT and Macquarie Group Limited.
Other than Macquarie Bank Limited ABN 46 008 583 542 (“Macquarie Bank”), any Macquarie Group entity noted in this document is not an authorized deposit-taking institution for the purposes of the Banking Act 1959 (Commonwealth of Australia). The obligations of these other Macquarie Group entities do not represent deposits or other liabilities of Macquarie Bank. Macquarie Bank does not guarantee or otherwise provide assurance in respect of the obligations of these other Macquarie Group entities. In addition, if this document relates to an investment, (a) the investor is subject to investment risk including possible delays in repayment and loss of income and principal invested and (b) none of Macquarie Bank or any other Macquarie Group entity guarantees any particular rate of return on or the performance of the investment, nor do they guarantee repayment of capital in respect of the investment.
The Fund is governed by US laws and regulations.
This page is not part of the Financial statements and other information.
Item 8. Changes in and Disagreements with Accountants for Open-End Management Investment Companies.
Not applicable.
Item 9. Proxy Disclosures for Open-End Management Investment Companies.
Not applicable.
Item 10. Remuneration Paid to Directors, Officers, and Others of Open-End Management Investment Companies.
This information is included as part of materials filed under Item 7 of this form.
Item 11. Statement Regarding Basis for Approval of Investment Advisory Contract.
This information is included as part of materials filed under Item 7 of this form.
Item 12. Disclosure of Proxy Voting Policies and Procedures for Closed-End Management Investment Companies.
Not applicable.
Item 13. Portfolio Managers of Closed-End Management Investment Companies.
Not applicable.
Item 14. Purchases of Equity Securities by Closed-End Management Investment Company and Affiliated Purchasers.
Not applicable.
Item 15. Submission of Matters to a Vote of Security Holders.
There have been no material changes to the procedures by which shareholders may recommend nominees to the registrant’s board of trustees, where those changes were implemented after the registrant last provided disclosure in response to the requirements of Item 407(c)(2)(iv) of Regulation S-K (17 CFR 229.407) (as required by Item 22(b)(15) of Schedule 14A (17 CFR 240.14a-101)), or this Item.
Item 16. Controls and Procedures.
| | (a) | The registrant’s principal executive officer and principal financial officers, or persons performing similar functions, have concluded that the registrant’s disclosure controls and procedures (as defined in Rule 30a-3(c) under the Investment Company Act of 1940, as amended (17 CFR 270.30a-3(c))) are effective, as of a date within 90 days of the filing of this report, based on their evaluation of these controls and procedures required by Rule 30a-3(b) under the Investment Company Act of 1940 (17 CFR 270.30a-3(b)) and Rules 13a-15(b) or 15d-15(b) under the Securities Exchange Act of 1934, as amended (17 CFR 240.13a-15(b) or 240.15d-15(b)) and provide reasonable assurance that the information required to be disclosed by the registrant in its reports or statements filed under the Securities Exchange Act of 1934 is recorded, processed, summarized and reported within the time periods specified in the rules and forms of the Securities and Exchange Commission. |
| | (b) | There were no significant changes in the registrant’s internal control over financial reporting (as defined in Rule 30a-3(d) under the Investment Company Act of 1940 (17 CFR 270.30a-3(d)) that occurred during the period covered by the report to stockholders included herein that have materially affected, or are reasonably likely to materially affect, the registrant’s internal control over financial reporting. |
Item 17. Disclosure of Securities Lending Activities for Closed-End Management Investment Companies.
Not applicable.
Item 18. Recovery of Erroneously Awarded Compensation.
Not applicable.
SIGNATURES
Pursuant to the requirements of the Securities Exchange Act of 1934 and the Investment Company Act of 1940, the registrant has duly caused this report to be signed on its behalf, by the undersigned, thereunto duly authorized.
| | |
| Name of Registrant: Delaware Group® Limited-Term Government Funds |
|
| /s/ SHAWN K. LYTLE |
| By: | | Shawn K. Lytle |
| Title: | | President and Chief Executive Officer |
| Date: | | March 7, 2025 |
Pursuant to the requirements of the Securities Exchange Act of 1934 and the Investment Company Act of 1940, this report has been signed below by the following persons on behalf of the registrant and in the capacities and on the dates indicated.
| | |
| /s/ SHAWN K. LYTLE |
| By: | | Shawn K. Lytle |
| Title: | | President and Chief Executive Officer |
| Date: | | March 7, 2025 |
|
| /s/ RICHARD SALUS |
| By: | | Richard Salus |
| Title: | | Chief Financial Officer |
| Date: | | March 7, 2025 |