UNITED STATES SECURITIES AND EXCHANGE COMMISSION
Washington, D.C. 20549
FORM N-CSR
CERTIFIED SHAREHOLDER REPORT OF REGISTERED MANAGEMENT
INVESTMENT COMPANIES
| Investment Company Act file number: | | 811-03363 |
| | | |
| Exact name of registrant as specified in charter: | | Delaware Group® Limited-Term
Government Funds |
| | | |
| Address of principal executive offices: | | 610 Market Street |
| | Philadelphia, PA 19106 |
| | | |
| Name and address of agent for service: | | David F. Connor, Esq. |
| | 610 Market Street |
| | Philadelphia, PA 19106 |
| | | |
| Registrant’s telephone number, including area code: | | (800) 523-1918 |
| | | |
| Date of fiscal year end: | | December 31 |
| | | |
| Date of reporting period: | | December 31, 2021 |
Item 1. Reports to Stockholders
Table of Contents
| | |
 |  |
| | |
| | |
| | |
| | |
| | Annual report |
| | |
Fixed income mutual fund
Delaware Limited-Term Diversified Income Fund
December 31, 2021
Carefully consider the Fund’s investment objectives, risk factors, charges, and expenses before investing. This and other information can be found in the Fund’s prospectus and its summary prospectus, which may be obtained by visiting delawarefunds.com/literature or calling 800 523-1918. Investors should read the prospectus and the summary prospectus carefully before investing.
You can obtain shareholder reports and prospectuses online instead of in the mail.
Visit delawarefunds.com/edelivery.
Table of Contents
Experience Delaware Funds by Macquarie®
Macquarie Investment Management (MIM) is a global asset manager with offices in the United States, Europe, Asia, and Australia. As active managers, we prioritize autonomy and accountability at the investment team level in pursuit of opportunities that matter for clients. Delaware Funds is one of the longest-standing mutual fund families, with more than 80 years in existence.
If you are interested in learning more about creating an investment plan, contact your financial advisor.
You can learn more about Delaware Funds or obtain a prospectus for Delaware Limited-Term Diversified Income Fund at delawarefunds.com/literature.
Manage your account online
| ● | Check your account balance and transactions |
| ● | View statements and tax forms |
| ● | Make purchases and redemptions |
Visit delawarefunds.com/account-access.
Macquarie Asset Management (MAM) offers a diverse range of products including securities investment management, infrastructure and real asset management, and fund and equity-based structured products. MIM is the marketing name for certain companies comprising the asset management division of Macquarie Group. This includes the following investment advisers: Macquarie Investment Management Business Trust (MIMBT), Macquarie Funds Management Hong Kong Limited, Macquarie Investment Management Austria Kapitalanlage AG, Macquarie Investment Management Global Limited, Macquarie Investment Management Europe Limited, and Macquarie Investment Management Europe S.A.
The Fund is distributed by Delaware Distributors, L.P. (DDLP), an affiliate of MIMBT and Macquarie Group Limited.
Other than Macquarie Bank Limited ABN 46 008 583 542 (“Macquarie Bank”), any Macquarie Group entity noted in this document is not an authorized deposit-taking institution for the purposes of the Banking Act 1959 (Commonwealth of Australia). The obligations of these other Macquarie Group entities do not represent deposits or other liabilities of Macquarie Bank. Macquarie Bank does not guarantee or otherwise provide assurance in respect of the obligations of these other Macquarie Group entities. In addition, if this document relates to an investment, (a) the investor is subject to investment risk including possible delays in repayment and loss of income and principal invested and (b) none of Macquarie Bank or any other Macquarie Group entity guarantees any particular rate of return on or the performance of the investment, nor do they guarantee repayment of capital in respect of the investment.
The Fund is governed by US laws and regulations.
Unless otherwise noted, views expressed herein are current as of December 31, 2021, and subject to change for events occurring after such date.
The Fund is not FDIC insured and is not guaranteed. It is possible to lose the principal amount invested.
Advisory services provided by Delaware Management Company, a series of MIMBT, a US registered investment advisor.
All third-party marks cited are the property of their respective owners.
© 2022 Macquarie Management Holdings, Inc.
Table of Contents
| Portfolio management review | |
| Delaware Limited-Term Diversified Income Fund | December 31, 2021 (Unaudited) |
Performance preview (for the year ended December 31, 2021)
| Delaware Limited-Term Diversified Income Fund (Institutional Class shares) | | 1-year return | | -0.30% |
| Delaware Limited-Term Diversified Income Fund (Class A shares) | | 1-year return | | -0.45% |
| Bloomberg 1-3 Year US Government/Credit Index | | 1-year return | | -0.47% |
Past performance does not guarantee future results.
For complete, annualized performance for Delaware Limited-Term Diversified Income Fund, please see the table on page 5.
Institutional Class shares are not subject to a sales charge and are offered for sale exclusively to certain eligible investors. In addition, Institutional Class shares pay no distribution and service fee.
The performance of Class A shares excludes the applicable sales charge. The performance of both Institutional Class shares and Class A shares reflects the reinvestment of all distributions.
Please see page 8 for a description of the index. Index performance returns do not reflect any management fees, transaction costs, or expenses. Indices are unmanaged and one cannot invest directly in an index.
Investment objective
The Fund seeks maximum total return, consistent with reasonable risk.
Market review
The economic recovery that began in 2020 continued through 2021. Gross domestic product (GDP) growth was strong, benefiting from consumers’ resilience and the significant amounts of liquidity the US Federal Reserve provided. Positive news was abundant early in the fiscal year ended December 31, 2021. The improving US jobs market, rapid vaccination rollout, and the $1.9 trillion stimulus package Congress passed in March all helped boost confidence that the economy was returning to normal.
As the year progressed, the news became mixed. Initial efforts to pass a major infrastructure bill were pushed back by a fair bit of congressional resistance. Although a smaller version of that bill eventually passed, the broader Build Back Better Act failed to garner enough support to become law in 2021.
The housing market was the strongest it had been since the global financial crisis, aided by fiscal stimulus and the Fed’s accommodative monetary policies. Investors appeared comfortable with the
During the fiscal year, the Fund benefited from:
| ● | an allocation to high yield corporate bonds |
| ● | an overweight and beneficial security selection in investment grade credit |
| ● | a position in AAA-rated collateralized loan obligation |
| ● | an overweight to emerging markets debt. |
1
Table of Contents
Portfolio management review
Delaware Limited-Term Diversified Income Fund
idea that interest rates were rising for good reason, leading them to continue to buy non-Treasury fixed income investments.
In the spring of 2021, risk markets rose, and economic growth remained robust as vaccination counts climbed at a time when inflation numbers were increasing. The yield curve began to flatten, and the Fed hinted at a possible change in monetary policy; however, as company fundamentals continued to improve, investors remained resilient and continued to support markets. A similar narrative was unfolding in European markets.
Interestingly, in the summer of 2021, the Fed highlighted additional policy considerations, including climate change and equality in the workforce. These new factors meant that investors may have to adjust how the Fed’s decisions could be affected by environmental and equality concerns.
In the third and fourth quarters of 2021, COVID-19 variants Delta and Omicron resulted in rising infection rates and called into question the return to normalcy. Significantly, the Fed, which had been describing inflation as transitory, quickly abandoned that term late in the year, raising the specter that a change in policy was afoot.
Within the Fund
For its fiscal year ended December 31, 2021, Delaware Limited-Term Diversified Income Fund declined although it outperformed its benchmark, the Bloomberg 1-3 Year US Government/Credit Index. The Fund’s Institutional Class shares fell 0.30%. The Fund’s Class A shares declined 0.45% at net asset value and declined 3.20% at maximum offer price (both returns reflect all distributions reinvested). For the same period, the Fund’s benchmark fell 0.47%. Complete annualized performance for Delaware Limited-Term Diversified Income Fund is shown in the table on page 5.
The Fund’s portfolio came under pressure during the fiscal year as short-term rates increased. The 5-year US Treasury yield rose about 90 basis points while the 2-year Treasury increased about 60 basis points during the calendar year (a basis point equals one hundredth of a percentage point).
The impact of higher rates out along the Treasury yield curve detracted from performance as longer-dated assets underperformed. That led to a 12-month absolute return for the Fund that was slightly negative. However, the Fund’s exposure to relatively high yielding fixed income securities, including an overweight to investment grade credit, led to favorable performance versus the benchmark.
An out-of-benchmark allocation to high yield corporate bonds contributed to relative returns, as it was one of the better-performing fixed income asset classes. Within high yield, we were primarily focused on higher-quality issues, specifically BB-rated securities, with an emphasis on industrials. This included Avient Corp., a chemical company; Southwestern Energy Co.,an independent crude oil and natural gas exploration and production company; and media company AMC Networks Inc., which broadcasts and distributes content through online streaming and mobile platforms. All three Fund holdings contributed to performance, and the Fund continues to own them.
The Fund also benefited from holding AAA-rated collateralized loan obligations (CLOs), which performed favorably during 2021. We continue to view these securities as attractive and, accordingly, we have made little change to the Fund’s CLO allocation going into 2022.
An overweight to investment grade credit along with beneficial security selection, particularly among BBB-rated issuers, played a favorable role.
2
Table of Contents
Individual contributors included Avolon Holdings Funding Ltd.; a commercial-jet leasing company based in Ireland that has performed well despite the challenges that the airline industry had during the early part of the COVID-19 pandemic. Delta Air Lines Inc. also contributed to performance. The Fund continues to own both.
An overweight combined with good security selection in emerging markets debt produced beneficial results. These out-of-benchmark investments included First Quantum Minerals Ltd., a metals and mining firm that mines copper and gold, and we maintain the Fund’s position.
There were few detractors of any significance at the sector level. The Fund’s underweight to non-corporate issuers mildly detracted from relative performance.
Among individual securities, Mondelez International Inc., a manufacturer of snack foods, detracted slightly from performance. We maintain the holding, however. Otis Worldwide Corp., the elevator manufacturer, also detracted slightly, and we exited the Fund’s position. Industrial conglomerate Teledyne Technologies Inc. and AbbVie Inc., a biopharmaceutical firm, also modestly detracted from performance. We continue to own both in the Fund.
Key risks and opportunities
As we enter 2022, there is growing uncertainty about what the next few months and full year may look like for monetary and fiscal policy.
We believe that fundamentals continue to support credit. The incremental yield advantage the asset class offers over lower-risk assets remains important, as the additional income continues to be critical. US-dollar assets remain attractive to foreign investors. Accordingly, we continue to maintain the Fund’s overweight to credit entering the new fiscal year.
With that fundamental backdrop remaining strong, we believe the Fund’s small allocation to high yield bonds should remain helpful in taking advantage of those incremental yield opportunities. Our primary focus in high yield continues to be BB-rated issues (relatively good quality within high yield), particularly in industrials companies.
In our view, further flattening of the US Treasury yield curve, particularly on the front end, could be a risk along with possible Fed policy mistakes. One could argue that a policy mistake already occurred when the Fed delayed action on historically high inflation. At a time when the central bank is pulling back quantitative easing and considering raising interest rates, investors will be focused on how effectively the Fed addresses inflation throughout the year.
With credit spreads starting 2022 wider than long-term historical averages, we don’t anticipate meaningful price appreciation. We also don’t foresee material spread widening in the first few months of the year. However, as the year progresses and the Fed embarks on a rate hiking cycle, we would anticipate a possible rise in market volatility.
Finally, geopolitical tensions have risen lately, as highlighted by increased uncertainty regarding Russia-Ukraine and the ongoing China-US rivalry as China looks to extend its influence around the world. More broadly, we believe the global rise of autocrats is worth monitoring, particularly at a time when the US, the largest democracy in the world, deals with its own challenges on the political home front.
With all these factors at play, we think market volatility is likely to increase in the coming months. However, with fundamentals relatively strong, we will continue to source income from spread products while keeping one eye on the Fed and the impacts that its policy responses may have on markets, and we will adjust our thinking accordingly.
3
Table of Contents
Portfolio management review
Delaware Limited-Term Diversified Income Fund
The Fund made minimal use of derivatives during the fiscal year. These were limited to interest rate futures used primarily for risk management purposes and foreign exchange (FX) forwards to hedge the US dollar value of securities denominated in foreign currencies. Overall, these derivatives had a negative effect that was not material to the Fund’s performance.
4
Table of Contents
Performance summary | |
Delaware Limited-Term Diversified Income Fund | December 31, 2021 (Unaudited) |
The performance quoted represents past performance and does not guarantee future results. Investment return and principal value of an investment will fluctuate so that shares, when redeemed, may be worth more or less than their original cost. Current performance may be lower or higher than the performance quoted. Performance data current to the most recent month end may be obtained by calling 800 523-1918 or visiting delawarefunds.com/performance.
| Fund and benchmark performance1,2 | | Average annual total returns through December 31, 2021 |
| | 1 year | | 5 year | | 10 year | | Lifetime |
| Class A (Est. November 24, 1985) | | | | | | | | | | | | |
| Excluding sales charge | | -0.45 | % | | +1.82 | % | | +1.40 | % | | +4.47 | % |
| Including sales charge | | -3.20 | % | | +1.26 | % | | +1.12 | % | | +4.39 | % |
| Class C (Est. November 28, 1995) | | | | | | | | | | | | |
| Excluding sales charge | | -1.41 | % | | +0.96 | % | | +0.54 | % | | +2.69 | % |
| Including sales charge | | -2.39 | % | | +0.96 | % | | +0.54 | % | | +2.69 | % |
| Class R (Est. June 2, 2003) | | | | | | | | | | | | |
| Excluding sales charge | | -0.80 | % | | +1.47 | % | | +1.05 | % | | +2.29 | % |
| Including sales charge | | -0.80 | % | | +1.47 | % | | +1.05 | % | | +2.29 | % |
| Institutional Class (Est. June 1, 1992) | | | | | | | | | | | | |
| Excluding sales charge | | -0.30 | % | | +2.00 | % | | +1.56 | % | | +3.82 | % |
| Including sales charge | | -0.30 | % | | +2.00 | % | | +1.56 | % | | +3.82 | % |
| Class R6 (Est. May 1, 2017) | | | | | | | | | | | | |
| Excluding sales charge | | -0.36 | % | | — | | | — | | | +1.92 | % |
| Including sales charge | | -0.36 | % | | — | | | — | | | +1.92 | % |
| Bloomberg 1-3 Year US Government/Credit | | | | | | | | | | | | |
| Index | | -0.47 | % | | +1.85 | % | | +1.39 | % | | +3.70 | %* |
| * | The benchmark lifetime return is for Institutional Class share comparison only and is calculated using the month end prior to the Fund’s Institutional Class inception date. |
1 | Returns reflect the reinvestment of all distributions and are presented both with and without the applicable sales charges described below. Returns do not reflect the deduction of taxes the shareholder would pay on Fund distributions or redemptions of Fund shares. |
Expense limitations were in effect for certain classes during some or all of the periods shown in the “Fund and benchmark performance” table. Expenses for each class are listed on the “Fund expense ratios” table on page 7. Performance would have been lower had expense limitations not been in effect.
Institutional Class shares are not subject to a sales charge and are offered for sale exclusively to certain eligible investors. In addition, Institutional Class shares pay no distribution and service (12b-1) fee.
Class A shares are sold with a maximum front-end sales charge of 2.75%, and have an annual 12b-1 fee of 0.25% of average daily net assets. Performance for Class A shares, excluding
5
Table of Contents
Performance summary
Delaware Limited-Term Diversified Income Fund
sales charges, assumes that no front-end sales charge applied.
Class C shares are sold with a contingent deferred sales charge (CDSC) of 1.00% if redeemed during the first 12 months. They are also subject to an annual (12b-1) fee of 1.00% of average daily net assets. Performance for Class C shares, excluding sales charges, assumes either that CDSCs did not apply or that the investment was not redeemed.
Class R shares are available only for certain retirement plan products. They are sold without a sales charge and have an annual 12b-1 fee of 0.50% of average daily net assets.
Class R6 shares are available only to certain investors. In addition, Class R6 shares do not pay any service fees, sub-accounting fees, and/or sub-transfer agency fees to any brokers, dealers, or other financial intermediaries. Class R6 shares pay no 12b-1 fee.
Fixed income securities and bond funds can lose value, and investors can lose principal as interest rates rise. They also may be affected by economic conditions that hinder an issuer’s ability to make interest and principal payments on its debt. This includes prepayment risk, the risk that the principal of a bond that is held by a portfolio will be prepaid prior to maturity at the time when interest rates are lower than what the bond was paying. A portfolio may then have to reinvest that money at a lower interest rate. Interest payments on inflation-indexed debt securities will vary as the principal and/or interest is adjusted for inflation.
High yielding, non-investment-grade bonds (junk bonds) involve higher risk than investment grade bonds. The high yield secondary market is particularly susceptible to liquidity problems when institutional investors, such as mutual funds and certain other financial institutions, temporarily stop buying bonds for regulatory, financial, or other reasons. In addition, a less liquid secondary market makes it more difficult to obtain precise valuations of the high yield securities.
The Fund may invest in derivatives, which may involve additional expenses and are subject to risk, including the risk that an underlying security or securities index moves in the opposite direction from what the portfolio manager anticipated. A derivatives transaction depends upon the counterparties’ ability to fulfill their contractual obligations.
International investments entail risks including fluctuation in currency values, differences in accounting principles, or economic or political instability. Investing in emerging markets can be riskier than investing in established foreign markets due to increased volatility, lower trading volume, and higher risk of market closures. In many emerging markets, there is substantially less publicly available information and the available information may be incomplete or misleading. Legal claims are generally more difficult to pursue.
If and when the Fund invests in forward foreign currency contracts or uses other investments to hedge against currency risks, the Fund will be subject to special risks, including counterparty risk.
Diversification may not protect against market risk.
IBOR risk is the risk that changes related to the use of the London interbank offered rate (LIBOR) or similar rates (such as EONIA) could have adverse impacts on financial instruments that reference these rates. The abandonment of these rates and transition to alternative rates could affect the value and liquidity of instruments that reference them and could affect investment strategy performance.
The disruptions caused by natural disasters, pandemics, or similar events could prevent the Fund from executing advantageous investment decisions in a timely manner and could negatively impact the Fund’s ability to achieve its investment objective and the value of the Fund’s investments.
6
Table of Contents
2 | The Fund’s expense ratios, as described in the most recent prospectus, are disclosed in the following “Fund expense ratios” table. Delaware Management Company has agreed to reimburse certain expenses and/or waive certain fees in order to prevent total annual fund operating expenses (excluding any 12b-1 fees, acquired fund fees and expenses, taxes, interest, short sale dividend and interest expenses, brokerage fees, certain insurance costs, and nonroutine expenses or costs, including, but not limited to, those relating to reorganizations, litigation, conducting shareholder meetings, and liquidations) from exceeding 0.39% of the Fund’s average daily net assets for all share classes other than Class R6, and 0.32% of the Fund’s Class R6 shares’ average daily net assets from January 1, 2021 to December 31, 2021.* Please see the most recent prospectus and any applicable supplement(s) for additional information on these fee waivers and/or reimbursements. Please see the “Financial highlights” section in this report for the most recent expense ratios. |
| | | | | | | | | | | Institutional | | | |
| Fund expense ratios | | Class A | | Class C | | Class R | | Class | | Class R6 |
| Total annual operating expenses | | | | | | | | | | | | | | | |
| (without fee waivers) | | 0.95 | % | | 1.70 | % | | 1.20 | % | | 0.70 | % | | 0.63 | % |
| Net expenses (including fee | | | | | | | | | | | | | | | |
| waivers, if any) | | 0.54 | % | | 1.39 | % | | 0.89 | % | | 0.39 | % | | 0.32 | % |
| Type of waiver | | Contractual | | Contractual | | Contractual | | Contractual | | Contractual |
* | The aggregate contractual waiver period covering this report is from May 1, 2020 through April 30, 2022. |
7
Table of Contents
Performance summary
Delaware Limited-Term Diversified Income Fund
Performance of a $10,000 investment1
Average annual total returns from December 31, 2011 through December 31, 2021

| For period beginning December 31, 2011 through December 31, 2021 | | Starting value | | Ending value |
 | Delaware Limited-Term Diversified Income Fund — Institutional | | | | |
| Class shares | | $10,000 | | $11,670 |
 | Bloomberg 1-3 Year US Government/Credit Index | | $10,000 | | $11,477 |
 | Delaware Limited-Term Diversified Income Fund — Class A | | | | |
| shares | | $9,725 | | $11,180 |
1 | The “Performance of a $10,000 investment” graph assumes $10,000 invested in Institutional Class and Class A shares of the Fund on December 31, 2011, and includes the effect of a 2.75% front-end sales charge (for Class A shares) and the reinvestment of all distributions. The graph does not reflect the deduction of taxes the shareholders would pay on Fund distributions or redemptions of Fund shares. Expense limitations were in effect for some or all of the periods shown. Performance would have been lower had expense limitations not been in effect. Expenses are listed in the “Fund expense ratios” table on page 7. Please note additional details on pages 5 through 9. |
The graph also assumes $10,000 invested in the Bloomberg 1-3 Year US Government/Credit Index as of December 31, 2011. The Bloomberg 1-3 Year US Government/Credit Index is a market value–weighted index of government fixed-rate debt securities and investment grade US and foreign fixed-rate debt securities with average maturities of one to three years.
Index performance returns do not reflect any management fees, transaction costs, or expenses. Indices are unmanaged and one cannot invest directly in an index. Past performance does not guarantee future results.
Performance of other Fund classes will vary due to different charges and expenses.
8
Table of Contents
| | Nasdaq symbols | | CUSIPs |
| Class A | | DTRIX | | 245912308 |
| Class C | | DTICX | | 245912704 |
| Class R | | DLTRX | | 245912803 |
| Institutional Class | | DTINX | | 245912506 |
| Class R6 | | DLTZX | | 245912886 |
9
Table of Contents
Disclosure of Fund expenses
For the six-month period from July 1, 2021 to December 31, 2021 (Unaudited)
As a shareholder of the Fund, you incur two types of costs: (1) transaction costs, including sales charges (loads) on purchase payments, reinvested dividends, or other distributions; redemption fees; and exchange fees; and (2) ongoing costs, including management fees; distribution and service (12b-1) fees; and other Fund expenses. This example is intended to help you understand your ongoing costs (in dollars) of investing in the Fund and to compare these costs with the ongoing costs of investing in other mutual funds.
The example is based on an investment of $1,000 invested at the beginning of the period and held for the entire six-month period from July 1, 2021 to December 31, 2021.
Actual expenses
The first section of the table shown, “Actual Fund return,” provides information about actual account values and actual expenses. You may use the information in this section of the table, together with the amount you invested, to estimate the expenses that you paid over the period. Simply divide your account value by $1,000 (for example, an $8,600 account value divided by $1,000 = 8.6), then multiply the result by the number in the first section under the heading entitled “Expenses Paid During Period” to estimate the expenses you paid on your account during this period.
Hypothetical example for comparison purposes
The second section of the table shown, “Hypothetical 5% return,” provides information about hypothetical account values and hypothetical expenses based on the Fund’s actual expense ratio and an assumed rate of return of 5% per year before expenses, which is not the Fund’s actual return. The hypothetical account values and expenses may not be used to estimate the actual ending account balance or expenses you paid for the period. You may use this information to compare the ongoing costs of investing in the Fund and other funds. To do so, compare this 5% hypothetical example with the 5% hypothetical examples that appear in the shareholder reports of the other funds.
Please note that the expenses shown in the table are meant to highlight your ongoing costs only and do not reflect any transactional costs, such as sales charges (loads), redemption fees, or exchange fees. Therefore, the second section of the table is useful in comparing ongoing costs only, and will not help you determine the relative total costs of owning different funds. In addition, if these transactional costs were included, your costs would have been higher. The Fund’s expenses shown in the table reflect fee waivers in effect and assume reinvestment of all dividends and distributions.
10
Table of Contents
Delaware Limited-Term Diversified Income Fund
Expense analysis of an investment of $1,000
| | Beginning | | Ending | | | | | | | Expenses |
| | Account Value | | Account Value | | Annualized | | Paid During Period |
| | 7/1/21 | | 12/31/21 | | Expense Ratio | | 7/1/21 to 12/31/21* |
| Actual Fund return† | | | | | | | | | | | | | | | | | | | | |
| Class A | | | $ | 1,000.00 | | | | $ | 995.30 | | | | 0.54 | % | | | | $ | 2.72 | |
| Class C | | | | 1,000.00 | | | | | 989.90 | | | | 1.39 | % | | | | | 6.97 | |
| Class R | | | | 1,000.00 | | | | | 993.60 | | | | 0.89 | % | | | | | 4.47 | |
| Institutional Class | | | | 1,000.00 | | | | | 996.10 | | | | 0.39 | % | | | | | 1.96 | |
| Class R6 | | | | 1,000.00 | | | | | 996.40 | | | | 0.34 | % | | | | | 1.71 | |
| Hypothetical 5% return (5% return before expenses) | | | | | | | | | | | |
| Class A | | | $ | 1,000.00 | | | | $ | 1,022.48 | | | | 0.54 | % | | | | $ | 2.75 | |
| Class C | | | | 1,000.00 | | | | | 1,018.20 | | | | 1.39 | % | | | | | 7.07 | |
| Class R | | | | 1,000.00 | | | | | 1,020.72 | | | | 0.89 | % | | | | | 4.53 | |
| Institutional Class | | | | 1,000.00 | | | | | 1,023.24 | | | | 0.39 | % | | | | | 1.99 | |
| Class R6 | | | | 1,000.00 | | | | | 1,023.49 | | | | 0.34 | % | | | | | 1.73 | |
| * | “Expenses Paid During Period” are equal to the Fund’s annualized expense ratio, multiplied by the average account value over the period, multiplied by 184/365 (to reflect the one-half year period). |
| † | Because actual returns reflect only the most recent six-month period, the returns shown may differ significantly from fiscal year returns. |
In addition to the Fund’s expenses reflected above, the Fund also indirectly bears its portion of the fees and expenses of the investment companies (Underlying Funds) in which it invests. The table above does not reflect the expenses of the Underlying Funds.
11
Table of Contents
| Security type / sector allocation | |
| Delaware Limited-Term Diversified Income Fund | As of December 31, 2021 (Unaudited) |
Sector designations may be different from the sector designations presented in other Fund materials. The sector designations may represent the investment manager’s internal sector classifications.
| Security type / sector | | Percentage of net assets |
| Agency Asset-Backed Security | | | 0.00 | % | |
| Agency Collateralized Mortgage Obligations | | | 2.60 | % | |
| Agency Commercial Mortgage-Backed Securities | | | 1.53 | % | |
| Agency Mortgage-Backed Securities | | | 7.81 | % | |
| Collateralized Debt Obligations | | | 7.86 | % | |
| Corporate Bonds | | | 58.12 | % | |
| Banking | | | 14.90 | % | |
| Basic Industry | | | 2.31 | % | |
| Brokerage | | | 0.13 | % | |
| Capital Goods | | | 3.37 | % | |
| Communications | | | 3.50 | % | |
| Consumer Cyclical | | | 4.25 | % | |
| Consumer Non-Cyclical | | | 5.75 | % | |
| Electric | | | 7.28 | % | |
| Energy | | | 4.66 | % | |
| Finance Companies | | | 4.31 | % | |
| Insurance | | | 3.67 | % | |
| Real Estate | | | 0.27 | % | |
| Technology | | | 1.82 | % | |
| Transportation | | | 1.90 | % | |
| Non-Agency Asset-Backed Securities | | | 6.42 | % | |
| Loan Agreements | | | 0.19 | % | |
| Sovereign Bonds | | | 0.22 | % | |
| US Treasury Obligations | | | 12.43 | % | |
| Short-Term Investments | | | 2.29 | % | |
| Total Value of Securities | | | 99.47 | % | |
| Receivables and Other Assets Net of Liabilities | | | 0.53 | % | |
| Total Net Assets | | | 100.00 | % | |
12
Table of Contents
| Schedule of investments | |
| Delaware Limited-Term Diversified Income Fund | December 31, 2021 |
| | | | Principal | | | |
| | | | | amount° | | Value (US $) |
| Agency Asset-Backed Security – 0.00% | | | | | |
| Freddie Mac Structured Pass Through Certificates | | | | | |
| | Series T-30 A5 8.61% 12/25/30 ◆, ● | | 3,091 | | $ | 3,350 |
| Total Agency Asset-Backed Security (cost $3,231) | | | | | 3,350 |
| | | | | | |
| Agency Collateralized Mortgage Obligations – 2.60% | | | | | |
| Fannie Mae Grantor Trust | | | | | |
| | Series 2001-T5 A2 6.976% 6/19/41 ● | | 15,858 | | | 17,998 |
| Freddie Mac REMICs | | | | | |
| | Series 5092 WG 1.00% 4/25/31 | | 6,337,398 | | | 6,267,802 |
| Freddie Mac Structured Agency Credit Risk REMIC Trust | | | | | |
| | Series 2020-DNA6 M1 144A 0.95% (SOFR + 0.90%) | | | | | |
| | 12/25/50 #, ● | | 330,635 | | | 330,635 |
| | Series 2021-DNA1 M1 144A 0.70% (SOFR + 0.65%) 1/25/51 #, ● | | 593,214 | | | 593,038 |
| | Series 2021-DNA3 M1 144A 0.80% (SOFR + 0.75%) | | | | | |
| | 10/25/33 #, ● | | 1,931,383 | | | 1,930,797 |
| | Series 2021-DNA5 M1 144A 0.70% (SOFR + 0.65%) 1/25/34 #, ● | | 666,480 | | | 666,265 |
| | Series 2021-HQA1 M1 144A 0.75% (SOFR + 0.70%) 8/25/33 #, ● | | 1,230,948 | | | 1,230,233 |
| | Series 2021-HQA2 M1 144A 0.75% (SOFR + 0.70%) | | | | | |
| | 12/25/33 #, ● | | 1,375,000 | | | 1,373,748 |
| Freddie Mac Structured Pass Through Certificates | | | | | |
| | Series T-54 2A 6.50% 2/25/43 ◆ | | 539 | | | 632 |
| | Series T-58 2A 6.50% 9/25/43 ◆ | | 275,667 | | | 311,952 |
| GNMA | | | | | |
| | Series 2017-163 KH 3.50% 3/20/44 | | 82,773 | | | 83,014 |
| Total Agency Collateralized Mortgage Obligations (cost $12,894,538) | | | | | 12,806,114 |
| | | | | | |
| Agency Commercial Mortgage-Backed Securities – 1.53% | | | | | |
| Freddie Mac Multifamily Structured Pass Through Certificates | | | | | |
| | Series K729 A2 3.136% 10/25/24 ◆ | | 2,000,000 | | | 2,092,760 |
| | Series K734 A1 3.139% 6/25/25 ◆ | | 2,595,439 | | | 2,692,364 |
| FREMF Mortgage Trust | | | | | |
| | Series 2015-K720 B 144A 3.39% 7/25/22 #, ● | | 2,700,000 | | | 2,730,220 |
| Total Agency Commercial Mortgage-Backed Securities (cost $7,595,861) | | | | | 7,515,344 |
| | | | | |
| Agency Mortgage-Backed Securities – 7.81% | | | | | |
| Fannie Mae S.F. 15 yr | | | | | |
| | 2.00% 4/1/36 | | 1,267,399 | | | 1,300,164 |
| | 2.50% 8/1/35 | | 1,057,038 | | | 1,093,108 |
| | 2.50% 11/1/35 | | 3,956,480 | | | 4,099,414 |
13
Table of Contents
Schedule of investments
Delaware Limited-Term Diversified Income Fund
| | | | Principal amount° | | Value (US $) |
| Agency Mortgage-Backed Securities (continued) | | | | | |
| | Fannie Mae S.F. 20 yr | | | | | |
| | 2.00% 5/1/41 | | 1,370,472 | | $ | 1,392,540 |
| | 2.50% 7/1/41 | | 615,106 | | | 635,075 |
| Fannie Mae S.F. 30 yr | | | | | |
| | 2.00% 12/1/50 | | 91,373 | | | 91,319 |
| | 2.00% 1/1/51 | | 54,219 | | | 54,124 |
| | 2.00% 2/1/51 | | 482,209 | | | 481,634 |
| | 2.50% 9/1/50 | | 142,304 | | | 146,417 |
| | 2.50% 10/1/50 | | 253,981 | | | 261,999 |
| | 2.50% 10/1/51 | | 160,858 | | | 164,473 |
| | 3.00% 11/1/49 | | 153,874 | | | 162,613 |
| | 3.00% 5/1/51 | | 786,413 | | | 826,717 |
| | 3.50% 10/1/42 | | 775,845 | | | 833,783 |
| | 3.50% 7/1/47 | | 196,001 | | | 210,150 |
| | 3.50% 2/1/48 | | 202,927 | | | 217,723 |
| | 3.50% 11/1/48 | | 102,114 | | | 107,974 |
| | 3.50% 11/1/49 | | 654,637 | | | 695,947 |
| | 3.50% 3/1/50 | | 37,537 | | | 39,773 |
| | 3.50% 9/1/50 | | 723,235 | | | 786,054 |
| | 3.50% 6/1/51 | | 634,031 | | | 673,078 |
| | 4.00% 6/1/48 | | 143,463 | | | 155,767 |
| | 4.00% 10/1/48 | | 899,930 | | | 983,789 |
| | 4.50% 2/1/44 | | 1,014,794 | | | 1,125,160 |
| | 4.50% 4/1/44 | | 1,134,067 | | | 1,259,034 |
| | 4.50% 11/1/44 | | 1,179,906 | | | 1,310,345 |
| | 4.50% 10/1/45 | | 646,579 | | | 713,487 |
| | 4.50% 5/1/46 | | 803,180 | | | 886,386 |
| | 4.50% 9/1/49 | | 986,927 | | | 1,072,607 |
| | 5.00% 7/1/47 | | 3,839,196 | | | 4,347,585 |
| | 5.00% 5/1/48 | | 388,378 | | | 426,394 |
| | 5.00% 8/1/49 | | 1,603,742 | | | 1,782,497 |
| | 5.50% 5/1/44 | | 2,564,285 | | | 2,921,120 |
| | 6.00% 6/1/41 | | 297,531 | | | 343,591 |
| | 6.00% 7/1/41 | | 2,669,606 | | | 3,086,233 |
| | 6.00% 1/1/42 | | 181,881 | | | 210,657 |
| Freddie Mac S.F. 15 yr | | | | | |
| | 3.00% 3/1/35 | | 488,555 | | | 515,104 |
| Freddie Mac S.F. 20 yr | | | | | |
| | 2.50% 6/1/41 | | 579,504 | | | 598,317 |
| | 3.00% 9/1/40 | | 276,786 | | | 289,319 |
| Freddie Mac S.F. 30 yr | | | | | |
| | 3.00% 11/1/46 | | 291,379 | | | 307,372 |
14
Table of Contents
| | | | Principal amount° | | Value (US $) |
| Agency Mortgage-Backed Securities (continued) | | | | | |
| | Freddie Mac S.F. 30 yr | | | | | |
| | 3.00% 8/1/50 | | 185,529 | | $ | 196,421 |
| | 3.50% 3/1/47 | | 101,015 | | | 108,525 |
| | 4.00% 5/1/46 | | 111,238 | | | 121,092 |
| | 4.50% 8/1/48 | | 670,936 | | | 725,954 |
| | 4.50% 4/1/49 | | 156,716 | | | 170,204 |
| | 4.50% 5/1/49 | | 399,068 | | | 431,528 |
| | 6.00% 5/1/39 | | 19,769 | | | 22,619 |
| Total Agency Mortgage-Backed Securities (cost $38,555,628) | | | | | 38,385,186 |
| | | | | | | | |
| Collateralized Debt Obligations – 7.86% | | | | | |
| Ballyrock CLO | | | | | |
| | Series 2018-1A A1 144A 1.132% (LIBOR03M + 1.00%) | | | | | |
| | 4/20/31 #, ● | | 2,750,000 | | | 2,750,080 |
| Benefit Street Partners CLO IX | | | | | |
| | Series 2016-9A AR 144A 1.242% (LIBOR03M + 1.11%) | | | | | |
| | 7/20/31 #, ● | | 500,000 | | | 500,738 |
| BlueMountain CLO XXX | | | | | |
| | Series 2020-30A A 144A 1.514% (LIBOR03M + 1.39%, Floor | | | | | |
| | 1.39%) 1/15/33 #, ● | | 1,750,000 | | | 1,754,315 |
| Canyon Capital CLO | | | | | |
| | Series 2019-2A AR 144A 1.304% (LIBOR03M + 1.18%, Floor | | | | | |
| | 1.18%) 10/15/34 #, ● | | 2,800,000 | | | 2,799,297 |
| Carlyle Global Market Strategies CLO | | | | | |
| | Series 2014-2RA A1 144A 1.206% (LIBOR03M + 1.05%) | | | | | |
| | 5/15/31 #, ● | | 985,636 | | | 984,536 |
| CBAM | | | | | |
| | Series 2020-13A A 144A 1.562% (LIBOR03M + 1.43%, Floor | | | | | |
| | 1.43%) 1/20/34 #, ● | | 3,000,000 | | | 3,006,954 |
| Cedar Funding IX CLO | | | | | |
| | Series 2018-9A A1 144A 1.112% (LIBOR03M + 0.98%, Floor | | | | | |
| | 0.98%) 4/20/31 #, ● | | 1,500,000 | | | 1,497,264 |
| CIFC Funding | | | | | |
| | Series 2013-4A A1RR 144A 1.195% (LIBOR03M + 1.06%, Floor | | | | | |
| | 1.06%) 4/27/31 #, ● | | 2,900,000 | | | 2,902,436 |
| Dryden 83 CLO | | | | | |
| | Series 2020-83A A 144A 1.342% (LIBOR03M + 1.22%, Floor | | | | | |
| | 1.22%) 1/18/32 #, ● | | 3,100,000 | | | 3,099,219 |
| Galaxy XXI CLO | | | | | |
| | Series 2015-21A AR 144A 1.152% (LIBOR03M + 1.02%) | | | | | |
| | 4/20/31 #, ● | | 1,500,000 | | | 1,500,051 |
15
Table of Contents
Schedule of investments
Delaware Limited-Term Diversified Income Fund
| | | | Principal amount° | | Value (US $) |
| Collateralized Debt Obligations (continued) | | | | | |
| | KKR CLO 32 | | | | | |
| | Series 32A A1 144A 1.444% (LIBOR03M + 1.32%, Floor 1.32%) | | | | | |
| | 1/15/32 #, ● | | 1,700,000 | | $ | 1,704,604 |
| LCM XVIII | | | | | |
| | Series 18A A1R 144A 1.152% (LIBOR03M + 1.02%) 4/20/31 #, ● | | 2,200,000 | | | 2,197,111 |
| Octagon Investment Partners 33 | | | | | |
| | Series 2017-1A A1 144A 1.322% (LIBOR03M + 1.19%) | | | | | |
| | 1/20/31 #, ● | | 2,650,000 | | | 2,648,633 |
| Octagon Investment Partners 48 | | | | | |
| | Series 2020-3A AR 144A 1.277% (LIBOR03M + 1.15%, Floor | | | | | |
| | 1.15%) 10/20/34 #, ● | | 2,900,000 | | | 2,899,272 |
| Sound Point CLO XXI | | | | | |
| | Series 2018-3A A1A 144A 1.305% (LIBOR03M + 1.18%, Floor | | | | | |
| | 1.18%) 10/26/31 #, ● | | 3,200,000 | | | 3,200,230 |
| TRESTLES CLO V | | | | | |
| | Series 2021-5A A1 144A 1.33% (LIBOR03M + 1.17%, Floor | | | | | |
| | 1.17%) 10/20/34 #, ● | | 2,500,000 | | | 2,502,455 |
| Venture 34 CLO | | | | | |
| | Series 2018-34A A 144A 1.354% (LIBOR03M + 1.23%, Floor | | | | | |
| | 1.23%) 10/15/31 #, ● | | 700,000 | | | 699,599 |
| Zais CLO 16 | | | | | |
| | Series 2020-16A A1R 144A 1.549% (LIBOR03M + 1.42%, Floor | | | | | |
| | 1.42%) 10/20/34 #, ● | | 2,000,000 | | | 1,999,496 |
| Total Collateralized Debt Obligations (cost $38,448,463) | | | | | 38,646,290 |
| | | | | | | | |
| Corporate Bonds – 58.12% | | | | | |
| Banking – 14.90% | | | | | |
| Ally Financial 5.75% 11/20/25 | | 1,511,000 | | | 1,705,701 |
| Banco Continental 144A 2.75% 12/10/25 # | | 585,000 | | | 568,804 |
| Banco de Bogota 144A 6.25% 5/12/26 # | | 200,000 | | | 216,269 |
| Banco de Credito del Peru 144A 2.70% 1/11/25 # | | 200,000 | | | 203,987 |
| Banco de Credito e Inversiones 144A 4.00% 2/11/23 # | | 200,000 | | | 205,963 |
| Banco del Estado de Chile 144A 2.704% 1/9/25 # | | 220,000 | | | 224,916 |
| Banco Santander 3.50% 4/11/22 | | 2,800,000 | | | 2,821,531 |
| Banco Santander Mexico | | | | | |
| | 144A 4.125% 11/9/22 # | | 150,000 | | | 153,760 |
| | 144A 5.95% 10/1/28 #, µ | | 200,000 | | | 210,765 |
| Bancolombia 3.00% 1/29/25 | | 215,000 | | | 216,088 |
| Bank of America | | | | | |
| | 3.458% 3/15/25 µ | | 4,345,000 | | | 4,546,330 |
| | 4.10% 7/24/23 | | 340,000 | | | 357,535 |
| Bank of China 144A 5.00% 11/13/24 # | | 200,000 | | | 218,305 |
16
Table of Contents
| | | | Principal amount° | | Value (US $) |
| Corporate Bonds (continued) | | | | | |
| Banking (continued) | | | | | |
| | Bank of Georgia 144A 6.00% 7/26/23 # | | 200,000 | | $ | 213,400 |
| Bank of Ireland Group 144A 2.029% 9/30/27 #, µ | | 425,000 | | | 417,828 |
| Bank of Montreal 1.85% 5/1/25 | | 605,000 | | | 614,399 |
| Barclays Bank 1.70% 5/12/22 | | 2,660,000 | | | 2,669,217 |
| BBVA Bancomer | | | | | |
| | 144A 1.875% 9/18/25 # | | 1,115,000 | | | 1,106,699 |
| | 144A 6.75% 9/30/22 # | | 150,000 | | | 155,441 |
| Citigroup | | | | | |
| | 1.281% 11/3/25 µ | | 1,960,000 | | | 1,955,956 |
| | 4.044% 6/1/24 µ | | 2,430,000 | | | 2,533,356 |
| Credit Agricole 144A 1.907% 6/16/26 #, µ | | 650,000 | | | 651,785 |
| Credit Suisse Group 144A 2.593% 9/11/25 #, µ | | 2,295,000 | | | 2,345,108 |
| Emirates NBD Bank 2.625% 2/18/25 | | 200,000 | | | 206,998 |
| Goldman Sachs Group | | | | | |
| | 0.86% (SOFR + 0.81%) 3/9/27 ● | | 4,905,000 | | | 4,934,937 |
| | 0.925% 10/21/24 µ | | 3,535,000 | | | 3,521,205 |
| | 1.542% 9/10/27 µ | | 315,000 | | | 308,795 |
| | 5.75% 1/24/22 | | 4,000,000 | | | 4,012,088 |
| Hana Bank 144A 3.375% 1/30/22 # | | 500,000 | | | 500,962 |
| ICICI Bank 3.25% 9/9/22 | | 320,000 | | | 323,856 |
| JPMorgan Chase & Co. | | | | | |
| | 0.63% (SOFR + 0.58%) 3/16/24 ● | | 1,310,000 | | | 1,312,886 |
| | 0.934% (SOFR + 0.885%) 4/22/27 ● | | 955,000 | | | 968,031 |
| | 2.545% 11/8/32 µ | | 415,000 | | | 417,796 |
| | 4.023% 12/5/24 µ | | 7,650,000 | | | 8,069,450 |
| | 4.60% 2/1/25 µ, ψ | | 265,000 | | | 272,287 |
| KeyBank | | | | | |
| | 2.40% 6/9/22 | | 500,000 | | | 504,482 |
| | 3.18% 10/15/27 | | 1,990,000 | | | 2,010,284 |
| Kookmin Bank 144A 2.875% 3/25/23 # | | 200,000 | | | 204,971 |
| Morgan Stanley | | | | | |
| | 0.731% 4/5/24 µ | | 2,735,000 | | | 2,727,248 |
| | 1.164% 10/21/25 µ | | 945,000 | | | 938,116 |
| | 2.75% 5/19/22 | | 1,195,000 | | | 1,205,822 |
| | 3.737% 4/24/24 µ | | 350,000 | | | 362,199 |
| National Securities Clearing 144A 1.20% 4/23/23 # | | 910,000 | | | 916,475 |
| NBK SPC 144A 1.625% 9/15/27 #, µ | | 200,000 | | | 195,244 |
| NongHyup Bank 144A 0.875% 7/28/24 # | | 200,000 | | | 198,136 |
| Nordea Bank 144A 0.625% 5/24/24 # | | 3,580,000 | | | 3,538,047 |
17
Table of Contents
Schedule of investments
Delaware Limited-Term Diversified Income Fund
| | | | Principal amount° | | Value (US $) |
| Corporate Bonds (continued) | | | | | |
| Banking (continued) | | | | | |
| | Oversea-Chinese Banking 144A 4.25% 6/19/24 # | | 200,000 | | $ | 212,891 |
| Popular 6.125% 9/14/23 | | 523,000 | | | 557,152 |
| QNB Finance | | | | | |
| | 2.625% 5/12/25 | | 250,000 | | | 257,101 |
| | 3.50% 3/28/24 | | 380,000 | | | 398,610 |
| State Street 1.684% 11/18/27 µ | | 660,000 | | | 661,236 |
| Toronto-Dominion Bank 0.405% (SOFR + 0.355%) 3/4/24 ● | | 3,960,000 | | | 3,964,489 |
| Truist Bank 2.636% 9/17/29 µ | | 2,480,000 | | | 2,550,845 |
| UBS 144A 1.75% 4/21/22 # | | 400,000 | | | 401,278 |
| UBS Group 144A 2.65% 2/1/22 # | | 580,000 | | | 581,026 |
| US Bank 3.40% 7/24/23 | | 1,630,000 | | | 1,695,397 |
| | | | | | | | 73,243,483 |
| Basic Industry – 2.31% | | | | | |
| Avient 144A 5.75% 5/15/25 # | | 1,540,000 | | | 1,607,175 |
| First Quantum Minerals 144A 7.50% 4/1/25 # | | 1,585,000 | | | 1,632,510 |
| Gold Fields Orogen Holdings BVI 144A 5.125% 5/15/24 # | | 250,000 | | | 266,848 |
| Inversiones CMPC 144A 4.75% 9/15/24 # | | 1,720,000 | | | 1,835,765 |
| JSW Steel 144A 3.95% 4/5/27 # | | 200,000 | | | 197,712 |
| MEGlobal Canada 144A 5.00% 5/18/25 # | | 200,000 | | | 218,607 |
| New Gold 144A 6.375% 5/15/25 # | | 166,000 | | | 171,160 |
| Nutrien 1.90% 5/13/23 | | 1,995,000 | | | 2,021,159 |
| OCP 144A 4.50% 10/22/25 # | | 835,000 | | | 883,607 |
| Sasol Financing USA 4.375% 9/18/26 | | 200,000 | | | 201,478 |
| Sociedad Quimica y Minera de Chile 144A 3.625% 4/3/23 # | | 200,000 | | | 204,935 |
| Steel Dynamics 2.80% 12/15/24 | | 1,455,000 | | | 1,512,755 |
| Stillwater Mining 144A 4.00% 11/16/26 # | | 200,000 | | | 196,605 |
| Suzano Austria 144A 5.75% 7/14/26 # | | 200,000 | | | 228,553 |
| Volcan Cia Minera 144A 4.375% 2/11/26 # | | 200,000 | | | 192,967 |
| | | | | | | | 11,371,836 |
| Brokerage – 0.13% | | | | | |
| Charles Schwab 4.00% 6/1/26 µ, ψ | | 460,000 | | | 469,775 |
| XP 144A 3.25% 7/1/26 # | | 200,000 | | | 192,015 |
| | | | | | | | 661,790 |
| Capital Goods – 3.37% | | | | | |
| Carlisle 0.55% 9/1/23 | | 1,015,000 | | | 1,006,286 |
| L3Harris Technologies 3.85% 12/15/26 | | 215,000 | | | 233,960 |
| Mauser Packaging Solutions Holding 144A 5.50% 4/15/24 # | | 847,000 | | | 855,868 |
| Roper Technologies 2.35% 9/15/24 | | 4,345,000 | | | 4,457,625 |
| Spirit AeroSystems 144A 5.50% 1/15/25 # | | 1,240,000 | | | 1,286,196 |
18
Table of Contents
| | | | Principal | | | |
| | | | | amount° | | Value (US $) |
| Corporate Bonds (continued) | | | | | |
| Capital Goods (continued) | | | | | |
| Teledyne Technologies 0.95% 4/1/24 | | 5,745,000 | | $ | 5,689,701 |
| TransDigm 144A 8.00% 12/15/25 # | | 1,232,000 | | | 1,301,282 |
| Turkiye Sise ve Cam Fabrikalari 144A 6.95% 3/14/26 # | | 200,000 | | | 204,600 |
| Welbilt 9.50% 2/15/24 | | 597,000 | | | 603,701 |
| WESCO Distribution 144A 7.125% 6/15/25 # | | 886,000 | | | 940,290 |
| | | | | | | 16,579,509 |
| Communications – 3.50% | | | | | |
| AMC Networks 5.00% 4/1/24 | | 610,000 | | | 615,216 |
| Artera Services 144A 9.033% 12/4/25 # | | 680,000 | | | 720,154 |
| Charter Communications Operating 4.908% 7/23/25 | | 1,515,000 | | | 1,669,531 |
| Clear Channel International 144A 6.625% 8/1/25 # | | 675,000 | | | 702,678 |
| Fox | | | | | |
| | 3.666% 1/25/22 | | 880,000 | | | 881,749 |
| | 4.03% 1/25/24 | | 5,265,000 | | | 5,562,935 |
| IHS Holding 144A 5.625% 11/29/26 # | | 200,000 | | | 202,600 |
| Ooredoo International Finance 144A 5.00% 10/19/25 # | | 200,000 | | | 225,040 |
| Sirius XM Radio 144A 3.125% 9/1/26 # | | 250,000 | | | 250,401 |
| Sprint Spectrum 144A 4.738% 9/20/29 # | | 365,625 | | | 382,998 |
| Tencent Holdings 144A 3.28% 4/11/24 # | | 200,000 | | | 208,835 |
| Time Warner Entertainment 8.375% 3/15/23 | | 1,795,000 | | | 1,946,993 |
| T-Mobile USA 3.50% 4/15/25 | | 510,000 | | | 540,704 |
| Turk Telekomunikasyon 144A 4.875% 6/19/24 # | | 200,000 | | | 197,188 |
| Verizon Communications 0.75% 3/22/24 | | 3,135,000 | | | 3,123,706 |
| | | | | | | 17,230,728 |
| Consumer Cyclical – 4.25% | | | | | |
| BMW US Capital 144A 0.75% 8/12/24 # | | 1,810,000 | | | 1,790,947 |
| Boyd Gaming 144A 8.625% 6/1/25 # | | 556,000 | | | 596,432 |
| Carnival 144A 7.625% 3/1/26 # | | 947,000 | | | 993,929 |
| Daimler Trucks Finance North America 144A 1.625% 12/13/24 # | | 2,125,000 | | | 2,142,352 |
| Ford Motor Credit 3.375% 11/13/25 | | 1,635,000 | | | 1,700,784 |
| General Motors Financial | | | | | |
| | 0.81% (SOFR + 0.76%) 3/8/24 ● | | 2,695,000 | | | 2,707,767 |
| | 3.45% 4/10/22 | | 2,155,000 | | | 2,161,651 |
| | 4.15% 6/19/23 | | 2,850,000 | | | 2,965,083 |
| IRB Holding 144A 7.00% 6/15/25 # | | 177,000 | | | 187,440 |
| JD.com 3.875% 4/29/26 | | 430,000 | | | 460,461 |
| Kia 144A 1.00% 4/16/24 # | | 250,000 | | | 249,143 |
| Prime Security Services Borrower 144A 5.25% 4/15/24 # | | 1,008,000 | | | 1,073,701 |
| Sands China 3.80% 1/8/26 | | 200,000 | | | 201,239 |
| Scientific Games International 144A 5.00% 10/15/25 # | | 1,515,000 | | | 1,561,700 |
19
Table of Contents
Schedule of investments
Delaware Limited-Term Diversified Income Fund
| | | | Principal | | | |
| | | | | amount° | | Value (US $) |
| Corporate Bonds (continued) | | | | | |
| Consumer Cyclical (continued) | | | | | |
| Six Flags Entertainment 144A 4.875% 7/31/24 # | | 1,470,000 | | $ | 1,486,376 |
| VF 2.40% 4/23/25 | | 580,000 | | | 597,083 |
| | | | | | | 20,876,088 |
| Consumer Non-Cyclical – 5.75% | | | | | |
| AbbVie | | | | | |
| | 2.60% 11/21/24 | | 3,625,000 | | | 3,763,624 |
| | 3.75% 11/14/23 | | 340,000 | | | 356,115 |
| Bausch Health 144A 6.125% 4/15/25 # | | 1,100,000 | | | 1,121,818 |
| Bidvest Group UK 144A 3.625% 9/23/26 # | | 200,000 | | | 199,590 |
| Cigna | | | | | |
| | 1.014% (LIBOR03M + 0.89%) 7/15/23 ● | | 2,055,000 | | | 2,074,719 |
| | 3.75% 7/15/23 | | 507,000 | | | 527,418 |
| CK Hutchison International 17 144A 2.875% 4/5/22 # | | 200,000 | | | 201,028 |
| Conagra Brands 0.50% 8/11/23 | | 1,295,000 | | | 1,284,356 |
| DP World Crescent 144A 3.908% 5/31/23 # | | 615,000 | | | 636,767 |
| Gilead Sciences 3.70% 4/1/24 | | 1,615,000 | | | 1,698,490 |
| Global Payments | | | | | |
| | 1.50% 11/15/24 | | 1,485,000 | | | 1,486,125 |
| | 2.65% 2/15/25 | | 1,723,000 | | | 1,771,961 |
| Mondelez International 1.50% 5/4/25 | | 1,210,000 | | | 1,212,070 |
| Ortho-Clinical Diagnostics 144A 7.375% 6/1/25 # | | 744,000 | | | 785,675 |
| PayPal Holdings 1.35% 6/1/23 | | 3,025,000 | | | 3,050,566 |
| Royalty Pharma 1.20% 9/2/25 | | 3,690,000 | | | 3,615,485 |
| Takeda Pharmaceutical 4.40% 11/26/23 | | 1,850,000 | | | 1,958,215 |
| Teva Pharmaceutical Finance Netherlands III | | | | | |
| | 4.75% 5/9/27 | | 250,000 | | | 248,030 |
| | 6.00% 4/15/24 | | 250,000 | | | 262,270 |
| Viatris 1.65% 6/22/25 | | 2,035,000 | | | 2,028,917 |
| | | | | | | 28,283,239 |
| Electric – 7.28% | | | | | |
| AEP Texas 2.40% 10/1/22 | | 3,310,000 | | | 3,350,337 |
| Avangrid 3.20% 4/15/25 | | 885,000 | | | 930,763 |
| Azure Power Energy 144A 3.575% 8/19/26 # | | 200,000 | | | 202,300 |
| CenterPoint Energy 0.70% (SOFR + 0.65%) 5/13/24 ● | | 5,580,000 | | | 5,582,364 |
| Cleveland Electric Illuminating 5.50% 8/15/24 | | 2,580,000 | | | 2,841,602 |
| CLP Power Hong Kong Financing 2.875% 4/26/23 | | 200,000 | | | 204,561 |
| Duke Energy 4.875% 9/16/24 µ, Ψ | | 1,030,000 | | | 1,071,200 |
| Engie Energia Chile 144A 4.50% 1/29/25 # | | 1,540,000 | | | 1,642,379 |
| Entergy 4.00% 7/15/22 | | 1,895,000 | | | 1,918,258 |
| Entergy Louisiana 4.05% 9/1/23 | | 2,030,000 | | | 2,112,324 |
20
Table of Contents
| | | | Principal | | | |
| | | | | amount° | | Value (US $) |
| Corporate Bonds (continued) | | | | | |
| Electric (continued) | | | | | |
| ITC Holdings 2.70% 11/15/22 | | 3,325,000 | | $ | 3,377,159 |
| NRG Energy 144A 3.75% 6/15/24 # | | 2,535,000 | | | 2,646,337 |
| Southern California Edison 1.10% 4/1/24 | | 4,155,000 | | | 4,141,299 |
| Vistra Operations 144A 3.55% 7/15/24 # | | 2,825,000 | | | 2,910,870 |
| WEC Energy Group 0.80% 3/15/24 | | 2,895,000 | | | 2,866,738 |
| | | | | | | 35,798,491 |
| Energy – 4.66% | | | | | |
| Apache 4.625% 11/15/25 | | 1,028,000 | | | 1,105,090 |
| Cheniere Corpus Christi Holdings 7.00% 6/30/24 | | 1,955,000 | | | 2,163,741 |
| Devon Energy 5.25% 9/15/24 | | 853,000 | | | 923,396 |
| Enbridge | | | | | |
| | 0.45% (SOFR + 0.40%) 2/17/23 ● | | 1,705,000 | | | 1,705,518 |
| | 0.55% 10/4/23 | | 735,000 | | | 729,613 |
| Greenko Mauritius 144A 6.25% 2/21/23 # | | 210,000 | | | 214,630 |
| MPLX 4.875% 12/1/24 | | 1,955,000 | | | 2,123,358 |
| Murphy Oil 5.75% 8/15/25 | | 1,237,000 | | | 1,272,725 |
| NuStar Logistics 5.75% 10/1/25 | | 1,077,000 | | | 1,160,064 |
| Occidental Petroleum 5.50% 12/1/25 | | 1,247,000 | | | 1,384,638 |
| ONEOK 7.50% 9/1/23 | | 2,985,000 | | | 3,246,408 |
| Pertamina Persero 144A 1.40% 2/9/26 # | | 200,000 | | | 194,471 |
| Petroleos Mexicanos 4.625% 9/21/23 | | 130,000 | | | 133,422 |
| Pioneer Natural Resources 0.55% 5/15/23 | | 1,990,000 | | | 1,983,008 |
| Qatar Energy 144A 1.375% 9/12/26 # | | 200,000 | | | 196,374 |
| Sabine Pass Liquefaction 5.75% 5/15/24 | | 2,575,000 | | | 2,801,914 |
| Saudi Arabian Oil 144A 1.625% 11/24/25 # | | 205,000 | | | 204,143 |
| Schlumberger Holdings 144A 3.75% 5/1/24 # | | 930,000 | | | 976,185 |
| Southwestern Energy 6.45% 1/23/25 | | 188,000 | | | 206,835 |
| Tengizchevroil Finance Co International 144A 2.625% 8/15/25 # | | 200,000 | | | 200,729 |
| | | | | | | 22,926,262 |
| Finance Companies – 4.31% | | | | | |
| AerCap Ireland Capital DAC | | | | | |
| | 1.65% 10/29/24 | | 1,215,000 | | | 1,213,419 |
| | 3.15% 2/15/24 | | 3,905,000 | | | 4,029,576 |
| Air Lease | | | | | |
| | 0.80% 8/18/24 | | 1,755,000 | | | 1,720,142 |
| | 2.875% 1/15/26 | | 875,000 | | | 903,374 |
| | 3.00% 9/15/23 | | 1,225,000 | | | 1,257,697 |
| Aviation Capital Group 144A 1.95% 1/30/26 # | | 2,940,000 | | | 2,870,520 |
| Avolon Holdings Funding 144A 3.95% 7/1/24 # | | 4,960,000 | | | 5,200,210 |
| BOC Aviation USA 144A 1.625% 4/29/24 # | | 200,000 | | | 199,801 |
21
Table of Contents
Schedule of investments
Delaware Limited-Term Diversified Income Fund
| | | | Principal | | | |
| | | | | amount° | | Value (US $) |
| Corporate Bonds (continued) | | | | | |
| Finance Companies (continued) | | | | | |
| DAE Sukuk DIFC 144A 3.75% 2/15/26 # | | 200,000 | | $ | 206,905 |
| SURA Asset Management 144A 4.875% 4/17/24 # | | 620,000 | | | 654,429 |
| USAA Capital 144A 1.50% 5/1/23 # | | 2,900,000 | | | 2,929,514 |
| | | | | | | 21,185,587 |
| Insurance – 3.67% | | | | | |
| AIA Group 3.125% 3/13/23 | | 210,000 | | | 214,886 |
| Athene Global Funding | | | | | |
| | 144A 0.75% (SOFR + 0.70%) 5/24/24 #, ● | | 2,055,000 | | | 2,061,332 |
| | 144A 1.00% 4/16/24 # | | 2,535,000 | | | 2,514,572 |
| Brighthouse Financial Global Funding | | | | | |
| | 144A 0.809% (SOFR + 0.76%) 4/12/24 #, ● | | 1,745,000 | | | 1,754,438 |
| | 144A 1.00% 4/12/24 # | | 2,145,000 | | | 2,127,723 |
| Equitable Financial Life Global Funding 144A 0.80% 8/12/24 # | | 765,000 | | | 753,466 |
| Equitable Holdings 3.90% 4/20/23 | | 1,355,000 | | | 1,402,717 |
| F&G Global Funding 144A 0.90% 9/20/24 # | | 1,945,000 | | | 1,917,255 |
| GA Global Funding Trust 144A 1.00% 4/8/24 # | | 4,115,000 | | | 4,077,348 |
| USI 144A 6.875% 5/1/25 # | | 1,194,000 | | | 1,204,262 |
| | | | | | | 18,027,999 |
| Real Estate – 0.27% | | | | | |
| Goodman HK Finance 4.375% 6/19/24 | | 200,000 | | | 212,651 |
| HAT Holdings I 144A 6.00% 4/15/25 # | | 821,000 | | | 854,661 |
| Kaisa Group Holdings 9.375% 6/30/24 | | 200,000 | | | 53,500 |
| Trust Fibra UNO 144A 5.25% 1/30/26 # | | 200,000 | | | 219,210 |
| | | | | | | 1,340,022 |
| Technology – 1.82% | | | | | |
| Baidu 1.72% 4/9/26 | | 200,000 | | | 197,882 |
| International Business Machines 3.00% 5/15/24 | | 1,280,000 | | | 1,337,818 |
| Microchip Technology | | | | | |
| | 144A 0.983% 9/1/24 # | | 2,305,000 | | | 2,264,000 |
| | 4.333% 6/1/23 | | 615,000 | | | 641,249 |
| NXP 144A 2.70% 5/1/25 # | | 100,000 | | | 103,445 |
| Qorvo 144A 1.75% 12/15/24 # | | 930,000 | | | 931,579 |
| SK Hynix 144A 1.50% 1/19/26 # | | 620,000 | | | 607,132 |
| Skyworks Solutions 0.90% 6/1/23 | | 2,885,000 | | | 2,871,052 |
| | | | | | | 8,954,157 |
| Transportation – 1.90% | | | | | |
| Adani Ports & Special Economic Zone 144A 3.375% 7/24/24 # | | 235,000 | | | 241,747 |
| Aerovias de Mexico 144A 7.00% 2/5/25 #, ‡ | | 200,000 | | | 191,703 |
22
Table of Contents
| | | | Principal | | | |
| | | | | amount° | | Value (US $) |
| Corporate Bonds (continued) | | | | | |
| Transportation (continued) | | | | | |
| Canadian Pacific Railway 1.35% 12/2/24 | | 2,295,000 | | $ | 2,298,229 |
| DAE Funding 144A 1.55% 8/1/24 # | | 200,000 | | | 198,743 |
| Delta Air Lines | | | | | |
| | 144A 7.00% 5/1/25 # | | 2,041,000 | | | 2,335,502 |
| | 7.375% 1/15/26 | | 476,000 | | | 560,897 |
| Spirit Loyalty Cayman 144A 8.00% 9/20/25 # | | 581,999 | | | 643,208 |
| Triton Container International 144A 1.15% 6/7/24 # | | 2,725,000 | | | 2,687,623 |
| United Airlines 144A 4.375% 4/15/26 # | | 175,000 | | | 182,709 |
| | | | | | | 9,340,361 |
| Total Corporate Bonds (cost $283,760,904) | | | | | 285,819,552 |
| | |
| Non-Agency Asset-Backed Securities – 6.42% | | | | | |
| ARI Fleet Lease Trust | | | | | |
| | Series 2018-B A2 144A 3.22% 8/16/27 # | | 59,122 | | | 59,205 |
| Avis Budget Rental Car Funding AESOP | | | | | |
| | Series 2019-2A A 144A 3.35% 9/22/25 # | | 830,000 | | | 869,226 |
| CarMax Auto Owner Trust | | | | | |
| | Series 2018-2 B 3.37% 10/16/23 | | 1,850,000 | | | 1,870,226 |
| Dell Equipment Finance Trust | | | | | |
| | Series 2021-2 A2 144A 0.33% 12/22/26 # | | 1,800,000 | | | 1,793,328 |
| Ford Credit Auto Owner Trust | | | | | |
| | Series 2021-A B 0.70% 10/15/26 | | 180,000 | | | 176,267 |
| Ford Credit Floorplan Master Owner Trust A | | | | | |
| | Series 2020-1 A1 | | | | | |
| | 0.70% 9/15/25 | | 5,330,000 | | | 5,307,760 |
| GM Financial Leasing Trust | | | | | |
| | Series 2021-1 B 0.54% 2/20/25 | | 270,000 | | | 268,041 |
| GMF Floorplan Owner Revolving Trust | | | | | |
| | Series 2020-1 A 144A 0.68% 8/15/25 # | | 500,000 | | | 497,715 |
| Hyundai Auto Lease Securitization Trust | | | | | |
| | Series 2021-A B 144A 0.61% 10/15/25 # | | 4,100,000 | | | 4,079,372 |
| John Deere Owner Trust | | | | | |
| | Series 2019-A A3 | | | | | |
| | 2.91% 7/17/23 | | 779,300 | | | 783,555 |
| JPMorgan Chase Bank | | | | | |
| | Series 2020-2 B 144A 0.84% 2/25/28 # | | 1,521,011 | | | 1,518,169 |
| Mercedes-Benz Master Owner Trust | | | | | |
| | Series 2019-BA A 144A 2.61% 5/15/24 # | | 1,200,000 | | | 1,209,762 |
| MMAF Equipment Finance | | | | | |
| | Series 2020-BA A2 144A 0.38% 8/14/23 # | | 3,075,026 | | | 3,072,815 |
23
Table of Contents
Schedule of investments
Delaware Limited-Term Diversified Income Fund
| | | Principal | | | |
| | | | amount° | | | Value (US $) |
| Non-Agency Asset-Backed Securities (continued) | | | | | |
| Tesla Auto Lease Trust | | | | | |
| Series 2021-A B 144A 1.02% 3/20/25 # | | 4,725,000 | | $ | 4,705,725 |
| Towd Point Mortgage Trust | | | | | |
| Series 2015-6 A1B 144A 2.75% 4/25/55 #, ● | | 4,814 | | | 4,811 |
| Trafigura Securitisation Finance | | | | | |
| Series 2021-1A A2 144A 1.08% 1/15/25 # | | 3,850,000 | | | 3,801,948 |
| UNIFY Auto Receivables Trust | | | | | |
| Series 2021-1A A3 144A 0.51% 6/16/25 # | | 400,000 | | | 398,758 |
| Verizon Owner Trust | | | | | |
| Series 2020-C A 0.41% 4/21/25 | | 1,000,000 | | | 995,406 |
| Volkswagen Auto Lease Trust | | | | | |
| Series 2020-A A4 0.45% 7/21/25 | | 150,000 | | | 149,266 |
| Total Non-Agency Asset-Backed Securities (cost $31,725,008) | | | | | 31,561,355 |
| |
| Loan Agreements – 0.19% | | | | | |
| Applied Systems 1st Lien 3.50% (LIBOR01M + 3.00%) 9/19/24 ● | | 244,033 | | | 244,243 |
| AssuredPartners 3.605% (LIBOR01M + 3.50%) 2/12/27 ● | | 259,198 | | | 257,578 |
| Charter Communications Operating Tranche B2 1.85% (LIBOR01M | | | | | |
| + 1.75%) 2/1/27 ● | | 240,060 | | | 238,064 |
| Gardner Denver Tranche B-1 1.854% (LIBOR01M + 1.75%) | | | | | |
| 3/1/27 ● | | 204,622 | | | 202,720 |
| Total Loan Agreements (cost $942,102) | | | | | 942,605 |
| |
| Sovereign Bonds – 0.22%Δ | | | | | |
| Croatia – 0.04% | | | | | |
| Croatia Government International Bond 144A 5.50% 4/4/23 # | | 200,000 | | | 211,536 |
| | | | | | 211,536 |
| Nigeria – 0.05% | | | | | |
| Nigeria Government International Bond 5.625% 6/27/22 | | 250,000 | | | 253,110 |
| | | | | | 253,110 |
| Saudi Arabia – 0.05% | | | | | |
| Kingdom of Saudi Arabia Sukuk 144A 2.894% 4/20/22 # | | 250,000 | | | 251,938 |
| | | | | | 251,938 |
| Turkey – 0.04% | | | | | |
| Turkiye Ihracat Kredi Bankasi 144A 5.75% 7/6/26 # | | 200,000 | | | 183,914 |
| | | | | | 183,914 |
24
Table of Contents
| | | Principal | | | |
| | | | amount° | | Value (US $) |
| Sovereign BondsΔ (continued) | | | | | |
| Uzbekistan – 0.04% | | | | | |
| Republic of Uzbekistan International Bond 144A 4.75% 2/20/24 # | | 200,000 | | $ | 208,459 |
| | | | | | 208,459 |
| Total Sovereign Bonds (cost $1,110,474) | | | | | 1,108,957 |
| |
| US Treasury Obligations – 12.43% | | | | | |
| US Treasury Notes | | | | | |
| 0.375% 9/15/24 | | 1,060,000 | | | 1,045,135 |
| 0.75% 12/31/23 | | 12,205,000 | | | 12,208,337 |
| 1.00% 12/15/24 | | 47,790,000 | | | 47,847,869 |
| Total US Treasury Obligations (cost $61,076,593) | | | | | 61,101,341 |
| |
| | | Number of | | | |
| | | shares | | | |
| Short-Term Investments – 2.29% | | | | | |
| Money Market Mutual Funds – 2.29% | | | | | |
| BlackRock FedFund – Institutional Shares (seven-day effective | | | | | |
| yield 0.03%) | | 2,809,357 | | | 2,809,357 |
| Fidelity Investments Money Market Government Portfolio – Class I | | | | | |
| (seven-day effective yield 0.01%) | | 2,809,357 | | | 2,809,357 |
| GS Financial Square Government Fund – Institutional Shares | | | | | |
| (seven-day effective yield 0.02%) | | 2,809,357 | | | 2,809,357 |
| Morgan Stanley Government Portfolio – Institutional Share Class | | | | | |
| (seven-day effective yield 0.03%) | | 2,809,357 | | | 2,809,357 |
| Total Short-Term Investments (cost $11,237,428) | | | | | 11,237,428 |
| Total Value of Securities—99.47% | | | | | |
| (cost $487,350,230) | | | | $ | 489,127,522 |
| ° | Principal amount shown is stated in USD unless noted that the security is denominated in another currency. |
| ◆ | Pass Through Agreement. Security represents the contractual right to receive a proportionate amount of underlying payments due to the counterparty pursuant to various agreements related to the rescheduling of obligations and the exchange of certain notes. |
25
Table of Contents
Schedule of investments
Delaware Limited-Term Diversified Income Fund
| ● | Variable rate investment. Rates reset periodically. Rate shown reflects the rate in effect at December 31, 2021. For securities based on a published reference rate and spread, the reference rate and spread are indicated in their descriptions. The reference rate descriptions (i.e. LIBOR03M, LIBOR06M, etc.) used in this report are identical for different securities, but the underlying reference rates may differ due to the timing of the reset period. Certain variable rate securities are not based on a published reference rate and spread but are determined by the issuer or agent and are based on current market conditions, or for mortgage-backed securities, are impacted by the individual mortgages which are paying off over time. These securities do not indicate a reference rate and spread in their descriptions. |
| # | Security exempt from registration under Rule 144A of the Securities Act of 1933, as amended. At December 31, 2021, the aggregate value of Rule 144A securities was $161,664,909, which represents 32.88% of the Fund’s net assets. See Note 11 in “Notes to financial statements.” |
| µ | Fixed to variable rate investment. The rate shown reflects the fixed rate in effect at December 31, 2021. Rate will reset at a future date. |
| ψ | Perpetual security. Maturity date represents next call date. |
| ‡ | Non-income producing security. Security is currently in default. |
| Δ | Securities have been classified by country of risk. |
The following futures contracts were outstanding at December 31, 2021:1
Futures Contracts
Exchange-Traded
| | | | | | | | | | | | | | | | | | Variation |
| | | | | | | | | | | | | | | | | | Margin |
| | | | | | | | Notional | | | | Value/ | | Due from |
| | | | Notional | | Cost | | Expiration | | Unrealized | | (Due to) |
| Contracts to Buy (Sell) | | Amount | | (Proceeds) | | Date | | Depreciation | | Brokers |
| 113 | | US Treasury 2 yr Notes | | $ | 24,653,422 | | | $ | 24,671,340 | | | 3/31/22 | | $ | (17,918 | ) | | $ | 5,297 | |
| 78 | | US Treasury 3 yr Notes | | | 17,773,031 | | | | 17,796,978 | | | 3/31/22 | | | (23,947 | ) | | | 7,312 | |
| (30) | | US Treasury 5 yr Notes | | | (3,629,296 | ) | | | (3,613,991 | ) | | 3/31/22 | | | (15,305 | ) | | | (2,109 | ) |
| Total Futures Contracts | | | | | | $ | 38,854,327 | | | | | $ | (57,170 | ) | | $ | 10,500 | |
The use of futures contracts involves elements of market risk and risks in excess of the amounts disclosed in these financial statements. The notional amounts presented above represent the Fund’s total exposure in such contracts, whereas only the variation margin is reflected in the Fund’s net assets.
| 1 | See Note 9 in “Notes to financial statements.” |
| Summary of abbreviations: |
| CLO – Collateralized Loan Obligation |
| DAC – Designated Activity Company |
| DIFC – Dubai International Financial Centre |
| FREMF – Freddie Mac Multifamily |
26
Table of Contents
| Summary of abbreviations: (continued) |
| GNMA – Government National Mortgage Association |
| GS – Goldman Sachs |
| ICE – Intercontinental Exchange, Inc. |
| LIBOR – London interbank offered rate |
| LIBOR01M – ICE LIBOR USD 1 Month |
| LIBOR03M – ICE LIBOR USD 3 Month |
| LIBOR06M – ICE LIBOR USD 6 Month |
| REMIC – Real Estate Mortgage Investment Conduit |
| S.F. – Single Family |
| SOFR – Secured Overnight Financing Rate |
| USD – US Dollar |
| yr – Year |
See accompanying notes, which are an integral part of the financial statements.
27
Table of Contents
| Statement of assets and liabilities | |
| Delaware Limited-Term Diversified Income Fund | December 31, 2021 |
| Assets: | | | | |
| | Investments, at value* | | $ | 489,127,522 | |
| Cash | | | 763,710 | |
| Cash collateral due from brokers | | | 165,605 | |
| Dividends and interest receivable | | | 2,289,985 | |
| Receivable for fund shares sold | | | 1,413,338 | |
| Variation margin due from broker on futures contracts | | | 10,500 | |
| Other assets | | | 3,336 | |
| Total Assets | | | 493,773,996 | |
| Liabilities: | | | | |
| Payable for fund shares redeemed | | | 1,593,003 | |
| Investment management fees payable to affiliates | | | 96,421 | |
| Distribution payable | | | 95,464 | |
| Other accrued expenses | | | 78,368 | |
| Dividend disbursing and transfer agent fees and expenses payable to | | | | |
| non-affiliates | | | 74,660 | |
| Distribution fees payable to affiliates | | | 43,265 | |
| Reports and statements to shareholders expenses payable to non-affiliates | | | 38,816 | |
| Audit and tax fees payable | | | 5,850 | |
| Dividend disbursing and transfer agent fees and expenses payable to affiliates | | | 3,733 | |
| Accounting and administration expenses payable to affiliates | | | 1,885 | |
| Trustees’ fees and expenses payable to affiliates | | | 1,311 | |
| Legal fees payable to affiliates | | | 665 | |
| Reports and statements to shareholders expenses payable to affiliates | | | 436 | |
| Total Liabilities | | | 2,033,877 | |
| Total Net Assets | | $ | 491,740,119 | |
| |
| Net Assets Consist of: | | | | |
| Paid-in capital | | $ | 566,305,300 | |
| Total distributable earnings (loss) | | | (74,565,181 | ) |
| Total Net Assets | | $ | 491,740,119 | |
28
Table of Contents
Net Asset Value
| Class A: | | | | |
| Net assets | | $ | 260,162,139 | |
| Shares of beneficial interest outstanding, unlimited authorization, no par | | | 31,525,344 | |
| Net asset value per share | | $ | 8.25 | |
| Sales charge | | | 2.75 | % |
| Offering price per share, equal to net asset value per share / (1 - sales charge) | | $ | 8.48 | |
| | | | | |
| Class C: | | | | |
| Net assets | | $ | 11,354,622 | |
| Shares of beneficial interest outstanding, unlimited authorization, no par | | | 1,377,442 | |
| Net asset value per share | | $ | 8.24 | |
| | | | | |
| Class R: | | | | |
| Net assets | | $ | 842,782 | |
| Shares of beneficial interest outstanding, unlimited authorization, no par | | | 102,166 | |
| Net asset value per share | | $ | 8.25 | |
| | | | | |
| Institutional Class: | | | | |
| Net assets | | $ | 213,457,279 | |
| Shares of beneficial interest outstanding, unlimited authorization, no par | | | 25,883,435 | |
| Net asset value per share | | $ | 8.25 | |
| | | | | |
| Class R6: | | | | |
| Net assets | | $ | 5,923,297 | |
| Shares of beneficial interest outstanding, unlimited authorization, no par | | | 718,629 | |
| Net asset value per share | | $ | 8.24 | |
____________________ | | | | |
| *Investments, at cost | | $ | 487,350,230 | |
See accompanying notes, which are an integral part of the financial statements.
29
Table of Contents
| Statement of operations | |
| Delaware Limited-Term Diversified Income Fund | Year ended December 31, 2021 |
| Investment Income: | | | |
| | Interest | $ | 6,217,140 | |
| Dividends | | 3,488 | |
| | | | 6,220,628 | |
| | | | | |
| Expenses: | | | |
| Management fees | | 2,176,864 | |
| Distribution expenses — Class A | | 452,543 | |
| Distribution expenses — Class C | | 122,814 | |
| Distribution expenses — Class R | | 4,498 | |
| Dividend disbursing and transfer agent fees and expenses | | 395,304 | |
| Accounting and administration expenses | | 111,372 | |
| Reports and statements to shareholders expenses | | 76,064 | |
| Legal fees | | 66,824 | |
| Registration fees | | 64,485 | |
| Audit and tax fees | | 53,204 | |
| Custodian fees | | 19,169 | |
| Trustees’ fees and expenses | | 14,574 | |
| Other | | 59,254 | |
| | | | 3,616,969 | |
| Less expenses waived | | (1,336,847 | ) |
| Less waived distribution expenses — Class A | | (181,017 | ) |
| Less expenses paid indirectly | | (393 | ) |
| Total operating expenses | | 2,098,712 | |
| Net Investment Income | | 4,121,916 | |
| Net Realized and Unrealized Gain (Loss): | | | |
| Net realized gain (loss) on: | | | |
| | Investments | | 702,335 | |
| | Foreign currencies | | 12,539 | |
| | Foreign currency exchange contracts | | (15,762 | ) |
| | Futures contracts | | 118,578 | |
| Net realized gain | | 817,690 | |
| | | | | |
| Net change in unrealized appreciation (depreciation) of: | | | |
| | Investments | | (7,674,914 | ) |
| | Foreign currency exchange contracts | | 70,147 | |
| | Futures contracts | | (53,678 | ) |
| Net change in unrealized appreciation (depreciation) | | (7,658,445 | ) |
| Net Realized and Unrealized Loss | | (6,840,755 | ) |
| Net Decrease in Net Assets Resulting from Operations | $ | (2,718,839 | ) |
See accompanying notes, which are an integral part of the financial statements.
30
Table of Contents
Statements of changes in net assets
Delaware Limited-Term Diversified Income Fund
| | | | Year ended |
| | | | 12/31/21 | | 12/31/20 |
| Increase (Decrease) in Net Assets from Operations: | | | | | | | | |
| | Net investment income | | $ | 4,121,916 | | | $ | 5,757,934 | |
| Net realized gain | | | 817,690 | | | | 6,571,148 | |
| Net change in unrealized appreciation (depreciation) | | | (7,658,445 | ) | | | 4,674,281 | |
| Net increase (decrease) in net assets resulting from | | | | | | | | |
| | operations | | | (2,718,839 | ) | | | 17,003,363 | |
| | | | | | | | | | |
| Dividends and Distributions to Shareholders from: | | | | | | | | |
| Distributable earnings: | | | | | | | | |
| | Class A | | | (3,260,438 | ) | | | (2,426,621 | ) |
| | Class C | | | (121,591 | ) | | | (279,518 | ) |
| | Class R | | | (13,239 | ) | | | (17,729 | ) |
| | Institutional Class | | | (4,673,033 | ) | | | (4,532,737 | ) |
| | Class R6 | | | (94,746 | ) | | | (76,898 | ) |
| | | | | | | | | | |
| Return of capital: | | | | | | | | |
| | Class A | | | (19,538 | ) | | | (487,399 | ) |
| | Class C | | | (854 | ) | | | (74,277 | ) |
| | Class R | | | (63 | ) | | | (3,112 | ) |
| | Institutional Class | | | (16,042 | ) | | | (864,604 | ) |
| | Class R6 | | | (445 | ) | | | (15,294 | ) |
| | | | | (8,199,989 | ) | | | (8,778,189 | ) |
| | | | | | | | | | |
| Capital Share Transactions: | | | | | | | | |
| Proceeds from shares sold: | | | | | | | | |
| | Class A | | | 23,366,159 | | | | 85,532,172 | |
| | Class C | | | 2,553,201 | | | | 4,695,605 | |
| | Class R | | | 106,182 | | | | 327,423 | |
| | Institutional Class | | | 64,370,934 | | | | 112,963,850 | |
| | Class R6 | | | 2,031,791 | | | | 2,935,649 | |
| Net assets from merger:1 | | | | | | | | |
| | Class A | | | 135,168,861 | | | | — | |
| | Institutional Class | | | 5,634,030 | | | | — | |
| | Class R6 | | | 132,707 | | | | — | |
31
Table of Contents
Statements of changes in net assets
Delaware Limited-Term Diversified Income Fund
| | | | Year ended |
| | | | 12/31/21 | | 12/31/20 |
| | Net asset value of shares issued upon reinvestment of | | | | | | | | |
| | dividends and distributions: | | | | | | | | |
| | Class A | | $ | 3,171,705 | | | $ | 2,698,399 | |
| | Class C | | | 119,435 | | | | 350,010 | |
| | Class R | | | 12,682 | | | | 21,043 | |
| | Institutional Class | | | 3,582,151 | | | | 4,759,849 | |
| | Class R6 | | | 94,316 | | | | 91,011 | |
| | | | | 240,344,154 | | | | 214,375,011 | |
| Capital Share Transactions (continued): | | | | | | | | |
| Cost of shares redeemed: | | | | | | | | |
| | Class A | | | (44,821,491 | ) | | | (80,548,004 | ) |
| | Class C | | | (13,601,718 | ) | | | (19,985,927 | ) |
| | Class R | | | (201,251 | ) | | | (1,014,470 | ) |
| | Institutional Class | | | (117,303,090 | ) | | | (109,466,013 | ) |
| | Class R6 | | | (874,783 | ) | | | (1,555,843 | ) |
| | | | | (176,802,333 | ) | | | (212,570,257 | ) |
| Increase in net assets derived from capital share transactions | | | 63,541,821 | | | | 1,804,754 | |
| Net Increase in Net Assets | | | 52,622,993 | | | | 10,029,928 | |
| | | | | | | | | | |
| Net Assets: | | | | | | | | |
| Beginning of year | | | 439,117,126 | | | | 429,087,198 | |
| End of year | | $ | 491,740,119 | | | $ | 439,117,126 | |
| 1 | See Note 7 in “Notes to financial statements.” |
See accompanying notes, which are an integral part of the financial statements.
32
Table of Contents
Financial highlights
Delaware Limited-Term Diversified Income Fund Class A
Selected data for each share of the Fund outstanding throughout each period were as follows:
| Net asset value, beginning of period |
| |
| Income (loss) from investment operations: |
| Net investment income1 |
| Net realized and unrealized gain (loss) |
| Total from investment operations |
| |
| Less dividends and distributions from: |
| Net investment income |
| Return of capital |
| Total dividends and distributions |
| |
| Net asset value, end of period |
| |
| Total return3 |
| |
| Ratios and supplemental data: |
| Net assets, end of period (000 omitted) |
| Ratio of expenses to average net assets4 |
| Ratio of expenses to average net assets prior to fees waived4 |
| Ratio of net investment income to average net assets |
| Ratio of net investment income to average net assets prior to fees waived |
| Portfolio turnover |
| 1 | Calculated using average shares outstanding. |
| 2 | Amount is less than $(0.005) per share. |
| 3 | Total return is based on the change in net asset value of a share during the period and assumes reinvestment of dividends and distributions at net asset value and does not reflect the impact of a sales charge. Total return during all of the periods shown reflects waivers by the manager and/or distributor. Performance would have been lower had the waivers not been in effect. |
| 4 | Expense ratios do not include expenses of the Underlying Funds in which the Fund invests. |
See accompanying notes, which are an integral part of the financial statements.
34
Table of Contents
| Year ended | |
| 12/31/21 | | 12/31/20 | | 12/31/19 | | 12/31/18 | | 12/31/17 | |
| $ | 8.44 | | | $ | 8.27 | | | $ | 8.14 | | | $ | 8.46 | | | $ | 8.48 | | |
| | | | | | | | | | | | | | | | | | | | | |
| | | | | | | | | | | | | | | | | | | | | |
| | 0.07 | | | | 0.11 | | | | 0.21 | | | | 0.20 | | | | 0.16 | | |
| | (0.11 | ) | | | 0.23 | | | | 0.15 | | | | (0.29 | ) | | | 0.02 | | |
| | (0.04 | ) | | | 0.34 | | | | 0.36 | | | | (0.09 | ) | | | 0.18 | | |
| | | | | | | | | | | | | | | | | | | | | |
| | | | | | | | | | | | | | | | | | | | | |
| | (0.15 | ) | | | (0.14 | ) | | | (0.20 | ) | | | (0.19 | ) | | | (0.15 | ) | |
| | — | 2 | | | (0.03 | ) | | | (0.03 | ) | | | (0.04 | ) | | | (0.05 | ) | |
| | (0.15 | ) | | | (0.17 | ) | | | (0.23 | ) | | | (0.23 | ) | | | (0.20 | ) | |
| | | | | | | | | | | | | | | | | | | | | |
| $ | 8.25 | | | $ | 8.44 | | | $ | 8.27 | | | $ | 8.14 | | | $ | 8.46 | | |
| | | | | | | | | | | | | | | | | | | | | |
| | (0.45% | ) | | | 4.16% | | | | 4.51% | | | | (1.08% | ) | | | 2.11% | | |
| | | | | | | | | | | | | | | | | | | | | |
| | | | | | | | | | | | | | | | | | | | | |
| $ | 260,162 | | | $ | 148,185 | | | $ | 137,798 | | | $ | 168,003 | | | $ | 382,353 | | |
| | 0.54% | | | | 0.54% | | | | 0.54% | | | | 0.60% | | | | 0.74% | | |
| | 0.95% | | | | 0.96% | | | | 0.96% | | | | 0.95% | | | | 0.94% | | |
| | 0.89% | | | | 1.32% | | | | 2.58% | | | | 2.46% | | | | 1.95% | | |
| | 0.48% | | | | 0.90% | | | | 2.16% | | | | 2.11% | | | | 1.75% | | |
| | 205% | | | | 224% | | | | 123% | | | | 130% | | | | 151% | | |
35
Table of Contents
Financial highlights
Delaware Limited-Term Diversified Income Fund Class C
Selected data for each share of the Fund outstanding throughout each period were as follows:
| Net asset value, beginning of period |
| |
| Income (loss) from investment operations: |
| Net investment income1 |
| Net realized and unrealized gain (loss) |
| Total from investment operations |
| |
| Less dividends and distributions from: |
| Net investment income |
| Return of capital |
| Total dividends and distributions |
| |
| Net asset value, end of period |
| |
| Total return3 |
| |
| Ratios and supplemental data: |
| Net assets, end of period (000 omitted) |
| Ratio of expenses to average net assets4 |
| Ratio of expenses to average net assets prior to fees waived4 |
| Ratio of net investment income to average net assets |
| Ratio of net investment income (loss) to average net assets prior to fees waived |
| Portfolio turnover |
| 1 | Calculated using average shares outstanding. |
| 2 | Amount is less than $(0.005) per share. |
| 3 | Total return is based on the change in net asset value of a share during the period and assumes reinvestment of dividends and distributions at net asset value and does not reflect the impact of a sales charge. Total return during all of the periods shown reflects a waiver by the manager. Performance would have been lower had the waiver not been in effect. |
| 4 | Expense ratios do not include expenses of the Underlying Funds in which the Fund invests. |
See accompanying notes, which are an integral part of the financial statements.
36
Table of Contents
| Year ended | |
| | 12/31/21 | | 12/31/20 | | 12/31/19 | | 12/31/18 | | 12/31/17 | |
| $ | 8.44 | | | $ | 8.27 | | | $ | 8.14 | | | $ | 8.45 | | | $ | 8.47 | | |
| | | | | | | | | | | | | | | | | | | | | |
| | | | | | | | | | | | | | | | | | | | | |
| | — | | | | 0.04 | | | | 0.14 | | | | 0.13 | | | | 0.09 | | |
| | (0.12 | ) | | | 0.23 | | | | 0.15 | | | | (0.28 | ) | | | 0.02 | | |
| | (0.12 | ) | | | 0.27 | | | | 0.29 | | | | (0.15 | ) | | | 0.11 | | |
| | | | | | | | | | | | | | | | | | | | | |
| | | | | | | | | | | | | | | | | | | | | |
| | (0.08 | ) | | | (0.07 | ) | | | (0.13 | ) | | | (0.12 | ) | | | (0.08 | ) | |
| | — | 2 | | | (0.03 | ) | | | (0.03 | ) | | | (0.04 | ) | | | (0.05 | ) | |
| | (0.08 | ) | | | (0.10 | ) | | | (0.16 | ) | | | (0.16 | ) | | | (0.13 | ) | |
| | | | | | | | | | | | | | | | | | | | | |
| $ | 8.24 | | | $ | 8.44 | | | $ | 8.27 | | | $ | 8.14 | | | $ | 8.45 | | |
| | | | | | | | | | | | | | | | | | | | | |
| | (1.41% | ) | | | 3.28% | | | | 3.63% | | | | (1.80% | ) | | | 1.25% | | |
| | | | | | | | | | | | | | | | | | | | | |
| | | | | | | | | | | | | | | | | | | | | |
| $ | 11,355 | | | $ | 22,565 | | | $ | 36,977 | | | $ | 64,324 | | | $ | 89,456 | | |
| | 1.39% | | | | 1.39% | | | | 1.39% | | | | 1.45% | | | | 1.59% | | |
| | 1.70% | | | | 1.71% | | | | 1.71% | | | | 1.70% | | | | 1.69% | | |
| | 0.04% | | | | 0.47% | | | | 1.73% | | | | 1.61% | | | | 1.10% | | |
| | (0.27% | ) | | | 0.15% | | | | 1.41% | | | | 1.36% | | | | 1.00% | | |
| | 205% | | | | 224% | | | | 123% | | | | 130% | | | | 151% | | |
37
Table of Contents
Financial highlights
Delaware Limited-Term Diversified Income Fund Class R
Selected data for each share of the Fund outstanding throughout each period were as follows:
| Net asset value, beginning of period |
| |
| Income (loss) from investment operations: |
| Net investment income1 |
| Net realized and unrealized gain (loss) |
| Total from investment operations |
| |
| Less dividends and distributions from: |
| Net investment income |
| Return of capital |
| Total dividends and distributions |
| |
| Net asset value, end of period |
| |
| Total return3 |
| |
| Ratios and supplemental data: |
| Net assets, end of period (000 omitted) |
| Ratio of expenses to average net assets4 |
| Ratio of expenses to average net assets prior to fees waived4 |
| Ratio of net investment income to average net assets |
| Ratio of net investment income to average net assets prior to fees waived |
| Portfolio turnover |
| 1 | Calculated using average shares outstanding. |
| 2 | Amount is less than $(0.005) per share. |
| 3 | Total return is based on the change in net asset value of a share during the period and assumes reinvestment of dividends and distributions at net asset value. Total return during all of the periods shown reflects a waiver by the manager. Performance would have been lower had the waiver not been in effect. |
| 4 | Expense ratios do not include expenses of the Underlying Funds in which the Fund invests. |
See accompanying notes, which are an integral part of the financial statements.
38
Table of Contents
| Year ended |
| 12/31/21 | | 12/31/20 | | 12/31/19 | | 12/31/18 | | 12/31/17 |
| $ | 8.44 | | | $ | 8.28 | | | $ | 8.14 | | | $ | 8.46 | | | $ | 8.48 | |
| |
| | | | | | | | | | | | | | | | | | | | |
| | 0.04 | | | | 0.08 | | | | 0.18 | | | | 0.18 | | | | 0.14 | |
| | (0.11 | ) | | | 0.22 | | | | 0.16 | | | | (0.30 | ) | | | 0.01 | |
| | (0.07 | ) | | | 0.30 | | | | 0.34 | | | | (0.12 | ) | | | 0.15 | |
| |
| |
| | (0.12 | ) | | | (0.11 | ) | | | (0.17 | ) | | | (0.16 | ) | | | (0.12 | ) |
| | — | 2 | | | (0.03 | ) | | | (0.03 | ) | | | (0.04 | ) | | | (0.05 | ) |
| | (0.12 | ) | | | (0.14 | ) | | | (0.20 | ) | | | (0.20 | ) | | | (0.17 | ) |
| |
| $ | 8.25 | | | $ | 8.44 | | | $ | 8.28 | | | $ | 8.14 | | | $ | 8.46 | |
| |
| | (0.80 | %) | | | 3.66 | % | | | 4.27 | % | | | (1.43 | %) | | | 1.76 | % |
| |
| |
| $ | 843 | | | $ | 946 | | | $ | 1,586 | | | $ | 2,753 | | | $ | 3,819 | |
| | 0.89 | % | | | 0.89 | % | | | 0.89 | % | | | 0.95 | % | | | 1.09 | % |
| | 1.20 | % | | | 1.21 | % | | | 1.21 | % | | | 1.20 | % | | | 1.19 | % |
| | 0.54 | % | | | 0.97 | % | | | 2.23 | % | | | 2.11 | % | | | 1.60 | % |
| | 0.23 | % | | | 0.65 | % | | | 1.91 | % | | | 1.86 | % | | | 1.50 | % |
| | 205 | % | | | 224 | % | | | 123 | % | | | 130 | % | | | 151 | % |
39
Table of Contents
Financial highlights
Delaware Limited-Term Diversified Income Fund Institutional Class
Selected data for each share of the Fund outstanding throughout each period were as follows:
| Net asset value, beginning of period |
| |
| Income (loss) from investment operations: |
| Net investment income1 |
| Net realized and unrealized gain (loss) |
| Total from investment operations |
| |
| Less dividends and distributions from: |
| Net investment income |
| Return of capital |
| Total dividends and distributions |
| |
| Net asset value, end of period |
| |
| Total return3 |
| |
| Ratios and supplemental data: |
| Net assets, end of period (000 omitted) |
| Ratio of expenses to average net assets4 |
| Ratio of expenses to average net assets prior to fees waived4 |
| Ratio of net investment income to average net assets |
| Ratio of net investment income to average net assets prior to fees waived |
| Portfolio turnover |
| 1 | Calculated using average shares outstanding. |
| 2 | Amount is less than $(0.005) per share. |
| 3 | Total return is based on the change in net asset value of a share during the period and assumes reinvestment of dividends and distributions at net asset value. Total return during all of the periods shown reflects a waiver by the manager. Performance would have been lower had the waiver not been in effect. |
| 4 | Expense ratios do not include expenses of the Underlying Funds in which the Fund invests. |
See accompanying notes, which are an integral part of the financial statements.
40
Table of Contents
| Year ended |
| 12/31/21 | | 12/31/20 | | 12/31/19 | | 12/31/18 | | 12/31/17 |
| $ | 8.44 | | | $ | 8.27 | | | $ | 8.14 | | | $ | 8.46 | | | $ | 8.47 | |
| |
| |
| | 0.09 | | | | 0.12 | | | | 0.23 | | | | 0.22 | | | | 0.18 | |
| | (0.12 | ) | | | 0.23 | | | | 0.15 | | | | (0.30 | ) | | | 0.02 | |
| | (0.03 | ) | | | 0.35 | | | | 0.38 | | | | (0.08 | ) | | | 0.20 | |
| |
| |
| | (0.16 | ) | | | (0.15 | ) | | | (0.22 | ) | | | (0.20 | ) | | | (0.16 | ) |
| | — | 2 | | | (0.03 | ) | | | (0.03 | ) | | | (0.04 | ) | | | (0.05 | ) |
| | (0.16 | ) | | | (0.18 | ) | | | (0.25 | ) | | | (0.24 | ) | | | (0.21 | ) |
| |
| $ | 8.25 | | | $ | 8.44 | | | $ | 8.27 | | | $ | 8.14 | | | $ | 8.46 | |
| |
| | (0.30 | %) | | | 4.31 | % | | | 4.67 | % | | | (0.93 | %) | | | 2.39 | % |
| |
| |
| $ | 213,457 | | | $ | 262,775 | | | $ | 249,667 | | | $ | 240,614 | | | $ | 266,274 | |
| | 0.39 | % | | | 0.39 | % | | | 0.39 | % | | | 0.45 | % | | | 0.59 | % |
| | 0.70 | % | | | 0.71 | % | | | 0.71 | % | | | 0.70 | % | | | 0.69 | % |
| | 1.04 | % | | | 1.47 | % | | | 2.73 | % | | | 2.61 | % | | | 2.10 | % |
| | 0.73 | % | | | 1.15 | % | | | 2.41 | % | | | 2.36 | % | | | 2.00 | % |
| | 205 | % | | | 224 | % | | | 123 | % | | | 130 | % | | | 151 | % |
41
Table of Contents
Financial highlights
Delaware Limited-Term Diversified Income Fund Class R6
Selected data for each share of the Fund outstanding throughout each period were as follows:
| Net asset value, beginning of period |
| |
| Income (loss) from investment operations: |
| Net investment income2 |
| Net realized and unrealized gain (loss) |
| Total from investment operations |
| |
| Less dividends and distributions from: |
| Net investment income |
| Return of capital |
| Total dividends and distributions |
| Net asset value, end of period |
| Total return4 |
| Ratios and supplemental data: |
| Net assets, end of period (000 omitted) |
| Ratio of expenses to average net assets5 |
| Ratio of expenses to average net assets prior to fees waived5 |
| Ratio of net investment income to average net assets |
| Ratio of net investment income to average net assets prior to fees waived |
| Portfolio turnover |
| 1 | Date of commencement of operations; ratios have been annualized and total return has not been annualized. |
| 2 | Calculated using average shares outstanding. |
| 3 | Amount is less than $(0.005) per share. |
| 4 | Total return is based on the change in net asset value of a share during the period and assumes reinvestment of dividends and distributions at net asset value. Total return during all of the periods shown reflects a waiver by the manager. Performance would have been lower had the waiver not been in effect. |
| 5 | Expense ratios do not include expenses of the Underlying Funds in which the Fund invests. |
| 6 | Portfolio turnover is representative of the Fund for the entire year. |
See accompanying notes, which are an integral part of the financial statements.
42
Table of Contents
| | | 5/1/171 |
| Year ended | | to |
| 12/31/21 | | 12/31/20 | | 12/31/19 | | 12/31/18 | | 12/31/17 |
| $ | 8.44 | | | $ | 8.27 | | | $ | 8.14 | | | $ | 8.45 | | | $ | 8.50 | | |
| | |
| | |
| | 0.09 | | | | 0.13 | | | | 0.23 | | | | 0.22 | | | | 0.12 | | |
| | (0.12 | ) | | | 0.23 | | | | 0.15 | | | | (0.28 | ) | | | (0.03 | ) | |
| | (0.03 | ) | | | 0.36 | | | | 0.38 | | | | (0.06 | ) | | | 0.09 | | |
| | |
| | |
| | (0.17 | ) | | | (0.16 | ) | | | (0.22 | ) | | | (0.21 | ) | | | (0.09 | ) | |
| | — | 3 | | | (0.03 | ) | | | (0.03 | ) | | | (0.04 | ) | | | (0.05 | ) | |
| | (0.17 | ) | | | (0.19 | ) | | | (0.25 | ) | | | (0.25 | ) | | | (0.14 | ) | |
| $ | 8.24 | | | $ | 8.44 | | | $ | 8.27 | | | $ | 8.14 | | | $ | 8.45 | | |
| | (0.36 | %) | | | 4.38 | % | | | 4.74 | % | | | (0.75 | %) | | | 1.10 | % | |
| | |
| $ | 5,923 | | | $ | 4,646 | | | $ | 3,059 | | | $ | 1,631 | | | $ | 1,634 | | |
| | 0.32 | % | | | 0.32 | % | | | 0.32 | % | | | 0.38 | % | | | 0.52 | % | |
| | 0.63 | % | | | 0.63 | % | | | 0.64 | % | | | 0.62 | % | | | 0.61 | % | |
| | 1.10 | % | | | 1.54 | % | | | 2.80 | % | | | 2.68 | % | | | 2.11 | % | |
| | 0.79 | % | | | 1.23 | % | | | 2.48 | % | | | 2.44 | % | | | 2.02 | % | |
| | 205 | % | | | 224 | % | | | 123 | % | | | 130 | % | | | 151 | % | 6 |
43
Table of Contents
| Notes to financial statements | |
| Delaware Limited-Term Diversified Income Fund | December 31, 2021 |
Delaware Group® Limited-Term Government Funds (Trust) is organized as a Delaware statutory trust and offers three series: Delaware Limited-Term Diversified Income Fund, Delaware Tax-Free New Jersey Fund, and Delaware Tax-Free Oregon Fund. These financial statements pertain to Delaware Limited-Term Diversified Income Fund (Fund). The Trust is an open-end investment company. The Fund is considered diversified under the Investment Company Act of 1940, as amended, and offers Class A, Class C, Class R, Institutional Class, and Class R6 shares. Class A shares are sold with a maximum front-end sales charge of 2.75%. There is no front-end sales charge when you purchase $1,000,000 or more of Class A shares. However, if Delaware Distributors, L.P. (DDLP) paid your financial intermediary a commission on your purchase of $1,000,000 or more of Class A shares, for shares purchased prior to July 1, 2020, you will have to pay a limited contingent deferred sales charge (Limited CDSC) of 1.00% if you redeem these shares within the first year after your purchase and 0.50% if you redeem these shares within the second year; or for shares purchased on or after July 1, 2020, you will have to pay a Limited CDSC of 1.00% if you redeem these shares within the first 18 months after your purchase; unless a specific waiver of the Limited CDSC applies. Class C shares are sold with a contingent deferred sales charge (CDSC) of 1.00%, which will be incurred if redeemed during the first 12 months. Class R, Institutional Class, and Class R6 shares are not subject to a sales charge and are offered for sale exclusively to certain eligible investors. In addition, Class R6 shares do not pay any service fees, sub-accounting fees, and/or sub-transfer agency fees to any brokers, dealers, or other financial intermediaries.
1. Significant Accounting Policies
The Fund follows accounting and reporting guidance under Financial Accounting Standards Board (FASB) Accounting Standards Codification Topic 946, Financial Services — Investment Companies. The following accounting policies are in accordance with US generally accepted accounting principles (US GAAP) and are consistently followed by the Fund.
Security Valuation — Equity securities, except those traded on the Nasdaq Stock Market LLC (Nasdaq), are valued at the last quoted sales price as of the time of the regular close of the New York Stock Exchange on the valuation date. Equity securities traded on the Nasdaq are valued in accordance with the Nasdaq Official Closing Price, which may not be the last sales price. If, on a particular day, an equity security does not trade, the mean between the bid and ask prices will be used, which approximates fair value. Securities listed on a foreign exchange are normally valued at the last quoted sales price on the valuation date. Debt securities and credit default swap (CDS) contracts are valued based upon valuations provided by an independent pricing service or broker/counterparty and reviewed by management. To the extent current market prices are not available, the pricing service may take into account developments related to the specific security, as well as transactions in comparable securities. US government and agency securities are valued at the mean between the bid and ask prices, which approximates fair value. Valuations for fixed income securities utilize matrix systems, which reflect such factors as security prices, yields, maturities, and ratings, and are supplemented by dealer and exchange quotations. Open-end investment companies are valued at their published net asset value (NAV). For asset-backed securities, collateralized mortgage obligations (CMOs), commercial mortgage securities, and US government agency mortgage securities, pricing vendors utilize matrix pricing which considers
44
Table of Contents
prepayment speed, attributes of the collateral, yield or price of bonds of comparable quality, coupon, maturity, and type as well as broker/dealer-supplied prices. Swap prices are derived using daily swap curves and models that incorporate a number of market data factors, such as discounted cash flows, trades, and values of the underlying reference instruments. Foreign currency exchange contracts are valued at the mean between the bid and ask prices, which approximates fair value. Interpolated values are derived when the settlement date of the contract is an interim date for which quotations are not available. Futures contracts and options on futures contracts are valued at the daily quoted settlement prices. Generally, other securities and assets for which market quotations are not readily available are valued at fair value as determined in good faith under the direction of the Trust’s Board of Trustees (Board). In determining whether market quotations are readily available or fair valuation will be used, various factors will be taken into consideration, such as market closures or suspension of trading in a security. Restricted securities are valued at fair value using methods approved by the Board.
Federal and Foreign Income Taxes — No provision for federal income taxes has been made as the Fund intends to continue to qualify for federal income tax purposes as a regulated investment company under Subchapter M of the Internal Revenue Code of 1986, as amended, and make the requisite distributions to shareholders. The Fund evaluates tax positions taken or expected to be taken in the course of preparing the Fund’s tax returns to determine whether the tax positions are “more-likely-than-not” of being sustained by the applicable tax authority. Tax positions not deemed to meet the “more-likely-than-not” threshold are recorded as a tax benefit or expense in the current year. Management has analyzed the Fund’s tax positions taken or expected to be taken on the Fund’s federal income tax returns through the year ended December 31, 2021, and for all open tax years (years ended December 31, 2018–December 31, 2020), and has concluded that no provision for federal income tax is required in the Fund’s financial statements. In regard to foreign taxes only, the Fund has open tax years in certain foreign countries in which it invests that may date back to the inception of the Fund. If applicable, the Fund recognizes interest accrued on unrecognized tax benefits in interest expense and penalties in “Other” on the “Statement of operations.” During the year ended December 31, 2021, the Fund did not incur any interest or tax penalties.
Class Accounting — Investment income and common expenses are allocated to the various classes of the Fund on the basis of “settled shares” of each class in relation to the net assets of the Fund. Realized and unrealized gain (loss) on investments are allocated to the various classes of the Fund on the basis of daily net assets of each class. Distribution expenses relating to a specific class are charged directly to that class. Class R6 shares will not be allocated any expenses related to service fees, sub-accounting fees, and/or sub-transfer agency fees paid to brokers, dealers, or other financial intermediaries.
To Be Announced Trades (TBA) — The Fund may contract to purchase or sell securities for a fixed price at a transaction date beyond the customary settlement period (examples: when issued, delayed delivery, forward commitment, or TBA transactions) consistent with the Fund’s ability to manage its investment portfolio and meet redemption requests. These transactions involve a commitment by the Fund to purchase or sell securities for a predetermined price or yield with payment and delivery taking place more than three days in the future, or after a period longer than the customary settlement period for that type of security. No interest will be earned by the Fund on such purchases until the securities are delivered or the transaction is completed; however, the market value may change prior to delivery.
45
Table of Contents
Notes to financial statements
Delaware Limited-Term Diversified Income Fund
1. Significant Accounting Policies (continued)
Foreign Currency Transactions — Transactions denominated in foreign currencies are recorded at the prevailing exchange rates on the valuation date in accordance with the Fund’s prospectus. The value of all assets and liabilities denominated in foreign currencies is translated daily into US dollars at the exchange rate of such currencies against the US dollar. Transaction gains or losses resulting from changes in exchange rates during the reporting period or upon settlement of the foreign currency transaction are reported in operations for the current period. The Fund generally bifurcates that portion of realized gains and losses on investments in debt securities which is due to changes in foreign exchange rates from that which is due to changes in market prices of debt securities. That portion of gains (losses), attributable to changes in foreign exchange rates, is included on the “Statement of operations” under “Net realized gain (loss) on foreign currencies.” For foreign equity securities, these changes are included on the “Statement of operations” under “Net realized and unrealized gain (loss) on investments.” The Fund reports certain foreign currency related transactions as components of realized gains (losses) for financial reporting purposes, whereas such components are treated as ordinary income (loss) for federal income tax purposes.
Use of Estimates — The preparation of financial statements in conformity with US GAAP requires management to make estimates and assumptions that affect the fair value of investments, the reported amounts of assets and liabilities and disclosure of contingent assets and liabilities at the date of the financial statements, and the reported amounts of revenues and expenses during the reporting period. Actual results could differ from those estimates and the differences could be material.
Other — Expenses directly attributable to the Fund are charged directly to the Fund. Other expenses common to various funds within the Delaware Funds by Macquarie® (Delaware Funds) are generally allocated among such fund on the basis of average net assets. Management fees and certain other expenses are paid monthly. Security transactions are recorded on the date the securities are purchased or sold (trade date) for financial reporting purposes. Costs used in calculating realized gains and losses on the sale of investment securities are those of the specific securities sold. Dividend income is recorded on the ex-dividend date and interest income is recorded on the accrual basis. Discounts and premiums on debt securities are accreted or amortized to interest income, respectively, over the lives of the respective securities using the effective interest method. Premiums on callable debt securities are amortized to interest income to the earliest call date using the effective interest method. Realized gains (losses) on paydowns of asset- and mortgage-backed securities are classified as interest income. The Fund declares dividends daily from net investment income and pays the dividends monthly and declares and pays distributions from net realized gain on investments, if any, annually. The Fund may distribute more frequently, if necessary for tax purposes. Dividends and distributions, if any, are recorded on the ex-dividend date.
The Fund receives earnings credits from its custodian when positive cash balances are maintained, which may be used to offset custody fees. The expenses paid under this arrangement are included on the “Statement of operations” under “Custodian fees” with the corresponding expenses offset included under “Less expenses paid indirectly.” For the year ended December 31, 2021, the Fund earned $0 under this arrangement. There were no such earnings credits for the year ended December 31, 2021.
46
Table of Contents
The Fund receives earnings credits from its transfer agent when positive cash balances are maintained, which may be used to offset transfer agent fees. If the amount earned is greater than $1, the expenses paid under this arrangement are included on the “Statement of operations” under “Dividend disbursing and transfer agent fees and expenses” with the corresponding expenses offset included under “Less expenses paid indirectly.” For the year ended December 31, 2021, the Fund earned $393 under this arrangement.
2. Investment Management, Administration Agreements, and Other Transactions with Affiliates
In accordance with the terms of its investment management agreement, the Fund pays Delaware Management Company (DMC), a series of Macquarie Investment Management Business Trust and the investment manager, an annual fee which is calculated daily and paid monthly at the rates of 0.50% on the first $500 million of average daily net assets of the Fund, 0.475% on the next $500 million, 0.45% on the next $1.5 billion, and 0.425% on average daily net assets in excess of $2.5 billion.
DMC has contractually agreed to waive all or a portion, if any, of its management fee and/or pay/reimburse the Fund to the extent necessary to ensure total annual operating expenses (excluding any distribution and service (12b-1) fees, acquired fund fees and expenses, taxes, interest, short sale dividend and interest expenses, brokerage fees, certain insurance costs, and nonroutine expenses or costs, including, but not limited to, those relating to reorganizations, litigation, conducting shareholder meetings, and liquidations) do not exceed 0.39% of the Fund’s Class A, Class C, Class R, and Institutional Class average daily net assets and 0.32% of the Fund’s Class R6 shares average daily net assets January 1, 2021 through December 31, 2021.* For purposes of these waivers and reimbursements, nonroutine expenses may also include such additional costs and expenses, as may be agreed upon from time to time by the Board and DMC. These waivers and reimbursements apply only to expenses paid directly by the Fund and may be terminated only by agreement of DMC and the Fund. The waivers and reimbursements are accrued daily and received monthly.
DMC may seek investment advice and recommendations from its affiliates: Macquarie Investment Management Europe Limited, Macquarie Investment Management Austria Kapitalanlage AG, and Macquarie Investment Management Global Limited (MIMGL) (together, the “Affiliated Sub-Advisors”). The Manager may also permit these Affiliated Sub-Advisors to execute Fund security trades on behalf of the Manager and exercise investment discretion for securities in certain markets where DMC believes it will be beneficial to utilize an Affiliated Sub-Advisor’s specialized market knowledge. Although the Affiliated Sub-Advisors serve as sub-advisors, DMC has ultimate responsibility for all investment advisory services. For these services, DMC, not the Fund, pays each Affiliated Sub-Advisor a portion of its investment management fee.
Delaware Investments Fund Services Company (DIFSC), an affiliate of DMC, provides fund accounting and financial administrative oversight services to the Fund. For these services, DIFSC’s fees are calculated daily and paid monthly based on the aggregate daily net assets of all funds within the Delaware Funds at the following annual rates: 0.00475% of the first $35 billion; 0.0040% of the next $10 billion; and 0.0025% of aggregate average daily net assets in excess of $45 billion (Total Fee). Each fund in the Delaware Funds pays a minimum of $4,000, which, in aggregate, is subtracted from the Total
47
Table of Contents
Notes to financial statements
Delaware Limited-Term Diversified Income Fund
2. Investment Management, Administration Agreements, and Other Transactions with Affiliates (continued)
Fee. Each fund then pays its portion of the remainder of the Total Fee on a relative NAV basis. This amount is included on the “Statement of operations” under “Accounting and administration expenses.” For the year ended December 31, 2021, the Fund was charged $19,302 for these services.
DIFSC is also the transfer agent and dividend disbursing agent of the Fund. For these services, DIFSC’s fees are calculated daily and paid monthly based on the aggregate daily net assets of the retail funds within the Delaware Funds at the following annual rates: 0.014% of the first $20 billion; 0.011% of the next $5 billion; 0.007% of the next $5 billion; 0.005% of the next $20 billion; and 0.0025% of average daily net assets in excess of $50 billion. The fees payable to DIFSC under the shareholder services agreement described above are allocated among all retail funds in the Delaware Funds on a relative NAV basis. This amount is included on the “Statement of operations” under “Dividend disbursing and transfer agent fees and expenses.” For the year ended December 31, 2021, the Fund was charged $36,956 for these services. Pursuant to a sub-transfer agency agreement between DIFSC and BNY Mellon Investment Servicing (US) Inc. (BNYMIS), BNYMIS provides certain sub-transfer agency services to the Fund. Sub-transfer agency fees are paid by the Fund and are also included on the “Statement of operations” under “Dividend disbursing and transfer agent fees and expenses.” The fees are calculated daily and paid as invoices are received on a monthly or quarterly basis.
Pursuant to a distribution agreement and distribution plan, the Fund pays DDLP, the distributor and an affiliate of DMC, an annual 12b-1 fee of 0.25%, 1.00%, and 0.50% of the average daily net assets of the Class A, Class C, and Class R shares, respectively. The fees are calculated daily and paid monthly. DDLP has contractually agreed to waive Class A shares’ 12b-1 fee to 0.15% of average daily net assets from January 1, 2021 through December 31, 2021.* The waiver is calculated daily and received monthly. Institutional Class and Class R6 shares do not pay 12b-1 fees.
As provided in the investment management agreement, the Fund bears a portion of the cost of certain resources shared with DMC, including the cost of internal personnel of DMC and/or its affiliates that provide legal and regulatory reporting services to the Fund. For the year ended December 31, 2021, the Fund was charged $17,749 for internal legal and regulatory reporting services provided by DMC and/or its affiliates’ employees. This amount is included on the “Statement of operations” under “Legal fees.”
For the year ended December 31, 2021, DDLP earned $2,640 for commissions on sales of the Fund’s Class A shares. For the year ended December 31, 2021, DDLP received gross CDSC commissions of $9,251 and $387 on redemptions of the Fund’s Class A and Class C shares respectively, and these commissions were entirely used to offset upfront commissions previously paid by DDLP to broker/ dealers on sales of those shares.
Trustees’ fees include expenses accrued by the Fund for each Trustee’s retainer and meeting fees. Certain officers of DMC, DIFSC, and DDLP are officers and/or Trustees of the Trust. These officers and Trustees are paid no compensation by the Fund.
In addition to the management fees and other expenses of the Fund, the Fund indirectly bears the investment management fees and other expenses of the investment companies (Underlying Funds) in
48
Table of Contents
which it invests. The amount of these fees and expenses incurred indirectly by the Fund will vary based upon the expense and fee levels of the Underlying Funds and the number of shares that are owned of the Underlying Funds at different times.
____________________
| * | The aggregate contractual waiver period covering this report is from May 1, 2020 through April 30, 2022. |
3. Investments
For the year ended December 31, 2021, the Fund made purchases and sales of investment securities other than short-term investments as follows:
| Purchases other than US government securities | $ | 138,711,329 |
| Purchases of US government securities | | 734,179,077 |
| Sales other than US government securities | | 151,480,426 |
| Sales of US government securities | | 794,396,838 |
The tax cost of investments and derivatives includes adjustments to net unrealized appreciation (depreciation), which may not necessarily be the final tax cost basis adjustments but which approximate the tax basis unrealized gains and losses that may be realized and distributed to shareholders. At December 31, 2021, the cost and unrealized appreciation (depreciation) of investments and derivatives for federal income tax purposes for the Fund were as follows:
| Cost of investments and derivatives | $ | 490,959,849 | |
| Aggregate unrealized appreciation of investments and derivatives | $ | 2,232,464 | |
| Aggregate unrealized depreciation of investments and derivatives | | (4,121,961 | ) |
| Net unrealized depreciation of investments | $ | (1,889,497 | ) |
US GAAP defines fair value as the price that the Fund would receive to sell an asset or pay to transfer a liability in an orderly transaction between market participants at the measurement date under current market conditions. A three-level hierarchy for fair value measurements has been established based upon the transparency of inputs to the valuation of an asset or liability. Inputs may be observable or unobservable and refer broadly to the assumptions that market participants would use in pricing the asset or liability. Observable inputs reflect the assumptions market participants would use in pricing the asset or liability based on market data obtained from sources independent of the reporting entity. Unobservable inputs reflect the reporting entity’s own assumptions about the assumptions that market participants would use in pricing the asset or liability based on the best information available under the
49
Table of Contents
Notes to financial statements
Delaware Limited-Term Diversified Income Fund
3. Investments (continued)
circumstances. The Fund’s investment in its entirety is assigned a level based upon the observability of the inputs which are significant to the overall valuation. The three-level hierarchy of inputs is summarized as follows:
| Level 1 – | Inputs are quoted prices in active markets for identical investments. (Examples: equity securities, open-end investment companies, futures contracts, and exchange-traded options contracts) |
| | |
| Level 2 – | Other observable inputs, including, but not limited to: quoted prices for similar assets or liabilities in markets that are active, quoted prices for identical or similar assets or liabilities in markets that are not active, inputs other than quoted prices that are observable for the assets or liabilities (such as interest rates, yield curves, volatilities, prepayment speeds, loss severities, credit risks, and default rates) or other market-corroborated inputs. (Examples: debt securities, government securities, swap contracts, foreign currency exchange contracts, foreign securities utilizing international fair value pricing, broker-quoted securities, and fair valued securities) |
| | |
| Level 3 – | Significant unobservable inputs, including the Fund’s own assumptions used to determine the fair value of investments. (Examples: broker-quoted securities and fair valued securities) |
Level 3 investments are valued using significant unobservable inputs. The Fund may also use an income-based valuation approach in which the anticipated future cash flows of the investment are discounted to calculate fair value. Discounts may also be applied due to the nature or duration of any restrictions on the disposition of the investments. Valuations may also be based upon current market prices of securities that are comparable in coupon, rating, maturity, and industry. The derived value of a Level 3 investment may not represent the value which is received upon disposition and this could impact the results of operations.
The following table summarizes the valuation of the Fund’s investments by fair value hierarchy levels as of December 31, 2021:
| | Level 1 | | Level 2 | | Total |
| Securities | | | | | | | | | |
| Assets: | | | | | | | | | |
| Agency Asset-Backed Security | | $ | — | | $ | 3,350 | | $ | 3,350 |
| Agency Collateralized Mortgage Obligations | | | — | | | 12,806,114 | | | 12,806,114 |
| Agency Commercial Mortgage-Backed Securities | | | — | | | 7,515,344 | | | 7,515,344 |
| Agency Mortgage-Backed Securities | | | — | | | 38,385,186 | | | 38,385,186 |
| Collateralized Debt Obligations | | | — | | | 38,646,290 | | | 38,646,290 |
| Corporate Bonds | | | — | | | 285,819,552 | | | 285,819,552 |
| Loan Agreements | | | — | | | 942,605 | | | 942,605 |
| Non-Agency Asset-Backed Securities | | | — | | | 31,561,355 | | | 31,561,355 |
| Sovereign Bonds | | | — | | | 1,108,957 | | | 1,108,957 |
| US Treasury Obligations | | | — | | | 61,101,341 | | | 61,101,341 |
50
Table of Contents
| | Level 1 | | Level 2 | | Total |
| Short-Term Investments | | $ | 11,237,428 | | | $ | — | | $ | 11,237,428 | |
| Total Value of Securities | | $ | 11,237,428 | | | $ | 477,890,094 | | $ | 489,127,522 | |
| | | | | | | | | | | | |
| Derivatives1 | | | | | | | | | | | |
| Liabilities: | | | | | | | | | | | |
| Futures Contracts | | $ | (57,170 | ) | | $ | — | | $ | (57,170 | ) |
| 1 | Futures contracts are valued at the unrealized appreciation (depreciation) on the instrument at the year end. |
During the year ended December 31, 2021, there were no transfers into or out of Level 3 investments. The Fund’s policy is to recognize transfers into or out of Level 3 investments based on fair value at the beginning of the reporting period.
A reconciliation of Level 3 investments is presented when the Fund has a significant amount of Level 3 investments at the beginning or end of the year in relation to the Fund’s net assets. During the year ended December 31, 2021, there were no Level 3 investments.
4. Dividend and Distribution Information
Income and long-term capital gain distributions are determined in accordance with federal income tax regulations, which may differ from US GAAP. Additionally, distributions from net gains on foreign currency transactions and net short-term gains on sales of investment securities are treated as ordinary income for federal income tax purposes. The tax character of dividends and distributions paid during the years ended December 31, 2021 and 2020 were as follows:
| Year ended |
| 12/31/21 | | 12/31/20 |
| Ordinary income | $ | 8,163,047 | | $ | 7,333,503 |
| Return of capital | | 36,942 | | | 1,444,686 |
| Total | $ | 8,199,989 | | $ | 8,778,189 |
5. Components of Net Assets on a Tax Basis
As of December 31, 2021, the components of net assets on a tax basis were as follows:
| Shares of beneficial interest | $ | 566,305,300 | |
| Distributions payable | | (95,464 | ) |
| Capital loss carryforwards* | | (72,580,220 | ) |
| Unrealized appreciation (depreciation) of investments and foreign currencies | | (1,889,497 | ) |
| Net assets | $ | 491,740,119 | |
| * | A portion of the Fund’s capital loss carryforward is subject to limitation under the Internal Revenue Code and related regulations. |
51
Table of Contents
Notes to financial statements
Delaware Limited-Term Diversified Income Fund
5. Components of Net Assets on a Tax Basis (continued)
The differences between book basis and tax basis components of net assets are primarily attributable to tax deferral of losses on wash sales, tax deferral on straddle losses, mark-to-market of foreign currency exchange contracts, mark-to-market of futures contracts, and tax treatment of market discount and premium on debt instruments.
For financial reporting purposes, capital accounts are adjusted to reflect the tax character of permanent book/tax differences. Results of operations and net assets were not affected by these reclassifications. For the year ended December 31, 2021, the Fund had the following reclassifications due to wash sales and capital loss carryover due to merger:
| Paid-in capital | $ | 32,872,888 | |
| Total distributable earnings (loss) | | (32,872,888 | ) |
The Fund has capital loss carryforwards available to offset future realized capital gains as follows:
| | Loss carryforward character | |
| | Short-term | | Long-term | | Total | |
| | $ | 16,495,084 | | $ | 56,085,136 | | $ | 72,580,220 | |
6. Capital Shares
Transactions in capital shares were as follows:
| | Year ended |
| | 12/31/21 | | 12/31/20 |
| Shares sold: | | | | |
| Class A | | 2,778,588 | | 10,183,253 |
| Class C | | 307,296 | | 561,625 |
| Class R | | 12,683 | | 39,184 |
| Institutional Class | | 7,695,615 | | 13,501,343 |
| Class R6 | | 245,244 | | 356,405 |
| | | | | |
| Shares from merger:1 | | | | |
| Class A | | 16,187,888 | | — |
| Institutional Class | | 675,543 | | — |
| Class R6 | | 15,912 | | — |
| | | | | |
| Shares issued upon reinvestment of dividends and distributions: | | | | |
| Class A | | 380,454 | | 324,079 |
| Class C | | 14,298 | | 42,180 |
| Class R | | 1,519 | | 2,531 |
| Institutional Class | | 429,101 | | 571,627 |
| Class R6 | | 11,309 | | 10,920 |
| | 28,755,450 | | 25,593,147 |
52
Table of Contents
| Year ended |
| 12/31/21 | | 12/31/20 |
| Shares redeemed: | | | | | |
| Class A | (5,369,213 | ) | | (9,612,472 | ) |
| Class C | (1,618,329 | ) | | (2,401,714 | ) |
| Class R | (24,078 | ) | | (121,390 | ) |
| Institutional Class | (14,044,781 | ) | | (13,123,875 | ) |
| Class R6 | (104,452 | ) | | (186,711 | ) |
| (21,160,853 | ) | | (25,446,162 | ) |
| Net increase | 7,594,597 | | | 146,985 | |
Certain shareholders may exchange shares of one class for shares of another class in the same Fund. These exchange transactions are included as subscriptions and redemptions in the table above and on the “Statements of changes in net assets.” For the years ended December 31, 2021 and 2020, the Fund had the following exchange transactions:
| | Exchange Redemptions Exchange Subscriptions | | | | |
| | | | | | | | Institutional | | | | |
| | Class A | | Class C | | Class A | | Class | | | | |
| | Shares | | Shares | | Shares | | Shares | | Value | |
| Year ended | | | | | | | | | | | | |
| 12/31/21 | | 34,550 | | 74,631 | | 70,070 | | 39,097 | | $ | 914,869 | |
| 12/31/20 | | 33,289 | | 71,750 | | 70,157 | | 34,898 | | | 875,844 | |
7. Reorganization
On September 17, 2021, the Board approved a proposal to reorganize Delaware Limited Duration Bond Fund, a series of Delaware Group® Equity Funds IV (the “Acquired Fund”) with and into Delaware Limited-Term Diversified Income Fund (the “Acquiring Fund”), (the “Reorganization”). Pursuant to an Agreement and Plan of Reorganization (the “Plan”): (i) all of the property, assets, and goodwill of the Acquired Fund were acquired by the Acquiring Fund, and (ii) the Trust, on behalf of the Acquiring Fund, assumed the liabilities of the Acquired Fund, in exchange for shares of the Acquiring Fund. In accordance with the Plan, the Acquired Fund liquidated and dissolved following the Reorganization. The purpose of the transaction was to allow shareholders of the Acquired Fund to own shares of a Fund with a similar investment objective and style as, and potentially lower net expenses than the Acquired Fund. The Reorganization was accomplished by a tax-free exchange of shares on September 17, 2021. For financial reporting purposes, assets received and shares issued by the Acquiring Fund were recorded at fair value; however, the cost basis of the investments received from the Acquired Fund was carried forward to align ongoing reporting of the Acquiring Fund’s realized and unrealized gains and losses with amounts distributable to shareholders for tax purposes.
53
Table of Contents
Notes to financial statements
Delaware Limited-Term Diversified Income Fund
7. Reorganization (continued)
The share transactions associated with the Reorganization are as follows:
| | | | | | | | Shares | | | | | | | |
| | | Acquired | | Acquired | | Converted | | Acquiring | | | | |
| | | Funds | | Fund Shares | | to Acquiring | | Fund | | Conversion |
| | | Net Assets | | Outstanding | | Fund | | Net Assets | | Ratio |
| | | Delaware Limited Duration Bond | | Delaware Limited-Term | | | | |
| | | Fund | | Diversified Income Fund | | | | |
| Class A | | $ | 135,168,861 | | 14,497,661 | | 16,187,888 | | $ | 139,412,276 | | | 1.1166 | |
| Institutional | | | | | | | | | | | | | | |
| | Class | | | 5,634,030 | | 602,541 | | 675,543 | | | 236,217,556 | | | 1.1212 | |
| Class R6 | | | 132,707 | | 14,167 | | 15,912 | | | 4,372,466 | | | 1.1232 | |
The net assets of the Acquiring Fund before the Reorganization were $391,466,063. The net assets of the Acquiring Fund immediately following the Reorganization were $532,401,661.
Assuming the Reorganization had been completed on January 1, 2021, the Acquiring Fund’s pro forma results of operations for the year ended December 31, 2021, would have been as follows:
| Net investment income | | $ | 7,215,398 | |
| Net realized gain on investments | | | 787,093 | |
| Net change in unrealized appreciation (depreciation) | | | (10,012,395 | ) |
| Net decrease in net assets resulting from operations | | $ | (2,009,904 | ) |
Because the combined investment portfolios have been managed as a single integrated portfolio since the acquisition was completed, it is not practical to separate the amounts of revenue and earnings of the Acquired Fund that have been included in the Acquiring Fund’s Statement of Operations since the Reorganization was consummated on September 17, 2021.
8. Line of Credit
The Fund, along with certain other funds in the Delaware Funds (Participants), was a participant in a $225,000,000 revolving line of credit (Agreement) intended to be used for temporary or emergency purposes as an additional source of liquidity to fund redemptions of investor shares. Under the Agreement, the Participants were charged an annual commitment fee of 0.15% with the addition of an upfront fee of 0.05%, which was allocated across the Participants based on a weighted average of the respective net assets of each Participant. The Participants were permitted to borrow up to a maximum of one-third of their net assets under the Agreement. Each Participant was individually, and not jointly, liable for its particular advances, if any, under the line of credit. The line of credit available under the Agreement expired on November 1, 2021.
On November 1, 2021, the Fund, along with the other Participants, entered into an amendment to the agreement for a $355,000,000 revolving line of credit to be used as described above and operates in substantially the same manner as the original Agreement. Under the amendment to the agreement, the Participants are charged an annual commitment fee of 0.15%, with the addition of an upfront fee of
54
Table of Contents
0.05%, which is allocated across the Participants based on a weighted average of the respective net assets of each Participant. The line of credit available under the agreement expires on October 31, 2022.
The Fund had no amounts outstanding as of December 31, 2021, or at any time during the year then ended.
9. Derivatives
US GAAP requires disclosures that enable investors to understand: (1) how and why an entity uses derivatives; (2) how they are accounted for; and (3) how they affect an entity’s results of operations and financial position.
Foreign Currency Exchange Contracts — The Fund may enter into foreign currency exchange contracts and foreign cross currency exchange contracts as a way of managing foreign exchange rate risk. The Fund may enter into these contracts to fix the US dollar value of a security that it has agreed to buy or sell for the period between the date the trade was entered into and the date the security is delivered and paid for. The Fund may also enter into these contracts to hedge the US dollar value of securities it already owns that are denominated in foreign currencies. In addition, the Fund may enter into these contracts to facilitate or expedite the settlement of portfolio transactions. The change in value is recorded as an unrealized gain or loss. When the contract is closed, a realized gain or loss is recorded equal to the difference between the value of the contract at the time it was opened and the value at the time it was closed.
The use of foreign currency exchange contracts and foreign cross currency exchange contracts does not eliminate fluctuations in the underlying prices of the securities, but does establish a rate of exchange that can be achieved in the future. Although foreign currency exchange contracts and foreign cross currency exchange contracts limit the risk of loss due to an unfavorable change in the value of the hedged currency, they also limit any potential gain that might result should the value of the currency change favorably. In addition, the Fund could be exposed to risks if the counterparties to the contracts are unable to meet the terms of their contracts. The Fund’s maximum risk of loss from counterparty credit risk is the value of its currency exchanged with the counterparty. The risk is generally mitigated by having a netting arrangement between the Fund and the counterparty and by the posting of collateral by the counterparty to the Fund to cover the Fund’s exposure to the counterparty.
During the year ended December 31, 2021, the Fund entered into foreign currency exchange contracts to hedge the US dollar value of securities it already owns that are denominated in foreign currencies to increase/decrease exposure to foreign currencies.
Futures Contracts — A futures contract is an agreement in which the writer (or seller) of the contract agrees to deliver to the buyer an amount of cash or securities equal to a specific dollar amount times the difference between the value of a specific security or index at the close of the last trading day of the contract and the price at which the agreement is made. The Fund may use futures contracts in the normal course of pursuing its investment objective. The Fund may invest in futures contracts to hedge its existing portfolio securities against fluctuations in value caused by changes in interest rates or market conditions. Upon entering into a futures contract, the Fund deposits cash or pledges US government securities to a broker, equal to the minimum “initial margin” requirements of the exchange on which the
55
Table of Contents
Notes to financial statements
Delaware Limited-Term Diversified Income Fund
9. Derivatives (continued)
contract is traded. Subsequent payments are received from the broker or paid to the broker each day, based on the daily fluctuation in the market value of the contract. These receipts or payments are known as “variation margin” and are recorded daily by the Fund as unrealized gains or losses until the contracts are closed. When the contracts are closed, the Fund records a realized gain or loss equal to the difference between the value of the contract at the time it was opened and the value at the time it was closed. Risks of entering into futures contracts include potential imperfect correlation between the futures contracts and the underlying securities and the possibility of an illiquid secondary market for these instruments. When investing in futures, there is reduced counterparty credit risk to the Fund because futures are exchange-traded and the exchange’s clearinghouse, as counterparty to all exchange-traded futures, guarantees against default. At December 31, 2021, the Fund posted $165,605 in cash collateral as margin for open futures contracts, which is included in “Cash collateral due from brokers” on the “Statement of assets and liabilities.”
During the year ended December 31, 2021, the Fund entered into futures contracts to hedge the Fund’s existing portfolio securities against fluctuations in value caused by changes in interest rates or market conditions.
Fair values of derivative instruments as of December 31, 2021 were as follows:
| | Liability Derivatives Fair Value |
| | Interest | | | | |
| Statement of Assets and | | Rate | | | | |
| Liabilities Location | | Contracts | | Total |
| Variation margin due to broker on futures contracts* | | $ | (57,170 | ) | | $ | (57,170 | ) |
| * | Includes cumulative appreciation (depreciation) of futures contracts from the date the contracts were opened through December 31, 2021. Only current day variation margin is reported on the “Statement of assets and liabilities.” |
56
Table of Contents
The effect of derivative instruments on the “Statement of operations” for the year ended December 31, 2021 was as follows:
| | Net Realized Gain (Loss) on: |
| | Foreign | | | | | | | |
| | Currency | | | | | | | |
| | Exchange | | Futures | | | | |
| | Contracts | | Contracts | | Total |
| Currency | | | | | | | | | | |
| | contracts | $ | (15,762 | ) | | $ | — | | $ | (15,762 | ) |
| Interest rate | | | | | | | | | | |
| contracts | | — | | | | 118,578 | | | 118,578 | |
| Total | $ | (15,762 | ) | | $ | 118,578 | | $ | 102,816 | |
| | | Net Change in Unrealized Appreciation (Depreciation) of: |
| | | Foreign | | | | | | | | | | | | |
| | | Currency | | | | | | | | | | | | |
| | | Exchange | | Futures | | | | | | |
| | | Contracts | | Contracts | | Total |
| Currency | | | | | | | | | | | | | | | | | |
| | contracts | | | $ | 70,147 | | | | $ | — | | | | | $ | 70,147 | | |
| Interest rate | | | | | | | | | | | | | | | | | |
| contracts | | | | — | | | | | (53,678 | ) | | | | | (53,678 | ) | |
| Total | | | $ | 70,147 | | | | $ | (53,678 | ) | | | | $ | 16,469 | | |
The table below summarizes the average balance of derivative holdings by the Fund during the year ended December 31, 2021:
| | Long Derivative | | Short Derivative |
| | Volume | | Volume |
| Foreign currency exchange contracts (average notional value) | | $ | — | | $ | 361,426 |
| Futures contracts (average notional value) | | | 6,277,433 | | | 5,477,629 |
10. Securities Lending
The Fund, along with other funds in the Delaware Funds, may lend its securities pursuant to a security lending agreement (Lending Agreement) with The Bank of New York Mellon (BNY Mellon). At the time a security is loaned, the borrower must post collateral equal to the required percentage of the market value of the loaned security, including any accrued interest. The required percentage is: (1) 102% with respect to US securities and foreign securities that are denominated and payable in US dollars; and (2) 105% with respect to foreign securities. With respect to each loan, if on any business day the aggregate market value of securities collateral plus cash collateral held is less than the aggregate market value of the securities which are the subject of such loan, the borrower will be notified to provide additional collateral by the end of the following business day, which, together with the collateral already held, will be not less than the applicable initial collateral requirements for such security loan. If the aggregate market value of securities collateral and cash collateral held with respect to a security loan exceeds the applicable initial collateral requirement, upon the request of the borrower, BNY Mellon must return enough collateral to
57
Table of Contents
Notes to financial statements
Delaware Limited-Term Diversified Income Fund
10. Securities Lending (continued)
the borrower by the end of the following business day to reduce the value of the remaining collateral to the applicable initial collateral requirement for such security loan. As a result of the foregoing, the value of the collateral held with respect to a loaned security on any particular day, may be more or less than the value of the security on loan. The collateral percentage with respect to the market value of the loaned security is determined by the security lending agent.
Cash collateral received by each fund of the Trust is generally invested in a series of individual separate accounts, each corresponding to a fund. The investment guidelines permit each separate account to hold certain securities that would be considered eligible securities for a money market fund. Cash collateral received is generally invested in government securities; certain obligations issued by government sponsored enterprises; repurchase agreements collateralized by US Treasury securities; obligations issued by the central government of any Organization for Economic Cooperation and Development (OECD) country or its agencies, instrumentalities, or establishments; obligations of supranational organizations; commercial paper, notes, bonds, and other debt obligations; certificates of deposit, time deposits, and other bank obligations; certain money market funds; and asset-backed securities. The Fund can also accept US government securities and letters of credit (non-cash collateral) in connection with securities loans.
In the event of default or bankruptcy by the lending agent, realization and/or retention of the collateral may be subject to legal proceedings. In the event the borrower fails to return loaned securities and the collateral received is insufficient to cover the value of the loaned securities and provided such collateral shortfall is not the result of investment losses, the lending agent has agreed to pay the amount of the shortfall to the Fund or, at the discretion of the lending agent, replace the loaned securities. The Fund continues to record dividends or interest, as applicable, on the securities loaned and is subject to changes in value of the securities loaned that may occur during the term of the loan. The Fund has the right under the Lending Agreement to recover the securities from the borrower on demand. With respect to security loans collateralized by non-cash collateral, the Fund receives loan premiums paid by the borrower. With respect to security loans collateralized by cash collateral, the earnings from the collateral investments are shared among the Fund, the security lending agent, and the borrower. The Fund records security lending income net of allocations to the security lending agent and the borrower.
The Fund may incur investment losses as a result of investing securities lending collateral. This could occur if an investment in the collateral investment account defaulted or became impaired. Under those circumstances, the value of the Fund’s cash collateral account may be less than the amount the Fund would be required to return to the borrowers of the securities and the Fund would be required to make up for this shortfall.
During the year ended December 31, 2021, the Fund had no securities out on loan.
11. Credit and Market Risk
Beginning in January 2020, global financial markets have experienced and may continue to experience significant volatility resulting from the spread of a novel coronavirus known as COVID-19. The outbreak of COVID-19 has resulted in travel and border restrictions, quarantines, supply chain disruptions, lower
58
Table of Contents
consumer demand, and general market uncertainty. The effects of COVID-19 have and may continue to adversely affect the global economy, the economies of certain nations and individual issuers, all of which may negatively impact the Fund’s performance.
Investments in equity securities in general are subject to market risks that may cause their prices to fluctuate over time. Fluctuations in the value of equity securities in which the Fund invests will cause the NAV of the Fund to fluctuate.
When interest rates rise, fixed income securities (i.e. debt obligations) generally will decline in value. These declines in value are greater for fixed income securities with longer maturities or durations.
IBOR risk is the risk that changes related to the use of the London interbank offered rate (LIBOR) and other interbank offered rate (collectively, “IBORs”) could have adverse impacts on financial instruments that reference LIBOR (or the corresponding IBOR). The abandonment of LIBOR could affect the value and liquidity of instruments that reference LIBOR. The use of alternative reference rate products may impact investment strategy performance. These risks may also apply with respect to changes in connection with other IBORs, such as the euro overnight index average (EONIA), which are also the subject of recent reform.
Some countries in which the Fund may invest require governmental approval for the repatriation of investment income, capital, or the proceeds of sales of securities by foreign investors. In addition, if there is deterioration in a country’s balance of payments or for other reasons, a country may impose temporary restrictions on foreign capital remittances abroad.
The securities exchanges of certain foreign markets are substantially smaller, less liquid, and more volatile than the major securities markets in the US. Consequently, acquisition and disposition of securities by the Fund may be inhibited. In addition, a significant portion of the aggregate market value of equity securities listed on the major securities exchanges in emerging markets is held by a smaller number of investors. This may limit the number of shares available for acquisition or disposition by the Fund.
The Fund invests a portion of its assets in high yield fixed income securities, which are securities rated lower than BBB- by S&P and Baa3 by Moody’s, or similarly rated by another nationally recognized statistical rating organization. Investments in these higher yielding securities are generally accompanied by a greater degree of credit risk than higher rated securities. Additionally, lower rated securities may be more susceptible to adverse economic and competitive industry conditions than investment grade securities.
The Fund invests in fixed income securities whose value is derived from an underlying pool of mortgages or consumer loans. The value of these securities is sensitive to changes in economic conditions, including delinquencies and/or defaults, and may be adversely affected by shifts in the market’s perception of the issuers and changes in interest rates. Investors receive principal and interest payments as the underlying mortgages and consumer loans are paid back. Some of these securities are CMOs. CMOs are debt securities issued by US government agencies or by financial institutions and other mortgage lenders, which are collateralized by a pool of mortgages held under an indenture. Prepayment of mortgages may shorten the stated maturity of the obligations and can result in a loss of premium, if
59
Table of Contents
Notes to financial statements
Delaware Limited-Term Diversified Income Fund
11. Credit and Market Risk (continued)
any has been paid. Certain of these securities may be stripped (securities which provide only the principal or interest feature of the underlying security). The yield to maturity on an interest-only CMO is extremely sensitive not only to changes in prevailing interest rates, but also to the rate of principal payments (including prepayments) on the related underlying mortgage assets. A rapid rate of principal payments may have a material adverse effect on the Fund’s yield to maturity. If the underlying mortgage assets experience greater than anticipated prepayments of principal, the Fund may fail to fully recoup its initial investment in these securities even if the securities are rated in the highest rating categories.
The Fund invests in certain obligations that may have liquidity protection designed to ensure that the receipt of payments due on the underlying security is timely. Such protection may be provided through guarantees, insurance policies, or letters of credit obtained by the issuer or sponsor through third parties, through various means of structuring the transaction, or through a combination of such approaches. The Fund will not pay any additional fees for such credit support, although the existence of credit support may increase the price of a security.
The Fund invests in bank loans and other securities that may subject it to direct indebtedness risk, the risk that the Fund will not receive payment of principal, interest, and other amounts due in connection with these investments and will depend primarily on the financial condition of the borrower. Loans that are fully secured offer the Fund more protection than unsecured loans in the event of nonpayment of scheduled interest or principal, although there is no assurance that the liquidation of collateral from a secured loan would satisfy the corporate borrower’s obligation, or that the collateral can be liquidated. Some loans or claims may be in default at the time of purchase. Certain of the loans and the other direct indebtedness acquired by the Fund may involve revolving credit facilities or other standby financing commitments that obligate the Fund to pay additional cash on a certain date or on demand. These commitments may require the Fund to increase its investment in a company at a time when the Fund might not otherwise decide to do so (including at a time when the company’s financial condition makes it unlikely that such amounts will be repaid). To the extent that the Fund is committed to advance additional funds, it will at all times hold and maintain cash or other high grade debt obligations in an amount sufficient to meet such commitments. When a loan agreement is purchased, the Fund may pay an assignment fee. On an ongoing basis, the Fund may receive a commitment fee based on the undrawn portion of the underlying line of credit portion of a loan agreement. Prepayment penalty fees are received upon the prepayment of a loan agreement by a borrower. Prepayment penalty, facility, commitment, consent and amendment fees are recorded to income as earned or paid.
As the Fund may be required to rely upon another lending institution to collect and pass on to the Fund amounts payable with respect to the loan and to enforce the Fund’s rights under the loan and other direct indebtedness, an insolvency, bankruptcy, or reorganization of the lending institution may delay or prevent the Fund from receiving such amounts. The highly leveraged nature of many loans may make them especially vulnerable to adverse changes in economic or market conditions. Investments in such loans and other direct indebtedness may involve additional risk to the Fund.
The Fund may invest up to 15% of its net assets in illiquid securities, which may include securities with contractual restrictions on resale, securities exempt from registration under Rule 144A promulgated
60
Table of Contents
under the Securities Act of 1933, as amended, and other securities which may not be readily marketable. The relative illiquidity of these securities may impair the Fund from disposing of them in a timely manner and at a fair price when it is necessary or desirable to do so. While maintaining oversight, the Board has delegated to DMC the day-to-day functions of determining whether individual securities are liquid for purposes of the Fund’s limitation on investments in illiquid securities. Securities eligible for resale pursuant to Rule 144A, which are determined to be liquid, are not subject to the Fund’s 15% limit on investments in illiquid securities. Rule 144A securities have been identified on the “Schedule of investments.”
12. Contractual Obligations
The Fund enters into contracts in the normal course of business that contain a variety of indemnifications. The Fund’s maximum exposure under these arrangements is unknown. However, the Fund has not had prior claims or losses pursuant to these contracts. Management has reviewed the Fund’s existing contracts and expects the risk of loss to be remote.
13. Recent Accounting Pronouncements
In March 2020, FASB issued an Accounting Standards Update (ASU), ASU 2020-04, Reference Rate Reform (Topic 848) – Facilitation of the Effects of Reference Rate Reform on Financial Reporting. The amendments in ASU 2020-04 provide optional temporary financial reporting relief from the effect of certain types of contract modifications due to the planned discontinuation of LIBOR and other interbank-offered based reference rates as of the end of 2021. ASU 2020-04 is effective for certain reference rate-related contract modifications that occur during the period March 12, 2020 through December 31, 2022. As of the financial reporting period, Management is evaluating the impact of applying this ASU.
14. Subsequent Events
Management has determined that no material events or transactions occurred subsequent to December 31, 2021, that would require recognition or disclosure in the Fund’s financial statements.
61
Table of Contents
Report of independent
registered public accounting firm
To the Board of Trustees of Delaware Group® Limited-Term Government Funds and Shareholders of
Delaware Limited-Term Diversified Income Fund
Opinion on the Financial Statements
We have audited the accompanying statement of assets and liabilities, including the schedule of investments, of Delaware Limited-Term Diversified Income Fund (one of the funds constituting Delaware Group® Limited-Term Government Funds, referred to hereafter as the “Fund”) as of December 31, 2021, the related statement of operations for the year ended December 31, 2021, the statements of changes in net assets for each of the two years in the period ended December 31, 2021, including the related notes, and the financial highlights for each of the periods indicated therein (collectively referred to as the “financial statements”). In our opinion, the financial statements present fairly, in all material respects, the financial position of the Fund as of December 31, 2021, the results of its operations for the year then ended, the changes in its net assets for each of the two years in the period ended December 31, 2021 and the financial highlights for each of the periods indicated therein in conformity with accounting principles generally accepted in the United States of America.
Basis for Opinion
These financial statements are the responsibility of the Fund’s management. Our responsibility is to express an opinion on the Fund’s financial statements based on our audits. We are a public accounting firm registered with the Public Company Accounting Oversight Board (United States) (PCAOB) and are required to be independent with respect to the Fund in accordance with the U.S. federal securities laws and the applicable rules and regulations of the Securities and Exchange Commission and the PCAOB.
We conducted our audits of these financial statements in accordance with the standards of the PCAOB. Those standards require that we plan and perform the audit to obtain reasonable assurance about whether the financial statements are free of material misstatement, whether due to error or fraud.
Our audits included performing procedures to assess the risks of material misstatement of the financial statements, whether due to error or fraud, and performing procedures that respond to those risks. Such procedures included examining, on a test basis, evidence regarding the amounts and disclosures in the financial statements. Our audits also included evaluating the accounting principles used and significant estimates made by management, as well as evaluating the overall presentation of the financial statements. Our procedures included confirmation of securities owned as of December 31, 2021 by correspondence with the custodian, transfer agents, agent banks and brokers; when replies were not received from brokers, we performed other auditing procedures. We believe that our audits provide a reasonable basis for our opinion.
/s/PricewaterhouseCoopers LLP
Philadelphia, Pennsylvania
February 17, 2022
We have served as the auditor of one or more investment companies in Delaware Funds by Macquarie® since 2010.
62
Table of Contents
Other Fund information (Unaudited)
Delaware Limited-Term Diversified Income Fund
Tax Information
All disclosures are based on financial information available as of the date of this annual report and, accordingly are subject to change. For any and all items requiring reporting, it is the intention of the Fund to report the maximum amount permitted under the Internal Revenue Code and the regulations thereunder.
For the year ended December 31, 2021, the Fund reports distributions paid during the year as follows:
| (A) Ordinary Income Distributions (Tax Basis) | | 99.55% |
| (B) Return of Capital Distributions (Tax Basis) | | 0.45% |
| Total Distributions (Tax Basis) | | 100.00% |
____________________
| (A) and (B) are based on a percentage of the Fund’s total distributions. |
Board consideration of Investment Advisory and Sub-Advisory Agreements for Delaware Limited-Term Diversified Income Fund at a meeting held August 10-12, 2021
At a meeting held on August 10-12, 2021 (the “Annual Meeting”), the Board of Trustees (the “Board”), including a majority of disinterested or independent Trustees, approved the renewal of the Investment Advisory and Sub-Advisory Agreements for Delaware Limited-Term Diversified Income Fund (the “Fund”). In making its decision, the Board considered information furnished at regular quarterly Board meetings, including reports detailing Fund performance, investment strategies, and expenses, as well as information prepared specifically in connection with the renewal of the investment advisory and sub-advisory contracts. Information furnished specifically in connection with the renewal of the Investment Management Agreement with Delaware Management Company (“DMC”), a series of Macquarie Investment Management Business Trust (“MIMBT”), and the Sub-Advisory Agreements with Macquarie Investment Management Global Limited (“MIMGL”), Macquarie Investment Management Europe Limited (“MIMEL”), and Macquarie Investment Management Austria Kapitalanlage AG (“MIMAK”) (the “Sub-Advisers”), included materials provided by DMC and its affiliates (collectively, “Macquarie Asset Management”) and the Sub-Advisers, as applicable concerning, among other things, the nature, extent, and quality of services provided to the Fund; the costs of such services to the Fund; economies of scale; and the investment manager’s financial condition and profitability. In addition, in connection with the Annual Meeting, materials were provided to the Trustees in May 2021, including reports provided by Broadridge Financial Solutions (“Broadridge”). The Broadridge reports compared the Fund’s investment performance and expenses with those of other comparable mutual funds. The Independent Trustees reviewed and discussed the Broadridge reports with independent legal counsel to the Independent Trustees. In addition to the information noted above, the Board also requested and received information regarding DMC’s policy with respect to advisory fee levels and its breakpoint philosophy; the structure of portfolio manager compensation; comparative client fee information; and any constraints or limitations on the availability of securities for certain investment styles, which had in the past year inhibited, or which were likely in the future to inhibit, the investment manager’s ability to invest fully in accordance with Fund policies.
In considering information relating to the approval of the Fund’s advisory and sub-advisory agreements, as applicable, the Independent Trustees received assistance and advice from and met separately with
63
Table of Contents
Other Fund information (Unaudited)
Delaware Limited-Term Diversified Income Fund
Board consideration of Investment Advisory and Sub-Advisory Agreements for Delaware Limited-Term Diversified Income Fund at a meeting held August 10-12, 2021 (continued)
independent legal counsel to the Independent Trustees and also received assistance and advice from an experienced and knowledgeable independent fund consultant, JDL Consultants, LLC (“JDL”). Although the Board gave attention to all information furnished, the following discussion identifies, under separate headings, the primary factors taken into account by the Board during its contract renewal considerations.
Nature, extent, and quality of services. The Board considered the services provided by DMC to the Fund and its shareholders. In reviewing the nature, extent, and quality of services, the Board considered reports furnished to it throughout the year, which covered matters such as the relative performance of the Fund; compliance of portfolio managers with the investment policies, strategies, and restrictions for the Fund; compliance by DMC and Delaware Distributors, L.P. (together, “Management”) personnel with the Code of Ethics adopted throughout the Delaware Funds by Macquarie® (“Delaware Funds”); and adherence to fair value pricing procedures as established by the Board. The Board was pleased with the current staffing of DMC and the emphasis placed on research in the investment process. The Board recognized DMC’s receipt of certain favorable industry distinctions during the past several years. The Board gave favorable consideration to DMC’s efforts to control expenses while maintaining service levels committed to Fund matters. The Board also noted the benefits provided to Fund shareholders through (a) each shareholder’s ability to: (i) exchange an investment in one Delaware Fund for the same class of shares in another Delaware Fund without a sales charge, or (ii) reinvest Fund dividends into additional shares of the Fund or into additional shares of other Delaware Funds, and (b) the privilege to combine holdings in other Delaware Funds to obtain a reduced sales charge. The Board was satisfied with the nature, extent, and quality of the overall services provided by DMC.
Nature, extent, and quality of services. The Board considered the services provided by each Sub-Adviser to the Fund. In reviewing the nature, extent, and quality of services, the Board considered reports furnished to it throughout the year at regular Board Meetings covering matters such as relative performance of the Fund; compliance of portfolio managers with the investment policies, strategies, and restrictions for the Fund; the compliance of Sub-Adviser personnel with its Code of Ethics; and adherence to fair value pricing procedures as established by the Board. The Board was pleased with the current staffing of the Sub-Advisers and the emphasis placed on research in the investment process. The Board was satisfied with the nature, extent, and quality of the overall services provided by the Sub-Advisers.
Investment performance. The Board placed significant emphasis on the investment performance of the Fund in view of the importance of investment performance to shareholders. Although the Board considered performance reports and discussions with portfolio managers at Investment Committee meetings throughout the year, the Board gave particular weight to the Broadridge reports furnished for the Annual Meeting. The Broadridge reports prepared for the Fund showed the Fund’s investment performance in comparison to a group of similar funds (the “Performance Universe”). A fund with the best performance ranked first, and a fund with the poorest performance ranked last. The highest/best performing 25% of funds in the Performance Universe make up the first quartile; the next 25%, the second quartile; the next 25%, the third quartile; and the poorest/worst performing 25% of funds in the Performance Universe make up the fourth quartile. Comparative annualized performance for the Fund
64
Table of Contents
was shown for the past 1-, 3-, 5-, and 10-year periods, to the extent applicable, ended December 31, 2020. The Board’s objective is that the Fund’s performance for the 1-, 3-, and 5-year periods be at or above the median of its Performance Universe.
The Performance Universe for the Fund consisted of the Fund and all retail and institutional short-intermediate investment-grade debt funds as selected by Broadridge. The Broadridge report comparison showed that the Fund’s total return for the 1- and 5-year periods was in the third quartile of its Performance Universe. The report further showed that the Fund’s total return for the 3- and 10-year periods was in the fourth quartile of its Performance Universe. The Board observed that the Fund’s performance results were not in line with the Board’s objective. In evaluating the Fund’s performance, the Board considered the numerous investment and performance reports delivered by Management personnel to the Board’s Investments Committee. The Board was satisfied that Management was taking action to improve Fund performance and to meet the Board’s performance objective.
Comparative expenses. The Board considered expense data for the Delaware Funds. Management provided the Board with information on pricing levels and fee structures for the Fund as of its most recently completed fiscal year. The Board also focused on the comparative analysis of effective management fees and total expense ratios of the Fund versus effective management fees and total expense ratios of a group of similar funds (the “Expense Group”). In reviewing comparative costs, the Fund’s contractual management fee and the actual management fee incurred by the Fund were compared with the contractual management fees (assuming all funds in the Expense Group were similar in size to the Fund) and actual management fees (as reported by each fund) within the Expense Group, taking into account any applicable breakpoints and fee waivers. The Fund’s total expenses were also compared with those of its Expense Group and, for comparative consistency, included 12b 1 and non-12b 1 service fees. The Board’s objective is for each Fund’s total expense ratio to be competitive with those of the peer funds within its Expense Group.
The expense comparisons for the Fund showed that its actual management fee and total expenses were in the quartile with lowest expenses of its Expense Group. The Board was satisfied with the management fee and total expenses of the Fund in comparison to those of its Expense Group as shown in the Broadridge report.
Management profitability. The Board considered the level of profits realized by DMC in connection with the operation of the Fund. In this respect, the Board reviewed the Investment Management Profitability Analysis that addressed the overall profitability of DMC’s business in providing management and other services to each of the individual funds and the Delaware Funds as a whole. Specific attention was given to the methodology used by DMC in allocating costs for the purpose of determining profitability. Management stated that the level of profits of DMC, to a certain extent, reflects recent operational cost savings and efficiencies initiated by DMC. The Board considered DMC’s efforts to improve services provided to Fund shareholders and to meet additional regulatory and compliance requirements resulting from recent industry-wide Securities and Exchange Commission initiatives. The Board also considered the extent to which DMC might derive ancillary benefits from fund operations, including the potential for procuring additional business as a result of the prestige and visibility associated with its role as service provider to the Delaware Funds and the benefits from allocation of fund brokerage to improve trading efficiencies. As part of its work, the Board also reviewed a report prepared by JDL regarding MIMBT profitability as compared to certain peer fund complexes and the Independent Trustees discussed with
65
Table of Contents
Other Fund information (Unaudited)
Delaware Limited-Term Diversified Income Fund
Board consideration of Investment Advisory and Sub-Advisory Agreements for Delaware Limited-Term Diversified Income Fund at a meeting held August 10-12, 2021 (continued)
JDL personnel regarding DMC’s profitability in such context. The Board found that the management fees were reasonable in light of the services rendered and the level of profitability of DMC.
Management profitability. Trustees were also given available information on profits being realized by each of the Sub-Advisers in relation to the services being provided to the Fund and in relation to each Sub-Adviser’s overall investment advisory business, but believed such information to be of limited relevance because the sub-advisory fees are paid by DMC out of its management fee, and changes in the level of sub-advisory fees have no impact on Fund expenses. The Board was also provided information on potential fall-out benefits derived or to be derived by the Sub-Advisers in connection with their relationship to the Fund, such as reputational enhancement, soft dollar arrangements, or commissions paid to affiliated broker/dealers, as applicable.
Economies of scale. The Trustees considered whether economies of scale are realized by DMC as the Fund’s assets increase and the extent to which any economies of scale are reflected in the level of management fees charged. The Trustees reviewed the Fund’s advisory fee pricing and structure, approved by the Board and shareholders, which includes breakpoints, and which applies to most funds in the Delaware Funds complex. Breakpoints in the advisory fee occur when the advisory fee rate is reduced on assets in excess of specified levels. Breakpoints result in a lower advisory fee than would otherwise be the case in the absence of breakpoints, when the asset levels specified in the breakpoints are exceeded. Although, as of March 31, 2021, the Fund had not reached a size at which it could take advantage of any breakpoints in the applicable fee schedule, the Board recognized that the fee was structured so that, if the Fund increases sufficiently in size, then economies of scale may be shared.
66
Table of Contents
Board of trustees / directors and officers addendum
Delaware Funds by Macquarie®
A mutual fund is governed by a Board of Trustees/Directors (“Trustees”), which has oversight responsibility for the management of a fund’s business affairs. Trustees establish procedures and oversee and review the performance of the investment manager, the distributor, and others who perform services for the fund. The independent fund trustees, in particular, are advocates for shareholder interests. Each trustee has served in that capacity since he or she was elected to or appointed to the Board of Trustees, and will continue to serve until his or her retirement or the election of a new trustee in his or her place. The following is a list of the Trustees and Officers with certain background and related information.
| | | | | | | | Number of | | Other |
| | | | | | Principal | | Portfolios in Fund | | Directorships |
| Name, | | Position(s) | | | | Occupation(s) | | Complex Overseen | | Held by |
| Address, | | Held with | | Length of Time | | During the | | by Trustee | | Trustee |
| and Birth Date | | Fund(s) | | Served | | Past Five Years | | or Officer | | or Officer |
| Interested Trustee |
| |
| Shawn K. Lytle1 | | President, | | President and | | Global Head of Macquarie | | 148 | | Trustee — UBS Relationship |
| 610 Market Street | | Chief Executive | | Chief Executive | | Investment Management2 | | | | Funds, SMA Relationship Trust, |
| Philadelphia, PA | | Officer, | | Officer | | (January 2019–Present) | | | | and UBS Funds |
| 19106-2354 | | and Trustee | | since August 2015 | | Head of Americas of | | | | (May 2010–April 2015) |
| February 1970 | | | | Trustee since | | Macquarie Group | | | | |
| | | | September 2015 | | (December 2017–Present) | | | | |
| | | | | | Deputy Global Head of | | | | |
| | | | | | Macquarie Investment | | | | |
| | | | | | Management | | | | |
| | | | | | (2017–2019) | | | | |
| | | | | | Head of Macquarie Investment | | | | |
| | | | | | Management Americas | | | | |
| | | | | | (2015–2017) | | | | |
67
Table of Contents
Board of trustees / directors and officers addendum
Delaware Funds by Macquarie®
| | | | | | | | Number of | | Other |
| | | | | | Principal | | Portfolios in Fund | | Directorships |
| Name, | | Position(s) | | | | Occupation(s) | | Complex Overseen | | Held by |
| Address, | | Held with | | Length of Time | | During the | | by Trustee | | Trustee |
| and Birth Date | | Fund(s) | | Served | | Past Five Years | | or Officer | | or Officer |
| Independent Trustees |
| |
| Jerome D. | | Trustee | | Since January 2019 | | Managing Member, Stonebrook | | 148 | | None |
| Abernathy | | | | | | Capital Management, LLC | | | | |
| 610 Market Street | | | | | | (financial technology: macro | | | | |
| Philadelphia, PA | | | | | | factors and databases) | | | | |
| 19106-2354 | | | | | | (January 1993-Present) | | | | |
| July 1959 | | | | | | | | | | |
| |
| Thomas L. Bennett | | Chair and Trustee | | Trustee since March | | Private Investor | | 148 | | None |
| 610 Market Street | | | | 2005 | | (March 2004–Present) | | | | |
| Philadelphia, PA | | | | Chair since March | | | | | | |
| 19106-2354 | | | | 2015 | | | | | | |
| October 1947 | | | | | | | | | | |
| |
| Ann D. Borowiec | | Trustee | | Since March 2015 | | Chief Executive Officer, Private | | 148 | | Director — Banco Santander |
| 610 Market Street | | | | | | Wealth Management | | | | International |
| Philadelphia, PA | | | | | | (2011–2013) and Market | | | | (October 2016–December 2019) |
| 19106-2354 | | | | | | Manager, New Jersey Private | | | | Director — Santander Bank, N.A. |
| November 1958 | | | | | | Bank (2005–2011) — J.P. | | | | (December 2016–December |
| | | | | | Morgan Chase & Co. | | | | 2019) |
68
Table of Contents
| | | | | | | | Number of | | Other |
| | | | | | Principal | | Portfolios in Fund | | Directorships |
| Name, | | Position(s) | | | | Occupation(s) | | Complex Overseen | | Held by |
| Address, | | Held with | | Length of Time | | During the | | by Trustee | | Trustee |
| and Birth Date | | Fund(s) | | Served | | Past Five Years | | or Officer | | or Officer |
| | | | | | | | | | | |
| Joseph W. Chow | | Trustee | | Since January 2013 | | Private Investor | | 148 | | Director and Audit Committee |
| 610 Market Street | | | | | | (April 2011–Present) | | | | Member — Hercules Technology |
| Philadelphia, PA | | | | | | | | | | Growth Capital, Inc. |
| 19106-2354 | | | | | | | | | | (July 2004–July 2014) |
| January 1953 | | | | | | | | | | |
69
Table of Contents
Board of trustees / directors and officers addendum
Delaware Funds by Macquarie®
| | | | | | | | Number of | | Other |
| | | | | | Principal | | Portfolios in Fund | | Directorships |
| Name, | | Position(s) | | | | Occupation(s) | | Complex Overseen | | Held by |
| Address, | | Held with | | Length of Time | | During the | | by Trustee | | Trustee |
| and Birth Date | | Fund(s) | | Served | | Past Five Years | | or Officer | | or Officer |
| | | | | | | | | | | |
| H. Jeffrey Dobbs3 | | Trustee | | Since December 2021 | | Global Sector Chairman, | | 148 | | Director, Valparaiso University |
| 610 Market Street | | | | | | Industrial Manufacturing, | | | | (2012–Present) |
| Philadelphia, PA | | | | | | KPMG LLP | | | | Director, TechAccel LLC |
| 19106-2354 | | | | | | (2010-2015) | | | | (2015–Present) (Tech R&D) |
| May 1955 | | | | | | | | | | Board Member, Kansas City |
| | | | | | | | | | Repertory Theatre |
| | | | | | | | | | (2015–Present) |
| | | | | | | | | | Board Member, Patients |
| | | | | | | | | | Voices, Inc. (healthcare) |
| | | | | | | | | | (2018–Present) |
| | | | | | | | | | Kansas City Campus for Animal |
| | | | | | | | | | Care (2018–Present) |
| | | | | | | | | | Director, National Association of |
| | | | | | | | | | Manufacturers (2010–2015) |
| | | | | | | | | | Director, The Children’s Center |
| | | | | | | | | | (2003–2015) |
| | | | | | | | | | Director, Metropolitan Affairs |
| | | | | | | | | | Coalition (2003–2015) |
| | | | | | | | | | Director, Michigan Roundtable |
| | | | | | | | | | for Diversity and Inclusion |
| | | | | | | | | | (2003–2015) |
| | | | | | | | | | Trustee, Ivy Funds Complex |
| | | | | | | | | | (2019–2021) |
70
Table of Contents
| | | | | | | | Number of | | Other |
| | | | | | Principal | | Portfolios in Fund | | Directorships |
| Name, | | Position(s) | | | | Occupation(s) | | Complex Overseen | | Held by |
| Address, | | Held with | | Length of Time | | During the | | by Trustee | | Trustee |
| and Birth Date | | Fund(s) | | Served | | Past Five Years | | or Officer | | or Officer |
| | | | | | | | | | | |
| John A. Fry | | Trustee | | Since January 2001 | | Drexel University | | 148 | | Director; Compensation |
| 610 Market Street | | | | | | (August 2010–Present) | | | | Committee and Governance |
| Philadelphia, PA | | | | | | President — Franklin & Marshall | | | | Committee Member — |
| 19106-2354 | | | | | | College | | | | Community Health Systems |
| May 1960 | | | | | | (July 2002��June 2010) | | | | (May 2004–Present) |
| | | | | | | | | | Director — Drexel Morgan & Co. |
| | | | | | | | | | (2015–2019) |
| | | | | | | | | | Director, Audit and |
| | | | | | | | | | Compensation Committee |
| | | | | | | | | | Member — vTv Therapeutics Inc. |
| | | | | | | | | | (2017–Present) |
| | | | | | | | | | Director and Audit Committee |
| | | | | | | | | | Member — FS Credit Real Estate |
| | | | | | | | | | Income Trust, Inc. |
| | | | | | | | | | (2018–Present) |
| | | | | | | | | | Director — Federal Reserve |
| | | | | | | | | | Bank of Philadelphia |
| | | | | | | | | | (January 2020–Present) |
71
Table of Contents
Board of trustees / directors and officers addendum
Delaware Funds by Macquarie®
| | | | | | | | Number of | | Other |
| | | | | | Principal | | Portfolios in Fund | | Directorships |
| Name, | | Position(s) | | | | Occupation(s) | | Complex Overseen | | Held by |
| Address, | | Held with | | Length of Time | | During the | | by Trustee | | Trustee |
| and Birth Date | | Fund(s) | | Served | | Past Five Years | | or Officer | | or Officer |
| | | | | | | | | | | |
| Joseph Harroz, Jr.3 | | Trustee | | Since December 2021 | | President (2020–Present), Interim | | 148 | | Director, OU Medicine, Inc. |
| 610 Market Street | | | | | | President (2019–2020), Vice | | | | (2020–Present) |
| Philadelphia, PA | | | | | | President (2010–2019) and Dean | | | | Director and Shareholder, |
| 19106-2354 | | | | | | (2010–2019), College of Law, | | | | Valliance Bank |
| January 1967 | | | | | | University of Oklahoma; | | | | (2007–Present) |
| | | | | | Managing Member, Harroz | | | | Director, Foundation Healthcare |
| | | | | | Investments, LLC, (commercial | | | | (formerly Graymark HealthCare) |
| | | | | | enterprises) (1998–2019); | | | | (2008–2017) |
| | | | | | Managing Member, St. Clair, | | | | Trustee, the Mewbourne Family |
| | | | | | LLC (commercial enterprises) | | | | Support Organization |
| | | | | | (2019–Present) | | | | (2006–Present) (non-profit) |
| | | | | | | | | | Independent Director, LSQ |
| | | | | | | | | | Manager, Inc. (real estate) |
| | | | | | | | | | (2007–2016) |
| | | | | | | | | | Director, Oklahoma Foundation |
| | | | | | | | | | for Excellence (non-profit) |
| | | | | | | | | | (2008–Present) |
| | | | | | | | | | Trustee, Ivy Funds Complex |
| | | | | | | | | | (1998–2021) |
72
Table of Contents
| | | | | | | | Number of | | Other |
| | | | | | Principal | | Portfolios in Fund | | Directorships |
| Name, | | Position(s) | | | | Occupation(s) | | Complex Overseen | | Held by |
| Address, | | Held with | | Length of Time | | During the | | by Trustee | | Trustee |
| and Birth Date | | Fund(s) | | Served | | Past Five Years | | or Officer | | or Officer |
| | | | | | | | | | | |
| Sandra A.J. | | Trustee | | Since December 2021 | | Chief Administrative Officer, | | 148 | | Director, Hall Family Foundation |
| Lawrence3 | | | | | | Children’s Mercy Hospitals and | | | | (1993–Present) |
| 610 Market Street | | | | | | Clinics | | | | Director, Westar Energy (utility) |
| Philadelphia, PA | | | | | | (2016–2019); | | | | (2004–2018) |
| 19106-2354 | | | | | | CFO, Children’s Mercy Hospitals | | | | Trustee, Nelson-Atkins Museum |
| September 1957 | | | | | | and Clinics | | | | of Art (non-profit) (2021–Present) |
| | | | | | (2005–2016) | | | | (2007–2020) |
| | | | | | | | | | Director, Turn the Page KC |
| | | | | | | | | | (non-profit) (2012–2016) |
| | | | | | | | | | Director, Kansas Metropolitan |
| | | | | | | | | | Business and Healthcare |
| | | | | | | | | | Coalition (non-profit) (2017–2019) |
| | | | | | | | | | Director, National Association of |
| | | | | | | | | | Corporate Directors (non-profit) |
| | | | | | | | | | National Board (2022–Present); |
| | | | | | | | | | Regional Board (2017–2021) |
| | | | | | | | | | Director, American Shared |
| | | | | | | | | | Hospital Services (medical |
| | | | | | | | | | device) (2017–2021) |
| | | | | | | | | | Director, Evergy, Inc., Kansas |
| | | | | | | | | | City Power & Light Company, |
| | | | | | | | | | KCP&L Greater Missouri |
| | | | | | | | | | Operations Company, Westar |
| | | | | | | | | | Energy, Inc. and Kansas Gas and |
| | | | | | | | | | Electric Company (related utility |
| | | | | | | | | | companies) (2018–Present) |
73
Table of Contents
Board of trustees / directors and officers addendum
Delaware Funds by Macquarie®
| | | | | | | | Number of | | Other |
| | | | | | Principal | | Portfolios in Fund | | Directorships |
| Name, | | Position(s) | | | | Occupation(s) | | Complex Overseen | | Held by |
| Address, | | Held with | | Length of Time | | During the | | by Trustee | | Trustee |
| and Birth Date | | Fund(s) | | Served | | Past Five Years | | or Officer | | or Officer |
| | | | | | | | | | | |
| Sandra A.J. | | Trustee | | Since December 2021 | | Chief Administrative Officer, | | 148 | | Director, Stowers (research) |
| Lawrence3 | | | | | | Children’s Mercy Hospitals and | | | | (2018) |
| (continued) | | | | | | Clinics | | | | Co-Chair, Women Corporate |
| 610 Market Street | | | | | | (2016–2019); | | | | Directors (director education) |
| Philadelphia, PA | | | | | | CFO, Children’s Mercy Hospitals | | | | (2018–2020) |
| 19106-2354 | | | | | | and Clinics | | | | Trustee, Ivy Funds Complex |
| September 1957 | | | | | | (2005–2016) | | | | (2019-2021) |
| | | | | | | | | | Director, Brixmor Property |
| | | | | | | | | | Group Inc. |
| | | | | | | | | | (2021–Present) |
| | | | | | | | | | Director, Sera Prognostics Inc. |
| | | | | | | | | | (biotechnology) |
| | | | | | | | | | (2021–Present) |
| | | | | | | | | | Director, Recology (resource |
| | | | | | | | | | recovery) |
| | | | | | | | | | (2021–Present) |
74
Table of Contents
| | | | | | | | Number of | | Other |
| | | | | | Principal | | Portfolios in Fund | | Directorships |
| Name, | | Position(s) | | | | Occupation(s) | | Complex Overseen | | Held by |
| Address, | | Held with | | Length of Time | | During the | | by Trustee | | Trustee |
| and Birth Date | | Fund(s) | | Served | | Past Five Years | | or Officer | | or Officer |
| | | | | | | | | | | |
| Frances A. | | Trustee | | Since September | | Private Investor | | 148 | | Trust Manager and Audit |
| Sevilla-Sacasa | | | | 2011 | | (January 2017–Present) | | | | Committee Chair — Camden |
| 610 Market Street | | | | | | Chief Executive Officer — Banco | | | | Property Trust |
| Philadelphia, PA | | | | | | Itaú International | | | | (August 2011–Present) |
| 19106-2354 | | | | | | (April 2012–December 2016) | | | | Director; Audit |
| January 1956 | | | | | | Executive Advisor to Dean | | | | and Compensation |
| | | | | | (August 2011–March 2012) and | | | | Committee Member — |
| | | | | | Interim Dean | | | | Callon Petroleum Company |
| | | | | | (January 2011–July 2011) — | | | | (December 2019–Present) |
| | | | | | University of Miami School of | | | | Director — New Senior |
| | | | | | Business Administration | | | | Investment Group Inc. |
| | | | | | President — U.S. Trust, Bank of | | | | (January 2021–September 2021) |
| | | | | | America Private Wealth | | | | Director; Audit Committee |
| | | | | | Management (Private Banking) | | | | Member — Carrizo Oil & Gas, |
| | | | | | (July 2007-December 2008) | | | | Inc. (March 2018–December |
| | | | | | | | | | 2019) |
75
Table of Contents
Board of trustees / directors and officers addendum
Delaware Funds by Macquarie®
| | | | | | | | Number of | | Other |
| | | | | | Principal | | Portfolios in Fund | | Directorships |
| Name, | | Position(s) | | | | Occupation(s) | | Complex Overseen | | Held by |
| Address, | | Held with | | Length of Time | | During the | | by Trustee | | Trustee |
| and Birth Date | | Fund(s) | | Served | | Past Five Years | | or Officer | | or Officer |
| | | | | | | | | | | |
| Thomas K. Whitford | | Trustee | | Since January 2013 | | Vice Chairman — PNC Financial | | 148 | | Director — HSBC North America |
| 610 Market Street | | | | | | Services Group | | | | Holdings Inc. |
| Philadelphia, PA | | | | | | (2010–April 2013) | | | | (December 2013–Present) |
| 19106-2354 | | | | | | | | | | Director — HSBC USA Inc. |
| March 1956 | | | | | | | | | | (July 2014–Present) |
| | | | | | | | | | Director — HSBC Bank USA, |
| | | | | | | | | | National Association |
| | | | | | | | | | (July 2014–March 2017) |
| | | | | | | | | | Director — HSBC Finance |
| | | | | | | | | | Corporation |
| | | | | | | | | | (December 2013–April 2018) |
76
Table of Contents
| | | | | | | | Number of | | Other |
| | | | | | Principal | | Portfolios in Fund | | Directorships |
| Name, | | Position(s) | | | | Occupation(s) | | Complex Overseen | | Held by |
| Address, | | Held with | | Length of Time | | During the | | by Trustee | | Trustee |
| and Birth Date | | Fund(s) | | Served | | Past Five Years | | or Officer | | or Officer |
| | | | | | | | | | | |
| Christianna Wood | | Trustee | | Since January 2019 | | Chief Executive Officer and | | 148 | | Director; Finance Committee and |
| 610 Market Street | | | | | | President — Gore Creek Capital, | | | | Audit Committee Member — |
| Philadelphia, PA | | | | | | Ltd. (August 2009–Present) | | | | H&R Block Corporation |
| 19106-2354 | | | | | | | | | | (July 2008–Present) |
| August 1959 | | | | | | | | | | Director; Investments |
| | | | | | | | | | Committee, Capital and Finance |
| | | | | | | | | | Committee, and Audit |
| | | | | | | | | | Committee Member — Grange |
| | | | | | | | | | Insurance (2013–Present) |
| | | | | | | | | | Trustee; Chair of Nominating and |
| | | | | | | | | | Governance Committee and |
| | | | | | | | | | Audit Committee Member — |
| | | | | | | | | | The Merger Fund |
| | | | | | | | | | (2013–October 2021), |
| | | | | | | | | | The Merger Fund VL |
| | | | | | | | | | (2013–October 2021); WCM |
| | | | | | | | | | Alternatives: Event-Driven Fund |
| | | | | | | | | | (2013–October 2021), and WCM |
| | | | | | | | | | Alternatives: Credit Event Fund |
| | | | | | | | | | (December 2017–October 2021) |
| | | | | | | | | | Director; Chair of Governance |
| | | | | | | | | | Committee and Audit Committee |
| | | | | | | | | | Member — International |
| | | | | | | | | | Securities Exchange (2010–2016) |
77
Table of Contents
Board of trustees / directors and officers addendum
Delaware Funds by Macquarie®
| | | | | | | | Number of | | Other |
| | | | | | Principal | | Portfolios in Fund | | Directorships |
| Name, | | Position(s) | | | | Occupation(s) | | Complex Overseen | | Held by |
| Address, | | Held with | | Length of Time | | During the | | by Trustee | | Trustee |
| and Birth Date | | Fund(s) | | Served | | Past Five Years | | or Officer | | or Officer |
| | | | | | | | | | | |
| Janet L. Yeomans | | Trustee | | Since April 1999 | | Vice President and Treasurer | | 148 | | Director; Personnel and |
| 610 Market Street | | | | | | (January 2006–July 2012), Vice | | | | Compensation Committee Chair; |
| Philadelphia, PA | | | | | | President — Mergers & | | | | Member of Nominating, |
| 19106-2354 | | | | | | Acquisitions | | | | Investments, and Audit |
| July 1948 | | | | | | (January 2003–January 2006), | | | | Committees for various periods |
| | | | | | and Vice President and Treasurer | | | | throughout directorship — |
| | | | | | (July 1995–January 2003) — 3M | | | | Okabena Company (2009–2017) |
| | | | | | Company | | | | |
| |
| Officers | | | | | | | | | | |
| |
| David F. Connor | | Senior Vice President, | | Senior Vice President, | | David F. Connor has served in | | 148 | | None4 |
| 610 Market Street | | General Counsel, and | | since May 2013; | | various capacities at different | | | | |
| Philadelphia, PA | | Secretary | | General Counsel | | times at Macquarie Investment | | | | |
| 19106-2354 | | | | since May 2015; | | Management. | | | | |
| December 1963 | | | | Secretary since | | | | | | |
| | | | October 2005 | | | | | | |
| |
| Daniel V. Geatens | | Senior Vice President | | Senior Vice President | | Daniel V. Geatens has served in | | 148 | | None4 |
| 610 Market Street | | and Treasurer | | and Treasurer since | | various capacities at different | | | | |
| Philadelphia, PA | | | | October 2007 | | times at Macquarie Investment | | | | |
| 19106-2354 | | | | | | Management. | | | | |
| October 1972 | | | | | | | | | | |
78
Table of Contents
| | | | | | | | Number of | | Other |
| | | | | | Principal | | Portfolios in Fund | | Directorships |
| Name, | | Position(s) | | | | Occupation(s) | | Complex Overseen | | Held by |
| Address, | | Held with | | Length of Time | | During the | | by Trustee | | Trustee |
| and Birth Date | | Fund(s) | | Served | | Past Five Years | | or Officer | | or Officer |
| | | | | | | | | | | |
| Richard Salus | | Senior Vice President | | Senior Vice President | | Richard Salus has served in | | 148 | | None |
| 610 Market Street | | and Chief Financial | | and Chief Financial | | various capacities at different | | | | |
| Philadelphia, PA | | Officer | | Officer since | | times at Macquarie Investment | | | | |
| 19106-2354 | | | | November 2006 | | Management. | | | | |
| October 1963 | | | | | | | | | | |
| 1 | Shawn K. Lytle is considered to be an “Interested Trustee” because he is an executive officer of the Fund’s(s’) investment advisor. |
| 2 | Macquarie Investment Management is the marketing name for Macquarie Management Holdings, Inc. and its subsidiaries, including the Fund’s(s’) investment advisor, principal underwriter, and its transfer agent. |
| 3 | Messrs. Dobbs and Harroz and Ms. Lawrence were elected as Trustees of the Trust effective December 17, 2021. |
| 4 | David F. Connor serves as Senior Vice President and Secretary, and Daniel V. Geatens serves as Senior Vice President, Treasurer, and Chief Financial Officer, for the six portfolios of the Optimum Fund Trust, which have the same investment advisor, principal underwriter, and transfer agent as the registrant. Mr. Geatens also serves as the Chief Financial Officer and Treasurer for Macquarie Global Infrastructure Total Return Fund Inc. |
The Statement of Additional Information for the Fund(s) includes additional information about the Trustees and Officers and is available, without charge, upon request by calling 800 523-1918.
79
Table of Contents
About the organization
| Board of trustees | | | |
Shawn K. Lytle
President and
Chief Executive Officer
Delaware Funds
by Macquarie®
Philadelphia, PA Jerome D. Abernathy
Managing Member,
Stonebrook Capital
Management, LLC
Jersey City, NJ Thomas L. Bennett
Chairman of the Board
Delaware Funds
by Macquarie
Private Investor
Rosemont, PA | Ann D. Borowiec
Former Chief Executive
Officer
Private Wealth Management
J.P. Morgan Chase & Co.
New York, NY Joseph W. Chow
Former Executive Vice
President
State Street Corporation
Boston, MA H. Jeffrey Dobbs
Former Global Sector
Chairman
Industrial Manufacturing,
KPMG, LLP
Detroit, MI | John A. Fry
President
Drexel University
Philadelphia, PA Joseph Harroz, Jr.
President
University of Oklahoma
Norman, OK Sandra A.J. Lawrence
Former Chief Administrative
Officer
Children’s Mercy Hospitals
and Clinics
Kansas City, MO | Frances A.
Sevilla-Sacasa
Former Chief Executive
Officer
Banco Itaú International
Miami, FL Thomas K. Whitford
Former Vice Chairman
PNC Financial Services
Group
Pittsburgh, PA Christianna Wood
Chief Executive Officer
and President
Gore Creek Capital, Ltd.
Golden, CO Janet L. Yeomans
Former Vice President and
Treasurer
3M Company
St. Paul, MN |
| | | | |
| Affiliated officers | | | |
David F. Connor
Senior Vice President,
General Counsel,
and Secretary
Delaware Funds
by Macquarie
Philadelphia, PA | Daniel V. Geatens
Senior Vice President and
Treasurer
Delaware Funds
by Macquarie
Philadelphia, PA | Richard Salus
Senior Vice President and
Chief Financial Officer
Delaware Funds
by Macquarie
Philadelphia, PA | |
This annual report is for the information of Delaware Limited-Term Diversified Income Fund shareholders, but it may be used with prospective investors when preceded or accompanied by the Delaware Fund fact sheet for the most recently completed calendar quarter. These documents are available at delawarefunds.com/literature.
The Fund files its complete schedule of portfolio holdings with the Securities and Exchange Commission (SEC) for the first and third quarters of each fiscal year on Form N-PORT. The Fund’s Forms N-PORT, as well as a description of the policies and procedures that the Fund uses to determine how to vote proxies (if any) relating to portfolio securities, are available without charge (i) upon request, by calling 800 523-1918; and (ii) on the SEC’s website at sec.gov. In addition, a description of the policies and procedures that the Fund uses to determine how to vote proxies (if any) relating to portfolio securities and the Schedule of Investments included in the Fund’s most recent Form N-PORT are available without charge on the Fund’s website at delawarefunds.com/literature. The Fund’s Forms N-PORT may be reviewed and copied at the SEC’s Public Reference Room in Washington, D.C.; information on the operation of the Public Reference Room may be obtained by calling 800 SEC-0330.
Information (if any) regarding how the Fund voted proxies relating to portfolio securities during the most recently disclosed 12-month period ended June 30 is available without charge (i) through the Fund’s website at delawarefunds.com/proxy; and (ii) on the SEC’s website at sec.gov.
80
Table of Contents
| | |
 |  |
| | |
| | |
| | |
| | |
| | Annual report |
| | |
Fixed income mutual funds
Delaware Tax-Free New Jersey Fund
Delaware Tax-Free Oregon Fund
December 31, 2021
Carefully consider the Funds’ investment objectives, risk factors, charges, and expenses before investing. This and other information can be found in the Funds’ prospectus and their summary prospectuses, which may be obtained by visiting delawarefunds.com/literature or calling 800 523-1918. Investors should read the prospectus and the summary prospectus carefully before investing.
You can obtain shareholder reports and prospectuses online instead of in the mail.
Visit delawarefunds.com/edelivery.
Table of Contents
Experience Delaware Funds by Macquarie®
Macquarie Investment Management (MIM) is a global asset manager with offices in the United States, Europe, Asia, and Australia. As active managers, we prioritize autonomy and accountability at the investment team level in pursuit of opportunities that matter for clients. Delaware Funds is one of the longest-standing mutual fund families, with more than 80 years in existence.
If you are interested in learning more about creating an investment plan, contact your financial advisor.
You can learn more about Delaware Funds or obtain a prospectus for Delaware Tax-Free New Jersey Fund and Delaware Tax-Free Oregon Fund at delawarefunds.com/literature.
Manage your account online
| ● | Check your account balance and transactions |
| ● | View statements and tax forms |
| ● | Make purchases and redemptions |
Visit delawarefunds.com/account-access.
Macquarie Asset Management (MAM) offers a diverse range of products including securities investment management, infrastructure and real asset management, and fund and equity-based structured products. MIM is the marketing name for certain companies comprising the asset management division of Macquarie Group. This includes the following investment advisers: Macquarie Investment Management Business Trust (MIMBT), Macquarie Funds Management Hong Kong Limited, Macquarie Investment Management Austria Kapitalanlage AG, Macquarie Investment Management Global Limited, Macquarie Investment Management Europe Limited, and Macquarie Investment Management Europe S.A.
The Funds are distributed by Delaware Distributors, L.P. (DDLP), an affiliate of MIMBT and Macquarie Group Limited.
Other than Macquarie Bank Limited ABN 46 008 583 542 (“Macquarie Bank”), any Macquarie Group entity noted in this document is not an authorized deposit-taking institution for the purposes of the Banking Act 1959 (Commonwealth of Australia). The obligations of these other Macquarie Group entities do not represent deposits or other liabilities of Macquarie Bank. Macquarie Bank does not guarantee or otherwise provide assurance in respect of the obligations of these other Macquarie Group entities. In addition, if this document relates to an investment, (a) the investor is subject to investment risk including possible delays in repayment and loss of income and principal invested and (b) none of Macquarie Bank or any other Macquarie Group entity guarantees any particular rate of return on or the performance of the investment, nor do they guarantee repayment of capital in respect of the investment.
The Funds are governed by US laws and regulations.
Unless otherwise noted, views expressed herein are current as of December 31, 2021, and subject to change for events occurring after such date.
The Funds are not FDIC insured and are not guaranteed. It is possible to lose the principal amount invested.
Advisory services provided by Delaware Management Company, a series of MIMBT, a US registered investment advisor.
All third-party marks cited are the property of their respective owners.
© 2022 Macquarie Management Holdings, Inc.
Table of Contents
| Portfolio management review | |
| Delaware Funds by Macquarie® tax-exempt funds | January 11, 2022 (Unaudited) |
| Performance preview (for the year ended December 31, 2021) | | | |
| Delaware Tax–Free New Jersey Fund (Institutional Class shares) | 1-year return | | +3.53% |
| Delaware Tax–Free New Jersey Fund (Class A shares) | 1-year return | | +3.28% |
| Bloomberg Municipal Bond Index (benchmark) | 1-year return | | +1.52% |
| Lipper New Jersey Municipal Debt Funds Average | 1-year return | | +2.57% |
Past performance does not guarantee future results.
For complete, annualized performance for Delaware Tax-Free New Jersey Fund, please see the table on page 6.
Institutional Class shares are not subject to a sales charge and are offered for sale exclusively to certain eligible investors. In addition, Institutional Class shares pay no distribution and service fee.
The performance of Class A shares excludes the applicable sales charge. The performance of both Institutional Class shares and Class A shares reflects the reinvestment of all distributions.
The Lipper New Jersey Municipal Debt Funds Average compares funds that invest primarily in municipal debt issues that are exempt from taxation in New Jersey.
Please see page 9 for a description of the index. Index performance returns do not reflect any management fees, transaction costs, or expenses. Indices are unmanaged and one cannot invest directly in an index.
| Delaware Tax–Free Oregon Fund (Institutional Class shares) | 1-year return | | +3.00% |
| Delaware Tax–Free Oregon Fund (Class A shares) | 1-year return | | +2.82% |
| Bloomberg Municipal Bond Index (benchmark) | 1-year return | | +1.52% |
| Lipper Other States Municipal Debt Funds Average | 1-year return | | +1.40% |
Past performance does not guarantee future results.
For complete, annualized performance for Delaware Tax-Free Oregon Fund, please see the table on page 10.
Institutional Class shares are not subject to a sales charge and are offered for sale exclusively to certain eligible investors. In addition, Institutional Class shares pay no distribution and service fee.
The performance of Class A shares excludes the applicable sales charge. The performance of both Institutional Class shares and Class A shares reflects the reinvestment of all distributions.
The Lipper Other States Municipal Debt Funds Average compares funds that limit assets to those securities that are exempt from taxation on a specified city or state basis.
Please see page 13 for a description of the index. Index performance returns do not reflect any management fees, transaction costs, or expenses. Indices are unmanaged and one cannot invest directly in an index.
1
Table of Contents
Portfolio management review
Delaware Funds by Macquarie® tax-exempt funds
Investment objectives
Delaware Tax-Free New Jersey Fund seeks a high level of interest income that is exempt from both federal and state income tax for individual residents of the state of New Jersey.
Delaware Tax-Free Oregon Fund seeks a high level of interest income that is exempt from both federal and state income tax for individual residents of the state of Oregon.
Economic backdrop
During the fiscal year ended December 31, 2021, the US economy continued to bounce back from its sharp decline at the start of the pandemic in 2020, benefiting as states and municipalities reopened their economies. The $1.9 trillion American Rescue Plan Act, a federal stimulus program, lifted economic growth further while continued aggressive monetary policy for much of the year provided an added boost.
Investors began the year optimistically, as the introduction of COVID-19 vaccines initially promised to lead to a dramatic decline in virus cases and hospitalization rates and to boost economic growth. By the second half of 2021, however, uncertainty about the path of the coronavirus had returned. First came the Delta variant in the summer and fall, and then, late in the year, the fast-spreading Omicron variant. One silver lining for investors concerned about the long-term economic impact of COVID-19 was the initial evidence that Omicron, well on its way to becoming the dominant form of the virus, appeared less likely than other variants to lead to hospitalization and death.
Overall, the US economy enjoyed strong growth in the first half of 2021, though that growth decelerated in the year’s second half amid the resurgent pandemic. In the first two quarters of 2021, US gross domestic product (GDP) – a measure of national economic output – expanded by an annualized 6.3% and 6.7%, respectively. By the third quarter of 2021 (at this writing, the latest period for which data was available), GDP growth remained positive but slowed to 2.3%, as the Delta variant, combined with supply chain concerns, limited economic activity.
Meanwhile, reflecting the more favorable economic backdrop, the employment situation steadily improved throughout 2021. The US jobless rate, which began the year at 6.7%, had fallen to 3.9% by December – the lowest level since the pandemic began.
Throughout 2021, the US Federal Reserve maintained its benchmark short-term interest rate – also known as the federal funds rate – essentially at zero, where the rate has been throughout the pandemic. As the year progressed and signs mounted that inflation was accelerating, however, the Fed signaled its plans to raise interest rates multiple times in 2022.
Municipal bond market conditions
Overall, the municipal bond market, as measured by the Bloomberg Municipal Bond Index, returned +1.52% for the fiscal year ended December 31, 2021.
During the Fund’s fiscal year, municipal bonds benefited from a favorable technical backdrop. In other words, robust demand for tax-exempt debt along with constrained supply lifted the asset class and helped it outperform the taxable bond market. Other factors to boost municipal bond values during the 12-month period included greater investor confidence in issuers’ underlying credit quality, healthy fiscal stimulus from the federal government, higher-than-anticipated state and local tax collections, and expectations for higher tax rates in the future. With continued-low interest rates, longer-dated, lower-rated municipal bonds saw particularly strong demand, benefiting from their higher income.
During 2021, municipal bond yields rose modestly, while the municipal yield curve flattened
2
Table of Contents
(indicating that rates on shorter-term bonds rose more than on longer-dated bonds). Bonds with longer maturities generally outperformed their intermediate- and shorter-dated counterparts, while lower-rated bonds outpaced higher-quality issues.
The following tables show municipal bond returns by maturity length and by credit quality for the fiscal year ended December 31, 2021.
| Returns by credit rating | |
| AAA | 0.47% |
| AA | 0.92% |
| A | 2.25% |
| BBB | 4.85% |
| | |
| Returns by maturity | |
| 1 year | 0.31% |
| 3 years | 0.40% |
| 5 years | 0.34% |
| 10 years | 0.96% |
| 22+ years | 3.17% |
Source: Bloomberg.
Economic backdrop in the states
New Jersey ranked fourth among US states in GDP growth during the third quarter of 2021, after trailing median US growth in the second quarter of the year. The state’s higher-than-national-level 6.6% unemployment rate in November 2021 declined from 7% sequentially and from 10.2% in November 2020. The $18.1 billion tax revenue for the first half of fiscal year 2022 (July-December) was $3.44 billion, or 23.5%, above the 2020 level during the same period. Personal income tax revenues are 19.9% higher in the first half of fiscal year 2022 versus the first half of fiscal year 2021. Corporate income taxes are running 28.2% above the first half of fiscal year 2021. Fiscal-year-to-date sales taxes are higher by 12%. The second half of fiscal year 2022 should see a slowdown in tax revenue growth from approved tax cuts for the calendar year. All four rating agencies have upgraded their outlooks on state general obligation and lease debt since the enactment of the fiscal year 2022 state budget, which will provide the full annual pension funding for the first time in decades.
Sources: bea.gov, bls.gov, nj.gov/treasury.
Oregon’s recent revenue boom has led to upward revisions to the fiscal year 2022 revenue outlook: $558 million in personal income tax refunds and $250 million in corporate refunds. The new forecast for the fiscal year 2021-2023 biennium budget has reached $807 million as of December, with personal income taxes $531 million higher and corporate income taxes $250.3 million higher. As of November 2021, Oregon’s unemployment rate was 4.2%, down from 4.4% in October 2021 and 6.6% in November 2020. The state had more than 100,000 job openings as of December 2021.
Sources: oregon.gov/das/OEA, bls.gov.
A consistent management approach
For both Funds discussed in this report, we pursued the same bottom-up investment management strategy we follow regardless of the market conditions. We rely on our team’s thorough credit research to choose bonds on an issuer-by-issuer basis. We regularly seek tax-exempt bonds that offer the Funds’ shareholders what we see as an attractive trade-off between return opportunity and risk.
Because of their generally higher income, bonds with lower-investment-grade or below-investment-grade credit ratings and backed by what we assess to be solid underlying credit quality are generally the most suitable for our strategy.
As of the end of the fiscal year on December 31, 2021, roughly 19.9% of Delaware Tax-Free New Jersey Fund’s net assets were invested in bonds with lower-investment-grade credit ratings (rated A and BBB). Approximately 9.2% of
3
Table of Contents
Portfolio management review
Delaware Funds by Macquarie® tax-exempt funds
Delaware Tax-Free Oregon Fund’s net assets were invested in these bonds from these same credit tiers.
At year end, both Funds also maintained allocations to high yield municipal bonds, referring to securities with credit ratings below BBB. By prospectus, the Funds may hold up to 20% of their net assets in high yield debt. Whenever we invest in the high yield market segment, we thoroughly analyze the securities’ credit risk and emphasize those bonds we believe offer our shareholders a favorable risk-reward balance.
Focusing on income
At the start of this fiscal year, we were comfortable with the Funds’ basic positioning, which entailed maintaining relative overweightings in the longer-dated and lower-rated segments of the municipal bond market. Accordingly, our priority throughout the past 12 months was to preserve that positioning as much as possible –a goal we believe we achieved with very limited turnover in each portfolio.
When we did purchase new bonds, we sought additions that allowed us to maintain our relative overweights, to enhance the Funds’ income while optimizing total return. Following this strategy, for example, we bought tax-exempt debt affiliated with the Commonwealth of Puerto Rico, a US territory, in which we continued to find value amid the island’s ongoing financial restructuring.
As the fiscal year progressed and credit spreads on municipal bonds narrowed, we became especially selective with our new investments, focusing purchases on bonds we believed offered our shareholders a favorable risk-reward trade-off. When attractive value opportunities became harder to find, we continued to focus on higher yielding state bonds we believed represented long-term value, and we remained patient while pursuing this goal.
Individual performance effects
As mentioned, longer-duration bonds – meaning those with more sensitivity to interest-rate changes – generally outperformed shorter-duration bonds, while lower-rated bonds outpaced higher-quality bonds. During this fiscal year, the Funds’ highest and lowest performers reflected these performance trends.
In Delaware Tax-Free New Jersey Fund and Delaware Tax-Free Oregon Fund, for example, several of our strongest-performing securities were affiliated with Puerto Rico. (Like those of other US territories, Puerto Rico bonds are generally fully tax-exempt for US residents.) Besides benefiting from their below-investment-grade credit ratings and relatively long maturity dates, these bonds gained on investors’ optimism about the commonwealth’s improved credit quality, progress with its debt restructuring plan, and the securities’ relatively low valuation to start the fiscal year.
Delaware Tax-Free New Jersey Fund also saw strong performance from lower-rated project-finance bonds of Aries Clean Technologies, which were issued to develop an environmentally friendly biosolids plant in Linden, New Jersey. These nonrated bonds returned about 9% for the Fund this year, rising off a depressed valuation earlier in the pandemic. Another strong individual performer for this Fund was South Jersey Port Corporation bonds, which benefited from their lower credit rating and longer maturity date in a market environment that tended to reward such securities.
Delaware Tax-Free New Jersey Fund’s weakest individual performers were highly rated, shorter-duration bonds, as these characteristics proved less compelling to yield-seeking investors. For example, our positions in Essex County Improvement Authority dedicated-tax bonds and New Jersey State Educational Facilities Authority bonds for Princeton University returned roughly
4
Table of Contents
-1% for the fiscal year, as these shorter-dated securities occupied an underperforming area of the municipal yield curve.
Delaware Tax-Free Oregon Fund similarly benefited from several strong-performing Puerto Rico positions. Among Oregon securities, the Fund’s leading individual performers were nonrated bonds with longer maturity dates. This included a position in Metro East Web Academy, an online charter school; these bonds gained about 8% for the fiscal year. A position in bonds for Rose Villa Retirement, a senior-living center in Portland, also added value. As with the debt of numerous retirement housing communities, these bonds were somewhat depressed coming into the fiscal year, and they enjoyed a rebound in their prices over the past 12 months.
In contrast, Delaware Tax-Free Oregon Fund’s weakest performers were, again, bonds with high credit quality and relatively short maturities. These included a pre-refunded bond issue for Umatilla County School District and school district bonds for Linn County Community School District.
5
Table of Contents
| Performance summaries |
| Delaware Tax–Free New Jersey Fund | December 31, 2021 (Unaudited) |
The performance quoted represents past performance and does not guarantee future results. Investment return and principal value of an investment will fluctuate so that shares, when redeemed, may be worth more or less than their original cost. Current performance may be lower or higher than the performance quoted. Performance data current to the most recent month end may be obtained by calling 800 523-1918 or visiting delawarefunds.com/performance.
| Fund and benchmark performance1,2 | | Average annual total returns through December 31, 2021 |
| | 1 year | | 5 year | | 10 year | | Lifetime |
| Class A (Est. September 13, 1988) | | | | | | | | |
| Excluding sales charge | | +3.28% | | +3.88% | | +3.26% | | — |
| Including sales charge | | -1.40% | | +3.03% | | +2.84% | | — |
| Institutional Class (Est. May 1, 2013) | | | | | | | | |
| Excluding sales charge | | +3.53% | | +4.12% | | — | | +3.04% |
| Including sales charge | | +3.53% | | +4.12% | | — | | +3.04% |
| Bloomberg Municipal Bond Index | | +1.52% | | +4.17% | | +3.72% | | — |
| 1 | Returns reflect the reinvestment of all distributions and are presented both with and without the applicable sales charges described below. Returns do not reflect the deduction of taxes the shareholder would pay on Fund distributions or redemptions of Fund shares. |
Expense limitations were in effect for certain classes during some or all of the periods shown in the “Fund and benchmark performance” table. Expenses for each class are listed on the “Fund expense ratios” table on page 7. Performance would have been lower had expense limitations not been in effect.
Institutional Class shares are not subject to a sales charge and are offered for sale exclusively to certain eligible investors. In addition, Institutional Class shares pay no distribution and service (12b-1) fee.
Class A shares are sold with a maximum front-end sales charge of 4.50%, and have an annual 12b-1 fee of 0.25% of average daily net assets. Performance of the predecessor fund contained a 4.00% sales charge. Performance for Class A shares, excluding sales charges, assumes that no front-end sales charge applied.
Fixed income securities and bond funds can lose value, and investors can lose principal, as interest rates rise. They also may be affected by economic conditions that hinder an issuer’s ability to make interest and principal payments on its debt. This includes prepayment risk, the risk that the principal of a bond that is held by a portfolio will be prepaid prior to maturity, at the time when interest rates are lower than what the bond was paying. A portfolio may then have to reinvest that money at a lower interest rate.
Funds that invest primarily in one state may be more susceptible to the economic, regulatory, regional, and other factors of that state than geographically diversified funds.
Substantially all dividend income derived from tax-free funds is exempt from federal income tax. Some income may be subject to state or local and/or the federal alternative minimum tax (AMT) that applies to certain investors. Capital gains, if any, are taxable.
Duration number will change as market conditions change. Therefore, duration should not be solely relied upon to indicate a municipal bond fund’s potential volatility.
6
Table of Contents
IBOR risk is the risk that changes related to the use of the London interbank offered rate (LIBOR) or similar rates (such as EONIA) could have adverse impacts on financial instruments that reference these rates. The abandonment of these rates and transition to alternative rates could affect the value and liquidity of instruments that reference them and could affect investment strategy performance.
The disruptions caused by natural disasters, pandemics, or similar events could prevent the Fund from executing advantageous investment decisions in a timely manner and could negatively impact the Fund’s ability to achieve its investment objective and the value of the Fund’s investments.
| 2 | The Fund’s expense ratios, as described in the most recent prospectus, are disclosed in the following “Fund expense ratios” table. Delaware Management Company has agreed to reimburse certain expenses and/or waive certain fees in order to prevent total annual fund operating expenses (excluding any 12b-1 fees, acquired fund fees and expenses, taxes, interest, short sale dividend and interest expenses, brokerage fees, certain insurance costs, and nonroutine expenses or costs, including, but not limited to, those relating to reorganizations, litigation, conducting shareholder meetings, and liquidations (collectively, nonroutine expenses)) from exceeding 0.59% of the Fund’s average daily net assets for Class A shares and Institutional Class shares, of the Fund’s average daily net assets from January 1, 2021 through December 31, 2021.* Please see the most recent prospectus and any applicable supplement(s) for additional information on these fee waivers and/or reimbursements. Please see the “Financial highlights” section in this report for the most recent expense ratios. |
| Fund expense ratios | | Class A | | Institutional Class |
Total annual operating expenses
(without fee waivers) | | 1.25% | | 1.00% |
Net expenses (including fee
waivers, if any) | | 0.84% | | 0.59% |
| Type of waiver | | Contractual | | Contractual |
* | The aggregate contractual waiver period covering this report is from April 30, 2021 through April 30, 2022. |
7
Table of Contents
Performance summaries
Delaware Tax–Free New Jersey Fund
Performance of a $10,000 investment1
Class A shares
Average annual total returns from December 31, 2011 through December 31, 2021
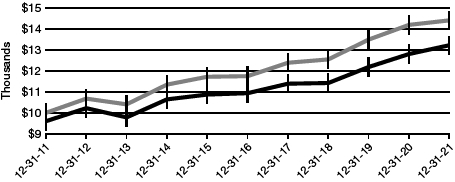
| For period beginning December 31, 2011 through December 31, 2021 | | Starting value | | Ending value |
 | Bloomberg Municipal Bond Index | | | $10,000 | | | $14,414 |
 | Delaware Tax–Free New Jersey Fund — Class A shares | | | $9,600 | | | $13,227 |
Institutional Class shares
Average annual total returns from May 1, 2013 (inception date) through December 31, 2021
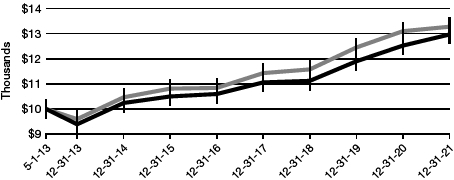
| For period beginning May 1, 2013 through December 31, 2021 | | Starting value | | Ending value |
| Bloomberg Municipal Bond Index | | $10,000 | | $13,272 |
| Delaware Tax–Free New Jersey Fund — Institutional Class shares | | $10,000 | | $12,962 |
8
Table of Contents
| 1 | The “Performance of a $10,000 investment” graph for Class A shares assumes $10,000 invested in Class A shares of the Fund on December 31, 2011, and includes the effect of a 4.50% front-end sales charge and the reinvestment of all distributions. The graph also assumes $10,000 invested in the Bloomberg Municipal Bond Index as of December 31, 2011. |
The “Performance of a $10,000 investment” graph for Institutional Class shares assumes $10,000 invested in Institutional Class shares of the Fund on May 1, 2013, and includes the reinvestment of all distributions. The graph also assumes $10,000 invested in the Bloomberg Municipal Bond Index as of May 1, 2013.
The graphs do not reflect the deduction of taxes the shareholders would pay on Fund distributions or redemptions of Fund shares. Expense limitations were in effect for some or all of the periods shown. Performance would have been lower had expense limitations not been in effect. Expenses are listed in the “Fund expense ratios” table on page 7. Please note additional details on pages 6 through 9.
The Bloomberg Municipal Bond Index measures the total return performance of the long-term, investment grade tax-exempt bond market.
Gross domestic product, mentioned on pages 2 and 3, is a measure of all goods and services produced by a nation in a year. It is a measure of economic activity.
Index performance returns do not reflect any management fees, transaction costs, or expenses. Indices are unmanaged and one cannot invest directly in an index. Past performance does not guarantee future results.
Performance of other Fund classes will vary due to different charges and expenses.
| | Nasdaq symbols | | CUSIPs |
| Class A | | FINJX | | 245912779 |
| Institutional Class | | FINLX | | 245912761 |
9
Table of Contents
| Performance summaries | |
| Delaware Tax–Free Oregon Fund | December 31, 2021 (Unaudited) |
The performance quoted represents past performance and does not guarantee future results. Investment return and principal value of an investment will fluctuate so that shares, when redeemed, may be worth more or less than their original cost. Current performance may be lower or higher than the performance quoted. Performance data current to the most recent month end may be obtained by calling 800 523-1918 or visiting delawarefunds.com/performance.
| Fund and benchmark performance1,2 | | Average annual total returns through December 31, 2021 |
| | | 1 year | | 5 year | | 10 year | | Lifetime |
| Class A (Est. May 4, 1992) | | | | | | | | |
| Excluding sales charge | | +2.82% | | +3.37% | | +2.92% | | — |
| Including sales charge | | -1.84% | | +2.52% | | +2.49% | | — |
| Institutional Class (Est. May 1, 2013) | | | | | | | | |
| Excluding sales charge | | +3.00% | | +3.63% | | — | | +2.66% |
| Including sales charge | | +3.00% | | +3.63% | | — | | +2.66% |
| Bloomberg Municipal Bond Index | | +1.52% | | +4.17% | | +3.72% | | — |
| 1 | Returns reflect the reinvestment of all distributions and are presented both with and without the applicable sales charges described below. Returns do not reflect the deduction of taxes the shareholder would pay on Fund distributions or redemptions of Fund shares. |
Expense limitations were in effect for certain classes during some or all of the periods shown in the “Fund and benchmark performance” table. Expenses for each class are listed on the “Fund expense ratios” table on page 11. Performance would have been lower had expense limitations not been in effect.
Institutional Class shares are not subject to a sales charge and are offered for sale exclusively to certain eligible investors. In addition, Institutional Class shares pay no distribution and service (12b-1) fee.
Class A shares are sold with a maximum front-end sales charge of 4.50%, and have an annual 12b-1 fee of 0.25% of average daily net assets. Performance of the predecessor fund contained a 4.00% sales charge. Performance for Class A shares, excluding sales charges, assumes that no front-end sales charge applied.
Fixed income securities and bond funds can lose value, and investors can lose principal, as interest rates rise. They also may be affected by economic conditions that hinder an issuer’s ability to make interest and principal payments on its debt. This includes prepayment risk, the risk that the principal of a bond that is held by a portfolio will be prepaid prior to maturity, at the time when interest rates are lower than what the bond was paying. A portfolio may then have to reinvest that money at a lower interest rate.
Funds that invest primarily in one state may be more susceptible to the economic, regulatory, regional, and other factors of that state than geographically diversified funds.
Substantially all dividend income derived from tax-free funds is exempt from federal income tax. Some income may be subject to state or local and/or the federal alternative minimum tax (AMT) that applies to certain investors. Capital gains, if any, are taxable.
Duration number will change as market conditions change. Therefore, duration should not be solely relied upon to indicate a municipal bond fund’s potential volatility.
10
Table of Contents
IBOR risk is the risk that changes related to the use of the London interbank offered rate (LIBOR) or similar rates (such as EONIA) could have adverse impacts on financial instruments that reference these rates. The abandonment of these rates and transition to alternative rates could affect the value and liquidity of instruments that reference them and could affect investment strategy performance.
The disruptions caused by natural disasters, pandemics, or similar events could prevent the Fund from executing advantageous investment decisions in a timely manner and could negatively impact the Fund’s ability to achieve its investment objective and the value of the Fund’s investments.
| 2 | The Fund’s expense ratios, as described in the most recent prospectus, are disclosed in the following “Fund expense ratios” table. Delaware Management Company has agreed to reimburse certain expenses and/or waive certain fees in order to prevent total annual fund operating expenses (excluding any 12b-1 fees, acquired fund fees and expenses, taxes, interest, short sale dividend and interest expenses, brokerage fees, certain insurance costs, and nonroutine expenses or costs, including, but not limited to, those relating to reorganizations, litigation, conducting shareholder meetings, and liquidations (collectively, nonroutine expenses)) from exceeding 0.65% of the Fund’s average daily net assets for Class A shares and Institutional Class shares, of the Fund’s average daily net assets from January 1, 2021 through December 31, 2021.* Please see the most recent prospectus and any applicable supplement(s) for additional information on these fee waivers and/or reimbursements. Please see the “Financial highlights” section in this report for the most recent expense ratios. |
| Fund expense ratios | Class A | | Institutional Class |
Total annual operating expenses
(without fee waivers) | 1.19% | | 0.94% |
Net expenses (including fee
waivers, if any) | 0.90% | | 0.65% |
| Type of waiver | Contractual | | Contractual |
| * | The aggregate contractual waiver period covering this report is from April 30, 2021 through April 30, 2022. |
11
Table of Contents
Performance summaries
Delaware Tax–Free Oregon Fund
Performance of a $10,000 investment1
Class A shares
Average annual total returns from December 31, 2011 through December 31, 2021
| For period beginning December 31, 2011 through December 31, 2021 | | Starting value | | Ending value |
 | Bloomberg Municipal Bond Index | | | $10,000 | | | | $14,414 | |
 | Delaware Tax–Free Oregon Fund — Class A shares | | | $9,600 | | | | $12,793 | |
Institutional Class shares
Average annual total returns from May 1, 2013 (inception date) through December 31, 2021
| For period beginning May 1, 2013 through December 31, 2021 | | Starting value | | Ending value |
| Bloomberg Municipal Bond Index | | | $10,000 | | | | $13,272 | |
| Delaware Tax–Free Oregon Fund — Institutional Class shares | | | $10,000 | | | | $12,556 | |
12
Table of Contents
| 1 | The “Performance of a $10,000 investment” graph for Class A shares assumes $10,000 invested in Class A shares of the Fund on December 31, 2011, and includes the effect of a 4.50% front-end sales charge and the reinvestment of all distributions. The graph also assumes $10,000 invested in the Bloomberg Municipal Bond Index as of December 31, 2011. |
The “Performance of a $10,000 investment” graph for Institutional Class shares assumes $10,000 invested in Institutional Class shares of the Fund on May 1, 2013, and includes the reinvestment of all distributions. The graph also assumes $10,000 invested in the Bloomberg Municipal Bond Index as of May 1, 2013.
The graphs do not reflect the deduction of taxes the shareholders would pay on Fund distributions or redemptions of Fund shares. Expense limitations were in effect for some or all of the periods shown. Performance would have been lower had expense limitations not been in effect. Expenses are listed in the “Fund expense ratios” table on page 11. Please note additional details on pages 10 through 13.
The Bloomberg Municipal Bond Index measures the total return performance of the long-term, investment grade tax-exempt bond market.
Gross domestic product, mentioned on pages 2 and 3, is a measure of all goods and services produced by a nation in a year. It is a measure of economic activity.
Index performance returns do not reflect any management fees, transaction costs, or expenses. Indices are unmanaged and one cannot invest directly in an index. Past performance does not guarantee future results.
Performance of other Fund classes will vary due to different charges and expenses.
| | Nasdaq symbols | | CUSIPs |
| Class A | | FTORX | | 245912712 |
| Institutional Class | | FTOTX | | 245912696 |
13
Table of Contents
Disclosure of Fund expenses
For the six-month period from July 1, 2021 to December 31, 2021 (Unaudited)
As a shareholder of a Fund, you incur two types of costs: (1) transaction costs, including sales charges (loads) on purchase payments, reinvested dividends, or other distributions; redemption fees; and exchange fees; and (2) ongoing costs, including management fees; distribution and service (12b-1) fees; and other Fund expenses. The following examples are intended to help you understand your ongoing costs (in dollars) of investing in a Fund and to compare these costs with the ongoing costs of investing in other mutual funds.
The examples are based on an investment of $1,000 invested at the beginning of the period and held for the entire six-month period from July 1, 2021 to December 31, 2021.
Actual expenses
The first section of the tables shown, “Actual Fund return,” provides information about actual account values and actual expenses. You may use the information in this section of the table, together with the amount you invested, to estimate the expenses that you paid over the period. Simply divide your account value by $1,000 (for example, an $8,600 account value divided by $1,000 = 8.6), then multiply the result by the number in the first section under the heading entitled “Expenses Paid During Period” to estimate the expenses you paid on your account during this period.
Hypothetical example for comparison purposes
The second section of the tables shown, “Hypothetical 5% return,” provides information about hypothetical account values and hypothetical expenses based on the Funds’ actual expense ratios and an assumed rate of return of 5% per year before expenses, which is not the Funds’ actual return. The hypothetical account values and expenses may not be used to estimate the actual ending account balance or expenses you paid for the period. You may use this information to compare the ongoing costs of investing in each Fund and other funds. To do so, compare this 5% hypothetical example with the 5% hypothetical examples that appear in the shareholder reports of the other funds.
Please note that the expenses shown in the tables are meant to highlight your ongoing costs only and do not reflect any transactional costs, such as sales charges (loads), redemption fees, or exchange fees. Therefore, the second section of each table is useful in comparing ongoing costs only, and will not help you determine the relative total costs of owning different funds. In addition, if these transactional costs were included, your costs would have been higher. The Funds’ expenses shown in the tables reflect fee waivers in effect and assume reinvestment of all dividends and distributions.
14
Table of Contents
Delaware Tax–Free New Jersey Fund
Expense analysis of an investment of $1,000
| | Beginning | | Ending | | | | | | Expenses |
| | Account Value | | Account Value | | Annualized | | Paid During Period |
| | 7/1/21 | | 12/31/21 | | Expense Ratio | | 7/1/21 to 12/31/21* |
| Actual Fund return† | | | | | | | | | | | | | | | | | | | |
| Class A | | | $ | 1,000.00 | | | | $ | 1,008.90 | | | | 0.84% | | | | $ | 4.25 | |
| Institutional Class | | | | 1,000.00 | | | | | 1,010.20 | | | | 0.59% | | | | | 2.99 | |
| Hypothetical 5% return (5% return before expenses) | | | | | | | | | | |
| Class A | | | $ | 1,000.00 | | | | $ | 1,020.97 | | | | 0.84% | | | | $ | 4.28 | |
| Institutional Class | | | | 1,000.00 | | | | | 1,022.23 | | | | 0.59% | | | | | 3.01 | |
Delaware Tax–Free Oregon Fund
Expense analysis of an investment of $1,000
| | Beginning | | Ending | | | | | | Expenses |
| | Account Value | | Account Value | | Annualized | | Paid During Period |
| | 7/1/21 | | 12/31/21 | | Expense Ratio | | 7/1/21 to 12/31/21* |
| Actual Fund return† | | | | | | | | | | | | | | | | | | | |
| Class A | | | $ | 1,000.00 | | | | $ | 1,009.00 | | | | 0.89% | | | | $ | 4.51 | |
| Institutional Class | | | | 1,000.00 | | | | | 1,009.50 | | | | 0.64% | | | | | 3.24 | |
| Hypothetical 5% return (5% return before expenses) | | | | | | | | | | |
| Class A | | | $ | 1,000.00 | | | | $ | 1,020.72 | | | | 0.89% | | | | $ | 4.53 | |
| Institutional Class | | | | 1,000.00 | | | | | 1,021.98 | | | | 0.64% | | | | | 3.26 | |
| * | “Expenses Paid During Period” are equal to the relevant Fund’s annualized expense ratio, multiplied by the average account value over the period, multiplied by 184/365 (to reflect the one-half year period). |
| † | Because actual returns reflect only the most recent six-month period, the returns shown may differ significantly from fiscal year returns. |
15
Table of Contents
| Security type / sector / state / territory allocations |
| Delaware Tax–Free New Jersey Fund | As of December 31, 2021 (Unaudited) |
Sector designations may be different from the sector designations presented in other Fund materials.
| Security type / sector | | Percentage of net assets |
| Municipal Bonds* | | | 98.22 | % | |
| Corporate Revenue Bond | | | 2.17 | % | |
| Education Revenue Bonds | | | 11.87 | % | |
| Electric Revenue Bonds | | | 3.16 | % | |
| Healthcare Revenue Bonds | | | 4.47 | % | |
| Housing Revenue Bond | | | 1.43 | % | |
| Lease Revenue Bonds | | | 16.68 | % | |
| Local General Obligation Bonds | | | 17.64 | % | |
| Pre-Refunded Bonds | | | 6.33 | % | |
| Resource Recovery Revenue Bond | | | 0.98 | % | |
| Special Tax Revenue Bonds | | | 22.37 | % | |
| State General Obligation Bonds | | | 4.88 | % | |
| Transportation Revenue Bonds | | | 6.24 | % | |
| Short-Term Investments | | | 0.75 | % | |
| Total Value of Securities | | | 98.97 | % | |
| Receivables and Other Assets Net of Liabilities | | | 1.03 | % | |
| Total Net Assets | | | 100.00 | % | |
| * | As of the date of this report, Delaware Tax–Free New Jersey Fund held bonds issued by or on behalf of territories and the states of the US as follows: |
| State / territory | | Percentage of net assets |
| New Jersey | | | 79.55 | % | |
| Pennsylvania | | | 1.63 | % | |
| Puerto Rico | | | 17.42 | % | |
| US Virgin Islands | | | 0.37 | % | |
| Total Value of Securities | | | 98.97 | % | |
16
Table of Contents
| Security type / sector / state / territory allocations |
| Delaware Tax–Free Oregon Fund | As of December 31, 2021 (Unaudited) |
Sector designations may be different from the sector designations presented in other Fund materials.
| Security type / sector | | Percentage of net assets |
| Municipal Bonds* | | | 98.42 | % | |
| Education Revenue Bonds | | | 8.45 | % | |
| Electric Revenue Bonds | | | 2.82 | % | |
| Healthcare Revenue Bonds | | | 14.81 | % | |
| Housing Revenue Bonds | | | 3.81 | % | |
| Lease Revenue Bonds | | | 0.56 | % | |
| Local General Obligation Bonds | | | 25.47 | % | |
| Pre-Refunded Bonds | | | 15.82 | % | |
| Special Tax Revenue Bonds | | | 14.42 | % | |
| State General Obligation Bonds | | | 6.35 | % | |
| Transportation Revenue Bonds | | | 4.54 | % | |
| Water & Sewer Revenue Bonds | | | 1.37 | % | |
| Short-Term Investments | | | 0.49 | % | |
| Total Value of Securities | | | 98.91 | % | |
| Receivables and Other Assets Net of Liabilities | | | 1.09 | % | |
| Total Net Assets | | | 100.00 | % | |
| * | As of the date of this report, Delaware Tax–Free Oregon Fund held bonds issued by or on behalf of territories and the states of the US as follows: |
| State / territory | | Percentage of net assets |
| Oregon | | | 80.58 | % | |
| Puerto Rico | | | 17.92 | % | |
| US Virgin Islands | | | 0.41 | % | |
| Total Value of Securities | | | 98.91 | % | |
17
Table of Contents
| Schedules of investments | |
| Delaware Tax–Free New Jersey Fund | December 31, 2021 |
| | | | Principal | | | |
| | | | | amount° | | Value (US $) |
| Municipal Bonds – 98.22% | | | | | |
| Corporate Revenue Bond – 2.17% | | | | | |
| New Jersey Tobacco Settlement Financing Corporation | | | | | |
| | (Subordinate) | | | | | |
| | Series B 5.00% 6/1/46 | | 500,000 | | $ | 582,590 |
| | | | | | | 582,590 |
| Education Revenue Bonds – 11.87% | | | | | |
| New Jersey Educational Facilities Authority Revenue | | | | | |
| | (Montclair State University) | | | | | |
| | Series A 5.00% 7/1/39 | | 1,000,000 | | | 1,098,320 |
| | Series D 5.00% 7/1/36 | | 500,000 | | | 568,905 |
| | (Princeton University) | | | | | |
| | Series I 5.00% 7/1/32 | | 500,000 | | | 612,410 |
| | (Ramapo College) | | | | | |
| | Series A 5.00% 7/1/35 (AGM) | | 750,000 | | | 900,217 |
| | | | | | | 3,179,852 |
| Electric Revenue Bonds – 3.16% | | | | | |
| Puerto Rico Electric Power Authority Revenue | | | | | |
| | Series A 6.75% 7/1/36 ‡ | | 180,000 | | | 184,725 |
| | Series TT 5.00% 7/1/32 ‡ | | 335,000 | | | 334,581 |
| | Series XX 5.25% 7/1/40 ‡ | | 325,000 | | | 325,813 |
| | | | | | | 845,119 |
| Healthcare Revenue Bonds – 4.47% | | | | | |
| New Jersey Health Care Facilities Financing Authority Revenue | | | | | |
| | (Hackensack Meridian Health Obligated Group) | | | | | |
| | 5.00% 7/1/35 | | 750,000 | | | 907,762 |
| | (Valley Health System Obligated Group) | | | | | |
| | 4.00% 7/1/44 | | 250,000 | | | 288,945 |
| | | | | | | 1,196,707 |
| Housing Revenue Bond – 1.43% | | | | | |
| New Jersey Housing & Mortgage Finance Agency | | | | | |
| | (Single Family Housing) | | | | | |
| | Series D 4.00% 4/1/25 (AMT) | | 350,000 | | | 382,281 |
| | | | | | | 382,281 |
| Lease Revenue Bonds – 16.68% | | | | | |
| Garden State Preservation Trust | | | | | |
| | Series A 5.75% 11/1/28 (AGM) | | 1,000,000 | | | 1,219,790 |
| Hudson County Improvement Authority Revenue | | | | | |
| | (Hudson County Lease Project) | | | | | |
| | 5.375% 10/1/24 (AGM) | | 1,000,000 | | | 1,133,220 |
18
Table of Contents
| | | | | Principal | | | |
| | | | amount° | | Value (US $) |
| Municipal Bonds (continued) | | | | | |
| Lease Revenue Bonds (continued) | | | | | |
| Mercer County Improvement Authority Revenue | | | | | |
| | (Courthouse Annex Project) | | | | | |
| | 5.00% 9/1/40 | | 500,000 | | $ | 570,880 |
| New Jersey Economic Development Authority | | | | | |
| | (Transit Transportation Project) | | | | | |
| | Series A 4.00% 11/1/44 | | 700,000 | | | 798,126 |
| New Jersey State Transportation Trust Fund Authority Revenue | | | | | |
| | (Capital Appreciation-Transportation System) | | | | | |
| | Series A 2.48% 12/15/37 ^ | | 470,000 | | | 324,554 |
| | (Transportation System) | | | | | |
| | Series A 5.00% 12/15/23 | | 250,000 | | | 272,135 |
| Puerto Rico Public Buildings Authority Revenue | | | | | |
| | (Government Facilities) | | | | | |
| | Series M-1 5.75% 7/1/17 ‡ | | 55,000 | | | 61,325 |
| | Series Q 5.50% 7/1/37 ‡ | | 20,000 | | | 22,075 |
| | (Unrefunded Balance - Government Facilities) | | | | | |
| | 5.25% 7/1/36 ‡ | | 40,000 | | | 43,350 |
| | 5.75% 7/1/17 ‡ | | 20,000 | | | 22,300 |
| | | | | | | 4,467,755 |
| Local General Obligation Bonds – 17.64% | | | | | |
| Belleville Board of Education | | | | | |
| | 4.00% 9/1/37 (BAM) | | 1,000,000 | | | 1,099,700 |
| Ewing Township Board of Education | | | | | |
| | 4.00% 7/15/36 | | 1,000,000 | | | 1,154,570 |
| Hudson | | | | | |
| | (Energy Savings Obligation) | | | | | |
| | 4.00% 6/15/38 | | 1,000,000 | | | 1,162,500 |
| Livingston Township School District | | | | | |
| | 5.00% 7/15/37 | | 750,000 | | | 857,835 |
| Township of Montclair | | | | | |
| | (Parking Utility Refunding Bonds) | | | | | |
| | Series A 5.00% 1/1/37 | | 415,000 | | | 450,972 |
| | | | | | | 4,725,577 |
| Pre-Refunded Bonds – 6.33% | | | | | |
| Bayonne | | | | | |
| | (School Refunding Bonds) | | | | | |
| | 5.00% 7/1/39-26 (BAM) § | | 500,000 | | | 597,700 |
| Bergen County Improvement Authority Revenue | | | | | |
| | (Guaranteed Governmental Pooled Loan) | | | | | |
| | Series B 5.00% 2/15/39-24 § | | 1,000,000 | | | 1,098,930 |
| | | | | | | 1,696,630 |
19
Table of Contents
Schedules of investments
Delaware Tax–Free New Jersey Fund
| | | | | Principal | | | |
| | | | amount° | | Value (US $) |
| Municipal Bonds (continued) | | | | | |
| Resource Recovery Revenue Bond – 0.98% | | | | | |
| Union County, New Jersey Improvement Authority | | | | | |
| | (Aries Linden, LLC Project) | | | | | |
| | 144A 6.75% 12/1/41 (AMT) # | | 250,000 | | $ | 262,185 |
| | | | | | | 262,185 |
| Special Tax Revenue Bonds – 22.37% | | | | | |
| Burlington County Bridge Commission | | | | | |
| | (Governmental Loan Program) | | | | | |
| | 4.00% 8/1/35 | | 465,000 | | | 542,925 |
| Camden County, New Jersey Improvement Authority Revenue | | | | | |
| | (County Capital Program) | | | | | |
| | Series A 5.00% 1/15/40 | | 750,000 | | | 840,202 |
| Essex County, New Jersey Improvement Authority Revenue | | | | | |
| | 5.50% 10/1/27 (NATL) | | 1,000,000 | | | 1,269,480 |
| GDB Debt Recovery Authority of Puerto Rico (Taxable) | | | | | |
| | 7.50% 8/20/40 | | 568,109 | | | 542,544 |
| Hudson County Improvement Authority Revenue | | | | | |
| | (Guttenberg General Obligation Bond Project) | | | | | |
| | 5.00% 8/1/42 | | 500,000 | | | 568,520 |
| Puerto Rico Infrastructure Financing Authority Revenue | | | | | |
| | Series B 5.00% 7/1/16 ‡ | | 155,000 | | | 75,369 |
| | Series B 5.00% 7/1/41 ‡ | | 1,000,000 | | | 488,750 |
| Puerto Rico Sales Tax Financing Revenue | | | | | |
| | (Capital Appreciation - Restructured) | | | | | |
| | Series A-1 4.62% 7/1/46 ^ | | 225,000 | | | 76,741 |
| | Series A-1 4.903% 7/1/51 ^ | | 300,000 | | | 73,878 |
| | (Restructured) | | | | | |
| | Series A-1 4.75% 7/1/53 | | 870,000 | | | 996,211 |
| | Series A-1 5.00% 7/1/58 | | 360,000 | | | 417,618 |
| Virgin Islands Public Finance Authority Revenue | | | | | |
| | (Matching Fund Loan Note) | | | | | |
| | Series A 5.00% 10/1/29 | | 100,000 | | | 100,242 |
| | | | | | | 5,992,480 |
| State General Obligation Bonds – 4.88% | | | | | |
| Commonwealth of Puerto Rico | | | | | |
| | (Public Improvement) | | | | | |
| | Series A 5.00% 7/1/24 ‡ | | 75,000 | | | 74,437 |
| | Series A 5.00% 7/1/41 ‡ | | 120,000 | | | 108,150 |
| | Series A 5.25% 7/1/34 ‡ | | 60,000 | | | 59,850 |
| | Series A 5.375% 7/1/33 ‡ | | 135,000 | | | 133,481 |
| | Series A 8.00% 7/1/35 ‡ | | 280,000 | | | 249,200 |
| | Series B 5.75% 7/1/38 ‡ | | 175,000 | | | 170,844 |
20
Table of Contents
| | | | | Principal | | | |
| | | | amount° | | Value (US $) |
| Municipal Bonds (continued) | | | | | |
| State General Obligation Bonds (continued) | | | | | |
| Commonwealth of Puerto Rico | | | | | |
| | (Public Improvement) | | | | | |
| | Series C 6.00% 7/1/39 ‡ | | 155,000 | | $ | 152,481 |
| | (Unrefunded Balance - Public Improvement) | | | | | |
| | Series B 5.00% 7/1/35 ‡ | | 50,000 | | | 49,688 |
| State of New Jersey | | | | | |
| | Series A 4.00% 6/1/31 | | 250,000 | | | 307,903 |
| | | | | | | 1,306,034 |
| Transportation Revenue Bonds – 6.24% | | | | | |
| Delaware River Port Authority Revenue | | | | | |
| | 5.00% 1/1/30 | | 400,000 | | | 436,428 |
| New Jersey Turnpike Authority Revenue | | | | | |
| | Series A 5.00% 1/1/48 | | 500,000 | | | 614,145 |
| South Jersey Port Corporation | | | | | |
| | (Subordinated Marine Terminal) | | | | | |
| | Series B 5.00% 1/1/48 (AMT) | | 535,000 | | | 621,809 |
| | | | | | | 1,672,382 |
| Total Municipal Bonds (cost $23,563,765) | | | | | 26,309,592 |
| | |
| Short-Term Investments – 0.75% | | | | | |
| Variable Rate Demand Note – 0.75%¤ | | | | | |
| New Jersey Health Care Facilities Financing Authority Revenue | | | | | |
| | (Virtua Health) Series B 0.05% 7/1/43 | | | | | |
| | (LOC – JPMorgan Chase Bank N.A.) | | 200,000 | | | 200,000 |
| Total Short-Term Investments (cost $200,000) | | | | | 200,000 |
| Total Value of Securities–98.97% | | | | | |
| (cost $23,763,765) | | | | $ | 26,509,592 |
| ° | Principal amount shown is stated in USD unless noted that the security is denominated in another currency. |
| ‡ | Non-income producing security. Security is currently in default. |
| ^ | Zero-coupon security. The rate shown is the effective yield at the time of purchase. |
| § | Pre-refunded bonds. Municipal bonds that are generally backed or secured by US Treasury bonds. For pre-refunded bonds, the stated maturity is followed by the year in which the bond will be pre-refunded. See Note 9 in “Notes to financial statements.” |
| # | Security exempt from registration under Rule 144A of the Securities Act of 1933, as amended. At December 31, 2021, the aggregate value of Rule 144A securities was $262,185, which represents 0.98% of the Fund’s net assets. See Note 9 in “Notes to financial statements.” |
21
Table of Contents
Schedules of investments
Delaware Tax–Free New Jersey Fund
| ¤ | Tax-exempt obligations that contain a floating or variable interest rate adjustment formula and an unconditional right of demand to receive payment of the unpaid principal balance plus accrued interest upon a short notice period (generally up to 30 days) prior to specified dates either from the issuer or by drawing on a bank letter of credit, a guarantee, or insurance issued with respect to such instrument. Each rate shown is as of December 31, 2021. |
Summary of abbreviations:
AGM – Insured by Assured Guaranty Municipal Corporation
AMT – Subject to Alternative Minimum Tax
BAM – Insured by Build America Mutual Assurance
LLC – Limited Liability Corporation
LOC – Letter of Credit
N.A. – National Association
NATL – Insured by National Public Finance Guarantee Corporation
USD – US Dollar
See accompanying notes, which are an integral part of the financial statements.
22
Table of Contents
| Schedules of investments |
| Delaware Tax–Free Oregon Fund | December 31, 2021 |
| | | | | Principal | | | |
| | | | amount° | | Value (US $) |
| Municipal Bonds – 98.42% | | | | | |
| Education Revenue Bonds – 8.45% | | | | | |
| Oregon Health & Science University Revenue | | | | | |
| | Series A 4.00% 7/1/44 | | 600,000 | | $ | 700,740 |
| Oregon State Facilities Authority Revenue | | | | | |
| | (Metro East Web Academy Project) | | | | | |
| | Series A 144A 5.00% 6/15/49 # | | 1,000,000 | | | 1,081,510 |
| | (Willamette University Projects) | | | | | |
| | Series A 4.00% 10/1/51 | | 500,000 | | | 569,515 |
| University of Oregon General Revenue | | | | | |
| | Series A 5.00% 4/1/45 | | 1,000,000 | | | 1,128,870 |
| | | | | | | 3,480,635 |
| Electric Revenue Bonds – 2.82% | | | | | |
| Puerto Rico Electric Power Authority Revenue | | | | | |
| | Series A 6.75% 7/1/36 ‡ | | 240,000 | | | 246,300 |
| | Series TT 5.00% 7/1/32 ‡ | | 380,000 | | | 379,525 |
| | Series XX 5.25% 7/1/40 ‡ | | 535,000 | | | 536,338 |
| | | | | | | 1,162,163 |
| Healthcare Revenue Bonds – 14.81% | | | | | |
| Clackamas County Hospital Facility Authority | | | | | |
| | (Rose Villa Project) | | | | | |
| | Series A 5.375% 11/15/55 | | 500,000 | | | 550,945 |
| Hospital Facilities Authority of Multnomah County, Oregon | | | | | |
| | (Mirabella At South Waterfront Project) | | | | | |
| | Series A 5.40% 10/1/44 | | 900,000 | | | 964,008 |
| Oregon Health & Science University Revenue | | | | | |
| | Series A 4.00% 7/1/41 | | 250,000 | | | 301,700 |
| Oregon State Facilities Authority Revenue | | | | | |
| | (Providence Health & Services) | | | | | |
| | Series C 5.00% 10/1/45 | | 1,650,000 | | | 1,895,091 |
| | (Samaritan Health Services Project) | | | | | |
| | Series A 5.00% 10/1/40 | | 750,000 | | | 935,272 |
| Salem, Oregon Hospital Facility Authority Revenue | | | | | |
| | (Multi Model - Salem Health Project) | | | | | |
| | Series A 4.00% 5/15/49 | | 500,000 | | | 574,585 |
| Yamhill County Oregon Hospital Authority Revenue | | | | | |
| | (Friendsview) | | | | | |
| | Series A 5.00% 11/15/51 | | 750,000 | | | 873,008 |
| | | | | | | 6,094,609 |
| Housing Revenue Bonds – 3.81% | | | | | |
| Home Forward Multifamily Housing Revenue | | | | | |
| | (Gretchen Kafoury Commons) | | | | | |
| | 5.00% 1/1/29 | | 565,000 | | | 603,798 |
23
Table of Contents
Schedules of investments
Delaware Tax–Free Oregon Fund
| | | | Principal | | | |
| | | | | amount° | | Value (US $) |
| Municipal Bonds (continued) | | | | | |
| Housing Revenue Bonds (continued) | | | | | |
| Oregon State Housing & Community Services Department Mortgage | | | | | |
| | Revenue | | | | | |
| | (Single-Family Mortgage Program) | | | | | |
| | Series A 4.00% 7/1/50 | | 880,000 | | $ | 963,741 |
| | | | | | | 1,567,539 |
| Lease Revenue Bonds – 0.56% | | | | | |
| Puerto Rico Public Buildings Authority Revenue | | | | | |
| | (Government Facilities) | | | | | |
| | Series M-1 5.75% 7/1/17 ‡ | | 85,000 | | | 94,775 |
| | Series Q 5.50% 7/1/37 ‡ | | 30,000 | | | 33,112 |
| | (Unrefunded Balance - Government Facilities) | | | | | |
| | 5.25% 7/1/36 ‡ | | 65,000 | | | 70,444 |
| | 5.75% 7/1/17 ‡ | | 30,000 | | | 33,450 |
| | | | | | | 231,781 |
| Local General Obligation Bonds – 25.47% | | | | | |
| Boardman, Oregon | | | | | |
| | 2.125% 6/15/45 (BAM) | | 500,000 | | | 489,315 |
| Clackamas County School District No. 12 North Clackamas | | | | | |
| | Series B 5.00% 6/15/37 | | 1,500,000 | | | 1,814,175 |
| Columbia County School District No. 502 | | | | | |
| | 5.00% 6/15/36 | | 575,000 | | | 696,434 |
| Linn County Community School District No. 9 Lebanon | | | | | |
| | 5.50% 6/15/27 (NATL) | | 1,000,000 | | | 1,251,530 |
| Marion County School District No. 103 Woodburn | | | | | |
| | 5.00% 6/1/30 | | 300,000 | | | 381,594 |
| Newport, Oregon | | | | | |
| | Series B 0.00% 6/1/29 (AGC) ^ | | 1,225,000 | | | 1,110,108 |
| Portland, Oregon Revenue | | | | | |
| | (Portland Building Project) | | | | | |
| | Series B 5.00% 6/15/34 | | 1,000,000 | | | 1,252,370 |
| Redmond, Oregon | | | | | |
| | Series B-1 5.00% 6/1/38 | | 1,000,000 | | | 1,246,780 |
| Salem-Keizer School District No. 24J | | | | | |
| | 5.00% 6/15/33 | | 1,000,000 | | | 1,250,580 |
| Washington County Oregon School District No. 15 Forest Grove | | | | | |
| | Series B 0.00% 6/15/23 ^ | | 1,000,000 | | | 993,260 |
| | | | | | | 10,486,146 |
| Pre-Refunded Bonds – 15.82% | | | | | |
| Eugene Oregon Electric Utility System Revenue | | | | | |
| | 5.00% 8/1/38-22 § | | 2,000,000 | | | 2,055,820 |
24
Table of Contents
| | | | Principal | | | |
| | | | | amount° | | Value (US $) |
| Municipal Bonds (continued) | | | | | |
| Pre-Refunded Bonds (continued) | | | | | |
| Marion County School District No. 103 Woodburn | | | | | |
| | 5.00% 6/15/35-25 § | | 500,000 | | $ | 576,175 |
| Oregon Health & Science University Revenue | | | | | |
| | Series E 5.00% 7/1/32-22 § | | 1,000,000 | | | 1,023,900 |
| Tigard, Oregon Water Revenue | | | | | |
| | 5.00% 8/1/31-22 § | | 1,695,000 | | | 1,742,307 |
| Umatilla County Oregon School District No. 16R Pendleton | | | | | |
| | Series A 5.00% 6/15/33-24 § | | 1,000,000 | | | 1,113,740 |
| | | | | | | 6,511,942 |
| Special Tax Revenue Bonds – 14.42% | | | | | |
| GDB Debt Recovery Authority of Puerto Rico (Taxable) | | | | | |
| | 7.50% 8/20/40 | | 1,078,384 | | | 1,029,857 |
| Oregon State Department Administrative Services Lottery Revenue | | | | | |
| | Series A 5.00% 4/1/35 | | 1,000,000 | | | 1,135,300 |
| Puerto Rico Commonwealth Infrastructure Financing Authority | | | | | |
| | Special Tax Revenue | | | | | |
| | Series B 5.00% 7/1/16 ‡ | | 240,000 | | | 116,700 |
| | Series B 5.00% 7/1/41 ‡ | | 1,250,000 | | | 610,937 |
| Puerto Rico Sales Tax Financing Revenue | | | | | |
| | (Capital Appreciation - Restructured) | | | | | |
| | Series A-1 4.62% 7/1/46 ^ | | 340,000 | | | 115,964 |
| | Series A-1 4.903% 7/1/51 ^ | | 450,000 | | | 110,817 |
| | (Restructured) | | | | | |
| | Series A-1 4.75% 7/1/53 | | 1,770,000 | | | 2,026,774 |
| | Series A-2 4.329% 7/1/40 | | 550,000 | | | 621,109 |
| Virgin Islands Public Finance Authority Revenue | | | | | |
| | (Virgin Islands Matching Fund Loan Note) | | | | | |
| | Series A 4.00% 10/1/22 | | 70,000 | | | 69,663 |
| | Series A 5.00% 10/1/29 | | 100,000 | | | 100,242 |
| | | | | | | 5,937,363 |
| State General Obligation Bonds – 6.35% | | | | | |
| Commonwealth of Puerto Rico | | | | | |
| | (Public Improvement) | | | | | |
| | Series A 5.00% 7/1/24 ‡ | | 95,000 | | | 94,287 |
| | Series A 5.00% 7/1/41 ‡ | | 140,000 | | | 126,175 |
| | Series A 5.25% 7/1/34 ‡ | | 240,000 | | | 239,400 |
| | Series A 5.375% 7/1/33 ‡ | | 140,000 | | | 138,425 |
| | Series A 8.00% 7/1/35 ‡ | | 360,000 | | | 320,400 |
| | Series B 5.75% 7/1/38 ‡ | | 200,000 | | | 195,250 |
| | Series C 6.00% 7/1/39 ‡ | | 180,000 | | | 177,075 |
25
Table of Contents
Schedules of investments
Delaware Tax–Free Oregon Fund
| | | | Principal | | | |
| | | | | amount° | | Value (US $) |
| Municipal Bonds (continued) | | | | | |
| State General Obligation Bonds (continued) | | | | | |
| Commonwealth of Puerto Rico | | | | | |
| | (Unrefunded Balance - Public Improvement) | | | | | |
| | Series B 5.00% 7/1/35 ‡ | | 65,000 | | $ | 64,594 |
| Oregon State | | | | | |
| | (Article XI-Q State Projects) | | | | | |
| | Series A 5.00% 5/1/44 | | 1,000,000 | | | 1,258,460 |
| | | | | | | 2,614,066 |
| Transportation Revenue Bonds – 4.54% | | | | | |
| Port of Portland Oregon Airport Revenue | | | | | |
| | 5.00% 7/1/42 (AMT) | | 1,100,000 | | | 1,293,237 |
| | (Portland International Airport) | | | | | |
| | 5.00% 7/1/31 | | 500,000 | | | 574,545 |
| | | | | | | 1,867,782 |
| Water & Sewer Revenue Bonds – 1.37% | | | | | |
| Hermiston, Oregon Water & Sewer System Revenue | | | | | |
| | 5.00% 11/1/34 (AGM) | | 500,000 | | | 562,500 |
| | | | | | | 562,500 |
| Total Municipal Bonds (cost $36,960,837) | | | | | 40,516,526 |
| | | | | | |
| Short-Term Investments – 0.49% | | | | | |
| Variable Rate Demand Note – 0.49%¤ | | | | | |
| Oregon State Facilities Authority Revenue | | | | | |
| | (PeaceHealth) Series B 0.07% 8/1/34 | | | | | |
| | (LOC - TD Bank N.A.) | | 200,000 | | | 200,000 |
| Total Short-Term Investments (cost $200,000) | | | | | 200,000 |
| Total Value of Securities–98.91% | | | | | |
| (cost $37,160,837) | | | | $ | 40,716,526 |
| ° | Principal amount shown is stated in USD unless noted that the security is denominated in another currency. |
| # | Security exempt from registration under Rule 144A of the Securities Act of 1933, as amended. At December 31, 2021, the aggregate value of Rule 144A securities was $1,081,510, which represents 2.63% of the Fund’s net assets. See Note 9 in “Notes to financial statements.” |
| ‡ | Non-income producing security. Security is currently in default. |
| ^ | Zero-coupon security. The rate shown is the effective yield at the time of purchase. |
| § | Pre-refunded bonds. Municipal bonds that are generally backed or secured by US Treasury bonds. For pre-refunded bonds, the stated maturity is followed by the year in which the bond will be pre-refunded. See Note 9 in “Notes to financial statements.” |
26
Table of Contents
| ¤ | Tax-exempt obligations that contain a floating or variable interest rate adjustment formula and an unconditional right of demand to receive payment of the unpaid principal balance plus accrued interest upon a short notice period (generally up to 30 days) prior to specified dates either from the issuer or by drawing on a bank letter of credit, a guarantee, or insurance issued with respect to such instrument. Each rate shown is as of December 31, 2021. |
Summary of abbreviations:
AGC – Insured by Assured Guaranty Corporation
AGM – Insured by Assured Guaranty Municipal Corporation
AMT – Subject to Alternative Minimum Tax
BAM – Insured by Build America Mutual Assurance
LOC – Letter of Credit
N.A. – National Association
NATL – Insured by National Public Finance Guarantee Corporation
USD – US Dollar
See accompanying notes, which are an integral part of the financial statements.
27
Table of Contents
| Statements of assets and liabilities | |
| December 31, 2021 |
| | | Delaware Tax–Free | | Delaware Tax–Free |
| | | | New Jersey Fund | | Oregon Fund |
| Assets: | | | | | | |
| Investments, at value* | | $ | 26,509,592 | | $ | 40,716,526 |
| Cash | | | — | | | 148,750 |
| Interest receivable | | | 362,525 | | | 392,563 |
| Receivable for fund shares sold | | | 33,573 | | | 14,528 |
| Other assets | | | 181 | | | 278 |
| Total Assets | | | 26,905,871 | | | 41,272,645 |
| Liabilities: | | | | | | |
| Due to custodian | | | 14,441 | | | — |
| Payable for fund shares redeemed | | | 38,722 | | | 11,154 |
| Payable for securities purchased | | | 26,841 | | | 41,105 |
| Accounting and administration fees payable to non-affiliates | | | 10,599 | | | 10,914 |
| Reports and statements to shareholders expenses payable to | | | | | | |
| non-affiliates | | | 10,071 | | | 12,501 |
| Distribution fees payable to affiliates | | | 5,279 | | | 7,729 |
| Audit and tax fees payable | | | 4,950 | | | 4,950 |
| Distribution payable | | | 4,194 | | | 6,831 |
| Dividend disbursing and transfer agent fees and expenses | | | | | | |
| payable to non-affiliates | | | 2,368 | | | 2,624 |
| Investment management fees payable to affiliates | | | 1,905 | | | 4,149 |
| Other accrued expenses | | | 478 | | | 5,083 |
| Accounting and administration expenses payable to affiliates | | | 423 | | | 467 |
| Dividend disbursing and transfer agent fees and expenses | | | | | | |
| payable to affiliates | | | 200 | | | 308 |
| Trustees’ fees and expenses payable to affiliates | | | 69 | | | 106 |
| Legal fees payable to affiliates | | | 25 | | | 38 |
| Reports and statements to shareholders expenses payable to | | | | | | |
| affiliates | | | 22 | | | 34 |
| Total Liabilities | | | 120,587 | | | 107,993 |
| Total Net Assets | | $ | 26,785,284 | | $ | 41,164,652 |
| | |
| Net Assets Consist of: | | | | | | |
| Paid-in capital | | $ | 24,022,777 | | $ | 38,155,029 |
| Total distributable earnings (loss) | | | 2,762,507 | | | 3,009,623 |
| Total Net Assets | | $ | 26,785,284 | | $ | 41,164,652 |
28
Table of Contents
| | | Delaware Tax–Free | | Delaware Tax–Free |
| | | | New Jersey Fund | | Oregon Fund |
| Net Asset Value | | | | | | | | |
| | | | | | | | | |
| Class A: | | | | | | | | |
| Net assets | | $ | 24,741,856 | | | $ | 36,215,952 | |
| Shares of beneficial interest outstanding, unlimited | | | | | | | | |
| authorization, no par | | | 1,942,633 | | | | 2,632,780 | |
| Net asset value per share | | $ | 12.74 | | | $ | 13.76 | |
| Sales charge | | | 4.50 | % | | | 4.50 | % |
| Offering price per share, equal to net asset value per share / | | | | | | | | |
| (1 - sales charge) | | $ | 13.34 | | | $ | 14.41 | |
| | | | | | | | | | |
| Institutional Class: | | | | | | | | |
| Net assets | | $ | 2,043,428 | | | $ | 4,948,700 | |
| Shares of beneficial interest outstanding, unlimited | | | | | | | | |
| authorization, no par | | | 160,659 | | | | 360,313 | |
| Net asset value per share | | $ | 12.72 | | | $ | 13.73 | |
____________________ | | | | | | | | |
| *Investments, at cost | | $ | 23,763,765 | | | $ | 37,160,837 | |
See accompanying notes, which are an integral part of the financial statements.
29
Table of Contents
| Statements of operations | Year ended December 31, 2021 |
| | | Delaware Tax–Free | | Delaware Tax–Free |
| | | New Jersey Fund | | Oregon Fund |
| Investment Income: | | | | | | | | |
| Interest | | $ | 900,554 | | | $ | 1,381,190 | |
| | | | | | | | | | |
| Expenses: | | | | | | | | |
| Management fees | | | 154,344 | | | | 228,879 | |
| Distribution expenses — Class A | | | 65,286 | | | | 93,284 | |
| Accounting and administration expenses | | | 43,520 | | | | 45,711 | |
| Audit and tax fees | | | 40,832 | | | | 40,934 | |
| Reports and statements to shareholders expenses | | | 20,581 | | | | 26,929 | |
| Dividend disbursing and transfer agent fees and expenses | | | 15,048 | | | | 19,791 | |
| Registration fees | | | 4,176 | | | | 4,931 | |
| Legal fees | | | 3,191 | | | | 4,660 | |
| Custodian fees | | | 980 | | | | 1,494 | |
| Trustees’ fees and expenses | | | 959 | | | | 1,396 | |
| Other | | | 9,849 | | | | 11,520 | |
| | | | 358,766 | | | | 479,529 | |
| Less expenses waived | | | (121,800 | ) | | | (114,290 | ) |
| Less expenses paid indirectly | | | (43 | ) | | | (49 | ) |
| Total operating expenses | | | 236,923 | | | | 365,190 | |
| Net Investment Income | | | 663,631 | | | | 1,016,000 | |
| Net Realized and Unrealized Gain (Loss): | | | | | | | | |
| Net realized gain (loss) on investments | | | 373,003 | | | | (69,982 | ) |
| Net change in unrealized appreciation (depreciation) of | | | | | | | | |
| investments | | | (127,153 | ) | | | 217,123 | |
| Net Realized and Unrealized Gain | | | 245,850 | | | | 147,141 | |
| Net Increase in Net Assets Resulting from Operations | | $ | 909,481 | | | $ | 1,163,141 | |
See accompanying notes, which are an integral part of the financial statements.
30
Table of Contents
Statements of changes in net assets
Delaware Tax–Free New Jersey Fund
| | | Year ended |
| | | 12/31/21 | | 12/31/20 |
| Increase (Decrease) in Net Assets from Operations: | | | | | | | | |
| Net investment income | | $ | 663,631 | | | $ | 866,814 | |
| Net realized gain | | | 373,003 | | | | 843,759 | |
| Net change in unrealized appreciation (depreciation) | | | (127,153 | ) | | | (106,443 | ) |
| Net increase in net assets resulting from operations | | | 909,481 | | | | 1,604,130 | |
| | | | | | | | | | |
| Dividends and Distributions to Shareholders from: | | | | | | | | |
| Distributable earnings: | | | | | | | | |
| Class A | | | (1,057,312 | ) | | | (1,585,015 | ) |
| Institutional Class | | | (87,975 | ) | | | (110,426 | ) |
| | | | (1,145,287 | ) | | | (1,695,441 | ) |
| | | | | | | | | |
| Capital Share Transactions: | | | | | | | | |
| Proceeds from shares sold: | | | | | | | | |
| Class A | | | 904,730 | | | | 610,856 | |
| Institutional Class | | | 231,775 | | | | 22,433 | |
| | | | | | | | | | |
| Net asset value of shares issued upon reinvestment of | | | | | | | | |
| dividends and distributions: | | | | | | | | |
| Class A | | | 973,194 | | | | 1,413,826 | |
| Institutional Class | | | 87,901 | | | | 109,952 | |
| Class R61 | | | — | | | | 154 | |
| | | | 2,197,600 | | | | 2,157,221 | |
31
Table of Contents
Statements of changes in net assets
Delaware Tax–Free New Jersey Fund
| | | Year ended |
| | | 12/31/21 | | 12/31/20 |
| Capital Share Transactions (continued): | | | | | | | | |
| Cost of shares redeemed: | | | | | | | | |
| Class A | | $ | (5,408,606 | ) | | $ | (12,928,275 | ) |
| Institutional Class | | | (275,802 | ) | | | (493,256 | ) |
| Class R61 | | | — | | | | (10,307 | ) |
| | | | | (5,684,408 | ) | | | (13,431,838 | ) |
| Decrease in net assets derived from capital share | | | | | | | | |
| transactions | | | (3,486,808 | ) | | | (11,274,617 | ) |
| Net Decrease in Net Assets | | | (3,722,614 | ) | | | (11,365,928 | ) |
| | | | | | | | | |
| Net Assets: | | | | | | | | |
| Beginning of year | | | 30,507,898 | | | | 41,873,826 | |
| End of year | | $ | 26,785,284 | | | $ | 30,507,898 | |
| 1 | All Class R6 were liquidated on August 20, 2020. |
See accompanying notes, which are an integral part of the financial statements.
32
Table of Contents
Statements of changes in net assets
Delaware Tax–Free Oregon Fund
| | Year ended |
| | 12/31/21 | | 12/31/20 |
| Increase (Decrease) in Net Assets from Operations: | | | | | | | |
| Net investment income | $ | 1,016,000 | | | $ | 1,095,308 | |
| Net realized gain (loss) | | (69,982 | ) | | | 699,031 | |
| Net change in unrealized appreciation (depreciation) | | 217,123 | | | | 202,592 | |
| Net increase in net assets resulting from operations | | 1,163,141 | | | | 1,996,931 | |
| | | | | | | | |
| Dividends and Distributions to Shareholders from: | | | | | | | |
| Distributable earnings: | | | | | | | |
| Class A | | (901,796 | ) | | | (1,004,613 | ) |
| Institutional Class | | (114,204 | ) | | | (89,523 | ) |
| | | (1,016,000 | ) | | | (1,094,136 | ) |
| | | | | | | | | |
| Capital Share Transactions: | | | | | | | |
| Proceeds from shares sold: | | | | | | | |
| Class A | | 1,726,889 | | | | 1,678,253 | |
| Institutional Class | | 1,384,411 | | | | 1,051,375 | |
| | | | | | | | | |
| Net asset value of shares issued upon reinvestment of | | | | | | | |
| dividends and distributions: | | | | | | | |
| Class A | | 810,511 | | | | 862,268 | |
| Institutional Class | | 114,207 | | | | 79,762 | |
| Class R61 | | — | | | | 155 | |
| | | 4,036,018 | | | | 3,671,813 | |
33
Table of Contents
Statements of changes in net assets
Delaware Tax–Free Oregon Fund
| | | | | Year ended |
| | | | 12/31/21 | | 12/31/20 |
| Capital Share Transactions (continued): | | | | | | | | |
| Cost of shares redeemed: | | | | | | | | |
| | Class A | | $ | (4,750,657 | ) | | $ | (8,980,286 | ) |
| | Institutional Class | | | (121,883 | ) | | | (603,701 | ) |
| | Class R61 | | | — | | | | (10,343 | ) |
| | | | | (4,872,540 | ) | | | (9,594,330 | ) |
| Decrease in net assets derived from capital share | | | | | | | | |
| | transactions | | | (836,522 | ) | | | (5,922,517 | ) |
| Net Decrease in Net Assets | | | (689,381 | ) | | | (5,019,722 | ) |
| | | | | | | | | |
| Net Assets: | | | | | | | | |
| Beginning of year | | | 41,854,033 | | | | 46,873,755 | |
| End of year | | $ | 41,164,652 | | | $ | 41,854,033 | |
| 1 | All Class R6 were liquidated on August 20, 2020. |
See accompanying notes, which are an integral part of the financial statements.
34
Table of Contents
Financial highlights
Delaware Tax–Free New Jersey Fund Class A
Selected data for each share of the Fund outstanding throughout each period were as follows:
| Net asset value, beginning of period |
| |
| Income (loss) from investment operations: |
| Net investment income2 |
| Net realized and unrealized gain (loss) |
| Total from investment operations |
| |
| Less dividends and distributions from: |
| Net investment income |
| Net realized gain |
| Total dividends and distributions |
| |
| Net asset value, end of period |
| |
| Total return3 |
| |
| Ratios and supplemental data: |
| Net assets, end of period (000 omitted) |
| Ratio of expenses to average net assets |
| Ratio of expenses to average net assets prior to fees waived |
| Ratio of net investment income to average net assets |
| Ratio of net investment income to average net assets prior to fees waived |
| Portfolio turnover |
| 1 | On October 4, 2019, Class A shares of First Investors New Jersey Tax Exempt Fund were reorganized into Class A shares of Delaware Tax–Free New Jersey Fund. See Notes to Financial Statements. The Class A shares’ financial highlights for the periods prior to October 4, 2019, reflect the performance of First Investors New Jersey Tax Exempt Fund Class A shares. |
| 2 | Calculated using average shares outstanding. |
| 3 | Total return is based on the change in net asset value of a share during the period and assumes reinvestment of dividends and distributions at net asset value and does not reflect the impact of a sales charge. Total return during all of the periods shown reflects a waiver by the manager. Performance would have been lower had the waiver not been in effect. |
| 4 | The Fund’s portfolio turnover rate increased substantially during the year ended December 31, 2019 due to a change in the Fund’s portfolio managers and associated repositioning. |
See accompanying notes, which are an integral part of the financial statements.
36
Table of Contents
| Year ended |
| 12/31/21 | | 12/31/20 | | 12/31/191 | | 12/31/18 | | 12/31/17 | |
| $ | 12.86 | | | $ | 12.88 | | | $ | 12.40 | | | $ | 12.78 | | | $ | 12.69 | | |
| | | |
| | | |
| | 0.30 | | | | 0.31 | | | | 0.34 | | | | 0.41 | | | | 0.43 | | |
| | 0.11 | | | | 0.33 | | | | 0.48 | | | | (0.38 | ) | | | 0.09 | | |
| | 0.41 | | | | 0.64 | | | | 0.82 | | | | 0.03 | | | | 0.52 | | |
| | | | | | | | | | | | | | | | | | | | | |
| | | | | | | | | | | | | | | | | | | | | |
| | (0.30 | ) | | | (0.31 | ) | | | (0.34 | ) | | | (0.41 | ) | | | (0.43 | ) | |
| | (0.23 | ) | | | (0.35 | ) | | | — | | | | — | | | | — | | |
| | (0.53 | ) | | | (0.66 | ) | | | (0.34 | ) | | | (0.41 | ) | | | (0.43 | ) | |
| | | | | | | | | | | | | | | | | | | | | |
| $ | 12.74 | | | $ | 12.86 | | | $ | 12.88 | | | $ | 12.40 | | | $ | 12.78 | | |
| | |
| | 3.28% | | | | 5.10% | | | | 6.68% | | | | 0.29% | | | | 4.13% | | |
| | | |
| | | |
| $ | 24,742 | | | $ | 28,488 | | | $ | 39,479 | | | $ | 43,895 | | | $ | 48,917 | | |
| | 0.86% | | | | 0.90% | | | | 0.96% | | | | 0.95% | | | | 0.94% | | |
| | 1.30% | | | | 1.25% | | | | 1.07% | | | | 0.98% | | | | 1.04% | | |
| | 2.35% | | | | 2.44% | | | | 2.67% | | | | 3.31% | | | | 3.35% | | |
| | 1.91% | | | | 2.09% | | | | 2.56% | | | | 3.28% | | | | 3.25% | | |
| | 7% | | | | 21% | | | | 47% | 4 | | | 20% | | | | 44% | | |
37
Table of Contents
Financial highlights
Delaware Tax–Free New Jersey Fund Institutional Class
Selected data for each share of the Fund outstanding throughout each period were as follows:
| Net asset value, beginning of period |
| |
| Income (loss) from investment operations: |
| Net investment income2 |
| Net realized and unrealized gain (loss) |
| Total from investment operations |
| |
| Less dividends and distributions from: |
| Net investment income |
| Net realized gain |
| Total dividends and distributions |
| |
| Net asset value, end of period |
| |
| Total return3 |
| |
| Ratios and supplemental data: |
| Net assets, end of period (000 omitted) |
| Ratio of expenses to average net assets |
| Ratio of expenses to average net assets prior to fees waived |
| Ratio of net investment income to average net assets |
| Ratio of net investment income to average net assets prior to fees waived |
| Portfolio turnover |
| 1 | On October 4, 2019, Advisor Class shares of First Investors New Jersey Tax Exempt Fund were reorganized into Institutional Class shares of Delaware Tax–Free New Jersey Fund. See Notes to Financial Statements. The Institutional Class shares’ financial highlights for the periods prior to October 4, 2019, reflect the performance of First Investors New Jersey Tax Exempt Fund Advisor Class shares. |
| 2 | Calculated using average shares outstanding. |
| 3 | Total return is based on the change in net asset value of a share during the period and assumes reinvestment of dividends and distributions at net asset value. Total return during all of the periods shown reflects a waiver by the manager. Performance would have been lower had the waiver not been in effect. |
| 4 | The Fund’s portfolio turnover rate increased substantially during the year ended December 31, 2019 due to a change in the Fund’s portfolio managers and associated repositioning. |
See accompanying notes, which are an integral part of the financial statements.
38
Table of Contents
| Year ended |
| 12/31/21 | | 12/31/20 | | 12/31/191 | | 12/31/18 | | 12/31/17 | |
| $ | 12.84 | | | $ | 12.87 | | | $ | 12.38 | | | $ | 12.76 | | | $ | 12.68 | | |
| | | |
| | | |
| | 0.33 | | | | 0.34 | | | | 0.37 | | | | 0.44 | | | | 0.46 | | |
| | 0.11 | | | | 0.32 | | | | 0.49 | | | | (0.37 | ) | | | 0.08 | | |
| | 0.44 | | | | 0.66 | | | | 0.86 | | | | 0.07 | | | | 0.54 | | |
| | | | | | | | | | | | | | | | | | | | | |
| | | | | | | | | | | | | | | | | | | | | |
| | (0.33 | ) | | | (0.34 | ) | | | (0.37 | ) | | | (0.45 | ) | | | (0.46 | ) | |
| | (0.23 | ) | | | (0.35 | ) | | | — | | | | — | | | | — | | |
| | (0.56 | ) | | | (0.69 | ) | | | (0.37 | ) | | | (0.45 | ) | | | (0.46 | ) | |
| | | | | | | | | | | | | | | | | | | | | |
| $ | 12.72 | | | $ | 12.84 | | | $ | 12.87 | | | $ | 12.38 | | | $ | 12.76 | | |
| | | |
| | 3.53% | | | | 5.25% | | | | 7.00% | | | | 0.56% | | | | 4.36% | | |
| | | |
| | | |
| $ | 2,043 | | | $ | 2,020 | | | $ | 2,385 | | | $ | 3,251 | | | $ | 2,114 | | |
| | 0.62% | | | | 0.68% | | | | 0.73% | | | | 0.68% | | | | 0.66% | | |
| | 1.05% | | | | 1.00% | | | | 0.82% | | | | 0.71% | | | | 0.76% | | |
| | 2.59% | | | | 2.66% | | | | 2.89% | | | | 3.57% | | | | 3.63% | | |
| | 2.16% | | | | 2.34% | | | | 2.80% | | | | 3.54% | | | | 3.53% | | |
| | 7% | | | | 21% | | | | 47% | 4 | | | 20% | | | | 44% | | |
39
Table of Contents
Financial highlights
Delaware Tax–Free Oregon Fund Class A
Selected data for each share of the Fund outstanding throughout each period were as follows:
| Net asset value, beginning of period |
| |
| Income (loss) from investment operations: |
| Net investment income2 |
| Net realized and unrealized gain (loss) |
| Total from investment operations |
| |
| Less dividends and distributions from: |
| Net investment income |
| Total dividends and distributions |
| |
| Net asset value, end of period |
| |
| Total return3 |
| |
| Ratios and supplemental data: |
| Net assets, end of period (000 omitted) |
| Ratio of expenses to average net assets |
| Ratio of expenses to average net assets prior to fees waived |
| Ratio of net investment income to average net assets |
| Ratio of net investment income to average net assets prior to fees waived |
| Portfolio turnover |
| 1 | On October 4, 2019, Class A shares of First Investors Oregon Tax Exempt Fund were reorganized into Class A shares of Delaware Tax–Free Oregon Fund. See Notes to Financial Statements. The Class A shares’ financial highlights for the periods prior to October 4, 2019, reflect the performance of First Investors Oregon Tax Exempt Fund Class A shares. |
| 2 | Calculated using average shares outstanding. |
| 3 | Total return is based on the change in net asset value of a share during the period and assumes reinvestment of dividends and distributions at net asset value and does not reflect the impact of a sales charge. Total return during all of the periods shown reflects a waiver by the manager. Performance would have been lower had the waiver not been in effect. |
See accompanying notes, which are an integral part of the financial statements.
40
Table of Contents
| Year ended | |
| 12/31/21 | | 12/31/20 | | 12/31/191 | | 12/31/18 | | 12/31/17 | |
| $ | 13.71 | | | $ | 13.42 | | | $ | 13.01 | | | $ | 13.39 | | | $ | 13.33 | | |
| | | | | | | | | | | | | | | | | | | | |
| | | | | | | | | | | | | | | | | | | | |
| | 0.33 | | | | 0.33 | | | | 0.33 | | | | 0.37 | | | | 0.40 | | |
| | 0.05 | | | | 0.29 | | | | 0.42 | | | | (0.38 | ) | | | 0.09 | | |
| | 0.38 | | | | 0.62 | | | | 0.75 | | | | (0.01 | ) | | | 0.49 | | |
| | | | | | | | | | | | | | | | | | | | |
| | | | | | | | | | | | | | | | | | | | |
| | (0.33 | ) | | | (0.33 | ) | | | (0.34 | ) | | | (0.37 | ) | | | (0.43 | ) | |
| | (0.33 | ) | | | (0.33 | ) | | | (0.34 | ) | | | (0.37 | ) | | | (0.43 | ) | |
| | | | | | | | | | | | | | | | | | | | |
| $ | 13.76 | | | $ | 13.71 | | | $ | 13.42 | | | $ | 13.01 | | | $ | 13.39 | | |
| | | | | | | | | | | | | | | | | | | | |
| | 2.82% | | | | 4.70% | | | | 5.78% | | | | (0.04% | ) | | | 3.70% | | |
| | | | | | | | | | | | | | | | | | | | |
| | | | | | | | | | | | | | | | | | | | |
| $ | 36,216 | | | $ | 38,295 | | | $ | 43,911 | | | $ | 48,527 | | | $ | 52,210 | | |
| | 0.90% | | | | 0.91% | | | | 0.95% | | | | 0.96% | | | | 0.95% | | |
| | 1.18% | | | | 1.19% | | | | 1.05% | | | | 0.99% | | | | 1.05% | | |
| | 2.40% | | | | 2.46% | | | | 2.49% | | | | 2.84% | | | | 3.00% | | |
| | 2.12% | | | | 2.18% | | | | 2.39% | | | | 2.81% | | | | 2.90% | | |
| | 12% | | | | 25% | | | | 50% | | | | 49% | | | | 30% | | |
41
Table of Contents
Financial highlights
Delaware Tax–Free Oregon Fund Institutional Class
Selected data for each share of the Fund outstanding throughout each period were as follows:
| Net asset value, beginning of period |
| |
| Income (loss) from investment operations: |
| Net investment income2 |
| Net realized and unrealized gain (loss) |
| Total from investment operations |
| |
| Less dividends and distributions from: |
| Net investment income |
| Total dividends and distributions |
| |
| Net asset value, end of period |
| |
| Total return3 |
| |
| Ratios and supplemental data: |
| Net assets, end of period (000 omitted) |
| Ratio of expenses to average net assets |
| Ratio of expenses to average net assets prior to fees waived |
| Ratio of net investment income to average net assets |
| Ratio of net investment income to average net assets prior to fees waived |
| Portfolio turnover |
| 1 | On October 4, 2019, Advisor Class shares of First Investors Oregon Tax Exempt Fund were reorganized into Institutional Class shares of Delaware Tax–Free Oregon Fund. See Notes to Financial Statements. The Institutional Class shares’ financial highlights for the periods prior to October 4, 2019, reflect the performance of First Investors Oregon Tax Exempt Fund Advisor Class shares. |
| 2 | Calculated using average shares outstanding. |
| 3 | Total return is based on the change in net asset value of a share during the period and assumes reinvestment of dividends and distributions at net asset value. Total return during all of the periods shown reflects a waiver by the manager. Performance would have been lower had the waiver not been in effect. |
See accompanying notes, which are an integral part of the financial statements.
42
Table of Contents
| Year ended | |
| | 12/31/21 | | 12/31/20 | | 12/31/191 | | 12/31/18 | | 12/31/17 | |
| $ | 13.69 | | | $ | 13.40 | | | $ | 12.99 | | | $ | 13.36 | | | $ | 13.30 | | |
| | | | | | | | | | | | | | | | | | | | |
| | | | | | | | | | | | | | | | | | | | |
| | 0.36 | | | | 0.37 | | | | 0.37 | | | | 0.41 | | | | 0.44 | | |
| | 0.04 | | | | 0.29 | | | | 0.41 | | | | (0.37 | ) | | | 0.07 | | |
| | 0.40 | | | | 0.66 | | | | 0.78 | | | | 0.04 | | | | 0.51 | | |
| | | | | | | | | | | | | | | | | | | | |
| | | | | | | | | | | | | | | | | | | | |
| | (0.36 | ) | | | (0.37 | ) | | | (0.37 | ) | | | (0.41 | ) | | | (0.45 | ) | |
| | (0.36 | ) | | | (0.37 | ) | | | (0.37 | ) | | | (0.41 | ) | | | (0.45 | ) | |
| | | | | | | | | | | | | | | | | | | | |
| $ | 13.73 | | | $ | 13.69 | | | $ | 13.40 | | | $ | 12.99 | | | $ | 13.36 | | |
| | | | | | | | | | | | | | | | | | | | |
| | 3.00% | | | | 4.96% | | | | 6.03% | | | | 0.33% | | | | 3.91% | | |
| | | | | | | | | | | | | | | | | | | | |
| | | | | | | | | | | | | | | | | | | | |
| $ | 4,949 | | | $ | 3,559 | | | $ | 2,953 | | | $ | 4,605 | | | $ | 4,100 | | |
| | 0.65% | | | | 0.66% | | | | 0.70% | | | | 0.66% | | | | 0.64% | | |
| | 0.93% | | | | 0.94% | | | | 0.78% | | | | 0.69% | | | | 0.74% | | |
| | 2.65% | | | | 2.71% | | | | 2.76% | | | | 3.13% | | | | 3.30% | | |
| | 2.37% | | | | 2.43% | | | | 2.68% | | | | 3.10% | | | | 3.20% | | |
| | 12% | | | | 25% | | | | 50% | | | | 49% | | | | 30% | | |
43
Table of Contents
| Notes to financial statements |
| Delaware Funds by Macquarie® tax-exempt funds | December 31, 2021 |
Delaware Group® Limited-Term Government Funds (Trust) is organized as a Delaware statutory trust and offers three series: Delaware Limited-Term Diversified Income Fund, Delaware Tax-Free New Jersey Fund, and Delaware Tax-Free Oregon Fund. These financial statements and the related notes pertain to Delaware Tax-Free New Jersey Fund and Delaware Tax-Free Oregon Fund (each a Fund, or collectively, the Funds). Delaware Limited-Term Diversified Income Fund is included in a separate report. Each Fund is an open-end investment company. The Funds are considered diversified under the Investment Company Act of 1940, as amended (1940 Act), and offer Class A and Institutional Class shares. Class A shares are sold with a maximum front-end sales charge of 4.50%. There is no front-end sales charge when you purchase $250,000 or more of Class A shares. However, if Delaware Distributors, L.P. (DDLP) or a predecessor distributor paid your financial intermediary a commission on your purchase of $1 million or more of Class A shares, for shares of the Funds purchased prior to July 1, 2020, you will have to pay a limited contingent deferred sales charge (Limited CDSC) of 1.00% if you redeem these shares within the first year after your purchase and 0.50% if you redeem these shares within the second year; or if the Distributor paid your financial intermediary a commission on your purchase of $250,000 or more of Class A shares, for shares purchased on or after July 1, 2020, you will have to pay a Limited CDSC of 1.00% if you redeem these shares within the first 18 months after your purchase, unless a specific waiver of the Limited CDSC applies. Institutional Class shares are not subject to a sales charge and are offered for sale exclusively to certain eligible investors.
Before each Fund commenced operations, on October 4, 2019, all of the assets and liabilities of the corresponding fund identified as its respective Predecessor Fund (the “Predecessor Fund”) were transferred to the Fund in a tax-free reorganization as set forth in an agreement and plan of reorganization (each a Foresters Reorganization) between the Trust, on behalf of the Funds, and Foresters Investment Management Company, Inc., on behalf of the Predecessor Funds. As a result of each Foresters Reorganization, the applicable Fund assumed the performance and accounting history of its corresponding Predecessor Fund. Financial information included for the dates prior to the Foresters Reorganization is that of the Predecessor Funds.
| Fund | | Predecessor Fund |
| Delaware Tax-Free New Jersey Fund | | First Investors New Jersey Tax Exempt Fund |
| Delaware Tax-Free Oregon Fund | | First Investors Oregon Tax Exempt Fund |
1. Significant Accounting Policies
Each Fund follows accounting and reporting guidance under Financial Accounting Standards Board (FASB) Accounting Standards Codification Topic 946, Financial Services — Investment Companies. The following accounting policies are in accordance with US generally accepted accounting principles (US GAAP) and are consistently followed by the Funds.
Security Valuation — Debt securities are valued based upon valuations provided by an independent pricing service or broker and reviewed by management. To the extent current market prices are not available, the pricing service may take into account developments related to the specific security, as well
44
Table of Contents
as transactions in comparable securities. Valuations for fixed income securities utilize matrix systems, which reflect such factors as security prices, yields, maturities, and ratings, and are supplemented by dealer and exchange quotations. Generally, other securities and assets for which market quotations are not readily available are valued at fair value as determined in good faith under the direction of the Trust’s Board of Trustees (Board). In determining whether market quotations are readily available or fair valuation will be used, various factors will be taken into consideration, such as market closures or suspension of trading in a security. Restricted securities are valued at fair value using methods approved by the Board.
Federal Income Taxes — No provision for federal income taxes has been made as each Fund intends to continue to qualify for federal income tax purposes as a regulated investment company under Subchapter M of the Internal Revenue Code of 1986, as amended, and make the requisite distributions to shareholders. Each Fund evaluates tax positions taken or expected to be taken in the course of preparing each Fund’s tax returns to determine whether the tax positions are “more-likely-than-not” of being sustained by the applicable tax authority. Tax positions not deemed to meet the “more-likely-than-not” threshold are recorded as a tax benefit or expense in the current year. Management has analyzed each Fund’s tax positions taken or expected to be taken on each Fund’s federal income tax returns through the year ended December 31, 2021, and for all open tax years (years ended December 31, 2018–December 31, 2020), and has concluded that no provision for federal income tax is required in each Fund’s financial statements. If applicable, each Fund recognizes interest accrued on unrecognized tax benefits in interest expense and penalties in “Other” on the “Statements of operations.” During the year ended December 31, 2021, the Funds did not incur any interest or tax penalties.
Class Accounting — Investment income and common expenses are allocated to the various classes of each Fund on the basis of “settled shares” of each class in relation to the net assets of each Fund. Realized and unrealized gain (loss) on investments are allocated to the various classes of each Fund on the basis of daily net assets of each class. Distribution expenses relating to a specific class are charged directly to that class.
Use of Estimates — The preparation of financial statements in conformity with US GAAP requires management to make estimates and assumptions that affect the fair value of investments, the reported amounts of assets and liabilities and disclosure of contingent assets and liabilities at the date of the financial statements, and the reported amounts of revenues and expenses during the reporting period. Actual results could differ from those estimates and the differences could be material.
Other — Expenses directly attributable to a Fund are charged directly to that Fund. Other expenses common to various funds within the Delaware Funds by Macquarie® (Delaware Funds) are generally allocated among such funds on the basis of average net assets. Management fees and certain other expenses are paid monthly. Security transactions are recorded on the date the securities are purchased or sold (trade date) for financial reporting purposes. Costs used in calculating realized gains and losses on the sale of investment securities are those of the specific securities sold. Interest income is recorded on the accrual basis. Discounts and premiums on debt securities are accreted or amortized to interest income, respectively, over the lives of the respective securities using the effective interest method.
45
Table of Contents
Notes to financial statements
Delaware Funds by Macquarie® tax-exempt funds
1. Significant Accounting Policies (continued)
Premiums on callable debt securities are amortized to interest income to the earliest call date using the effective interest method. Each Fund declares dividends daily from net investment income and pays the dividends monthly and declares and pays distributions from net realized gain on investments, if any, annually. Each Fund may distribute more frequently, if necessary for tax purposes. Dividends and distributions, if any, are recorded on the ex-dividend date.
Each Fund receives earnings credits from its custodian when positive cash balances are maintained, which may be used to offset custody fees. There were no such earnings credits for the year ended December 31, 2021.
Each Fund receives earnings credits from its transfer agent when positive cash balances are maintained, which may be used to offset transfer agent fees. If the amount earned is greater than $1, the expenses paid under this arrangement are included on the “Statements of operations” under “Dividend disbursing and transfer agent fees and expenses” with the corresponding expenses offset included under “Less expenses paid indirectly.” For the year ended December 31, 2021, each Fund earned the following amounts under this arrangement:
| Fund | | Earnings Credits |
| Delaware Tax–Free New Jersey Fund | | | $ | 43 | |
| Delaware Tax–Free Oregon Fund | | | | 49 | |
2. Investment Management, Administration Agreements, and Other Transactions with Affiliates
In accordance with the terms of its respective investment management agreement, each Fund pays Delaware Management Company (DMC), a series of Macquarie Investment Management Business Trust and the investment manager, an annual fee which is calculated daily and paid monthly, based on each Fund’s average daily net assets as follows:
| | Delaware Tax–Free | | Delaware Tax–Free |
| | New Jersey Fund | | Oregon Fund |
| On the first $500 million | | | 0.5500 | % | | | | 0.5500 | % | |
| On the next $500 million | | | 0.5000 | % | | | | 0.5000 | % | |
| On the next $1.5 billion | | | 0.4500 | % | | | | 0.4500 | % | |
| In excess of $2.5 billion | | | 0.4250 | % | | | | 0.4250 | % | |
DMC has contractually agreed to waive all or a portion, if any, of its management fee and/or pay/reimburse expenses (excluding any distribution and service (12b-1) fees, acquired fund fees and expenses, taxes, interest, short sale dividend and interest expenses, brokerage fees, certain insurance costs, and nonroutine expenses or costs, including, but not limited to, those relating to reorganizations, litigation, conducting shareholder meetings, and liquidations), in order to prevent total annual fund operating expenses from exceeding the following percentages of each Fund’s average daily net assets from April 30, 2021 through December 31, 2021.* These waivers and reimbursements may only be
46
Table of Contents
terminated by agreement of DMC and each Fund. The waivers and reimbursements are accrued daily and received monthly.
| | Operating expense |
| | limitation as |
| | a percentage |
| | of average |
| | daily net assets |
| Fund | | (per annum) |
| Delaware Tax–Free New Jersey Fund | | | 0.59 | % | |
| Delaware Tax–Free Oregon Fund | | | 0.65 | % | |
From January 1, 2021 through April 29, 2021, the operating expense limitations were as follows:
| | | Delaware Tax–Free | | Delaware Tax–Free |
| | | | New Jersey Fund | | Oregon Fund |
| Operating expense limitation | | | | | | | | | | |
| as a percentage of | | | | | | | | | | |
| average daily net assets | | | | | | | | | | |
| Class A shares | | | 0.90 | % | | | | 0.91 | % | |
| Operating expense limitation | | | | | | | | | | |
| as a percentage of | | | | | | | | | | |
| average daily net assets | | | | | | | | | | |
| Institutional Class shares | | | 0.68 | % | | | | 0.66 | % | |
DMC may seek investment advice and recommendations from its affiliates: Macquarie Investment Management Europe Limited, Macquarie Investment Management Austria Kapitalanlage AG, and Macquarie Investment Management Global Limited (together, the “Affiliated Sub-Advisors”). The Manager may also permit these Affiliated Sub-Advisors to execute each Fund’s security trades on behalf of the Manager and exercise investment discretion for securities in certain markets where DMC believes it will be beneficial to utilize an Affiliated Sub-Advisor’s specialized market knowledge. Although the Affiliated Sub-Advisors serve as sub-advisors, DMC has ultimate responsibility for all investment advisory services. For these services, DMC, not each Fund, may pay each Affiliated Sub-Advisor a portion of its investment management fee.
Delaware Investments Fund Services Company (DIFSC), an affiliate of DMC, provides fund accounting and financial administrative oversight services to the Funds. For these services, DIFSC’s fees are calculated daily and paid monthly, based on the aggregate daily net assets of all funds within the Delaware Funds at the following annual rates: 0.00475% of the first $35 billion; 0.0040% of the next $10 billion; and 0.0025% of aggregate average daily net assets in excess of $45 billion (Total Fee). Each fund in the Delaware Funds pays a minimum of $4,000, which, in aggregate, is subtracted from the Total Fee. Each fund then pays its portion of the remainder of the Total Fee on a relative net asset value (NAV) basis. These amounts are included on the “Statements of operations” under “Accounting and
47
Table of Contents
Notes to financial statements
Delaware Funds by Macquarie® tax-exempt funds
2. Investment Management, Administration Agreements, and Other Transactions with Affiliates (continued)
administration expenses.” For the year ended December 31, 2021, each Fund was charged for these services as follows:
| Fund | | Fees |
| Delaware Tax–Free New Jersey Fund | | $ | 4,977 |
| Delaware Tax–Free Oregon Fund | | | 5,451 |
DIFSC is also the transfer agent and dividend disbursing agent of the Funds. For these services, DIFSC’s fees are calculated daily and paid monthly, based on the aggregate daily net assets of the retail funds within the Delaware Funds at the following annual rates: 0.014% of the first $20 billion; 0.011% of the next $5 billion; 0.007% of the next $5 billion; 0.005% of the next $20 billion; and 0.0025% of average daily net assets in excess of $50 billion. The fees payable to DIFSC under the shareholder services agreement described above are allocated among all retail funds in the Delaware Funds on a relative NAV basis. These amounts are included on the “Statements of operations” under “Dividend disbursing and transfer agent fees and expenses.” For the year ended December 31, 2021, each Fund was charged for these services as follows:
| Fund | | Fees |
| Delaware Tax–Free New Jersey Fund | | $ | 2,378 |
| Delaware Tax–Free Oregon Fund | | | 3,527 |
Pursuant to a sub-transfer agency agreement between DIFSC and BNY Mellon Investment Servicing (US) Inc. (BNYMIS), BNYMIS provides certain sub-transfer agency services to each Fund. Sub-transfer agency fees are paid by each Fund and are also included on the “Statements of operations” under “Dividend disbursing and transfer agent fees and expenses.” The fees that are calculated daily and paid as invoices are received on a monthly or quarterly basis.
Pursuant to a distribution agreement and distribution plan, each Fund pays DDLP, the distributor and an affiliate of DMC, an annual 12b-1 fee of 0.25% of the average daily net assets of the Class A shares. The fees are calculated daily and paid monthly. Institutional Class shares do not pay 12b-1 fees.
As provided in the investment management agreement, each Fund bears a portion of the cost of certain resources shared with DMC, including the cost of internal personnel of DMC and/or its affiliates that provide legal and regulatory reporting services to the Funds. These amounts are included on the “Statements of operations” under “Legal fees.” For the year ended December 31, 2021, each Fund was charged for internal legal and regulatory reporting services provided by DMC and/or its affiliates’ employees as follows:
| Fund | | Fees |
| Delaware Tax–Free New Jersey Fund | | $ | 965 |
| Delaware Tax–Free Oregon Fund | | | 1,431 |
48
Table of Contents
For the year ended December 31, 2021, DDLP earned commissions on sales of Class A shares for each Fund as follows:
| Fund | | Commissions |
| Delaware Tax–Free New Jersey Fund | | | $ | 508 | |
| Delaware Tax–Free Oregon Fund | | | | 1,118 | |
For the year ended December 31, 2021, DDLP received gross CDSC commissions on redemptions of each Fund’s Class A shares, and these commissions were entirely used to offset upfront commissions previously paid by DDLP to broker/dealers on sales of those shares. The amounts received were as follows:
| Fund | | Class A |
| Delaware Tax–Free New Jersey Fund | | | $ | 68 | |
| Delaware Tax–Free Oregon Fund | | | | — | |
Trustees’ fees include expenses accrued by each Fund for each Trustee’s retainer and meeting fees. Certain officers of DMC, DIFSC, and DDLP are officers and/or Trustees of the Trusts. These officers and Trustees are paid no compensation by the Funds.
Cross trades for the year ended December 31, 2021, were executed by each Fund pursuant to procedures adopted by the Board designed to ensure compliance with Rule 17a-7 under the 1940 Act. Cross trading is the buying or selling of portfolio securities between funds of investment companies, or between a fund of an investment company and another entity, that are or could be considered affiliates by virtue of having a common investment advisor (or affiliated investment advisors), common directors/trustees and/or common officers. At its regularly scheduled meetings, the Board reviews a report related to the Funds’ compliance with the procedures adopted by the Board. Pursuant to these procedures, for the year ended December 31, 2021, the Funds engaged in Rule 17a-7 securities purchases and securities sales, which resulted in net gains or losses as follows:
| | Purchases | | Sales | | Net realized gain (loss) |
| Delaware Tax–Free New Jersey Fund | | | $ | 400,003 | | | | $ | 2,100,865 | | | | $ | 101,957 | |
| Delaware Tax–Free Oregon Fund | | | | 2,800,017 | | | | | 3,882,806 | | | | | 39,367 | |
____________________
| * | The aggregate contractual waiver period covering this report is from April 30, 2021 through April 30, 2022. |
3. Investments
For the year ended December 31, 2021, each Fund made purchases and sales of investment securities other than short-term investments as follows:
| Fund | | Purchases | | Sales |
| Delaware Tax–Free New Jersey Fund | | | $ | 2,069,063 | | | | $ | 5,948,442 | |
| Delaware Tax–Free Oregon Fund | | | | 4,844,767 | | | | | 5,521,553 | |
49
Table of Contents
Notes to financial statements
Delaware Funds by Macquarie® tax-exempt funds
3. Investments (continued)
The tax cost of investments includes adjustments to net unrealized appreciation (depreciation), which may not necessarily be the final tax cost basis adjustments but which approximate the tax basis unrealized gains and losses that may be realized and distributed to shareholders. At December 31, 2021, the cost and unrealized appreciation (depreciation) of investments for federal income tax purposes for each Fund were as follows:
| | | | | | | Aggregate | | Aggregate | | | | | |
| | | | | | | unrealized | | unrealized | | Net unrealized |
| | Cost of | | appreciation | | depreciation | | appreciation |
| Fund | | investments | | of investments | | of investments | | of investments |
| Delaware Tax–Free New | | | | | | | | | | | | | | | | | | | | |
| Jersey Fund | | | $ | 23,763,884 | | | | $ | 2,745,708 | | | | $ | — | | | | $ | 2,745,708 | |
| Delaware Tax–Free | | | | | | | | | | | | | | | | | | | | |
| Oregon Fund | | | | 37,160,837 | | | | | 3,555,689 | | | | | — | | | | | 3,555,689 | |
US GAAP defines fair value as the price that each Fund would receive to sell an asset or pay to transfer a liability in an orderly transaction between market participants at the measurement date under current market conditions. A three-level hierarchy for fair value measurements has been established based upon the transparency of inputs to the valuation of an asset or liability. Inputs may be observable or unobservable and refer broadly to the assumptions that market participants would use in pricing the asset or liability. Observable inputs reflect the assumptions market participants would use in pricing the asset or liability based on market data obtained from sources independent of the reporting entity. Unobservable inputs reflect the reporting entity’s own assumptions about the assumptions that market participants would use in pricing the asset or liability based on the best information available under the circumstances. Each Fund’s investment in its entirety is assigned a level based upon the observability of the inputs which are significant to the overall valuation. The three-level hierarchy of inputs is summarized as follows:
| Level 1 – | Inputs are quoted prices in active markets for identical investments. (Examples: equity securities, open-end investment companies, futures contracts, and exchange-traded options contracts) |
| | |
| Level 2 – | Other observable inputs, including, but not limited to: quoted prices for similar assets or liabilities in markets that are active, quoted prices for identical or similar assets or liabilities in markets that are not active, inputs other than quoted prices that are observable for the assets or liabilities (such as interest rates, yield curves, volatilities, prepayment speeds, loss severities, credit risks, and default rates) or other market-corroborated inputs. (Examples: debt securities, government securities, swap contracts, foreign currency exchange contracts, foreign securities utilizing international fair value pricing, broker-quoted securities, and fair valued securities) |
| | |
| Level 3 – | Significant unobservable inputs, including each Fund’s own assumptions used to determine the fair value of investments. (Examples: broker-quoted securities and fair valued securities) |
50
Table of Contents
Level 3 investments are valued using significant unobservable inputs. Each Fund may also use an income-based valuation approach in which the anticipated future cash flows of the investment are discounted to calculate fair value. Discounts may also be applied due to the nature or duration of any restrictions on the disposition of the investments. Valuations may also be based upon current market prices of securities that are comparable in coupon, rating, maturity, and industry. The derived value of a Level 3 investment may not represent the value which is received upon disposition and this could impact the results of operations.
The following tables summarize the valuation of each Fund’s investments by fair value hierarchy levels as of December 31, 2021:
| | | | | |
| | Delaware Tax–Free New Jersey Fund |
| | Level 2 |
| Securities | | | | | |
| Assets: | | | | | |
| Municipal Bonds | | | $ | 26,309,592 | |
| Short-Term Investments | | | | 200,000 | |
| Total Value of Securities | | | $ | 26,509,592 | |
| | | |
| | Delaware Tax–Free Oregon Fund |
| | Level 2 |
| Securities | | | | | |
| Assets: | | | | | |
| Municipal Bonds | | | $ | 40,516,526 | |
| Short-Term Investments | | | | 200,000 | |
| Total Value of Securities | | | $ | 40,716,526 | |
During the year ended December 31, 2021, there were no transfers into or out of Level 3 investments. Each Fund’s policy is to recognize transfers into or out of Level 3 investments based on fair value at the beginning of the reporting period.
A reconciliation of Level 3 investments is presented when each Fund has a significant amount of Level 3 investments at the beginning or end of the year in relation to each Fund’s net assets. During the year ended December 31, 2021, there were no Level 3 investments.
51
Table of Contents
Notes to financial statements
Delaware Funds by Macquarie® tax-exempt funds
4. Dividend and Distribution Information
Income and long-term capital gain distributions are determined in accordance with federal income tax regulations, which may differ from US GAAP. Additionally, distributions from net short-term gains on sales of investment securities are treated as ordinary income for federal income tax purposes. The tax character of dividends and distributions paid during the years ended December 31, 2021 and 2020 were as follows:
| | | | | | | | Long-term | | | |
| | Tax-exempt | | Ordinary | | capital | | | |
| | income | | income | | gains | | Total |
| Year ended December 31, 2021: | | | | | | | | | | | | |
| Delaware Tax–Free New Jersey Fund | | $ | 661,809 | | $ | 14,793 | | $ | 468,685 | | $ | 1,145,287 |
| Delaware Tax–Free Oregon Fund | | | 1,013,122 | | | 2,878 | | | — | | | 1,016,000 |
| Year ended December 31, 2020: | | | | | | | | | | | | |
| Delaware Tax–Free New Jersey Fund | | | 859,040 | | | 154,376 | | | 682,025 | | | 1,695,441 |
| Delaware Tax–Free Oregon Fund | | | 1,090,840 | | | 3,296 | | | — | | | 1,094,136 |
5. Components of Net Assets on a Tax Basis
As of December 31, 2021, the components of net assets on a tax basis were as follows:
| | Delaware Tax–Free | | Delaware Tax–Free |
| | New Jersey Fund | | Oregon Fund |
| Shares of beneficial interest | | | $ | 24,022,777 | | | | $ | 38,155,029 | | |
| Undistributed tax-exempt income | | | | — | | | | | 173 | | |
| Undistributed long-term capital gains | | | | 16,799 | | | | | — | | |
| Capital loss carryforwards | | | | — | | | | | (546,239 | ) | |
| Unrealized appreciation (depreciation) of investments | | | | 2,745,708 | | | | | 3,555,689 | | |
| Net assets | | | $ | 26,785,284 | | | | $ | 41,164,652 | | |
The differences between book basis and tax basis components of net assets are primarily attributable to tax deferral of losses on wash sales.
For financial reporting purposes, capital accounts are adjusted to reflect the tax character of permanent book/tax differences. Results of operations and net assets were not affected by these reclassifications. For the year ended December 31, 2021, the Funds had no reclassifications.
52
Table of Contents
At December 31, 2021, capital loss carryforwards available to offset future realized capital gains, are as follows:
| | Loss carryforward character | | |
| | Short-term | | Long-term | | Total |
| Delaware Tax–Free | | | | | | |
| Oregon Fund | | $417,506 | | $128,733 | | $546,239 |
6. Capital Shares
Transactions in capital shares were as follows:
| | Delaware Tax–Free | | Delaware Tax–Free |
| | New Jersey Fund | | Oregon Fund |
| | Year ended | | Year ended |
| | 12/31/21 | | 12/31/20 | | 12/31/21 | | 12/31/20 |
| Shares sold: | | | | | | | | | | | | |
| Class A | | 70,165 | | | 47,340 | | | 126,190 | | | 124,360 | |
| Institutional Class | | 17,950 | | | 1,708 | | | 100,837 | | | 77,981 | |
| Shares issued upon reinvestment of dividends and distributions: | | | | | | | | | | | | |
| Class A | | 75,909 | | | 110,366 | | | 59,007 | | | 63,812 | |
| Institutional Class | | 6,866 | | | 8,593 | | | 8,327 | | | 5,904 | |
| Class R61 | | — | | | 12 | | | — | | | 12 | |
| | 170,890 | | | 168,019 | | | 294,361 | | | 272,069 | |
| | | | | | | | | | | | | |
| Shares redeemed: | | | | | | | | | | | | |
| Class A | | (419,079 | ) | | (1,006,043 | ) | | (345,912 | ) | | (667,323 | ) |
| Institutional Class | | (21,497 | ) | | (38,273 | ) | | (8,885 | ) | | (44,290 | ) |
| Class R61 | | — | | | (792 | ) | | — | | | (761 | ) |
| | (440,576 | ) | | (1,045,108 | ) | | (354,797 | ) | | (712,374 | ) |
| Net decrease | | (269,686 | ) | | (877,089 | ) | | (60,436 | ) | | (440,305 | ) |
| 1 | All Class R6 were liquidated on August 20, 2020. |
7. Line of Credit
Each Fund, along with certain other funds in the Delaware Funds (Participants), was a participant in a $225,000,000 revolving line of credit (Agreement) intended to be used for temporary or emergency purposes as an additional source of liquidity to fund redemptions of investor shares. Under the Agreement, the Participants were charged an annual commitment fee of 0.15% with the addition of an upfront fee of 0.05%, which was allocated across the Participants based on a weighted average of the respective net assets of each Participant. The Participants were permitted to borrow up to a maximum of one-third of their net assets under the Agreement. Each Participant was individually, and not jointly, liable for its particular advances, if any, under the line of credit. The line of credit available under the Agreement expired on November 1, 2021.
53
Table of Contents
Notes to financial statements
Delaware Funds by Macquarie® tax-exempt funds
7. Line of Credit (continued)
On November 1, 2021, each Fund, along with the other Participants, entered into an amendment to the agreement for a $355,000,000 revolving line of credit to be used as described above and operates in substantially the same manner as the original Agreement. Under the amendment to the agreement, the Participants are charged an annual commitment fee of 0.15%, with the addition of an upfront fee of 0.05%, which is allocated across the Participants based on a weighted average of the respective net assets of each Participant. The line of credit available under the agreement expires on October 31, 2022.
Each Fund had no amounts outstanding as of December 31, 2021, or at any time during the year then ended.
8. Securities Lending
Each Fund, along with other funds in the Delaware Funds, may lend its securities pursuant to a security lending agreement (Lending Agreement) with The Bank of New York Mellon (BNY Mellon). At the time a security is loaned, the borrower must post collateral equal to the required percentage of the market value of the loaned security, including any accrued interest. The required percentage is: (1) 102% with respect to US securities and foreign securities that are denominated and payable in US dollars; and (2) 105% with respect to foreign securities. With respect to each loan, if on any business day the aggregate market value of securities collateral plus cash collateral held is less than the aggregate market value of the securities which are the subject of such loan, the borrower will be notified to provide additional collateral by the end of the following business day, which, together with the collateral already held, will be not less than the applicable initial collateral requirements for such security loan. If the aggregate market value of securities collateral and cash collateral held with respect to a security loan exceeds the applicable initial collateral requirement, upon the request of the borrower, BNY Mellon must return enough collateral to the borrower by the end of the following business day to reduce the value of the remaining collateral to the applicable initial collateral requirement for such security loan. As a result of the foregoing, the value of the collateral held with respect to a loaned security on any particular day, may be more or less than the value of the security on loan. The collateral percentage with respect to the market value of the loaned security is determined by the security lending agent.
Cash collateral received by each fund of the Trust is generally invested in a series of individual separate accounts, each corresponding to a fund. The investment guidelines permit each separate account to hold certain securities that would be considered eligible securities for a money market fund. Cash collateral received is generally invested in government securities; certain obligations issued by government sponsored enterprises; repurchase agreements collateralized by US Treasury securities; obligations issued by the central government of any Organization for Economic Cooperation and Development (OECD) country or its agencies, instrumentalities, or establishments; obligations of supranational organizations; commercial paper, notes, bonds, and other debt obligations; certificates of deposit, time deposits, and other bank obligations; certain money market funds; and asset-backed securities. Each fund can also accept US government securities and letters of credit (non-cash collateral) in connection with securities loans.
54
Table of Contents
In the event of default or bankruptcy by the lending agent, realization and/or retention of the collateral may be subject to legal proceedings. In the event the borrower fails to return loaned securities and the collateral received is insufficient to cover the value of the loaned securities and provided such collateral shortfall is not the result of investment losses, the lending agent has agreed to pay the amount of the shortfall to each Fund or, at the discretion of the lending agent, replace the loaned securities. Each Fund continues to record dividends or interest, as applicable, on the securities loaned and is subject to changes in value of the securities loaned that may occur during the term of the loan. Each Fund has the right under the Lending Agreement to recover the securities from the borrower on demand. With respect to security loans collateralized by non-cash collateral, each Fund receives loan premiums paid by the borrower. With respect to security loans collateralized by cash collateral, the earnings from the collateral investments are shared among each Fund, the security lending agent, and the borrower. Each Fund records security lending income net of allocations to the security lending agent and the borrower.
Each Fund may incur investment losses as a result of investing securities lending collateral. This could occur if an investment in the collateral investment account defaulted or became impaired. Under those circumstances, the value of each Fund’s cash collateral account may be less than the amount each Fund would be required to return to the borrowers of the securities and each Fund would be required to make up for this shortfall.
During the year ended December 31, 2021, each Fund had no securities out on loan.
9. Geographic, Credit and Market Risks
Beginning in January 2020, global financial markets have experienced and may continue to experience significant volatility resulting from the spread of a novel coronavirus known as COVID-19. The outbreak of COVID-19 has resulted in travel and border restrictions, quarantines, supply chain disruptions, lower consumer demand and general market uncertainty. The effects of COVID-19 have and may continue to adversely affect the global economy, the economies of certain nations and individual issuers, all of which may negatively impact the Funds’ performance.
When interest rates rise, fixed income securities (i.e. debt obligations) generally will decline in value. These declines in value are greater for fixed income securities with longer maturities or durations.
IBOR risk is the risk that changes related to the use of the London interbank offered rate (LIBOR) and other interbank offered rate (collectively, IBORs) could have adverse impacts on financial instruments that reference LIBOR (or the corresponding IBOR). The abandonment of LIBOR could affect the value and liquidity of instruments that reference LIBOR. The use of alternative reference rate products may impact investment strategy performance. These risks may also apply with respect to changes in connection with other IBORs, such as the euro overnight index average (EONIA), which are also the subject of recent reform.
The Funds concentrate their investments in securities issued by each corresponding state’s municipalities. The Funds invest primarily in a specific state and may be subject to geographic concentration risk. In addition, the Funds have the flexibility to invest in issuers in US territories and possessions such as the Commonwealth of Puerto Rico, the US Virgin Islands, and Guam whose bonds are also free of federal and individual state income taxes. The value of the Funds’ investments may be
55
Table of Contents
Notes to financial statements
Delaware Funds by Macquarie® tax-exempt funds
9. Geographic, Credit and Market Risks (continued)
adversely affected by new legislation within the states or US territories, regional or local economic conditions, and differing levels of supply and demand for municipal bonds. Many municipalities insure repayment for their obligations. Although bond insurance reduces the risk of loss due to default by an issuer, such bonds remain subject to the risk that value may fluctuate for other reasons and there is no certainty that the insurance company will meet its obligations. A real or perceived decline in creditworthiness of a bond insurer can have an adverse impact on the value of insured bonds held in each Fund.
Each Fund invests a portion of its assets in high yield municipal fixed income securities, which are securities rated lower than BBB- by Standard & Poor’s Financial Services LLC (S&P), lower than Baa3 by Moody’s Investors Service, Inc. (Moody’s), or similarly rated by another nationally recognized statistical rating organization. Investments in these higher yielding securities are generally accompanied by a greater degree of credit risk than higher rated securities. Additionally, lower rated securities may be more susceptible to adverse economic and competitive industry conditions than investment grade securities.
Each Fund invests in certain obligations that may have liquidity protection designed to ensure that the receipt of payments due on the underlying security is timely. Such protection may be provided through guarantees, insurance policies, or letters of credit obtained by the issuer or sponsor through third parties, through various means of structuring the transaction, or through a combination of such approaches. Each Fund will not pay any additional fees for such credit support, although the existence of credit support may increase the price of a security.
Each Fund may invest in advanced refunded bonds, escrow secured bonds, or defeased bonds. Under current federal tax laws and regulations, state and local government borrowers are permitted to refinance outstanding bonds by issuing new bonds. The issuer refinances the outstanding debt to either reduce interest costs or to remove or alter restrictive covenants imposed by the bonds being refinanced. A refunding transaction where the municipal securities are being refunded within 90 days from the issuance of the refunding issue is known as a “current refunding.” “Advance refunded bonds” are bonds in which the refunded bond issue remains outstanding for more than 90 days following the issuance of the refunding issue. In an advance refunding, the issuer will use the proceeds of a new bond issue to purchase high grade interest bearing debt securities, which are then deposited in an irrevocable escrow account held by an escrow agent to secure all future payments of principal and interest and bond premium of the advance refunded bond. Bonds are “escrowed to maturity” when the proceeds of the refunding issue are deposited in an escrow account for investment sufficient to pay all of the principal and interest on the original interest payment and maturity dates.
Bonds are considered “pre-refunded” when the refunding issue’s proceeds are escrowed only until a permitted call date or dates on the refunded issue with the refunded issue being redeemed at the time, including any required premium. Bonds become “defeased” when the rights and interests of the bondholders and of their lien on the pledged revenues or other security under the terms of the bond contract are substituted with an alternative source of revenues (the escrow securities) sufficient to meet payments of principal and interest to maturity or to the first call dates. Escrowed secured bonds will
56
Table of Contents
often receive a rating of AAA from Moody’s, S&P, and/or Fitch Ratings due to the strong credit quality of the escrow securities and the irrevocable nature of the escrow deposit agreement.
Each Fund may invest up to 15% of its net assets in illiquid securities, which may include securities with contractual restrictions on resale, securities exempt from registration under Rule 144A promulgated under the Securities Act of 1933, as amended, and other securities which may not be readily marketable. The relative illiquidity of these securities may impair each Fund from disposing of them in a timely manner and at a fair price when it is necessary or desirable to do so. While maintaining oversight, the Board has delegated to DMC, the day-to-day functions of determining whether individual securities are liquid for purposes of each Fund’s limitation on investments in illiquid securities. Securities eligible for resale pursuant to Rule 144A, which are determined to be liquid, are not subject to each Fund’s 15% limit on investments in illiquid securities. Rule 144A securities have been identified on the “Schedules of investments.”
10. Contractual Obligations
Each Fund enters into contracts in the normal course of business that contain a variety of indemnifications. Each Fund’s maximum exposure under these arrangements is unknown. However, each Fund has not had prior claims or losses pursuant to these contracts. Management has reviewed each Fund’s existing contracts and expects the risk of loss to be remote.
11. Recent Accounting Pronouncements
In March 2020, FASB issued an Accounting Standards Update (ASU), ASU 2020-04, Reference Rate Reform (Topic 848) – Facilitation of the Effects of Reference Rate Reform on Financial Reporting. The amendments in ASU 2020-04 provide optional temporary financial reporting relief from the effect of certain types of contract modifications due to the planned discontinuation of LIBOR and other interbank-offered based reference rates as of the end of 2021. ASU 2020-04 is effective for certain reference rate-related contract modifications that occur during the period March 12, 2020 through December 31, 2022. As of the financial reporting period, Management is evaluating the impact of applying this ASU.
12. Subsequent Events
Management has determined that no material events or transactions occurred subsequent to December 31, 2021, that would require recognition or disclosure in the Funds’ financial statements.
57
Table of Contents
Report of independent
registered public accounting firm
To the Board of Trustees of Delaware Group® Limited-Term Government Funds and Shareholders of
Delaware Tax-Free New Jersey Fund and Delaware Tax-Free Oregon Fund
Opinions on the Financial Statements
We have audited the accompanying statements of assets and liabilities, including the schedules of investments, of Delaware Tax-Free New Jersey Fund and Delaware Tax-Free Oregon Fund (two of the funds constituting Delaware Group® Limited-Term Government Funds, hereafter collectively referred to as the “Funds”) as of December 31, 2021, the related statements of operations for the year ended December 31, 2021, the statements of changes in net assets for each of the two years in the period ended December 31, 2021, including the related notes, and the financial highlights for each of the three years in the period ended December 31, 2021 (collectively referred to as the “financial statements”). In our opinion, the financial statements present fairly, in all material respects, the financial position of each of the Funds as of December 31, 2021, the results of each of their operations for the year then ended, the changes in each of their net assets for each of the two years in the period ended December 31, 2021 and each of the financial highlights for each of the three years in the period ended December 31, 2021 in conformity with accounting principles generally accepted in the United States of America.
The financial statements of First Investors New Jersey Tax Exempt Fund and First Investors Oregon Tax Exempt Fund (subsequent to reorganization, known as Delaware Tax-Free New Jersey Fund and Delaware Tax-Free Oregon Fund, respectively) as of and for the year ended December 31, 2018 and the financial highlights for each of the periods ended on or prior to December 31, 2018 (not presented herein, other than the financial highlights) were audited by other auditors whose report dated February 26, 2019 expressed an unqualified opinion on those financial statements and financial highlights.
Basis for Opinions
These financial statements are the responsibility of the Funds’ management. Our responsibility is to express an opinion on the Funds’ financial statements based on our audits. We are a public accounting firm registered with the Public Company Accounting Oversight Board (United States) (PCAOB) and are required to be independent with respect to the Funds in accordance with the U.S. federal securities laws and the applicable rules and regulations of the Securities and Exchange Commission and the PCAOB.
We conducted our audits of these financial statements in accordance with the standards of the PCAOB. Those standards require that we plan and perform the audit to obtain reasonable assurance about whether the financial statements are free of material misstatement, whether due to error or fraud.
Our audits included performing procedures to assess the risks of material misstatement of the financial statements, whether due to error or fraud, and performing procedures that respond to those risks. Such procedures included examining, on a test basis, evidence regarding the amounts and disclosures in the financial statements. Our audits also included evaluating the accounting principles used and significant estimates made by management, as well as evaluating the overall presentation of the financial statements. Our procedures included confirmation of securities owned as of December 31, 2021 by correspondence with the custodian and brokers; when replies were not received from brokers, we performed other auditing procedures. We believe that our audits provide a reasonable basis for our opinions.
/s/PricewaterhouseCoopers LLP
Philadelphia, Pennsylvania
February 17, 2022
We have served as the auditor of one or more investment companies in Delaware Funds by Macquarie® since 2010.
58
Table of Contents
Other Fund information (Unaudited)
Delaware Funds by Macquarie® tax-exempt funds
Tax Information
The information set forth below is for the Funds’ fiscal year as required by federal income tax laws. Shareholders, however, must report distributions on a calendar year basis for income tax purposes, which may include distributions for portions of two fiscal years of the Funds. Accordingly, the information needed by shareholders for income tax purposes will be sent to them in January of each year. Please consult your tax advisor for proper treatment of this information.
All disclosures are based on financial information available as of the date of this annual report and, accordingly are subject to change. For any and all items requiring reporting, it is the intention of each Fund to report the maximum amount permitted under the Internal Revenue Code and the regulations thereunder.
For the fiscal year ended December 31, 2021, each Fund reports distributions paid during the year as follows:
| | (A) | | | | | | | | | | | | | | | |
| | Long-Term | | (B) | | (C) | | | | | |
| | Capital Gains | | Ordinary Income | | Tax-Exempt | | Total |
| | Distributions | | Distributions | | Distributions | | Distributions |
| | (Tax Basis) | | (Tax Basis) | | (Tax Basis) | | (Tax Basis) |
| Delaware Tax–Free New | | | | | | | | | | | | | | | | | | | | |
| Jersey Fund | | | 40.92 | % | | | | 1.29 | % | | | | 57.79 | % | | | | 100.00 | % | |
| Delaware Tax–Free | | | | | | | | | | | | | | | | | | | | |
| Oregon Fund | | | — | | | | | 0.28 | % | | | | 99.72 | % | | | | 100.00 | % | |
____________________
| (A), (B) and (C) are based on a percentage of each Fund’s total distributions. |
Board consideration of Investment Advisory Agreements for Delaware Tax-Free New Jersey Fund and Delaware Tax-Free Oregon Fund at a meeting held August 10-12, 2021
At a meeting held on August 10-12, 2021 (the “Annual Meeting”), the Board of Trustees (the “Board”), including a majority of disinterested or independent Trustees, approved the renewal of the Investment Advisory Agreement for each of Delaware Tax-Free New Jersey Fund and Delaware Tax-Free Oregon Fund (each, a “Fund” and together, the “Funds”). In making its decision, the Board considered information furnished at regular quarterly Board meetings, including reports detailing Fund performance, investment strategies, and expenses, as well as information prepared specifically in connection with the renewal of the investment advisory and sub-advisory contracts. Information furnished specifically in connection with the renewal of the Investment Management Agreement with Delaware Management Company (“DMC”), a series of Macquarie Investment Management Business Trust (“MIMBT”), included materials provided by DMC and its affiliates (collectively, “Macquarie Asset Management”) concerning, among other things, the nature, extent, and quality of services provided to the Funds; the costs of such services to the Funds; economies of scale; and the investment manager’s financial condition and profitability. In addition, in connection with the Annual Meeting, materials were provided to the Trustees in May 2021, including reports provided by Broadridge Financial Solutions (“Broadridge”). The Broadridge reports compared each Fund’s investment performance and expenses with those of other comparable mutual funds. The Independent Trustees reviewed and discussed the Broadridge reports
59
Table of Contents
Other Fund information (Unaudited)
Delaware Funds by Macquarie® tax-exempt funds
Board consideration of Investment Advisory Agreements for Delaware Tax-Free New Jersey Fund and Delaware Tax-Free Oregon Fund at a meeting held August 10-12, 2021 (continued)
with independent legal counsel to the Independent Trustees. In addition to the information noted above, the Board also requested and received information regarding DMC’s policy with respect to advisory fee levels and its breakpoint philosophy; the structure of portfolio manager compensation; comparative client fee information; and any constraints or limitations on the availability of securities for certain investment styles, which had in the past year inhibited, or which were likely in the future to inhibit, the investment manager’s ability to invest fully in accordance with Fund policies.
In considering information relating to the approval of each Fund’s advisory and sub-advisory agreements, the Independent Trustees received assistance and advice from and met separately with independent legal counsel to the Independent Trustees and also received assistance and advice from an experienced and knowledgeable independent fund consultant, JDL Consultants, LLC (“JDL”). Although the Board gave attention to all information furnished, the following discussion identifies, under separate headings, the primary factors taken into account by the Board during its contract renewal considerations.
Nature, extent, and quality of services. The Board considered the services provided by DMC to the Funds and their shareholders. In reviewing the nature, extent, and quality of services, the Board considered reports furnished to it throughout the year, which covered matters such as the relative performance of the Funds; compliance of portfolio managers with the investment policies, strategies, and restrictions for the Funds; compliance by DMC and Delaware Distributors, L.P. (together, “Management”) personnel with the Code of Ethics adopted throughout the Delaware Funds by Macquarie® (“Delaware Funds”); and adherence to fair value pricing procedures as established by the Board. The Board was pleased with the current staffing of DMC and the emphasis placed on research in the investment process. The Board recognized DMC’s receipt of certain favorable industry distinctions during the past several years. The Board gave favorable consideration to DMC’s efforts to control expenses while maintaining service levels committed to Fund matters. The Board also noted the benefits provided to Fund shareholders through (a) each shareholder’s ability to: (i) exchange an investment in one Delaware Fund for the same class of shares in another Delaware Fund without a sales charge, or (ii) reinvest Fund dividends into additional shares of the Fund or into additional shares of other Delaware Funds, and (b) the privilege to combine holdings in other Delaware Funds to obtain a reduced sales charge. The Board was satisfied with the nature, extent, and quality of the overall services provided by DMC.
Investment performance. The Board placed significant emphasis on the investment performance of the Funds in view of the importance of investment performance to shareholders. Although the Board considered performance reports and discussions with portfolio managers at Investment Committee meetings throughout the year, the Board gave particular weight to the Broadridge reports furnished for the Annual Meeting. The Broadridge reports prepared for the Funds showed each Fund’s investment performance in comparison to a group of similar funds (the “Performance Universe”). A fund with the best performance ranked first, and a fund with the poorest performance ranked last. The highest/best performing 25% of funds in the Performance Universe make up the first quartile; the next 25%, the second quartile; the next 25%, the third quartile; and the poorest/worst performing 25% of funds in the Performance Universe make up the fourth quartile. Comparative annualized performance for each Fund
60
Table of Contents
was shown for the past 1-, 3-, 5-, and 10-year periods, to the extent applicable, ended December 31, 2021. The Board’s objective is that each Fund’s performance for the 1-, 3-, and 5-year periods be at or above the median of its Performance Universe.
Delaware Tax-Free New Jersey Fund – The Performance Universe for the Fund consisted of the Fund and all retail and institutional New Jersey municipal debt funds as selected by Broadridge. The Broadridge report comparison showed that the Fund’s total return for the 1-year period was in the first quartile of its Performance Universe. The report further showed that the Fund’s total return for the 3-year period was in the second quartile of its Performance Universe and the Fund’s total return for the 5-year and since inception periods was in the third quartile of its Performance Universe. The Board was satisfied with performance.
Delaware Tax-Free Oregon Fund – The expense comparisons for the Fund showed that its actual management fee was in the quartile with the second lowest expenses of its Expense Group and its total expenses were in the quartile with the highest expenses of its Expense Group. The Board gave favorable consideration to the Fund’s management fee but noted that the Fund’s total expenses were not in line with the Board’s objective. In evaluating the total expenses, the Board considered fee waivers in place through April 2022 and various initiatives implemented by Management, such as a negotiation of lower fees for fund accounting, fund accounting oversight services, and custody, which had created an opportunity for a further reduction in expenses. The Board was satisfied with Management’s efforts to improve the Fund’s total expense ratio and to bring it in line with the Board’s objective.
Comparative expenses. The Board considered expense data for the Delaware Funds. Management provided the Board with information on pricing levels and fee structures for each Fund as of its most recently completed fiscal year. The Board also focused on the comparative analysis of effective management fees and total expense ratios of each Fund versus effective management fees and total expense ratios of a group of similar funds as selected by Broadridge (the “Expense Group”). In reviewing comparative costs, each Fund’s contractual management fee and the actual management fee incurred by the Fund were compared with the contractual management fees (assuming all funds in the Expense Group were similar in size to the Fund) and actual management fees (as reported by each fund) within the Expense Group, taking into account any applicable breakpoints and fee waivers. Each Fund’s total expenses were also compared with those of its Expense Group. The Broadridge total expenses, for comparative consistency, were shown by Broadridge for Class A shares and comparative total expenses including 12b-1 and non-12b-1 service fees. The Board’s objective is for each Fund’s total expense ratio to be competitive with those of the peer funds within its Expense Group.
Delaware Tax-Free New Jersey Fund – The expense comparisons for the Fund showed that its actual management fee was in the quartile with the second lowest expenses of its Expense Group and its total expenses were in the quartile with the highest expenses of its Expense Group. The Board gave favorable consideration to the Fund’s management fee but noted that the Fund’s total expenses were not in line with the Board’s objective. In evaluating the total expenses, the Board considered fee waivers in place through April 2022 and various initiatives implemented by Management, such as a negotiation of lower fees for fund accounting, fund accounting oversight services, and custody, which had created an opportunity for a further reduction in expenses. The Board was satisfied with Management’s efforts to improve the Fund’s total expense ratio and to bring it in line with the Board’s objective.
61
Table of Contents
Other Fund information (Unaudited)
Delaware Funds by Macquarie® tax-exempt funds
Board consideration of Investment Advisory Agreements for Delaware Tax-Free New Jersey Fund and Delaware Tax-Free Oregon Fund at a meeting held August 10-12, 2021 (continued)
Delaware Tax-Free Oregon Fund – The expense comparisons for the Fund showed that its actual management fee was in the quartile with the second lowest expenses of its Expense Group and its total expenses were in the quartile with the highest expenses of its Expense Group. The Board gave favorable consideration to the Fund’s management fee but noted that the Fund’s total expenses were not in line with the Board’s objective. In evaluating the total expenses, the Board considered fee waivers in place through April 2022 and various initiatives implemented by Management, such as a negotiation of lower fees for fund accounting, fund accounting oversight services, and custody, which had created an opportunity for a further reduction in expenses. The Board was satisfied with Management’s efforts to improve the Fund’s total expense ratio and to bring it in line with the Board’s objective.
Management profitability. The Board considered the level of profits realized by DMC in connection with the operation of the Funds. In this respect, the Board reviewed the Investment Management Profitability Analysis that addressed the overall profitability of DMC’s business in providing management and other services to each of the individual funds and the Delaware Funds as a whole. Specific attention was given to the methodology used by DMC in allocating costs for the purpose of determining profitability. Management stated that the level of profits of DMC, to a certain extent, reflects recent operational cost savings and efficiencies initiated by DMC. The Board considered DMC’s efforts to improve services provided to Fund shareholders and to meet additional regulatory and compliance requirements resulting from recent industry-wide Securities and Exchange Commission initiatives. The Board also considered the extent to which DMC might derive ancillary benefits from fund operations, including the potential for procuring additional business as a result of the prestige and visibility associated with its role as service provider to the Delaware Funds and the benefits from allocation of fund brokerage to improve trading efficiencies. As part of its work, the Board also reviewed a report prepared by JDL regarding MIMBT profitability as compared to certain peer fund complexes and the Independent Trustees discussed with JDL personnel regarding DMC’s profitability in such context. The Board found that the management fees were reasonable in light of the services rendered and the level of profitability of DMC.
Economies of scale. The Trustees considered whether economies of scale are realized by DMC as each Fund’s assets increase and the extent to which any economies of scale are reflected in the level of management fees charged. The Trustees reviewed each Fund’s advisory fee pricing and structure, approved by the Board and shareholders, which includes breakpoints, and which applies to most funds in the Delaware Funds complex. Breakpoints in the advisory fee occur when the advisory fee rate is reduced on assets in excess of specified levels. Breakpoints result in a lower advisory fee than would otherwise be the case in the absence of breakpoints, when the asset levels specified in the breakpoints are exceeded. The Board noted that although, as of March 31, 2021, the Funds had each not reached a size at which it could take advantage of any breakpoints in the applicable fee schedule, the Board recognized that the fee was structured so that, if the Fund increases sufficiently in size, then economies of scale may be shared.
62
Table of Contents
Board of trustees / directors and officers addendum
Delaware Funds by Macquarie®
A mutual fund is governed by a Board of Trustees/Directors (“Trustees”), which has oversight responsibility for the management of a fund’s business affairs. Trustees establish procedures and oversee and review the performance of the investment manager, the distributor, and others who perform services for the fund. The independent fund trustees, in particular, are advocates for shareholder interests. Each trustee has served in that capacity since he or she was elected to or appointed to the Board of Trustees, and will continue to serve until his or her retirement or the election of a new trustee in his or her place. The following is a list of the Trustees and Officers with certain background and related information.
| | | | | | | | Number of | | Other |
| | | | | | Principal | | Portfolios in Fund | | Directorships |
| Name, | | Position(s) | | | | Occupation(s) | | Complex Overseen | | Held by |
| Address, | | Held with | | Length of Time | | During the | | by Trustee | | Trustee |
| and Birth Date | | Fund(s) | | Served | | Past Five Years | | or Officer | | or Officer |
| Interested Trustee |
| | | | | | | | | | | |
| Shawn K. Lytle1 | | President, | | President and | | Global Head of Macquarie | | 148 | | Trustee — UBS Relationship |
| 610 Market Street | | Chief Executive | | Chief Executive | | Investment Management2 | | | | Funds, SMA Relationship Trust, |
| Philadelphia, PA | | Officer, | | Officer | | (January 2019–Present) | | | | and UBS Funds |
| 19106-2354 | | and Trustee | | since August 2015 | | Head of Americas of | | | | (May 2010–April 2015) |
| February 1970 | | | | Trustee since | | Macquarie Group | | | | |
| | | | September 2015 | | (December 2017–Present) | | | | |
| | | | | | Deputy Global Head of | | | | |
| | | | | | Macquarie Investment | | | | |
| | | | | | Management | | | | |
| | | | | | (2017–2019) | | | | |
| | | | | | Head of Macquarie Investment | | | | |
| | | | | | Management Americas | | | | |
| | | | | | (2015–2017) | | | | |
63
Table of Contents
Board of trustees / directors and officers addendum
Delaware Funds by Macquarie®
| | | | | | | | Number of | | Other |
| | | | | | Principal | | Portfolios in Fund | | Directorships |
| Name, | | Position(s) | | | | Occupation(s) | | Complex Overseen | | Held by |
| Address, | | Held with | | Length of Time | | During the | | by Trustee | | Trustee |
| and Birth Date | | Fund(s) | | Served | | Past Five Years | | or Officer | | or Officer |
| Independent Trustees |
| | | | | | | | | | | |
| Jerome D. | | Trustee | | Since January 2019 | | Managing Member, Stonebrook | | 148 | | None |
| Abernathy | | | | | | Capital Management, LLC | | | | |
| 610 Market Street | | | | | | (financial technology: macro | | | | |
| Philadelphia, PA | | | | | | factors and databases) | | | | |
| 19106-2354 | | | | | | (January 1993-Present) | | | | |
| July 1959 | | | | | | | | | | |
| |
| Thomas L. Bennett | | Chair and Trustee | | Trustee since March | | Private Investor | | 148 | | None |
| 610 Market Street | | | | 2005 | | (March 2004–Present) | | | | |
| Philadelphia, PA | | | | Chair since March | | | | | | |
| 19106-2354 | | | | 2015 | | | | | | |
| October 1947 | | | | | | | | | | |
| |
| Ann D. Borowiec | | Trustee | | Since March 2015 | | Chief Executive Officer, Private | | 148 | | Director — Banco Santander |
| 610 Market Street | | | | | | Wealth Management | | | | International |
| Philadelphia, PA | | | | | | (2011–2013) and Market | | | | (October 2016–December 2019) |
| 19106-2354 | | | | | | Manager, New Jersey Private | | | | Director — Santander Bank, N.A. |
| November 1958 | | | | | | Bank (2005–2011) — J.P. | | | | (December 2016–December |
| | | | | | Morgan Chase & Co. | | | | 2019) |
64
Table of Contents
| | | | | | | | Number of | | Other |
| | | | | | Principal | | Portfolios in Fund | | Directorships |
| Name, | | Position(s) | | | | Occupation(s) | | Complex Overseen | | Held by |
| Address, | | Held with | | Length of Time | | During the | | by Trustee | | Trustee |
| and Birth Date | | Fund(s) | | Served | | Past Five Years | | or Officer | | or Officer |
| |
| Joseph W. Chow | | Trustee | | Since January 2013 | | Private Investor | | 148 | | Director and Audit Committee |
| 610 Market Street | | | | | | (April 2011–Present) | | | | Member — Hercules Technology |
| Philadelphia, PA | | | | | | | | | | Growth Capital, Inc. |
| 19106-2354 | | | | | | | | | | (July 2004–July 2014) |
| January 1953 | | | | | | | | | | |
65
Table of Contents
Board of trustees / directors and officers addendum
Delaware Funds by Macquarie®
| | | | | | | | Number of | | Other |
| | | | | | Principal | | Portfolios in Fund | | Directorships |
| Name, | | Position(s) | | | | Occupation(s) | | Complex Overseen | | Held by |
| Address, | | Held with | | Length of Time | | During the | | by Trustee | | Trustee |
| and Birth Date | | Fund(s) | | Served | | Past Five Years | | or Officer | | or Officer |
| |
| H. Jeffrey Dobbs3 | | Trustee | | Since December 2021 | | Global Sector Chairman, | | 148 | | Director, Valparaiso University |
| 610 Market Street | | | | | | Industrial Manufacturing, | | | | (2012–Present) |
| Philadelphia, PA | | | | | | KPMG LLP | | | | Director, TechAccel LLC |
| 19106-2354 | | | | | | (2010-2015) | | | | (2015–Present) (Tech R&D) |
| May 1955 | | | | | | | | | | Board Member, Kansas City |
| | | | | | | | | | Repertory Theatre |
| | | | | | | | | | (2015–Present) |
| | | | | | | | | | Board Member, Patients |
| | | | | | | | | | Voices, Inc. (healthcare) |
| | | | | | | | | | (2018–Present) |
| | | | | | | | | | Kansas City Campus for Animal |
| | | | | | | | | | Care (2018–Present) |
| | | | | | | | | | Director, National Association of |
| | | | | | | | | | Manufacturers (2010–2015) |
| | | | | | | | | | Director, The Children’s Center |
| | | | | | | | | | (2003–2015) |
| | | | | | | | | | Director, Metropolitan Affairs |
| | | | | | | | | | Coalition (2003–2015) |
| | | | | | | | | | Director, Michigan Roundtable |
| | | | | | | | | | for Diversity and Inclusion |
| | | | | | | | | | (2003–2015) |
| | | | | | | | | | Trustee, Ivy Funds Complex |
| | | | | | | | | | (2019–2021) |
66
Table of Contents
| | | | | | | | Number of | | Other |
| | | | | | Principal | | Portfolios in Fund | | Directorships |
| Name, | | Position(s) | | | | Occupation(s) | | Complex Overseen | | Held by |
| Address, | | Held with | | Length of Time | | During the | | by Trustee | | Trustee |
| and Birth Date | | Fund(s) | | Served | | Past Five Years | | or Officer | | or Officer |
| |
| John A. Fry | | Trustee | | Since January 2001 | | Drexel University | | 148 | | Director; Compensation |
| 610 Market Street | | | | | | (August 2010–Present) | | | | Committee and Governance |
| Philadelphia, PA | | | | | | President — Franklin & Marshall | | | | Committee Member — |
| 19106-2354 | | | | | | College | | | | Community Health Systems |
| May 1960 | | | | | | (July 2002–June 2010) | | | | (May 2004–Present) |
| | | | | | | | | | Director — Drexel Morgan & Co. |
| | | | | | | | | | (2015–2019) |
| | | | | | | | | | Director, Audit and |
| | | | | | | | | | Compensation Committee |
| | | | | | | | | | Member — vTv Therapeutics Inc. |
| | | | | | | | | | (2017–Present) |
| | | | | | | | | | Director and Audit Committee |
| | | | | | | | | | Member — FS Credit Real Estate |
| | | | | | | | | | Income Trust, Inc. |
| | | | | | | | | | (2018–Present) |
| | | | | | | | | | Director — Federal Reserve |
| | | | | | | | | | Bank of Philadelphia |
| | | | | | | | | | (January 2020–Present) |
67
Table of Contents
Board of trustees / directors and officers addendum
Delaware Funds by Macquarie®
| | | | | | | | Number of | | Other |
| | | | | | Principal | | Portfolios in Fund | | Directorships |
| Name, | | Position(s) | | | | Occupation(s) | | Complex Overseen | | Held by |
| Address, | | Held with | | Length of Time | | During the | | by Trustee | | Trustee |
| and Birth Date | | Fund(s) | | Served | | Past Five Years | | or Officer | | or Officer |
| |
| Joseph Harroz, Jr.3 | | Trustee | | Since December 2021 | | President (2020–Present), Interim | | 148 | | Director, OU Medicine, Inc. |
| 610 Market Street | | | | | | President (2019–2020), Vice | | | | (2020–Present) |
| Philadelphia, PA | | | | | | President (2010–2019) and Dean | | | | Director and Shareholder, |
| 19106-2354 | | | | | | (2010–2019), College of Law, | | | | Valliance Bank |
| January 1967 | | | | | | University of Oklahoma; | | | | (2007–Present) |
| | | | | | Managing Member, Harroz | | | | Director, Foundation Healthcare |
| | | | | | Investments, LLC, (commercial | | | | (formerly Graymark HealthCare) |
| | | | | | enterprises) (1998–2019); | | | | (2008–2017) |
| | | | | | Managing Member, St. Clair, | | | | Trustee, the Mewbourne Family |
| | | | | | LLC (commercial enterprises) | | | | Support Organization |
| | | | | | (2019–Present) | | | | (2006–Present) (non-profit) |
| | | | | | | | | | Independent Director, LSQ |
| | | | | | | | | | Manager, Inc. (real estate) |
| | | | | | | | | | (2007–2016) |
| | | | | | | | | | Director, Oklahoma Foundation |
| | | | | | | | | | for Excellence (non-profit) |
| | | | | | | | | | (2008–Present) |
| | | | | | | | | | Trustee, Ivy Funds Complex |
| | | | | | | | | | (1998–2021) |
68
Table of Contents
| | | | | | | | Number of | | Other |
| | | | | | Principal | | Portfolios in Fund | | Directorships |
| Name, | | Position(s) | | | | Occupation(s) | | Complex Overseen | | Held by |
| Address, | | Held with | | Length of Time | | During the | | by Trustee | | Trustee |
| and Birth Date | | Fund(s) | | Served | | Past Five Years | | or Officer | | or Officer |
| |
| Sandra A.J. | | Trustee | | Since December 2021 | | Chief Administrative Officer, | | 148 | | Director, Hall Family Foundation |
| Lawrence3 | | | | | | Children’s Mercy Hospitals and | | | | (1993–Present) |
| 610 Market Street | | | | | | Clinics | | | | Director, Westar Energy (utility) |
| Philadelphia, PA | | | | | | (2016–2019); | | | | (2004–2018) |
| 19106-2354 | | | | | | CFO, Children’s Mercy Hospitals | | | | Trustee, Nelson-Atkins Museum |
| September 1957 | | | | | | and Clinics | | | | of Art (non-profit) (2021–Present) |
| | | | | | (2005–2016) | | | | (2007–2020) |
| | | | | | | | | | Director, Turn the Page KC |
| | | | | | | | | | (non-profit) (2012–2016) |
| | | | | | | | | | Director, Kansas Metropolitan |
| | | | | | | | | | Business and Healthcare |
| | | | | | | | | | Coalition (non-profit) (2017–2019) |
| | | | | | | | | | Director, National Association of |
| | | | | | | | | | Corporate Directors (non-profit) |
| | | | | | | | | | National Board (2022–Present); |
| | | | | | | | | | Regional Board (2017–2021) |
| | | | | | | | | | Director, American Shared |
| | | | | | | | | | Hospital Services (medical |
| | | | | | | | | | device) (2017–2021) |
| | | | | | | | | | Director, Evergy, Inc., Kansas |
| | | | | | | | | | City Power & Light Company, |
| | | | | | | | | | KCP&L Greater Missouri |
| | | | | | | | | | Operations Company, Westar |
| | | | | | | | | | Energy, Inc. and Kansas Gas and |
| | | | | | | | | | Electric Company (related utility |
| | | | | | | | | | companies) (2018–Present) |
69
Table of Contents
Board of trustees / directors and officers addendum
Delaware Funds by Macquarie®
| | | | | | | | Number of | | Other |
| | | | | | Principal | | Portfolios in Fund | | Directorships |
| Name, | | Position(s) | | | | Occupation(s) | | Complex Overseen | | Held by |
| Address, | | Held with | | Length of Time | | During the | | by Trustee | | Trustee |
| and Birth Date | | Fund(s) | | Served | | Past Five Years | | or Officer | | or Officer |
| |
| Sandra A.J. | | Trustee | | Since December 2021 | | Chief Administrative Officer, | | 148 | | Director, Stowers (research) |
| Lawrence3 | | | | | | Children’s Mercy Hospitals and | | | | (2018) |
| (continued) | | | | | | Clinics | | | | Co-Chair, Women Corporate |
| 610 Market Street | | | | | | (2016–2019); | | | | Directors (director education) |
| Philadelphia, PA | | | | | | CFO, Children’s Mercy Hospitals | | | | (2018–2020) |
| 19106-2354 | | | | | | and Clinics | | | | Trustee, Ivy Funds Complex |
| September 1957 | | | | | | (2005–2016) | | | | (2019-2021) |
| | | | | | | | | | Director, Brixmor Property |
| | | | | | | | | | Group Inc. |
| | | | | | | | | | (2021–Present) |
| | | | | | | | | | Director, Sera Prognostics Inc. |
| | | | | | | | | | (biotechnology) |
| | | | | | | | | | (2021–Present) |
| | | | | | | | | | Director, Recology (resource |
| | | | | | | | | | recovery) |
| | | | | | | | | | (2021–Present) |
70
Table of Contents
| | | | | | | | Number of | | Other |
| | | | | | Principal | | Portfolios in Fund | | Directorships |
| Name, | | Position(s) | | | | Occupation(s) | | Complex Overseen | | Held by |
| Address, | | Held with | | Length of Time | | During the | | by Trustee | | Trustee |
| and Birth Date | | Fund(s) | | Served | | Past Five Years | | or Officer | | or Officer |
| | | | | | | | | | |
| Frances A. | | Trustee | | Since September | | Private Investor | | 148 | | Trust Manager and Audit |
| Sevilla-Sacasa | | | | 2011 | | (January 2017–Present) | | | | Committee Chair — Camden |
| 610 Market Street | | | | | | Chief Executive Officer — Banco | | | | Property Trust |
| Philadelphia, PA | | | | | | Itaú International | | | | (August 2011–Present) |
| 19106-2354 | | | | | | (April 2012–December 2016) | | | | Director; Audit |
| January 1956 | | | | | | Executive Advisor to Dean | | | | and Compensation |
| | | | | | (August 2011–March 2012) and | | | | Committee Member — |
| | | | | | Interim Dean | | | | Callon Petroleum Company |
| | | | | | (January 2011–July 2011) — | | | | (December 2019–Present) |
| | | | | | University of Miami School of | | | | Director — New Senior |
| | | | | | Business Administration | | | | Investment Group Inc. |
| | | | | | President — U.S. Trust, Bank of | | | | (January 2021–September 2021) |
| | | | | | America Private Wealth | | | | Director; Audit Committee |
| | | | | | Management (Private Banking) | | | | Member — Carrizo Oil & Gas, |
| | | | | | (July 2007-December 2008) | | | | Inc. (March 2018–December |
| | | | | | | | | | 2019) |
71
Table of Contents
Board of trustees / directors and officers addendum
Delaware Funds by Macquarie®
| | | | | | | | Number of | | Other |
| | | | | | Principal | | Portfolios in Fund | | Directorships |
| Name, | | Position(s) | | | | Occupation(s) | | Complex Overseen | | Held by |
| Address, | | Held with | | Length of Time | | During the | | by Trustee | | Trustee |
| and Birth Date | | Fund(s) | | Served | | Past Five Years | | or Officer | | or Officer |
| | | | | | | | | | |
| Thomas K. Whitford | | Trustee | | Since January 2013 | | Vice Chairman — PNC Financial | | 148 | | Director — HSBC North America |
| 610 Market Street | | | | | | Services Group | | | | Holdings Inc. |
| Philadelphia, PA | | | | | | (2010–April 2013) | | | | (December 2013–Present) |
| 19106-2354 | | | | | | | | | | Director — HSBC USA Inc. |
| March 1956 | | | | | | | | | | (July 2014–Present) |
| | | | | | | | | | Director — HSBC Bank USA, |
| | | | | | | | | | National Association |
| | | | | | | | | | (July 2014–March 2017) |
| | | | | | | | | | Director — HSBC Finance |
| | | | | | | | | | Corporation |
| | | | | | | | | | (December 2013–April 2018) |
72
Table of Contents
| | | | | | | | Number of | | Other |
| | | | | | Principal | | Portfolios in Fund | | Directorships |
| Name, | | Position(s) | | | | Occupation(s) | | Complex Overseen | | Held by |
| Address, | | Held with | | Length of Time | | During the | | by Trustee | | Trustee |
| and Birth Date | | Fund(s) | | Served | | Past Five Years | | or Officer | | or Officer |
| | | | | | | | | | |
| Christianna Wood | | Trustee | | Since January 2019 | | Chief Executive Officer and | | 148 | | Director; Finance Committee and |
| 610 Market Street | | | | | | President — Gore Creek Capital, | | | | Audit Committee Member — |
| Philadelphia, PA | | | | | | Ltd. (August 2009–Present) | | | | H&R Block Corporation |
| 19106-2354 | | | | | | | | | | (July 2008–Present) |
| August 1959 | | | | | | | | | | Director; Investments |
| | | | | | | | | | Committee, Capital and Finance |
| | | | | | | | | | Committee, and Audit |
| | | | | | | | | | Committee Member — Grange |
| | | | | | | | | | Insurance (2013–Present) |
| | | | | | | | | | Trustee; Chair of Nominating and |
| | | | | | | | | | Governance Committee and |
| | | | | | | | | | Audit Committee Member — |
| | | | | | | | | | The Merger Fund |
| | | | | | | | | | (2013–October 2021), |
| | | | | | | | | | The Merger Fund VL |
| | | | | | | | | | (2013–October 2021); WCM |
| | | | | | | | | | Alternatives: Event-Driven Fund |
| | | | | | | | | | (2013–October 2021), and WCM |
| | | | | | | | | | Alternatives: Credit Event Fund |
| | | | | | | | | | (December 2017–October 2021) |
| | | | | | | | | | Director; Chair of Governance |
| | | | | | | | | | Committee and Audit Committee |
| | | | | | | | | | Member — International |
| | | | | | | | | | Securities Exchange (2010–2016) |
73
Table of Contents
Board of trustees / directors and officers addendum
Delaware Funds by Macquarie®
| | | | | | | | | | |
| | | | | | | | Number of | | Other |
| | | | | | Principal | | Portfolios in Fund | | Directorships |
| Name, | | Position(s) | | | | Occupation(s) | | Complex Overseen | | Held by |
| Address, | | Held with | | Length of Time | | During the | | by Trustee | | Trustee |
| and Birth Date | | Fund(s) | | Served | | Past Five Years | | or Officer | | or Officer |
| | | | | | | | | | |
| Janet L. Yeomans | | Trustee | | Since April 1999 | | Vice President and Treasurer | | 148 | | Director; Personnel and |
| 610 Market Street | | | | | | (January 2006–July 2012), Vice | | | | Compensation Committee Chair; |
| Philadelphia, PA | | | | | | President — Mergers & | | | | Member of Nominating, |
| 19106-2354 | | | | | | Acquisitions | | | | Investments, and Audit |
| July 1948 | | | | | | (January 2003–January 2006), | | | | Committees for various periods |
| | | | | | and Vice President and Treasurer | | | | throughout directorship — |
| | | | | | (July 1995–January 2003) — 3M | | | | Okabena Company (2009–2017) |
| | | | | | Company | | | | |
| | | | | | | | | | | |
| Officers |
| | | | | | | | | | | |
| David F. Connor | | Senior Vice President, | | Senior Vice President, | | David F. Connor has served in | | 148 | | None4 |
| 610 Market Street | | General Counsel, and | | since May 2013; | | various capacities at different | | | | |
| Philadelphia, PA | | Secretary | | General Counsel | | times at Macquarie Investment | | | | |
| 19106-2354 | | | | since May 2015; | | Management. | | | | |
| December 1963 | | | | Secretary since | | | | | | |
| | | | October 2005 | | | | | | |
| | | | | | | | | | | |
| Daniel V. Geatens | | Senior Vice President | | Senior Vice President | | Daniel V. Geatens has served in | | 148 | | None4 |
| 610 Market Street | | and Treasurer | | and Treasurer since | | various capacities at different | | | | |
| Philadelphia, PA | | | | October 2007 | | times at Macquarie Investment | | | | |
| 19106-2354 | | | | | | Management. | | | | |
| October 1972 | | | | | | | | | | |
74
Table of Contents
| | | | | | | | | | |
| | | | | | | | Number of | | Other |
| | | | | | Principal | | Portfolios in Fund | | Directorships |
| Name, | | Position(s) | | | | Occupation(s) | | Complex Overseen | | Held by |
| Address, | | Held with | | Length of Time | | During the | | by Trustee | | Trustee |
| and Birth Date | | Fund(s) | | Served | | Past Five Years | | or Officer | | or Officer |
| | | | | | | | | | |
| Richard Salus | | Senior Vice President | | Senior Vice President | | Richard Salus has served in | | 148 | | None |
| 610 Market Street | | and Chief Financial | | and Chief Financial | | various capacities at different | | | | |
| Philadelphia, PA | | Officer | | Officer since | | times at Macquarie Investment | | | | |
| 19106-2354 | | | | November 2006 | | Management. | | | | |
| October 1963 | | | | | | | | | | |
| 1 | Shawn K. Lytle is considered to be an “Interested Trustee” because he is an executive officer of the Fund’s(s’) investment advisor. |
| 2 | Macquarie Investment Management is the marketing name for Macquarie Management Holdings, Inc. and its subsidiaries, including the Fund’s(s’) investment advisor, principal underwriter, and its transfer agent. |
| 3 | Messrs. Dobbs and Harroz and Ms. Lawrence were elected as Trustees of the Trust effective December 17, 2021. |
| 4 | David F. Connor serves as Senior Vice President and Secretary, and Daniel V. Geatens serves as Senior Vice President, Treasurer, and Chief Financial Officer, for the six portfolios of the Optimum Fund Trust, which have the same investment advisor, principal underwriter, and transfer agent as the registrant. Mr. Geatens also serves as the Chief Financial Officer and Treasurer for Macquarie Global Infrastructure Total Return Fund Inc. |
The Statement of Additional Information for the Fund(s) includes additional information about the Trustees and Officers and is available, without charge, upon request by calling 800 523-1918.
75
Table of Contents
About the organization
Board of trustees | | | | | | |
| | | | | | | |
Shawn K. Lytle
President and
Chief Executive Officer
Delaware Funds
by Macquarie®
Philadelphia, PA Jerome D. Abernathy
Managing Member,
Stonebrook Capital
Management, LLC
Jersey City, NJ Thomas L. Bennett
Chairman of the Board
Delaware Funds
by Macquarie
Private Investor
Rosemont, PA | | Ann D. Borowiec
Former Chief Executive
Officer
Private Wealth Management
J.P. Morgan Chase & Co.
New York, NY Joseph W. Chow
Former Executive Vice
President
State Street Corporation
Boston, MA H. Jeffrey Dobbs
Former Global Sector
Chairman
Industrial Manufacturing,
KPMG, LLP
Detroit, MI | | John A. Fry
President
Drexel University
Philadelphia, PA Joseph Harroz, Jr.
President
University of Oklahoma
Norman, OK Sandra A.J. Lawrence
Former Chief Administrative
Officer
Children’s Mercy Hospitals
and Clinics
Kansas City, MO | | Frances A.
Sevilla-Sacasa
Former Chief Executive
Officer
Banco Itaú International
Miami, FL Thomas K. Whitford
Former Vice Chairman
PNC Financial Services
Group
Pittsburgh, PA Christianna Wood
Chief Executive Officer
and President
Gore Creek Capital, Ltd.
Golden, CO Janet L. Yeomans
Former Vice President and
Treasurer
3M Company
St. Paul, MN |
| | | | | | | |
Affiliated officers | | | | | | |
| | | | | | | |
David F. Connor
Senior Vice President,
General Counsel,
and Secretary
Delaware Funds
by Macquarie
Philadelphia, PA | | Daniel V. Geatens
Senior Vice President and
Treasurer
Delaware Funds
by Macquarie
Philadelphia, PA | | Richard Salus
Senior Vice President and
Chief Financial Officer
Delaware Funds
by Macquarie
Philadelphia, PA | | |
This annual report is for the information of Delaware Tax-Free New Jersey Fund and Delaware Tax-Free Oregon Fund shareholders, but it may be used with prospective investors when preceded or accompanied by the Delaware Fund fact sheet for the most recently completed calendar quarter. These documents are available at delawarefunds.com/literature. |
Each Fund files its complete schedule of portfolio holdings with the Securities and Exchange Commission (SEC) for the first and third quarters of each fiscal year on Form N-PORT. Each Fund’s Forms N-PORT, as well as a description of the policies and procedures that the Funds use to determine how to vote proxies (if any) relating to portfolio securities, are available without charge (i) upon request, by calling 800 523-1918; and (ii) on the SEC’s website at sec.gov. In addition, a description of the policies and procedures that the Funds use to determine how to vote proxies (if any) relating to portfolio securities and the Schedules of Investments included in the Funds’ most recent Form N-PORT are available without charge on the Funds’ website at delawarefunds.com/literature. Each Fund’s Forms N-PORT may be reviewed and copied at the SEC’s Public Reference Room in Washington, D.C.; information on the operation of the Public Reference Room may be obtained by calling 800 SEC-0330.
Information (if any) regarding how the Funds voted proxies relating to portfolio securities during the most recently disclosed 12-month period ended June 30 is available without charge (i) through the Funds’ website at delawarefunds.com/proxy; and (ii) on the SEC’s website at sec.gov.
76
Item 2. Code of Ethics
The registrant has adopted a code of ethics that applies to the registrant’s principal executive officer, principal financial officer, principal accounting officer or controller, or persons performing similar functions, regardless of whether these individuals are employed by the registrant or a third party. A copy of the registrant’s Code of Business Ethics has been posted on the Delaware Funds by Macquarie® Internet Web site at www.delawarefunds.com. Any amendments to the Code of Business Ethics, and information on any waiver from its provisions granted by the registrant, will also be posted on this Web site within five business days of such amendment or waiver and will remain on the Web site for at least 12 months.
Item 3. Audit Committee Financial Expert
The registrant’s Board of Trustees has determined that certain members of the registrant’s Audit Committee are audit committee financial experts, as defined below. For purposes of this item, an “audit committee financial expert” is a person who has the following attributes:
a. An understanding of generally accepted accounting principles and financial statements;
b. The ability to assess the general application of such principles in connection with the accounting for estimates, accruals, and reserves;
c. Experience preparing, auditing, analyzing, or evaluating financial statements that present a breadth and level of complexity of accounting issues that are generally comparable to the breadth and complexity of issues that can reasonably be expected to be raised by the registrant’s financial statements, or experience actively supervising one or more persons engaged in such activities;
d. An understanding of internal controls and procedures for financial reporting; and
e. An understanding of audit committee functions.
An “audit committee financial expert” shall have acquired such attributes through:
a. Education and experience as a principal financial officer, principal accounting officer, controller, public accountant, or auditor or experience in one or more positions that involve the performance of similar functions;
b. Experience actively supervising a principal financial officer, principal accounting officer, controller, public accountant, auditor, or person performing similar functions;
c. Experience overseeing or assessing the performance of companies or public accountants with respect to the preparation, auditing, or evaluation of financial statements; or
d. Other relevant experience.
The registrant’s Board of Trustees has also determined that each member of the registrant’s Audit Committee is independent. In order to be “independent” for purposes of this item, the Audit Committee member may not: (i) other than in his or her capacity as a member of the Board of Trustees or any committee thereof, accept directly or indirectly any consulting, advisory or other compensatory fee from the issuer; or (ii) be an “interested person” of the registrant as defined in Section 2(a)(19) of the Investment Company Act of 1940.
The names of the audit committee financial experts on the registrant’s Audit Committee are set forth below:
H. Jeffrey Dobbs
John A. Fry
Sandra A.J. Lawrence
Frances A. Sevilla-Sacasa, Chair
Item 4. Principal Accountant Fees and Services
(a) Audit fees.
The aggregate fees billed for services provided to the registrant by its independent auditors for the audit of the registrant’s annual financial statements and for services normally provided by the independent auditors in connection with statutory and regulatory filings or engagements were $113,706 for the fiscal year ended December 31, 2021.
The aggregate fees billed for services provided to the registrant by its independent auditors for the audit of the registrant’s annual financial statements and for services normally provided by the independent auditors in connection with statutory and regulatory filings or engagements were $126,340 for the fiscal year ended December 31, 2020.
(b) Audit-related fees.
The aggregate fees billed by the registrant’s independent auditors for services relating to the performance of the audit of the registrant’s financial statements and not reported under paragraph (a) of this Item were $0 for the fiscal year ended December 31, 2021.
The aggregate fees billed by the registrant’s independent auditors for services relating to the performance of the audit of the financial statements of the registrant’s investment adviser and other service providers under common control with the adviser and that relate directly to the operations or financial reporting of the registrant were $1,134,001 for the registrant’s fiscal year ended December 31, 2021. The percentage of these fees relating to services approved by the registrant’s Audit Committee pursuant to the de minimis exception from the pre-approval requirement in Rule 2-01(c)(7)(i)(C) of Regulation S-X was 0%. These audit-related services were as follows: year-end audit procedures; group reporting and subsidiary statutory audits.
The aggregate fees billed by the registrant’s independent auditors for services relating to the performance of the audit of the registrant’s financial statements and not reported under paragraph (a) of this Item were $0 for the fiscal year ended December 31, 2020.
The aggregate fees billed by the registrant’s independent auditors for services relating to the performance of the audit of the financial statements of the registrant’s investment adviser and other service providers under common control with the adviser and that relate directly to the operations or financial reporting of the registrant were $903,282 for the registrant’s fiscal year ended December 31, 2020. The percentage of these fees relating to services approved by the registrant’s Audit Committee pursuant to the de minimis exception from the pre-approval requirement in Rule 2-01(c)(7)(i)(C) of Regulation S-X was 0%. These audit-related services were as follows: year-end audit procedures; group reporting and subsidiary statutory audits.
(c) Tax fees.
The aggregate fees billed by the registrant’s independent auditors for tax-related services provided to the registrant were $15,750 for the fiscal year ended December 31, 2021. The percentage of these fees relating to services approved by the registrant’s Audit Committee pursuant to the de minimis exception from the pre-approval requirement in Rule 2-01(c)(7)(i)(C) of Regulation S-X was 0%. These tax-related services were as follows: review of income tax returns and review of annual excise distribution calculations.
The aggregate fees billed by the registrant’s independent auditors for tax-related services provided to the registrant’s investment adviser and other service providers under common control with the adviser and that relate directly to the operations or financial reporting of the registrant were $0 for the registrant’s fiscal year ended December 31, 2021. The percentage of these fees relating to services approved by the registrant’s Audit Committee pursuant to the de minimis exception from the pre-approval requirement in Rule 2-01(c)(7)(i)(C) of Regulation S-X was 0%.
The aggregate fees billed by the registrant’s independent auditors for tax-related services provided to the registrant were $17,500 for the fiscal year ended December 31, 2020. The percentage of these fees relating to services approved by the registrant’s Audit Committee pursuant to the de minimis exception from the pre-approval requirement in Rule 2-01(c)(7)(i)(C) of Regulation S-X was 0%. These tax-related services were as follows: review of income tax returns and review of annual excise distribution calculations.
The aggregate fees billed by the registrant’s independent auditors for tax-related services provided to the registrant’s investment adviser and other service providers under common control with the adviser and that relate directly to the operations or financial reporting of the registrant were $0 for the registrant’s fiscal year ended December 31, 2020. The percentage of these fees relating to services approved by the registrant’s Audit Committee pursuant to the de minimis exception from the pre-approval requirement in Rule 2-01(c)(7)(i)(C) of Regulation S-X was 0%.
(d) All other fees.
The aggregate fees billed for all services provided by the independent auditors to the registrant other than those set forth in paragraphs (a), (b) and (c) of this Item were $0 for the fiscal year ended December 31, 2021.
The aggregate fees billed for all services other than those set forth in paragraphs (b) and (c) of this Item provided by the registrant’s independent auditors to the registrant’s adviser and other service providers under common control with the adviser and that relate directly to the operations or financial reporting of the registrant were $0 for the registrant’s fiscal year ended December 31, 2021. The percentage of these fees relating to services approved by the registrant’s Audit Committee pursuant to the de minimis exception from the pre-approval requirement in Rule 2-01(c)(7)(i)(C) of Regulation S-X was 0%.
The aggregate fees billed for all services provided by the independent auditors to the registrant other than those set forth in paragraphs (a), (b) and (c) of this Item were $0 for the fiscal year ended December 31, 2020.
The aggregate fees billed for all services other than those set forth in paragraphs (b) and (c) of this Item provided by the registrant’s independent auditors to the registrant’s adviser and other service providers under common control with the adviser and that relate directly to the operations or financial reporting of the registrant were $0 for the registrant’s fiscal year ended December 31, 2020. The percentage of these fees relating to services approved by the registrant’s Audit Committee pursuant to the de minimis exception from the pre-approval requirement in Rule 2-01(c)(7)(i)(C) of Regulation S-X was 0%.
(e) The registrant’s Audit Committee has established pre-approval policies and procedures as permitted by Rule 2-01(c)(7)(i)(B) of Regulation S-X (the “Pre-Approval Policy”) with respect to services provided by the registrant’s independent auditors. Pursuant to the Pre-Approval Policy, the Audit Committee has pre-approved the services set forth in the table below with respect to the registrant up to the specified fee limits. Certain fee limits are based on aggregate fees to the registrant and other registrants within the Delaware Funds by Macquarie®.
| Service | Range of Fees |
| Audit Services | |
| Statutory audits or financial audits for new Funds | up to $50,000 per Fund |
| Services associated with SEC registration statements (e.g., Form N-1A, Form N-14, etc.), periodic reports and other documents filed with the SEC or other documents issued in connection with securities offerings (e.g., comfort letters for closed-end Fund offerings, consents), and assistance in responding to SEC comment letters | up to $10,000 per Fund |
| Consultations by Fund management as to the accounting or disclosure treatment of transactions or events and/or the actual or potential impact of final or proposed rules, standards or interpretations by the SEC, FASB, or other regulatory or standard-setting bodies (Note: Under SEC rules, some consultations may be considered “audit-related services” rather than “audit services”) | up to $25,000 in the aggregate |
| Audit-Related Services | |
| Consultations by Fund management as to the accounting or disclosure treatment of transactions or events and /or the actual or potential impact of final or proposed rules, standards or interpretations by the SEC, FASB, or other regulatory or standard-setting bodies (Note: Under SEC rules, some consultations may be considered “audit services” rather than “audit-related services”) | up to $25,000 in the aggregate |
| Tax Services | |
| U.S. federal, state and local and international tax planning and advice (e.g., consulting on statutory, regulatory or administrative developments, evaluation of Funds’ tax compliance function, etc.) | up to $25,000 in the aggregate |
| U.S. federal, state and local tax compliance (e.g., excise distribution reviews, etc.) | up to $5,000 per Fund |
| Review of federal, state, local and international income, franchise and other tax returns | up to $5,000 per Fund |
Under the Pre-Approval Policy, the Audit Committee has also pre-approved the services set forth in the table below with respect to the registrant’s investment adviser and other entities controlling, controlled by or under common control with the investment adviser that provide ongoing services to the registrant (the “Control Affiliates”) up to the specified fee limit. This fee limit is based on aggregate fees to the investment adviser and its Control Affiliates.
| Service | Range of Fees |
| Non-Audit Services | |
| Services associated with periodic reports and other documents filed with the SEC and assistance in responding to SEC comment letters | up to $10,000 in the aggregate |
The Pre-Approval Policy requires the registrant’s independent auditors to report to the Audit Committee at each of its regular meetings regarding all services initiated since the last such report was rendered, including those services authorized by the Pre-Approval Policy.
(f) Not applicable.
(g) The aggregate non-audit fees billed by the registrant’s independent auditors for services rendered to the registrant and to its investment adviser and other service providers under common control with the adviser were $9,044,000 and $8,455,000 for the registrant’s fiscal years ended December 31, 2021 and December 31, 2020, respectively.
(h) In connection with its selection of the independent auditors, the registrant’s Audit Committee has considered the independent auditors’ provision of non-audit services to the registrant’s investment adviser and other service providers under common control with the adviser that were not required to be pre-approved pursuant to Rule 2-01(c)(7)(ii) of Regulation S-X. The Audit Committee has determined that the independent auditors’ provision of these services is compatible with maintaining the auditors’ independence.
Item 5. Audit Committee of Listed Registrants
Not applicable.
Item 6. Investments
(a) Included as part of report to shareholders filed under Item 1 of this Form N-CSR.
(b) Divestment of securities in accordance with Section 13(c) of the Investment Company Act of 1940.
Not applicable.
Item 7. Disclosure of Proxy Voting Policies and Procedures for Closed-End Management Investment Companies
Not applicable.
Item 8. Portfolio Managers of Closed-End Management Investment Companies
Not applicable.
Item 9. Purchases of Equity Securities by Closed-End Management Investment Companies and Affiliated Purchasers
Not applicable.
Item 10. Submission of Matters to a Vote of Security Holders
Not applicable.
Item 11. Controls and Procedures
The registrant’s principal executive officer and principal financial officers, or persons performing similar functions, have concluded that the registrant’s disclosure controls and procedures (as defined in Rule 30a-3(c) under the Investment Company Act of 1940, as amended (17 CFR 270.30a-3(c))) are effective, as of a date within 90 days of the filing of this report, based on their evaluation of these controls and procedures required by Rule 30a-3(b) under the Investment Company Act of 1940 (17 CFR 270.30a-3(b)) and Rules 13a-15(b) or 15d-15(b) under the Securities Exchange Act of 1934, as amended (17 CFR 240.13a-15(b) or 240.15d-15(b)) and provide reasonable assurance that the information required to be disclosed by the registrant in its reports or statements filed under the Securities Exchange Act of 1934 is recorded, processed, summarized and reported within the time periods specified in the rules and forms of the Securities and Exchange Commission.
There were no significant changes in the registrant’s internal control over financial reporting (as defined in Rule 30a-3(d) under the Investment Company Act of 1940 (17 CFR 270.30a-3(d)) that occurred during the period covered by the report to stockholders included herein that have materially affected, or are reasonably likely to materially affect, the registrant’s internal control over financial reporting.
Item 12. Disclosure of Securities Lending Activities for Closed-End Management Investment Companies
Not applicable.
Item 13. Exhibits
(a) (1) Code of Ethics
Not applicable.
(2) Certifications of Principal Executive Officer and Principal Financial Officer pursuant to Rule 30a-2 under the Investment Company Act of 1940 are attached hereto as Exhibit 99.CERT.
(3) Written solicitations to purchase securities pursuant to Rule 23c-1 under the Securities Exchange Act of 1934.
Not applicable.
(b) Certifications pursuant to Section 906 of the Sarbanes-Oxley Act of 2002 are furnished herewith as Exhibit 99.906CERT.
SIGNATURES
Pursuant to the requirements of the Securities Exchange Act of 1934 and the Investment Company Act of 1940, the registrant has duly caused this report to be signed on its behalf, by the undersigned, thereunto duly authorized.
DELAWARE GROUP® LIMITED-TERM GOVERNMENT FUNDS
| /s/SHAWN K. LYTLE |
| By: | Shawn K. Lytle |
| Title: | President and Chief Executive Officer |
| Date: | March 4, 2022 |
Pursuant to the requirements of the Securities Exchange Act of 1934 and the Investment Company Act of 1940, this report has been signed below by the following persons on behalf of the registrant and in the capacities and on the dates indicated.
| /s/SHAWN K. LYTLE |
| By: | Shawn K. Lytle |
| Title: | President and Chief Executive Officer |
| Date: | March 4, 2022 |
| |
| /s/RICHARD SALUS |
| By: | Richard Salus |
| Title: | Chief Financial Officer |
| Date: | March 4, 2022 |

