UNITED STATES SECURITIES AND EXCHANGE COMMISSION
Washington, D.C. 20549
FORM N-CSR
CERTIFIED SHAREHOLDER REPORT OF REGISTERED MANAGEMENT
INVESTMENT COMPANIES
| Investment Company Act file number: | 811-03363 |
| | |
| Exact name of registrant as specified in charter: | Delaware Group® Limited-Term
Government Funds |
| | |
| Address of principal executive offices: | 610 Market Street Philadelphia, PA 19106 |
| | |
| Name and address of agent for service: | David F. Connor, Esq. 610 Market Street Philadelphia, PA 19106 |
| | |
| Registrant’s telephone number, including area code: | (800) 523-1918 |
| | |
| Date of fiscal year end: | December 31 |
| | |
| Date of reporting period: | December 31, 2023 |
| | |
Item 1. Reports to Stockholders
Annual report
Fixed income mutual fund
Delaware Limited-Term Diversified Income Fund
December 31, 2023
Carefully consider the Fund's investment objectives, risk factors, charges, and expenses before investing. This and other information can be found in the Fund's prospectus and its summary prospectus, which may be obtained by visiting delawarefunds.com/literature or calling 800 523-1918. Investors should read the prospectus and the summary prospectus carefully before investing.
You can obtain shareholder reports and prospectuses online instead of in the mail. Visit delawarefunds.com/edelivery.
Experience Delaware Funds by Macquarie®
Macquarie Asset Management (MAM) is a global asset manager that aims to deliver positive impact for everyone. MAM's public markets businesses trace their roots to 1929 and partner with institutional and individual clients to deliver specialist active investment capabilities across global equities, fixed income, and multi-asset solutions using a conviction-based, long-term approach to investing. In the US, retail investors recognize our Delaware Funds by Macquarie family of funds as one of the oldest mutual fund families.
If you are interested in learning more about creating an investment plan, contact your financial advisor.
You can learn more about Delaware Funds or obtain a prospectus for Delaware Limited-Term Diversified Income Fund at delawarefunds.com/literature.
Manage your account online
| · | Check your account balance and transactions |
| · | View statements and tax forms |
| �� | Make purchases and redemptions |
Visit delawarefunds.com/account-access.
Macquarie Asset Management (MAM) is the asset management division of Macquarie Group. MAM is an integrated asset manager across public and private markets offering a diverse range of capabilities, including real assets, real estate, credit, equities, and multi-asset solutions.
The Fund is advised by Delaware Management Company, a series of Macquarie Investment Management Business Trust (MIMBT), a US registered investment adviser, and distributed by Delaware Distributors, L.P. (DDLP), an affiliate of MIMBT and Macquarie Group Limited.
Other than Macquarie Bank Limited ABN 46 008 583 542 (“Macquarie Bank”), any Macquarie Group entity noted in this document is not an authorized deposit-taking institution for the purposes of the Banking Act 1959 (Commonwealth of Australia). The obligations of these other Macquarie Group entities do not represent deposits or other liabilities of Macquarie Bank. Macquarie Bank does not guarantee or otherwise provide assurance in respect of the obligations of these other Macquarie Group entities. In addition, if this document relates to an investment, (a) the investor is subject to investment risk including possible delays in repayment and loss of income and principal invested and (b) none of Macquarie Bank or any other Macquarie Group entity guarantees any particular rate of return on or the performance of the investment, nor do they guarantee repayment of capital in respect of the investment.
The Fund is governed by US laws and regulations.
This annual report is for the information of Delaware Limited-Term Diversified Income Fund shareholders, but it may be used with prospective investors when preceded or accompanied by the Delaware Fund fact sheet for the most recently completed calendar quarter. These documents are available at delawarefunds.com/literature.
Unless otherwise noted, views expressed herein are current as of December 31, 2023, and subject to change for events occurring after such date. These views are not intended to be investment advice, to forecast future events, or to guarantee future results.
The Fund is not FDIC insured and is not guaranteed. It is possible to lose the principal amount invested.
All third-party marks cited are the property of their respective owners.
© 2024 Macquarie Management Holdings, Inc.
Portfolio management review
| Delaware Limited-Term Diversified Income Fund | December 31, 2023 (Unaudited) |
| Performance preview (for the year ended December 31, 2023) | |
| Delaware Limited-Term Diversified Income Fund (Institutional Class shares) | 1-year return | +5.31% |
| Delaware Limited-Term Diversified Income Fund (Class A shares) | 1-year return | +5.08% |
| Bloomberg 1-3 Year US Government/Credit Index | 1-year return | +4.61% |
Past performance does not guarantee future results.
For complete, annualized performance for Delaware Limited-Term Diversified Income Fund, please see the table on page 4.
Institutional Class shares are not subject to a sales charge and are offered for sale exclusively to certain eligible investors. In addition, Institutional Class shares pay no distribution and service fee.
The performance of Class A shares excludes the applicable sales charge. The performance of both Institutional Class shares and Class A shares reflects the reinvestment of all distributions.
Please see page 7 for a description of the index. Index performance returns do not reflect any management fees, transaction costs, or expenses. Indices are unmanaged and one cannot invest directly in an index.
Investment objective
The Fund seeks maximum total return, consistent with reasonable risk.
Market review
There were significant changes in the macroeconomic backdrop during the fiscal year ended December 31, 2023. Geopolitical tensions escalated as the war in Ukraine continued and conflict in the Middle East erupted. Reshoring – the return of business operations from overseas – increased as trade restrictions intensified even as core inflation remained viscous.
Nonetheless, 2023’s market performance was the antithesis of 2022. Bond markets and equity returns were positive as fear of a US recession receded. The US economy proved resilient in the face of higher interest rates. The US Federal Reserve continued to aggressively tame inflation, which continued to run above target due to the abundance of fiscal and monetary stimulus injected into the economy during the height of the COVID-19 pandemic.
Additional fiscal spending during the year and consumers that drew down savings they had built up during the pandemic fueled spending.
Other factors that contributed to the economy’s resilience included a mortgage-market structure that diluted the cash-flow impact of higher short-term rates. Additionally, the corporate sector was healthy and successfully pushed out debt maturities during the low-yield environment of the past few years.
An inverted yield curve added credence to the belief that tighter credit conditions combined with higher rates would ultimately push economic growth into negative territory. Using history as our guide, sharp increases in the federal funds rate like those we have witnessed the last 20 months have usually been followed by a recession. There are some instances when a soft landing occurred such as the one former Fed Chair Alan Greenspan engineered during the mid-1990s. Even so, soft landings remain the exception rather than the rule.
The conflicts underway in Ukraine and the Middle East may have broad implications. The war in Ukraine initially had a significant impact on commodities, reverberating around the globe in 2022 and causing great hardship for many. As a result, central banks were inclined to maintain or tighten monetary policies further in 2023.
Portfolio management review
Delaware Limited-Term Diversified Income Fund
In the UK, inflation continued to run well above target while US prices declined more rapidly. Consequently, investors believed that the Fed was done raising rates and would commence an easing cycle in the coming months. That optimism led to looser financial conditions, creating a favorable environment for risk assets to perform well as interest rates declined from the highs reached in the fourth quarter. Meanwhile, standing apart from other central banks, the Bank of Japan continued to maintain ultra-easy monetary policy, including negative short-term rates, as it waits for concrete evidence of meaningful wage growth in an environment where uncertainty remains elevated.
US Treasury rates were volatile throughout the period, but mostly finished close to unchanged from the start of the period. The exception came at the short end, which was pushed higher by four separate Fed rate increases. The rate hikes amplified the inversion of the yield curve during the first half of the year. Credit markets performed well notwithstanding the intra-period rate volatility. Investors found higher yields sufficiently enticing to keep buying corporate credit and other risk assets for much of the year. The dollar see-sawed against major developed market currencies and finished close to unchanged.
Within the Fund
For the fiscal year ended December 31, 2023, Delaware Limited-Term Diversified Income Fund outperformed its benchmark, the Bloomberg 1-3 Year US Government/Credit Index. The Fund’s Institutional Class shares rose 5.31%. The Fund’s Class A shares increased 5.08% at net asset value and increased 2.17% at maximum offer price (both returns reflect all distributions reinvested). For the same period, the Fund’s benchmark rose 4.61%. For complete annualized performance of Delaware Limited-Term Diversified Income Fund, please see the table on page 4.
In early 2023 we continued to reduce the Fund’s exposure to investment grade corporate credit since valuations were near long-term averages and our macroeconomic assessment was that the economy would slow. The Fund’s sector allocation to BBB-rated bonds was its largest overweight credit tranche and contributed to the Fund’s yield advantage versus its benchmark. Within industrials, security selection contributed favorably to performance and included issuers such as Teledyne Technologies Inc., a provider of electronic subsystems and instrumentation. The Fund still holds Teledyne Technologies, in part because we believe there may be additional upside from a rating perspective. The Fund also benefited from exposure to Energy Transfer LP, a company engaged in transportation and storage of energy-related commodities.
Exposure to certain financial institutions, such as KeyBank N.A., a regional bank in the US, somewhat offset those gains. KeyBank experienced heightened volatility when a string of bank failures, including SVB Financial Group, Republic Bank, and Signature Bank, seemed to indicate that fundamental stress within the regional banking system could become systemic.
Out-of-benchmark exposure to collateralized loan obligations (CLOs) contributed to performance. These holdings were invested in the AAA-rated tranches, which we still believe represent value. Additional high-quality asset classes generating positive excess returns included an allocation to asset backed securities (ABS), agency mortgage-backed securities (MBS), and commercial mortgage-backed securities (CMBS).
The Fund’s exposure to emerging markets, both sovereigns and corporate credit, added performance overall. Examples of holdings include internet search-engine provider Baidu Inc. and Indonesian government-owned PT Pertamina, an oil and gas operator, which we sold due to valuation. Modest detractors from performance included sovereign exposure to the Republic of the Philippines and XP Inc., a financial services company serving customers in Brazil. We exited both positions during the fiscal year.
Yield curve management detracted modestly from performance. We generally maintained greater interest rate sensitivity in the portfolio than the overall benchmark.
At the end of the fiscal year, with a healthy dose of caution in mind, we made few changes in the positioning of the Fund. Over the course of the fiscal year, yields moved lower and risk premiums dropped below long-term historical averages. The Fed successfully cooled inflation from the highs of mid- 2022 without driving the US economy into a recession. Although the likelihood of a recession diminished, we continued to believe that the structural forces at play could still prevail over investors’ enthusiasm. The Fed’s rate-hike pause and pivot to potential future rate cuts induced interest rates and risk premiums to decline. Aggressive price action led many asset classes to trade higher than long-term historical averages.
More than 40% of the world’s population will hold national elections in 2024, according to Bloomberg. We think the election in the US, in particular, is likely to keep the world on edge, as major, global policy shifts could result. This, combined with worsening political polarization, could keep disruption risks elevated.
US fiscal spending continued at a torrid pace during this past fiscal year. However, with deficits reaching levels generally not witnessed outside of recessionary periods, the will of the fiscal hawks may be tested to avoid an economic slowdown.
We believe Fed Chair Jerome Powell and the Federal Open Market Committee (FOMC) deserve a fair amount of credit for the success of the current cycle of rate hikes, despite the policy errors of easy money coming out of the pandemic. Though many believe the US economy is likely to experience a “soft landing,” we think a recession is not off the table. Inverted yield curves combined with tighter lending standards historically have been an accurate predictor of looming economic contraction. We must ask ourselves: what happens to asset prices if a recession takes root after markets have effectively priced out the risk? For all these reasons, we think our cautious positioning of the Fund at fiscal year end is warranted.
Delaware Limited-Term Diversified Income Fund used derivatives, including interest rate futures, to risk manage the overall sensitivity of the Fund to changes in interest rates.
Performance summary
| Delaware Limited-Term Diversified Income Fund | December 31, 2023 (Unaudited) |
The performance quoted represents past performance and does not guarantee future results. Investment return and principal value of an investment will fluctuate so that shares, when redeemed, may be worth more or less than their original cost. Current performance may be lower or higher than the performance quoted. Performance data current to the most recent month end may be obtained by calling 800 523-1918 or visiting delawarefunds.com/performance.
| Fund and benchmark performance1,2 | Average annual total returns through December 31, 2023 |
| | 1 year | 5 year | 10 year | Lifetime |
| Class A (Est. November 24, 1985) | | | | |
| Excluding sales charge | +5.08% | +1.74% | +1.40% | — |
| Including sales charge | +2.17% | +1.18% | +1.12% | — |
| Class C (Est. November 28, 1995) | | | | |
| Excluding sales charge | +4.27% | +0.87% | +0.55% | — |
| Including sales charge | +3.27% | +0.87% | +0.55% | — |
| Class R (Est. June 2, 2003) | | | | |
| Excluding sales charge | +4.65% | +1.37% | +1.04% | — |
| Including sales charge | +4.65% | +1.37% | +1.04% | — |
| Institutional Class (Est. June 1, 1992) | | | | |
| Excluding sales charge | +5.31% | +1.91% | +1.56% | — |
| Including sales charge | +5.31% | +1.91% | +1.56% | — |
| Class R6 (Est. May 1, 2017) | | | | |
| Excluding sales charge | +5.37% | +1.95% | — | +1.51% |
| Including sales charge | +5.37% | +1.95% | — | +1.51% |
| Bloomberg 1-3 Year US Government/Credit Index | +4.61% | +1.51% | +1.27% | — |
1Returns reflect the reinvestment of all distributions and are presented both with and without the applicable sales charges described below. Returns do not reflect the deduction of taxes the shareholder would pay on Fund distributions or redemptions of Fund shares.
Expense limitations were in effect for certain classes during some or all of the periods shown in the “Fund and benchmark performance” table. Expenses for each class are listed in the “Fund expense ratios” table on page 6. Performance would have been lower had expense limitations not been in effect.
Class A shares are sold with a maximum front-end sales charge of 2.75%, and have an annual distribution and service (12b-1) fee of 0.25% of average daily net assets. Performance for Class A shares, excluding sales charges, assumes that no front-end sales charge applied.
Class C shares are sold with a contingent deferred sales charge (CDSC) of 1.00% if redeemed within one year of purchase. They are also subject to an annual 12b-1 fee of 1.00% of average daily net assets. Performance for Class C shares, excluding sales charges, assumes either that CDSCs did
not apply or that the investment was not redeemed.
Class R shares are available only for certain retirement plan products. They are sold without a sales charge and have an annual 12b-1 fee of 0.50% of average daily net assets.
Institutional Class shares are not subject to a sales charge and are offered for sale exclusively to certain eligible investors. In addition, Institutional Class shares pay no 12b-1 fee.
Class R6 shares are available only to certain investors. In addition, Class R6 shares do not pay any service fees, sub-accounting fees, and/or sub-transfer agency fees to any brokers, dealers, or other financial intermediaries. Class R6 shares pay no 12b-1 fee.
Fixed income securities and bond funds can lose value, and investors can lose principal as interest rates rise. They also may be affected by economic conditions that hinder an issuer’s ability to make interest and principal payments on its debt. This includes prepayment risk, the risk that the principal of a bond that is held by a portfolio will be prepaid prior to maturity at the time when interest rates are lower than what the bond was paying. A portfolio may then have to reinvest that money at a lower interest rate.
Interest payments on inflation-indexed debt securities will vary as the principal and/or interest is adjusted for inflation.
High yielding, non-investment-grade bonds (junk bonds) involve higher risk than investment grade bonds. The high yield secondary market is particularly susceptible to liquidity problems when institutional investors, such as mutual funds and certain other financial institutions, temporarily stop buying bonds for regulatory, financial, or other reasons. In addition, a less liquid secondary market makes it more difficult to obtain precise valuations of the high yield securities.
The Fund may invest in derivatives, which may involve additional expenses and are subject to risk, including the risk that an underlying security or securities index moves in the opposite direction from what the portfolio manager anticipated. A derivatives transaction depends upon the counterparties’ ability to fulfill their contractual obligations.
International investments entail risks including fluctuation in currency values, differences in accounting principles, or economic or political instability. Investing in emerging markets can be riskier than investing in established foreign markets due to increased volatility, lower trading volume, and higher risk of market closures. In many emerging markets, there is substantially less publicly available information and the available information may be incomplete or misleading. Legal claims are generally more difficult to pursue.
If and when the Fund invests in forward foreign currency contracts or uses other investments to hedge against currency risks, the Fund will be subject to special risks, including counterparty risk.
Diversification may not protect against market risk.
IBOR risk is the risk that changes related to the use of the London interbank offered rate (LIBOR) or similar rates (such as EONIA) could have adverse impacts on financial instruments that reference these rates. The abandonment of these rates and transition to alternative rates could affect the value and liquidity of instruments that reference them and could affect investment strategy performance.
Performance summary
Delaware Limited-Term Diversified Income Fund
The disruptions caused by natural disasters, pandemics, or similar events could prevent the Fund from executing advantageous investment decisions in a timely manner and could negatively impact the Fund’s ability to achieve its investment objective and the value of the Fund’s investments.
2The Fund’s expense ratios, as described in the most recent prospectus, are disclosed in the following “Fund expense ratios” table. The expense ratios below may differ from the expense ratios in the “Financial highlights” since they are based on different time periods and the expense ratios in the prospectus include acquired fund fees and expenses, if any. See Note 2 in “Notes to financial statements” for additional details. Please see the “Financial highlights” section in this report for the most recent expense ratios.
| | | | Institutional | |
| Fund expense ratios | Class A | Class C | Class R | Class | Class R6 |
| Total annual operating expenses (without fee waivers) | 0.96% | 1.71% | 1.21% | 0.71% | 0.65% |
| Net expenses (including fee waivers, if any) | 0.64% | 1.39% | 0.89% | 0.39% | 0.32% |
| Type of waiver | Contractual | Contractual | Contractual | Contractual | Contractual |
| | | | | | |
Performance of a $10,000 investment1
For the period December 31, 2013 through December 31, 2023
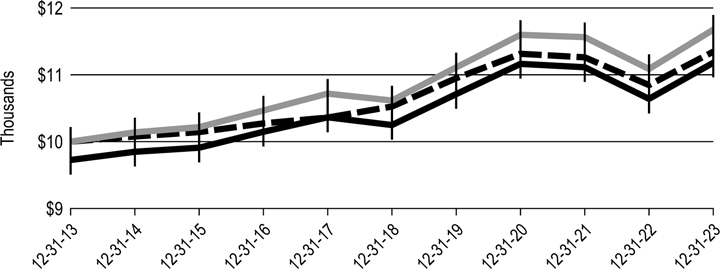
| | | Starting value | Ending value |
 | Delaware Limited-Term Diversified Income Fund − Institutional Class shares | $10,000 | $11,675 |
 | Bloomberg 1-3 Year US Government/Credit Index | $10,000 | $11,346 |
 | Delaware Limited-Term Diversified Income Fund − Class A shares | $ 9,725 | $11,180 |
1The “Performance of a $10,000 investment” graph assumes $10,000 invested in Institutional Class and Class A shares of the Fund on December 31, 2013, and includes the effect of a 2.75% front-end sales charge (for Class A shares) and the reinvestment of all distributions. The graph does not reflect the deduction of taxes the shareholders would pay on Fund distributions or redemptions of Fund shares. Expense limitations were in effect for some or all of the periods shown. Performance would have been lower had expense limitations not been in effect. Expenses are listed in the “Fund expense ratios” table on page 6. Please note additional details on pages 4 through 8.
The graph also assumes $10,000 invested in the Bloomberg 1-3 Year US Government/ Credit Index as of December 31, 2013. The Bloomberg 1-3 Year US Government/Credit Index is a market value-weighted index of government fixed-rate debt securities and investment grade US and foreign fixed-rate debt securities with average maturities of one to three years.
Index performance returns do not reflect any management fees, transaction costs, or expenses. Indices are unmanaged and one cannot invest directly in an index. Past performance does not guarantee future results.
Performance summary
Delaware Limited-Term Diversified Income Fund
Performance of other Fund classes will vary due to different charges and expenses.
| | Nasdaq symbols | CUSIPs |
| Class A | DTRIX | 245912308 |
| Class C | DTICX | 245912704 |
| Class R | DLTRX | 245912803 |
| Institutional Class | DTINX | 245912506 |
| Class R6 | DLTZX | 245912886 |
Disclosure of Fund expenses
For the six-month period from July 1, 2023 to December 31, 2023 (Unaudited)
As a shareholder of the Fund, you incur two types of costs: (1) transaction costs, including sales charges (loads) on purchase payments, reinvested dividends, or other distributions; redemption fees; and exchange fees; and (2) ongoing costs, including management fees; distribution and service (12b-1) fees; and other Fund expenses. This example is intended to help you understand your ongoing costs (in dollars) of investing in the Fund and to compare these costs with the ongoing costs of investing in other mutual funds.
The example is based on an investment of $1,000 invested at the beginning of the period and held for the entire six-month period from July 1, 2023 to December 31, 2023.
Actual expenses
The first section of the table shown, “Actual Fund return,” provides information about actual account values and actual expenses. You may use the information in this section of the table, together with the amount you invested, to estimate the expenses that you paid over the period. Simply divide your account value by $1,000 (for example, an $8,600 account value divided by $1,000 = 8.6), then multiply the result by the number in the first section under the heading entitled “Expenses Paid During Period” to estimate the expenses you paid on your account during this period.
Hypothetical example for comparison purposes
The second section of the table shown, “Hypothetical 5% return,” provides information about hypothetical account values and hypothetical expenses based on the Fund’s actual expense ratio and an assumed rate of return of 5% per year before expenses, which is not the Fund’s actual return. The hypothetical account values and expenses may not be used to estimate the actual ending account balance or expenses you paid for the period. You may use this information to compare the ongoing costs of investing in the Fund and other funds. To do so, compare this 5% hypothetical example with the 5% hypothetical examples that appear in the shareholder reports of the other funds.
Please note that the expenses shown in the table are meant to highlight your ongoing costs only and do not reflect any transactional costs, such as sales charges (loads), redemption fees, or exchange fees. Therefore, the second section of the table is useful in comparing ongoing costs only, and will not help you determine the relative total costs of owning different funds. In addition, if these transactional costs were included, your costs would have been higher. The Fund's expenses shown in the table reflect fee waivers in effect and assume reinvestment of all dividends and distributions.
Disclosure of Fund expenses
For the six-month period from July 1, 2023 to December 31, 2023 (Unaudited)
Delaware Limited-Term Diversified Income Fund
Expense analysis of an investment of $1,000
| | Beginning
Account Value | Ending
Account Value | Annualized | Expenses
Paid During Period |
| | 7/1/23 | 12/31/23 | Expense Ratio | 7/1/23 to 12/31/23* |
| Actual Fund return† | | | | |
| Class A | $1,000.00 | $1,036.40 | 0.64% | $3.29 |
| Class C | 1,000.00 | 1,032.50 | 1.39% | 7.12 |
| Class R | 1,000.00 | 1,033.70 | 0.89% | 4.56 |
| Institutional Class | 1,000.00 | 1,039.00 | 0.39% | 2.00 |
| Class R6 | 1,000.00 | 1,038.00 | 0.32% | 1.64 |
| Hypothetical 5% return (5% return before expenses) | | | |
| Class A | $1,000.00 | $1,021.98 | 0.64% | $3.26 |
| Class C | 1,000.00 | 1,018.20 | 1.39% | 7.07 |
| Class R | 1,000.00 | 1,020.72 | 0.89% | 4.53 |
| Institutional Class | 1,000.00 | 1,023.24 | 0.39% | 1.99 |
| Class R6 | 1,000.00 | 1,023.59 | 0.32% | 1.63 |
*“Expenses Paid During Period” are equal to the Fund's annualized expense ratio, multiplied by the average account value over the period, multiplied by 184/365 (to reflect the one-half year period).
†Because actual returns reflect only the most recent six-month period, the returns shown may differ significantly from fiscal year returns.
In addition to the Fund’s expenses reflected above, the Fund also indirectly bears its portion of the fees and expenses of any investment companies (Underlying Funds), in which it invests. The table above does not reflect the expenses of any Underlying Funds.
Security type / sector allocations
| Delaware Limited-Term Diversified Income Fund | As of December 31, 2023 (Unaudited) |
Sector designations may be different from the sector designations presented in other Fund materials. The sector designations may represent the investment manager’s internal sector classifications, which may result in the sector designations for one fund being different from another fund's sector designations.
| Security type / sector | Percentage of net assets |
| Agency Collateralized Mortgage Obligations | 1.22% |
| Agency Commercial Mortgage-Backed Securities | 3.56% |
| Agency Mortgage-Backed Securities | 2.55% |
| Collateralized Debt Obligations | 5.45% |
| Corporate Bonds | 46.01% |
| Banking | 13.21% |
| Basic Industry | 0.95% |
| Brokerage | 0.07% |
| Capital Goods | 4.70% |
| Communications | 4.11% |
| Consumer Cyclical | 1.92% |
| Consumer Non-Cyclical | 3.01% |
| Electric | 4.32% |
| Energy | 2.95% |
| Finance Companies | 2.10% |
| Industrials | 0.07% |
| Insurance | 4.14% |
| Natural Gas | 0.21% |
| Real Estate Investment Trusts | 1.88% |
| Technology | 1.90% |
| Transportation | 0.47% |
| Government Agency Obligations | 0.76% |
| Non-Agency Asset-Backed Securities | 11.27% |
| Non-Agency Collateralized Mortgage Obligations | 1.18% |
| Sovereign Bonds | 0.05% |
| US Treasury Obligations | 26.13% |
| Short-Term Investments | 6.63% |
| Total Value of Securities | 104.81% |
| Liabilities Net of Receivables and Other Assets | (4.81)% |
| Total Net Assets | 100.00% |
Schedule of investments
| Delaware Limited-Term Diversified Income Fund | December 31, 2023 |
| | | Principal | | | | |
| | | amount° | | | Value (US $) | |
| Agency Collateralized Mortgage Obligations — 1.22% | | | | | | | | |
| Connecticut Avenue Securities Trust | | | | | | | | |
| Series 2023-R08 1M1 144A 6.837% (SOFR + 1.50%) 10/25/43 #, • | | | 1,917,975 | | | $ | 1,922,179 | |
| Fannie Mae Grantor Trust Series 2001-T5 A2 7.00% 6/19/41 • | | | 12,392 | | | | 12,707 | |
| Freddie Mac REMIC Series 5092 WG 1.00% 4/25/31 | | | 4,222,687 | | | | 3,712,159 | |
| Freddie Mac Structured Agency Credit Risk REMIC Trust | | | | | | | | |
| Series 2021-DNA3 M1 144A 6.087% (SOFR + 0.75%) 10/25/33 #, • | | | 328,076 | | | | 327,135 | |
| Series 2021-HQA2 M1 144A 6.037% (SOFR + 0.70%) 12/25/33 #, • | | | 77,411 | | | | 77,201 | |
| Series 2023-HQA3 A1 144A 7.187% (SOFR + 1.85%) 11/25/43 #, • | | | 1,686,720 | | | | 1,698,758 | |
| Freddie Mac Structured Pass Through Certificates | | | | | | | | |
| Series T-30 A5 8.61% 12/25/30 ¨, ~ | | | 2,262 | | | | 2,170 | |
| Series T-54 2A 6.50% 2/25/43 ¨ | | | 469 | | | | 486 | |
| Series T-58 2A 6.50% 9/25/43 ¨ | | | 211,144 | | | | 214,071 | |
| GNMA | | | | | | | | |
| Series 2012-39 PA 2.00% 3/16/42 | | | 1,352,425 | | | | 1,235,063 | |
| Series 2015-151 KC 3.50% 4/20/34 | | | 560,730 | | | | 540,623 | |
| Total Agency Collateralized Mortgage Obligations | | | | | | | | |
| (cost $9,079,966) | | | | | | | 9,742,552 | |
| | | | | | | | | |
| Agency Commercial Mortgage-Backed Securities — 3.56% | | | | | | | | |
| Freddie Mac Multifamily Structured Pass Through Certificates | | | | | | | | |
| Series K729 A2 3.136% 10/25/24 ¨ | | | 2,000,000 | | | | 1,966,815 | |
| Series K734 A1 3.139% 6/25/25 ¨ | | | 1,577,665 | | | | 1,553,202 | |
| FREMF Mortgage Trust | | | | | | | | |
| Series 2015-KF12 B 144A 12.545% (SOFR + 7.21%, Floor 7.10%) 9/25/22 #, • | | | 2,284,181 | | | | 2,270,005 | |
| Series 2017-K728 C 144A 3.723% 11/25/50 #, • | | | 910,000 | | | | 890,642 | |
| Series 2017-KF33 B 144A 7.995% (SOFR + 2.66%, Floor 2.55%) 6/25/27 #, • | | | 968,036 | | | | 898,054 | |
| Series 2017-KF39 B 144A 7.945% (SOFR + 2.61%, Floor 2.50%) 11/25/24 #, • | | | 1,852,558 | | | | 1,823,491 | |
| Series 2017-KF40 B 144A 8.145% (SOFR + 2.81%, Floor 2.70%) 11/25/27 #, • | | | 1,447,006 | | | | 1,338,987 | |
| Series 2018-K732 B 144A 4.056% 5/25/25 #, • | | | 985,000 | | | | 960,193 | |
| Series 2018-KF46 B 144A 7.395% (SOFR + 2.06%, Floor 1.95%) 3/25/28 #, • | | | 1,423,361 | | | | 1,304,200 | |
| Series 2018-KF47 B 144A 7.445% (SOFR + 2.11%, Floor 2.00%) 5/25/25 #, • | | | 989,299 | | | | 963,661 | |
| | | Principal | | | | |
| | | amount° | | | Value (US $) | |
| Agency Commercial Mortgage-Backed Securities (continued) | | | | | | |
| FREMF Mortgage Trust | | | | | | | | |
| Series 2018-KF48 B 144A 7.495% (SOFR + 2.16%, Floor 2.05%) 6/25/28 #, • | | | 798,326 | | | $ | 714,580 | |
| Series 2018-KF49 B 144A 7.345% (SOFR + 2.01%, Floor 1.90%) 6/25/25 #, • | | | 837,687 | | | | 808,227 | |
| Series 2018-KF51 B 144A 7.295% (SOFR + 1.96%, Floor 1.85%) 8/25/25 #, • | | | 2,421,495 | | | | 2,345,250 | |
| Series 2019-KF60 B 144A 7.795% (SOFR + 2.46%, Floor 2.35%) 2/25/26 #, • | | | 2,638,635 | | | | 2,537,250 | |
| Series 2019-KF61 B 144A 7.645% (SOFR + 2.31%, Floor 2.20%) 4/25/29 #, • | | | 924,201 | | | | 832,224 | |
| Series 2019-KF68 B 144A 7.645% (SOFR + 2.31%, Floor 2.20%) 7/25/26 #, • | | | 1,819,395 | | | | 1,727,527 | |
| Series 2019-KF69 B 144A 7.745% (SOFR + 2.41%, Floor 2.30%) 8/25/29 #, • | | | 1,062,100 | | | | 969,829 | |
| Series 2019-KF70 B 144A 7.745% (SOFR + 2.41%, Floor 2.30%) 9/25/29 #, • | | | 977,364 | | | | 904,312 | |
| Series 2019-KF73 B 144A 7.895% (SOFR + 2.56%, Floor 2.45%) 11/25/29 #, • | | | 2,022,964 | | | | 1,873,252 | |
| Series 2020-KF74 B 144A 7.595% (SOFR + 2.26%, Floor 2.15%) 1/25/27 #, • | | | 872,290 | | | | 831,575 | |
| Series 2020-KF75 B 144A 7.695% (SOFR + 2.36%, Floor 2.25%) 12/25/29 #, • | | | 1,025,590 | | | | 931,397 | |
| Total Agency Commercial Mortgage-Backed Securities | | | | | | | | |
| (cost $30,015,738) | | | | | | | 28,444,673 | |
| | | | | | | | | |
| Agency Mortgage-Backed Securities — 2.55% | | | | | | | | |
| Fannie Mae | | | | | | | | |
| 3.50% 10/1/42 | | | 556,470 | | | | 522,780 | |
| Fannie Mae S.F. 15 yr | | | | | | | | |
| 2.00% 4/1/36 | | | 1,000,841 | | | | 902,849 | |
| 2.50% 11/1/35 | | | 1,267,442 | | | | 1,176,207 | |
| 2.50% 8/1/36 | | | 797,549 | | | | 734,264 | |
| 4.50% 9/1/37 | | | 61,596 | | | | 61,274 | |
| Fannie Mae S.F. 20 yr | | | | | | | | |
| 4.00% 9/1/42 | | | 97,112 | | | | 93,104 | |
| Fannie Mae S.F. 30 yr | | | | | | | | |
| 3.50% 7/1/47 | | | 100,070 | | | | 94,469 | |
| 3.50% 2/1/48 | | | 151,740 | | | | 142,164 | |
| 3.50% 11/1/48 | | | 203,022 | | | | 189,472 | |
| 3.50% 3/1/50 | | | 24,975 | | | | 23,384 | |
| 3.50% 8/1/50 | | | 43,689 | | | | 40,774 | |
Schedule of investments
Delaware Limited-Term Diversified Income Fund
| | | Principal | | | | |
| | | amount° | | | Value (US $) | |
| Agency Mortgage-Backed Securities (continued) | | | | | | | | |
| Fannie Mae S.F. 30 yr | | | | | | | | |
| 3.50% 9/1/50 | | | 558,142 | | | $ | 522,538 | |
| 3.50% 6/1/51 | | | 440,892 | | | | 406,591 | |
| 3.50% 1/1/52 | | | 187,773 | | | | 172,457 | |
| 4.00% 6/1/48 | | | 99,173 | | | | 95,578 | |
| 4.00% 10/1/48 | | | 673,498 | | | | 649,528 | |
| 4.00% 9/1/52 | | | 127,627 | | | | 120,718 | |
| 4.50% 1/1/50 | | | 3,132,904 | | | | 3,128,251 | |
| 4.50% 4/1/50 | | | 781,915 | | | | 770,844 | |
| 4.50% 2/1/53 | | | 275,770 | | | | 267,403 | |
| 5.00% 7/1/47 | | | 2,665,787 | | | | 2,708,928 | |
| 5.00% 5/1/48 | | | 212,101 | | | | 213,832 | |
| 5.00% 8/1/49 | | | 990,302 | | | | 1,000,260 | |
| 5.50% 5/1/44 | | | 1,769,411 | | | | 1,822,185 | |
| 6.00% 1/1/42 | | | 1,188,147 | | | | 1,241,171 | |
| 6.00% 12/1/52 | | | 173,618 | | | | 176,684 | |
| Freddie Mac S.F. 15 yr | | | | | | | | |
| 3.00% 3/1/35 | | | 336,349 | | | | 319,004 | |
| 3.50% 1/1/29 | | | 494,738 | | | | 482,760 | |
| Freddie Mac S.F. 20 yr | | | | | | | | |
| 2.50% 9/1/42 | | | 496,084 | | | | 441,100 | |
| 3.00% 9/1/40 | | | 205,436 | | | | 189,387 | |
| Freddie Mac S.F. 30 yr | | | | | | | | |
| 4.00% 4/1/52 | | | 186,693 | | | | 176,513 | |
| 4.50% 8/1/48 | | | 461,237 | | | | 455,531 | |
| 6.00% 1/1/53 | | | 986,165 | | | | 1,017,253 | |
| Total Agency Mortgage-Backed Securities | | | | | | | | |
| (cost $22,019,429) | | | | | | | 20,359,257 | |
| | | | | | | | | |
| Collateralized Debt Obligations — 5.45% | | | | | | | | |
| Ballyrock CLO Series 2018-1A A1 144A 6.677% (TSFR03M + 1.26%) 4/20/31 #, • | | | 2,327,659 | | | | 2,323,969 | |
| Benefit Street Partners CLO IX Series 2016-9A AR 144A 6.787% (TSFR03M + 1.37%) 7/20/31 #, • | | | 488,784 | | | | 488,650 | |
| BlueMountain CLO XXX Series 2020-30A AR 144A 6.764% (TSFR03M + 1.37%, Floor 1.37%) 4/15/35 #, • | | | 3,000,000 | | | | 2,981,277 | |
| Canyon Capital CLO Series 2019-2A AR 144A 6.835% (TSFR03M + 1.44%, Floor 1.18%) 10/15/34 #, • | | | 2,800,000 | | | | 2,784,096 | |
| Carlyle Global Market Strategies CLO | | | | | | | | |
| Series 2014-2RA A1 144A 6.691% (TSFR03M + 1.31%) 5/15/31 #, • | | | 917,390 | | | | 915,985 | |
| | | Principal | | | | |
| | | amount° | | | Value (US $) | |
| Collateralized Debt Obligations (continued) | | | | | | |
| CBAM Series 2020-13A A 144A 7.107% (TSFR03M + 1.69%, Floor 1.43%) 1/20/34 #, • | | | 3,000,000 | | | $ | 2,998,512 | |
| Cedar Funding IX CLO Series 2018-9A A1 144A 6.657% (TSFR03M + 1.24%, Floor 0.98%) 4/20/31 #, • | | | 1,475,443 | | | | 1,472,532 | |
| Dryden 77 CLO Series 2020-77A AR 144A 6.749% (TSFR03M + 1.38%, Floor 1.38%) 5/20/34 #, • | | | 2,600,000 | | | | 2,591,566 | |
| Golub Capital Partners CLO 50B-R Series 2020-50A A1R 144A 6.786% (TSFR03M + 1.37%, Floor 1.37%) 4/20/35 #, • | | | 5,000,000 | | | | 4,960,690 | |
| KKR CLO 41 Series 2022-41A A1 144A 6.724% (TSFR03M + 1.33%, Floor 1.33%) 4/15/35 #, • | | | 5,000,000 | | | | 4,966,415 | |
| PPM CLO 3 Series 2019-3A AR 144A 6.754% (TSFR03M + 1.35%, Floor 1.09%) 4/17/34 #, • | | | 3,750,000 | | | | 3,712,586 | |
| Sound Point CLO XXI Series 2018-3A A1A 144A 6.821% (TSFR03M + 1.44%, Floor 1.18%) 10/26/31 #, • | | | 3,200,000 | | | | 3,201,696 | |
| Sound Point CLO XXV Series 2019-4A A1R 144A 6.658% (TSFR03M + 1.28%, Floor 1.28%) 4/25/33 #, • | | | 5,000,000 | | | | 4,965,900 | |
| TRESTLES CLO V Series 2021-5A A1 144A 6.847% (TSFR03M + 1.43%, Floor 1.17%) 10/20/34 #, • | | | 2,500,000 | | | | 2,491,400 | |
| Venture 34 CLO Series 2018-34A A 144A 6.885% (TSFR03M + 1.49%, Floor 1.23%) 10/15/31 #, • | | | 700,000 | | | | 696,763 | |
| Zais CLO 16 Series 2020-16A A1R 144A 7.097% (TSFR03M + 1.68%, Floor 1.68%) 10/20/34 #, • | | | 2,000,000 | | | | 1,999,040 | |
| Total Collateralized Debt Obligations | | | | | | | | |
| (cost $43,604,318) | | | | | | | 43,551,077 | |
| | | | | | | | | |
| Corporate Bonds — 46.01% | | | | | | | | |
| Banking — 13.21% | | | | | | | | |
| Banco Continental 144A 2.75% 12/10/25 # | | | 200,000 | | | | 187,799 | |
| Banco de Credito e Inversiones 144A 3.50% 10/12/27 # | | | 300,000 | | | | 283,969 | |
| Banco Internacional del Peru 144A 3.25% 10/4/26 # | | | 200,000 | | | | 188,864 | |
| Banco Santander 5.588% 8/8/28 | | | 800,000 | | | | 816,561 | |
| Banco Santander Mexico 144A 7.525% 10/1/28 #, m | | | 200,000 | | | | 209,460 | |
| Bank Leumi Le-Israel 144A 5.125% 7/27/27 # | | | 200,000 | | | | 197,179 | |
| Bank of America | | | | | | | | |
| 1.843% 2/4/25 m | | | 3,125,000 | | | | 3,113,062 | |
| 3.458% 3/15/25 m | | | 4,345,000 | | | | 4,324,922 | |
| 4.125% 1/22/24 | | | 3,000,000 | | | | 2,997,667 | |
| 4.20% 8/26/24 | | | 3,675,000 | | | | 3,642,243 | |
| 5.819% 9/15/29 m | | | 595,000 | | | | 614,572 | |
| 5.826% 6/14/24 • | | | 2,175,000 | | | | 2,172,081 | |
| 6.204% 11/10/28 m | | | 75,000 | | | | 78,282 | |
Schedule of investments
Delaware Limited-Term Diversified Income Fund
| | | Principal | | | | |
| | | amount° | | | Value (US $) | |
| Corporate Bonds (continued) | | | | | | |
| Banking (continued) | | | | | | | | |
| Bank of New York Mellon 5.802% 10/25/28 m | | | 2,064,000 | | | $ | 2,141,130 | |
| Barclays 7.385% 11/2/28 m | | | 550,000 | | | | 588,117 | |
| BBVA Bancomer 144A 1.875% 9/18/25 # | | | 200,000 | | | | 188,888 | |
| Citibank 5.488% 12/4/26 | | | 825,000 | | | | 840,163 | |
| Citigroup | | | | | | | | |
| 1.281% 11/3/25 m | | | 1,960,000 | | | | 1,886,382 | |
| 2.014% 1/25/26 m | | | 1,600,000 | | | | 1,538,184 | |
| 5.50% 9/13/25 | | | 1,900,000 | | | | 1,909,698 | |
| Citizens Bank | | | | | | | | |
| 4.119% 5/23/25 m | | | 5,990,000 | | | | 5,847,350 | |
| 6.064% 10/24/25 m | | | 1,935,000 | | | | 1,888,366 | |
| Credicorp 144A 2.75% 6/17/25 # | | | 200,000 | | | | 190,805 | |
| Credit Suisse 7.95% 1/9/25 | | | 600,000 | | | | 613,659 | |
| Deutsche Bank | | | | | | | | |
| 6.72% 1/18/29 m | | | 724,000 | | | | 758,602 | |
| 6.819% 11/20/29 m | | | 1,170,000 | | | | 1,232,578 | |
| 7.146% 7/13/27 m | | | 925,000 | | | | 960,656 | |
| Fifth Third Bank 5.852% 10/27/25 m | | | 3,160,000 | | | | 3,152,774 | |
| Goldman Sachs Group | | | | | | | | |
| 1.542% 9/10/27 m | | | 179,000 | | | | 162,428 | |
| 3.85% 7/8/24 | | | 3,190,000 | | | | 3,162,122 | |
| 4.25% 10/21/25 | | | 3,234,000 | | | | 3,176,263 | |
| 5.859% (SOFR + 0.49%) 10/21/24 • | | | 3,535,000 | | | | 3,531,035 | |
| 6.20% (SOFR + 0.79%) 12/9/26 • | | | 3,700,000 | | | | 3,665,084 | |
| 6.22% (SOFR + 0.81%) 3/9/27 • | | | 4,905,000 | | | | 4,834,614 | |
| HSBC Holdings 5.887% 8/14/27 m | | | 565,000 | | | | 573,079 | |
| Huntington National Bank | | | | | | | | |
| 4.008% 5/16/25 m | | | 3,390,000 | | | | 3,340,228 | |
| 5.65% 1/10/30 | | | 750,000 | | | | 757,206 | |
| ICICI Bank 144A 4.00% 3/18/26 # | | | 200,000 | | | | 195,684 | |
| ING Groep 6.083% 9/11/27 m | | | 655,000 | | | | 668,878 | |
| JPMorgan Chase & Co. | | | | | | | | |
| 3.875% 9/10/24 | | | 2,542,000 | | | | 2,514,931 | |
| 4.08% 4/26/26 m | | | 6,515,000 | | | | 6,412,394 | |
| 6.258% (SOFR + 0.885%) 4/22/27 • | | | 955,000 | | | | 953,671 | |
| KeyBank | | | | | | | | |
| 4.15% 8/8/25 | | | 3,020,000 | | | | 2,929,323 | |
| 5.85% 11/15/27 | | | 465,000 | | | | 464,997 | |
| KeyCorp 3.878% 5/23/25 m | | | 2,895,000 | | | | 2,830,890 | |
| | | Principal | | | | |
| | | amount° | | | Value (US $) | |
| Corporate Bonds (continued) | | | | | | |
| Banking (continued) | | | | | | | | |
| Morgan Stanley | | | | | | | | |
| 6.138% 10/16/26 m | | | 10,465,000 | | | $ | 10,661,389 | |
| 6.296% 10/18/28 m | | | 1,534,000 | | | | 1,607,759 | |
| NBK SPC 144A 1.625% 9/15/27 #, m | | | 200,000 | | | | 181,337 | |
| Oversea-Chinese Banking 144A 4.25% 6/19/24 # | | | 200,000 | | | | 198,812 | |
| Popular 7.25% 3/13/28 | | | 675,000 | | | | 695,152 | |
| Shinhan Bank 3.875% 3/24/26 | | | 300,000 | | | | 290,026 | |
| Truist Bank 2.636% 9/17/29 m | | | 2,480,000 | | | | 2,309,004 | |
| Truist Financial 7.161% 10/30/29 m | | | 355,000 | | | | 383,668 | |
| US Bancorp | | | | | | | | |
| 4.653% 2/1/29 m | | | 84,000 | | | | 82,725 | |
| 5.727% 10/21/26 m | | | 107,000 | | | | 107,771 | |
| 6.787% 10/26/27 m | | | 1,330,000 | | | | 1,389,258 | |
| Wells Fargo & Co. 3.908% 4/25/26 m | | | 3,515,000 | | | | 3,447,554 | |
| Wells Fargo Bank 5.254% 12/11/26 | | | 1,410,000 | | | | 1,427,775 | |
| | | | | | | | 105,519,070 | |
| Basic Industry — 0.95% | | | | | | | | |
| Anglo American Capital 144A 4.00% 9/11/27 # | | | 200,000 | | | | 192,307 | |
| Avient 144A 5.75% 5/15/25 # | | | 1,325,000 | | | | 1,326,377 | |
| Celanese US Holdings | | | | | | | | |
| 6.05% 3/15/25 | | | 149,000 | | | | 150,019 | |
| 6.165% 7/15/27 | | | 1,885,000 | | | | 1,933,859 | |
| Graphic Packaging International 144A 0.821% 4/15/24 # | | | 3,650,000 | | | | 3,601,586 | |
| Sasol Financing USA 4.375% 9/18/26 | | | 200,000 | | | | 186,479 | |
| Suzano Austria 144A 5.75% 7/14/26 # | | | 200,000 | | | | 201,988 | |
| | | | | | | | 7,592,615 | |
| Brokerage — 0.07% | | | | | | | | |
| Jefferies Financial Group 5.875% 7/21/28 | | | 505,000 | | | | 518,132 | |
| | | | | | | | 518,132 | |
| Capital Goods — 4.70% | | | | | | | | |
| Boeing 2.196% 2/4/26 | | | 1,490,000 | | | | 1,408,139 | |
| Carrier Global 144A 5.80% 11/30/25 # | | | 3,035,000 | | | | 3,076,726 | |
| General Electric 5.012% 1/1/24 | | | 1,059,067 | | | | 1,059,067 | |
| Lennox International 1.35% 8/1/25 | | | 3,925,000 | | | | 3,696,106 | |
| Mauser Packaging Solutions Holding 144A 7.875% 8/15/26 # | | | 4,110,000 | | | | 4,186,368 | |
| Parker-Hannifin | | | | | | | | |
| 3.65% 6/15/24 | | | 5,265,000 | | | | 5,216,149 | |
| 4.25% 9/15/27 | | | 3,875,000 | | | | 3,843,424 | |
| Republic Services 0.875% 11/15/25 | | | 2,200,000 | | | | 2,039,393 | |
Schedule of investments
Delaware Limited-Term Diversified Income Fund
| | | Principal | | | | |
| | | amount° | | | Value (US $) | |
| Corporate Bonds (continued) | | | | | | |
| Capital Goods (continued) | | | | | | | | |
| RTX 5.75% 11/8/26 | | | 1,298,000 | | | $ | 1,334,139 | |
| SAN Miguel Industrias 144A 3.50% 8/2/28 # | | | 200,000 | | | | 172,205 | |
| Teledyne Technologies 0.95% 4/1/24 | | | 5,745,000 | | | | 5,680,106 | |
| TransDigm 144A 6.25% 3/15/26 # | | | 4,705,000 | | | | 4,701,647 | |
| Turkiye Sise ve Cam Fabrikalari 144A 6.95% 3/14/26 # | | | 200,000 | | | | 199,732 | |
| WESCO Distribution 144A 7.125% 6/15/25 # | | | 886,000 | | | | 893,125 | |
| | | | | | | | 37,506,326 | |
| Communications — 4.11% | | | | | | | | |
| AT&T 1.70% 3/25/26 | | | 2,640,000 | | | | 2,470,500 | |
| Charter Communications Operating 6.15% 11/10/26 | | | 5,530,000 | | | | 5,655,043 | |
| Clear Channel International 144A 6.625% 8/1/25 # | | | 675,000 | | | | 678,808 | |
| Crown Castle 1.05% 7/15/26 | | | 1,750,000 | | | | 1,579,841 | |
| Crown Castle Towers 144A 3.663% 5/15/45 # | | | 2,050,000 | | | | 1,988,944 | |
| Netflix 5.875% 2/15/25 | | | 3,750,000 | | | | 3,783,169 | |
| Prosus 144A 3.257% 1/19/27 # | | | 200,000 | | | | 184,873 | |
| Sprint Spectrum 144A 4.738% 9/20/29 # | | | 140,625 | | | | 139,479 | |
| T-Mobile USA 3.75% 4/15/27 | | | 4,010,000 | | | | 3,890,615 | |
| Verizon Communications | | | | | | | | |
| 0.75% 3/22/24 | | | 3,135,000 | | | | 3,101,695 | |
| 1.45% 3/20/26 | | | 2,200,000 | | | | 2,049,844 | |
| Warnermedia Holdings | | | | | | | | |
| 3.638% 3/15/25 | | | 6,180,000 | | | | 6,049,112 | |
| 6.412% 3/15/26 | | | 1,250,000 | | | | 1,250,922 | |
| | | | | | | | 32,822,845 | |
| Consumer Cyclical — 1.92% | | | | | | | | |
| Alsea 144A 7.75% 12/14/26 # | | | 200,000 | | | | 204,415 | |
| Aptiv 2.396% 2/18/25 | | | 4,125,000 | | | | 3,991,578 | |
| Carnival 144A 7.625% 3/1/26 # | | | 662,000 | | | | 674,383 | |
| Ford Motor Credit | | | | | | | | |
| 2.30% 2/10/25 | | | 435,000 | | | | 418,632 | |
| 2.70% 8/10/26 | | | 1,700,000 | | | | 1,575,278 | |
| 3.375% 11/13/25 | | | 4,130,000 | | | | 3,953,992 | |
| 6.798% 11/7/28 | | | 525,000 | | | | 549,669 | |
| 6.95% 6/10/26 | | | 350,000 | | | | 359,258 | |
| Mercedes-Benz Finance North America 144A 5.10% 8/3/28 # | | | 1,370,000 | | | | 1,397,459 | |
| Prime Security Services Borrower 144A 5.25% 4/15/24 # | | | 134,000 | | | | 133,254 | |
| VICI Properties 4.95% 2/15/30 | | | 2,140,000 | | | | 2,078,603 | |
| | | | | | | | 15,336,521 | |
| | | Principal | | | | |
| | | amount° | | | Value (US $) | |
| Corporate Bonds (continued) | | | | | | | | |
| Consumer Non-Cyclical — 3.01% | | | | | | | | |
| AbbVie 2.60% 11/21/24 | | | 3,625,000 | | | $ | 3,543,073 | |
| Amgen 5.15% 3/2/28 | | | 3,105,000 | | | | 3,180,025 | |
| InRetail Consumer 144A 3.25% 3/22/28 # | | | 200,000 | | | | 179,647 | |
| McCormick & Co. 0.90% 2/15/26 | | | 2,975,000 | | | | 2,739,982 | |
| Medtronic Global Holdings 4.25% 3/30/28 | | | 1,775,000 | | | | 1,768,222 | |
| Mondelez International 1.50% 5/4/25 | | | 1,210,000 | | | | 1,154,451 | |
| Pfizer Investment Enterprises 4.45% 5/19/28 | | | 1,610,000 | | | | 1,609,767 | |
| Royalty Pharma 1.20% 9/2/25 | | | 7,630,000 | | | | 7,122,785 | |
| Tenet Healthcare 4.875% 1/1/26 | | | 2,500,000 | | | | 2,473,593 | |
| Teva Pharmaceutical Finance Netherlands III 4.75% 5/9/27 | | | 250,000 | | | | 239,688 | |
| | | | | | | | 24,011,233 | |
| Electric — 4.32% | | | | | | | | |
| Avangrid 3.20% 4/15/25 | | | 885,000 | | | | 860,398 | |
| CenterPoint Energy 6.042% (SOFR + 0.65%) 5/13/24 • | | | 1,589,000 | | | | 1,589,023 | |
| Colbun 144A 3.95% 10/11/27 # | | | 200,000 | | | | 191,945 | |
| Duke Energy 4.875% 9/16/24 m, y | | | 790,000 | | | | 779,798 | |
| Duke Energy Carolinas 3.95% 11/15/28 | | | 3,400,000 | | | | 3,350,736 | |
| Edison International 3.55% 11/15/24 | | | 3,700,000 | | | | 3,633,975 | |
| Metropolitan Edison 144A 5.20% 4/1/28 # | | | 2,300,000 | | | | 2,319,737 | |
| National Rural Utilities Cooperative Finance | | | | | | | | |
| 1.875% 2/7/25 | | | 4,350,000 | | | | 4,201,612 | |
| 4.45% 3/13/26 | | | 1,080,000 | | | | 1,078,838 | |
| NextEra Energy Capital Holdings | | | | | | | | |
| 5.749% 9/1/25 | | | 245,000 | | | | 247,414 | |
| 6.051% 3/1/25 | | | 545,000 | | | | 550,194 | |
| NRG Energy 144A 3.75% 6/15/24 # | | | 1,260,000 | | | | 1,245,768 | |
| Southern 4.85% 6/15/28 | | | 3,210,000 | | | | 3,236,191 | |
| Southern California Edison 1.10% 4/1/24 | | | 4,155,000 | | | | 4,109,837 | |
| Vistra Operations | | | | | | | | |
| 144A 3.55% 7/15/24 # | | | 2,825,000 | | | | 2,785,959 | |
| 144A 5.125% 5/13/25 # | | | 1,495,000 | | | | 1,481,396 | |
| WEC Energy Group 0.80% 3/15/24 | | | 2,895,000 | | | | 2,865,845 | |
| | | | | | | | 34,528,666 | |
| Energy — 2.95% | | | | | | | | |
| ConocoPhillips 2.40% 3/7/25 | | | 149,000 | | | | 144,836 | |
| Enbridge 2.50% 2/14/25 | | | 1,040,000 | | | | 1,009,252 | |
| Energean Israel Finance 144A 4.875% 3/30/26 # | | | 200,000 | | | | 184,850 | |
Schedule of investments
Delaware Limited-Term Diversified Income Fund
| | | Principal | | | | |
| | | amount° | | | Value (US $) | |
| Corporate Bonds (continued) | | | | | | | | |
| Energy (continued) | | | | | | | | |
| Energy Transfer | | | | | | | | |
| 4.25% 4/1/24 | | | 3,200,000 | | | $ | 3,188,367 | |
| 5.55% 2/15/28 | | | 4,440,000 | | | | 4,532,019 | |
| Galaxy Pipeline Assets Bidco 144A 1.75% 9/30/27 # | | | 2,715,720 | | | | 2,558,689 | |
| MPLX 4.875% 12/1/24 | | | 1,955,000 | | | | 1,944,944 | |
| NuStar Logistics 5.75% 10/1/25 | | | 1,077,000 | | | | 1,071,168 | |
| Occidental Petroleum | | | | | | | | |
| 5.50% 12/1/25 | | | 1,247,000 | | | | 1,247,525 | |
| 5.875% 9/1/25 | | | 4,560,000 | | | | 4,588,500 | |
| ONEOK 5.65% 11/1/28 | | | 425,000 | | | | 440,289 | |
| Southwestern Energy 5.70% 1/23/25 | | | 188,000 | | | | 187,369 | |
| Targa Resources Partners 5.00% 1/15/28 | | | 2,445,000 | | | | 2,416,925 | |
| | | | | | | | 23,514,733 | |
| Finance Companies — 2.10% | | | | | | | | |
| AerCap Ireland Capital DAC | | | | | | | | |
| 1.65% 10/29/24 | | | 3,475,000 | | | | 3,355,698 | |
| 3.00% 10/29/28 | | | 1,100,000 | | | | 1,004,826 | |
| 3.15% 2/15/24 | | | 3,905,000 | | | | 3,889,844 | |
| Air Lease | | | | | | | | |
| 0.80% 8/18/24 | | | 1,755,000 | | | | 1,701,775 | |
| 2.875% 1/15/26 | | | 875,000 | | | | 833,990 | |
| Aviation Capital Group | | | | | | | | |
| 144A 1.95% 1/30/26 # | | | 3,235,000 | | | | 3,000,308 | |
| 144A 4.375% 1/30/24 # | | | 3,000,000 | | | | 2,995,334 | |
| | | | | | | | 16,781,775 | |
| Industrials — 0.07% | | | | | | | | |
| Bidvest Group UK 144A 3.625% 9/23/26 # | | | 200,000 | | | | 186,000 | |
| CK Hutchison International 23 144A 4.75% 4/21/28 # | | | 400,000 | | | | 400,789 | |
| | | | | | | | 586,789 | |
| Insurance — 4.14% | | | | | | | | |
| Athene Global Funding | | | | | | | | |
| 144A 0.914% 8/19/24 # | | | 2,150,000 | | | | 2,083,347 | |
| 144A 0.95% 1/8/24 # | | | 3,000,000 | | | | 2,997,835 | |
| 144A 1.00% 4/16/24 # | | | 2,535,000 | | | | 2,496,030 | |
| 144A 6.102% (SOFR + 0.70%) 5/24/24 #, • | | | 2,055,000 | | | | 2,053,526 | |
| Brighthouse Financial Global Funding | | | | | | | | |
| 144A 1.00% 4/12/24 # | | | 2,145,000 | | | | 2,114,613 | |
| 144A 6.126% (SOFR + 0.76%) 4/12/24 #, • | | | 1,745,000 | | | | 1,741,549 | |
| GA Global Funding Trust 144A 1.00% 4/8/24 # | | | 4,115,000 | | | | 4,055,330 | |
| MassMutual Global Funding II 144A 0.60% 4/12/24 # | | | 5,100,000 | | | | 5,029,778 | |
| | | Principal | | | | |
| | | amount° | | | Value (US $) | |
| Corporate Bonds (continued) | | | | | | | | |
| Insurance (continued) | | | | | | | | |
| Met Tower Global Funding 144A 3.70% 6/13/25 # | | | 4,380,000 | | | $ | 4,310,613 | |
| New York Life Global Funding 144A 5.45% 9/18/26 # | | | 1,850,000 | | | | 1,892,217 | |
| Principal Life Global Funding II 144A 0.75% 4/12/24 # | | | 2,200,000 | | | | 2,168,978 | |
| UnitedHealth Group 4.25% 1/15/29 | | | 2,150,000 | | | | 2,147,375 | |
| | | | | | | | 33,091,191 | |
| Natural Gas — 0.21% | | | | | | | | |
| ENN Energy Holdings 144A 4.625% 5/17/27 # | | | 250,000 | | | | 248,146 | |
| Sempra Energy 3.30% 4/1/25 | | | 1,475,000 | | | | 1,440,191 | |
| | | | | | | | 1,688,337 | |
| Real Estate Investment Trusts — 1.88% | | | | | | | | |
| SBA Tower Trust | | | | | | | | |
| 144A 1.884% 7/15/50 # | | | 3,222,000 | | | | 2,989,247 | |
| 144A 2.836% 1/15/50 # | | | 5,840,000 | | | | 5,639,506 | |
| 144A 3.869% 10/15/49 #, ~ | | | 6,500,000 | | | | 6,391,134 | |
| | | | | | | | 15,019,887 | |
| Technology — 1.90% | | | | | | | | |
| Baidu 1.72% 4/9/26 | | | 1,250,000 | | | | 1,161,168 | |
| Oracle 5.80% 11/10/25 | | | 2,355,000 | | | | 2,392,525 | |
| Roper Technologies | | | | | | | | |
| 1.00% 9/15/25 | | | 3,600,000 | | | | 3,366,443 | |
| 2.35% 9/15/24 | | | 4,345,000 | | | | 4,239,690 | |
| Sensata Technologies 144A 5.00% 10/1/25 # | | | 3,720,000 | | | | 3,726,819 | |
| SK Hynix 144A 1.50% 1/19/26 # | | | 300,000 | | | | 276,393 | |
| | | | | | | | 15,163,038 | |
| Transportation — 0.47% | | | | | | | | |
| ERAC USA Finance 144A 4.60% 5/1/28 # | | | 3,225,000 | | | | 3,207,091 | |
| Rumo Luxembourg 144A 5.25% 1/10/28 # | | | 200,000 | | | | 192,676 | |
| TAV Havalimanlari Holding 144A 8.50% 12/7/28 # | | | 200,000 | | | | 204,950 | |
| United Airlines 144A 4.375% 4/15/26 # | | | 175,000 | | | | 170,658 | |
| | | | | | | | 3,775,375 | |
| Total Corporate Bonds | | | | | | | | |
| (cost $373,381,071) | | | | | | | 367,456,533 | |
| | | | | | | | | |
| Government Agency Obligations — 0.76% | | | | | | | | |
| BOC Aviation USA 144A 1.625% 4/29/24 # | | | 200,000 | | | | 197,483 | |
| CIMB Bank 144A 2.125% 7/20/27 # | | | 200,000 | | | | 182,820 | |
| DAE Sukuk DIFC 144A 3.75% 2/15/26 # | | | 200,000 | | | | 192,499 | |
| Emirates NBD Bank 2.625% 2/18/25 | | | 200,000 | | | | 194,203 | |
Schedule of investments
Delaware Limited-Term Diversified Income Fund
| | | Principal | | | | |
| | | amount° | | | Value (US $) | |
| Government Agency Obligations (continued) | | | | | | | | |
| Freeport Indonesia 144A 4.763% 4/14/27 # | | | 200,000 | | | $ | 197,500 | |
| Georgian Railway 4.00% 6/17/28 | | | 200,000 | | | | 184,605 | |
| Harvest Operations 144A 1.00% 4/26/24 # | | | 3,600,000 | | | | 3,550,425 | |
| KazMunayGas National 144A 4.75% 4/19/27 # | | | 200,000 | | | | 194,899 | |
| MEGlobal Canada 144A 5.00% 5/18/25 # | | | 200,000 | | | | 197,990 | |
| MISC Capital Two Labuan 144A 3.75% 4/6/27 # | | | 200,000 | | | | 192,690 | |
| OCP 144A 4.50% 10/22/25 # | | | 200,000 | | | | 195,344 | |
| QatarEnergy Trading 144A 1.375% 9/12/26 # | | | 200,000 | | | | 183,788 | |
| QNB Finance 2.625% 5/12/25 | | | 250,000 | | | | 240,450 | |
| Saudi Arabian Oil 144A 1.625% 11/24/25 # | | | 200,000 | | | | 188,433 | |
| Total Government Agency Obligations | | | | | | | | |
| (cost $6,240,703) | | | | | | | 6,093,129 | |
| | | | | | | | | |
| Non-Agency Asset-Backed Securities — 11.27% | | | | | | | | |
| American Express Credit Account Master Trust | | | | | | | | |
| Series 2022-3 A 3.75% 8/15/27 | | | 4,000,000 | | | | 3,931,829 | |
| Series 2023-1 A 4.87% 5/15/28 | | | 2,500,000 | | | | 2,518,318 | |
| Avis Budget Rental Car Funding AESOP | | | | | | | | |
| Series 2019-2A A 144A 3.35% 9/22/25 # | | | 830,000 | | | | 819,926 | |
| BMW Vehicle Lease Trust Series 2022-1 A3 1.10% 3/25/25 | | | 2,072,225 | | | | 2,060,466 | |
| Discover Card Execution Note Trust Series 2022-A4 A 5.03% 10/15/27 | | | 10,050,000 | | | | 10,089,332 | |
| Enterprise Fleet Financing | | | | | | | | |
| Series 2022-2 A2 144A 4.65% 5/21/29 # | | | 2,019,201 | | | | 2,005,521 | |
| Series 2023-3 A2 144A 6.40% 3/20/30 # | | | 4,000,000 | | | | 4,088,492 | |
| Ford Credit Auto Owner Trust | | | | | | | | |
| Series 2021-A B 0.70% 10/15/26 | | | 180,000 | | | | 170,521 | |
| Series 2022-A B 1.91% 7/15/27 | | | 5,215,000 | | | | 4,903,260 | |
| Ford Credit Floorplan Master Owner Trust | | | | | | | | |
| Series 2020-2 A 1.06% 9/15/27 | | | 7,600,000 | | | | 7,112,826 | |
| GM Financial Automobile Leasing Trust Series 2022-1 B 2.23% 2/20/26 | | | 6,300,000 | | | | 6,171,525 | |
| GTE Auto Receivables Trust Series 2023-1 A2 144A 5.65% 8/17/26 # | | | 3,166,203 | | | | 3,160,468 | |
| Hyundai Auto Lease Securitization Trust | | | | | | | | |
| Series 2023-A A3 144A 5.05% 1/15/26 # | | | 4,500,000 | | | | 4,488,252 | |
| JPMorgan Chase Bank Series 2020-2 B 144A 0.84% 2/25/28 # | | | 28,868 | | | | 28,756 | |
| OCCU Auto Receivables Trust Series 2023-1A A2 144A 6.23% 4/15/27 # | | | 2,500,000 | | | | 2,510,883 | |
| | | Principal | | | | |
| | | amount° | | | Value (US $) | |
| Non-Agency Asset-Backed Securities (continued) | | | | | | | | |
| Porsche Financial Auto Securitization Trust | | | | | | | | |
| Series 2023-2A A2B 144A 5.917% (SOFR + 0.58%) 11/23/26 #, • | | | 3,750,000 | | | $ | 3,754,240 | |
| Trafigura Securitisation Finance Series 2021-1A A2 144A 1.08% 1/15/25 # | | | 3,850,000 | | | | 3,696,281 | |
| Verizon Master Trust | | | | | | | | |
| Series 2021-2 A 0.99% 4/20/28 | | | 5,000,000 | | | | 4,829,552 | |
| Series 2022-2 A 1.53% 7/20/28 | | | 6,707,000 | | | | 6,460,487 | |
| Series 2022-2 B 1.83% 7/20/28 | | | 5,215,000 | | | | 5,011,975 | |
| Volkswagen Auto Lease Trust Series 2022-A A3 3.44% 7/21/25 | | | 5,700,000 | | | | 5,655,946 | |
| Volkswagen Auto Loan Enhanced Trust | | | | | | | | |
| Series 2023-2 A2B 5.968% (SOFR + 0.63%) 3/22/27 • | | | 6,500,000 | | | | 6,512,007 | |
| Total Non-Agency Asset-Backed Securities | | | | | | | | |
| (cost $90,626,544) | | | | | | | 89,980,863 | |
| | | | | | | | | |
| Non-Agency Collateralized Mortgage Obligations — 1.18% | | | | | | | | |
| COLT Mortgage Loan Trust Series 2023-3 A1 144A 7.18% 9/25/68 #, ~ | | | 2,165,746 | | | | 2,218,328 | |
| OBX Trust Series 2023-NQM8 A1 144A 7.045% 9/25/63 #, ~ | | | 2,144,567 | | | | 2,187,762 | |
| Verus Securitization Trust Series 2023-6 A1 144A 6.665% 9/25/68 #, ~ | | | 4,975,508 | | | | 5,041,340 | |
| Total Non-Agency Collateralized Mortgage Obligations | | | | | | | | |
| (cost $9,285,700) | | | | | | | 9,447,430 | |
| | | | | | | | | |
| Sovereign Bonds — 0.05%D | | | | | | | | |
| Hong Kong — 0.02% | | | | | | | | |
| Airport Authority 144A 1.75% 1/12/27 # | | | 200,000 | | | | 184,904 | |
| | | | | | | | 184,904 | |
| Republic of Korea — 0.03% | | | | | | | | |
| Korea Hydro & Nuclear Power 144A 5.00% 7/18/28 # | | | 200,000 | | | | 202,107 | |
| | | | | | | | 202,107 | |
| Total Sovereign Bonds | | | | | | | | |
| (cost $397,678) | | | | | | | 387,011 | |
| | | | | | | | | |
| US Treasury Obligations — 26.13% | | | | | | | | |
| US Treasury Floating Rate Notes | | | | | | | | |
| 5.501% (USBMMY3M + 0.17%) 10/31/25 • | | | 19,835,000 | | | | 19,809,583 | |
Schedule of investments
Delaware Limited-Term Diversified Income Fund
| | | Principal | | | | |
| | | amount° | | | Value (US $) | |
| US Treasury Obligations (continued) | | | | | | | | |
| US Treasury Notes | | | | | | | | |
| 0.375% 9/15/24 | | | 395,000 | | | $ | 382,546 | |
| 4.00% 7/31/28 | | | 90,000 | | | | 90,940 | |
| 4.125% 6/15/26 | | | 48,130,000 | | | | 48,127,180 | |
| 4.25% 12/31/25 | | | 25,115,000 | | | | 25,112,057 | |
| 4.375% 12/15/26 | | | 4,410,000 | | | | 4,453,756 | |
| 4.625% 9/30/28 | | | 30,725,000 | | | | 31,718,763 | |
| 4.75% 10/15/26 | | | 69,215,000 | | | | 70,250,519 | |
| 4.875% 10/31/28 | | | 8,335,000 | | | | 8,702,261 | |
| Total US Treasury Obligations | | | | | | | | |
| (cost $204,926,337) | | | | | | | 208,647,605 | |
| | | Number of | | | | |
| | | shares | | | | |
| Short-Term Investments — 6.63% | | | | | | | | |
| Money Market Mutual Funds — 6.63% | | | | | | | | |
| BlackRock Liquidity FedFund – Institutional Shares (seven-day effective yield 5.26%) | | | 13,242,336 | | | | 13,242,336 | |
| Fidelity Investments Money Market Government Portfolio – Class I (seven-day effective yield 5.25%) | | | 13,242,336 | | | | 13,242,336 | |
| Goldman Sachs Financial Square Government Fund – Institutional Shares (seven-day effective yield 5.37%) | | | 13,242,336 | | | | 13,242,336 | |
| Morgan Stanley Institutional Liquidity Funds Government Portfolio – Institutional Class (seven-day effective yield 5.27%) | | | 13,242,336 | | | | 13,242,336 | |
| Total Short-Term Investments | | | | | | | | |
| (cost $52,969,344) | | | | | | | 52,969,344 | |
| Total Value of Securities—104.81% | | | | | | | | |
| (cost $842,546,828) | | | | | | $ | 837,079,474 | |
| ° | Principal amount shown is stated in USD unless noted that the security is denominated in another currency. |
| # | Security exempt from registration under Rule 144A of the Securities Act of 1933, as amended. At December 31, 2023, the aggregate value of Rule 144A securities was $209,859,468, which represents 26.28% of the Fund's net assets. See Note 11 in “Notes to financial statements.” |
| • | Variable rate investment. Rates reset periodically. Rate shown reflects the rate in effect at December 31, 2023. For securities based on a published reference rate and spread, the reference rate and spread are indicated in their descriptions. The reference rate descriptions (i.e. SOFR01M, SOFR03M, etc.) used in this report are identical for different securities, but the underlying reference rates may differ due to the timing of the reset period. Certain variable rate securities are not based on a published reference rate and spread but are determined by the issuer or agent and are based on current market conditions, or for mortgage-backed securities, are impacted by the individual mortgages which are paying off over time. These securities do not indicate a reference rate and spread in their descriptions. |
| ¨ | Pass Through Agreement. Security represents the contractual right to receive a proportionate amount of underlying payments due to the counterparty pursuant to various agreements related to the rescheduling of obligations and the exchange of certain notes. |
| ~ | Step-up bond that pays an initial coupon rate for the first period and then a higher coupon rate for the following periods. Stated rate in effect at December 31, 2023. |
| m | Fixed to variable rate investment. The rate shown reflects the fixed rate in effect at December 31, 2023. Rate will reset at a future date. |
| y | Perpetual security. Maturity date represents next call date. |
| D | Securities have been classified by country of risk. |
The following futures contracts were outstanding at December 31, 2023:1
Futures Contracts
Exchange-Traded
| | | | | | | | | | | | | | | | Variation |
| | | | | | | | | | | | | | | | Margin |
| | | | | | | | Notional | | | | | Value/ | | | Due from |
| | | | | Notional | | | Cost | | | Expiration | | Unrealized | | | (Due to) |
| Contracts to Buy (Sell) | | Amount | | | (Proceeds) | | | Date | | Appreciation | | | Brokers |
| 697 | | US Treasury
2 yr Notes | | $ | 143,522,102 | | | $ | 141,950,001 | | | 3/28/24 | | $ | 1,572,101 | | | $87,125 |
The use of futures contracts involves elements of market risk and risks in excess of the amounts disclosed in the financial statements. The notional amounts presented above represent the Fund's total exposure in such contracts, whereas only the variation margin is reflected in the Fund's net assets.
1 See Note 9 in “Notes to financial statements.”
Summary of abbreviations:
CLO – Collateralized Loan Obligation
DAC – Designated Activity Company
DIFC – Dubai International Financial Centre
Schedule of investments
Delaware Limited-Term Diversified Income Fund
Summary of abbreviations: (continued)
FREMF – Freddie Mac Multifamily
GNMA – Government National Mortgage Association
REMIC – Real Estate Mortgage Investment Conduit
S.F. – Single Family
SOFR – Secured Overnight Financing Rate
SOFR01M – Secured Overnight Financing Rate 1 Month
SOFR03M – Secured Overnight Financing Rate 3 Month
TSFR03M – 3 Month Term Secured Overnight Financing Rate
USBMMY3M – US Treasury 3 Month Bill Money Market Yield
USD – US Dollar
yr – Year
See accompanying notes, which are an integral part of the financial statements.
Statement of assets and liabilities
| Delaware Limited-Term Diversified Income Fund | December 31, 2023 |
| Assets: | | | |
| Investments, at value* | | $ | 837,079,474 | |
| Cash collateral due from brokers | | | 881,705 | |
| Dividends and interest receivable | | | 5,851,199 | |
| Receivable for fund shares sold | | | 2,419,872 | |
| Variation margin due from broker on futures contracts | | | 87,125 | |
| Prepaid expenses | | | 49,587 | |
| Other assets | | | 3,336 | |
| Total Assets | | | 846,372,298 | |
| Liabilities: | | | | |
| Due to custodian | | | 4,248 | |
| Payable for securities purchased | | | 45,114,283 | |
| Payable for fund shares redeemed | | | 2,151,239 | |
| Other accrued expenses | | | 173,815 | |
| Distribution fees payable to affiliates | | | 102,065 | |
| Distribution payable | | | 93,095 | |
| Investment management fees payable to affiliates | | | 50,081 | |
| Administration expenses payable to affiliates | | | 48,509 | |
| Total Liabilities | | | 47,737,335 | |
| Total Net Assets | | $ | 798,634,963 | |
| | | | | |
| Net Assets Consist of: | | | | |
| Paid-in capital | | $ | 951,155,014 | |
| Total distributable earnings (loss) | | | (152,520,051 | ) |
| Total Net Assets | | $ | 798,634,963 | |
Statement of assets and liabilities
Delaware Limited-Term Diversified Income Fund
Net Asset Value
| Class A: | | | | |
| Net assets | | $ | 430,219,292 | |
| Shares of beneficial interest outstanding, unlimited authorization, no par | | | 54,974,764 | |
| Net asset value per share | | $ | 7.83 | |
| Sales charge | | | 2.75 | % |
| Offering price per share, equal to net asset value per share / (1 - sales charge) | | $ | 8.05 | |
| Class C: | | | | |
| Net assets | | $ | 11,691,763 | |
| Shares of beneficial interest outstanding, unlimited authorization, no par | | | 1,495,276 | |
| Net asset value per share | | $ | 7.82 | |
| Class R: | | | | |
| Net assets | | $ | 1,092,924 | |
| Shares of beneficial interest outstanding, unlimited authorization, no par | | | 139,675 | |
| Net asset value per share | | $ | 7.82 | |
| Institutional Class: | | | | |
| Net assets | | $ | 333,210,283 | |
| Shares of beneficial interest outstanding, unlimited authorization, no par | | | 42,581,011 | |
| Net asset value per share | | $ | 7.83 | |
| Class R6: | | | | |
| Net assets | | $ | 22,420,701 | |
| Shares of beneficial interest outstanding, unlimited authorization, no par | | | 2,867,475 | |
| Net asset value per share | | $ | 7.82 | |
| | | | | |
| *Investments, at cost | | $ | 842,546,828 | |
See accompanying notes, which are an integral part of the financial statements.
Statement of operations
| Delaware Limited-Term Diversified Income Fund | Year ended December 31, 2023 |
| Investment Income: | | | | |
| Interest | | $ | 19,851,259 | |
| Dividends | | | 601,345 | |
| | | | 20,452,604 | |
| | | | | |
| Expenses: | | | | |
| Management fees | | | 2,590,977 | |
| Distribution expenses — Class A | | | 671,527 | |
| Distribution expenses — Class C | | | 99,011 | |
| Distribution expenses — Class R | | | 4,159 | |
| Dividend disbursing and transfer agent fees and expenses | | | 508,555 | |
| Reports and statements to shareholders expenses | | | 133,431 | |
| Accounting and administration expenses | | | 108,557 | |
| Registration fees | | | 82,605 | |
| Audit and tax fees | | | 71,371 | |
| Legal fees | | | 66,689 | |
| Trustees’ fees and expenses | | | 16,764 | |
| Custodian fees | | | 9,894 | |
| Other | | | 77,227 | |
| | | | 4,440,767 | |
| Less expenses waived | | | (1,668,834 | ) |
| Less waived distribution expenses — Class A | | | (67,183 | ) |
| Less expenses paid indirectly | | | (126 | ) |
| Total operating expenses | | | 2,704,624 | |
| Net Investment Income (Loss) | | | 17,747,980 | |
Statement of operations
Delaware Limited-Term Diversified Income Fund
| Net Realized and Unrealized Gain (Loss): | | | | |
| Net realized gain (loss) on: | | | | |
| Investments | | $ | (7,055,888 | ) |
| Futures contracts | | | (1,772,178 | ) |
| Swap contracts | | | (490 | ) |
| Net realized gain (loss) | | | (8,828,556 | ) |
| | | | | |
| Net change in unrealized appreciation (depreciation) on: | | | | |
| Investments | | | 21,270,993 | |
| Foreign currencies | | | 1,817 | |
| Futures contracts | | | 1,523,630 | |
| Net change in unrealized appreciation (depreciation) | | | 22,796,440 | |
| Net Realized and Unrealized Gain (Loss) | | | 13,967,884 | |
| Net Increase (Decrease) in Net Assets Resulting from Operations | | $ | 31,715,864 | |
See accompanying notes, which are an integral part of the financial statements.
Statements of changes in net assets
Delaware Limited-Term Diversified Income Fund
| | | Year ended | |
| | | 12/31/23 | | | 12/31/22 | |
| Increase (Decrease) in Net Assets from Operations: | | | | | | | | |
| Net investment income (loss) | | $ | 17,747,980 | | | $ | 7,925,685 | |
| Net realized gain (loss) | | | (8,828,556 | ) | | | (10,309,704 | ) |
| Net change in unrealized appreciation (depreciation) | | | 22,796,440 | | | | (17,983,046 | ) |
| Net increase (decrease) in net assets resulting from operations | | | 31,715,864 | | | | (20,367,065 | ) |
| | | | | | | | | |
| Dividends and Distributions to Shareholders from: | | | | | | | | |
| Distributable earnings: | | | | | | | | |
| Class A | | | (9,324,334 | ) | | | (5,546,328 | ) |
| Class C | | | (262,952 | ) | | | (155,545 | ) |
| Class R | | | (26,278 | ) | | | (15,526 | ) |
| Institutional Class | | | (8,277,385 | ) | | | (5,199,946 | ) |
| Class R6 | | | (677,743 | ) | | | (134,184 | ) |
| | | | (18,568,692 | ) | | | (11,051,529 | ) |
| | | | | | | | | |
| Capital Share Transactions (See Note 6): | | | | | | | | |
| Proceeds from shares sold: | | | | | | | | |
| Class A | | | 49,646,562 | | | | 31,822,245 | |
| Class C | | | 2,066,279 | | | | 3,548,179 | |
| Class R | | | 59,451 | | | | 74,195 | |
| Institutional Class | | | 84,358,626 | | | | 75,904,229 | |
| Class R6 | | | 24,337,430 | | | | 598,055 | |
| Net assets from merger:1 | | | | | | | | |
| Class A | | | 248,424,336 | | | | — | |
| Class C | | | 6,020,079 | | | | — | |
| Class R | | | 333,903 | | | | — | |
| Institutional Class | | | 191,309,290 | | | | — | |
| Class R6 | | | 3,657,465 | | | | — | |
Statements of changes in net assets
Delaware Limited-Term Diversified Income Fund
| | | Year ended | |
| | | 12/31/23 | | | 12/31/22 | |
| Capital Share Transactions (continued): | | | | | | | | |
| Net asset value of shares issued upon reinvestment of dividends and distributions: | | | | | | | | |
| Class A | | $ | 9,581,740 | | | $ | 5,324,399 | |
| Class C | | | 267,381 | | | | 153,156 | |
| Class R | | | 26,648 | | | | 15,326 | |
| Institutional Class | | | 7,875,509 | | | | 4,053,271 | |
| Class R6 | | | 682,560 | | | | 134,191 | |
| | | | 628,647,259 | | | | 121,627,246 | |
| Cost of shares redeemed: | | | | | | | | |
| Class A | | | (100,801,563 | ) | | | (64,715,473 | ) |
| Class C | | | (6,199,415 | ) | | | (5,018,751 | ) |
| Class R | | | (86,937 | ) | | | (136,755 | ) |
| Institutional Class | | | (155,536,333 | ) | | | (79,907,521 | ) |
| Class R6 | | | (11,313,172 | ) | | | (1,392,319 | ) |
| | | | (273,937,420 | ) | | | (151,170,819 | ) |
| Increase (decrease) in net assets derived from capital share transactions | | | 354,709,839 | | | | (29,543,573 | ) |
| Net Increase (Decrease) in Net Assets | | | 367,857,011 | | | | (60,962,167 | ) |
| Net Assets: | | | | | | | | |
| Beginning of year | | | 430,777,952 | | | | 491,740,119 | |
| End of year | | $ | 798,634,963 | | | $ | 430,777,952 | |
| 1 | See Note 7 in "Notes to financial statements." |
See accompanying notes, which are an integral part of the financial statements.
Financial highlights
Delaware Limited-Term Diversified Income Fund Class A
Selected data for each share of the Fund outstanding throughout each period were as follows:
| Net asset value, beginning of period |
| |
| Income (loss) from investment operations: |
| Net investment income1 |
| Net realized and unrealized gain (loss) |
| Total from investment operations |
| |
| Less dividends and distributions from: |
| Net investment income |
| Return of capital |
| Total dividends and distributions |
| |
| Net asset value, end of period |
| |
| Total return3 |
| |
| Ratios and supplemental data: |
| Net assets, end of period (000 omitted) |
| Ratio of expenses to average net assets4 |
| Ratio of expenses to average net assets prior to fees waived4 |
| Ratio of net investment income to average net assets |
| Ratio of net investment income to average net assets prior to fees waived |
| Portfolio turnover |
| 1 | Calculated using average shares outstanding. |
| 2 | Amount is less than $(0.005) per share. |
| 3 | Total return is based on the change in net asset value of a share during the period and assumes reinvestment of dividends and distributions at net asset value and does not reflect the impact of a sales charge. Total return during the period reflects waivers by the manager and/or distributor (as applicable). Performance would have been lower had the waivers not been in effect. |
| 4 | Expense ratios do not include expenses of any investment companies in which the Fund invests. |
See accompanying notes, which are an integral part of the financial statements.
| Year ended | |
| | 12/31/23 | | | | 12/31/22 | | | | 12/31/21 | | | | 12/31/20 | | | | 12/31/19 | |
| $ | 7.71 | | | $ | 8.25 | | | $ | 8.44 | | | $ | 8.27 | | | $ | 8.14 | |
| | | | | | | | | | | | | | | | | | | |
| | | | | | | | | | | | | | | | | | | |
| | 0.26 | | | | 0.13 | | | | 0.07 | | | | 0.11 | | | | 0.21 | |
| | 0.12 | | | | (0.48 | ) | | | (0.11 | ) | | | 0.23 | | | | 0.15 | |
| | 0.38 | | | | (0.35 | ) | | | (0.04 | ) | | | 0.34 | | | | 0.36 | |
| | | | | | | | | | | | | | | | | | | |
| | | | | | | | | | | | | | | | | | | |
| | (0.26 | ) | | | (0.19 | ) | | | (0.15 | ) | | | (0.14 | ) | | | (0.20 | ) |
| | — | | | | — | | | | — | 2 | | | (0.03 | ) | | | (0.03 | ) |
| | (0.26 | ) | | | (0.19 | ) | | | (0.15 | ) | | | (0.17 | ) | | | (0.23 | ) |
| | | | | | | | | | | | | | | | | | | |
| $ | 7.83 | | | $ | 7.71 | | | $ | 8.25 | | | $ | 8.44 | | | $ | 8.27 | |
| | | | | | | | | | | | | | | | | | | |
| | 5.08 | % | | | (4.26 | )% | | | (0.45 | )% | | | 4.16 | % | | | 4.51 | % |
| | | | | | | | | | | | | | | | | | | |
| | | | | | | | | | | | | | | | | | | |
| $ | 430,219 | | | $ | 216,299 | | | $ | 260,162 | | | $ | 148,185 | | | $ | 137,798 | |
| | 0.61 | % | | | 0.53 | % | | | 0.54 | % | | | 0.54 | % | | | 0.54 | % |
| | 0.95 | % | | | 0.96 | % | | | 0.95 | % | | | 0.96 | % | | | 0.96 | % |
| | 3.31 | % | | | 1.71 | % | | | 0.89 | % | | | 1.32 | % | | | 2.58 | % |
| | 2.97 | % | | | 1.28 | % | | | 0.48 | % | | | 0.90 | % | | | 2.16 | % |
| | 116 | % | | | 110 | % | | | 205 | % | | | 224 | % | | | 123 | % |
Financial highlights
Delaware Limited-Term Diversified Income Fund Class C
Selected data for each share of the Fund outstanding throughout each period were as follows:
| Net asset value, beginning of period |
| |
| Income (loss) from investment operations: |
| Net investment income1 |
| Net realized and unrealized gain (loss) |
| Total from investment operations |
| |
| Less dividends and distributions from: |
| Net investment income |
| Return of capital |
| Total dividends and distributions |
| |
| Net asset value, end of period |
| |
| Total return3 |
| |
| Ratios and supplemental data: |
| Net assets, end of period (000 omitted) |
| Ratio of expenses to average net assets4 |
| Ratio of expenses to average net assets prior to fees waived4 |
| Ratio of net investment income to average net assets |
| Ratio of net investment income (loss) to average net assets prior to fees waived |
| Portfolio turnover |
| 1 | Calculated using average shares outstanding. |
| 2 | Amount is less than $(0.005) per share. |
| 3 | Total return is based on the change in net asset value of a share during the period and assumes reinvestment of dividends and distributions at net asset value and does not reflect the impact of a sales charge. Total return during the period reflects waivers by the manager and/or distributor (as applicable). Performance would have been lower had the waivers not been in effect. |
| 4 | Expense ratios do not include expenses of any investment companies in which the Fund invests. |
See accompanying notes, which are an integral part of the financial statements.
| Year ended | |
| | 12/31/23 | | | | 12/31/22 | | | | 12/31/21 | | | | 12/31/20 | | | | 12/31/19 | |
| $ | 7.70 | | | $ | 8.24 | | | $ | 8.44 | | | $ | 8.27 | | | $ | 8.14 | |
| | | | | | | | | | | | | | | | | | | |
| | | | | | | | | | | | | | | | | | | |
| | 0.19 | | | | 0.07 | | | | — | | | | 0.04 | | | | 0.14 | |
| | 0.13 | | | | (0.49 | ) | | | (0.12 | ) | | | 0.23 | | | | 0.15 | |
| | 0.32 | | | | (0.42 | ) | | | (0.12 | ) | | | 0.27 | | | | 0.29 | |
| | | | | | | | | | | | | | | | | | | |
| | | | | | | | | | | | | | | | | | | |
| | (0.20 | ) | | | (0.12 | ) | | | (0.08 | ) | | | (0.07 | ) | | | (0.13 | ) |
| | — | | | | — | | | | — | 2 | | | (0.03 | ) | | | (0.03 | ) |
| | (0.20 | ) | | | (0.12 | ) | | | (0.08 | ) | | | (0.10 | ) | | | (0.16 | ) |
| | | | | | | | | | | | | | | | | | | |
| $ | 7.82 | | | $ | 7.70 | | | $ | 8.24 | | | $ | 8.44 | | | $ | 8.27 | |
| | | | | | | | | | | | | | | | | | | |
| | 4.27 | % | | | (5.08 | )% | | | (1.41 | )% | | | 3.28 | % | | | 3.63 | % |
| | | | | | | | | | | | | | | | | | | |
| | | | | | | | | | | | | | | | | | | |
| $ | 11,692 | | | $ | 9,339 | | | $ | 11,355 | | | $ | 22,565 | | | $ | 36,977 | |
| | 1.39 | % | | | 1.38 | % | | | 1.39 | % | | | 1.39 | % | | | 1.39 | % |
| | 1.70 | % | | | 1.71 | % | | | 1.70 | % | | | 1.71 | % | | | 1.71 | % |
| | 2.53 | % | | | 0.86 | % | | | 0.04 | % | | | 0.47 | % | | | 1.73 | % |
| | 2.22 | % | | | 0.53 | % | | | (0.27 | )% | | | 0.15 | % | | | 1.41 | % |
| | 116 | % | | | 110 | % | | | 205 | % | | | 224 | % | | | 123 | % |
Financial highlights
Delaware Limited-Term Diversified Income Fund Class R
Selected data for each share of the Fund outstanding throughout each period were as follows:
| Net asset value, beginning of period |
| |
| Income (loss) from investment operations: |
| Net investment income1 |
| Net realized and unrealized gain (loss) |
| Total from investment operations |
| |
| Less dividends and distributions from: |
| Net investment income |
| Return of capital |
| Total dividends and distributions |
| |
| Net asset value, end of period |
| |
| Total return3 |
| |
| Ratios and supplemental data: |
| Net assets, end of period (000 omitted) |
| Ratio of expenses to average net assets4 |
| Ratio of expenses to average net assets prior to fees waived4 |
| Ratio of net investment income to average net assets |
| Ratio of net investment income to average net assets prior to fees waived |
| Portfolio turnover |
| 1 | Calculated using average shares outstanding. |
| 2 | Amount is less than $(0.005) per share. |
| 3 | Total return is based on the change in net asset value of a share during the period and assumes reinvestment of dividends and distributions at net asset value. Total return during the period reflects a waiver by the manager and/or distributor (as applicable). Performance would have been lower had the waivers not been in effect. |
| 4 | Expense ratios do not include expenses of any investment companies in which the Fund invests. |
See accompanying notes, which are an integral part of the financial statements.
| Year ended | |
| | 12/31/23 | | | | 12/31/22 | | | | 12/31/21 | | | | 12/31/20 | | | | 12/31/19 | |
| $ | 7.71 | | | $ | 8.25 | | | $ | 8.44 | | | $ | 8.28 | | | $ | 8.14 | |
| | | | | | | | | | | | | | | | | | | |
| | | | | | | | | | | | | | | | | | | |
| | 0.23 | | | | 0.11 | | | | 0.04 | | | | 0.08 | | | | 0.18 | |
| | 0.12 | | | | (0.49 | ) | | | (0.11 | ) | | | 0.22 | | | | 0.16 | |
| | 0.35 | | | | (0.38 | ) | | | (0.07 | ) | | | 0.30 | | | | 0.34 | |
| | | | | | | | | | | | | | | | | | | |
| | | | | | | | | | | | | | | | | | | |
| | (0.24 | ) | | | (0.16 | ) | | | (0.12 | ) | | | (0.11 | ) | | | (0.17 | ) |
| | — | | | | — | | | | — | 2 | | | (0.03 | ) | | | (0.03 | ) |
| | (0.24 | ) | | | (0.16 | ) | | | (0.12 | ) | | | (0.14 | ) | | | (0.20 | ) |
| | | | | | | | | | | | | | | | | | | |
| $ | 7.82 | | | $ | 7.71 | | | $ | 8.25 | | | $ | 8.44 | | | $ | 8.28 | |
| | | | | | | | | | | | | | | | | | | |
| | 4.65 | % | | | (4.59 | )% | | | (0.80 | )% | | | 3.66 | % | | | 4.27 | % |
| | | | | | | | | | | | | | | | | | | |
| | | | | | | | | | | | | | | | | | | |
| $ | 1,093 | | | $ | 743 | | | $ | 843 | | | $ | 946 | | | $ | 1,586 | |
| | 0.89 | % | | | 0.88 | % | | | 0.89 | % | | | 0.89 | % | | | 0.89 | % |
| | 1.20 | % | | | 1.21 | % | | | 1.20 | % | | | 1.21 | % | | | 1.21 | % |
| | 3.03 | % | | | 1.36 | % | | | 0.54 | % | | | 0.97 | % | | | 2.23 | % |
| | 2.72 | % | | | 1.03 | % | | | 0.23 | % | | | 0.65 | % | | | 1.91 | % |
| | 116 | % | | | 110 | % | | | 205 | % | | | 224 | % | | | 123 | % |
Financial highlights
Delaware Limited-Term Diversified Income Fund Institutional Class
Selected data for each share of the Fund outstanding throughout each period were as follows:
| Net asset value, beginning of period |
| |
| Income (loss) from investment operations: |
| Net investment income1 |
| Net realized and unrealized gain (loss) |
| Total from investment operations |
| |
| Less dividends and distributions from: |
| Net investment income |
| Return of capital |
| Total dividends and distributions |
| |
| Net asset value, end of period |
| |
| Total return3 |
| |
| Ratios and supplemental data: |
| Net assets, end of period (000 omitted) |
| Ratio of expenses to average net assets4 |
| Ratio of expenses to average net assets prior to fees waived4 |
| Ratio of net investment income to average net assets |
| Ratio of net investment income to average net assets prior to fees waived |
| Portfolio turnover |
| 1 | Calculated using average shares outstanding. |
| 2 | Amount is less than $(0.005) per share. |
| 3 | Total return is based on the change in net asset value of a share during the period and assumes reinvestment of dividends and distributions at net asset value. Total return during the period reflects waivers by the manager. Performance would have been lower had the waivers not been in effect. |
| 4 | Expense ratios do not include expenses of any investment companies in which the Fund invests. |
See accompanying notes, which are an integral part of the financial statements.
| Year ended | |
| | 12/31/23 | | | | 12/31/22 | | | | 12/31/21 | | | | 12/31/20 | | | | 12/31/19 | |
| $ | 7.71 | | | $ | 8.25 | | | $ | 8.44 | | | $ | 8.27 | | | $ | 8.14 | |
| | | | | | | | | | | | | | | | | | | |
| | | | | | | | | | | | | | | | | | | |
| | 0.27 | | | | 0.15 | | | | 0.09 | | | | 0.12 | | | | 0.23 | |
| | 0.13 | | | | (0.49 | ) | | | (0.12 | ) | | | 0.23 | | | | 0.15 | |
| | 0.40 | | | | (0.34 | ) | | | (0.03 | ) | | | 0.35 | | | | 0.38 | |
| | | | | | | | | | | | | | | | | | | |
| | | | | | | | | | | | | | | | | | | |
| | (0.28 | ) | | | (0.20 | ) | | | (0.16 | ) | | | (0.15 | ) | | | (0.22 | ) |
| | — | | | | — | | | | — | 2 | | | (0.03 | ) | | | (0.03 | ) |
| | (0.28 | ) | | | (0.20 | ) | | | (0.16 | ) | | | (0.18 | ) | | | (0.25 | ) |
| | | | | | | | | | | | | | | | | | | |
| $ | 7.83 | | | $ | 7.71 | | | $ | 8.25 | | | $ | 8.44 | | | $ | 8.27 | |
| | | | | | | | | | | | | | | | | | | |
| | 5.31 | % | | | (4.12 | )% | | | (0.30 | )% | | | 4.31 | % | | | 4.67 | % |
| | | | | | | | | | | | | | | | | | | |
| | | | | | | | | | | | | | | | | | | |
| $ | 333,210 | | | $ | 199,497 | | | $ | 213,457 | | | $ | 262,775 | | | $ | 249,667 | |
| | 0.39 | % | | | 0.38 | % | | | 0.39 | % | | | 0.39 | % | | | 0.39 | % |
| | 0.70 | % | | | 0.71 | % | | | 0.70 | % | | | 0.71 | % | | | 0.71 | % |
| | 3.53 | % | | | 1.86 | % | | | 1.04 | % | | | 1.47 | % | | | 2.73 | % |
| | 3.22 | % | | | 1.53 | % | | | 0.73 | % | | | 1.15 | % | | | 2.41 | % |
| | 116 | % | | | 110 | % | | | 205 | % | | | 224 | % | | | 123 | % |
Financial highlights
Delaware Limited-Term Diversified Income Fund Class R6
Selected data for each share of the Fund outstanding throughout each period were as follows:
| Net asset value, beginning of period |
| Income (loss) from investment operations: |
| Net investment income1 |
| Net realized and unrealized gain (loss) |
| Total from investment operations |
| Less dividends and distributions from: |
| Net investment income |
| Return of capital |
| Total dividends and distributions |
| |
| Net asset value, end of period |
| |
| Total return3 |
| |
| Ratios and supplemental data: |
| Net assets, end of period (000 omitted) |
| Ratio of expenses to average net assets4 |
| Ratio of expenses to average net assets prior to fees waived4 |
| Ratio of net investment income to average net assets |
| Ratio of net investment income to average net assets prior to fees waived |
| Portfolio turnover |
| 1 | Calculated using average shares outstanding. |
| 2 | Amount is less than $(0.005) per share. |
| 3 | Total return is based on the change in net asset value of a share during the period and assumes reinvestment of dividends and distributions at net asset value. Total return during the period reflects waivers by the manager. Performance would have been lower had the waivers not been in effect. |
| 4 | Expense ratios do not include expenses of any investment companies in which the Fund invests. |
See accompanying notes, which are an integral part of the financial statements.
| Year ended | |
| 12/31/23 | | | 12/31/22 | | | 12/31/21 | | | 12/31/20 | | | 12/31/19 | |
| $ | 7.70 | | | $ | 8.24 | | | $ | 8.44 | | | $ | 8.27 | | | $ | 8.14 | |
| | | | | | | | | | | | | | | | | | | |
| | | | | | | | | | | | | | | | | | | |
| | 0.28 | | | | 0.15 | | | | 0.09 | | | | 0.13 | | | | 0.23 | |
| | 0.13 | | | | (0.48 | ) | | | (0.12 | ) | | | 0.23 | | | | 0.15 | |
| | 0.41 | | | | (0.33 | ) | | | (0.03 | ) | | | 0.36 | | | | 0.38 | |
| | | | | | | | | | | | | | | | | | | |
| | | | | | | | | | | | | | | | | | | |
| | (0.29 | ) | | | (0.21 | ) | | | (0.17 | ) | | | (0.16 | ) | | | (0.22 | ) |
| | — | | | | — | | | | — | 2 | | | (0.03 | ) | | | (0.03 | ) |
| | (0.29 | ) | | | (0.21 | ) | | | (0.17 | ) | | | (0.19 | ) | | | (0.25 | ) |
| | | | | | | | | | | | | | | | | | | |
| $ | 7.82 | | | $ | 7.70 | | | $ | 8.24 | | | $ | 8.44 | | | $ | 8.27 | |
| | | | | | | | | | | | | | | | | | | |
| | 5.37 | % | | | (4.06 | )% | | | (0.36 | )% | | | 4.38 | % | | | 4.74 | % |
| | | | | | | | | | | | | | | | | | | |
| | | | | | | | | | | | | | | | | | | |
| $ | 22,421 | | | $ | 4,900 | | | $ | 5,923 | | | $ | 4,646 | | | $ | 3,059 | |
| | 0.32 | % | | | 0.32 | % | | | 0.32 | % | | | 0.32 | % | | | 0.32 | % |
| | 0.65 | % | | | 0.65 | % | | | 0.63 | % | | | 0.63 | % | | | 0.64 | % |
| | 3.60 | % | | | 1.92 | % | | | 1.10 | % | | | 1.54 | % | | | 2.80 | % |
| | 3.27 | % | | | 1.59 | % | | | 0.79 | % | | | 1.23 | % | | | 2.48 | % |
| | 116 | % | | | 110 | % | | | 205 | % | | | 224 | % | | | 123 | % |
Notes to financial statements
| Delaware Limited-Term Diversified Income Fund | December 31, 2023 |
Delaware Group® Limited-Term Government Funds (Trust) is organized as a Delaware statutory trust and offers two series: Delaware Limited-Term Diversified Income Fund and Delaware Tax-Free Oregon Fund. These financial statements pertain to Delaware Limited-Term Diversified Income Fund (Fund). The Trust is an open-end investment company. The Fund is considered diversified under the Investment Company Act of 1940, as amended (1940 Act), and offers Class A, Class C, Class R, Institutional Class, and Class R6 shares. Class A shares are sold with a maximum front-end sales charge of 2.75%. There is no front-end sales charge when you purchase $1 million or more of Class A shares. However, if Delaware Distributors, L.P. (DDLP) paid your financial intermediary a commission on your purchase of $1 million or more of Class A shares, you will have to pay a limited contingent deferred sales charge (Limited CDSC) of 1.00% if you redeem these shares within the first 18 months after your purchase, unless a specific waiver of the Limited CDSC applies. Class C shares have no upfront sales charge, but are sold with a contingent deferred sales charge (CDSC) of 1.00%, which will be incurred if redeemed during the first 12 months. Class R, Institutional Class, and Class R6 shares are not subject to a sales charge and are offered for sale exclusively to certain eligible investors. In addition, Class R6 shares do not pay any service fees, sub-accounting fees, and/or sub-transfer agency fees to any brokers, dealers, or other financial intermediaries.
1. Significant Accounting Policies
The Fund follows accounting and reporting guidance under Financial Accounting Standards Board (FASB) Accounting Standards Codification Topic 946, Financial Services — Investment Companies. The following accounting policies are in accordance with US generally accepted accounting principles (US GAAP) and are consistently followed by the Fund.
Security Valuation — Equity securities and exchange-traded funds (ETFs), except those traded on the Nasdaq Stock Market LLC (Nasdaq), are valued at the last quoted sales price as of the time of the regular close of the New York Stock Exchange on the valuation date. Equity securities and ETFs traded on the Nasdaq are valued in accordance with the Nasdaq Official Closing Price, which may not be the last sales price. If, on a particular day, an equity security or ETF does not trade, the mean between the bid and the ask prices will be used, which approximates fair value. Equity securities listed on a foreign exchange are normally valued at the last quoted sales price on the valuation date. Fixed income securities and credit default swap (CDS) contracts are generally priced based upon valuations provided by an independent pricing service or broker/counterparty in accordance with methodologies included within Delaware Management Company (DMC)’s Pricing Policy (the Policy). Fixed income security valuations are then reviewed by DMC as part of its duties as the Fund’s valuation designee and, to the extent required by the Policy and applicable regulation, fair valued consistent with the Policy. To the extent current market prices are not available, the pricing service may take into account developments related to the specific security, as well as transactions in comparable securities. US government and agency securities are valued at the mean between the bid and the ask prices, which approximates fair value. Valuations for fixed income securities utilize matrix systems, which reflect such factors as security prices, yields, maturities, and ratings, and are
supplemented by dealer and exchange quotations. Open-end investment companies, other than ETFs, are valued at their published net asset value (NAV). For asset-backed securities, collateralized mortgage obligations (CMOs), commercial mortgage securities, and US government agency mortgage securities, pricing vendors utilize matrix pricing which considers prepayment speed, attributes of the collateral, yield or price of bonds of comparable quality, coupon, maturity, and type as well as broker/dealer-supplied prices. Swap prices are derived using daily swap curves and models that incorporate a number of market data factors, such as discounted cash flows, trades, and values of the underlying reference instruments. Futures contracts and options on futures contracts are valued at the daily quoted settlement prices. Generally, other securities and assets for which market quotations are not readily available are valued at fair value as determined in good faith by DMC. Subject to the oversight of the Trust's Board of Trustees (Board), DMC, as valuation designee, has adopted policies and procedures to fair value securities for which market quotations are not readily available consistent with the requirements of Rule 2a-5 under the 1940 Act. The Series may use fair value pricing more frequently for securities traded primarily in non-US markets because, among other things, most foreign markets close well before the Series value their securities, generally as of 4:00pm ET. The earlier close of these foreign markets gives rise to the possibility that significant events, including broad market moves, government actions or pronouncements, aftermarket trading, or news events may have occurred in the interim. Whenever such a significant event occurs, the Series may value foreign securities using fair value prices based on third-party vendor modeling tools (international fair value pricing). In determining whether market quotations are readily available or fair valuation will be used, various factors will be taken into consideration, such as market closures or suspension of trading in a security. Restricted securities and private placements are valued at fair value.
Federal Income Taxes — No provision for federal income taxes has been made as the Fund intends to continue to qualify for federal income tax purposes as a regulated investment company under Subchapter M of the Internal Revenue Code of 1986, as amended, and make the requisite distributions to shareholders. The Fund evaluates tax positions taken or expected to be taken in the course of preparing the Fund's tax returns to determine whether the tax positions are “more-likely-than-not” of being sustained by the applicable tax authority. Tax positions not deemed to meet the “more-likely-than-not” threshold are recorded as a tax benefit or expense in the current year. Management has analyzed the Fund’s tax positions taken or expected to be taken on the Fund’s federal income tax returns through the year ended December 31, 2023, and for all open tax years (years ended December 31, 2020–December 31, 2022), and has concluded that no provision for federal income tax is required in the Fund’s financial statements. If applicable, the Fund recognizes interest accrued on unrecognized tax benefits in interest expense and penalties in “Other” on the “Statement of operations.” During the year ended December 31, 2023, the Fund did not incur any interest or tax penalties.
Class Accounting — Investment income and common expenses are allocated to the various classes of the Fund on the basis of “settled shares” of each class in relation to the net assets of the Fund. Realized and unrealized gain (loss) on investments are allocated to the various
Notes to financial statements
Delaware Limited-Term Diversified Income Fund
1. Significant Accounting Policies (continued)
classes of the Fund on the basis of daily net assets of each class. Distribution expenses relating to a specific class are charged directly to that class. Class R6 shares will not be allocated any expenses related to service fees, sub-accounting fees, and/or sub-transfer agency fees paid to brokers, dealers, or other financial intermediaries.
To Be Announced Trades (TBA) — The Fund may contract to purchase or sell securities for a fixed price at a transaction date beyond the customary settlement period (examples: when issued, delayed delivery, forward commitment, or TBA transactions) consistent with the Fund’s ability to manage its investment portfolio and meet redemption requests. These transactions involve a commitment by the Fund to purchase or sell securities for a predetermined price or yield with payment and delivery taking place more than three days in the future, or after a period longer than the customary settlement period for that type of security. No interest will be earned by the Fund on such purchases until the securities are delivered or the transaction is completed; however, the market value may change prior to delivery.
Foreign Currency Transactions — Transactions denominated in foreign currencies are recorded at the prevailing exchange rates on the valuation date. The value of all assets and liabilities denominated in foreign currencies is translated daily into US dollars at the exchange rate of such currencies against the US dollar. Transaction gains or losses resulting from changes in exchange rates during the reporting period or upon settlement of the foreign currency transaction are reported in operations for the current period. The Fund generally bifurcates that portion of realized gains and losses on investments in debt securities which is due to changes in foreign exchange rates from that which is due to changes in market prices of debt securities. That portion of realized gains (losses), attributable to changes in foreign exchange rates, is included on the “Statement of operations” under “Net realized gain (loss) on foreign currencies.” The Fund reports certain foreign currency related transactions as components of realized gains (losses) for financial reporting purposes, whereas such components are treated as ordinary income (loss) for federal income tax purposes.
Derivative Financial Instruments — The Fund may invest in various derivative financial instruments. These instruments are used to obtain exposure to a security, commodity, index, market, and/or other assets without owning or taking physical custody of securities, commodities and/or other referenced assets or to manage market, equity, credit, interest rate, foreign currency exchange rate, commodity and/or other risks. Derivative financial instruments may give rise to a form of economic leverage and involve risks, including the imperfect correlation between the value of a derivative financial instrument and the underlying asset, possible default of the counterparty to the transaction or illiquidity of the instrument. Pursuant to Rule 18f-4 under the 1940 Act, among other things, the Fund intends to use either derivative financial instruments with embedded leverage in a limited manner or comply with an outer limit on fund leverage risk based on value-at-risk.
Segregation and Collateralization — In certain cases, based on requirements and agreements with certain exchanges and third-party broker-dealers, the Fund may deliver or receive collateral
in connection with certain investments (e.g., futures contracts, forward foreign currency exchange contracts, options written, securities with extended settlement periods, and swaps). Certain countries require that cash reserves be held while investing in companies incorporated in that country. Cash collateral that has been pledged/received to cover obligations of the Fund under derivative contracts, if any, will be reported separately on the “Statement of assets and liabilities” as cash collateral due to/from broker. Securities collateral pledged for the same purpose, if any, is noted on the “Schedule of investments.”
Use of Estimates — The preparation of financial statements in conformity with US GAAP requires management to make estimates and assumptions that affect the fair value of investments, the reported amounts of assets and liabilities and disclosure of contingent assets and liabilities at the date of the financial statements, and the reported amounts of revenues and expenses during the reporting period. Actual results could differ from those estimates and the differences could be material.
Other — Expenses directly attributable to the Fund are charged directly to the Fund. Other expenses common to various funds within the Delaware Funds by Macquarie® (Delaware Funds) are generally allocated among such funds on the basis of average net assets. Management fees and certain other expenses are paid monthly. Security transactions are recorded on the date the securities are purchased or sold (trade date) for financial reporting purposes. Costs used in calculating realized gains and losses on the sale of investment securities are those of the specific securities sold. Dividend income is recorded on the ex-dividend date and interest income is recorded on an accrual basis. Income and capital gain distributions from any investment companies (Underlying Funds) in which the Fund invests are recorded on the ex-dividend date. Discounts and premiums on debt securities are accreted or amortized to interest income, respectively, over the lives of the respective securities using the effective interest method. Premiums on callable debt securities are amortized to interest income to the earliest call date using the effective interest method. Realized gains (losses) on paydowns of asset- and mortgage-backed securities are classified as interest income. The Fund declares dividends daily from net investment income and pays the dividends monthly and declares and pays distributions from net realized gain on investments, if any, at least annually. The Fund may distribute more frequently, if necessary for tax purposes. Dividends and distributions, if any, are recorded on the ex-dividend date.
The Fund receives earnings credits from its transfer agent when positive cash balances are maintained, which may be used to offset transfer agent fees. If the amount earned is greater than $1, the expenses paid under this arrangement are included on the “Statement of operations” under “Dividend disbursing and transfer agent fees and expenses” with the corresponding expenses offset included under “Less expenses paid indirectly.”
Notes to financial statements
Delaware Limited-Term Diversified Income Fund
2. Investment Management, Administration Agreements, and Other Transactions with Affiliates
In accordance with the terms of its investment management agreement, the Fund pays DMC, a series of Macquarie Investment Management Business Trust and the investment manager, an annual fee which is calculated daily and paid monthly at the rates of 0.50% on the first $500 million of average daily net assets of the Fund, 0.475% on the next $500 million, 0.45% on the next $1.5 billion, and 0.425% on average daily net assets in excess of $2.5 billion.
DMC has contractually agreed to waive all or a portion of its investment advisory fees and/or pay/reimburse expenses (excluding any distribution and service (12b-1) fees, acquired fund fees and expenses, taxes, interest, short sale dividend and interest expenses, brokerage fees, certain insurance costs, and nonroutine expenses or costs, including, but not limited to, those relating to reorganizations, litigation, conducting shareholder meetings, and liquidations), in order to prevent total annual fund operating expenses from exceeding 0.39% of the Fund’s Class A, Class C, Class R, and Institutional Class shares' average daily net assets and 0.32% of the Fund’s Class R6 shares' average daily net assets from January 1, 2023 through April 30, 2024. These waivers and reimbursements may only be terminated by agreement of DMC and the Fund. The waivers and reimbursements are accrued daily and received monthly.
After consideration of class specific expenses, including 12b-1 fees, the class level operating expense limitation as a percentage of average daily net assets from January 1, 2023 (except as noted) through April 30, 2024 is as follows:
| Operating expense limitation as a percentage of average daily net assets |
| Class A | | Class C | | Class R | | Institutional Class | | Class R6 |
| 0.64%* | | 1.39% | | 0.89% | | 0.39% | | 0.32% |
* Effective May 1, 2023. Prior to May 1, 2023, the expense limitation for Class A was 0.54%.
DMC may seek investment advice and recommendations from its affiliates: Macquarie Investment Management Austria Kapitalanlage AG, Macquarie Investment Management Europe Limited, and Macquarie Investment Management Global Limited (MIMGL) (together, the “Affiliated Sub-Advisors”). DMC may also permit these Affiliated Sub-Advisors to execute Fund security trades on its behalf and exercise investment discretion for securities in certain markets where DMC believes it will be beneficial to utilize an Affiliated Sub-Advisor’s specialized market knowledge. Although the Affiliated Sub-Advisors serve as sub-advisors, DMC has ultimate responsibility for all investment advisory services. For these services, DMC, not the Fund, pays each Affiliated Sub-Advisor a portion of its investment management fee.
Delaware Investments Fund Services Company (DIFSC), an affiliate of DMC, provides fund accounting and financial administrative oversight services to the Fund. For these services, effective October 1, 2023, DIFSC’s fees are calculated daily and paid monthly, based on the aggregate daily net assets of all funds within the Delaware Funds at the following annual rates: 0.0050% of the first $60 billion; 0.00475% of the next $30 billion; and 0.0015% of aggregate average daily net assets in excess of $90 billion (Total Fee). Prior to October 1, 2023,
DIFSC's annual rates were: 0.00475% of the first $35 billion; 0.0040% of the next $10 billion; 0.0025% of the next $45 billion; and 0.0015% of aggregate average daily net assets in excess of $90 billion. Each fund in the Delaware Funds pays a minimum of $4,000, which, in aggregate, is subtracted from the Total Fee. Each fund then pays its portion of the remainder of the Total Fee on a relative NAV basis. This amount is included on the “Statement of operations” under “Accounting and administration expenses.” For the year ended December 31, 2023, the Fund paid $21,608 for these services.
DIFSC is also the transfer agent and dividend disbursing agent of the Fund. For these services, DIFSC’s fees are calculated daily and paid monthly, based on the aggregate daily net assets of the retail funds within the Delaware Funds at the following annual rates: 0.014% of the first $20 billion; 0.011% of the next $5 billion; 0.007% of the next $5 billion; 0.004% of the next $20 billion; 0.002% of the next $25 billion; and 0.0015% of average daily net assets in excess of $75 billion. The fees payable to DIFSC under the shareholder services agreement described above are allocated among all retail funds in the Delaware Funds on a relative NAV basis. This amount is included on the “Statement of operations” under “Dividend disbursing and transfer agent fees and expenses.” For the year ended December 31, 2023, the Fund paid $34,042 for these services. Pursuant to a sub-transfer agency agreement between DIFSC and BNY Mellon Investment Servicing (US) Inc. (BNYMIS), BNYMIS provides certain sub-transfer agency services to the Fund. Sub-transfer agency fees are paid by the Fund and are also included on the “Statement of operations” under “Dividend disbursing and transfer agent fees and expenses.” The fees are calculated daily and paid as invoices are received on a monthly or quarterly basis.
Pursuant to a distribution agreement and distribution plan, the Fund pays DDLP, the distributor and an affiliate of DMC, an annual 12b-1 fee of 0.25%, 1.00%, and 0.50% of the average daily net assets of the Class A, Class C, and Class R shares, respectively. The fees are calculated daily and paid monthly. DDLP had contractually agreed to waive Class A shares’ 12b-1 fee to 0.15% of average daily net assets from January 1, 2023 through April 29, 2023. The waiver was calculated daily and received monthly. Institutional Class and Class R6 shares do not pay 12b-1 fees.
As provided in the investment management agreement, the Fund bears a portion of the cost of certain resources shared with DMC, including the cost of internal personnel of DMC and/or its affiliates that provide legal and regulatory reporting services to the Fund. This amount is included on the “Statement of operations” under “Legal fees.” For the year ended December 31, 2023, the Fund paid $16,503 for internal legal and regulatory reporting services provided by DMC and/or its affiliates’ employees.
For the year ended December 31, 2023, DDLP earned $10,231 for commissions on sales of the Fund’s Class A shares. For the year ended December 31, 2023, DDLP received gross CDSC commissions of $107 and $6,080 on redemptions of the Fund’s Class A and Class C shares, respectively, and these commissions were entirely used to offset upfront commissions previously paid by DDLP to broker/dealers on sales of those shares.
Notes to financial statements
Delaware Limited-Term Diversified Income Fund
2. Investment Management, Administration Agreements, and Other Transactions with Affiliates (continued)
Trustees’ fees include expenses accrued by the Fund for each Trustee’s retainer and meeting fees. Certain officers of DMC, DIFSC, and DDLP are officers and/or Trustees of the Trust. These officers and Trustees are paid no compensation by the Fund.
In addition to the management fees and other expenses of the Fund, the Fund indirectly bears the investment management fees and other expenses of any Underlying Funds, including ETFs, in which it invests. The amount of these fees and expenses incurred indirectly by the Fund will vary based upon the expense and fee levels of any Underlying Funds and the number of shares that are owned of any Underlying Funds at different times.
3. Investments
For the year ended December 31, 2023, the Fund made purchases and sales of investment securities other than short-term investments as follows:
| Purchases other than US government securities | | $ | 98,029,427 | |
| Purchases of US government securities | | | 507,811,588 | |
| Sales other than US government securities | | | 203,480,730 | |
| Sales of US government securities | | | 487,987,001 | |
The tax cost of investments and derivatives includes adjustments to net unrealized appreciation (depreciation) which may not necessarily be the final tax cost basis adjustments but which approximate the tax basis unrealized gains and losses that may be realized and distributed to shareholders. At December 31, 2023, the cost and unrealized appreciation (depreciation) of investments and derivatives for federal income tax purposes for the Fund were as follows:
| Cost of investments and derivatives | | $ | 845,136,008 | |
| Aggregate unrealized appreciation of investments and derivatives | | $ | 4,071,409 | |
| Aggregate unrealized depreciation of investments and derivatives | | | (12,264,546 | ) |
| Net unrealized depreciation of investments and derivatives | | $ | (8,193,137 | ) |
US GAAP defines fair value as the price that the Fund would receive to sell an asset or pay to transfer a liability in an orderly transaction between market participants at the measurement date under current market conditions. A three-level hierarchy for fair value measurements has been established based upon the transparency of inputs to the valuation of an asset or liability. Inputs may be observable or unobservable and refer broadly to the assumptions that market participants would use in pricing the asset or liability. Observable inputs reflect the assumptions market participants would use in pricing the asset or liability based on market data obtained from sources independent of the reporting entity. Unobservable inputs reflect the reporting entity’s own assumptions about the assumptions that market participants would use in pricing the asset or liability based on the best information available under the circumstances. The Fund's
investment in its entirety is assigned a level based upon the observability of the inputs which are significant to the overall valuation. The three-level hierarchy of inputs is summarized as follows:
| Level 1 | − | Inputs are quoted prices in active markets for identical investments. (Examples: equity securities, open-end investment companies, futures contracts, and exchange-traded options contracts) |
| | | |
| Level 2 | − | Other observable inputs, including, but not limited to: quoted prices for similar assets or liabilities in markets that are active, quoted prices for identical or similar assets or liabilities in markets that are not active, inputs other than quoted prices that are observable for the assets or liabilities (such as interest rates, yield curves, volatilities, prepayment speeds, loss severities, credit risks, and default rates) or other market-corroborated inputs. (Examples: debt securities, government securities, swap contracts, forward foreign currency exchange contracts, foreign securities utilizing international fair value pricing, broker-quoted securities, and fair valued securities) |
| | | |
| Level 3 | − | Significant unobservable inputs, including the Fund's own assumptions used to determine the fair value of investments. (Examples: broker-quoted securities and fair valued securities) |
Level 3 investments are valued using significant unobservable inputs. The Fund may also use an income-based valuation approach in which the anticipated future cash flows of the investment are discounted to calculate fair value. Discounts may also be applied due to the nature or duration of any restrictions on the disposition of the investments. Valuations may also be based upon current market prices of securities that are comparable in coupon, rating, maturity, and industry. The derived value of a Level 3 investment may not represent the value which is received upon disposition and this could impact the results of operations.
The following table summarizes the valuation of the Fund’s investments by fair value hierarchy levels as of December 31, 2023:
| | | Level 1 | | | Level 2 | | | Total | |
| Securities | | | | | | | | | | | | |
| Assets: | | | | | | | | | | | | |
| Agency Collateralized Mortgage Obligations | | $ | — | | | $ | 9,742,552 | | | $ | 9,742,552 | |
| Agency Commercial Mortgage-Backed Securities | | | — | | | | 28,444,673 | | | | 28,444,673 | |
| Agency Mortgage-Backed Securities | | | — | | | | 20,359,257 | | | | 20,359,257 | |
| Collateralized Debt Obligations | | | — | | | | 43,551,077 | | | | 43,551,077 | |
| Corporate Bonds | | | — | | | | 367,456,533 | | | | 367,456,533 | |
| Government Agency Obligations | | | — | | | | 6,093,129 | | | | 6,093,129 | |
| Non-Agency Asset-Backed Securities | | | — | | | | 89,980,863 | | | | 89,980,863 | |
| Non-Agency Collateralized Mortgage Obligations | | | — | | | | 9,447,430 | | | | 9,447,430 | |
| Sovereign Bonds | | | — | | | | 387,011 | | | | 387,011 | |
| US Treasury Obligations | | | — | | | | 208,647,605 | | | | 208,647,605 | |
| Short-Term Investments | | | 52,969,344 | | | | — | | | | 52,969,344 | |
Notes to financial statements
Delaware Limited-Term Diversified Income Fund
3. Investments (continued)
| | | Level 1 | | | Level 2 | | | Total | |
| Total Value of Securities | | $ | 52,969,344 | | | $ | 784,110,130 | | | $ | 837,079,474 | |
| Derivatives1 | | | | | | | | | | | | |
| Assets: | | | | | | | | | | | | |
| Futures Contracts | | $ | 1,572,101 | | | $ | — | | | $ | 1,572,101 | |
1Futures contracts are valued at the unrealized appreciation (depreciation) on the instrument at the year end.
During the year ended December 31, 2023, there were no transfers into or out of Level 3 investments. The Fund's policy is to recognize transfers into or out of Level 3 investments based on fair value at the beginning of the reporting year.
A reconciliation of Level 3 investments is presented when the Fund has a significant amount of Level 3 investments at the beginning or end of the year in relation to the Fund's net assets. As of December 31, 2023, there were no Level 3 investments.
4. Dividend and Distribution Information
Income and long-term capital gain distributions are determined in accordance with federal income tax regulations, which may differ from US GAAP. Additionally, distributions from net gains on foreign currency transactions and net short-term gains on sales of investment securities are treated as ordinary income for federal income tax purposes. The tax character of dividends and distributions paid during the years ended December 31, 2023 and 2022 were as follows:
| | | Year ended | |
| | | | 12/31/23 | | | | 12/31/22 | |
| Ordinary income | | $ | 18,568,692 | | | $ | 11,051,529 | |
5. Components of Net Assets on a Tax Basis
As of December 31, 2023, the components of net assets on a tax basis were as follows:
| Shares of beneficial interest | | $ | 951,155,014 | |
| Undistributed ordinary income | | | 900,857 | |
| Distributions payable | | | (93,095 | ) |
| Capital loss carryforwards* | | | (145,095,067 | ) |
| Deferred directors fees | | | (39,609 | ) |
| Unrealized depreciation of investments, foreign currencies and derivatives | | | (8,193,137 | ) |
| Net assets | | $ | 798,634,963 | |
| * | A portion of the Fund's capital loss carryforward is subject to limitation under the Internal Revenue Code and related regulations. |
The differences between book basis and tax basis components of net assets are primarily attributable to tax deferral of losses on wash sales, tax deferral on straddle losses, mark-to-market of futures contracts, and tax treatment of market discount and premium on debt instruments.
For financial reporting purposes, capital accounts are adjusted to reflect the tax character of permanent book/tax differences. Reclassifications are primarily due to reorganization-related adjustments, amortization on fixed income securities, and paydown gains (loss) of asset- and mortgage-back securities. Results of operations and net assets were not affected by these reclassifications. For the year ended December 31, 2023, the adjustments were to decrease total distributable earnings (loss) and increase paid-in capital by $47,599,784.
For federal income tax purposes, capital loss carryforwards may be carried forward and applied against future capital gains. At December 31, 2023, the Fund has capital loss carryforwards available to offset future realized capital gains as follows:
|
| | Loss carryforward character | | | | |
| | Short-term | | | | Long-term | | | | Total | |
| $ | 45,129,760 | | | $ | 99,965,307 | | | $ | 145,095,067 | |
6. Capital Shares
Transactions in capital shares were as follows:
| | | Year ended | |
| | | | 12/31/23 | | | | 12/31/22 | |
| Shares sold: | | | | | | | | |
| Class A | | | 6,400,453 | | | | 4,039,237 | |
| Class C | | | 268,208 | | | | 454,886 | |
| Class R | | | 7,679 | | | | 9,455 | |
| Institutional Class | | | 10,931,906 | | | | 9,669,965 | |
| Class R6 | | | 3,136,214 | | | | 75,973 | |
| | | | | | | | | |
| Shares from merger:1 | | | | | | | | |
| Class A | | | 32,346,919 | | | | — | |
| Class C | | | 784,886 | | | | — | |
| Class R | | | 43,477 | | | | — | |
| Institutional Class | | | 24,910,064 | | | | — | |
| Class R6 | | | 476,853 | | | | — | |
Notes to financial statements
Delaware Limited-Term Diversified Income Fund
6. Capital Shares (continued)
| | | Year ended | |
| | | | 12/31/23 | | | | 12/31/22 | |
| Shares issued upon reinvestment of dividends and distributions: | | | | | | | | |
| Class A | | | 1,240,119 | | | | 679,355 | |
| Class C | | | 34,645 | | | | 19,598 | |
| Class R | | | 3,449 | | | | 1,958 | |
| Institutional Class | | | 1,019,577 | | | | 517,582 | |
| Class R6 | | | 88,507 | | | | 17,133 | |
| | | | 81,692,956 | | | | 15,485,142 | |
| Shares redeemed: | | | | | | | | |
| Class A | | | (13,062,921 | ) | | | (8,193,742 | ) |
| Class C | | | (804,856 | ) | | | (639,533 | ) |
| Class R | | | (11,275 | ) | | | (17,234 | ) |
| Institutional Class | | | (20,168,147 | ) | | | (10,183,371 | ) |
| Class R6 | | | (1,470,275 | ) | | | (175,559 | ) |
| | | | (35,517,474 | ) | | | (19,209,439 | ) |
| Net increase (decrease) | | | 46,175,482 | | | | (3,724,297 | ) |
1 See Note 7.
Certain shareholders may exchange shares of one class for shares of another class in the same Fund. These exchange transactions are included as subscriptions and redemptions in the table above and on the previous page and on the “Statements of changes in net assets.” For the years ended December 31, 2023 and 2022 the Fund had the following exchange transactions:
| | | | | | Exchange Redemptions | | | | Exchange Subscriptions | | | | | |
| | | | | | Class A
Shares | | | | Class C
Shares | | | | Institutional
Class
Shares | | | | Class A
Shares | | | | Institutional
Class
Shares | | | | Class R6
Shares | | | | Value | |
| | Year ended | | | | | | | | | | | | | | | | | | | | | | | | | | | | | |
| | 12/31/23 | | | | 72,819 | | | | 7,353 | | | | 52,393 | | | | 15,631 | | | | 74,278 | | | | 42,754 | | | $ | 1,027,038 | |
| | 12/31/22 | | | | 2,098 | | | | 2,330 | | | | 2,665 | | | | 4,992 | | | | 2,101 | | | | — | | | | 55,211 | |
7. Reorganization
On February 15-16, 2023, the Board approved a proposal to reorganize Delaware Ivy Limited-Term Bond Fund, a series of Ivy Funds (the “Acquired Fund”), with and into Delaware Limited-Term Diversified Income Fund (the “Acquiring Fund”), a series of the Trust (the “Reorganization”). Pursuant to an Agreement and Plan of Reorganization (the “Plan”): (i) all of the property, and assets of Acquired Fund were acquired by the Acquiring Fund and (ii) the Trust, on behalf of Acquiring Fund, assumed the liabilities of Acquired Fund, in exchange for shares of Acquiring Fund. In accordance with the Plan, the Acquired Fund liquidated and dissolved
following the Reorganization. In approving the Reorganization, the Board considered various factors, including that the Acquiring Fund and the Acquired Fund share similar investment objectives, principal investment strategies and principal risks, and materially identical fundamental investment restrictions and that the Acquiring Fund's overall total expense ratio is expected to be equal to or lower than the corresponding Acquired Fund's total expense ratio following the Reorganization taking into account applicable expense limitation arrangements. The Reorganization was accomplished by a tax-free exchange of shares on September 15, 2023 for Acquired Fund reorganization. For financial reporting purposes, assets received and shares issued by Acquiring Fund were recorded at fair value; however, the cost basis of the investments received from the Acquired Fund was carried forward to align ongoing reporting of Acquiring Fund’s realized and unrealized gains and losses with amounts distributable to shareholders for tax purposes.
The share transactions associated with September 15, 2023 for Acquired Fund Reorganizations were as follows:
| | | Acquired
Fund
Net Assets | | | Acquired
Fund Shares
Outstanding | | | Shares
Converted
to Acquiring
Fund | | | Acquiring
Fund
Net Assets | | | Conversion
Ratio | |
| | | | Delaware Ivy Limited-Term Bond
Fund | | | | Delaware Limited-Term
Diversified Income Fund | | | | | |
| Class A | | $ | 246,784,159 | | | | 24,006,241 | | | | 32,346,919 | | | | 192,294,852 | | | | 1.3385 | |
| Class C | | | 6,020,079 | | | | 585,611 | | | | 784,886 | | | | 7,917,537 | | | | 1.3403 | |
| Class R | | | 333,903 | | | | 32,481 | | | | 43,477 | | | | 731,310 | | | | 1.3385 | |
| Institutional | | | | | | | | | | | | | | | | | | | | |
| Class | | | 191,309,290 | | | | 18,609,853 | | | | 24,910,064 | | | | 151,854,344 | | | | 1.3385 | |
| Class R6 | | | 3,657,465 | | | | 355,785 | | | | 476,853 | | | | 20,905,819 | | | | 1.3403 | |
| Class Y* | | | 1,640,177 | | | | 159,550 | | | | — | | | | — | | | | — | |
* Class Y shares of the Acquired Fund were converted into class A shares of the Acquiring Fund.
The net assets of the Acquired Fund before the Reorganization were $450,538,440. The acquired Fund net assets and shares outstanding presented on the table above do not include the shareholders that did not participate in the reorganization. The net assets of the Acquiring Fund immediately following the Reorganization were $824,242,301.
Assuming the Reorganizations had been completed on January 1, 2023, Acquiring Fund's pro forma results of operations for the year ended December 31, 2023, would have been as follows:
| Net investment income | | $ | 25,039,362 | |
| Net realized loss on investments | | | (16,493,714 | ) |
| Net change in unrealized appreciation (depreciation) | | | 26,268,228 | |
| Net increase in net assets resulting from operations | | $ | 34,813,876 | |
Notes to financial statements
Delaware Limited-Term Diversified Income Fund
7. Reorganization (continued)
Because the combined investment portfolios have been managed as a single integrated portfolio since the acquisition was completed, it is not practical to separate the amounts of revenue and earnings of Acquired Fund that have been included in Acquiring Fund’s “Statement of operations” since the Reorganization was consummated on September 15, 2023.
8. Line of Credit
The Fund, along with certain other funds in the Delaware Funds (Participants), was a participant in a $355,000,000 revolving line of credit (Agreement) intended to be used for temporary or emergency purposes as an additional source of liquidity to fund redemptions of investor shares. Under the Agreement, the Participants were charged an annual commitment fee of 0.15%, which was allocated across the Participants based on a weighted average of the respective net assets of each Participant. The Participants were permitted to borrow up to a maximum of one-third of their net assets under the Agreement. Each Participant was individually, and not jointly, liable for its particular advances, if any, under the line of credit. The line of credit available under the Agreement expired on October 30, 2023.
On October 30, 2023, the Fund, along with the other Participants, entered into an amendment to the Agreement for a $335,000,000 revolving line of credit. It operates in substantially the same manner as the original Agreement. Under the amendment to the Agreement, the Participants are charged an annual commitment fee of 0.15%, which is allocated across the Participants based on a weighted average of the respective net assets of each Participant. The line of credit available under the Agreement expires on October 28, 2024.
The Fund had no amounts outstanding as of December 31, 2023, or at any time during the year then ended.
9. Derivatives
US GAAP requires disclosures that enable investors to understand: (1) how and why an entity uses derivatives; (2) how they are accounted for; and (3) how they affect an entity’s results of operations and financial position.
Futures Contracts — A futures contract is an agreement in which the writer (or seller) of the contract agrees to deliver to the buyer an amount of cash or securities equal to a specific dollar amount times the difference between the value of a specific security or index at the close of the last trading day of the contract and the price at which the agreement is made. The Fund may use futures contracts in the normal course of pursuing its investment objective. The Fund may invest in futures contracts to hedge its existing portfolio securities against fluctuations in value caused by changes in interest rates or market conditions. Upon entering into a futures contract, the Fund deposits cash or pledges US government securities to a broker, equal to the minimum “initial margin” requirements of the exchange on which the contract is traded. Subsequent payments are received from the broker or paid to the broker each day, based on the daily fluctuation in the market value of the contract. These receipts or payments are known as “variation margin” and
are recorded daily by the Fund as unrealized gains or losses until the contracts are closed. When the contracts are closed, the Fund records a realized gain or loss equal to the difference between the value of the contract at the time it was opened and the value at the time it was closed. Risks of entering into futures contracts include potential imperfect correlation between the futures contracts and the underlying securities and the possibility of an illiquid secondary market for these instruments. When investing in futures, there is reduced counterparty credit risk to the Fund because futures are exchange-traded and the exchange’s clearinghouse, as counterparty to all exchange-traded futures, guarantees against default. At December 31, 2023, the Fund posted $881,705 in cash as collateral for open futures contracts, which is included in “Cash collateral due from brokers” on the “Statement of assets and liabilities". Open futures contracts, if any, are disclosed on the “Schedule of investments.”
During the year ended December 31, 2023, the Fund experienced net realized and unrealized gains or losses attributable to futures contracts holdings, which are disclosed on the "Statement of assets and liabilities" and “Statement of operations.”
During the year ended December 31, 2023, the Fund entered into futures contracts to hedge the Fund’s existing portfolio securities against fluctuations in value caused by changes in interest rates or market conditions.
The table below summarizes the average daily balance of derivative holdings by the Fund during the year ended December 31, 2023:
| | | | Long Derivative
Volume | | | Short Derivative
Volume | |
| Futures contracts (average notional value) | | | | 89,110,881 | | | | 2,221,456 | |
10. Securities Lending
The Fund, along with other funds in the Delaware Funds, may lend its securities pursuant to a security lending agreement (Lending Agreement) with The Bank of New York Mellon (BNY Mellon). At the time a security is loaned, the borrower must post collateral equal to the required percentage of the market value of the loaned security, including any accrued interest. The required percentage is: (1) 102% with respect to US securities and foreign securities that are denominated and payable in US dollars; and (2) 105% with respect to foreign securities. With respect to each loan, if on any business day the aggregate market value of securities collateral plus cash collateral held is less than the aggregate market value of the securities which are the subject of such loan, the borrower will be notified to provide additional collateral by the end of the following business day, which, together with the collateral already held, will be not less than the applicable initial collateral requirements for such security loan. If the aggregate market value of securities collateral and cash collateral held with respect to a security loan exceeds the applicable initial collateral requirement, upon the request of the borrower, BNY Mellon must return enough collateral to the borrower by the end of the following business day to reduce the value of the remaining collateral to the applicable initial collateral requirement for such security loan. As a result of the foregoing, the value of the collateral held with respect to a loaned security
Notes to financial statements
Delaware Limited-Term Diversified Income Fund
10. Securities Lending (continued)
on any particular day, may be more or less than the value of the security on loan. The collateral percentage with respect to the market value of the loaned security is determined by the security lending agent.
Cash collateral received by the Fund is generally invested in an individual separate account. The investment guidelines permit each separate account to hold certain securities that would be considered eligible securities for a money market fund. Cash collateral received is generally invested in government securities; certain obligations issued by government sponsored enterprises; repurchase agreements collateralized by US Treasury securities; obligations issued by the central government of any Organization for Economic Cooperation and Development (OECD) country or its agencies, instrumentalities, or establishments; obligations of supranational organizations; commercial paper, notes, bonds, and other debt obligations; certificates of deposit, time deposits, and other bank obligations; certain money market funds; and asset-backed securities. The Fund can also accept US government securities and letters of credit (non-cash collateral) in connection with securities loans.
In the event of default or bankruptcy by the lending agent, realization and/or retention of the collateral may be subject to legal proceedings. In the event the borrower fails to return loaned securities and the collateral received is insufficient to cover the value of the loaned securities and provided such collateral shortfall is not the result of investment losses, the lending agent has agreed to pay the amount of the shortfall to the Fund or, at the discretion of the lending agent, replace the loaned securities. The Fund continues to record dividends or interest, as applicable, on the securities loaned and is subject to changes in value of the securities loaned that may occur during the term of the loan. The Fund has the right under the Lending Agreement to recover the securities from the borrower on demand. With respect to security loans collateralized by non-cash collateral, the Fund receives loan premiums paid by the borrower. With respect to security loans collateralized by cash collateral, the earnings from the collateral investments are shared among the Fund, the security lending agent, and the borrower. The Fund records security lending income net of allocations to the security lending agent and the borrower.
The Fund may incur investment losses as a result of investing securities lending collateral. This could occur if an investment in the collateral investment account defaulted or became impaired. Under those circumstances, the value of the Fund's cash collateral account may be less than the amount the Fund would be required to return to the borrowers of the securities and the Fund would be required to make up for this shortfall.
At December 31, 2023, the Fund had no securities out on loan.
11. Credit and Market Risks
The impact of COVID-19, and other infectious illness outbreaks that may arise in the future, could adversely affect the economies of many nations or the entire global economy, individual issuers and capital markets in ways that cannot necessarily be foreseen.
Investments in equity securities in general are subject to market risks that may cause their prices to fluctuate over time. Fluctuations in the value of equity securities in which the Fund invests will cause the NAV of the Fund to fluctuate.
When interest rates rise, fixed income securities (i.e. debt obligations) generally will decline in value. These declines in value are greater for fixed income securities with longer maturities or durations. Interest rate changes are influenced by a number of factors, such as government policy, monetary policy, inflation expectations, and the supply and demand of bonds. A fund may be subject to a greater risk of rising interest rates when interest rates are low or inflation rates are high or rising.
Some countries in which the Fund may invest require governmental approval for the repatriation of investment income, capital, or the proceeds of sales of securities by foreign investors. In addition, if there is deterioration in a country’s balance of payments or for other reasons, a country may impose temporary restrictions on foreign capital remittances abroad.
The securities exchanges of certain foreign markets are substantially smaller, less liquid, and more volatile than the major securities markets in the US. Consequently, acquisition and disposition of securities by the Fund may be inhibited. In addition, a significant portion of the aggregate market value of equity securities listed on the major securities exchanges in emerging markets is held by a smaller number of investors. This may limit the number of shares available for acquisition or disposition by the Fund.
The Fund invests a portion of its assets in high yield fixed income securities, which are securities rated lower than BBB- by S&P and Baa3 by Moody’s, or similarly rated by another nationally recognized statistical rating organization. Investments in these higher yielding securities are generally accompanied by a greater degree of credit risk than higher rated securities. Additionally, lower rated securities may be more susceptible to adverse economic and competitive industry conditions than investment grade securities.
The Fund may invest in mortgage-backed and asset-backed securities. Mortgage-backed and asset-backed securities, like other fixed income securities, are subject to credit risk and interest rate risk, and may also be subject to prepayment risk and extension risk. Mortgage-backed and asset-backed securities can be highly sensitive to interest rate changes. As a result, small movements in interest rates can substantially impact the value and liquidity of these securities. Prepayment risk is the risk that the principal on mortgage-backed or asset-backed securities may be prepaid at any time, which will reduce the yield and market value of the securities and may cause the Fund to reinvest the proceeds in lower yielding securities. Extension risk is the risk that principal on mortgage-backed or asset-backed securities will be repaid more slowly than expected, which may reduce the proceeds available for reinvestment in higher yielding securities and may cause the security to experience greater volatility due to the extended maturity of the security. When interest rates rise, the value of mortgage-backed and asset-backed securities can be expected to decline. When interest rates go down, however, the value of these securities may not increase as much as other fixed income securities due to borrowers refinancing their loans at lower interest rates or prepaying their loans. In addition, mortgage-backed and asset-backed
Notes to financial statements
Delaware Limited-Term Diversified Income Fund
11. Credit and Market Risks (continued)
securities may decline in value, become more volatile, face difficulties in valuation, or experience reduced liquidity due to changes in general economic conditions. During periods of economic downturn, for example, underlying borrowers may not make timely payments on their loans and the value of property that secures the loans may decline in value such that it is worth less than the amount of the associated loans. If the collateral securing a mortgage-backed or asset-backed security is insufficient to repay the loan, the Fund could sustain a loss. Such risks generally will be heightened where a mortgage-backed or asset-backed security includes “subprime” loans. Although mortgage-backed securities are often supported by government guarantees or private insurance, there can be no guarantee that those obligations will be met. Furthermore, in certain economic conditions, loan servicers, loan originators and other participants in the market for mortgage-backed and other asset-backed securities may be unable to receive sufficient funding, impairing their ability to perform their obligations on the loans. Certain mortgage-backed or asset-backed securities may be more susceptible to these risks than other mortgage-backed, asset-backed, or fixed-income securities. For example, the Fund’s investments in CMOs, real estate mortgage investment conduits (“REMICs”), and stripped mortgage-backed securities are generally highly susceptible to interest rate risk, prepayment risk, and extension risk. At times, these investments may be difficult to value and/or illiquid. Some classes of CMOs and REMICs may have preference in receiving principal or interest payments relative to more junior classes. The market prices and yields of these junior classes will generally be more volatile than more senior classes and will be more susceptible to interest rate risk, prepayment risk, and extension risk than more senior classes. Stripped mortgage-backed securities that receive only payments of interest (“IOs”) will generally decrease in value if interest rates decline or prepayment rates increase. Stripped mortgage-backed securities that receive only payments of principal (“POs”) will generally decrease in value if interest rates increase or prepayment rates decrease. These changes in value can be substantial and could cause the Fund to lose the entire value of its investment in CMOs, REMICs, and stripped mortgage-backed securities.
The Fund invests in certain obligations that may have liquidity protection designed to ensure that the receipt of payments due on the underlying security is timely. Such protection may be provided through guarantees, insurance policies, or letters of credit obtained by the issuer or sponsor through third parties, through various means of structuring the transaction, or through a combination of such approaches. The Fund will not pay any additional fees for such credit support, although the existence of credit support may increase the price of the security.
Derivatives contracts, such as futures, forward foreign currency contracts, options, and swaps, may involve additional expenses (such as the payment of premiums) and are subject to significant loss, which may exceed amounts disclosed on the Statement of Assets and Liabilities, if a security, index, reference rate, or other asset or market factor to which a derivatives contract is associated, moves in the opposite direction from what the portfolio manager anticipated. When used for hedging, the change in value of the derivatives instrument may also not correlate specifically with the currency, rate, or other risk being hedged, in which case a fund may not realize the intended benefits. Derivatives contracts are also subject to the risk that the
counterparty may fail to perform its obligations under the contract due to, among other reasons, financial difficulties (such as a bankruptcy or reorganization).
The Fund may invest up to 15% of its net assets in illiquid securities, which may include securities with contractual restrictions on resale, securities exempt from registration under Rule 144A promulgated under the Securities Act of 1933, as amended, and other securities which may not be readily marketable. The relative illiquidity of these securities may impair the Fund from disposing of them in a timely manner and at a fair price when it is necessary or desirable to do so. While maintaining oversight, the Board has delegated to DMC the day-to-day functions of determining whether individual securities are liquid for purposes of the Fund’s limitation on investments in illiquid securities. Securities eligible for resale pursuant to Rule 144A, which are determined to be liquid, are not subject to the Fund’s 15% limit on investments in illiquid securities. Rule 144A securities have been identified on the “Schedule of investments.”
12. Contractual Obligations
The Fund enters into contracts in the normal course of business that contain a variety of indemnifications. The Fund's maximum exposure under these arrangements is unknown. However, the Fund has not had prior claims or losses pursuant to these contracts. Management has reviewed the Fund's existing contracts and expects the risk of loss to be remote.
13. Subsequent Events
Management has determined that no material events or transactions occurred subsequent to December 31, 2023, that would require recognition or disclosure in the Fund's financial statements.
Report of independent
registered public accounting firm
To the Board of Trustees of Delaware Group® Limited-Term Government Funds and Shareholders of Delaware Limited-Term Diversified Income Fund
Opinion on the Financial Statements
We have audited the accompanying statement of assets and liabilities, including the schedule of investments, of Delaware Limited-Term Diversified Income Fund (one of the funds constituting Delaware Group® Limited-Term Government Funds, referred to hereafter as the “Fund”) as of December 31, 2023, the related statement of operations for the year ended December 31, 2023, the statement of changes in net assets for each of the two years in the period ended December 31, 2023, including the related notes, and the financial highlights for each of the five years in the period ended December 31, 2023 (collectively referred to as the “financial statements”). In our opinion, the financial statements present fairly, in all material respects, the financial position of the Fund as of December 31, 2023, the results of its operations for the year then ended, the changes in its net assets for each of the two years in the period ended December 31, 2023 and the financial highlights for each of the five years in the period ended December 31, 2023 in conformity with accounting principles generally accepted in the United States of America.
Basis for Opinion
These financial statements are the responsibility of the Fund’s management. Our responsibility is to express an opinion on the Fund’s financial statements based on our audits. We are a public accounting firm registered with the Public Company Accounting Oversight Board (United States) (PCAOB) and are required to be independent with respect to the Fund in accordance with the U.S. federal securities laws and the applicable rules and regulations of the Securities and Exchange Commission and the PCAOB.
We conducted our audits of these financial statements in accordance with the standards of the PCAOB. Those standards require that we plan and perform the audit to obtain reasonable assurance about whether the financial statements are free of material misstatement, whether due to error or fraud.
Our audits included performing procedures to assess the risks of material misstatement of the financial statements, whether due to error or fraud, and performing procedures that respond to those risks. Such procedures included examining, on a test basis, evidence regarding the amounts and disclosures in the financial statements. Our audits also included evaluating the accounting principles used and significant estimates made by management, as well as evaluating the overall presentation of the financial statements. Our procedures included confirmation of securities owned as of December 31, 2023 by correspondence with the custodian, transfer agents and brokers. We believe that our audits provide a reasonable basis for our opinion.
/s/PricewaterhouseCoopers LLP
Philadelphia, Pennsylvania
February 19, 2024
We have served as the auditor of one or more Macquarie investment companies since 2010.
Other Fund information (Unaudited)
Delaware Limited-Term Diversified Income Fund
Tax Information
The information set forth below is for the Fund’s fiscal year as required by federal income tax laws. Shareholders, however, must report distributions on a calendar year basis for income tax purposes, which may include distributions for portions of two fiscal years of the Fund. Accordingly, the information needed by shareholders for income tax purposes will be sent to them in January of each year. Please consult your tax advisor for proper treatment of this information.
All disclosures are based on financial information available as of the date of this annual report and, accordingly are subject to change. For any and all items requiring reporting, it is the intention of the Fund to report the maximum amount permitted under the Internal Revenue Code and the regulations thereunder.
For the fiscal year ended December 31, 2023, the Fund reports distributions paid during the year as follows:
| (A) Ordinary Income Distributions (Tax Basis) | | | 100.00 | % |
(A) is based on a percentage of the Fund’s total distributions.
Board Consideration of Investment Management Agreement and Sub-Advisory Agreements at a Meeting Held on August 8-10, 2023
At a meeting held on August 8-10, 2023 (the “Annual Contract Renewal Meeting”), the Board of Trustees (the “Board”), including a majority of Trustees each of whom is not an “interested person” as defined under the Investment Company Act of 1940 (the “Independent Trustees”), approved the renewal of the Delaware Limited-Term Diversified Income Fund (the “Fund”) Investment Management Agreement with Delaware Management Company (“DMC”) and the Sub-Advisory Agreements with Macquarie Investment Management Global Limited (“MIMGL”), Macquarie Investment Management Austria Kapitalanlage AG (“MIMAK”) and Macquarie Investment Management Europe Limited (“MIMEL”) (together, the “Affiliated Sub-Advisers”).
Prior to the Annual Contract Renewal Meeting, including at a Board meeting held in May 2023, the Trustees conferred extensively among themselves and with representatives of DMC about these matters. Also, the Board was assisted by the Equity Investments Committee and the Fixed Income Multi-Asset Sub-Advised Funds Investments Committee (each an “Investment Committee” and together, the “Investment Committees”), with each Investment Committee assisting the full Board in reviewing investment performance and other matters throughout the year. The Independent Trustees were also assisted in their evaluation of the Investment Management Agreement and the Sub-Advisory Agreements by independent legal counsel, from whom they received separate legal advice and with whom they met separately.
In providing information to the Board, DMC was guided by a detailed set of requests for information submitted to them by independent legal counsel on behalf of the Independent Trustees at the start of the Board’s annual contract renewal process earlier in 2023. Prior to the Annual Contract Renewal Meeting, and in response to the requests, the Board received and
Other Fund information (Unaudited)
Delaware Limited-Term Diversified Income Fund
Board Consideration of Investment Management Agreement and Sub-Advisory Agreements at a Meeting Held on August 8-10, 2023 (continued)
reviewed materials specifically relating to the renewal of the Investment Management Agreement and the Sub-Advisory Agreements. In considering and approving the Investment Management Agreement and the Sub-Advisory Agreements, the Trustees considered the information they believed relevant, including but not limited to the information discussed below. The Board considered not only the specific information presented in connection with the Annual Contract Renewal Meeting and the review process for the Investment Management Agreement and the Sub-Advisory Agreements, but also the knowledge gained over time through interaction with DMC about various topics. In this regard, the Board reviewed reports of DMC at each of its quarterly meetings, which included information about, among other things, Fund performance, investment strategies, and expenses. In addition, the Investment Committees confer with portfolio managers at various times throughout the year. In considering information relating to the approval of the Fund’s Investment Management Agreement and the Sub-Advisory Agreements, the Independent Trustees also received information from an independent fund consultant, JDL Consultants, LLC (“JDL”).
The Board did not identify any particular information or consideration that was all-important or controlling, and each individual Trustee may have attributed different weights to various factors.
After its deliberations, the Board, including the Independent Trustees, unanimously approved the continuation of the Investment Management Agreement and the Sub-Advisory Agreements for a one-year term. The following summarizes a number of important, but not necessarily all, factors considered by the Board in support of its approval.
Nature, extent, and quality of services. The Board received and considered various information regarding the nature, extent, and quality of the advisory services provided to the Fund by DMC under its Investment Management Agreement and the experience of the officers and employees of DMC who provide these services, including the Fund’s portfolio managers. The Board’s review included consideration of DMC’s investment process and oversight and research and analysis capabilities, and its ability to attract and retain skilled investment professionals. The Board also considered information regarding DMC’s programs for risk management, including investment, operational, liquidity, derivatives (as applicable), valuation, and compliance risks. The Board received information with respect to the cybersecurity program and business continuity plans of DMC and its affiliates.
In addition, the Board considered certain non-advisory services that DMC and its affiliates provide to the Delaware Funds by Macquarie complex (the “Delaware Funds”). Among other things, these services include third party service provider oversight, transfer agency, internal audit, valuation, portfolio trading, and legal and compliance functions. The Board noted DMC’s responsibility for overseeing the preparation of the Delaware Funds’ registration statement and supplements thereto and shareholder reports; responsibility for periodic filings with regulators; organizing Board meetings and preparing materials for such Board meetings; and furnishing analytical and other support to assist the Board. The Board took into account the benefits to shareholders of investing in a Fund that is part of a family of funds managed by an affiliate of
Macquarie Group Ltd. (“Macquarie”), the parent company of DMC, and the resources available to DMC as part of Macquarie’s global asset management business.
The Board received and considered various information with respect to the services provided by the Affiliated Sub-Advisers under the Sub-Advisory Agreements and the credentials and experience of the officers and employees of the Affiliated Sub-Advisers who provide these services. The Board considered the division of responsibilities between DMC and the Affiliated Sub-Advisers and the oversight provided by DMC. The Board also considered the expertise of the Affiliated Sub-Advisers with respect to certain asset classes and/or investment styles. The Board noted that the Affiliated Sub-Advisers are part of Macquarie’s global investment platform that has offices and personnel that are located around the world. These Affiliated Sub-Advisers provide research, investment and trading analysis on the markets and economies of various countries in which the Fund may invest, make recommendations regarding securities, provide portfolio management services and assist with security trades, as applicable. The Board took into account that the Sub-Advisory Agreements may benefit the Fund and its shareholders by permitting DMC to use the resources and talents of the Affiliated Sub-Advisers in managing the Fund.
The Board also received and considered information about the nature and extent of services offered and fee rates charged by DMC to other types of clients with investment strategies similar to those of the Fund. In this regard, the Board received information about the significantly greater scope of services, and compliance, reporting and other legal and regulatory obligations and risks of managing registered investment companies compared with those associated with managing assets of other types of clients, including third-party sub-advised fund clients, unregistered funds and separately managed accounts.
The Board concluded that, overall, it was satisfied with the nature, extent and quality of services provided (and expected to be provided) to the Fund by DMC and the Affiliated Sub-Advisers.
Investment performance. The Board received and considered information with respect to the investment performance of the Fund, including performance reports and discussions with portfolio managers at meetings of the Board’s Investment Committees throughout the year as well as reports provided by Broadridge Financial Solutions, Inc., an independent investment company data provider (“Broadridge”), furnished for the Annual Contract Renewal Meeting. The Broadridge reports prepared for the Fund’s institutional share class showed its investment performance in comparison to the institutional share class of a group of similar funds (the “Performance Universe”). The Board received a description of the methodology used by Broadridge to select the peer funds in the Performance Universe. Comparative annualized performance for the Fund was shown for the past 1-, 3-, 5-, and 10-year or since inception periods, as applicable, ended December 31, 2022.
The Performance Universe for the Fund consisted of the Fund and all retail and institutional short-intermediate investment-grade debt funds, regardless of asset size or primary channel of distribution. The Board noted that the Broadridge report comparison showed that the Fund’s total return for the 1- and 3-year periods was in the first quartile of its Performance Universe and for the 5- and 10-year periods was in the third quartile of its Performance Universe. The Broadridge report comparison showed that the Fund’s total return for the 1- and 3-year periods was above
Other Fund information (Unaudited)
Delaware Limited-Term Diversified Income Fund
Board Consideration of Investment Management Agreement and Sub-Advisory Agreements at a Meeting Held on August 8-10, 2023 (continued)
the median of its Performance Universe and for the 5- and 10-year periods was below the median of its Performance Universe. The Board also noted that the Fund outperformed its benchmark index for the 3-year period and underperformed its benchmark index for the 1-, 5-, and 10-year periods. The Board, however, noted that the investment performance of the current portfolio management team only began as of September 2020. The Board noted the explanations from DMC and from the Affiliated Sub-Advisers concerning the reasons for the Fund’s relative performance versus its Performance Universe and benchmark index for the various periods. The Board noted that the Fund’s performance was ahead of its Performance Universe median for the 1-year and 3-year periods.
Comparative expenses. The Board received and considered expense data for the Fund. DMC provided the Board with information on pricing levels and fee structures for the Fund as of its most recently completed fiscal year. The Broadridge total expenses, for comparative consistency, were shown by Broadridge for Institutional Class shares and comparative total expenses including 12b-1 and non-12b-1 service fees. The Board also considered the comparative analysis of contractual management fees and actual total expense ratios of the Fund versus contractual management fees and actual total expense ratios of a group of peer funds as selected by Broadridge (the “Expense Group”). In reviewing comparative costs, the Fund’s contractual management fee and the actual management fee incurred by the Fund were compared with the contractual management fees (assuming all funds in the Expense Group were similar in size to the Fund) and actual management fees, taking into account any applicable breakpoints and fee waivers, with the Fund’s expense universe, which is comprised of the Fund, its Expense Group and all other similar institutional funds, excluding outliers (the “Expense Universe”). The Fund’s total expenses were also compared with those of its Expense Universe. The Board also received and considered information regarding the Fund’s net operating expense ratios and their various components, including actual management fees, custodian and other non-management fees, and Rule 12b-1 and non-Rule 12b-1 shareholder service fees.
The expense comparisons for the Fund showed that its actual management fee was below the median of its Expense Universe and its actual total expenses were below its Expense Group average. It was noted that consistent with DMC’s waiver methodology, its advisory fee waivers, if any, were at the fund level and not class level.
The Board noted that DMC, and not the Fund, pays the sub-advisory fees to the Affiliated Sub-Advisers and, accordingly, that the retention of the Affiliated Sub-Advisers does not increase the fees and expenses incurred by the Fund.
Based on its consideration of the factors and information it deemed relevant, including those described here, the Board determined that the compensation payable to DMC under the Investment Management Agreement and to the Affiliated Sub-Advisers under the Sub-Advisory Agreements was reasonable.
Economies of scale. The Board received and considered information about the potential for DMC to realize economies of scale in the provision of management services to the Fund, the
difficulties of calculating economies of scale at an individual Fund level, and the extent to which potential scale benefits are shared with shareholders, including the extent to which any economies of scale are reflected in the level of management fees charged. DMC discussed its advisory fee pricing and structure for the Delaware Funds, including the current breakpoints. The Board noted that the Fund may also benefit from economies of scale through initial fee setting, fee waivers and expense reimbursements, as well as DMC’s investment in its business, including investments in business infrastructure, technology and cybersecurity.
Management profitability. The Board received and considered the Investment Management Profitability Analysis that addressed the overall profitability of DMC’s business in providing management and other services to the Fund and the Delaware Funds as a whole, including the methodology used by DMC in allocating costs for the purpose of determining profitability. The Board noted DMC’s changes to its cost allocation methodology for its profitability analysis and the explanations for such changes. The Board also reviewed a report prepared by JDL regarding DMC’s profitability as compared to certain peer fund complexes and the Independent Trustees discussed DMC’s profitability in such context with representatives from JDL. The Board recognized that calculating and comparing profitability at the individual fund level is difficult; that DMC’s profit, if any, can vary significantly depending on the particular fund; and that DMC’s support for, and commitment to, a fund is not solely dependent on the profits realized as to that fund.
The Board also received and considered information about the portion of the total management fee that was retained by DMC after payment of the fee to the Affiliated Sub-Advisers for sub-advisory services. In assessing the reasonableness of this amount, the Board received and evaluated information about the nature and extent of the responsibilities retained and risk assumed by DMC and not delegated to or assumed by the Affiliated Sub-Advisers. Given the affiliation between DMC and the Affiliated Sub-Advisers, the Board ascribed limited relevance to the allocation of fees between them.
Based on its review, the Board determined that DMC’s profitability was not excessive in light of the nature, extent and quality of the services provided to the Fund.
Ancillary benefits. The Board received and considered information regarding the extent to which DMC and its affiliates might derive ancillary benefits from fund operations, including the potential for procuring additional business as a result of the prestige and visibility associated with its role as investment manager to the Delaware Funds; the benefits from allocation of fund brokerage to improve trading efficiencies; the portfolio transactions executed through “soft dollar” arrangements; and the fees that various affiliates received for serving as transfer agent and for overseeing fund accounting and financial administration services to the Delaware Funds. The Board considered that it receives periodic reports from DMC that include a representation that any soft dollar arrangements are consistent with regulatory requirements. The Board received information from DMC regarding its view of the performance of its affiliates in providing transfer agent and fund accounting and financial administration oversight services and the organizational structure employed to provide these services pursuant to their contracts with the Fund.
Based on its consideration of the factors and information it deemed relevant, including the costs of providing investment management and other services to the Fund and the ongoing
Other Fund information (Unaudited)
Delaware Limited-Term Diversified Income Fund
Board Consideration of Investment Management Agreement and Sub-Advisory Agreements at a Meeting Held on August 8-10, 2023 (continued)
commitment of DMC and its affiliates to the Fund, the Board did not find that any ancillary benefits received by DMC and its affiliates, including the Affiliated Sub-Advisers, were unreasonable.
Conclusion. Based on its review, consideration and evaluation of all factors it believed relevant, including the above-described factors and conclusions, the Board, including all of the Independent Trustees, approved the continuation of DMC’s Investment Management Agreement and of the Affiliated Sub-Advisers’ Sub-Advisory Agreements for an additional one-year period.
Form N-PORT and proxy voting information
The Fund files its complete schedule of portfolio holdings with the Securities and Exchange Commission (SEC) for the first and third quarters of each fiscal year on Form N-PORT. The Fund’s Form N-PORT, as well as a description of the policies and procedures that the Fund uses to determine how to vote proxies (if any) relating to portfolio securities, is available without charge (i) upon request, by calling 800 523-1918; and (ii) on the SEC’s website at sec.gov. In addition, a description of the policies and procedures that the Fund uses to determine how to vote proxies (if any) relating to portfolio securities and the Schedule of Investments included in the Fund’s most recent Form N-PORT are available without charge on the Fund’s website at delawarefunds.com/literature.
Information (if any) regarding how the Fund voted proxies relating to portfolio securities during the most recently disclosed 12-month period ended June 30 is available without charge (i) through the Fund’s website at delawarefunds.com/proxy; and (ii) on the SEC’s website at sec.gov.
Board of trustees and officers addendum
Delaware Funds by Macquarie®
A mutual fund is governed by a Board of Trustees (“Trustees”), which has oversight responsibility for the management of a fund’s business affairs. Trustees establish procedures and oversee and review the performance of the investment manager, the distributor, and others who perform services for the fund. The independent fund trustees, in particular, are advocates for shareholder interests. Each trustee has served in that capacity since he or she was elected to or appointed to the Board of Trustees, and will continue to serve until his or her retirement or the election of a new trustee in his or her place. The following is a list of the Trustees and Officers with certain background and related information.
Name,
Address,
and Birth Year | | Position(s)
Held with
the Trust | | Length of Time
Served1 | | Number of
Funds in Fund
Complex Overseen
by Trustee | | Principal
Occupation(s)
During the
Past Five Years | | Other
Directorships
Held by Trustee
During the
Past Five Years |
| Interested Trustee | | | | | | |
Shawn K. Lytle2
100 Independence
610 Market Street
Philadelphia, PA
19106-2354
1970 | | President,
Chief Executive
Officer,
and Trustee | | President and
Chief Executive
Officer
since August 2015
Trustee since
September 2015 | | 105 | | Macquarie Asset
Management3
(2015–Present)
-Head of Equities &
Multi-Asset
(2023–Present)
-Head of Americas of
Macquarie Group
(2017–Present)
-Global Head of Public
Investments
(2019–2023) | | None |
Board of trustees and officers addendum
Delaware Funds by Macquarie®
Name,
Address,
and Birth Year | | Position(s)
Held with
the Trust | | Length of Time
Served1 | | Number of
Funds in Fund
Complex Overseen
by Trustee | | Principal
Occupation(s)
During the
Past Five Years | | Other
Directorships
Held by Trustee
During the
Past Five Years |
| Independent Trustees | | | | | | |
Jerome D.
Abernathy
100 Independence
610 Market Street
Philadelphia, PA
19106-2354
1959 | | Trustee | | Since January 2019 | | 105 | | Stonebrook Capital
Management, LLC
(financial
technology: macro
factors and databases)
-Managing Member
(1993-Present) | | None |
| | | | | | | | | | | |
Ann D. Borowiec
100 Independence
610 Market Street
Philadelphia, PA
19106-2354
1958 | | Trustee | | Since March 2015 | | 105 | | J.P. Morgan Chase & Co.
(1987-2013)
-Chief Executive Officer,
Private Wealth
Management
(2011–2013) | | Banco Santander International
(2016–2019)
Santander Bank, N.A.
(2016-2019) |
Name,
Address,
and Birth Year | | Position(s)
Held with
the Trust | | Length of Time
Served1 | | Number of
Funds in Fund
Complex Overseen
by Trustee | | Principal
Occupation(s)
During the
Past Five Years | | Other
Directorships
Held by Trustee
During the
Past Five Years |
Joseph W. Chow
100 Independence
610 Market Street
Philadelphia, PA
19106-2354
1953 | | Trustee | | Since January 2013 | | 105 | | Private Investor
(2011–Present)
State Street Bank and
Trust Company
(1996-2011)
-Executive Vice President
of Enterprise Risk
Management and
Emerging Economies
Strategy; and Chief Risk
and Corporate
Administration Officer | | None |
| | | | | | | | | | | |
H. Jeffrey Dobbs
100 Independence
610 Market Street
Philadelphia, PA
19106-2354
1955 | | Trustee | | Since April 20194 | | 105 | | KPMG LLP
(2002-2015)
-Global Sector Chairman,
Industrial Manufacturing
(2010-2015) | | TechAccel LLC
(2015–Present)
PatientsVoices, Inc.
(2018–Present)
Valparaiso University Board
(2012-Present)
Ivy Funds Complex (2019-2021) |
Board of trustees and officers addendum
Delaware Funds by Macquarie®
Name,
Address,
and Birth Year | | Position(s)
Held with
the Trust | | Length of Time
Served1 | | Number of
Funds in Fund
Complex Overseen
by Trustee | | Principal
Occupation(s)
During the
Past Five Years | | Other
Directorships
Held by Trustee
During the
Past Five Years |
John A. Fry
100 Independence
610 Market Street
Philadelphia, PA
19106-2354
1960 | | Trustee | | Since January 2001 | | 105 | | Drexel University
-President
(2010–Present) | | Federal Reserve
Bank of Philadelphia
(2020–Present)
Kresge Foundation
(2018-Present)
FS Credit Real Estate Income
Trust, Inc.
(2018–Present)
vTv Therapeutics Inc.
(2017–Present)
Community Health Systems
(2004–Present)
Drexel Morgan & Co.
(2015–2019) |
Name,
Address,
and Birth Year | | Position(s)
Held with
the Trust | | Length of Time
Served1 | | Number of
Funds in Fund
Complex Overseen
by Trustee | | Principal
Occupation(s)
During the
Past Five Years | | Other
Directorships
Held by Trustee
During the
Past Five Years |
Joseph Harroz, Jr.
100 Independence
610 Market Street
Philadelphia, PA
19106-2354
1967 | | Trustee | | Since November
19984 | | 105 | | University of Oklahoma
-President
(2020–Present)
-Interim President
(2019–2020)
-Vice President and
Dean, College of Law
(2010–2019)
Brookhaven Investments
LLC (commercial
enterprises)
-Managing Member
(2019–Present)
St. Clair, LLC
(commercial enterprises)
-Managing Member
(2019–Present) | | OU Medicine, Inc.
(2020–Present)
Big 12 Athletic Conference
(2019-Present)
Valliance Bank
(2007–Present)
Ivy Funds Complex
(1998-2021) |
Board of trustees and officers addendum
Delaware Funds by Macquarie®
Name,
Address,
and Birth Year | | Position(s)
Held with
the Trust | | Length of Time
Served1 | | Number of
Funds in Fund
Complex Overseen
by Trustee | | Principal
Occupation(s)
During the
Past Five Years | | Other
Directorships
Held by Trustee
During the
Past Five Years |
Sandra A.J.
Lawrence
100 Independence
610 Market Street
Philadelphia, PA
19106-2354
1957 | | Trustee | | Since April 20194 | | 105 | | Children’s Mercy
Hospitals and Clinics
(2005–2019)
-Chief Administrative
Officer
(2016–2019) | | Brixmor Property Group Inc.
(2021-Present)
Sera Prognostics Inc.
(biotechnology) (2021-Present)
Recology (resource recovery)
(2021-2023)
Evergy, Inc., Kansas City Power
& Light Company, KCP&L
Greater Missouri Operations
Company, Westar Energy, Inc.
and Kansas Gas and Electric
Company (related utility
companies) (2018-Present)
National Association of Corporate
Directors (2017-Present)
American Shared Hospital
Services (medical device)
(2017-2021)
Ivy Funds Complex (2019-2021) |
Name,
Address,
and Birth Year | | Position(s)
Held with
the Trust | | Length of Time
Served1 | | Number of
Funds in Fund
Complex Overseen
by Trustee | | Principal
Occupation(s)
During the
Past Five Years | | Other
Directorships
Held by Trustee
During the
Past Five Years |
Frances A.
Sevilla-Sacasa
100 Independence
610 Market Street
Philadelphia, PA
19106-2354
1956 | | Trustee | | Since September 2011 | | 105 | | Banco Itaú International
-Chief Executive Officer
(2012–2016)
US Trust Bank of
America Private Wealth
Management
-President (2007-2008)
U.S. Trust Corp.
-President & CEO
(2005-2007) | | Invitation Homes Inc.
(2023-Present)
Florida Chapter of National
Association of Corporate
Directors (2021-Present)
Callon Petroleum Company
(2019-Present)
Camden Property Trust
(2011-Present)
New Senior Investment
Group Inc. (REIT) (2021)
Carrizo Oil & Gas, Inc.
(2018-2019) |
| | | | | | | | | | | |
Thomas K. Whitford
100 Independence
610 Market Street
Philadelphia, PA
19106-2354
1956 | | Chair and Trustee | | Trustee since January
2013
Chair since January
2023 | | 105 | | PNC Financial Services
Group (1983–2013)
-Vice Chairman
(2009-2013) | | HSBC USA Inc.
(2014–2022)
HSBC North America
Holdings Inc.
(2013–2022) |
Board of trustees and officers addendum
Delaware Funds by Macquarie®
Name,
Address,
and Birth Year | | Position(s)
Held with
the Trust | | Length of Time
Served1 | | Number of
Funds in Fund
Complex Overseen
by Trustee | | Principal
Occupation(s)
During the
Past Five Years | | Other
Directorships
Held by Trustee
During the
Past Five Years |
Christianna Wood
100 Independence
610 Market Street
Philadelphia, PA
19106-2354
1959 | | Trustee | | Since January 2019 | | 105 | | Gore Creek
Capital, Ltd.
-Chief Executive Officer
and President
(2009–Present)
Capital Z Asset
Management
-Chief Executive Officer
(2008-2009)
California Public
Employees' Retirement
System (CalPERS)
-Senior Investment
Officer of Global Equity
(2002-2008) | | The Merger Fund
(2013–2021),
The Merger Fund VL
(2013–2021),
WCM Alternatives: Event-Driven
Fund (2013–2021),
and WCM Alternatives: Credit
Event Fund (2017–2021)
Grange Insurance
(2013–Present)
H&R Block Corporation
(2008–2022) |
| Officers | | | | | | | | | | |
David F. Connor
100 Independence
610 Market Street
Philadelphia, PA
19106-2354
1963 | | Senior Vice President,
General Counsel, and
Secretary | | Senior Vice President,
since May 2013;
General Counsel
since May 2015;
Secretary since
October 2005 | | 105 | | David F. Connor has
served in various
capacities at different
times at Macquarie Asset
Management. | | None5 |
Name,
Address,
and Birth Year | | Position(s)
Held with
the Trust | | Length of Time
Served1 | | Number of
Funds in Fund
Complex Overseen
by Trustee | | Principal
Occupation(s)
During the
Past Five Years | | Other
Directorships
Held by Trustee
During the
Past Five Years |
Daniel V. Geatens
100 Independence
610 Market Street
Philadelphia, PA
19106-2354
1972 | | Senior Vice President
and Treasurer | | Senior Vice President
and Treasurer since
October 2007 | | 105 | | Daniel V. Geatens has
served in various
capacities at different
times at Macquarie Asset
Management. | | None5 |
| | | | | | | | | | | |
Richard Salus
100 Independence
610 Market Street
Philadelphia, PA
19106-2354
1963 | | Senior Vice President
and Chief Financial
Officer | | Senior Vice President
and Chief Financial
Officer since
November 2006 | | 105 | | Richard Salus has
served in various
capacities at different
times at Macquarie Asset
Management. | | None5 |
| 1 | “Length of Time Served” refers to the time since the Trustee or officer began serving one or more of the Trusts in the Delaware Funds complex. |
| 2 | Shawn K. Lytle is considered to be an “Interested Trustee” because he is an executive officer of the Funds' investment advisor. |
| 3 | Macquarie Asset Management is the marketing name for certain companies comprising the asset management division of Macquarie Group, including the Funds' investment advisor, principal underwriter, and transfer agent. |
| 4 | Includes time served on the Board of the Ivy Funds complex prior to the date when the Ivy Funds joined the Delaware Funds complex. |
Board of trustees and officers addendum
Delaware Funds by Macquarie®
| 5 | David F. Connor and Daniel V. Geatens serve in similar capacities for the six portfolios of the Optimum Fund Trust, which have the same investment manager, principal underwriter, and transfer agent as the Funds. Mr. Connor also serves as Senior Vice President and Assistant Secretary for the three portfolios of the Macquarie ETF Trust, which have the same investment manager as the Funds. Mr. Geatens also serves as the Chief Financial Officer of the Optimum Fund Trust and as Senior Vice President and Treasurer for the Macquarie ETF Trust. Mr. Salus serves in a similar capacity for the Macquarie ETF Trust. |
The Statement of Additional Information for the Fund(s) includes additional information about the Trustees and Officers and is available, without charge, upon request by calling 800 523-1918.
Table of Contents
Annual report
Fixed income mutual fund
Delaware Tax-Free Oregon Fund
December 31, 2023
Carefully consider the Fund’s investment objectives, risk factors, charges, and expenses before investing. This and other information can be found in the Fund’s prospectus and its summary prospectus, which may be obtained by visiting delawarefunds.com/literature or calling 800 523-1918. Investors should read the prospectus and the summary prospectus carefully before investing.
You can obtain shareholder reports and prospectuses online instead of in the mail.
Visit delawarefunds.com/edelivery.
Experience Delaware Funds by Macquarie®
Macquarie Asset Management (MAM) is a global asset manager that aims to deliver positive impact for everyone. MAM’s public markets businesses trace their roots to 1929 and partner with institutional and individual clients to deliver specialist active investment capabilities across global equities, fixed income, and multi-asset solutions using a conviction-based, long-term approach to investing. In the US, retail investors recognize our Delaware Funds by Macquarie family of funds as one of the oldest mutual fund families.
If you are interested in learning more about creating an investment plan, contact your financial advisor.
You can learn more about Delaware Funds or obtain a prospectus for Delaware Tax-Free Oregon Fund at delawarefunds.com/literature.
Manage your account online
| · | Check your account balance and transactions |
| · | View statements and tax forms |
| · | Make purchases and redemptions |
Visit delawarefunds.com/account-access.
Macquarie Asset Management (MAM) is the asset management division of Macquarie Group. MAM is an integrated asset manager across public and private markets offering a diverse range of capabilities, including real assets, real estate, credit, equities, and multi-asset solutions.
The Fund is advised by Delaware Management Company, a series of Macquarie Investment Management Business Trust (MIMBT), a US registered investment adviser, and distributed by Delaware Distributors, L.P. (DDLP), an affiliate of MIMBT and Macquarie Group Limited.
Other than Macquarie Bank Limited ABN 46 008 583 542 (“Macquarie Bank”), any Macquarie Group entity noted in this document is not an authorized deposit-taking institution for the purposes of the Banking Act 1959 (Commonwealth of Australia). The obligations of these other Macquarie Group entities do not represent deposits or other liabilities of Macquarie Bank. Macquarie Bank does not guarantee or otherwise provide assurance in respect of the obligations of these other Macquarie Group entities. In addition, if this document relates to an investment, (a) the investor is subject to investment risk including possible delays in repayment and loss of income and principal invested and (b) none of Macquarie Bank or any other Macquarie Group entity guarantees any particular rate of return on or the performance of the investment, nor do they guarantee repayment of capital in respect of the investment.
The Fund is governed by US laws and regulations.
Table of contents
This annual report is for the information of Delaware Tax-Free Oregon Fund shareholders, but it may be used with prospective investors when preceded or accompanied by the Delaware Fund fact sheet for the most recently completed calendar quarter. These documents are available at delawarefunds.com/literature.
Unless otherwise noted, views expressed herein are current as of December 31, 2023, and subject to change for events occurring after such date. These views are not intended to be investment advice, to forecast future events, or to guarantee future results.
The Fund is not FDIC insured and is not guaranteed. It is possible to lose the principal amount invested.
All third-party marks cited are the property of their respective owners.
© 2024 Macquarie Management Holdings, Inc.
| Portfolio management review | |
| Delaware Tax-Free Oregon Fund | December 31, 2023 (Unaudited) |
| Performance preview (for the year ended December 31, 2023) | |
| Delaware Tax–Free Oregon Fund (Institutional Class shares) | 1-year return | +6.53% |
| Delaware Tax–Free Oregon Fund (Class A shares) | 1-year return | +6.26% |
| Bloomberg Municipal Bond Index (benchmark) | 1-year return | +6.40% |
| Lipper Other States Municipal Debt Funds Average | 1-year return | +5.38% |
Past performance does not guarantee future results.
For complete, annualized performance for Delaware Tax-Free Oregon Fund, please see the table on page 5.
Institutional Class shares are not subject to a sales charge and are offered for sale exclusively to certain eligible investors. In addition, Institutional Class shares pay no distribution and service fee.
The performance of Class A shares excludes the applicable sales charge. The performance of both Institutional Class shares and Class A shares reflects the reinvestment of all distributions.
The Lipper Other States Municipal Debt Funds Average compares funds that limit assets to those securities exempt from taxation in a specified state or city.
Please see page 7 for a description of the index. Index performance returns do not reflect any management fees, transaction costs, or expenses. Indices are unmanaged and one cannot invest directly in an index.
Investment objective
The Fund seeks a high level of interest income that is exempt from both federal and state income tax for individual residents of the state of Oregon.
Economic backdrop
During the fiscal year ended December 31, 2023, a consensus gradually formed around the idea that the US economy might achieve a soft landing, despite significant challenges that had raised concerns about a potential recession. These challenges included the US Federal Reserve’s cycle of rate hikes, a regional banking crisis, and concerns about the global economic impact of China’s slowdown.
Nevertheless, the US economy continued to surpass expectations. The country’s gross domestic product (GDP) grew by an unexpected 4.9% annualized rate in the third quarter of 2023. This marked the fifth consecutive quarter of GDP growth and was the fastest pace in nearly two years. Additionally, employment data remained strong. In December 2023, the US unemployment rate was 3.7%, a slight rise from 3.5% a year earlier but still near historic lows.
With inflation beginning to ease, the Fed started to slow its pace of interest rate hikes. Although the central bank indicated that additional rate increases were necessary in response to ongoing robust employment and inflation rates that were higher than desired, it also acknowledged that its efforts to combat inflation were starting to have an effect, as the rate of inflation declined during the year.
At the onset of the fiscal year in January 2023, the US inflation rate, as measured by the Consumer Price Index (CPI), was historically high at 6.5%, yet it was several percentage points lower than the June 2022 peak of 9.1%. Over the following months, the CPI continued to fall, finishing the year at 3.4%, a bit higher than its June 2023 low of 3.0%.
The Fed implemented 0.25-percentage-point increases in February, March, May, and then again in July following a June pause. The central bank acknowledged progress in tempering inflation but remained ready to
Portfolio management review
Delaware Tax-Free Oregon Fund
continue raising rates if necessary to further slow the pace of price increases. From July through year end, the federal funds rate was 5.25%-5.50%, more than double the rate from the preceding year.
Municipal bond market conditions
Overall, the municipal bond market, as measured by the Bloomberg Municipal Bond Index, returned 6.40% for the fiscal year ended December 31, 2023.
In the first quarter of 2023, the US municipal bond market saw positive returns, driven by investor focus on inflation and the Fed’s policy actions. Softer economic data and the prospect of easing inflation fueled optimism that the Fed might decelerate its interest rate hikes or approach the end of its rate-increase cycle.
However, the second quarter witnessed a slight retreat in municipal securities, attributed to an uptick in supply coupled with waning demand. The third quarter presented a tougher climate for municipal bonds, as investor sentiment soured in response to upbeat economic news and the potential for the Fed to keep interest rates higher for longer.
While October posed challenges for municipal bond investors at the start of the fourth quarter, the landscape significantly shifted in November. The Fed hinted at wrapping up its rate-hiking cycle, sparking a rally in financial markets, with municipal securities following suit. During this period, bond prices surged across all fixed income categories, with municipal bonds experiencing healthy gains.
Against this backdrop, bonds with longer maturities generally outperformed their shorter-term counterparts. Meanwhile, bonds rated as lower-investment-grade (A and BBB) tended to outperform higher-quality issues (AAA and AA), while high yield municipal debt (bonds rated below BBB) also performed exceptionally well.
The following tables show municipal bond returns by maturity length and by credit quality for the fiscal year ended December 31, 2023.
Returns by maturity
| 1 year | 3.39% |
| 3 years | 3.46% |
| 5 years | 4.31% |
| 10 years | 5.78% |
| 22+ years | 9.35% |
Returns by credit rating
| AAA | 5.80% |
| AA | 5.92% |
| A | 7.34% |
| BBB | 8.93% |
Source: Bloomberg.
Economic backdrop in Oregon
In December 2023, Oregon revised its budget forecast for the current 2023-2025 biennial period upward from its September and 2023 close-of-session forecasts. According to the December forecast, gross general fund receipts are projected to reach $25.8 billion, anticipated personal income-tax collections are pegged at $21.2 billion, and corporate income-tax collections are projected to total $2.6 billion. All other revenue collections are projected to amount to $2.0 billion, 2.1% below the September forecast and 0.2% under the close-of-session projection. As of November 2023, the state’s unemployment rate was 3.6%, below the 3.7% national unemployment rate and lower than the state’s 4.8% rate a year earlier.
(Sources: oregon.gov/das/OEA, bls.gov)
Within the Fund
For the fiscal year ended December 31, 2023, Delaware Tax-Free Oregon Fund’s Institutional Class shares returned 6.53%. The Fund’s Class A shares returned 6.26% at net asset value (NAV) and 1.46% at maximum offer price. These figures reflect reinvestment of all distributions. During the same period, the Fund’s benchmark, the Bloomberg Municipal Bond Index, returned 6.40%. For complete annualized performance of Delaware Tax-Free Oregon Fund, please see the table on page 5.
During the fiscal year, our management approach remained consistent, as it does regardless of the underlying economic and market backdrop. Our strategy is bottom-up, meaning we engage in thorough credit research to select municipal securities on an issuer-by-issuer basis. In implementing our strategy, we prioritize tax-exempt bonds that provide our shareholders with what we view as a desirable trade-off between risk and return potential.
Because we have significant confidence in the credit research capabilities of our team, we emphasize higher yielding, lower-rated bonds with strong credit fundamentals when searching for new investments to add to the Fund’s portfolio. In our view, such securities provide increased opportunity for us to add value for the Fund’s shareholders.
At fiscal year end, 15.2% of the Fund’s assets were invested in bonds with lower-investment-grade credit ratings (rated A and BBB). Because the Oregon municipal bond marketplace tends to feature substantial high-quality issuance, it can sometimes be challenging to identify lower-rated bonds that meet our stringent credit standards. In these instances, we stay on the lookout for attractive new opportunities to add to the portfolio while remaining selective about the bonds we ultimately do purchase.
In addition, we maintained an allocation to non-rated bonds in the portfolio. Whenever we purchase non-rated bonds or securities rated below investment grade, we thoroughly analyze ‘the securities’ credit risk and emphasize those issues we believe offer the Fund’s shareholders a desirable trade-off between reward potential and risk. At the end of the fiscal year, the Fund had an allocation of 18.4% to non-rated bonds.
Pursuing scarce opportunities
Amid volatile conditions in the municipal bond market for much of this 12-month reporting period, we held a bit more cash than usual in the portfolio. Our rationale was to maintain sufficient liquidity both to satisfy potential shareholder redemptions if market conditions weakened further, as well as to have proceeds available to take advantage of opportunities to buy bonds that we found attractive at temporarily depressed prices.
One of our management priorities throughout the fiscal year was to take advantage of periodic market declines to engage in tax-loss selling. With this strategy, we exchanged lower yielding bonds for similar issues offering higher prevailing yields. With these swaps, we secured higher income for the Fund at a comparable level of risk while also generating tax losses we could apply against future capital gains. Executing such a strategy can be challenging in states with smaller municipal markets such as Oregon’s. However, as opportunities to implement this approach occasionally presented themselves during the fiscal year, we believe we were successful in achieving our objectives.
As we periodically received new net shareholder investments throughout the fiscal year, we took advantage by investing in those
Portfolio management review
Delaware Tax-Free Oregon Fund
securities we saw as the best currently available fits. When making new purchases, we prioritized bonds that would allow us to keep the portfolio’s duration sufficiently long. Meanwhile, during periods of outflows when we had to liquidate bonds to meet shareholder redemptions, we focused on selling securities with lower book yields or shorter call dates, given their limited upside and our desire to manage portfolio duration.
Proceeds for our opportunistic bond purchases came from bond calls and maturities, as well as from the cash balances we maintained in the Fund. Also, when appropriate, we engaged in relative value trades, selling certain lower yielding bonds and using the proceeds to buy other bonds we believed provided better long-term opportunities for shareholders.
Individual performance effects
As discussed, during this fiscal year, bonds with longer durations tended to outperform their shorter counterparts, with less sensitivity to interest rates, while bonds with lower credit ratings generally outpaced higher-rated, lower yielding issues. Accordingly, the strongest- and weakest-performing securities in the Fund reflected these performance trends.
For example, the Fund’s leading contributors were zero-coupon Puerto Rico general obligation bonds, which returned more than 30%. Generally, high yield Puerto Rico bonds performed well this fiscal year, while these securities further benefited from their lower credit ratings and longer duration.
Other notably strong performers in the portfolio included University of Oregon and Portland Airport revenue bonds, which returned more than 14% and more than 13%, respectively. With their longer maturity dates and lower coupons, these securities gained favor as market demand shifted toward bonds with greater interest rate sensitivity, in anticipation of potential rate cuts in 2024.
In contrast, the weakest performer in the portfolio by far – and the only one to generate a negative return – was an investment in Puerto Rico Electric Power Authority bonds, also known as PREPAs. These securities declined 65% for the fiscal year, as PREPA, which is going through a restructuring, received an unfavorable ruling in bankruptcy court over the summer that dragged down the securities’ prices. The next-weakest-performing securities in the Fund were pre-refunded school district bonds for Marion County and Umatilla County. Both issues returned less than 3% for the 12-month period, primarily due to their very short durations.
Performance summary
| Delaware Tax–Free Oregon Fund | December 31, 2023 (Unaudited) |
The performance quoted represents past performance and does not guarantee future results. Investment return and principal value of an investment will fluctuate so that shares, when redeemed, may be worth more or less than their original cost. Current performance may be lower or higher than the performance quoted. Performance data current to the most recent month end may be obtained by calling 800 523-1918 or visiting delawarefunds.com/performance.
| Fund and benchmark performance1,2 | Average annual total returns through December 31, 2023 |
| | 1 year | 5 year | 10 year |
| Class A (Est. May 4, 1992) | | | |
Excluding sales charge | +6.26% | +1.75% | +2.36% |
| Including sales charge | +1.46% | +0.93% | +1.94% |
| Institutional Class (Est. May 1, 2013) | | | |
Excluding sales charge | +6.53% | +2.00% | +2.63% |
| Including sales charge | +6.53% | +2.00% | +2.63% |
| Bloomberg Municipal Bond Index | +6.40% | +2.25% | +3.03% |
1Returns reflect the reinvestment of all distributions and are presented both with and without the applicable sales charges described below. Returns do not reflect the deduction of taxes the shareholder would pay on Fund distributions or redemptions of Fund shares.
Expense limitations were in effect for certain classes during some or all of the periods shown in the “Fund and benchmark performance” table. Expenses for each class are listed in the “Fund expense ratios” table on page 6. Performance would have been lower had expense limitations not been in effect.
The Fund adopted the performance of the First Investors Oregon Tax Exempt Fund (Predecessor Fund) as the result of a reorganization of the Predecessor Fund into the Fund, which was consummated after the close of business on October 4, 2019 (Reorganization). The Fund had not yet commenced operations prior to the Reorganization. The returns shown for periods ending on or prior to October 4, 2019 reflect the performance and expenses of the Predecessor Fund. The returns shown for periods after October 4, 2019 reflect the performance and expenses of the Fund.
Class A shares are sold with a maximum front-end sales charge of 4.50%, and have an annual distribution and service (12b-1) fee of 0.25% of average daily net assets. Performance of the predecessor fund contained a 4.00% sales charge. Performance for Class A shares, excluding sales charges, assumes that no front-end sales charge applied.
Institutional Class shares are not subject to a sales charge and are offered for sale exclusively to certain eligible investors. In addition, Institutional Class shares pay no 12b-1 fee.
Fixed income securities and bond funds can lose value, and investors can lose principal, as interest rates rise. They also may be affected by economic conditions that hinder an issuer’s ability to make interest and principal payments on its debt. This includes prepayment risk, the risk that the principal of a bond that is held by a portfolio will be prepaid prior to maturity, at the time when interest rates are lower than
Performance summary
Delaware Tax–Free Oregon Fund
what the bond was paying. A portfolio may then have to reinvest that money at a lower interest rate.
Funds that invest primarily in one state may be more susceptible to the economic, regulatory, regional, and other factors of that state than geographically diversified funds.
Substantially all dividend income derived from tax-free funds is exempt from federal income tax. Some income may be subject to state or local and/or the federal alternative minimum tax (AMT) that applies to certain investors. Capital gains, if any, are taxable.
Duration number will change as market conditions change. Therefore, duration should not be solely relied upon to indicate a municipal bond fund’s potential volatility.
IBOR risk is the risk that changes related to the use of the London interbank offered rate (LIBOR) or similar rates (such as EONIA) could have adverse impacts on financial instruments that reference these rates. The abandonment of these rates and transition to alternative rates could affect the value and liquidity of instruments that reference them and could affect investment strategy performance.
The disruptions caused by natural disasters, pandemics, or similar events could prevent the Fund from executing advantageous investment decisions in a timely manner and could negatively impact the Fund’s ability to achieve its investment objective and the value of the Fund’s investments.
2The Fund’s expense ratios, as described in the most recent prospectus, are disclosed in the following “Fund expense ratios” table. The expense ratios below may differ from the expense ratios in the “Financial highlights” since they are based on different time periods and the expense ratios in the prospectus include acquired fund fees and expenses, if any. See Note 2 in “Notes to financial statements” for additional details. Please see the “Financial highlights” section in this report for the most recent expense ratios.
| Fund expense ratios | Class A | Institutional Class |
| Total annual operating expenses (without fee waivers) | 1.19% | 0.94% |
| Net expenses (including fee waivers, if any) | 0.90% | 0.65% |
| Type of waiver | Contractual | Contractual |
Performance of a $10,000 investment1
For the period December 31, 2013 through December 31, 2023

| | | Starting value | Ending value |
 | Bloomberg Municipal Bond Index | $10,000 | $13,483 |
 | Delaware Tax–Free Oregon Fund – Institutional Class shares | $10,000 | $12,968 |
 | Delaware Tax–Free Oregon Fund – Class A shares | $9,600 | $12,120 |
1The “Performance of a $10,000 investment” graph assumes $10,000 invested in Institutional Class and Class A shares of the Fund on December 31, 2013, and includes the effect of a 4.00% front-end sales charge (for Class A shares, reflecting the sales charge of the predecessor fund) and the reinvestment of all distributions. The graph does not reflect the deduction of taxes the shareholders would pay on Fund distributions or redemptions of Fund shares. Expense limitations were in effect for some or all of the periods shown. Performance would have been lower had expense limitations not been in effect. Expenses are listed in the “Fund expense ratios” table on page 6. Please note additional details on pages 5 through 8.
The graph also assumes $10,000 invested in the Bloomberg Municipal Bond Index as of December 31, 2013. The Bloomberg Municipal Bond Index measures the total return performance of the long-term, investment grade tax-exempt bond market.
The US Consumer Price Index (CPI), mentioned on page 1, is a measure of inflation that is calculated by the US Department of Labor, representing changes in prices of all goods and services purchased for consumption by urban households.
Gross domestic product, mentioned on page 1, is a measure of all goods and services produced by a nation in a year. It is a measure of economic activity.
Index performance returns do not reflect any management fees, transaction costs, or expenses. Indices are unmanaged and one cannot invest directly in an index. Past performance does not guarantee future results.
Performance of other Fund classes will vary due to different charges and expenses.
Performance summary
Delaware Tax–Free Oregon Fund
| | Nasdaq symbols | CUSIPs |
| Class A | FTORX | 245912712 |
| Institutional Class | FTOTX | 245912696 |
Disclosure of Fund expenses
For the six-month period from July 1, 2023 to December 31, 2023 (Unaudited)
As a shareholder of the Fund, you incur two types of costs: (1) transaction costs, including sales charges (loads) on purchase payments, reinvested dividends, or other distributions; redemption fees; and exchange fees; and (2) ongoing costs, including management fees; distribution and service (12b-1) fees; and other Fund expenses. This example is intended to help you understand your ongoing costs (in dollars) of investing in the Fund and to compare these costs with the ongoing costs of investing in other mutual funds.
The example is based on an investment of $1,000 invested at the beginning of the period and held for the entire six-month period from July 1, 2023 to December 31, 2023.
Actual expenses
The first section of the table shown, “Actual Fund return,” provides information about actual account values and actual expenses. You may use the information in this section of the table, together with the amount you invested, to estimate the expenses that you paid over the period. Simply divide your account value by $1,000 (for example, an $8,600 account value divided by $1,000 = 8.6), then multiply the result by the number in the first section under the heading entitled “Expenses Paid During Period” to estimate the expenses you paid on your account during this period.
Hypothetical example for comparison purposes
The second section of the table shown, “Hypothetical 5% return,” provides information about hypothetical account values and hypothetical expenses based on the Fund’s actual expense ratio and an assumed rate of return of 5% per year before expenses, which is not the Fund’s actual return. The hypothetical account values and expenses may not be used to estimate the actual ending account balance or expenses you paid for the period. You may use this information to compare the ongoing costs of investing in the Fund and other funds. To do so, compare this 5% hypothetical example with the 5% hypothetical examples that appear in the shareholder reports of the other funds.
Please note that the expenses shown in the table are meant to highlight your ongoing costs only and do not reflect any transactional costs, such as sales charges (loads), redemption fees, or exchange fees. Therefore, the second section of the table is useful in comparing ongoing costs only, and will not help you determine the relative total costs of owning different funds. In addition, if these transactional costs were included, your costs would have been higher. The Fund’s expenses shown in the table reflect fee waivers in effect and assume reinvestment of all dividends and distributions.
Disclosure of Fund expenses
For the six-month period from July 1, 2023 to December 31, 2023 (Unaudited)
Delaware Tax–Free Oregon Fund
Expense analysis of an investment of $1,000
| | Beginning
Account Value | Ending
Account Value | Annualized | Expenses
Paid During Period |
| 7/1/23 | 12/31/23 | Expense Ratio | 7/1/23 to 12/31/23* |
| Actual Fund return† | | | | |
| Class A | $1,000.00 | $1,038.40 | 0.90% | $4.62 |
| Institutional Class | 1,000.00 | 1,039.70 | 0.65% | 3.34 |
| Hypothetical 5% return (5% return before expenses) |
| Class A | $1,000.00 | $1,020.67 | 0.90% | $4.58 |
| Institutional Class | 1,000.00 | 1,021.93 | 0.65% | 3.31 |
*“Expenses Paid During Period” are equal to the Fund’s annualized expense ratio, multiplied by the average account value over the period, multiplied by 184/365 (to reflect the one-half year period).
†Because actual returns reflect only the most recent six-month period, the returns shown may differ significantly from fiscal year returns.
Security type / sector / state / territory allocations
| Delaware Tax–Free Oregon Fund | As of December 31, 2023 (Unaudited) |
Sector designations may be different from the sector designations presented in other Fund materials.
| Security type / sector | Percentage of net assets |
| Municipal Bonds* | 95.88% |
| Education Revenue Bonds | 9.04% |
| Electric Revenue Bonds | 1.18% |
| Healthcare Revenue Bonds | 16.19% |
| Housing Revenue Bond | 0.62% |
| Industrial Development Revenue/Pollution Control Revenue Bond | 2.04% |
| Local General Obligation Bonds | 20.02% |
| Pre-Refunded Bonds | 5.07% |
| Special Tax Revenue Bonds | 16.72% |
| State General Obligation Bonds | 7.86% |
| Transportation Revenue Bonds | 11.29% |
| Water & Sewer Revenue Bonds | 5.85% |
| Short-Term Investments | 3.54% |
| Total Value of Securities | 99.42% |
| Receivables and Other Assets Net of Liabilities | 0.58% |
| Total Net Assets | 100.00% |
*As of the date of this report, Delaware Tax–Free Oregon Fund held bonds issued by or on behalf of territories and the states of the US as follows:
| State / territory | Percentage of net assets |
| Guam | 0.55% |
| Oregon | 81.06% |
| Puerto Rico | 14.27% |
| Total Value of Securities | 95.88% |
| Schedule of investments | | |
| Delaware Tax–Free Oregon Fund | | December 31, 2023 |
| | | Principal | | | | |
| | | amount° | | | Value (US $) | |
| Municipal Bonds — 95.88% | | | | | | | | |
| Education Revenue Bonds — 9.04% | | | | | | | | |
| Oregon Health & Science University Revenue Series A 4.00% 7/1/44 | | | 600,000 | | | $ | 604,746 | |
| Oregon State Facilities Authority Revenue | | | | | | | | |
| (Metro East Web Academy Project) | | | | | | | | |
| Series A 144A 5.00% 6/15/39 # | | | 500,000 | | | | 473,685 | |
| Series A 144A 5.00% 6/15/49 # | | | 500,000 | | | | 444,680 | |
| (Willamette University Projects) | | | | | | | | |
| Series A 4.00% 10/1/51 | | | 500,000 | | | | 437,905 | |
| University of Oregon General Revenue | | | | | | | | |
| Series A 3.50% 4/1/52 (BAM) | | | 1,000,000 | | | | 903,050 | |
| Series A 5.00% 4/1/45 | | | 1,000,000 | | | | 1,012,730 | |
| Series A 5.00% 4/1/50 | | | 440,000 | | | | 471,306 | |
| | | | | | | | 4,348,102 | |
| Electric Revenue Bonds — 1.18% | | | | | | | | |
| Guam Power Authority Revenue | | | | | | | | |
| (Tax-Exempt Forward Delivery) | | | | | | | | |
| Series A 5.00% 10/1/44 | | | 250,000 | | | | 262,408 | |
| Puerto Rico Electric Power Authority Revenue | | | | | | | | |
| Series A 6.75% 7/1/36 ‡ | | | 240,000 | | | | 63,000 | |
| Series TT 5.00% 7/1/32 ‡ | | | 380,000 | | | | 99,750 | |
| Series XX 5.25% 7/1/40 ‡ | | | 535,000 | | | | 140,437 | |
| | | | | | | | 565,595 | |
| | | | | | | | | |
| Healthcare Revenue Bonds — 16.19% | | | | | | | | |
| Clackamas County Hospital Facility Authority Revenue | | | | | | | | |
| (Rose Villa Project) | | | | | | | | |
| Series A 5.375% 11/15/55 | | | 500,000 | | | | 457,110 | |
| Oregon Health & Science University Revenue | | | | | | | | |
| (Green Bonds) | | | | | | | | |
| Series A 4.00% 7/1/51 | | | 1,175,000 | | | | 1,160,301 | |
| Oregon State Facilities Authority Revenue | | | | | | | | |
| (Providence Health & Services) | | | | | | | | |
| Series C 5.00% 10/1/45 | | | 650,000 | | | | 658,671 | |
| (Samaritan Health Services Project) | | | | | | | | |
| Series A 5.00% 10/1/40 | | | 750,000 | | | | 791,730 | |
| Salem, Oregon Hospital Facility Authority Revenue | | | | | | | | |
| (Capital Manor Project) | | | | | | | | |
| 4.00% 5/15/47 | | | 865,000 | | | | 684,847 | |
| (Salem Health Projects) | | | | | | | | |
| Series A 4.00% 5/15/41 | | | 870,000 | | | | 871,122 | |
| Series A 4.00% 5/15/49 | | | 810,000 | | | | 786,413 | |
| Series A 5.00% 5/15/39 | | | 555,000 | | | | 587,484 | |
| | | Principal | | | | |
| | | amount° | | | Value (US $) | |
| Municipal Bonds (continued) | | | | | | | | |
| Healthcare Revenue Bonds (continued) | | | | | | | | |
| Union County, Oregon Hospital Facility Authority Revenue | | | | | | | | |
| (Grande Ronde Hospital Project) | | | | | | | | |
| 5.00% 7/1/40 | | | 100,000 | | | $ | 103,369 | |
| 5.00% 7/1/41 | | | 535,000 | | | | 551,521 | |
| 5.00% 7/1/47 | | | 500,000 | | | | 507,965 | |
| Yamhill County, Oregon Hospital Authority Revenue | | | | | | | | |
| (Friendsview) | | | | | | | | |
| Series A 5.00% 11/15/56 | | | 840,000 | | | | 622,406 | |
| | | | | | | | 7,782,939 | |
| | | | | | | | | |
| Housing Revenue Bond — 0.62% | | | | | | | | |
| Home Forward Multifamily Housing Revenue | | | | | | | | |
| (Gretchen Kafoury Commons) | | | | | | | | |
| 5.00% 1/1/29 | | | 300,000 | | | | 300,447 | |
| | | | | | | | 300,447 | |
| Industrial Development Revenue/Pollution Control Revenue Bond — 2.04% | | | | | | | | |
| Children’s Trust Fund Revenue | | | | | | | | |
| (Asset-Backed) | | | | | | | | |
| Series A 0.564% 5/15/57 ^ | | | 12,000,000 | | | | 979,440 | |
| | | | | | | | 979,440 | |
| | | | | | | | | |
| Local General Obligation Bonds — 20.02% | | | | | | | | |
| Boardman, Oregon | | | | | | | | |
| (Green Bonds) | | | | | | | | |
| 2.125% 6/15/45 (BAM) | | | 500,000 | | | | 333,435 | |
| Clackamas & Washington Counties School District No. 3 | | | | | | | | |
| Series A 1.779% 6/15/35 ^ | | | 1,250,000 | | | | 799,888 | |
| Clackamas County School District No. 12 North Clackamas | | | | | | | | |
| Series B 5.00% 6/15/37 | | | 250,000 | | | | 266,295 | |
| Columbia County School District No. 502 | | | | | | | | |
| 5.00% 6/15/36 | | | 575,000 | | | | 616,578 | |
| Eugene, Oregon | | | | | | | | |
| (Parks & Recreation Facility Projects) | | | | | | | | |
| Series A 5.00% 6/1/42 | | | 335,000 | | | | 383,823 | |
| Jackson County School District No. 5 Ashland | | | | | | | | |
| 4.00% 6/15/37 | | | 350,000 | | | | 366,149 | |
| Linn County Community School District No. 9 Lebanon | | | | | | | | |
| 5.50% 6/15/27 (NATL) | | | 1,000,000 | | | | 1,099,870 | |
| Medford, Oregon | | | | | | | | |
| Series A 2.00% 6/1/33 | | | 350,000 | | | | 308,217 | |
Schedule of investments
Delaware Tax–Free Oregon Fund
| | | Principal | | | | |
| | | amount° | | | Value (US $) | |
| Municipal Bonds (continued) | | | | | | | | |
| Local General Obligation Bonds (continued) | | | | | | | | |
| Multnomah County School District No. 40 | | | | | | | | |
| Series A 5.157% 6/15/51 ^ | | | 5,000,000 | | | $ | 1,299,000 | |
| Multnomah-Clackamas Counties Centennial School District No. 28JT | | | | | | | | |
| 4.00% 6/15/38 | | | 1,050,000 | | | | 1,089,249 | |
| Newport, Oregon | | | | | | | | |
| Series B 12.101% 6/1/29 (AGC) ^ | | | 1,225,000 | | | | 1,045,991 | |
| Portland, Oregon | | | | | | | | |
| (Portland Building Project) | | | | | | | | |
| Series B 5.00% 6/15/34 | | | 500,000 | | | | 550,575 | |
| (Transportation Projects) | | | | | | | | |
| Series A 3.00% 10/1/33 | | | 300,000 | | | | 299,103 | |
| Salem-Keizer School District No. 24J | | | | | | | | |
| 5.00% 6/15/33 | | | 500,000 | | | | 551,645 | |
| Washington-Multnomah Counties Beaverton School District No. 48J | | | | | | | | |
| (Current Interest Bonds) | | | | | | | | |
| Series B 5.00% 6/15/52 | | | 560,000 | | | | 612,623 | |
| | | | | | | | 9,622,441 | |
| Pre-Refunded Bonds — 5.07% | | | | | | | | |
| Marion County School District No. 103 Woodburn | | | | | | | | |
| 5.00% 6/15/35-25 § | | | 500,000 | | | | 516,190 | |
| Multnomah County Hospital Facility Authority | | | | | | | | |
| (Mirabella at South Waterfront Project) | | | | | | | | |
| Series A 5.40% 10/1/44-24 § | | | 900,000 | | | | 914,184 | |
| Umatilla County Oregon School District No. 16R Pendleton | | | | | | | | |
| Series A 5.00% 6/15/33-24 § | | | 1,000,000 | | | | 1,009,120 | |
| | | | | | | | 2,439,494 | |
| Special Tax Revenue Bonds — 16.72% | | | | | | |
| Commonwealth of Puerto Rico Revenue | | | | | | |
| 0.01% 11/1/51 • | | | 1,024,333 | | | | 419,977 | |
| (Subordinate) | | | | | | | | |
| Series C 4.018% 11/1/43 • | | | 477,395 | | | | 260,777 | |
| GDB Debt Recovery Authority of Puerto Rico Revenue | | | | | | | | |
| 7.50% 8/20/40 | | | 1,446,463 | | | | 1,283,736 | |
| Oregon State Bond Bank Revenue | | | | | | | | |
| (Oregon Business Development Department) | | | | | | | | |
| Series A 5.00% 1/1/32 | | | 250,000 | | | | 260,580 | |
| Oregon State Department Administrative Services | | | | | | | | |
| Lottery Revenue | | | | | | | | |
| Series A 5.00% 4/1/41 | | | 580,000 | | | | 655,411 | |
| | | Principal | | | | |
| | | amount° | | | Value (US $) | |
| Municipal Bonds (continued) | | | | | | | | |
| Special Tax Revenue Bonds (continued) | | | | | | | | |
| Puerto Rico Sales Tax Financing Revenue | | | | | | | | |
| (Capital Appreciation - Restructured) | | | | | | | | |
| Series A-1 5.563% 7/1/46 ^ | | | 1,255,000 | | | $ | 395,036 | |
| Series A-1 6.263% 7/1/51 ^ | | | 1,939,000 | | | | 455,200 | |
| (Restructured) | | | | | | | | |
| Series A-1 4.75% 7/1/53 | | | 2,325,000 | | | | 2,306,749 | |
| Tri-County Metropolitan Transportation District of Oregon | | | | | | | | |
| Revenue | | | | | | | | |
| Series A 5.00% 9/1/38 | | | 500,000 | | | | 552,960 | |
| (Sustainability Bonds) | | | | | | | | |
| Series A 3.00% 9/1/37 | | | 405,000 | | | | 387,520 | |
| Series A 4.00% 9/1/41 | | | 795,000 | | | | 813,881 | |
| (Unrefunded) | | | | | | | | |
| Series A 4.00% 9/1/40 | | | 245,000 | | | | 246,590 | |
| | | | | | | | 8,038,417 | |
| | | | | | | | | |
| State General Obligation Bonds — 7.86% | | | | | | | | |
| Commonwealth of Puerto Rico | | | | | | | | |
| (Restructured) | | | | | | | | |
| Series A-1 4.00% 7/1/41 | | | 250,000 | | | | 230,125 | |
| Series A-1 4.00% 7/1/46 | | | 250,000 | | | | 223,617 | |
| Oregon State | | | | | | | | |
| (Article XI-M and XI-N Seismic Grant Programs) | | | | | | | | |
| Series C 5.00% 6/1/41 | | | 650,000 | | | | 741,981 | |
| (Article XI-Q State Projects) | | | | | | | | |
| Series A 5.00% 5/1/41 | | | 500,000 | | | | 579,610 | |
| Series A 5.00% 5/1/44 | | | 500,000 | | | | 542,365 | |
| Series A 5.25% 5/1/45 | | | 1,000,000 | | | | 1,152,050 | |
| (Higher Education) | | | | | | | | |
| Series F 5.00% 8/1/43 | | | 275,000 | | | | 308,050 | |
| | | | | | | | 3,777,798 | |
| | | | | | | | | |
| Transportation Revenue Bonds — 11.29% | | | | | | | | |
| Oregon State Department of Transportation Revenue | | | | | | | | |
| (Senior Lien) | | | | | | | | |
| Series A 5.25% 11/15/47 | | | 1,000,000 | | | | 1,138,470 | |
| (Subordinate) | | | | | | | | |
| Series A 4.00% 11/15/38 | | | 300,000 | | | | 313,437 | |
| Series A 5.00% 11/15/35 | | | 500,000 | | | | 567,460 | |
| Series A 5.00% 11/15/39 | | | 400,000 | | | | 452,316 | |
| Port of Portland Oregon Airport Revenue | | | | | | | | |
| Series 24B 5.00% 7/1/42 (AMT) | | | 500,000 | | | | 512,780 | |
| Series 28 4.00% 7/1/47 (AMT) | | | 555,000 | | | | 536,935 | |
Schedule of investments
Delaware Tax–Free Oregon Fund
| | | Principal | | | | |
| | | amount° | | | Value (US $) | |
| Municipal Bonds (continued) | | | | | | | | |
| Transportation Revenue Bonds (continued) | | | | | | | | |
| Port of Portland Oregon Airport Revenue | | | | | | | | |
| Series 28 5.00% 7/1/52 (AMT) | | | 250,000 | | | $ | 263,150 | |
| (Green Bonds) | | | | | | | | |
| Series 29 5.50% 7/1/53 (AMT) | | | 1,500,000 | | | | 1,642,230 | |
| | | | | | | | 5,426,778 | |
| | | | | | | | | |
| Water & Sewer Revenue Bonds — 5.85% | | | | | | | | |
| Eugene, Oregon Water Utility System Revenue | | | | | | | | |
| 5.00% 8/1/52 | | | 500,000 | | | | 553,045 | |
| Hermiston, Oregon Water & Sewer System Revenue | | | | | | | | |
| 5.00% 11/1/34 (AGM) | | | 500,000 | | | | 509,200 | |
| Portland, Oregon Sewer System Revenue | | | | | | | | |
| (Second Lien) | | | | | | | | |
| Series A 5.00% 12/1/42 | | | 1,000,000 | | | | 1,137,030 | |
| Series A 5.00% 12/1/47 | | | 550,000 | | | | 611,930 | |
| | | | | | | | 2,811,205 | |
| Total Municipal Bonds (cost $45,988,040) | | | | | | | 46,092,656 | |
| | | | | | | | | |
| Short-Term Investments — 3.54% | | | | | | | | |
| Variable Rate Demand Note — 3.54%¤ | | | | | | | | |
| Oregon State Facilities Authority Revenue | | | | | | | | |
| (PeaceHealth) Series B 4.00% 8/1/34 | | | | | | | | |
| (LOC - TD Bank N.A.) | | | 1,700,000 | | | | 1,700,000 | |
| Total Short-Term Investments (cost $1,700,000) | | | | | | | 1,700,000 | |
| Total Value of Securities—99.42% | | | | | | | | |
| (cost $47,688,040) | | | | | | $ | 47,792,656 | |
| ° | Principal amount shown is stated in USD unless noted that the security is denominated in another currency. |
| # | Security exempt from registration under Rule 144A of the Securities Act of 1933, as amended. At December 31, 2023, the aggregate value of Rule 144A securities was $918,365, which represents 1.91% of the Fund’s net assets. See Note 9 in “Notes to financial statements.” |
| ‡ | Non-income producing security. Security is currently in default. |
| ^ | Zero-coupon security. The rate shown is the effective yield at the time of purchase. |
| § | Pre-refunded bonds. Municipal bonds that are generally backed or secured by US Treasury bonds. For pre-refunded bonds, the stated maturity is followed by the year in which the bond will be pre-refunded. See Note 9 in “Notes to financial statements.” |
| • | Variable rate investment. Rates reset periodically. Rate shown reflects the rate in effect at December 31, 2023. For securities based on a published reference rate and spread, the reference rate and spread are indicated in their descriptions. The reference rate descriptions (i.e. SOFR01M, SOFR03M, etc.) used in this report are identical for different securities, but the underlying reference rates may differ due to the timing of the reset period. Certain variable rate securities are not based on a published reference rate and spread but are determined by the issuer or agent and are based on current market conditions, or for mortgage-backed securities, are impacted by the individual mortgages which are paying off over time. These securities do not indicate a reference rate and spread in their descriptions. |
| ¤ | Tax-exempt obligations that contain a floating or variable interest rate adjustment formula and an unconditional right of demand to receive payment of the unpaid principal balance plus accrued interest upon a short notice period (generally up to 30 days) prior to specified dates either from the issuer or by drawing on a bank letter of credit, a guarantee, or insurance issued with respect to such instrument. Each rate shown is as of December 31, 2023. |
Summary of abbreviations:
AGC – Insured by Assured Guaranty Corporation
AGM – Insured by Assured Guaranty Municipal Corporation
AMT – Subject to Alternative Minimum Tax
BAM – Insured by Build America Mutual Assurance
LOC – Letter of Credit
N.A. – National Association
NATL – Insured by National Public Finance Guarantee Corporation
SOFR – Secured Overnight Financing Rate
SOFR01M – Secured Overnight Financing Rate 1 Month
SOFR03M – Secured Overnight Financing Rate 3 Month
USD – US Dollar
See accompanying notes, which are an integral part of the financial statements.
| Statement of assets and liabilities | |
| Delaware Tax–Free Oregon Fund | December 31, 2023 |
| Assets: | | | | |
| Investments, at value* | | $ | 47,792,656 | |
| Cash | | | 910,713 | |
| Interest receivable | | | 459,909 | |
| Receivable for fund shares sold | | | 190,505 | |
| Receivable due from Advisor | | | 17,287 | |
| Prepaid expenses | | | 8,617 | |
| Other assets | | | 279 | |
| Total Assets | | | 49,379,966 | |
| Liabilities: | | | | |
Payable for securities purchased | | | 1,062,125 | |
| Payable for fund shares redeemed | | | 181,738 | |
| Other accrued expenses | | | 37,713 | |
| Administration expenses payable to affiliates | | | 11,308 | |
| Distribution payable | | | 7,541 | |
| Distribution fees payable to affiliates | | | 6,900 | |
| Total Liabilities | | | 1,307,325 | |
| Total Net Assets | | $ | 48,072,641 | |
| | | | | |
| Net Assets Consist of: | | | | |
| Paid-in capital | | $ | 48,955,495 | |
| Total distributable earnings (loss) | | | (882,854 | ) |
| Total Net Assets | | $ | 48,072,641 | |
| Net Asset Value | | | |
| | | | | |
| Class A: | | | | |
| Net assets | | $ | 32,932,798 | |
| Shares of beneficial interest outstanding, unlimited authorization, no par | | | 2,657,581 | |
| Net asset value per share | | $ | 12.39 | |
| Sales charge | | | 4.50 | % |
| Offering price per share, equal to net asset value per share / (1 - sales charge) | | $ | 12.97 | |
| | | | | |
| Institutional Class: | | | | |
| Net assets | | $ | 15,139,843 | |
| Shares of beneficial interest outstanding, unlimited authorization, no par | | | 1,223,568 | |
| Net asset value per share | | $ | 12.37 | |
| __________________ | | | | |
| *Investments, at cost | | $ | 47,688,040 | |
See accompanying notes, which are an integral part of the financial statements.
Statement of operations
| Delaware Tax–Free Oregon Fund | Year ended December 31, 2023 |
| Investment Income: | | | |
| Interest | | $ | 1,936,285 | |
| | | | | |
| Expenses: | | | | |
| Management fees | | | 254,314 | |
| Distribution expenses — Class A | | | 81,984 | |
| Audit and tax fees | | | 50,403 | |
| Accounting and administration expenses | | | 43,682 | |
| Dividend disbursing and transfer agent fees and expenses | | | 28,402 | |
| Reports and statements to shareholders expenses | | | 27,919 | |
| Registration fees | | | 8,971 | �� |
| Legal fees | | | 5,139 | |
| Custodian fees | | | 3,427 | |
| Trustees’ fees and expenses | | | 1,336 | |
| Other | | | 10,937 | |
| | | | 516,514 | |
| Less expenses waived | | | (133,730 | ) |
| Less expenses paid indirectly | | | (35 | ) |
| Total operating expenses | | | 382,749 | |
| Net Investment Income (Loss) | | | 1,553,536 | |
| | | | | |
| Net Realized and Unrealized Gain (Loss): | | | | |
| Net realized gain (loss) on investments | | | (1,676 | ) |
| Net change in unrealized appreciation (depreciation) on investments | | | 1,207,928 | |
| Net Realized and Unrealized Gain (Loss) | | | 1,206,252 | |
| Net Increase (Decrease) in Net Assets Resulting from Operations | | $ | 2,759,788 | |
See accompanying notes, which are an integral part of the financial statements.
Statements of changes in net assets
Delaware Tax–Free Oregon Fund
| | | Year ended | |
| | | 12/31/23 | | | 12/31/22 | |
| Increase (Decrease) in Net Assets from Operations: | | | | | | | | |
| Net investment income (loss) | | $ | 1,553,536 | | | $ | 1,121,715 | |
| Net realized gain (loss) | | | (1,676 | ) | | | (439,728 | ) |
| Net change in unrealized appreciation (depreciation) | | | 1,207,928 | | | | (4,659,001 | ) |
| Net increase (decrease) in net assets resulting from operations | | | 2,759,788 | | | | (3,977,014 | ) |
| | | | | | | | | |
| Dividends and Distributions to Shareholders from: | | | | | | | | |
| Distributable earnings: | | | | | | | | |
| Class A | | | (1,076,666 | ) | | | (919,010 | ) |
| Institutional Class | | | (476,870 | ) | | | (202,705 | ) |
| | | | (1,553,536 | ) | | | (1,121,715 | ) |
| | | | | | | | | |
| Capital Share Transactions (See Note 6): | | | | | | | | |
| Proceeds from shares sold: | | | | | | | | |
| Class A | | | 2,478,290 | | | | 5,887,046 | |
| Institutional Class | | | 9,809,945 | | | | 11,361,819 | |
| | | | | | | | | |
| Net asset value of shares issued upon reinvestment of dividends and distributions: | | | | | | | | |
| Class A | | | 993,490 | | | | 836,936 | |
| Institutional Class | | | 476,870 | | | | 202,722 | |
| | | | 13,758,595 | | | | 18,288,523 | |
| | | | | | | | | |
| Cost of shares redeemed: | | | | | | | | |
| Class A | | | (4,514,681 | ) | | | (5,412,437 | ) |
| Institutional Class | | | (6,034,942 | ) | | | (5,284,592 | ) |
| | | | (10,549,623 | ) | | | (10,697,029 | ) |
| | | | | | | | | |
| Increase in net assets derived from capital share transactions | | | 3,208,972 | | | | 7,591,494 | |
| Net Increase in Net Assets | | | 4,415,224 | | | | 2,492,765 | |
| | | | | | | | | |
| Net Assets: | | | | | | | | |
| Beginning of year | | | 43,657,417 | | | | 41,164,652 | |
| End of year | | $ | 48,072,641 | | | $ | 43,657,417 | |
See accompanying notes, which are an integral part of the financial statements.
Financial highlights
Delaware Tax–Free Oregon Fund Class A
Selected data for each share of the Fund outstanding throughout each period were as follows:
| Net asset value, beginning of period |
| |
| Income (loss) from investment operations: |
| Net investment income2 |
| Net realized and unrealized gain (loss) |
| Total from investment operations |
| |
| Less dividends and distributions from: |
| Net investment income |
| Total dividends and distributions |
| |
| Net asset value, end of period |
| |
| Total return3 |
| |
| Ratios and supplemental data: |
| Net assets, end of period (000 omitted) |
| Ratio of expenses to average net assets |
| Ratio of expenses to average net assets prior to fees waived |
| Ratio of net investment income to average net assets |
| Ratio of net investment income to average net assets prior to fees waived |
| Portfolio turnover |
| 1 | On October 4, 2019, Class A shares of First Investors Oregon Tax Exempt Fund were reorganized into Class A shares of Delaware Tax–Free Oregon Fund. The Class A shares’ financial highlights for the periods prior to October 4, 2019, reflect the performance of First Investors Oregon Tax Exempt Fund Class A shares. |
| 2 | Calculated using average shares outstanding. |
| 3 | Total return is based on the change in net asset value of a share during the period and assumes reinvestment of dividends and distributions at net asset value and does not reflect the impact of a sales charge. Total return during the period reflects waivers by the manager and/or distributor (as applicable). Performance would have been lower had the waivers not been in effect. |
See accompanying notes, which are an integral part of the financial statements.
| Year ended | |
| 12/31/23 | | | 12/31/22 | | | 12/31/21 | | | 12/31/20 | | | 12/31/191 | |
| $ | 12.05 | | | $ | 13.76 | | | $ | 13.71 | | | $ | 13.42 | | | $ | 13.01 | |
| | | | | | | | | | | | | | | | | | | |
| | | | | | | | | | | | | | | | | | | |
| | 0.39 | | | | 0.36 | | | | 0.33 | | | | 0.33 | | | | 0.33 | |
| | 0.34 | | | | (1.71 | ) | | | 0.05 | | | | 0.29 | | | | 0.42 | |
| | 0.73 | | | | (1.35 | ) | | | 0.38 | | | | 0.62 | | | | 0.75 | |
| | | | | | | | | | | | | | | | | | | |
| | | | | | | | | | | | | | | | | | | |
| | (0.39 | ) | | | (0.36 | ) | | | (0.33 | ) | | | (0.33 | ) | | | (0.34 | ) |
| | (0.39 | ) | | | (0.36 | ) | | | (0.33 | ) | | | (0.33 | ) | | | (0.34 | ) |
| | | | | | | | | | | | | | | | | | | |
| $ | 12.39 | | | $ | 12.05 | | | $ | 13.76 | | | $ | 13.71 | | | $ | 13.42 | |
| | | | | | | | | | | | | | | | | | | |
| | 6.26 | % | | | (9.86 | )% | | | 2.82 | % | | | 4.70 | % | | | 5.78 | % |
| | | | | | | | | | | | | | | | | | | |
| | | | | | | | | | | | | | | | | | | |
| $ | 32,933 | | | $ | 33,102 | | | $ | 36,216 | | | $ | 38,295 | | | $ | 43,911 | |
| | 0.90 | % | | | 0.90 | % | | | 0.90 | % | | | 0.91 | % | | | 0.95 | % |
| | 1.19 | % | | | 1.19 | % | | | 1.18 | % | | | 1.19 | % | | | 1.05 | % |
| | 3.29 | % | | | 2.86 | % | | | 2.40 | % | | | 2.46 | % | | | 2.49 | % |
| | 3.00 | % | | | 2.57 | % | | | 2.12 | % | | | 2.18 | % | | | 2.39 | % |
| | 25 | % | | | 44 | % | | | 12 | % | | | 25 | % | | | 50 | % |
Financial highlights
Delaware Tax–Free Oregon Fund Institutional Class
Selected data for each share of the Fund outstanding throughout each period were as follows:
| Net asset value, beginning of period |
| |
| Income (loss) from investment operations: |
| Net investment income2 |
| Net realized and unrealized gain (loss) |
| Total from investment operations |
| |
| Less dividends and distributions from: |
| Net investment income |
| Total dividends and distributions |
| |
| Net asset value, end of period |
| |
| Total return3 |
| |
| Ratios and supplemental data: |
| Net assets, end of period (000 omitted) |
| Ratio of expenses to average net assets |
| Ratio of expenses to average net assets prior to fees waived |
| Ratio of net investment income to average net assets |
| Ratio of net investment income to average net assets prior to fees waived |
| Portfolio turnover |
| 1 | On October 4, 2019, Advisor Class shares of the predecessor fund First Investors Oregon Tax Exempt Fund were reorganized into Institutional Class shares of Delaware Tax–Free Oregon Fund. The Institutional Class shares’ financial highlights for the periods prior to October 4, 2019, reflect the performance of First Investors Oregon Tax Exempt Fund Advisor Class shares. |
| 2 | Calculated using average shares outstanding. |
| 3 | Total return is based on the change in net asset value of a share during the period and assumes reinvestment of dividends and distributions at net asset value. Total return during the period reflects waivers by the manager. Performance would have been lower had the waivers not been in effect. |
See accompanying notes, which are an integral part of the financial statements.
| Year ended | |
| 12/31/23 | | | 12/31/22 | | | 12/31/21 | | | 12/31/20 | | | 12/31/191 | |
| $ | 12.03 | | | $ | 13.73 | | | $ | 13.69 | | | $ | 13.40 | | | $ | 12.99 | |
| | | | | | | | | | | | | | | | | | | |
| | | | | | | | | | | | | | | | | | | |
| | 0.42 | | | | 0.39 | | | | 0.36 | | | | 0.37 | | | | 0.37 | |
| | 0.34 | | | | (1.70 | ) | | | 0.04 | | | | 0.29 | | | | 0.41 | |
| | 0.76 | | | | (1.31 | ) | | | 0.40 | | | | 0.66 | | | | 0.78 | |
| | | | | | | | | | | | | | | | | | | |
| | | | | | | | | | | | | | | | | | | |
| | (0.42 | ) | | | (0.39 | ) | | | (0.36 | ) | | | (0.37 | ) | | | (0.37 | ) |
| | (0.42 | ) | | | (0.39 | ) | | | (0.36 | ) | | | (0.37 | ) | | | (0.37 | ) |
| | | | | | | | | | | | | | | | | | | |
| $ | 12.37 | | | $ | 12.03 | | | $ | 13.73 | | | $ | 13.69 | | | $ | 13.40 | |
| | | | | | | | | | | | | | | | | | | |
| | 6.53 | % | | | (9.58 | )% | | | 3.00 | % | | | 4.96 | % | | | 6.03 | % |
| | | | | | | | | | | | | | | | | | | |
| | | | | | | | | | | | | | | | | | | |
| $ | 15,140 | | | $ | 10,555 | | | $ | 4,949 | | | $ | 3,559 | | | $ | 2,953 | |
| | 0.65 | % | | | 0.65 | % | | | 0.65 | % | | | 0.66 | % | | | 0.70 | % |
| | 0.94 | % | | | 0.94 | % | | | 0.93 | % | | | 0.94 | % | | | 0.78 | % |
| | 3.54 | % | | | 3.14 | % | | | 2.65 | % | | | 2.71 | % | | | 2.76 | % |
| | 3.25 | % | | | 2.85 | % | | | 2.37 | % | | | 2.43 | % | | | 2.68 | % |
| | 25 | % | | | 44 | % | | | 12 | % | | | 25 | % | | | 50 | % |
Notes to financial statements
| Delaware Tax-Free Oregon Fund | December 31, 2023 |
Delaware Group® Limited-Term Government Funds (Trust) is organized as a Delaware statutory trust and offers two series: Delaware Limited-Term Diversified Income Fund and Delaware Tax- Free Oregon Fund. These financial statements and the related notes pertain to Delaware Tax-Free Oregon Fund. The Trust is an open-end investment company. The Fund is considered diversified under the Investment Company Act of 1940, as amended (1940 Act), and offers Class A and Institutional Class shares. Class A shares are sold with a maximum front-end sales charge of 4.50%. There is no front-end sales charge when you purchase $250,000 or more of Class A shares. However, if Delaware Distributors, L.P. (DDLP) paid your financial intermediary a commission on your purchase of $250,000 or more of Class A shares, you will have to pay a limited contingent deferred sales charge (Limited CDSC) of 1.00% if you redeem these shares within the first 18 months after your purchase, unless a specific waiver of the Limited CDSC applies. Institutional Class shares are not subject to a sales charge and are offered for sale exclusively to certain eligible investors.
1. Significant Accounting Policies
The Fund follows accounting and reporting guidance under Financial Accounting Standards Board (FASB) Accounting Standards Codification Topic 946, Financial Services — Investment Companies. The following accounting policies are in accordance with US generally accepted accounting principles (US GAAP) and are consistently followed by the Fund.
Security Valuation — Fixed income securities are generally priced based upon valuations provided by an independent pricing service or broker in accordance with methodologies included within Delaware Management Company (DMC)’s Pricing Policy (the Policy). Fixed income security valuations are then reviewed by DMC as part of its duties as the Fund’s valuation designee and, to the extent required by the Policy and applicable regulation, fair valued consistent with the Policy. To the extent current market prices are not available, the pricing service may take into account developments related to the specific security, as well as transactions in comparable securities. Valuations for fixed income securities utilize matrix systems, which reflect such factors as security prices, yields, maturities, and ratings, and are supplemented by dealer and exchange quotations. Generally, other securities and assets for which market quotations are not readily available are valued at fair value as determined in good faith by DMC. Subject to the oversight of the Trust’s Board of Trustees (Board), DMC, as valuation designee, has adopted policies and procedures to fair value securities for which market quotations are not readily available consistent with the requirements of Rule 2a-5 under the 1940 Act. In determining whether market quotations are readily available or fair valuation will be used, various factors will be taken into consideration, such as market closures or suspension of trading in a security. Restricted securities and private placements are valued at fair value.
Federal Income Taxes — No provision for federal income taxes has been made as the Fund intends to continue to qualify for federal income tax purposes as a regulated investment company under Subchapter M of the Internal Revenue Code of 1986, as amended, and make the requisite distributions to shareholders. The Fund evaluates tax positions taken or expected to be taken in the course of preparing the Fund’s tax returns to determine whether the tax positions
are “more-likely-than-not” of being sustained by the applicable tax authority. Tax positions not deemed to meet the “more-likely-than-not” threshold are recorded as a tax benefit or expense in the current year. Management has analyzed the Fund’s tax positions taken or expected to be taken on the Fund’s federal income tax returns through the year ended December 31, 2023, and for all open tax years (years ended December 31, 2020–December 31, 2022), and has concluded that no provision for federal income tax is required in the Fund’s financial statements. If applicable, the Fund recognizes interest accrued on unrecognized tax benefits in interest expense and penalties in “Other” on the “Statement of operations.” During the year ended December 31, 2023, the Fund did not incur any interest or tax penalties.
Class Accounting — Investment income and common expenses are allocated to the various classes of the Fund on the basis of “settled shares” of each class in relation to the net assets of the Fund. Realized and unrealized gain (loss) on investments are allocated to the various classes of the Fund on the basis of daily net assets of each class. Distribution expenses relating to a specific class are charged directly to that class.
Use of Estimates — The preparation of financial statements in conformity with US GAAP requires management to make estimates and assumptions that affect the fair value of investments, the reported amounts of assets and liabilities and disclosure of contingent assets and liabilities at the date of the financial statements, and the reported amounts of revenues and expenses during the reporting period. Actual results could differ from those estimates and the differences could be material.
Other — Expenses directly attributable to the Fund are charged directly to the Fund. Other expenses common to various funds within the Delaware Funds by Macquarie® (Delaware Funds) are generally allocated among such funds on the basis of average net assets. Management fees and certain other expenses are paid monthly. Security transactions are recorded on the date the securities are purchased or sold (trade date) for financial reporting purposes. Costs used in calculating realized gains and losses on the sale of investment securities are those of the specific securities sold. Interest income is recorded on an accrual basis. Discounts and premiums on debt securities are accreted or amortized to interest income, respectively, over the lives of the respective securities using the effective interest method. Premiums on callable debt securities are amortized to interest income to the earliest call date using the effective interest method. The Fund declares dividends daily from net investment income and pays the dividends monthly and declares and pays distributions from net realized gain on investments, if any, at least annually. The Fund may distribute more frequently, if necessary for tax purposes. Dividends and distributions, if any, are recorded on the ex-dividend date.
The Fund receives earnings credits from its transfer agent when positive cash balances are maintained, which may be used to offset transfer agent fees. If the amount earned is greater than $1, the expenses paid under this arrangement are included on the “Statement of operations” under “Dividend disbursing and transfer agent fees and expenses” with the corresponding expenses offset included under “Less expenses paid indirectly.”
Notes to financial statements
Delaware Tax-Free Oregon Fund
2. Investment Management, Administration Agreements, and Other Transactions with Affiliates
In accordance with the terms of its respective investment management agreement, the Fund pays DMC, a series of Macquarie Investment Management Business Trust and the investment manager, an annual fee which is calculated daily and paid monthly, at the rates of 0.55% on the first $500 million of average daily net assets of the Fund, 0.50% on the next $500 million, 0.45% on the next $1.5 billion, and 0.425% on average daily net assets in excess of $2.5 billion.
DMC has contractually agreed to waive all or a portion of its investment advisory fee and/or pay/reimburse expenses (excluding any distribution and service (12b-1) fees, acquired fund fees and expenses, taxes, interest, short sale dividend and interest expenses, brokerage fees, certain insurance costs, and nonroutine expenses or costs, including, but not limited to, those relating to reorganizations, litigation, conducting shareholder meetings, and liquidations), in order to prevent total annual fund operating expenses from exceeding 0.65% of the average daily net assets from January 1, 2023 through April 30, 2024. These waivers and reimbursements may only be terminated by agreement of DMC and the Fund. The waivers and reimbursements are accrued daily and received monthly.
After consideration of class specific expenses, including 12b-1 fees, the class level operating expense limitation as a percentage of average daily net assets from January 1, 2023 through April 30, 2024 is as follows:
| Operating expense limitation as a percentage of average daily net assets |
| Class A | | Institutional Class |
| 0.90% | | 0.65% |
Delaware Investments Fund Services Company (DIFSC), an affiliate of DMC, provides fund accounting and financial administrative oversight services to the Fund. For these services, effective October 1, 2023, DIFSC’s fees are calculated daily and paid monthly, based on the aggregate daily net assets of all funds within the Delaware Funds at the following annual rates: 0.0050% of the first $60 billion; 0.00475% of the next $30 billion; and 0.0015% of aggregate average daily net assets in excess of $90 billion (Total Fee). Prior to October 1, 2023, DIFSC’s annual rates were: 0.00475% of the first $35 billion; 0.0040% of the next $10 billion; 0.0025% of the next $45 billion; and 0.0015% of aggregate average daily net assets in excess of $90 billion. Each fund in the Delaware Funds pays a minimum of $4,000, which, in aggregate, is subtracted from the Total Fee. Each fund then pays its portion of the remainder of the Total Fee on a relative net asset value (NAV) basis. This amount is included on the “Statement of operations” under “Accounting and administration expenses.” For the year ended December 31, 2023, the Fund paid $5,496 for these services.
DIFSC is also the transfer agent and dividend disbursing agent of the Fund. For these services, DIFSC’s fees are calculated daily and paid monthly, based on the aggregate daily net assets of the retail funds within the Delaware Funds at the following annual rates: 0.014% of the first $20 billion; 0.011% of the next $5 billion; 0.007% of the next $5 billion; 0.004% of the next
$20 billion; 0.002% of the next $25 billion; and 0.0015% of average daily net assets in excess of $75 billion. The fees payable to DIFSC under the shareholder services agreement described above are allocated among all retail funds in the Delaware Funds on a relative NAV basis. This amount is included on the “Statement of operations” under “Dividend disbursing and transfer agent fees and expenses.” For the year ended December 31, 2023, the Fund paid $2,989 for these services. Pursuant to a sub-transfer agency agreement between DIFSC and BNY Mellon Investment Servicing (US) Inc. (BNYMIS), BNYMIS provides certain sub-transfer agency services to the Fund. Sub-transfer agency fees are paid by the Fund and are also included on the “Statement of operations” under “Dividend disbursing and transfer agent fees and expenses.” The fees are calculated daily and paid as invoices are received on a monthly or quarterly basis.
Pursuant to a distribution agreement and distribution plan, the Fund pays DDLP, the distributor and an affiliate of DMC, an annual 12b-1 fee of 0.25% of the average daily net assets of the Class A shares. The fees are calculated daily and paid monthly. Institutional Class shares do not pay 12b-1 fees.
As provided in the investment management agreement, the Fund bears a portion of the cost of certain resources shared with DMC, including the cost of internal personnel of DMC and/or its affiliates that provide legal and regulatory reporting services to the Fund. For the year ended December 31, 2023, the Fund paid $1,539 for internal legal and regulatory reporting services provided by DMC and/or its affiliates’ employees. This amount is included on the “Statement of operations” under “Legal fees.”
For the year ended December 31, 2023, DDLP earned $1,022 for commissions on sales of the Fund’s Class A shares. For the year ended December 31, 2023, DDLP received gross CDSC commissions of $139 on redemptions of the Fund’s Class A shares, and these commissions were entirely used to offset upfront commissions previously paid by DDLP to broker/dealers on sales of those shares.
Trustees’ fees include expenses accrued by the Fund for each Trustee’s retainer and meeting fees. Certain officers of DMC, DIFSC, and DDLP are officers and/or Trustees of the Trust. These officers and Trustees are paid no compensation by the Fund.
3. Investments
For the year ended December 31, 2023, the Fund made purchases and sales of investment securities other than short-term investments and US government securities as follows:
| Purchases | | $ | 13,649,609 | |
| Sales | | | 11,138,220 | |
The tax cost of investments includes adjustments to net unrealized appreciation (depreciation) which may not necessarily be the final tax cost basis adjustments but which approximate the tax basis unrealized gains and losses that may be realized and distributed to shareholders. At
Notes to financial statements
Delaware Tax-Free Oregon Fund
3. Investments (continued)
December 31, 2023, the cost and unrealized appreciation (depreciation) of investments for federal income tax purposes for the Fund were as follows:
| Cost of investments | | $ | 47,725,151 | |
| Aggregate unrealized appreciation of investments | | $ | 1,538,368 | |
| Aggregate unrealized depreciation of investments | | | (1,455,543 | ) |
| Net unrealized appreciation of investments | | $ | 82,825 | |
US GAAP defines fair value as the price that the Fund would receive to sell an asset or pay to transfer a liability in an orderly transaction between market participants at the measurement date under current market conditions. A three-level hierarchy for fair value measurements has been established based upon the transparency of inputs to the valuation of an asset or liability. Inputs may be observable or unobservable and refer broadly to the assumptions that market participants would use in pricing the asset or liability. Observable inputs reflect the assumptions market participants would use in pricing the asset or liability based on market data obtained from sources independent of the reporting entity. Unobservable inputs reflect the reporting entity’s own assumptions about the assumptions that market participants would use in pricing the asset or liability based on the best information available under the circumstances. The Fund’s investment in its entirety is assigned a level based upon the observability of the inputs which are significant to the overall valuation. The three-level hierarchy of inputs is summarized as follows:
| Level 1 - | Inputs are quoted prices in active markets for identical investments. (Examples: equity securities, open-end investment companies, futures contracts, and exchange-traded options contracts) |
| Level 2 – | Other observable inputs, including, but not limited to: quoted prices for similar assets or liabilities in markets that are active, quoted prices for identical or similar assets or liabilities in markets that are not active, inputs other than quoted prices that are observable for the assets or liabilities (such as interest rates, yield curves, volatilities, prepayment speeds, loss severities, credit risks, and default rates) or other market-corroborated inputs. (Examples: debt securities, government securities, swap contracts, forward foreign currency exchange contracts, foreign securities utilizing international fair value pricing, broker-quoted securities, and fair valued securities) |
| Level 3 – | Significant unobservable inputs, including the Fund’s own assumptions used to determine the fair value of investments. (Examples: broker-quoted securities and fair valued securities) |
Level 3 investments are valued using significant unobservable inputs. The Fund may also use an income-based valuation approach in which the anticipated future cash flows of the investment are discounted to calculate fair value. Discounts may also be applied due to the nature or duration of any restrictions on the disposition of the investments. Valuations may also be based upon current market prices of securities that are comparable in coupon, rating, maturity, and
industry. The derived value of a Level 3 investment may not represent the value which is received upon disposition and this could impact the results of operations.
The following table summarizes the valuation of the Fund’s investments by fair value hierarchy levels as of December 31, 2023:
| | | Level 2 | |
| Securities | | | |
| Assets: | | | |
| Municipal Bonds | | $ | 46,092,656 | |
| Short-Term Investments | | | 1,700,000 | |
| Total Value of Securities | | $ | 47,792,656 | |
During the year ended December 31, 2023, there were no transfers into or out of Level 3 investments. The Fund’s policy is to recognize transfers into or out of Level 3 investments based on fair value at the beginning of the reporting year.
A reconciliation of Level 3 investments is presented when the Fund has a significant amount of Level 3 investments at the beginning or end of the year in relation to the Fund’s net assets. As of December 31, 2023, there were no Level 3 investments.
4. Dividend and Distribution Information
Income and long-term capital gain distributions are determined in accordance with federal income tax regulations, which may differ from US GAAP. Additionally, distributions from net short-term gains on sales of investment securities are treated as ordinary income for federal income tax purposes. The tax character of dividends and distributions paid during the years ended December 31, 2023 and 2022 were as follows:
| | | Year ended | |
| | | 12/31/23 | | | 12/31/22 | |
| Tax-exempt income | | $ | 1,514,196 | | | $ | 1,101,604 | |
| Ordinary income | | | 39,340 | | | | 20,111 | |
| Total | | $ | 1,553,536 | | | $ | 1,121,715 | |
5. Components of Net Assets on a Tax Basis
As of December 31, 2023, the components of net assets on a tax basis were as follows:
| Shares of beneficial interest | | | 48,955,495 | |
| Undistributed tax-exempt income | | | 173 | |
| Capital loss carryforwards | | | (965,852 | ) |
| Unrealized appreciation of investments | | | 82,825 | |
| Net assets | | $ | 48,072,641 | |
Notes to financial statements
Delaware Tax-Free Oregon Fund
5. Components of Net Assets on a Tax Basis (continued)
The differences between book basis and tax basis components of net assets are primarily attributable to tax deferral of losses on wash sales and tax treatment of discount and premium on debt instruments.
For financial reporting purposes, capital accounts are adjusted to reflect the tax character of permanent book/tax differences. Results of operations and net assets were not affected by these reclassifications. For the year ended December 31, 2023, the Fund had no reclassifications.
For federal income tax purposes, capital loss carryforwards may be carried forward and applied against future capital gains. At December 31, 2023, the the Fund has capital loss carryforwards available to offset future realized capital gains are as follows:
| Loss carryforward character | | | | | |
| Short-term | | | Long-term | | | Total | |
| $ | 644,718 | | | $ | 321,134 | | | $ | 965,852 | |
6. Capital Shares
Transactions in capital shares were as follows:
| | | Year ended | |
| | | 12/31/23 | | | 12/31/22 | |
| Shares sold: | | | | | | | | |
| Class A | | | 203,347 | | | | 479,410 | |
| Institutional Class | | | 810,793 | | | | 929,548 | |
| |
| Shares issued upon reinvestment of dividends and distributions: |
| Class A | | | 82,879 | | | | 67,216 | |
| Institutional Class | | | 39,881 | | | | 16,400 | |
| | | | 1,136,900 | | | | 1,492,574 | |
| | | | | | | | | |
| Shares redeemed: | | | | | | | | |
| Class A | | | (376,627 | ) | | | (431,424 | ) |
| Institutional Class | | | (504,611 | ) | | | (428,756 | ) |
| | | | (881,238 | ) | | | (860,180 | ) |
| Net increase | | | 255,662 | | | | 632,394 | |
Certain shareholders may exchange shares of one class for shares of another class in the same Fund. These exchange transactions are included as subscriptions and redemptions in the table on the previous page and on the “Statements of changes in net assets.” The Fund did not have any exchange transactions for the year ended December 31, 2022. For the year ended December 31, 2023, the Fund had the following exchange transactions:
| | | Exchange Redemptions | | | Exchange Subscriptions | | | | |
| | | | | | Institutional | | | | |
| | | Class A | | | Class | | | | |
| | | Shares | | | Shares | | | Value | |
| Year ended | | | | | | | | | |
| 12/31/23 | | 1,535 | | | 1,538 | | | $ | 17,377 | |
7. Line of Credit
The Fund, along with certain other funds in the Delaware Funds (Participants), was a participant in a $355,000,000 revolving line of credit (Agreement) intended to be used for temporary or emergency purposes as an additional source of liquidity to fund redemptions of investor shares. Under the Agreement, the Participants were charged an annual commitment fee of 0.15%, which was allocated across the Participants based on a weighted average of the respective net assets of each Participant. The Participants were permitted to borrow up to a maximum of one-third of their net assets under the Agreement. Each Participant was individually, and not jointly, liable for its particular advances, if any, under the line of credit. The line of credit available under the Agreement expired on October 30, 2023.
On October 30, 2023, the Fund, along with the other Participants, entered into an amendment to the Agreement for a $335,000,000 revolving line of credit. It operates in substantially the same manner as the original Agreement. Under the amendment to the Agreement, the Participants are charged an annual commitment fee of 0.15%, which is allocated across the Participants based on a weighted average of the respective net assets of each Participant. The line of credit available under the Agreement expires on October 28, 2024.
The Fund had no amounts outstanding as of December 31, 2023, or at any time during the year then ended.
8. Securities Lending
The Fund, along with other funds in the Delaware Funds, may lend its securities pursuant to a security lending agreement (Lending Agreement) with The Bank of New York Mellon (BNY Mellon). At the time a security is loaned, the borrower must post collateral equal to the required percentage of the market value of the loaned security, including any accrued interest. The required percentage is: (1) 102% with respect to US securities and foreign securities that are denominated and payable in US dollars; and (2) 105% with respect to foreign securities. With respect to each loan, if on any business day the aggregate market value of securities collateral plus cash collateral held is less than the aggregate market value of the securities which are the subject of such loan, the borrower will be notified to provide additional collateral by the end of the
Notes to financial statements
Delaware Tax-Free Oregon Fund
8. Securities Lending (continued)
following business day, which, together with the collateral already held, will be not less than the applicable initial collateral requirements for such security loan. If the aggregate market value of securities collateral and cash collateral held with respect to a security loan exceeds the applicable initial collateral requirement, upon the request of the borrower, BNY Mellon must return enough collateral to the borrower by the end of the following business day to reduce the value of the remaining collateral to the applicable initial collateral requirement for such security loan. As a result of the foregoing, the value of the collateral held with respect to a loaned security on any particular day, may be more or less than the value of the security on loan. The collateral percentage with respect to the market value of the loaned security is determined by the security lending agent.
Cash collateral received by the Fund is generally invested in an individual separate account. The investment guidelines permit each separate account to hold certain securities that would be considered eligible securities for a money market fund. Cash collateral received is generally invested in government securities; certain obligations issued by government sponsored enterprises; repurchase agreements collateralized by US Treasury securities; obligations issued by the central government of any Organization for Economic Cooperation and Development (OECD) country or its agencies, instrumentalities, or establishments; obligations of supranational organizations; commercial paper, notes, bonds, and other debt obligations; certificates of deposit, time deposits, and other bank obligations; certain money market funds; and asset-backed securities. The Fund can also accept US government securities and letters of credit (non-cash collateral) in connection with securities loans.
In the event of default or bankruptcy by the lending agent, realization and/or retention of the collateral may be subject to legal proceedings. In the event the borrower fails to return loaned securities and the collateral received is insufficient to cover the value of the loaned securities and provided such collateral shortfall is not the result of investment losses, the lending agent has agreed to pay the amount of the shortfall to the Fund or, at the discretion of the lending agent, replace the loaned securities. The Fund continues to record dividends or interest, as applicable, on the securities loaned and is subject to changes in value of the securities loaned that may occur during the term of the loan. The Fund has the right under the Lending Agreement to recover the securities from the borrower on demand. With respect to security loans collateralized by non-cash collateral, the Fund receives loan premiums paid by the borrower. With respect to security loans collateralized by cash collateral, the earnings from the collateral investments are shared among the Fund, the security lending agent, and the borrower. The Fund records security lending income net of allocations to the security lending agent and the borrower.
The Fund may incur investment losses as a result of investing securities lending collateral. This could occur if an investment in the collateral investment account defaulted or became impaired. Under those circumstances, the value of the Fund’s cash collateral account may be less than the amount the Fund would be required to return to the borrowers of the securities and the Fund would be required to make up for this shortfall.
At December 31, 2023, the Fund had no securities out on loan.
9. Credit and Market Risks
The impact of COVID-19, and other infectious illness outbreaks that may arise in the future, could adversely affect the economies of many nations or the entire global economy, individual issuers and capital markets in ways that cannot necessarily be foreseen.
When interest rates rise, fixed income securities (i.e. debt obligations) generally will decline in value. These declines in value are greater for fixed income securities with longer maturities or durations. Interest rate changes are influenced by a number of factors, such as government policy, monetary policy, inflation expectations, and the supply and demand of bonds. A fund may be subject to a greater risk of rising interest rates when interest rates are low or inflation rates are high or rising.
The Fund concentrates its investments in securities issued by municipalities, mainly in Oregon. The Fund invests primarily in a specific state and may be subject to geographic concentration risk. In addition, the Fund has the flexibility to invest in issuers in US territories and possessions such as the Commonwealth of Puerto Rico, the US Virgin Islands, and Guam, whose bonds are also free of federal and individual state income taxes. The value of the Fund’s investments may be adversely affected by new legislation within the states or US territories, regional or local economic conditions, and differing levels of supply and demand for municipal bonds. Many municipalities insure repayment for their obligations. Although bond insurance reduces the risk of loss due to default by an issuer, such bonds remain subject to the risk that value may fluctuate for other reasons and there is no certainty that the insurance company will meet its obligations. A real or perceived decline in creditworthiness of a bond insurer can have an adverse impact on the value of insured bonds held in the Fund.
The Fund invests a portion of its assets in high yield municipal fixed income securities, which are securities rated lower than BBB- by Standard & Poor’s Financial Services LLC (S&P), lower than Baa3 by Moody’s Investors Service, Inc. (Moody’s), or similarly rated by another nationally recognized statistical rating organization. Investments in these higher yielding securities are generally accompanied by a greater degree of credit risk than higher rated securities. Additionally, lower rated securities may be more susceptible to adverse economic and competitive industry conditions than investment grade securities.
The Fund invests in certain obligations that may have liquidity protection designed to ensure that the receipt of payments due on the underlying security is timely. Such protection may be provided through guarantees, insurance policies, or letters of credit obtained by the issuer or sponsor through third parties, through various means of structuring the transaction, or through a combination of such approaches. The Fund will not pay any additional fees for such credit support, although the existence of credit support may increase the price of the security.
The Fund may invest in advance refunded bonds, escrow secured bonds, or defeased bonds. Under current federal tax laws and regulations, state and local government borrowers are permitted to refinance outstanding bonds by issuing new bonds. The issuer refinances the
Notes to financial statements
Delaware Tax-Free Oregon Fund
9. Credit and Market Risks (continued)
outstanding debt to either reduce interest costs or to remove or alter restrictive covenants imposed by the bonds being refinanced. A refunding transaction where the municipal securities are being refunded within 90 days from the issuance of the refunding issue is known as a “current refunding.” “Advance refunded bonds” are bonds in which the refunded bond issue remains outstanding for more than 90 days following the issuance of the refunding issue. In an advance refunding, the issuer will use the proceeds of a new bond issue to purchase high grade interest-bearing debt securities, which are then deposited in an irrevocable escrow account held by an escrow agent to secure all future payments of principal and interest and bond premium of the advance refunded bond. Bonds are “escrowed to maturity” when the proceeds of the refunding issue are deposited in an escrow account for investment sufficient to pay all of the principal and interest on the original interest payment and maturity dates.
Bonds are considered “pre-refunded” when the refunding issuer’s proceeds are escrowed only until a permitted call date or dates on the refunded issue with the refunded issue being redeemed at the time, including any required premium. Bonds become “defeased” when the rights and interests of the bondholders and of their lien on the pledged revenues or other security under the terms of the bond contract are substituted with an alternative source of revenues (the escrow securities) sufficient to meet payments of principal and interest to maturity or to the first call dates. Escrowed secured bonds will often receive a rating of AAA from Moody’s, S&P, and/or Fitch Ratings due to the strong credit quality of the escrow securities and the irrevocable nature of the escrow deposit agreement.
The Fund may invest up to 15% of its net assets in illiquid securities, which may include securities with contractual restrictions on resale, securities exempt from registration under Rule 144A promulgated under the Securities Act of 1933, as amended, and other securities which may not be readily marketable. The relative illiquidity of these securities may impair the Fund from disposing of them in a timely manner and at a fair price when it is necessary or desirable to do so. While maintaining oversight, the Board has delegated to DMC the day-to-day functions of determining whether individual securities are liquid for purposes of the Fund’s limitation on investments in illiquid securities. Securities eligible for resale pursuant to Rule 144A, which are determined to be liquid, are not subject to the Fund’s 15% limit on investments in illiquid securities. Rule 144A securities have been identified on the “Schedule of investments.”
10. Contractual Obligations
The Fund enters into contracts in the normal course of business that contain a variety of indemnifications. The Fund’s maximum exposure under these arrangements is unknown. However, the Fund has not had prior claims or losses pursuant to these contracts. Management has reviewed the Fund’s existing contracts and expects the risk of loss to be remote.
11. Subsequent Events
Management has determined that no material events or transactions occurred subsequent to December 31, 2023, that would require recognition or disclosure in the Fund’s financial statements.
Report of independent
registered public accounting firm
To the Board of Trustees of Delaware Group® Limited-Term Government Funds and Shareholders of Delaware Tax-Free Oregon Fund
Opinion on the Financial Statements
We have audited the accompanying statement of assets and liabilities, including the schedule of investments, of Delaware Tax-Free Oregon Fund (one of the Funds constituting Delaware Group® Limited-Term Government Funds, hereafter referred to as the “Fund”) as of December 31, 2023, the related statement of operations for the year ended December 31, 2023, the statement of changes in net assets for each of the two years in the period ended December 31, 2023, including the related notes, and the financial highlights for each of the five years in the period ended December 31, 2023 (collectively referred to as the “financial statements”). In our opinion, the financial statements present fairly, in all material respects, the financial position of the Fund as of December 31, 2023, the results of its operations for the year then ended, the changes in its net assets for each of the two years in the period ended December 31, 2023 and the financial highlights for each of the five years in the period ended December 31, 2023 in conformity with accounting principles generally accepted in the United States of America.
Basis for Opinion
These financial statements are the responsibility of the Fund’s management. Our responsibility is to express an opinion on the Fund’s financial statements based on our audits. We are a public accounting firm registered with the Public Company Accounting Oversight Board (United States) (PCAOB) and are required to be independent with respect to the Fund in accordance with the U.S. federal securities laws and the applicable rules and regulations of the Securities and Exchange Commission and the PCAOB.
We conducted our audits of these financial statements in accordance with the standards of the PCAOB. Those standards require that we plan and perform the audit to obtain reasonable assurance about whether the financial statements are free of material misstatement, whether due to error or fraud.
Our audits included performing procedures to assess the risks of material misstatement of the financial statements, whether due to error or fraud, and performing procedures that respond to those risks. Such procedures included examining, on a test basis, evidence regarding the amounts and disclosures in the financial statements. Our audits also included evaluating the accounting principles used and significant estimates made by management, as well as evaluating the overall presentation of the financial statements. Our procedures included confirmation of securities owned as of December 31, 2023 by correspondence with the custodian and brokers; when replies were not received from brokers, we performed other auditing procedures. We believe that our audits provide a reasonable basis for our opinion.
/s/PricewaterhouseCoopers LLP
Philadelphia, Pennsylvania
February 19, 2024
We have served as the auditor of one or more Macquarie investment companies since 2010.
Other Fund information (Unaudited)
Delaware Tax-Free Oregon Fund
Tax Information
The information set forth below is for the Fund’s fiscal year as required by federal income tax laws. Shareholders, however, must report distributions on a calendar year basis for income tax purposes, which may include distributions for portions of two fiscal years of the Fund. Accordingly, the information needed by shareholders for income tax purposes will be sent to them in January of each year. Please consult your tax advisor for proper treatment of this information.
All disclosures are based on financial information available as of the date of this annual report and, accordingly are subject to change. For any and all items requiring reporting, it is the intention of the Fund to report the maximum amount permitted under the Internal Revenue Code and the regulations thereunder.
For the fiscal year ended December 31, 2023, the Fund reports distributions paid during the year as follows:
| (A) Ordinary Income Distributions (Tax Basis) | | | 2.53 | % |
| (B) Tax Exempt Distributions (Tax Basis) | | | 97.47 | % |
| Total Distributions (Tax Basis) | | | 100.00 | % |
_______________________
(A) and (B) are based on a percentage of the Fund’s total distributions.
Board Consideration of Investment Management Agreement at a Meeting Held on August 8-10, 2023
At a meeting held on August 8-10, 2023 (the “Annual Contract Renewal Meeting”), the Board of Trustees (the “Board”), including a majority of Trustees each of whom is not an “interested person” as defined under the Investment Company Act of 1940 (the “Independent Trustees”), approved the renewal of the Delaware Tax-Free Oregon Fund (the “Fund”) Investment Management Agreement with Delaware Management Company (“DMC”).
Prior to the Annual Contract Renewal Meeting, including at a Board meeting held in May 2023, the Trustees conferred extensively among themselves and with representatives of DMC about these matters. Also, the Board was assisted by the Equity Investments Committee and the Fixed Income Multi-Asset Sub-Advised Funds Investments Committee (each an “Investment Committee” and together, the “Investment Committees”), with each Investment Committee assisting the full Board in reviewing investment performance and other matters throughout the year. The Independent Trustees were also assisted in their evaluation of the Investment Management Agreement by independent legal counsel, from whom they received separate legal advice and with whom they met separately.
In providing information to the Board, DMC was guided by a detailed set of requests for information submitted to them by independent legal counsel on behalf of the Independent Trustees at the start of the Board’s annual contract renewal process earlier in 2023. Prior to the Annual Contract Renewal Meeting, and in response to the requests, the Board received and reviewed materials specifically relating to the renewal of the Investment Management
Other Fund information (Unaudited)
Delaware Tax-Free Oregon Fund
Board Consideration of Investment Management Agreement at a Meeting Held on August 8-10, 2023 (continued)
Agreement. In considering and approving the Investment Management Agreement, the Trustees considered the information they believed relevant, including but not limited to the information discussed below. The Board considered not only the specific information presented in connection with the Annual Contract Renewal Meeting and the review process for the Investment Management Agreement, but also the knowledge gained over time through interaction with DMC about various topics. In this regard, the Board reviewed reports of DMC at each of its quarterly meetings, which included information about, among other things, Fund performance, investment strategies, and expenses. In addition, the Investment Committees confer with portfolio managers at various times throughout the year. In considering information relating to the approval of the Fund’s Investment Management Agreement, the Independent Trustees also received information from an independent fund consultant, JDL Consultants, LLC (“JDL”).
The Board did not identify any particular information or consideration that was all-important or controlling, and each individual Trustee may have attributed different weights to various factors.
After its deliberations, the Board, including the Independent Trustees, unanimously approved the continuation of the Investment Management Agreement for a one-year term. The following summarizes a number of important, but not necessarily all, factors considered by the Board in support of its approval.
Nature, extent, and quality of services. The Board received and considered various information regarding the nature, extent, and quality of the advisory services provided to the Fund by DMC under its Investment Management Agreement and the experience of the officers and employees of DMC who provide these services, including the Fund’s portfolio managers. The Board’s review included consideration of DMC’s investment process and oversight and research and analysis capabilities, and its ability to attract and retain skilled investment professionals. The Board also considered information regarding DMC’s programs for risk management, including investment, operational, liquidity, derivatives (as applicable), valuation, and compliance risks. The Board received information with respect to the cybersecurity program and business continuity plans of DMC and its affiliates.
In addition, the Board considered certain non-advisory services that DMC and its affiliates provide to the Delaware Funds by Macquarie complex (the “Delaware Funds”). Among other things, these services include third party service provider oversight, transfer agency, internal audit, valuation, portfolio trading, and legal and compliance functions. The Board noted DMC’s responsibility for overseeing the preparation of the Delaware Funds’ registration statement and supplements thereto and shareholder reports; responsibility for periodic filings with regulators; organizing Board meetings and preparing materials for such Board meetings; and furnishing analytical and other support to assist the Board. The Board took into account the benefits to shareholders of investing in a Fund that is part of a family of funds managed by an affiliate of Macquarie Group Ltd. (“Macquarie”), the parent company of DMC, and the resources available to DMC as part of Macquarie’s global asset management business.
The Board also received and considered information about the nature and extent of services offered and fee rates charged by DMC to other types of clients with investment strategies similar to those of the Fund. In this regard, the Board received information about the significantly greater scope of services, and compliance, reporting and other legal and regulatory obligations and risks of managing registered investment companies compared with those associated with managing assets of other types of clients, including third-party sub-advised fund clients, unregistered funds and separately managed accounts.
The Board concluded that, overall, it was satisfied with the nature, extent and quality of services provided (and expected to be provided) to the Fund by DMC.
Investment performance. The Board received and considered information with respect to the investment performance of the Fund, including performance reports and discussions with portfolio managers at meetings of the Board’s Investment Committees throughout the year as well as reports provided by Broadridge Financial Solutions, Inc., an independent investment company data provider (“Broadridge”), furnished for the Annual Contract Renewal Meeting. The Broadridge reports prepared for the Fund’s institutional share class showed its investment performance in comparison to the institutional share class of a group of similar funds (the “Performance Universe”). The Board received a description of the methodology used by Broadridge to select the peer funds in the Performance Universe. Comparative annualized performance for the Fund was shown for the past 1-, 3-, 5-, and 10-year or since inception periods, as applicable, ended December 31, 2022.
The Performance Universe for the Fund consisted of the Fund all retail and institutional “other states” municipal debt funds, regardless of asset size or primary channel of distribution. The Board noted that the Broadridge report comparison showed that the Fund’s total return for the 1-year and since inception periods was in the second quartile of its Performance Universe and for the 3- and 5-year periods was in the first quartile of its Performance Universe. The Broadridge report comparison showed that the Fund’s total return for the 1-, 3-, and 5-year and since inception periods was above the median of its Performance Universe. The Board also noted that the Fund underperformed its benchmark index for the 1- and 5-year and since inception periods and was approximately equal to its benchmark index for the 3-year period. The Board noted that the Fund was generally performing in line with its Performance Universe during the periods under review. The Board also noted that the Fund has adopted the performance of its predecessor fund (“Predecessor Fund”) prior to October 5, 2019 as the result of a reorganization of the Predecessor Fund into the Fund, and that the investment performance of the current portfolio management team only began as of October 2019. The Board noted the explanations from DMC concerning the reasons for the Fund’s relative performance versus its benchmark index for the various periods.
Comparative expenses. The Board received and considered expense data for the Fund. DMC provided the Board with information on pricing levels and fee structures for the Fund as of its most recently completed fiscal year. The Broadridge total expenses, for comparative consistency, were shown by Broadridge for Institutional Class shares and comparative total expenses including 12b-1 and non-12b-1 service fees. The Board also considered the comparative analysis of contractual management fees and actual total expense ratios of the Fund versus contractual
Other Fund information (Unaudited)
Delaware Tax-Free Oregon Fund
Board Consideration of Investment Management Agreement at a Meeting Held on August 8-10, 2023 (continued)
management fees and actual total expense ratios of a group of peer funds as selected by Broadridge (the “Expense Group”). In reviewing comparative costs, the Fund’s contractual management fee and the actual management fee incurred by the Fund were compared with the contractual management fees (assuming all funds in the Expense Group were similar in size to the Fund) and actual management fees, taking into account any applicable breakpoints and fee waivers, with a Fund’s expense universe, which is comprised of the Fund, its Expense Group and all other similar institutional funds, excluding outliers (the “Expense Universe”). The Fund’s total expenses were also compared with those of its Expense Universe. The Board also received and considered information regarding the Fund’s net operating expense ratios and their various components, including actual management fees, custodian and other non-management fees, and Rule 12b-1 and non-Rule 12b-1 shareholder service fees.
The expense comparisons for the Fund showed that its actual management fee was below the median of its Expense Universe and its actual total expenses were above its Expense Group average. It was noted that consistent with DMC’s waiver methodology, its advisory fee waivers, if any, were at the fund level and not class level.
Based on its consideration of the factors and information it deemed relevant, including those described here, the Board determined that the compensation payable to DMC under the Investment Management Agreement was reasonable.
Economies of scale. The Board received and considered information about the potential for DMC to realize economies of scale in the provision of management services to the Fund, the difficulties of calculating economies of scale at an individual Fund level, and the extent to which potential scale benefits are shared with shareholders, including the extent to which any economies of scale are reflected in the level of management fees charged. DMC discussed its advisory fee pricing and structure for the Delaware Funds, including the current breakpoints. The Board noted that the Fund may also benefit from economies of scale through initial fee setting, fee waivers and expense reimbursements, as well as DMC’s investment in its business, including investments in business infrastructure, technology and cybersecurity.
Management profitability. The Board received and considered the Investment Management Profitability Analysis that addressed the overall profitability of DMC’s business in providing management and other services to the Fund and the Delaware Funds as a whole, including the methodology used by DMC in allocating costs for the purpose of determining profitability. The Board noted DMC’s changes to its cost allocation methodology for its profitability analysis and the explanations for such changes. The Board also reviewed a report prepared by JDL regarding DMC’s profitability as compared to certain peer fund complexes and the Independent Trustees discussed DMC’s profitability in such context with representatives from JDL. The Board recognized that calculating and comparing profitability at the individual fund level is difficult; that DMC’s profit, if any, can vary significantly depending on the particular fund; and that DMC’s support for, and commitment to, a fund are not solely dependent on the profits realized as to that fund.
Based on its review, the Board determined that DMC’s profitability was not excessive in light of the nature, extent and quality of the services provided to the Fund.
Ancillary benefits. The Board received and considered information regarding the extent to which DMC and its affiliates might derive ancillary benefits from fund operations, including the potential for procuring additional business as a result of the prestige and visibility associated with its role as investment manager to the Delaware Funds; the benefits from allocation of fund brokerage to improve trading efficiencies; the portfolio transactions executed through “soft dollar” arrangements; and the fees that various affiliates received for serving as transfer agent and for overseeing fund accounting and financial administration services to the Delaware Funds. The Board considered that it receives periodic reports from DMC that include a representation that any soft dollar arrangements are consistent with regulatory requirements. The Board received information from DMC regarding its view of the performance of its affiliates in providing transfer agent and fund accounting and financial administration oversight services and the organizational structure employed to provide these services pursuant to their contracts with the Fund.
Based on its consideration of the factors and information it deemed relevant, including the costs of providing investment management and other services to the Fund and the ongoing commitment of DMC and its affiliates to the Fund, the Board did not find that any ancillary benefits received by DMC and its affiliates, were unreasonable.
Conclusion. Based on its review, consideration and evaluation of all factors it believed relevant, including the above-described factors and conclusions, the Board, including all of the Independent Trustees, approved the continuation of DMC’s Investment Management Agreement for an additional one-year period.
Form N-PORT and proxy voting information
The Fund files its complete schedule of portfolio holdings with the Securities and Exchange Commission (SEC) for the first and third quarters of each fiscal year on Form N-PORT. The Fund’s Form N-PORT, as well as a description of the policies and procedures that the Fund uses to determine how to vote proxies (if any) relating to portfolio securities, is available without charge (i) upon request, by calling 800 523-1918; and (ii) on the SEC’s website at sec.gov. In addition, a description of the policies and procedures that the Fund uses to determine how to vote proxies (if any) relating to portfolio securities and the Schedule of Investments included in the Fund’s most recent Form N-PORT are available without charge on the Fund’s website at delawarefunds.com/literature.
Information (if any) regarding how the Fund voted proxies relating to portfolio securities during the most recently disclosed 12-month period ended June 30 is available without charge (i) through the Fund’s website at delawarefunds.com/proxy; and (ii) on the SEC’s website at sec.gov.
Board of trustees and officers addendum
Delaware Funds by Macquarie®
A mutual fund is governed by a Board of Trustees (“Trustees”), which has oversight responsibility for the management of a fund’s business affairs. Trustees establish procedures and oversee and review the performance of the investment manager, the distributor, and others who perform services for the fund. The independent fund trustees, in particular, are advocates for shareholder interests. Each trustee has served in that capacity since he or she was elected to or appointed to the Board of Trustees, and will continue to serve until his or her retirement or the election of a new trustee in his or her place. The following is a list of the Trustees and Officers with certain background and related information.
Name,
Address,
and Birth Year | | Position(s)
Held with
the Trust | | Length of Time
Served1 | | Number of
Funds in Fund
Complex Overseen
by Trustee | | Principal
Occupation(s)
During the
Past Five Years | | Other
Directorships
Held by Trustee
During the
Past Five Years |
| Interested Trustee | | | | | | |
| | | | | | | | | | | |
Shawn K. Lytle2
100 Independence
610 Market Street
Philadelphia, PA
19106-2354
1970 | | President, Chief Executive Officer, and Trustee | | President and Chief Executive Officer since August 2015 Trustee since September 2015 | | 105 | | Macquarie Asset Management3
(2015–Present)
-Head of Equities & Multi-Asset
(2023–Present)
-Head of Americas of Macquarie Group
(2017–Present)
-Global Head of Public Investments
(2019–2023) | | None |
Name,
Address,
and Birth Year | | Position(s)
Held with
the Trust | | Length of Time
Served1 | | Number of
Funds in Fund
Complex Overseen
by Trustee | | Principal
Occupation(s)
During the
Past Five Years | | Other
Directorships
Held by Trustee
During the
Past Five Years |
| Independent Trustees | | | | | | | | |
| | | | | | | | | | | |
Jerome D.
Abernathy
100 Independence
610 Market Street
Philadelphia, PA
19106-2354
1959 | | Trustee | | Since January 2019 | | 105 | | Stonebrook Capital Management, LLC (financial technology: macro factors and databases)
-Managing Member
(1993-Present) | | None |
| | | | | | | | | | | |
Ann D. Borowiec
100 Independence
610 Market Street
Philadelphia, PA
19106-2354
1958 | | Trustee | | Since March 2015 | | 105 | | J.P. Morgan Chase & Co.
(1987-2013)
-Chief Executive Officer, Private Wealth
Management
(2011–2013) | | Banco Santander International
(2016–2019)
Santander Bank, N.A.
(2016-2019) |
Board of trustees and officers addendum
Delaware Funds by Macquarie®
Name,
Address,
and Birth Year | | Position(s)
Held with
the Trust | | Length of Time
Served1 | | Number of
Funds in Fund
Complex Overseen
by Trustee | | Principal
Occupation(s)
During the
Past Five Years | | Other
Directorships
Held by Trustee
During the
Past Five Years |
| | | | | | | | | | | |
Joseph W. Chow
100 Independence
610 Market Street
Philadelphia, PA
19106-2354
1953 | | Trustee | | Since January 2013 | | 105 | | Private Investor
(2011–Present)
State Street Bank and Trust Company
(1996-2011)
-Executive Vice President of Enterprise Risk Management and Emerging Economies Strategy; and Chief Risk and Corporate Administration Officer | | None |
| | | | | | | | | | | |
H. Jeffrey Dobbs
100 Independence
610 Market Street
Philadelphia, PA
19106-2354
1955 | | Trustee | | Since April 20194 | | 105 | | KPMG LLP
(2002-2015)
-Global Sector Chairman,
Industrial Manufacturing
(2010-2015) | | TechAccel LLC
(2015–Present)
PatientsVoices, Inc.
(2018–Present)
Valparaiso University Board
(2012-Present)
Ivy Funds Complex
(2019-2021) |
Name,
Address,
and Birth Year | | Position(s)
Held with
the Trust | | Length of Time
Served1 | | Number of
Funds in Fund
Complex Overseen
by Trustee | | Principal
Occupation(s)
During the
Past Five Years | | Other
Directorships
Held by Trustee
During the
Past Five Years |
| | | | | | | | | | | |
John A. Fry
100 Independence
610 Market Street
Philadelphia, PA
19106-2354
1960 | | Trustee | | Since January 2001 | | 105 | | Drexel University
-President
(2010–Present) | | Federal Reserve Bank of Philadelphia
(2020–Present)
Kresge Foundation
(2018-Present)
FS Credit Real Estate Income
Trust, Inc. (2018–Present)
vTv Therapeutics Inc.
(2017–Present)
Community Health Systems
(2004–Present)
Drexel Morgan & Co.
(2015–2019) |
Board of trustees and officers addendum
Delaware Funds by Macquarie®
Name,
Address,
and Birth Year | | Position(s)
Held with
the Trust | | Length of Time
Served1 | | Number of
Funds in Fund
Complex Overseen
by Trustee | | Principal
Occupation(s)
During the
Past Five Years | | Other
Directorships
Held by Trustee
During the
Past Five Years |
| | | | | | | | | | | |
Joseph Harroz, Jr.
100 Independence
610 Market Street
Philadelphia, PA
19106-2354
1967 | | Trustee | | Since November 19984 | | 105 | | University of Oklahoma
-President
(2020–Present)
-Interim President
(2019–2020)
-Vice President and Dean, College of Law
(2010–2019)
Brookhaven Investments LLC (commercial enterprises)
-Managing Member
(2019–Present)
St. Clair, LLC
(commercial enterprises)
-Managing Member
(2019–Present) | | OU Medicine, Inc.
(2020–Present)
Big 12 Athletic Conference
(2019-Present)
Valliance Bank
(2007–Present)
Ivy Funds Complex
(1998-2021) |
Name,
Address,
and Birth Year | | Position(s)
Held with
the Trust | | Length of Time
Served1 | | Number of
Funds in Fund
Complex Overseen
by Trustee | | Principal
Occupation(s)
During the
Past Five Years | | Other
Directorships
Held by Trustee
During the
Past Five Years |
| | | | | | | | | | | |
Sandra A.J. Lawrence
100 Independence
610 Market Street
Philadelphia, PA
19106-2354
1957 | | Trustee | | Since April 20194 | | 105 | | Children’s Mercy
Hospitals and Clinics
(2005–2019)
-Chief Administrative Officer
(2016–2019) | | Brixmor Property Group Inc.
(2021-Present)
Sera Prognostics Inc.
(biotechnology) (2021-Present) Recology (resource recovery)
(2021-2023)
Evergy, Inc., Kansas City Power & Light Company, KCP&L
Greater Missouri Operations
Company, Westar Energy, Inc.
and Kansas Gas and Electric
Company (related utility companies) (2018-Present)
National Association of Corporate
Directors (2017-Present)
American Shared Hospital
Services (medical device)
(2017-2021)
Ivy Funds Complex
(2019-2021) |
Board of trustees and officers addendum
Delaware Funds by Macquarie®
Name,
Address,
and Birth Year | | Position(s)
Held with
the Trust | | Length of Time
Served1 | | Number of
Funds in Fund
Complex Overseen
by Trustee | | Principal
Occupation(s)
During the
Past Five Years | | Other
Directorships
Held by Trustee
During the
Past Five Years |
| | | | | | | | | | | |
Frances A.
Sevilla-Sacasa
100 Independence
610 Market Street
Philadelphia, PA
19106-2354
1956 | | Trustee | | Since September
2011 | | 105 | | Banco Itaú International
-Chief Executive Officer
(2012–2016)
US Trust Bank of America Private Wealth Management
-President (2007-2008)
U.S. Trust Corp.
-President & CEO
(2005-2007) | | Invitation Homes Inc.
(2023-Present)
Florida Chapter of National Association of Corporate Directors (2021-Present) Callon Petroleum Company
(2019-Present)
Camden Property Trust
(2011-Present)
New Senior Investment
Group Inc. (REIT) (2021)
Carrizo Oil & Gas, Inc.
(2018-2019) |
| | | | | | | | | | | |
Thomas K. Whitford
100 Independence
610 Market Street
Philadelphia, PA
19106-2354
1956 | | Chair and Trustee | | Trustee since January 2013 Chair since January 2023 | | 105 | | PNC Financial Services Group (1983–2013)
-Vice Chairman
(2009-2013) | | HSBC USA Inc.
(2014–2022)
HSBC North America Holdings Inc.
(2013–2022) |
Name,
Address,
and Birth Year | | Position(s)
Held with
the Trust | | Length of Time
Served1 | | Number of
Funds in Fund
Complex Overseen
by Trustee | | Principal
Occupation(s)
During the
Past Five Years | | Other
Directorships
Held by Trustee
During the
Past Five Years |
| | | | | | | | | | | |
Christianna Wood
100 Independence
610 Market Street
Philadelphia, PA
19106-2354
1959 | | Trustee | | Since January 2019 | | 105 | | Gore Creek Capital, Ltd.
-Chief Executive Officer and President
(2009–Present)
Capital Z Asset Management
-Chief Executive Officer
(2008-2009)
California Public Employees’ Retirement System (CalPERS)
-Senior Investment Officer of Global Equity
(2002-2008) | | The Merger Fund
(2013–2021),
The Merger Fund VL
(2013–2021),
WCM Alternatives: Event-Driven Fund (2013–2021), and WCM Alternatives: Credit
Event Fund (2017–2021)
Grange Insurance
(2013–Present)
H&R Block Corporation
(2008–2022) |
| Officers | | | | | | | | | | |
David F. Connor
100 Independence
610 Market Street
Philadelphia, PA
19106-2354
1963 | | Senior Vice President,
General Counsel, and Secretary | | Senior Vice President, since May 2013;
General Counsel
since May 2015;
Secretary since October 2005 | | 105 | | David F. Connor has served in various capacities at different times at Macquarie Asset Management. | | None5 |
Board of trustees and officers addendum
Delaware Funds by Macquarie®
Name,
Address,
and Birth Year | | Position(s)
Held with
the Trust | | Length of Time
Served1 | | Number of
Funds in Fund
Complex Overseen
by Trustee | | Principal
Occupation(s)
During the
Past Five Years | | Other
Directorships
Held by Trustee
During the
Past Five Years |
| | | | | | | | | | | |
Daniel V. Geatens
100 Independence
610 Market Street
Philadelphia, PA
19106-2354
1972 | | Senior Vice President and Treasurer | | Senior Vice President and Treasurer since October 2007 | | 105 | | Daniel V. Geatens has served in various capacities at different times at Macquarie Asset Management. | | None5 |
| | | | | | | | | | | |
Richard Salus
100 Independence
610 Market Street
Philadelphia, PA
19106-2354
1963 | | Senior Vice President and Chief Financial Officer | | Senior Vice President and Chief Financial Officer since November 2006 | | 105 | | Richard Salus has served in various capacities at different times at Macquarie Asset Management. | | None5 |
| 1 | “Length of Time Served” refers to the time since the Trustee or officer began serving one or more of the Trusts in the Delaware Funds complex. |
| 2 | Shawn K. Lytle is considered to be an “Interested Trustee” because he is an executive officer of the Funds’ investment advisor. |
| 3 | Macquarie Asset Management is the marketing name for certain companies comprising the asset management division of Macquarie Group, including the Funds’ investment advisor, principal underwriter, and transfer agent. |
| 4 | Includes time served on the Board of the Ivy Funds complex prior to the date when the Ivy Funds joined the Delaware Funds complex. |
| 5 | David F. Connor and Daniel V. Geatens serve in similar capacities for the six portfolios of the Optimum Fund Trust, which have the same investment manager, principal underwriter, and transfer agent as the Funds. Mr. Connor also serves as Senior Vice President and Assistant Secretary for the three portfolios of the Macquarie ETF Trust, which have the same investment manager as the Funds. Mr. Geatens also serves as the Chief Financial Officer of the Optimum Fund Trust and as Senior Vice President and Treasurer for the Macquarie ETF Trust. Mr. Salus serves in a similar capacity for the Macquarie ETF Trust. |
The Statement of Additional Information for the Fund(s) includes additional information about the Trustees and Officers and is available, without charge, upon request by calling 800 523-1918.
Item 2. Code of Ethics
The registrant has adopted a code of ethics that applies to the registrant’s principal executive officer, principal financial officer, principal accounting officer or controller, or persons performing similar functions, regardless of whether these individuals are employed by the registrant or a third party. A copy of the registrant’s Code of Business Ethics has been posted on the Delaware Funds by Macquarie® Internet Web site at www.delawarefunds.com. Any amendments to the Code of Business Ethics, and information on any waiver from its provisions granted by the registrant, will also be posted on this Web site within five business days of such amendment or waiver and will remain on the Web site for at least 12 months.
Item 3. Audit Committee Financial Expert
The registrant’s Board of Trustees has determined that certain members of the registrant’s Audit Committee are audit committee financial experts, as defined below. For purposes of this item, an “audit committee financial expert” is a person who has the following attributes:
a. An understanding of generally accepted accounting principles and financial statements;
b. The ability to assess the general application of such principles in connection with the accounting for estimates, accruals, and reserves;
c. Experience preparing, auditing, analyzing, or evaluating financial statements that present a breadth and level of complexity of accounting issues that are generally comparable to the breadth and complexity of issues that can reasonably be expected to be raised by the registrant’s financial statements, or experience actively supervising one or more persons engaged in such activities;
d. An understanding of internal controls and procedures for financial reporting; and
e. An understanding of audit committee functions.
An “audit committee financial expert” shall have acquired such attributes through:
a. Education and experience as a principal financial officer, principal accounting officer, controller, public accountant, or auditor or experience in one or more positions that involve the performance of similar functions;
b. Experience actively supervising a principal financial officer, principal accounting officer, controller, public accountant, auditor, or person performing similar functions;
c. Experience overseeing or assessing the performance of companies or public accountants with respect to the preparation, auditing, or evaluation of financial statements; or
d. Other relevant experience.
The registrant’s Board of Trustees has also determined that each member of the registrant’s Audit Committee is independent. In order to be “independent” for purposes of this item, the Audit Committee member may not: (i) other than in his or her capacity as a member of the Board of Trustees or any committee thereof, accept directly or indirectly any consulting,
advisory or other compensatory fee from the issuer; or (ii) be an “interested person” of the registrant as defined in Section 2(a)(19) of the Investment Company Act of 1940.
The names of the audit committee financial experts on the registrant’s Audit Committee are set forth below:
H. Jeffrey Dobbs
Frances Sevilla-Sacasa, Chair
Christianna Wood
Item 4. Principal Accountant Fees and Services
(a) Audit fees.
The aggregate fees billed for services provided to the registrant by its independent auditors for the audit of the registrant’s annual financial statements and for services normally provided by the independent auditors in connection with statutory and regulatory filings or engagements were $85,053 for the fiscal year ended December 31, 2023.
The aggregate fees billed for services provided to the registrant by its independent auditors for the audit of the registrant’s annual financial statements and for services normally provided by the independent auditors in connection with statutory and regulatory filings or engagements were $123,940 for the fiscal year ended December 31, 2022.
(b) Audit-related fees.
The aggregate fees billed by the registrant’s independent auditors for services relating to the performance of the audit of the registrant’s financial statements and not reported under paragraph (a) of this Item were $0 for the fiscal year ended December 31, 2023.
The aggregate fees billed by the registrant’s independent auditors for services relating to the performance of the audit of the financial statements of the registrant’s investment adviser and other service providers under common control with the adviser and that relate directly to the operations or financial reporting of the registrant were $1,362,878 for the registrant’s fiscal year ended December 31, 2023. The percentage of these fees relating to services approved by the registrant’s Audit Committee pursuant to the de minimis exception from the pre-approval requirement in Rule 2-01(c)(7)(i)(C) of Regulation S-X was 0%. These audit-related services were as follows: year-end audit procedures; group reporting and subsidiary statutory audits.
The aggregate fees billed by the registrant’s independent auditors for services relating to the performance of the audit of the registrant’s financial statements and not reported under paragraph (a) of this Item were $0 for the fiscal year ended December 31, 2022.
The aggregate fees billed by the registrant’s independent auditors for services relating to the performance of the audit of the financial statements of the registrant’s investment adviser and other service providers under common control with the adviser and that relate directly to the operations or financial reporting of the registrant were $2,050,189 for the registrant’s fiscal year ended December 31, 2022. The percentage of these fees relating to services approved by the registrant’s Audit Committee pursuant to the de minimis exception from the pre-approval requirement in Rule 2-01(c)(7)(i)(C) of Regulation S-X was 0%. These audit-related services were as follows: year-end audit procedures; group reporting and subsidiary statutory audits.
(c) Tax fees.
The aggregate fees billed by the registrant’s independent auditors for tax-related services provided to the registrant were $16,854 for the fiscal year ended December 31, 2023. The percentage of these fees relating to services approved by the registrant’s Audit Committee pursuant to the de minimis exception from the pre-approval requirement in Rule 2-01(c)(7)(i)(C) of Regulation S-X was 0%. These tax-related services were as follows: review of income tax returns and review of annual excise distribution calculations.
The aggregate fees billed by the registrant’s independent auditors for tax-related services provided to the registrant’s investment adviser and other service providers under common control with the adviser and that relate directly to the operations or financial reporting of the registrant were $0 for the registrant’s fiscal year ended December 31, 2023. The percentage of these fees relating to services approved by the registrant’s Audit Committee pursuant to the de minimis exception from the pre-approval requirement in Rule 2-01(c)(7)(i)(C) of Regulation S-X was 0%.
The aggregate fees billed by the registrant’s independent auditors for tax-related services provided to the registrant were $16,854 for the fiscal year ended December 31, 2022. The percentage of these fees relating to services approved by the registrant’s Audit Committee pursuant to the de minimis exception from the pre-approval requirement in Rule 2-01(c)(7)(i)(C) of Regulation S-X was 0%. These tax-related services were as follows: review of income tax returns and review of annual excise distribution calculations.
The aggregate fees billed by the registrant’s independent auditors for tax-related services provided to the registrant’s investment adviser and other service providers under common control with the adviser and that relate directly to the operations or financial reporting of the registrant were $0 for the registrant’s fiscal year ended December 31, 2022. The percentage of these fees relating to services approved by the registrant’s Audit Committee pursuant to the de minimis exception from the pre-approval requirement in Rule 2-01(c)(7)(i)(C) of Regulation S-X was 0%.
(d) All other fees.
The aggregate fees billed for all services provided by the independent auditors to the registrant other than those set forth in paragraphs (a), (b) and (c) of this Item were $0 for the fiscal year ended December 31, 2023.
The aggregate fees billed for all services other than those set forth in paragraphs (b) and (c) of this Item provided by the registrant’s independent auditors to the registrant’s adviser and other service providers under common control with the adviser and that relate directly to the operations or financial reporting of the registrant were $0 for the registrant’s fiscal year ended December 31, 2023. The percentage of these fees relating to services approved by the registrant’s Audit Committee pursuant to the de minimis exception from the pre-approval requirement in Rule 2-01(c)(7)(i)(C) of Regulation S-X was 0%.
The aggregate fees billed for all services provided by the independent auditors to the registrant other than those set forth in paragraphs (a), (b) and (c) of this Item were $0 for the fiscal year ended December 31, 2022.
The aggregate fees billed for all services other than those set forth in paragraphs (b) and (c) of this Item provided by the registrant’s independent auditors to the registrant’s adviser and
other service providers under common control with the adviser and that relate directly to the operations or financial reporting of the registrant were $0 for the registrant’s fiscal year ended December 31, 2022. The percentage of these fees relating to services approved by the registrant’s Audit Committee pursuant to the de minimis exception from the pre-approval requirement in Rule 2-01(c)(7)(i)(C) of Regulation S-X was 0%.
(e) The registrant’s Audit Committee has established pre-approval policies and procedures as permitted by Rule 2-01(c)(7)(i)(B) of Regulation S-X (the “Pre-Approval Policy”) with respect to services provided by the registrant’s independent auditors. Pursuant to the Pre-Approval Policy, the Audit Committee has pre-approved the services set forth in the table below with respect to the registrant up to the specified fee limits. Certain fee limits are based on aggregate fees to the registrant and other registrants within the Delaware Funds by Macquarie®.
| Service | Range of Fees |
| Audit Services | |
| Statutory audits or financial audits for new Funds | up to $50,000 per Fund |
| Services associated with SEC registration statements (e.g., Form N-1A, Form N-14, etc.), periodic reports and other documents filed with the SEC or other documents issued in connection with securities offerings (e.g., comfort letters for closed-end Fund offerings, consents), and assistance in responding to SEC comment letters | up to $10,000 per Fund |
| Consultations by Fund management as to the accounting or disclosure treatment of transactions or events and/or the actual or potential impact of final or proposed rules, standards or interpretations by the SEC, FASB, or other regulatory or standard-setting bodies (Note: Under SEC rules, some consultations may be considered “audit-related services” rather than “audit services”) | up to $25,000 in the aggregate |
| Audit-Related Services | |
| Consultations by Fund management as to the accounting or disclosure treatment of transactions or events and /or the actual or potential impact of final or proposed rules, standards or interpretations by the SEC, FASB, or other regulatory or standard-setting bodies (Note: Under SEC rules, some consultations may be considered “audit services” rather than “audit-related services”) | up to $25,000 in the aggregate |
| Tax Services | |
| U.S. federal, state and local and international tax planning and advice (e.g., consulting on statutory, regulatory or administrative developments, evaluation of Funds’ tax compliance function, etc.) | up to $25,000 in the aggregate |
| U.S. federal, state and local tax compliance (e.g., excise distribution reviews, etc.) | up to $5,000 per Fund |
| Review of federal, state, local and international income, franchise and other tax returns | up to $5,000 per Fund |
Under the Pre-Approval Policy, the Audit Committee has also pre-approved the services set forth in the table below with respect to the registrant’s investment adviser and other entities controlling, controlled by or under common control with the investment adviser that provide ongoing services to the registrant (the “Control Affiliates”) up to the specified fee limit. This fee limit is based on aggregate fees to the investment adviser and its Control Affiliates.
| Service | Range of Fees |
| Non-Audit Services | |
| Services associated with periodic reports and other documents filed with the SEC and assistance in responding to SEC comment letters | up to $10,000 in the aggregate |
The Pre-Approval Policy requires the registrant’s independent auditors to report to the Audit Committee at each of its regular meetings regarding all services initiated since the last such report was rendered, including those services authorized by the Pre-Approval Policy.
(f) Not applicable.
(g) The aggregate non-audit fees billed by the registrant’s independent auditors for services rendered to the registrant and to its investment adviser and other service providers under common control with the adviser were $24,428,000 and $9,044,000 for the registrant’s fiscal years ended December 31, 2023 and December 31, 2022, respectively.
(h) In connection with its selection of the independent auditors, the registrant’s Audit Committee has considered the independent auditors’ provision of non-audit services to the registrant’s investment adviser and other service providers under common control with the adviser that were not required to be pre-approved pursuant to Rule 2-01(c)(7)(ii) of Regulation S-X. The Audit Committee has determined that the independent auditors’ provision of these services is compatible with maintaining the auditors’ independence.
(i) Not applicable.
(j) Not applicable.
Item 5. Audit Committee of Listed Registrants
Not applicable.
Item 6. Investments
(a) Included as part of report to shareholders filed under Item 1 of this Form N-CSR.
(b) Divestment of securities in accordance with Section 13(c) of the Investment Company Act of 1940.
Not applicable.
Item 7. Disclosure of Proxy Voting Policies and Procedures for Closed-End Management Investment Companies
Not applicable.
Item 8. Portfolio Managers of Closed-End Management Investment Companies
Not applicable.
Item 9. Purchases of Equity Securities by Closed-End Management Investment Companies and Affiliated Purchasers
Not applicable.
Item 10. Submission of Matters to a Vote of Security Holders
Not applicable.
Item 11. Controls and Procedures
The registrant’s principal executive officer and principal financial officers, or persons performing similar functions, have concluded that the registrant’s disclosure controls and procedures (as defined in Rule 30a-3(c) under the Investment Company Act of 1940, as amended (17 CFR 270.30a-3(c))) are effective, as of a date within 90 days of the filing of this report, based on their evaluation of these controls and procedures required by Rule 30a-3(b) under the Investment Company Act of 1940 (17 CFR 270.30a-3(b)) and Rules 13a-15(b) or 15d-15(b) under the Securities Exchange Act of 1934, as amended (17 CFR 240.13a-15(b) or 240.15d-15(b)) and provide reasonable assurance that the information required to be disclosed by the registrant in its reports or statements filed under the Securities Exchange Act of 1934 is recorded, processed, summarized and reported within the time periods specified in the rules and forms of the Securities and Exchange Commission.
There were no significant changes in the registrant’s internal control over financial reporting (as defined in Rule 30a-3(d) under the Investment Company Act of 1940 (17 CFR 270.30a-3(d)) that occurred during the period covered by the report to stockholders included herein that have materially affected, or are reasonably likely to materially affect, the registrant’s internal control over financial reporting.
Item 12. Disclosure of Securities Lending Activities for Closed-End Management Investment Companies
Not applicable.
Item 13. Recovery of Erroneously Awarded Compensation
Not applicable.
Item 14. Exhibits
Not applicable.
(2) Certifications of Principal Executive Officer and Principal Financial Officer pursuant to Rule 30a-2 under the Investment Company Act of 1940 are attached hereto as Exhibit 99.CERT.
(3) Written solicitations to purchase securities pursuant to Rule 23c-1 under the Securities Exchange Act of 1934.
Not applicable.
SIGNATURES
Pursuant to the requirements of the Securities Exchange Act of 1934 and the Investment Company Act of 1940, the registrant has duly caused this report to be signed on its behalf, by the undersigned, thereunto duly authorized.
DELAWARE GROUP® LIMITED-TERM GOVERNMENT FUNDS
| /s/SHAWN K. LYTLE | |
| By: | Shawn K. Lytle |
| Title: | President and Chief Executive Officer |
| Date: | February 20, 2024 |
| | | |
Pursuant to the requirements of the Securities Exchange Act of 1934 and the Investment Company Act of 1940, this report has been signed below by the following persons on behalf of the registrant and in the capacities and on the dates indicated.
| /s/SHAWN K. LYTLE | |
| By: | Shawn K. Lytle |
| Title: | President and Chief Executive Officer |
| Date: | February 20, 2024 |
| | | |
| /s/RICHARD SALUS | |
| By: | Richard Salus |
| Title: | Chief Financial Officer |
| Date: | February 20, 2024 |