UNITED STATES SECURITIES AND EXCHANGE COMMISSION
Washington, D.C. 20549
FORM N-CSR
CERTIFIED SHAREHOLDER REPORT OF REGISTERED MANAGEMENT
INVESTMENT COMPANIES
| Investment Company Act file number: | | 811-03363 |
| | | |
| Exact name of registrant as specified in charter: | | Delaware Group® Limited-Term
Government Funds |
| | | |
| Address of principal executive offices: | | 610 Market Street |
| | Philadelphia, PA 19106 |
| | | |
| Name and address of agent for service: | | David F. Connor, Esq. |
| | 610 Market Street |
| | Philadelphia, PA 19106 |
| | | |
| Registrant’s telephone number, including area code: | | (800) 523-1918 |
| | | |
| Date of fiscal year end: | | December 31 |
| | | |
| Date of reporting period: | | December 31, 2020 |
Item 1. Reports to Stockholders
Annual report
Fixed income mutual fund
Delaware Limited-Term Diversified Income Fund
December 31, 2020
Beginning on or about June 1, 2021, as permitted by regulations adopted by the Securities and Exchange Commission, paper copies of your Fund’s shareholder reports will no longer be sent to you by mail, unless you specifically request them from the Fund or from your financial intermediary, such as a broker/dealer, bank, or insurance company. Instead, you will be notified by mail each time a report is posted on the website and provided with a link to access the report. If you already elected to receive shareholder reports electronically, you will not be affected by this change and you do not need to take any action. You may elect to receive shareholder reports and other communications from the Fund electronically by signing up at delawarefunds.com/edelivery. If you own these shares through a financial intermediary, you may contact your financial intermediary. You may elect to receive paper copies of all future shareholder reports free of charge. You can inform the Fund that you wish to continue receiving paper copies of your shareholder reports by contacting us at 800 523-1918. If you own these shares through a financial intermediary, you may contact your financial intermediary to elect to continue to receive paper copies of your shareholder reports. Your election to receive reports in paper will apply to all funds held with the Delaware Funds® by Macquarie or your financial intermediary. |
Carefully consider the Fund’s investment objectives, risk factors, charges, and expenses before investing. This and other information can be found in the Fund’s prospectus and its summary prospectus, which may be obtained by visiting delawarefunds.com/literature or calling 800 523-1918. Investors should read the prospectus and the summary prospectus carefully before investing.
You can obtain shareholder reports and prospectuses online instead of in the mail. Visit delawarefunds.com/edelivery.
Experience Delaware Funds® by Macquarie
Macquarie Investment Management (MIM) is a global asset manager with offices in the United States, Europe, Asia, and Australia. As active managers, we prioritize autonomy and accountability at the investment team level in pursuit of opportunities that matter for clients. Delaware Funds is one of the longest-standing mutual fund families, with more than 80 years in existence.
If you are interested in learning more about creating an investment plan, contact your financial advisor.
You can learn more about Delaware Funds or obtain a prospectus for Delaware Limited-Term Diversified Income Fund at delawarefunds.com/literature.
Manage your account online
| ● | Check your account balance and transactions |
| ● | View statements and tax forms |
| ● | Make purchases and redemptions |
Visit delawarefunds.com/account-access.
Macquarie Asset Management (MAM) offers a diverse range of products including securities investment management, infrastructure and real asset management, and fund and equity-based structured products. MIM is the marketing name for certain companies comprising the asset management division of Macquarie Group. This includes the following investment advisers: Macquarie Investment Management Business Trust (MIMBT), Macquarie Funds Management Hong Kong Limited, Macquarie Investment Management Austria Kapitalanlage AG, Macquarie Investment Management Global Limited, Macquarie Investment Management Europe Limited, and Macquarie Investment Management Europe S.A.
The Fund is distributed by Delaware Distributors, L.P. (DDLP), an affiliate of MIMBT and Macquarie Group Limited.
Other than Macquarie Bank Limited (MBL), none of the entities noted are authorized deposit-taking institutions for the purposes of the Banking Act 1959 (Commonwealth of Australia). The obligations of these entities do not represent deposits or other liabilities of MBL. MBL does not guarantee or otherwise provide assurance in respect of the obligations of these entities, unless noted otherwise.
The Fund is governed by US laws and regulations.
| Table of contents | | |
| Portfolio management review | | 1 |
| Performance summary | | 4 |
| Disclosure of Fund expenses | | 9 |
| Security type / sector allocation | | 11 |
| Schedule of investments | | 12 |
| Statement of assets and liabilities | | 30 |
| Statement of operations | | 32 |
| Statements of changes in net assets | | 34 |
| Financial highlights | | 36 |
| Notes to financial statements | | 46 |
Report of independent
registered public accounting firm | | 66 |
| Other Fund information | | 67 |
Board of trustees / directors
and officers addendum | | 71 |
| About the organization | | 79 |
Unless otherwise noted, views expressed herein are current as of December 31, 2020, and subject to change for events occurring after such date.
The Fund is not FDIC insured and is not guaranteed. It is possible to lose the principal amount invested.
Advisory services provided by Delaware Management Company, a series of MIMBT, a US registered investment advisor.
All third-party marks cited are the property of their respective owners.
© 2021 Macquarie Management Holdings, Inc.
| Portfolio management review | |
| Delaware Limited-Term Diversified Income Fund | January 12, 2021 (Unaudited) |
| Performance preview (for the year ended December 31, 2020) | | | | |
| Delaware Limited-Term Diversified Income Fund (Institutional Class shares) | | 1-year return | | +4.31% |
| Delaware Limited-Term Diversified Income Fund (Class A shares) | | 1-year return | | +4.16% |
| Bloomberg Barclays 1-3 Year US Government/Credit Index | | 1-year return | | +3.33% |
Past performance does not guarantee future results.
For complete, annualized performance for Delaware Limited-Term Diversified Income Fund, please see the table on page 4.
Institutional Class shares are not subject to a sales charge and are offered for sale exclusively to certain eligible investors. In addition, Institutional Class shares pay no distribution and service fee.
The performance of Class A shares excludes the applicable sales charge. The performance of both Institutional Class shares and Class A shares reflects the reinvestment of all distributions.
Please see page 7 for a description of the index. Index performance returns do not reflects any management fees, transaction costs, or expenses. Indices are unmanaged and one cannot invest directly in an index.
Investment objective
The Fund seeks maximum total return, consistent with reasonable risk.
Market review
As 2020 began, the economy appeared to be entering a mature credit cycle, and investors were concerned with the possibility of a mild recession. Instead, the coronavirus pandemic struck and spread rapidly. The global community was unprepared. Initial uncertainty was quickly followed by an extreme market selloff and global economic collapse.
Governments and central banks applied lessons learned from the recession of 2008-2009, and in March they intervened with substantial monetary- and fiscal-policy measures. The effective use of global fiscal and monetary support defined how the economy and financial markets evolved in 2020.
Investors’ uncertainty in March 2020 provoked a risk-premium explosion in the market and economic shutdowns. However, backstopped by the US Federal Reserve’s unprecedented, aggressive asset-purchase programs, which included purchasing corporate bonds, some confidence returned to markets. As the world
| Consistent with our outlook, we reduced exposure to areas we believe offer limited upside, such as higher-quality credit and ABS, and replaced them with agency MBS and securities with more attractive yield profiles, such as CLOs. We have retained exposure to the reflationary theme, including airlines and certain consumer goods, and we continue to search for areas where we believe there is potential to capture yield without altering the Fund’s risk exposure. |
1
Portfolio management review
Delaware Limited-Term Diversified Income Fund
began to understand how the virus behaved and how to help bring it under control, the US and global economies began to reopen. Credit markets, which had widened substantially as markets collapsed, started to compress, bolstered by now dual Fed and congressional puts. Then came the race to develop vaccines, along with a better understanding of how to manage the virus.
Although the markets and parts of the economy generally adapted quickly, COVID-19-affected sectors, particularly services, experienced extreme distress. These included transportation and other consumer-related areas such as retail. Damage to labor markets was significant, with unemployment still standing higher than 6% at year end. However, with monetary and fiscal policy in place and a clear commitment to support the economy for as long as it would take, the path to the other side of the pandemic became clearer.
Within the Fund
For its fiscal year ended December 31, 2020, Delaware Limited-Term Diversified Income Fund outperformed its benchmark, the Bloomberg Barclays 1-3 Year US Government/Credit Index. The Fund’s Institutional Class shares gained 4.31%. The Fund’s Class A shares advanced 4.16% at net asset value and 1.34% at maximum offer price (both returns reflect all distributions reinvested). For the same period, the Fund’s benchmark gained 3.33%. Complete annualized performance for Delaware Limited-Term Diversified Income Fund is shown in the table on page 4.
We viewed 2020 from the prism of different market regimes, each of which called for a distinct approach to managing risk. Entering the year, because compensation for risk was poor, we cut back on the Fund’s risk exposure and built a capital reserve to spend as opportunities arose, nearly eliminating exposure to higher-risk parts of the market, such as higher yield bonds. The year became a litmus test for managing risk, and we believe our agile approach to risk management was critical in helping the Fund outperform its benchmark for the 12-month period.
With the Fund’s capital reserve in hand, we began to look for investment opportunities created by market dislocations in the initial phase of the pandemic. Investors’ anticipated liquidity needs no longer seemed to a major concern. We focused on issuers that we assessed would more likely survive the pandemic. Accordingly, we began to spend the Fund’s liquid capital reserve, selecting higher yielding parts of the securitized bond sector and high-quality investment grade issuers, such as Bank of America Corp., which we felt offered attractive compensation for the underlying risk.
As visibility gradually increased, we expanded our search for opportunities to also include traditionally higher-beta (more volatile) parts of the market that had experienced dislocations, specifically within the high yield and emerging markets sectors. We added to issuers that we felt were strongest within COVID-19-sensitive areas, such as Delta Air Lines Inc. We viewed Delta as well positioned to survive the pandemic while offering historically high yields. In addition, an overweight to certain higher-quality emerging market issuers, such as Banco Santander S.A., benefited performance as well. The Fund continues to hold these securities as we believe they have retained their relative value potential.
While security selection overall was additive, some individual securities did underperform amid the demand contraction. This was the case with General Motors Financial Co. Inc., which underperformed during the peak of the crisis but has since recovered as monetary support improved liquidity prospects. We maintain the Fund’s position given our outlook for continued economic recovery with the vaccine rollout.
The Fund’s positioning also benefited from our decision early in the year to increase duration for
2
the purpose of mitigating risk, as we thought that a high degree of uncertainty would likely result in a dramatic decline in interest rates as the Fed intervened. That willingness to dynamically manage interest rate risk paid off.
There were few detractors from the Fund’s benchmark-relative returns for the fiscal year. Our use of mortgage-backed securities (MBS) as a funding source detracted marginally; however, the Fund was better compensated within investment grade bonds. The Fund’s modest allocation to bank loans, which remained static throughout the year, modestly detracted from returns. A moderate overweight to energy securities, albeit strongly positioned to manage through the pandemic, detracted as the sector had not fully recovered.
We also focused on higher-quality issuers within investment grade, whose business models we thought were more likely to survive the pandemic. By summer, we also added somewhat to the Fund’s exposure to the higher yielding areas of the fixed income market, such as emerging markets debt and high yield bonds (from 2% to 10%). Within the securitized bond sector, we increased the Fund’s allocation to collateralized loan obligations (CLOs) from 0% to 7%, funded with Treasurys and lower yielding floating-rate asset-backed securities (ABS).
Key risks and opportunities
As we enter 2021, COVID-19 vaccines’ high efficacy and their production and distribution have redefined the outlook for the pandemic and the global economy. Nonetheless, the near-term reality is that the virus is still raging, and mutations could make the virus more resistant to vaccines.
On the political front, Democrats control both houses of Congress and the White House, increasing the possibility of additional fiscal stimulus, which would support an economic recovery.
Consistent with our outlook, we reduced exposure to areas we believe offer limited upside, such as higher-quality credit and ABS, and replaced them with agency MBS and securities with what we view as more attractive yield profiles, such as CLOs. We have retained exposure to the reflationary theme, including airlines and certain consumer goods, and we continue to search for areas where we believe there is potential to capture yield without altering the Fund’s risk exposure.
Finally, from a risk perspective, the Fund remains driven by a fundamental, bond-by-bond investment approach. Our goal is to construct the Fund’s portfolio to comprise issuers that have a business model, liquidity, and adequate debt leverage profile to perform well regardless of the degree of volatility we may experience.
The Fund used derivatives during the fiscal year, primarily for risk management purposes, including the use of interest rate futures to manage yield-curve risk and broader portfolio risks. The Fund used currency forwards to hedge non-US-dollar risk back to US dollars. The Fund also used foreign exchange (FX) forwards to gain access to a given currency, though we generally do this more directly through the bond market. The Fund also used credit default swaps to manage credit risk. Overall, these derivatives had a positive effect that was generally not material to the Fund’s performance.
3
| Performance summary | |
| Delaware Limited-Term Diversified Income Fund | December 31, 2020 (Unaudited) |
The performance quoted represents past performance and does not guarantee future results. Investment return and principal value of an investment will fluctuate so that shares, when redeemed, may be worth more or less than their original cost. Current performance may be lower or higher than the performance quoted. Performance data current to the most recent month end may be obtained by calling 800 523-1918 or visiting delawarefunds.com/performance.
| Fund and benchmark performance1,2 | Average annual total returns through December 31, 2020 |
| | 1 year | | 5 year | | 10 year | | Lifetime | |
| Class A (Est. November 24, 1985) | | | | | | | | | |
| Excluding sales charge | | +4.16% | | +2.40% | | +1.73% | | +4.62% | |
| Including sales charge | | +1.34% | | +1.83% | | +1.45% | | +4.53% | |
| Class C (Est. November 28, 1995) | | | | | | | | | |
| Excluding sales charge | | +3.28% | | +1.56% | | +0.88% | | +2.86% | |
| Including sales charge | | +2.28% | | +1.56% | | +0.88% | | +2.86% | |
| Class R (Est. June 2, 2003) | | | | | | | | | |
| Excluding sales charge | | +3.66% | | +2.05% | | +1.37% | | +2.47% | |
| Including sales charge | | +3.66% | | +2.05% | | +1.37% | | +2.47% | |
| Institutional Class (Est. June 1, 1992) | | | | | | | | | |
| Excluding sales charge | | +4.31% | | +2.56% | | +1.88% | | +3.97% | |
| Including sales charge | | +4.31% | | +2.56% | | +1.88% | | +3.97% | |
| Class R6 (Est. May 1, 2017) | | | | | | | | | |
| Excluding sales charge | | +4.38% | | — | | — | | +2.56% | |
| Including sales charge | | +4.38% | | — | | — | | +2.56% | |
| Bloomberg Barclays 1-3 Year US | | | | | | | | | |
| Government/Credit Index | | +3.33% | | +2.21% | | +1.60% | | +3.85%* | |
| * | The benchmark lifetime return is for Institutional Class share comparison only and is calculated using the month end prior to the Fund’s Institutional Class inception date. |
| 1 | Returns reflect the reinvestment of all distributions and are presented both with and without the applicable sales charges described below. Returns do not reflect the deduction of taxes the shareholder would pay on Fund distributions or redemptions of Fund shares. |
Expense limitations were in effect for certain classes during some or all of the periods shown in the “Fund and benchmark performance” table. Expenses for each class are listed on the “Fund expense ratios” table on page 6. Performance would have been lower had expense limitations not been in effect.
Institutional Class shares are not subject to a sales charge and are offered for sale exclusively to certain eligible investors. In addition, Institutional Class shares pay no distribution and service (12b-1) fee.
Class A shares are sold with a maximum front-end sales charge of 2.75%, and have an annual 12b-1 fee of 0.25% of average daily net assets. Performance for Class A shares, excluding sales
4
charges, assumes that no front-end sales charge applied.
Class C shares are sold with a contingent deferred sales charge of 1.00% if redeemed during the first 12 months. They are also subject to an annual 12b-1 fee of 1.00% of average daily net assets. Performance for Class C shares, excluding sales charges, assumes either that contingent deferred sales charges did not apply or that the investment was not redeemed.
Class R shares are available only for certain retirement plan products. They are sold without a sales charge and have an annual 12b-1 fee of 0.50% of average daily net assets.
Class R6 shares are available only to certain investors. In addition, Class R6 shares do not pay any service fees, sub-accounting fees, and/or sub-transfer agency fees to any brokers, dealers, or other financial intermediaries. Class R6 shares pay no 12b-1 fee.
Fixed income securities and bond investments can lose value, and investors can lose principal, as interest rates rise. They also may be affected by economic conditions that hinder an issuer’s ability to make interest and principal payments on its debt.
The Fund may also be subject to prepayment risk, the risk that the principal of a bond that is held by a portfolio will be prepaid prior to maturity, at the time when interest rates are lower than what the bond was paying. A portfolio may then have to reinvest that money at a lower interest rate.
High yielding, non-investment-grade bonds (junk bonds) involve higher risk than investment grade bonds.
The high yield secondary market is particularly susceptible to liquidity problems when institutional investors, such as mutual funds and certain other financial institutions, temporarily stop buying bonds for regulatory, financial, or other reasons. In addition, a less liquid secondary market makes it more difficult for the Fund to obtain precise valuations of the high yield securities in its portfolio.
The Fund may invest in derivatives, which may involve additional expenses and are subject to risk, including the risk that an underlying security or securities index moves in the opposite direction from what the portfolio manager anticipated. A derivatives transaction depends upon the counterparties’ ability to fulfill their contractual obligations.
International investments entail risks including fluctuation in currency values, differences in accounting principles, or economic or political instability. Investing in emerging markets can be riskier than investing in established foreign markets due to increased volatility, lower trading volume, and higher risk of market closures. In many emerging markets, there is substantially less publicly available information and the available information may be incomplete or misleading. Legal claims are generally more difficult to pursue.
If and when the Fund invests in forward foreign currency contracts or uses other investments to hedge against currency risks, the Fund will be subject to special risks, including counterparty risk.
Diversification may not protect against market risk.
IBOR risk is the risk that changes related to the use of the London interbank offered rate (LIBOR) or similar rates (such as EONIA) could have adverse impacts on financial instruments that reference these rates. The abandonment of these rates and transition to alternative rates could affect the value and liquidity of instruments that reference them and could affect investment strategy performance.
The disruptions caused by natural disasters, pandemics, or similar events could prevent the Fund from executing advantageous investment
5
Performance summary
Delaware Limited-Term Diversified Income Fund
decisions in a timely manner and could negatively impact the Fund’s ability to achieve its investment objective and the value of the Fund’s investments.
| 2 | The Fund’s expense ratios, as described in the most recent prospectus, are disclosed in the following “Fund expense ratios” table. Delaware Management Company has agreed to reimburse certain expenses and/or waive certain fees in order to prevent total annual fund operating expenses (excluding any 12b-1 fees, acquired fund fees and expenses, taxes, interest, short sale dividend and interest expenses, brokerage fees, certain insurance costs, and nonroutine expenses or costs, including, but not limited to, those relating to reorganizations, litigation, conducting shareholder meetings, and liquidations (collectively, nonroutine expenses)) from exceeding 0.39% of the Fund’s average daily net assets for all share classes other than R6, and 0.32% of the Fund’s Class R6 shares’ average daily net assets from January 1, 2020 to December 31, 2020.* Please see the most recent prospectus and any applicable supplement(s) for additional information on these fee waivers and/or reimbursements. Please see the “Financial highlights” section in this report for the most recent expense ratios. |
| | | | | | | | Institutional | | | |
| Fund expense ratios | | Class A | | Class C | | Class R | | Class | | Class R6 | |
| Total annual operating expenses | | | | | | | | | | | |
| (without fee waivers) | | 0.96% | | 1.71% | | 1.21% | | 0.71% | | 0.64% | |
| Net expenses (including fee | | | | | | | | | | | |
| waivers, if any) | | 0.54% | | 1.39% | | 0.89% | | 0.39% | | 0.32% | |
| Type of waiver | | Contractual | | Contractual | | Contractual | | Contractual | | Contractual | |
| * | The aggregate contractual waiver period covering this report is from May 1, 2019 through April 30, 2021. |
6
Performance of a $10,000 Investment1
Average annual total returns from December 31, 2010 through December 31, 2020
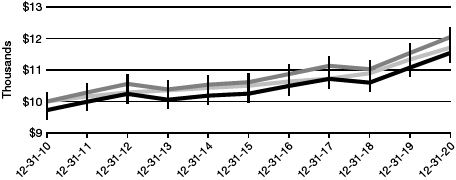
| For period beginning December 31, 2010 through December 31, 2020 | Starting value | Ending value |
| | | Delaware Limited-Term Diversified Income Fund — Institutional Class shares | | $10,000 | | | $12,049 | |
| | | Bloomberg Barclays 1-3 Year US Government/Credit Index | | $10,000 | | | $11,715 | |
| | | Delaware Limited-Term Diversified Income Fund — Class A shares | | $9,725 | | | $11,546 | |
| 1 | The “Performance of a $10,000 investment” graph assumes $10,000 invested in Institutional Class and Class A shares of the Fund on December 31, 2010, and includes the effect of a 2.75% front-end sales charge (for Class A shares) and the reinvestment of all distributions. The graph does not reflect the deduction of taxes the shareholders would pay on Fund distributions or redemptions of Fund shares. Expense limitations were in effect for some or all of the periods shown. Performance would have been lower had expense limitations not been in effect. Expenses are listed in the “Fund expense ratios” table on page 6. Please note additional details on pages 4 through 8. |
The graph also assumes $10,000 invested in the Bloomberg Barclays 1-3 Year US Government/ Credit Index as of December 31, 2010.
Index performance returns do not reflect any management fees, transaction costs, or expenses. Indices are unmanaged and one cannot invest directly in an index. Past performance is not a guarantee of future results.
Performance of other Fund classes will vary due to different charges and expenses.
7
Performance summary
Delaware Limited-Term Diversified Income Fund
| | Nasdaq symbols | | CUSIPs | |
| Class A | | | DTRIX | | | 245912308 | |
| Class C | | | DTICX | | | 245912704 | |
| Class R | | | DLTRX | | | 245912803 | |
| Institutional Class | | | DTINX | | | 245912506 | |
| Class R6 | | | DLTZX | | | 245912886 | |
8
Disclosure of Fund expenses
For the six-month period from July 1, 2020 to December 31, 2020 (Unaudited)
As a shareholder of the Fund, you incur two types of costs: (1) transaction costs, including sales charges (loads) on purchase payments, reinvested dividends, or other distributions; redemption fees; and exchange fees; and (2) ongoing costs, including management fees; distribution and service (12b-1) fees; and other Fund expenses. This example is intended to help you understand your ongoing costs (in dollars) of investing in the Fund and to compare these costs with the ongoing costs of investing in other mutual funds.
The example is based on an investment of $1,000 invested at the beginning of the period and held for the entire six-month period from July 1, 2020 to December 31, 2020.
Actual expenses
The first section of the table shown, “Actual Fund return,” provides information about actual account values and actual expenses. You may use the information in this section of the table, together with the amount you invested, to estimate the expenses that you paid over the period. Simply divide your account value by $1,000 (for example, an $8,600 account value divided by $1,000 = 8.6), then multiply the result by the number in the first section under the heading entitled “Expenses Paid During Period” to estimate the expenses you paid on your account during this period.
Hypothetical example for comparison purposes
The second section of the table shown, “Hypothetical 5% return,” provides information about hypothetical account values and hypothetical expenses based on the Fund’s actual expense ratio and an assumed rate of return of 5% per year before expenses, which is not the Fund’s actual return. The hypothetical account values and expenses may not be used to estimate the actual ending account balance or expenses you paid for the period. You may use this information to compare the ongoing costs of investing in the Fund and other funds. To do so, compare this 5% hypothetical example with the 5% hypothetical examples that appear in the shareholder reports of the other funds.
Please note that the expenses shown in the table are meant to highlight your ongoing costs only and do not reflect any transactional costs, such as sales charges (loads), redemption fees, or exchange fees. Therefore, the second section of the table is useful in comparing ongoing costs only, and will not help you determine the relative total costs of owning different funds. In addition, if these transactional costs were included, your costs would have been higher. The Fund’s expenses shown in the table reflect fee waivers in effect and assume reinvestment of all dividends and distributions.
9
Disclosure of Fund expenses
For the six-month period from July 1, 2020 to December 31, 2020 (Unaudited)
Delaware Limited-Term Diversified Income Fund
Expense analysis of an investment of $1,000
| | Beginning | | Ending | | | | | | | Expenses |
| | Account Value | | Account Value | | Annualized | | Paid During Period |
| | 7/1/20 | | 12/31/20 | | Expense Ratio | | 7/1/20 to 12/31/20* |
| Actual Fund return† | | | | | | | | | | | | | | | | | | | | |
| Class A | | | $ | 1,000.00 | | | | $ | 1,014.90 | | | | 0.54 | % | | | | $ | 2.73 | |
| Class C | | | | 1,000.00 | | | | | 1,011.80 | | | | 1.39 | % | | | | | 7.03 | |
| Class R | | | | 1,000.00 | | | | | 1,013.10 | | | | 0.89 | % | | | | | 4.50 | |
| Institutional Class | | | | 1,000.00 | | | | | 1,015.70 | | | | 0.39 | % | | | | | 1.98 | |
| Class R6 | | | | 1,000.00 | | | | | 1,017.20 | | | | 0.32 | % | | | | | 1.62 | |
| Hypothetical 5% return (5% return before expenses) | | | | | | | | | | | | | | | |
| Class A | | | $ | 1,000.00 | | | | $ | 1,022.42 | | | | 0.54 | % | | | | $ | 2.75 | |
| Class C | | | | 1,000.00 | | | | | 1,018.15 | | | | 1.39 | % | | | | | 7.05 | |
| Class R | | | | 1,000.00 | | | | | 1,020.66 | | | | 0.89 | % | | | | | 4.52 | |
| Institutional Class | | | | 1,000.00 | | | | | 1,023.18 | | | | 0.39 | % | | | | | 1.98 | |
| Class R6 | | | | 1,000.00 | | | | | 1,023.53 | | | | 0.32 | % | | | | | 1.63 | |
| * | “Expenses Paid During Period” are equal to the Fund’s annualized expense ratio, multiplied by the average account value over the period, multiplied by 184/366 (to reflect the one-half year period). |
| † | Because actual returns reflect only the most recent six-month period, the returns shown may differ significantly from fiscal year returns. |
In addition to the Fund’s expenses reflected above, the Fund also indirectly bears its portion of the fees and expenses of the investment companies (Underlying Funds) in which it invests. The table above does not reflect the expenses of the Underlying Funds.
10
| Security type / sector allocation | |
| Delaware Limited-Term Diversified Income Fund | As of December 31, 2020 (Unaudited) |
Sector designations may be different than the sector designations presented in other Fund materials. The sector designations may represent the investment manager’s internal sector classifications.
| Security type / sector | | Percentage of net assets |
| Agency Asset-Backed Securities | | | 0.00 | % | |
| Agency Collateralized Mortgage Obligations | | | 2.17 | % | |
| Agency Commercial Mortgage-Backed Securities | | | 0.30 | % | |
| Agency Mortgage-Backed Securities | | | 12.82 | % | |
| Collateralized Debt Obligations | | | 6.99 | % | |
| Convertible Bond | | | 0.01 | % | |
| Corporate Bonds | | | 46.02 | % | |
| Banking | | | 10.70 | % | |
| Banks | | | 0.37 | % | |
| Basic Industry | | | 4.00 | % | |
| Capital Goods | | | 2.91 | % | |
| Communications | | | 3.51 | % | |
| Consumer Cyclical | | | 3.37 | % | |
| Consumer Non-Cyclical | | | 6.02 | % | |
| Electric | | | 4.36 | % | |
| Energy | | | 4.85 | % | |
| Finance Companies | | | 2.15 | % | |
| Healthcare | | | 0.46 | % | |
| Insurance | | | 0.65 | % | |
| Real Estate | | | 0.34 | % | |
| Services | | | 0.82 | % | |
| Technology | | | 0.44 | % | |
| Transportation | | | 1.07 | % | |
| Non-Agency Asset-Backed Securities | | | 8.19 | % | |
| Non-Agency Collateralized Mortgage Obligations | | | 0.47 | % | |
| Non-Agency Commercial Mortgage-Backed Securities | | | 1.23 | % | |
| Loan Agreements | | | 0.30 | % | |
| Sovereign Bonds | | | 3.17 | % | |
| Supranational Bank | | | 0.12 | % | |
| US Treasury Obligations | | | 16.32 | % | |
| Preferred Stock | | | 0.34 | % | |
| Short-Term Investments | | | 2.91 | % | |
| Total Value of Securities | | | 101.36 | % | |
| Liabilities Net of Receivables and Other Assets | | | (1.36 | %) | |
| Total Net Assets | | | 100.00 | % | |
11
| Schedule of investments | |
| Delaware Limited-Term Diversified Income Fund | December 31, 2020 |
| | | | | Principal amount° | | Value (US $) |
| Agency Asset-Backed Securities — 0.00% | | | | | |
| Fannie Mae REMIC Trust | | | | | |
| | Series 2001-W2 AS5 6.473% 10/25/31 ϕ | | 3 | | $ | 3 |
| Freddie Mac Structured Pass Through Certificates | | | | | |
| | Series T-30 A5 8.61% 12/25/30 ⧫, ● | | 3,391 | | | 3,820 |
| Total Agency Asset-Backed Securities (cost $3,547) | | | | | 3,823 |
| | | | | | | |
| Agency Collateralized Mortgage Obligations — 2.17% | | | | | |
| Fannie Mae Grantor Trust | | | | | |
| | Series 2001-T5 A2 6.977% 6/19/41 ● | | 18,336 | | | 21,567 |
| Fannie Mae REMICs | | | | | |
| | Series 2011-105 FP 0.548% (LIBOR01M + 0.40%, | | | | | |
| | Cap 6.50%, Floor 0.40%) 6/25/41 ● | | 968,158 | | | 971,252 |
| | Series 2017-94 CZ 3.50% 11/25/47 | | 35,745 | | | 38,421 |
| Freddie Mac REMICs | | | | | |
| | Series 3067 FA 0.509% (LIBOR01M + 0.35%, | | | | | |
| | Cap 7.00%, Floor 0.35%) 11/15/35 ● | | 1,371,278 | | | 1,377,074 |
| | Series 3800 AF 0.659% (LIBOR01M + 0.50%, | | | | | |
| | Cap 7.00%, Floor 0.50%) 2/15/41 ● | | 803,801 | | | 811,893 |
| | Series 4650 JG 3.00% 11/15/46 | | 1,997,000 | | | 2,182,116 |
| | Series 4994 AV 2.00% 12/25/45 | | 1,200,000 | | | 1,232,351 |
| Freddie Mac Structured Agency Credit Risk REMIC | | | | | |
| | Trust | | | | | |
| | Series 2020-DNA6 M1 144A 0.977% (SOFR + | | | | | |
| | 0.90%) 12/25/50 #, ● | | 1,700,000 | | | 1,700,267 |
| Freddie Mac Structured Pass Through Certificates | | | | | |
| | Series T-54 2A 6.50% 2/25/43 ⧫ | | 586 | | | 715 |
| | Series T-58 2A 6.50% 9/25/43 ⧫ | | 336,095 | | | 390,705 |
| GNMA | | | | | |
| | Series 2017-88 PB 3.00% 1/20/47 | | 304,000 | | | 333,199 |
| | Series 2017-163 KH 3.50% 3/20/44 | | 455,000 | | | 472,758 |
| Total Agency Collateralized Mortgage Obligations (cost $9,019,677) | | | | | 9,532,318 |
| | | | | | | |
| Agency Commercial Mortgage-Backed Securities — 0.30% | | | | | |
| FREMF Mortgage Trust | | | | | |
| | Series 2011-K15 B 144A 4.965% 8/25/44 #, ● | | 95,000 | | | 96,852 |
| | Series 2014-K717 B 144A 3.63% 11/25/47 #, ● | | 245,000 | | | 248,649 |
| | Series 2014-K717 C 144A 3.63% 11/25/47 #, ● | | 80,000 | | | 80,905 |
12
| | | | | Principal amount° | | Value (US $) |
| Agency Commercial Mortgage-Backed Securities (continued) | | | | | |
| FREMF Mortgage Trust | | | | | |
| | Series 2016-K722 B 144A 3.845% 7/25/49 #, ● | | 430,000 | | $ | 455,665 |
| NCUA Guaranteed Notes Trust | | | | | |
| | Series 2011-C1 2A 0.682% (LIBOR01M + 0.53%, | | | | | |
| | Cap 8.00%, Floor 0.53%) 3/9/21 ● | | 451,589 | | | 449,764 |
| Total Agency Commercial Mortgage-Backed Securities (cost $1,319,908) | | | | | 1,331,835 |
| | | | | | | |
| Agency Mortgage-Backed Securities — 12.82% | | | | | |
| Fannie Mae S.F. 15 yr | | | | | |
| | 2.50% 8/1/35 | | 944,093 | | | 986,693 |
| Fannie Mae S.F. 30 yr | | | | | |
| | 2.50% 7/1/50 | | 2,430,270 | | | 2,571,464 |
| | 2.50% 9/1/50 | | 159,994 | | | 171,190 |
| | 2.50% 10/1/50 | | 2,263,324 | | | 2,393,342 |
| | 2.50% 11/1/50 | | 853,051 | | | 899,891 |
| | 3.00% 5/1/46 | | 864,160 | | | 909,259 |
| | 3.00% 1/1/47 | | 1,268,147 | | | 1,347,650 |
| | 3.00% 11/1/49 | | 194,624 | | | 211,240 |
| | 3.00% 3/1/50 | | 1,137,991 | | | 1,222,099 |
| | 3.00% 7/1/50 | | 3,398,207 | | | 3,567,440 |
| | 3.00% 8/1/50 | | 1,173,089 | | | 1,249,865 |
| | 3.50% 7/1/47 | | 334,105 | | | 359,021 |
| | 3.50% 11/1/48 | | 196,689 | | | 207,756 |
| | 3.50% 3/1/50 | | 86,734 | | | 93,451 |
| | 3.50% 7/1/50 | | 2,560,739 | | | 2,724,168 |
| | 3.50% 9/1/50 | | 832,196 | | | 933,036 |
| | 4.00% 6/1/48 | | 210,519 | | | 231,266 |
| | 4.00% 10/1/48 | | 1,291,094 | | | 1,421,800 |
| | 4.50% 10/1/45 | | 936,244 | | | 1,045,436 |
| | 4.50% 5/1/46 | | 1,157,988 | | | 1,293,888 |
| | 4.50% 9/1/49 | | 1,691,111 | | | 1,872,289 |
| | 5.00% 7/1/47 | | 1,612,073 | | | 1,871,942 |
| | 5.00% 8/1/49 | | 4,007,054 | | | 4,555,622 |
| | 5.50% 4/1/33 | | 42,046 | | | 48,892 |
| | 5.50% 6/1/33 | | 39,891 | | | 46,413 |
| | 5.50% 10/1/33 | | 20,109 | | | 22,460 |
| | 5.50% 12/1/33 | | 172,357 | | | 201,019 |
| | 5.50% 2/1/34 | | 80,114 | | | 93,926 |
| | 5.50% 9/1/34 | | 111,104 | | | 129,254 |
| | 5.50% 8/1/37 | | 222,920 | | | 260,448 |
| | 5.50% 1/1/38 | | 224,472 | | | 261,568 |
| | 5.50% 7/1/41 | | 37,075 | | | 43,584 |
13
Schedule of investments
Delaware Limited-Term Diversified Income Fund
| | Principal amount° | | Value (US $) |
| Agency Mortgage-Backed Securities (continued) | | | | | |
| Fannie Mae S.F. 30 yr | | | | | |
| 5.50% 5/1/44 | | 4,007,752 | | $ | 4,701,112 |
| 6.00% 6/1/41 | | 381,977 | | | 458,765 |
| 6.00% 7/1/41 | | 4,392,160 | | | 5,299,949 |
| 6.00% 1/1/42 | | 239,265 | | | 285,407 |
| Fannie Mae S.F. 30 yr TBA | | | | | |
| 2.00% 1/1/50 | | 3,317,000 | | | 3,445,141 |
| 2.50% 1/1/50 | | 1,928,000 | | | 2,032,079 |
| Freddie Mac ARM | | | | | |
| 2.68% (LIBOR12M + 1.93%, Cap 9.697%, Floor | | | | | |
| 1.93%) 8/1/38 ● | | 3,468 | | | 3,481 |
| Freddie Mac S.F. 30 yr | | | | | |
| 2.00% 11/1/50 | | 860,366 | | | 897,921 |
| 3.00% 7/1/50 | | 1,820,568 | | | 1,909,315 |
| 4.50% 8/1/48 | | 1,227,779 | | | 1,346,908 |
| 4.50% 1/1/49 | | 129,850 | | | 144,323 |
| 4.50% 4/1/49 | | 278,882 | | | 306,423 |
| 4.50% 5/1/49 | | 748,149 | | | 820,563 |
| 5.50% 1/1/34 | | 27,915 | | | 32,782 |
| 5.50% 6/1/34 | | 240,602 | | | 283,003 |
| 5.50% 6/1/35 | | 60,636 | | | 70,819 |
| 5.50% 7/1/37 | | 90,604 | | | 106,521 |
| 5.50% 8/1/37 | | 76,392 | | | 89,832 |
| 5.50% 10/1/37 | | 80,410 | | | 94,557 |
| 5.50% 7/1/38 | | 174,436 | | | 206,484 |
| 5.50% 11/1/38 | | 171,153 | | | 201,241 |
| 5.50% 4/1/40 | | 38,711 | | | 44,200 |
| 5.50% 6/1/41 | | 193,672 | | | 227,725 |
| 6.00% 5/1/39 | | 25,192 | | | 29,899 |
| Total Agency Mortgage-Backed Securities (cost $55,430,884) | | | | | 56,285,822 |
| | | | | | |
| Collateralized Debt Obligations — 6.99% | | | | | |
| AMMC CLO 23 | | | | | |
| Series 2020-23A A1L 144A 1.635% (LIBOR03M + | | | | | |
| 1.40%, Floor 1.40%) 10/17/31 #, ● | | 1,200,000 | | | 1,198,486 |
| Ballyrock CLO | | | | | |
| Series 2018-1A A1 144A 1.218% (LIBOR03M + | | | | | |
| 1.00%) 4/20/31 #, ● | | 2,000,000 | | | 1,979,054 |
| Series 2020-2A A1 144A 1.529% (LIBOR03M + | | | | | |
| 1.32%, Floor 1.32%) 10/20/31 #, ● | | 1,500,000 | | | 1,498,105 |
14
| | Principal amount° | | Value (US $) |
| Collateralized Debt Obligations (continued) | | | | | |
| Battalion CLO 18 | | | | | |
| Series 2020-18A A1 144A 2.035% (LIBOR03M + | | | | | |
| 1.80%, Floor 1.80%) 10/15/32 #, ● | | 2,000,000 | | $ | 2,006,392 |
| Benefit Street Partners CLO IX | | | | | |
| Series 2016-9A AR 144A 1.328% (LIBOR03M + | | | | | |
| 1.11%) 7/20/31 #, ● | | 500,000 | | | 498,621 |
| BlueMountain CLO XXX | | | | | |
| Series 2020-30A A 144A 1.549% (LIBOR03M + | | | | | |
| 1.39%, Floor 1.39%) 1/15/33 #, ● | | 1,250,000 | | | 1,248,433 |
| Carlyle Global Market Strategies CLO | | | | | |
| Series 2014-2RA A1 144A 1.271% (LIBOR03M + | | | | | |
| 1.05%) 5/15/31 #, ● | | 985,635 | | | 977,052 |
| Series 2015-5A A1R 144A 1.538% (LIBOR03M + | | | | | |
| 1.32%, Floor 1.32%) 1/20/32 #, ● | | 1,000,000 | | | 998,801 |
| CBAM | | | | | |
| Series 2020-13A A 144A 1.585% (LIBOR03M + | | | | | |
| 1.43%, Floor 1.43%) 1/20/34 #, ● | | 2,200,000 | | | 2,197,241 |
| Cedar Funding IX CLO | | | | | |
| Series 2018-9A A1 144A 1.198% (LIBOR03M + | | | | | |
| 0.98%, Floor 0.98%) 4/20/31 #, ● | | 575,000 | | | 572,866 |
| CIFC Funding | | | | | |
| Series 2013-4A A1RR 144A 1.277% (LIBOR03M + | | | | | |
| 1.06%, Floor 1.06%) 4/27/31 #, ● | | 2,000,000 | | | 1,988,756 |
| Dryden 83 CLO | | | | | |
| Series 2020-83A A 144A 0.000% (LIBOR03M + | | | | | |
| 1.22%, Floor 1.22%) 1/18/32 #, ●, ^ | | 2,200,000 | | | 2,200,000 |
| Galaxy XXI CLO | | | | | |
| Series 2015-21A AR 144A 1.238% (LIBOR03M + | | | | | |
| 1.02%) 4/20/31 #, ● | | 1,000,000 | | | 990,306 |
| KKR CLO 32 | | | | | |
| Series 32A A1 144A 1.545% (LIBOR03M + | | | | | |
| 1.32%, Floor 1.32%) 1/15/32 #, ● | | 1,200,000 | | | 1,198,496 |
| LCM XVIII | | | | | |
| Series 18A A1R 144A 1.238% (LIBOR03M + | | | | | |
| 1.02%) 4/20/31 #, ● | | 1,500,000 | | | 1,491,309 |
| Octagon Investment Partners 33 | | | | | |
| Series 2017-1A A1 144A 1.408% (LIBOR03M + | | | | | |
| 1.19%) 1/20/31 #, ● | | 2,350,000 | | | 2,346,228 |
| Octagon Investment Partners 48 | | | | | |
| Series 2020-3A A 144A 1.732% (LIBOR03M + | | | | | |
| 1.50%, Floor 1.50%) 10/20/31 #, ● | | 2,000,000 | | | 2,003,022 |
| Sound Point CLO XXI | | | | | |
| Series 2018-3A A1A 144A 1.395% (LIBOR03M + | | | | | |
| 1.18%, Floor 1.18%) 10/26/31 #, ● | | 2,300,000 | | | 2,292,352 |
15
Schedule of investments
Delaware Limited-Term Diversified Income Fund
| | Principal amount° | | Value (US $) |
| Collateralized Debt Obligations (continued) | | | | | |
| York CLO-6 | | | | | |
| Series 2019-1A A1 144A 1.566% (LIBOR03M + | | | | | |
| 1.35%) 7/22/32 #, ● | | 1,000,000 | | $ | 999,404 |
| Zais CLO 16 | | | | | |
| Series 2020-16A A1 144A 2.48% (LIBOR03M + | | | | | |
| 2.19%, Floor 2.19%) 10/20/31 #, ● | | 2,000,000 | | | 1,998,192 |
| Total Collateralized Debt Obligations (cost $30,611,451) | | | | | 30,683,116 |
| | | | | | |
| Convertible Bond — 0.01% | | | | | |
| Cheniere Energy PIK 144A 4.875% exercise price | | | | | |
| $93.64, maturity date 5/28/21 #, > | | 38,826 | | | 39,068 |
| Total Convertible Bond (cost $39,149) | | | | | 39,068 |
| | | | | | |
| Corporate Bonds — 46.02% | | | | | |
| Banking — 10.70% | | | | | |
| Banco Continental 144A 2.75% 12/10/25 # | | 200,000 | | | 199,500 |
| Banco de Credito del Peru 144A 2.70% 1/11/25 # | | 200,000 | | | 209,052 |
| Banco de Credito e Inversiones 144A 4.00% | | | | | |
| 2/11/23 # | | 200,000 | | | 212,330 |
| Banco del Estado de Chile 144A 2.704% 1/9/25 # | | 220,000 | | | 232,790 |
| Banco Santander 3.50% 4/11/22 | | 1,600,000 | | | 1,661,691 |
| Banco Santander Mexico 144A 4.125% 11/9/22 # | | 150,000 | | | 158,438 |
| Bancolombia 3.00% 1/29/25 | | 215,000 | | | 223,804 |
| Bank of America | | | | | |
| 2.738% 1/23/22 µ | | 1,370,000 | | | 1,371,678 |
| 3.458% 3/15/25 µ | | 2,845,000 | | | 3,098,574 |
| Bank of Georgia 144A 6.00% 7/26/23 # | | 200,000 | | | 212,500 |
| Bank of Montreal 1.85% 5/1/25 | | 345,000 | | | 362,344 |
| Barclays Bank 1.70% 5/12/22 | | 2,420,000 | | | 2,463,200 |
| BBVA Bancomer | | | | | |
| 144A 1.875% 9/18/25 # | | 1,135,000 | | | 1,147,769 |
| 144A 6.75% 9/30/22 # | | 150,000 | | | 162,300 |
| Citigroup 4.044% 6/1/24 µ | | 2,430,000 | | | 2,643,242 |
| Citizens Financial Group 2.85% 7/27/26 | | 1,545,000 | | | 1,721,196 |
| Credit Agricole 144A 1.907% 6/16/26 #, µ | | 370,000 | | | 384,097 |
| Credit Suisse Group 144A 2.593% 9/11/25 #, µ | | 2,295,000 | | | 2,415,833 |
| Development Bank of Mongolia 144A 7.25% | | | | | |
| 10/23/23 # | | 200,000 | | | 214,718 |
| Emirates NBD Bank 2.625% 2/18/25 | | 200,000 | | | 211,100 |
| Goldman Sachs Group 3.50% 4/1/25 | | 180,000 | | | 200,320 |
| ICICI Bank 3.25% 9/9/22 | | 320,000 | | | 328,917 |
16
| | Principal amount° | | Value (US $) |
| Corporate Bonds (continued) | | | | | |
| Banking (continued) | | | | | |
| JPMorgan Chase & Co. | | | | | |
| 4.023% 12/5/24 µ | | 4,240,000 | | $ | 4,672,508 |
| 4.60% µ, ψ | | 135,000 | | | 139,556 |
| KEB Hana Bank 144A 3.375% 1/30/22 # | | 500,000 | | | 515,219 |
| KeyBank | | | | | |
| 2.40% 6/9/22 | | 250,000 | | | 257,370 |
| 3.18% 5/22/22 | | 1,335,000 | | | 1,384,611 |
| Kookmin Bank 144A 2.875% 3/25/23 # | | 200,000 | | | 210,281 |
| Morgan Stanley | | | | | |
| 2.188% 4/28/26 µ | | 415,000 | | | 438,615 |
| 2.75% 5/19/22 | | 1,075,000 | | | 1,110,373 |
| 3.622% 4/1/31 µ | | 305,000 | | | 354,466 |
| National Securities Clearing 144A 1.20% 4/23/23 # | | 520,000 | | | 530,526 |
| Natwest Group 8.625% µ, ψ | | 1,285,000 | | | 1,336,567 |
| PNC Bank 2.70% 11/1/22 | | 3,280,000 | | | 3,418,166 |
| Popular 6.125% 9/14/23 | | 523,000 | | | 566,746 |
| QNB Finance 3.50% 3/28/24 | | 330,000 | | | 354,703 |
| Regions Financial 3.80% 8/14/23 | | 1,070,000 | | | 1,161,230 |
| Truist Bank 2.636% 9/17/29 µ | | 1,465,000 | | | 1,550,479 |
| Truist Financial 2.70% 1/27/22 | | 2,785,000 | | | 2,851,497 |
| UBS 144A 1.75% 4/21/22 # | | 200,000 | | | 203,590 |
| UBS Group | | | | | |
| 144A 1.364% 1/30/27 #, µ | | 205,000 | | | 207,398 |
| 144A 3.00% 4/15/21 # | | 2,700,000 | | | 2,720,917 |
| US Bank 3.40% 7/24/23 | | 1,380,000 | | | 1,483,151 |
| USB Capital IX 3.50% (LIBOR03M + 1.02%) ψ, ● | | 1,710,000 | | | 1,684,350 |
| | | | | | 46,987,712 |
| Banks — 0.37% | | | | | |
| Morgan Stanley 1.433% LIBOR03M + 1.22% | | | | | |
| 5/8/24 ● | | 1,605,000 | | | 1,636,508 |
| | | | | | 1,636,508 |
| Basic Industry — 4.00% | | | | | |
| Avient 144A 5.75% 5/15/25 # | | 822,000 | | | 874,402 |
| BMC East 144A 5.50% 10/1/24 # | | 500,000 | | | 513,750 |
| DuPont de Nemours 2.169% 5/1/23 | | 1,495,000 | | | 1,515,231 |
| Equate Petrochemical 144A 3.00% 3/3/22 # | | 265,000 | | | 270,804 |
| First Quantum Minerals 144A 7.50% 4/1/25 # | | 1,085,000 | | | 1,131,112 |
| Georgia-Pacific 144A 1.75% 9/30/25 # | | 285,000 | | | 298,104 |
| Gold Fields Orogen Holdings BVI 144A 5.125% | | | | | |
| 5/15/24 # | | 250,000 | | | 277,214 |
| Hudbay Minerals 144A 7.625% 1/15/25 # | | 861,000 | | | 895,978 |
17
Schedule of investments
Delaware Limited-Term Diversified Income Fund
| | Principal amount° | | Value (US $) |
| Corporate Bonds (continued) | | | | | |
| Basic Industry (continued) | | | | | |
| Inversiones CMPC 144A 4.75% 9/15/24 # | | 2,200,000 | | $ | 2,439,943 |
| Kraton Polymers 144A 7.00% 4/15/25 # | | 1,500,000 | | | 1,580,250 |
| LYB International Finance III 2.875% 5/1/25 | | 225,000 | | | 245,424 |
| New Gold 144A 6.375% 5/15/25 # | | 166,000 | | | 173,781 |
| Novolipetsk Steel Via Steel Funding DAC 144A | | | | | |
| 4.50% 6/15/23 # | | 250,000 | | | 268,219 |
| Nutrien 1.90% 5/13/23 | | 1,995,000 | | | 2,061,791 |
| OCP 144A 4.50% 10/22/25 # | | 1,000,000 | | | 1,091,749 |
| PowerTeam Services 144A 9.033% 12/4/25 # | | 605,000 | | | 674,642 |
| Sociedad Quimica y Minera de Chile 144A 3.625% | | | | | |
| 4/3/23 # | | 200,000 | | | 210,531 |
| Steel Dynamics 2.80% 12/15/24 | | 1,455,000 | | | 1,565,706 |
| Syngenta Finance | | | | | |
| 144A 3.933% 4/23/21 # | | 620,000 | | | 624,197 |
| 144A 4.441% 4/24/23 # | | 200,000 | | | 210,008 |
| WESCO Distribution 144A 7.125% 6/15/25 # | | 605,000 | | | 666,199 |
| | | | | | 17,589,035 |
| Capital Goods — 2.91% | | | | | |
| Bombardier 144A 6.00% 10/15/22 # | | 500,000 | | | 492,075 |
| General Dynamics 3.00% 5/11/21 | | 2,920,000 | | | 2,948,221 |
| General Electric 3.45% 5/1/27 | | 245,000 | | | 276,695 |
| Mauser Packaging Solutions Holding 144A 5.50% | | | | | |
| 4/15/24 # | | 1,802,000 | | | 1,840,184 |
| Otis Worldwide 2.056% 4/5/25 | | 1,245,000 | | | 1,320,572 |
| Roper Technologies 2.35% 9/15/24 | | 2,295,000 | | | 2,444,475 |
| Spirit AeroSystems 144A 5.50% 1/15/25 # | | 890,000 | | | 939,974 |
| Terex 144A 5.625% 2/1/25 # | | 890,000 | | | 918,480 |
| TransDigm 144A 8.00% 12/15/25 # | | 820,000 | | | 908,224 |
| Turkiye Sise ve Cam Fabrikalari 144A 6.95% | | | | | |
| 3/14/26 # | | 200,000 | | | 223,000 |
| Welbilt 9.50% 2/15/24 | | 433,000 | | | 448,335 |
| | | | | | 12,760,235 |
| Communications — 3.51% | | | | | |
| AMC Networks 5.00% 4/1/24 | | 1,096,000 | | | 1,115,180 |
| Charter Communications Operating 4.908% | | | | | |
| 7/23/25 | | 1,515,000 | | | 1,761,245 |
| Clear Channel International 144A 6.625% 8/1/25 # | | 475,000 | | | 502,906 |
| Clear Channel Worldwide Holdings 9.25% 2/15/24 | | 525,000 | | | 532,930 |
| Crown Castle International 5.25% 1/15/23 | | 3,110,000 | | | 3,403,937 |
| CSC Holdings 6.75% 11/15/21 | | 375,000 | | | 392,578 |
18
| | | | Principal amount° | | Value (US $) |
| Corporate Bonds (continued) | | | | | |
| Communications (continued) | | | | | |
| | Fox | | | | | |
| 3.666% 1/25/22 | | 880,000 | | $ | 911,010 |
| 4.03% 1/25/24 | | 2,280,000 | | | 2,512,143 |
| IHS Netherlands Holdco 144A 7.125% 3/18/25 # | | 200,000 | | | 210,500 |
| Ooredoo International Finance 144A 5.00% | | | | | |
| 10/19/25 # | | 200,000 | | | 233,689 |
| Sirius XM Radio 144A 4.625% 7/15/24 # | | 250,000 | | | 259,375 |
| Sprint Spectrum 144A 4.738% 3/20/25 # | | 450,000 | | | 488,797 |
| Tencent Holdings 144A 3.28% 4/11/24 # | | 200,000 | | | 213,232 |
| Time Warner Entertainment 8.375% 3/15/23 | | 1,795,000 | | | 2,099,310 |
| T-Mobile USA | | | | | |
| 144A 1.50% 2/15/26 # | | 250,000 | | | 256,436 |
| 144A 3.50% 4/15/25 # | | 290,000 | | | 320,734 |
| Turk Telekomunikasyon 144A 4.875% 6/19/24 # | | 200,000 | | | 207,396 |
| | | | | | 15,421,398 |
| Consumer Cyclical – 3.37% | | | | | |
| Boyd Gaming 144A 8.625% 6/1/25 # | | 791,000 | | | 880,731 |
| Caesars Entertainment 144A 6.25% 7/1/25 # | | 675,000 | | | 719,722 |
| Carnival 144A 7.625% 3/1/26 # | | 685,000 | | | 747,585 |
| Ford Motor 8.50% 4/21/23 | | 1,256,000 | | | 1,418,244 |
| Ford Motor Credit 3.375% 11/13/25 | | 1,200,000 | | | 1,230,372 |
| General Motors Financial | | | | | |
| 3.45% 4/10/22 | | 1,195,000 | | | 1,229,022 |
| 4.15% 6/19/23 | | 1,390,000 | | | 1,495,812 |
| IRB Holding 144A 7.00% 6/15/25 # | | 129,000 | | | 141,161 |
| JD.com 3.875% 4/29/26 | | 1,500,000 | | | 1,679,454 |
| L Brands 144A 6.875% 7/1/25 # | | 810,000 | | | 880,705 |
| Meituan 144A 2.125% 10/28/25 # | | 250,000 | | | 254,227 |
| MGM Resorts International 5.75% 6/15/25 | | 1,100,000 | | | 1,218,277 |
| Sands China 144A 3.80% 1/8/26 # | | 200,000 | | | 214,092 |
| Scientific Games International 144A 5.00% | | | | | |
| 10/15/25 # | | 1,085,000 | | | 1,120,957 |
| Six Flags Entertainment 144A 4.875% 7/31/24 # | | 665,000 | | | 668,006 |
| Station Casinos 144A 5.00% 10/1/25 # | | 541,000 | | | 548,263 |
| VF 2.40% 4/23/25 | | 330,000 | | | 352,156 |
| | | | | | 14,798,786 |
| Consumer Non-Cyclical – 6.02% | | | | | |
| AbbVie | | | | | |
| 2.60% 11/21/24 | | 2,915,000 | | | 3,126,527 |
| 2.95% 11/21/26 | | 10,000 | | | 11,071 |
| Anheuser-Busch InBev Worldwide 4.15% 1/23/25 | | 2,965,000 | | | 3,377,301 |
19
Schedule of investments
Delaware Limited-Term Diversified Income Fund
| | | | Principal amount° | | Value (US $) |
| Corporate Bonds (continued) | | | | | |
| Consumer Non-Cyclical (continued) | | | | | |
| | Cigna | | | | | |
| 1.127% LIBOR03M + 0.89% 7/15/23 ● | | 2,055,000 | | $ | 2,079,280 |
| 3.75% 7/15/23 | | 935,000 | | | 1,010,976 |
| CK Hutchison International 17 144A 2.875% | | | | | |
| 4/5/22 # | | 200,000 | | | 205,205 |
| CVS Health | | | | | |
| 3.70% 3/9/23 | | 387,000 | | | 414,399 |
| 4.30% 3/25/28 | | 116,000 | | | 138,159 |
| Diageo Capital 1.375% 9/29/25 | | 435,000 | | | 447,789 |
| DP World Crescent 144A 3.908% 5/31/23 # | | 200,000 | | | 211,630 |
| General Mills 3.70% 10/17/23 | | 2,075,000 | | | 2,261,747 |
| Global Payments 2.65% 2/15/25 | | 1,412,000 | | | 1,512,679 |
| Mondelez International | | | | | |
| 1.50% 5/4/25 | | 1,210,000 | | | 1,252,482 |
| 2.125% 4/13/23 | | 1,320,000 | | | 1,371,673 |
| PayPal Holdings 1.35% 6/1/23 | | 3,025,000 | | | 3,098,983 |
| Pilgrim’s Pride 144A 5.75% 3/15/25 # | | 870,000 | | | 894,230 |
| Primo Water Holdings 144A 5.50% 4/1/25 # | | 847,000 | | | 875,586 |
| Royalty Pharma | | | | | |
| 144A 1.20% 9/2/25 # | | 345,000 | | | 350,590 |
| 144A 1.75% 9/2/27 # | | 230,000 | | | 236,852 |
| Tenet Healthcare 5.125% 5/1/25 | | 1,160,000 | | | 1,184,058 |
| Teva Pharmaceutical Finance Netherlands III 6.00% | | | | | |
| 4/15/24 | | 250,000 | | | 265,581 |
| Viatris | | | | | |
| 144A 1.65% 6/22/25 # | | 1,960,000 | | | 2,027,589 |
| 144A 2.30% 6/22/27 # | | 80,000 | | | 85,260 |
| | | | | | 26,439,647 |
| Electric – 4.36% | | | | | |
| AEP Texas 2.40% 10/1/22 | | 2,810,000 | | | 2,900,085 |
| Avangrid 3.20% 4/15/25 | | 505,000 | | | 553,285 |
| Azure Power Energy 144A 5.50% 11/3/22 # | | 215,000 | | | 220,912 |
| Centrais Eletricas Brasileiras 144A 3.625% 2/4/25 # | | 200,000 | | | 207,752 |
| Cleveland Electric Illuminating 5.50% 8/15/24 | | 1,430,000 | | | 1,648,247 |
| CLP Power Hong Kong Financing 2.875% 4/26/23 | | 200,000 | | | 209,090 |
| Duke Energy | | | | | |
| 1.80% 9/1/21 | | 2,250,000 | | | 2,269,741 |
| 4.875% µ, ψ | | 570,000 | | | 618,638 |
| Engie Energia Chile 144A 4.50% 1/29/25 # | | 2,200,000 | | | 2,443,816 |
| Entergy 4.00% 7/15/22 | | 1,050,000 | | | 1,101,250 |
| Entergy Louisiana 4.05% 9/1/23 | | 1,125,000 | | | 1,222,993 |
20
| | | | Principal amount° | | Value (US $) |
| Corporate Bonds (continued) | | | | | |
| Electric (continued) | | | | | |
| ITC Holdings 2.70% 11/15/22 | | 1,570,000 | | $ | 1,634,700 |
| NRG Energy 144A 3.75% 6/15/24 # | | 1,200,000 | | | 1,314,303 |
| Pacific Gas and Electric 2.10% 8/1/27 | | 980,000 | | | 995,943 |
| Vistra Operations 144A 3.55% 7/15/24 # | | 1,650,000 | | | 1,787,640 |
| | | | | | 19,128,395 |
| Energy – 4.85% | | | | | |
| Apache 4.625% 11/15/25 | | 785,000 | | | 825,231 |
| Cheniere Corpus Christi Holdings 7.00% 6/30/24 | | 1,955,000 | | | 2,284,267 |
| Continental Resources 3.80% 6/1/24 | | 625,000 | | | 644,922 |
| Energy Transfer Operating 5.25% 4/15/29 | | 1,235,000 | | | 1,442,256 |
| Greenko Mauritius 144A 6.25% 2/21/23 # | | 210,000 | | | 217,153 |
| Marathon Oil 2.80% 11/1/22 | | 765,000 | | | 786,538 |
| MPLX | | | | | |
| 1.75% 3/1/26 | | 210,000 | | | 217,438 |
| 4.875% 12/1/24 | | 1,955,000 | | | 2,243,927 |
| Murphy Oil 5.75% 8/15/25 | | 905,000 | | | 902,833 |
| NiSource 0.95% 8/15/25 | | 1,850,000 | | | 1,862,012 |
| NuStar Logistics 5.75% 10/1/25 | | 715,000 | | | 762,548 |
| Occidental Petroleum 5.50% 12/1/25 | | 905,000 | | | 945,259 |
| ONEOK 7.50% 9/1/23 | | 1,655,000 | | | 1,916,288 |
| Petroleos Mexicanos 4.625% 9/21/23 | | 130,000 | | | 135,281 |
| Sabine Pass Liquefaction 5.75% 5/15/24 | | 1,990,000 | | | 2,275,822 |
| Saudi Arabian Oil 144A 1.625% 11/24/25 # | | 205,000 | | | 210,168 |
| Southwestern Energy 6.45% 1/23/25 | | 983,000 | | | 1,021,706 |
| Tengizchevroil Finance Co International 144A | | | | | |
| 2.625% 8/15/25 # | | 1,200,000 | | | 1,250,755 |
| Tullow Oil 144A 6.25% 4/15/22 # | | 250,000 | | | 200,000 |
| Western Midstream Operating 4.10% 2/1/25 | | 465,000 | | | 479,954 |
| WPX Energy 5.25% 9/15/24 | | 621,000 | | | 677,989 |
| | | | | | 21,302,347 |
| Finance Companies – 2.15% | | | | | |
| AerCap Ireland Capital 3.15% 2/15/24 | | 1,780,000 | | | 1,866,699 |
| Air Lease 2.875% 1/15/26 | | 780,000 | | | 825,923 |
| Ally Financial 5.75% 11/20/25 | | 771,000 | | | 898,211 |
| Avolon Holdings Funding 144A 3.95% 7/1/24 # | | 555,000 | | | 586,555 |
| China Overseas Finance Cayman V 3.95% | | | | | |
| 11/15/22 | | 205,000 | | | 214,118 |
| DAE Funding 144A 5.75% 11/15/23 # | | 750,000 | | | 771,562 |
| DAE Sukuk DIFC 144A 3.75% 2/15/26 # | | 200,000 | | | 206,000 |
| GE Capital Funding 144A 3.45% 5/15/25 # | | 485,000 | | | 535,624 |
21
Schedule of investments
Delaware Limited-Term Diversified Income Fund
| | | | Principal amount° | | | Value (US $) |
| Corporate Bonds (continued) | | | | | |
| Finance Companies (continued) | | | | | |
| SURA Asset Management 144A 4.875% 4/17/24 # | | 500,000 | | $ | 548,880 |
| USAA Capital 144A 1.50% 5/1/23 # | | 2,900,000 | | | 2,975,524 |
| | | | | | 9,429,096 |
| Healthcare – 0.46% | | | | | |
| Bausch Health 144A 6.125% 4/15/25 # | | 1,025,000 | | | 1,057,451 |
| Ortho-Clinical Diagnostics 144A 7.375% 6/1/25 # | | 900,000 | | | 960,188 |
| | | | | | 2,017,639 |
| Insurance – 0.65% | | | | | |
| AIA Group 3.125% 3/13/23 | | 210,000 | | | 220,370 |
| Equitable Holdings 3.90% 4/20/23 | | 1,620,000 | | | 1,743,392 |
| USI 144A 6.875% 5/1/25 # | | 850,000 | | | 873,897 |
| | | | | | 2,837,659 |
| Real Estate – 0.34% | | | | | |
| Arabian Centres Sukuk 144A 5.375% 11/26/24 # | | 200,000 | | | 203,580 |
| Goodman HK Finance 4.375% 6/19/24 | | 200,000 | | | 217,544 |
| HAT Holdings I 144A 6.00% 4/15/25 # | | 821,000 | | | 879,496 |
| Kaisa Group Holdings 9.375% 6/30/24 | | 200,000 | | | 194,375 |
| | | | | | 1,494,995 |
| Services – 0.82% | | | | | |
| GFL Environmental 144A 3.75% 8/1/25 # | | 375,000 | | | 383,203 |
| Prime Security Services Borrower 144A 5.25% | | | | | |
| 4/15/24 # | | 649,000 | | | 693,619 |
| Sabre GLBL | | | | | |
| 144A 7.375% 9/1/25 # | | 1,250,000 | | | 1,358,125 |
| 144A 9.25% 4/15/25 # | | 785,000 | | | 935,131 |
| Shimao Group Holdings 6.125% 2/21/24 | | 200,000 | | | 212,401 |
| | | | | | 3,582,479 |
| Technology – 0.44% | | | | | |
| Baidu 1.72% 4/9/26 | | 200,000 | | | 203,177 |
| Broadcom | | | | | |
| 3.15% 11/15/25 | | 260,000 | | | 284,007 |
| 4.70% 4/15/25 | | 165,000 | | | 189,122 |
| International Business Machines 3.00% 5/15/24 | | 1,090,000 | | | 1,181,163 |
| NXP 144A 2.70% 5/1/25 # | | 55,000 | | | 59,233 |
| | | | | | 1,916,702 |
| Transportation – 1.07% | | | | | |
| Adani Ports & Special Economic Zone 144A 3.375% | | | | | |
| 7/24/24 # | | 235,000 | | | 244,772 |
22
| | | | | Principal amount° | | Value (US $) |
| Corporate Bonds (continued) | | | | | |
| Transportation (continued) | | | | | |
| Aerovias de Mexico 144A 7.00% 2/5/25 #, ‡ | | 200,000 | | $ | 80,500 |
| ASG Finance Designated Activity 144A 7.875% | | | | | |
| | 12/3/24 # | | 217,000 | | | 187,705 |
| Delta Air Lines | | | | | |
| | 144A 7.00% 5/1/25 # | | 1,510,000 | | | 1,744,377 |
| | 7.375% 1/15/26 | | 621,000 | | | 709,822 |
| Penske Truck Leasing 144A 1.20% 11/15/25 # | | 910,000 | | | 918,431 |
| Spirit Loyalty Cayman 144A 8.00% 9/20/25 # | | 740,000 | | | 832,500 |
| | | | | | | 4,718,107 |
| Total Corporate Bonds (cost $195,277,265) | | | | | 202,060,740 |
| | | | | | | |
| Non-Agency Asset-Backed Securities – 8.19% | | | | | |
| American Express Credit Account Master Trust | | | | | |
| | Series 2017-2 A 0.609% (LIBOR01M + 0.45%) | | | | | |
| | 9/16/24 ● | | 270,000 | | | 271,174 |
| | Series 2017-5 A 0.539% (LIBOR01M + 0.38%) | | | | | |
| | 2/18/25 ● | | 575,000 | | | 577,602 |
| | Series 2018-6 A 3.06% 2/15/24 | | 1,145,000 | | | 1,162,509 |
| ARI Fleet Lease Trust | | | | | |
| | Series 2018-B A2 144A 3.22% 8/16/27 # | | 356,097 | | | 358,918 |
| BA Credit Card Trust | | | | | |
| | Series 2020-A1 A1 0.34% 5/15/26 | | 2,000,000 | | | 2,002,425 |
| BMW Floorplan Master Owner Trust | | | | | |
| | Series 2018-1 A2 144A 0.479% (LIBOR01M + | | | | | |
| | 0.32%) 5/15/23 #, ● | | 1,500,000 | | | 1,501,175 |
| Chase Auto Credit Linked Notes | | | | | |
| | Series 2020-2 B 144A 0.84% 2/25/28 # | | 1,750,000 | | | 1,751,684 |
| Dell Equipment Finance Trust | | | | | |
| | Series 2020-2 A2 144A 0.47% 10/24/22 # | | 2,400,000 | | | 2,404,260 |
| Ford Credit Auto Lease Trust | | | | | |
| | Series 2020-A A2 1.80% 7/15/22 | | 1,112,474 | | | 1,117,586 |
| Ford Credit Auto Owner Trust | | | | | |
| | Series 2017-2 A 144A 2.36% 3/15/29 # | | 2,100,000 | | | 2,171,998 |
| | Series 2017-C A3 2.01% 3/15/22 | | 9,098 | | | 9,108 |
| Ford Credit Floorplan Master Owner Trust A | | | | | |
| | Series 2020-1 A1 | | | | | |
| | 0.70% 9/15/25 | | 4,000,000 | | | 4,028,298 |
| GM Financial Automobile Leasing Trust | | | | | |
| | Series 2020-3 A2A 0.35% 11/21/22 | | 1,000,000 | | | 1,000,760 |
| GMF Floorplan Owner Revolving Trust | | | | | |
| | Series 2020-1 A 144A 0.68% 8/15/25 # | | 500,000 | | | 502,957 |
23
Schedule of investments
Delaware Limited-Term Diversified Income Fund
| | | | Principal amount° | | Value (US $) |
| Non-Agency Asset-Backed Securities (continued) | | | | | |
| Harley-Davidson Motorcycle Trust | | | | | |
| Series 2020-A A2A 1.83% 1/17/23 | | 431,196 | | $ | 433,005 |
| HOA Funding | | | | | |
| Series 2014-1A A2 144A 4.846% 8/20/44 # | | 231,875 | | | 218,046 |
| Hyundai Auto Receivables Trust | | | | | |
| Series 2019-B A2 1.93% 7/15/22 | | 305,027 | | | 306,096 |
| Series 2020-C A2 0.26% 9/15/23 | | 1,500,000 | | | 1,500,468 |
| Invitation Homes Trust | | | | | |
| Series 2018-SFR1 A 144A 0.853% (LIBOR01M + | | | | | |
| 0.70%) 3/17/37 #, ● | | 810,155 | | | 803,413 |
| Mercedes-Benz Auto Lease Trust | | | | | |
| Series 2019-B A2 2.01% 12/15/21 | | 117,383 | | | 117,619 |
| Mercedes-Benz Master Owner Trust | | | | | |
| Series 2019-BA A 144A 2.61% 5/15/24 # | | 1,200,000 | | | 1,239,728 |
| MMAF Equipment Finance | | | | | |
| Series 2015-AA A5 144A 2.49% 2/19/36 # | | 714,153 | | | 722,095 |
| Series 2020-BA A2 144A 0.38% 8/14/23 # | | 4,300,000 | | | 4,302,537 |
| Nissan Master Owner Trust Receivables | | | | | |
| Series 2019-B A 0.589% (LIBOR01M + 0.43%) | | | | | |
| 11/15/23 ● | | 150,000 | | | 150,372 |
| PFS Financing | | | | | |
| Series 2020-G A 144A 0.97% 2/15/26 # | | 1,000,000 | | | 1,005,244 |
| Tesla Auto Lease Trust | | | | | |
| Series 2018-B A 144A 3.71% 8/20/21 # | | 642,093 | | | 646,160 |
| Series 2019-A A2 144A 2.13% 4/20/22 # | | 1,754,039 | | | 1,770,179 |
| Towd Point Mortgage Trust | | | | | |
| Series 2015-5 A1B 144A 2.75% 5/25/55 #, ● | | 91,806 | | | 92,475 |
| Series 2015-6 A1B 144A 2.75% 4/25/55 #, ● | | 160,525 | | | 162,990 |
| Trafigura Securitisation Finance | | | | | |
| Series 2018-1A A1 144A 0.889% (LIBOR01M + | | | | | |
| 0.73%) 3/15/22 #, ● | | 200,000 | | | 199,902 |
| Verizon Owner Trust | | | | | |
| Series 2020-C A 0.41% 4/21/25 | | 1,000,000 | | | 1,001,851 |
| Volkswagen Auto Lease Trust | | | | | |
| Series 2020-A A4 0.45% 7/21/25 | | 150,000 | | | 150,232 |
| Volvo Financial Equipment | | | | | |
| Series 2020-1A A2 | | | | | |
| 144A 0.37% 4/17/23 # | | 2,200,000 | | | 2,201,453 |
| Wheels SPV 2 | | | | | |
| Series 2018-1A A2 144A 3.06% 4/20/27 # | | 79,713 | | | 79,998 |
| Total Non-Agency Asset-Backed Securities (cost $35,887,182) | | | | | 35,964,317 |
24
| | | | Principal amount° | | Value (US $) |
| Non-Agency Collateralized Mortgage Obligations – 0.47% | | | | | |
| GSMPS Mortgage Loan Trust | | | | | |
| Series 1998-2 A 144A 7.75% 5/19/27 #, ● | | 19,755 | | $ | 19,753 |
| JPMorgan Mortgage Trust | | | | | |
| Series 2014-IVR6 2A4 144A 2.269% 7/25/44 #, ● | | 320,962 | | | 326,237 |
| Silverstone Master Issuer | | | | | |
| Series 2018-1A 1A 144A 0.599% (LIBOR03M + | | | | | |
| 0.39%) 1/21/70 #, ● | | 1,680,000 | | | 1,678,454 |
| Wells Fargo Mortgage-Backed Securities Trust | | | | | |
| Series 2006-AR5 2A1 4.006% 4/25/36 ● | | 36,684 | | | 35,728 |
| Total Non-Agency Collateralized Mortgage Obligations (cost $2,035,280) | | | | | 2,060,172 |
| | | | | | |
| Non-Agency Commercial Mortgage-Backed Securities – 1.23% | | | | | |
| Benchmark Mortgage Trust | | | | | |
| Series 2020-B17 A5 2.289% 3/15/53 | | 5,000,000 | | | 5,320,955 |
| DB-UBS Mortgage Trust | | | | | |
| Series 2011-LC1A C 144A 5.565% 11/10/46 #, ● | | 100,000 | | | 100,247 |
| Total Non-Agency Commercial Mortgage-Backed Securities (cost $5,352,055) | | | | | 5,421,202 |
| | | | | | |
| Loan Agreements – 0.30% | | | | | |
| Applied Systems 1st Lien 4.00% (LIBOR03M + | | | | | |
| 3.00%) 9/19/24 ● | | 246,881 | | | 247,190 |
| AssuredPartners 3.646% (LIBOR01M + 3.50%) | | | | | |
| 2/12/27 ● | | 261,843 | | | 258,461 |
| Berry Global Tranche W 2.149% (LIBOR01M + | | | | | |
| 2.00%) 10/1/22 ● | | 129,391 | | | 129,440 |
| Blue Ribbon 1st Lien 5.00% (LIBOR02M + 4.00%) | | | | | |
| 11/15/21 ● | | 266,671 | | | 253,115 |
| Charter Communications Operating | | | | | |
| Tranche B2 1.90% (LIBOR01M + 1.75%) 2/1/27 ● | | 242,516 | | | 241,590 |
| Gardner Denver Tranche B-1 1.897% (LIBOR01M + | | | | | |
| 1.75%) 3/1/27 ● | | 206,705 | | | 204,232 |
| Total Loan Agreements (cost $1,349,476) | | | | | 1,334,028 |
| |
| Sovereign BondsΔ – 3.17% | | | | | |
| Croatia – 0.05% | | | | | |
| Croatia Government International Bond 144A 5.50% | | | | | |
| 4/4/23 # | | 200,000 | | | 220,605 |
| | | | | | 220,605 |
25
Schedule of investments
Delaware Limited-Term Diversified Income Fund
| | | | Principal amount° | | Value (US $) |
| Sovereign Bonds (continued) | | | | | | | |
| Georgia – 0.05% | | | | | | | |
| Georgia Government International Bond 6.875% | | | | | | | |
| 4/12/21 | | | | 200,000 | | $ | 203,440 |
| | | | | | | | 203,440 |
| Indonesia – 0.07% | | | | | | | |
| Indonesia Government International Bond 144A | | | | | | | |
| 3.375% 4/15/23 # | | | | 310,000 | | | 329,378 |
| | | | | | | | 329,378 |
| Kenya – 0.05% | | | | | | | |
| Kenya Government International Bond 144A 6.875% | | | | | | | |
| 6/24/24 # | | | | 200,000 | | | 219,602 |
| | | | | | | | 219,602 |
| Nigeria – 0.06% | | | | | | | |
| Nigeria Government International Bond 5.625% | | | | | | | |
| 6/27/22 | | | | 250,000 | | | 259,226 |
| | | | | | | | 259,226 |
| Republic of Korea – 0.11% | | | | | | | |
| Export-Import Bank of Korea 1.00% 6/1/23 ● | | | | 500,000 | | | 505,587 |
| | | | | | | | 505,587 |
| Saudi Arabia – 0.06% | | | | | | | |
| Kingdom of Saudi Arabia Sukuk 144A 2.894% | | | | | | | |
| 4/20/22 # | | | | 250,000 | | | 257,811 |
| | | | | | | | 257,811 |
| Senegal – 0.05% | | | | | | | |
| Senegal Government International Bond 144A | | | | | | | |
| 6.25% 7/30/24 # | | | | 200,000 | | | 220,937 |
| | | | | | | | 220,937 |
| Spain – 2.62% | | | | | | | |
| Spanish Treasury Bill 0.00% 1/15/21 ~ | | EUR | | 9,410,000 | | | 11,498,861 |
| | | | | | | | 11,498,861 |
| Uzbekistan – 0.05% | | | | | | | |
| Republic of Uzbekistan Bond 144A 4.75% 2/20/24 # | | | | 200,000 | | | 217,722 |
| | | | | | | | 217,722 |
| Total Sovereign Bonds (cost $13,789,330) | | | | | | | 13,933,169 |
26
| | | | Principal amount° | | Value (US $) |
| Supranational Bank – 0.12% | | | | | |
| Banque Ouest Africaine de Developpement | | | | | |
| 144A 5.50% 5/6/21 # | | 500,000 | | $ | 508,520 |
| Total Supranational Bank (cost $529,500) | | | | | 508,520 |
| | | | | | |
| US Treasury Obligations – 16.32% | | | | | |
| US Treasury Floating Rate Note | | | | | |
| 0.145% (USBMMY3M + 0.055%) 7/31/22 ● | | 35,745,000 | | | 35,749,268 |
| US Treasury Notes | | | | | |
| 0.375% 11/30/25 | | 34,080,000 | | | 34,122,600 |
| 1.625% 12/31/21 | | 1,775,000 | | | 1,801,802 |
| Total US Treasury Obligations (cost $71,577,820) | | | | | 71,673,670 |
| | | | | | |
| | | Number of shares | | | |
| Preferred Stock – 0.34% | | | | | |
| Morgan Stanley 4.047% (LIBOR03M + | | | | | |
| 3.81%) ● | | 1,180,000 | | | 1,174,442 |
| USB Realty 144A | | | | | |
| 1.384% (LIBOR03M + 1.147%) #, ● | | 400,000 | | | 300,000 |
| Total Preferred Stock (cost $1,490,000) | | | | | 1,474,442 |
| | | | | | |
| Short-Term Investments – 2.91% | | | | | |
| Money Market Mutual Funds – 2.91% | | | | | |
| BlackRock FedFund – Institutional Shares | | | | | |
| (seven-day effective yield 0.00%) | | 3,197,567 | | | 3,197,567 |
| Fidelity Investments Money Market Government | | | | | |
| Portfolio – Class I (seven-day effective yield | | | | | |
| 0.01%) | | 3,197,567 | | | 3,197,567 |
| GS Financial Square Government Fund – | | | | | |
| Institutional Shares (seven-day effective yield | | | | | |
| 0.02%) | | 3,197,567 | | | 3,197,567 |
| Morgan Stanley Government Portfolio – Institutional | | | | | |
| Share Class (seven-day effective yield 0.00%) | | 3,197,567 | | | 3,197,567 |
| Total Short-Term Investments (cost $12,790,268) | | | | | 12,790,268 |
| Total Value of Securities–101.36% | | | | | |
| (cost $436,502,792) | | | | $ | 445,096,510 |
| ° | Principal amount shown is stated in USD unless noted that the security is denominated in another currency. |
| ϕ | Step coupon bond. Stated rate in effect at December 31, 2020 through maturity date. |
27
Schedule of investments
Delaware Limited-Term Diversified Income Fund
| ⧫ | Pass Through Agreement. Security represents the contractual right to receive a proportionate amount of underlying payments due to the counterparty pursuant to various agreements related to the rescheduling of obligations and the exchange of certain notes. |
| ● | Variable rate investment. Rates reset periodically. Rate shown reflects the rate in effect at December 31, 2020. For securities based on a published reference rate and spread, the reference rate and spread are indicated in their descriptions. The reference rate descriptions (i.e. LIBOR03M, LIBOR06M, etc.) used in this report are identical for different securities, but the underlying reference rates may differ due to the timing of the reset period. Certain variable rate securities are not based on a published reference rate and spread but are determined by the issuer or agent and are based on current market conditions, or for mortgage-backed securities, are impacted by the individual mortgages which are paying off over time. These securities do not indicate a reference rate and spread in their descriptions. |
| # | Security exempt from registration under Rule 144A of the Securities Act of 1933, as amended. At December 31, 2020, the aggregate value of Rule 144A securities was $125,943,386, which represents 28.68% of the Fund’s net assets. See Note 11 in “Notes to financial statements.” |
| ^ | Zero-coupon security. The rate shown is the effective yield at the time of purchase. |
| > | PIK. 100% of the income received was in the form of cash. |
| µ | Fixed to variable rate investment. The rate shown reflects the fixed rate in effect at December 31, 2020. Rate will reset at a future date. |
| ψ | No contractual maturity date. |
| ‡ | Non-income producing security. Security is currently in default. |
| Δ | Securities have been classified by country of origin. |
| ~ | The rate shown is the effective yield at the time of purchase. |
The following foreign currency exchange contracts and futures contracts were outstanding at December 31, 2020:1
Foreign Currency Exchange Contracts
| | Currency to | | | | | Settlement | | Unrealized | | Unrealized |
| Counterparty | | Receive (Deliver) | | In Exchange For | | Date | | Appreciation | | Depreciation |
| TD | | EUR | (9,410,000) | | USD | 11,430,091 | | 1/15/21 | | $ | – | | $ | (70,147 | ) |
Futures Contracts
Exchange-Traded
| | | | | | | | | | | | | | | | Variation |
| | | | | | | | | | | | | | | | Margin |
| | | | | | Notional | | | | Value/ | | Due from |
| | Notional | | Cost | | Expiration | | Unrealized | | (Due to) |
| Contracts to Buy (Sell) | | | Amount | | (Proceeds) | | Date | | Depreciation | | Brokers |
| (22) US Treasury 10 yr Notes | | $ | (3,037,719 | ) | | $ | (3,034,227 | ) | | 3/22/21 | | $ | (3,492 | ) | | $ | (2,406 | ) |
The use of foreign currency exchange contracts and futures contracts involve elements of market risk and risks in excess of the amounts disclosed in these financial statements. The foreign currency exchange contracts and notional amounts
28
presented on the previous page represent the Fund’s total exposure in such contracts, whereas only the net unrealized appreciation (depreciation) and variation margin are reflected in the Fund’s net assets.
| 1 | See Note 8 in “Notes to financial statements.” |
Summary of abbreviations:
ARM – Adjustable Rate Mortgage
CLO – Collateralized Loan Obligation
DAC – Designated Activity Company
DIFC – Dubai International Financial Centre
FREMF – Freddie Mac Multifamily
GNMA – Government National Mortgage Association
GS – Goldman Sachs
GSMPS – Goldman Sachs Reperforming Mortgage Securities
ICE – Intercontinental Exchange, Inc.
LIBOR – London interbank offered rate
LIBOR01M – ICE LIBOR USD 1 Month
LIBOR02M – ICE LIBOR USD 2 Month
LIBOR03M – ICE LIBOR USD 3 Month
LIBOR06M – ICE LIBOR USD 6 Month
LIBOR12M – ICE LIBOR USD 12 Month
NCUA – National Credit Union Administration
PIK – Payment-in-kind
REMIC – Real Estate Mortgage Investment Conduit
S.F. – Single Family
SOFR – Secured Overnight Financing Rate
TBA – To be announced
TD – TD Bank
USBMMY3M – US Treasury 3 Month Bill Money Market Yield
yr – Year
Summary of currencies:
EUR – European Monetary Unit
USD – US Dollar
See accompanying notes, which are an integral part of the financial statements.
29
Statement of assets and liabilities
| Delaware Limited-Term Diversified Income Fund | December 31, 2020 |
| | | | | |
| Assets: | | | | |
| Investments, at value* | | $ | 445,096,510 | |
| Cash collateral due from brokers | | | 143,880 | |
| Receivable for securities sold | | | 365,577 | |
| Dividends and interest receivable | | | 2,276,773 | |
| Receivable for fund shares sold | | | 951,650 | |
| Total Assets | | | 448,834,390 | |
| Liabilities: | | | | |
| Due to custodian | | | 1,200 | |
| Payable for securities purchased | | | 8,013,259 | |
| Payable for fund shares redeemed | | | 1,167,623 | |
| Other accrued expenses | | | 165,773 | |
| Distribution payable | | | 163,950 | |
| Investment management fees payable to affiliates | | | 80,319 | |
| Unrealized depreciation on foreign currency exchange contracts | | | 70,147 | |
| Distribution fees payable to affiliates | | | 38,624 | |
| Audit and tax fees payable | | | 6,500 | |
| Dividend disbursing and transfer agent fees and expenses payable to affiliates | | | 3,308 | |
| Variation margin due to broker on futures contracts | | | 2,406 | |
| Accounting and administration expenses payable to affiliates | | | 1,617 | |
| Trustees’ fees and expenses payable to affiliates | | | 1,422 | |
| Legal fees payable to affiliates | | | 675 | |
| Reports and statements to shareholders expenses payable to affiliates | | | 441 | |
| Total Liabilities | | | 9,717,264 | |
| Total Net Assets | | $ | 439,117,126 | |
| | | | | |
| Net Assets Consist of: | | | | |
| Paid-in capital | | $ | 470,779,336 | |
| Total distributable earnings (loss) | | | (31,662,210 | ) |
| Total Net Assets | | $ | 439,117,126 | |
30
| Net Asset Value | | | |
| | | | |
| Class A: | | | |
| Net assets | $ | 148,185,242 | |
| Shares of beneficial interest outstanding, unlimited authorization, no par | | 17,547,627 | |
| Net asset value per share | $ | 8.44 | |
| Sales charge | | 2.75 | % |
| Offering price per share, equal to net asset value per share / (1 - sales charge) | $ | 8.68 | |
| | | | |
| Class C: | | | |
| Net assets | $ | 22,565,422 | |
| Shares of beneficial interest outstanding, unlimited authorization, no par | | 2,674,177 | |
| Net asset value per share | $ | 8.44 | |
| | | | |
| Class R: | | | |
| Net assets | $ | 946,089 | |
| Shares of beneficial interest outstanding, unlimited authorization, no par | | 112,042 | |
| Net asset value per share | $ | 8.44 | |
| | | | |
| Institutional Class: | | | |
| Net assets | $ | 262,774,498 | |
| Shares of beneficial interest outstanding, unlimited authorization, no par | | 31,127,957 | |
| Net asset value per share | $ | 8.44 | |
| | | | |
| Class R6: | | | |
| Net assets | $ | 4,645,875 | |
| Shares of beneficial interest outstanding, unlimited authorization, no par | | 550,616 | |
| Net asset value per share | $ | 8.44 | |
____________________ | | | | |
| * Investments, at cost | $ | 436,502,792 | |
See accompanying notes, which are an integral part of the financial statements.
31
Statement of operations
| Delaware Limited-Term Diversified Income Fund | Year ended December 31, 2020 | |
| | | | |
| Investment Income: | | | | |
| Interest | | $ | 7,836,032 | |
| Dividends | | | 80,632 | |
| | | 7,916,664 | |
| | | | | |
| Expenses: | | | | |
| Management fees | | | 2,125,308 | |
| Distribution expenses — Class A | | | 360,096 | |
| Distribution expenses — Class C | | | 285,571 | |
| Distribution expenses — Class R | | | 6,038 | |
| Dividend disbursing and transfer agent fees and expenses | | | 404,457 | |
| Accounting and administration expenses | | | 111,232 | |
| Registration fees | | | 91,561 | |
| Reports and statements to shareholders expenses | | | 66,800 | |
| Audit and tax fees | | | 54,508 | |
| Legal fees | | | 47,097 | |
| Trustees’ fees and expenses | | | 24,609 | |
| Custodian fees | | | 19,659 | |
| Other | | | 58,721 | |
| | | 3,655,657 | |
| Less expenses waived | | | (1,351,223 | ) |
| Less waived distribution expenses — Class A | | | (144,038 | ) |
| Less expenses paid indirectly | | | (1,666 | ) |
| Total operating expenses | | | 2,158,730 | |
| Net Investment Income | | | 5,757,934 | |
32
| Net Realized and Unrealized Gain (Loss): | | | |
| Net realized gain (loss) on: | | | |
| Investments | $ | 7,364,890 | |
| Foreign currencies | | 24,012 | |
| Foreign currency exchange contracts | | (15,537 | ) |
| Futures contracts | | (1,360,629 | ) |
| Swap contracts | | 558,412 | |
| Net realized gain | | 6,571,148 | |
| | | | |
| Net change in unrealized appreciation (depreciation) of: | | | |
| Investments | | 3,510,872 | |
| Foreign currency exchange contracts | | (70,147 | ) |
| Futures contracts | | 32,010 | |
| Swap contracts | | 1,201,546 | |
| Net change in unrealized appreciation (depreciation) | | 4,674,281 | |
| Net Realized and Unrealized Gain | | 11,245,429 | |
| Net Increase in Net Assets Resulting from Operations | $ | 17,003,363 | |
See accompanying notes, which are an integral part of the financial statements.
33
Statements of changes in net assets
Delaware Limited-Term Diversified Income Fund
| | | Year ended |
| | | 12/31/20 | | 12/31/19 |
| Increase (Decrease) in Net Assets from Operations: | | | | | | | | |
| | Net investment income | | $ | 5,757,934 | | | $ | 11,700,927 | |
| Net realized gain (loss) | | | 6,571,148 | | | | (1,982,015 | ) |
| Net change in unrealized appreciation (depreciation) | | | 4,674,281 | | | | 10,584,393 | |
| Net increase in net assets resulting from operations | | | 17,003,363 | | | | 20,303,305 | |
| | | | | | | | | | |
| Dividends and Distributions to Shareholders from: | | | | | | | | |
| Distributable earnings: | | | | | | | | |
| Class A | | | (2,426,621 | ) | | | (3,576,198 | ) |
| Class C | | | (279,518 | ) | | | (880,688 | ) |
| Class R | | | (17,729 | ) | | | (48,543 | ) |
| Institutional Class | | | (4,532,737 | ) | | | (6,691,457 | ) |
| Class R6 | | | (76,898 | ) | | | (57,680 | ) |
| | | | | | | | | | |
| Return of capital: | | | | | | | | |
| Class A | | | (487,399 | ) | | | (519,147 | ) |
| Class C | | | (74,277 | ) | | | (139,416 | ) |
| Class R | | | (3,112 | ) | | | (5,977 | ) |
| Institutional Class | | | (864,604 | ) | | | (940,821 | ) |
| Class R6 | | | (15,294 | ) | | | (11,535 | ) |
| | | | (8,778,189 | ) | | | (12,871,462 | ) |
| | | | | | | | | | |
| Capital Share Transactions: | | | | | | | | |
| Proceeds from shares sold: | | | | | | | | |
| Class A | | | 85,532,172 | | | | 37,064,126 | |
| Class C | | | 4,695,605 | | | | 5,434,688 | |
| Class R | | | 327,423 | | | | 512,146 | |
| Institutional Class | | | 112,963,850 | | | | 120,185,353 | |
| Class R6 | | | 2,935,649 | | | | 2,152,082 | |
| | | | | | | | | | |
| Net asset value of shares issued upon reinvestment of | | | | | | | | |
| dividends and distributions: | | | | | | | | |
| Class A | | | 2,698,399 | | | | 3,877,071 | |
| Class C | | | 350,010 | | | | 941,340 | |
| Class R | | | 21,043 | | | | 52,149 | |
| Institutional Class | | | 4,759,849 | | | | 6,700,166 | |
| Class R6 | | | 91,011 | | | | 67,441 | |
| | | | 214,375,011 | | | | 176,986,562 | |
34
| | | Year ended |
| | | 12/31/20 | | 12/31/19 |
| Capital Share Transactions (continued): | | | | | | | | |
| | Cost of shares redeemed: | | | | | | | | |
| Class A | | $ | (80,548,004 | ) | | $ | (73,497,716 | ) |
| Class C | | | (19,985,927 | ) | | | (34,653,775 | ) |
| Class R | | | (1,014,470 | ) | | | (1,768,338 | ) |
| Institutional Class | | | (109,466,013 | ) | | | (121,919,642 | ) |
| Class R6 | | | (1,555,843 | ) | | | (816,717 | ) |
| | | | (212,570,257 | ) | | | (232,656,188 | ) |
| Increase (decrease) in net assets derived from capital share | | | | | | | | |
| transactions | | | 1,804,754 | | | | (55,669,626 | ) |
| Net Increase (Decrease) in Net Assets | | | 10,029,928 | | | | (48,237,783 | ) |
| | | | | | | | | |
| Net Assets: | | | | | | | | |
| Beginning of year | | | 429,087,198 | | | | 477,324,981 | |
| End of year | | $ | 439,117,126 | | | $ | 429,087,198 | |
See accompanying notes, which are an integral part of the financial statements.
35
Financial highlights
Delaware Limited-Term Diversified Income Fund Class A
Selected data for each share of the Fund outstanding throughout each period were as follows:
| Net asset value, beginning of period |
| |
| Income (loss) from investment operations: |
| Net investment income1 |
| Net realized and unrealized gain (loss) |
| Total from investment operations |
| |
| Less dividends and distributions from: |
| Net investment income |
| Return of capital |
| Total dividends and distributions |
| |
| Net asset value, end of period |
| |
| Total return2 |
| |
| Ratios and supplemental data: |
| Net assets, end of period (000 omitted) |
| Ratio of expenses to average net assets3 |
| Ratio of expenses to average net assets prior to fees waived3 |
| Ratio of net investment income to average net assets |
| Ratio of net investment income to average net assets prior to fees waived |
| Portfolio turnover |
| 1 | The average shares outstanding have been applied for per share information. |
| 2 | Total return is based on the change in net asset value of a share during the period and assumes reinvestment of dividends and distributions at net asset value and does not reflect the impact of a sales charge. Total return during all of the periods shown reflects waivers by the manager and/or distributor. Performance would have been lower had the waivers not been in effect. |
| 3 | Expense ratios do not include expenses of the Underlying Funds in which the Fund invests. |
See accompanying notes, which are an integral part of the financial statements.
36
| Year ended | |
| | | 12/31/20 | | | | 12/31/19 | | | | 12/31/18 | | | | 12/31/17 | | | | 12/31/16 | | |
| $ | 8.27 | | | $ | 8.14 | | | $ | 8.46 | | | $ | 8.48 | | | $ | 8.43 | | |
| | | |
| | | |
| | 0.11 | | | | 0.21 | | | | 0.20 | | | | 0.16 | | | | 0.12 | | |
| | 0.23 | | | | 0.15 | | | | (0.29 | ) | | | 0.02 | | | | 0.08 | | |
| | 0.34 | | | | 0.36 | | | | (0.09 | ) | | | 0.18 | | | | 0.20 | | |
| | | |
| | | |
| | (0.14 | ) | | | (0.20 | ) | | | (0.19 | ) | | | (0.15 | ) | | | (0.14 | ) | |
| | (0.03 | ) | | | (0.03 | ) | | | (0.04 | ) | | | (0.05 | ) | | | (0.01 | ) | |
| | (0.17 | ) | | | (0.23 | ) | | | (0.23 | ) | | | (0.20 | ) | | | (0.15 | ) | |
| | | |
| $ | 8.44 | | | $ | 8.27 | | | $ | 8.14 | | | $ | 8.46 | | | $ | 8.48 | | |
| | | |
| | 4.16% | | | | 4.51% | | | | (1.08% | ) | | | 2.11% | | | | 2.42% | | |
| | | |
| | | |
| $ | 148,185 | | | $ | 137,798 | | | $ | 168,003 | | | $ | 382,353 | | | $ | 437,803 | | |
| | 0.54% | | | | 0.54% | | | | 0.60% | | | | 0.74% | | | | 0.81% | | |
| | 0.96% | | | | 0.96% | | | | 0.95% | | | | 0.94% | | | | 0.92% | | |
| | 1.32% | | | | 2.58% | | | | 2.46% | | | | 1.95% | | | | 1.36% | | |
| | 0.90% | | | | 2.16% | | | | 2.11% | | | | 1.75% | | | | 1.25% | | |
| | 224% | | | | 123% | | | | 130% | | | | 151% | | | | 124% | | |
37
Financial highlights
Delaware Limited-Term Diversified Income Fund Class C
Selected data for each share of the Fund outstanding throughout each period were as follows:
| Net asset value, beginning of period |
| |
| Income (loss) from investment operations: |
| Net investment income1 |
| Net realized and unrealized gain (loss) |
| Total from investment operations |
| |
| Less dividends and distributions from: |
| Net investment income |
| Return of capital |
| Total dividends and distributions |
| |
| Net asset value, end of period |
| |
| Total return2 |
| |
| Ratios and supplemental data: |
| Net assets, end of period (000 omitted) |
| Ratio of expenses to average net assets3 |
| Ratio of expenses to average net assets prior to fees waived3 |
| Ratio of net investment income to average net assets |
| Ratio of net investment income to average net assets |
| prior to fees waived |
| Portfolio turnover |
| 1 | The average shares outstanding have been applied for per share information. |
| 2 | Total return is based on the change in net asset value of a share during the period and assumes reinvestment of dividends and distributions at net asset value and does not reflect the impact of a sales charge. Total return during all of the periods shown reflects a waiver by the manager. Performance would have been lower had the waiver not been in effect. |
| 3 | Expense ratios do not include expenses of the Underlying Funds in which the Fund invests. |
See accompanying notes, which are an integral part of the financial statements.
38
| | Year ended |
| | 12/31/20 | | 12/31/19 | | 12/31/18 | | 12/31/17 | | 12/31/16 | |
| | $ 8.27 | | $ 8.14 | | $8.45 | | $ 8.47 | | $8.42 | |
| | | |
| | | |
| | 0.04 | | 0.14 | | 0.13 | | 0.09 | | 0.04 | |
| | 0.23 | | 0.15 | | (0.28) | | 0.02 | | 0.09 | |
| | 0.27 | | 0.29 | | (0.15) | | 0.11 | | 0.13 | |
| | | |
| | | |
| | (0.07) | | (0.13) | | (0.12) | | (0.08) | | (0.07) | |
| | (0.03) | | (0.03) | | (0.04) | | (0.05) | | (0.01) | |
| | (0.10) | | (0.16) | | (0.16) | | (0.13) | | (0.08) | |
| | | |
| | $8.44 | | $ 8.27 | | $8.14 | | $ 8.45 | | $8.47 | |
| | | |
| | 3.28% | | 3.63% | | (1.80%) | | 1.25% | | 1.55% | |
| | | |
| | | |
| | $22,565 | | $36,977 | | $64,324 | | $89,456 | | $120,011 | |
| | 1.39% | | 1.39% | | 1.45% | | 1.59% | | 1.66% | |
| | 1.71% | | 1.71% | | 1.70% | | 1.69% | | 1.67% | |
| | 0.47% | | 1.73% | | 1.61% | | 1.10% | | 0.51% | |
| | | |
| | 0.15% | | 1.41% | | 1.36% | | 1.00% | | 0.50% | |
| | 224% | | 123% | | 130% | | 151% | | 124% | |
39
Financial highlights
Delaware Limited-Term Diversified Income Fund Class R
Selected data for each share of the Fund outstanding throughout each period were as follows:
| Net asset value, beginning of period |
| |
| Income (loss) from investment operations: |
| Net investment income1 |
| Net realized and unrealized gain (loss) |
| Total from investment operations |
| |
| Less dividends and distributions from: |
| Net investment income |
| Return of capital |
| Total dividends and distributions |
| |
| Net asset value, end of period |
| |
| Total return2 |
| |
| Ratios and supplemental data: |
| Net assets, end of period (000 omitted) |
| Ratio of expenses to average net assets3 |
| Ratio of expenses to average net assets prior to fees waived3 |
| Ratio of net investment income to average net assets |
| Ratio of net investment income to average net assets |
| prior to fees waived |
| Portfolio turnover |
| 1 | The average shares outstanding have been applied for per share information. |
| 2 | Total return is based on the change in net asset value of a share during the period and assumes reinvestment of dividends and distributions at net asset value. Total return during all of the periods shown reflects a waiver by the manager. Performance would have been lower had the waiver not been in effect. |
| 3 | Expense ratios do not include expenses of the Underlying Funds in which the Fund invests. |
See accompanying notes, which are an integral part of the financial statements.
40
| | Year ended |
| | 12/31/20 | | 12/31/19 | | 12/31/18 | | 12/31/17 | | 12/31/16 | |
| | $ | 8.28 | | $ | 8.14 | | $ | 8.46 | | $ | 8.48 | | $ | 8.43 | |
| | | | |
| | | 0.08 | | | 0.18 | | | 0.18 | | | 0.14 | | | 0.09 | |
| | | 0.22 | | | 0.16 | | | (0.30) | | | 0.01 | | | 0.08 | |
| | | 0.30 | | | 0.34 | | | (0.12) | | | 0.15 | | | 0.17 | |
| | | | |
| | | | |
| | | (0.11) | | | (0.17) | | | (0.16) | | | (0.12) | | | (0.11) | |
| | | (0.03) | | | (0.03) | | | (0.04) | | | (0.05) | | | (0.01) | |
| | | (0.14) | | | (0.20) | | | (0.20) | | | (0.17) | | | (0.12) | |
| | | | |
| | $ | 8.44 | | $ | 8.28 | | $ | 8.14 | | $ | 8.46 | | $ | 8.48 | |
| | | | |
| | | 3.66% | | | 4.27% | | | (1.43%) | | | 1.76% | | | 2.06% | |
| | | | |
| | $ | 946 | | $ | 1,586 | | $ | 2,753 | | $ | 3,819 | | $ | 4,984 | |
| | | 0.89% | | | 0.89% | | | 0.95% | | | 1.09% | | | 1.16% | |
| | | 1.21% | | | 1.21% | | | 1.20% | | | 1.19% | | | 1.17% | |
| | | 0.97% | | | 2.23% | | | 2.11% | | | 1.60% | | | 1.01% | |
| | | | |
| | | 0.65% | | | 1.91% | | | 1.86% | | | 1.50% | | | 1.00% | |
| | | 224% | | | 123% | | | 130% | | | 151% | | | 124% | |
41
Financial highlights
Delaware Limited-Term Diversified Income Fund Institutional Class
Selected data for each share of the Fund outstanding throughout each period were as follows:
| Net asset value, beginning of period |
| |
| Income (loss) from investment operations: |
| Net investment income1 |
| Net realized and unrealized gain (loss) |
| Total from investment operations |
| |
| Less dividends and distributions from: |
| Net investment income |
| Return of capital |
| Total dividends and distributions |
| |
| Net asset value, end of period |
| |
| Total return2 |
| |
| Ratios and supplemental data: |
| Net assets, end of period (000 omitted) |
| Ratio of expenses to average net assets3 |
| Ratio of expenses to average net assets prior to fees waived3 |
| Ratio of net investment income to average net assets |
| Ratio of net investment income to average net assets prior to fees waived |
| Portfolio turnover |
| 1 | The average shares outstanding have been applied for per share information. |
| 2 | Total return is based on the change in net asset value of a share during the period and assumes reinvestment of dividends and distributions at net asset value. Total return during all of the periods shown reflects a waiver by the manager. Performance would have been lower had the waiver not been in effect. |
| 3 | Expense ratios do not include expenses of the Underlying Funds in which the Fund invests. |
See accompanying notes, which are an integral part of the financial statements.
42
| | Year ended |
| | 12/31/20 | | 12/31/19 | | 12/31/18 | | 12/31/17 | | 12/31/16 | |
| | $8.27 | | $8.14 | | $8.46 | | $8.47 | | $8.43 | |
| | | |
| | | |
| | 0.12 | | 0.23 | | 0.22 | | 0.18 | | 0.13 | |
| | 0.23 | | 0.15 | | (0.30) | | 0.02 | | 0.07 | |
| | 0.35 | | 0.38 | | (0.08) | | 0.20 | | 0.20 | |
| | | |
| | | |
| | (0.15) | | (0.22) | | (0.20) | | (0.16) | | (0.15) | |
| | (0.03) | | (0.03) | | (0.04) | | (0.05) | | (0.01) | |
| | (0.18) | | (0.25) | | (0.24) | | (0.21) | | (0.16) | |
| | | |
| | $8.44 | | $8.27 | | $8.14 | | $8.46 | | $8.47 | |
| | | |
| | 4.31% | | 4.67% | | (0.93%) | | 2.39% | | 2.45% | |
| | | |
| | | |
| | $262,775 | | $249,667 | | $240,614 | | $266,274 | | $377,595 | |
| | 0.39% | | 0.39% | | 0.45% | | 0.59% | | 0.66% | |
| | 0.71% | | 0.71% | | 0.70% | | 0.69% | | 0.67% | |
| | 1.47% | | 2.73% | | 2.61% | | 2.10% | | 1.51% | |
| | 1.15% | | 2.41% | | 2.36% | | 2.00% | | 1.50% | |
| | 224% | | 123% | | 130% | | 151% | | 124% | |
43
Financial highlights
Delaware Limited-Term Diversified Income Fund Class R6
Selected data for each share of the Fund outstanding throughout each period were as follows:
| Net asset value, beginning of period |
| |
| Income (loss) from investment operations: |
| Net investment income2 |
| Net realized and unrealized gain (loss) |
| Total from investment operations |
| |
| Less dividends and distributions from: |
| Net investment income |
| Return of capital |
| Total dividends and distributions |
| Net asset value, end of period |
| Total return3 |
| Ratios and supplemental data: |
| Net assets, end of period (000 omitted) |
| Ratio of expenses to average net assets4 |
| Ratio of expenses to average net assets prior to fees waived4 |
| Ratio of net investment income to average net assets |
| Ratio of net investment income to average net assets prior to fees waived |
| Portfolio turnover |
| 1 | Date of commencement of operations; ratios have been annualized and total return has not been annualized. |
| 2 | The average shares outstanding have been applied for per share information. |
| 3 | Total return is based on the change in net asset value of a share during the period and assumes reinvestment of dividends and distributions at net asset value. Total return during all of the periods shown reflects a waiver by the manager. Performance would have been lower had the waiver not been in effect. |
| 4 | Expense ratios do not include expenses of the Underlying Funds in which the Fund invests. |
| 5 | Portfolio turnover is representative of the Fund for the entire period. |
See accompanying notes, which are an integral part of the financial statements.
44
| | | | | | | | | | 5/1/171 | |
| Year ended | | to | |
| 12/31/20 | | 12/31/19 | | 12/31/18 | | 12/31/17 | |
| $ 8.27 | | | $ 8.14 | | | $ 8.45 | | | $ 8.50 | | |
| | | | | | | | | | | | | |
| | | | | | | | | | | | | |
| 0.13 | | | 0.23 | | | 0.22 | | | 0.12 | | |
| 0.23 | | | 0.15 | | | (0.28 | ) | | (0.03 | ) | |
| 0.36 | | | 0.38 | | | (0.06 | ) | | 0.09 | | |
| | | | | | | | | | | | |
| | | | | | | | | | | | |
| (0.16 | ) | | (0.22 | ) | | (0.21 | ) | | (0.09 | ) | |
| (0.03 | ) | | (0.03 | ) | | (0.04 | ) | | (0.05 | ) | |
| (0.19 | ) | | (0.25 | ) | | (0.25 | ) | | (0.14 | ) | |
| $ 8.44 | | | $ 8.27 | | | $ 8.14 | | | $ 8.45 | | |
| 4.38% | | | 4.74% | | | (0.75% | ) | | 1.10% | | |
| | | | | | | | | | | | |
| $ 4,646 | | | $ 3,059 | | | $ 1,631 | | | $ 1,634 | | |
| 0.32% | | | 0.32% | | | 0.38% | | | 0.52% | | |
| 0.63% | | | 0.64% | | | 0.62% | | | 0.61% | | |
| 1.54% | | | 2.80% | | | 2.68% | | | 2.11% | | |
| 1.23% | | | 2.48% | | | 2.44% | | | 2.02% | | |
| 224% | | | 123% | | | 130% | | | 151% | 5 | |
45
| Notes to financial statements | |
| Delaware Limited-Term Diversified Income Fund | December 31, 2020 |
Delaware Group® Limited-Term Government Funds (Trust) is organized as a Delaware statutory trust and offers three series: Delaware Limited-Term Diversified Income Fund, Delaware Tax-Free New Jersey Fund, and Delaware Tax-Free Oregon Fund. These financial statements pertain to Delaware Limited-Term Diversified Income Fund (Fund). The Trust is an open-end investment company. The Fund is considered diversified under the Investment Company Act of 1940, as amended, and offers Class A, Class C, Class R, Institutional Class, and Class R6 shares. Class A shares are sold with a maximum front-end sales charge of 2.75%. Class A share purchases of $1,000,000 or more will incur a limited contingent deferred sales charge (CDSC) instead of a front-end sales charge of 1.00% if redeemed during the first year, provided that Delaware Distributors, L.P. (DDLP) paid a financial advisor a commission on the purchase of those shares. Class C shares are sold with a CDSC of 1.00%, which will be incurred if redeemed during the first 12 months. Class R, Institutional Class, and Class R6 shares are not subject to a sales charge and are offered for sale exclusively to certain eligible investors. In addition, Class R6 shares do not pay any service fees, sub-accounting fees, and/or sub-transfer agency fees to any brokers, dealers or other financial intermediaries.
1. Significant Accounting Policies
The Fund follows accounting and reporting guidance under Financial Accounting Standards Board (FASB) Accounting Standards Codification Topic 946, Financial Services — Investment Companies. The following accounting policies are in accordance with US generally accepted accounting principles (US GAAP) and are consistently followed by the Fund.
Security Valuation — Equity securities, except those traded on the Nasdaq Stock Market LLC (Nasdaq), are valued at the last quoted sales price as of the time of the regular close of the New York Stock Exchange on the valuation date. Equity securities traded on the Nasdaq are valued in accordance with the Nasdaq Official Closing Price, which may not be the last sales price. If, on a particular day, an equity security does not trade, the mean between the bid and ask prices will be used, which approximates fair value. Securities listed on a foreign exchange are normally valued at the last quoted sales price on the valuation date. Debt securities and credit default swap (CDS) contracts are valued based upon valuations provided by an independent pricing service or broker/counterparty and reviewed by management. To the extent current market prices are not available, the pricing service may take into account developments related to the specific security, as well as transactions in comparable securities. US government and agency securities are valued at the mean between the bid and ask prices, which approximates fair value. Valuations for fixed income securities utilize matrix systems, which reflect such factors as security prices, yields, maturities, and ratings, and are supplemented by dealer and exchange quotations. Open-end investment companies are valued at their published net asset value (NAV). For asset-backed securities, collateralized mortgage obligations, commercial mortgage securities, and US government agency mortgage securities, pricing vendors utilize matrix pricing which considers prepayment speed; attributes of the collateral; yield or price of bonds of comparable quality, coupon, maturity, and type as well as broker/dealer-supplied prices. Swap prices are derived using daily swap curves and models that incorporate a number of market data factors, such as discounted cash flows, trades, and values of the underlying reference instruments. Foreign currency exchange contracts are valued at the mean between the bid and ask prices, which approximates fair value. Interpolated values
46
are derived when the settlement date of the contract is an interim date for which quotations are not available. Futures contracts and options on futures contracts are valued at the daily quoted settlement prices. Generally, other securities and assets for which market quotations are not readily available are valued at fair value as determined in good faith under the direction of the Trust’s Board of Trustees (Board). In determining whether market quotations are readily available or fair valuation will be used, various factors will be taken into consideration, such as market closures or suspension of trading in a security. Restricted securities are valued at fair value using methods approved by the Board.
Federal and Foreign Income Taxes — No provision for federal income taxes has been made as the Fund intends to continue to qualify for federal income tax purposes as a regulated investment company under Subchapter M of the Internal Revenue Code of 1986, as amended, and make the requisite distributions to shareholders. The Fund evaluates tax positions taken or expected to be taken in the course of preparing the Fund’s tax returns to determine whether the tax positions are “more-likely-than-not” of being sustained by the applicable tax authority. Tax positions not deemed to meet the “more-likely-than-not” threshold are recorded as a tax benefit or expense in the current year. Management has analyzed the Fund’s tax positions taken or expected to be taken on the Fund’s federal income tax returns through the year ended December 31, 2020 and for all open tax years (years ended December 31, 2017–December 31, 2019), and has concluded that no provision for federal income tax is required in the Fund’s financial statements. In regard to foreign taxes only, the Fund has open tax years in certain foreign countries in which it invests that may date back to the inception of the Fund. If applicable, the Fund recognizes interest accrued on unrecognized tax benefits in interest expense and penalties in “Other” on the “Statement of operations.” During the year ended December 31, 2020, the Fund did not incur any interest or tax penalties.
Class Accounting — Investment income and common expenses are allocated to the various classes of the Fund on the basis of “settled shares” of each class in relation to the net assets of the Fund. Realized and unrealized gain (loss) on investments are allocated to the various classes of the Fund on the basis of daily net assets of each class. Distribution expenses relating to a specific class are charged directly to that class. Class R6 shares will not be allocated any expenses related to service fees, sub-accounting fees, and/or sub-transfer agency fees paid to brokers, dealers, or financial intermediaries.
To Be Announced Trades — The Fund may contract to purchase or sell securities for a fixed price at a transaction date beyond the customary settlement period (examples: when issued, delayed delivery, forward commitment, or TBA transactions) consistent with the Fund’s ability to manage its investment portfolio and meet redemption requests. These transactions involve a commitment by the Fund to purchase or deliver securities for a predetermined price or yield with payment and delivery taking place more than three days in the future, or after a period longer than the customary settlement period for that type of security. No interest will be earned by the Fund on such purchases until the securities are delivered or the transaction is completed; however, the market value may change prior to delivery.
Foreign Currency Transactions — Transactions denominated in foreign currencies are recorded at the prevailing exchange rates on the valuation date in accordance with the Fund’s prospectus. The value of all assets and liabilities denominated in foreign currencies is translated daily into US dollars at the exchange rate of such currencies against the US dollar. Transaction gains or losses resulting from
47
Notes to financial statements
Delaware Limited-Term Diversified Income Fund
1. Significant Accounting Policies (continued)
changes in exchange rates during the reporting period or upon settlement of the foreign currency transaction are reported in operations for the current period. The Fund generally bifurcates that portion of realized gains and losses on investments in debt securities which is due to changes in foreign exchange rates from that which is due to changes in market prices of debt securities. That portion of gains (losses), attributable to changes in foreign exchange rates, is included on the “Statement of operations” under “Net realized gain (loss) on foreign currencies.” For foreign equity securities, these changes are included on the “Statement of operations” under “Net realized and unrealized gain (loss) on investments.” The Fund reports certain foreign currency related transactions as components of realized gains (losses) for financial reporting purposes, whereas such components are treated as ordinary income (loss) for federal income tax purposes.
Use of Estimates — The preparation of financial statements in conformity with US GAAP requires management to make estimates and assumptions that affect the fair value of investments, the reported amounts of assets and liabilities and disclosure of contingent assets and liabilities at the date of the financial statements, and the reported amounts of revenues and expenses during the reporting period. Actual results could differ from those estimates and the differences could be material.
Other — Expenses directly attributable to the Fund are charged directly to the Fund. Other expenses common to various funds within the Delaware Funds® by Macquarie (Delaware Funds) are generally allocated among such funds on the basis of average net assets. Management fees and certain other expenses are paid monthly. Security transactions are recorded on the date the securities are purchased or sold (trade date) for financial reporting purposes. Costs used in calculating realized gains and losses on the sale of investment securities are those of the specific securities sold. Dividend income is recorded on the ex-dividend date and interest income is recorded on the accrual basis. Discounts and premiums on debt securities are accreted or amortized to interest income, respectively, over the lives of the respective securities using the effective interest method. Premiums on callable debt securities are amortized to interest income to the earliest call date using the effective interest method. Realized gains (losses) on paydowns of asset- and mortgage-backed securities are classified as interest income. The Fund declares dividends daily from net investment income and pays the dividends monthly and declares and pays distributions from net realized gain on investments, if any, annually. The Fund may distribute more frequently, if necessary for tax purposes. Dividends and distributions, if any, are recorded on the ex-dividend date.
The Fund receives earnings credits from its custodian when positive cash balances are maintained, which may be used to offset custody fees. The expenses paid under this arrangement are included on the “Statement of operations” under “Custodian fees” with the corresponding expenses offset included under “Less expenses paid indirectly.” For the year ended December 31, 2020, the Fund earned $1,216 under this arrangement.
The Fund receives earnings credits from its transfer agent when positive cash balances are maintained, which may be used to offset transfer agent fees. If the amount earned is greater than $1, the expenses paid under this arrangement are included on the “Statement of operations” under “Dividend disbursing
48
and transfer agent fees and expenses” with the corresponding expenses offset included under “Less expenses paid indirectly.” For the year ended December 31, 2020, the Fund earned $450 under this arrangement.
2. Investment Management, Administration Agreements, and Other Transactions with Affiliates
In accordance with the terms of its investment management agreement, the Fund pays Delaware Management Company (DMC), a series of Macquarie Investment Management Business Trust and the investment manager, an annual fee which is calculated daily and paid monthly at the rates of 0.50% on the first $500 million of average daily net assets of the Fund, 0.475% on the next $500 million, 0.45% on the next $1.5 billion, and 0.425% on average daily net assets in excess of $2.5 billion.
DMC has contractually agreed to waive all or a portion, if any, of its management fee and/or pay/reimburse the Fund to the extent necessary to ensure total annual operating expenses (excluding any distribution and service (12b-1) fees, acquired fund fees and expenses, taxes, interest, short sale dividend and interest expenses, brokerage fees, certain insurance costs, and nonroutine expenses or costs, including, but not limited to, those relating to reorganizations, litigation, conducting shareholder meetings, and liquidations) do not exceed 0.39% of the Fund’s Class A, Class C, Class R, and Institutional Class average daily net assets and 0.32% of the Fund’s Class R6 shares average daily net assets January 1, 2020 through December 31, 2020.* For purposes of these waivers and reimbursements, nonroutine expenses may also include such additional costs and expenses, as may be agreed upon from time to time by the Board and DMC. These waivers and reimbursements apply only to expenses paid directly by the Fund and may be terminated only by agreement of DMC and the Fund. The waivers and reimbursements are accrued daily and received monthly.
DMC may seek investment advice and recommendations from its affiliates: Macquarie Investment Management Europe Limited, Macquarie Investment Management Austria Kapitalanlage AG, and Macquarie Investment Management Global Limited (together, the “Affiliated Sub-Advisors”). The Manager may also permit these Affiliated Sub-Advisors to execute Fund security trades on behalf of the Manager and exercise investment discretion for securities in certain markets where DMC believes it will be beneficial to utilize an Affiliated Sub-Advisor’s specialized market knowledge. Although the Affiliated Sub-Advisors serve as sub-advisors, DMC has ultimate responsibility for all investment advisory services. For these services, DMC, not the Fund, pays each Affiliated Sub-Advisor a portion of its investment management fee.
Delaware Investments Fund Services Company (DIFSC), an affiliate of DMC, provides fund accounting and financial administrative oversight services to the Fund. For these services, DIFSC’s fees are calculated daily and paid monthly based on the aggregate daily net assets of all funds within the Delaware Funds at the following annual rates: 0.00475% of the first $35 billion; 0.0040% of the next $10 billion; and 0.0025% of aggregate average daily net assets in excess of $45 billion (Total Fee). Each fund in the Delaware Funds pays a minimum of $4,000, which, in aggregate, is subtracted from the Total Fee. Each fund then pays its portion of the remainder of the Total Fee on a relative NAV basis. This amount is included on the “Statement of operations” under “Accounting and administration expenses.” For the year ended December 31, 2020, the Fund was charged $18,532 for these services.
49
Notes to financial statements
Delaware Limited-Term Diversified Income Fund
2. Investment Management, Administration Agreements, and Other Transactions with Affiliates (continued)
DIFSC is also the transfer agent and dividend disbursing agent of the Fund. For these services, DIFSC’s fees are calculated daily and paid monthly based on the aggregate daily net assets of the retail funds within the Delaware Funds at the following annual rates: 0.014% of the first $20 billion; 0.011% of the next $5 billion; 0.007% of the next $5 billion; 0.005% of the next $20 billion; and 0.0025% of average daily net assets in excess of $50 billion. The fees payable to DIFSC under the shareholder services agreement described above are allocated among all retail funds in the Delaware Funds on a relative NAV basis. This amount is included on the “Statement of operations” under “Dividend disbursing and transfer agent fees and expenses.” For the year ended December 31, 2020, the Fund was charged $39,380 for these services. Pursuant to a sub-transfer agency agreement between DIFSC and BNY Mellon Investment Servicing (US) Inc. (BNYMIS), BNYMIS provides certain sub-transfer agency services to the Fund. Sub-transfer agency fees are paid by the Fund and are also included on the “Statement of operations” under “Dividend disbursing and transfer agent fees and expenses.” The fees that are calculated daily and paid as invoices are received on a monthly or quarterly basis.
Pursuant to a distribution agreement and distribution plan, the Fund pays DDLP, the distributor and an affiliate of DMC, an annual 12b-1 fee of 0.25%, 1.00%, and 0.50% of the average daily net assets of the Class A, Class C, and Class R shares, respectively. The fees are calculated daily and paid monthly. DDLP has contractually agreed to waive Class A shares’ 12b-1 fee to 0.15% of average daily net assets from January 1, 2020 through December 31, 2020.** The waiver is calculated daily and received monthly. Institutional Class and Class R6 shares do not pay 12b-1 fees.
As provided in the investment management agreement, the Fund bears a portion of the cost of certain resources shared with DMC, including the cost of internal personnel of DMC and/or its affiliates that provide legal, tax, and regulatory reporting services to the Fund. For the year ended December 31, 2020, the Fund was charged $12,727 for internal legal, tax, and regulatory reporting services provided by DMC and/or its affiliates’ employees. This amount is included on the “Statement of operations” under “Legal fees.”
For the year ended December 31, 2020, DDLP earned $1,209 for commissions on sales of the Fund’s Class A shares. For the year ended December 31, 2020, DDLP received gross CDSC commissions of $792 on redemptions of the Fund’s Class C shares and these commissions were entirely used to offset upfront commissions previously paid by DDLP to broker/dealers on sales of those shares.
Trustees’ fees include expenses accrued by the Fund for each Trustee’s retainer and meeting fees. Certain officers of DMC, DIFSC, and DDLP are officers and/or Trustees of the Trust. These officers and Trustees are paid no compensation by the Fund.
In addition to the management fees and other expenses of the Fund, the Fund indirectly bears the investment management fees and other expenses of the investment companies (Underlying Funds) in which it invests. The amount of these fees and expenses incurred indirectly by the Fund will vary based upon the expense and fee levels of the Underlying Funds and the number of shares that are owned of the Underlying Funds at different times.
____________________
50
| * | The aggregate contractual waiver period covering this report is from May 1, 2019 through April 30, 2021 for all classes. |
| ** | The aggregate contractual waiver period covering this report is from May 1, 2019 through April 30, 2021. |
3. Investments
For the year ended December 31, 2020, the Fund made purchases and sales of investment securities other than short-term investments as follows:
| Purchases other than US government securities | | $231,828,834 |
| Purchases of US government securities | | 694,737,487 |
| Sales other than US government securities | | 248,487,083 |
| Sales of US government securities | | 660,540,027 |
The tax cost of investments includes adjustments to net unrealized appreciation (depreciation) which may not necessarily be the final tax cost basis adjustments, but approximate the tax basis unrealized gains and losses that may be realized and distributed to shareholders. At December 31, 2020, the cost and unrealized appreciation (depreciation) of investments and derivatives for federal income tax purposes for the Fund as follows:
| Cost of investments and derivatives | $ | 438,504,703 | |
| Aggregate unrealized appreciation of investments and derivatives | $ | 7,569,775 | |
| Aggregate unrealized depreciation of investments and derivatives | | (1,051,607 | ) |
| Net unrealized appreciation of investments and derivatives | $ | 6,518,168 | |
US GAAP defines fair value as the price that the Fund would receive to sell an asset or pay to transfer a liability in an orderly transaction between market participants at the measurement date under current market conditions. A three-level hierarchy for fair value measurements has been established based upon the transparency of inputs to the valuation of an asset or liability. Inputs may be observable or unobservable and refer broadly to the assumptions that market participants would use in pricing the asset or liability. Observable inputs reflect the assumptions market participants would use in pricing the asset or liability based on market data obtained from sources independent of the reporting entity. Unobservable inputs reflect the reporting entity’s own assumptions about the assumptions that market participants would use in pricing the asset or liability based on the best information available under the circumstances. The Fund’s investment in its entirety is assigned a level based upon the observability of the inputs which are significant to the overall valuation. The three-level hierarchy of inputs is summarized as follows:
| Level 1 – | Inputs are quoted prices in active markets for identical investments. (Examples: equity securities, open-end investment companies, futures contracts, and exchange-traded options contracts) |
| | |
| Level 2 – | Other observable inputs, including, but not limited to: quoted prices for similar assets or liabilities in markets that are active, quoted prices for identical or similar assets or liabilities in |
51
Notes to financial statements
Delaware Limited-Term Diversified Income Fund
3. Investments (continued)
| markets that are not active, inputs other than quoted prices that are observable for the assets or liabilities (such as interest rates, yield curves, volatilities, prepayment speeds, loss severities, credit risks, and default rates) or other market-corroborated inputs. (Examples: debt securities, government securities, swap contracts, foreign currency exchange contracts, foreign securities utilizing international fair value pricing, broker-quoted securities, and fair valued securities) |
| | |
| Level 3 – | Significant unobservable inputs, including the Fund’s own assumptions used to determine the fair value of investments. (Examples: broker-quoted securities and fair valued securities) |
Level 3 investments are valued using significant unobservable inputs. The Fund may also use an income-based valuation approach in which the anticipated future cash flows of the investment are discounted to calculate fair value. Discounts may also be applied due to the nature or duration of any restrictions on the disposition of the investments. Valuations may also be based upon current market prices of securities that are comparable in coupon, rating, maturity, and industry. The derived value of a Level 3 investment may not represent the value which is received upon disposition and this could impact the results of operations.
The following table summarizes the valuation of the Fund’s investments by fair value hierarchy levels as of December 31, 2020:
| | | Level 1 | | | Level 2 | | | Total |
| Securities | | | | | | | | | |
| Assets: | | | | | | | | | |
| Agency Asset-Backed Securities | | $ | — | | $ | 3,823 | | $ | 3,823 |
| Agency Collateralized Mortgage Obligations | | | — | | | 9,532,318 | | | 9,532,318 |
| Agency Commercial Mortgage-Backed Securities | | | — | | | 1,331,835 | | | 1,331,835 |
| Agency Mortgage-Backed Securities | | | — | | | 56,285,822 | | | 56,285,822 |
| Collateralized Debt Obligations | | | — | | | 30,683,116 | | | 30,683,116 |
| Convertible Bond | | | — | | | 39,068 | | | 39,068 |
| Corporate Bonds | | | — | | | 202,060,740 | | | 202,060,740 |
| Loan Agreements | | | — | | | 1,334,028 | | | 1,334,028 |
| Non-Agency Asset-Backed Securities | | | — | | | 35,964,317 | | | 35,964,317 |
| Non-Agency Collateralized Mortgage Obligations | | | — | | | 2,060,172 | | | 2,060,172 |
| Non-Agency Commercial Mortgage-Backed Securities | | | — | | | 5,421,202 | | | 5,421,202 |
| Preferred Stock | | | — | | | 1,474,442 | | | 1,474,442 |
| Sovereign Bonds | | | — | | | 13,933,169 | | | 13,933,169 |
| Supranational Bank | | | — | | | 508,520 | | | 508,520 |
| US Treasury Obligations | | | — | | | 71,673,670 | | | 71,673,670 |
| Short-Term Investments | | | 12,790,268 | | | — | | | 12,790,268 |
| Total Value of Securities | | $ | 12,790,268 | | $ | 432,306,242 | | $ | 445,096,510 |
| | | | | | | | | | |
Derivatives1 | | | | | | | | | | |
52
| | Level 1 | | Level 2 | | Total |
| Liabilities: | | | | | | | | | | | | | |
| Foreign Currency Exchange Contracts | | $ | — | | | $ | (70,147 | ) | | $ | (70,147 | ) |
| Futures Contracts | | | (3,492 | ) | | | — | | | | (3,492 | ) |
| 1 | Foreign currency exchange contracts and futures contracts are valued at the unrealized appreciation (depreciation) on the instrument at the year end. |
During the year ended December 31, 2020, there were no transfers into or out of Level 3 investments. The Fund’s policy is to recognize transfers into or out of Level 3 investments based on fair value at the beginning of the reporting period.
A reconciliation of Level 3 investments is presented when the Fund has a significant amount of Level 3 investments at the beginning, interim, or end of the year in relation to the Fund’s net assets. During the year ended November 30, 2020, there were no Level 3 investments.
4. Dividend and Distribution Information
Income and long-term capital gain distributions are determined in accordance with federal income tax regulations, which may differ from US GAAP. Additionally, distributions from net gains on foreign currency transactions and net short-term gains on sales of investment securities are treated as ordinary income for federal income tax purposes. The tax character of dividends and distributions paid during the years ended December 31, 2020 and 2019 was as follows:
| | Year ended |
| | 12/31/20 | | 12/31/19 |
| Ordinary income | | $ | 7,333,503 | | $ | 11,254,566 |
| Return of capital | | | 1,444,686 | | | 1,616,896 |
| Total | | $ | 8,778,189 | | $ | 12,871,462 |
5. Components of Net Assets on a Tax Basis
As of December 31, 2020, the components of net assets on a tax basis were as follows:
| Shares of beneficial interest | | $ | 470,779,336 | |
| Qualified late year loss deferrals | | | (58,030 | ) |
| Distributions payable | | | (163,950 | ) |
| Capital loss carryforwards | | | (37,958,398 | ) |
| Unrealized appreciation (depreciation) of investments and foreign currencies | | | 6,518,168 | |
| Net assets | | $ | 439,117,126 | |
The differences between book basis and tax basis components of net assets are primarily attributable to tax deferral of losses on wash sales, tax deferral on straddle losses, mark-to-market of foreign currency exchange contracts, mark-to-market of futures contracts, and tax treatment of market discount and premium on debt instruments.
53
Notes to financial statements
Delaware Limited-Term Diversified Income Fund
5. Components of Net Assets on a Tax Basis (continued)
Qualified late year losses represent losses realized on investment transactions from November 1, 2020 through December 31, 2020 that, in accordance with federal income tax regulations, the Fund has elected to defer and treat as having arisen in the following fiscal year.
For financial reporting purposes, capital accounts are adjusted to reflect the tax character of permanent book/tax differences. Results of operations and net assets were not affected by these reclassifications. For the year ended December 31, 2020, the Fund had no reclassifications.
For federal income tax purposes, capital loss carryforwards may be carried forward and applied against future capital gains. At December 31, 2020, the fund utilized $4,768,873, respectively.
The Fund has capital loss carryforwards available to offset future realized capital gains as follows:
| | Loss carryforward character | | |
| | Short-term | | Long-term | | Total |
| | $14,029,105 | | $23,929,293 | | $37,958,398 |
54
6. Capital Shares
Transactions in capital shares were as follows:
| | Year ended |
| | 12/31/20 | | 12/31/19 |
| Shares sold: | | | | | | |
| Class A | | 10,183,253 | | | 4,503,964 | |
| Class C | | 561,625 | | | 660,861 | |
| Class R | | 39,184 | | | 62,094 | |
| Institutional Class | | 13,501,343 | | | 14,608,756 | |
| Class R6 | | 356,405 | | | 260,643 | |
| | | | | | | |
| Shares issued upon reinvestment of dividends and distributions: | | | | | | |
| Class A | | 324,079 | | | 469,761 | |
| Class C | | 42,180 | | | 114,873 | |
| Class R | | 2,531 | | | 6,328 | |
| Institutional Class | | 571,627 | | | 812,809 | |
| Class R6 | | 10,920 | | | 8,176 | |
| | | 25,593,147 | | | 21,508,265 | |
| | | | | | | |
| Shares redeemed: | | | | | | |
| Class A | | (9,612,472 | ) | | (8,954,747 | ) |
| Class C | | (2,401,714 | ) | | (4,208,592 | ) |
| Class R | | (121,390 | ) | | (214,824 | ) |
| Institutional Class | | (13,123,875 | ) | | (14,800,280 | ) |
| Class R6 | | (186,711 | ) | | (99,260 | ) |
| | (25,446,162 | ) | | (28,277,703 | ) |
| Net increase (decrease) | | 146,985 | | | (6,769,438 | ) |
Certain shareholders may exchange shares of one class for shares of another class in the same Fund. These exchange transactions are included as subscriptions and redemptions in the table above and on the “Statements of changes in net assets.” For the years ended December 31, 2020 and 2019, the Fund had the following exchange transactions:
| | Exchange Redemptions | | Exchange Subscriptions | | |
| | | | | | | | Institutional | | |
| | Class A | | Class C | | Class A | | Class | | |
| | Shares | | Shares | | Shares | | Shares | | Value |
| Year ended | | | | | | | | | | |
| 12/31/20 | | 33,289 | | 71,750 | | 70,157 | | 34,898 | | $875,844 |
| Year ended | | | | | | | | | | |
| 12/31/19 | | 16,248 | | 67,900 | | 66,237 | | 17,926 | | 695,642 |
55
Notes to financial statements
Delaware Limited-Term Diversified Income Fund
7. Line of Credit
The Fund, along with certain other funds in the Delaware Funds (Participants), was a participant in a $250,000,000 revolving line of credit (Agreement) intended to be used for temporary or emergency purposes as an additional source of liquidity to fund redemptions of investor shares. The Agreement was increased to $275,000,000 on May 6, 2020. Under the Agreement, the Participants were charged an annual commitment fee of 0.15%, which was allocated across the Participants based on a weighted average of the respective net assets of each Participant. The Participants were permitted to borrow up to a maximum of one-third of their net assets under the Agreement. Each Participant was individually, and not jointly, liable for its particular advances, if any, under the line of credit. The line of credit available under the Agreement expired on November 2, 2020.
On November 2, 2020, the Fund, along with the other Participants entered into an amendment to the Agreement for an amount of $225,000,000 to be used as described above. It operates in substantially the same manner as the original Agreement with the addition of an upfront fee of 0.05%, which was allocated across the Participants. The line of credit available under the Agreement expires on November 1, 2021.
The Fund had no amounts outstanding as of December 31, 2020, or at any time during the year then ended.
8. Derivatives
US GAAP requires disclosures that enable investors to understand: (1) how and why an entity uses derivatives; (2) how they are accounted for; and (3) how they affect an entity’s results of operations and financial position.
Foreign Currency Exchange Contracts — The Fund may enter into foreign currency exchange contracts and foreign cross currency exchange contracts as a way of managing foreign exchange rate risk. The Fund may enter into these contracts to fix the US dollar value of a security that it has agreed to buy or sell for the period between the date the trade was entered into and the date the security is delivered and paid for. The Fund may also enter into these contracts to hedge the US dollar value of securities it already owns that are denominated in foreign currencies. In addition, the Fund may enter into these contracts to facilitate or expedite the settlement of portfolio transactions. The change in value is recorded as an unrealized gain or loss. When the contract is closed, a realized gain or loss is recorded equal to the difference between the value of the contract at the time it was opened and the value at the time it was closed.
The use of foreign currency exchange contracts and foreign cross currency exchange contracts does not eliminate fluctuations in the underlying prices of the securities, but does establish a rate of exchange that can be achieved in the future. Although foreign currency exchange contracts and foreign cross currency exchange contracts limit the risk of loss due to an unfavorable change in the value of the hedged currency, they also limit any potential gain that might result should the value of the currency change favorably. In addition, the Fund could be exposed to risks if the counterparties to the contracts are unable to meet the terms of their contracts. The Fund’s maximum risk of loss from counterparty credit risk is the value of its currency exchanged with the counterparty. The risk is generally mitigated by having
56
a netting arrangement between the Fund and the counterparty and by the posting of collateral by the counterparty to the Fund to cover the Fund’s exposure to the counterparty. At December 31, 2020, the Fund posted $110,000 in cash collateral for open foreign currency exchange contracts, which is included in “Cash collateral due from brokers” on the “Statement of assets and liabilities”.
During the year ended December 31, 2020, the Fund entered into foreign currency exchange contracts to hedge the US dollar value of securities it already owns that are denominated in foreign currencies to increase/decrease exposure to foreign currencies.
Futures Contracts — A futures contract is an agreement in which the writer (or seller) of the contract agrees to deliver to the buyer an amount of cash or securities equal to a specific dollar amount times the difference between the value of a specific security or index at the close of the last trading day of the contract and the price at which the agreement is made. The Fund may use futures contracts in the normal course of pursuing its investment objective. The Fund may invest in futures contracts to hedge its existing portfolio securities against fluctuations in value caused by changes in interest rates or market conditions. Upon entering into a futures contract, the Fund deposits cash or pledges US government securities to a broker, equal to the minimum “initial margin” requirements of the exchange on which the contract is traded. Subsequent payments are received from the broker or paid to the broker each day, based on the daily fluctuation in the market value of the contract. These receipts or payments are known as “variation margin” and are recorded daily by the Fund as unrealized gains or losses until the contracts are closed. When the contracts are closed, the Fund records a realized gain or loss equal to the difference between the value of the contract at the time it was opened and the value at the time it was closed. Risks of entering into futures contracts include potential imperfect correlation between the futures contracts and the underlying securities and the possibility of an illiquid secondary market for these instruments. When investing in futures, there is reduced counterparty credit risk to the Fund because futures are exchange-traded and the exchange’s clearinghouse, as counterparty to all exchange-traded futures, guarantees against default. At December 31, 2020, the Fund posted $33,880 in cash collateral as margin for open futures contracts, which is included in “Cash collateral due from brokers” on the “Statement of assets and liabilities.”
During the year ended December 31, 2020, the Fund entered into futures contracts to hedge the Fund’s existing portfolio securities against fluctuations in value caused by changes in interest rates or market conditions.
Swap Contracts — The Fund may enter into CDS contracts in the normal course of pursuing its investment objective. The Fund may enter into CDS contracts in order to hedge against a credit event, to enhance total return, or to gain exposure to certain securities or markets. The Fund will not be permitted to enter into any swap transactions unless, at the time of entering into such transactions, the unsecured long-term debt of the actual counterparty, combined with any credit enhancements, is rated at least BBB- by Standard & Poor’s Financial Services LLC (S&P) or Baa3 by Moody’s Investors Service, Inc. (Moody’s) or is determined to be of equivalent credit quality by DMC.
Credit Default Swaps. A CDS contract is a risk-transfer instrument through which one party (purchaser of protection) transfers to another party (seller of protection) the financial risk of a credit event (as defined in the CDS agreement), as it relates to a particular reference security or basket of securities (such as an
57
Notes to financial statements
Delaware Limited-Term Diversified Income Fund
8. Derivatives (continued)
index). In exchange for the protection offered by the seller of protection, the purchaser of protection agrees to pay the seller of protection a periodic amount at a stated rate that is applied to the notional amount of the CDS contract. In addition, an upfront payment may be made or received by the Fund in connection with an unwinding or assignment of a CDS contract. Upon the occurrence of a credit event, the seller of protection would pay the par (or other agreed-upon) value of the reference security (or basket of securities) to the counterparty. Credit events generally include, among others, bankruptcy, failure to pay, and obligation default.
During the year ended December 31, 2020, the Fund entered into CDS contracts as a purchaser of protection. Periodic payments (receipts) on such contracts are accrued daily and recorded as unrealized losses (gains) on swap contracts. Upon payment (receipt), such amounts are recorded as realized losses (gains) on swap contracts. Upfront payments made or received in connection with CDS contracts are amortized over the expected life of the CDS contracts as unrealized losses (gains) on swap contracts. The change in value of CDS contracts is recorded daily as unrealized appreciation or depreciation. A realized gain or loss is recorded upon a credit event (as defined in the CDS agreement) or the maturity or termination of the agreement. Initial margin and variation margin are posted to central counterparties for centrally cleared CDS basket trades, as determined by the applicable central counterparty. During the year ended December 31, 2020, the Fund did not enter into any CDS contracts as a seller of protection.
CDS contracts may involve greater risks than if the Fund had invested in the reference obligation directly. CDS contracts are subject to general market risk, liquidity risk, counterparty risk, and credit risk. The Fund’s maximum risk of loss from counterparty credit risk, either as the seller of protection or the buyer of protection, is the fair value of the contract. This risk is mitigated by (1) for bilateral swap contracts, having a netting arrangement between the Fund and the counterparty and by the posting of collateral by the counterparty to the Fund to cover the Fund’s exposure to the counterparty, and (2) for cleared swaps, trading these instruments through a central counterparty.
During the year ended December 31, 2020, the Fund used CDS contracts to hedge against credit events.
Swaps Generally. For centrally cleared swaps, payments are received from the broker or paid to the broker each day, based on the daily fluctuation in the market value of the contract. These receipts or payments are known as “variation margin” and are recorded by the Fund as unrealized gains or losses until the contracts are closed. When the contracts are closed, the Fund records a realized gain or loss equal to the difference between the value of the contract at the time it was opened and the value at the time it was closed. The value of open swaps may differ from that which would be realized in the event the Fund terminated its position in the contract on a given day. Risks of entering into these contracts include the potential inability of the counterparty to meet the terms of the contracts. This type of risk is generally limited to the amount of favorable movement in the value of the underlying security, instrument, or basket of instruments, if any, at the day of default. Risks also arise from potential losses from adverse market movements and such losses could exceed the unrealized amounts shown on the “Schedule of investments.”
58
Fair values of derivative instruments as of December 31, 2020 were as follows:
| | Liability Derivatives Fair Value | | | | |
| | | | | | | | Interest | | | | |
| Statement of Assets and | | Currency | | Rate | | | | |
| Liabilities Location | | Contracts | | Contracts | | Total |
| Unrealized depreciation on | | | | | | | | | | | | | | | | |
| foreign currency | | | | | | | | | | | | | | | | |
| exchange contracts | | | $ | (70,147 | ) | | | | $ | — | | | | $ | (70,147 | ) |
| Variation margin due to | | | | | | | | | | | | | | | | |
| broker on futures | | | | | | | | | | | | | | | | |
| contracts* | | | | — | | | | | | (3,492 | ) | | | | (3,492 | ) |
| Total | | | $ | (70,147 | ) | | | | $ | (3,492 | ) | | | $ | (73,639 | ) |
| * | Includes cumulative appreciation (depreciation) of futures contracts from the date the contracts were opened through December 31, 2020. Only current day variation margin is reported on the “Statement of assets and liabilities.” |
The effect of derivative instruments on the “Statement of operations” for the year ended December 31, 2020 was as follows:
| | Net Realized Gain (Loss) on: | | | | |
| | Foreign | | | | | | | | | | | |
| | Currency | | | | | | | | | | | |
| | Exchange | | Futures | | Swap | | | | |
| | Contracts | | Contracts | | Contracts | | Total |
| Currency contracts | | $ | (15,537 | ) | | $ | — | | | $ | — | | $ | (15,537 | ) |
| Interest rate contracts | | | — | | | | (1,360,629 | ) | | | — | | | (1,360,629 | ) |
| Credit contracts | | | — | | | | — | | | | 558,412 | | | 558,412 | |
| Total | | $ | (15,537 | ) | | $ | (1,360,629 | ) | | $ | 558,412 | | $ | (817,754 | ) |
| | Net Change in Unrealized Appreciation (Depreciation) of: | | | | |
| | Foreign | | | | | | | | | | |
| | Currency | | | | | | | | | | |
| | Exchange | | Futures | | Swap | | | | |
| | Contracts | | Contracts | | Contracts | | Total |
| Currency contracts | | | $ | (70,147 | ) | | | $ | — | | $ | — | | $ | (70,147 | ) |
| Interest rate contracts | | | | — | | | | | 32,010 | | | — | | | 32,010 | |
| Credit contracts | | | | — | | | | | — | | | 1,201,546 | | | 1,201,546 | |
| Total | | | $ | (70,147 | ) | | | $ | 32,010 | | $ | 1,201,546 | | $ | 1,163,409 | |
59
Notes to financial statements
Delaware Limited-Term Diversified Income Fund
8. Derivatives (continued)
The table below summarizes the average balance of derivative holdings by the Fund during the year ended December 31, 2020:
| | Long Derivative | | Short Derivative |
| | Volume | | Volume |
| Foreign currency exchange | | | | | | |
| contracts (average | | | | | | |
| notional value) | | $ | 45,157 | | $ | 677,673 |
| Futures contracts (average | | | | | | |
| notional value) | | | 1,708,884 | | | 7,776,066 |
| CDS contracts (average | | | | | | |
| notional value)* | | | 4,703,755 | | | — |
| * | Long represents buying protection and short represents selling protection. |
9. Offsetting
The Fund entered into an International Swaps and Derivatives Association, Inc. Master Agreement (ISDA Master Agreement) or a similar agreement with certain of its derivative contract counterparties in order to better define its contractual rights and to secure rights that will help the Fund mitigate its counterparty risk. An ISDA Master Agreement is a bilateral agreement between the Fund and a counterparty that governs over-the-counter (OTC) derivatives and foreign exchange contracts and typically contains, among other things, collateral posting items and netting provisions in the event of a default and/or termination event. Under an ISDA Master Agreement, the Fund may, under certain circumstances, offset with the counterparty certain derivative financial instruments’ payables and/or receivables with collateral held and/or posted and create one single net payment. The provisions of the ISDA Master Agreement typically permit a single net payment in the event of default (close-out), including the bankruptcy or insolvency of the counterparty. However, bankruptcy or insolvency laws of a particular jurisdiction may impose restrictions on or prohibitions against the right of offset in bankruptcy, insolvency, or other events.
For financial reporting purposes, the Fund does not offset derivative assets and derivative liabilities that are subject to netting arrangements on the “Statement of assets and liabilities.”
60
At December 31, 2020, the Fund had the following assets and liabilities subject to offsetting provisions:
Offsetting of Financial Assets and Liabilities and Derivative Assets and Liabilities
| | Gross Value of | | Gross Value of | | |
| Counterparty | | Derivative Asset | | Derivative Liability | | Net Position |
| TD Bank | | $— | | $(70,147) | | $(70,147) |
| | | | Fair Value of | | | | Fair Value of | | | | |
| | | | Non-Cash | | Cash Collateral | | Non-Cash | | Cash Collateral | | |
| Counterparty | | Net Position | | Collateral Received | | Received | | Collateral Pledged | | Pledged(a) | | Net Exposure(b) |
| TD Bank | | $(70,147) | | $— | | $— | | $— | | $70,147 | | $— |
| (a) | The value of the related collateral exceeded the value of the derivatives as of December 31, 2020, as applicable. |
| (b) | Net exposure represents the receivable (payable) that would be due from (to) the counterparty in the event of default. |
10. Securities Lending
The Fund, along with other funds in the Delaware Funds, may lend its securities pursuant to a security lending agreement (Lending Agreement) with The Bank of New York Mellon (BNY Mellon). At the time a security is loaned, the borrower must post collateral equal to the required percentage of the market value of the loaned security, including any accrued interest. The required percentage is: (1) 102% with respect to US securities and foreign securities that are denominated and payable in US dollars; and (2) 105% with respect to foreign securities. With respect to each loan, if on any business day, the aggregate market value of securities collateral plus cash collateral held is less than the aggregate market value of the securities which are the subject of such loan, the borrower will be notified to provide additional collateral by the end of the following business day, which, together with the collateral already held, will be not less than the applicable initial collateral requirements for such security loan. If the aggregate market value of securities collateral and cash collateral held with respect to a security loan exceeds the applicable initial collateral requirement, upon the request of the borrower, BNY Mellon must return enough collateral to the borrower by the end of the following business day to reduce the value of the remaining collateral to the applicable initial collateral requirement for such security loan. As a result of the foregoing, the value of the collateral held with respect to a loaned security on any particular day, may be more or less than the value of the security on loan. The collateral percentage with respect to the market value of the loaned security is determined by the security lending agent.
Cash collateral received by each fund of the Trust is generally invested in a series of individual separate accounts, each corresponding to a fund. The investment guidelines permit each separate account to hold certain securities that would be considered eligible securities for a money market fund. Cash collateral received is generally invested in government securities; certain obligations issued by government sponsored enterprises; repurchase agreements collateralized by US Treasury securities; obligations issued by the central government of any Organization for Economic Cooperation and Development (OECD) country or its agencies, instrumentalities, or establishments; obligations of supranational organizations; commercial paper, notes, bonds, and other debt obligations; certificates of
61
Notes to financial statements
Delaware Limited-Term Diversified Income Fund
10. Securities Lending (continued)
deposit, time deposits, and other bank obligations; and asset-backed securities. A fund can also accept US government securities and letters of credit (non-cash collateral) in connection with securities loans.
In the event of default or bankruptcy by the lending agent, realization and/or retention of the collateral may be subject to legal proceedings. In the event the borrower fails to return loaned securities and the collateral received is insufficient to cover the value of the loaned securities and provided such collateral shortfall is not the result of investment losses, the lending agent has agreed to pay the amount of the shortfall to the Fund or, at the discretion of the lending agent, replace the loaned securities. The Fund continues to record dividends or interest, as applicable, on the securities loaned and is subject to changes in value of the securities loaned that may occur during the term of the loan. The Fund has the right under the Lending Agreement to recover the securities from the borrower on demand. With respect to security loans collateralized by non-cash collateral, the Fund receives loan premiums paid by the borrower. With respect to security loans collateralized by cash collateral, the earnings from the collateral investments are shared among the Fund, the security lending agent, and the borrower. The Fund records security lending income net of allocations to the security lending agent and the borrower.
The Fund may incur investment losses as a result of investing securities lending collateral. This could occur if an investment in the collateral investment account defaulted or became impaired. Under those circumstances, the value of the Fund’s cash collateral account may be less than the amount the Fund would be required to return to the borrowers of the securities and the Fund would be required to make up for this shortfall.
During the year ended December 31, 2020, the Fund had no securities out on loan.
11. Credit and Market Risk
Beginning in January 2020, global financial markets have experienced and may continue to experience significant volatility resulting from the spread of a novel coronavirus known as COVID-19. The outbreak of COVID-19 has resulted in travel and border restrictions, quarantines, supply chain disruptions, lower consumer demand, and general market uncertainty. The effects of COVID-19 have and may continue to adversely affect the global economy, the economies of certain nations, and individual issuers, all of which may negatively impact the Fund’s performance.
When interest rates rise, fixed income securities (i.e. debt obligations) generally will decline in value. These declines in value are greater for fixed income securities with longer maturities or durations.
IBOR is the risk that changes related to the use of the London interbank offered rate (LIBOR) and other interbank offered rate (collectively, “IBORs”) could have adverse impacts on financial instruments that reference LIBOR (or the corresponding IBOR). The abandonment of LIBOR could affect the value and liquidity of instruments that reference LIBOR. The use of alternative reference rate products may impact investment strategy performance. These risks may also apply with respect to changes in connection with other IBORs, such as the euro overnight index average (EONIA), which are also the subject of recent reform.
62
Some countries in which the Fund may invest require governmental approval for the repatriation of investment income, capital, or the proceeds of sales of securities by foreign investors. In addition, if there is deterioration in a country’s balance of payments or for other reasons, a country may impose temporary restrictions on foreign capital remittances abroad.
The securities exchanges of certain foreign markets are substantially smaller, less liquid, and more volatile than the major securities markets in the US. Consequently, acquisition and disposition of securities by the Fund may be inhibited. In addition, a significant portion of the aggregate market value of equity securities listed on the major securities exchanges in emerging markets is held by a smaller number of investors. This may limit the number of shares available for acquisition or disposition by the Fund.
The Fund invests a portion of its assets in high-yield fixed income securities, which are securities rated lower than BBB- by S&P and Baa3 by Moody’s, or similarly rated by another nationally recognized statistical rating organization. Investments in these higher yielding securities are generally accompanied by a greater degree of credit risk than higher rated securities. Additionally, lower rated securities may be more susceptible to adverse economic and competitive industry conditions than investment grade securities.
The Fund invests in fixed income securities whose value is derived from an underlying pool of mortgages or consumer loans. The value of these securities is sensitive to changes in economic conditions, including delinquencies and/or defaults, and may be adversely affected by shifts in the market’s perception of the issuers and changes in interest rates. Investors receive principal and interest payments as the underlying mortgages and consumer loans are paid back. Some of these securities are collateralized mortgage obligations (CMOs). CMOs are debt securities issued by US government agencies or by financial institutions and other mortgage lenders, which are collateralized by a pool of mortgages held under an indenture. Prepayment of mortgages may shorten the stated maturity of the obligations and can result in a loss of premium, if any has been paid. Certain of these securities may be stripped (securities which provide only the principal or interest feature of the underlying security). The yield to maturity on an interest-only CMO is extremely sensitive not only to changes in prevailing interest rates, but also to the rate of principal payments (including prepayments) on the related underlying mortgage assets. A rapid rate of principal payments may have a material adverse effect on the Fund’s yield to maturity. If the underlying mortgage assets experience greater than anticipated prepayments of principal, the Fund may fail to fully recoup its initial investment in these securities even if the securities are rated in the highest rating categories.
The Fund invests in certain obligations that may have liquidity protection designed to ensure that the receipt of payments due on the underlying security is timely. Such protection may be provided through guarantees, insurance policies, or letters of credit obtained by the issuer or sponsor through third parties, through various means of structuring the transaction, or through a combination of such approaches. The Fund will not pay any additional fees for such credit support, although the existence of credit support may increase the price of the security.
The Fund invests in bank loans and other securities that may subject it to direct indebtedness risk, the risk that the Fund will not receive payment of principal, interest, and other amounts due in connection
63
Notes to financial statements
Delaware Limited-Term Diversified Income Fund
11. Credit and Market Risk (continued)
with these investments and will depend primarily on the financial condition of the borrower. Loans that are fully secured offer the Fund more protection than unsecured loans in the event of nonpayment of scheduled interest or principal, although there is no assurance that the liquidation of collateral from a secured loan would satisfy the corporate borrower’s obligation, or that the collateral can be liquidated. Some loans or claims may be in default at the time of purchase. Certain of the loans and the other direct indebtedness acquired by the Fund may involve revolving credit facilities or other standby financing commitments that obligate the Fund to pay additional cash on a certain date or on demand. These commitments may require the Fund to increase its investment in a company at a time when the Fund might not otherwise decide to do so (including at a time when the company’s financial condition makes it unlikely that such amounts will be repaid). To the extent that the Fund is committed to advance additional funds, it will at all times hold and maintain cash or other high-grade debt obligations in an amount sufficient to meet such commitments. When a loan agreement is purchased, the Fund may pay an assignment fee. On an ongoing basis, the Fund may receive a commitment fee based on the undrawn portion of the underlying line of credit portion of a loan agreement. Prepayment penalty fees are received upon the prepayment of a loan agreement by the borrower. Prepayment penalty, facility, commitment, consent, and amendment fees are recorded to income as earned or paid.
As the Fund may be required to rely upon another lending institution to collect and pass on to the Fund amounts payable with respect to the loan and to enforce the Fund’s rights under the loan and other direct indebtedness, an insolvency, bankruptcy, or reorganization of the lending institution may delay or prevent the Fund from receiving such amounts. The highly leveraged nature of many loans may make them especially vulnerable to adverse changes in economic or market conditions. Investments in such loans and other direct indebtedness may involve additional risk to the Fund.
The Fund may invest up to 15% of its net assets in illiquid securities, which may include securities with contractual restrictions on resale, securities exempt from registration under Rule 144A promulgated under the Securities Act of 1933, as amended, and other securities which may not be readily marketable. The relative illiquidity of these securities may impair the Fund from disposing of them in a timely manner and at a fair price when it is necessary or desirable to do so. While maintaining oversight, the Board has delegated to DMC the day-to-day functions of determining whether individual securities are liquid for purposes of the Fund’s limitation on investments in illiquid securities. Securities eligible for resale pursuant to Rule 144A, which are determined to be liquid, are not subject to the Fund’s 15% limit on investments in illiquid securities. Rule 144A securities have been identified on the “Schedule of investments.”
12. Contractual Obligations
The Fund enters into contracts in the normal course of business that contain a variety of indemnifications. The Fund’s maximum exposure under these arrangements is unknown. However, the Fund has not had prior claims or losses pursuant to these contracts. Management has reviewed the Fund’s existing contracts and expects the risk of loss to be remote.
64
13. Recent Accounting Pronouncements
In August 2018, the FASB issued an Accounting Standards Update (ASU), ASU 2018-13, which changes certain fair value measurement disclosure requirements. ASU 2018-13, in addition to other modifications and additions, removes the requirement to disclose the amount and reasons for transfers between Level 1 and Level 2 of the fair value hierarchy, the policy for the timing of transfers between levels and the valuation process for Level 3 fair value measurements. ASU 2018-13 is effective for fiscal years, and interim periods within those fiscal years, beginning after December 15, 2019. Management has implemented ASU 2018-13 on the financial statements.
In March 2020, FASB issued ASU 2020-04, Reference Rate Reform (Topic 848) – Facilitation of the Effects of Reference Rate Reform on Financial Reporting. The amendments in ASU 2020-04 provide optional temporary financial reporting relief from the effect of certain types of contract modifications due to the planned discontinuation of LIBOR and other interbank-offered based reference rates as of the end of 2021. ASU 2020-04 is effective for certain reference rate-related contract modifications that occur during the period March 12, 2020 through December 31, 2022. As of the financial reporting period, Management is evaluating the impact of applying this ASU.
14. Subsequent Events
Management has determined that no material events or transactions occurred subsequent to December 31, 2020, that would require recognition or disclosure in the Fund’s financial statements.
65
Report of independent
registered public accounting firm
To the Board of Trustees of Delaware Group® Limited-Term Government Funds and Shareholders of Delaware Limited-Term Diversified Income Fund
Opinion on the Financial Statements
We have audited the accompanying statement of assets and liabilities, including the schedule of investments, of Delaware Limited-Term Diversified Income Fund (one of the funds constituting the Delaware Group® Limited-Term Government Funds, referred to hereafter as the “Fund”) as of December 31, 2020, the related statement of operations for the year ended December 31, 2020, the statements of changes in net assets for each of the two years in the period ended December 31, 2020, including the related notes, and the financial highlights for each of the periods indicated therein (collectively referred to as the “financial statements”). In our opinion, the financial statements present fairly, in all material respects, the financial position of the Fund as of December 31, 2020, the results of its operations for the year then ended, the changes in its net assets for each of the two years in the period ended December 31, 2020 and the financial highlights for each of the periods indicated therein in conformity with accounting principles generally accepted in the United States of America.
Basis for Opinion
These financial statements are the responsibility of the Fund’s management. Our responsibility is to express an opinion on the Fund’s financial statements based on our audits. We are a public accounting firm registered with the Public Company Accounting Oversight Board (United States) (PCAOB) and are required to be independent with respect to the Fund in accordance with the U.S. federal securities laws and the applicable rules and regulations of the Securities and Exchange Commission and the PCAOB.
We conducted our audits of these financial statements in accordance with the standards of the PCAOB. Those standards require that we plan and perform the audit to obtain reasonable assurance about whether the financial statements are free of material misstatement, whether due to error or fraud.
Our audits included performing procedures to assess the risks of material misstatement of the financial statements, whether due to error or fraud, and performing procedures that respond to those risks. Such procedures included examining, on a test basis, evidence regarding the amounts and disclosures in the financial statements. Our audits also included evaluating the accounting principles used and significant estimates made by management, as well as evaluating the overall presentation of the financial statements. Our procedures included confirmation of securities owned as of December 31, 2020 by correspondence with the custodian, transfer agents and brokers; when replies were not received from brokers, we performed other auditing procedures. We believe that our audits provide a reasonable basis for our opinion.
/s/PricewaterhouseCoopers LLP
Philadelphia, Pennsylvania
February 17, 2021
We have served as the auditor of one or more investment companies in Delaware Funds® by Macquarie since 2010.
66
Other Fund information (Unaudited)
Delaware Limited-Term Diversified Income Fund
Tax Information
All disclosures are based on financial information available as of the date of this annual report and, accordingly are subject to change. For any and all items requiring reporting, it is the intention of the Fund to report the maximum amount permitted under the Internal Revenue Code and the regulations thereunder.
For the year ended December 31, 2020, the Fund reports distributions paid during the year as follows:
| (A) Ordinary Income Distributions (Tax Basis) | | 83.54% |
| (B) Return of Capital Distributions (Tax Basis) | | 16.46% |
| Total Distributions (Tax Basis) | | 100.00% |
____________________
(A) and (B) are based on a percentage of the Fund’s total distributions.
Board consideration of Investment Advisory and Sub-Advisory Agreements for Delaware Limited-Term Diversified Income Fund at a meeting held August 11-13, 2020
At a meeting held on August 11-13, 2020 (the “Annual Meeting”), the Board of Trustees (the “Board”), including a majority of disinterested or independent Trustees, approved the renewal of the Investment Advisory and Sub-Advisory Agreements for Delaware Limited-Term Diversified Income Fund (the “Fund”). In making its decision, the Board considered information furnished at regular quarterly Board meetings, including reports detailing Fund performance, investment strategies, and expenses, as well as information prepared specifically in connection with the renewal of the investment advisory and sub-advisory contracts. Information furnished specifically in connection with the renewal of the Investment Management Agreement with Delaware Management Company (“DMC”), a series of Macquarie Investment Management Business Trust (“MIMBT”) and the Sub-Advisory Agreements with Macquarie Investment Management Global Limited (“MIMGL”), Macquarie Investment Management Europe Limited (“MIMEL”), and Macquarie Investment Management Austria Kapitalanlage AG (“MIMAK”) (the “Sub-Advisers”), included materials provided by DMC and its affiliates (collectively, “Macquarie Investment Management”) concerning, among other things, the nature, extent, and quality of services provided to the Fund; the costs of such services to the Fund; economies of scale; and the investment manager’s financial condition and profitability. In addition, in connection with the Annual Meeting, materials were provided to the Trustees in May 2020, including reports provided by Broadridge Financial Solutions (“Broadridge”). The Broadridge reports compared the Fund’s investment performance and expenses with those of other comparable mutual funds. The Independent Trustees reviewed and discussed the Broadridge reports with independent legal counsel to the Independent Trustees. In addition to the information noted above, the Board also requested and received information regarding DMC’s policy with respect to advisory fee levels and its breakpoint philosophy; the structure of portfolio manager compensation; comparative client fee information; and any constraints or limitations on the availability of securities for certain investment styles, which had in the past year inhibited, or which were likely in the future to inhibit, the investment manager’s ability to invest fully in accordance with Fund policies.
In considering information relating to the approval of the Fund’s advisory and sub-advisory agreements, as applicable, the Independent Trustees received assistance and advice from and met separately with
67
Other Fund information (Unaudited)
Delaware Limited-Term Diversified Income Fund
Board consideration of Investment Advisory and Sub-Advisory Agreements for Delaware Limited-Term Diversified Income Fund at a meeting held August 11-13, 2020 (continued)
independent legal counsel to the Independent Trustees and also received assistance and advice from an experienced and knowledgeable independent fund consultant, JDL Consultants, LLC (“JDL”). Although the Board gave attention to all information furnished, the following discussion identifies, under separate headings, the primary factors taken into account by the Board during its contract renewal considerations.
Nature, extent, and quality of services. The Board considered the services provided by DMC to the Fund and its shareholders. In reviewing the nature, extent, and quality of services, the Board considered reports furnished to it throughout the year, which covered matters such as the relative performance of the Fund; compliance of portfolio managers with the investment policies, strategies, and restrictions for the Fund; compliance by DMC and Delaware Distributors, L.P. (together, “Management”) personnel with the Code of Ethics adopted throughout the Delaware Funds® by Macquarie (“Delaware Funds”); and adherence to fair value pricing procedures as established by the Board. The Board was pleased with the current staffing of DMC and the emphasis placed on research in the investment process. The Board recognized DMC’s receipt of certain favorable industry distinctions during the past several years. The Board gave favorable consideration to DMC’s efforts to control expenses while maintaining service levels committed to Fund matters. The Board also noted the benefits provided to Fund shareholders through (a) each shareholder’s ability to: (i) exchange an investment in one Delaware Fund for the same class of shares in another Delaware Fund without a sales charge, or (ii) reinvest Fund dividends into additional shares of the Fund or into additional shares of other Delaware Funds, and (b) the privilege to combine holdings in other Delaware Funds to obtain a reduced sales charge. The Board was satisfied with the nature, extent, and quality of the overall services provided by DMC.
Nature, extent, and quality of services. The Board considered the services provided by each Sub-Adviser to the Fund. In reviewing the nature, extent, and quality of services, the Board considered reports furnished to it throughout the year at regular Board Meetings covering matters such as relative performance of the Fund; compliance of portfolio managers with the investment policies, strategies, and restrictions for the Fund; the compliance of Sub-Adviser personnel with its Code of Ethics; and adherence to fair value pricing procedures as established by the Board. The Board was pleased with the current staffing of the Sub-Advisers and the emphasis placed on research in the investment process. The Board was satisfied with the nature, extent, and quality of the overall services provided by the Sub-Advisers.
Investment performance. The Board placed significant emphasis on the investment performance of the Fund in view of the importance of investment performance to shareholders. Although the Board considered performance reports and discussions with portfolio managers at Investment Committee meetings throughout the year, the Board gave particular weight to the Broadridge reports furnished for the Annual Meeting. The Broadridge reports prepared for the Fund showed the investment performance of its Class A shares in comparison to a group of similar funds as selected by Broadridge (the “Performance Universe”). A fund with the best performance ranked first, and a fund with the poorest performance ranked last. The highest/best performing 25% of funds in the Performance Universe make up the first quartile; the next 25%, the second quartile; the next 25%, the third quartile; and the poorest/worst performing 25% of funds in the Performance Universe make up the fourth quartile.
68
Comparative annualized performance for the Fund was shown for the past 1-, 3-, 5-, and 10-year periods, to the extent, applicable, ended January 31, 2020. The Board’s objective is that the Fund’s performance for the 1-, 3-, and 5-year periods be at or above the median of its Performance Universe.
The Performance Universe for the Fund consisted of the Fund and all retail and institutional short-intermediate investment-grade debt funds as selected by Broadridge. The Broadridge report comparison showed that the Fund’s total return for the 1- and 5-year periods was in the third quartile of its Performance Universe. The report further showed that the Fund’s total return for the 3- and 10-year periods was in the fourth quartile of its Performance Universe. The Board observed that the Fund’s performance results were not in line with the Board’s objective. In evaluating the Fund’s performance, the Board considered the numerous investment and performance reports delivered by Management personnel to the Board’s Investments Committee. The Board was satisfied that Management was taking action to improve Fund performance and to meet the Board’s performance objective.
Comparative expenses. The Board considered expense data for the Delaware Funds. Management provided the Board with information on pricing levels and fee structures for the Fund as of its most recently completed fiscal year. The Board also focused on the comparative analysis of effective management fees and total expense ratios of the Fund versus effective management fees and total expense ratios of a group of similar funds as selected by Broadridge (the “Expense Group”). In reviewing comparative costs, the Fund’s contractual management fee and the actual management fee incurred by the Fund were compared with the contractual management fees (assuming all funds in the Expense Group were similar in size to the Fund) and actual management fees (as reported by each fund) within the Expense Group, taking into account any applicable breakpoints and fee waivers. The Fund’s total expenses were also compared with those of its Expense Group. The Broadridge total expenses, for comparative consistency, were shown by Broadridge for Class A shares and comparative total expenses including 12b-1 and non-12b-1 service fees. The Board’s objective is for the Fund’s total expense ratio to be competitive with those of the peer funds within its Expense Group.
The expense comparisons for the Fund showed that its actual management fee and total expenses were in the quartile with lowest expenses of its Expense Group. The Board was satisfied with the management fee and total expenses of the Fund in comparison to those of its Expense Group as shown in the Broadridge report.
Management profitability. The Board considered the level of profits realized by DMC in connection with the operation of the Fund. In this respect, the Board reviewed the Investment Management Profitability Analysis that addressed the overall profitability of DMC’s business in providing management and other services to each of the individual funds and the Delaware Funds as a whole. Specific attention was given to the methodology used by DMC in allocating costs for the purpose of determining profitability. Management stated that the level of profits of DMC, to a certain extent, reflects recent operational cost savings and efficiencies initiated by DMC. The Board considered DMC’s efforts to improve services provided to Fund shareholders and to meet additional regulatory and compliance requirements resulting from recent industry-wide Securities and Exchange Commission initiatives. The Board also considered the extent to which DMC might derive ancillary benefits from fund operations, including the potential for procuring additional business as a result of the prestige and visibility associated with its role as service provider to the Delaware Funds and the benefits from allocation of fund brokerage to improve trading efficiencies. As part of its work, the Board also reviewed a report prepared by JDL regarding MIMBT
69
Other Fund information (Unaudited)
Delaware Limited-Term Diversified Income Fund
Board consideration of Investment Advisory and Sub-Advisory Agreements for Delaware Limited-Term Diversified Income Fund at a meeting held August 11-13, 2020 (continued)
profitability as compared to certain peer fund complexes and the Independent Trustees met with JDL personnel to discuss DMC’s profitability in such context. The Board found that the management fees were reasonable in light of the services rendered and the level of profitability of DMC.
Management profitability. Trustees were also given available information on profits being realized by each of the Sub-Advisers in relation to the services being provided to the Fund and in relation to the Sub-Adviser’s overall investment advisory business, but believed such information to be of limited relevance because the sub-advisory fees are paid by DMC out of its management fee, and changes in the level of sub-advisory fees have no impact on Fund expenses. The Board was also provided information on potential fall-out benefits derived or to be derived by the Sub-Advisers in connection with their relationship to the Fund, such as reputational enhancement, soft dollar arrangements, or commissions paid to affiliated broker/dealers, as applicable.
Economies of scale. The Trustees considered whether economies of scale are realized by DMC as the Fund’s assets increase and the extent to which any economies of scale are reflected in the level of management fees charged. The Trustees reviewed the Fund’s advisory fee pricing and structure, approved by the Board and shareholders, which includes breakpoints, and which applies to most funds in the Delaware Funds complex. Breakpoints in the advisory fee occur when the advisory fee rate is reduced on assets in excess of specified levels. Breakpoints result in a lower advisory fee than would otherwise be the case in the absence of breakpoints, when the asset levels specified in the breakpoints are exceeded. Although, as of March 31, 2020, the Fund had not reached a size at which it could take advantage of any breakpoints in the applicable fee schedule, the Board recognized that the fee was structured so that, if the Fund increases sufficiently in size, then economies of scale may be shared.
70
Board of trustees / directors and officers addendum
Delaware Funds® by Macquarie
A mutual fund is governed by a Board of Trustees/Directors (“Trustees”), which has oversight responsibility for the management of a fund’s business affairs. Trustees establish procedures and oversee and review the performance of the investment manager, the distributor, and others who perform services for the fund. The independent fund trustees, in particular, are advocates for shareholder interests. Each trustee has served in that capacity since he or she was elected to or appointed to the Board of Trustees, and will continue to serve until his or her retirement or the election of a new trustee in his or her place. The following is a list of the Trustees and Officers with certain background and related information.
| | | | | | | | Number of | | Other |
| | | | | | Principal | | Portfolios in Fund | | Directorships |
| Name, | | Position(s) | | | | Occupation(s) | | Complex Overseen | | Held by |
| Address, | | Held with | | Length of Time | | During the | | by Trustee | | Trustee |
| and Birth Date | | Fund(s) | | Served | | Past Five Years | | or Officer | | or Officer |
| Interested Trustee | | | | | | | | | | |
| | | | | | | | | | | |
| Shawn K. Lytle1 | | President, | | President and | | Global Head of Macquarie | | 85 | | Trustee — UBS Relationship |
| 610 Market Street | | Chief Executive | | Chief Executive | | Investment Management2 | | | | Funds, SMA Relationship Trust, |
| Philadelphia, PA | | Officer, | | Officer | | (January 2019–Present) | | | | and UBS Funds |
| 19106-2354 | | and Trustee | | since August 2015 | | Head of Americas of | | | | (May 2010–April 2015) |
| February 1970 | | | | Trustee since | | Macquarie Group | | | | |
| | | | September 2015 | | (December 2017–Present) | | | | |
| | | | | | Deputy Global Head of | | | | |
| | | | | | Macquarie Investment | | | | |
| | | | | | Management | | | | |
| | | | | | (2017–2019) | | | | |
| | | | | | Head of Macquarie Investment | | | | |
| | | | | | Management Americas | | | | |
| | | | | | (2015–2017) | | | | |
71
Board of trustees / directors and officers addendum
Delaware Funds® by Macquarie
| | | | | | | | Number of | | Other |
| | | | | | Principal | | Portfolios in Fund | | Directorships |
| Name, | | Position(s) | | | | Occupation(s) | | Complex Overseen | | Held by |
| Address, | | Held with | | Length of Time | | During the | | by Trustee | | Trustee |
| and Birth Date | | Fund(s) | | Served | | Past Five Years | | or Officer | | or Officer |
| Independent Trustees | | | | | | | | | | |
| | | | | | | | | | | |
| Jerome D. | | Trustee | | Since January 2019 | | Managing Member, Stonebrook | | 85 | | None |
| Abernathy | | | | | | Capital Management, LLC | | | | |
| 610 Market Street | | | | | | (financial technology: macro | | | | |
| Philadelphia, PA | | | | | | factors and databases) | | | | |
| 19106-2354 | | | | | | (January 1993-Present) | | | | |
| July 1959 | | | | | | | | | | |
| | | | | | | | | | | |
| Thomas L. Bennett | | Chair and Trustee | | Trustee since March | | Private Investor | | 85 | | None |
| 610 Market Street | | | | 2005 | | (March 2004–Present) | | | | |
| Philadelphia, PA | | | | Chair since March | | | | | | |
| 19106-2354 | | | | 2015 | | | | | | |
| October 1947 | | | | | | | | | | |
| | | | | | | | | | | |
| Ann D. Borowiec | | Trustee | | Since March 2015 | | Chief Executive Officer, Private | | 85 | | Director — Banco Santander |
| 610 Market Street | | | | | | Wealth Management | | | | International |
| Philadelphia, PA | | | | | | (2011–2013) and Market | | | | (October 2016–December 2019) |
| 19106-2354 | | | | | | Manager, New Jersey Private | | | | Director — Santander Bank, N.A. |
| November 1958 | | | | | | Bank (2005–2011) — J.P. | | | | (December 2016–December |
| | | | | | Morgan Chase & Co. | | | | 2019) |
72
| | | | | | | | Number of | | Other |
| | | | | | Principal | | Portfolios in Fund | | Directorships |
| Name, | | Position(s) | | | | Occupation(s) | | Complex Overseen | | Held by |
| Address, | | Held with | | Length of Time | | During the | | by Trustee | | Trustee |
| and Birth Date | | Fund(s) | | Served | | Past Five Years | | or Officer | | or Officer |
| | | | | | | | | | | |
| Joseph W. Chow | | Trustee | | Since January 2013 | | Private Investor | | 85 | | Director and Audit Committee |
| 610 Market Street | | | | | | (April 2011–Present) | | | | Member — Hercules Technology |
| Philadelphia, PA | | | | | | | | | | Growth Capital, Inc. |
| 19106-2354 | | | | | | | | | | (July 2004–July 2014) |
| January 1953 | | | | | | | | | | |
| | | | | | | | | | | |
| John A. Fry | | Trustee | | Since January 2001 | | President — Drexel University | | 85 | | Director; Compensation |
| 610 Market Street | | | | | | (August 2010–Present) | | | | Committee and Governance |
| Philadelphia, PA | | | | | | President — Franklin & Marshall | | | | Committee Member — |
| 19106-2354 | | | | | | College (July 2002–June 2010) | | | | Community Health Systems |
| May 1960 | | | | | | | | | | (May 2004–Present) |
| | | | | | | | | | Director — Drexel Morgan & Co. |
| | | | | | | | | | (2015–2019) |
| | | | | | | | | | Director and Audit Committee |
| | | | | | | | | | Member — vTv Therapeutics Inc. |
| | | | | | | | | | (2017–Present) |
| | | | | | | | | | Director and Audit Committee |
| | | | | | | | | | Member — FS Credit Real Estate |
| | | | | | | | | | Income Trust, Inc. |
| | | | | | | | | | (2018–Present) |
| | | | | | | | | | Director — Federal Reserve |
| | | | | | | | | | Bank of Philadelphia |
| | | | | | | | | | (January 2020–Present) |
73
Board of trustees / directors and officers addendum
Delaware Funds® by Macquarie
| | | | | | | | Number of | | Other |
| | | | | | Principal | | Portfolios in Fund | | Directorships |
| Name, | | Position(s) | | | | Occupation(s) | | Complex Overseen | | Held by |
| Address, | | Held with | | Length of Time | | During the | | by Trustee | | Trustee |
| and Birth Date | | Fund(s) | | Served | | Past Five Years | | or Officer | | or Officer |
| | | | | | | | | | | |
| Frances A. | | Trustee | | Since September | | Private Investor | | 85 | | Trust Manager and Audit |
| Sevilla-Sacasa | | | | 2011 | | (January 2017–Present) | | | | Committee Chair — Camden |
| 610 Market Street | | | | | | Chief Executive Officer — Banco | | | | Property Trust |
| Philadelphia, PA | | | | | | Itaú International | | | | (August 2011–Present) |
| 19106-2354 | | | | | | (April 2012–December 2016) | | | | Director; Strategic |
| January 1956 | | | | | | Executive Advisor to Dean | | | | Planning and Reserves |
| | | | | | (August 2011–March 2012) and | | | | Committee and Nominating |
| | | | | | Interim Dean | | | | and Governance |
| | | | | | (January 2011–July 2011) — | | | | Committee Member — |
| | | | | | University of Miami School of | | | | Callon Petroleum Company |
| | | | | | Business Administration | | | | (December 2019–Present) |
| | | | | | President — U.S. Trust, Bank of | | | | Director — New Senior |
| | | | | | America Private Wealth | | | | Investment Group Inc. |
| | | | | | Management (Private Banking) | | | | (January 2021–Present) |
| | | | | | (July 2007-December 2008) | | | | Director; Audit Committee |
| | | | | | | | | | Member — Carrizo Oil & Gas, |
| | | | | | | | | | Inc. (March 2018–December |
| | | | | | | | | | 2019) |
74
| | | | | | | | Number of | | Other |
| | | | | | Principal | | Portfolios in Fund | | Directorships |
| Name, | | Position(s) | | | | Occupation(s) | | Complex Overseen | | Held by |
| Address, | | Held with | | Length of Time | | During the | | by Trustee | | Trustee |
| and Birth Date | | Fund(s) | | Served | | Past Five Years | | or Officer | | or Officer |
| | | | | | | | | | | |
| Thomas K. Whitford | | Trustee | | Since January 2013 | | Vice Chairman (2010–April 2013) | | 85 | | Director — HSBC North America |
| 610 Market Street | | | | | | — PNC Financial Services Group | | | | Holdings Inc. |
| Philadelphia, PA | | | | | | | | | | (December 2013–Present) |
| 19106-2354 | | | | | | | | | | Director — HSBC USA Inc. |
| March 1956 | | | | | | | | | | (July 2014–Present) |
| | | | | | | | | | Director — HSBC Bank USA, |
| | | | | | | | | | National Association |
| | | | | | | | | | (July 2014–March 2017) |
| | | | | | | | | | Director — HSBC Finance |
| | | | | | | | | | Corporation |
| | | | | | | | | | (December 2013–April 2018) |
75
Board of trustees / directors and officers addendum
Delaware Funds® by Macquarie
| | | | | | | | Number of | | Other |
| | | | | | Principal | | Portfolios in Fund | | Directorships |
| Name, | | Position(s) | | | | Occupation(s) | | Complex Overseen | | Held by |
| Address, | | Held with | | Length of Time | | During the | | by Trustee | | Trustee |
| and Birth Date | | Fund(s) | | Served | | Past Five Years | | or Officer | | or Officer |
| | | | | | | | | | | |
| Christianna Wood | | Trustee | | Since January 2019 | | Chief Executive Officer and | | 85 | | Director; Finance Committee and |
| 610 Market Street | | | | | | President — Gore Creek Capital, | | | | Audit Committee Member — |
| Philadelphia, PA | | | | | | Ltd. (August 2009–Present) | | | | H&R Block Corporation |
| 19106-2354 | | | | | | | | | | (July 2008–Present) |
| August 1959 | | | | | | | | | | Director; Investments |
| | | | | | | | | | Committee, Capital and Finance |
| | | | | | | | | | Committee, and Audit |
| | | | | | | | | | Committee Member — Grange |
| | | | | | | | | | Insurance (2013–Present) |
| | | | | | | | | | Trustee; Chair of Nominating and |
| | | | | | | | | | Governance Committee and |
| | | | | | | | | | Audit Committee Member — The |
| | | | | | | | | | Merger Fund (2013–Present), The |
| | | | | | | | | | Merger Fund VL (2013–Present); |
| | | | | | | | | | WCM Alternatives: Event-Driven |
| | | | | | | | | | Fund (2013–Present), and WCM |
| | | | | | | | | | Alternatives: Credit Event Fund |
| | | | | | | | | | (December 2017–Present) |
| | | | | | | | | | Director; Chair of Governance |
| | | | | | | | | | Committee and Audit Committee |
| | | | | | | | | | Member — International |
| | | | | | | | | | Securities Exchange (2010–2016) |
76
| | | | | | | | Number of | | Other |
| | | | | | Principal | | Portfolios in Fund | | Directorships |
| Name, | | Position(s) | | | | Occupation(s) | | Complex Overseen | | Held by |
| Address, | | Held with | | Length of Time | | During the | | by Trustee | | Trustee |
| and Birth Date | | Fund(s) | | Served | | Past Five Years | | or Officer | | or Officer |
| | | | | | | | | | | |
| Janet L. Yeomans | | Trustee | | Since April 1999 | | Vice President and Treasurer | | 85 | | Director; Personnel and |
| 610 Market Street | | | | | | (January 2006–July 2012), Vice | | | | Compensation Committee Chair; |
| Philadelphia, PA | | | | | | President — Mergers & | | | | Member of Nominating, |
| 19106-2354 | | | | | | Acquisitions | | | | Investments, and Audit |
| July 1948 | | | | | | (January 2003–January 2006), | | | | Committees for various periods |
| | | | | | and Vice President and Treasurer | | | | throughout directorship — |
| | | | | | (July 1995–January 2003) — 3M | | | | Okabena Company (2009–2017) |
| | | | | | Company | | | | |
| | | | | | | | | | | |
| Officers | | | | | | | | | | |
| | | | | | | | | | | |
| David F. Connor | | Senior Vice President, | | Senior Vice President, | | David F. Connor has served in | | 85 | | None3 |
| 610 Market Street | | General Counsel, and | | since May 2013; | | various capacities at different | | | | |
| Philadelphia, PA | | Secretary | | General Counsel | | times at Macquarie Investment | | | | |
| 19106-2354 | | | | since May 2015; | | Management. | | | | |
| December 1963 | | | | Secretary since | | | | | | |
| | | | October 2005 | | | | | | |
| Daniel V. Geatens | | Vice President and | | Vice President and | | Daniel V. Geatens has served in | | 85 | | None3 |
| 610 Market Street | | Treasurer | | Treasurer since | | various capacities at different | | | | |
| Philadelphia, PA | | | | October 2007 | | times at Macquarie Investment | | | | |
| 19106-2354 | | | | | | Management. | | | | |
| October 1972 | | | | | | | | | | |
77
Board of trustees / directors and officers addendum
Delaware Funds® by Macquarie
| | | | | | | | Number of | | Other |
| | | | | | Principal | | Portfolios in Fund | | Directorships |
| Name, | | Position(s) | | | | Occupation(s) | | Complex Overseen | | Held by |
| Address, | | Held with | | Length of Time | | During the | | by Trustee | | Trustee |
| and Birth Date | | Fund(s) | | Served | | Past Five Years | | or Officer | | or Officer |
| | | | | | | | | | | |
| Richard Salus | | Senior Vice President | | Senior Vice President | | Richard Salus has served in | | 85 | | None |
| 610 Market Street | | and Chief Financial | | and Chief Financial | | various capacities at different | | | | |
| Philadelphia, PA | | Officer | | Officer since | | times at Macquarie Investment | | | | |
| 19106-2354 | | | | November 2006 | | Management. | | | | |
| October 1963 | | | | | | | | | | |
| 1 | Shawn K. Lytle is considered to be an “Interested Trustee” because he is an executive officer of the Fund’s(s’) investment advisor. |
| 2 | Macquarie Investment Management is the marketing name for Macquarie Management Holdings, Inc. and its subsidiaries, including the Fund’s(s’) investment manager, principal underwriter, and its transfer agent. |
| 3 | David F. Connor and Daniel V. Geatens serve in similar capacities for the six portfolios of the Optimum Fund Trust, which have the same investment advisor, principal underwriter, and transfer agent as the registrant. Mr. Geatens also serves as the Chief Financial Officer of the Optimum Fund Trust, and he is the Chief Financial Officer and Treasurer for Macquarie Global Infrastructure Total Return Fund Inc. |
The Statement of Additional Information for the Fund(s) includes additional information about the Trustees and Officers and is available, without charge, upon request by calling 800 523-1918.
78
About the organization
Board of trustees | | | | | | |
Shawn K. Lytle
President and
Chief Executive Officer
Delaware Funds®
by Macquarie
Philadelphia, PA
Jerome D. Abernathy
Managing Director
Stonebrook Capital
Management, LLC
Jersey City, NJ
Thomas L. Bennett
Chairman of the Board
Delaware Funds
by Macquarie
Private Investor
Rosemont, PA | | Ann D. Borowiec
Former Chief Executive
Officer
Private Wealth Management
J.P. Morgan Chase & Co.
New York, NY
Joseph W. Chow
Former Executive Vice
President
State Street Corporation
Boston, MA
John A. Fry
President
Drexel University
Philadelphia, PA | | Frances A.
Sevilla-Sacasa
Former Chief Executive
Officer
Banco Itaú International
Miami, FL
Thomas K. Whitford
Former Vice Chairman
PNC Financial Services
Group
Pittsburgh, PA | | Christianna Wood
Chief Executive Officer
and President
Gore Creek Capital, Ltd.
Golden, CO
Janet L. Yeomans
Former Vice President and
Treasurer
3M Company
St. Paul, MN |
| | | | | | | |
| Affiliated officers | | | | | | |
| David F. Connor | | Daniel V. Geatens | | Richard Salus | | |
Senior Vice President,
General Counsel,
and Secretary
Delaware Funds
by Macquarie
Philadelphia, PA | | Vice President and
Treasurer
Delaware Funds
by Macquarie
Philadelphia, PA | | Senior Vice President and
Chief Financial Officer
Delaware Funds
by Macquarie
Philadelphia, PA | | |
This annual report is for the information of Delaware Limited-Term Diversified Income Fund shareholders, but it may be used with prospective investors when preceded or accompanied by the Delaware Fund fact sheet for the most recently completed calendar quarter. These documents are available at delawarefunds.com/literature. |
The Fund files its complete schedule of portfolio holdings with the Securities and Exchange Commission (SEC) for the first and third quarters of each fiscal year on Form N-PORT. The Fund’s Forms N-PORT, as well as a description of the policies and procedures that the Fund uses to determine how to vote proxies (if any) relating to portfolio securities, are available without charge (i) upon request, by calling 800 523-1918; and (ii) on the SEC’s website at sec.gov. In addition, a description of the policies and procedures that the Fund uses to determine how to vote proxies (if any) relating to portfolio securities and the Schedule of Investments included in the Fund’s most recent Form N-PORT are available without charge on the Fund’s website at delawarefunds.com/literature. The Fund’s Forms N-PORT may be reviewed and copied at the SEC’s Public Reference Room in Washington, D.C.; information on the operation of the Public Reference Room may be obtained by calling 800 SEC-0330.
Information (if any) regarding how the Fund voted proxies relating to portfolio securities during the most recently disclosed 12-month period ended June 30 is available without charge (i) through the Fund’s website at delawarefunds.com/proxy; and (ii) on the SEC’s website at sec.gov.
79
Annual report
Fixed income mutual funds
Delaware Tax-Free New Jersey Fund
Delaware Tax-Free Oregon Fund
December 31, 2020
Beginning on or about June 1, 2021, as permitted by regulations adopted by the Securities and Exchange Commission, paper copies of your Fund’s shareholder reports will no longer be sent to you by mail, unless you specifically request them from the Fund or from your financial intermediary, such as a broker/dealer, bank, or insurance company. Instead, you will be notified by mail each time a report is posted on the website and provided with a link to access the report. If you already elected to receive shareholder reports electronically, you will not be affected by this change and you do not need to take any action. You may elect to receive shareholder reports and other communications from the Fund electronically by signing up at delawarefunds.com/edelivery. If you own these shares through a financial intermediary, you may contact your financial intermediary. You may elect to receive paper copies of all future shareholder reports free of charge. You can inform the Fund that you wish to continue receiving paper copies of your shareholder reports by contacting us at 800 523-1918. If you own these shares through a financial intermediary, you may contact your financial intermediary to elect to continue to receive paper copies of your shareholder reports. Your election to receive reports in paper will apply to all funds held with the Delaware Funds® by Macquarie or your financial intermediary. |
Carefully consider the Funds’ investment objectives, risk factors, charges, and expenses before investing. This and other information can be found in the Funds’ prospectus and their summary prospectuses, which may be obtained by visiting delawarefunds.com/literature or calling 800 523-1918. Investors should read the prospectus and the summary prospectus carefully before investing.
You can obtain shareholder reports and prospectuses online instead of in the mail. Visit delawarefunds.com/edelivery.
Experience Delaware Funds® by Macquarie
Macquarie Investment Management (MIM) is a global asset manager with offices in the United States, Europe, Asia, and Australia. As active managers, we prioritize autonomy and accountability at the investment team level in pursuit of opportunities that matter for clients. Delaware Funds is one of the longest-standing mutual fund families, with more than 80 years in existence.
If you are interested in learning more about creating an investment plan, contact your financial advisor.
You can learn more about Delaware Funds or obtain a prospectus for Delaware Tax-Free New Jersey Fund and Delaware Tax-Free Oregon Fund at delawarefunds.com/literature.
Manage your account online
| ● | Check your account balance and transactions |
| ● | View statements and tax forms |
| ● | Make purchases and redemptions |
Visit delawarefunds.com/account-access.
Macquarie Asset Management (MAM) offers a diverse range of products including securities investment management, infrastructure and real asset management, and fund and equity-based structured products. MIM is the marketing name for certain companies comprising the asset management division of Macquarie Group. This includes the following investment advisers: Macquarie Investment Management Business Trust (MIMBT), Macquarie Funds Management Hong Kong Limited, Macquarie Investment Management Austria Kapitalanlage AG, Macquarie Investment Management Global Limited, Macquarie Investment Management Europe Limited, and Macquarie Investment Management Europe S.A.
The Funds are distributed by Delaware Distributors, L.P. (DDLP), an affiliate of MIMBT and Macquarie Group Limited.
Other than Macquarie Bank Limited (MBL), none of the entities noted are authorized deposit-taking institutions for the purposes of the Banking Act 1959 (Commonwealth of Australia). The obligations of these entities do not represent deposits or other liabilities of MBL. MBL does not guarantee or otherwise provide assurance in respect of the obligations of these entities, unless noted otherwise.
The Funds are governed by US laws and regulations.
| Table of contents | | |
| Portfolio management reviews | | 1 |
| Performance summaries | | 6 |
| Disclosure of Fund expenses | | 14 |
| Security type / sector / state / territory allocations | | 16 |
| Schedules of investments | | 18 |
| Statements of assets and liabilities | | 27 |
| Statements of operations | | 29 |
| Statements of changes in net assets | | 30 |
| Financial highlights | | 34 |
| Notes to financial statements | | 42 |
| Report of independent | | |
| registered public accounting firm | | 57 |
| Other Fund information | | 58 |
| Board of trustees / directors | | |
| and officers addendum | | 62 |
| About the organization | | 70 |
Unless otherwise noted, views expressed herein are current as of December 31, 2020, and subject to change for events occurring after such date.
The Funds are not FDIC insured and are not guaranteed. It is possible to lose the principal amount invested.
Advisory services provided by Delaware Management Company, a series of MIMBT, a US registered investment advisor.
All third-party marks cited are the property of their respective owners.
© 2021 Macquarie Management Holdings, Inc.
| Portfolio management review | |
| Delaware Funds® by Macquarie tax-exempt funds | January 12, 2021 (Unaudited) |
| Performance preview (for the year ended December 31, 2020) | | | | |
| Delaware Tax–Free New Jersey Fund (Institutional Class shares) | | 1-year return | | +5.25% |
| Delaware Tax–Free New Jersey Fund (Class A shares) | | 1-year return | | +5.10% |
| Bloomberg Barclays Municipal Bond Index (benchmark) | | 1-year return | | +5.21% |
| Lipper New Jersey Municipal Debt Funds Average | | 1-year return | | +4.42% |
Past performance does not guarantee future results.
For complete, annualized performance for Delaware Tax-Free New Jersey Fund, please see the table on page 6.
Institutional Class shares are not subject to a sales charge and are offered for sale exclusively to certain eligible investors. In addition, Institutional Class shares pay no distribution and service fee.
The performance of Class A shares excludes the applicable sales charge. The performance of both Institutional Class shares and Class A shares reflects the reinvestment of all distributions.
The Lipper New Jersey Municipal Debt Funds Average compares funds that invest primarily in municipal debt issues that are exempt from taxation in New Jersey.
Please see page 9 for a description of the index. Index performance returns do not reflect any management fees, transaction costs, or expenses. Indices are unmanaged and one cannot invest directly in an index.
| Delaware Tax–Free Oregon Fund (Institutional Class shares) | | 1-year return | | +4.96% |
| Delaware Tax–Free Oregon Fund (Class A shares) | | 1-year return | | +4.70% |
| Bloomberg Barclays Municipal Bond Index (benchmark) | | 1-year return | | +5.21% |
| Lipper Other States Municipal Debt Funds Average | | 1-year return | | +4.17% |
Past performance does not guarantee future results.
For complete, annualized performance for Delaware Tax-Free Oregon Fund, please see the table on page 10.
Institutional Class shares are not subject to a sales charge and are offered for sale exclusively to certain eligible investors. In addition, Institutional Class shares pay no distribution and service fee.
The performance of Class A shares excludes the applicable sales charge. The performance of both Institutional Class shares and Class A shares reflects the reinvestment of all distributions.
The Lipper Other States Municipal Debt Funds Average compares funds that limit assets to those securities that are exempt from taxation on a specified city or state basis.
Please see page 13 for a description of the index. Index performance returns do not reflect any management fees, transaction costs, or expenses. Indices are unmanaged and one cannot invest directly in an index.
1
Portfolio management review
Delaware Funds® by Macquarie tax-exempt funds
Investment objectives
Delaware Tax-Free New Jersey Fund seeks a high level of interest income that is exempt from both federal and state income tax for individual residents of the state of New Jersey.
Delaware Tax-Free Oregon Fund seeks a high level of interest income that is exempt from both federal and state income tax for individual residents of the state of Oregon.
Economic backdrop
At the start of 2020, the US economy was continuing along its steady growth path, benefiting from historically low unemployment. In February, however, economic and financial market conditions around the world deteriorated as the global scale of the COVID-19 pandemic became obvious. Quarantine orders mounted across the country and around the world, economic activity ceased, and job losses grew by the millions. In this environment, US gross domestic product (GDP) shrank by an annualized 5.0% in the first quarter of 2020. Then, in the year’s second quarter, it fell by an annualized 31.4% – the most significant quarterly economic contraction in US history.
To attempt to ease this economic damage, both the US Federal Reserve and federal government took aggressive action. In early March, the Fed cut its benchmark short-term interest rate by 50 basis points. (One basis point is a hundredth of a percentage point.) Two weeks later, it followed that with a reduction of another 100 basis points, bringing the federal funds rate to essentially zero, where it stood throughout the remainder of 2020. Further, in late March, the federal government passed the Coronavirus Aid, Relief, and Economic Security (CARES) Act, a $2 trillion economic stimulus bill centered on providing support to individuals and businesses hurt by the economic fallout.
The economic decline in the United States peaked in April 2020, with 20.5 million jobs reported lost and an unemployment rate that soared to 14.8% – the highest jobless level since the Great Depression. Soon, however, the national economic picture began to improve. As state and local economies around the country reopened one by one, US GDP rose by an unprecedented 33.4% in the year’s third quarter. As the year progressed and the prospect of safe, effective vaccines for COVID-19 came into view, optimism about economic normalization in 2021 grew. Providing further enthusiasm for investors was a new round of federal economic stimulus legislation, which ultimately passed on December 30. Against this backdrop, the US unemployment rate finished the year at 6.7%, still historically high, but well below the country’s April peak.
Sources: US Bureau of Economic Analysis, US Bureau of Labor Statistics, and Bloomberg.
Municipal bond market conditions
Overall, the municipal bond market, as measured by the Bloomberg Barclays Municipal Bond Index, returned 5.21% for the fiscal year ended December 31, 2020.
With regard to market conditions, the year can be divided into three distinct periods. The first period is between January 1 and March 9, 2020, when municipal bonds had solid performance amid favorable demand for tax-exempt securities coupled with relatively limited supply. In this environment, longer-duration, lower-rated securities generally outperformed their shorter-maturity, more highly rated counterparts, as many investors accepted greater interest rate risk and credit risk in exchange for higher yields. During this stretch, the municipal bond market, as measured by the Bloomberg Barclays Municipal Bond Index, gained 3.73%. Starting on March 10, however, conditions for investors in municipal bonds abruptly shifted. With
2
mounting concern about the coronavirus, market volatility soared, liquidity dried up, and more highly leveraged institutional investors were forced to unload their municipal debt. Eager for safety, investors bid up prices of more highly rated, shorter-term bonds, while lower-quality, longer-term issues lagged, reflecting their increased credit and duration risk. Between March 10 and April 30, the Bloomberg Barclays Municipal Bond Index returned -4.84%, with most of that decline coming during two especially difficult weeks in March. Lower-investment-grade and below-investment-grade bonds were poor performers during this roughly seven-week stretch, returning -11.85% and -14.00%, respectively.
Finally, between May 1 and the end of 2020, municipal securities rallied strongly, with the Bloomberg Barclays Municipal Bond Index gaining 7.23%. Better-than-expected national economic data and heightened demand for tax-exempt bonds, especially lower-rated issues that had fallen disproportionately during the market’s earlier downturn, boosted the asset class.
Looking at the full fiscal year, the following tables indicate that bonds with longer maturities generally outperformed their shorter- and intermediate-duration counterparts. More highly rated issues, which more quickly recovered from the sharp market downturn in March and April, fared better than lower-rated bonds.
| Returns by credit rating | | |
| AAA | | 5.51% |
| AA | | 5.24% |
| A | | 5.27% |
| BBB | | 4.55% |
| | | |
| Returns by maturity | | |
| 1 year | | 1.76% |
| 3 years | | 2.97% |
| 10 years | | 5.62% |
| 22+ years | | 6.25% |
Source: Bloomberg
Economic backdrop in the states
New Jersey’s unemployment rate rose to 10.2% in November 2020 from 8.0% in October and 6.7% in September. The April high was 16.3%. The state issued $3.7 billion of general obligation debt in 2020’s fourth quarter to offset revenue losses. November 2020 revenues were 6% higher year over year due to a recently implemented millionaires’ tax and higher gas tax. Sales taxes in November increased 5% and have been higher for four consecutive months compared to 2019. (Sources: bls.gov, njspotlight.com.)
Oregon’s 6.0% unemployment rate in November continued its steady downward move from 6.8% in October, 7.9% in September, and the pandemic-high 14.9% in April. The fiscal year 2021 state budget could see a $1.7 billion surplus based on better-than-expected revenue from corporate taxes, lottery revenues, and higher-than-expected sales taxes.
(Sources: bls.gov, oregon.gov/transparency.)
A consistent management approach
For the Funds highlighted in this report, we maintained the same management strategy we employ in all market conditions. We follow a bottom-up (bond-by-bond) investment approach. This entails selecting bonds on an issuer-by-issuer basis, based on our team’s thorough credit research. We regularly seek bonds that offer our shareholders what we see as an attractive trade-off between reward potential and risk.
Following this approach, we generally maintain less exposure to highly rated, lower yielding bonds and more exposure to bonds with lower-investment-grade or below-investment-grade credit ratings. We believe that by focusing on higher yielding securities of solid underlying credit quality when appropriate, we have more opportunity to add value for the Funds’ shareholders.
3
Portfolio management review
Delaware Funds® by Macquarie tax-exempt funds
As of the end of the fiscal year on December 31, 2020, roughly 31% of Delaware Tax-Free New Jersey Fund’s net assets were invested in bonds with lower-investment-grade credit ratings (A and BBB). Approximately 16% of Delaware Tax-Free Oregon Fund’s assets were invested in bonds from these same credit tiers.
Both Funds also maintained allocations to high yield municipal bonds, those with credit ratings below BBB. By prospectus, the Funds may hold up to 20% of their net assets in high yield debt, although their allocations remained below that threshold throughout the fiscal year. Whenever we invest in the high yield market segment, we thoroughly analyze the securities’ credit risk and emphasize those bonds that we believe offer shareholders a favorable risk-reward balance.
Adapting to market changes
For the first part of the fiscal year – roughly the span between January 1 and the pandemic-fueled market selloff in March – our purchase and sale activity for the Funds tended to be limited. We adopted this approach based on our view that the Funds were generally well positioned coming into 2020.
Market conditions dramatically shifted, however, with the arrival of the pandemic. In March, demand for municipal bonds suddenly weakened, and an environment of mutual fund inflows across the market turned into one of rapid outflows. We quickly determined this outflow trend was likely to worsen. Thus, we decided to raise cash in these Funds by orderly selling bonds. Our goal was to preserve each Fund’s positioning as best we could, to be able to satisfy shareholder redemptions while avoiding having to sell securities at temporarily depressed prices. This approach also enabled us to prepare the Funds for the eventual market rebound that we anticipated. We believe these proactive sales worked to shareholders’ benefit, as the Funds had enough cash on hand to meet the redemption requests we received.
By April, municipal market conditions had begun to improve as a result of aggressive economic stimulus and investors’ optimism about reopening state economies. Especially in late May and early June, we took advantage of periodic opportunities to buy certain lower-rated, attractively valued bonds in the new-issue market that we viewed as solid long-term holdings for the Funds. Proceeds for these purchases largely came from selling certain higher-rated, lower-earning bonds.
Notable performance factors
For the fiscal year, longer-duration bonds – meaning those with more sensitivity to interest rates – outperformed bonds with shorter durations. Also, bonds with higher credit ratings outperformed lower-quality issues, which fell disproportionately during the municipal market’s March downturn. Between the market’s low point that month and the rest of 2020, however, lower-rated, higher yielding bonds bounced back strongly and made up most of their prior relative performance shortfall.
Puerto Rico sales-tax bonds, known as COFINA bonds, were notably strong performers for both Delaware Tax-Free New Jersey Fund and Delaware Tax-Free Oregon Fund, with gains in the Funds from these securities ranging from 10% to 11%. COFINA bonds benefited from strong investor demand due to the securities’ fully tax-exempt status (bonds of US territories are generally tax-exempt for residents of all 50 states), as well as Puerto Rico’s better-than-expected fiscal position.
Delaware Tax-Free New Jersey Fund also saw strong performance from its investment in New Jersey tobacco-securitization debt. These securities gained approximately 9% for the Fund. For the fiscal year, lower-rated tobacco bonds were among the municipal bond market’s strongest overall performers. The securities have
4
benefited as tobacco consumption trends have weakened more slowly than expected. In addition, because many tobacco issuers have refinanced their outstanding debt, older, higher yielding bonds have benefited from their scarcity.
A position in Ewing Township school district bonds also added value for Delaware Tax-Free New Jersey Fund. These bonds, with a AA-rating, benefited from their relatively full effective durations. In other words, because these bonds had increased sensitivity to changes in interest rates, they benefited as rates declined during the fiscal year.
In what was a strong environment for municipal bond performance, even the weakest-returning bonds in Delaware Tax-Free New Jersey Fund generated a small positive return. For example, Monmouth County Improvement Authority and Delaware River Port Authority bonds returned about 1% and 2%, respectively. Both were subdued performers due to their short effective durations related to near-term call dates.
In Delaware Tax-Free Oregon Fund, the leading individual performers – after the Puerto Rico COFINA bonds – were longer-duration positions, led by Oregon Health & Science University bonds and City of Newport general obligation issues. These securities returned about 10% and 9%, respectively, in the Fund’s portfolio.
The biggest individual detractor for Delaware Tax-Free Oregon Fund, meanwhile, was a position in bonds of Red Rock Biofuels. The Fund’s holding in these securities returned about -35% because of the issuer’s cash flow challenges exacerbated by the pandemic.
Other relative underperformers in this Fund were City of Portland Water System revenue bonds and Multnomah County School District No. 3 Parkrose bonds. Both issues returned about 2% for the Fund, reflecting the securities’ relatively short effective durations.
5
| Performance summaries | |
| Delaware Tax–Free New Jersey Fund | December 31, 2020 (Unaudited) |
The performance quoted represents past performance and does not guarantee future results. Investment return and principal value of an investment will fluctuate so that shares, when redeemed, may be worth more or less than their original cost. Current performance may be lower or higher than the performance quoted. Performance data current to the most recent month end may be obtained by calling 800 523-1918 or visiting delawarefunds.com/performance.
| Fund and benchmark performance1,2 | | Average annual total returns through December 31, 2020 |
| | 1 year | | 5 year | | 10 year | | Lifetime | |
| Class A (Est. September 13, 1988) | | | | | | | | | |
| Excluding sales charge | | +5.10% | | +3.33% | | +3.97% | | — | |
| Including sales charge | | +0.34% | | +2.50% | | +3.55% | | — | |
| Institutional Class (Est. May 1, 2013) | | | | | | | | | |
| Excluding sales charge | | +5.25% | | +3.59% | | — | | +2.97% | |
| Including sales charge | | +5.25% | | +3.59% | | — | | +2.97% | |
| Bloomberg Barclays Municipal Bond Index | | +5.21% | | +3.91% | | +4.63% | | — | |
| 1 | Returns reflect the reinvestment of all distributions and are presented both with and without the applicable sales charges described below. Returns do not reflect the deduction of taxes the shareholder would pay on Fund distributions or redemptions of Fund shares. |
Expense limitations were in effect for certain classes during some or all of the periods shown in the “Fund and benchmark performance” table. Expenses for each class are listed on the “Fund expense ratios” table on page 7. Performance would have been lower had expense limitations not been in effect.
Institutional Class shares are not subject to a sales charge and are offered for sale exclusively to certain eligible investors. In addition, Institutional Class shares pay no distribution and service (12b-1) fee.
Class A shares are sold with a maximum front-end sales charge of 4.50%, and have an annual 12b-1 fee of 0.25% of average daily net assets. Performance of the predecessor fund contained a 4.00% sales charge. Performance for Class A shares, excluding sales charges, assumes that no front-end sales charge applied.
Fixed income securities and bond funds can lose value, and investors can lose principal, as interest rates rise. They also may be affected by economic conditions that hinder an issuer’s ability to make interest and principal payments on its debt.
The Fund may also be subject to prepayment risk, the risk that the principal of a bond that is held by a portfolio will be prepaid prior to maturity, at the time when interest rates are lower than what the bond was paying. A portfolio may then have to reinvest that money at a lower interest rate.
Funds that invest primarily in one state may be more susceptible to the economic, regulatory, regional, and other factors of that state than geographically diversified funds.
Substantially all dividend income derived from tax-free funds is exempt from federal income tax. Some income may be subject to state or local and/or the federal alternative minimum tax (AMT) that applies to certain investors. Capital gains, if any, are taxable.
Duration number will change as market conditions change. Therefore, duration should not be solely relied upon to indicate a municipal bond fund’s potential volatility.
6
IBOR risk is the risk that changes related to the use of the London interbank offered rate (LIBOR) or similar rates (such as EONIA) could have adverse impacts on financial instruments that reference these rates. The abandonment of these rates and transition to alternative rates could affect the value and liquidity of instruments that reference them and could affect investment strategy performance.
The disruptions caused by natural disasters, pandemics, or similar events could prevent the Fund from executing advantageous investment decisions in a timely manner and could negatively impact the Fund’s ability to achieve its investment objective and the value of the Fund’s investments.
2The Fund’s expense ratios, as described in the most recent prospectus, are disclosed in the following “Fund expense ratios” table. Delaware Management Company has agreed to reimburse certain expenses and/or waive certain fees in order to prevent total annual fund operating expenses (excluding any 12b-1 fees, acquired fund fees and expenses, taxes, interest, short sale dividend interest expenses, brokerage fees, certain insurance costs, and nonroutine expenses or costs, including, but not limited to, those relating to reorganizations, litigation, conducting shareholder meetings, and liquidations (collectively, nonroutine expenses)) from exceeding 0.90% and 0.68% of the Fund’s average daily net assets for Class A shares and Institutional Class shares, respectively, of the Fund’s average daily net assets from January 1, 2020 through December 31, 2020.* Please see the most recent prospectus and any applicable supplement(s) for additional information on these fee waivers and/or reimbursements. Please see the “Financial highlights” section in this report for the most recent expense ratios.
| Fund expense ratios | | Class A | | Institutional Class | |
| Total annual operating expenses | | | | | |
| (without fee waivers) | | 1.19% | | 0.94% | |
| Net expenses (including fee | | | | | |
| waivers, if any) | | 0.90% | | 0.68% | |
| Type of waiver | | Contractual | | Contractual | |
| * | The aggregate contractual waiver period covering this report is from October 4, 2019 through October 31, 2021. |
7
Performance summaries
Delaware Tax–Free New Jersey Fund
Performance of a $10,000 investment1
Class A shares
Average annual total returns from December 31, 2010 through December 31, 2020
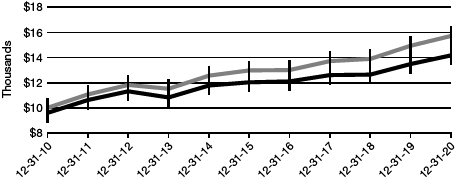
| For period beginning December 31, 2010 through December 31, 2020 | | Starting value | | Ending value |
| | Bloomberg Barclays Municipal Bond Index | | | $10,000 | | | $15,718 |
| | Delaware Tax–Free New Jersey Fund — Class A shares | | | $9,600 | | | $14,173 |
Institutional Class shares
Average annual total returns from May 1, 2013 through December 31, 2020
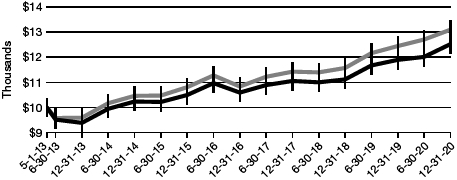
| For period beginning May 1, 2013 through December 31, 2020 | | Starting value | | Ending value |
| | Bloomberg Barclays Municipal Bond Index | | $10,000 | | $13,095 |
| | Delaware Tax–Free New Jersey Fund — Institutional Class shares | | $10,000 | | $12,521 |
8
| 1 | The “Performance of a $10,000 investment” graph assumes $10,000 invested in Institutional Class and Class A shares of the Fund on December 31, 2010, and includes the effect of a 4.50% front-end sales charge (for Class A shares) and the reinvestment of all distributions. The graph does not reflect the deduction of taxes the shareholders would pay on Fund distributions or redemptions of Fund shares. Expense limitations were in effect for some or all of the periods shown. Performance would have been lower had expense limitations not been in effect. Expenses are listed in the “Fund expense ratios” table on page 7. Please note additional details on pages 6 through 9. |
The graph also assumes $10,000 invested in the Bloomberg Barclays Municipal Bond Index as of December 31, 2010. The Bloomberg Barclays Municipal Bond Index measures the total return performance of the long-term, investment grade tax-exempt bond market.
Index performance returns do not reflect any management fees, transaction costs, or expenses. Indices are unmanaged and one cannot invest directly in an index. Past performance is not a guarantee of future results.
Performance of other Fund classes will vary due to different charges and expenses.
| | Nasdaq symbols | | CUSIPs | |
| Class A | | | FINJX | | | 245912779 | |
| Institutional Class | | | FINLX | | | 245912761 | |
9
| Performance summaries | |
| Delaware Tax–Free Oregon Fund | December 31, 2020 (Unaudited) |
The performance quoted represents past performance and does not guarantee future results. Investment return and principal value of an investment will fluctuate so that shares, when redeemed, may be worth more or less than their original cost. Current performance may be lower or higher than the performance quoted. Performance data current to the most recent month end may be obtained by calling 800 523-1918 or visiting delawarefunds.com/performance.
| Fund and benchmark performance1,2 | Average annual total returns through December 31, 2020 |
| | | 1 year | | 5 year | | 10 year | | Lifetime | |
| Class A (Est. May 4, 1992) | | | | | | | | | |
| Excluding sales charge | | +4.70% | | +2.81% | | +3.73% | | — | |
| Including sales charge | | +0.01% | | +1.97% | | +3.30% | | — | |
| Institutional Class (Est. May 1, 2013) | | | | | | | | | |
| Excluding sales charge | | +4.96% | | +3.10% | | — | | +2.62% | |
| Including sales charge | | +4.96% | | +3.10% | | — | | +2.62% | |
| Bloomberg Barclays Municipal Bond Index | | +5.21% | | +3.91% | | +4.63% | | — | |
| 1 | Returns reflect the reinvestment of all distributions and are presented both with and without the applicable sales charges described below. Returns do not reflect the deduction of taxes the shareholder would pay on Fund distributions or redemptions of Fund shares. |
Expense limitations were in effect for certain classes during some or all of the periods shown in the “Fund and benchmark performance” table. Expenses for each class are listed on the “Fund expense ratios” table on page 11. Performance would have been lower had expense limitations not been in effect.
Institutional Class shares are not subject to a sales charge and are offered for sale exclusively to certain eligible investors. In addition, Institutional Class shares pay no distribution and service (12b-1) fee.
Class A shares are sold with a maximum front-end sales charge of 4.50%, and have an annual 12b-1 fee of 0.25% of average daily net assets. Performance of the predecessor fund contained a 4.00% sales charge. Performance for Class A shares, excluding sales charges, assumes that no front-end sales charge applied.
Fixed income securities and bond funds can lose value, and investors can lose principal, as interest rates rise. They also may be affected by economic conditions that hinder an issuer’s ability to make interest and principal payments on its debt.
The Fund may also be subject to prepayment risk, the risk that the principal of a bond that is held by a portfolio will be prepaid prior to maturity, at the time when interest rates are lower than what the bond was paying. A portfolio may then have to reinvest that money at a lower interest rate.
Funds that invest primarily in one state may be more susceptible to the economic, regulatory, regional, and other factors of that state than geographically diversified funds.
Substantially all dividend income derived from tax-free funds is exempt from federal income tax. Some income may be subject to state or local and/or the federal alternative minimum tax (AMT) that applies to certain investors. Capital gains, if any, are taxable.
Duration number will change as market conditions change. Therefore, duration should not be solely relied upon to indicate a municipal bond fund’s potential volatility.
10
IBOR risk is the risk that changes related to the use of the London interbank offered rate (LIBOR) or similar rates (such as EONIA) could have adverse impacts on financial instruments that reference these rates. The abandonment of these rates and transition to alternative rates could affect the value and liquidity of instruments that reference them and could affect investment strategy performance.
The disruptions caused by natural disasters, pandemics, or similar events could prevent the Fund from executing advantageous investment decisions in a timely manner and could negatively impact the Fund’s ability to achieve its investment objective and the value of the Fund’s investments.
2 The Fund’s expense ratios, as described in the most recent prospectus, are disclosed in the following “Fund expense ratios” table. Delaware Management Company has agreed to reimburse certain expenses and/or waive certain fees in order to prevent total annual fund operating expenses (excluding any 12b-1 fees, acquired fund fees and expenses, taxes, interest, short sale dividend and interest expenses, brokerage fees, certain insurance costs, and nonroutine expenses or costs, including, but not limited to, those relating to reorganizations, litigation, conducting shareholder meetings, and liquidations (collectively, nonroutine expenses)) from exceeding 0.91% and 0.66% of the Fund’s average daily net assets for Class A shares and Institutional Class shares, respectively, of the Fund’s average daily net assets from January 1, 2020 through December 31, 2020.* Please see the most recent prospectus and any applicable supplement(s) for additional information on these fee waivers and/or reimbursements. Please see the “Financial highlights” section in this report for the most recent expense ratios.
| Fund expense ratios | | Class A | | Institutional Class | |
| Total annual operating expenses | | | | | |
| (without fee waivers) | | 1.16% | | 0.91% | |
| Net expenses (including fee | | | | | |
| waivers, if any) | | 0.91% | | 0.66% | |
| Type of waiver | | Contractual | | Contractual | |
| * | The aggregate contractual waiver period covering this report is from October 4, 2019 through October 31, 2021. |
11
Performance summaries
Delaware Tax–Free Oregon Fund
Performance of a $10,000 investment1
Class A shares
Average annual total returns from December 31, 2010 through December 31, 2020
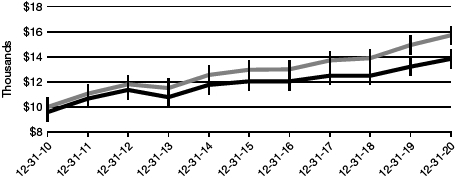
| For period beginning December 31, 2010 through December 31, 2020 | Starting value | Ending value |
| | | Bloomberg Barclays Municipal Bond Index | $10,000 | $15,718 |
| | | Delaware Tax–Free Oregon Fund — Class A shares | $9,600 | $13,841 |
Institutional Class shares
Average annual total returns from May 1, 2013 through December 31, 2020
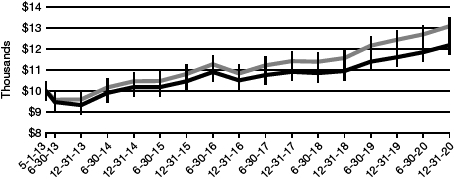
| For period beginning May 1, 2013 through December 31, 2020 | Starting value | Ending value |
| | | Bloomberg Barclays Municipal Bond Index | $10,000 | $13,095 |
| | | Delaware Tax–Free Oregon Fund — Institutional Class shares | $10,000 | $12,190 |
12
| 1 | The “Performance of a $10,000 investment” graph assumes $10,000 invested in Institutional Class and Class A shares of the Fund on December 31, 2010, and includes the effect of a 4.50% front-end sales charge (for Class A shares) and the reinvestment of all distributions. The graph does not reflect the deduction of taxes the shareholders would pay on Fund distributions or redemptions of Fund shares. Expense limitations were in effect for some or all of the periods shown. Performance would have been lower had expense limitations not been in effect. Expenses are listed in the “Fund expense ratios” table on page 11. Please note additional details on pages 10 through 13. |
The graph also assumes $10,000 invested in the Bloomberg Barclays Municipal Bond Index as of December 31, 2010. The Bloomberg Barclays Municipal Bond Index measures the total return performance of the long-term, investment grade tax-exempt bond market.
Index performance returns do not reflect any management fees, transaction costs, or expenses. Indices are unmanaged and one cannot invest directly in an index. Past performance is not a guarantee of future results.
Performance of other Fund classes will vary due to different charges and expenses.
| | Nasdaq symbols | | CUSIPs | |
| Class A | | | FTORX | | | 245912712 | |
| Institutional Class | | | FTOTX | | | 245912696 | |
13
Disclosure of Fund expenses
For the six-month period from July 1, 2020 to December 31, 2020 (Unaudited)
As a shareholder of a Fund, you incur two types of costs: (1) transaction costs, including sales charges (loads) on purchase payments, reinvested dividends, or other distributions; redemption fees; and exchange fees; and (2) ongoing costs, including management fees; distribution and service (12b-1) fees; and other Fund expenses. The following examples are intended to help you understand your ongoing costs (in dollars) of investing in a Fund and to compare these costs with the ongoing costs of investing in other mutual funds.
The examples are based on an investment of $1,000 invested at the beginning of the period and held for the entire six-month period from July 1, 2020 to December 31, 2020.
Actual expenses
The first section of the tables shown, “Actual Fund return,” provides information about actual account values and actual expenses. You may use the information in this section of the table, together with the amount you invested, to estimate the expenses that you paid over the period. Simply divide your account value by $1,000 (for example, an $8,600 account value divided by $1,000 = 8.6), then multiply the result by the number in the first section under the heading entitled “Expenses Paid During Period” to estimate the expenses you paid on your account during this period.
Hypothetical example for comparison purposes
The second section of the tables shown, “Hypothetical 5% return,” provides information about hypothetical account values and hypothetical expenses based on the Funds’ actual expense ratios and an assumed rate of return of 5% per year before expenses, which is not the Funds’ actual return. The hypothetical account values and expenses may not be used to estimate the actual ending account balance or expenses you paid for the period. You may use this information to compare the ongoing costs of investing in each Fund and other funds. To do so, compare this 5% hypothetical example with the 5% hypothetical examples that appear in the shareholder reports of the other funds.
Please note that the expenses shown in the tables are meant to highlight your ongoing costs only and do not reflect any transactional costs, such as sales charges (loads), redemption fees, or exchange fees. Therefore, the second section of each table is useful in comparing ongoing costs only, and will not help you determine the relative total costs of owning different funds. In addition, if these transactional costs were included, your costs would have been higher. The Funds’ expenses shown in the tables reflect fee waivers in effect and assume reinvestment of all dividends and distributions.
14
Delaware Tax–Free New Jersey Fund
Expense analysis of an investment of $1,000
| | Beginning | | Ending | | | | | | | Expenses |
| | Account Value | | Account Value | | Annualized | | Paid During Period |
| | 7/1/20 | | 12/31/20 | | Expense Ratio | | 7/1/20 to 12/31/20* |
| Actual Fund return† | | | | | | | | | | | | | | | | | | | | |
| Class A | | | $ | 1,000.00 | | | | $ | 1,040.90 | | | | 0.90 | % | | | | $ | 4.62 | |
| Institutional Class | | | | 1,000.00 | | | | | 1,042.20 | | | | 0.68 | % | | | | | 3.49 | |
| Hypothetical 5% return (5% return before expenses) |
| Class A | | | $ | 1,000.00 | | | | $ | 1,020.61 | | | | 0.90 | % | | | | $ | 4.57 | |
| Institutional Class | | | | 1,000.00 | | | | | 1,021.72 | | | | 0.68 | % | | | | | 3.46 | |
| | |
Delaware Tax–Free Oregon Fund
Expense analysis of an investment of $1,000 |
| | | | | | | | | | | | |
| | Beginning | | Ending | | | | | | | Expenses |
| | Account Value | | Account Value | | Annualized | | Paid During Period |
| | 7/1/20 | | 12/31/20 | | Expense Ratio | | 7/1/20 to 12/31/20* |
| Actual Fund return† | | | | | | | | | | | | | | | | | | | | |
| Class A | | | $ | 1,000.00 | | | | $ | 1,026.90 | | | | 0.91 | % | | | | $ | 4.64 | |
| Institutional Class | | | | 1,000.00 | | | | | 1,028.20 | | | | 0.66 | % | | | | | 3.36 | |
| Hypothetical 5% return (5% return before expenses) |
| Class A | | | $ | 1,000.00 | | | | $ | 1,020.56 | | | | 0.91 | % | | | | $ | 4.62 | |
| Institutional Class | | | | 1,000.00 | | | | | 1,021.82 | | | | 0.66 | % | | | | | 3.35 | |
| * | “Expenses Paid During Period” are equal to the relevant Fund’s annualized expense ratio, multiplied by the average account value over the period, multiplied by 184/366 (to reflect the one-half year period). |
| † | Because actual returns reflect only the most recent six-month period, the returns shown may differ significantly from fiscal year returns. |
15
| Security type / sector / state / territory allocations |
| Delaware Tax–Free New Jersey Fund | As of December 31, 2020 (Unaudited) |
Sector designations may be different than the sector designations presented in other Fund materials.
| Security type / sector | | Percentage of net assets |
| Municipal Bonds* | | | 98.50 | % | |
| Corporate Revenue Bonds | | | 1.91 | % | |
| Education Revenue Bonds | | | 12.41 | % | |
| Electric Revenue Bonds | | | 1.38 | % | |
| Healthcare Revenue Bonds | | | 6.89 | % | |
| Housing Revenue Bond | | | 2.75 | % | |
| Lease Revenue Bonds | | | 15.45 | % | |
| Local General Obligation Bonds | | | 18.71 | % | |
| Resource Recovery Revenue Bond | | | 0.84 | % | |
| Special Tax Revenue Bonds | | | 24.85 | % | |
| State General Obligation Bonds | | | 3.52 | % | |
| Transportation Revenue Bonds | | | 9.79 | % | |
| Total Value of Securities | | | 98.50 | % | |
| Receivables and Other Assets Net of Liabilities | | | 1.50 | % | |
| Total Net Assets | | | 100.00 | % | |
| | |
| * As of the date of this report, Delaware Tax–Free New Jersey Fund held bonds issued by or on behalf of territories and the states of the US as follows: |
| | | | | | |
| State / territory | | Percentage of net assets |
| Guam | | | 1.47 | % | |
| New Jersey | | | 80.26 | % | |
| New York | | | 1.92 | % | |
| Pennsylvania | | | 2.39 | % | |
| Puerto Rico | | | 11.81 | % | |
| US Virgin Islands | | | 0.65 | % | |
| Total Value of Securities | | | 98.50 | % | |
16
| Security type / sector / state / territory allocations |
| Delaware Tax–Free Oregon Fund | As of December 31, 2020 (Unaudited) |
Sector designations may be different than the sector designations presented in other Fund materials.
| Security type / sector | | Percentage of net assets |
| Municipal Bonds* | | | 98.25 | % | |
| Corporate Revenue Bond | | | 0.39 | % | |
| Education Revenue Bonds | | | 6.94 | % | |
| Electric Revenue Bonds | | | 1.21 | % | |
| Healthcare Revenue Bonds | | | 13.04 | % | |
| Housing Revenue Bonds | | | 4.14 | % | |
| Local General Obligation Bonds | | | 29.50 | % | |
| Pre-Refunded Bonds | | | 17.28 | % | |
| Special Tax Revenue Bonds | | | 12.00 | % | |
| State General Obligation Bonds | | | 5.60 | % | |
| Transportation Revenue Bonds | | | 5.56 | % | |
| Water & Sewer Revenue Bonds | | | 2.59 | % | |
| Total Value of Securities | | | 98.25 | % | |
| Receivables and Other Assets Net of Liabilities | | | 1.75 | % | |
| Total Net Assets | | | 100.00 | % | |
| | |
| * As of the date of this report, Delaware Tax–Free Oregon Fund held bonds issued by or on behalf of territories and the states of the US as follows: |
| | | | | | |
| State / territory | | Percentage of net assets |
| Guam | | | 1.07 | % | |
| Oregon | | | 85.47 | % | |
| Puerto Rico | | | 11.31 | % | |
| US Virgin Islands | | | 0.40 | % | |
| Total Value of Securities | | | 98.25 | % | |
17
| Schedules of investments | |
| Delaware Tax–Free New Jersey Fund | December 31, 2020 |
| | | | | Principal amount° | | Value (US $) |
| Municipal Bonds — 98.50% | | | | | |
| Corporate Revenue Bonds — 1.91% | | | | | |
| New Jersey Tobacco Settlement Financing | | | | | |
| | Corporation | | | | | |
| | (Subordinate) | | | | | |
| | Series B 5.00% 6/1/46 | | 500,000 | | $ | 584,015 |
| | | | | | | 584,015 |
| Education Revenue Bonds — 12.41% | | | | | |
| New Jersey Educational Facilities Authority Revenue | | | | | |
| | (Montclair State University) | | | | | |
| | Series A 5.00% 7/1/39 | | 1,000,000 | | | 1,109,440 |
| | Series D 5.00% 7/1/36 | | 500,000 | | | 570,690 |
| | (Princeton University) | | | | | |
| | Series I 5.00% 7/1/32 | | 500,000 | | | 640,845 |
| | (Ramapo College) | | | | | |
| | Series A 5.00% 7/1/35 (AGM) | | 1,000,000 | | | 1,215,750 |
| | (Stevens Institute of Technology) | | | | | |
| | Series A 4.00% 7/1/50 | | 225,000 | | | 248,051 |
| | | | | | | 3,784,776 |
| Electric Revenue Bonds — 1.38% | | | | | |
| Puerto Rico Electric Power Authority Revenue | | | | | |
| | Series A 6.75% 7/1/36 ‡ | | 180,000 | | | 150,075 |
| | Series TT 5.00% 7/1/32 ‡ | | 335,000 | | | 271,350 |
| | | | | | | 421,425 |
| Healthcare Revenue Bonds — 6.89% | | | | | |
| New Jersey Health Care Facilities Financing | | | | | |
| | Authority Revenue | | | | | |
| | (Hackensack Meridian Health Obligated Group) | | | | | |
| | 5.00% 7/1/35 | | 1,000,000 | | | 1,235,950 |
| | (Valley Health System Obligated Group) | | | | | |
| | 4.00% 7/1/44 | | 750,000 | | | 865,372 |
| | | | | | | 2,101,322 |
| Housing Revenue Bond — 2.75% | | | | | |
| New Jersey Housing & Mortgage Finance Agency | | | | | |
| | (Single Family Housing) | | | | | |
| | Series D 4.00% 4/1/25 (AMT) | | 750,000 | | | 839,018 |
| | | | | | | 839,018 |
| Lease Revenue Bonds — 15.45% | | | | | |
| Garden State Preservation Trust | | | | | |
| | Series A 5.75% 11/1/28 (AGM) | | 1,000,000 | | | 1,258,460 |
| Hudson County Improvement Authority Revenue | | | | |
| (Hudson County Lease Project) | | | | |
| | 5.375% 10/1/24 (AGM) | | 1,000,000 | | | 1,188,230 |
18
| | | Principal amount° | | Value (US $) |
| Municipal Bonds (continued) | | | | | |
| Lease Revenue Bonds (continued) | | | | | |
| | Mercer County Improvement Authority Revenue | | | | | |
| (Courthouse Annex Project) | | | | | |
| 5.00% 9/1/40 | | 500,000 | | $ | 595,980 |
| New Jersey Economic Development Authority | | | | | |
| (Transit Transportation Project) | | | | | |
| Series A 4.00% 11/1/44 | | 1,000,000 | | | 1,109,030 |
| New Jersey State Transportation Trust Fund | | | | | |
| Authority Revenue | | | | | |
| (Transportation System) | | | | | |
| Series A 5.00% 12/15/23 | | 500,000 | | | 562,555 |
| | | | | | 4,714,255 |
| Local General Obligation Bonds — 18.71% | | | | | |
| Bayonne | | | | | |
| (School Refunding Bonds) | | | | | |
| 5.00% 7/1/39 (BAM) | | 500,000 | | | 599,645 |
| Belleville Board of Education | | | | | |
| 4.00% 9/1/37 (BAM) | | 1,000,000 | | | 1,095,870 |
| Ewing Township Board of Education | | | | | |
| 4.00% 7/15/36 | | 1,000,000 | | | 1,183,110 |
| Hudson | | | | | |
| (Energy Savings Obligation) | | | | | |
| 4.00% 6/15/38 | | 1,000,000 | | | 1,175,470 |
| Livingston Township School District | | | | | |
| 5.00% 7/15/37 | | 1,000,000 | | | 1,184,450 |
| Township of Montclair | | | | | |
| (Parking Utility Refunding Bonds) | | | | | |
| Series A 5.00% 1/1/37 | | 415,000 | | | 470,332 |
| | | | | | 5,708,877 |
| Resource Recovery Revenue Bond — 0.84% | | | | | |
| Union County, New Jersey Improvement Authority | | | | | |
| (Aries Linden, LLC Project) | | | | | |
| 144A 6.75% 12/1/41 (AMT) # | | 250,000 | | | 256,463 |
| | | | | | 256,463 |
| Special Tax Revenue Bonds — 24.85% | | | | | |
| Bergen County Improvement Authority Revenue | | | | | |
| (Guaranteed Governmental Pooled Loan) | | | | | |
| Series B 5.00% 2/15/39 | | 1,000,000 | | | 1,132,380 |
| Burlington County Bridge Commission | | | | | |
| (Governmental Loan Program) | | | | | |
| 4.00% 8/1/35 | | 465,000 | | | 555,917 |
19
Schedules of investments
Delaware Tax–Free New Jersey Fund
| | | Principal amount° | | Value (US $) |
| Municipal Bonds (continued) | | | | | |
| Special Tax Revenue Bonds (continued) | | | | | |
| | Camden County, New Jersey Improvement | | | | | |
| Authority Revenue | | | | | |
| (County Capital Program) | | | | | |
| Series A 5.00% 1/15/40 | | 1,000,000 | | $ | 1,160,500 |
| Essex County, New Jersey Improvement Authority | | | | | |
| Revenue | | | | | |
| 5.50% 10/1/27 (NATL) | | 1,000,000 | | | 1,337,760 |
| GDB Debt Recovery Authority of Puerto Rico | | | | | |
| (Taxable) | | | | | |
| 7.50% 8/20/40 | | 370,000 | | | 284,437 |
| Hudson County Improvement Authority Revenue | | | | | |
| (Guttenberg General Obligation Bond Project) | | | | | |
| 5.00% 8/1/42 | | 500,000 | | | 587,440 |
| Monmouth County Improvement Authority Revenue | | | | | |
| 5.00% 1/15/29 | | 190,000 | | | 190,642 |
| Puerto Rico Sales Tax Financing Revenue | | | | | |
| (Restructured) | | | | | |
| Series A-1 4.75% 7/1/53 | | 1,370,000 | | | 1,509,000 |
| Series A-1 5.00% 7/1/58 | | 360,000 | | | 402,084 |
| Series A-2 4.329% 7/1/40 | | 205,000 | | | 222,659 |
| Virgin Islands Public Finance Authority Revenue | | | | | |
| (Matching Fund Loan Note) | | | | | |
| Series A 4.00% 10/1/22 | | 100,000 | | | 98,920 |
| Series A 5.00% 10/1/29 | | 100,000 | | | 100,006 |
| | | | | | 7,581,745 |
| State General Obligation Bonds — 3.52% | | | | | |
| Commonwealth of Puerto Rico | | | | | |
| (General Obligation) | | | | | |
| Series A 8.00% 7/1/35 ‡ | | 280,000 | | | 192,500 |
| (Public Improvement) | | | | | |
| Series A 5.00% 7/1/24 ‡ | | 75,000 | | | 58,125 |
| Series A 5.00% 7/1/41 ‡ | | 120,000 | | | 84,000 |
| Series A 5.25% 7/1/34 ‡ | | 60,000 | | | 46,650 |
| Series A 5.375% 7/1/33 ‡ | | 120,000 | | | 92,250 |
| Series B 5.75% 7/1/38 ‡ | | 175,000 | | | 133,000 |
| Series C 6.00% 7/1/39 ‡ | | 155,000 | | | 118,769 |
| (Unrefunded Balance - Public Improvement) | | | | | |
| Series B 5.00% 7/1/35 ‡ | | 50,000 | | | 38,812 |
| State of New Jersey | | | | | |
| Series A 4.00% 6/1/31 | | 250,000 | | | 309,425 |
| | | | | | 1,073,531 |
20
| | | Principal amount° | | Value (US $) |
| Municipal Bonds (continued) | | | | | |
| Transportation Revenue Bonds — 9.79% | | | | | |
| | Delaware River Port Authority Revenue | | | | | |
| 5.00% 1/1/30 | | 650,000 | | $ | 729,027 |
| New Jersey Turnpike Authority Revenue | | | | | |
| Series A 5.00% 1/1/48 | | 500,000 | | | 621,585 |
| Port Authority of Guam Revenue | | | | | |
| Series A 5.00% 7/1/48 | | 375,000 | | | 448,069 |
| Port Authority of New York & New Jersey | | | | | |
| 5.00% 10/15/41 | | 500,000 | | | 585,570 |
| South Jersey Port Corporation | | | | | |
| (Subordinated Marine Terminal) | | | | | |
| Series B 5.00% 1/1/48 (AMT) | | 535,000 | | | 601,693 |
| | | | | | 2,985,944 |
| Total Municipal Bonds (cost $27,178,391) | | | | | 30,051,371 |
| Total Value of Securities—98.50% | | | | | |
| (cost $27,178,391) | | | | $ | 30,051,371 |
| ° | Principal amount shown is stated in USD unless noted that the security is denominated in another currency. |
| ‡ | Non-income producing security. Security is currently in default. |
| # | Security exempt from registration under Rule 144A of the Securities Act of 1933, as amended. At December 31, 2020, the aggregate value of Rule 144A securities was $256,463, which represents 0.84% of the Fund’s net assets. See Note 9 in “Notes to financial statements.” |
Summary of abbreviations:
AGM – Insured by Assured Guaranty Municipal Corporation
AMT – Subject to Alternative Minimum Tax
BAM – Insured by Build America Mutual Assurance
LLC – Limited Liability Corporation
NATL – Insured by National Public Finance Guarantee Corporation
See accompanying notes, which are an integral part of the financial statements.
21
| Schedules of investments | |
| Delaware Tax–Free Oregon Fund | December 31, 2020 |
| | | Principal amount° | | Value (US $) |
| Municipal Bonds — 98.25% | | | | | |
| Corporate Revenue Bond — 0.39% | | | | | |
| | Oregon State Business Development Commission | | | | | |
| Economic Development Revenue | | | | | |
| (Red Rock Biofuels LLC Energy Project) | | | | | |
| 144A 6.50% 4/1/31 (AMT) #, ‡ | | 300,000 | | $ | 165,000 |
| | | | | | 165,000 |
| Education Revenue Bonds — 6.94% | | | | | |
| Oregon Health & Science University Revenue | | | | | |
| Series A 4.00% 7/1/44 | | 600,000 | | | 714,090 |
| Oregon State Facilities Authority Revenue | | | | | |
| (Metro East Web Academy Project) | | | | | |
| Series A 144A 5.00% 6/15/49 # | | 1,000,000 | | | 1,044,780 |
| University of Oregon General Revenue | | | | | |
| Series A 5.00% 4/1/45 | | 1,000,000 | | | 1,145,930 |
| | | | | | 2,904,800 |
| Electric Revenue Bonds — 1.21% | | | | | |
| Puerto Rico Electric Power Authority Revenue | | | | | |
| Series A 6.75% 7/1/36 ‡ | | 240,000 | | | 200,100 |
| Series TT 5.00% 7/1/32 ‡ | | 380,000 | | | 307,800 |
| | | | | | 507,900 |
| Healthcare Revenue Bonds — 13.04% | | | | | |
| Clackamas County Hospital Facility Authority | | | | | |
| (Rose Villa Project) | | | | | |
| Series A 5.375% 11/15/55 | | 500,000 | | | 537,920 |
| Hospital Facilities Authority of Multnomah County, | | | | | |
| Oregon | | | | | |
| (Mirabella At South Waterfront Project) | | | | | |
| Series A 5.40% 10/1/44 | | 900,000 | | | 947,772 |
| Oregon State Facilities Authority Revenue | | | | | |
| (Providence Health & Services) | | | | | |
| Series C 5.00% 10/1/45 | | 1,650,000 | | | 1,889,118 |
| (Samaritan Health Services Project) | | | | | |
| Series A 5.00% 10/1/40 | | 750,000 | | | 945,690 |
| Salem, Oregon Hospital Facility Authority Revenue | | | | | |
| (Multi Model - Salem Health Project) | | | | | |
| Series A 4.00% 5/15/49 | | 1,000,000 | | | 1,135,670 |
| | | | | | 5,456,170 |
| Housing Revenue Bonds — 4.14% | | | | | |
| Home Forward Multifamily Housing Revenue | | | | | |
| (Gretchen Kafoury Commons) | | | | | |
| 5.00% 1/1/29 | | 565,000 | | | 625,715 |
22
| | | Principal amount° | | Value (US $) |
| Municipal Bonds (continued) | | | | | |
| Housing Revenue Bonds (continued) | | | | | |
| Oregon State Housing & Community Services | | | | | |
| | Department Mortgage Revenue | | | | | |
| (Single-Family Mortgage Program) | | | | | |
| Series A 4.00% 7/1/50 | | 990,000 | | $ | 1,107,335 |
| | | | | | 1,733,050 |
| Local General Obligation Bonds — 29.50% | | | | | |
| Central Oregon Community College | | | | | |
| 5.00% 6/15/30 | | 500,000 | | | 501,035 |
| Clackamas County School District No. 12 North | | | | | |
| Clackamas | | | | | |
| Series B 5.00% 6/15/37 | | 1,500,000 | | | 1,861,515 |
| Clackamas County School District No. 7J Lake | | | | | |
| Oswego | | | | | |
| 5.25% 6/1/21 (AGM) | | 1,000,000 | | | 1,020,750 |
| Columbia County School District No. 502 | | | | | |
| 5.00% 6/15/36 | | 575,000 | | | 713,247 |
| Linn County Community School District No. 9 | | | | | |
| Lebanon | | | | | |
| 5.50% 6/15/27 (NATL) | | 1,000,000 | | | 1,317,420 |
| Marion County School District No. 103 Woodburn | | | | | |
| 5.00% 6/1/30 | | 300,000 | | | 396,546 |
| 5.00% 6/15/35 | | 500,000 | | | 587,965 |
| Newport, Oregon | | | | | |
| Series B 0.00% 6/1/29 (AGC) ^ | | 1,225,000 | | | 1,103,750 |
| Portland, Oregon Revenue | | | | | |
| (Portland Building Project) | | | | | |
| Series B 5.00% 6/15/34 | | 1,000,000 | | | 1,290,840 |
| Redmond, Oregon | | | | | |
| Series B-1 5.00% 6/1/38 | | 1,000,000 | | | 1,272,930 |
| Salem-Keizer School District No. 24J | | | | | |
| 5.00% 6/15/33 | | 1,000,000 | | | 1,291,440 |
| Washington County Oregon School District No. 15 | | | | | |
| Forest Grove | | | | | |
| Series B 0.00% 6/15/23 ^ | | 1,000,000 | | | 987,920 |
| | | | | | 12,345,358 |
| Pre-Refunded Bonds — 17.28% | | | | | |
| Eugene Oregon Electric Utility System Revenue | | | | | |
| 5.00% 8/1/38-22 § | | 2,000,000 | | | 2,152,600 |
| Multnomah County School District No. 3 Parkrose | | | | | |
| Series A 5.00% 6/30/35-21 § | | 500,000 | | | 511,805 |
| Oregon Health & Science University Revenue | | | | | |
| Series E 5.00% 7/1/32-22 § | | 1,475,000 | | | 1,581,583 |
23
Schedules of investments
Delaware Tax–Free Oregon Fund
| | | | | Principal amount° | | | Value (US $) |
| Municipal Bonds (continued) | | | | | |
| Pre-Refunded Bonds (continued) | | | | | |
| Tigard, Oregon Water Revenue | | | | | |
| | 5.00% 8/1/31-22 § | | 1,695,000 | | $ | 1,822,922 |
| Umatilla County Oregon School District No. 16R | | | | | |
| | Pendleton | | | | | |
| | Series A 5.00% 6/15/33-24 § | | 1,000,000 | | | 1,165,060 |
| | | | | | | 7,233,970 |
| Special Tax Revenue Bonds — 12.00% | | | | | |
| GDB Debt Recovery Authority of Puerto Rico | | | | | |
| | (Taxable) | | | | | |
| | 7.50% 8/20/40 | | 475,000 | | | 365,156 |
| Oregon State Department Administrative Services | | | | | |
| | Lottery Revenue | | | | | |
| | Series A 5.00% 4/1/35 | | 1,000,000 | | | 1,171,750 |
| Portland, Oregon Revenue | | | | | |
| | (Central Eastside) | | | | | |
| | Series B 5.25% 6/15/30 | | 500,000 | | | 510,530 |
| Puerto Rico Sales Tax Financing Revenue | | | | | |
| | (Restructured) | | | | | |
| | Series A-1 4.75% 7/1/53 | | 1,770,000 | | | 1,949,584 |
| | Series A-1 5.075% 7/1/46 ^ | | 840,000 | | | 260,938 |
| | Series A-2 4.329% 7/1/40 | | 300,000 | | | 325,842 |
| | Series A-2 4.329% 7/1/40 | | 250,000 | | | 271,360 |
| Virgin Islands Public Finance Authority Revenue | | | | | |
| | (Virgin Islands Matching Fund Loan Note) | | | | | |
| | Series A 4.00% 10/1/22 | | 70,000 | | | 69,244 |
| | Series A 5.00% 10/1/29 | | 100,000 | | | 100,006 |
| | | | | | | 5,024,410 |
| State General Obligation Bonds — 5.60% | | | | | |
| Commonwealth of Puerto Rico | | | | | |
| | (General Obligation) | | | | | |
| | Series A 8.00% 7/1/35 ‡ | | 360,000 | | | 247,500 |
| | (Public Improvement) | | | | | |
| | Series A 5.00% 7/1/24 ‡ | | 95,000 | | | 73,625 |
| | Series A 5.00% 7/1/41 ‡ | | 140,000 | | | 98,000 |
| | Series A 5.25% 7/1/34 ‡ | | 240,000 | | | 186,600 |
| | Series A 5.375% 7/1/33 ‡ | | 140,000 | | | 107,625 |
| | Series B 5.75% 7/1/38 ‡ | | 200,000 | | | 152,000 |
| | Series C 6.00% 7/1/39 ‡ | | 180,000 | | | 137,925 |
| | (Unrefunded Balance - Public Improvement) | | | | | |
| | Series B 5.00% 7/1/35 ‡ | | 65,000 | | | 50,456 |
24
| | | | | Principal amount° | | Value (US $) |
| Municipal Bonds (continued) | | | | | |
| State General Obligation Bonds (continued) | | | | | |
| Oregon State | | | | | |
| | (Article XI-Q State Projects) | | | | | |
| | Series A 5.00% 5/1/44 | | 1,000,000 | | $ | 1,289,840 |
| | | | | | | 2,343,571 |
| Transportation Revenue Bonds — 5.56% | | | | | |
| Port Authority of Guam Revenue | | | | | |
| | Series A 5.00% 7/1/48 | | 375,000 | | | 448,069 |
| Port of Portland Oregon Airport Revenue | | | | | |
| | 5.00% 7/1/42 (AMT) | | 1,100,000 | | | 1,292,258 |
| | (Portland International Airport) | | | | | |
| | 5.00% 7/1/31 | | 500,000 | | | 585,205 |
| | | | | | | 2,325,532 |
| Water & Sewer Revenue Bonds — 2.59% | | | | | |
| Hermiston, Oregon Water & Sewer System Revenue | | | | | |
| | 5.00% 11/1/34 (AGM) | | 500,000 | | | 576,185 |
| Portland, Oregon Water System Revenue | | | | | |
| | (First Lien) | | | | | |
| | Series A 5.00% 5/1/34 | | 500,000 | | | 507,345 |
| | | | | | | 1,083,530 |
| Total Municipal Bonds (cost $37,784,725) | | | | | 41,123,291 |
| Total Value of Securities—98.25% | | | | | |
| (cost $37,784,725) | | | | $ | 41,123,291 |
| ° | Principal amount shown is stated in USD unless noted that the security is denominated in another currency. |
| # | Security exempt from registration under Rule 144A of the Securities Act of 1933, as amended. At December 31, 2020, the aggregate value of Rule 144A securities was $1,209,780, which represents 2.89% of the Fund’s net assets. See Note 9 in “Notes to financial statements.” |
| ‡ | Non-income producing security. Security is currently in default. |
| ^ | Zero-coupon security. The rate shown is the effective yield at the time of purchase. |
| § | Pre-refunded bonds. Municipal bonds that are generally backed or secured by US Treasury bonds. For pre-refunded bonds, the stated maturity is followed by the year in which the bond will be pre-refunded. See Note 9 in “Notes to financial statements.” |
Summary of abbreviations:
AGC – Insured by Assured Guaranty Corporation
AGM – Insured by Assured Guaranty Municipal Corporation
AMT – Subject to Alternative Minimum Tax
LLC – Limited Liability Corporation
25
Schedules of investments
Delaware Tax–Free Oregon Fund
Summary of abbreviations: (continued)
NATL – Insured by National Public Finance Guarantee Corporation
See accompanying notes, which are an integral part of the financial statements.
26
| Statements of assets and liabilities | December 31, 2020 |
| | | | Delaware Tax–Free | | Delaware Tax–Free |
| | New Jersey Fund | | Oregon Fund |
| Assets: | | | | | | |
| Investments, at value* | | $ | 30,051,371 | | $ | 41,123,291 |
| Cash | | | 71,262 | | | 392,750 |
| Interest receivable | | | 444,937 | | | 402,043 |
| Receivable for fund shares sold | | | 7,853 | | | 667 |
| Other assets | | | 1,777 | | | 1,955 |
| Total Assets | | | 30,577,200 | | | 41,920,706 |
| Liabilities: | | | | | | |
| Payable for fund shares redeemed | | | 18,078 | | | 5,811 |
| Accounting and administration fees payable to non-affiliates | | | 10,649 | | | 10,879 |
| Investment management fees payable to affiliates | | | 8,525 | | | 13,333 |
| Distribution payable | | | 7,041 | | | 8,733 |
| Distribution fees payable to affiliates | | | 6,098 | | | 8,166 |
| Audit and tax fees payable | | | 5,500 | | | 5,500 |
| Reports and statements to shareholders expenses payable to | | | | | | |
| non-affiliates | | | 4,993 | | | 5,375 |
| Pricing fees payable | | | 4,808 | | | 4,841 |
| Other accrued expenses | | | 2,790 | | | 3,039 |
| Accounting and administration expenses payable to affiliates | | | 426 | | | 458 |
| Dividend disbursing and transfer agent fees and expenses | | | | | | |
| payable to affiliates | | | 225 | | | 308 |
| Trustees’ fees and expenses payable to affiliates | | | 98 | | | 134 |
| Reports and statements to shareholders expenses payable to | | | | | | |
| affiliates | | | 40 | | | 42 |
| Legal fees payable to affiliates | | | 31 | | | 54 |
| Total Liabilities | | | 69,302 | | | 66,673 |
| Total Net Assets | | $ | 30,507,898 | | $ | 41,854,033 |
| |
| Net Assets Consist of: | | | | | | |
| Paid-in capital | | $ | 27,509,585 | | $ | 38,991,551 |
| Total distributable earnings (loss) | | | 2,998,313 | | | 2,862,482 |
| Total Net Assets | | $ | 30,507,898 | | $ | 41,854,033 |
27
Statements of assets and liabilities
| | Delaware Tax–Free | | Delaware Tax–Free |
| | New Jersey Fund | | Oregon Fund |
| Net Asset Value | | | | | | | | |
| Class A: | | | | | | | | |
| Net assets | | $ | 28,487,607 | | | $ | 38,294,891 | |
| Shares of beneficial interest outstanding, unlimited authorization, | | | | | | | | |
| no par | | | 2,215,638 | | | | 2,793,495 | |
| Net asset value per share | | $ | 12.86 | | | $ | 13.71 | |
| Sales charge | | | 4.50 | % | | | 4.50 | % |
| Offering price per share, equal to net asset value per share / (1 - | | | | | | | | |
| sales charge) | | $ | 13.47 | | | $ | 14.36 | |
| | | | | | | | | |
| Institutional Class: | | | | | | | | |
| Net assets | | $ | 2,020,291 | | | $ | 3,559,142 | |
| Shares of beneficial interest outstanding, unlimited authorization, | | | | | | | | |
| no par | | | 157,340 | | | | 260,034 | |
| Net asset value per share | | $ | 12.84 | | | $ | 13.69 | |
____________________
* Investments, at cost | | $ | 27,178,391 | | | $ | 37,784,725 | |
See accompanying notes, which are an integral part of the financial statements.
28
| Statements of operations | Year ended December 31, 2020 |
| | Delaware Tax–Free | | Delaware Tax–Free |
| | New Jersey Fund | | Oregon Fund |
| Investment Income: | | | | | | | | |
| Interest | | $ | 1,180,646 | | | $ | 1,488,280 | |
| | | | | | | | | |
| Expenses: | | | | | | | | |
| Management fees | | | 194,465 | | | | 242,375 | |
| Distribution expenses — Class A | | | 83,221 | | | | 101,958 | |
| Audit and tax fees | | | 63,090 | | | | 63,390 | |
| Accounting and administration expenses | | | 45,683 | | | | 47,123 | |
| Dividend disbursing and transfer agent fees and expenses | | | 23,739 | | | | 27,699 | |
| Reports and statements to shareholders expenses | | | 12,593 | | | | 13,617 | |
| Registration fees | | | 2,997 | | | | 4,797 | |
| Trustees’ fees and expenses | | | 2,083 | | | | 2,581 | |
| Legal fees | | | 1,406 | | | | 2,254 | |
| Custodian fees | | | 380 | | | | 616 | |
| Other | | | 9,331 | | | | 9,822 | |
| | | | 438,988 | | | | 516,232 | |
| Less expenses waived | | | (124,572 | ) | | | (122,709 | ) |
| Less expenses paid indirectly | | | (584 | ) | | | (551 | ) |
| Total operating expenses | | | 313,832 | | | | 392,972 | |
| Net Investment Income | | | 866,814 | | | | 1,095,308 | |
| Net Realized and Unrealized Gain (Loss): | | | | | | | | |
| Net realized gain on investments | | | 843,759 | | | | 699,031 | |
| Net change in unrealized appreciation (depreciation) of | | | | | | | | |
| investments | | | (106,443 | ) | | | 202,592 | |
| Net Realized and Unrealized Gain | | | 737,316 | | | | 901,623 | |
| Net Increase in Net Assets Resulting from Operations | | $ | 1,604,130 | | | $ | 1,996,931 | |
See accompanying notes, which are an integral part of the financial statements.
29
Statements of changes in net assets
Delaware Tax–Free New Jersey Fund
| | Year ended |
| | 12/31/20 | | 12/31/19 |
| Increase (Decrease) in Net Assets from Operations: | | | | | | | | |
| Net investment income | | $ | 866,814 | | | $ | 1,256,125 | |
| Net realized gain | | | 843,759 | | | | 631,855 | |
| Net change in unrealized appreciation (depreciation) | | | (106,443 | ) | | | 1,254,303 | |
| Net increase in net assets resulting from operations | | | 1,604,130 | | | | 3,142,283 | |
| |
| Dividends and Distributions to Shareholders from: | | | | | | | | |
| Distributable earnings: | | | | | | | | |
| Class A | | | (1,585,015 | ) | | | (1,172,604 | ) |
| Class B1 | | | — | | | | (2,511 | ) |
| Institutional Class2 | | | (110,426 | ) | | | (87,650 | ) |
| Class R63, 4 | | | — | | | | (221 | ) |
| | | | (1,695,441 | ) | | | (1,262,986 | ) |
| |
| Capital Share Transactions: | | | | | | | | |
| Proceeds from shares sold: | | | | | | | | |
| Class A | | | 610,856 | | | | 2,087,168 | |
| Class B1 | | | — | | | | 450 | |
| Institutional Class2 | | | 22,433 | | | | 250,098 | |
| Class R63, 4 | | | — | | | | 9,998 | |
| Net asset value of shares issued upon reinvestment of | | | | | | | | |
| dividends and distributions: | | | | | | | | |
| Class A | | | 1,413,826 | | | | 968,175 | |
| Class B1 | | | — | | | | 2,266 | |
| Institutional Class2 | | | 109,952 | | | | 84,709 | |
| Class R63, 4 | | | 154 | | | | 210 | |
| | | 2,157,221 | | | | 3,403,074 | |
30
| | Year ended |
| | 12/31/20 | | 12/31/19 |
| Capital Share Transactions (continued): | | | | | | | | |
| Cost of shares redeemed: | | | | | | | | |
| Class A | | $ | (12,928,275 | ) | | $ | (9,204,894 | ) |
| Class B1 | | | — | | | | (267,038 | ) |
| Institutional Class2 | | | (493,256 | ) | | | (1,338,992 | ) |
| Class R63, 4 | | | (10,307 | ) | | | (6,909 | ) |
| | | | (13,431,838 | ) | | | (10,817,833 | ) |
| Decrease in net assets derived from capital share | | | | | | | | |
| transactions | | | (11,274,617 | ) | | | (7,414,759 | ) |
| Net Decrease in Net Assets | | | (11,365,928 | ) | | | (5,535,462 | ) |
| | | | | | | | | |
| Net Assets: | | | | | | | | |
| Beginning of year | | | 41,873,826 | | | | 47,409,288 | |
| End of year | | $ | 30,507,898 | | | $ | 41,873,826 | |
| 1 | All Class B shares were converted into Class A shares on June 14, 2019. |
| 2 | On October 4, 2019, Advisor Class shares were reorganized into Institutional Class shares. See Notes to Financial Statements. |
| 3 | On October 4, 2019, Institutional Class shares were reorganized into Class R6 shares. See Notes to Financial Statements. |
| 4 | All Class R6 shares were liquidated on August 20, 2020. |
See accompanying notes, which are an integral part of the financial statements.
31
Statements of changes in net assets
Delaware Tax–Free Oregon Fund
| | Year ended |
| | 12/31/20 | | 12/31/19 |
| Increase in Net Assets from Operations: | | | | | | | | |
| Net investment income | | $ | 1,095,308 | | | $ | 1,286,707 | |
| Net realized gain | | | 699,031 | | | | 502,483 | |
| Net change in unrealized appreciation (depreciation) | | | 202,592 | | | | 1,147,321 | |
| Net increase in net assets resulting from operations | | | 1,996,931 | | | | 2,936,511 | |
| |
| Dividends and Distributions to Shareholders from: | | | | | | | | |
| Distributable earnings: | | | | | | | | |
| Class A | | | (1,004,613 | ) | | | (1,189,623 | ) |
| Class B1 | | | — | | | | (5 | ) |
| Institutional Class2 | | | (89,523 | ) | | | (113,411 | ) |
| Class R63, 4 | | | — | | | | (206 | ) |
| | | (1,094,136 | ) | | | (1,303,245 | ) |
| |
| Capital Share Transactions: | | | | | | | | |
| Proceeds from shares sold: | | | | | | | | |
| Class A | | | 1,678,253 | | | | 4,708,665 | |
| Class B1 | | | — | | | | 160 | |
| Institutional Class2 | | | 1,051,375 | | | | 2,569,510 | |
| Class R63, 4 | | | — | | | | 9,999 | |
| Net asset value of shares issued upon reinvestment of | | | | | | | | |
| dividends and distributions: | | | | | | | | |
| Class A | | | 862,268 | | | | 994,922 | |
| Class B1 | | | — | | | | 4 | |
| Institutional Class2 | | | 79,762 | | | | 79,225 | |
| Class R63, 4 | | | 155 | | | | 195 | |
| | | 3,671,813 | | | | 8,362,680 | |
32
| | Year ended |
| | 12/31/20 | | 12/31/19 |
| Capital Share Transactions (continued): | | | | | | | | |
| Cost of shares redeemed: | | | | | | | | |
| Class A | | $ | (8,980,286 | ) | | $ | (11,809,575 | ) |
| Class B1 | | | — | | | | (5,098 | ) |
| Institutional Class2 | | | (603,701 | ) | | | (4,443,859 | ) |
| Class R63, 4 | | | (10,343 | ) | | | (6,737 | ) |
| | | | (9,594,330 | ) | | | (16,265,269 | ) |
| Decrease in net assets derived from capital share | | | | | | | | |
| transactions | | | (5,922,517 | ) | | | (7,902,589 | ) |
| Net Decrease in Net Assets | | | (5,019,722 | ) | | | (6,269,323 | ) |
| | | | | | | | | |
| Net Assets: | | | | | | | | |
| Beginning of year | | | 46,873,755 | | | | 53,143,078 | |
| End of year | | $ | 41,854,033 | | | $ | 46,873,755 | |
| 1 | All Class B shares were converted into Class A shares on June 14, 2019. |
| 2 | On October 4, 2019, Advisor Class shares were reorganized into Institutional Class shares. See Notes to Financial Statements. |
| 3 | On October 4, 2019, Institutional Class shares were reorganized into Class R6 shares. See Notes to Financial Statements. |
| 4 | All Class R6 shares were liquidated on August 20, 2020. |
See accompanying notes, which are an integral part of the financial statements.
33
Financial highlights
Delaware Tax–Free New Jersey Fund Class A
Selected data for each share of the Fund outstanding throughout each period were as follows:
| Net asset value, beginning of period |
| |
| Income (loss) from investment operations: |
| Net investment income2 |
| Net realized and unrealized gain (loss) |
| Total from investment operations |
| |
| Less dividends and distributions from: |
| Net investment income |
| Net realized gain |
| Total dividends and distributions |
| |
| Net asset value, end of period |
| |
| Total return3 |
| |
| Ratios and supplemental data: |
| Net assets, end of period (000 omitted) |
| Ratio of expenses to average net assets |
| Ratio of expenses to average net assets prior to fees waived |
| Ratio of net investment income to average net assets |
| Ratio of net investment income to average net assets prior to fees waived |
| Portfolio turnover |
| 1 | On October 4, 2019, Class A shares of First Investors New Jersey Tax Exempt Fund were reorganized into Class A shares of Delaware Tax–Free New Jersey Fund. See Notes to Financial Statements. The Class A shares financial highlights for the periods prior to October 4, 2019, reflect the performance of First Investors New Jersey Tax Exempt Fund Class A shares. |
| 2 | The average shares outstanding have been applied for per share information. |
| 3 | Total return is based on the change in net asset value of a share during the period and assumes reinvestment of dividends and distributions at net asset value and does not reflect the impact of a sales charge. Total return during all of the periods shown reflects a waiver by the manager. Performance would have been lower had the waiver not been in effect. |
| 4 | The Fund’s portfolio turnover rate increased substantially during the year ended December 31, 2019 due to a change in the Fund’s portfolio managers and associated repositioning. |
See accompanying notes, which are an integral part of the financial statements.
34
| | | Year ended |
| | | 12/31/20 | | | | 12/31/191 | | | | 12/31/18 | | | | 12/31/17 | | | | 12/31/16 | |
| | $ | 12.88 | | | $ | 12.40 | | | $ | 12.78 | | | $ | 12.69 | | | $ | 13.04 | |
| | | | | | | | | | | | | | | | | | | | |
| | | | | | | | | | | | | | | | | | | | |
| | | 0.31 | | | | 0.34 | | | | 0.41 | | | | 0.43 | | | | 0.44 | |
| | | 0.33 | | | | 0.48 | | | | (0.38 | ) | | | 0.09 | | | | (0.35 | ) |
| | | 0.64 | | | | 0.82 | | | | 0.03 | | | | 0.52 | | | | 0.09 | |
| | | | | | | | | | | | | | | | | | | | |
| | | | | | | | | | | | | | | | | | | | |
| | | (0.31 | ) | | | (0.34 | ) | | | (0.41 | ) | | | (0.43 | ) | | | (0.44 | ) |
| | | (0.35 | ) | | | — | | | | — | | | | — | | | | — | |
| | | (0.66 | ) | | | (0.34 | ) | | | (0.41 | ) | | | (0.43 | ) | | | (0.44 | ) |
| | | | | | | | | | | | | | | | | | | | |
| | $ | 12.86 | | | $ | 12.88 | | | $ | 12.40 | | | $ | 12.78 | | | $ | 12.69 | |
| | | | | | | | | | | | | | | | | | | | |
| | | 5.10% | | | | 6.68% | | | | 0.29% | | | | 4.13% | | | | 0.61% | |
| | | | | | | | | | | | | | | | | | | | |
| | | | | | | | | | | | | | | | | | | | |
| | $ | 28,488 | | | $ | 39,479 | | | $ | 43,895 | | | $ | 48,917 | | | $ | 47,698 | |
| | | 0.90% | | | | 0.96% | | | | 0.95% | | | | 0.94% | | | | 0.95% | |
| | | 1.25% | | | | 1.07% | | | | 0.98% | | | | 1.04% | | | | 1.05% | |
| | | 2.44% | | | | 2.67% | | | | 3.31% | | | | 3.35% | | | | 3.31% | |
| | | 2.09% | | | | 2.56% | | | | 3.28% | | | | 3.25% | | | | 3.21% | |
| | | 21% | | | | 47% | 4 | | | 20% | | | | 44% | | | | 25% | |
35
Financial highlights
Delaware Tax–Free New Jersey Fund Institutional Class
Selected data for each share of the Fund outstanding throughout each period were as follows:
| Net asset value, beginning of period |
| |
| Income (loss) from investment operations: |
| Net investment income2 |
| Net realized and unrealized gain (loss) |
| Total from investment operations |
| |
| Less dividends and distributions from: |
| Net investment income |
| Net realized gain |
| Total dividends and distributions |
| |
| Net asset value, end of period |
| |
| Total return3 |
| |
| Ratios and supplemental data: |
| Net assets, end of period (000 omitted) |
| Ratio of expenses to average net assets |
| Ratio of expenses to average net assets prior to fees waived |
| Ratio of net investment income to average net assets |
| Ratio of net investment income to average net assets prior to fees waived |
| Portfolio turnover |
| 1 | On October 4, 2019, Advisor Class shares of First Investors New Jersey Tax Exempt Fund were reorganized into Institutional Class shares of Delaware Tax–Free New Jersey Fund. See Notes to Financial Statements. The Institutional Class shares financial highlights for the periods prior to October 4, 2019, reflect the performance of First Investors New Jersey Tax Exempt Fund Advisor Class shares. |
| 2 | The average shares outstanding have been applied for per share information. |
| 3 | Total return is based on the change in net asset value of a share during the period and assumes reinvestment of dividends and distributions at net asset value. Total return during all of the periods shown reflects a waiver by the manager. Performance would have been lower had the waiver not been in effect. |
| 4 | The Fund’s portfolio turnover rate increased substantially during the year ended December 31, 2019 due to a change in the Fund’s portfolio managers and associated repositioning. |
See accompanying notes, which are an integral part of the financial statements.
36
| | Year ended |
| | 12/31/20 | | | | 12/31/191 | | | | 12/31/18 | | | | 12/31/17 | | | | 12/31/16 | |
| $ | 12.87 | | | $ | 12.38 | | | $ | 12.76 | | | $ | 12.68 | | | $ | 13.03 | |
| | | | | | | | | | | | | | | | | | | |
| | | | | | | | | | | | | | | | | | | |
| | 0.34 | | | | 0.37 | | | | 0.44 | | | | 0.46 | | | | 0.47 | |
| | 0.32 | | | | 0.49 | | | | (0.37 | ) | | | 0.08 | | | | (0.34 | ) |
| | 0.66 | | | | 0.86 | | | | 0.07 | | | | 0.54 | | | | 0.13 | |
| | | | | | | | | | | | | | | | | | | |
| | | | | | | | | | | | | | | | | | | |
| | (0.34 | ) | | | (0.37 | ) | | | (0.45 | ) | | | (0.46 | ) | | | (0.48 | ) |
| | (0.35 | ) | | | — | | | | — | | | | — | | | | — | |
| | (0.69 | ) | | | (0.37 | ) | | | (0.45 | ) | | | (0.46 | ) | | | (0.48 | ) |
| | | | | | | | | | | | | | | | | | | |
| $ | 12.84 | | | $ | 12.87 | | | $ | 12.38 | | | $ | 12.76 | | | $ | 12.68 | |
| | | | | | | | | | | | | | | | | | | |
| | 5.25% | | | | 7.00% | | | | 0.56% | | | | 4.36% | | | | 0.93% | |
| | | | | | | | | | | | | | | | | | | |
| | | | | | | | | | | | | | | | | | | |
| $ | 2,020 | | | $ | 2,385 | | | $ | 3,251 | | | $ | 2,114 | | | $ | 1,289 | |
| | 0.68% | | | | 0.73% | | | | 0.68% | | | | 0.66% | | | | 0.64% | |
| | 1.00% | | | | 0.82% | | | | 0.71% | | | | 0.76% | | | | 0.74% | |
| | 2.66% | | | | 2.89% | | | | 3.57% | | | | 3.63% | | | | 3.62% | |
| | 2.34% | | | | 2.80% | | | | 3.54% | | | | 3.53% | | | | 3.52% | |
| | 21% | | | | 47% | 4 | | | 20% | | | | 44% | | | | 25% | |
37
Financial highlights
Delaware Tax–Free Oregon Fund Class A
Selected data for each share of the Fund outstanding throughout each period were as follows:
| Net asset value, beginning of period |
| |
| Income (loss) from investment operations: |
| Net investment income2 |
| Net realized and unrealized gain (loss) |
| Total from investment operations |
| |
| Less dividends and distributions from: |
| Net investment income |
| Total dividends and distributions |
| |
| Net asset value, end of period |
| |
| Total return3 |
| |
| Ratios and supplemental data: |
| Net assets, end of period (000 omitted) |
| Ratio of expenses to average net assets |
| Ratio of expenses to average net assets prior to fees waived |
| Ratio of net investment income to average net assets |
| Ratio of net investment income to average net assets prior to fees waived |
| Portfolio turnover |
| 1 | On October 4, 2019, Class A shares of First Investors Oregon Tax Exempt Fund were reorganized into Class A shares of Delaware Tax–Free Oregon Fund. See Notes to Financial Statements. The Class A shares financial highlights for the periods prior to October 4, 2019, reflect the performance of First Investors Oregon Tax Exempt Fund Class A shares. |
| 2 | The average shares outstanding have been applied for per share information. |
| 3 | Total return is based on the change in net asset value of a share during the period and assumes reinvestment of dividends and distributions at net asset value and does not reflect the impact of a sales charge. Total return during all of the periods shown reflects a waiver by the manager. Performance would have been lower had the waiver not been in effect. |
See accompanying notes, which are an integral part of the financial statements.
38
| Year ended |
| 12/31/20 | | | 12/31/191 | | 12/31/18 | | 12/31/17 | | 12/31/16 |
| $ | 13.42 | | | $ | 13.01 | | | $ | 13.39 | | | $ | 13.33 | | | $ | 13.72 | |
| |
| |
| | 0.33 | | | | 0.33 | | | | 0.37 | | | | 0.40 | | | | 0.42 | |
| | 0.29 | | | | 0.42 | | | | (0.38 | ) | | | 0.09 | | | | (0.41 | ) |
| | 0.62 | | | | 0.75 | | | | (0.01 | ) | | | 0.49 | | | | 0.01 | |
| |
| |
| | (0.33 | ) | | | (0.34 | ) | | | (0.37 | ) | | | (0.43 | ) | | | (0.40 | ) |
| | (0.33 | ) | | | (0.34 | ) | | | (0.37 | ) | | | (0.43 | ) | | | (0.40 | ) |
| |
| $ | 13.71 | | | $ | 13.42 | | | $ | 13.01 | | | $ | 13.39 | | | $ | 13.33 | |
| |
| | 4.70% | | | | 5.78% | | | | (0.04% | ) | | | 3.70% | | | | 0.03% | |
| |
| $ | 38,295 | | | $ | 43,911 | | | $ | 48,527 | | | $ | 52,210 | | | $ | 51,480 | |
| | 0.91% | | | | 0.95% | | | | 0.96% | | | | 0.95% | | | | 0.95% | |
| | 1.19% | | | | 1.05% | | | | 0.99% | | | | 1.05% | | | | 1.05% | |
| | 2.46% | | | | 2.49% | | | | 2.84% | | | | 3.00% | | | | 3.08% | |
| | 2.18% | | | | 2.39% | | | | 2.81% | | | | 2.90% | | | | 2.98% | |
| | 25% | | | | 50% | | | | 49% | | | | 30% | | | | 34% | |
39
Financial highlights
Delaware Tax–Free Oregon Fund Institutional Class
Selected data for each share of the Fund outstanding throughout each period were as follows:
| Net asset value, beginning of period |
| |
| Income (loss) from investment operations: |
| Net investment income2 |
| Net realized and unrealized gain (loss) |
| Total from investment operations |
| |
| Less dividends and distributions from: |
| Net investment income |
| Total dividends and distributions |
| |
| Net asset value, end of period |
| |
| Total return3 |
| |
| Ratios and supplemental data: |
| Net assets, end of period (000 omitted) |
| Ratio of expenses to average net assets |
| Ratio of expenses to average net assets prior to fees waived |
| Ratio of net investment income to average net assets |
| Ratio of net investment income to average net assets prior to fees waived |
| Portfolio turnover |
| 1 | On October 4, 2019, Advisor Class shares of First Investors Oregon Tax Exempt Fund were reorganized into Institutional Class shares of Delaware Tax–Free Oregon Fund. See Notes to Financial Statements. The Institutional Class shares financial highlights for the periods prior to October 4, 2019, reflect the performance of First Investors Oregon Tax Exempt Fund Advisor Class shares. |
| 2 | The average shares outstanding have been applied for per share information. |
| 3 | Total return is based on the change in net asset value of a share during the period and assumes reinvestment of dividends and distributions at net asset value. Total return during all of the periods shown reflects a waiver by the manager. Performance would have been lower had the waiver not been in effect. |
See accompanying notes, which are an integral part of the financial statements.
40
| Year ended |
| 12/31/20 | | 12/31/191 | | 12/31/18 | | 12/31/17 | | 12/31/16 |
| $ | 13.40 | | | $ | 12.99 | | | $ | 13.36 | | | $ | 13.30 | | | $ | 13.69 | |
| |
| |
| | 0.37 | | | | 0.37 | | | | 0.41 | | | | 0.44 | | | | 0.47 | |
| | 0.29 | | | | 0.41 | | | | (0.37 | ) | | | 0.07 | | | | (0.40 | ) |
| | 0.66 | | | | 0.78 | | | | 0.04 | | | | 0.51 | | | | 0.07 | |
| |
| |
| | (0.37 | ) | | | (0.37 | ) | | | (0.41 | ) | | | (0.45 | ) | | | (0.46 | ) |
| | (0.37 | ) | | | (0.37 | ) | | | (0.41 | ) | | | (0.45 | ) | | | (0.46 | ) |
| |
| $ | 13.69 | | | $ | 13.40 | | | $ | 12.99 | | | $ | 13.36 | | | $ | 13.30 | |
| |
| | 4.96% | | | | 6.03% | | | | 0.33% | | | | 3.91% | | | | 0.42% | |
| |
| $ | 3,559 | | | $ | 2,953 | | | $ | 4,605 | | | $ | 4,100 | | | $ | 3,048 | |
| | 0.66% | | | | 0.70% | | | | 0.66% | | | | 0.64% | | | | 0.64% | |
| | 0.94% | | | | 0.78% | | | | 0.69% | | | | 0.74% | | | | 0.74% | |
| | 2.71% | | | | 2.76% | | | | 3.13% | | | | 3.30% | | | | 3.39% | |
| | 2.43% | | | | 2.68% | | | | 3.10% | | | | 3.20% | | | | 3.29% | |
| | 25% | | | | 50% | | | | 49% | | | | 30% | | | | 34% | |
41
| Notes to financial statements | |
| Delaware Funds® by Macquarie tax-exempt funds | December 31, 2020 |
Delaware Group® Limited-Term Government Funds (Trust) is organized as a Delaware statutory trust and offers three series. These financial statements and the related notes pertain to Delaware Tax-Free New Jersey Fund and Delaware Tax-Free Oregon Fund (each a Fund, or collectively, the Funds). Delaware Limited-Term Diversified Income Fund is included in a separate report. Each Fund is an open-end investment company. The Funds are considered diversified under the Investment Company Act of 1940, as amended (1940 Act), and offer Class A and Institutional Class shares. Class A shares are sold with a maximum front-end sales charge of 4.50%. Class A share purchases of $1,000,000 or more will incur a contingent deferred sales charge (CDSC) instead of a front-end sales charge of 1.00%, if redeemed during the first year, and 0.50% during the second year, provided that Delaware Distributors, L.P. (DDLP) paid a financial advisor a commission on the purchase of those shares. Institutional Class shares are not subject to a sales charge and are offered for sale exclusively to certain eligible investors.
Before each Fund commenced operations, on October 4, 2019, all of the assets and liabilities of the corresponding fund identified as its respective Predecessor Fund (the “Predecessor Fund”) were transferred to the Fund in a tax-free reorganization as set forth in an agreement and plan of reorganization (each a Foresters Reorganization) between the Trust, on behalf of the Funds, and Foresters Investment Management Company, Inc., on behalf of the Predecessor Funds. As a result of each Foresters Reorganization, the applicable Fund assumed the performance and accounting history of its corresponding Predecessor Fund. Financial information included for the dates prior to the Foresters Reorganization is that of the Predecessor Funds.
| Fund | Predecessor Fund |
| Delaware Tax-Free New Jersey Fund | First Investors New Jersey Tax Exempt Fund |
| Delaware Tax-Free Oregon Fund | First Investors Oregon Tax Exempt Fund |
1. Significant Accounting Policies
Each Fund follows accounting and reporting guidance under Financial Accounting Standards Board (FASB) Accounting Standards Codification Topic 946, Financial Services — Investment Companies. The following accounting policies are in accordance with US generally accepted accounting principles (US GAAP) and are consistently followed by the Funds.
Security Valuation — Debt securities are valued based upon valuations provided by an independent pricing service or broker and reviewed by management. To the extent current market prices are not available, the pricing service may take into account developments related to the specific security, as well as transactions in comparable securities. Valuations for fixed income securities utilize matrix systems, which reflect such factors as security prices, yields, maturities, and ratings, and are supplemented by dealer and exchange quotations. Generally, other securities and assets for which market quotations are not readily available are valued at fair value as determined in good faith under the direction of the Trust’s Board of Trustees (Board). In determining whether market quotations are readily available or fair
42
valuation will be used, various factors will be taken into consideration, such as market closures or suspension of trading in a security. Restricted securities are valued at fair value using methods approved by the Board.
Federal Income Taxes — No provision for federal income taxes has been made as each Fund intends to continue to qualify for federal income tax purposes as a regulated investment company under Subchapter M of the Internal Revenue Code of 1986, as amended, and make the requisite distributions to shareholders. Each Fund evaluates tax positions taken or expected to be taken in the course of preparing each Fund’s tax returns to determine whether the tax positions are “more-likely-than-not” of being sustained by the applicable tax authority. Tax positions not deemed to meet the “more-likely-than-not” threshold are recorded as a tax benefit or expense in the current year. Management has analyzed each Fund’s tax positions taken or expected to be taken on each Fund’s federal income tax returns through the year ended December 31, 2020 and for all open tax years (years ended December 31, 2017–December 31, 2019), and has concluded that no provision for federal income tax is required in each Fund’s financial statements. If applicable, each Fund recognizes interest accrued on unrecognized tax benefits in interest expense and penalties in “Other” on the “Statements of operations.” During the year ended December 31, 2020, the Funds did not incur any interest or tax penalties.
Class Accounting — Investment income and common expenses are allocated to the various classes of each Fund on the basis of “settled shares” of each class in relation to the net assets of each Fund. Realized and unrealized gain (loss) on investments are allocated to the various classes of each Fund on the basis of daily net assets of each class. Distribution expenses relating to a specific class are charged directly to that class.
Use of Estimates — The preparation of financial statements in conformity with US GAAP requires management to make estimates and assumptions that affect the fair value of investments, the reported amounts of assets and liabilities and disclosure of contingent assets and liabilities at the date of the financial statements, and the reported amounts of revenues and expenses during the reporting period. Actual results could differ from those estimates and the differences could be material.
Other — Expenses directly attributable to a Fund are charged directly to that Fund. Other expenses common to various funds within the Delaware Funds® by Macquarie (Delaware Funds) are generally allocated among such funds on the basis of average net assets. Management fees and certain other expenses are paid monthly. Security transactions are recorded on the date the securities are purchased or sold (trade date) for financial reporting purposes. Costs used in calculating realized gains and losses on the sale of investment securities are those of the specific securities sold. Interest income is recorded on the accrual basis. Discounts and premiums on debt securities are accreted and amortized using the effective interest method. Premiums on callable debt securities are amortized to interest income to the earliest call date using the effective interest method. Each Fund declares dividends daily from net investment income and pays the dividends monthly and declares and pays distributions from net realized gain on investments, if any, annually. Each Fund may distribute more frequently, if necessary for tax purposes. Dividends and distributions, if any, are recorded on the ex-dividend date.
43
Notes to financial statements
Delaware Funds® by Macquarie tax-exempt funds
1. Significant Accounting Policies (continued)
Each Fund receives earnings credits from its custodian when positive cash balances are maintained, which may be used to offset custody fees. The expenses paid under this arrangement are included on the “Statements of operations” under “Custodian fees” with the corresponding expenses offset included under “Less expenses paid indirectly.” For the year ended December 31, 2020, each Fund earned the following amounts under this arrangement:
| Fund | | Custody credits |
| Delaware Tax–Free New Jersey Fund | | | $531 | |
| Delaware Tax–Free Oregon Fund | | | 488 | |
Each Fund receives earnings credits from its transfer agent when positive cash balances are maintained, which may be used to offset transfer agent fees. If the amount earned is greater than $1, the expenses paid under this arrangement are included on the “Statements of operations” under “Dividend disbursing and transfer agent fees and expenses” with the corresponding expenses offset included under “Less expenses paid indirectly.” For the year ended December 31, 2020, each Fund earned the following amounts under this arrangement:
| Fund | | Earnings Credits |
| Delaware Tax–Free New Jersey Fund | | | $53 | |
| Delaware Tax–Free Oregon Fund | | | 63 | |
2. Investment Management, Administration Agreements, and Other Transactions with Affiliates
In accordance with the terms of its respective investment management agreement, each Fund pays Delaware Management Company (DMC), a series of Macquarie Investment Management Business Trust and the investment manager, an annual fee which is calculated daily and paid monthly, based on each Fund’s average daily net assets as follows:
| | Delaware Tax–Free | | Delaware Tax–Free |
| | New Jersey Fund | | Oregon Fund |
| On the first $500 million | | 0.5500% | | 0.5500% |
| On the next $500 million | | 0.5000% | | 0.5000% |
| On the next $1.5 billion | | 0.4500% | | 0.4500% |
| In excess of $2.5 billion | | 0.4250% | | 0.4250% |
DMC has contractually agreed to waive all or a portion of its investment advisory fees and/or pay/reimburse expenses (excluding any acquired fund fees and expenses, taxes, interest, short sale dividend and interest expenses, brokerage fees, certain insurance costs, and nonroutine expenses or costs, including, but not limited to, those relating to reorganizations, litigation, conducting shareholder meetings, and liquidations) in order to not exceed the following percentages of each Fund’s average daily net assets from January 1, 2020 through December 31, 2020.* These waivers and reimbursements
44
may be terminated only by agreement of DMC and each Fund. The waivers and reimbursements are accrued daily and received monthly.
| | Delaware Tax–Free | | Delaware Tax–Free |
| | New Jersey Fund | | Oregon Fund |
| Operating expense limitation | | | | |
| as a percentage of | | | | |
| average daily net assets | | | | |
| Class A shares | | 0.90% | | 0.91% |
| Operating expense limitation | | | | |
| as a percentage of | | | | |
| average daily net assets | | | | |
| Institutional Class shares | | 0.68% | | 0.66% |
DMC may seek investment advice and recommendations from its affiliates: Macquarie Investment Management Europe Limited, Macquarie Investment Management Austria Kapitalanlage AG, and Macquarie Investment Management Global Limited (together, the “Affiliated Sub-Advisors”). The Manager may also permit these Affiliated Sub-Advisors to execute Fund security trades on behalf of the Manager and exercise investment discretion for securities in certain markets where DMC believes it will be beneficial to utilize an Affiliated Sub-Advisor’s specialized market knowledge. Although the Affiliated Sub-Advisors serve as sub-advisors, DMC has ultimate responsibility for all investment advisory services. For these services, DMC, not the Fund, pays each Affiliated Sub-Advisor a portion of its investment management fee.
Delaware Investments Fund Services Company (DIFSC), an affiliate of DMC, provides fund accounting and financial administrative oversight services to the Funds. For these services, DIFSC’s fees are calculated daily and paid monthly based on the aggregate daily net assets of all funds within the Delaware Funds at the following annual rates: 0.00475% of the first $35 billion; 0.0040% of the next $10 billion; and 0.0025% of aggregate average daily net assets in excess of $45 billion (Total Fee). Each fund in the Delaware Funds pays a minimum of $4,000, which, in aggregate, is subtracted from the Total Fee. Each fund then pays its portion of the remainder of the Total Fee on a relative net asset value (NAV) basis. These amounts are included on the “Statements of operations” under “Accounting and administration expenses.”
For the year ended December 31, 2020, each Fund was charged for these services as follows:
| Fund | | Fees |
| Delaware Tax–Free New Jersey Fund | | $5,210 |
| Delaware Tax–Free Oregon Fund | | 5,507 |
DIFSC is also the transfer agent and dividend disbursing agent of the Funds. For these services, DIFSC’s fees are calculated daily and paid monthly based on the aggregate daily net assets of the retail funds within the Delaware Funds at the following annual rates: 0.014% of the first $20 billion; 0.011% of the next $5 billion; 0.007% of the next $5 billion; 0.005% of the next $20 billion; and 0.0025% of average daily net assets in excess of $50 billion. The fees payable to DIFSC under the shareholder services agreement described previously are allocated among all retail funds in the Delaware Funds on a relative
45
Notes to financial statements
Delaware Funds® by Macquarie tax-exempt funds
2. Investment Management, Administration Agreements, and Other Transactions with Affiliates (continued)
NAV basis. These amounts are included on the “Statements of operations” under “Dividend disbursing and transfer agent fees and expenses.”
For the year ended December 31, 2020, each Fund was charged for these services as follows:
| Fund | | Fees |
| Delaware Tax–Free New Jersey Fund | | $3,280 |
| Delaware Tax–Free Oregon Fund | | 4,088 |
Pursuant to a sub-transfer agency agreement between DIFSC and BNY Mellon Investment Servicing (US) Inc. (BNYMIS), BNYMIS provides certain sub-transfer agency services to each Fund. Sub-transfer agency fees are paid by each Fund and are also included on the “Statements of operations” under “Dividend disbursing and transfer agent fees and expenses.” The fees that are calculated daily and paid as invoices are received on a monthly or quarterly basis. Prior to May 4, 2020, Foresters Investor Services, Inc. provided sub-transfer agency services to each Fund.
Pursuant to a distribution agreement and distribution plan, each Fund pays DDLP, the distributor and an affiliate of DMC, an annual 12b-1 fee of 0.25% of the average daily net assets of the Class A shares. The fees are calculated daily and paid monthly. Institutional Class shares do not pay 12b-1 fees.
As provided in the investment management agreement, each Fund bears a portion of the cost of certain resources shared with DMC, including the cost of internal personnel of DMC and/or its affiliates that provide legal, tax, and regulatory reporting services to the Funds. These amounts are included on the “Statements of operations” under “Legal fees.”
For the year ended December 31, 2020, each Fund was charged for internal legal, tax, and regulatory reporting services provided by DMC and/or its affiliates’ employees as follows:
| Fund | | Fees |
| Delaware Tax–Free New Jersey Fund | | $1,240 |
| Delaware Tax–Free Oregon Fund | | 1,501 |
For the year ended December 31, 2020, DDLP earned commissions on sales of Class A shares for each Fund as follows:
| Fund | | Commissions |
| Delaware Tax–Free New Jersey Fund | | | $1,165 | |
| Delaware Tax–Free Oregon Fund | | | 2,847 | |
For the year ended December 31, 2020, DDLP received gross CDSC commissions on redemptions of each Fund’s Class A shares, and these commissions were entirely used to offset upfront commissions previously paid by DDLP to broker/dealers on sales of those shares. The amounts received were as follows:
| Fund | | Class A |
| Delaware Tax–Free New Jersey Fund | | $460 |
46
| Fund | | Class A |
| Delaware Tax–Free Oregon Fund | | $ 6 |
Trustees’ fees include expenses accrued by each Fund for each Trustee’s retainer and meeting fees. Certain officers of DMC, DIFSC, and DDLP are officers and/or Trustees of the Trust. These officers and Trustees are paid no compensation by the Funds.
Cross trades for the year ended December 31, 2020, were executed by each Fund pursuant to procedures adopted by the Board designed to ensure compliance with Rule 17a-7 under the 1940 Act. Cross trading is the buying or selling of portfolio securities between funds of investment companies, or between a fund of an investment company and another entity, that are or could be considered affiliates by virtue of having a common investment advisor (or affiliated investment advisors), common directors/trustees and/or common officers. At their regularly scheduled meetings, the Board reviews such transactions for compliance with the procedures adopted by the Board.
Pursuant to these procedures, for the year ended December 31, 2020, the Funds engaged in the following Rule 17a-7 securities purchases and securities sales, which resulted in net realized gains (losses) as follows:
| | Purchases | | Sales | | Net realized gain (loss) |
| Delaware Tax–Free New Jersey Fund | | $1,108,483 | | $1,097,484 | | | $(56,512) | |
| Delaware Tax–Free Oregon Fund | | 2,782,217 | | 1,600,016 | | | (3) | |
____________________
| * | The aggregate contractual waiver period covering this report is from October 4, 2019 through October 31, 2021. |
3. Investments
For the year ended December 31, 2020, each Fund made purchases and sales of investment securities other than short-term investments as follows:
| Fund | | Purchases | | Sales |
| Delaware Tax–Free New Jersey Fund | | $ 7,473,647 | | $18,735,491 |
| Delaware Tax–Free Oregon Fund | | 10,933,440 | | 16,619,356 |
The tax cost of investments includes adjustments to net unrealized appreciation (depreciation) which may not necessarily be the final tax cost basis adjustments, but approximates the tax basis unrealized gains and losses that may be realized and distributed to shareholders. At December 31, 2020, the cost
47
Notes to financial statements
Delaware Funds® by Macquarie tax-exempt funds
3. Investments (continued)
and unrealized appreciation (depreciation) of investments for federal income tax purposes for each Fund were as follows:
| | | | Aggregate | | Aggregate | | | | |
| | | | unrealized | | unrealized | | Net unrealized |
| | Cost of | | appreciation | | depreciation | | appreciation |
| Fund | | investments | | of investments | | of investments | | of investments |
| Delaware Tax–Free New | | | | | | | | | | | | | | |
| Jersey Fund | | $27,243,672 | | | $2,940,827 | | | | $(133,128) | | | | $2,807,699 | |
| Delaware Tax–Free | | | | | | | | | | | | | | |
| Oregon Fund | | 37,784,725 | | | 3,516,991 | | | | (178,425) | | | | 3,338,566 | |
US GAAP defines fair value as the price that each Fund would receive to sell an asset or pay to transfer a liability in an orderly transaction between market participants at the measurement date under current market conditions. A three-level hierarchy for fair value measurements has been established based upon the transparency of inputs to the valuation of an asset or liability. Inputs may be observable or unobservable and refer broadly to the assumptions that market participants would use in pricing the asset or liability. Observable inputs reflect the assumptions market participants would use in pricing the asset or liability based on market data obtained from sources independent of the reporting entity. Unobservable inputs reflect the reporting entity’s own assumptions about the assumptions that market participants would use in pricing the asset or liability based on the best information available under the circumstances. Each Fund’s investment in its entirety is assigned a level based upon the observability of the inputs which are significant to the overall valuation. The three-level hierarchy of inputs is summarized as follows:
| Level 1 – | Inputs are quoted prices in active markets for identical investments. (Examples: equity securities, open-end investment companies, futures contracts, and exchange-traded options contracts) |
| | |
| Level 2 – | Other observable inputs, including, but not limited to: quoted prices for similar assets or liabilities in markets that are active, quoted prices for identical or similar assets or liabilities in markets that are not active, inputs other than quoted prices that are observable for the assets or liabilities (such as interest rates, yield curves, volatilities, prepayment speeds, loss severities, credit risks, and default rates) or other market-corroborated inputs. (Examples: debt securities, government securities, swap contracts, foreign currency exchange contracts, foreign securities utilizing international fair value pricing, broker-quoted securities, and fair valued securities) |
| | |
| Level 3 – | Significant unobservable inputs, including each Fund’s own assumptions used to determine the fair value of investments. (Examples: broker-quoted securities and fair valued securities) |
Level 3 investments are valued using significant unobservable inputs. Each Fund may also use an income-based valuation approach in which the anticipated future cash flows of the investment are discounted to calculate fair value. Discounts may also be applied due to the nature or duration of any restrictions on the disposition of the investments. Valuations may also be based upon current market
48
prices of securities that are comparable in coupon, rating, maturity, and industry. The derived value of a Level 3 investment may not represent the value which is received upon disposition and this could impact the results of operations.
The following tables summarize the valuation of each Fund’s investments by fair value hierarchy levels as of December 31, 2020:
| | Delaware Tax–Free New Jersey Fund |
| | Level 2 |
| Securities | | |
| Assets: | | |
| Municipal Bonds | | $30,051,371 |
| | | |
| | Delaware Tax–Free Oregon Fund |
| | Level 2 |
| Securities | | |
| Assets: | | |
| Municipal Bonds | | $41,123,291 |
During the year ended December 31, 2020, there were no transfers into or out of Level 3 investments. Each Fund’s policy is to recognize transfers into or out of Level 3 based on fair value at the beginning of the reporting period.
A reconciliation of Level 3 investments is presented when each Fund has a significant amount of Level 3 investments at the beginning, interim, or end of the period in relation to each Fund’s net assets. During the year ended December 31, 2020, there were no Level 3 investments.
4. Dividend and Distribution Information
Income and long-term capital gain distributions are determined in accordance with federal income tax regulations, which may differ from US GAAP. Additionally, distributions from net short-term gains on sales of investment securities are treated as ordinary income for federal income tax purposes. The tax character of dividends and distributions paid during the years ended December 31, 2020 and 2019 was as follows:
| | | | | | | | Long-term | | | |
| | Tax-exempt | | Ordinary | | capital | | | |
| | income | | income | | gains | | Total |
| Year ended December 31, 2020: | | | | | | | | | | | | |
| Delaware Tax–Free New Jersey Fund | | $ | 859,040 | | $ | 154,376 | | $ | 682,025 | | $ | 1,695,441 |
| Delaware Tax–Free Oregon Fund | | | 1,090,840 | | | 3,296 | | | — | | | 1,094,136 |
| Year ended December 31, 2019: | | | | | | | | | | | | |
| Delaware Tax–Free New Jersey Fund | | | 1,261,118 | | | 1,868 | | | — | | | 1,262,986 |
| Delaware Tax–Free Oregon Fund | | | 1,300,445 | | | 2,800 | | | — | | | 1,303,245 |
49
Notes to financial statements
Delaware Funds® by Macquarie tax-exempt funds
5. Components of Net Assets on a Tax Basis
As of December 31, 2020, the components of net assets on a tax basis were as follows:
| | Delaware Tax–Free | | Delaware Tax–Free |
| | New Jersey Fund | | Oregon Fund |
| Shares of beneficial interest | | $ | 27,509,585 | | $ | 38,991,551 | |
| Undistributed tax-exempt | | | | | | | |
| income | | | — | | | 173 | |
| Undistributed long-term | | | | | | | |
| capital gains | | | 190,614 | | | — | |
| Capital loss carryforwards | | | — | | | (476,257 | ) |
| Unrealized appreciation of | | | | | | | |
| investments | | | 2,807,699 | | | 3,338,566 | |
| Net assets | | $ | 30,507,898 | | $ | 41,854,033 | |
The differences between book basis and tax basis components of net assets are primarily attributable to tax deferral of losses on wash sales.
For financial reporting purposes, capital accounts are adjusted to reflect the tax character of permanent book/tax differences. Results of operations and net assets were not affected by these reclassifications. For the year ended December 31, 2020, the Funds had no reclassifications.
For federal income tax purposes, capital loss carryforwards may be carried forward and applied against future capital gains. At December 31, 2020, the Funds utilized capital loss carryforwards as follows:
| Delaware Tax–Free Oregon Fund | | $699,031 |
At December 31, 2020, capital loss carryforwards available to offset future realized capital gains, are as follows:
| | Loss carryforward character | | |
| | Short-term | | Long-term | | Total |
Delaware Tax–Free
Oregon Fund | | $476,257 | | $— | | $476,257 |
50
6. Capital Shares
Transactions in capital shares were as follows:
| | Delaware Tax–Free | | Delaware Tax–Free |
| | New Jersey Fund | | Oregon Fund |
| | Year ended | | Year ended |
| | 12/31/20 | | 12/31/19 | | 12/31/20 | | 12/31/19 |
| Shares sold: | | | | | | | | | | | | |
| Class A | | 47,340 | | | 163,436 | | | 124,360 | | | 353,142 | |
| Class B1 | | — | | | 36 | | | — | | | 12 | |
| Institutional Class2 | | 1,708 | | | 19,824 | | | 77,981 | | | 193,094 | |
| Class R63, 4 | | — | | | 775 | | | — | | | 744 | |
| Shares issued upon reinvestment of dividends and distributions: | | | | | | | | | | | | |
| Class A | | 110,366 | | | 75,880 | | | 63,812 | | | 74,692 | |
| Class B1 | | — | | | 181 | | | — | | | — | |
| Institutional Class2 | | 8,593 | | | 6,653 | | | 5,904 | | | 5,969 | |
| Class R63, 4 | | 12 | | | 17 | | | 12 | | | 15 | |
| | 168,019 | | | 266,802 | | | 272,069 | | | 627,668 | |
| | | | | | | | | | | | | |
| Shares redeemed: | | | | | | | | | | | | |
| Class A | | (1,006,043 | ) | | (716,086 | ) | | (667,323 | ) | | (884,411 | ) |
| Class B1 | | — | | | (21,001 | ) | | — | | | (387 | ) |
| Institutional Class2 | | (38,273 | ) | | (103,797 | ) | | (44,290 | ) | | (333,093 | ) |
| Class R63, 4 | | (792 | ) | | (538 | ) | | (761 | ) | | (504 | ) |
| | (1,045,108 | ) | | (841,422 | ) | | (712,374 | ) | | (1,218,395 | ) |
| Net decrease | | (877,089 | ) | | (574,620 | ) | | (440,305 | ) | | (590,727 | ) |
| 1 | All Class B shares were converted into Class A shares on June 14, 2019. |
| 2 | On October 4, 2019, Advisor Class shares were reorganized into Institutional Class shares. |
| 3 | On October 4, 2019, Institutional Class shares were reorganized into Class R6 shares. |
| 4 | All Class R6 shares were liquidated on August 20, 2020. |
All Class B shares converted into Class A shares on June 14, 2019. These transactions were included as subscriptions and redemptions in the tables above and the “Statements of changes in net assets.” The share transactions associated with the conversion were as follows:
| | Year ended 12/31/19 |
| | Class B | | Class A | | |
| | Shares | | Shares | | Value |
| Delaware Tax–Free New Jersey Fund | | 20,580 | | 20,467 | | $261,776 |
| Delaware Tax–Free Oregon Fund | | 89 | | 89 | | 1,185 |
51
Notes to financial statements
Delaware Funds® by Macquarie tax-exempt funds
6. Capital Shares (continued)
Certain shareholders may exchange shares of one class for shares of another class in the same Fund. These exchange transactions were included as subscriptions and redemptions in the previous tables and on the “Statements of changes in net assets.” The Funds did not have any exchange transactions for the year ended December 31, 2020. Tax-Free New Jersey did not have any exchange transactions for the year ended December 31, 2019.
| | Exchange Redemptions Exchange Subscriptions | | |
| | | | Institutional | | | | |
| | Class A | | Class | | Class R6 | | |
| | Shares | | Shares | | Shares | | Value |
| Year ended | | | | | | | | |
| 12/31/19 | | 24,337 | | 23,834 | | 552 | | $319,219 |
7. Line of Credit
Each Fund, along with certain other funds in the Delaware Funds (Participants), was a participant in a $250,000,000 revolving line of credit (Agreement) intended to be used for temporary or emergency purposes as an additional source of liquidity to fund redemptions of investor shares. The Agreement was increased to $275,000,000 on May 6, 2020. Under the Agreement, the Participants were charged an annual commitment fee of 0.15%, which was allocated across the Participants based on a weighted average of the respective net assets of each Participant. The Participants were permitted to borrow up to a maximum of one-third of their net assets under the Agreement. Each Participant was individually, and not jointly, liable for its particular advances, if any, under the line of credit. The line of credit available under the Agreement expired on November 2, 2020.
On November 2, 2020, each Fund, along with the other Participants entered into an amendment to the Agreement for an amount of $225,000,000 to be used as described above. It operates in substantially the same manner as the original Agreement with the addition of an upfront fee of 0.05%, which was allocated across the Participants. The line of credit available under the Agreement expires on November 1, 2021.
The Funds had no amounts outstanding as of December 31, 2020, or at any time during the year then ended.
8. Securities Lending
Each Fund, along with other funds in the Delaware Funds, may lend its securities pursuant to a security lending agreement (Lending Agreement) with The Bank of New York Mellon (BNY Mellon). At the time a security is loaned, the borrower must post collateral equal to the required percentage of the market value of the loaned security, including any accrued interest. The required percentage is: (1) 102% with respect to US securities and foreign securities that are denominated and payable in US dollars; and (2) 105% with respect to foreign securities. With respect to each loan, if on any business day the aggregate market value of securities collateral plus cash collateral held is less than the aggregate market value of the securities which are the subject of such loan, the borrower will be notified to provide additional collateral by the end of the following business day, which, together with the collateral already held, will be not less
52
than the applicable initial collateral requirements for such security loan. If the aggregate market value of securities collateral and cash collateral held with respect to a security loan exceeds the applicable initial collateral requirement, upon the request of the borrower, BNY Mellon must return enough collateral to the borrower by the end of the following business day to reduce the value of the remaining collateral to the applicable initial collateral requirement for such security loan. As a result of the foregoing, the value of the collateral held with respect to a loaned security on any particular day, may be more or less than the value of the security on loan. The collateral percentage with respect to the market value of the loaned security is determined by the security lending agent.
Cash collateral received by each fund of the Trust is generally invested in a series of individual separate accounts, each corresponding to a fund. The investment guidelines permit each separate account to hold certain securities that would be considered eligible securities for a money market fund. Cash collateral received is generally invested in government securities; certain obligations issued by government sponsored enterprises; repurchase agreements collateralized by US Treasury securities; obligations issued by the central government of any Organization for Economic Cooperation and Development (OECD) country or its agencies, instrumentalities, or establishments; obligations of supranational organizations; commercial paper, notes, bonds, and other debt obligations; certificates of deposit, time deposits, and other bank obligations; and asset-backed securities. A fund can also accept US government securities and letters of credit (non-cash collateral) in connection with securities loans.
In the event of default or bankruptcy by the lending agent, realization and/or retention of the collateral may be subject to legal proceedings. In the event the borrower fails to return loaned securities and the collateral received is insufficient to cover the value of the loaned securities and provided such collateral shortfall is not the result of investment losses, the lending agent has agreed to pay the amount of the shortfall to each Fund or, at the discretion of the lending agent, replace the loaned securities. Each Fund continues to record dividends or interest, as applicable, on the securities loaned and is subject to changes in value of the securities loaned that may occur during the term of the loan. Each Fund has the right under the Lending Agreement to recover the securities from the borrower on demand. With respect to security loans collateralized by non-cash collateral, each Fund receives loan premiums paid by the borrower. With respect to security loans collateralized by cash collateral, the earnings from the collateral investments are shared among each Fund, the security lending agent, and the borrower. Each Fund records security lending income net of allocations to the security lending agent and the borrower.
Each Fund may incur investment losses as a result of investing securities lending collateral. This could occur if an investment in the collateral investment account defaulted or became impaired. Under those circumstances, the value of each Fund’s cash collateral account may be less than the amount each Fund would be required to return to the borrowers of the securities and each Fund would be required to make up for this shortfall.
During the year ended December 31, 2020, the Fund had no securities out on loan.
9. Geographic, Credit and Market Risks
Beginning in January 2020, global financial markets have experienced and may continue to experience significant volatility resulting from the spread of a novel coronavirus known as COVID-19. The outbreak
53
Notes to financial statements
Delaware Funds® by Macquarie tax-exempt funds
9. Geographic, Credit and Market Risks (continued)
of COVID-19 has resulted in travel and border restrictions, quarantines, supply chain disruptions, lower consumer demand and general market uncertainty. The effects of COVID-19 have and may continue to adversely affect the global economy, the economies of certain nations and individual issuers, all of which may negatively impact the Funds’ performance.
When interest rates rise, fixed income securities (i.e. debt obligations) generally will decline in value. These declines in value are greater for fixed income securities with longer maturities or durations.
IBOR is the risk that changes related to the use of the London interbank offered rate (LIBOR) and other interbank offered rate (collectively, “IBORs”) could have adverse impacts on financial instruments that reference LIBOR (or the corresponding IBOR). The abandonment of LIBOR could affect the value and liquidity of instruments that reference LIBOR. The use of alternative reference rate products may impact investment strategy performance. These risks may also apply with respect to changes in connection with other IBORs, such as the euro overnight index average (EONIA), which are also the subject of recent reform.
The Funds concentrate their investments in securities issued by each corresponding state’s municipalities. The Funds invest primarily in a specific state and may be subject to geographic concentration risk. In addition, the Funds have the flexibility to invest in issuers in US territories and possessions such as the Commonwealth of Puerto Rico, the US Virgin Islands, and Guam whose bonds are also free of federal and individual state income taxes. The value of the Funds’ investments may be adversely affected by new legislation within the states or US territories, regional or local economic conditions, and differing levels of supply and demand for municipal bonds. Many municipalities insure repayment for their obligations. Although bond insurance reduces the risk of loss due to default by an issuer, such bonds remain subject to the risk that value may fluctuate for other reasons and there is no certainty that the insurance company will meet its obligations. A real or perceived decline in creditworthiness of a bond insurer can have an adverse impact on the value of insured bonds held in each Fund.
At December 31, 2020, the percentages of each Fund’s net assets insured by bond insurers are listed below and these securities have been identified on the “Schedules of investments.”
| | Delaware Tax–Free | | Delaware Tax–Free |
| | New Jersey Fund | | Oregon Fund |
| Assured Guaranty Corporation | | | — | | | | 2.64 | % |
| Assured Guaranty Municipal Corporation | | | 12.00 | % | | | 3.82 | % |
| Build America Mutual Assurance | | | 5.56 | % | | | — | |
| National Public Finance Guarantee Corporation | | | 4.38 | % | | | 3.15 | % |
| Total | | | 21.94 | % | | | 9.61 | % |
Each Fund invests a portion of its assets in high yield municipal fixed income securities, which are securities rated lower than BBB- by Standard & Poor’s Financial Services LLC (S&P), lower than Baa3 by Moody’s Investors Service, Inc. (Moody’s), or similarly rated by another nationally recognized statistical rating organization. Investments in these higher yielding securities are generally accompanied by a
54
greater degree of credit risk than higher rated securities. Additionally, lower rated securities may be more susceptible to adverse economic and competitive industry conditions than investment grade securities.
Each Fund invests in certain obligations that may have liquidity protection designed to ensure that the receipt of payments due on the underlying security is timely. Such protection may be provided through guarantees, insurance policies, or letters of credit obtained by the issuer or sponsor through third parties, through various means of structuring the transaction, or through a combination of such approaches. Each Fund will not pay any additional fees for such credit support, although the existence of credit support may increase the price of a security.
Each Fund may invest in advanced refunded bonds, escrow secured bonds, or defeased bonds. Under current federal tax laws and regulations, state and local government borrowers are permitted to refinance outstanding bonds by issuing new bonds. The issuer refinances the outstanding debt to either reduce interest costs or to remove or alter restrictive covenants imposed by the bonds being refinanced. A refunding transaction where the municipal securities are being refunded within 90 days from the issuance of the refunding issue is known as a “current refunding.” “Advance refunded bonds” are bonds in which the refunded bond issue remains outstanding for more than 90 days following the issuance of the refunding issue. In an advance refunding, the issuer will use the proceeds of a new bond issue to purchase high grade interest bearing debt securities, which are then deposited in an irrevocable escrow account held by an escrow agent to secure all future payments of principal and interest and bond premium of the advance refunded bond. Bonds are “escrowed to maturity” when the proceeds of the refunding issue are deposited in an escrow account for investment sufficient to pay all of the principal and interest on the original interest payment and maturity dates.
Bonds are considered “pre-refunded” when the refunding issue’s proceeds are escrowed only until a permitted call date or dates on the refunded issue with the refunded issue being redeemed at the time, including any required premium. Bonds become “defeased” when the rights and interests of the bondholders and of their lien on the pledged revenues or other security under the terms of the bond contract are substituted with an alternative source of revenues (the escrow securities) sufficient to meet payments of principal and interest to maturity or to the first call dates. Escrowed secured bonds will often receive a rating of AAA from Moody’s, S&P, and/or Fitch Ratings due to the strong credit quality of the escrow securities and the irrevocable nature of the escrow deposit agreement.
Each Fund may invest up to 15% of its net assets in illiquid securities, which may include securities with contractual restrictions on resale, securities exempt from registration under Rule 144A promulgated under the Securities Act of 1933, as amended, and other securities which may not be readily marketable. The relative illiquidity of these securities may impair each Fund from disposing of them in a timely manner and at a fair price when it is necessary or desirable to do so. While maintaining oversight, the Board has delegated to DMC, the day-to-day functions of determining whether individual securities are liquid for purposes of each Fund’s limitation on investments in illiquid securities. Securities eligible for resale pursuant to Rule 144A, which are determined to be liquid, are not subject to each Fund’s 15% limit on investments in illiquid securities. Rule 144A securities have been identified on the “Schedules of investments.”
55
Notes to financial statements
Delaware Funds® by Macquarie tax-exempt funds
10. Contractual Obligations
Each Fund enters into contracts in the normal course of business that contain a variety of indemnifications. Each Fund’s maximum exposure under these arrangements is unknown. However, each Fund has not had prior claims or losses pursuant to these contracts. Management has reviewed each Fund’s existing contracts and expects the risk of loss to be remote.
11. Recent Accounting Pronouncements
In August 2018, FASB issued an Accounting Standards Update (ASU), ASU 2018-13, which changes certain fair value measurement disclosure requirements. ASU 2018-13, in addition to other modifications and additions, removes the requirement to disclose the amount and reasons for transfers between Level 1 and Level 2 of the fair value hierarchy, the policy for the timing of transfers between levels and the valuation process for Level 3 fair value measurements. ASU 2018-13 is effective for fiscal years, and interim periods within those fiscal years, beginning after December 15, 2019. Management has implemented ASU 2018-13 on the financial statements.
In March 2020, FASB issued ASU 2020-04, Reference Rate Reform (Topic 848) – Facilitation of the Effects of Reference Rate Reform on Financial Reporting. The amendments in ASU 2020-04 provide optional temporary financial reporting relief from the effect of certain types of contract modifications due to the planned discontinuation of LIBOR and other interbank-offered based reference rates as of the end of 2021. ASU 2020-04 is effective for certain reference rate-related contract modifications that occur during the period March 12, 2020 through December 31, 2022. As of the financial reporting period, Management is evaluating the impact of applying this ASU.
12. Subsequent Events
Management has determined that no material events or transactions occurred subsequent to December 31, 2020, that would require recognition or disclosure in the Funds’ financial statements.
56
Report of independent
registered public accounting firm
To the Board of Trustees of Delaware Group® Limited-Term Government Funds and Shareholders of Delaware Tax-Free New Jersey Fund and Delaware Tax-Free Oregon Fund
Opinions on the Financial Statements
We have audited the accompanying statements of assets and liabilities, including the schedules of investments, of Delaware Tax-Free New Jersey Fund and Delaware Tax-Free Oregon Fund (two of the funds constituting the Delaware Group® Limited-Term Government Funds, hereafter collectively referred to as the “Funds”) as of December 31, 2020, the related statement of operations for the year ended December 31, 2020, the statements of changes in net assets for each of the two years in the period ended December 31, 2020, including the related notes, and the financial highlights for each of the two years in the period ended December 31, 2020 (collectively referred to as the “financial statements”). In our opinion, the financial statements present fairly, in all material respects, the financial position of each of the Funds as of December 31, 2020, the results of each of their operations for the year then ended, the changes in each of their net assets for each of the two years in the period ended December 31, 2020, and each of the financial highlights for each of the two years in the period ended December 31, 2020 in conformity with accounting principles generally accepted in the United States of America.
The financial statements of First Investors New Jersey Tax Exempt Fund and First Investors Oregon Tax Exempt Fund (subsequent to reorganization, known as Delaware Tax-Free New Jersey Fund and Delaware Tax-Free Oregon Fund, respectively) as of and for the year ended December 31, 2018 and the financial highlights for each of the periods ended on or prior to December 31, 2018 (not presented herein, other than the financial highlights) were audited by other auditors whose report dated February 26, 2019 expressed an unqualified opinion on those financial statements and financial highlights.
Basis for Opinions
These financial statements are the responsibility of the Funds’ management. Our responsibility is to express an opinion on the Funds’ financial statements based on our audits. We are a public accounting firm registered with the Public Company Accounting Oversight Board (United States) (PCAOB) and are required to be independent with respect to the Funds in accordance with the U.S. federal securities laws and the applicable rules and regulations of the Securities and Exchange Commission and the PCAOB.
We conducted our audits of these financial statements in accordance with the standards of the PCAOB. Those standards require that we plan and perform the audit to obtain reasonable assurance about whether the financial statements are free of material misstatement, whether due to error or fraud.
Our audits included performing procedures to assess the risks of material misstatement of the financial statements, whether due to error or fraud, and performing procedures that respond to those risks. Such procedures included examining, on a test basis, evidence regarding the amounts and disclosures in the financial statements. Our audits also included evaluating the accounting principles used and significant estimates made by management, as well as evaluating the overall presentation of the financial statements. Our procedures included confirmation of securities owned as of December 31, 2020 by correspondence with the custodian. We believe that our audits provide a reasonable basis for our opinions.
/s/PricewaterhouseCoopers LLP
Philadelphia, Pennsylvania
February 17, 2021
We have served as the auditor of one or more investment companies in Delaware Funds® by Macquarie since 2010.
57
Other Fund information (Unaudited)
Delaware Funds® by Macquarie tax-exempt funds
Tax Information
The information set forth below is for the Funds’ fiscal year as required by federal income tax laws. Shareholders, however, must report distributions on a calendar year basis for income tax purposes, which may include distributions for portions of two fiscal years of the Funds. Accordingly, the information needed by shareholders for income tax purposes will be sent to them in January of each year. Please consult your tax advisor for proper treatment of this information.
All disclosures are based on financial information available as of the date of this annual report and, accordingly are subject to change. For any and all items requiring reporting, it is the intention of each Fund to report the maximum amount permitted under the Internal Revenue Code and the regulations thereunder.
For the fiscal year ended December 31, 2020, each Fund reports distributions paid during the year as follows:
| | (A) | | | | | | |
| | Long-Term | | (B) | | (C) | | |
| | Capital Gains | | Ordinary Income | | Tax-Exempt | | Total |
| | Distributions | | Distributions | | Distributions | | Distributions |
| | (Tax Basis) | | (Tax Basis) | | (Tax Basis) | | (Tax Basis) |
| Delaware Tax–Free | | | | | | | | |
| New Jersey Fund | | 40.23% | | 9.10% | | 50.67% | | 100.00% |
| Delaware Tax–Free | | | | | | | | |
| Oregon Fund | | — | | 0.30% | | 99.70% | | 100.00% |
____________________
(A), (B) and (C) are based on a percentage of each Fund’s total distributions.
Board consideration of Investment Advisory Agreements for Delaware Tax-Free New Jersey Fund and Delaware Tax-Free Oregon Fund at a meeting held August 11-13, 2020
At a meeting held on August 11-13, 2020 (the “Annual Meeting”), the Board of Trustees (the “Board”), including a majority of disinterested or independent Trustees, approved the renewal of the Investment Advisory Agreement for each of Delaware Tax-Free New Jersey Fund and Delaware Tax-Free Oregon Fund (each, a “Fund” and together, the “Funds”). In making its decision, the Board considered information furnished at regular quarterly Board meetings, including reports detailing Fund performance, investment strategies, and expenses, as well as information prepared specifically in connection with the renewal of the investment advisory contracts. Information furnished specifically in connection with the renewal of the Investment Management Agreement with Delaware Management Company (“DMC”), a series of Macquarie Investment Management Business Trust (“MIMBT”), included materials provided by DMC and its affiliates (collectively, “Macquarie Investment Management”) concerning, among other things, the nature, extent, and quality of services provided to the Funds; the costs of such services to the Funds; economies of scale; and the investment manager’s financial condition and profitability. In addition, in connection with the Annual Meeting, materials were provided to the Trustees in May 2020, including reports provided by Broadridge Financial Solutions (“Broadridge”). The Broadridge reports compared each Fund’s investment performance and expenses with those of other comparable mutual funds. The Independent Trustees reviewed and discussed the Broadridge reports with independent legal
58
counsel to the Independent Trustees. In addition to the information noted previously, the Board also requested and received information regarding DMC’s policy with respect to advisory fee levels and its breakpoint philosophy; the structure of portfolio manager compensation; comparative client fee information; and any constraints or limitations on the availability of securities for certain investment styles, which had in the past year inhibited, or which were likely in the future to inhibit, the investment manager’s ability to invest fully in accordance with Fund policies.
In considering information relating to the approval of each Fund’s advisory agreement, as applicable, the Independent Trustees received assistance and advice from and met separately with independent legal counsel to the Independent Trustees and also received assistance and advice from an experienced and knowledgeable independent fund consultant, JDL Consultants, LLC (“JDL”). Although the Board gave attention to all information furnished, the following discussion identifies, under separate headings, the primary factors taken into account by the Board during its contract renewal considerations.
Nature, extent, and quality of services. The Board considered the services provided by DMC to the Funds and their shareholders. In reviewing the nature, extent, and quality of services, the Board considered reports furnished to it throughout the year, which covered matters such as the relative performance of the Funds; compliance of portfolio managers with the investment policies, strategies, and restrictions for the Funds; compliance by DMC and Delaware Distributors, L.P. (together, “Management”) personnel with the Code of Ethics adopted throughout the Delaware Funds® by Macquarie (“Delaware Funds”); and adherence to fair value pricing procedures as established by the Board. The Board was pleased with the current staffing of DMC and the emphasis placed on research in the investment process. The Board recognized DMC’s receipt of certain favorable industry distinctions during the past several years. The Board gave favorable consideration to DMC’s efforts to control expenses while maintaining service levels committed to Fund matters. The Board also noted the benefits provided to Fund shareholders through (a) each shareholder’s ability to: (i) exchange an investment in one Delaware Fund for the same class of shares in another Delaware Fund without a sales charge, or (ii) reinvest Fund dividends into additional shares of the Fund or into additional shares of other Delaware Funds, and (b) the privilege to combine holdings in other Delaware Funds to obtain a reduced sales charge. The Board was satisfied with the nature, extent, and quality of the overall services provided by DMC.
Investment performance. The Board placed significant emphasis on the investment performance of the Funds in view of the importance of investment performance to shareholders. Although the Board considered performance reports and discussions with portfolio managers at Investment Committee meetings throughout the year, the Board gave particular weight to the Broadridge reports furnished for the Annual Meeting. The Broadridge reports prepared for each Fund showed the investment performance of its Class A shares in comparison to a group of similar funds as selected by Broadridge (the “Performance Universe”). A fund with the best performance ranked first, and a fund with the poorest performance ranked last. The highest/best performing 25% of funds in the Performance Universe make up the first quartile; the next 25%, the second quartile; the next 25%, the third quartile; and the poorest/ worst performing 25% of funds in the Performance Universe make up the fourth quartile. Comparative annualized performance for each Fund was shown for the past 1-, 3-, 5-, and 10-year periods, to the extent, applicable, ended January 31, 2020. The Board’s objective is that each Fund’s performance for the 1-, 3-, and 5-year periods be at or above the median of its Performance Universe.
59
| Other Fund information (Unaudited) |
| Delaware Funds® by Macquarie tax-exempt funds |
Board consideration of Investment Advisory Agreements for Delaware Tax-Free New Jersey Fund and Delaware Tax-Free Oregon Fund at a meeting held August 11-13, 2020 (continued)
Delaware Tax-Free New Jersey Fund – The Performance Universe for the Fund consisted of the Fund and all retail and institutional New Jersey municipal debt funds as selected by Broadridge. The Broadridge report comparison showed that the Fund’s total return for the 1-year period was in the third quartile of its Performance Universe. The report further showed that the Fund’s total return for the 3-, 5-, and 10-year periods was in the fourth quartile of its Performance Universe. The Board observed that the Fund’s performance results were not in line with the Board’s objective. In evaluating the Fund’s performance, the Board considered that much of the Fund’s underperformance preceded Management’s acquisition of the Fund in October 2019. The Board also considered the numerous investment and performance reports delivered by Management personnel to the Board’s Investments Committee. The Board was satisfied that Management was taking action to improve Fund performance and to meet the Board’s performance objective.
Delaware Tax-Free Oregon Fund – The Performance Universe for the Fund consisted of the Fund and all retail and institutional other states municipal debt funds as selected by Broadridge. The Broadridge report comparison showed that the Fund’s total return for the 1-, 3-, 5-, and 10-year periods was in the third quartile of its Performance Universe. The Board observed that the Fund’s performance results were not in line with the Board’s objective. In evaluating the Fund’s performance, the Board considered that much of the Fund’s underperformance preceded Management’s acquisition of the Fund in October 2019. The Board also considered the numerous investment and performance reports delivered by Management personnel to the Board’s Investments Committee. The Board was satisfied that Management was taking action to improve Fund performance and to meet the Board’s performance objective.
Comparative expenses. The Board considered expense data for the Delaware Funds. Management provided the Board with information on pricing levels and fee structures for each Fund as of its most recently completed fiscal year. The Board also focused on the comparative analysis of effective management fees and total expense ratios of each Fund versus effective management fees and total expense ratios of a group of similar funds as selected by Broadridge (the “Expense Group”). In reviewing comparative costs, each Fund’s contractual management fee and the actual management fee incurred by the Fund were compared with the contractual management fees (assuming all funds in the Expense Group were similar in size to the Fund) and actual management fees (as reported by each fund) within the Expense Group, taking into account any applicable breakpoints and fee waivers. Each Fund’s total expenses were also compared with those of its Expense Group. The Broadridge total expenses, for comparative consistency, were shown by Broadridge for Class A shares and comparative total expenses including 12b-1 and non-12b-1 service fees. The Board’s objective is for each Fund’s total expense ratio to be competitive with those of the peer funds within its Expense Group.
Delaware Tax-Free New Jersey Fund – The expense comparisons for the Fund showed that its actual management fee and total expenses were in the quartile with the highest expenses of its Expense Group. The Board noted that the Fund’s total expenses were not in line with the Board’s objective. In evaluating the total expenses, the Board considered fee waivers in place through October 2021 and various initiatives implemented by Management, such as a negotiation of lower fees for fund accounting, fund accounting oversight services, and custody, which had created an opportunity for a further reduction in
60
expenses. The Board was satisfied with Management’s efforts to improve the Fund’s total expense ratio and to bring it in line with the Board’s objective.
Delaware Tax-Free Oregon Fund – The expense comparisons for the Fund showed that its actual management fee was in the quartile with the second highest expenses of its Expense Group and its total expenses were in the quartile with the highest expenses of its Expense Group. The Board noted that the Fund’s total expenses were not in line with the Board’s objective. In evaluating the total expenses, the Board considered fee waivers in place through October 2021 and various initiatives implemented by Management, such as a negotiation of lower fees for fund accounting, fund accounting oversight services, and custody, which had created an opportunity for a further reduction in expenses. The Board was satisfied with Management’s efforts to improve the Fund’s total expense ratio and to bring it in line with the Board’s objective.
Management profitability. The Board considered the level of profits realized by DMC in connection with the operation of the Funds. In this respect, the Board reviewed the Investment Management Profitability Analysis that addressed the overall profitability of DMC’s business in providing management and other services to each of the individual funds and the Delaware Funds as a whole. Specific attention was given to the methodology used by DMC in allocating costs for the purpose of determining profitability. Management stated that the level of profits of DMC, to a certain extent, reflects recent operational cost savings and efficiencies initiated by DMC. The Board considered DMC’s efforts to improve services provided to Fund shareholders and to meet additional regulatory and compliance requirements resulting from recent industry-wide Securities and Exchange Commission initiatives. The Board also considered the extent to which DMC might derive ancillary benefits from fund operations, including the potential for procuring additional business as a result of the prestige and visibility associated with its role as service provider to the Delaware Funds and the benefits from allocation of fund brokerage to improve trading efficiencies. As part of its work, the Board also reviewed a report prepared by JDL regarding MIMBT profitability as compared to certain peer fund complexes and the Independent Trustees met with JDL personnel to discuss DMC’s profitability in such context. The Board found that the management fees were reasonable in light of the services rendered and the level of profitability of DMC.
Economies of scale. The Trustees considered whether economies of scale are realized by DMC as each Fund’s assets increase and the extent to which any economies of scale are reflected in the level of management fees charged. The Trustees reviewed each Fund’s advisory fee pricing and structure, approved by the Board and shareholders, which includes breakpoints, and which applies to most funds in the Delaware Funds complex. Breakpoints in the advisory fee occur when the advisory fee rate is reduced on assets in excess of specified levels. Breakpoints result in a lower advisory fee than would otherwise be the case in the absence of breakpoints, when the asset levels specified in the breakpoints are exceeded. Although, as of March 31, 2020, each of the Funds had not reached a size at which it could take advantage of any breakpoints in the applicable fee schedule, the Board recognized that the fee was structured so that, if the Fund increases sufficiently in size, then economies of scale may be shared.
61
| Board of trustees / directors and officers addendum |
| Delaware Funds® by Macquarie |
A mutual fund is governed by a Board of Trustees/Directors (“Trustees”), which has oversight responsibility for the management of a fund’s business affairs. Trustees establish procedures and oversee and review the performance of the investment manager, the distributor, and others who perform services for the fund. The independent fund trustees, in particular, are advocates for shareholder interests. Each trustee has served in that capacity since he or she was elected to or appointed to the Board of Trustees, and will continue to serve until his or her retirement or the election of a new trustee in his or her place. The following is a list of the Trustees and Officers with certain background and related information.
| | | | | | | | Number of | | Other |
| | | | | | Principal | | Portfolios in Fund | | Directorships |
| Name, | | Position(s) | | | | Occupation(s) | | Complex Overseen | | Held by |
| Address, | | Held with | | Length of Time | | During the | | by Trustee | | Trustee |
| and Birth Date | | Fund(s) | | Served | | Past Five Years | | or Officer | | or Officer |
| Interested Trustee |
| |
| Shawn K. Lytle1 | | President, | | President and | | Global Head of Macquarie | | 85 | | Trustee — UBS Relationship |
| 610 Market Street | | Chief Executive | | Chief Executive | | Investment Management2 | | | | Funds, SMA Relationship Trust, |
| Philadelphia, PA | | Officer, | | Officer | | (January 2019–Present) | | | | and UBS Funds |
| 19106-2354 | | and Trustee | | since August 2015 | | Head of Americas of | | | | (May 2010–April 2015) |
| February 1970 | | | | Trustee since | | Macquarie Group | | | | |
| | | | September 2015 | | (December 2017–Present) | | | | |
| | | | | | Deputy Global Head of | | | | |
| | | | | | Macquarie Investment | | | | |
| | | | | | Management | | | | |
| | | | | | (2017–2019) | | | | |
| | | | | | Head of Macquarie Investment | | | | |
| | | | | | Management Americas | | | | |
| | | | | | (2015–2017) | | | | |
62
| | | | | | | | Number of | | Other |
| | | | | | Principal | | Portfolios in Fund | | Directorships |
| Name, | | Position(s) | | | | Occupation(s) | | Complex Overseen | | Held by |
| Address, | | Held with | | Length of Time | | During the | | by Trustee | | Trustee |
| and Birth Date | | Fund(s) | | Served | | Past Five Years | | or Officer | | or Officer |
| Independent Trustees |
| |
| Jerome D. | | Trustee | | Since January 2019 | | Managing Member, Stonebrook | | 85 | | None |
| Abernathy | | | | | | Capital Management, LLC | | | | |
| 610 Market Street | | | | | | (financial technology: macro | | | | |
| Philadelphia, PA | | | | | | factors and databases) | | | | |
| 19106-2354 | | | | | | (January 1993-Present) | | | | |
| July 1959 | | | | | | | | | | |
| |
| Thomas L. Bennett | | Chair and Trustee | | Trustee since March | | Private Investor | | 85 | | None |
| 610 Market Street | | | | 2005 | | (March 2004–Present) | | | | |
| Philadelphia, PA | | | | Chair since March | | | | | | |
| 19106-2354 | | | | 2015 | | | | | | |
| October 1947 | | | | | | | | | | |
| |
| Ann D. Borowiec | | Trustee | | Since March 2015 | | Chief Executive Officer, Private | | 85 | | Director — Banco Santander |
| 610 Market Street | | | | | | Wealth Management | | | | International |
| Philadelphia, PA | | | | | | (2011–2013) and Market | | | | (October 2016–December 2019) |
| 19106-2354 | | | | | | Manager, New Jersey Private | | | | Director — Santander Bank, N.A. |
| November 1958 | | | | | | Bank (2005–2011) — J.P. | | | | (December 2016–December |
| | | | | | Morgan Chase & Co. | | | | 2019) |
63
| Board of trustees / directors and officers addendum |
| Delaware Funds® by Macquarie |
| | | | | | | | Number of | | Other |
| | | | | | Principal | | Portfolios in Fund | | Directorships |
| Name, | | Position(s) | | | | Occupation(s) | | Complex Overseen | | Held by |
| Address, | | Held with | | Length of Time | | During the | | by Trustee | | Trustee |
| and Birth Date | | Fund(s) | | Served | | Past Five Years | | or Officer | | or Officer |
| |
| Joseph W. Chow | | Trustee | | Since January 2013 | | Private Investor | | 85 | | Director and Audit Committee |
| 610 Market Street | | | | | | (April 2011–Present) | | | | Member — Hercules Technology |
| Philadelphia, PA | | | | | | | | | | Growth Capital, Inc. |
| 19106-2354 | | | | | | | | | | (July 2004–July 2014) |
| January 1953 | | | | | | | | | | |
| |
| John A. Fry | | Trustee | | Since January 2001 | | President — Drexel University | | 85 | | Director; Compensation |
| 610 Market Street | | | | | | (August 2010–Present) | | | | Committee and Governance |
| Philadelphia, PA | | | | | | President — Franklin & Marshall | | | | Committee Member — |
| 19106-2354 | | | | | | College (July 2002–June 2010) | | | | Community Health Systems |
| May 1960 | | | | | | | | | | (May 2004–Present) |
| | | | | | | | | | Director — Drexel Morgan & Co. |
| | | | | | | | | | (2015–2019) |
| | | | | | | | | | Director and Audit Committee |
| | | | | | | | | | Member — vTv Therapeutics Inc. |
| | | | | | | | | | (2017–Present) |
| | | | | | | | | | Director and Audit Committee |
| | | | | | | | | | Member — FS Credit Real Estate |
| | | | | | | | | | Income Trust, Inc. |
| | | | | | | | | | (2018–Present) |
| | | | | | | | | | Director — Federal Reserve |
| | | | | | | | | | Bank of Philadelphia |
| | | | | | | | | | (January 2020–Present) |
64
| | | | | | | | Number of | | Other |
| | | | | | Principal | | Portfolios in Fund | | Directorships |
| Name, | | Position(s) | | | | Occupation(s) | | Complex Overseen | | Held by |
| Address, | | Held with | | Length of Time | | During the | | by Trustee | | Trustee |
| and Birth Date | | Fund(s) | | Served | | Past Five Years | | or Officer | | or Officer |
| | | | | | | | | | | |
| Frances A. | | Trustee | | Since September | | Private Investor | | 85 | | Trust Manager and Audit |
| Sevilla-Sacasa | | | | 2011 | | (January 2017–Present) | | | | Committee Chair — Camden |
| 610 Market Street | | | | | | Chief Executive Officer — Banco | | | | Property Trust |
| Philadelphia, PA | | | | | | Itaú International | | | | (August 2011–Present) |
| 19106-2354 | | | | | | (April 2012–December 2016) | | | | Director; Strategic |
| January 1956 | | | | | | Executive Advisor to Dean | | | | Planning and Reserves |
| | | | | | (August 2011–March 2012) and | | | | Committee and Nominating |
| | | | | | Interim Dean | | | | and Governance |
| | | | | | (January 2011–July 2011) — | | | | Committee Member — |
| | | | | | University of Miami School of | | | | Callon Petroleum Company |
| | | | | | Business Administration | | | | (December 2019–Present) |
| | | | | | President — U.S. Trust, Bank of | | | | Director — New Senior |
| | | | | | America Private Wealth | | | | Investment Group Inc. |
| | | | | | Management (Private Banking) | | | | (January 2021–Present) |
| | | | | | (July 2007-December 2008) | | | | Director; Audit Committee |
| | | | | | | | | | Member — Carrizo Oil & Gas, |
| | | | | | | | | | Inc. (March 2018–December |
| | | | | | | | | | 2019) |
65
Board of trustees / directors and officers addendum
Delaware Funds® by Macquarie
| | | | | | | | Number of | | Other |
| | | | | | Principal | | Portfolios in Fund | | Directorships |
| Name, | | Position(s) | | | | Occupation(s) | | Complex Overseen | | Held by |
| Address, | | Held with | | Length of Time | | During the | | by Trustee | | Trustee |
| and Birth Date | | Fund(s) | | Served | | Past Five Years | | or Officer | | or Officer |
| | | | | | | | | | | |
| Thomas K. Whitford | | Trustee | | Since January 2013 | | Vice Chairman (2010–April 2013) | | 85 | | Director — HSBC North America |
| 610 Market Street | | | | | | — PNC Financial Services Group | | | | Holdings Inc. |
| Philadelphia, PA | | | | | | | | | | (December 2013–Present) |
| 19106-2354 | | | | | | | | | | Director — HSBC USA Inc. |
| March 1956 | | | | | | | | | | (July 2014–Present) |
| | | | | | | | | | Director — HSBC Bank USA, |
| | | | | | | | | | National Association |
| | | | | | | | | | (July 2014–March 2017) |
| | | | | | | | | | Director — HSBC Finance |
| | | | | | | | | | Corporation |
| | | | | | | | | | (December 2013–April 2018) |
66
| | | | | | | | Number of | | Other |
| | | | | | Principal | | Portfolios in Fund | | Directorships |
| Name, | | Position(s) | | | | Occupation(s) | | Complex Overseen | | Held by |
| Address, | | Held with | | Length of Time | | During the | | by Trustee | | Trustee |
| and Birth Date | | Fund(s) | | Served | | Past Five Years | | or Officer | | or Officer |
| | | | | | | | | | | |
| Christianna Wood | | Trustee | | Since January 2019 | | Chief Executive Officer and | | 85 | | Director; Finance Committee and |
| 610 Market Street | | | | | | President — Gore Creek Capital, | | | | Audit Committee Member — |
| Philadelphia, PA | | | | | | Ltd. (August 2009–Present) | | | | H&R Block Corporation |
| 19106-2354 | | | | | | | | | | (July 2008–Present) |
| August 1959 | | | | | | | | | | Director; Investments |
| | | | | | | | | | Committee, Capital and Finance |
| | | | | | | | | | Committee, and Audit |
| | | | | | | | | | Committee Member — Grange |
| | | | | | | | | | Insurance (2013–Present) |
| | | | | | | | | | Trustee; Chair of Nominating and |
| | | | | | | | | | Governance Committee and |
| | | | | | | | | | Audit Committee Member — The |
| | | | | | | | | | Merger Fund (2013–Present), The |
| | | | | | | | | | Merger Fund VL (2013–Present); |
| | | | | | | | | | WCM Alternatives: Event-Driven |
| | | | | | | | | | Fund (2013–Present), and WCM |
| | | | | | | | | | Alternatives: Credit Event Fund |
| | | | | | | | | | (December 2017–Present) |
| | | | | | | | | | Director; Chair of Governance |
| | | | | | | | | | Committee and Audit Committee |
| | | | | | | | | | Member — International |
| | | | | | | | | | Securities Exchange (2010–2016) |
67
Board of trustees / directors and officers addendum
Delaware Funds® by Macquarie
| | | | | | | | Number of | | Other |
| | | | | | Principal | | Portfolios in Fund | | Directorships |
| Name, | | Position(s) | | | | Occupation(s) | | Complex Overseen | | Held by |
| Address, | | Held with | | Length of Time | | During the | | by Trustee | | Trustee |
| and Birth Date | | Fund(s) | | Served | | Past Five Years | | or Officer | | or Officer |
| | | | | | | | | | | |
| Janet L. Yeomans | | Trustee | | Since April 1999 | | Vice President and Treasurer | | 85 | | Director; Personnel and |
| 610 Market Street | | | | | | (January 2006–July 2012), Vice | | | | Compensation Committee Chair; |
| Philadelphia, PA | | | | | | President — Mergers & | | | | Member of Nominating, |
| 19106-2354 | | | | | | Acquisitions | | | | Investments, and Audit |
| July 1948 | | | | | | (January 2003–January 2006), | | | | Committees for various periods |
| | | | | | and Vice President and Treasurer | | | | throughout directorship — |
| | | | | | (July 1995–January 2003) — 3M | | | | Okabena Company (2009–2017) |
| | | | | | Company | | | | |
| |
| Officers |
| |
| David F. Connor | | Senior Vice President, | | Senior Vice President, | | David F. Connor has served in | | 85 | | None3 |
| 610 Market Street | | General Counsel, and | | since May 2013; | | various capacities at different | | | | |
| Philadelphia, PA | | Secretary | | General Counsel | | times at Macquarie Investment | | | | |
| 19106-2354 | | | | since May 2015; | | Management. | | | | |
| December 1963 | | | | Secretary since | | | | | | |
| | | | October 2005 | | | | | | |
| | | | | | | | | | | |
| Daniel V. Geatens | | Vice President and | | Vice President and | | Daniel V. Geatens has served in | | 85 | | None3 |
| 610 Market Street | | Treasurer | | Treasurer since | | various capacities at different | | | | |
| Philadelphia, PA | | | | October 2007 | | times at Macquarie Investment | | | | |
| 19106-2354 | | | | | | Management. | | | | |
| October 1972 | | | | | | | | | | |
68
| | | | | | | | Number of | | Other |
| | | | | | Principal | | Portfolios in Fund | | Directorships |
| Name, | | Position(s) | | | | Occupation(s) | | Complex Overseen | | Held by |
| Address, | | Held with | | Length of Time | | During the | | by Trustee | | Trustee |
| and Birth Date | | Fund(s) | | Served | | Past Five Years | | or Officer | | or Officer |
| | | | | | | | | | | |
| Richard Salus | | Senior Vice President | | Senior Vice President | | Richard Salus has served in | | 85 | | None |
| 610 Market Street | | and Chief Financial | | and Chief Financial | | various capacities at different | | | | |
| Philadelphia, PA | | Officer | | Officer since | | times at Macquarie Investment | | | | |
| 19106-2354 | | | | November 2006 | | Management. | | | | |
| October 1963 | | | | | | | | | | |
| 1 | Shawn K. Lytle is considered to be an “Interested Trustee” because he is an executive officer of the Fund’s(s’) investment advisor. |
| 2 | Macquarie Investment Management is the marketing name for Macquarie Management Holdings, Inc. and its subsidiaries, including the Fund’s(s’) investment advisor, principal underwriter, and its transfer agent. |
| 3 | David F. Connor and Daniel V. Geatens serve in similar capacities for the six portfolios of the Optimum Fund Trust, which have the same investment advisor, principal underwriter, and transfer agent as the registrant. Mr. Geatens also serves as the Chief Financial Officer of the Optimum Fund Trust and he is the Chief Financial Officer and Treasurer for Macquarie Global Infrastructure Total Return Fund Inc. In addition, Mr. Connor serves as Chief Legal Officer and Secretary for Macquarie Global Infrastructure Total Return Fund Inc. |
The Statement of Additional Information for the Funds includes additional information about the Trustees and Officers and is available, without charge, upon request by calling your financial advisor or 800 523-1918.
69
About the organization
| Board of trustees |
Shawn K. Lytle
President and
Chief Executive Officer
Delaware Funds®
by Macquarie
Philadelphia, PA Jerome D. Abernathy
Managing Director
Stonebrook Capital
Management, LLC
Jersey City, NJ Thomas L. Bennett
Chairman of the Board
Delaware Funds
by Macquarie
Private Investor
Rosemont, PA | | Ann D. Borowiec
Former Chief Executive
Officer
Private Wealth Management
J.P. Morgan Chase & Co.
New York, NY Joseph W. Chow
Former Executive Vice
President
State Street Corporation
Boston, MA John A. Fry
President
Drexel University
Philadelphia, PA | | Frances A.
Sevilla-Sacasa
Former Chief Executive
Officer
Banco Itaú International
Miami, FL Thomas K. Whitford
Former Vice Chairman
PNC Financial Services
Group
Pittsburgh, PA | | Christianna Wood
Chief Executive Officer
and President
Gore Creek Capital, Ltd.
Golden, CO Janet L. Yeomans
Former Vice President and
Treasurer
3M Company
St. Paul, MN |
| |
| Affiliated officers |
David F. Connor
Senior Vice President,
General Counsel,
and Secretary
Delaware Funds
by Macquarie
Philadelphia, PA | | Daniel V. Geatens
Vice President and
Treasurer
Delaware Funds
by Macquarie
Philadelphia, PA | | Richard Salus
Senior Vice President and
Chief Financial Officer
Delaware Funds
by Macquarie
Philadelphia, PA | | |
| This annual report is for the information of Delaware Tax-Free New Jersey Fund and Delaware Tax-Free Oregon Fund shareholders, but it may be used with prospective investors when preceded or accompanied by the Delaware Fund fact sheet for the most recently completed calendar quarter. These documents are available at delawarefunds.com/literature. |
Each Fund files its complete schedule of portfolio holdings with the Securities and Exchange Commission (SEC) for the first and third quarters of each fiscal year on Form N-PORT. Each Fund’s Forms N-PORT, as well as a description of the policies and procedures that the Funds use to determine how to vote proxies (if any) relating to portfolio securities, are available without charge (i) upon request, by calling 800 523-1918; and (ii) on the SEC’s website at sec.gov. In addition, a description of the policies and procedures that the Funds use to determine how to vote proxies (if any) relating to portfolio securities and the Schedules of Investments included in the Funds’ most recent Form N-PORT are available without charge on the Funds’ website at delawarefunds.com/literature. Each Fund’s Forms N-PORT may be reviewed and copied at the SEC’s Public Reference Room in Washington, D.C.; information on the operation of the Public Reference Room may be obtained by calling 800 SEC-0330.
Information (if any) regarding how the Funds voted proxies relating to portfolio securities during the most recently disclosed 12-month period ended June 30 is available without charge (i) through the Funds’ website at delawarefunds.com/proxy; and (ii) on the SEC’s website at sec.gov.
70
Item 2. Code of Ethics
The registrant has adopted a code of ethics that applies to the registrant’s principal executive officer, principal financial officer, principal accounting officer or controller, or persons performing similar functions, regardless of whether these individuals are employed by the registrant or a third party. A copy of the registrant’s Code of Business Ethics has been posted on the Delaware Funds® by Macquarie Internet Web site at www.delawarefunds.com. Any amendments to the Code of Business Ethics, and information on any waiver from its provisions granted by the registrant, will also be posted on this Web site within five business days of such amendment or waiver and will remain on the Web site for at least 12 months.
Item 3. Audit Committee Financial Expert
The registrant’s Board of Trustees has determined that certain members of the registrant’s Audit Committee are audit committee financial experts, as defined below. For purposes of this item, an “audit committee financial expert” is a person who has the following attributes:
a. An understanding of generally accepted accounting principles and financial statements;
b. The ability to assess the general application of such principles in connection with the accounting for estimates, accruals, and reserves;
c. Experience preparing, auditing, analyzing, or evaluating financial statements that present a breadth and level of complexity of accounting issues that are generally comparable to the breadth and complexity of issues that can reasonably be expected to be raised by the registrant’s financial statements, or experience actively supervising one or more persons engaged in such activities;
d. An understanding of internal controls and procedures for financial reporting; and
e. An understanding of audit committee functions.
An “audit committee financial expert” shall have acquired such attributes through:
a. Education and experience as a principal financial officer, principal accounting officer, controller, public accountant, or auditor or experience in one or more positions that involve the performance of similar functions;
b. Experience actively supervising a principal financial officer, principal accounting officer, controller, public accountant, auditor, or person performing similar functions;
c. Experience overseeing or assessing the performance of companies or public accountants with respect to the preparation, auditing, or evaluation of financial statements; or
d. Other relevant experience.
The registrant’s Board of Trustees has also determined that each member of the registrant’s Audit Committee is independent. In order to be “independent” for purposes of this item, the Audit Committee member may not: (i) other than in his or her capacity as a member of the Board of Trustees or any committee thereof, accept directly or indirectly any consulting, advisory or other compensatory fee from the issuer; or (ii) be an “interested person” of the registrant as defined in Section 2(a)(19) of the Investment Company Act of 1940.
The names of the audit committee financial experts on the registrant’s Audit Committee are set forth below:
Jerome D. Abernathy
John A. Fry
Thomas K. Whitford, Chair
Christianna Wood
Item 4. Principal Accountant Fees and Services
(a) Audit fees.
The aggregate fees billed for services provided to the registrant by its independent auditors for the audit of the registrant’s annual financial statements and for services normally provided by the independent auditors in connection with statutory and regulatory filings or engagements were $126,340 for the fiscal year ended December 31, 2020.
The aggregate fees billed for services provided to the registrant by its independent auditors for the audit of the registrant’s annual financial statements and for services normally provided by the independent auditors in connection with statutory and regulatory filings or engagements were $360,490 for the fiscal year ended December 31, 2019.
(b) Audit-related fees.
The aggregate fees billed by the registrant’s independent auditors for services relating to the performance of the audit of the registrant’s financial statements and not reported under paragraph (a) of this Item were $0 for the fiscal year ended December 31, 2020.
The aggregate fees billed by the registrant’s independent auditors for services relating to the performance of the audit of the financial statements of the registrant’s investment adviser and other service providers under common control with the adviser and that relate directly to the operations or financial reporting of the registrant were $903,282 for the registrant’s fiscal year ended December 31, 2020. The percentage of these fees relating to services approved by the registrant’s Audit Committee pursuant to the de minimis exception from the pre-approval requirement in Rule 2-01(c)(7)(i)(C) of Regulation S-X was 0%. These audit-related services were as follows: year-end audit procedures; group reporting and subsidiary statutory audits.
The aggregate fees billed by the registrant’s independent auditors for services relating to the performance of the audit of the registrant’s financial statements and not reported under paragraph (a) of this Item were $0 for the fiscal year ended December 31, 2019.
The aggregate fees billed by the registrant’s independent auditors for services relating to the performance of the audit of the financial statements of the registrant’s investment adviser and other service providers under common control with the adviser and that relate directly to the operations or financial reporting of the registrant were $909,000 for the registrant’s fiscal year ended December 31, 2019. The percentage of these fees relating to services approved by the registrant’s Audit Committee pursuant to the de minimis exception from the pre-approval requirement in Rule 2-01(c)(7)(i)(C) of Regulation S-X was 0%. These audit-related services were as follows: year-end audit procedures; group reporting and subsidiary statutory audits.
(c) Tax fees.
The aggregate fees billed by the registrant’s independent auditors for tax-related services provided to the registrant were $17,500 for the fiscal year ended December 31, 2020. The percentage of these fees relating to services approved by the registrant’s Audit Committee pursuant to the de minimis exception from the pre-approval requirement in Rule 2-01(c)(7)(i)(C) of Regulation S-X was 0%. These tax-related services were as follows: review of income tax returns and review of annual excise distribution calculations.
The aggregate fees billed by the registrant’s independent auditors for tax-related services provided to the registrant’s investment adviser and other service providers under common control with the adviser and that relate directly to the operations or financial reporting of the registrant were $0 for the registrant’s fiscal year ended December 31, 2020. The percentage of these fees relating to services approved by the registrant’s Audit Committee pursuant to the de minimis exception from the pre-approval requirement in Rule 2-01(c)(7)(i)(C) of Regulation S-X was 0%.
The aggregate fees billed by the registrant’s independent auditors for tax-related services provided to the registrant were $38,080 for the fiscal year ended December 31, 2019. The percentage of these fees relating to services approved by the registrant’s Audit Committee pursuant to the de minimis exception from the pre-approval requirement in Rule 2-01(c)(7)(i)(C) of Regulation S-X was 0%. These tax-related services were as follows: review of income tax returns and review of annual excise distribution calculations.
The aggregate fees billed by the registrant’s independent auditors for tax-related services provided to the registrant’s investment adviser and other service providers under common control with the adviser and that relate directly to the operations or financial reporting of the registrant were $0 for the registrant’s fiscal year ended December 31, 2019. The percentage of these fees relating to services approved by the registrant’s Audit Committee pursuant to the de minimis exception from the pre-approval requirement in Rule 2-01(c)(7)(i)(C) of Regulation S-X was 0%.
(d) All other fees.
The aggregate fees billed for all services provided by the independent auditors to the registrant other than those set forth in paragraphs (a), (b) and (c) of this Item were $0 for the fiscal year ended December 31, 2020.
The aggregate fees billed for all services other than those set forth in paragraphs (b) and (c) of this Item provided by the registrant’s independent auditors to the registrant’s adviser and other service providers under common control with the adviser and that relate directly to the operations or financial reporting of the registrant were $0 for the registrant’s fiscal year ended December 31, 2020. The percentage of these fees relating to services approved by the registrant’s Audit Committee pursuant to the de minimis exception from the pre-approval requirement in Rule 2-01(c)(7)(i)(C) of Regulation S-X was 0%.
The aggregate fees billed for all services provided by the independent auditors to the registrant other than those set forth in paragraphs (a), (b) and (c) of this Item were $0 for the fiscal year ended December 31, 2019.
The aggregate fees billed for all services other than those set forth in paragraphs (b) and (c) of this Item provided by the registrant’s independent auditors to the registrant’s adviser and other service providers under common control with the adviser and that relate directly to the operations or financial reporting of the registrant were $0 for the registrant’s fiscal year ended December 31, 2019. The percentage of these fees relating to services approved by the registrant’s Audit Committee pursuant to the de minimis exception from the pre-approval requirement in Rule 2-01(c)(7)(i)(C) of Regulation S-X was 0%.
(e) The registrant’s Audit Committee has established pre-approval policies and procedures as permitted by Rule 2-01(c)(7)(i)(B) of Regulation S-X (the “Pre-Approval Policy”) with respect to services provided by the registrant’s independent auditors. Pursuant to the Pre-Approval Policy, the Audit Committee has pre-approved the services set forth in the table below with respect to the registrant up to the specified fee limits. Certain fee limits are based on aggregate fees to the registrant and other registrants within the Delaware Funds® by Macquarie.
| Service | Range of Fees |
| Audit Services | |
| Statutory audits or financial audits for new Funds | up to $40,000 per Fund |
| Services associated with SEC registration statements (e.g., Form N-1A, Form N-14, etc.), periodic reports and other documents filed with the SEC or other documents issued in connection with securities offerings (e.g., comfort letters for closed-end Fund offerings, consents), and assistance in responding to SEC comment letters | up to $10,000 per Fund |
| Consultations by Fund management as to the accounting or disclosure treatment of transactions or events and/or the actual or potential impact of final or proposed rules, standards or interpretations by the SEC, FASB, or other regulatory or standard-setting bodies (Note: Under SEC rules, some consultations may be considered “audit-related services” rather than “audit services”) | up to $25,000 in the aggregate |
| Audit-Related Services | |
| Consultations by Fund management as to the accounting or disclosure treatment of transactions or events and /or the actual or potential impact of final or proposed rules, standards or interpretations by the SEC, FASB, or other regulatory or standard-setting bodies (Note: Under SEC rules, some consultations may be considered “audit services” rather than “audit-related services”) | up to $25,000 in the aggregate |
| Tax Services | |
| U.S. federal, state and local and international tax planning and advice (e.g., consulting on statutory, regulatory or administrative developments, evaluation of Funds’ tax compliance function, etc.) | up to $25,000 in the aggregate |
| U.S. federal, state and local tax compliance (e.g., excise distribution reviews, etc.) | up to $5,000 per Fund |
| Review of federal, state, local and international income, franchise and other tax returns | up to $5,000 per Fund |
Under the Pre-Approval Policy, the Audit Committee has also pre-approved the services set forth in the table below with respect to the registrant’s investment adviser and other entities controlling, controlled by or under common control with the investment adviser that provide ongoing services to the registrant (the “Control Affiliates”) up to the specified fee limit. This fee limit is based on aggregate fees to the investment adviser and its Control Affiliates.
| Service | Range of Fees |
| Non-Audit Services | |
| Services associated with periodic reports and other documents filed with the SEC and assistance in responding to SEC comment letters | up to $10,000 in the aggregate |
The Pre-Approval Policy requires the registrant’s independent auditors to report to the Audit Committee at each of its regular meetings regarding all services initiated since the last such report was rendered, including those services authorized by the Pre-Approval Policy.
(f) Not applicable.
(g) The aggregate non-audit fees billed by the registrant’s independent auditors for services rendered to the registrant and to its investment adviser and other service providers under common control with the adviser were $8,455,000 and $4,687,000 for the registrant’s fiscal years ended December 31, 2020 and December 31, 2019, respectively.
(h) In connection with its selection of the independent auditors, the registrant’s Audit Committee has considered the independent auditors’ provision of non-audit services to the registrant’s investment adviser and other service providers under common control with the adviser that were not required to be pre-approved pursuant to Rule 2-01(c)(7)(ii) of Regulation S-X. The Audit Committee has determined that the independent auditors’ provision of these services is compatible with maintaining the auditors’ independence.
Item 5. Audit Committee of Listed Registrants
Not applicable.
Item 6. Investments
(a) Included as part of report to shareholders filed under Item 1 of this Form N-CSR.
(b) Divestment of securities in accordance with Section 13(c) of the Investment Company Act of 1940.
Not applicable.
Item 7. Disclosure of Proxy Voting Policies and Procedures for Closed-End Management Investment Companies
Not applicable.
Item 8. Portfolio Managers of Closed-End Management Investment Companies
Not applicable.
Item 9. Purchases of Equity Securities by Closed-End Management Investment Companies and Affiliated Purchasers
Not applicable.
Item 10. Submission of Matters to a Vote of Security Holders
Not applicable.
Item 11. Controls and Procedures
The registrant’s principal executive officer and principal financial officer have evaluated the registrant’s disclosure controls and procedures within 90 days of the filing of this report and have concluded that they are effective in providing reasonable assurance that the information required to be disclosed by the registrant in its reports or statements filed under the Securities Exchange Act of 1934 is recorded, processed, summarized and reported within the time periods specified in the rules and forms of the Securities and Exchange Commission.
There were no significant changes in the registrant’s internal control over financial reporting that occurred during the period covered by the report to stockholders included herein that have materially affected, or are reasonably likely to materially affect, the registrant’s internal control over financial reporting.
Item 12. Disclosure of Securities Lending Activities for Closed-End Management Investment Companies
Not applicable.
Item 13. Exhibits
(a) (1) Code of Ethics
Not applicable.
(2) Certifications of Principal Executive Officer and Principal Financial Officer pursuant to Rule 30a-2 under the Investment Company Act of 1940 are attached hereto as Exhibit 99.CERT.
(3) Written solicitations to purchase securities pursuant to Rule 23c-1 under the Securities Exchange Act of 1934.
Not applicable.
(b) Certifications pursuant to Section 906 of the Sarbanes-Oxley Act of 2002 are furnished herewith as Exhibit 99.906CERT.
SIGNATURES
Pursuant to the requirements of the Securities Exchange Act of 1934 and the Investment Company Act of 1940, the registrant has duly caused this report to be signed on its behalf, by the undersigned, thereunto duly authorized.
DELAWARE GROUP® LIMITED-TERM GOVERNMENT FUNDS
| /s/SHAWN K. LYTLE |
| By: | Shawn K. Lytle |
| Title: | President and Chief Executive Officer |
| Date: | March 5, 2021 |
Pursuant to the requirements of the Securities Exchange Act of 1934 and the Investment Company Act of 1940, this report has been signed below by the following persons on behalf of the registrant and in the capacities and on the dates indicated.
| /s/SHAWN K. LYTLE |
| By: | Shawn K. Lytle |
| Title: | President and Chief Executive Officer |
| Date: | March 5, 2021 |
| |
| /s/RICHARD SALUS |
| By: | Richard Salus |
| Title: | Chief Financial Officer |
| Date: | March 5, 2021 |