UNITED STATES SECURITIES AND EXCHANGE COMMISSION
Washington, D.C. 20549
FORM N-CSR
CERTIFIED SHAREHOLDER REPORT OF REGISTERED MANAGEMENT
INVESTMENT COMPANIES
| Investment Company Act file number: | 811-03363 |
| Exact name of registrant as specified in charter: | Delaware Group® Limited-Term |
| Government Funds | |
| Address of principal executive offices: | 2005 Market Street |
| Philadelphia, PA 19103 | |
| Name and address of agent for service: | David F. Connor, Esq. |
| 2005 Market Street | |
| Philadelphia, PA 19103 | |
| Registrant’s telephone number, including area code: | (800) 523-1918 |
| Date of fiscal year end: | December 31 |
| Date of reporting period: | December 31, 2016 |
Item 1. Reports to Stockholders
Table of Contents

Annual report
Fixed income mutual fund
Delaware Limited-Term Diversified Income Fund
December 31, 2016
Carefully consider the Fund’s investment objectives, risk factors, charges, and expenses before investing. This and other information can be found in the Fund’s prospectus and its summary prospectus, which may be obtained by visiting delawareinvestments.com/literature or calling 800 523-1918. Investors should read the prospectus and the summary prospectus carefully before investing.
You can obtain shareholder reports and prospectuses online instead of in the mail.
Visit delawareinvestments.com/edelivery.
Table of Contents
Experience Delaware Investments
Delaware Investments is committed to the pursuit of consistently superior asset management and unparalleled client service. We believe in our investment processes, which seek to deliver consistent results, and in convenient services that help add value for our clients.
If you are interested in learning more about creating an investment plan, contact your financial advisor.
You can learn more about Delaware Investments or obtain a prospectus for Delaware Limited-Term Diversified Income Fund at delawareinvestments.com/literature.
Manage your investments online
| ● | 24-hour access to your account information |
| ● | Obtain share prices |
| ● | Check your account balance and recent transactions |
| ● | Request statements or literature |
| ● | Make purchases and redemptions |
Delaware Management Holdings, Inc. and its subsidiaries (collectively known by the marketing name of Delaware Investments) are wholly owned subsidiaries of Macquarie Group Limited, a global provider of banking, financial, advisory, investment, and funds management services.
Neither Delaware Investments nor its affiliates referred to in this document are authorized deposit-taking institutions for the purpose of the Banking Act 1959 (Commonwealth of Australia). The obligations of these entities do not represent deposits or other liabilities of Macquarie Bank Limited (MBL), a subsidiary of Macquarie Group Limited and an affiliate of Delaware Investments. MBL does not guarantee or otherwise provide assurance in respect of the obligations of these entities, unless noted otherwise. The Fund is governed by U.S. laws and regulations.
| 1 | ||||
| 4 | ||||
| 8 | ||||
| 10 | ||||
| 11 | ||||
| 38 | ||||
| 40 | ||||
| 42 | ||||
| 44 | ||||
| 52 | ||||
| 70 | ||||
| 71 | ||||
| 76 | ||||
| 83 |
Unless otherwise noted, views expressed herein are current as of Dec. 31, 2016, and subject to change for events occurring after such date.
The Fund is not FDIC insured and is not guaranteed. It is possible to lose the principal amount invested.
Mutual fund advisory services provided by Delaware Management Company, a series of Delaware Management Business Trust, which is a registered investment advisor. Delaware Investments, a member of Macquarie Group, refers to Delaware Management Holdings, Inc. and its subsidiaries, including the Fund’s distributor, Delaware Distributors, L.P. Macquarie Group refers to Macquarie Group Limited and its subsidiaries and affiliates worldwide.
© 2017 Delaware Management Holdings, Inc.
All third-party marks cited are the property of their respective owners.
Table of Contents
| Portfolio management review | ||||
| Delaware Limited-Term Diversified Income Fund | January 10, 2017 | |||
| Performance preview (for the year ended December 31, 2016) | ||||||||
Delaware Limited-Term Diversified Income Fund (Institutional Class shares) | 1-year return | +2.45 | % | |||||
Delaware Limited-Term Diversified Income Fund (Class A shares) | 1-year return | +2.42 | % | |||||
Bloomberg Barclays 1–3 Year U.S. Government/Credit Index* (benchmark) | 1-year return | +1.28 | % | |||||
Past performance does not guarantee future results.
For complete, annualized performance for Delaware Limited-Term Diversified Income Fund, please see the table on page 4.
Institutional Class shares are available without sales or asset-based distribution charges only to certain eligible accounts. The performance of Class A shares excludes the applicable sales charge. Both Institutional Class shares and Class A shares reflect the reinvestment of all distributions.
Please see page 6 for a description of the index. Index performance returns do not reflect any management fees, transaction costs, or expenses. Indices are unmanaged and one cannot invest directly in an index.
*Formerly known as the Barclays 1–3 Year U.S. Government/Credit Index.
The U.S. economy continued its slow to moderate pace of growth in 2016, expanding more quickly than the rest of the global economy. After an initial rate hike in December 2015, the U.S. Federal Reserve was expected to continue raising short-term interest rates. However, partly in response to ongoing sluggish global growth, the Fed paused before raising rates again, awaiting further signs of economic strength.
In contrast, throughout the year, central banks in the European Union, the United Kingdom, China, and Japan all maintained or increased monetary stimulus programs, increasing liquidity and setting historically low interest rates. These divergent central bank policies – and interest rates – between the United States and the rest of the world created a technical boost, with increased foreign demand for U.S. assets, including investment grade corporate bonds.
U.S. Treasury yields rose sharply after Donald Trump’s election as U.S. president on the market’s assumption that a Trump administration would implement fiscal stimulus through tax cuts, deregulation, and infrastructure spending. The Fed made its long-awaited second rate hike in December 2016 after mounting indications of U.S. economic acceleration.
Fund performance
For the fiscal year ended Dec. 31, 2016, Delaware Limited-Term Diversified Income Fund Institutional Class shares returned +2.45%. The Fund’s Class A shares returned +2.42% at net asset value and -0.42% at maximum offer price. These figures reflect all distributions reinvested. For the same period, the Bloomberg Barclays 1–3 Year U.S. Government/Credit Index returned +1.28%. Complete annualized performance for Delaware Limited-Term Diversified Income Fund is shown in the table on page 4.
The robust returns of investment grade corporate bonds drove the Fund’s relatively strong performance, as returns for corporate bonds were boosted by strong foreign demand and a general reach for yield.
The Fund was able to capture additional income relative to the benchmark index through an overweight allocation in corporate bonds. This included longer-duration bonds. We accomplished that without taking on excess interest rate risk by allocating significantly to AAA-rated asset-backed floating rate bonds in auto loans and credit card receivables to act as a portfolio anchor.
The floating rate nature of these bonds allowed us to own intermediate- to longer-term corporate bonds, generating relatively high income. That
1
Table of Contents
Portfolio management review
Delaware Limited-Term Diversified Income Fund
enabled the Fund to out-earn the benchmark index without taking excessive interest rate risk.
Although the Fed had indicated it might raise rates three times in 2016, we thought the Fed would only make one or two hikes. In our view, the Fed was too optimistic about U.S. economic growth. We saw inflation as less of a risk. In contrast to previous monetary tightening efforts, when the Fed’s goal had been to slow an overheated economy, the focus in this case was on normalizing interest rates, which involves a slower, more deliberate and gradual pace of monetary tightening.
The Fund’s resulting positioning benefited from our assumption of less Fed action in 2016. The Fund holding both short-term floating rate bonds and longer-term corporate bonds aided performance as the rate curve flattened. However, the Fund’s yield curve positioning became a negative factor after the November election when the curve began to steepen.
Our emphasis on fundamental analysis benefited the Fund. We saw an increase in leverage by companies and significant new issue of bonds. These new issues were used to fund increased dividends and share buybacks, shareholder-friendly, and bond-unfriendly activities. We saw this as an indication that companies hadn’t found a better use of capital. That supported our concern regarding slow U.S. growth and our belief that the Fed was overly optimistic.
Modest allocations to high yield (roughly 3% of the Fund’s portfolio), bank loans (2%), and emerging markets bonds (2%) – all out-of-benchmark sectors that did better than the benchmark index – contributed to the Fund’s outperformance as well. An overweight to BBB-rated corporate bonds (8%) also helped, as lower-quality assets outperformed higher-quality assets throughout the year.
An average 8% allocation to agency mortgage-backed securities (MBS) likewise contributed.
Within agency MBS, we benefited from exposure to high-coupon, short-duration mortgages that had shown benign prepayments because of significant seasoning, in which borrowers hadn’t refinanced despite ample opportunities to do so.
Avoiding Treasury securities, which made up just 1% of the Fund’s portfolio, was also positive in a rate hiking cycle. On the short end of the spectrum, we replaced Treasurys with asset-backed securities and high-coupon agency mortgages, which made up 15% of the portfolio.
In contrast, a modest allocation of about 1% to municipal bonds detracted as that sector’s returns were negative. High yield bonds and bank loans performed relatively well during the fiscal period, but occasional hedges on those positions in an attempt to protect against credit risk (using CDX high yield swaps) detracted from the Fund’s performance.
The Fund’s portfolio structure has remained the same for the past couple of years with a continued overweight positioning in corporate credit. In 2016, we maintained an overweight allocation to corporate credits despite an overall increase in leverage in the corporate market; this was due to strong demand from foreign central investors seeking higher interest rates and, importantly, our fundamental research allowed us to focus on companies that, in our view, were responsibly managing their balance sheets.
Given our views on the timing of upcoming Fed rate hikes, we have maintained the Fund’s barbell portfolio strategy of purchasing both short- and long-term bonds in an attempt to seek better risk-adjusted returns.
Although credit spreads have narrowed, we believe they are within historical averages and fairly priced and we remain confident in our ability to manage idiosyncratic risk through fundamental research. As bottom-up bond pickers focused on fundamental credits of individual companies, we seek to add value by seeking to avoid risks
2
Table of Contents
associated with latent problems of individual companies.
The Fund used Treasury futures to help manage duration. Treasury futures made up 1.29% of the Fund’s portfolio on average, while exposure to high yield CDX, a credit derivative, averaged about 3%. Neither had a material effect on the portfolio, with high yield CDX holdings having a negative impact, while Treasury futures were positive for the Fund.
3
Table of Contents
| Delaware Limited-Term Diversified Income Fund | December 31, 2016 |
The performance data quoted represent past performance; past performance does not guarantee future results. Investment return and principal value will fluctuate so your shares, when redeemed, may be worth more or less than their original cost. Please obtain the performance data current for the most recent month end by calling 800 523-1918 or visiting our website at delawareinvestments.com/performance. Current performance may be lower or higher than the performance data quoted.
Fund and benchmark performance1,2 | Average annual total returns through December 31, 2016 | |||||||||||||||
| 1 year | 5 years | 10 years | Lifetime | |||||||||||||
Class A (Est. Nov. 24, 1985) | ||||||||||||||||
Excluding sales charge | +2.42% | +0.99% | +3.23% | +4.90% | ||||||||||||
Including sales charge | -0.42% | +0.42% | +2.94% | +4.81% | ||||||||||||
Class C (Est. Nov. 28, 1995) | ||||||||||||||||
Excluding sales charge | +1.55% | +0.11% | +2.34% | +3.10% | ||||||||||||
Including sales charge | +0.55% | +0.11% | +2.34% | +3.10% | ||||||||||||
Class R (Est. June 2, 2003) | ||||||||||||||||
Excluding sales charge | +2.06% | +0.63% | +2.85% | +2.59% | ||||||||||||
Including sales charge | +2.06% | +0.63% | +2.85% | +2.59% | ||||||||||||
Institutional Class (Est. June 1, 1992) | ||||||||||||||||
Excluding sales charge | +2.45% | +1.11% | +3.37% | +4.19% | ||||||||||||
Including sales charge | +2.45% | +1.11% | +3.37% | +4.19% | ||||||||||||
Bloomberg Barclays 1–3 Year U.S. Government/Credit Index | +1.28% | +0.92% | +2.45% | +4.05% | * | |||||||||||
*The benchmark lifetime return is for Institutional Class share comparison only and is calculated using the last business day in the month of the Fund’s Institutional Class inception date.
1 Returns reflect the reinvestment of all distributions and are presented both with and without the applicable sales charges described below. Returns do not reflect the deduction of taxes the shareholder would pay on Fund distributions or redemptions of Fund shares.
Expense limitations were in effect for certain classes during some or all of the periods shown in the “Fund and benchmark performance” table. Expenses for each class are listed on the “Fund expense ratios” table on page 6. Performance would have been lower had expense limitations not been in effect.
Institutional Class shares are available without sales or asset-based distribution charges only to certain eligible institutional accounts.
Class A shares are sold with a maximum front-end sales charge of 2.75%, and have an annual distribution and service fee of 0.25% of average daily net assets. This fee was contractually limited to 0.15% of average daily net assets from Jan. 1, 2016 through Dec. 31, 2016.* Performance for Class A shares, excluding sales charges, assumes that no front-end sales charge applied.
Class C shares are sold with a contingent deferred sales charge of 1.00% if redeemed during the first 12 months. They are also subject to an annual distribution and service fee of 1.00% of average daily net assets. Performance for Class C shares, excluding sales charges, assumes either that contingent deferred sales charges did not apply or that the investment was not redeemed.
4
Table of Contents
Class R shares are available only for certain retirement plan products. They are sold without a sales charge and have an annual distribution and service fee of 0.50% of average daily net assets.
Fixed income securities and bond funds can lose value, and investors can lose principal, as interest rates rise. They also may be affected by economic conditions that hinder an issuer’s ability to make interest and principal payments on its debt.
The Fund may also be subject to prepayment risk, the risk that the principal of a fixed income security that is held by the Fund may be prepaid prior to maturity, potentially forcing the Fund to reinvest that money at a lower interest rate.
High yielding, non-investment-grade bonds (junk bonds) involve higher risk than investment grade bonds.
The high yield secondary market is particularly susceptible to liquidity problems when institutional investors, such as mutual funds and certain other financial institutions, temporarily stop buying bonds for regulatory, financial, or other reasons. In addition, a less liquid secondary market makes it more difficult for the Fund to obtain precise valuations of the high yield securities in its portfolio.
If and when the Fund invests in forward foreign currency contracts or uses other investments to hedge against currency risks, the Fund will be subject to special risks, including counterparty risk.
The Fund may invest in derivatives, which may involve additional expenses and are subject to risk, including the risk that an underlying security or securities index moves in the opposite direction from what the portfolio manager anticipated. A derivative transaction depends upon the counterparties’ ability to fulfill their contractual obligations.
International investments entail risks not ordinarily associated with U.S. investments including fluctuation in currency values, differences in accounting principles, or economic or political instability in other nations.
Investing in emerging markets can be riskier than investing in established foreign markets due to increased volatility and lower trading volume. Diversification may not protect against market risk.
* The aggregate contractual waiver period covering this report is from April 29, 2015 through May 1, 2017.
2 The Fund’s expense ratios, as described in the most recent prospectus, are disclosed in the following “Fund expense ratios” table. Delaware Management Company has agreed to reimburse certain expenses and/or waive certain fees in order to prevent total annual fund operating expenses (excluding any 12b-1 fees, acquired fund fees and expenses, taxes, interest, short sale and dividend interest expenses, brokerage fees, certain insurance costs, and nonroutine expenses or costs, including, but not limited to, those relating to reorganizations, litigation, conducting shareholder meetings, and liquidations (collectively, nonroutine expenses)) from exceeding 0.59% of the Fund’s average daily net assets during the period from Oct. 5, 2016 through Dec. 31, 2016 .** Please see the most recent prospectus and any applicable supplement(s) for additional information on these fee waivers and/or reimbursements.
5
Table of Contents
Performance summary
Delaware Limited-Term Diversified Income Fund
| Fund expense ratios | Class A | Class C | Class R | Institutional Class | ||||||||||||
Total annual operating expenses | 0.92% | 1.67% | 1.17% | 0.67% | ||||||||||||
(without fee waivers) | ||||||||||||||||
Net expenses | 0.74% | 1.59% | 1.09% | 0.59% | ||||||||||||
(including fee waivers, if any) | ||||||||||||||||
Type of waiver | Contractual | Contractual | Contractual | Contractual | ||||||||||||
** The aggregate contractual waiver period covering this report is from Oct. 5, 2016 through Oct. 5, 2017.
Performance of a $10,000 investment1
Average annual total returns from Dec. 31, 2006 through Dec. 31, 2016
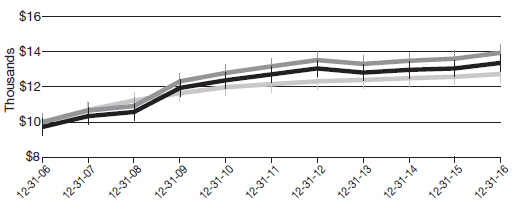
For the period beginning Dec. 31, 2006 through Dec. 31, 2016 | Starting value | Ending value | ||||||
| $10,000 | $13,928 | ||||||
Fund — Institutional Class shares | ||||||||
| $9,725 | $13,363 | ||||||
Fund — Class A shares | ||||||||
| $10,000 | $12,732 | ||||||
 Delaware Limited-Term Diversified Income
 Delaware Limited-Term Diversified Income
 Bloomberg Barclays 1–3 Year U.S. Government/Credit Index
1 The “Performance of a $10,000 investment” graph assumes $10,000 invested in Institutional Class and Class A shares of the Fund on Dec. 31, 2006, and includes the effect of a 2.75% front-end sales charge (for Class A shares) and the reinvestment of all distributions. The graph does not reflect the deduction of taxes the shareholders would pay on Fund distributions or redemptions of Fund shares. Expense limitations were in effect for some or all of the periods shown. Performance would have been lower had expense limitations
not been in effect. Expenses are listed in the “Fund expense ratios” table above. Please note additional details on pages 4 through 7.
The graph also assumes $10,000 invested in the Bloomberg Barclays 1–3 Year U.S. Government/ Credit Index as of Dec. 31, 2006. The Bloomberg Barclays 1–3 Year U.S. Government/Credit Index (formerly known as the Barclays 1–3 Year U.S. Government/Credit Index) is a market value-weighted index of government fixed-rate debt securities and investment grade U.S. and foreign
6
Table of Contents
fixed-rate debt securities with average maturities of one to three years.
Index performance returns do not reflect any management fees, transaction costs, or expenses. Indices are unmanaged and one cannot invest directly in an index. Past performance is not a guarantee of future results.
Performance of other Fund classes will vary due to different charges and expenses.
| ||||||||
| Nasdaq symbols | CUSIPs | |||||||
Class A | DTRIX | 245912308 | ||||||
Class C | DTICX | 245912704 | ||||||
Class R | DLTRX | 245912803 | ||||||
Institutional Class | DTINX | 245912506 | ||||||
| ||||||||
7
Table of Contents
For the six-month period from July 1, 2016 to December 31, 2016 (Unaudited)
As a shareholder of the Fund, you incur two types of costs: (1) transaction costs, including sales charges (loads) on purchase payments, reinvested dividends, or other distributions; redemption fees; and exchange fees; and (2) ongoing costs, including management fees; distribution and/or service (12b-1) fees; and other Fund expenses. This example is intended to help you understand your ongoing costs (in dollars) of investing in the Fund and to compare these costs with the ongoing costs of investing in other mutual funds.
The example is based on an investment of $1,000 invested at the beginning of the period and held for the entire six-month period from July 1, 2016 to Dec. 31, 2016.
Actual expenses
The first section of the table shown, “Actual Fund return,” provides information about actual account values and actual expenses. You may use the information in this section of the table, together with the amount you invested, to estimate the expenses that you paid over the period. Simply divide your account value by $1,000 (for example, an $8,600 account value divided by $1,000 = 8.6), then multiply the result by the number in the first section under the heading entitled “Expenses Paid During Period” to estimate the expenses you paid on your account during this period.
Hypothetical example for comparison purposes
The second section of the table shown, “Hypothetical 5% return,” provides information about hypothetical account values and hypothetical expenses based on the Fund’s actual expense ratio and an assumed rate of return of 5% per year before expenses, which is not the Fund’s actual return. The hypothetical account values and expenses may not be used to estimate the actual ending account balance or expenses you paid for the period. You may use this information to compare the ongoing costs of investing in the Fund and other funds. To do so, compare this 5% hypothetical example with the 5% hypothetical examples that appear in the shareholder reports of the other funds.
Please note that the expenses shown in the table are meant to highlight your ongoing costs only and do not reflect any transactional costs, such as sales charges (loads), redemption fees, or exchange fees. Therefore, the second section of the table is useful in comparing ongoing costs only, and will not help you determine the relative total costs of owning different funds. In addition, if these transactional costs were included, your costs would have been higher. The Fund’s expenses shown in the table reflect fee waivers in effect. The expenses shown in the table assume reinvestment of all dividends and distributions.
8
Table of Contents
Delaware Limited-Term Diversified Income Fund
Expense analysis of an investment of $1,000
Beginning
Account Value
7/1/16 | Ending
Account Value
12/31/16 | Annualized
Expense Ratio | Expenses
Paid During Period
7/1/16 to 12/31/16* | |||||||||||||||||
Actual Fund return† | ||||||||||||||||||||
Class A | $1,000.00 | $999.00 | 0.78% | $3.92 | ||||||||||||||||
Class C | 1,000.00 | 993.50 | 1.63% | 8.17 | ||||||||||||||||
Class R | 1,000.00 | 997.20 | 1.13% | 5.67 | ||||||||||||||||
Institutional Class | 1,000.00 | 998.50 | 0.63% | 3.16 | ||||||||||||||||
Hypothetical 5% return (5% return before expenses) | ||||||||||||||||||||
Class A | $1,000.00 | $1,021.22 | 0.78% | $3.96 | ||||||||||||||||
Class C | 1,000.00 | 1,016.94 | 1.63% | 8.26 | ||||||||||||||||
Class R | 1,000.00 | 1,019.46 | 1.13% | 5.74 | ||||||||||||||||
Institutional Class | 1,000.00 | 1,021.97 | 0.63% | 3.20 | ||||||||||||||||
| * | “Expenses Paid During Period” are equal to the Fund’s annualized expense ratio, multiplied by the average account value over the period, multiplied by 184/366 (to reflect the one-half year period). |
| † | Because actual returns reflect only the most recent six-month period, the returns shown may differ significantly from fiscal year returns. |
9
Table of Contents
Security type / sector allocation
| Delaware Limited-Term Diversified Income Fund | As of December 31, 2016 (Unaudited) |
Sector designations may be different than the sector designations presented in other Fund materials. The sector designations may represent the investment manager’s internal sector classifications, which may result in the sector designations for one fund being different than another fund’s sector designations.
Security type / sector
| Percentage of net assets
| ||||
Agency Asset-Backed Securities | 0.02% | ||||
Agency Collateralized Mortgage Obligations | 7.70% | ||||
Agency Commercial Mortgage-Backed Securities | 0.27% | ||||
Agency Mortgage-Backed Securities | 8.32% | ||||
Collateralized Debt Obligations | 1.55% | ||||
Convertible Bond | 0.15% | ||||
Corporate Bonds | 42.20% | ||||
Automotive | 0.05% | ||||
Banking | 15.39% | ||||
Basic Industry | 1.68% | ||||
Brokerage | 0.26% | ||||
Capital Goods | 0.41% | ||||
Communications | 2.77% | ||||
Consumer Cyclical | 2.34% | ||||
Consumer Non-Cyclical | 3.68% | ||||
Electric | 5.96% | ||||
Energy | 2.74% | ||||
Finance Companies | 1.27% | ||||
Healthcare | 0.60% | ||||
Insurance | 2.06% | ||||
Natural Gas | 0.55% | ||||
Real Estate | 0.79% | ||||
Technology | 0.92% | ||||
Transportation | 0.73% | ||||
Municipal Bonds | 1.17% | ||||
Non-Agency Asset-Backed Securities | 30.44% | ||||
Non-Agency Collateralized Mortgage Obligations | 0.25% | ||||
Non-Agency Commercial Mortgage-Backed Securities | 0.32% | ||||
Senior Secured Loans | 6.96% | ||||
Sovereign Bonds | 0.55% | ||||
U.S. Treasury Obligation | 0.11% | ||||
Preferred Stock | 0.52% | ||||
Short-Term Investments | 1.94% | ||||
Total Value of Securities | 102.47% | ||||
Liabilities Net of Receivables and Other Assets | (2.47%) | ||||
Total Net Assets | 100.00% | ||||
10
Table of Contents
| Schedule of investments | ||
| Delaware Limited-Term Diversified Income Fund | December 31, 2016 |
| Principal amount° | Value (U.S. $) | |||||||
| ||||||||
Agency Asset-Backed Securities – 0.02% | ||||||||
| ||||||||
Fannie Mae Grantor Trust | ||||||||
Series 2003-T4 2A5 4.98% 9/26/33 f | 182,889 | $ | 200,154 | |||||
Fannie Mae REMIC Trust | ||||||||
Series 2001-W2 AS5 6.473% 10/25/31 f | 150 | 151 | ||||||
Freddie Mac Structured Pass Through Securities | ||||||||
Series T-30 A5 6.90% 12/25/30 ◆f | 4,466 | 4,612 | ||||||
|
| |||||||
Total Agency Asset-Backed Securities (cost $186,243) | 204,917 | |||||||
|
| |||||||
| ||||||||
Agency Collateralized Mortgage Obligations – 7.70% | ||||||||
| ||||||||
Fannie Mae Grantor Trust | ||||||||
Series 2001-T5 A2 6.985% 6/19/41 ● | 29,104 | 32,574 | ||||||
Series 2002-T1 A2 7.00% 11/25/31 | 68,949 | 80,759 | ||||||
Fannie Mae Interest Strip | ||||||||
Series 413 167 4.50% 7/25/42 S● | 1,427,226 | 349,568 | ||||||
Fannie Mae REMIC Trust | ||||||||
Series 2002-W1 2A 6.181% 2/25/42 ● | 78,608 | 89,289 | ||||||
Fannie Mae REMICs | ||||||||
Series 2002-90 A1 6.50% 6/25/42 | 865 | 1,008 | ||||||
Series 2003-52 NA 4.00% 6/25/23 | 95,564 | 100,035 | ||||||
Series 2003-78 B 5.00% 8/25/23 | 38,556 | 40,995 | ||||||
Series 2003-120 BL 3.50% 12/25/18 | 143,146 | 145,033 | ||||||
Series 2004-36 FA 1.156% 5/25/34 ● | 297,754 | 297,570 | ||||||
Series 2004-49 EB 5.00% 7/25/24 | 29,134 | 31,264 | ||||||
Series 2005-66 FD 1.056% 7/25/35 ● | 1,312,942 | 1,306,771 | ||||||
Series 2005-110 MB 5.50% 9/25/35 | 8,881 | 9,395 | ||||||
Series 2006-105 FB 1.176% 11/25/36 ● | 78,681 | 78,640 | ||||||
Series 2010-29 PA 4.50% 10/25/38 | 7,594 | 7,609 | ||||||
Series 2010-41 PN 4.50% 4/25/40 | 86,000 | 93,337 | ||||||
Series 2010-75 NA 4.00% 9/25/28 | 13,924 | 13,927 | ||||||
Series 2011-88 AB 2.50% 9/25/26 | 77,765 | 78,376 | ||||||
Series 2011-105 FP 1.156% 6/25/41 ● | 2,151,869 | 2,142,265 | ||||||
Series 2011-113 MC 4.00% 12/25/40 | 168,900 | 173,755 | ||||||
Series 2012-93 LY 2.50% 9/25/42 | 433,000 | 378,250 | ||||||
Series 2012-98 MI 3.00% 8/25/31 S | 28,428,876 | 3,387,727 | ||||||
Series 2012-122 SD 5.344% 11/25/42 S● | 3,366,735 | 674,063 | ||||||
Series 2012-128 NP 2.50% 11/25/42 | 474,983 | 448,267 | ||||||
Series 2012-145 MZ 3.50% 1/25/43 | 149,505 | 142,702 | ||||||
Series 2013-02 LZ 3.00% 2/25/43 | 68,417 | 63,376 | ||||||
Series 2013-07 EI 3.00% 10/25/40 S | 1,743,763 | 245,643 | ||||||
Series 2013-20 IH 3.00% 3/25/33 S | 424,592 | 59,852 | ||||||
Series 2013-28 YB 3.00% 4/25/43 | 1,550,000 | 1,473,128 | ||||||
Series 2013-38 AI 3.00% 4/25/33 S | 1,354,749 | 190,104 | ||||||
Series 2013-52 ZA 3.00% 6/25/43 | 215,856 | 204,745 | ||||||
11
Table of Contents
Schedule of investments
Delaware Limited-Term Diversified Income Fund
| Principal amount° | Value (U.S. $) | |||||||
| ||||||||
Agency Collateralized Mortgage Obligations (continued) | ||||||||
| ||||||||
Fannie Mae REMICs | ||||||||
Series 2013-55 AI 3.00% 6/25/33 S | 17,400,788 | $ | 2,486,153 | |||||
Series 2013-62 PY 2.50% 6/25/43 | 431,000 | 391,191 | ||||||
Series 2013-94 GQ 3.00% 9/25/43 | 1,619,672 | 1,610,773 | ||||||
Series 2013-129 KI 3.00% 8/25/28 S | 2,156,553 | 192,020 | ||||||
Series 2014-5 JL 4.00% 2/25/44 | 78,000 | 81,945 | ||||||
Series 2014-21 ID 3.50% 6/25/33 S | 433,632 | 60,770 | ||||||
Series 2014-67 GZ 2.00% 12/25/42 | 603,935 | 527,584 | ||||||
Series 2014-85 IB 3.00% 12/25/44 S | 1,024,673 | 202,531 | ||||||
Series 2015-31 ZD 3.00% 5/25/45 | 441,506 | 388,151 | ||||||
Series 2015-34 OK 0.00% 3/25/44 W | 1,185,000 | 930,589 | ||||||
Series 2015-44 AI 3.50% 1/25/34 S | 870,836 | 125,611 | ||||||
Series 2015-82 AI 3.50% 6/25/34 S | 4,975,389 | 775,659 | ||||||
Series 2015-85 BI 4.50% 9/25/43 S | 720,812 | 143,427 | ||||||
Series 2015-89 EZ 3.00% 12/25/45 | 633,224 | 590,221 | ||||||
Series 2015-95 SH 5.244% 1/25/46 S● | 147,357 | 34,891 | ||||||
Series 2016-17 BI 4.00% 2/25/43 S | 1,308,540 | 227,959 | ||||||
Series 2016-54 PI 3.00% 2/25/44 S | 1,425,805 | 168,627 | ||||||
Series 2016-55 SK 5.244% 8/25/46 S● | 120,600 | 30,074 | ||||||
Series 2016-74 IH 3.50% 11/25/45 S | 127,347 | 23,311 | ||||||
Series 2016-90 CI 3.00% 2/25/45 S | 824,331 | 105,120 | ||||||
Series 2016-95 IO 3.00% 12/25/46 S | 3,107,093 | 543,040 | ||||||
Freddie Mac REMICs | ||||||||
Series 1730 Z 7.00% 5/15/24 | 28,291 | 31,620 | ||||||
Series 2708 ZD 5.50% 11/15/33 | 163,628 | 183,375 | ||||||
Series 2901 CA 4.50% 11/15/19 | 51,871 | 52,588 | ||||||
Series 3016 FL 1.094% 8/15/35 ● | 37,408 | 37,473 | ||||||
Series 3027 DE 5.00% 9/15/25 | 30,406 | 32,808 | ||||||
Series 3067 FA 1.054% 11/15/35 ● | 2,687,058 | 2,679,820 | ||||||
Series 3232 KF 1.154% 10/15/36 ● | 70,327 | 70,435 | ||||||
Series 3241 FM 1.084% 11/15/36 ● | 27,220 | 27,178 | ||||||
Series 3297 BF 0.944% 4/15/37 ● | 889,837 | 883,992 | ||||||
Series 3316 FB 1.004% 8/15/35 ● | 123,922 | 123,203 | ||||||
Series 3578 EO 0.00% 5/15/37 W | 418,311 | 382,843 | ||||||
Series 3737 NA 3.50% 6/15/25 | 115,574 | 120,029 | ||||||
Series 3780 LF 1.104% 3/15/29 ● | 173,864 | 174,000 | ||||||
Series 3800 AF 1.204% 2/15/41 ● | 1,709,021 | 1,715,820 | ||||||
Series 3803 TF 1.104% 11/15/28 ● | 167,805 | 168,179 | ||||||
Series 3852 TP 5.50% 5/15/41 ● | 100,257 | 104,074 | ||||||
Series 4076 QB 1.75% 11/15/41 | 558,139 | 542,346 | ||||||
Series 4100 EI 3.00% 8/15/27 S | 814,491 | 87,156 | ||||||
Series 4109 AI 3.00% 7/15/31 S | 6,753,903 | 793,232 | ||||||
Series 4136 EZ 3.00% 11/15/42 | 157,023 | 155,403 | ||||||
12
Table of Contents
| Principal amount° | Value (U.S. $) | |||||||
| ||||||||
Agency Collateralized Mortgage Obligations (continued) | ||||||||
| ||||||||
Freddie Mac REMICs | ||||||||
Series 4142 HA 2.50% 12/15/32 | 412,361 | $ | 413,087 | |||||
Series 4150 PQ 2.50% 1/15/43 | 81,385 | 75,883 | ||||||
Series 4171 Z 3.00% 2/15/43 | 466,668 | 445,992 | ||||||
Series 4185 LI 3.00% 3/15/33 S | 488,924 | 68,343 | ||||||
Series 4210 Z 3.00% 5/15/43 | 474,263 | 453,476 | ||||||
Series 4342 CI 3.00% 11/15/33 S | 1,266,197 | 157,145 | ||||||
Series 4366 DI 3.50% 5/15/33 S | 1,714,600 | 318,895 | ||||||
Series 4408 ZG 2.00% 9/15/41 | 398,676 | 347,781 | ||||||
Series 4453 DI 3.50% 11/15/33 S | 6,736,990 | 928,427 | ||||||
Series 4457 KZ 3.00% 4/15/45 | 12,380,120 | 12,052,635 | ||||||
Series 4554 MP 3.00% 2/15/46 | 2,252,500 | 2,190,973 | ||||||
Series 4567 LI 4.00% 8/15/45 S | 563,744 | 104,419 | ||||||
Series 4614 HB 2.50% 9/15/46 | 62,000 | 55,090 | ||||||
Series 4623 LZ 2.50% 10/15/46 | 51,213 | 43,331 | ||||||
Series 4623 MW 2.50% 10/15/46 | 60,000 | 55,870 | ||||||
Freddie Mac Strips | ||||||||
Series 284 S6 5.396% 10/15/42 S● | 1,351,649 | 296,841 | ||||||
Series 303 151 4.34% 12/15/42 S● | 475,952 | 116,582 | ||||||
Series 303 185 3.492% 1/15/43 S● | 1,276,318 | 244,450 | ||||||
Series 326 S2 5.246% 3/15/44 S● | 84,083 | 16,922 | ||||||
Freddie Mac Structured Pass Through Certificates | ||||||||
Series T-42 A5 7.50% 2/25/42 ◆ | 34,927 | 40,925 | ||||||
Series T-54 2A 6.50% 2/25/43 ◆ | 835 | 966 | ||||||
Series T-58 2A 6.50% 9/25/43 ◆ | 588,622 | 673,429 | ||||||
GNMA | ||||||||
Series 2013-26 KD 2.50% 2/16/43 | 870,000 | 796,132 | ||||||
Series 2013-79 KE 3.00% 5/20/43 | 5,267,000 | 5,151,050 | ||||||
Series 2015-76 MZ 3.00% 5/20/45 | 6,860,839 | 6,613,668 | ||||||
Series 2015-106 QZ 2.50% 7/20/45 | 3,728,611 | 3,508,191 | ||||||
Series 2015-134 PZ 3.00% 9/20/45 | 2,256,967 | 2,126,577 | ||||||
Series 2015-185 PZ 3.00% 12/20/45 | 3,435,407 | 3,292,295 | ||||||
Series 2016-134 MW 3.00% 10/20/46 | 10,000 | 9,884 | ||||||
Series 2016-49 PZ 3.00% 11/16/45 | 224,439 | 204,686 | ||||||
Series 2016-5 GL 3.00% 7/20/45 | 5,000 | 4,866 | ||||||
Series 2016-74 PL 3.00% 5/20/46 | 610,000 | 601,802 | ||||||
Series 2016-80 JZ 3.00% 6/20/46 | 659,811 | 633,129 | ||||||
|
| |||||||
Total Agency Collateralized Mortgage Obligations (cost $71,764,757) | 72,388,990 | |||||||
|
| |||||||
| ||||||||
Agency Commercial Mortgage-Backed Securities – 0.27% | ||||||||
| ||||||||
FREMF Mortgage Trust | ||||||||
Series 2011-K15 B 144A 4.948% 8/25/44 #● | 95,000 | 102,484 | ||||||
Series 2012-K708 B 144A 3.751% 2/25/45 #● | 675,000 | 692,310 | ||||||
13
Table of Contents
Schedule of investments
Delaware Limited-Term Diversified Income Fund
| Principal amount° | Value (U.S. $) | |||||||
| ||||||||
Agency Commercial Mortgage-Backed Securities (continued) | ||||||||
| ||||||||
FREMF Mortgage Trust | ||||||||
Series 2013-K712 B 144A 3.365% 5/25/45 #● | 345,000 | $ | 350,338 | |||||
NCUA Guaranteed Notes Trust | ||||||||
Series 2011-C1 2A 1.182% 3/9/21 ● | 1,396,121 | 1,393,309 | ||||||
|
| |||||||
Total Agency Commercial Mortgage-Backed Securities (cost $2,551,810) | 2,538,441 | |||||||
|
| |||||||
| ||||||||
Agency Mortgage-Backed Securities – 8.32% | ||||||||
| ||||||||
Fannie Mae | ||||||||
10.50% 6/1/30 | 24,809 | 25,261 | ||||||
Fannie Mae ARM | ||||||||
2.638% 3/1/38 ● | 5,110 | 5,366 | ||||||
2.657% 12/1/33 ● | 87,991 | 93,363 | ||||||
2.81% 8/1/34 ● | 122,173 | 127,679 | ||||||
2.832% 9/1/38 ● | 1,300,198 | 1,395,083 | ||||||
2.834% 4/1/36 ● | 29,017 | 30,653 | ||||||
2.907% 8/1/36 ● | 39,646 | 41,748 | ||||||
2.923% 4/1/36 ● | 364,939 | 388,290 | ||||||
2.951% 6/1/36 ● | 122,232 | 128,979 | ||||||
2.993% 7/1/36 ● | 113,258 | 118,934 | ||||||
3.018% 7/1/36 ● | 106,584 | 113,922 | ||||||
3.027% 6/1/34 ● | 58,108 | 61,208 | ||||||
3.069% 11/1/35 ● | 354,881 | 373,658 | ||||||
3.076% 8/1/35 ● | 31,213 | 32,940 | ||||||
3.205% 11/1/39 ● | 201,148 | 212,528 | ||||||
3.46% 1/1/41 ● | 181,228 | 187,665 | ||||||
4.554% 11/1/39 ● | 783,991 | 820,010 | ||||||
Fannie Mae S.F. 30 yr | ||||||||
4.50% 8/1/40 | 117,928 | 127,266 | ||||||
4.50% 3/1/44 | 26,301,000 | 28,206,281 | ||||||
5.00% 4/1/33 | 204,131 | 223,628 | ||||||
5.00% 11/1/33 | 92,697 | 101,823 | ||||||
5.00% 12/1/33 | 11,377 | 12,494 | ||||||
5.00% 3/1/34 | 67,038 | 73,342 | ||||||
5.00% 4/1/35 | 14,475 | 15,841 | ||||||
5.00% 5/1/35 | 7,643 | 8,359 | ||||||
5.00% 6/1/35 | 40,411 | 44,057 | ||||||
5.00% 7/1/35 | 15,044 | 16,517 | ||||||
5.00% 8/1/35 | 37,248 | 40,693 | ||||||
5.00% 9/1/35 | 17,993 | 19,706 | ||||||
5.00% 10/1/35 | 94,818 | 104,150 | ||||||
5.00% 12/1/35 | 15,369 | 17,043 | ||||||
5.00% 2/1/36 | 27,308 | 29,823 | ||||||
5.00% 3/1/36 | 28,594 | 31,239 | ||||||
14
Table of Contents
| Principal amount° | Value (U.S. $) | |||||||
| ||||||||
Agency Mortgage-Backed Securities (continued) | ||||||||
| ||||||||
Fannie Mae S.F. 30 yr | ||||||||
5.00% 6/1/36 | 38,224 | $ | 41,755 | |||||
5.00% 7/1/36 | 45,812 | 50,308 | ||||||
5.00% 10/1/36 | 11,713 | 12,785 | ||||||
5.00% 11/1/36 | 27,051 | 29,543 | ||||||
5.00% 12/1/36 | 15,290 | 16,696 | ||||||
5.00% 2/1/38 | 79,083 | 86,282 | ||||||
5.00% 3/1/39 | 70,059 | 77,432 | ||||||
5.00% 4/1/39 | 165,600 | 181,566 | ||||||
5.00% 6/1/39 | 4,527 | 4,939 | ||||||
5.00% 1/1/40 | 79,111 | 87,778 | ||||||
5.50% 12/1/32 | 22,171 | 24,867 | ||||||
5.50% 4/1/33 | 25,908 | 29,055 | ||||||
5.50% 5/1/33 | 4,394 | 4,922 | ||||||
5.50% 6/1/33 | 160,976 | 180,426 | ||||||
5.50% 7/1/33 | 6,256 | 7,008 | ||||||
5.50% 12/1/33 | 3,235 | 3,629 | ||||||
5.50% 1/1/34 | 11,185 | 12,704 | ||||||
5.50% 4/1/34 | 207,059 | 232,686 | ||||||
5.50% 5/1/34 | 843,459 | 945,962 | ||||||
5.50% 7/1/34 | 101,514 | 113,859 | ||||||
5.50% 8/1/34 | 7,327 | 8,216 | ||||||
5.50% 9/1/34 | 393,614 | 441,468 | ||||||
5.50% 11/1/34 | 740,720 | 830,700 | ||||||
5.50% 12/1/34 | 75,391 | 84,454 | ||||||
5.50% 1/1/35 | 110,876 | 124,211 | ||||||
5.50% 2/1/35 | 19,236 | 21,537 | ||||||
5.50% 3/1/35 | 110,440 | 123,660 | ||||||
5.50% 7/1/35 | 9,787 | 10,985 | ||||||
5.50% 9/1/35 | 301,180 | 336,813 | ||||||
5.50% 10/1/35 | 3,325 | 3,729 | ||||||
5.50% 12/1/35 | 113,930 | 127,376 | ||||||
5.50% 1/1/36 | 433,503 | 486,142 | ||||||
5.50% 4/1/36 | 848,553 | 949,722 | ||||||
5.50% 5/1/36 | 65,268 | 73,167 | ||||||
5.50% 7/1/36 | 1,108,316 | 1,241,656 | ||||||
5.50% 9/1/36 | 562,396 | 630,918 | ||||||
5.50% 11/1/36 | 706,725 | 792,169 | ||||||
5.50% 2/1/37 | 262,473 | 293,167 | ||||||
5.50% 4/1/37 | 173,603 | 194,656 | ||||||
5.50% 8/1/37 | 877,161 | 983,385 | ||||||
5.50% 1/1/38 | 2,549,101 | 2,848,540 | ||||||
5.50% 2/1/38 | 93,098 | 104,332 | ||||||
15
Table of Contents
Schedule of investments
Delaware Limited-Term Diversified Income Fund
| Principal amount° | Value (U.S. $) | |||||||
| ||||||||
Agency Mortgage-Backed Securities (continued) | ||||||||
| ||||||||
Fannie Mae S.F. 30 yr | ||||||||
5.50% 9/1/38 | 4,512 | $ | 5,052 | |||||
5.50% 12/1/38 | 17,628 | 19,770 | ||||||
5.50% 1/1/39 | 665,336 | 745,184 | ||||||
5.50% 3/1/40 | 2,427,722 | 2,717,913 | ||||||
5.50% 3/1/41 | 32,922 | 36,917 | ||||||
5.50% 7/1/41 | 29,642 | 33,054 | ||||||
5.50% 9/1/41 | 21,044 | 23,523 | ||||||
6.00% 3/1/34 | 52,400 | 60,249 | ||||||
6.00% 8/1/34 | 14,422 | 16,531 | ||||||
6.00% 9/1/34 | 210 | 240 | ||||||
6.00% 11/1/34 | 1,173 | 1,327 | ||||||
6.00% 4/1/35 | 174,118 | 198,570 | ||||||
6.00% 7/1/35 | 26,889 | 30,824 | ||||||
6.00% 4/1/36 | 9,399 | 10,642 | ||||||
6.00% 6/1/36 | 15,401 | 17,464 | ||||||
6.00% 9/1/36 | 142,794 | 165,893 | ||||||
6.00% 3/1/37 | 4,759 | 5,392 | ||||||
6.00% 7/1/37 | 2,422,501 | 2,776,367 | ||||||
6.00% 8/1/37 | 82,052 | 94,397 | ||||||
6.00% 9/1/37 | 1,440,267 | 1,630,461 | ||||||
6.00% 3/1/38 | 1,758,158 | 2,018,820 | ||||||
6.00% 5/1/38 | 419,215 | 475,053 | ||||||
6.00% 10/1/38 | 4,232 | 4,787 | ||||||
6.00% 10/1/39 | 2,871,512 | 3,308,134 | ||||||
6.00% 5/1/41 | 250,846 | 284,161 | ||||||
6.00% 7/1/41 | 5,131,043 | 5,810,277 | ||||||
6.50% 1/1/29 | 7,410 | 8,383 | ||||||
6.50% 6/1/29 | 1,318 | 1,491 | ||||||
6.50% 1/1/34 | 1,415 | 1,625 | ||||||
6.50% 6/1/36 | 3,939 | 4,456 | ||||||
6.50% 10/1/36 | 3,340 | 3,778 | ||||||
6.50% 12/1/36 | 813,167 | 921,385 | ||||||
6.50% 8/1/37 | 272 | 308 | ||||||
6.50% 5/1/40 | 236,150 | 268,516 | ||||||
7.00% 12/1/34 | 891 | 942 | ||||||
7.00% 12/1/35 | 1,418 | 1,580 | ||||||
7.00% 12/1/37 | 4,525 | 4,833 | ||||||
7.50% 6/1/31 | 651 | 788 | ||||||
7.50% 4/1/32 | 464 | 530 | ||||||
7.50% 5/1/33 | 1,169 | 1,177 | ||||||
7.50% 6/1/34 | 568 | 647 | ||||||
10.00% 2/1/25 | 31,429 | 33,667 | ||||||
16
Table of Contents
| Principal amount° | Value (U.S. $) | |||||||
| ||||||||
Agency Mortgage-Backed Securities (continued) | ||||||||
| ||||||||
Freddie Mac ARM | ||||||||
2.553% 10/1/46 ● | 406,482 | $ | 409,455 | |||||
2.681% 10/1/36 ● | 6,579 | 6,950 | ||||||
2.846% 4/1/33 ● | 46,218 | 47,812 | ||||||
2.919% 6/1/37 ● | 366,682 | 383,622 | ||||||
2.943% 11/1/44 ● | 164,369 | 168,688 | ||||||
2.966% 2/1/35 ● | 72,302 | 76,275 | ||||||
3.135% 7/1/38 ● | 876,553 | 928,252 | ||||||
3.151% 2/1/37 ● | 5,080 | 5,379 | ||||||
3.275% 10/1/37 ● | 184,339 | 193,788 | ||||||
4.899% 8/1/38 ● | 20,515 | 21,452 | ||||||
Freddie Mac S.F. 30 yr | ||||||||
4.50% 8/1/44 | 255,676 | 277,360 | ||||||
5.50% 1/1/38 | 9,933 | 11,169 | ||||||
5.50% 6/1/41 | 107,786 | 120,195 | ||||||
6.00% 2/1/36 | 226,240 | 258,850 | ||||||
6.00% 3/1/36 | 248,442 | 283,981 | ||||||
6.00% 8/1/36 | 832,616 | 943,036 | ||||||
6.00% 5/1/37 | 735,130 | 837,345 | ||||||
6.00% 9/1/37 | 11,138 | 12,655 | ||||||
6.00% 6/1/38 | 191,052 | 216,912 | ||||||
6.00% 8/1/38 | 2,077,303 | 2,382,962 | ||||||
6.00% 5/1/39 | 54,159 | 62,149 | ||||||
6.00% 11/1/39 | 34,662 | 39,342 | ||||||
6.00% 5/1/40 | 268,979 | 303,873 | ||||||
6.00% 7/1/40 | 32,298 | 36,780 | ||||||
7.00% 11/1/33 | 416 | 489 | ||||||
7.50% 7/1/32 | 4,128 | 4,903 | ||||||
GNMA II S.F. 30 yr | ||||||||
5.50% 5/20/37 | 189,306 | 209,854 | ||||||
5.50% 4/20/40 | 174,758 | 191,332 | ||||||
6.00% 2/20/39 | 262,162 | 296,305 | ||||||
6.00% 2/20/40 | 919,786 | 1,049,816 | ||||||
6.00% 4/20/46 | 284,745 | 317,369 | ||||||
6.50% 10/20/39 | 286,114 | 323,968 | ||||||
|
| |||||||
Total Agency Mortgage-Backed Securities (cost $78,046,439) | 78,252,180 | |||||||
|
| |||||||
17
Table of Contents
Schedule of investments
Delaware Limited-Term Diversified Income Fund
| Principal amount° | Value (U.S. $) | |||||||
| ||||||||
Collateralized Debt Obligations – 1.55% | ||||||||
| ||||||||
AMMC CLO | ||||||||
Series 2015-16A AX 144A 2.231% 4/14/27 #● | 4,750,000 | $ | 4,746,420 | |||||
Dryden 36 Senior Loan Fund | ||||||||
Series 2014-36A X 144A 2.187% 1/15/28 #● | 3,200,000 | 3,210,131 | ||||||
Eaton Vance CLO | ||||||||
Series 2013-1A AX 144A 1.735% 1/15/28 #● | 2,400,000 | 2,398,800 | ||||||
Harbourview CLO VII | ||||||||
Series 7A AX 144A 2.259% 11/18/26 #● | 3,333,333 | 3,330,803 | ||||||
Steele Creek CLO | ||||||||
Series 2016-1A X 144A 1.963% 6/15/28 #● | 875,000 | 874,340 | ||||||
|
| |||||||
Total Collateralized Debt Obligations (cost $14,549,698) | 14,560,494 | |||||||
|
| |||||||
| ||||||||
Convertible Bond – 0.15% | ||||||||
| ||||||||
Jefferies Group 3.875% exercise price $43.93, maturity date 11/1/29 | 1,355,000 | 1,373,631 | ||||||
|
| |||||||
Total Convertible Bond (cost $1,443,922) | 1,373,631 | |||||||
|
| |||||||
| ||||||||
Corporate Bonds – 42.20% | ||||||||
| ||||||||
Automotive – 0.05% | ||||||||
IHO Verwaltungs 144A PIK 4.125% 9/15/21 #T | 500,000 | 506,250 | ||||||
|
| |||||||
| 506,250 | ||||||||
|
| |||||||
Banking – 15.39% | ||||||||
ANZ New Zealand International 144A 2.60% 9/23/19 # | 3,900,000 | 3,934,499 | ||||||
Banco Nacional de Costa Rica 144A 5.875% 4/25/21 # | 450,000 | 454,500 | ||||||
Bank of America | ||||||||
2.503% 10/21/22 | 460,000 | 445,473 | ||||||
4.45% 3/3/26 | 4,470,000 | 4,615,150 | ||||||
5.75% 12/1/17 | 6,900,000 | 7,148,945 | ||||||
Bank of New York Mellon | ||||||||
2.45% 11/27/20 | 3,340,000 | 3,343,069 | ||||||
2.50% 4/15/21 | 2,280,000 | 2,283,890 | ||||||
Barclays 3.20% 8/10/21 | 1,695,000 | 1,676,764 | ||||||
BB&T 2.05% 5/10/21 | 3,360,000 | 3,299,712 | ||||||
BBVA Bancomer 144A 7.25% 4/22/20 # | 500,000 | 551,250 | ||||||
Branch Banking & Trust 3.625% 9/16/25 | 1,075,000 | 1,094,160 | ||||||
Capital One 2.25% 9/13/21 | 1,285,000 | 1,255,171 | ||||||
Capital One Financial 4.20% 10/29/25 | 505,000 | 507,600 | ||||||
Citigroup 2.90% 12/8/21 | 1,565,000 | 1,562,557 | ||||||
Citizens Bank | ||||||||
2.45% 12/4/19 | 5,010,000 | 5,030,265 | ||||||
2.50% 3/14/19 | 2,890,000 | 2,913,756 | ||||||
Commonwealth Bank of Australia 2.40% 11/2/20 | 4,055,000 | 4,031,432 | ||||||
Compass Bank 2.75% 9/29/19 | 7,305,000 | 7,269,987 | ||||||
18
Table of Contents
| Principal amount° | Value (U.S. $) | |||||||
| ||||||||
Corporate Bonds (continued) | ||||||||
| ||||||||
Banking (continued) | ||||||||
Cooperatieve Centrale Rabobank VA/NY 2.25% 1/14/19 | 5,690,000 | $ | 5,722,154 | |||||
Credit Suisse | ||||||||
2.30% 5/28/19 | 4,890,000 | 4,903,677 | ||||||
3.00% 10/29/21 | 475,000 | 479,860 | ||||||
Export Credit Bank of Turkey 144A 5.375% 2/8/21 # | 300,000 | 294,329 | ||||||
Export-Import Bank of India 3.125% 7/20/21 | 410,000 | 408,387 | ||||||
Fifth Third Bancorp 2.875% 7/27/20 | 1,045,000 | 1,059,108 | ||||||
Fifth Third Bank | ||||||||
2.25% 6/14/21 | 200,000 | 197,851 | ||||||
2.30% 3/15/19 | 510,000 | 513,599 | ||||||
3.85% 3/15/26 | 515,000 | 519,246 | ||||||
Goldman Sachs Group 3.50% 11/16/26 | 2,270,000 | 2,222,335 | ||||||
HBOS 144A 6.75% 5/21/18 # | 2,555,000 | 2,700,627 | ||||||
HSBC Holdings 2.65% 1/5/22 | 1,200,000 | 1,172,329 | ||||||
JPMorgan Chase & Co. | ||||||||
2.55% 3/1/21 | 3,810,000 | 3,800,258 | ||||||
4.25% 10/1/27 | 2,060,000 | 2,121,056 | ||||||
5.30% 12/29/49 ● | 1,000,000 | 1,023,060 | ||||||
KeyBank | ||||||||
2.35% 3/8/19 | 955,000 | 960,791 | ||||||
2.50% 11/22/21 | 1,890,000 | 1,879,225 | ||||||
3.18% 5/22/22 | 1,335,000 | 1,349,832 | ||||||
KeyCorp 5.00% 12/29/49 ● | 550,000 | 508,750 | ||||||
Morgan Stanley | ||||||||
3.95% 4/23/27 | 4,290,000 | 4,255,620 | ||||||
5.95% 12/28/17 | 6,900,000 | 7,183,445 | ||||||
PNC Bank | ||||||||
2.30% 6/1/20 | 4,275,000 | 4,275,248 | ||||||
2.45% 11/5/20 | 810,000 | 811,921 | ||||||
PNC Financial Services Group 5.00% 12/29/49 ● | 1,160,000 | 1,122,300 | ||||||
Popular 7.00% 7/1/19 | 1,000,000 | 1,036,250 | ||||||
Royal Bank of Scotland Group | ||||||||
3.875% 9/12/23 | 1,795,000 | 1,726,164 | ||||||
8.625% 12/29/49 ● | 910,000 | 930,475 | ||||||
Santander UK Group Holdings | ||||||||
2.875% 10/16/20 | 2,530,000 | 2,512,267 | ||||||
3.125% 1/8/21 | 560,000 | 560,280 | ||||||
Skandinaviska Enskilda Banken 144A 2.375% 3/25/19 # | 4,580,000 | 4,596,337 | ||||||
State Street 2.55% 8/18/20 | 1,075,000 | 1,086,406 | ||||||
SunTrust Banks | ||||||||
2.50% 5/1/19 | 3,705,000 | 3,738,619 | ||||||
2.70% 1/27/22 | 2,785,000 | 2,789,462 | ||||||
19
Table of Contents
Schedule of investments
Delaware Limited-Term Diversified Income Fund
| Principal amount° | Value (U.S. $) | |||||||
| ||||||||
Corporate Bonds (continued) | ||||||||
| ||||||||
Banking (continued) | ||||||||
SVB Financial Group 3.50% 1/29/25 | 1,235,000 | $ | 1,192,029 | |||||
Swedbank 144A 2.375% 2/27/19 # | 2,000,000 | 2,010,792 | ||||||
Toronto-Dominion Bank 2.25% 11/5/19 | 3,580,000 | 3,602,780 | ||||||
Turkiye Garanti Bankasi 144A 6.25% 4/20/21 # | 230,000 | 234,388 | ||||||
U.S. Bancorp 2.35% 1/29/21 | 1,000,000 | 1,002,861 | ||||||
U.S. Bank 1.40% 4/26/19 | 250,000 | 247,366 | ||||||
UBS Group Funding Jersey | ||||||||
144A 2.65% 2/1/22 # | 640,000 | 622,744 | ||||||
144A 3.00% 4/15/21 # | 2,700,000 | 2,704,118 | ||||||
USB Capital IX 3.50% 10/29/49 ● | 6,960,000 | 5,724,600 | ||||||
Wells Fargo 5.625% 12/11/17 | 5,000,000 | 5,184,510 | ||||||
Wells Fargo Bank 2.15% 12/6/19 | 2,345,000 | 2,344,536 | ||||||
|
| |||||||
| 144,750,172 | ||||||||
|
| |||||||
Basic Industry – 1.68% | ||||||||
CF Industries 144A 3.40% 12/1/21 # | 1,225,000 | 1,213,483 | ||||||
Equate Petrochemical 144A 3.00% 3/3/22 # | 265,000 | 253,348 | ||||||
FMG Resources August 2006 144A 6.875% 4/1/22 # | 1,000,000 | 1,042,500 | ||||||
Freeport-McMoRan 144A 6.50% 11/15/20 # | 1,000,000 | 1,032,500 | ||||||
Georgia-Pacific | ||||||||
144A 2.539% 11/15/19 # | 1,000,000 | 1,009,439 | ||||||
144A 5.40% 11/1/20 # | 5,750,000 | 6,326,926 | ||||||
INVISTA Finance 144A 4.25% 10/15/19 # | 1,330,000 | 1,325,205 | ||||||
MMC Finance 4.375% 4/30/18 | 500,000 | 512,394 | ||||||
NCI Building Systems 144A 8.25% 1/15/23 # | 335,000 | 363,475 | ||||||
Suzano Trading 144A 5.875% 1/23/21 # | 200,000 | 207,640 | ||||||
Teck Resources 144A 8.00% 6/1/21 # | 200,000 | 220,500 | ||||||
Vale Overseas 5.875% 6/10/21 | 260,000 | 273,000 | ||||||
WestRock | ||||||||
3.50% 3/1/20 | 1,010,000 | 1,036,266 | ||||||
4.45% 3/1/19 | 945,000 | 986,589 | ||||||
|
| |||||||
| 15,803,265 | ||||||||
|
| |||||||
Brokerage – 0.26% | ||||||||
Jefferies Group 5.125% 1/20/23 | 2,285,000 | 2,394,447 | ||||||
|
| |||||||
| 2,394,447 | ||||||||
|
| |||||||
Capital Goods – 0.41% | ||||||||
Cemex Finance 144A 9.375% 10/12/22 # | 900,000 | 983,250 | ||||||
Fortune Brands Home & Security 3.00% 6/15/20 | 630,000 | 634,553 | ||||||
Reynolds Group Issuer 8.25% 2/15/21 | 346,793 | 358,167 | ||||||
Roper Technologies 2.80% 12/15/21 | 1,100,000 | 1,100,736 | ||||||
Union Andina de Cementos 144A 5.875% 10/30/21 # | 244,000 | 253,150 | ||||||
Waste Management 2.40% 5/15/23 | 540,000 | 524,375 | ||||||
|
| |||||||
| 3,854,231 | ||||||||
|
| |||||||
20
Table of Contents
| Principal amount° | Value (U.S. $) | |||||||
| ||||||||
Corporate Bonds (continued) | ||||||||
| ||||||||
Communications – 2.77% | ||||||||
21st Century Fox America 4.50% 2/15/21 | 1,340,000 | $ | 1,433,996 | |||||
Altice Luxembourg 144A 7.75% 5/15/22 # | 500,000 | 535,000 | ||||||
AT&T 2.80% 2/17/21 | 70,000 | 69,511 | ||||||
Cablevision 144A 6.50% 6/15/21 # | 195,000 | 198,656 | ||||||
CenturyLink 5.625% 4/1/20 | 750,000 | 795,938 | ||||||
Charter Communications Operating 4.908% 7/23/25 | 1,610,000 | 1,699,724 | ||||||
Columbus Cable Barbados 144A 7.375% 3/30/21 # | 500,000 | 533,945 | ||||||
Crown Castle Towers 144A 3.663% 5/15/25 # | 635,000 | 636,721 | ||||||
CSC Holdings 6.75% 11/15/21 | 750,000 | 808,125 | ||||||
Deutsche Telekom International Finance | ||||||||
144A 1.50% 9/19/19 # | 725,000 | 713,792 | ||||||
144A 1.95% 9/19/21 # | 600,000 | 578,793 | ||||||
Digicel Group 144A 8.25% 9/30/20 # | 500,000 | 431,485 | ||||||
Dish DBS 6.75% 6/1/21 | 500,000 | 543,750 | ||||||
Frontier Communications 8.875% 9/15/20 | 400,000 | 427,500 | ||||||
GTH Finance 144A 6.25% 4/26/20 # | 500,000 | 525,459 | ||||||
GTP Acquisition Partners I 144A 2.35% 6/15/20 # | 520,000 | 506,761 | ||||||
JD.com 3.125% 4/29/21 | 400,000 | 395,845 | ||||||
Millicom International Cellular 144A 6.625% 10/15/21 # | 300,000 | 315,984 | ||||||
Myriad International Holdings 144A 6.375% 7/28/17 # | 300,000 | 306,753 | ||||||
SBA Tower Trust 144A 2.24% 4/16/18 # | 1,995,000 | 1,999,351 | ||||||
Sky 144A 3.75% 9/16/24 # | 1,845,000 | 1,853,930 | ||||||
Sprint Communications | ||||||||
144A 7.00% 3/1/20 # | 450,000 | 489,375 | ||||||
144A 9.00% 11/15/18 # | 750,000 | 828,750 | ||||||
Verizon Communications | ||||||||
4.50% 9/15/20 | 3,165,000 | 3,389,800 | ||||||
5.15% 9/15/23 | 4,530,000 | 5,016,169 | ||||||
WideOpenWest Finance 10.25% 7/15/19 | 500,000 | 528,750 | ||||||
Wind Acquisition Finance 144A 7.375% 4/23/21 # | 500,000 | 521,250 | ||||||
|
| |||||||
| 26,085,113 | ||||||||
|
| |||||||
Consumer Cyclical – 2.34% | ||||||||
Alibaba Group Holding 3.125% 11/28/21 | 200,000 | 200,219 | ||||||
Beacon Roofing Supply 6.375% 10/1/23 | 500,000 | 535,940 | ||||||
CVS Health | ||||||||
2.125% 6/1/21 | 1,135,000 | 1,114,079 | ||||||
2.80% 7/20/20 | 440,000 | 446,793 | ||||||
3.875% 7/20/25 | 255,000 | 263,523 | ||||||
Daimler Finance North America 144A 2.70% 8/3/20 # | 4,480,000 | 4,509,062 | ||||||
Ford Motor Credit | ||||||||
3.096% 5/4/23 | 980,000 | 947,750 | ||||||
3.336% 3/18/21 | 1,575,000 | 1,587,476 | ||||||
21
Table of Contents
Schedule of investments
Delaware Limited-Term Diversified Income Fund
| Principal amount° | Value (U.S. $) | |||||||
| ||||||||
Corporate Bonds (continued) | ||||||||
| ||||||||
Consumer Cyclical (continued) | ||||||||
General Motors Financial | ||||||||
3.15% 1/15/20 | 1,135,000 | $ | 1,142,915 | |||||
3.45% 4/10/22 | 1,070,000 | 1,059,423 | ||||||
3.70% 5/9/23 | 330,000 | 325,170 | ||||||
Hyundai Capital America | ||||||||
144A 2.55% 2/6/19 # | 1,000,000 | 1,006,359 | ||||||
144A 3.00% 3/18/21 # | 545,000 | 544,953 | ||||||
JC Penney 5.65% 6/1/20 | 750,000 | 743,438 | ||||||
MGM Resorts International 6.75% 10/1/20 | 375,000 | 418,125 | ||||||
NCL 144A 4.75% 12/15/21 # | 1,000,000 | 1,001,880 | ||||||
Penn National Gaming 5.875% 11/1/21 | 750,000 | 785,625 | ||||||
Starbucks 2.10% 2/4/21 | 2,110,000 | 2,104,480 | ||||||
Walgreens Boots Alliance | ||||||||
2.60% 6/1/21 | 2,905,000 | 2,889,743 | ||||||
3.10% 6/1/23 | 415,000 | 412,852 | ||||||
|
| |||||||
| 22,039,805 | ||||||||
|
| |||||||
Consumer Non-Cyclical – 3.68% | ||||||||
Abbott Laboratories 2.90% 11/30/21 | 4,365,000 | 4,357,501 | ||||||
AbbVie 2.30% 5/14/21 | 3,805,000 | 3,731,921 | ||||||
Anheuser-Busch InBev Finance 2.65% 2/1/21 | 3,360,000 | 3,382,485 | ||||||
Becton Dickinson 2.675% 12/15/19 | 3,720,000 | 3,777,016 | ||||||
Cencosud 144A 5.50% 1/20/21 # | 500,000 | 538,896 | ||||||
DP World 144A 3.25% 5/18/20 # | 500,000 | 508,150 | ||||||
Gilead Sciences 1.95% 3/1/22 | 2,300,000 | 2,226,970 | ||||||
JBS Investments 144A 7.75% 10/28/20 # | 300,000 | 319,890 | ||||||
Molson Coors Brewing 2.10% 7/15/21 | 1,670,000 | 1,628,175 | ||||||
Pernod Ricard 144A 4.45% 1/15/22 # | 1,795,000 | 1,906,597 | ||||||
Reynolds American 4.00% 6/12/22 | 2,370,000 | 2,481,862 | ||||||
Shire Acquisitions Investments Ireland | ||||||||
2.40% 9/23/21 | 1,090,000 | 1,054,089 | ||||||
2.875% 9/23/23 | 1,040,000 | 989,955 | ||||||
St. Jude Medical 2.80% 9/15/20 | 1,175,000 | 1,182,600 | ||||||
Sysco 2.50% 7/15/21 | 1,660,000 | 1,644,029 | ||||||
Teva Pharmaceutical Finance Netherlands III | ||||||||
2.80% 7/21/23 | 760,000 | 720,470 | ||||||
Thermo Fisher Scientific 3.00% 4/15/23 | 2,130,000 | 2,096,476 | ||||||
22
Table of Contents
| Principal amount° | Value (U.S. $) | |||||||
| ||||||||
Corporate Bonds (continued) | ||||||||
| ||||||||
Consumer Non-Cyclical (continued) | ||||||||
Zimmer Holdings 2.70% 4/1/20 | 2,085,000 | $ | 2,086,712 | |||||
|
| |||||||
| 34,633,794 | ||||||||
|
| |||||||
Electric – 5.96% | ||||||||
AES Gener 144A 5.25% 8/15/21 # | 420,000 | 441,243 | ||||||
Ameren 2.70% 11/15/20 | 3,665,000 | 3,687,965 | ||||||
Arizona Public Service 2.20% 1/15/20 | 4,195,000 | 4,201,708 | ||||||
Berkshire Hathaway Energy 2.00% 11/15/18 | 5,510,000 | 5,536,156 | ||||||
CMS Energy 6.25% 2/1/20 | 1,345,000 | 1,488,821 | ||||||
Dominion Resources 2.00% 8/15/21 | 410,000 | 398,042 | ||||||
DTE Energy | ||||||||
2.40% 12/1/19 | 1,725,000 | 1,734,686 | ||||||
3.30% 6/15/22 | 1,050,000 | 1,069,391 | ||||||
Duke Energy 1.80% 9/1/21 | 2,450,000 | 2,362,707 | ||||||
Dynegy 6.75% 11/1/19 | 1,000,000 | 1,022,500 | ||||||
Entergy 4.00% 7/15/22 | 3,175,000 | 3,324,025 | ||||||
Exelon 2.85% 6/15/20 | 2,000,000 | 2,022,962 | ||||||
Fortis 144A 2.10% 10/4/21 # | 2,895,000 | 2,801,193 | ||||||
IPALCO Enterprises 3.45% 7/15/20 | 710,000 | 725,975 | ||||||
Majapahit Holding 144A 8.00% 8/7/19 # | 500,000 | 561,250 | ||||||
National Rural Utilities Cooperative Finance 2.15% 2/1/19 | 6,030,000 | 6,077,872 | ||||||
NextEra Energy Capital Holdings 2.70% 9/15/19 | 2,980,000 | 3,019,616 | ||||||
NV Energy 6.25% 11/15/20 | 2,460,000 | 2,792,179 | ||||||
PPL Capital Funding 1.90% 6/1/18 | 3,810,000 | 3,810,411 | ||||||
Southern 2.35% 7/1/21 | 3,360,000 | 3,306,418 | ||||||
WEC Energy Group 2.45% 6/15/20 | 2,075,000 | 2,078,015 | ||||||
Xcel Energy 2.40% 3/15/21 | 3,590,000 | 3,573,439 | ||||||
|
| |||||||
| 56,036,574 | ||||||||
|
| |||||||
Energy – 2.74% | ||||||||
Antero Resources 5.375% 11/1/21 | 500,000 | 513,125 | ||||||
BP Capital Markets | ||||||||
3.216% 11/28/23 | 1,040,000 | 1,051,338 | ||||||
3.723% 11/28/28 | 480,000 | 488,407 | ||||||
Chevron 2.10% 5/16/21 | 2,495,000 | 2,475,145 | ||||||
Cia Brasileira de Aluminio 144A 6.75% 4/5/21 # | 250,000 | 261,875 | ||||||
CNOOC Finance 2015 Australia 2.625% 5/5/20 | 500,000 | 498,779 | ||||||
Dominion Gas Holdings 2.50% 12/15/19 | 2,020,000 | 2,043,620 | ||||||
Empresa Nacional del Petroleo 144A 4.75% 12/6/21 # | 395,000 | 408,836 | ||||||
Energy Transfer Equity 7.50% 10/15/20 | 500,000 | 560,000 | ||||||
Genesis Energy 5.75% 2/15/21 | 500,000 | 507,500 | ||||||
KazMunayGas National 144A 6.375% 4/9/21 # | 500,000 | 543,965 | ||||||
Kunlun Energy 144A 2.875% 5/13/20 # | 400,000 | 399,248 | ||||||
Newfield Exploration 5.75% 1/30/22 | 500,000 | 529,375 | ||||||
23
Table of Contents
Schedule of investments
Delaware Limited-Term Diversified Income Fund
| Principal amount° | Value (U.S. $) | |||||||
| ||||||||
Corporate Bonds (continued) | ||||||||
| ||||||||
Energy (continued) | ||||||||
Pertamina Persero 144A 5.25% 5/23/21 # | 325,000 | $ | 342,805 | |||||
Petrobras Global Finance | ||||||||
4.875% 3/17/20 | 425,000 | 421,260 | ||||||
8.375% 5/23/21 | 80,000 | 86,400 | ||||||
Petroleos Mexicanos | ||||||||
3.50% 7/18/18 | 250,000 | 252,875 | ||||||
144A 4.607% 3/11/22 #● | 250,000 | 258,125 | ||||||
Petronas Global Sukuk 144A 2.707% 3/18/20 # | 500,000 | 499,999 | ||||||
Regency Energy Partners 5.00% 10/1/22 | 1,020,000 | 1,082,191 | ||||||
Shell International Finance 1.75% 9/12/21 | 2,725,000 | 2,649,855 | ||||||
Targa Resources Partners 4.125% 11/15/19 | 1,000,000 | 1,017,500 | ||||||
Transocean 7.375% 4/15/18 | 520,000 | 530,400 | ||||||
Williams Partners 7.25% 2/1/17 | 4,695,000 | 4,713,428 | ||||||
Woodside Finance 144A 8.75% 3/1/19 # | 2,235,000 | 2,523,373 | ||||||
WPX Energy 7.50% 8/1/20 | 500,000 | 540,000 | ||||||
YPF | ||||||||
144A 8.875% 12/19/18 # | 430,000 | 468,808 | ||||||
144A 26.333% 7/7/20 #● | 110,000 | 125,950 | ||||||
|
| |||||||
| 25,794,182 | ||||||||
|
| |||||||
Finance Companies – 1.27% | ||||||||
AerCap Ireland Capital | ||||||||
3.95% 2/1/22 | 975,000 | 985,969 | ||||||
4.25% 7/1/20 | 500,000 | 515,000 | ||||||
4.625% 10/30/20 | 500,000 | 521,250 | ||||||
Air Lease 3.00% 9/15/23 | 1,030,000 | 985,523 | ||||||
Ally Financial 4.125% 3/30/20 | 500,000 | 506,250 | ||||||
Aviation Capital Group 144A 2.875% 9/17/18 # | 1,610,000 | 1,632,138 | ||||||
Corporacion Financiera de Desarrollo 144A | ||||||||
3.25% 7/15/19 # | 500,000 | 507,500 | ||||||
General Electric | ||||||||
1.261% 5/5/26 ● | 280,000 | 271,260 | ||||||
5.55% 5/4/20 | 2,175,000 | 2,406,474 | ||||||
6.00% 8/7/19 | 1,445,000 | 1,597,111 | ||||||
Gruposura Finance 144A 5.70% 5/18/21 # | 500,000 | 531,250 | ||||||
Nationwide Building Society 144A 4.00% 9/14/26 # | 780,000 | 744,622 | ||||||
SMBC Aviation Capital Finance 144A 2.65% 7/15/21 # | 720,000 | 693,852 | ||||||
|
| |||||||
| 11,898,199 | ||||||||
|
| |||||||
Healthcare – 0.60% | ||||||||
Aetna 2.40% 6/15/21 | 2,835,000 | 2,825,120 | ||||||
HCA Holdings 6.25% 2/15/21 | 1,000,000 | 1,078,750 | ||||||
IASIS Healthcare 8.375% 5/15/19 | 250,000 | 218,750 | ||||||
Mallinckrodt International Finance 144A 4.875% 4/15/20 # | 500,000 | 504,375 | ||||||
24
Table of Contents
| Principal amount° | Value (U.S. $) | |||||||
| ||||||||
Corporate Bonds (continued) | ||||||||
| ||||||||
Healthcare (continued) | ||||||||
Roche Holdings 144A 1.75% 1/28/22 # | 1,015,000 | $ | 976,155 | |||||
|
| |||||||
| 5,603,150 | ||||||||
|
| |||||||
Insurance – 2.06% | ||||||||
ACE INA Holdings 2.30% 11/3/20 | 3,540,000 | 3,541,126 | ||||||
American International Group 2.30% 7/16/19 | 3,700,000 | 3,719,666 | ||||||
Metropolitan Life Global Funding I 144A 1.875% 6/22/18 # | 2,015,000 | 2,021,124 | ||||||
Pricoa Global Funding I | ||||||||
144A 1.60% 5/29/18 # | 1,050,000 | 1,049,511 | ||||||
144A 2.20% 5/16/19 # | 3,855,000 | 3,868,361 | ||||||
Principal Life Global Funding II 144A 3.00% 4/18/26 # | 815,000 | 793,186 | ||||||
TIAA Asset Management Finance | ||||||||
144A 2.95% 11/1/19 # | 975,000 | 992,499 | ||||||
144A 4.125% 11/1/24 # | 460,000 | 465,388 | ||||||
UnitedHealth Group 2.70% 7/15/20 | 2,900,000 | 2,945,112 | ||||||
|
| |||||||
| 19,395,973 | ||||||||
|
| |||||||
Natural Gas – 0.55% | ||||||||
CenterPoint Energy 5.95% 2/1/17 | 2,365,000 | 2,373,088 | ||||||
CenterPoint Energy Resources 4.50% 1/15/21 | 2,700,000 | 2,835,346 | ||||||
|
| |||||||
| 5,208,434 | ||||||||
|
| |||||||
Real Estate – 0.79% | ||||||||
American Tower | ||||||||
2.25% 1/15/22 | 2,790,000 | 2,675,599 | ||||||
3.30% 2/15/21 | 470,000 | 475,799 | ||||||
4.40% 2/15/26 | 445,000 | 455,555 | ||||||
CC Holdings GS V 3.849% 4/15/23 | 1,165,000 | 1,185,551 | ||||||
Crown Castle International 5.25% 1/15/23 | 805,000 | 869,400 | ||||||
Host Hotels & Resorts 3.75% 10/15/23 | 505,000 | 496,500 | ||||||
Iron Mountain 144A 4.375% 6/1/21 # | 1,000,000 | 1,025,000 | ||||||
WEA Finance 144A 3.75% 9/17/24 # | 200,000 | 202,552 | ||||||
|
| |||||||
| 7,385,956 | ||||||||
|
| |||||||
Technology – 0.92% | ||||||||
Analog Devices 2.50% 12/5/21 | 980,000 | 972,124 | ||||||
Cisco Systems 1.85% 9/20/21 | 1,005,000 | 981,504 | ||||||
Diamond 1 Finance 144A 4.42% 6/15/21 # | 1,000,000 | 1,035,768 | ||||||
Fidelity National Information Services 3.00% 8/15/26 | 2,200,000 | 2,069,899 | ||||||
National Semiconductor 6.60% 6/15/17 | 3,325,000 | 3,407,852 | ||||||
Tencent Holdings 144A 3.375% 5/2/19 # | 200,000 | 204,629 | ||||||
|
| |||||||
| 8,671,776 | ||||||||
|
| |||||||
Transportation – 0.73% | ||||||||
Penske Truck Leasing 144A 3.375% 2/1/22 # | 2,000,000 | 2,019,184 | ||||||
Ryder System 3.45% 11/15/21 | 1,895,000 | 1,943,580 | ||||||
25
Table of Contents
Schedule of investments
Delaware Limited-Term Diversified Income Fund
| Principal amount° | Value (U.S. $) | |||||||
| ||||||||
Corporate Bonds (continued) | ||||||||
| ||||||||
Transportation (continued) | ||||||||
United Airlines 2015-1 Class AA Pass-Through Trust | ||||||||
3.45% 12/1/27 ◆ | 351,297 | $ | 347,784 | |||||
United Parcel Service 5.125% 4/1/19 | 2,340,000 | 2,513,717 | ||||||
|
| |||||||
| 6,824,265 | ||||||||
|
| |||||||
Total Corporate Bonds (cost $395,920,091) | 396,885,586 | |||||||
|
| |||||||
| ||||||||
Municipal Bonds – 1.17% | ||||||||
| ||||||||
Baltimore, Maryland | ||||||||
5.00% 2/1/26 | 2,030,000 | 2,487,156 | ||||||
Commonwealth of Massachusetts | ||||||||
Series C 5.00% 10/1/25 | 635,000 | 769,925 | ||||||
New York City, New York | ||||||||
Series C 5.00% 8/1/26 | 515,000 | 617,825 | ||||||
Series C 5.00% 8/1/27 | 595,000 | 708,032 | ||||||
University of California | ||||||||
1.272% 7/1/41 ● | 6,385,000 | 6,381,297 | ||||||
|
| |||||||
Total Municipal Bonds (cost $11,144,699) | 10,964,235 | |||||||
|
| |||||||
| ||||||||
Non-Agency Asset-Backed Securities – 30.44% | ||||||||
| ||||||||
Ally Master Owner Trust | ||||||||
Series 2012-5 A 1.54% 9/15/19 | 3,855,000 | 3,860,483 | ||||||
Series 2014-4 A2 1.43% 6/17/19 | 1,510,000 | 1,510,892 | ||||||
American Express Credit Account Master Trust | ||||||||
Series 2012-1 A 0.974% 1/15/20 ● | 3,900,000 | 3,902,214 | ||||||
Series 2013-1 A 1.124% 2/16/21 ● | 7,135,000 | 7,157,201 | ||||||
Series 2013-2 A 1.124% 5/17/21 ● | 2,474,000 | 2,481,593 | ||||||
Series 2014-1 A 1.074% 12/15/21 ● | 2,100,000 | 2,103,823 | ||||||
ARI Fleet Lease Trust | ||||||||
Series 2015-A A2 144A 1.11% 11/15/18 # | 136,016 | 135,766 | ||||||
Avis Budget Rental Car Funding AESOP | ||||||||
Series 2013-2A A 144A 2.97% 2/20/20 # | 6,500,000 | 6,567,252 | ||||||
Bank of America Credit Card Trust | ||||||||
Series 2007-A4 A4 0.744% 11/15/19 ● | 10,495,000 | 10,488,846 | ||||||
Series 2014-A2 A 0.974% 9/16/19 ● | 5,500,000 | 5,501,080 | ||||||
Series 2014-A3 A 0.994% 1/15/20 ● | 1,265,000 | 1,265,878 | ||||||
Series 2015-A1 A 1.034% 6/15/20 ● | 748,000 | 749,005 | ||||||
Barclays Dryrock Issuance Trust | ||||||||
Series 2014-2 A 1.044% 3/16/20 ● | 590,000 | 590,102 | ||||||
BMW Vehicle Lease Trust | ||||||||
Series 2016-2 A3 1.43% 9/20/19 | 1,810,000 | 1,810,743 | ||||||
Cabela’s Credit Card Master Note Trust | ||||||||
Series 2014-2 A 1.154% 7/15/22 ● | 6,000,000 | 6,008,122 | ||||||
26
Table of Contents
| Principal amount° | Value (U.S. $) | |||||||
| ||||||||
Non-Agency Asset-Backed Securities (continued) | ||||||||
| ||||||||
Cabela’s Credit Card Master Note Trust | ||||||||
Series 2015-1A A1 2.26% 3/15/23 | 500,000 | $ | 500,695 | |||||
Capital One Multi-Asset Execution Trust | ||||||||
Series 2007-A1 A1 0.754% 11/15/19 ● | 8,665,000 | 8,664,999 | ||||||
Series 2007-A2 A2 0.784% 12/16/19 ● | 4,650,000 | 4,650,000 | ||||||
Series 2007-A5 A5 0.744% 7/15/20 ● | 200,000 | 199,789 | ||||||
Series 2014-A3 A3 1.084% 1/18/22 ● | 2,000,000 | 2,000,812 | ||||||
Series 2016-A1 A1 1.154% 2/15/22 ● | 7,660,000 | 7,691,116 | ||||||
Series 2016-A2 A2 1.334% 2/15/24 ● | 2,500,000 | 2,514,827 | ||||||
Chase Issuance Trust | ||||||||
Series 2007-B1 B1 0.954% 4/15/19 ● | 2,100,000 | 2,099,426 | ||||||
Series 2007-C1 C1 1.164% 4/15/19 ● | 4,700,000 | 4,699,611 | ||||||
Series 2012-A10 A10 0.964% 12/16/19 ● | 2,750,000 | 2,753,009 | ||||||
Series 2013-A3 A3 0.984% 4/15/20 ● | 3,670,000 | 3,675,832 | ||||||
Series 2013-A6 A6 1.124% 7/15/20 ● | 4,000,000 | 4,013,472 | ||||||
Series 2013-A9 A 1.124% 11/16/20 ● | 8,900,000 | 8,926,583 | ||||||
Series 2014-A5 A5 1.074% 4/15/21 ● | 8,781,000 | 8,794,344 | ||||||
Series 2014-A7 A7 1.38% 11/15/19 | 5,500,000 | 5,504,778 | ||||||
Series 2015-A6 A6 0.954% 5/15/19 ● | 11,270,000 | 11,274,030 | ||||||
Series 2016-A1 A 1.114% 5/17/21 ● | 695,000 | 697,172 | ||||||
Series 2016-A3 A3 1.254% 6/15/23 ● | 4,500,000 | 4,513,722 | ||||||
Chesapeake Funding | ||||||||
Series 2014-1A A 144A 1.072% 3/7/26 #● | 5,489,293 | 5,470,431 | ||||||
Citibank Credit Card Issuance Trust | ||||||||
Series 2013-A4 A4 1.176% 7/24/20 ● | 800,000 | 802,546 | ||||||
Series 2013-A7 A7 1.094% 9/10/20 ● | 8,100,000 | 8,129,098 | ||||||
CNH Equipment Trust | ||||||||
Series 2016-B A2B 1.104% 10/15/19 ● | 145,000 | 145,186 | ||||||
Discover Card Execution Note Trust | ||||||||
Series 2012-A4 A4 1.074% 11/15/19 ● | 500,000 | 500,496 | ||||||
Series 2013-A1 A1 1.004% 8/17/20 ● | 3,300,000 | 3,302,702 | ||||||
Series 2013-A6 A6 0.988% 4/15/21 ● | 2,405,000 | 2,414,729 | ||||||
Series 2014-A1 A1 1.134% 7/15/21 ● | 8,365,000 | 8,396,203 | ||||||
Series 2015-A1 A1 1.054% 8/17/20 ● | 7,350,000 | 7,361,068 | ||||||
Series 2016-A4 A4 1.39% 3/15/22 | 2,000,000 | 1,977,171 | ||||||
Enterprise Fleet Financing | ||||||||
Series 2014-1 A2 144A 0.87% 9/20/19 # | 111,217 | 111,135 | ||||||
Ford Credit Auto Lease Trust | ||||||||
Series 2015-A A3 1.13% 6/15/18 | 681,731 | 681,810 | ||||||
Ford Credit Auto Owner Trust | ||||||||
Series 2016-B A2B 1.014% 3/15/19 ● | 624,222 | 624,563 | ||||||
Series 2016-C A2B 0.844% 9/15/19 ● | 2,500,000 | 2,500,066 | ||||||
27
Table of Contents
Schedule of investments
Delaware Limited-Term Diversified Income Fund
| Principal amount° | Value (U.S. $) | |||||||
| ||||||||
Non-Agency Asset-Backed Securities (continued) | ||||||||
| ||||||||
Ford Credit Floorplan Master Owner Trust A | ||||||||
Series 2014-1 A1 1.20% 2/15/19 | 4,100,000 | $ | 4,100,194 | |||||
Series 2014-1 A2 1.104% 2/15/19 ● | 4,024,000 | 4,024,688 | ||||||
Series 2014-2 A 1.204% 2/15/21 ● | 6,612,000 | 6,622,038 | ||||||
Series 2014-4 A2 1.054% 8/15/19 ● | 7,650,000 | 7,658,241 | ||||||
Golden Credit Card Trust | ||||||||
Series 2014-2A A 144A 1.154% 3/15/21 #● | 535,000 | 535,610 | ||||||
Series 2015-1A A 144A 1.144% 2/15/20 #● | 7,750,000 | 7,755,477 | ||||||
GreatAmerica Leasing Receivables | ||||||||
Series 2014-1 A3 144A 0.89% 7/15/17 # | 94,892 | 94,867 | ||||||
Hertz Fleet Lease Funding | ||||||||
Series 2014-1 A 144A 1.064% 4/10/28 #● | 2,335,984 | 2,334,897 | ||||||
HOA Funding | ||||||||
Series 2014-1A A2 144A 4.846% 8/20/44 # | 253,075 | 224,039 | ||||||
Honda Auto Receivables Owner Trust | ||||||||
Series 2015-3 A3 1.27% 4/18/19 | 6,000,000 | 5,998,061 | ||||||
Hyundai Auto Lease Securitization Trust | ||||||||
Series 2015-A A3 144A 1.42% 9/17/18 # | 5,797,459 | 5,805,414 | ||||||
Hyundai Auto Receivables Trust | ||||||||
Series 2015-C A2B 1.074% 11/15/18 ● | 560,282 | 560,426 | ||||||
Series 2016-A A2B 1.074% 6/17/19 ● | 2,636,264 | 2,639,609 | ||||||
Mercedes-Benz Auto Lease Trust | ||||||||
Series 2015-B A2B 1.224% 1/16/18 ● | 2,654,979 | 2,655,838 | ||||||
Series 2016-A A2B 1.264% 7/16/18 ● | 410,592 | 411,081 | ||||||
Mercedes-Benz Master Owner Trust | ||||||||
Series 2015-AA A 144A 1.024% 4/15/19 #● | 4,000,000 | 4,000,000 | ||||||
Series 2015-BA A 144A 1.084% 4/15/20 #● | 1,000,000 | 1,000,010 | ||||||
Navistar Financial Dealer Note Master Owner Trust II | ||||||||
Series 2016-1 A 144A 2.106% 9/27/21 #● | 390,000 | 391,046 | ||||||
NextGear Floorplan Master Owner Trust | ||||||||
Series 2014-1A A 144A 1.92% 10/15/19 # | 1,015,000 | 1,014,999 | ||||||
Nissan Auto Lease Trust | ||||||||
Series 2015-B A2B 1.234% 12/15/17 ● | 364,918 | 365,270 | ||||||
Series 2016-A A2B 1.084% 8/15/18 ● | 480,085 | 480,651 | ||||||
Series 2016-B A2B 0.984% 12/17/18 ● | 1,705,000 | 1,705,982 | ||||||
Nissan Auto Receivables Owner Trust | ||||||||
Series 2015-C A2B 1.054% 11/15/18 ● | 280,472 | 280,753 | ||||||
Series 2016-B A2B 1.004% 4/15/19 ● | 2,500,000 | 2,501,500 | ||||||
Penarth Master Issuer | ||||||||
Series 2015-1A A1 144A 1.136% 3/18/19 #● | 385,000 | 384,913 | ||||||
Series 2015-2A A1 144A 1.136% 5/18/19 #● | 3,800,000 | 3,800,027 | ||||||
PFS Financing | ||||||||
Series 2014-AA A 144A 1.304% 2/15/19 #● | 8,000,000 | 7,995,334 | ||||||
Series 2015-AA A 144A 1.324% 4/15/20 #● | 2,000,000 | 1,995,891 | ||||||
28
Table of Contents
| Principal amount° | Value (U.S. $) | |||||||
| ||||||||
Non-Agency Asset-Backed Securities (continued) | ||||||||
| ||||||||
Porsche Innovative Lease Owner Trust | ||||||||
Series 2015-1 A3 144A 1.19% 7/23/18 # | 718,559 | $ | 718,651 | |||||
Synchrony Credit Card Master Note Trust | ||||||||
Series 2012-6 A 1.36% 8/17/20 | 870,000 | 870,485 | ||||||
Series 2015-2 A 1.60% 4/15/21 | 640,000 | 640,540 | ||||||
Toyota Auto Receivables Owner Trust | ||||||||
Series 2016-B A2B 0.954% 10/15/18 ● | 500,000 | 500,319 | ||||||
Volkswagen Credit Auto Master Trust | ||||||||
Series 2014-1A A2 144A 1.40% 7/22/19 # | 2,210,000 | 2,208,476 | ||||||
Wells Fargo Dealer Floorplan Master Note Trust | ||||||||
Series 2012-2 A 1.489% 4/22/19 ● | 9,865,000 | 9,876,324 | ||||||
Series 2014-2 A 1.189% 10/20/19 ● | 8,575,000 | 8,576,830 | ||||||
Series 2015-1 A 1.239% 1/20/20 ● | 4,810,000 | 4,817,106 | ||||||
Wheels | ||||||||
Series 2014-1A A2 144A 0.84% 3/20/23 # | 331,376 | 331,171 | ||||||
World Financial Network Credit Card Master Trust | ||||||||
Series 2015-A A 1.184% 2/15/22 ● | 685,000 | 686,322 | ||||||
|
| |||||||
Total Non-Agency Asset-Backed Securities | 286,287,501 | |||||||
|
| |||||||
| ||||||||
Non-Agency Collateralized Mortgage Obligations – 0.25% | ||||||||
| ||||||||
American Home Mortgage Investment Trust | ||||||||
Series 2005-2 5A1 5.064% 9/25/35 f | 27,110 | 26,817 | ||||||
Bank of America Alternative Loan Trust | ||||||||
Series 2005-6 7A1 5.50% 7/25/20 | 27,183 | 26,173 | ||||||
GSMPS Mortgage Loan Trust | ||||||||
Series 1998-2 A 144A 7.75% 5/19/27 #● | 57,194 | 59,052 | ||||||
JPMorgan Mortgage Trust | ||||||||
Series 2014-IVR6 2A4 144A 2.50% 7/25/44 #● | 455,000 | 448,108 | ||||||
Sequoia Mortgage Trust | ||||||||
Series 2014-2 A4 144A 3.50% 7/25/44 #● | 431,639 | 430,729 | ||||||
Towd Point Mortgage Trust | ||||||||
Series 2015-5 A1B 144A 2.75% 5/25/55 #● | 613,207 | 614,694 | ||||||
Series 2015-6 A1B 144A 2.75% 4/25/55 #● | 653,297 | 653,696 | ||||||
Wells Fargo Mortgage-Backed Securities Trust | ||||||||
Series 2006-AR5 2A1 3.154% 4/25/36 ● | 123,318 | 115,350 | ||||||
|
| |||||||
Total Non-Agency Collateralized Mortgage Obligations (cost $2,336,044) | 2,374,619 | |||||||
|
| |||||||
| ||||||||
Non-Agency Commercial Mortgage-Backed Securities – 0.32% | ||||||||
| ||||||||
Bear Stearns Commercial Mortgage Securities Trust | ||||||||
Series 2007-PW16 A1A 5.711% 6/11/40 ● | 1,089,075 | 1,099,559 | ||||||
Citigroup Commercial Mortgage Trust | ||||||||
Series 2007-C6 AM 5.711% 12/10/49 ● | 535,000 | 542,674 | ||||||
29
Table of Contents
Schedule of investments
Delaware Limited-Term Diversified Income Fund
| Principal amount° | Value (U.S. $) | |||||||
| ||||||||
Non-Agency Commercial Mortgage-Backed Securities (continued) | ||||||||
| ||||||||
DB-UBS Mortgage Trust | ||||||||
Series 2011-LC1A A3 144A 5.002% 11/10/46 # | 1,285,000 | $ | 1,394,117 | |||||
|
| |||||||
Total Non-Agency Commercial Mortgage-Backed Securities | 3,036,350 | |||||||
|
| |||||||
| ||||||||
Senior Secured Loans – 6.96%« | ||||||||
| ||||||||
Air Medical Group Holdings Tranche B 1st Lien 4.25% 4/28/22 | 1,744,323 | 1,741,706 | ||||||
Amaya Holdings 1st Lien 5.00% 8/1/21 | 497,475 | 500,273 | ||||||
Applied Systems 2nd Lien 7.50% 1/23/22 | 200,000 | 202,375 | ||||||
Avago Technologies Cayman Finance Tranche B3 1st Lien 3.704% 2/1/23 | 336,514 | 341,667 | ||||||
BJ’s Wholesale Club 2nd Lien 8.50% 3/31/20 | 199,047 | 201,909 | ||||||
BJ’s Wholesale Club Tranche B 1st Lien 4.50% 9/26/19 | 2,735,605 | 2,763,817 | ||||||
Blue Ribbon 1st Lien 5.00% 11/13/21 | 642,969 | 638,147 | ||||||
Builders FirstSource Tranche B 1st Lien 4.75% 7/31/22 | 1,492,500 | 1,507,612 | ||||||
Charter Communications Operating Tranche H 1st Lien 2.00% 1/15/22 | 497,500 | 500,609 | ||||||
Communications Sale & Leasing Tranche B 1st Lien 4.50% 10/24/22 | 2,500,000 | 2,532,500 | ||||||
Community Health Systems Tranche F 1st Lien 4.185% 12/31/18 | 285,209 | 281,154 | ||||||
ConvaTec Healthcare D Sarl Tranche B 1st Lien 3.25% 10/26/23 | 3,000,000 | 3,022,500 | ||||||
FCA US Tranche B 1st Lien 3.27% 12/31/18 | 292,204 | 293,299 | ||||||
First Data 1st Lien 3.756% 3/24/21 | 721,580 | 729,547 | ||||||
First Eagle Holdings Tranche B 1st Lien 4.998% 12/1/22 | 1,492,462 | 1,509,253 | ||||||
FMG Resources August 2006 Pty 1st Lien 3.75% 6/30/19 | 197,611 | 198,253 | ||||||
Forterra Finance 1st Lien 4.50% 10/25/23 | 2,992,500 | 3,030,529 | ||||||
Frank Russell Tranche B 1st Lien 6.75% 6/1/23 | 2,240,620 | 2,265,128 | ||||||
Gardner Denver 1st Lien 4.25% 7/30/20 | 1,096,139 | 1,086,548 | ||||||
Hilton Worldwide Finance Tranche B1 1st Lien 3.50% 10/26/20 | 33,338 | 33,658 | ||||||
Hilton Worldwide Finance Tranche B2 1st Lien 3.256% 10/25/23 | 453,271 | 459,059 | ||||||
Ineos U.S. Finance Tranche B 3.75% 5/4/18 | 494,883 | 496,862 | ||||||
JC Penney Tranche B 1st Lien 5.25% 6/23/23 | 291,086 | 293,268 | ||||||
KIK Custom Products 1st Lien 6.00% 8/26/22 | 1,989,924 | 2,012,311 | ||||||
Landry’s Tranche B 1st Lien 4.00% 10/4/23 | 2,750,000 | 2,783,688 | ||||||
Mission Broadcasting Tranche B 1st Lien 3.767% 1/17/24 | 84,364 | 84,153 | ||||||
Mohegan Tribal Gaming Authority Tranche B 1st Lien 5.50% 10/13/23 | 2,358,435 | 2,378,336 | ||||||
MPH Acquisition Holdings 5.00% 6/7/23 | 231,988 | 236,463 | ||||||
NBTY Tranche B 1st Lien 5.00% 5/5/23 | 139,150 | 140,498 | ||||||
Nexstar Broadcasting Tranche B 1st Lien 3.00% 9/26/23 | 2,415,636 | 2,439,507 | ||||||
30
Table of Contents
| Principal amount° | Value (U.S. $) | |||||||
| ||||||||
Senior Secured Loans« (continued) | ||||||||
| ||||||||
Nielsen Finance Tranche B 1st Lien 3.154% 10/4/23 | 3,000,000 | $ | 3,030,702 | |||||
NXP Tranche B 1st Lien 3.405% 12/7/20 | 1,995,000 | 2,008,093 | ||||||
ON Semiconductor Tranche B 1st Lien 4.02% 3/31/23 | 2,374,050 | 2,405,373 | ||||||
PQ 1st Lien 5.25% 11/4/22 | 697,751 | 705,414 | ||||||
Prime Security Services Borrower 1st Lien 4.25% 5/2/22 | 249,375 | 253,505 | ||||||
Republic of Angola (Unsecured) 7.57% 12/16/23 | 446,250 | 370,388 | ||||||
Reynolds Group Holdings 1st Lien 4.25% 2/5/23 | 2,493,750 | 2,524,072 | ||||||
Rite Aid 2nd Lien 5.75% 8/21/20 | 500,000 | 503,047 | ||||||
Sable International Finance Tranche B 1st Lien 5.50% 1/3/23 | 3,165,000 | 3,204,563 | ||||||
Scientific Games International 1st Lien 6.00% 10/18/20 | 397,949 | 403,868 | ||||||
SFR Group Tranche B10 1st Lien 4.038% 1/31/25 | 3,500,000 | 3,536,096 | ||||||
Telenet Financing USD Tranche B 1st Lien 3.704% 1/31/25 | 2,500,000 | 2,520,313 | ||||||
TransDigm Tranche F 1st Lien 3.77% 6/9/23 | 2,487,500 | 2,514,447 | ||||||
Univision Communications Tranche C4 1st Lien 4.00% 3/1/20 | 2,486,690 | 2,501,369 | ||||||
USI Insurance Services Tranche B 1st Lien 4.25% 12/27/19 | 396,923 | 398,990 | ||||||
WideOpenWest Finance Tranche B 1st Lien 4.50% 8/19/23 | 2,500,000 | 2,521,528 | ||||||
Windstream Services Tranche B6 1st Lien | ||||||||
4.75% 12/2/23 | 750,000 | 754,922 | ||||||
4.75% 3/30/21 | 547,875 | 551,471 | ||||||
|
| |||||||
Total Senior Secured Loans (cost $64,607,918) | 65,412,790 | |||||||
|
| |||||||
| ||||||||
Sovereign Bonds – 0.55%D | ||||||||
| ||||||||
Argentina – 0.02% | ||||||||
Argentine Republic Government International Bond 144A 6.25% 4/22/19 # | 180,000 | 192,600 | ||||||
|
| |||||||
| 192,600 | ||||||||
|
| |||||||
Brazil – 0.03% | ||||||||
Brazilian Government International Bond 4.875% 1/22/21 | 255,000 | 263,288 | ||||||
|
| |||||||
| 263,288 | ||||||||
|
| |||||||
Croatia – 0.06% | ||||||||
Croatia Government International Bond 144A 6.375% 3/24/21 # | 500,000 | 544,928 | ||||||
|
| |||||||
| 544,928 | ||||||||
|
| |||||||
Dominican Republic – 0.04% | ||||||||
Dominican Republic International Bond 144A 7.50% 5/6/21 # | 300,000 | 326,352 | ||||||
|
| |||||||
| 326,352 | ||||||||
|
| |||||||
31
Table of Contents
Schedule of investments
Delaware Limited-Term Diversified Income Fund
| Principal amount° | Value (U.S. $) | |||||||
| ||||||||
Sovereign BondsD (continued) | ||||||||
| ||||||||
Hungary – 0.06% | ||||||||
Hungary Government International Bond 6.375% 3/29/21 | 500,000 | $ | 560,928 | |||||
|
| |||||||
| 560,928 | ||||||||
|
| |||||||
Indonesia – 0.06% | ||||||||
Indonesia Government International Bond 144A 3.70% 1/8/22 # | 200,000 | 200,949 | ||||||
Perusahaan Penerbit Indonesia III 144A 6.125% 3/15/19 # | 300,000 | 324,390 | ||||||
|
| |||||||
| 525,339 | ||||||||
|
| |||||||
Mongolia – 0.03% | ||||||||
Mongolia Government International Bond 144A 10.875% 4/6/21 # | 300,000 | 316,145 | ||||||
|
| |||||||
| 316,145 | ||||||||
|
| |||||||
Qatar – 0.06% | ||||||||
Qatar Government International Bond 144A 2.375% 6/2/21 # | 565,000 | 553,890 | ||||||
|
| |||||||
| 553,890 | ||||||||
|
| |||||||
Saudi Arabia – 0.03% | ||||||||
Saudi Government International Bond 144A 2.375% 10/26/21 # | 325,000 | 315,861 | ||||||
|
| |||||||
| 315,861 | ||||||||
|
| |||||||
Serbia – 0.05% | ||||||||
Republic of Serbia 144A 4.875% 2/25/20 # | 500,000 | 509,630 | ||||||
|
| |||||||
| 509,630 | ||||||||
|
| |||||||
Slovenia – 0.06% | ||||||||
Slovenia Government International Bond 144A 4.75% 5/10/18 # | 500,000 | 518,650 | ||||||
|
| |||||||
| 518,650 | ||||||||
|
| |||||||
Sri Lanka – 0.05% | ||||||||
Sri Lanka Government International Bond 144A 5.125% 4/11/19 # | 250,000 | 253,204 | ||||||
144A 5.75% 1/18/22 # | 250,000 | 247,129 | ||||||
|
| |||||||
| 500,333 | ||||||||
|
| |||||||
Total Sovereign Bonds (cost $5,138,240) | 5,127,944 | |||||||
|
| |||||||
32
Table of Contents
| Principal amount° | Value (U.S. $) | |||||||
| ||||||||
U.S. Treasury Obligation – 0.11% | ||||||||
| ||||||||
U.S. Treasury Notes | ||||||||
1.25% 10/31/21 | 1,045,000 | $ | 1,013,446 | |||||
|
| |||||||
Total U.S. Treasury Obligation (cost $1,012,793) | 1,013,446 | |||||||
|
| |||||||
Number of Shares | ||||||||
| ||||||||
Preferred Stock – 0.52% | ||||||||
| ||||||||
Bank of America 8.125% ● | 1,000,000 | 1,040,000 | ||||||
General Electric 5.00% ● | 1,111,000 | 1,154,273 | ||||||
Morgan Stanley 5.55% ● | 1,180,000 | 1,194,750 | ||||||
PNC Preferred Funding Trust II 2.186% #● | 1,200,000 | 1,161,000 | ||||||
USB Realty 2.027% #● | 400,000 | 353,000 | ||||||
|
| |||||||
Total Preferred Stock (cost $4,877,272) | 4,903,023 | |||||||
|
| |||||||
| Principal amount | ° | |||||||
| ||||||||
Short-Term Investments – 1.94% | ||||||||
| ||||||||
Discount Notes - 0.07%≠ | ||||||||
Federal Home Loan Bank | ||||||||
0.366% 1/27/17 | 302,391 | 302,316 | ||||||
0.379% 2/3/17 | 151,195 | 151,132 | ||||||
0.434% 1/25/17 | 259,490 | 259,431 | ||||||
|
| |||||||
| 712,879 | ||||||||
|
| |||||||
Repurchase Agreements – 1.87% | ||||||||
Bank of America Merrill Lynch | ||||||||
0.41%, dated 12/30/16, to be repurchased on 1/3/17, repurchase price $5,927,916 (collateralized by U.S. government obligations 2.00% 8/15/25; market value $6,046,199) | 5,927,646 | 5,927,646 | ||||||
Bank of Montreal | ||||||||
0.30%, dated 12/30/16, to be repurchased on 1/3/17, repurchase price $6,915,818 (collateralized by U.S. government obligations 0.00%-4.375% 5/15/18-11/15/44; market value $7,053,902) | 6,915,587 | 6,915,587 | ||||||
BNP Paribas | ||||||||
0.48%, dated 12/30/16, to be repurchased on 1/3/17, repurchase price $4,735,019 (collateralized by U.S. government obligations 2.125% 12/31/22; market value $4,829,465) | 4,734,767 | 4,734,767 | ||||||
|
| |||||||
| 17,578,000 | ||||||||
|
| |||||||
Total Short-Term Investments (cost $18,290,860) | 18,290,879 | |||||||
|
| |||||||
Total Value of Securities – 102.47% | $ | 963,615,026 | ||||||
|
| |||||||
33
Table of Contents
Schedule of investments
Delaware Limited-Term Diversified Income Fund
| # | Security exempt from registration under Rule 144A of the Securities Act of 1933, as amended. At Dec. 31, 2016, the aggregate value of Rule 144A securities was $161,055,962, which represents 17.13% of the Fund’s net assets. See Note 11 in “Notes to financial statements.” |
| ◆ | Pass Through Agreement. Security represents the contractual right to receive a proportionate amount of underlying payments due to the counterparty pursuant to various agreements related to the rescheduling of obligations and the exchange of certain notes. |
| T | PIK. 100% of the income received was in the form of cash. |
| ≠ | The rate shown is the effective yield at the time of purchase. |
| « | Senior secured loans generally pay interest at rates which are periodically reset by reference to a base lending rate plus a premium. These base lending rates are generally: (i) the prime rate offered by one or more U.S. banks, (ii) the lending rate offered by one or more European banks such as the London Interbank Offered Rate (LIBOR), and (iii) the certificate of deposit rate. Senior secured loans may be subject to restrictions on resale. Stated rate in effect at Dec. 31, 2016. |
| º | Principal amount shown is stated in U.S. dollars unless noted that the security is denominated in another currency. |
| D | Securities have been classified by country of origin. |
| S | Interest only security. An interest only security is the interest only portion of a fixed income security, which is separated and sold individually from the principal portion of the security. |
| W | Principal only security. A principal only security is the principal only portion of a fixed income security which is separated and sold individually from the interest portion of the security. |
| ● | Variable rate security. Each rate shown is as of Dec. 31, 2016. Interest rates reset periodically. |
| f | Step coupon bond. Coupon increases or decreases periodically based on a predetermined schedule. Stated rate in effect at Dec. 31, 2016. |
The following futures and swap contracts were outstanding at Dec. 31, 2016:1
Futures Contracts
Notional Cost | Notional | Expiration | Unrealized Appreciation | |||||||||||||||
Contracts to Buy (Sell) | (Proceeds) | Value | Date | (Depreciation) | ||||||||||||||
13 | U.S. Treasury 10 yr Notes | $ 1,220,841 | $ | 1,615,656 | 3/23/17 | $ | 394,815 | |||||||||||
(90) | U.S. Treasury Long Bonds | (13,457,089 | ) | (13,559,062 | ) | 3/23/17 | (101,973 | ) | ||||||||||
|
|
|
| |||||||||||||||
| $(12,236,248 | ) | $ | 292,842 | |||||||||||||||
|
|
|
| |||||||||||||||
34
Table of Contents
Swap Contracts
CDS Contracts2
Swap Referenced | Annual Protection | Termination | Upfront Payment | Unrealized Appreciation | ||||||||||||||||||
Counterparty | Obligation | Notional Value3 | Payments | Date | (Received) | (Depreciation)4 | ||||||||||||||||
| Protection Purchased: | ||||||||||||||||||||||
ICE | JPMC - CDX.NA.HY.275 | 70,000,000 | 5.00% | 12/20/21 | $(3,218,502) | $ | (1,111,825) | |||||||||||||||
The use of futures contracts and swap contracts involves elements of market risk and risks in excess of the amounts disclosed in these financial statements. The notional values presented above represent the Fund’s total exposure in such contracts, whereas only the net unrealized appreciation (depreciation) is reflected in the Fund’s net assets.
1See Note 8 in “Notes to financial statements.”
2A CDS contract is a risk-transfer instrument through which one party (purchaser of protection) transfers to another party (seller of protection) the financial risk of a credit event (as defined in the CDS agreement), as it relates to a particular reference security or basket of securities (such as an index). Periodic payments (receipts) on such contracts are accrued daily and recorded as unrealized losses (gains) on swap contracts. Upon payment (receipt), such amounts are recorded as realized losses (gains) on swap contracts. Upfront payments made or received in connection with CDS contracts are amortized over the expected life of the CDS contracts as unrealized losses (gains) on swap contracts. The change in value of CDS contracts is recorded as unrealized appreciation or depreciation daily. A realized gain or loss is recorded upon a credit event (as defined in the CDS agreement) or the maturity or termination of the agreement.
3Notional value shown is stated in U.S. Dollars unless noted that the swap is denominated in another currency.
4Unrealized appreciation (depreciation) does not include periodic interest payments on swap contracts accrued daily in the amount of $(119,269).
5Markit’s CDX.NA.HY Index, is composed of one hundred (100) of the most liquid North American entities with high yield credit ratings that trade in the CDS market.
35
Table of Contents
Schedule of investments
Delaware Limited-Term Diversified Income Fund
Summary of abbreviations:
ARM – Adjustable Rate Mortgage
CLO – Collateralized Loan Obligation
CDS – Credit Default Swap
CDX.NA.HY – Credit Default Swap Index North American High-Yield
DB-UBS – Deutsche Bank United Bank of Switzerland
GNMA – Government National Mortgage Association
GSMPS – Goldman Sachs Reperforming Mortgage Securities
ICE – Intercontinental Exchange, Inc.
JPMC – JPMorgan Chase Bank
NCUA – National Credit Union Administration
PIK – Pay-in-kind
REMIC – Real Estate Mortgage Investment Conduit
S.F. – Single Family
yr – Year
See accompanying notes, which are an integral part of the financial statements.
36
Table of Contents
This page intentionally left blank.
Table of Contents
| Statement of assets and liabilities | ||
| Delaware Limited-Term Diversified Income Fund | December 31, 2016 |
Assets: | ||||
Investments, at value1 | $ | 945,324,147 | ||
Short-term investments, at value2 | 18,290,879 | |||
Cash collateral due from broker on futures contracts | 383,000 | |||
Cash collateral due from broker on TBA transactions | 528,000 | |||
Cash collateral due from broker on swap contracts | 6,681,237 | |||
Cash | 4,643,102 | |||
Receivable for securities sold | 54,503,894 | |||
Dividends and interest receivable | 4,428,170 | |||
Receivable for fund shares sold | 1,311,298 | |||
|
| |||
Total assets | 1,036,093,727 | |||
|
| |||
Liabilities: | ||||
Payable for securities purchased | 88,689,229 | |||
Upfront payments received on credit default swap contracts | 3,218,502 | |||
Payable for fund shares redeemed | 1,150,928 | |||
Unrealized depreciation on credit default swap contracts | 1,051,983 | |||
Income distribution payable | 486,660 | |||
Investment management fees payable | 386,182 | |||
Other accrued expenses | 293,461 | |||
Distribution fees payable to affiliates | 160,185 | |||
Swap payments payable | 116,140 | |||
Variation margin payable on futures contracts | 63,031 | |||
Variation margin payable on credit default swap contracts | 59,842 | |||
Dividend disbursing and transfer agent fees and expenses payable to affiliates | 16,102 | |||
Accounting and administration expenses payable to affiliates | 3,756 | |||
Trustees’ fees and expenses payable | 2,367 | |||
Legal fees payable to affiliates | 1,727 | |||
Reports and statements to shareholders payable to affiliates | 830 | |||
|
| |||
Total liabilities | 95,700,925 | |||
|
| |||
Total Net Assets | $ | 940,392,802 | ||
|
| |||
Net Assets Consist of: | ||||
Paid-in capital | $ | 973,068,205 | ||
Distributions in excess of net investment income | (973,747 | ) | ||
Accumulated net realized loss on investments | (33,455,190 | ) | ||
Net unrealized appreciation of investments | 2,691,786 | |||
Net unrealized depreciation of future contracts | 292,842 | |||
Net unrealized depreciation of swap contracts | (1,231,094 | ) | ||
|
| |||
Total Net Assets | $ | 940,392,802 | ||
|
| |||
38
Table of Contents
Net Asset Value | ||||
Class A: | ||||
Net assets | $ | 437,803,149 | ||
Shares of beneficial interest outstanding, unlimited authorization, no par | 51,649,819 | |||
Net asset value per share | $ | 8.48 | ||
Sales charge | 2.75 | % | ||
Offering price per share, equal to net asset value per share / (1 – sales charge) | $ | 8.72 | ||
Class C: | ||||
Net assets | $ | 120,010,258 | ||
Shares of beneficial interest outstanding, unlimited authorization, no par | 14,167,244 | |||
Net asset value per share | $ | 8.47 | ||
Class R: | ||||
Net assets | $ | 4,984,275 | ||
Shares of beneficial interest outstanding, unlimited authorization, no par | 587,886 | |||
Net asset value per share | $ | 8.48 | ||
Institutional Class: | ||||
Net assets | $ | 377,595,120 | ||
Shares of beneficial interest outstanding, unlimited authorization, no par | 44,555,460 | |||
Net asset value per share | $ | 8.47 | ||
1 Investments, at cost | $ | 942,632,380 | ||
2 Short-term investments, at cost | 18,290,860 | |||
See accompanying notes, which are an integral part of the financial statements.
39
Table of Contents
| Statement of operations | ||
| Delaware Limited-Term Diversified Income Fund | Year ended December 31, 2016 |
Investment Income: | ||||
Interest | $ | 21,730,872 | ||
Dividends | 19,125 | |||
Foreign tax withheld | (3,438 | ) | ||
|
| |||
| 21,746,559 | ||||
|
| |||
Expenses: | ||||
Management fees | 4,880,395 | |||
Distribution expenses – Class A | 1,094,052 | |||
Distribution expenses – Class C | 1,328,712 | |||
Distribution expenses – Class R | 29,244 | |||
Dividend disbursing and transfer agent fees and expenses | 1,074,552 | |||
Accounting and administration expenses | 321,486 | |||
Reports and statements to shareholders | 91,763 | |||
Registration fees | 78,426 | |||
Legal fees | 75,334 | |||
Custodian fees | 55,100 | |||
Audit and tax | 52,057 | |||
Trustee’s fees and expenses | 49,985 | |||
Other | 73,481 | |||
|
| |||
| 9,204,587 | ||||
Less waived distribution expenses – Class A | (437,621 | ) | ||
Less expenses waived | (126,318 | ) | ||
Less expense paid indirectly | (735 | ) | ||
|
| |||
Total operating expenses | 8,639,913 | |||
|
| |||
Net Investment Income | 13,106,646 | |||
|
| |||
Net Realized and Unrealized Gain (Loss): | ||||
Net realized gain (loss) on: | ||||
Investments | 4,153,003 | |||
Futures contracts | 3,863,907 | |||
Swap contracts | (604,765 | ) | ||
|
| |||
Net realized gain | 7,412,145 | |||
|
| |||
Net change in unrealized appreciation (depreciation) of: | ||||
Investments | 4,398,332 | |||
Futures contracts | 376,462 | |||
Swap contracts | (1,197,974 | ) | ||
|
| |||
Net change in unrealized appreciation (depreciation) | 3,576,820 | |||
|
| |||
Net Realized and Unrealized Gain | 10,988,965 | |||
|
| |||
Net Increase in Net Assets Resulting from Operations | $ | 24,095,611 | ||
|
| |||
See accompanying notes, which are an integral part of the financial statements.
40
Table of Contents
This page intentionally left blank.
Table of Contents
Statements of changes in net assets
Delaware Limited-Term Diversified Income Fund
| Year ended | ||||||||
| 12/31/16 | 12/31/15 | |||||||
Increase (Decrease) in Net Assets from Operations: | ||||||||
Net investment income | $ | 13,106,646 | $ | 14,157,717 | ||||
Net realized gain (loss) | 7,412,145 | (193,633 | ) | |||||
Net change in unrealized appreciation (depreciation) | 3,576,820 | (7,529,011 | ) | |||||
|
|
|
| |||||
Net increase in net assets resulting from operations | 24,095,611 | 6,435,073 | ||||||
|
|
|
| |||||
Dividends and Distributions to Shareholders from: | ||||||||
Net investment income: | ||||||||
Class A | (7,258,655 | ) | (6,931,891 | ) | ||||
Class C | (1,080,963 | ) | (1,084,268 | ) | ||||
Class R | (77,048 | ) | (86,795 | ) | ||||
Institutional Class | (7,716,809 | ) | (8,784,079 | ) | ||||
Return of capital: | ||||||||
Class A | (608,436 | ) | (704,076 | ) | ||||
Class C | (166,890 | ) | (227,301 | ) | ||||
Class R | (6,925 | ) | (10,090 | ) | ||||
Institutional Class | (524,864 | ) | (744,408 | ) | ||||
|
|
|
| |||||
| (17,440,590 | ) | (18,572,908 | ) | |||||
|
|
|
| |||||
Capital Share Transactions: | ||||||||
Proceeds from shares sold: | ||||||||
Class A | 93,552,583 | 84,609,259 | ||||||
Class C | 11,115,741 | 10,048,027 | ||||||
Class R | 1,684,314 | 2,238,721 | ||||||
Institutional Class | 137,699,714 | 225,483,344 | ||||||
42
Table of Contents
| Year ended | ||||||||
| 12/31/16 | 12/31/15 | |||||||
Capital Share Transactions (continued): | ||||||||
Net asset value of shares issued upon reinvestment of dividends and distributions: | ||||||||
Class A | $ | 7,607,393 | $ | 7,395,560 | ||||
Class C | 1,138,578 | 1,197,202 | ||||||
Class R | 83,230 | 96,472 | ||||||
Institutional Class | 6,090,455 | 6,894,310 | ||||||
|
|
|
| |||||
| 258,972,008 | 337,962,895 | |||||||
|
|
|
| |||||
Cost of shares redeemed: | ||||||||
Class A | (105,173,090 | ) | (120,394,983 | ) | ||||
Class C | (34,970,751 | ) | (44,868,826 | ) | ||||
Class R | (3,128,378 | ) | (3,988,140 | ) | ||||
Institutional Class | (233,738,073 | ) | (298,885,305 | ) | ||||
|
|
|
| |||||
| (377,010,292 | ) | (468,137,254 | ) | |||||
|
|
|
| |||||
Decrease in net assets derived from capital share transactions | (118,038,284 | ) | (130,174,359 | ) | ||||
|
|
|
| |||||
Net Decrease in Net Assets | (111,383,263 | ) | (142,312,194 | ) | ||||
Net Assets: | ||||||||
Beginning of year | 1,051,776,065 | 1,194,088,259 | ||||||
|
|
|
| |||||
End of year | $ | 940,392,802 | $ | 1,051,776,065 | ||||
|
|
|
| |||||
Distributions in excess of net investment income | $ | (973,747 | ) | $ | (594,678 | ) | ||
|
|
|
| |||||
See accompanying notes, which are an integral part of the financial statements.
43
Table of Contents
Delaware Limited-Term Diversified Income Fund Class A
Selected data for each share of the Fund outstanding throughout each period were as follows:
Net asset value, beginning of period |
Income (loss) from investment operations: |
Net investment income1 |
Net realized and unrealized gain (loss) |
Total from investment operations. |
Less dividends and distributions from: |
Net investment income |
Return of capital |
Net realized gain |
Total dividends and distributions |
Net asset value, end of period |
Total return2 |
Ratios and supplemental data: |
Net assets, end of period (000 omitted) |
Ratio of expenses to average net assets |
Ratio of expenses to average net assets prior to fees waived |
Ratio of net investment income to average net assets |
Ratio of net investment income to average net assets prior to fees waived |
Portfolio turnover |
| 1 | The average shares outstanding method has been applied for per share information. |
| 2 | Total investment return is based on the change in net asset value of a share during the period and assumes reinvestment of dividends and distributions at net asset value and does not reflect the impact of a sales charge. Total investment return during all of the periods shown reflects waivers by the manager and/or distributor. Performance would have been lower had the waivers not been in effect. |
See accompanying notes, which are an integral part of the financial statements.
44
Table of Contents
| Year ended | ||||||||||||||||||||||||||||
| ||||||||||||||||||||||||||||
| 12/31/16 | 12/31/15 | 12/31/14 | 12/31/13 | 12/31/12 | ||||||||||||||||||||||||
| ||||||||||||||||||||||||||||
| $ | 8.430 | $ | 8.520 | $ | 8.550 | $ | 8.850 | $ | 8.820 | |||||||||||||||||||
| 0.116 | 0.110 | 0.097 | 0.079 | 0.096 | ||||||||||||||||||||||||
| 0.087 | (0.057 | ) | 0.013 | (0.239 | ) | 0.123 | ||||||||||||||||||||||
|
|
|
|
|
|
|
|
|
| |||||||||||||||||||
| 0.203 | 0.053 | 0.110 | (0.160 | ) | 0.219 | |||||||||||||||||||||||
|
|
|
| �� |
|
|
|
|
|
| ||||||||||||||||||
| (0.141 | ) | (0.129 | ) | (0.136 | ) | — | (0.174 | ) | ||||||||||||||||||||
| (0.012 | ) | (0.014 | ) | (0.004 | ) | (0.140 | ) | (0.004 | ) | |||||||||||||||||||
| — | — | — | — | (0.011 | ) | |||||||||||||||||||||||
|
|
|
|
|
|
|
|
|
| |||||||||||||||||||
| (0.153 | ) | (0.143 | ) | (0.140 | ) | (0.140 | ) | (0.189 | ) | |||||||||||||||||||
|
|
|
|
|
|
|
|
|
| |||||||||||||||||||
| $ | 8.480 | $ | 8.430 | $ | 8.520 | $ | 8.550 | $ | 8.850 | |||||||||||||||||||
|
|
|
|
|
|
|
|
|
| |||||||||||||||||||
| 2.42% | 0.62% | 1.28% | (1.81% | ) | 2.49% | |||||||||||||||||||||||
| $ | 437,803 | $ | 439,310 | $ | 472,654 | $ | 780,359 | $ | 1,337,983 | |||||||||||||||||||
| 0.81% | 0.83% | 0.83% | 0.82% | 0.81% | ||||||||||||||||||||||||
| 0.92% | 0.93% | 0.93% | 0.96% | 0.96% | ||||||||||||||||||||||||
| 1.36% | 1.29% | 1.13% | 0.91% | 1.07% | ||||||||||||||||||||||||
| 1.25% | 1.19% | 1.03% | 0.77% | 0.92% | ||||||||||||||||||||||||
| 124% | 94% | 80% | 236% | 262% | ||||||||||||||||||||||||
45
Table of Contents
Financial highlights
Delaware Limited-Term Diversified Income Fund Class C
Selected data for each share of the Fund outstanding throughout each period were as follows:
Net asset value, beginning of period |
Income (loss) from investment operations: |
Net investment income1 |
Net realized and unrealized gain (loss) |
Total from investment operations |
Less dividends and distributions from: |
Net investment income |
Return of capital |
Net realized gain |
Total dividends and distributions |
Net asset value, end of period |
Total return2 |
Ratios and supplemental data: |
Net assets, end of period (000 omitted) |
Ratio of expenses to average net assets |
Ratio of expenses to average net assets prior to fees waived |
Ratio of net investment income to average net assets |
Ratio of net investment income to average net assets prior to fees waived |
Portfolio turnover |
| 1 | The average shares outstanding method has been applied for per share information. |
| 2 | Total investment return is based on the change in net asset value of a share during the period and assumes reinvestment of dividends and distributions at net asset value and does not reflect the impact of a sales charge. Total investment return during some of the periods shown reflects a waiver by the manager. Performance would have been lower had the waiver not been in effect. |
See accompanying notes, which are an integral part of the financial statements.
46
Table of Contents
| Year ended | ||||||||||||||||||||||||||||
| ||||||||||||||||||||||||||||
| 12/31/16 | 12/31/15 | 12/31/14 | 12/31/13 | 12/31/12 | ||||||||||||||||||||||||
| ||||||||||||||||||||||||||||
| $ | 8.420 | $ | 8.520 | $ | 8.540 | $ | 8.850 | $ | 8.820 | |||||||||||||||||||
| 0.043 | 0.038 | 0.024 | 0.005 | 0.020 | ||||||||||||||||||||||||
| 0.088 | (0.067 | ) | 0.023 | (0.248 | ) | 0.123 | ||||||||||||||||||||||
|
|
|
|
|
|
|
|
|
| |||||||||||||||||||
| 0.131 | (0.029 | ) | 0.047 | (0.243 | ) | 0.143 | ||||||||||||||||||||||
|
|
|
|
|
|
|
|
|
| |||||||||||||||||||
| (0.069 | ) | (0.057 | ) | (0.063 | ) | — | (0.098 | ) | ||||||||||||||||||||
| (0.012 | ) | (0.014 | ) | (0.004 | ) | (0.067 | ) | (0.004 | ) | |||||||||||||||||||
| — | — | — | — | (0.011 | ) | |||||||||||||||||||||||
|
|
|
|
|
|
|
|
|
| |||||||||||||||||||
| (0.081 | ) | (0.071 | ) | (0.067 | ) | (0.067 | ) | (0.113 | ) | |||||||||||||||||||
|
|
|
|
|
|
|
|
|
| |||||||||||||||||||
| $ | 8.470 | $ | 8.420 | $ | 8.520 | $ | 8.540 | $ | 8.850 | |||||||||||||||||||
|
|
|
|
|
|
|
|
|
| |||||||||||||||||||
| 1.55% | (0.35% | ) | 0.55% | (2.75% | ) | 1.62% | ||||||||||||||||||||||
| $ | 120,011 | $ | 141,739 | $ | 176,904 | $ | 260,073 | $ | 452,197 | |||||||||||||||||||
| 1.66% | 1.68% | 1.68% | 1.67% | 1.66% | ||||||||||||||||||||||||
| 1.67% | 1.68% | 1.68% | 1.67% | 1.66% | ||||||||||||||||||||||||
| 0.51% | 0.44% | 0.28% | 0.06% | 0.22% | ||||||||||||||||||||||||
| 0.50% | 0.44% | 0.28% | 0.06% | 0.22% | ||||||||||||||||||||||||
| 124% | 94% | 80% | 236% | 262% | ||||||||||||||||||||||||
47
Table of Contents
Financial highlights
Delaware Limited-Term Diversified Income Fund Class R
Selected data for each share of the Fund outstanding throughout each period were as follows:
Net asset value, beginning of period |
Income (loss) from investment operations: |
Net investment income1 |
Net realized and unrealized gain (loss) |
Total from investment operations |
Less dividends and distributions from: |
Net investment income |
Return of capital |
Net realized gain |
Total dividends and distributions |
Net asset value, end of period |
Total return2 |
Ratios and supplemental data: |
Net assets, end of period (000 omitted) |
Ratio of expenses to average net assets |
Ratio of expenses to average net assets prior to fees waived |
Ratio of net investment income to average net assets |
Ratio of net investment income to average net assets prior to fees waived |
Portfolio turnover |
| 1 | The average shares outstanding method has been applied for per share information. |
| 2 | Total investment return is based on the change in net asset value of a share during the period and assumes reinvestment of dividends and distributions at net asset value. Total investment return during some of the periods shown reflects waivers by the manager and/or distributor. Performance would have been lower had the waivers not been in effect. |
See accompanying notes, which are an integral part of the financial statements.
48
Table of Contents
| Year ended | ||||||||||||||||||||||||||||
| ||||||||||||||||||||||||||||
| 12/31/16 | 12/31/15 | 12/31/14 | 12/31/13 | 12/31/12 | ||||||||||||||||||||||||
| ||||||||||||||||||||||||||||
| $ | 8.430 | $ | 8.520 | $ | 8.550 | $ | 8.850 | $ | 8.820 | |||||||||||||||||||
| 0.086 | 0.080 | 0.067 | 0.048 | 0.065 | ||||||||||||||||||||||||
| 0.087 | (0.057 | ) | 0.012 | (0.238 | ) | 0.123 | ||||||||||||||||||||||
|
|
|
|
|
|
|
|
|
| |||||||||||||||||||
| 0.173 | 0.023 | 0.079 | (0.190 | ) | 0.188 | |||||||||||||||||||||||
|
|
|
|
|
|
|
|
|
| |||||||||||||||||||
| (0.111 | ) | (0.099 | ) | (0.105 | ) | — | (0.143 | ) | ||||||||||||||||||||
| (0.012 | ) | (0.014 | ) | (0.004 | ) | (0.110 | ) | (0.004 | ) | |||||||||||||||||||
| — | — | — | — | (0.011 | ) | |||||||||||||||||||||||
|
|
|
|
|
|
|
|
|
| |||||||||||||||||||
| (0.123 | ) | (0.113 | ) | (0.109 | ) | (0.110 | ) | (0.158 | ) | |||||||||||||||||||
|
|
|
|
|
|
|
|
|
| |||||||||||||||||||
| $ | 8.480 | $ | 8.430 | $ | 8.520 | $ | 8.550 | $ | 8.850 | |||||||||||||||||||
|
|
|
|
|
|
|
|
|
| |||||||||||||||||||
| 2.06% | 0.27% | 0.93% | (2.16% | ) | 2.13% | |||||||||||||||||||||||
| $ | 4,984 | $ | 6,298 | $ | 8,022 | $ | 10,672 | $ | 17,243 | |||||||||||||||||||
| 1.16% | 1.18% | 1.18% | 1.17% | 1.16% | ||||||||||||||||||||||||
| 1.17% | 1.18% | 1.18% | 1.25% | 1.26% | ||||||||||||||||||||||||
| 1.01% | 0.94% | 0.78% | 0.56% | 0.72% | ||||||||||||||||||||||||
| 1.00% | 0.94% | 0.78% | 0.48% | 0.62% | ||||||||||||||||||||||||
| 124% | 94% | 80% | 236% | 262% | ||||||||||||||||||||||||
49
Table of Contents
Financial highlights
Delaware Limited-Term Diversified Income Fund Institutional Class
Selected data for each share of the Fund outstanding throughout each period were as follows:
Net asset value, beginning of period |
Income (loss) from investment operations: |
Net investment income1 |
Net realized and unrealized gain (loss) |
Total from investment operations |
Less dividends and distributions from: |
Net investment income |
Return of capital |
Net realized gain |
Total dividends and distributions |
Net asset value, end of period |
Total return2 |
Ratios and supplemental data: |
Net assets, end of period (000 omitted) |
Ratio of expenses to average net assets |
Ratio of expenses to average net assets prior to fees waived |
Ratio of net investment income to average net assets . |
Ratio of net investment income to average net assets prior to fees waived |
Portfolio turnover |
| 1 | The average shares outstanding method has been applied for per share information. |
| 2 | Total investment return is based on the change in net asset value of a share during the period and assumes reinvestment of dividends and distributions at net asset value. Total investment return during some of the periods shown reflects a waiver by the manager. Performance would have been lower had the waiver not been in effect. |
See accompanying notes, which are an integral part of the financial statements.
50
Table of Contents
| Year ended | ||||||||||||||||||||||||||||
| ||||||||||||||||||||||||||||
| 12/31/16 | 12/31/15 | 12/31/14 | 12/31/13 | 12/31/12 | ||||||||||||||||||||||||
| ||||||||||||||||||||||||||||
| $ | 8.430 | $ | 8.520 | $ | 8.550 | $ | 8.850 | $ | 8.820 | |||||||||||||||||||
| 0.129 | 0.123 | 0.110 | 0.092 | 0.109 | ||||||||||||||||||||||||
| 0.077 | (0.057 | ) | 0.012 | (0.239 | ) | 0.123 | ||||||||||||||||||||||
|
|
|
|
|
|
|
|
|
| |||||||||||||||||||
| 0.206 | 0.066 | 0.122 | (0.147 | ) | 0.232 | |||||||||||||||||||||||
|
|
|
|
|
|
|
|
|
| |||||||||||||||||||
| (0.154 | ) | (0.142 | ) | (0.148 | ) | — | (0.187 | ) | ||||||||||||||||||||
| (0.012 | ) | (0.014 | ) | (0.004 | ) | (0.153 | ) | (0.004 | ) | |||||||||||||||||||
| — | — | — | — | (0.011 | ) | |||||||||||||||||||||||
|
|
|
|
|
|
|
|
|
| |||||||||||||||||||
| (0.166 | ) | (0.156 | ) | (0.152 | ) | (0.153 | ) | (0.202 | ) | |||||||||||||||||||
|
|
|
|
|
|
|
|
|
| |||||||||||||||||||
| $ | 8.470 | $ | 8.430 | $ | 8.520 | $ | 8.550 | $ | 8.850 | |||||||||||||||||||
|
|
|
|
|
|
|
|
|
| |||||||||||||||||||
| 2.45% | 0.77% | 1.43% | (1.66% | ) | 2.64% | |||||||||||||||||||||||
| $ | 377,595 | $ | 464,429 | $ | 536,508 | $ | 437,690 | $ | 742,773 | |||||||||||||||||||
| 0.66% | 0.68% | 0.68% | 0.67% | 0.66% | ||||||||||||||||||||||||
| 0.67% | 0.68% | 0.68% | 0.67% | 0.66% | ||||||||||||||||||||||||
| 1.51% | 1.44% | 1.28% | 1.06% | 1.22% | ||||||||||||||||||||||||
| 1.50% | 1.44% | 1.28% | 1.06% | 1.22% | ||||||||||||||||||||||||
| 124% | 94% | 80% | 236% | 262% | ||||||||||||||||||||||||
51
Table of Contents
| Delaware Limited-Term Diversified Income Fund | December 31, 2016 |
Delaware Group® Limited-Term Government Funds (Trust) is organized as a Delaware statutory trust and offers one series: Delaware Limited-Term Diversified Income Fund (Fund). The Trust is an open-end investment company. The Fund is considered diversified under the Investment Company Act of 1940 (1940 Act), as amended, and offers Class A, Class C, Class R, and Institutional Class shares. Class A shares are sold with a maximum front-end sales charge of 2.75%. Class A share purchases of $1,000,000 or more will incur a limited contingent deferred sales charge (CDSC) of 0.75% if redeemed during the first year, provided that Delaware Distributors, L.P. (DDLP) paid a financial advisor a commission on the purchase of those shares. Class C shares are sold with a CDSC of 1.00%, if redeemed during the first 12 months. Class R and Institutional Class shares are not subject to a sales charge and are offered for sale exclusively to certain eligible investors.
The investment objective of the Fund is to seek maximum total return, consistent with reasonable risk.
1. Significant Accounting Policies
The following accounting policies are in accordance with U.S. generally accepted accounting principles (U.S. GAAP) and are consistently followed by the Fund.
Security Valuation – Equity securities, except those traded on the Nasdaq Stock Market LLC (Nasdaq), are valued at the last quoted sales price as of the time of the regular close of the New York Stock Exchange on the valuation date. Equity securities traded on the Nasdaq are valued in accordance with the Nasdaq Official Closing Price, which may not be the last sales price. If, on a particular day, an equity security does not trade, the mean between the bid and ask prices will be used, which approximates fair value. Securities listed on a foreign exchange are normally valued at the last quoted sales price on the valuation date. Debt securities and credit default swap (CDS) contracts are valued based upon valuations provided by an independent pricing service or broker/counterparty and reviewed by management. To the extent current market prices are not available, the pricing service may take into account developments related to the specific security, as well as transactions in comparable securities. U.S. government and agency securities are valued at the mean between the bid and ask prices, which approximates fair value. For asset-backed securities, collateralized mortgage obligations, commercial mortgage securities, and U.S. government agency mortgage securities, pricing vendors utilize matrix pricing which considers prepayment speed; attributes of the collateral; yield or price of bonds of comparable quality, coupon, maturity, and type as well as broker/dealer-supplied prices. Swap prices are derived using daily swap curves and models that incorporate a number of market data factors, such as discounted cash flows, trades, and values of the underlying reference instruments. Foreign currency exchange contracts and foreign cross currency exchange contracts are valued at the mean between the bid and ask prices, which approximates fair value. Interpolated values are derived when the settlement date of the contract is an interim date for which quotations are not available. Futures contracts and options on futures contracts are valued at the daily quoted settlement prices. Exchange-traded options are valued at the last reported sale price or, if no sales are reported, at the mean between the last reported bid and ask prices, which approximates fair value. Generally, other securities and assets for which market quotations are not readily available are valued at fair value as determined in good faith under the direction of the Trust’s Board of Trustees (Board). In determining whether market quotations are readily available or fair valuation will be used, various factors will be taken into consideration, such as market closures or suspension of trading in a security. The Fund may use fair value pricing more
52
Table of Contents
frequently for securities traded primarily in non-U.S. markets because, among other things, most foreign markets close well before the Fund values its securities, generally as of 4:00 p.m. Eastern time. The earlier close of these foreign markets gives rise to the possibility that significant events, including broad market moves, government actions or pronouncements, aftermarket trading, or news events may have occurred in the interim. Whenever such a significant event occurs, the Fund may value foreign securities using fair value prices based on third-party vendor modeling tools (international fair value pricing).
Federal and Foreign Income Taxes – No provision for federal income taxes has been made as the Fund intends to continue to qualify for federal income tax purposes as a regulated investment company under Subchapter M of the Internal Revenue Code of 1986, as amended, and make the requisite distributions to shareholders. The Fund evaluates tax positions taken or expected to be taken in the course of preparing the Fund’s tax returns to determine whether the tax positions are “more-likely-than-not” of being sustained by the applicable tax authority. Tax positions not deemed to meet the “more-likely-than-not” threshold are recorded as a tax benefit or expense in the current year. Management has analyzed the Fund’s tax positions taken for all open federal income tax years (Dec. 31, 2013–Dec. 31, 2016), and has concluded that no provision for federal income tax is required in the Fund’s financial statements. In regard to foreign taxes only, the Fund has open tax years in certain foreign countries in which it invests that may date back to the inception of the Fund.
Class Accounting – Investment income and common expenses are allocated to the various classes of the Fund on the basis of “settled shares” of each class in relation to the net assets of the Fund. Realized and unrealized gain (loss) on investments are allocated to the various classes of the Fund on the basis of daily net assets of each class. Distribution expenses relating to a specific class are charged directly to that class.
Repurchase Agreements – The Fund may purchase certain U.S. government securities subject to the counterparty’s agreement to repurchase them at an agreed upon date and price. The counterparty will be required on a daily basis to maintain the value of the collateral subject to the agreement at not less than the repurchase price (including accrued interest). The agreements are conditioned upon the collateral being deposited under the Federal Reserve book-entry system with the Fund’s custodian or a third party sub-custodian. In the event of default or bankruptcy by the other party to the agreement, retention of the collateral may be subject to legal proceedings. All open repurchase agreements as of the date of this report were entered into on Dec. 30, 2016 and matured on the next business day.
To Be Announced Trades – The Fund may contract to purchase or sell securities for a fixed price at a transaction date beyond the customary settlement period (examples: when issued, delayed delivery, forward commitment, or TBA transactions) consistent with the Fund’s ability to manage its investment portfolio and meet redemption requests. These transactions involve a commitment by the Fund to purchase or deliver securities for a predetermined price or yield with payment and delivery taking place more than three days in the future, or after a period longer than the customary settlement period for that type of security. No interest will be earned by the Fund on such purchases until the securities are delivered or the transaction is completed; however, the market value may change prior to delivery. The Fund posted $528,000 cash collateral due from broker on TBA transactions.
Foreign Currency Transactions – Transactions denominated in foreign currencies are recorded at the prevailing exchange rates on the valuation date in accordance with the Fund’s prospectus. The value of
53
Table of Contents
Notes to financial statements
Delaware Limited-Term Diversified Income Fund
1. Significant Accounting Policies (continued)
all assets and liabilities denominated in foreign currencies is translated daily into U.S. dollars at the exchange rate of such currencies against the U.S. dollar. Transaction gains or losses resulting from changes in exchange rates during the reporting period or upon settlement of the foreign currency transaction are reported in operations for the current period. The Fund generally bifurcates that portion of realized gains and losses on investments in debt securities which is due to changes in foreign exchange rates from that which is due to changes in market prices of debt securities. That portion of gains (losses) attributable to changes in foreign exchange rates is included on the “Statement of operations” under “Net realized gain (loss) on foreign currencies.” The Fund reports certain foreign currency related transactions as components of realized gains (losses) for financial reporting purposes, whereas such components are treated as ordinary income (loss) for federal income tax purposes.
Use of Estimates – The Fund is an investment company, whose financial statements are prepared in conformity with U.S. GAAP. Therefore, the Fund follows the accounting and reporting guidelines for investment companies. The preparation of financial statements in conformity with U.S. GAAP requires management to make estimates and assumptions that affect the fair value of investments, the reported amounts of assets and liabilities and disclosure of contingent assets and liabilities at the date of the financial statements, and the reported amounts of revenues and expenses during the reporting period. Actual results could differ from those estimates and the differences could be material.
Other – Expenses directly attributable to the Fund are charged directly to the Fund. Other expenses common to various funds within the Delaware Investments® Family of Funds are generally allocated among such funds on the basis of average net assets. Management fees and certain other expenses are paid monthly. Security transactions are recorded on the date the securities are purchased or sold (trade date) for financial reporting purposes. Costs used in calculating realized gains and losses on the sale of investment securities are those of the specific securities sold. Dividend income is recorded on the ex-dividend date and interest income is recorded on the accrual basis. Discounts and premiums on debt securities are accreted or amortized to interest income, respectively, over the lives of the respective securities using the effective interest method. Realized gains (losses) on paydowns of asset- and mortgage-backed securities are classified as interest income. The Fund declares dividends daily from net investment income and pays the dividends monthly and declares and pays distributions from net realized gain on investments, if any, annually. The Fund may distribute more frequently, if necessary for tax purposes. Dividends and distributions, if any, are recorded on the ex-dividend date.
The Fund may receive earnings credits from its custodian when positive cash balances are maintained, which may be used to offset custody fees. There were no such earnings credits for the year ended Dec. 31, 2016.
The Fund receives earnings credits from its transfer agent when positive cash balances are maintained, which may be used to offset transfer agent fees. If the amount earned is greater than $1.00, the expense paid under this arrangement is included on the “Statement of operations” under “Dividend disbursing and transfer agent fees and expenses” with the corresponding expense offset shown under “Less expense paid indirectly.” For the year ended Dec. 31, 2016, the Fund earned $735 under this agreement.
54
Table of Contents
2. Investment Management, Administration Agreements, and Other Transactions with Affiliates
In accordance with the terms of its investment management agreement, the Fund pays Delaware Management Company (DMC), a series of Delaware Management Business Trust and the investment manager, an annual fee which is calculated daily at the rate of 0.50% on the first $500 million of average daily net assets of the Fund, 0.475% on the next $500 million, 0.45% on the next $1.5 billion, and 0.425% on average daily net assets in excess of $2.5 billion.
DMC has contractually agreed to waive that portion, if any, of its management fee and reimburse the Fund to the extent necessary to ensure that annual operating expenses (excluding any 12b-1 fees, taxes, interest, short sale and dividend interest expenses, acquired fund fees and expenses, brokerage fees, certain insurance costs, and nonroutine expenses or costs, including, but not limited to, those relating to reorganizations, litigation, conducting shareholder meetings, and liquidations), do not exceed 0.59% of average daily net assets of the Fund. The expense waiver was in effect from Oct. 5, 2016 through Dec. 31, 2016.* Prior to Oct. 5, 2016, the Fund had no management fee waiver. For purposes of these waivers and reimbursements, nonroutine expenses may also include such additional costs and expenses as may be agreed upon from time to time by the Fund’s Board and DMC. These expense waivers and reimbursements apply only to expenses paid directly by the Fund and may only be terminated by agreement of DMC and the Fund.
Delaware Investments Fund Services Company (DIFSC), an affiliate of DMC, provides fund accounting and financial administration oversight services to the Fund. For these services, DIFSC’s fees are calculated based on the aggregate daily net assets of the Delaware Investments® Family of Funds at the following annual rate: 0.0050% of the first $30 billion; 0.0045% of the next $10 billion; 0.0040% of the next $10 billion; and 0.0025% of aggregate average daily net assets in excess of $50 billion. The fees payable to DIFSC under the service agreement described above are allocated among all funds in the Delaware Investments Family of Funds on a relative net asset value basis. For the year ended Dec. 31, 2016, the Fund was charged $47,421 for these services. This amount is included on the “Statement of operations” under “Accounting and administration expenses.”
DIFSC is also the transfer agent and dividend disbursing agent of the Fund. For these services, DIFSC’s fees are calculated based on the aggregate daily net assets of the retail funds within the Delaware Investments Family of Funds at the following annual rate: 0.025% of the first $20 billion; 0.020% of the next $5 billion; 0.015% of the next $5 billion; and 0.013% on average daily net assets in excess of $30 billion. The fees payable to DIFSC under the service agreement described above are allocated among all retail funds in the Delaware Investments Family of Funds on a relative net asset value basis. This amount is included on the “Statement of operations” under “Dividend disbursing and transfer agent fees and expenses.” For the year ended Dec. 31, 2016, the Fund was charged $206,087 for these services. Pursuant to a sub-transfer agency agreement between DIFSC and BNY Mellon Investment Servicing (US) Inc. (BNYMIS), BNYMIS provides certain sub-transfer agency services to the Fund. Sub-transfer agency fees are paid by the Fund and are also included on the “Statement of operations” under “Dividend disbursing and transfer agent fees and expenses.”
Pursuant to a distribution agreement and distribution plan, the Fund pays DDLP, the distributor and an affiliate of DMC, an annual distribution and service fee of 0.25%, 1.00%, and 0.50% of the average daily net assets of the Class A, Class C, and Class R shares, respectively. DDLP has contractually agreed to
55
Table of Contents
Notes to financial statements
Delaware Limited-Term Diversified Income Fund
2. Investment Management, Administration Agreements, and Other Transactions with Affiliates (continued)
waive Class A shares’ 12b-1 fees to 0.15% of average daily net assets from Jan. 1, 2016 through Dec. 31, 2016.** Institutional Class shares pay no distribution and service fees.
As provided in the investment management agreement, the Fund bears a portion of the cost of resources shared with DMC, including the cost of internal personnel of DMC and/or its affiliates that provide legal, tax, and regulatory reporting services to the Fund. For the year ended Dec. 31, 2016, the Fund was charged $20,957 for internal legal, tax, and regulatory reporting services provided by DMC and/or its affiliates’ employees. This amount is included on the “Statement of operations” under “Legal fees.”
For the year ended Dec. 31, 2016, DDLP earned $6,439 for commissions on sales of the Fund’s Class A shares. For the year ended Dec. 31, 2016, DDLP received gross CDSC commissions of $1,022 and $5,246 on redemption of the Fund’s Class A and Class C shares, respectively, and these commissions were entirely used to offset upfront commissions previously paid by DDLP to broker/dealers on sales of those shares.
Trustees’ fees include expenses accrued by the Fund for each Trustee’s retainer and meeting fees. Certain officers of DMC, DIFSC, and DDLP are officers and/or Trustees of the Trust. These officers and Trustees are paid no compensation by the Fund.
Cross trades for the year ended Dec. 31, 2016, were executed by the Fund pursuant to procedures adopted by the Board designed to ensure compliance with Rule 17a-7 under the 1940 Act. Cross trading is the buying or selling of portfolio securities between funds of investment companies, or between a fund of an investment company and another entity, that are or could be considered affiliates by virtue of having a common investment advisor (or affiliated investment advisors), common directors/trustees and/or common officers. At its regularly scheduled meetings, the Board reviews such transactions for compliance with the procedures adopted by the Board. Pursuant to these procedures, for the year ended Dec. 31, 2016, the Fund engaged in securities purchases of $15,784,979 and securities sales of $76,614,731, which resulted in net realized gains of $5,748.
| * | The aggregate contractual waiver period covering this report is from Oct. 5, 2016 through Oct. 5, 2017. |
| ** | The aggregate contractual waiver period covering this report is from April 29, 2015 through May 1, 2017. |
3. Investments
For the year ended Dec. 31, 2016, the Fund made purchases and sales of investment securities other than short-term investments as follows:
Purchases other than U.S. government securities | $ | 1,013,738,987 | ||
Purchases of U.S. government securities | 213,266,496 | |||
Sales other than U.S. government securities | 1,103,121,705 | |||
Sales of U.S. government securities | 246,738,014 |
56
Table of Contents
At Dec. 31, 2016, the cost of investments and unrealized appreciation (depreciation) for federal income tax purposes for the Fund were as follows:
Cost of investments | $ | 965,161,996 | ||
|
| |||
Aggregate unrealized appreciation of investments | $ | 10,787,194 | ||
Aggregate unrealized depreciation of investments | (12,334,164 | ) | ||
|
| |||
Net unrealized depreciation of investments | $ | (1,546,970 | ) | |
|
|
U.S. GAAP defines fair value as the price that the Fund would receive to sell an asset or pay to transfer a liability in an orderly transaction between market participants at the measurement date under current market conditions. A three-level hierarchy for fair value measurements has been established based upon the transparency of inputs to the valuation of an asset or liability. Inputs may be observable or unobservable and refer broadly to the assumptions that market participants would use in pricing the asset or liability. Observable inputs reflect the assumptions market participants would use in pricing the asset or liability based on market data obtained from sources independent of the reporting entity. Unobservable inputs reflect the reporting entity’s own assumptions about the assumptions that market participants would use in pricing the asset or liability based on the best information available under the circumstances. The Fund’s investment in its entirety is assigned a level based upon the observability of the inputs which are significant to the overall valuation. The three-level hierarchy of inputs is summarized below.
| Level 1 – | Inputs are quoted prices in active markets for identical investments. (Examples: equity securities, open-end investment companies, futures contracts, exchange-traded options contracts) | |
| Level 2 – | Other observable inputs, including, but not limited to: quoted prices for similar assets or liabilities in markets that are active, quoted prices for identical or similar assets or liabilities in markets that are not active, inputs other than quoted prices that are observable for the assets or liabilities (such as interest rates, yield curves, volatilities, prepayment speeds, loss severities, credit risks, and default rates), or other market-corroborated inputs. (Examples: debt securities, government securities, swap contracts, foreign currency exchange contracts, foreign securities utilizing international fair value pricing, broker-quoted securities, fair valued securities) | |
| Level 3 – | Significant unobservable inputs, including the Fund’s own assumptions used to determine the fair value of investments. (Examples: broker-quoted securities, fair valued securities) | |
Level 3 investments are valued using significant unobservable inputs. The Fund may also use an income-based valuation approach in which the anticipated future cash flows of the investment are discounted to calculate fair value. Discounts may also be applied due to the nature or duration of any restrictions on the disposition of the investments. Valuations may also be based upon current market prices of securities that are comparable in coupon, rating, maturity, and industry. The derived value of a Level 3 investment may not represent the value which is received upon disposition and this could impact the results of operations.
57
Table of Contents
Notes to financial statements
Delaware Limited-Term Diversified Income Fund
3. Investments (continued)
The following table summarizes the valuation of the Fund’s investments by fair value hierarchy levels as of Dec. 31, 2016:
Securities | Level 1 | Level 2 | Level 3 | Total | ||||||||||||
Agency, Asset- & Mortgage-Backed Securities | $ | — | $ | 459,643,492 | $ | — | $ | 459,643,492 | ||||||||
Corporate Debt | — | 398,259,217 | — | 398,259,217 | ||||||||||||
Foreign Debt | — | 5,127,944 | — | 5,127,944 | ||||||||||||
Senior Secured Loans1 | — | 65,042,402 | 370,388 | 65,412,790 | ||||||||||||
Municipal Bonds | — | 10,964,235 | — | 10,964,235 | ||||||||||||
Preferred Stock | — | 4,903,023 | — | 4,903,023 | ||||||||||||
Short-Term Investments | — | 18,290,879 | — | 18,290,879 | ||||||||||||
U.S. Treasury Obligations | — | 1,013,446 | — | 1,013,446 | ||||||||||||
|
|
|
|
|
|
|
| |||||||||
Total Value of Securities | $ | — | $ | 963,244,638 | $ | 370,388 | $ | 963,615,026 | ||||||||
|
|
|
|
|
|
|
| |||||||||
Futures Contracts | $ | 292,842 | $ | — | $ | — | $ | 292,842 | ||||||||
Swap Contracts | — | (1,111,825 | ) | — | (1,111,825 | ) | ||||||||||
1Security type is valued across multiple levels. Level 2 investments represent investments with observable inputs, or matrix-price investments, and Level 3 investments represent investments without observable inputs. The amounts attributed to Level 2 investments and Level 3 investments represent the following percentages of the total market value of this security type:
Level 2 | Level 3 | Total | ||||||||||
Senior Secured Loans | 99.43 | % | 0.57 | % | 100.00 | % | ||||||
During the year ended Dec. 31, 2016, there were no transfers between Level 1 investments, Level 2 investments, or Level 3 investments that had a significant impact to the Fund. The Fund’s policy is to recognize transfers between levels at the beginning of the reporting period.
A reconciliation of Level 3 investments is presented when the Fund has a significant amount of Level 3 investments at the beginning, interim, or end of the period in relation to net assets. We did not present a reconciliation of Level 3 investments as they were not considered significant to the Fund’s net assets at the beginning, interim, or end of the year.
58
Table of Contents
4. Dividends and Distribution Information
Income and long-term capital gain distributions are determined in accordance with federal income tax regulations, which may differ from U.S. GAAP. Additionally, distributions from net gains on foreign currency transactions and net short-term gains on sales of investment securities are treated as ordinary income for federal income tax purposes. The tax character of dividends and distributions paid during the years ended Dec. 31, 2016 and 2015 was as follows:
| Year ended | ||||||||
| 12/31/16 | 12/31/15 | |||||||
Ordinary income | $16,133,475 | $16,887,033 | ||||||
Return of capital | 1,307,115 | 1,685,875 | ||||||
Total | $17,440,590 | $18,572,908 | ||||||
5. Components of Net Assets on a Tax Basis
As of Dec. 31, 2016, the components of net assets on a tax basis were as follows:
Shares of beneficial interest | $ | 973,068,205 | ||
Capital loss carryforwards | (29,213,768 | ) | ||
Distributions payable | (486,660 | ) | ||
Qualified late year loss deferrals | (1,428,005 | ) | ||
Unrealized depreciation of investments, foreign currencies, and derivatives | (1,546,970 | ) | ||
|
| |||
Net assets | $ | 940,392,802 | ||
|
|
The differences between book basis and tax basis components of net assets are primarily attributable to tax deferral of losses on wash sales, mark-to-market of futures contracts, contingent payment debt instruments, tax treatment of market discount and premium on debt instruments, and CDS contracts.
Qualified late year losses represent losses realized on investment transactions from Nov. 1, 2016 through Dec. 31, 2016 that, in accordance with federal income tax regulations, the Fund has elected to defer and treat as having arisen in the following fiscal year.
For financial reporting purposes, capital accounts are adjusted to reflect the tax character of permanent book/tax differences. Reclassifications are primarily due to tax treatment of CDS contracts, market discount and premium on certain debt instruments and paydowns of asset- and mortgage-backed securities. Results of operations and net assets were not affected by these reclassifications. For the year ended Dec. 31, 2016 the Fund recorded the following reclassifications:
Distributions in excess of net investment income | $ | 2,647,760 | ||
Accumulated net realized loss on investments | (2,647,760 | ) |
For federal income tax purposes, capital loss carryforwards may be carried forward and applied against future capital gains.
In 2016, the Fund utilized $4,707,690 of capital loss carryforwards.
Under the Regulated Investment Company Modernization Act of 2010 (Act), net capital losses recognized for tax years beginning after Dec. 22, 2010 may be carried forward indefinitely, and their character is retained as short-term and/or long-term losses.
59
Table of Contents
Notes to financial statements
Delaware Limited-Term Diversified Income Fund
5. Components of Net Assets on a Tax Basis (continued)
The Fund has capital loss carryforwards available to offset future realized capital gains as follows:
| Loss carryforward character | ||||||||
| Short-term | Long-term | |||||||
| $ | 20,230,789 | $8,982,979 | ||||||
6. Capital Shares | ||||||||
Transactions in capital shares were as follows: | ||||||||
| Year ended | Year ended | |||||||
| 12/31/16 | 12/31/15 | |||||||
Shares sold: | ||||||||
Class A | 10,972,164 | 9,932,817 | ||||||
Class C | 1,306,386 | 1,184,276 | ||||||
Class R | 197,626 | 262,780 | ||||||
Institutional Class | 16,158,550 | 26,442,443 | ||||||
Shares issued upon reinvestment of dividends and distributions: | ||||||||
Class A | 892,174 | 867,778 | ||||||
Class C | 133,629 | 140,521 | ||||||
Class R | 9,760 | 11,311 | ||||||
Institutional Class | 714,443 | 808,812 | ||||||
|
|
|
| |||||
| 30,384,732 | 39,650,738 | |||||||
|
|
|
| |||||
Shares redeemed: | ||||||||
Class A | (12,350,885 | ) | (14,133,571 | ) | ||||
Class C | (4,104,280 | ) | (5,266,290 | ) | ||||
Class R | (366,643 | ) | (468,087 | ) | ||||
Institutional Class | (27,440,485 | ) | (35,099,017 | ) | ||||
|
|
|
| |||||
| (44,262,293 | ) | (54,966,965 | ) | |||||
|
|
|
| |||||
Net decrease | (13,877,561 | ) | (15,316,227 | ) | ||||
|
|
|
| |||||
60
Table of Contents
Certain shareholders may exchange shares of one class for shares of another class in the same Fund.
For the year ended Dec. 31, 2016 exchange transactions were as follows:
| Exchange Redemptions | Exchange Subscriptions | |||||||||
Class A Shares | Class C Shares |
Institutional Class Shares | Class A Shares |
Institutional Class Shares | Value | |||||
101,612 | 2,226 | — | — | 103,942 | $888,028 |
For the year ended Dec. 31, 2015 exchange transactions were as follows:
| Exchange Redemptions | Exchange Subscriptions | |||||||||
Class A Shares | Class C Shares |
Institutional Class Shares | Class A Shares |
Institutional Class Shares | Value | |||||
3,174 | 5,640 | 1,999 | 2,002 | 8,821 | $91,609 |
These exchange transactions are included as subscriptions and redemptions in the table on the previous page and on the “Statements of changes in net assets.”
7. Line of Credit
The Fund, along with certain other funds in the Delaware Investments® Family of Funds (Participants), was a participant in a $155,000,000 revolving line of credit to be used for temporary or emergency purposes as an additional source of liquidity to fund redemptions of investor shares. Under the agreement, the Participants were charged an annual commitment fee of 0.10%, which was allocated across the Participants on the basis of relative net assets of each Participant’s allocation of the entire facility. The Participants were permitted to borrow up to a maximum of one third of their net assets under the agreement. Each Participant is individually, and not jointly, liable for its particular advances, if any, under the line of credit. The line of credit available under the agreement expired on Nov. 7, 2016.
On Nov. 7, 2016, the Fund, along with the other Participants, entered into an amendment to the agreement for a $155,000,000 revolving line of credit. The line of credit is to be used as described above and operates in substantially the same manner as the original agreement, with the exception of the annual commitment fee. Under the amendment to the agreement, the Participants are charged an annual commitment fee of 0.15%, which is allocated across the Participants on the basis of relative net assets of each Participant’s allocation of the entire facility. The line of credit available under the agreement expires on Nov. 6, 2017.
The Fund had no amounts outstanding as of Dec. 31, 2016 or at any time during the year then ended.
8. Derivatives
U.S. GAAP requires disclosures that enable investors to understand: (1) how and why an entity uses derivatives, (2) how they are accounted for, and (3) how they affect an entity’s results of operations and financial position.
Futures Contracts – A futures contract is an agreement in which the writer (or seller) of the contract agrees to deliver to the buyer an amount of cash or securities equal to a specific dollar amount times the
61
Table of Contents
Notes to financial statements
Delaware Limited-Term Diversified Income Fund
8. Derivatives (continued)
difference between the value of a specific security or index at the close of the last trading day of the contract and the price at which the agreement is made. The Fund may use futures in the normal course of pursuing its investment objective. The Fund may invest in futures contracts to hedge its existing portfolio securities against fluctuations in fair value caused by changes in interest rates or market conditions. Upon entering into a futures contract, the Fund deposits cash or pledges U.S. government securities to a broker, equal to the minimum “initial margin” requirements of the exchange on which the contract is traded. Subsequent payments are received from the broker or paid to the broker each day, based on the daily fluctuation in the market value of the contract. These receipts or payments are known as “variation margin” and are recorded daily by the Fund as unrealized gains or losses until the contracts are closed. When the contracts are closed, the Fund records a realized gain or loss equal to the difference between the value of the contract at the time it was opened and the value at the time it was closed. Risks of entering into futures contracts include potential imperfect correlation between the futures contracts and the underlying securities and the possibility of an illiquid secondary market for these instruments. When investing in futures, there is reduced counterparty credit risk to the Fund because futures are exchange-traded and the exchange’s clearinghouse, as counterparty to all exchange-traded futures, guarantees against default. At Dec. 31, 2016, the Fund posted $383,000 cash collateral for open futures contracts, which is presented as “Cash collateral due from broker on futures contracts” on the “Statement of assets and liabilities.”
During the year ended Dec. 31, 2016, the Fund used futures contracts to hedge its existing portfolio securities against fluctuations in value caused by changes in interest rates or market conditions.
Swap Contracts – The Fund may enter into CDS contracts in the normal course of pursuing its investment objective. The Fund may enter into CDS contracts in order to hedge against credit events, to enhance total return, or to gain exposure to certain securities or markets. The Fund will not be permitted to enter into any swap transactions unless, at the time of entering into such transactions, the unsecured long-term debt of the actual counterparty, combined with any credit enhancements, is rated at least BBB- by Standard & Poor’s Financial Services LLC (S&P) or Baa3 by Moody’s Investors Service, Inc. (Moody’s) or is determined to be of equivalent credit quality by DMC.
Credit Default Swaps. A CDS contract is a risk-transfer instrument through which one party (purchaser of protection) transfers to another party (seller of protection) the financial risk of a credit event (as defined in the CDS agreement), as it relates to a particular reference security or basket of securities (such as an index). In exchange for the protection offered by the seller of protection, the purchaser of protection agrees to pay the seller of protection a periodic amount at a stated rate that is applied to the notional amount of the CDS contract. In addition, an upfront payment may be made or received by the Fund in connection with an unwinding or assignment of a CDS contract. Upon the occurrence of a credit event, the seller of protection would pay the par (or other agreed-upon) value of the reference security (or basket of securities) to the counterparty. Credit events generally include, among others, bankruptcy, failure to pay, and obligation default.
62
Table of Contents
During the year ended Dec. 31, 2016, the Fund entered into CDS contracts as a purchaser of protection. Periodic payments (receipts) on such contracts are accrued daily and recorded as unrealized losses (gains) on swap contracts. Upon payment (receipt), such amounts are recorded as realized losses (gains) on swap contracts. Upfront payments made or received in connection with CDS contracts are amortized over the expected life of the CDS contracts as unrealized losses (gains) on swap contracts. The change in value of CDS contracts is recorded daily as unrealized appreciation or depreciation. A realized gain or loss is recorded upon a credit event (as defined in the CDS agreement) or the maturity or termination of the agreement. For the year ended Dec. 31, 2016, the Fund did not enter into any CDS contracts as a seller of protection. Initial margin and variation margin are posted to central counterparties for CDS basket trades, as determined by the applicable central counterparty. At Dec. 31, 2016, the Fund posted $6,681,237 cash collateral for open centrally cleared credit default swap contracts, which is presented as “Cash collateral due from broker on swap contracts” on the “Statement of assets and liabilities.”
CDS contracts may involve greater risks than if the Fund had invested in the reference obligation directly. CDS contracts are subject to general market risk, liquidity risk, counterparty risk, and credit risk. The Fund’s maximum risk of loss from counterparty credit risk, either as the seller of protection or the buyer of protection, is the fair value of the contract. This risk is mitigated by (1) for bilateral swap contracts, having a netting arrangement between the Fund and the counterparty and by the posting of collateral by the counterparty to the Fund to cover the Fund’s exposure to the counterparty or (2) for cleared swaps, trading these instruments through a central counterparty.
During the year ended Dec. 31, 2016, the Fund used CDS contracts to hedge against credit events.
Swaps Generally. The value of open swaps may differ from that which would be realized in the event the Fund terminated its position in the contract on a given day. Risks of entering into these contracts include the potential inability of the counterparty to meet the terms of the contracts. This type of risk is generally limited to the amount of favorable movement in the value of the underlying security, instrument, or basket of instruments, if any, at the day of default. Risks also arise from potential losses from adverse market movements and such losses could exceed the unrealized amounts that would be shown on the “Schedule of investments.”
63
Table of Contents
Notes to financial statements
Delaware Limited-Term Diversified Income Fund
8. Derivatives (continued)
Fair value of derivative instruments as of Dec. 31, 2016 was as follows:
| Statements of Assets and Liabilities Location | Asset Derivatives Fair Value Interest Contracts | ||||
Variation margin payable on futures contracts* | $394,815 | ||||
| Liability Derivatives | |||||||||||||||
| Fair Value | |||||||||||||||
| Statements of Assets and Liabilities Location | Interest Contracts | Credit Contracts | Total | ||||||||||||
Variation margin payable on futures contracts* | $101,973 | $ — | $ 101,973 | ||||||||||||
Unrealized depreciation on credit default swap contracts | — | 1,051,983 | 1,051,983 | ||||||||||||
Variation margin payable on credit default swap contracts | 59,842 | 59,842 | |||||||||||||
Total | $101,973 | $1,111,825 | $1,213,798 | ||||||||||||
*Includes cumulative appreciation (depreciation) of futures contracts from the date the contracts are opened through Dec. 31, 2016. Only current day variation margin is reported on the “Statement of assets and liabilities.”
The effect of derivative instruments on the “Statement of operations” for the year ended Dec. 31, 2016 was as follows:
| Net Realized Gain (Loss) on: | |||||||||||||||
| Futures Contracts |
Swap | Total | |||||||||||||
Interest rate contracts | $3,863,907 | $ — | $3,863,907 | ||||||||||||
Credit contracts | — | (604,765 | ) | (604,765 | ) | ||||||||||
Total
| $3,863,907 | $(604,765 | ) | $3,259,142 | |||||||||||
| Net Change in Unrealized Appreciation (Depreciation) of: | |||||||||||||||
Futures | Swap Contracts | Total | |||||||||||||
Interest rate contracts | $376,462 | $ — | $ 376,462 | ||||||||||||
Credit contracts | — | (1,197,974 | ) | (1,197,974 | ) | ||||||||||
Total | $376,462 | $(1,197,974 | ) | $ (821,512 | ) | ||||||||||
Derivatives Generally. The table below summarizes the average balance of derivative holdings by the Fund during the year ended Dec. 31, 2016.
| Long Derivatives Volume | Short Derivatives Volume | |||||||||||
Futures contracts (average notional value) | USD 8,687,750 | USD 58,352,119 | ||||||||||
CDS contracts (average notional value)* | 40,599,206 | — | ||||||||||
*Long represents buying protection and short represents selling protection.
64
Table of Contents
9. Offsetting
In December 2011, the Financial Accounting Standards Board (FASB) issued guidance that expanded disclosure requirements on the offsetting of certain assets and liabilities. The disclosures are required for investments and derivative financial instruments subject to master netting or similar agreements which are eligible for offset on the “Statement of assets and liabilities” and require an entity to disclose both gross and net information about such investments and transactions in the financial statements. In January 2013, the FASB issued guidance that clarified which investments and transactions are subject to the offsetting disclosure requirements. The scope of the disclosure requirements for offsetting is limited to derivative instruments, repurchase agreements and reverse repurchase agreements, and securities borrowing.
In order to better define its contractual rights and to secure rights that will help the Fund mitigate its counterparty risk, the Fund entered into an International Swaps and Derivatives Association, Inc. Master Agreement (ISDA Master Agreement) or a similar agreement with certain of its derivative contract counterparties. An ISDA Master Agreement is a bilateral agreement between the Fund and a counterparty that governs over-the-counter (OTC) derivatives and foreign exchange contracts and typically contains, among other things, collateral posting items and provisions in the event of a default and/or termination event. Under an ISDA Master Agreement, the Fund may, under certain circumstances, offset with the counterparty certain derivative financial instruments’ payables and/or receivables with collateral held and/or posted and create one single net payment. The provisions of the ISDA Master Agreement typically permit a single net payment in the event of default (close-out), including the bankruptcy or insolvency of the counterparty. However, bankruptcy or insolvency laws of a particular jurisdiction may impose restrictions on or prohibitions against the right of offset in bankruptcy, insolvency, or other events.
For financial reporting purposes, the Fund does not offset derivative assets and derivative liabilities that are subject to netting arrangements on the “Statement of assets and liabilities.”
Master Repurchase Agreements
| Counterparty | Repurchase Agreements | Fair Value of Non-Cash Collateral Received(a) | Cash Collateral Received | Net Collateral Received | Net Exposure(b) | ||||||||||||||||||||
Bank of America Merrill Lynch | $ 5,927,646 | $ (5,927,646 | ) | $— | $ (5,927,646 | ) | $— | ||||||||||||||||||
Bank of Montreal | 6,915,587 | (6,915,587 | ) | — | (6,915,587 | ) | — | ||||||||||||||||||
BNP Paribas | 4,734,767 | (4,734,767 | ) | — | (4,734,767 | ) | — | ||||||||||||||||||
Total | $17,578,000 | $(17,578,000 | ) | $— | $(17,578,000 | ) | $— | ||||||||||||||||||
(a)The value of the related collateral received exceeded the value of the repurchase agreements as of Dec. 31, 2016.
(b)Net exposure represents the receivable (payable) that would be due from (to) the counterparty in the event of default.
10. Securities Lending
The Fund, along with other funds in the Delaware Investments® Family of Funds, may lend its securities pursuant to a security lending agreement (Lending Agreement) with The Bank of New York Mellon (BNY Mellon). At the time a security is loaned, the borrower must post collateral equal to the required
65
Table of Contents
Notes to financial statements
Delaware Limited-Term Diversified Income Fund
10. Securities Lending (continued)
percentage of the market value of the loaned security, including any accrued interest. The required percentage is: (1) 102% with respect to U.S. securities and foreign securities that are denominated and payable in U.S. dollars; and (2) 105% with respect to foreign securities. With respect to each loan, if on any business day the aggregate market value of securities collateral plus cash collateral held is less than the aggregate market value of the securities that are the subject of such loan, the borrower will be notified to provide additional collateral by the end of the following business day, which, together with the collateral already held, will be not less than the applicable initial collateral requirements for such security loan. If the aggregate market value of securities collateral and cash collateral held with respect to a security loan exceeds the applicable initial collateral requirement, upon the request of the borrower, BNY Mellon must return enough collateral to the borrower by the end of the following business day to reduce the value of the remaining collateral to the applicable initial collateral requirement for such security loan. As a result of the foregoing, the value of the collateral held with respect to a loaned security on any particular day may be more or less than the value of the security on loan.
On Dec. 29, 2015, the assets in the Collective Trust were transferred to a series of individual separate accounts, each corresponding to a Fund. The investment guidelines permit each separate account to hold certain securities that would be considered eligible securities for a money market fund. Cash collateral received is generally invested in government securities; certain obligations issued by government sponsored enterprises; repurchase agreements collateralized by U.S. Treasury securities; obligations issued by the central government of any Organization for Economic Cooperation and Development (OECD) country or its agencies, instrumentalities, or establishments; obligations of supranational organizations; commercial paper, notes, bonds, and other debt obligations; certificates of deposit, time deposits, and other bank obligations; and asset-backed securities.
In the event of default or bankruptcy by the lending agent, realization and/or retention of the collateral may be subject to legal proceedings. In the event the borrower fails to return loaned securities and the collateral received is insufficient to cover the value of the loaned securities and provided such collateral shortfall is not the result of investment losses, the lending agent has agreed to pay the amount of the shortfall to the Fund or, at the discretion of the lending agent, replace the loaned securities. The Fund continues to record dividends or interest, as applicable, on the securities loaned and is subject to changes in value of the securities loaned that may occur during the term of the loan. The Fund has the right under the Lending Agreement to recover the securities from the borrower on demand. With respect to security loans collateralized by non-cash collateral, the Fund receives loan premiums paid by the borrower. With respect to security loans collateralized by cash collateral, the earnings from the collateral investments are shared among the Fund, the security lending agent, and the borrower. The Fund records security lending income net of allocations to the security lending agent and the borrower.
The Fund may incur investment losses as a result of investing securities lending collateral. This could occur if an investment in the collateral investment account defaulted or became impaired. Under those circumstances, the value of a Fund’s cash collateral account may be less than the amount the Fund would be required to return to the borrowers of the securities and the Fund would be required to make up for this shortfall.
During the year ended Dec. 31, 2016, the Fund had no securities out on loan.
66
Table of Contents
11. Credit and Market Risk
Some countries in which the Fund may invest require governmental approval for the repatriation of investment income, capital, or the proceeds of sales of securities by foreign investors. In addition, if there is deterioration in a country’s balance of payments or for other reasons, a country may impose temporary restrictions on foreign capital remittances abroad.
The securities exchanges of certain foreign markets are substantially smaller, less liquid, and more volatile than the major securities markets in the United States. Consequently, acquisition and disposition of securities by the Fund may be inhibited. In addition, a significant portion of the aggregate market value of equity securities listed on the major securities exchanges in emerging markets is held by a smaller number of investors. This may limit the number of shares available for acquisition or disposition by the Fund.
The Fund invests a portion of its assets in high-yield fixed income securities, which are securities rated lower than BBB- by S&P and Baa3 by Moody’s, or similarly rated by another nationally recognized statistical rating organization. Investments in these higher yielding securities are generally accompanied by a greater degree of credit risk than higher rated securities. Additionally, lower rated securities may be more susceptible to adverse economic and competitive industry conditions than investment grade securities.
The Fund invests in fixed income securities whose value is derived from an underlying pool of mortgages or consumer loans. The value of these securities is sensitive to changes in economic conditions, including delinquencies and/or defaults, and may be adversely affected by shifts in the market’s perception of the issuers and changes in interest rates. Investors receive principal and interest payments as the underlying mortgages and consumer loans are paid back. Some of these securities are collateralized mortgage obligations (CMOs). CMOs are debt securities issued by U.S. government agencies or by financial institutions and other mortgage lenders, which are collateralized by a pool of mortgages held under an indenture. Prepayment of mortgages may shorten the stated maturity of the obligations and can result in a loss of premium, if any has been paid. Certain of these securities may be stripped (securities which provide only the principal or interest feature of the underlying security). The yield to maturity on an interest-only CMO is extremely sensitive not only to changes in prevailing interest rates, but also to the rate of principal payments (including prepayments) on the related underlying mortgage assets. A rapid rate of principal payments may have a material adverse effect on the Fund’s yield to maturity. If the underlying mortgage assets experience greater than anticipated prepayments of principal, the Fund may fail to fully recoup its initial investment in these securities even if the securities are rated in the highest rating categories.
The Fund invests in certain obligations that may have liquidity protection designed to ensure that the receipt of payments due on the underlying security is timely. Such protection may be provided through guarantees, insurance policies, or letters of credit obtained by the issuer or sponsor through third parties, through various means of structuring the transaction, or through a combination of such approaches. The Fund will not pay any additional fees for such credit support, although the existence of credit support may increase the price of the security.
The Fund invests in bank loans and other securities that may subject it to direct indebtedness risk, the risk that the Fund will not receive payment of principal, interest, and other amounts due in connection
67
Table of Contents
Notes to financial statements
Delaware Limited-Term Diversified Income Fund
11. Credit and Market Risk (continued)
with these investments and will depend primarily on the financial condition of the borrower. Loans that are fully secured offer the Fund more protection than unsecured loans in the event of nonpayment of scheduled interest or principal, although there is no assurance that the liquidation of collateral from a secured loan would satisfy the corporate borrower’s obligation, or that the collateral can be liquidated. Some loans or claims may be in default at the time of purchase. Certain of the loans and the other direct indebtedness acquired by the Fund may involve revolving credit facilities or other standby financing commitments that obligate the Fund to pay additional cash on a certain date or on demand. These commitments may require the Fund to increase its investment in a company at a time when the Fund might not otherwise decide to do so (including at a time when the company’s financial condition makes it unlikely that such amounts will be repaid). To the extent that the Fund is committed to advance additional funds, it will at all times hold and maintain cash or other high-grade debt obligations in an amount sufficient to meet such commitments. As the Fund may be required to rely upon another lending institution to collect and pass on to the Fund amounts payable with respect to the loan and to enforce the Fund’s rights under the loan and other direct indebtedness, an insolvency, bankruptcy, or reorganization of the lending institution may delay or prevent the Fund from receiving such amounts. The highly leveraged nature of many loans may make them especially vulnerable to adverse changes in economic or market conditions. Investments in such loans and other direct indebtedness may involve additional risk to the Fund.
The Fund may invest up to 15% of its net assets in illiquid securities, which may include securities with contractual restrictions on resale, securities exempt from registration under Rule 144A promulgated under the Securities Act of 1933, as amended, and other securities which may not be readily marketable. The relative illiquidity of these securities may impair the Fund from disposing of them in a timely manner and at a fair price when it is necessary or desirable to do so. While maintaining oversight, the Fund’s Board has delegated to DMC the day-to-day functions of determining whether individual securities are liquid for purposes of the Fund’s limitation on investments in illiquid securities. Securities eligible for resale pursuant to Rule 144A, which are determined to be liquid, are not subject to the Fund’s 15% limit on investments in illiquid securities. Rule 144A securities have been identified on the “Schedule of investments.”
12. Contractual Obligations
The Fund enters into contracts in the normal course of business that contain a variety of indemnifications. The Fund’s maximum exposure under these arrangements is unknown. However, the Fund has not had prior claims or losses pursuant to these contracts. Management has reviewed the Fund’s existing contracts and expects the risk of loss to be remote.
13. Recent Accounting Pronouncements
On Oct. 13, 2016, the Securities and Exchange Commission amended existing rules intended to modernize reporting and disclosure of information. These amendments relate to Regulation S-X which sets forth the form and content of financial statements. At this time, management is evaluating the implications of adopting these amendments and their impact on the financial statements and accompanying notes.
68
Table of Contents
14. Subsequent Events
Management has determined that no material events or transactions occurred subsequent to Dec. 31, 2016 that would require recognition or disclosure in the Fund’s financial statements.
69
Table of Contents
registered public accounting firm
To the Board of Trustees of Delaware Group® Limited-Term Government Funds
and Shareholders of Delaware Limited-Term Diversified Income Fund:
In our opinion, the accompanying statement of assets and liabilities, including the schedule of investments, and the related statements of operations and of changes in net assets and the financial highlights present fairly, in all material respects, the financial position of Delaware Limited-Term Diversified Income Fund (constituting Delaware Group Limited-Term Government Funds, hereafter referred to as the “Fund”) as of December 31, 2016, the results of its operations for the year then ended, the changes in its net assets for each of the two years in the period then ended and the financial highlights for each of the five years in the period then ended, in conformity with accounting principles generally accepted in the United States of America. These financial statements and financial highlights (hereafter referred to as “financial statements”) are the responsibility of the Fund’s management. Our responsibility is to express an opinion on these financial statements based on our audits. We conducted our audits of these financial statements in accordance with the standards of the Public Company Accounting Oversight Board (United States). Those standards require that we plan and perform the audit to obtain reasonable assurance about whether the financial statements are free of material misstatement. An audit includes examining, on a test basis, evidence supporting the amounts and disclosures in the financial statements, assessing the accounting principles used and significant estimates made by management, and evaluating the overall financial statement presentation. We believe that our audits, which included confirmation of securities as of December 31, 2016 by correspondence with the custodian and brokers, provide a reasonable basis for our opinion.
PricewaterhouseCoopers LLP
Philadelphia, Pennsylvania
February 16, 2017
70
Table of Contents
Other Fund information (Unaudited)
Delaware Limited-Term Diversified Income Fund
Board consideration of Delaware Limited-Term Diversified Income Fund’s investment advisory agreement
At a meeting held on Aug. 16–18, 2016 (the “Annual Meeting”), the Board of Trustees (the “Board”), including a majority of disinterested or independent Trustees, approved the renewal of the Investment Advisory Agreement for Delaware Limited-Term Diversified Income Fund (the “Fund”). In making its decision, the Board considered information furnished at regular quarterly Board meetings, including reports detailing Fund performance, investment strategies, and expenses, as well as information prepared specifically in connection with the renewal of the investment advisory and sub-advisory contracts. Information furnished specifically in connection with the renewal of the Investment Management Agreement with Delaware Management Company (“DMC”) included materials provided by DMC and its affiliates (“Delaware Investments”) concerning, among other things, the nature, extent, and quality of services provided to the Fund; the costs of such services to the Fund; economies of scale; and the investment manager’s financial condition and profitability. In addition, in connection with the Annual Meeting, reports were provided to the Trustees in May 2016 and included reports provided by Broadridge Financial Solutions (“Broadridge”). The Broadridge reports compared the Fund’s investment performance and expenses with those of other comparable mutual funds. The Independent Trustees reviewed and discussed the Broadridge reports with independent legal counsel to the Independent Trustees. In addition to the information noted above, the Board also requested and received information regarding DMC’s policy with respect to advisory fee levels and its breakpoint philosophy; the structure of portfolio manager compensation; comparative client fee information; and any constraints or limitations on the availability of securities for certain investment styles, which had in the past year inhibited, or which were likely in the future to inhibit, the investment manager’s ability to invest fully in accordance with Fund policies.
In considering information relating to the approval of the Fund’s advisory agreement, the Independent Trustees received assistance and advice from and met separately with independent legal counsel to the Independent Trustees. Although the Board gave attention to all information furnished, the following discussion identifies, under separate headings, the primary factors taken into account by the Board during its contract renewal considerations.
Nature, extent, and quality of service. The Board considered the services provided by DMC to the Fund and its shareholders. In reviewing the nature, extent, and quality of services, the Board considered reports furnished to it throughout the year, which covered matters such as the relative performance of the Fund; compliance of portfolio managers with the investment policies, strategies, and restrictions for the Fund; compliance by DMC and Delaware Distributors, L.P. (together, “Management”) personnel with the Code of Ethics adopted throughout the Delaware Investments® Family of Funds complex; and adherence to fair value pricing procedures as established by the Board. The Board was pleased with the current staffing of the Fund’s investment advisor and the emphasis placed on research in the investment process. The Board recognized DMC’s receipt of several industry distinctions during the past several years. The Board gave favorable consideration to DMC’s efforts to control expenditures while maintaining service levels committed to Fund matters. The Board also noted the benefits provided to Fund shareholders through each shareholder’s ability to exchange an investment in one Delaware Investments fund for the same class of shares in another Delaware Investments fund without a sales charge, to reinvest Fund dividends into additional shares of the Fund or into additional shares of other
71
Table of Contents
Other Fund information (Unaudited)
Delaware Limited-Term Diversified Income Fund
Board consideration of Delaware Limited-Term Diversified Income Fund’s investment advisory agreement (continued)
Delaware Investments funds and the privilege to combine holdings in other Delaware Investments funds to obtain a reduced sales charge. The Board was satisfied with the nature, extent, and quality of the overall services provided by DMC.
Investment performance. The Board placed significant emphasis on the investment performance of the Fund in view of the importance of investment performance to shareholders. Although the Board gave appropriate consideration to performance reports and discussions with portfolio managers at Investment Committee meetings throughout the year, the Board gave particular weight to the Broadridge reports furnished for the Annual Meeting. The Broadridge reports prepared for the Fund showed the investment performance of its Class A shares in comparison to a group of similar funds as selected by Broadridge (the “Performance Universe”). A fund with the best performance ranked first, and a fund with the poorest performance ranked last. The highest/best performing 25% of funds in the Performance Universe make up the first quartile; the next 25%, the second quartile; the next 25%, the third quartile; and the poorest/ worst performing 25% of funds in the Performance Universe make up the fourth quartile. Comparative annualized performance for the Fund was shown for the past 1-, 3-, 5-, and 10-year periods, to the extent applicable, ended Jan. 31, 2016. The Board’s objective is that the Fund’s performance for the periods considered be at or above the median of its Performance Universe.
The Performance Universe for the Fund consisted of the Fund and all retail and institutional short-intermediate investment grade debt funds as selected by Broadridge. The Broadridge report comparison showed that the Fund’s total return for the 1-year period was in the second quartile of its Performance Universe. The report further showed that the Fund’s total return for the 3- and 10-year periods was in the third quartile of its Performance Universe and the Fund’s total return for the 5-year period was in the fourth quartile of its Performance Universe. The Board observed that the Fund’s intermediate- and long-term performance was not in line with the Board’s objective. In evaluating the Fund’s performance, the Board considered the Fund’s short-term performance results, which were strong, and consequently, the Board was satisfied with performance.
Comparative expenses. The Board considered expense comparison data for the Delaware Investments® Family of Funds. Management provided the Board with information on pricing levels and fee structures for the Fund as of its most recently completed fiscal year. The Board also focused on the comparative analysis of effective management fees and total expense ratios of the Fund versus effective management fees and expense ratios of a group of similar funds as selected by Broadridge (the “Expense Group”). In reviewing comparative costs, the Fund’s contractual management fee and the actual management fee incurred by the Fund were compared with the contractual management fees (assuming all funds in the Expense Group were similar in size to the Fund) and actual management fees (as reported by each fund) within the Expense Group, taking into account any applicable breakpoints and fee waivers. The Fund’s total expenses were also compared with those of its Expense Group. The Broadridge total expenses, for comparative consistency, were shown by Broadridge for Class A shares and comparative total expenses including 12b-1 and non-12b-1 service fees. The Board’s objective is to limit the Fund’s total expense ratio to be competitive with that of the Expense Group.
72
Table of Contents
The expense comparisons for the Fund showed that its actual management fee was in the quartile with the highest expenses of its Expense Group and its total expenses were in the quartile with the second lowest expenses of its Expense Group. The Board was satisfied with the total expenses of the Fund in comparison to those of its Expense Group as shown in the Broadridge report.
Management profitability. The Board considered the level of profits realized by DMC in connection with the operation of the Fund. In this respect, the Board reviewed the Investment Management Profitability Analysis that addressed the overall profitability of DMC’s business in providing management and other services to each of the individual funds and the Delaware Investments® Family of Funds as a whole. Specific attention was given to the methodology followed in allocating costs for the purpose of determining profitability. Management stated that the level of profits of DMC, to a certain extent, reflects recent operational cost savings and efficiencies initiated by DMC. The Board considered DMC’s efforts to improve services provided to fund shareholders and to meet additional regulatory and compliance requirements resulting from recent industry-wide Securities and Exchange Commission initiatives. The Board also considered the extent to which DMC might derive ancillary benefits from fund operations, including the potential for procuring additional business as a result of the prestige and visibility associated with its role as service provider to the Delaware Investments Family of Funds and the benefits from allocation of fund brokerage to improve trading efficiencies. The Board found that the management fees were reasonable in light of the services rendered and the level of profitability of DMC.
Economies of scale. The Trustees considered whether economies of scale are realized by DMC as the Fund’s assets increase and the extent to which any economies of scale are reflected in the level of management fees charged. The Trustees reviewed the standardized advisory fee pricing and structure, approved by the Board and shareholders, which includes breakpoints, and which applies to most funds in the Delaware Investments Family of Funds complex. Breakpoints in the advisory fee occur when the advisory fee rate is reduced on assets in excess of specified levels. Breakpoints result in a lower advisory fee than would otherwise be the case in the absence of breakpoints, when the asset levels specified in the breakpoints are exceeded. The Board noted that the fee under the Fund’s management contract fell within the standardized fee pricing structure. The Board also noted that, as of May 31, 2016, the Fund’s assets exceeded the second breakpoint level. The Board believed that, given the extent to which economies of scale might be realized by the advisor and its affiliates, the schedule of fees under the Investment Management Agreement provides a sharing of benefits with the Fund and its shareholders.
73
Table of Contents
Other Fund information (Unaudited)
Delaware Limited-Term Diversified Income Fund
Tax Information
All disclosures are based on financial information available as of the date of this annual report and, accordingly are subject to change. For any and all items requiring reporting, it is the intention of the Fund to report the maximum amount permitted under the Internal Revenue Code and the regulations thereunder.
For the year ended Dec. 31, 2016, the Fund reports distributions paid during the year as follows:
(A) Ordinary Income Distribution (Tax Basis) | 92.51 | % | ||
(B) Return of Capital (Tax-Basis) | 7.49 | % | ||
Total Distributions (Tax Basis) | 100.00 | % |
(A) and (B) are based on a percentage of the Fund’s total distributions.
74
Table of Contents
This page intentionally left blank.
Table of Contents
Board of trustees / directors and officers addendum
Delaware Investments® Family of Funds
A mutual fund is governed by a Board of Trustees/Directors (“Trustees”), which has oversight responsibility for the management of a fund’s business affairs. Trustees establish procedures and oversee and review the performance of the investment manager, the distributor, and others who perform services for the fund. The independent fund trustees, in particular, are advocates p>
Name, Address, and Birth Date | Position(s) Held with Fund(s) | Length of Time Served | ||
Interested Trustee | ||||
Shawn K. Lytle1,3 2005 Market Street Philadelphia, PA 19103 | President, Chief Executive Officer, and Trustee | Trustee since September 2015 | ||
February 1970 | President and Chief Executive Officer since August 2015 | |||
Independent Trustees | ||||
Thomas L. Bennett 2005 Market Street Philadelphia, PA 19103 | Chairman and Trustee | Trustee since March 2005 | ||
October 1947 | Chairman since March 2015 | |||
Ann D. Borowiec | Trustee | Since March 2015 | ||
2005 Market Street | ||||
Philadelphia, PA 19103 | ||||
November 1958 | ||||
Joseph W. Chow | Trustee | Since January 2013 | ||
2005 Market Street | ||||
Philadelphia, PA 19103 | ||||
January 1953 | ||||
| 1 | Shawn K. Lytle is considered to be an “Interested Trustee” because he is an executive officer of the Fund’s(s’) investment advisor. |
76
Table of Contents
for shareholder interests. Each trustee has served in that capacity since he or she was elected to or appointed to the Board of Trustees, and will continue to serve until his or her retirement or the election of a new trustee in his or her place. The following is a list of the Trustees and Officers with certain background and related information.
Principal Occupation(s) During the Past Five Years | Number of Portfolios in Fund Complex Overseen by Trustee or Officer | Other Directorships Held by Trustee or Officer | ||
| ||||
Shawn K. Lytle has served as | 62 | Trustee — UBS | ||
President of | Relationship Funds, | |||
Delaware Investments2 | SMA Relationship | |||
since June 2015 and was the | Trust, and UBS Funds | |||
Regional Head of Americas for | (May 2010–April 2015) | |||
UBS Global Asset | ||||
Management from | ||||
2010 through 2015. | ||||
| ||||
Private Investor | 62 | None | ||
(March 2004–Present) | ||||
Chief Executive Officer | 62 | Director — | ||
Private Wealth Management | Banco Santander International | |||
(2011–2013) and | ||||
Market Manager, | Director — | |||
New Jersey Private | Santander Bank, N.A. | |||
Bank (2005–2011) — | ||||
J.P. Morgan Chase & Co.
| ||||
Executive Vice President | 62 | Director and Audit Committee | ||
(Emerging Economies | Member — Hercules | |||
Strategies, Risks, and | Technology Growth | |||
Corporate Administration) | Capital, Inc. | |||
State Street Corporation | (2004–2014) | |||
(July 2004–March 2011) | ||||
| 2 | Delaware Investments is the marketing name for Delaware Management Holdings, Inc. and its subsidiaries, including the Fund’s(s’) investment advisor, principal underwriter, and its transfer agent. |
77
Table of Contents
Board of trustees / directors and officers addendum
Delaware Investments® Family of Funds
Name, Address, and Birth Date | Position(s) Held with Fund(s) | Length of Time Served | ||
Independent Trustees (continued) | ||||
John A. Fry | Trustee | Since January 2001 | ||
2005 Market Street | ||||
Philadelphia, PA 19103 | ||||
May 1960 | ||||
Lucinda S. Landreth | Trustee | Since March 2005 | ||
2005 Market Street | ||||
Philadelphia, PA 19103 | ||||
June 1947
| ||||
Frances A. Sevilla-Sacasa | Trustee | Since September 2011 | ||
2005 Market Street | ||||
Philadelphia, PA 19103 | ||||
January 1956 | ||||
78
Table of Contents
Principal Occupation(s) During the Past Five Years | Number of Portfolios in Fund Complex Overseen by Trustee or Officer | Other Directorships Held by Trustee or Officer | ||
| ||||
President — | 62 | Director, Audit | ||
Drexel University | and Governance Committee | |||
(August 2010–Present) | Member — Community | |||
| Health Systems | ||||
President — | ||||
Franklin & Marshall College | Director — Drexel | |||
(July 2002–July 2010) | Morgan & Co. | |||
| Director, Audit Committee | ||||
| Member — vTv | ||||
| Therapeutics LLC | ||||
Private Investor | 62 | None | ||
(2004–Present) | ||||
Chief Executive Officer — | 62 | Trust Manager and | ||
Banco Itaú | Audit Committee | |||
International | Member — Camden | |||
(April 2012–December 2016) | Property Trust | |||
Executive Advisor to Dean | ||||
(August 2011–March 2012) and Interim Dean | ||||
(January 2011–July 2011) — | ||||
University of Miami School of | ||||
Business Administration | ||||
President — U.S. Trust, | ||||
Bank of America Private | ||||
Wealth Management | ||||
(Private Banking) | ||||
(July 2007–December 2008)
|
79
Table of Contents
Board of trustees / directors and officers addendum
Delaware Investments® Family of Funds
Name, Address, and Birth Date | Position(s) Held with Fund(s) | Length of Time Served | ||
Independent Trustees (continued) | ||||
Thomas K. Whitford | Trustee | Since January 2013 | ||
2005 Market Street | ||||
Philadelphia, PA 19103 | ||||
March 1956 | ||||
Janet L. Yeomans | Trustee | Since April 1999 | ||
2005 Market Street | ||||
Philadelphia, PA 19103 | ||||
July 1948 | ||||
Officers | ||||
David F. Connor | Senior Vice President, | Senior Vice President | ||
2005 Market Street | General Counsel, | since May 2013; | ||
Philadelphia, PA 19103 | and Secretary | General Counsel | ||
December 1963 | since May 2015; | |||
| Secretary since | ||||
| October 2005 | ||||
Daniel V. Geatens | Vice President | Treasurer since October 2007 | ||
2005 Market Street | and Treasurer | |||
Philadelphia, PA 19103 | ||||
October 1972 | ||||
Richard Salus | Senior Vice President | Chief Financial Officer | ||
2005 Market Street | and Chief Financial Officer | since November 2006 | ||
Philadelphia, PA 19103 | ||||
October 1963 | ||||
The Statement of Additional Information for the Fund(s) includes additional information about the Trustees and Officers and is available, without charge, upon request by calling 800 523-1918.
80
Table of Contents
Principal Occupation(s) During the Past Five Years | Number of Portfolios in Fund Complex Overseen by Trustee or Officer | Other Directorships Held by Trustee or Officer | ||
| ||||
Vice Chairman | 62 | Director — HSBC Finance | ||
(2010–April 2013) — | Corporation and HSBC | |||
PNC Financial | North America Holdings Inc. | |||
Services Group | ||||
| Director — | ||||
HSBC Bank
| ||||
Vice President and Treasurer | 62 | Director, Personnel and | ||
(January 2006–July 2012), | Compensation Committee | |||
Vice President — | Chair, and Audit Committee | |||
Mergers & Acquisitions | Member — Okabena Company | |||
(January 2003–January 2006), and Vice President and Treasurer | ||||
(July 1995–January 2003) — | ||||
3M Company
| ||||
| ||||
David F. Connor has served | 62 | None3 | ||
in various capacities at different times at | ||||
Delaware Investments. | ||||
Daniel V. Geatens has served | 62 | None3 | ||
in various capacities at different times at | ||||
Delaware Investments. | ||||
Richard Salus has served | 62 | None3 | ||
in various capacities at different times at | ||||
Delaware Investments. | ||||
| 3 | Shawn K. Lytle, David F. Connor, Daniel V. Geatens, and Richard Salus serve in similar capacities for the six portfolios of the Optimum Fund Trust, which have the same investment advisor, principal underwriter, and transfer agent as the registrant. |
81
Table of Contents
This page intentionally left blank.
Table of Contents
| Board of trustees | ||||||||
| Shawn K. Lytle | Ann D. Borowiec | John A. Fry | Frances A. | |||||
President and Chief Executive Officer Delaware Investments® Family of Funds Philadelphia, PA
Thomas L. Bennett Chairman of the Board Delaware Investments Family of Funds Private Investor Rosemont, PA | Former Chief Executive Officer Private Wealth Management J.P. Morgan Chase & Co. New York, NY
Joseph W. Chow Former Executive Vice President State Street Corporation Boston, MA | President Drexel University Philadelphia, PA
Lucinda S. Landreth Former Chief Investment Officer Assurant, Inc. New York, NY | Sevilla-Sacasa Chief Executive Officer Banco Itaú International Miami, FL
Thomas K. Whitford Former Vice Chairman PNC Financial Services Group Pittsburgh, PA
Janet L. Yeomans Former Vice President and Treasurer 3M Company St. Paul, MN
| |||||
| Affiliated officers | ||||||||
David F. Connor |
Daniel V. Geatens |
Richard Salus | ||||||
Senior Vice President, General Counsel, and Secretary Delaware Investments Family of Funds Philadelphia, PA | Vice President and Treasurer Delaware Investments Family of Funds Philadelphia, PA | Senior Vice President and Chief Financial Officer Delaware Investments Family of Funds Philadelphia, PA | ||||||
This annual report is for the information of Delaware Limited-Term Diversified Income Fund shareholders, but it may be used with prospective investors when preceded or accompanied by the Delaware Investments Fund fact sheet for the most recently completed calendar quarter. These documents are available at delawareinvestments.com/literature.
Delaware Investments is the marketing name of Delaware Management Holdings, Inc. and its subsidiaries.
The Fund files its complete schedule of portfolio holdings with the Securities and Exchange Commission (SEC) for the first and third quarters of each fiscal year on Form N-Q. The Fund’s Forms N-Q, as well as a description of the policies and procedures that the Fund uses to determine how to vote proxies (if any) relating to portfolio securities are available without charge (i) upon request, by calling 800 523-1918; and (ii) on the SEC’s website at sec.gov. In addition, a description of the policies and procedures that the Fund uses to determine how to vote proxies (if any) relating to portfolio securities and the Schedules of Investments included in the Fund’s most recent Form N-Q are available without charge on the Fund’s website at delawareinvestments.com/literature. The Fund’s Forms N-Q may be reviewed and copied at the SEC’s Public Reference Room in Washington, D.C.; information on the operation of the Public Reference Room may be obtained by calling 800 SEC- 0330.
Information (if any) regarding how the Fund voted proxies relating to portfolio securities during the most recently disclosed 12-month period ended June 30 is available without charge (i) through the Fund’s website at delawareinvestments.com/proxy; and (ii) on the SEC’s website at sec.gov.
83
Item 2. Code of Ethics
The registrant has adopted a code of ethics that applies to the registrant’s principal executive officer, principal financial officer, principal accounting officer or controller, or persons performing similar functions, regardless of whether these individuals are employed by the registrant or a third party. A copy of the registrant’s Code of Business Ethics has been posted on the Delaware Investments Internet Web site at www.delawareinvestments.com. Any amendments to the Code of Business Ethics, and information on any waiver from its provisions granted by the registrant, will also be posted on this Web site within five business days of such amendment or waiver and will remain on the Web site for at least 12 months.
Item 3. Audit Committee Financial Expert
The registrant’s Board of Trustees/Directors has determined that certain members of the registrant’s Audit Committee are audit committee financial experts, as defined below. For purposes of this item, an “audit committee financial expert” is a person who has the following attributes:
a. An understanding of generally accepted accounting principles and financial statements;
b. The ability to assess the general application of such principles in connection with the accounting for estimates, accruals, and reserves;
c. Experience preparing, auditing, analyzing, or evaluating financial statements that present a breadth and level of complexity of accounting issues that are generally comparable to the breadth and complexity of issues that can reasonably be expected to be raised by the registrant’s financial statements, or experience actively supervising one or more persons engaged in such activities;
d. An understanding of internal controls and procedures for financial reporting; and
e. An understanding of audit committee functions.
An “audit committee financial expert” shall have acquired such attributes through:
a. Education and experience as a principal financial officer, principal accounting officer, controller, public accountant, or auditor or experience in one or more positions that involve the performance of similar functions;
b. Experience actively supervising a principal financial officer, principal accounting officer, controller, public accountant, auditor, or person performing similar functions;
c. Experience overseeing or assessing the performance of companies or public accountants with respect to the preparation, auditing, or evaluation of financial statements; or
d. Other relevant experience.
The registrant’s Board of Trustees/Directors has also determined that each member of the registrant’s Audit Committee is independent. In order to be “independent” for purposes of this item, the Audit Committee member may not: (i) other than in his or her capacity as a member of the Board of Trustees/Directors or any committee thereof, accept directly or indirectly any consulting, advisory or other compensatory fee from the issuer; or (ii) be an “interested person” of the registrant as defined in Section 2(a)(19) of the Investment Company Act of 1940.
The names of the audit committee financial experts on the registrant’s Audit Committee are set forth below:
Ann D. Borowiec
Joseph W. Chow
Lucinda S. Landreth1
Item 4. Principal Accountant Fees and Services
(a) Audit fees.
PricewaterhouseCoopers LLP (“PwC”), the Independent Accountant to the series portfolios of Delaware Group Limited-Term Government Funds (“Fund”), has advised the Audit Committee of the Board of Trustees of the Funds (“Audit Committee”) that, as of the date of the filing of this Annual Report on Form N-CSR, it is in discussions with the staff of the Securities and Exchange Commission (“SEC Staff”), or the SEC, regarding the interpretation and application of Rule 2-01(c)(1)(ii)(A) of Regulation S-X, or the Loan Rule.
The Loan Rule prohibits accounting firms, such as PwC, from having certain financial relationships with their audit clients and affiliated entities. Specifically, the Loan Rule provides, in relevant part, that an accounting firm generally would not be independent if it receives a loan from a lender that is a “record or beneficial owner of more than ten percent of the audit client’s equity securities.” Under the SEC Staff’s interpretation of the Loan Rule, based on information provided to us by PwC, some of PwC’s relationships with its lenders who also own shares of one or more funds within the Delaware Investments Family of Funds investment company complex implicate the Loan Rule, calling into question PwC’s independence with respect to the Fund. PwC believes that, in light of the facts of these lending relationships, its ability to exercise objective judgment with respect to the audit of the Fund has not been impaired.
The Audit Committee has considered the lending relationships described by PwC and has concluded that (1) the lending relationships did not affect PwC’s application of objective judgment in conducting its audits and issuing reports on the Fund’s financial statements; and (2) a reasonable investor with knowledge of the lending relationships described by PwC would reach the same conclusion. In making this determination, the Audit Committee considered, among other things, PwC’s description of the relevant lending relationships and PwC’s representation that its objectivity was not impaired in conducting its audit of the Fund’s financial statements. In connection with this determination, PwC advised the Audit Committee that it believes PwC is independent and it continues to have discussions with the SEC Staff.
If the SEC were ultimately to determine that PwC was not independent with respect to the Fund for certain time periods, the Fund’s filings with the SEC that contain the Fund’s financial statements for such periods would be non-compliant with the applicable securities laws. If the SEC determines that PwC was not independent, among other things, the Fund could be required to have independent audits conducted on the Fund’s previously audited financial statements by another registered public accounting firm for the affected periods. The time involved to conduct such independent audits may impair the Fund’s ability to issue shares. Any of the foregoing possible outcomes potentially could have a material adverse effect on the Fund.
1 The instructions to Form N-CSR require disclosure on the relevant experience of persons who qualify as audit committee financial experts based on “other relevant experience.” The Board of Trustees/Directors has determined that Ms. Landreth qualifies as an audit committee financial expert by virtue of her experience as a financial analyst, her Chartered Financial Analyst (CFA) designation, and her service as an audit committee chairperson for a non-profit organization.
The aggregate fees billed for services provided to the registrant by its independent auditors for the audit of the registrant’s annual financial statements and for services normally provided by the independent auditors in connection with statutory and regulatory filings or engagements were $45,575 for the fiscal year ended December 31, 2016.
The aggregate fees billed for services provided to the registrant by its independent auditors for the audit of the registrant’s annual financial statements and for services normally provided by the independent auditors in connection with statutory and regulatory filings or engagements were $43,835 for the fiscal year ended December 31, 2015.
(b) Audit-related fees.
The aggregate fees billed by the registrant’s independent auditors for services relating to the performance of the audit of the registrant’s financial statements and not reported under paragraph (a) of this Item were $0 for the fiscal year ended December 31, 2016.
The aggregate fees billed by the registrant’s independent auditors for services relating to the performance of the audit of the financial statements of the registrant’s investment adviser and other service providers under common control with the adviser and that relate directly to the operations or financial reporting of the registrant were $667,000 for the registrant’s fiscal year ended December 31, 2016. The percentage of these fees relating to services approved by the registrant’s Audit Committee pursuant to the de minimis exception from the pre-approval requirement in Rule 2-01(c)(7)(i)(C) of Regulation S-X was 0%. These audit-related services were as follows: year-end audit procedures; group reporting and subsidiary statutory audits.
The aggregate fees billed by the registrant’s independent auditors for services relating to the performance of the audit of the registrant’s financial statements and not reported under paragraph (a) of this Item were $0 for the fiscal year ended December 31, 2015.
The aggregate fees billed by the registrant’s independent auditors for services relating to the performance of the audit of the financial statements of the registrant’s investment adviser and other service providers under common control with the adviser and that relate directly to the operations or financial reporting of the registrant were $612,000 for the registrant’s fiscal year ended December 31, 2015. The percentage of these fees relating to services approved by the registrant’s Audit Committee pursuant to the de minimis exception from the pre-approval requirement in Rule 2-01(c)(7)(i)(C) of Regulation S-X was 0%. These audit-related services were as follows: year-end audit procedures; group reporting and subsidiary statutory audits.
(c) Tax fees.
The aggregate fees billed by the registrant’s independent auditors for tax-related services provided to the registrant were $5,558 for the fiscal year ended December 31, 2016. The percentage of these fees relating to services approved by the registrant’s Audit Committee pursuant to the de minimis exception from the pre-approval requirement in Rule 2-01(c)(7)(i)(C) of Regulation S-X was 0%. These tax-related services were as follows: review of income tax returns and review of annual excise distribution calculations.
The aggregate fees billed by the registrant’s independent auditors for tax-related services provided to the registrant’s investment adviser and other service providers under common control with the adviser and that relate directly to the operations or financial reporting of the registrant were $0 for the registrant’s fiscal year ended December 31, 2016.
The aggregate fees billed by the registrant’s independent auditors for tax-related services provided to the registrant were $5,558 for the fiscal year ended December 31, 2015. The percentage of these fees relating to services approved by the registrant’s Audit Committee pursuant to the de minimis exception from the pre-approval requirement in Rule 2-01(c)(7)(i)(C) of Regulation S-X was 0%. These tax-related services were as follows: review of income tax returns and review of annual excise distribution calculations.
The aggregate fees billed by the registrant’s independent auditors for tax-related services provided to the registrant’s investment adviser and other service providers under common control with the adviser and that relate directly to the operations or financial reporting of the registrant were $0 for the registrant’s fiscal year ended December 31, 2015.
(d) All other fees.
The aggregate fees billed for all services provided by the independent auditors to the registrant other than those set forth in paragraphs (a), (b) and (c) of this Item were $0 for the fiscal year ended December 31, 2016.
The aggregate fees billed for all services other than those set forth in paragraphs (b) and (c) of this Item provided by the registrant’s independent auditors to the registrant’s adviser and other service providers under common control with the adviser and that relate directly to the operations or financial reporting of the registrant were $0 for the registrant’s fiscal year ended December 31, 2016. The percentage of these fees relating to services approved by the registrant’s Audit Committee pursuant to the de minimis exception from the pre-approval requirement in Rule 2-01(c)(7)(i)(C) of Regulation S-X was 0%.
The aggregate fees billed for all services provided by the independent auditors to the registrant other than those set forth in paragraphs (a), (b) and (c) of this Item were $0 for the fiscal year ended December 31, 2015.
The aggregate fees billed for all services other than those set forth in paragraphs (b) and (c) of this Item provided by the registrant’s independent auditors to the registrant’s adviser and other service providers under common control with the adviser and that relate directly to the operations or financial reporting of the registrant were $0 for the registrant’s fiscal year ended December 31, 2015. The percentage of these fees relating to services approved by the registrant’s Audit Committee pursuant to the de minimis exception from the pre-approval requirement in Rule 2-01(c)(7)(i)(C) of Regulation S-X was 0%.
(e) The registrant’s Audit Committee has established pre-approval policies and procedures as permitted by Rule 2-01(c)(7)(i)(B) of Regulation S-X (the “Pre-Approval Policy”) with respect to services provided by the registrant’s independent auditors. Pursuant to the Pre-Approval Policy, the Audit Committee has pre-approved the services set forth in the table below with respect to the registrant up to the specified fee limits. Certain fee limits are based on aggregate fees to the registrant and other registrants within the Delaware Investments Family of Funds.
| Service | Range of Fees |
| Audit Services | |
| Statutory audits or financial audits for new Funds | up to $40,000 per Fund |
| Services associated with SEC registration statements (e.g., Form N-1A, Form N-14, etc.), periodic reports and other documents filed with the SEC or other documents issued in connection with securities offerings (e.g., comfort letters for closed-end Fund offerings, consents), and assistance in responding to SEC comment letters | up to $10,000 per Fund |
| Consultations by Fund management as to the accounting or disclosure treatment of transactions or events and/or the actual or potential impact of final or proposed rules, standards or interpretations by the SEC, FASB, or other regulatory or standard-setting bodies (Note: Under SEC rules, some consultations may be considered “audit-related services” rather than “audit services”) | up to $25,000 in the aggregate |
| Audit-Related Services | |
| Consultations by Fund management as to the accounting or disclosure treatment of transactions or events and/or the actual or potential impact of final or proposed rules, standards or interpretations by the SEC, FASB, or other regulatory or standard-setting bodies (Note: Under SEC rules, some consultations may be considered “audit services” rather than “audit-related services”) | up to $25,000 in the aggregate |
| Tax Services | |
| U.S. federal, state and local and international tax planning and advice (e.g., consulting on statutory, regulatory or administrative developments, evaluation of Funds’ tax compliance function, etc.) | up to $25,000 in the aggregate |
| U.S. federal, state and local tax compliance (e.g., excise distribution reviews, etc.) | up to $5,000 per Fund |
| Review of federal, state, local and international income, franchise and other tax returns | up to $5,000 per Fund |
Under the Pre-Approval Policy, the Audit Committee has also pre-approved the services set forth in the table below with respect to the registrant’s investment adviser and other entities controlling, controlled by or under common control with the investment adviser that provide ongoing services to the registrant (the “Control Affiliates”) up to the specified fee limit. This fee limit is based on aggregate fees to the investment adviser and its Control Affiliates.
| Service | Range of Fees |
| Non-Audit Services | |
| Services associated with periodic reports and other documents filed with the SEC and assistance in responding to SEC comment letters | up to $10,000 in the aggregate |
The Pre-Approval Policy requires the registrant’s independent auditors to report to the Audit Committee at each of its regular meetings regarding all services initiated since the last such report was rendered, including those services authorized by the Pre-Approval Policy.
(f) Not applicable.
(g) The aggregate non-audit fees billed by the registrant’s independent auditors for services rendered to the registrant and to its investment adviser and other service providers under common control with the adviser were $8,665,000 and $11,111,212 for the registrant’s fiscal years ended December 31, 2016 and December 31, 2015, respectively.
(h) In connection with its selection of the independent auditors, the registrant’s Audit Committee has considered the independent auditors’ provision of non-audit services to the registrant’s investment adviser and other service providers under common control with the adviser that were not required to be pre-approved pursuant to Rule 2-01(c)(7)(ii) of Regulation S-X. The Audit Committee has determined that the independent auditors’ provision of these services is compatible with maintaining the auditors’ independence.
Item 5. Audit Committee of Listed Registrants
Not applicable.
Item 6. Investments
(a) Included as part of report to shareholders filed under Item 1 of this Form N-CSR.
(b) Divestment of securities in accordance with Section 13(c) of the Investment Company Act of 1940.
Not applicable.
Item 7. Disclosure of Proxy Voting Policies and Procedures for Closed-End Management Investment Companies
Not applicable.
Item 8. Portfolio Managers of Closed-End Management Investment Companies
Not applicable.
Item 9. Purchases of Equity Securities by Closed-End Management Investment Company and Affiliated Purchasers
Not applicable.
Item 10. Submission of Matters to a Vote of Security Holders
Not applicable.
Item 11. Controls and Procedures
The registrant’s principal executive officer and principal financial officer have evaluated the registrant’s disclosure controls and procedures within 90 days of the filing of this report and have concluded that they are effective in providing reasonable assurance that the information required to be disclosed by the registrant in its reports or statements filed under the Securities Exchange Act of 1934 is recorded, processed, summarized and reported within the time periods specified in the rules and forms of the Securities and Exchange Commission.
There were no significant changes in the registrant’s internal control over financial reporting that occurred during the second fiscal quarter of the period covered by the report to stockholders included herein (i.e., the registrant’s fourth fiscal quarter) that have materially affected, or are reasonably likely to materially affect, the registrant’s internal control over financial reporting.
Item 12. Exhibits
(a) (1) Code of Ethics
Not applicable.
(2) Certifications of Principal Executive Officer and Principal Financial Officer pursuant to Rule 30a-2 under the Investment Company Act of 1940 are attached hereto as Exhibit 99.CERT.
(3) Written solicitations to purchase securities pursuant to Rule 23c-1 under the Securities Exchange Act of 1934.
Not applicable.
(b) Certifications pursuant to Section 906 of the Sarbanes-Oxley Act of 2002 are furnished herewith as Exhibit 99.906CERT.
SIGNATURES
Pursuant to the requirements of the Securities Exchange Act of 1934 and the Investment Company Act of 1940, the registrant has duly caused this report to be signed on its behalf, by the undersigned, thereunto duly authorized.
DELAWARE GROUP® LIMITED-TERM GOVERNMENT FUNDS
| /s/ SHAWN K. LYTLE | |
| By: | Shawn K. Lytle |
| Title: | President and Chief Executive Officer |
| Date: | March 3, 2017 |
Pursuant to the requirements of the Securities Exchange Act of 1934 and the Investment Company Act of 1940, this report has been signed below by the following persons on behalf of the registrant and in the capacities and on the dates indicated.
| /s/ SHAWN K. LYTLE | |
| By: | Shawn K. Lytle |
| Title: | President and Chief Executive Officer |
| Date: | March 3, 2017 |
| /s/ RICHARD SALUS | |
| By: | Richard Salus |
| Title: | Chief Financial Officer |
| Date: | March 3, 2017 |