UNITED STATES
SECURITIES AND EXCHANGE COMMISSION
Washington, DC 20549
FORM N-CSR
CERTIFIED SHAREHOLDER REPORT OF REGISTERED MANAGEMENT INVESTMENT COMPANIES
Investment Company Act file number 811-00537
Franklin Custodian Funds
(Exact name of registrant as specified in charter)
_One Franklin Parkway, San Mateo, CA 94403-1906
(Address of principal executive offices) (Zip code)
Craig S. Tyle, One Franklin Parkway, San Mateo, CA 94403-1906
(Name and address of agent for service)
Registrant's telephone number, including area code: 650 312-2000
Date of fiscal year end: 9/30
Date of reporting period: 9/30/14
Item 1. Reports to Stockholders.

| |
| Contents | |
| |
| Shareholder Letter | 1 |
| Annual Report | |
| Economic and Market Overview | 3 |
| Franklin DynaTech Fund | 4 |
| Franklin Growth Fund | 14 |
| Franklin Income Fund | 24 |
| Franklin U.S. Government | |
| Securities Fund | 35 |
| Franklin Utilities Fund | 44 |
| Financial Highlights and | |
| Statements of Investments | 54 |
| Financial Statements | 116 |
| Notes to Financial Statements | 125 |
| Report of Independent Registered | |
| Public Accounting Firm | 144 |
| Tax Information | 145 |
| Board Members and Officers | 146 |
| Shareholder Information | 151 |
|1
Annual Report
Economic and Market Overview
The U.S. economy continued to show signs of recovery during the 12-month period ended September 30, 2014, underpinned by manufacturing activity, consumer and business spending and rising inventories. Economic activity rebounded strongly in the second quarter of 2014 after severe weather conditions and a slowdown in health care spending led to a contraction in the first quarter. Except for a sharp rebound in March, retail sales rose at a modest pace that missed consensus expectations for most of the period. In the housing market, home sales experienced some weather-related weakness early in 2014 but ticked up in May, and home prices remained higher than a year earlier. The unemployment rate declined to 5.9% in September 2014 from 7.2% in September 2013.1 Inflation, as measured by the Consumer Price Index, was subdued for the period.
U.S. economic growth trends were generally encouraging during the period. In January 2014, the U.S. Federal Reserve Board (Fed) began reducing its bond purchases $10 billion a month, based on largely positive economic and employment data in late 2013. The Fed continued to taper its asset purchases during the year. In September 2014, the Fed indicated it planned to maintain its near-zero interest rate policy for a “considerable time” after its bond-buying program likely ends in October. The Fed also noted that inflation remained below its unofficial 2% target. Fed actions to normalize monetary policy remained dependent on economic performance, and the Fed lowered its U.S. economic growth projections in September.
Investors’ confidence grew as corporate profits rose and generally favorable economic data indicated continued recovery despite brief sell-offs when many investors reacted to the Fed’s statements, political instability in certain emerging markets, crises in Ukraine and the Middle East, weakness in Europe and moderating economic data in China. U.S. stocks rose for the 12 months under review as the Standard & Poor’s 500 Index (S&P 500) and Dow Jones Industrial Average reached all-time highs.
The 10-year Treasury yield rose from 2.64% at the beginning of the period to a high of 3.04% on December 31, 2013, mainly because of an improved economic environment and market uncertainty about the Fed’s plans. However, the yield declined to 2.52% at period-end, as investors shifted to less risky assets following the crises in Ukraine and the Middle East, growth concerns about emerging markets, record low bond yields and weak economic data in Europe, and lower Treasury issuance.
The foregoing information reflects our analysis and opinions as of September 30, 2014. The information is not a complete analysis of every aspect of any market, country, industry, security or fund. Statements of fact are from sources considered reliable.
1. Source: Bureau of Labor Statistics.
franklintempleton.com Annual Report | 3
Franklin DynaTech Fund
This annual report for Franklin DynaTech Fund covers the fiscal year ended September 30, 2014.
Your Fund’s Goal and Main Investments
The Fund seeks capital appreciation by investing substantially in equity securities of companies emphasizing scientific or technological development or that are in fast-growing industries.
Performance Overview
The Fund’s Class A shares delivered a +13.98% cumulative total return for the 12 months under review. In comparison, the Russell 1000® Growth Index, which measures performance of the largest companies in the Russell 3000® Index with higher price-to-book ratios and higher forecasted growth values, generated a total return of +19.15%.1 Also for comparison, the broad U.S. stock market as measured by the Standard & Poor’s 500 Index (S&P 500), produced a +19.73% return, and domestic and international-based stocks as measured by the NASDAQ Composite Index® posted a +20.61% total return.1 You can find the Fund’s long-term performance data in the Performance Summary beginning on page 7.
Performance data represent past performance, which does not guarantee future results. Investment return and principal value will fluctuate, and you may have a gain or loss when you sell your shares. Current performance may differ from figures shown. Please visit franklintempleton.com or call (800) 342-5236 for most recent month-end performance.
Investment Strategy
We use fundamental, bottom-up research to seek companies meeting our criteria of growth potential, quality and valuation. In seeking sustainable growth characteristics, we look for companies we believe can produce sustainable earnings and cash flow growth, evaluating the long-term market opportunity and competitive structure of an industry to target leaders and emerging leaders. We define quality companies as those with strong and improving competitive positions in attractive markets. We also believe important attributes of quality are experienced and talented management teams as well as financial strength reflected in the capital structure, gross and operating margins, free cash flow generation and returns on capital employed. Our valuation analysis includes a range of potential outcomes based on an assessment of multiple scenarios. In assessing value, we consider whether security prices fully reflect the balance of the sustainable growth opportunities relative to business and financial risks.
Manager’s Discussion
The Fund’s health care positions contributed notably to absolute performance during the reporting period.2 Although generic and branded pharmaceuticals firm Actavis reported an operating loss for 2013, its shares were propelled during the reporting period by double-digit growth in sales of North American core branded products aided by its acquisition of specialty drug company Warner Chilcott. In addition, the launch of generic versions of Lidoderm and Cymbalta enjoyed strong sales. In biotechnology, Gilead Sciences, which specializes in antiviral and cardiovascular treatments, benefited from doubled revenue and earnings for the first and second quarters of 2014, largely based on strong sales of its hepatitis C medicine Sovaldi released in December 2013, as well as growing sales of its HIV drugs Stribild and Complera. Genetic analysis tools manufacturer Illumina experienced robust performance across all products and geographic regions in 2013 and introduced new products in early 2014 that the company hoped would redefine the direction of genetic research. Illumina issued encouraging future earnings guidance and experienced double-digit revenue growth in 2014.
The Fund’s information technology (IT) positions also substantially supported results.3 The share price of personal computing and mobile communication device manufacturer Apple reached a record high during the period due to strong quarterly results, high expectations of new product launches and a stock split aimed at lowering its share price to make it affordable to more people. Web-based search engine and advertising provider Google, which celebrated its 10th year since its initial public offering, reported second-quarter sales that exceeded estimates as the company sold more advertising and boosted user traffic
1. Source: Morningstar.
The indexes are unmanaged and include reinvested dividends. One cannot invest directly in an index, and an index is not representative of the Fund’s portfolio.
Russell Investment Group is the source and owner of the trademarks, service marks and copyrights related to the Russell Indexes. Russell® is a trademark of Russell
Investment Group.
See www.franklintempletondatasources.com for additional data provider information.
2. The health care sector comprises biotechnology, health care equipment and supplies, health care providers and services, health care technology, life sciences tools and
services, and pharmaceuticals in the SOI.
3. The IT sector comprises communications equipment; computers and peripherals; Internet and catalog retail; Internet software and services; IT services; semiconductors
and semiconductor equipment; software; and technology hardware, storage and peripherals in the SOI.
The dollar value, number of shares or principal amount, and names of all portfolio holdings are listed in the Fund’s Statement of Investments (SOI).
The SOI begins on page 59.
4 | Annual Report franklintempleton.com
FRANKLIN DYNATECH FUND
to attract marketers. Supported by double-digit increases in the number of traditional and mobile users, Facebook doubled its first- and second-quarter earnings aided by increased advertising revenue, particularly for mobile advertising that represented over half of total revenue. Intel shipped a record number of microprocessor units in the second quarter, fueling a double-digit increase in quarterly income from its personal computer, data center and Internet businesses.
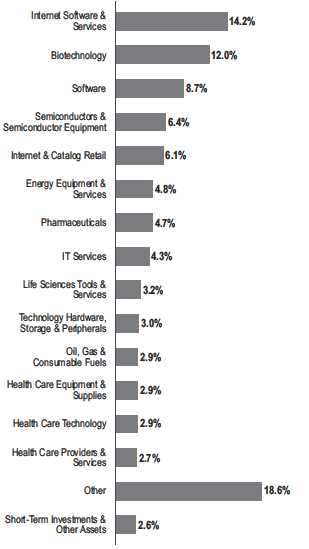
Portfolio Breakdown
Based on Total Net Assets as of 9/30/14
| | |
| Top 10 Holdings | | |
| 9/30/14 | | |
| Company | % of Total | |
| Sector/Industry | Net Assets | |
| Google Inc., A & C | 3.1 | % |
| Internet Software & Services | | |
| Actavis PLC | 2.8 | % |
| Pharmaceuticals | | |
| Gilead Sciences Inc. | 2.4 | % |
| Biotechnology | | |
| Biogen Idec Inc. | 2.2 | % |
| Biotechnology | | |
| Facebook Inc., A | 2.2 | % |
| Internet Software & Services | | |
| MasterCard Inc., A | 2.1 | % |
| IT Services | | |
| Visa Inc., A | 2.1 | % |
| IT Services | | |
| Apple Inc. | 2.1 | % |
| Technology Hardware, Storage & Peripherals | | |
| Celgene Corp. | 2.0 | % |
| Biotechnology | | |
| Amazon.com Inc. | 1.8 | % |
| Internet & Catalog Retail | | |
In contrast, some holdings notably weighed on performance. Revenue fell for biopharmaceutical firm Celldex Therapeutics, which specializes in immunology, as royalties expired for infant rotavirus vaccine Rotarix and the firm pursued clinical studies for new medicines. Despite generating increased revenue above estimates, the share price declined for LinkedIn, the world’s largest professional, Internet network, after the company reported operating losses, lower 2014 earnings guidance and slower user base growth. Challenges for LinkedIn included a low percentage of paid subscription users, narrow operating margins, and high sales and marketing costs. Although revenue grew and market share improved for NetSuite, a leading provider of cloud-based financials, enterprise resource planning and omnichannel commerce software suites, the company suffered from net losses resulting from its sales promotion and product development efforts. The stock price declined for MercadoLibre, Latin America’s leading e-commerce technology company, largely as a result of inconsistent quarterly earnings as well as concerns about inflation and currency risks in Venezuela and Argentina, in which the company earned much of its recent profits. MercadoLibre sought to enhance its website and customer experience, including for mobile users.
franklintempleton.com Annual Report | 5
FRANKLIN DYNATECH FUND
As managers of Franklin DynaTech Fund, at period-end we remained encouraged by the relative abundance of companies that we believe have strong long-term growth prospects trading at what we perceive to be attractive valuations. We believe it is these innovative, thought-leading companies that may promote economic advancement over the longer term.
Thank you for your continued participation in Franklin DynaTech Fund. We look forward to serving your future investment needs.

The foregoing information reflects our analysis, opinions and portfolio holdings as of September 30, 2014, the end of the reporting period. The way we implement our main investment strategies and the resulting portfolio holdings may change depending on factors such as market and economic conditions. These opinions may not be relied upon as investment advice or an offer for a particular security. The information is not a complete analysis of every aspect of any market, country, industry, security or the Fund. Statements of fact are from sources considered reliable, but the investment manager makes no representation or warranty as to their completeness or accuracy. Although historical performance is no guarantee of future results, these insights may help you understand our investment management philosophy.
6 | Annual Report franklintempleton.com
FRANKLIN DYNATECH FUND
Performance Summary as of September 30, 2014
Your dividend income will vary depending on dividends or interest paid by securities in the Fund’s portfolio, adjusted for operating expenses of each class. Capital gain distributions are net profits realized from the sale of portfolio securities. The performance table and graphs do not reflect any taxes that a shareholder would pay on Fund dividends, capital gain distributions, if any, or any realized gains on the sale of Fund shares. Total return reflects reinvestment of the Fund’s dividends and capital gain distributions, if any, and any unrealized gains or losses.
| | | |
| Net Asset Value | | | |
| Share Class (Symbol) | 9/30/14 | 9/30/13 | Change |
| A (FKDNX) | $46.08 | $42.13 | +$3.95 |
| C (FDYNX) | $40.53 | $37.53 | +$3.00 |
| R (FDNRX) | $45.35 | $41.58 | +$3.77 |
| R6 (FDTRX) | $46.97 | $42.74 | +$4.23 |
| Advisor (FDYZX) | $46.87 | $42.71 | +$4.16 |
| | |
| Distributions (10/1/13–9/30/14) | | |
| | | Long-Term |
| Share Class | | Capital Gain |
| A | $ | 1.8063 |
| C | $ | 1.8063 |
| R | $ | 1.8063 |
| R6 | $ | 1.8063 |
| Advisor | $ | 1.8063 |
franklintempleton.com Annual Report | 7
FRANKLIN DYNATECH FUND
PERFORMANCE SUMMARY
Performance as of 9/30/141
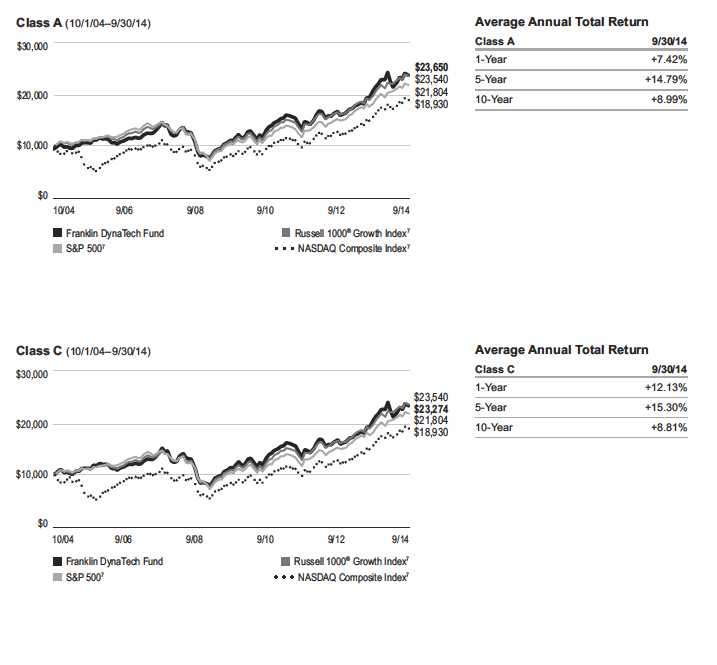
Cumulative total return excludes sales charges. Average annual total return and value of $10,000 investment include maximum sales charges. Class A: 5.75% maximum initial sales charge; Class C: 1% contingent deferred sales charge in first year only;
Class R/R6/Advisor Class: no sales charges.
| | | | | | | |
| | Cumulative | | Average Annual | | Value of | Total Annual | |
| Share Class | Total Return2 | | Total Return3 | | 10,000 Investment4 | Operating Expenses5 | |
| A | | | | | | 0.94 | % |
| 1-Year | +13.98 | % | +7.42 | % | $10,742 | | |
| 5-Year | +111.47 | % | +14.79 | % | $19,928 | | |
| 10-Year | +150.89 | % | +8.99 | % | $23,650 | | |
| C | | | | | | 1.69 | % |
| 1-Year | +13.13 | % | +12.13 | % | $11,213 | | |
| 5-Year | +103.74 | % | +15.30 | % | $20,374 | | |
| 10-Year | +132.74 | % | +8.81 | % | $23,274 | | |
| R | | | | | | 1.19 | % |
| 1-Year | +13.72 | % | +13.72 | % | $11,372 | | |
| 5-Year | +108.91 | % | +15.88 | % | $20,891 | | |
| Since Inception (12/1/08) | +208.57 | % | +21.32 | % | $30,857 | | |
| R6 | | | | | | 0.52 | % |
| 1-Year | +14.45 | % | +14.45 | % | $11,445 | | |
| Since Inception (5/1/13) | +33.79 | % | +22.82 | % | $13,379 | | |
| Advisor6 | | | | | | 0.69 | % |
| 1-Year | +14.29 | % | +14.29 | % | $11,429 | | |
| 5-Year | +114.19 | % | +16.46 | % | $21,419 | | |
| 10-Year | +154.95 | % | +9.81 | % | $25,495 | | |
Performance data represent past performance, which does not guarantee future results. Investment return and principal value will fluctuate, and you may have a gain or loss when you sell your shares. Current performance may differ from figures shown. For most recent month-end performance, go to franklintempleton.com or call (800) 342-5236.
8 | Annual Report franklintempleton.com
FRANKLIN DYNATECH FUND
PERFORMANCE SUMMARY
Total Return Index Comparison for a Hypothetical $10,000 Investment1
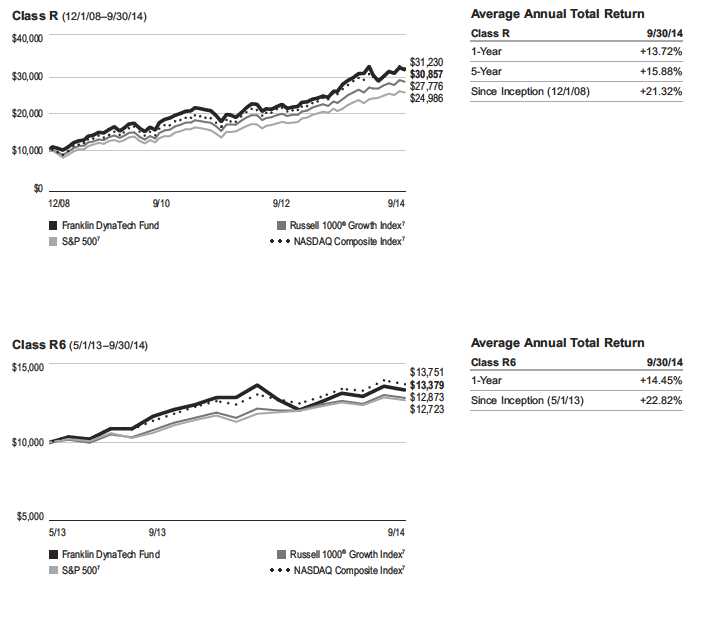
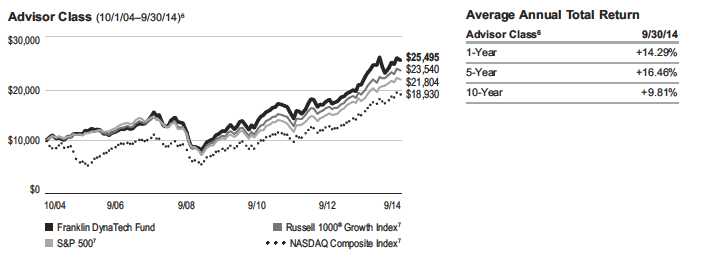
Total return represents the change in value of an investment over the periods shown. It includes any applicable, maximum sales charge, Fund expenses, account fees and reinvested distributions. The unmanaged indexes include reinvestment of any income or distributions. They differ from the Fund in composition and do not pay management fees or expenses. One cannot invest directly in an index.
franklintempleton.com Annual Report | 9
FRANKLIN DYNATECH FUND
PERFORMANCE SUMMARY
Total Return Index Comparison for a Hypothetical $10,000 Investment1 (continued)
10 | Annual Report franklintempleton.com
FRANKLIN DYNATECH FUND
PERFORMANCE SUMMARY
Total Return Index Comparison for a Hypothetical $10,000 Investment1 (continued)
All investments involve risks, including possible loss of principal. The Fund’s investments in fast-growing industries, including the technology and health care
sectors (which have historically been volatile) could result in increased price fluctuation, especially over the short term, due to the rapid pace of product change
and development and changes in government regulation of companies emphasizing scientific or technological advancement or regulatory approval for new
drugs and medical instruments. The Fund may also invest in small capitalization companies, which can be particularly sensitive to changing economic condi-
tions, and their prospects for growth are less certain than those of larger, more established companies. The Fund is actively managed but there is no guarantee
that the manager’s investment decisions will produce the desired results. The Fund’s prospectus also includes a description of the main investment risks.
| |
| Class C: | These shares have higher annual fees and expenses than Class A shares. |
| Class R: | Shares are available to certain eligible investors as described in the prospectus. These shares have higher annual fees and expenses than Class A shares. |
| Class R6: | Shares are available to certain eligible investors as described in the prospectus. |
| Advisor Class: | Shares are available to certain eligible investors as described in the prospectus. |
1. The Fund has a fee waiver associated with its investments in a Franklin Templeton money fund, contractually guaranteed through at least its current fiscal year-end.
Fund investment results reflect the fee waiver, to the extent applicable; without this reduction, the results would have been lower.
2. Cumulative total return represents the change in value of an investment over the periods indicated.
3. Average annual total return represents the average annual change in value of an investment over the periods indicated.
4. These figures represent the value of a hypothetical $10,000 investment in the Fund over the periods indicated.
5. Figures are as stated in the Fund’s current prospectus. In periods of market volatility, assets may decline significantly, causing total annual Fund operating expenses to
become higher than the figures shown.
6. Effective 5/15/08, the Fund began offering Advisor Class shares, which do not have sales charges or a Rule 12b-1 plan. Performance quotations for this class reflect the
following methods of calculation: (a) For periods prior to 10/3/05, a restated figure is used based upon the Fund’s Class A performance, excluding the effect of Class A’s
maximum initial sales charge, but reflecting the effect of the Class A Rule 12b-1 fees; and (b) for periods after 5/15/08, actual Advisor Class performance is used reflecting
all charges and fees applicable to that class. Since 5/15/08 (commencement of sales), the cumulative and average annual total returns of Advisor Class shares were
+74.82% and +9.15%.
7. Source: Morningstar. The Russell 1000 Growth Index is market capitalization weighted and measures performance of those Russell 1000 Index companies with higher
price-to-book ratios and higher forecasted growth values. The S&P 500 is a market capitalization-weighted index of 500 stocks designed to measure total U.S. equity market
performance. The NASDAQ Composite Index is a broad-based, market capitalization-weighted index designed to measure all NASDAQ domestic and international-based
common type stocks listed on The NASDAQ Stock Market.
Russell Investment Group is the source and owner of the trademarks, service marks and copyrights related to the Russell Indexes. Russell® is a trademark of Russell
Investment Group.
See www.franklintempletondatasources.com for additional data provider information.
franklintempleton.com Annual Report | 11
FRANKLIN DYNATECH FUND
Your Fund’s Expenses
As a Fund shareholder, you can incur two types of costs:
- Transaction costs, including sales charges (loads) on Fund purchases; and
- Ongoing Fund costs, including management fees, distribu- tion and service (12b-1) fees, and other Fund expenses. All mutual funds have ongoing costs, sometimes referred to as operating expenses.
The following table shows ongoing costs of investing in the Fund and can help you understand these costs and compare them with those of other mutual funds. The table assumes a $1,000 investment held for the six months indicated.
Actual Fund Expenses
The first line (Actual) for each share class listed in the table provides actual account values and expenses. The “Ending Account Value” is derived from the Fund’s actual return, which includes the effect of Fund expenses.
You can estimate the expenses you paid during the period by following these steps. Of course, your account value and expenses will differ from those in this illustration:
| 1. | Divide your account value by $1,000. |
| | If an account had an $8,600 value, then $8,600 ÷ $1,000 = 8.6. |
| 2. | Multiply the result by the number under the heading “Expenses Paid During Period.” |
| | If Expenses Paid During Period were $7.50, then 8.6 x $7.50 = $64.50. |
In this illustration, the estimated expenses paid this period are $64.50.
Hypothetical Example for Comparison with Other Funds
Information in the second line (Hypothetical) for each class in the table can help you compare ongoing costs of investing in the Fund with those of other mutual funds. This information may not be used to estimate the actual ending account balance or expenses you paid during the period. The hypothetical “Ending Account Value” is based on the actual expense ratio for each class and an assumed 5% annual rate of return before expenses, which does not represent the Fund’s actual return. The figure under the heading “Expenses Paid During Period” shows the hypothetical expenses your account would have incurred under this scenario. You can compare this figure with the 5% hypothetical examples that appear in shareholder reports of other funds.
Please note that expenses shown in the table are meant to highlight ongoing costs and do not reflect any transaction costs, such as sales charges. Therefore, the second line for each class is useful in comparing ongoing costs only, and will not help you compare total costs of owning different funds. In addition, if transaction costs were included, your total costs would have been higher. Please refer to the Fund prospectus for additional information on operating expenses.
12 | Annual Report franklintempleton.com
FRANKLIN DYNATECH FUND
YOUR FUND’S EXPENSES
| | | | | | |
| | | Beginning Account | | Ending Account | | Expenses Paid During |
| Share Class | | Value 4/1/14 | | Value 9/30/14 | | Period* 4/1/14–9/30/14 |
| A | | | | | | |
| Actual | $ | 1,000 | $ | 1,047.30 | $ | 4.57 |
| Hypothetical (5% return before expenses) | $ | 1,000 | $ | 1,020.61 | $ | 4.51 |
| C | | | | | | |
| Actual | $ | 1,000 | $ | 1,043.20 | $ | 8.40 |
| Hypothetical (5% return before expenses) | $ | 1,000 | $ | 1,016.85 | $ | 8.29 |
| R | | | | | | |
| Actual | $ | 1,000 | $ | 1,046.10 | $ | 5.85 |
| Hypothetical (5% return before expenses) | $ | 1,000 | $ | 1,019.35 | $ | 5.77 |
| R6 | | | | | | |
| Actual | $ | 1,000 | $ | 1,049.40 | $ | 2.52 |
| Hypothetical (5% return before expenses) | $ | 1,000 | $ | 1,022.61 | $ | 2.48 |
| Advisor | | | | | | |
| Actual | $ | 1,000 | $ | 1,048.80 | $ | 3.29 |
| Hypothetical (5% return before expenses) | $ | 1,000 | $ | 1,021.86 | $ | 3.24 |
*Expenses are calculated using the most recent six-month expense ratio, net of expense waivers, annualized for each class (A: 0.89%;
C: 1.64%; R: 1.14%; R6: 0.49%; and Advisor: 0.64%), multiplied by the average account value over the period, multiplied by 183/365 to
reflect the one-half year period.
franklintempleton.com Annual Report | 13
Franklin Growth Fund
This annual report for Franklin Growth Fund covers the fiscal year ended September 30, 2014.
Your Fund’s Goal and Main Investments
The Fund seeks capital appreciation by investing substantially in equity securities of companies that are leaders in their industries.
Performance Overview
The Fund’s Class A shares delivered a +19.08% cumulative total return for the 12 months under review. In comparison, the Standard & Poor’s 500 Index, which is a broad measure of U.S. stock performance, generated a +19.73% total return.1 You can find the Fund’s long-term performance data in the Performance Summary beginning on page 17.
Performance data represent past performance, which does not guarantee future results. Investment return and principal value will fluctuate, and you may have a gain or loss when you sell your shares. Current performance may differ from figures shown. Please visit franklintempleton.com or call (800) 342-5236 for most recent month-end performance.
Investment Strategy
We use fundamental, bottom-up research to seek companies meeting our criteria of growth potential, quality and valuation. In seeking sustainable growth characteristics, we look for companies we believe can produce sustainable earnings and cash flow growth, evaluating the long-term market opportunity and competitive structure of an industry to target leaders and emerging leaders. We define quality companies as those with strong and improving competitive positions in attractive markets. We also believe important attributes of quality are experienced and talented management teams as well as financial strength reflected in the capital structure, gross and operating margins, free cash flow generation and returns on capital employed. Our valuation analysis includes a range of potential outcomes based on an assessment of multiple scenarios. In assessing value, we consider whether security prices fully reflect the balance of the sustainable growth opportunities relative to business and financial risks.
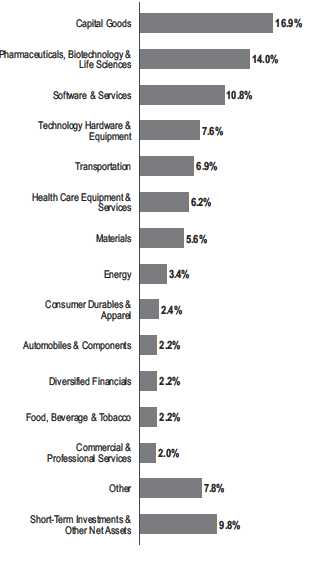
Portfolio Breakdown
Based on Total Net Assets as of 9/30/14
Manager’s Discussion
Franklin Growth Fund owned shares of 160 companies at period-end. We continue to invest in a broad array of companies of all sizes and in varied industries.
1. Source: Morningstar.
The index is unmanaged and includes reinvested dividends. One cannot invest directly in an index, and an index is not representative of the Fund’s portfolio.
See www.franklintempletondatasources.com for additional data provider information.
The dollar value, number of shares or principal amount, and names of all portfolio holdings are listed in the Fund’s Statement of Investments (SOI).
The SOI begins on page 68.
14 | Annual Report franklintempleton.com
FRANKLIN GROWTH FUND
During the year under review, all investment sectors benefited absolute performance, particularly industrials, health care and information technology (IT).2 In industrials, air service provider Alaska Air Group reported strong revenue growth in the second quarter of 2014 driven by increases in the passenger, freight and mail, and other segments. The company’s initiatives to boost revenue from other segments, such as modifying its card agreement with Bank of America, increasing bag fees and adding more seats, succeeded as these sources recorded the highest growth during the second quarter. Defense contractor Northrop Grumman’s share price rose as an analyst raised its rating to outperform due to robust earnings growth, a solid financial position with reasonable debt levels, attractive valuation levels and healthy cash flow from operations.
In health care, despite some volatility due to a potential hostile takeover by Valeant Pharmaceuticals, beauty drug maker Allergan’s share price soared during the Fund’s fiscal year as the firm experienced strong second-quarter earnings resulting from its growing niche market position and solid product pipeline. The shares of biotechnology firm Biogen Idec gained after the U.S. Food and Drug Administration approved Plegridy, the company’s new treatment for patients with relapsing multiple sclerosis. Biogen Idec also benefited from an improved return on equity, low debt level and strong earnings growth.
In IT, the share price of personal computing and mobile communication device manufacturer Apple reached a record high during the period due to strong quarterly results, high expectations of new product launches and a stock split aimed at lowering its share price to make it affordable to more people. Web-based search engine and advertising provider Google, which celebrated its 10th year since its initial public offering, reported second-quarter sales that exceeded estimates as the company sold more advertising and boosted user traffic to attract marketers.
| | |
| Top 10 Holdings | | |
| 9/30/14 | | |
| Company | % of Total | |
| Sector/Industry | Net Assets | |
| |
| Apple Inc. | 3.9 | % |
| Technology Hardware & Equipment | | |
| Allergan Inc. | 1.7 | % |
| Pharmaceuticals, Biotechnology & Life Sciences | | |
| Google Inc., A & C | 1.7 | % |
| Software & Services | | |
| Biogen Idec Inc. | 1.6 | % |
| Pharmaceuticals, Biotechnology & Life Sciences | | |
| The Walt Disney Co. | 1.4 | % |
| Media | | |
| Northrop Grumman Corp. | 1.4 | % |
| Capital Goods | | |
| Amgen Inc. | 1.4 | % |
| Pharmaceuticals, Biotechnology & Life Sciences | | |
| The Boeing Co. | 1.4 | % |
| Capital Goods | | |
| Alaska Air Group Inc. | 1.3 | % |
| Transportation | | |
| W.W. Grainger Inc. | 1.3 | % |
| Capital Goods | | |
Conversely, some holdings weighed on absolute Fund performance. The share price of blood management solutions provider Haemonetics fell as the firm experienced a large year-over-year earnings decline mostly due to weak performance of its blood center disposables business. Nevertheless, the company’s hospital diagnostics business continued to grow and company management expected this segment to boost its operating income in its next fiscal year. Maintenance, repair and operating supplies distributor W.W. Grainger lowered its 2014 sales guidance and narrowed its earnings per share guidance. Nonetheless, the company expected long-term growth from expanding its product offerings and sales force. Mostly due to first-quarter weakness, earnings per share declined through the first six months of 2014 compared with the same period in 2013 for Waters, an analytical instrument manufacturing company. However, growing pharmaceutical demand and strong sales in the U.S. led to improvement in the second quarter, which the firm expected to continue.
2. The industrials sector comprises capital goods, commercial and professional services, and transportation in the SOI. The health care sector comprises health care
equipment and services; and pharmaceuticals, biotechnology and life sciences in the SOI. The IT sector comprises semiconductors and semiconductor equipment;
software and services; and technology hardware and equipment in the SOI.
franklintempleton.com Annual Report | 15
FRANKLIN GROWTH FUND
Thank you for your continued participation in Franklin Growth Fund. We look forward to serving your future investment needs.

The foregoing information reflects our analysis, opinions and portfolio holdings as of September 30, 2014, the end of the reporting period. The way we implement our main investment strategies and the resulting portfolio holdings may change depending on factors such as market and economic conditions. These opinions may not be relied upon as investment advice or an offer for a particular security. The information is not a complete analysis of every aspect of any market, country, industry, security or the Fund. Statements of fact are from sources considered reliable, but the investment manager makes no representation or warranty as to their completeness or accuracy. Although historical performance is no guarantee of future results, these insights may help you understand our investment management philosophy.
Conrad Herrmann is a senior vice president and portfolio manager for Franklin’s equity group and joined Franklin Templeton Investments in 1989. He is a lead portfolio manager for several equity growth portfolios and also serves as a back-up manager for Franklin Growth Fund and other growth portfolios. Prior to joining Franklin Templeton Investments, Mr. Herrmann was a vice president of Aquila Management, a mutual fund group in New York City, having joined the firm in 1983 as a fixed-income analyst.
CFA® is a trademark owned by CFA Institute.
16 | Annual Report franklintempleton.com
FRANKLIN GROWTH FUND
Performance Summary as of September 30, 2014
Your dividend income will vary depending on dividends or interest paid by securities in the Fund’s portfolio, adjusted for operating expenses of each class. Capital gain distributions are net profits realized from the sale of portfolio securities. The performance table and graphs do not reflect any taxes that a shareholder would pay on Fund dividends, capital gain distributions, if any, or any realized gains on the sale of Fund shares. Total return reflects reinvestment of the Fund’s dividends and capital gain distributions, if any, and any unrealized gains or losses.
| | | |
| Net Asset Value | | | |
| Share Class (Symbol) | 9/30/14 | 9/30/13 | Change |
| A (FKGRX) | $70.51 | $59.49 | +$11.02 |
| C (FRGSX) | $65.75 | $55.64 | +$10.11 |
| R (FGSRX) | $70.05 | $59.07 | +$10.98 |
| R6 (FIFRX) | $70.76 | $59.71 | +$11.05 |
| Advisor (FCGAX) | $70.75 | $59.66 | +$11.09 |
| | |
| Distributions (10/1/13–9/30/14) | | |
| | | Dividend |
| Share Class | | Income |
| A | $ | 0.2953 |
| R | $ | 0.0961 |
| R6 | $ | 0.5774 |
| Advisor | $ | 0.4175 |
franklintempleton.com Annual Report | 17
FRANKLIN GROWTH FUND
PERFORMANCE SUMMARY
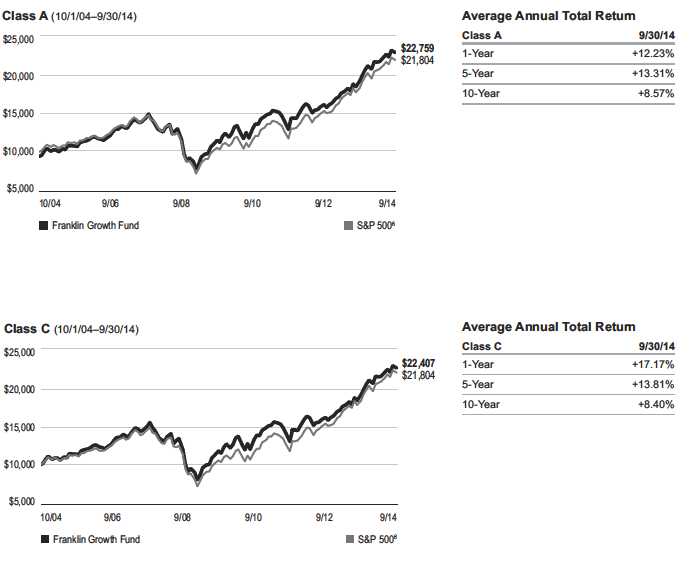
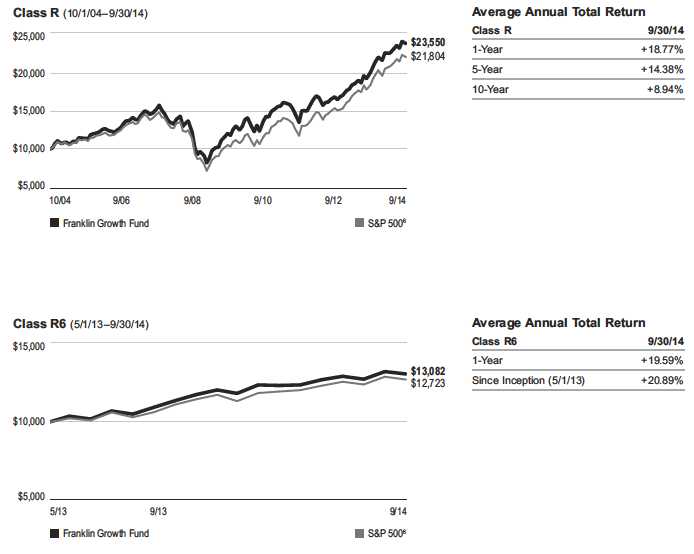
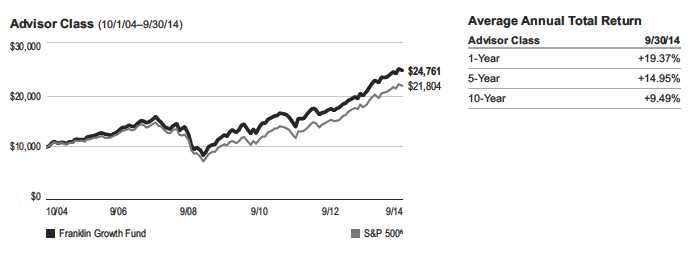
Performance as of 9/30/141
Cumulative total return excludes sales charges. Average annual total return and value of $10,000 investment include maximum sales charges. Class A: 5.75% maximum initial sales charge; Class C: 1% contingent deferred sales charge in first year only;
Class R/R6/Advisor Class: no sales charges.
| | | | | | | | | | | | |
| | | Cumulative | | | Average Annual | | | Value of | Total Annual Operating Expenses5 | |
| Share Class | | Total Return2 | | | Total Return3 | | $ | 10,000 Investment4 | (with waiver) | | (without waiver) | |
| A | | | | | | | | | 0.92 | % | 0.93 | % |
| 1-Year | + | 19.08 | % | + | 12.23 | % | $ | 11,223 | | | | |
| 5-Year | + | 98.21 | % | + | 13.31 | % | $ | 18,679 | | | | |
| 10-Year | + | 141.51 | % | + | 8.57 | % | $ | 22,759 | | | | |
| C | | | | | | | | | 1.67 | % | 1.68 | % |
| 1-Year | + | 18.17 | % | + | 17.17 | % | $ | 11,717 | | | | |
| 5-Year | + | 90.94 | % | + | 13.81 | % | $ | 19,094 | | | | |
| 10-Year | + | 124.07 | % | + | 8.40 | % | $ | 22,407 | | | | |
| R | | | | | | | | | 1.17 | % | 1.18 | % |
| 1-Year | + | 18.77 | % | + | 18.77 | % | $ | 11,877 | | | | |
| 5-Year | + | 95.76 | % | + | 14.38 | % | $ | 19,576 | | | | |
| 10-Year | + | 135.50 | % | + | 8.94 | % | $ | 23,550 | | | | |
| R6 | | | | | | | | | 0.49 | % | 0.50 | % |
| 1-Year | + | 19.59 | % | + | 19.59 | % | $ | 11,959 | | | | |
| Since Inception (5/1/13) | + | 30.82 | % | + | 20.89 | % | $ | 13,082 | | | | |
| Advisor | | | | | | | | | 0.67 | % | 0.68 | % |
| 1-Year | + | 19.37 | % | + | 19.37 | % | $ | 11,937 | | | | |
| 5-Year | + | 100.71 | % | + | 14.95 | % | $ | 20,071 | | | | |
| 10-Year | + | 147.61 | % | + | 9.49 | % | $ | 24,761 | | | | |
Performance data represent past performance, which does not guarantee future results. Investment return and principal value will fluctuate, and you may have a gain or loss when you sell your shares. Current performance may differ from figures shown. For most recent month-end performance, go to franklintempleton.com or call (800) 342-5236.
18 | Annual Report franklintempleton.com
FRANKLIN GROWTH FUND
PERFORMANCE SUMMARY
Total Return Index Comparison for a Hypothetical $10,000 Investment1
Total return represents the change in value of an investment over the periods shown. It includes any current, applicable, maximum sales charge, Fund expenses, account fees and reinvested distributions. The unmanaged index includes reinvestment of any income or distributions. It differs from the Fund in composition and does not pay management fees or expenses. One cannot invest directly in an index.
franklintempleton.com Annual Report | 19
FRANKLIN GROWTH FUND
PERFORMANCE SUMMARY
Total Return Index Comparison for a Hypothetical $10,000 Investment1 (continued)
20 | Annual Report franklintempleton.com
FRANKLIN GROWTH FUND
PERFORMANCE SUMMARY
Total Return Index Comparison for a Hypothetical $10,000 Investment1 (continued)
All investments involve risks, including possible loss of principal. Historically, the Fund has focused on larger companies. The Fund may also invest in small,
relatively new and/or unseasoned companies, which involves additional risks, as the price of these securities can be volatile, particularly over the short term.
The Fund may focus on particular sectors of the market from time to time, which can carry greater risks of adverse developments in such sectors. In addition,
the Fund may invest up to 40% of its net assets in stocks of foreign companies, which involve special risks, including currency fluctuations and economic as
well as political uncertainty. The Fund is actively managed but there is no guarantee that the manager’s investment decisions will produce the desired results.
The Fund’s prospectus also includes a description of the main investment risks.
| |
| Class C: | These shares have higher annual fees and expenses than Class A shares. |
| Class R: | Shares are available to certain eligible investors as described in the prospectus. These shares have higher annual fees an expenses than Class A shares. |
| Class R6: | Shares are available to certain eligible investors as described in the prospectus. |
| Advisor Class: | Shares are available to certain eligible investors as described in the prospectus. |
1. The Fund has a fee waiver associated with its investments in a Franklin Templeton money fund, contractually guaranteed through at least its current fiscal year-end.
Fund investment results reflect the fee waiver, to the extent applicable; without this reduction, the results would have been lower.
2. Cumulative total return represents the change in value of an investment over the periods indicated.
3. Average annual total return represents the average annual change in value of an investment over the periods indicated.
4. These figures represent the value of a hypothetical $10,000 investment in the Fund over the periods indicated.
5. Figures are as stated in the Fund’s current prospectus. In periods of market volatility, assets may decline significantly, causing total annual Fund operating expenses to
become higher than the figures shown.
6. Source: Morningstar. The S&P 500 is a market capitalization-weighted index of 500 stocks designed to measure total U.S. equity market performance.
See www.franklintempletondatasources.com for additional data provider information.
franklintempleton.com Annual Report | 21
FRANKLIN GROWTH FUND
Your Fund’s Expenses
As a Fund shareholder, you can incur two types of costs:
- Transaction costs, including sales charges (loads) on Fund purchases; and
- Ongoing Fund costs, including management fees, distribu- tion and service (12b-1) fees, and other Fund expenses. All mutual funds have ongoing costs, sometimes referred to as operating expenses.
The following table shows ongoing costs of investing in the Fund and can help you understand these costs and compare them with those of other mutual funds. The table assumes a $1,000 investment held for the six months indicated.
Actual Fund Expenses
The first line (Actual) for each share class listed in the table provides actual account values and expenses. The “Ending Account Value” is derived from the Fund’s actual return, which includes the effect of Fund expenses.
You can estimate the expenses you paid during the period by following these steps. Of course, your account value and expenses will differ from those in this illustration:
| 1. | Divide your account value by $1,000. |
| | If an account had an $8,600 value, then $8,600 ÷ $1,000 = 8.6. |
| 2. | Multiply the result by the number under the heading “Expenses Paid During Period.” |
| | If Expenses Paid During Period were $7.50, then 8.6 x $7.50 = $64.50. |
In this illustration, the estimated expenses paid this period are $64.50.
Hypothetical Example for Comparison with Other Funds
Information in the second line (Hypothetical) for each class in the table can help you compare ongoing costs of investing in the Fund with those of other mutual funds. This information may not be used to estimate the actual ending account balance or expenses you paid during the period. The hypothetical “Ending Account Value” is based on the actual expense ratio for each class and an assumed 5% annual rate of return before expenses, which does not represent the Fund’s actual return. The figure under the heading “Expenses Paid During Period” shows the hypothetical expenses your account would have incurred under this scenario. You can compare this figure with the 5% hypothetical examples that appear in shareholder reports of other funds.
Please note that expenses shown in the table are meant to highlight ongoing costs and do not reflect any transaction costs, such as sales charges. Therefore, the second line for each class is useful in comparing ongoing costs only, and will not help you compare total costs of owning different funds. In addition, if transaction costs were included, your total costs would have been higher. Please refer to the Fund prospectus for additional information on operating expenses.
22 | Annual Report franklintempleton.com
FRANKLIN GROWTH FUND
YOUR FUND’S EXPENSES
| | | |
| | Beginning Account | Ending Account | Expenses Paid During |
| Share Class | Value 4/1/14 | Value 9/30/14 | Period* 4/1/14–9/30/14 |
| A | | | |
| Actual | $1,000 | $1,057.40 | $4.64 |
| Hypothetical (5% return before expenses) | $1,000 | $1,020.56 | $4.56 |
| C | | | |
| Actual | $1,000 | $1,053.50 | $8.49 |
| Hypothetical (5% return before expenses) | $1,000 | $1,016.80 | $8.34 |
| R | | | |
| Actual | $1,000 | $1,055.90 | $5.93 |
| Hypothetical (5% return before expenses) | $1,000 | $1,019.30 | $5.82 |
| R6 | | | |
| Actual | $1,000 | $1,059.80 | $2.38 |
| Hypothetical (5% return before expenses) | $1,000 | $1,022.76 | $2.33 |
| Advisor | | | |
| Actual | $1,000 | $1,058.70 | $3.35 |
| Hypothetical (5% return before expenses) | $1,000 | $1,021.81 | $3.29 |
*Expenses are calculated using the most recent six-month expense ratio, net of expense waivers, annualized for each class (A: 0.90%;
C: 1.65%; R: 1.15%; R6: 0.46% and Advisor: 0.65%), multiplied by the average account value over the period, multiplied by 183/365 to
reflect the one-half year period.
franklintempleton.com Annual Report | 23
Franklin Income Fund
This annual report for Franklin Income Fund covers the fiscal year ended September 30, 2014.
Your Fund’s Goal and Main Investments
The Fund seeks to maximize income while maintaining prospects for capital appreciation by investing, under normal market conditions, in a diversified portfolio of debt and equity securities.
Performance Overview
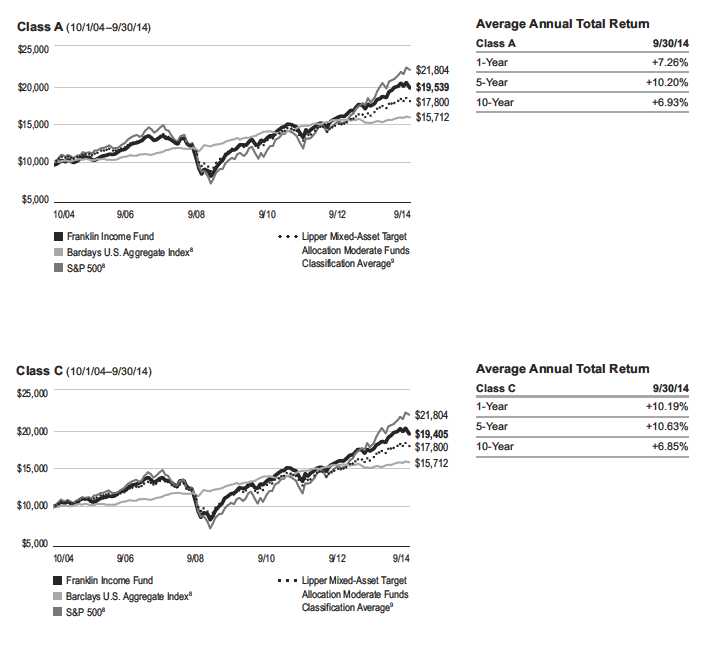
The Fund’s Class A shares delivered a cumulative total return of +11.86% for the 12 months under review. In comparison, the Fund’s equity benchmark, the Standard & Poor’s 500 Index (S&P 500), which is a broad measure of U.S. stock performance, returned +19.73%.1 The Fund’s fixed income benchmark, the Barclays U.S. Aggregate Index, which tracks the U.S. investment-grade, taxable bond market, posted a +3.96% total return.1 The Fund’s peers, as measured by the Lipper Mixed-Asset Target Allocation Moderate Funds Classification Average, which consists of funds chosen by Lipper that, by practice, maintain a mix of 40% to 60% equity securities, with the remainder in bonds and cash, returned +8.57%.2 You can find the Fund’s long-term performance data in the Performance Summary beginning on page 28.
Performance data represent past performance, which does not guarantee future results. Investment return and principal value will fluctuate, and you may have a gain or loss when you sell your shares. Current performance may differ from figures shown. Please visit franklintempleton.com or call (800) 342-5236 for most recent month-end performance.
| | | | | |
| Dividend Distributions* | | | |
| 10/1/13–9/30/14 | | | | |
| | | Dividend per Share (cents) | |
| | | | | | Advisor |
| Month | Class A | Class C | Class R | Class R6 | Class |
| October | 1.05 | 0.95 | 0.98 | 1.09 | 1.08 |
| November | 1.05 | 0.95 | 0.98 | 1.09 | 1.08 |
| December | 1.05 | 0.94 | 0.98 | 1.09 | 1.08 |
| January | 1.05 | 0.94 | 0.98 | 1.09 | 1.08 |
| February | 1.00 | 0.89 | 0.93 | 1.04 | 1.03 |
| March | 1.00 | 0.90 | 0.93 | 1.04 | 1.03 |
| April | 1.00 | 0.90 | 0.93 | 1.04 | 1.03 |
| May | 1.00 | 0.90 | 0.93 | 1.04 | 1.03 |
| June | 1.00 | 0.90 | 0.92 | 1.05 | 1.03 |
| July | 1.00 | 0.90 | 0.92 | 1.05 | 1.03 |
| August | 1.00 | 0.90 | 0.92 | 1.05 | 1.03 |
| September | 1.00 | 0.89 | 0.93 | 1.05 | 1.03 |
| Total | 12.20 | 10.96 | 11.33 | 12.72 | 12.56 |
*All Fund distributions will vary depending upon current market conditions, and past
distributions are not indicative of future trends.
Investment Strategy
By generally performing independent analysis of debt, convertible and equity securities, we search for undervalued or out-of-favor securities we believe offer opportunities for income today and significant growth tomorrow. We consider such factors as a company’s experience and managerial strength; its cash flow potential and profitability; its competitive positioning and advantages; its responsiveness to changes in interest rates and business conditions; debt maturity schedules and borrowing requirements; a company’s changing financial condition and market recognition of the change; and a security’s relative value based on such factors as anticipated cash flow, interest or dividend coverage, asset coverage and earnings.
1. Source: Morningstar.
2. Source: Lipper, a Thomson Reuters Company. For the 12-month period ended 9/30/14, this category consisted of 538 funds. Lipper calculations do not include sales
charges or expense subsidization by a fund’s manager. The Fund’s performance relative to the average may have differed if these and other factors had been considered.
The indexes are unmanaged and include reinvestment of any income or distributions. One cannot invest directly in an index, and an index is not representative of the
Fund’s portfolio.
See www.franklintempletondatasources.com for additional data provider information.
The dollar value, number of shares or principal amount, and names of all portfolio holdings are listed in the Fund’s Statement of Investments (SOI).
The SOI begins on page 78.
24 | Annual Report franklintempleton.com
FRANKLIN INCOME FUND
| | |
| Portfolio Breakdown | | |
| 9/30/14 | | |
| | % of Total | |
| | Net Assets | |
| Equity* | 60.6 | % |
| Utilities | 12.1 | % |
| Energy | 10.9 | % |
| Materials | 9.7 | % |
| Financials | 6.3 | % |
| Health Care | 5.1 | % |
| Information Technology | 4.7 | % |
| Industrials | 4.2 | % |
| Consumer Discretionary | 3.8 | % |
| Telecommunication Services | 3.0 | % |
| Consumer Staples | 0.8 | % |
| Fixed Income | 38.2 | % |
| Energy | 9.1 | % |
| Consumer Discretionary | 7.4 | % |
| Financials | 4.1 | % |
| Telecommunication Services | 3.9 | % |
| Information Technology | 3.5 | % |
| Materials | 3.1 | % |
| Health Care | 2.8 | % |
| Other | 4.3 | % |
| Short-Term Investments & Other Net Assets | 1.2 | % |
*Includes convertible bonds.
Manager’s Discussion
During the 12 months under review, we continued to strategically shift the Fund’s asset mix, and our equity holdings declined while our fixed income holdings increased. The Fund’s equity weighting fell from 63.4% to 60.6% of total net assets and its fixed income weighting rose from 35.1% to 38.2%. Our cash position decreased during the period from 1.5% to 1.2% of total net assets.
The Fund’s equity and fixed income positions contributed to returns during the period. The equity side of our portfolio benefited from positions in utilities, financials, energy and materials, as well as from smaller positions in other sectors. In fixed income, the Fund’s positions in communications, technology and energy were strong contributors. The Fund had few equity and fixed income detractors.
During the period, the Fund benefited from strong U.S. equity market performance that led all of the Fund’s equity sector positions to produce positive returns. At the sector level, the four largest sectors — utilities, financials, energy and materials —had the greatest positive effect.
The Fund’s largest equity sector weighting during the period was in utilities. Companies with relatively high commodity exposure such as Dynegy, Exelon and Entergy, as well as regulated utilities such as Duke Energy and PG&E, produced double-digit gains. Utilities continued to offer attractive dividend levels that appealed to many yield-oriented investors, especially as yields on Treasury bonds and other segments of the broader fixed income market remained near historically low levels. In this environment, we continued to find what we considered interesting energy infrastructure-related growth opportunities within the utilities sector, as individual companies invested in critical projects to fortify the U.S. electricity transmission grid, replaced aging gas pipelines, built facilities for the transport of liquefied natural gas and improved the ecological characteristics, such as reducing emissions, of their generating plants.
The Fund’s equity financials positions continued to be most concentrated among large U.S. banks, and the strong performance of Wells Fargo & Co., JPMorgan Chase & Co. and Bank of America helped Fund returns. We remained optimistic about the long-term outlook for financials because of improved loan growth, low credit losses, solid capital levels and better clarity on various regulatory measures that were gradually implemented following the 2008–2009 financial crisis. Net interest margins — a performance measurement that serves as a key driver of earnings at major U.S. banks — reached low levels at period-end, but we believe a possible gradual recovery could drive improved profitability for the U.S. banking sector.
Equity energy sector returns were boosted by solid gains among large integrated oil companies such as Royal Dutch Shell, BP and Total, which increased their production levels and focused on cash generation. As evidenced by these positions, in general, we identified what we considered exceptional energy sector investment opportunities on a global scale. We felt that certain companies offered similar geographic footprints but more attractive valuations, higher dividend yields and/or superior earnings growth potential than those available in the U.S. market. Pipeline operator The Williams Companies also added to returns.
Low natural gas prices during the period favorably impacted costs, capital allocation decisions and economic growth and drove the strong performance of The Dow Chemical Co. and LyondellBasell Industries, which led our materials equity sector positions.
franklintempleton.com Annual Report | 25
FRANKLIN INCOME FUND
Some other notable individual contributors included Intel, which benefited from improved demand for personal computer semiconductors. Strong product pipelines helped pharmaceutical companies Merck & Co. and Eli Lilly & Co. In addition, shares of defense contractor Lockheed Martin rose as revenue and profitability climbed throughout the period.
Although all of the Fund’s equity sectors contributed to absolute returns during the period, the consumer discretionary sector generated the lowest positive return. This was largely because of flat or negative share price movements by our positions in General Motors, Volkswagen International Finance and Lowe’s (sold by period-end). Individual detractors included several mining companies such as Newmont Mining, Barrick Gold and Goldcorp, which were pressured during the period by market price and production growth declines. Offshore oil and gas drilling companies Transocean, Diamond Offshore Drilling and Cobalt International were also weak during the period.
The Fund’s strongest fixed income performance during the fiscal year came from its higher credit quality holdings, while several of its lower credit quality holdings were among the largest detractors. This performance contrasted with that of 2013, when holdings rated CCC and B were among the Fund’s strongest performers. This dynamic was most notable near period-end when heightened concerns about slower economic growth and technical challenges in the broader fixed income market occurred after several strong years of performance.
Despite some challenges near period-end, most of the Fund’s fixed income sectors contributed to performance. Fixed income communications, technology and energy sectors made a significant impact on performance, while positions in the basic industry sector slightly detracted.3
Several of the Fund’s largest fixed income holdings were among the strongest performers. In the communications sector, iHeartCommunications delivered a double-digit return, and securities of Sprint Corp. benefited from improved operating fundamentals in recent quarters.
First Data, the Fund’s largest fixed income holding during the period, benefited from improved cash flow generation and a decline in leverage as a result of raising additional equity capital. Another information technology holding, Freescale Semiconductor, was also among the major contributors to Fund performance, largely because of an upgrade of the company’s credit ratings. Freescale also enjoyed improved operating cash flows from its automotive and wireless communications divisions. The company successfully refinanced its debt to reduce overall debt levels and drive down interest expense.
Several fixed income energy sector holdings also contributed to performance, including Chesapeake Energy, Sabine Pass LNG and SandRidge Energy.
Similar to the equity side of the portfolio, companies with exposure to precious and base metals as well as coal were among the Fund’s key individual fixed income detractors. Our positions in Walter Energy, Arch Coal and Alpha Natural Resources were relatively small, but these companies experienced price declines significant enough to rank among the Fund’s notable detractors in an otherwise strong performance period.
| | |
| Top Five Equity Holdings | | |
| 9/30/14 | | |
| Company | % of Total | |
| Sector/Industry | Net Assets | |
| |
| Royal Dutch Shell PLC | 1.9 | % |
| Energy | | |
| BP PLC | 1.5 | % |
| Energy | | |
| Pfizer Inc. | 1.4 | % |
| Health Care | | |
| Target Corp. | 1.3 | % |
| Consumer Discretionary | | |
| Exelon Corp., ord. & cvt. pfd. | 1.3 | % |
| Utilities | | |
| | |
| Top Five Fixed Income Holdings | | |
| and Senior Floating Rate Interests* | | |
| 9/30/14 | | |
| Company | % of Total | |
| Sector/Industry | Net Assets | |
| First Data Corp. | 2.1 | % |
| Information Technology | | |
| iHeartCommunications Inc. | 1.9 | % |
| Consumer Discretionary | | |
| JPMorgan Chase & Co. | 1.6 | % |
| Financials | | |
| Sprint Nextel Corp. | 1.2 | % |
| Telecommunication Services | | |
| Tenet Healthcare Corp. | 1.0 | % |
| Health Care | | |
| *Does not include convertible bonds. | | |
3. Communications holdings are in consumer discretionary and telecommunication services in the fixed income section of the SOI. Basic industry holdings are in materials
in the fixed income section of the SOI.
26 | Annual Report franklintempleton.com
FRANKLIN INCOME FUND
Thank you for your continued participation in Franklin Income Fund. We look forward to serving your future investment needs.

The foregoing information reflects our analysis, opinions and portfolio holdings as of September 30, 2014, the end of the reporting period. The way we implement our main investment strategies and the resulting portfolio holdings may change depending on factors such as market and economic conditions. These opinions may not be relied upon as investment advice or an offer for a particular security. The information is not a complete analysis of every aspect of any market, country, industry, security or the Fund. Statements of fact are from sources considered reliable, but the investment manager makes no representation or warranty as to their completeness or accuracy. Although historical performance is no guarantee of future results, these insights may help you understand our investment management philosophy.
franklintempleton.com Annual Report | 27
FRANKLIN INCOME FUND
Performance Summary as of September 30, 2014
Your dividend income will vary depending on dividends or interest paid by securities in the Fund’s portfolio, adjusted for operating expenses of each class. Capital gain distributions are net profits realized from the sale of portfolio securities. The performance tables and graphs do not reflect any taxes that a shareholder would pay on Fund dividends, capital gain distributions, if any, or any realized gains on the sale of Fund shares. Total return reflects reinvestment of the Fund’s dividends and capital gain distributions, if any, and any unrealized gains or losses.
| | | | | | |
| Net Asset Value | | | | | | |
| Share Class (Symbol) | | 9/30/14 | | 9/30/13 | | Change |
| A (FKINX) | $ | 2.48 | $ | 2.33 | +$ | 0.15 |
| C (FCISX) | $ | 2.50 | $ | 2.35 | +$ | 0.15 |
| R (FISRX) | $ | 2.44 | $ | 2.29 | +$ | 0.15 |
| R6 (FNCFX) | $ | 2.46 | $ | 2.31 | +$ | 0.15 |
| Advisor (FRIAX) | $ | 2.46 | $ | 2.31 | +$ | 0.15 |
| |
| |
| Distributions (10/1/13–9/30/14) | | | | | | |
| Dividend |
| Share Class | | Income | | | | |
| A | $ | 0.1220 | | | | |
| C | $ | 0.1096 | | | | |
| R | $ | 0.1133 | | | | |
| R6 | $ | 0.1272 | | | | |
| Advisor | $ | 0.1256 | | | | |
28 | Annual Report
franklintempleton.com
FRANKLIN INCOME FUND
PERFORMANCE SUMMARY
Performance as of 9/30/141
Cumulative total return excludes sales charges. Average annual total return and value of $10,000 investment include maximum sales charges. Class A: 4.25% maximum initial sales charge; Class C: 1% contingent deferred sales charge in first year only;
Class R/R6/Advisor Class: no sales charges.
| | | | | | | | | | |
| | | Cumulative | | | Average Annual | | | Value of | Total Annual | |
| Share Class | | Total Return2 | | | Total Return3 | | $ | 10,000 Investment4 | Operating Expenses5 | |
| A | | | | | | | | | 0.62 | % |
| 1-Year | + | 11.86 | % | + | 7.26 | % | $ | 10,726 | | |
| 5-Year | + | 69.85 | % | + | 10.20 | % | $ | 16,250 | | |
| 10-Year | + | 104.27 | % | + | 6.93 | % | $ | 19,539 | | |
| C | | | | | | | | | 1.12 | % |
| 1-Year | + | 11.19 | % | + | 10.19 | % | $ | 11,019 | | |
| 5-Year | + | 65.69 | % | + | 10.63 | % | $ | 16,569 | | |
| 10-Year | + | 94.05 | % | + | 6.85 | % | $ | 19,405 | | |
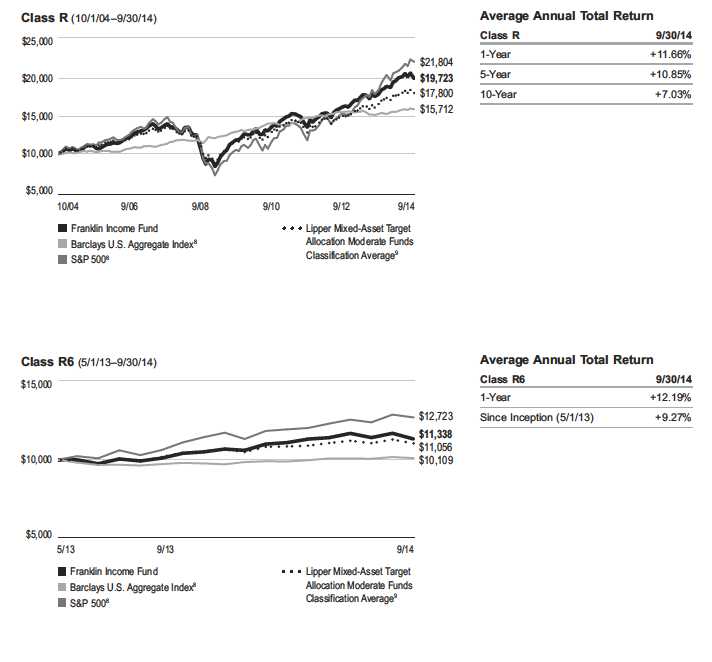
| R | | | | | | | | | 0.97 | % |
| 1-Year | + | 11.66 | % | + | 11.66 | % | $ | 11,166 | | |
| 5-Year | + | 67.40 | % | + | 10.85 | % | $ | 16,740 | | |
| 10-Year | + | 97.23 | % | + | 7.03 | % | $ | 19,723 | | |
| R6 | | | | | | | | | 0.39 | % |
| 1-Year | + | 12.19 | % | + | 12.19 | % | $ | 11,219 | | |
| Since Inception (5/1/13) | + | 13.38 | % | + | 9.27 | % | $ | 11,338 | | |
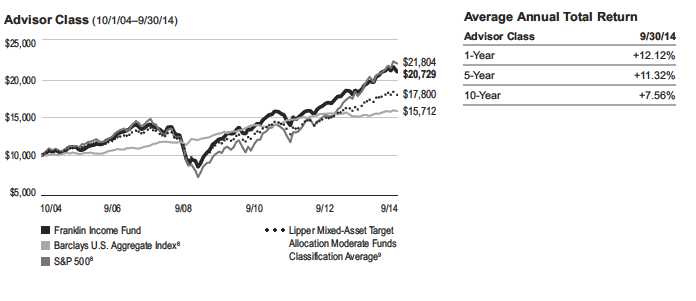
| Advisor | | | | | | | | | 0.47 | % |
| 1-Year | + | 12.12 | % | + | 12.12 | % | $ | 11,212 | | |
| 5-Year | + | 70.95 | % | + | 11.32 | % | $ | 17,095 | | |
| 10-Year | + | 107.29 | % | + | 7.56 | % | $ | 20,729 | | |
| | | | | | |
| | Distribution | | 30-Day Standardized Yield7 | |
| Share Class | Rate6 | | (with waiver) | | (without waiver) | |
| A | 4.63 | % | 3.45 | % | 3.45 | % |
| C | 4.27 | % | 3.11 | % | 3.11 | % |
| R | 4.57 | % | 3.24 | % | 3.24 | % |
| R6 | 5.12 | % | 3.85 | % | 3.85 | % |
| Advisor | 5.02 | % | 3.76 | % | 3.76 | % |
Performance data represent past performance, which does not guarantee future results. Investment return and principal value will fluctuate, and you may have a gain or loss when you sell your shares. Current performance may differ from figures shown. For most recent month-end performance, go to franklintempleton.com or call (800) 342-5236.
franklintempleton.com Annual Report | 29
FRANKLIN INCOME FUND
PERFORMANCE SUMMARY
Total Return Index Comparison for a Hypothetical $10,000 Investment1
Total return represents the change in value of an investment over the periods shown. It includes any current, applicable, maximum sales charge, Fund expenses, account fees and reinvested distributions. The unmanaged indexes include reinvestment of any income or distributions. They differ from the Fund in composition and do not pay management fees or expenses. One cannot invest directly in an index.
30 | Annual Report franklintempleton.com
FRANKLIN INCOME FUND
PERFORMANCE SUMMARY
Total Return Index Comparison for a Hypothetical $10,000 Investment1 (continued)
franklintempleton.com Annual Report | 31
FRANKLIN INCOME FUND
PERFORMANCE SUMMARY
Total Return Index Comparison for a Hypothetical $10,000 Investment1 (continued)
All investments involve risks, including possible loss of principal. Stock prices fluctuate, sometimes rapidly and dramatically, due to factors affecting individual
companies, particular industries or sectors, or general market conditions. The Fund’s share price and yield will be affected by interest rate movements. Bond
prices generally move in the opposite direction of interest rates. Thus, as prices of bonds in the Fund adjust to a rise in interest rates, the Fund’s share price
may decline. Changes in the financial strength of a bond issuer or in a bond’s credit rating may affect its value. The Fund’s portfolio includes a substantial
portion of higher yielding, lower rated corporate bonds because of the relatively higher yields they offer. Floating-rate loans are lower rated, higher yielding
instruments, which are subject to increased risk of default and can potentially result in loss of principal. These securities carry a greater degree of credit risk
relative to investment-grade securities. The Fund is actively managed but there is no guarantee that the manager’s investment decisions will produce the desired
results. The Fund’s prospectus also includes a description of the main investment risks.
| |
| Class C: | These shares have higher annual fees and expenses than Class A shares. |
| Class R: | Shares are available to certain eligible investors as described in the prospectus. These shares have higher annual fees and expenses than Class A shares. |
| Class R6: | Shares are available to certain eligible investors as described in the prospectus. |
| Advisor Class: | Shares are available to certain eligible investors as described in the prospectus. |
1. The Fund has a fee waiver associated with its investments in a Franklin Templeton money fund, contractually guaranteed through at least its current fiscal year-end.
Fund investment results reflect the fee waiver, to the extent applicable; without this reduction, the results would have been lower.
2. Cumulative total return represents the change in value of an investment over the periods indicated.
3. Average annual total return represents the average annual change in value of an investment over the periods indicated.
4. These figures represent the value of a hypothetical $10,000 investment in the Fund over the periods indicated.
5. Figures are as stated in the Fund’s current prospectus. In periods of market volatility, assets may decline significantly, causing total annual Fund operating expenses to
become higher than the figures shown.
6. Distribution rate is based on an annualization of the respective class’s September dividend and the maximum offering price (NAV for Classes C, R, R6 and Advisor) per
share on 9/30/14.
7. The 30-day standardized yield for the 30 days ended 9/30/14 reflects an estimated yield to maturity (assuming all portfolio securities are held to maturity). It should be
regarded as an estimate of the Fund’s rate of investment income, and it may not equal the Fund’s actual income distribution rate (which reflects the Fund’s past dividends
paid to shareholders) or the income reported in the Fund’s financial statements.
8. Source: Morningstar. The S&P 500 is a market capitalization-weighted index of 500 stocks designed to measure total U.S. equity market performance. The Barclays U.S.
Aggregate Index is a market capitalization-weighted index representing the U.S. investment-grade, fixed-rate, taxable bond market with index components for government
and corporate, mortgage pass-through and asset-backed securities. All issues included are SEC registered, taxable, dollar denominated and nonconvertible, must have
at least one year to final maturity and must be rated investment grade (Baa3/BBB-/BBB- or higher) using the middle rating of Moody’s, Standard & Poor’s and Fitch,
respectively.
9. Source: Lipper, a Thomas Reuters Company. The Lipper Mixed-Asset Target Allocation Moderate Funds Classification Average is calculated by averaging the total
returns of all funds within the Lipper Mixed-Asset Target Allocation Moderate Funds classification in the Lipper Open-End underlying funds universe. Lipper Mixed-Asset
Target Allocation Moderate Funds are defined as funds that, by portfolio practice, maintain a mix of between 40%–60% equity securities, with the remainder invested in
bonds, cash and cash equivalents. For the 12-month period ended 9/30/14, there were 538 funds in this category. Lipper calculations do not include sales charges or
expense subsidization by a fund’s manager. The Fund’s performance relative to the average may have differed if these and other factors had been considered.
See www.franklintempletondatasources.com for additional data provider information.
32 | Annual Report franklintempleton.com
FRANKLIN INCOME FUND
Your Fund’s Expenses
As a Fund shareholder, you can incur two types of costs:
- Transaction costs, including sales charges (loads) on Fund purchases; and
- Ongoing Fund costs, including management fees, distribu- tion and service (12b-1) fees, and other Fund expenses. All mutual funds have ongoing costs, sometimes referred to as operating expenses.
The following table shows ongoing costs of investing in the Fund and can help you understand these costs and compare them with those of other mutual funds. The table assumes a $1,000 investment held for the six months indicated.
Actual Fund Expenses
The first line (Actual) for each share class listed in the table provides actual account values and expenses. The “Ending Account Value” is derived from the Fund’s actual return, which includes the effect of Fund expenses.
You can estimate the expenses you paid during the period by following these steps. Of course, your account value and expenses will differ from those in this illustration:
| 1. | Divide your account value by $1,000. |
| | If an account had an $8,600 value, then $8,600 ÷ $1,000 = 8.6. |
| 2. | Multiply the result by the number under the heading “Expenses Paid During Period.” |
| | If Expenses Paid During Period were $7.50, then 8.6 x $7.50 = $64.50. |
In this illustration, the estimated expenses paid this period are $64.50.
Hypothetical Example for Comparison with Other Funds
Information in the second line (Hypothetical) for each class in the table can help you compare ongoing costs of investing in the Fund with those of other mutual funds. This information may not be used to estimate the actual ending account balance or expenses you paid during the period. The hypothetical “Ending Account Value” is based on the actual expense ratio for each class and an assumed 5% annual rate of return before expenses, which does not represent the Fund’s actual return. The figure under the heading “Expenses Paid During Period” shows the hypothetical expenses your account would have incurred under this scenario. You can compare this figure with the 5% hypothetical examples that appear in shareholder reports of other funds.
Please note that expenses shown in the table are meant to highlight ongoing costs and do not reflect any transaction costs, such as sales charges. Therefore, the second line for each class is useful in comparing ongoing costs only, and will not help you compare total costs of owning different funds. In addition, if transaction costs were included, your total costs would have been higher. Please refer to the Fund prospectus for additional information on operating expenses.
franklintempleton.com Annual Report | 33
FRANKLIN INCOME FUND
YOUR FUND’S EXPENSES
| | | | | | |
| | | Beginning Account | | Ending Account | | Expenses Paid During |
| Share Class | | Value 4/1/14 | | Value 9/30/14 | | Period* 4/1/14–9/30/14 |
| A | | | | | | |
| Actual | $ | 1,000 | $ | 1,019.90 | $ | 3.09 |
| Hypothetical (5% return before expenses) | $ | 1,000 | $ | 1,022.01 | $ | 3.09 |
| C | | | | | | |
| Actual | $ | 1,000 | $ | 1,013.20 | $ | 5.60 |
| Hypothetical (5% return before expenses) | $ | 1,000 | $ | 1,019.50 | $ | 5.62 |
| R | | | | | | |
| Actual | $ | 1,000 | $ | 1,018.30 | $ | 4.86 |
| Hypothetical (5% return before expenses) | $ | 1,000 | $ | 1,020.26 | $ | 4.86 |
| R6 | | | | | | |
| Actual | $ | 1,000 | $ | 1,021.10 | $ | 1.93 |
| Hypothetical (5% return before expenses) | $ | 1,000 | $ | 1,023.16 | $ | 1.93 |
| Advisor | | | | | | |
| Actual | $ | 1,000 | $ | 1,020.70 | $ | 2.33 |
| Hypothetical (5% return before expenses) | $ | 1,000 | $ | 1,022.76 | $ | 2.33 |
*Expenses are calculated using the most recent six-month expense ratio, net of expense waivers annualized for each class (A: 0.61%;
C: 1.11%; R: 0.96%; R6: 0.38%; and Advisor: 0.46%), multiplied by the average account value over the period, multiplied by 183/365 to
reflect the one-half year period.
34 | Annual Report
franklintempleton.com
Franklin U.S. Government Securities Fund
This annual report for Franklin U.S. Government Securities Fund covers the fiscal year ended September 30, 2014.
Your Fund’s Goal and Main Investments
The Fund seeks income by investing at least 80% of its net assets in U.S. government securities. The Fund presently invests substantially all of its assets in Government National Mortgage Association obligations (Ginnie Maes).
Since 1983, the Fund has invested substantially in Ginnie Mae securities, which carry a guarantee backed by the full faith and credit of the U.S. government as to the timely payment of interest and principal.1 Issued by the Government National Mortgage Association (GNMA), Ginnie Maes have been among the highest yielding U.S. government obligations available.
Performance data represent past performance, which does not guarantee future results. Investment return and principal value will fluctuate, and you may have a gain or loss when you sell your shares. Current performance may differ from figures shown. Please visit franklintempleton.com or call (800) 342-5236 for most recent month-end performance.
| | |
| Portfolio Breakdown | | |
| 9/30/14 | | |
| | % of Total | |
| | Investments | |
| GNMA | 98.6 | % |
| Short-Term Investments | 1.4 | % |
Performance Overview
The Fund’s Class A shares generated a +2.80% cumulative total return for the 12 months under review. In comparison, the Fund’s peers, as measured by the Lipper GNMA Funds Classification Average, which consists of funds chosen by Lipper that invest primarily in GNMAs, posted a +3.24% total return.2 The Barclays U.S. Government Index: Intermediate
Component, the intermediate component of the Barclays U.S. Government Index, returned +1.14% for the same period.3 The Fund’s return reflects the effect of management fees and expenses, while the Barclays U.S. Government Index: Intermediate Component does not have such costs. You can find the Fund’s long-term performance data in the Performance Summary beginning on page 37.
Investment Strategy
We currently invest the Fund’s assets predominantly in GNMA obligations. We analyze securities using proprietary models to help us identify attractive investment opportunities. The Fund’s short-term investments may include short-term government securities and cash or cash equivalents.
| | | | | |
| Dividend Distributions* | | | |
| 10/1/13–9/30/14 | | | | |
| | | Dividend per Share (cents) | |
| | | | | | Advisor |
| Month | Class A | Class C | Class R | Class R6 | Class |
| October | 1.99 | 1.71 | 1.79 | 2.15 | 2.07 |
| November | 2.00 | 1.73 | 1.81 | 2.15 | 2.08 |
| December | 2.02 | 1.74 | 1.83 | 2.18 | 2.10 |
| January | 1.92 | 1.63 | 1.72 | 2.08 | 2.00 |
| February | 1.97 | 1.72 | 1.79 | 2.12 | 2.04 |
| March | 1.93 | 1.65 | 1.74 | 2.09 | 2.01 |
| April | 1.93 | 1.66 | 1.74 | 2.09 | 2.01 |
| May | 1.88 | 1.60 | 1.68 | 2.04 | 1.96 |
| June | 1.88 | 1.61 | 1.69 | 2.04 | 1.96 |
| July | 1.85 | 1.57 | 1.65 | 1.99 | 1.93 |
| August | 1.81 | 1.53 | 1.62 | 1.95 | 1.89 |
| September | 1.84 | 1.57 | 1.66 | 1.98 | 1.92 |
| Total | 23.02 | 19.72 | 20.72 | 24.86 | 23.97 |
*All Fund distributions will vary depending upon current market conditions, and past
distributions are not indicative of future trends.
1. Securities owned by the Fund, but not shares of the Fund, are guaranteed by the U.S. government, its agencies or instrumentalities as to timely payment of principal and
interest. The Fund’s yield and share price are not guaranteed and will vary with market conditions.
2. Source: Lipper, a Thomson Reuters Company. For the 12-month period ended 9/30/14, there were 66 funds in this category. Lipper calculations do not include sales
charges or expense subsidization by a fund’s manager. The Fund’s performance relative to the average may have differed if these or other factors had been considered.
3. Source: Morningstar.
The indexes are unmanaged and include reinvestment of any income or distributions. One cannot invest directly in an index, and an index is not representative of the
Fund’s portfolio.
See www.franklintempletondatasources.com for additional data provider information.
The dollar value, number of shares or principal amount, and names of all portfolio holdings are listed in the Fund’s Statement of Investments (SOI).
The SOI begins on page 104.
franklintempleton.com Annual Report | 35
FRANKLIN U.S. GOVERNMENT SECURITIES FUND
Manager’s Discussion
U.S. economic trends were generally encouraging during the period. Economic activity rebounded in the second quarter of 2014 after a slowdown in the first quarter largely because of severe winter weather. Retail sales missed consensus expectations but rose during the period. Housing prices surpassed those from the previous year, and inflation was subdued. Near period-end, the Fed indicated it could end its bond-buying program in October 2014, contingent on economic data. The Fed also stated it would keep interest rates low after the program’s termination.
GNMA mortgage-backed securities (MBS) provided an income opportunity over Treasuries as the GNMA current coupon yielded 2.92% at period-end, compared to five- and 10-year Treasuries, which yielded 1.78% and 2.52%.
Mortgages outpaced Treasuries during the period as the agency mortgage market has benefited from continued, low interest rates since the beginning of 2014. We feel that if the U.S. economy continues to strengthen in line with the Fed’s expectations, the Fed could terminate its purchases of MBS later in the year. In our view, agency mortgages were fully valued. Questions still remained, however, about the demand source for agency MBS after the Fed ends its buying program. We felt demand from banks, mortgage real estate investment trusts, overseas investors and domestic money managers would need to rise to compensate for the Fed’s reduced presence in the MBS sector once the Fed ends its stimulus measures. Despite the low interest rate and mortgage rate environment over the period, mortgage credit issuance continued to be constrained and actual prepayment levels remained relatively low.
Within the agency mortgage pass-through sector, Fannie Mae MBS lagged their Ginnie Mae MBS and Freddie Mac MBS counterparts. Within Ginnie Maes, higher coupon 5.5% and 6.0% securities were the best performers from an excess returns perspective, while lower coupon 3.5% and 4.0% securities underperformed.
The Fund maintains a conservative, disciplined investment strategy and invests entirely in GNMA mortgage pass-throughs, which remain the only MBS that are backed by the full faith and credit of the U.S. government — the same guarantee applicable to U.S. Treasuries.1 Our collateral-intensive research approach can allow us to uncover dislocations across the GNMA markets and associated misvaluation of prepayment risk. We continue to focus on specified pools where we believe our experience and continual investment in new technologies help us uncover these discrepancies.
During the period, we were more weighted toward GNMA IIs (pools of mortgages from multiple issuers) than GNMA Is (pools of mortgages from single issuers). Over the period, we added to GNMA II 3.5% to 4.0% coupons while reducing exposure to 4.0% to 4.5% coupons. Our heaviest allocation was in 4.0% through 5.0% coupons. The Fund’s overweighted position relative to the benchmark in higher coupon 5.5% to 6.0% GNMA securities benefited performance as did the Fund’s underweighting in 5.0% coupon GNMAs, while the Fund’s allocation to 3.5% and 4.0% coupon GNMAs generally detracted from performance.
Thank you for your continued participation in Franklin U.S. Government Securities Fund. We welcome your comments and questions and look forward to serving your investment needs in the years ahead.

The foregoing information reflects our analysis, opinions and portfolio holdings as of September 30, 2014, the end of the reporting period. The way we implement our main investment strategies and the resulting portfolio holdings may change depending on factors such as market and economic conditions. These opinions may not be relied upon as investment advice or an offer for a particular security. The information is not a complete analysis of every aspect of any market, country, industry, security or the Fund. Statements of fact are from sources considered reliable, but the investment manager makes no representation or warranty as to their completeness or accuracy. Although historical performance is no guarantee of future results, these insights may help you understand our investment management philosophy.
36 | Annual Report franklintempleton.com
FRANKLIN U.S. GOVERNMENT SECURITIES FUND
Performance Summary as of September 30, 2014
Your dividend income will vary depending on dividends or interest paid by securities in the Fund’s portfolio, adjusted for operating expenses of each class. Capital gain distributions are net profits realized from the sale of portfolio securities. The performance tables and graphs do not reflect any taxes that a shareholder would pay on Fund dividends, capital gain distributions, if any, or any realized gains on the sale of Fund shares. Total return reflects reinvestment of the Fund’s dividends and capital gain distributions, if any, and any unrealized gains or losses.
| | | | | | |
| Net Asset Value | | | | | | |
| Share Class (Symbol) | | 9/30/14 | | 9/30/13 | | Change |
| A (FKUSX) | $ | 6.48 | $ | 6.53 | -$ | 0.05 |
| C (FRUGX) | $ | 6.44 | $ | 6.49 | -$ | 0.05 |
| R (FUSRX) | $ | 6.48 | $ | 6.53 | -$ | 0.05 |
| R6 (FGORX) | $ | 6.50 | $ | 6.55 | -$ | 0.05 |
| Advisor (FUSAX) | $ | 6.50 | $ | 6.55 | -$ | 0.05 |
| |
| |
| Distributions (10/1/13–9/30/14) | | | | | | |
| Dividend |
| Share Class | | Income | | | | |
| A | $ | 0.2302 | | | | |
| C | $ | 0.1972 | | | | |
| R | $ | 0.2072 | | | | |
| R6 | $ | 0.2486 | | | | |
| Advisor | $ | 0.2397 | | | | |
franklintempleton.com Annual Report | 37
FRANKLIN U.S. GOVERNMENT SECURITIES FUND
PERFORMANCE SUMMARY
Performance as of 9/30/141
Cumulative total return excludes sales charges. Average annual total returns include maximum sales charges. Class A: 4.25% maximum initial sales charge; Class C: 1% contingent deferred sales charge in first year only; Class R/R6/Advisor Class: no sales charges.
| | | | | | | | |
| | | Cumulative | | | Average Annual | | Total Annual | |
| Share Class | | Total Return2 | | | Total Return3 | | Operating Expenses4 | |
| A | | | | | | | 0.73 | % |
| 1-Year | + | 2.80 | % | | -1.57 | % | | |
| 5-Year | + | 16.97 | % | + | 2.28 | % | | |
| 10-Year | + | 49.44 | % | + | 3.64 | % | | |
| C | | | | | | | 1.23 | % |
| 1-Year | + | 2.30 | % | + | 1.31 | % | | |
| 5-Year | + | 13.94 | % | + | 2.65 | % | | |
| 10-Year | + | 42.03 | % | + | 3.57 | % | | |
| R | | | | | | | 1.08 | % |
| 1-Year | + | 2.44 | % | + | 2.44 | % | | |
| 5-Year | + | 14.88 | % | + | 2.81 | % | | |
| 10-Year | + | 44.10 | % | + | 3.72 | % | | |
| R6 | | | | | | | 0.46 | % |
| 1-Year | + | 3.08 | % | + | 3.08 | % | | |
| Since Inception (5/1/13) | + | 1.51 | % | + | 1.06 | % | | |
| Advisor | | | | | | | 0.58 | % |
| 1-Year | + | 2.94 | % | + | 2.94 | % | | |
| 5-Year | + | 17.79 | % | + | 3.33 | % | | |
| 10-Year | + | 51.59 | % | + | 4.25 | % | | |
| | | | | | |
| | Distribution | | 30-Day Standardized Yield6 | |
| Share Class | Rate5 | | (with waiver) | | (without waiver) | |
| A | 3.26 | % | 2.42 | % | 2.42 | % |
| C | 2.93 | % | 2.03 | % | 2.03 | % |
| R | 3.07 | % | 2.18 | % | 2.18 | % |
| R6 | 3.66 | % | 2.78 | % | 2.78 | % |
| Advisor | 3.54 | % | 2.69 | % | 2.69 | % |
Performance data represent past performance, which does not guarantee future results. Investment return and principal value
will fluctuate, and you may have a gain or loss when you sell your shares. Current performance may differ from figures shown.
For most recent month-end performance, go to franklintempleton.com or call (800) 342-5236.
38 | Annual Report franklintempleton.com
FRANKLIN U.S. GOVERNMENT SECURITIES FUND
PERFORMANCE SUMMARY
Total Return Index Comparison for a Hypothetical $10,000 Investment1
Total return represents the change in value of an investment over the periods shown. It includes any applicable, maximum sales charge, Fund expenses, account fees and reinvested distributions. The unmanaged indexes include reinvestment of any income or distributions. They differ from the Fund in composition and do not pay management fees or expenses. One cannot invest directly in an index.
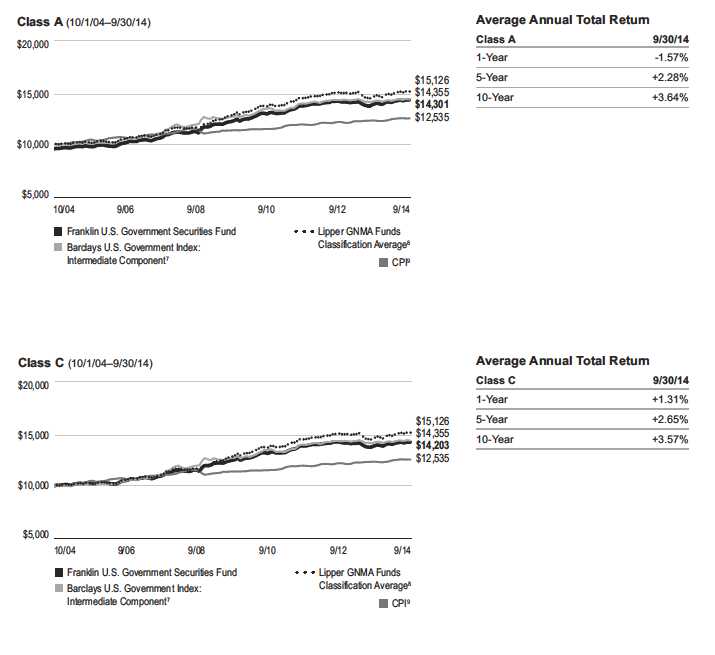
franklintempleton.com Annual Report | 39
FRANKLIN U.S. GOVERNMENT SECURITIES FUND
PERFORMANCE SUMMARY
Total Return Index Comparison for a Hypothetical $10,000 Investment1 (continued)
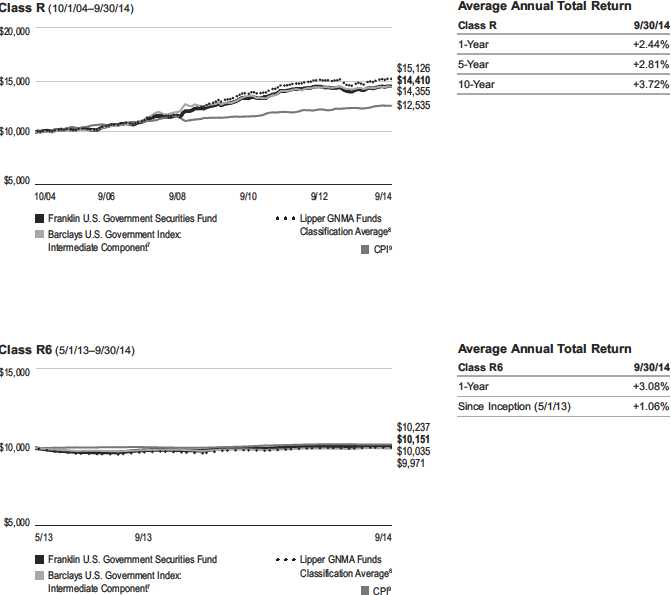
40 | Annual Report franklintempleton.com
FRANKLIN U.S. GOVERNMENT SECURITIES FUND
PERFORMANCE SUMMARY
Total Return Index Comparison for a Hypothetical $10,000 Investment1 (continued)
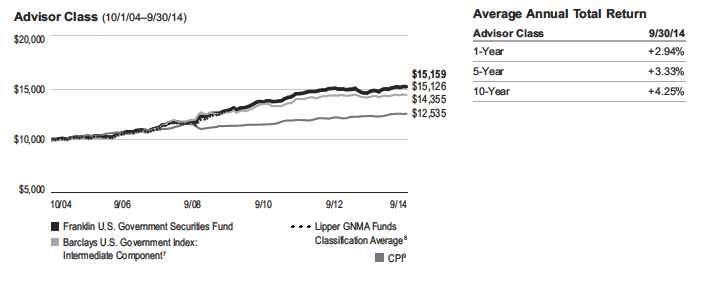
All investments involve risks, including possible loss of principal. The Fund’s share price and yield will be affected by interest rate movements and mortgage
prepayments. Bond prices generally move in the opposite direction of interest rates. Thus, as prices of bonds in the Fund adjust to a rise in interest rates, the
Fund’s share price may decline. Changes in the financial strength of a bond issuer or in a bond’s credit rating may affect its value. The Fund is actively managed
but there is no guarantee that the manager’s investment decisions will produce the desired results. The Fund’s prospectus also includes a description of the
main investment risks.
| |
| Class C: | These shares have higher annual fees and expenses than Class A shares. |
| Class R: | Shares are available to certain eligible investors as described in the prospectus. These shares have higher annual fees and expenses than Class A shares. |
| Class R6: | Shares are available to certain eligible investors as described in the prospectus. |
| Advisor Class: | Shares are available to certain eligible investors as described in the prospectus. |
1. The Fund has a fee waiver associated with its investments in a Franklin Templeton money fund, contractually guaranteed through at least its current fiscal year-end.
Fund investment results reflect the fee waiver, to the extent applicable; without these reductions, the results would have been lower.
2. Cumulative total return represents the change in value of an investment over the periods indicated.
3. Average annual total return represents the average annual change in value of an investment over the periods indicated.
4. Figures are as stated in the Fund’s current prospectus. In periods of market volatility, assets may decline significantly, causing total annual Fund operating expenses to
become higher than the figures shown.
5. Distribution rate is based on an annualization of the respective class’s September dividend and the maximum offering price (NAV for Classes C, R, R6 and Advisor) per
share on 9/30/14.
6. The 30-day standardized yield for the 30 days ended 9/30/14 reflects an estimated yield to maturity (assuming all portfolio securities are held to maturity). It should be
regarded as an estimate of the Fund’s rate of investment income, and it may not equal the Fund’s actual income distribution rate (which reflects the Fund’s past dividends
paid to shareholders) or the income reported in the Fund’s financial statements.
7. Source: Morningstar. The Barclays U.S. Government Index: Intermediate Component is the intermediate component of the Barclays U.S. Government Index, which
includes public obligations of the U.S. Treasury with at least one year to final maturity and publicly issued debt of U.S. government agencies, quasi-federal corporations, and
corporate or foreign debt guaranteed by the U.S. government.
8. Source: Lipper, a Thomson Reuters Company. The Lipper GNMA Funds Classification Average is calculated by averaging the total return for all funds within the Lipper
GNMA Funds classification in the Lipper Open-End underlying funds universe for the period indicated. Lipper GNMA Funds are defined as funds that invest primarily in
Government National Mortgage Association securities. For the 12-month period ended 9/30/14, there were 66 funds in this category. Lipper calculations do not include sales
charges or expense subsidization by a fund’s manager. The Fund’s performance relative to the average may have differed if these or other factors had been considered.
9. Source: Bureau of Labor Statistics, bls.gov/cpi. The Consumer Price Index (CPI) is a commonly used measure of the inflation rate.
See www.franklintempletondatasources.com for additional data provider information.
franklintempleton.com Annual Report | 41
FRANKLIN U.S. GOVERNMENT SECURITIES FUND
Your Fund’s Expenses
As a Fund shareholder, you can incur two types of costs:
- Transaction costs, including sales charges (loads) on Fund purchases; and
- Ongoing Fund costs, including management fees, distribu- tion and service (12b-1) fees, and other Fund expenses. All mutual funds have ongoing costs, sometimes referred to as operating expenses.
The following table shows ongoing costs of investing in the Fund and can help you understand these costs and compare them with those of other mutual funds. The table assumes a $1,000 investment held for the six months indicated.
Actual Fund Expenses
The first line (Actual) for each share class listed in the table provides actual account values and expenses. The “Ending Account Value” is derived from the Fund’s actual return, which includes the effect of Fund expenses.
You can estimate the expenses you paid during the period by following these steps. Of course, your account value and expenses will differ from those in this illustration:
| 1. | Divide your account value by $1,000. |
| | If an account had an $8,600 value, then $8,600 ÷ $1,000 = 8.6. |
| 2. | Multiply the result by the number under the heading “Expenses Paid During Period.” |
| | If Expenses Paid During Period were $7.50, then 8.6 x $7.50 = $64.50. |
In this illustration, the estimated expenses paid this period are $64.50.
Hypothetical Example for Comparison with Other Funds
Information in the second line (Hypothetical) for each class in the table can help you compare ongoing costs of investing in the Fund with those of other mutual funds. This information may not be used to estimate the actual ending account balance or expenses you paid during the period. The hypothetical “Ending Account Value” is based on the actual expense ratio for each class and an assumed 5% annual rate of return before expenses, which does not represent the Fund’s actual return. The figure under the heading “Expenses Paid During Period” shows the hypothetical expenses your account would have incurred under this scenario. You can compare this figure with the 5% hypothetical examples that appear in shareholder reports of other funds.
Please note that expenses shown in the table are meant to highlight ongoing costs and do not reflect any transaction costs, such as sales charges. Therefore, the second line for each class is useful in comparing ongoing costs only, and will not help you compare total costs of owning different funds. In addition, if transaction costs were included, your total costs would have been higher. Please refer to the Fund prospectus for additional information on operating expenses.
42 | Annual Report franklintempleton.com
FRANKLIN U.S. GOVERNMENT SECURITIES FUND
YOUR FUND’S EXPENSES
| | | | | | |
| | | Beginning Account | | Ending Account | | Expenses Paid During |
| Share Class | | Value 4/1/14 | | Value 9/30/14 | | Period* 4/1/14–9/30/14 |
| A | | | | | | |
| Actual | $ | 1,000 | $ | 1,017.30 | $ | 3.74 |
| Hypothetical (5% return before expenses) | $ | 1,000 | $ | 1,021.36 | $ | 3.75 |
| C | | | | | | |
| Actual | $ | 1,000 | $ | 1,014.80 | $ | 6.31 |
| Hypothetical (5% return before expenses) | $ | 1,000 | $ | 1,018.80 | $ | 6.33 |
| R | | | | | | |
| Actual | $ | 1,000 | $ | 1,015.50 | $ | 5.56 |
| Hypothetical (5% return before expenses) | $ | 1,000 | $ | 1,019.55 | $ | 5.57 |
| R6 | | | | | | |
| Actual | $ | 1,000 | $ | 1,018.70 | $ | 2.38 |
| Hypothetical (5% return before expenses) | $ | 1,000 | $ | 1,022.71 | $ | 2.38 |
| Advisor | | | | | | |
| Actual | $ | 1,000 | $ | 1,018.00 | $ | 3.04 |
| Hypothetical (5% return before expenses) | $ | 1,000 | $ | 1,022.06 | $ | 3.04 |
*Expenses are calculated using the most recent six-month expense ratio, net of expense waivers, annualized for each class (A: 0.74%;
C: 1.25%; R: 1.10%; R6: 0.47%; and Advisor: 0.60%), multiplied by the average account value over the period, multiplied by 183/365 to
reflect the one-half year period.
franklintempleton.com Annual Report | 43
Franklin Utilities Fund
This annual report for Franklin Utilities Fund covers the fiscal year ended September 30, 2014.
Your Fund’s Goals and Main Investments
The Fund seeks both capital appreciation and current income by investing at least 80% of its net assets in public utility company securities.
Performance Overview
The Fund’s Class A shares delivered a +17.24% cumulative total return for the 12 months under review. In comparison, the Standard & Poor’s 500 (S&P 500) Index, which is a broad measure of U.S. stock performance, generated a +19.73% total return, and the S&P 500 Utilities Index, which measures the performance of all utilities stocks in the S&P 500 Index, produced a +17.13% total return.1 You can find the Fund’s long-term performance data in the Performance Summary beginning on page 47.
Performance data represent past performance, which does not guarantee future results. Investment return and principal value will fluctuate, and you may have a gain or loss when you sell your shares. Current performance may differ from figures shown. Please visit franklintempleton.com or call (800) 342-5236 for most recent month-end performance.
Investment Strategy
We search for the best return opportunities available in the global utilities arena with a specific focus on the U.S. electricity and gas sector. Generally, we look for companies producing a high percentage of earnings from regulated utility franchise operations.
Manager’s Discussion
For the 12 months under review, the utilities and energy sectors underperformed the S&P 500 Index.2 However, relative to the S&P 500 Utilities Index, our investment in off-benchmark
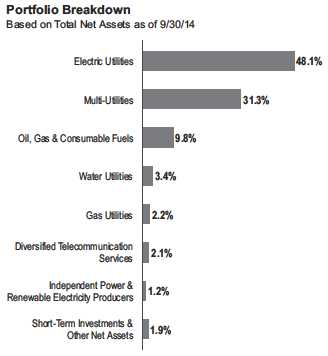
energy sector stocks helped the Fund’s performance during the 12-month period.3
Electric utilities led the Fund’s notable contributors to absolute performance. Edison International reported healthy earnings during the period, driven by its Southern California Edison subsidiary’s rate base growth, infrastructure investments, operational efficiencies and income tax benefits. Edison also issued positive earnings guidance for 2014 based on its expectation of continuing these trends. Earnings for Florida-based utility NextEra Energy, a leading clean energy developer and operator in the U.S. and Canada, were comparable to the prior year’s. The company benefited from an improved Florida economy as well as from modernizing its Cape Canaveral plant and bringing into service its Riviera Beach Next Generation Clean Energy Center. It also strengthened its electric grid against
1. Source: Morningstar.
The indexes are unmanaged and include reinvested dividends. One cannot invest directly in an index, and an index is not representative of the Fund’s portfolio.
See www.franklintempletondatasources.com for additional data provider information.
2. The utilities sector comprises electric utilities, gas utilities, multi-utilities and water utilities in the SOI.
3. The energy sector comprises oil, gas and consumable fuels in the SOI.
The dollar value, number of shares or principal amount, and names of all portfolio holdings are listed in the Fund’s Statement of Investments (SOI).
The SOI begins on page 113.
44 | Annual Report franklintempleton.com
FRANKLIN UTILITIES FUND
storms, constructed more solar power generation and signed new wind power purchase agreements. American Electric Power is one of the largest U.S. electric utilities and operates in 11 states. Its share price rallied resulting from increased earnings, dividends and earnings guidance. These results largely stemmed from rate base growth through the company’s investment in core regulated operations, including its transmission business, and from strong winter power demand as well as cost savings achieved through sustainable process improvements.
| | |
| Top 10 Equity Holdings | | |
| 9/30/14 | | |
| Company | % of Total | |
| Sector/Industry | Net Assets | |
| |
| Edison International | 4.7 | % |
| Electric Utilities | | |
| Duke Energy Corp. | 4.7 | % |
| Electric Utilities | | |
| NextEra Energy Inc. | 4.7 | % |
| Electric Utilities | | |
| Sempra Energy | 4.5 | % |
| Multi-Utilities | | |
| Dominion Resources Inc. | 4.4 | % |
| Multi-Utilities | | |
| American Electric Power Co. Inc. | 3.8 | % |
| Electric Utilities | | |
| PG&E Corp. | 3.5 | % |
| Multi-Utilities | | |
| The Southern Co. | 3.4 | % |
| Electric Utilities | | |
| Exelon Corp. | 3.3 | % |
| Electric Utilities | | |
| The Williams Cos. Inc. | 3.0 | % |
| Oil, Gas & Consumable Fuels | | |
Multi-utilities also helped absolute results. Sempra Energy, owner of electric and natural gas utilities in California and South America as well as natural gas pipelines, storage facilities and terminals in the U.S. and Mexico, reported increased revenue and earnings during the period and raised its dividend. Sempra pursued growth by launching an initial public offering for a new energy company in Mexico. The company also made plans to export liquefied natural gas via Cameron LNG as well as to expand its Copper Mountain Solar complex in Nevada. Electric and gas utility National Grid, which provides electricity and gas in the U.K. and electricity in the northeastern U.S., developed new transmission and generation infrastructure in its regulated utility networks that performed well despite severe winter weather. The company efficiently managed costs and increased full-year earnings compared to its prior fiscal year, while improving network reliability and resilience.
In the energy sector, the share price of The Williams Cos., an integrated natural gas company, soared in June after the company agreed to acquire the remainder of Access Midstream Partners, a master limited partnership that gathers and transports natural gas and related liquids from oil wells in Texas, Pennsylvania and Oklahoma. Williams expected the partnership’s business to grow rapidly.
In contrast, a few Fund holdings lost value during the reporting period and hindered absolute Fund performance. Declining sales, low natural gas prices and higher operating expenses resulted in inconsistent profits, lower earnings guidance and the first dividend reduction in the 17-year history of FirstEnergy, which owns electricity providers in six eastern states. Increased use of home-generated solar energy by customers, among other factors, led the company to sell power plants, reduce spending and focus on regulated assets that provide more reliable returns than for those selling power to wholesale markets. Electric and natural gas utility ALLETE continued to expand its renewable energy portfolio through developing new projects, such as those proposed for its Minnesota Power Division. Although the company beat second-quarter earnings estimates, its share price declined near period-end. One more position, The Southern Company, despite contributing to results, underperformed the S&P 500 and S&P Utilities Indexes. Southern, one of the nation’s largest electric utilities in terms of customers and generation, was hampered by cost overruns on construction of its Kemper generation facility in Mississippi. Investors were concerned about the ongoing impact of those costs as well as potential cost expansion at the Vogtle site in Georgia as Southern constructs two new nuclear units, which are due to come on line in 2018.
franklintempleton.com Annual Report | 45
FRANKLIN UTILITIES FUND
Thank you for your continued participation in Franklin Utilities Fund. We look forward to serving your future investment needs.

The foregoing information reflects our analysis, opinions and portfolio holdings as of September 30, 2014, the end of the reporting period. The way we implement our main investment strategies and the resulting portfolio holdings may change depending on factors such as market and economic conditions. These opinions may not be relied upon as investment advice or an offer for a particular security. The information is not a complete analysis of every aspect of any market, country, industry, security or the Fund. Statements of fact are from sources considered reliable, but the investment manager makes no representation or warranty as to their completeness or accuracy. Although historical performance is no guarantee of future results, these insights may help you understand our investment management philosophy.
46 | Annual Report
franklintempleton.com
FRANKLIN UTILITIES FUND
Performance Summary as of September 30, 2014
Your dividend income will vary depending on dividends or interest paid by securities in the Fund’s portfolio, adjusted for operating expenses of each class. Capital gain distributions are net profits realized from the sale of portfolio securities. The performance tables and graphs do not reflect any taxes that a shareholder would pay on Fund dividends, capital gain distributions, if any, or any realized gains on the sale of Fund shares. Total return reflects reinvestment of the Fund’s dividends and capital gain distributions, if any, and any unrealized gains or losses.
| | | |
| Net Asset Value | | | |
| Share Class (Symbol) | 9/30/14 | 9/30/13 | Change |
| A (FKUTX) | $16.58 | $14.62 | +$1.96 |
| C (FRUSX) | $16.50 | $14.56 | +$1.94 |
| R (FRURX) | $16.52 | $14.58 | +$1.94 |
| R6 (FUFRX) | $16.68 | $14.71 | +$1.97 |
| Advisor (FRUAX) | $16.68 | $14.71 | +$1.97 |
| | | | |
| Distributions (10/1/13–9/30/14) | | | | |
| | Dividend | Short-Term | Long-Term | |
| Share Class | Income | Capital Gain | Capital Gain | Total |
| A | $0.4892 | $0.0013 | $0.0351 | $0.5256 |
| C | $0.4123 | $0.0013 | $0.0351 | $0.4487 |
| R | $0.4351 | $0.0013 | $0.0351 | $0.4715 |
| R6 | $0.5313 | $0.0013 | $0.0351 | $0.5677 |
| Advisor | $0.5125 | $0.0013 | $0.0351 | $0.5489 |
franklintempleton.com Annual Report | 47
FRANKLIN UTILITIES FUND
PERFORMANCE SUMMARY
Performance as of 9/30/141
Cumulative total return excludes sales charges. Average annual total return and value of $10,000 investment include maximum
sales charges. Class A: 5.75% maximum initial sales charge; Class C: 1% contingent deferred sales charge in first year only;
Class R/R6/Advisor Class: no sales charges.
| | | | | | | | | | |
| | | Cumulative | | | Average Annual | | | Value of | Total Annual | |
| Share Class | | Total Return2 | | | Total Return3 | | $ | 10,000 Investment4 | Operating Expenses5 | |
| A | | | | | | | | | 0.75 | % |
| 1-Year | + | 17.24 | % | + | 12.25 | % | $ | 11,225 | | |
| 5-Year | + | 87.64 | % | + | 12.43 | % | $ | 17,962 | | |
| 10-Year | + | 159.93 | % | + | 9.55 | % | $ | 24,891 | | |
| C | | | | | | | | | 1.25 | % |
| 1-Year | + | 16.61 | % | + | 15.61 | % | $ | 11,561 | | |
| 5-Year | + | 82.86 | % | + | 12.83 | % | $ | 18,286 | | |
| 10-Year | + | 147.23 | % | + | 9.47 | % | $ | 24,723 | | |
| R | | | | | | | | | 1.10 | % |
| 1-Year | + | 16.75 | % | + | 16.75 | % | $ | 11,675 | | |
| 5-Year | + | 84.39 | % | + | 13.02 | % | $ | 18,439 | | |
| 10-Year | + | 150.89 | % | + | 9.63 | % | $ | 25,089 | | |
| R6 | | | | | | | | | 0.48 | % |
| 1-Year | + | 17.51 | % | + | 17.51 | % | $ | 11,751 | | |
| Since Inception (5/1/13) | + | 10.70 | % | + | 7.44 | % | $ | 11,070 | | |
| Advisor | | | | | | | | | 0.60 | % |
| 1-Year | + | 17.37 | % | + | 17.37 | % | $ | 11,737 | | |
| 5-Year | + | 89.08 | % | + | 13.59 | % | $ | 18,908 | | |
| 10-Year | + | 163.78 | % | + | 10.19 | % | $ | 26,378 | | |
| | | | | | |
| | Distribution | | 30-Day Standardized Yield7 | |
| Share Class | Rate6 | | (with waiver) | | (without waiver) | |
| A | 2.66 | % | 2.80 | % | 2.80 | % |
| C | 2.31 | % | 2.42 | % | 2.42 | % |
| R | 2.45 | % | 2.56 | % | 2.56 | % |
| R6 | 3.01 | % | 3.18 | % | 3.18 | % |
| Advisor | 2.90 | % | 3.07 | % | 3.07 | % |
Performance data represent past performance, which does not guarantee future results. Investment return and principal value will fluctuate, and you may have a gain or loss when you sell your shares. Current performance may differ from figures shown. For most recent month-end performance, go to franklintempleton.com or call (800) 342-5236.
48 | Annual Report franklintempleton.com
FRANKLIN UTILITIES FUND
PERFORMANCE SUMMARY
Total Return Index Comparison for a Hypothetical $10,000 Investment1
Total return represents the change in value of an investment over the periods shown. It includes any applicable, maximum sales charge, Fund expenses, account fees and reinvested distributions. The unmanaged indexes include reinvestment of any income or distributions. They differ from the Fund in composition and do not pay management fees or expenses. One cannot invest directly in an index.
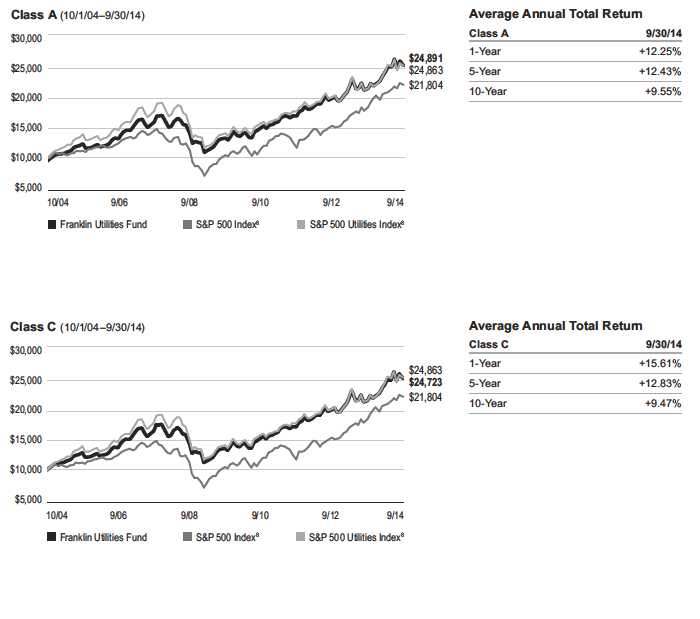
franklintempleton.com Annual Report | 49
FRANKLIN UTILITIES FUND
PERFORMANCE SUMMARY
Total Return Index Comparison for a Hypothetical $10,000 Investment1 (continued)
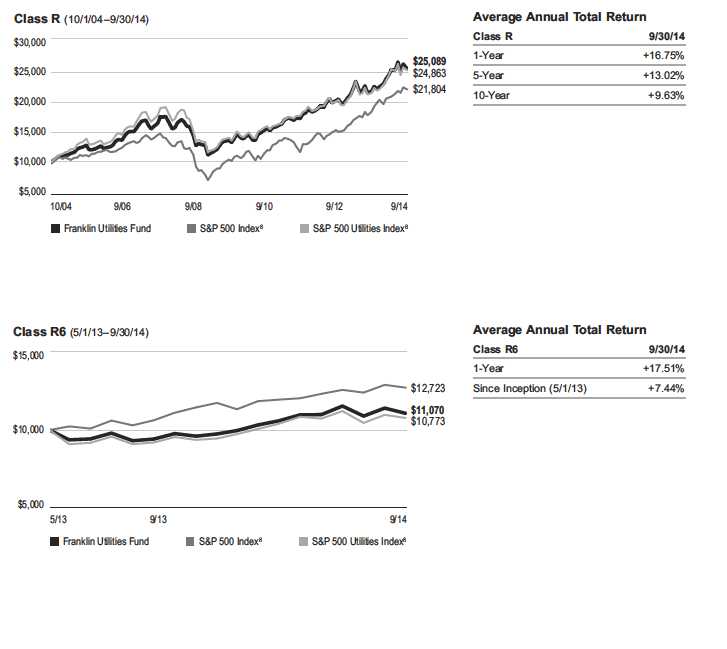
50 | Annual Report franklintempleton.com
FRANKLIN UTILITIES FUND
PERFORMANCE SUMMARY
Total Return Index Comparison for a Hypothetical $10,000 Investment1 (continued)
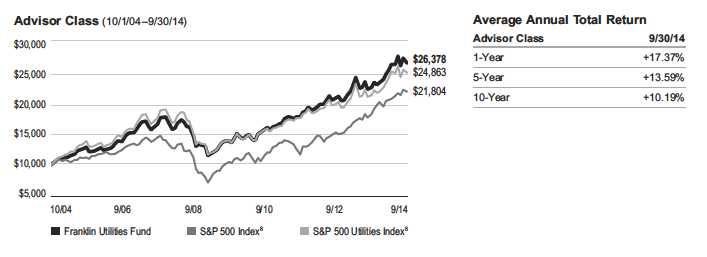
All investments involve risks, including possible loss of principal. In addition to being sensitive to other factors, securities issued by utility companies have been
historically sensitive to interest rate changes. When interest rates fall, utility securities prices, and thus a utilities fund’s share price, tend to rise; when interest
rates rise, their prices generally fall. The Fund is actively managed but there is no guarantee that the manager’s investment decisions will produce the desired
results. The Fund’s prospectus also includes a description of the main investment risks.
| |
| Class C: | These shares have higher annual fees and expenses than Class A shares. |
| Class R: | Shares are available to certain eligible investors as described in the prospectus. These shares have higher annual fees and expenses than Class A shares. |
| Class R6: | Shares are available to certain eligible investors as described in the prospectus. |
| Advisor Class: | Shares are available to certain eligible investors as described in the prospectus. |
1. The Fund has a fee waiver associated with its investments in a Franklin Templeton money fund, contractually guaranteed through at least its current fiscal year-end.
Fund investment results reflect the fee waiver, to the extent applicable; without these reductions, the results would have been lower.
2. Cumulative total return represents the change in value of an investment over the periods indicated.
3. Average annual total return represents the average annual change in value of an investment over the periods indicated.
4. These figures represent the value of a hypothetical $10,000 investment in the Fund over the periods indicated.
5. Figures are as stated in the Fund’s current prospectus. In periods of market volatility, assets may decline significantly, causing total annual Fund operating expenses to
become higher than the figures shown.
6. Distribution rate is based on an annualization of the respective class’s current quarterly dividend and the maximum offering price (NAV for Classes C, R, R6 and Advisor)
per share on 9/30/14.
7. The 30-day standardized yield for the 30 days ended 9/30/14 reflects an estimated yield to maturity (assuming all portfolio securities are held to maturity). It should be
regarded as an estimate of the Fund’s rate of investment income, and it may not equal the Fund’s actual income distribution rate (which reflects the Fund’s past dividends
paid to shareholders) or the income reported in the Fund’s financial statements.
8. Source: Morningstar. The S&P 500 Index is a market capitalization-weighted index of 500 stocks designed to measure total U.S. equity market performance. The S&P
500 Utilities Index is market capitalization weighted and consists of all utility stocks in the S&P 500 Index.
See www.franklintempletondatasources.com for additional data provider information.
franklintempleton.com Annual Report | 51
FRANKLIN UTILITIES FUND
Your Fund’s Expenses
As a Fund shareholder, you can incur two types of costs:
- Transaction costs, including sales charges (loads) on Fund purchases; and
- Ongoing Fund costs, including management fees, distribu- tion and service (12b-1) fees, and other Fund expenses. All mutual funds have ongoing costs, sometimes referred to as operating expenses.
The following table shows ongoing costs of investing in the Fund and can help you understand these costs and compare them with those of other mutual funds. The table assumes a $1,000 investment held for the six months indicated.
Actual Fund Expenses
The first line (Actual) for each share class listed in the table provides actual account values and expenses. The “Ending Account Value” is derived from the Fund’s actual return, which includes the effect of Fund expenses.
You can estimate the expenses you paid during the period by following these steps. Of course, your account value and expenses will differ from those in this illustration:
| 1. | Divide your account value by $1,000. |
| | If an account had an $8,600 value, then $8,600 ÷ $1,000 = 8.6. |
| 2. | Multiply the result by the number under the heading “Expenses Paid During Period.” |
| | If Expenses Paid During Period were $7.50, then 8.6 x $7.50 = $64.50. |
In this illustration, the estimated expenses paid this period are $64.50.
Hypothetical Example for Comparison with Other Funds
Information in the second line (Hypothetical) for each class in the table can help you compare ongoing costs of investing in the Fund with those of other mutual funds. This information may not be used to estimate the actual ending account balance or expenses you paid during the period. The hypothetical “Ending Account Value” is based on the actual expense ratio for each class and an assumed 5% annual rate of return before expenses, which does not represent the Fund’s actual return. The figure under the heading “Expenses Paid During Period” shows the hypothetical expenses your account would have incurred under this scenario. You can compare this figure with the 5% hypothetical examples that appear in shareholder reports of other funds.
Please note that expenses shown in the table are meant to highlight ongoing costs and do not reflect any transaction costs, such as sales charges. Therefore, the second line for each class is useful in comparing ongoing costs only, and will not help you compare total costs of owning different funds. In addition, if transaction costs were included, your total costs would have been higher. Please refer to the Fund prospectus for additional information on operating expenses.
52 | Annual Report
franklintempleton.com
FRANKLIN UTILITIES FUND
YOUR FUND’S EXPENSES
| | | | | | |
| | | Beginning Account | | Ending Account | | Expenses Paid During |
| Share Class | | Value 4/1/14 | | Value 9/30/14 | | Period* 4/1/14–9/30/14 |
| A | | | | | | |
| Actual | $ | 1,000 | $ | 1,043.30 | $ | 3.79 |
| Hypothetical (5% return before expenses) | $ | 1,000 | $ | 1,021.36 | $ | 3.75 |
| C | | | | | | |
| Actual | $ | 1,000 | $ | 1,040.40 | $ | 6.34 |
| Hypothetical (5% return before expenses) | $ | 1,000 | $ | 1,018.85 | $ | 6.28 |
| R | | | | | | |
| Actual | $ | 1,000 | $ | 1,041.10 | $ | 5.58 |
| Hypothetical (5% return before expenses) | $ | 1,000 | $ | 1,019.60 | $ | 5.52 |
| R6 | | | | | | |
| Actual | $ | 1,000 | $ | 1,044.40 | $ | 2.41 |
| Hypothetical (5% return before expenses) | $ | 1,000 | $ | 1,022.71 | $ | 2.38 |
| Advisor | | | | | | |
| Actual | $ | 1,000 | $ | 1,043.80 | $ | 3.02 |
| Hypothetical (5% return before expenses) | $ | 1,000 | $ | 1,022.11 | $ | 2.99 |
*Expenses are calculated using the most recent six-month expense ratio, net of expense waivers, annualized for each class (A: 0.74%;
C: 1.24%; R: 1.09%; R6: 0.47%; and Advisor: 0.59%), multiplied by the average account value over the period, multiplied by 183/365 to
reflect the one-half year period.
franklintempleton.com Annual Report | 53
| | | | | | | | | | | | | | | |
| FRANKLIN CUSTODIAN FUNDS | | | | | | | | | | | | | | | |
| |
| |
| Financial Highlights | | | | | | | | | | | | | | | |
| Franklin DynaTech Fund | | | | | | | | | | | | | | | |
| | | | | | Year Ended September 30, | | | | |
| | | 2014 | | | 2013 | | | 2012 | | | 2011 | | | 2010 | |
| Class A | | | | | | | | | | | | | | | |
| Per share operating performance | | | | | | | | | | | | | | | |
| (for a share outstanding throughout the year) | | | | | | | | | | | | | | | |
| Net asset value, beginning of year | $ | 42.13 | | $ | 34.00 | | $ | 27.66 | | $ | 27.16 | | $ | 23.20 | |
| Income from investment operationsa: | | | | | | | | | | | | | | | |
| Net investment income (loss)b | | (0.18 | ) | | (0.12 | ) | | (0.11 | ) | | (0.14 | ) | | (0.11 | ) |
| Net realized and unrealized gains (losses) | | 5.94 | | | 8.25 | | | 7.10 | | | 0.64 | | | 4.07 | |
| Total from investment operations | | 5.76 | | | 8.13 | | | 6.99 | | | 0.50 | | | 3.96 | |
| Less distributions from net realized gains | | (1.81 | ) | | — | | | (0.65 | ) | | — | | | — | |
| Net asset value, end of year | $ | 46.08 | | $ | 42.13 | | $ | 34.00 | | $ | 27.66 | | $ | 27.16 | |
| |
| Total returnc | | 13.98 | % | | 23.91 | % | | 25.59 | % | | 1.84 | % | | 17.07 | % |
| |
| Ratios to average net assets | | | | | | | | | | | | | | | |
| Expenses | | 0.89 | %d | | 0.94 | % | | 0.96 | % | | 0.97 | % | | 1.03 | % |
| Net investment income (loss) | | (0.41 | )% | | (0.34 | )% | | (0.35 | )% | | (0.46 | )% | | (0.44 | )% |
| |
| Supplemental data | | | | | | | | | | | | | | | |
| Net assets, end of year (000’s) | $ | 1,504,338 | | $ | 1,072,814 | | $ | 898,665 | | $ | 642,552 | | $ | 566,764 | |
| Portfolio turnover rate | | 26.43 | % | | 35.40 | % | | 16.65 | % | | 30.11 | % | | 31.39 | % |
aThe amount shown for a share outstanding throughout the period may not correlate with the Statement of Operations for the period due to the timing of sales and
repurchases of the Fund shares in relation to income earned and/or fluctuating fair value of the investments of the Fund.
bBased on average daily shares outstanding.
cTotal return does not reflect sales commissions or contingent deferred sales charges, if applicable.
dBenefit of waiver and payments by affiliates and expense reduction rounds to less than 0.01%.
54 | Annual Report | The accompanying notes are an integral part of these financial statements. franklintempleton.com
| | | | | | | | | | | | | | | |
| | | | | | | | | FRANKLIN CUSTODIAN FUNDS | |
| | | | | | | | | FINANCIAL HIGHLIGHTS | |
| |
| |
| |
| Franklin DynaTech Fund (continued) | | | | | | | | | | | | | | | |
| | | | | | Year Ended September 30, | | | | |
| | | 2014 | | | 2013 | | | 2012 | | | 2011 | | | 2010 | |
| Class C | | | | | | | | | | | | | | | |
| Per share operating performance | | | | | | | | | | | | | | | |
| (for a share outstanding throughout the year) | | | | | | | | | | | | | | | |
| Net asset value, beginning of year | $ | 37.53 | | $ | 30.52 | | $ | 25.07 | | $ | 24.81 | | $ | 21.34 | |
| Income from investment operationsa: | | | | | | | | | | | | | | | |
| Net investment income (loss)b | | (0.46 | ) | | (0.35 | ) | | (0.32 | ) | | (0.34 | ) | | (0.28 | ) |
| Net realized and unrealized gains (losses) | | 5.27 | | | 7.36 | | | 6.42 | | | 0.60 | | | 3.75 | |
| Total from investment operations | | 4.81 | | | 7.01 | | | 6.10 | | | 0.26 | | | 3.47 | |
| Less distributions from net realized gains | | (1.81 | ) | | — | | | (0.65 | ) | | — | | | — | |
| Net asset value, end of year | $ | 40.53 | | $ | 37.53 | | $ | 30.52 | | $ | 25.07 | | $ | 24.81 | |
| |
| Total returnc | | 13.13 | % | | 22.97 | % | | 24.67 | % | | 1.05 | % | | 16.26 | % |
| |
| Ratios to average net assets | | | | | | | | | | | | | | | |
| Expenses | | 1.64 | %d | | 1.69 | % | | 1.71 | % | | 1.72 | % | | 1.78 | % |
| Net investment income (loss) | | (1.16 | )% | | (1.09 | )% | | (1.10 | )% | | (1.21 | )% | | (1.19 | )% |
| |
| Supplemental data | | | | | | | | | | | | | | | |
| Net assets, end of year (000’s) | $ | 212,961 | | $ | 176,556 | | $ | 142,903 | | $ | 105,707 | | $ | 93,927 | |
| Portfolio turnover rate | | 26.43 | % | | 35.40 | % | | 16.65 | % | | 30.11 | % | | 31.39 | % |
aThe amount shown for a share outstanding throughout the period may not correlate with the Statement of Operations for the period due to the timing of sales and
repurchases of the Fund shares in relation to income earned and/or fluctuating fair value of the investments of the Fund.
bBased on average daily shares outstanding.
cTotal return does not reflect sales commissions or contingent deferred sales charges, if applicable.
dBenefit of waiver and payments by affiliates and expense reduction rounds to less than 0.01%.
franklintempleton.com The accompanying notes are an integral part of these financial statements. | Annual Report | 55
FRANKLIN CUSTODIAN FUNDS
FINANCIAL HIGHLIGHTS
| | | | | | | | | | | | | | | |
| Franklin DynaTech Fund (continued) | | | | | | | | | | | | | | | |
| | | | | | Year Ended September 30, | | | | |
| | | 2014 | | | 2013 | | | 2012 | | | 2011 | | | 2010 | |
| Class R | | | | | | | | | | | | | | | |
| Per share operating performance | | | | | | | | | | | | | | | |
| (for a share outstanding throughout the year) | | | | | | | | | | | | | | | |
| Net asset value, beginning of year | $ | 41.58 | | $ | 33.65 | | $ | 27.44 | | $ | 27.02 | | $ | 23.13 | |
| Income from investment operationsa: | | | | | | | | | | | | | | | |
| Net investment income (loss)b | | (0.29 | ) | | (0.21 | ) | | (0.19 | ) | | (0.22 | ) | | (0.17 | ) |
| Net realized and unrealized gains (losses) | | 5.87 | | | 8.14 | | | 7.05 | | | 0.64 | | | 4.06 | |
| Total from investment operations | | 5.58 | | | 7.93 | | | 6.86 | | | 0.42 | | | 3.89 | |
| Less distributions from net realized gains | | (1.81 | ) | | — | | | (0.65 | ) | | — | | | — | |
| Net asset value, end of year | $ | 45.35 | | $ | 41.58 | | $ | 33.65 | | $ | 27.44 | | $ | 27.02 | |
| |
| Total return | | 13.72 | % | | 23.57 | % | | 25.32 | % | | 1.55 | % | | 16.82 | % |
| |
| Ratios to average net assets | | | | | | | | | | | | | | | |
| Expenses | | 1.14 | %c | | 1.19 | % | | 1.21 | % | | 1.22 | % | | 1.28 | % |
| Net investment income (loss) | | (0.66 | )% | | (0.59 | )% | | (0.60 | )% | | (0.71 | )% | | (0.69 | )% |
| |
| Supplemental data | | | | | | | | | | | | | | | |
| Net assets, end of year (000’s) | $ | 45,230 | | $ | 41,825 | | $ | 33,338 | | $ | 11,100 | | $ | 7,034 | |
| Portfolio turnover rate | | 26.43 | % | | 35.40 | % | | 16.65 | % | | 30.11 | % | | 31.39 | % |
aThe amount shown for a share outstanding throughout the period may not correlate with the Statement of Operations for the period due to the timing of sales and
repurchases of the Fund shares in relation to income earned and/or fluctuating fair value of the investments of the Fund.
bBased on average daily shares outstanding.
cBenefit of waiver and payments by affiliates and expense reduction rounds to less than 0.01%.
56 | Annual Report | The accompanying notes are an integral part of these financial statements. franklintempleton.com
FRANKLIN CUSTODIAN FUNDS
FINANCIAL HIGHLIGHTS
| | |
| Franklin DynaTech Fund (continued) | | |
| | Year Ended |
| | September 30, |
| | 2014 | 2013a |
| Class R6 | | |
| Per share operating performance | | |
| (for a share outstanding throughout the year) | | |
| Net asset value, beginning of year | $42.74 | $36.56 |
| Income from investment operationsb: | | |
| Net investment income (loss)c | (0.01) | 0.01 |
| Net realized and unrealized gains (losses) | 6.05 | 6.17 |
| Total from investment operations | 6.04 | 6.18 |
| Less distributions from net realized gains | (1.81) | — |
| Net asset value, end of year | $46.97 | $42.74 |
| |
| Total returnd | 14.45% | 16.90% |
| |
| Ratios to average net assetse | | |
| Expenses | 0.49%f | 0.52% |
| Net investment income (loss) | (0.01)% | 0.08% |
| |
| Supplemental data | | |
| Net assets, end of year (000’s) | $342,466 | $317,315 |
| Portfolio turnover rate | 26.43% | 35.40% |
aFor the period May 1, 2013 (effective date) to September 30, 2013.
bThe amount shown for a share outstanding throughout the period may not correlate with the Statement of Operations for the period due to the timing of sales and
repurchases of the Fund shares in relation to income earned and/or fluctuating fair value of the investments of the Fund.
cBased on average daily shares outstanding.
dTotal return is not annualized for periods less than one year.
eRatios are annualized for periods less than one year.
fBenefit of waiver and payments by affiliates and expense reduction rounds to less than 0.01%.
franklintempleton.com The accompanying notes are an integral part of these financial statements. | Annual Report | 57
FRANKLIN CUSTODIAN FUNDS
FINANCIAL HIGHLIGHTS
| | | | | | | | | | | | | | | |
| Franklin DynaTech Fund (continued) | | | | | | | | | | | | | | | |
| | | | | | Year Ended September 30, | | | | |
| | | 2014 | | | 2013 | | | 2012 | | | 2011 | | | 2010 | |
| Advisor Class | | | | | | | | | | | | | | | |
| Per share operating performance | | | | | | | | | | | | | | | |
| (for a share outstanding throughout the year) | | | | | | | | | | | | | | | |
| Net asset value, beginning of year | $ | 42.71 | | $ | 34.39 | | $ | 27.89 | | $ | 27.33 | | $ | 23.28 | |
| Income from investment operationsa: | | | | | | | | | | | | | | | |
| Net investment income (loss)b | | (0.07 | ) | | (0.03 | ) | | (0.03 | ) | | (0.06 | ) | | (0.05 | ) |
| Net realized and unrealized gains (losses) | | 6.04 | | | 8.35 | | | 7.18 | | | 0.62 | | | 4.10 | |
| Total from investment operations | | 5.97 | | | 8.32 | | | 7.15 | | | 0.56 | | | 4.05 | |
| Less distributions from net realized gains | | (1.81 | ) | | — | | | (0.65 | ) | | — | | | — | |
| Net asset value, end of year | $ | 46.87 | | $ | 42.71 | | $ | 34.39 | | $ | 27.89 | | $ | 27.33 | |
| |
| Total return | | 14.29 | % | | 24.19 | % | | 25.96 | % | | 2.05 | % | | 17.40 | % |
| |
| Ratios to average net assets | | | | | | | | | | | | | | | |
| Expenses | | 0.64 | %c | | 0.69 | % | | 0.71 | % | | 0.72 | % | | 0.78 | % |
| Net investment income (loss) | | (0.16 | )% | | (0.09 | )% | | (0.10 | )% | | (0.21 | )% | | (0.19 | )% |
| |
| Supplemental data | | | | | | | | | | | | | | | |
| Net assets, end of year (000’s) | $ | 159,180 | | $ | 122,287 | | $ | 260,012 | | $ | 102,221 | | $ | 11,541 | |
| Portfolio turnover rate | | 26.43 | % | | 35.40 | % | | 16.65 | % | | 30.11 | % | | 31.39 | % |
aThe amount shown for a share outstanding throughout the period may not correlate with the Statement of Operations for the period due to the timing of sales and
repurchases of the Fund shares in relation to income earned and/or fluctuating fair value of the investments of the Fund.
bBased on average daily shares outstanding.
cBenefit of waiver and payments by affiliates and expense reduction rounds to less than 0.01%.
58 | Annual Report | The accompanying notes are an integral part of these financial statements. franklintempleton.com
FRANKLIN CUSTODIAN FUNDS
| | | | |
| Statement of Investments, September 30, 2014 | | | | |
| |
| Franklin DynaTech Fund | | | | |
| | Country | Shares | | Value |
| Common Stocks 97.4% | | | | |
| Aerospace & Defense 1.9% | | | | |
| The Boeing Co. | United States | 150,000 | $ | 19,107,001 |
| Precision Castparts Corp. | United States | 100,000 | | 23,688,000 |
| | | | | 42,795,001 |
| Air Freight & Logistics 0.7% | | | | |
| FedEx Corp. | United States | 100,000 | | 16,145,000 |
| Auto Components 0.5% | | | | |
| BorgWarner Inc. | United States | 200,000 | | 10,522,000 |
| Biotechnology 12.0% | | | | |
| aAlnylam Pharmaceuticals Inc. | United States | 200,000 | | 15,620,000 |
| Amgen Inc. | United States | 150,000 | | 21,069,000 |
| aAvalanche Biotechnologies Inc. | United States | 50,000 | | 1,709,500 |
| aBiogen Idec Inc. | United States | 150,000 | | 49,621,500 |
| aCelgene Corp. | United States | 480,000 | | 45,494,400 |
| aCelldex Therapeutics Inc. | United States | 330,000 | | 4,276,800 |
| aGilead Sciences Inc. | United States | 520,000 | | 55,354,000 |
| aIncyte Corp. | United States | 220,000 | | 10,791,000 |
| aKaryopharm Therapeutics Inc. | United States | 150,000 | | 5,241,000 |
| aMedivation Inc. | United States | 350,000 | | 34,604,500 |
| aPuma Biotechnology Inc. | United States | 25,000 | | 5,964,250 |
| aRegeneron Pharmaceuticals Inc. | United States | 60,000 | | 21,631,200 |
| | | | | 271,377,150 |
| Capital Markets 0.5% | | | | |
| The Charles Schwab Corp. | United States | 400,000 | | 11,756,000 |
| Chemicals 2.0% | | | | |
| Cytec Industries Inc. | United States | 500,000 | | 23,645,000 |
| Monsanto Co. | United States | 200,000 | | 22,502,000 |
| | | | | 46,147,000 |
| Commercial Services & Supplies 0.5% | | | | |
| aStericycle Inc. | United States | 100,000 | | 11,656,000 |
| Communications Equipment 2.0% | | | | |
| aPalo Alto Networks Inc. | United States | 300,000 | | 29,430,000 |
| QUALCOMM Inc. | United States | 200,000 | | 14,954,000 |
| | | | | 44,384,000 |
| Diversified Financial Services 1.7% | | | | |
| Intercontinental Exchange Inc. | United States | 80,000 | | 15,604,000 |
| Moody’s Corp. | United States | 250,000 | | 23,625,000 |
| | | | | 39,229,000 |
| Electrical Equipment 0.1% | | | | |
| Acuity Brands Inc. | United States | 20,000 | | 2,354,200 |
| Electronic Equipment, Instruments & Components 1.2% | | | | |
| Amphenol Corp., A | United States | 25,000 | | 2,496,500 |
| aCognex Corp. | United States | 320,000 | | 12,886,400 |
| aTrimble Navigation Ltd. | United States | 350,000 | | 10,675,000 |
| aUniversal Display Corp. | United States | 20,000 | | 652,800 |
| | | | | 26,710,700 |
franklintempleton.com Annual Report | 59
FRANKLIN CUSTODIAN FUNDS
STATEMENT OF INVESTMENTS
| | | | |
| Franklin DynaTech Fund (continued) | | | | |
| | Country | Shares | | Value |
| Common Stocks (continued) | | | | |
| Energy Equipment & Services 4.8% | | | | |
| Core Laboratories NV | United States | 50,000 | $ | 7,317,500 |
| aFMC Technologies Inc. | United States | 500,000 | | 27,155,000 |
| aForum Energy Technologies Inc. | United States | 300,000 | | 9,183,000 |
| National Oilwell Varco Inc. | United States | 200,000 | | 15,220,000 |
| Oceaneering International Inc. | United States | 300,000 | | 19,551,000 |
| Schlumberger Ltd. | United States | 300,000 | | 30,507,000 |
| | | | | 108,933,500 |
| Health Care Equipment & Supplies 2.9% | | | | |
| Abbott Laboratories | United States | 400,000 | | 16,636,000 |
| aDexCom Inc. | United States | 350,000 | | 13,996,500 |
| aEdwards Lifesciences Corp. | United States | 200,000 | | 20,430,000 |
| aHeartWare International Inc. | United States | 50,000 | | 3,881,500 |
| aIDEXX Laboratories Inc. | United States | 20,000 | | 2,356,600 |
| Stryker Corp. | United States | 100,000 | | 8,075,000 |
| | | | | 65,375,600 |
| Health Care Providers & Services 2.7% | | | | |
| aHealthEquity Inc. | United States | 26,100 | | 477,891 |
| McKesson Corp. | United States | 200,000 | | 38,934,000 |
| UnitedHealth Group Inc. | United States | 250,000 | | 21,562,500 |
| | | | | 60,974,391 |
| Health Care Technology 2.9% | | | | |
| aathenahealth Inc. | United States | 180,000 | | 23,704,200 |
| aCerner Corp. | United States | 550,000 | | 32,763,500 |
| aVeeva Systems Inc. | United States | 300,000 | | 8,451,000 |
| | | | | 64,918,700 |
| Internet & Catalog Retail 6.1% | | | | |
| aAmazon.com Inc. | United States | 125,000 | | 40,305,000 |
| aJumei International Holding Ltd., ADR | China | 20,000 | | 469,600 |
| aLiberty TripAdvisor Holdings Inc., A | United States | 300,000 | | 10,170,000 |
| aLiberty Ventures, A | United States | 300,000 | | 11,388,000 |
| aNetflix Inc. | United States | 55,000 | | 24,814,900 |
| aThe Priceline Group Inc. | United States | 30,000 | | 34,757,400 |
| aVipshop Holdings Ltd., ADR | China | 80,000 | | 15,120,800 |
| a,bZalando SE, 144A | Germany | 20,000 | | 543,047 |
| | | | | 137,568,747 |
| Internet Software & Services 14.2% | | | | |
| aAlibaba Group Holding Ltd., ADR | China | 200,000 | | 17,770,000 |
| aBaidu Inc., ADR | China | 105,000 | | 22,914,150 |
| aDemandware Inc. | United States | 400,000 | | 20,368,000 |
| aFacebook Inc., A | United States | 625,000 | | 49,400,000 |
| Google Inc., A | United States | 60,000 | | 35,304,600 |
| aGoogle Inc., C | United States | 60,000 | | 34,641,600 |
| aGrubHub Inc. | United States | 200,000 | | 6,848,000 |
| aLinkedIn Corp., A | United States | 150,000 | | 31,168,500 |
| MercadoLibre Inc. | Argentina | 100,000 | | 10,865,000 |
| Naver Corp. | South Korea | 25,000 | | 19,124,129 |
| Tencent Holdings Ltd. | China | 2,500,000 | | 37,123,373 |
60 | Annual Report franklintempleton.com
FRANKLIN CUSTODIAN FUNDS
STATEMENT OF INVESTMENTS
| | | | |
| Franklin DynaTech Fund (continued) | | | | |
| | Country | Shares | | Value |
| Common Stocks (continued) | | | | |
| Internet Software & Services (continued) | | | | |
| aTwitter Inc. | United States | 325,000 | $ | 16,763,500 |
| aYelp Inc. | United States | 300,000 | | 20,475,000 |
| | | | | 322,765,852 |
| IT Services 4.3% | | | | |
| MasterCard Inc., A | United States | 650,000 | | 48,048,000 |
| aVeriFone Systems Inc. | United States | 20,000 | | 687,600 |
| Visa Inc., A | United States | 225,000 | | 48,008,250 |
| | | | | 96,743,850 |
| Life Sciences Tools & Services 3.2% | | | | |
| aFluidigm Corp. | United States | 50,000 | | 1,225,000 |
| aIllumina Inc. | United States | 220,000 | | 36,062,400 |
| Thermo Fisher Scientific Inc. | United States | 200,000 | | 24,340,000 |
| aWaters Corp. | United States | 100,000 | | 9,912,000 |
| | | | | 71,539,400 |
| Machinery 1.1% | | | | |
| Flowserve Corp. | United States | 350,000 | | 24,682,000 |
| Media 1.2% | | | | |
| Liberty Media Corp., A | United States | 200,000 | | 9,436,000 |
| aLiberty Media Corp., C | United States | 400,000 | | 18,796,000 |
| | | | | 28,232,000 |
| Oil, Gas & Consumable Fuels 2.9% | | | | |
| Anadarko Petroleum Corp. | United States | 250,000 | | 25,360,000 |
| Noble Energy Inc. | United States | 300,000 | | 20,508,000 |
| Pioneer Natural Resources Co. | United States | 100,000 | | 19,697,000 |
| | | | | 65,565,000 |
| Pharmaceuticals 4.7% | | | | |
| AbbVie Inc. | United States | 375,000 | | 21,660,000 |
| aActavis PLC | United States | 260,000 | | 62,732,800 |
| Perrigo Co. PLC | United States | 140,000 | | 21,026,600 |
| | | | | 105,419,400 |
| Professional Services 0.2% | | | | |
| aThe Advisory Board Co. | United States | 80,000 | | 3,727,200 |
| Real Estate Investment Trusts (REITs) 1.4% | | | | |
| American Tower Corp. | United States | 350,000 | | 32,770,500 |
| Semiconductors & Semiconductor Equipment 6.4% | | | | |
| Applied Materials Inc. | United States | 100,000 | | 2,161,000 |
| ARM Holdings PLC, ADR | United Kingdom | 750,000 | | 32,767,500 |
| ASML Holding NV, N.Y. shs | Netherlands | 200,000 | | 19,764,000 |
| aCavium Inc. | United States | 80,000 | | 3,978,400 |
| Intel Corp. | United States | 900,000 | | 31,338,000 |
| Lam Research Corp. | United States | 300,000 | | 22,410,000 |
| aMicron Technology Inc. | United States | 150,000 | | 5,139,000 |
| aNXP Semiconductors NV | Netherlands | 175,000 | | 11,975,250 |
| Power Integrations Inc. | United States | 75,000 | | 4,043,250 |
| aSunPower Corp. | United States | 350,000 | | 11,858,000 |
| | | | | 145,434,400 |
franklintempleton.com Annual Report | 61
FRANKLIN CUSTODIAN FUNDS
STATEMENT OF INVESTMENTS
| | | | | |
| Franklin DynaTech Fund (continued) | | | | | |
| | Country | Shares | | Value | |
| Common Stocks (continued) | | | | | |
| Software 8.7% | | | | | |
| aAdobe Systems Inc. | United States | 200,000 | $ | 13,838,000 | |
| aANSYS Inc. | United States | 150,000 | | 11,350,500 | |
| aAspen Technology Inc. | United States | 550,000 | | 20,746,000 | |
| aCDK Global LLC | United States | 25,000 | | 764,750 | |
| aCyber-Ark Software Ltd./Israel | Israel | 35,200 | | 1,126,752 | |
| aGuidewire Software Inc. | United States | 300,000 | | 13,302,000 | |
| aMobileye NV | United States | 61,400 | | 3,290,426 | |
| aNetSuite Inc. | United States | 400,000 | | 35,816,000 | |
| aSalesforce.com Inc. | United States | 450,000 | | 25,888,500 | |
| aServiceNow Inc. | United States | 600,000 | | 35,268,000 | |
| aUltimate Software Group Inc. | United States | 100,000 | | 14,151,000 | |
| aWorkday Inc. | United States | 275,000 | | 22,687,500 | |
| | | | | 198,229,428 | |
| Technology Hardware, Storage & Peripherals 3.0% | | | | | |
| Apple Inc. | United States | 475,000 | | 47,856,250 | |
| SanDisk Corp. | United States | 200,000 | | 19,590,000 | |
| aStratasys Ltd. | United States | 10,000 | | 1,207,800 | |
| | | | | 68,654,050 | |
| Textiles, Apparel & Luxury Goods 1.3% | | | | | |
| NIKE Inc., B | United States | 250,000 | | 22,300,000 | |
| aUnder Armour Inc., A | United States | 100,000 | | 6,910,000 | |
| | | | | 29,210,000 | |
| Trading Companies & Distributors 0.5% | | | | | |
| Fastenal Co. | United States | 125,000 | | 5,612,500 | |
| aNOW Inc. | United States | 200,000 | | 6,082,000 | |
| | | | | 11,694,500 | |
| Wireless Telecommunication Services 1.8% | | | | | |
| aSBA Communications Corp. | United States | 300,000 | | 33,270,000 | |
| SoftBank Corp. | Japan | 100,000 | | 7,011,992 | |
| | | | | 40,281,992 | |
| Total Common Stocks (Cost $1,261,029,889) | | | | 2,205,796,561 | |
| Short Term Investments (Cost $63,171,650) 2.8% | | | | | |
| Money Market Funds 2.8% | | | | | |
| a,cInstitutional Fiduciary Trust Money Market Portfolio | United States | 63,171,650 | | 63,171,650 | |
| Total Investments (Cost $1,324,201,539) 100.2% | | | | 2,268,968,211 | |
| Other Assets, less Liabilities (0.2)% | | | | (4,793,588 | ) |
| Net Assets 100.0% | | | $ | 2,264,174,623 | |
See Abbreviations on page 143.
aNon-income producing.
bSecurity was purchased pursuant to Rule 144A under the Securities Act of 1933 and may be sold in transactions exempt from registration only to qualified institutional
buyers or in a public offering registered under the Securities Act of 1933. This security has been deemed liquid under guidelines approved by the Trust’s Board of Trustees.
At September 30, 2014, the value of this security was $543,047, representing 0.02% of net assets.
cSee Note 3(f) regarding investments in Institutional Fiduciary Trust Money Market Portfolio.
62 | Annual Report | The accompanying notes are an integral part of these financial statements. franklintempleton.com
FRANKLIN CUSTODIAN FUNDS
| | | | | | | | | | | | | | | |
| Financial Highlights | | | | | | | | | | | | | | | |
| Franklin Growth Fund | | | | | | | | | | | | | | | |
| | | | | | Year Ended September 30, | | | | |
| | | 2014 | | | 2013 | | | 2012 | | | 2011 | | | 2010 | |
| Class A | | | | | | | | | | | | | | | |
| Per share operating performance | | | | | | | | | | | | | | | |
| (for a share outstanding throughout the year) | | | | | | | | | | | | | | | |
| Net asset value, beginning of year | $ | 59.49 | | $ | 50.13 | | $ | 40.45 | | $ | 41.11 | | $ | 36.48 | |
| Income from investment operationsa: | | | | | | | | | | | | | | | |
| Net investment incomeb | | 0.26 | | | 0.26 | | | 0.20 | | | 0.19 | | | 0.20 | |
| Net realized and unrealized gains (losses) | | 11.06 | | | 9.24 | | | 9.76 | | | (0.67 | ) | | 4.71 | |
| Total from investment operations | | 11.32 | | | 9.50 | | | 9.96 | | | (0.48 | ) | | 4.91 | |
| Less distributions from: | | | | | | | | | | | | | | | |
| Net investment income | | (0.30 | ) | | (0.14 | ) | | (0.16 | ) | | (0.18 | ) | | (0.28 | ) |
| Net realized gains | | — | | | — | | | (0.12 | ) | | — | | | — | |
| Total distributions | | (0.30 | ) | | (0.14 | ) | | (0.28 | ) | | (0.18 | ) | | (0.28 | ) |
| Net asset value, end of year | $ | 70.51 | | $ | 59.49 | | $ | 50.13 | | $ | 40.45 | | $ | 41.11 | |
| |
| Total returnc | | 19.08 | % | | 19.01 | % | | 24.74 | % | | (1.23 | )% | | 13.52 | % |
| |
| Ratios to average net assets | | | | | | | | | | | | | | | |
| Expenses | | 0.90 | %d,e | | 0.91 | %e | | 0.94 | % | | 0.92 | % | | 0.94 | % |
| Net investment income | | 0.40 | % | | 0.49 | % | | 0.43 | % | | 0.42 | % | | 0.50 | % |
| |
| Supplemental data | | | | | | | | | | | | | | | |
| Net assets, end of year (000’s) | $ | 6,611,073 | | $ | 5,305,031 | | $ | 4,135,962 | | $ | 3,046,277 | | $ | 2,587,802 | |
| Portfolio turnover rate | | 1.50 | % | | 0.83 | % | | 3.50 | % | | 2.72 | % | | 4.36 | % |
aThe amount shown for a share outstanding throughout the period may not correlate with the Statement of Operations for the period due to the timing of sales and
repurchases of the Fund shares in relation to income earned and/or fluctuating fair value of the investments of the Fund.
bBased on average daily shares outstanding.
cTotal return does not reflect sales commissions or contingent deferred sales charges, if applicable.
dBenefit of waiver and payments by affiliates rounds to less than 0.01%.
eBenefit of expense reduction rounds to less than 0.01%.
franklintempleton.com The accompanying notes are an integral part of these financial statements. | Annual Report | 63
FRANKLIN CUSTODIAN FUNDS
FINANCIAL HIGHLIGHTS
| | | | | | | | | | | | | | | |
| Franklin Growth Fund (continued) | | | | | | | | | | | | | | | |
| | | | | | Year Ended September 30, | | | | |
| | | 2014 | | | 2013 | | | 2012 | | | 2011 | | | 2010 | |
| Class C | | | | | | | | | | | | | | | |
| Per share operating performance | | | | | | | | | | | | | | | |
| (for a share outstanding throughout the year) | | | | | | | | | | | | | | | |
| Net asset value, beginning of year | $ | 55.64 | | $ | 47.10 | | $ | 38.16 | | $ | 38.92 | | $ | 34.61 | |
| Income from investment operationsa: | | | | | | | | | | | | | | | |
| Net investment income (loss)b | | (0.22 | ) | | (0.13 | ) | | (0.14 | ) | | (0.14 | ) | | (0.09 | ) |
| Net realized and unrealized gains (losses) | | 10.33 | | | 8.67 | | | 9.20 | | | (0.62 | ) | | 4.47 | |
| Total from investment operations | | 10.11 | | | 8.54 | | | 9.06 | | | (0.76 | ) | | 4.38 | |
| Less distributions from: | | | | | | | | | | | | | | | |
| Net investment income | | — | | | — | | | — | | | — | | | (0.07 | ) |
| Net realized gains | | — | | | — | | | (0.12 | ) | | — | | | — | |
| Total distributions | | — | | | — | | | (0.12 | ) | | — | | | (0.07 | ) |
| Net asset value, end of year | $ | 65.75 | | $ | 55.64 | | $ | 47.10 | | $ | 38.16 | | $ | 38.92 | |
| |
| Total returnc | | 18.17 | % | | 18.13 | % | | 23.79 | % | | (1.95 | )% | | 12.69 | % |
| |
| Ratios to average net assets | | | | | | | | | | | | | | | |
| Expenses | | 1.65 | %d,e | | 1.66 | %e | | 1.69 | % | | 1.67 | % | | 1.69 | % |
| Net investment income (loss) | | (0.35 | )% | | (0.26 | )% | | (0.32 | )% | | (0.33 | )% | | (0.25 | )% |
| |
| Supplemental data | | | | | | | | | | | | | | | |
| Net assets, end of year (000’s) | $ | 662,548 | | $ | 546,505 | | $ | 466,205 | | $ | 390,171 | | $ | 349,188 | |
| Portfolio turnover rate | | 1.50 | % | | 0.83 | % | | 3.50 | % | | 2.72 | % | | 4.36 | % |
aThe amount shown for a share outstanding throughout the period may not correlate with the Statement of Operations for the period due to the timing of sales and
repurchases of the Fund shares in relation to income earned and/or fluctuating fair value of the investments of the Fund.
bBased on average daily shares outstanding.
cTotal return does not reflect sales commissions or contingent deferred sales charges, if applicable.
dBenefit of waiver and payments by affiliates rounds to less than 0.01%.
eBenefit of expense reduction rounds to less than 0.01%.
64 | Annual Report | The accompanying notes are an integral part of these financial statements. franklintempleton.com
FRANKLIN CUSTODIAN FUNDS
FINANCIAL HIGHLIGHTS
| | | | | | | | | | | | | | | |
| Franklin Growth Fund (continued) | | | | | | | | | | | | | | | |
| | | | | | Year Ended September 30, | | | | |
| | | 2014 | | | 2013 | | | 2012 | | | 2011 | | | 2010 | |
| Class R | | | | | | | | | | | | | | | |
| Per share operating performance | | | | | | | | | | | | | | | |
| (for a share outstanding throughout the year) | | | | | | | | | | | | | | | |
| Net asset value, beginning of year | $ | 59.07 | | $ | 49.82 | | $ | 40.23 | | $ | 40.94 | | $ | 36.37 | |
| Income from investment operationsa: | | | | | | | | | | | | | | | |
| Net investment incomeb | | 0.10 | | | 0.13 | | | 0.08 | | | 0.06 | | | 0.08 | |
| Net realized and unrealized gains (losses) | | 10.98 | | | 9.18 | | | 9.71 | | | (0.65 | ) | | 4.72 | |
| Total from investment operations | | 11.08 | | | 9.31 | | | 9.79 | | | (0.59 | ) | | 4.80 | |
| Less distributions from: | | | | | | | | | | | | | | | |
| Net investment income | | (0.10 | ) | | (0.06 | ) | | (0.08 | ) | | (0.12 | ) | | (0.23 | ) |
| Net realized gains | | — | | | — | | | (0.12 | ) | | — | | | — | |
| Total distributions | | (0.10 | ) | | (0.06 | ) | | (0.20 | ) | | (0.12 | ) | | (0.23 | ) |
| Net asset value, end of year | $ | 70.05 | | $ | 59.07 | | $ | 49.82 | | $ | 40.23 | | $ | 40.94 | |
| |
| Total return | | 18.77 | % | | 18.71 | % | | 24.42 | % | | (1.47 | )% | | 13.26 | % |
| |
| Ratios to average net assets | | | | | | | | | | | | | | | |
| Expenses | | 1.15 | %c,d | | 1.16 | %d | | 1.19 | % | | 1.17 | % | | 1.19 | % |
| Net investment income | | 0.15 | % | | 0.24 | % | | 0.18 | % | | 0.17 | % | | 0.25 | % |
| |
| Supplemental data | | | | | | | | | | | | | | | |
| Net assets, end of year (000’s) | $ | 565,634 | | $ | 552,391 | | $ | 466,954 | | $ | 283,464 | | $ | 117,484 | |
| Portfolio turnover rate | | 1.50 | % | | 0.83 | % | | 3.50 | % | | 2.72 | % | | 4.36 | % |
aThe amount shown for a share outstanding throughout the period may not correlate with the Statement of Operations for the period due to the timing of sales and
repurchases of the Fund shares in relation to income earned and/or fluctuating fair value of the investments of the Fund.
bBased on average daily shares outstanding.
cBenefit of waiver and payments by affiliates rounds to less than 0.01%.
dBenefit of expense reduction rounds to less than 0.01%.
franklintempleton.com The accompanying notes are an integral part of these financial statements. | Annual Report | 65
FRANKLIN CUSTODIAN FUNDS
FINANCIAL HIGHLIGHTS
| | | | | | |
| Franklin Growth Fund (continued) | | | | | | |
| | | Year Ended | |
| | | September 30, | |
| | | 2014 | | | 2013 | a |
| Class R6 | | | | | | |
| Per share operating performance | | | | | | |
| (for a share outstanding throughout the year) | | | | | | |
| Net asset value, beginning of year | $ | 59.71 | | $ | 54.58 | |
| Income from investment operationsb: | | | | | | |
| Net investment incomec | | 0.55 | | | 0.24 | |
| Net realized and unrealized gains (losses) | | 11.08 | | | 4.89 | |
| Total from investment operations | | 11.63 | | | 5.13 | |
| Less distributions from net investment income | | (0.58 | ) | | — | |
| Net asset value, end of year | $ | 70.76 | | $ | 59.71 | |
| |
| Total returnd | | 19.59 | % | | 9.40 | % |
| |
| Ratios to average net assetse | | | | | | |
| Expensesf | | 0.47 | %g | | 0.48 | % |
| Net investment income | | 0.83 | % | | 0.92 | % |
| |
| Supplemental data | | | | | | |
| Net assets, end of year (000’s) | $ | 1,107,887 | | $ | 871,260 | |
| Portfolio turnover rate | | 1.50 | % | | 0.83 | % |
aFor the period May 1, 2013 (effective date) to September 30, 2013.
bThe amount shown for a share outstanding throughout the period may not correlate with the Statement of Operations for the period due to the timing of sales and
repurchases of the Fund shares in relation to income earned and/or fluctuating fair value of the investments of the Fund.
cBased on average daily shares outstanding.
dTotal return is not annualized for periods less than one year.
eRatios are annualized for periods less than one year.
fBenefit of expense reduction rounds to less than 0.01%.
gBenefit of waiver and payments by affiliates rounds to less than 0.01%.
66 | Annual Report | The accompanying notes are an integral part of these financial statements. franklintempleton.com
FRANKLIN CUSTODIAN FUNDS
FINANCIAL HIGHLIGHTS
| | | | | | | | | | | | | | | |
| Franklin Growth Fund (continued) | | | | | | | | | | | | | | | |
| | | | | | Year Ended September 30, | | | | |
| | | 2014 | | | 2013 | | | 2012 | | | 2011 | | | 2010 | |
| Advisor Class | | | | | | | | | | | | | | | |
| Per share operating performance | | | | | | | | | | | | | | | |
| (for a share outstanding throughout the year) | | | | | | | | | | | | | | | |
| Net asset value, beginning of year | $ | 59.66 | | $ | 50.24 | | $ | 40.53 | | $ | 41.18 | | $ | 36.53 | |
| Income from investment operationsa: | | | | | | | | | | | | | | | |
| Net investment incomeb | | 0.43 | | | 0.39 | | | 0.32 | | | 0.30 | | | 0.29 | |
| Net realized and unrealized gains (losses) | | 11.08 | | | 9.26 | | | 9.78 | | | (0.68 | ) | | 4.72 | |
| Total from investment operations | | 11.51 | | | 9.65 | | | 10.10 | | | (0.38 | ) | | 5.01 | |
| Less distributions from: | | | | | | | | | | | | | | | |
| Net investment income | | (0.42 | ) | | (0.23 | ) | | (0.27 | ) | | (0.27 | ) | | (0.36 | ) |
| Net realized gains | | — | | | — | | | (0.12 | ) | | — | | | — | |
| Total distributions | | (0.42 | ) | | (0.23 | ) | | (0.39 | ) | | (0.27 | ) | | (0.36 | ) |
| Net asset value, end of year | $ | 70.75 | | $ | 59.66 | | $ | 50.24 | | $ | 40.53 | | $ | 41.18 | |
| |
| Total return | | 19.37 | % | | 19.29 | % | | 25.04 | % | | (0.96 | )% | | 13.82 | % |
| |
| Ratios to average net assets | | | | | | | | | | | | | | | |
| Expenses | | 0.65 | %c,d | | 0.66 | %d | | 0.69 | % | | 0.67 | % | | 0.69 | % |
| Net investment income | | 0.65 | % | | 0.74 | % | | 0.68 | % | | 0.67 | % | | 0.75 | % |
| |
| Supplemental data | | | | | | | | | | | | | | | |
| Net assets, end of year (000’s) | $ | 1,414,980 | | $ | 1,080,811 | | $ | 1,399,191 | | $ | 917,394 | | $ | 544,936 | |
| Portfolio turnover rate | | 1.50 | % | | 0.83 | % | | 3.50 | % | | 2.72 | % | | 4.36 | % |
aThe amount shown for a share outstanding throughout the period may not correlate with the Statement of Operations for the period due to the timing of sales and
repurchases of the Fund shares in relation to income earned and/or fluctuating fair value of the investments of the Fund.
bBased on average daily shares outstanding.
cBenefit of waiver and payments by affiliates rounds to less than 0.01%.
dBenefit of expense reduction rounds to less than 0.01%.
franklintempleton.com The accompanying notes are an integral part of these financial statements. | Annual Report | 67
FRANKLIN CUSTODIAN FUNDS
| | | | |
| Statement of Investments, September 30, 2014 | | | | |
| |
| Franklin Growth Fund | | | | |
| | Country | Shares | | Value |
| Common Stocks 90.2% | | | | |
| Automobiles & Components 2.2% | | | | |
| BorgWarner Inc. | United States | 1,200,000 | $ | 63,132,000 |
| Ford Motor Co. | United States | 1,200,000 | | 17,748,000 |
| General Motors Co. | United States | 800,000 | | 25,552,000 |
| Harley-Davidson Inc. | United States | 913,096 | | 53,142,187 |
| Johnson Controls Inc. | United States | 1,600,000 | | 70,400,000 |
| | | | | 229,974,187 |
| Banks 0.7% | | | | |
| JPMorgan Chase & Co. | United States | 600,000 | | 36,144,000 |
| Wells Fargo & Co. | United States | 750,000 | | 38,902,500 |
| | | | | 75,046,500 |
| Capital Goods 16.9% | | | | |
| 3M Co. | United States | 855,000 | | 121,136,400 |
| ABB Ltd., ADR | Switzerland | 1,500,000 | | 33,615,000 |
| Allegion PLC | United States | 366,666 | | 17,467,968 |
| The Boeing Co. | United States | 1,100,000 | | 140,118,000 |
| Caterpillar Inc. | United States | 550,000 | | 54,466,500 |
| Danaher Corp. | United States | 1,000,000 | | 75,980,000 |
| Deere & Co. | United States | 500,000 | | 40,995,000 |
| Emerson Electric Co. | United States | 1,100,000 | | 68,838,000 |
| General Dynamics Corp. | United States | 1,000,000 | | 127,090,000 |
| General Electric Co. | United States | 1,800,000 | | 46,116,000 |
| Huntington Ingalls Industries Inc. | United States | 166,666 | | 17,368,264 |
| Illinois Tool Works Inc. | United States | 1,000,000 | | 84,420,000 |
| Ingersoll-Rand PLC | United States | 1,100,000 | | 61,996,000 |
| Lockheed Martin Corp. | United States | 500,000 | | 91,390,000 |
| Northrop Grumman Corp. | United States | 1,100,000 | | 144,936,000 |
| aNOW Inc. | United States | 162,500 | | 4,941,625 |
| Pall Corp. | United States | 1,000,000 | | 83,700,000 |
| Precision Castparts Corp. | United States | 250,000 | | 59,220,000 |
| Raytheon Co. | United States | 600,000 | | 60,972,000 |
| Rockwell Collins Inc. | United States | 350,000 | | 27,475,000 |
| aSensata Technologies Holding NV | United States | 1,000,000 | | 44,530,000 |
| Stanley Black & Decker Inc. | United States | 600,000 | | 53,274,000 |
| Textron Inc. | United States | 1,600,000 | | 57,584,000 |
| United Technologies Corp. | United States | 900,000 | | 95,040,000 |
| W.W. Grainger Inc. | United States | 550,000 | | 138,407,500 |
| | | | | 1,751,077,257 |
| Commercial & Professional Services 2.0% | | | | |
| Dun & Bradstreet Corp. | United States | 400,000 | | 46,988,000 |
| Equifax Inc. | United States | 500,000 | | 37,370,000 |
| aIHS Inc., A | United States | 450,000 | | 56,335,500 |
| Robert Half International Inc. | United States | 150,000 | | 7,350,000 |
| aStericycle Inc. | United States | 200,000 | | 23,312,000 |
| aVerisk Analytics Inc., A | United States | 550,000 | | 33,489,500 |
| | | | | 204,845,000 |
68 | Annual Report franklintempleton.com
FRANKLIN CUSTODIAN FUNDS
STATEMENT OF INVESTMENTS
| | | | |
| Franklin Growth Fund (continued) | | | | |
| | Country | Shares | | Value |
| Common Stocks (continued) | | | | |
| Consumer Durables & Apparel 2.4% | | | | |
| NIKE Inc., B | United States | 900,000 | $ | 80,280,000 |
| Ralph Lauren Corp. | United States | 225,000 | | 37,064,250 |
| VF Corp. | United States | 2,000,000 | | 132,060,000 |
| | | | | 249,404,250 |
| Consumer Services 1.2% | | | | |
| Carnival Corp. | United States | 1,200,000 | | 48,204,000 |
| Graham Holdings Co., B | United States | 80,000 | | 55,967,200 |
| Starwood Hotels & Resorts Worldwide Inc. | United States | 250,000 | | 20,802,500 |
| | | | | 124,973,700 |
| Diversified Financials 2.2% | | | | |
| American Express Co. | United States | 600,000 | | 52,524,000 |
| aBerkshire Hathaway Inc., A | United States | 184 | | 38,069,600 |
| BlackRock Inc. | United States | 208,000 | | 68,290,560 |
| T. Rowe Price Group Inc. | United States | 900,000 | | 70,560,000 |
| | | | | 229,444,160 |
| Energy 3.4% | | | | |
| Anadarko Petroleum Corp. | United States | 675,000 | | 68,472,000 |
| Devon Energy Corp. | United States | 320,000 | | 21,817,600 |
| Exxon Mobil Corp. | United States | 70,000 | | 6,583,500 |
| aFMC Technologies Inc. | United States | 750,000 | | 40,732,500 |
| Halliburton Co. | United States | 850,000 | | 54,833,500 |
| National Oilwell Varco Inc. | United States | 650,000 | | 49,465,000 |
| Occidental Petroleum Corp. | United States | 300,000 | | 28,845,000 |
| Royal Dutch Shell PLC, A, ADR | United Kingdom | 280,000 | | 21,316,400 |
| Schlumberger Ltd. | United States | 550,000 | | 55,929,500 |
| | | | | 347,995,000 |
| Food & Staples Retailing 0.5% | | | | |
| CVS Health Corp. | United States | 600,000 | | 47,754,000 |
| Food, Beverage & Tobacco 2.2% | | | | |
| Bunge Ltd. | United States | 250,000 | | 21,057,500 |
| Mead Johnson Nutrition Co., A | United States | 850,000 | | 81,787,000 |
| aMonster Beverage Corp. | United States | 900,000 | | 82,503,000 |
| PepsiCo Inc. | United States | 450,000 | | 41,890,500 |
| | | | | 227,238,000 |
| Health Care Equipment & Services 6.2% | | | | |
| Abbott Laboratories | United States | 900,000 | | 37,431,000 |
| Aetna Inc. | United States | 400,000 | | 32,400,000 |
| aAllscripts Healthcare Solutions Inc. | United States | 1,100,000 | | 14,756,500 |
| Baxter International Inc. | United States | 400,000 | | 28,708,000 |
| Cardinal Health Inc. | United States | 300,000 | | 22,476,000 |
| aCareFusion Corp. | United States | 1,000,000 | | 45,250,000 |
| Covidien PLC | United States | 425,000 | | 36,766,750 |
| aEdwards Lifesciences Corp. | United States | 200,000 | | 20,430,000 |
| aEnvision Healthcare Holdings Inc. | United States | 1,360,000 | | 47,164,800 |
| aExpress Scripts Holding Co. | United States | 361,648 | | 25,543,198 |
| aHaemonetics Corp. | United States | 1,000,000 | | 34,920,000 |
| aHenry Schein Inc. | United States | 350,000 | | 40,764,500 |
| Hill-Rom Holdings Inc. | United States | 300,000 | | 12,429,000 |
franklintempleton.com Annual Report | 69
FRANKLIN CUSTODIAN FUNDS
STATEMENT OF INVESTMENTS
| | | | |
| Franklin Growth Fund (continued) | | | | |
| | Country | Shares | | Value |
| Common Stocks (continued) | | | | |
| Health Care Equipment & Services (continued) | | | | |
| aIntuitive Surgical Inc. | United States | 150,000 | $ | 69,273,000 |
| Quest Diagnostics Inc. | United States | 900,000 | | 54,612,000 |
| Stryker Corp. | United States | 400,000 | | 32,300,000 |
| Teleflex Inc. | United States | 500,000 | | 52,520,000 |
| aVarian Medical Systems Inc. | United States | 300,000 | | 24,036,000 |
| Zimmer Holdings Inc. | United States | 100,000 | | 10,055,000 |
| | | | | 641,835,748 |
| Household & Personal Products 0.3% | | | | |
| The Procter & Gamble Co. | United States | 335,000 | | 28,052,900 |
| Insurance 0.3% | | | | |
| Aflac Inc. | United States | 600,000 | | 34,950,000 |
| Materials 5.6% | | | | |
| Air Products and Chemicals Inc. | United States | 500,000 | | 65,090,000 |
| Avery Dennison Corp. | United States | 462,000 | | 20,628,300 |
| Celanese Corp., A | United States | 1,200,000 | | 70,224,000 |
| Cytec Industries Inc. | United States | 2,000,000 | | 94,580,000 |
| Ecolab Inc. | United States | 650,000 | | 74,639,500 |
| Freeport-McMoRan Inc., B | United States | 1,300,000 | | 42,445,000 |
| Martin Marietta Materials Inc. | United States | 275,000 | | 35,458,500 |
| Praxair Inc. | United States | 550,000 | | 70,950,000 |
| Sigma-Aldrich Corp. | United States | 800,000 | | 108,808,000 |
| | | | | 582,823,300 |
| Media 1.4% | | | | |
| The Walt Disney Co. | United States | 1,687,290 | | 150,219,429 |
| Pharmaceuticals, Biotechnology & Life Sciences 14.0% | | | | |
| AbbVie Inc. | United States | 400,000 | | 23,104,000 |
| Agilent Technologies Inc. | United States | 1,300,000 | | 74,074,000 |
| Allergan Inc. | United States | 1,000,000 | | 178,190,000 |
| Amgen Inc. | United States | 1,000,000 | | 140,460,000 |
| aBiogen Idec Inc. | United States | 500,000 | | 165,405,000 |
| aCelgene Corp. | United States | 780,000 | | 73,928,400 |
| aCovance Inc. | United States | 200,000 | | 15,740,000 |
| Eli Lilly & Co. | United States | 1,350,000 | | 87,547,500 |
| aGilead Sciences Inc. | United States | 600,000 | | 63,870,000 |
| aHospira Inc. | United States | 1,350,000 | | 70,240,500 |
| aIllumina Inc. | United States | 400,000 | | 65,568,000 |
| Johnson & Johnson | United States | 1,200,100 | | 127,918,659 |
| Merck & Co. Inc. | United States | 1,000,000 | | 59,280,000 |
| aMettler-Toledo International Inc. | United States | 425,000 | | 108,855,250 |
| Pfizer Inc. | United States | 2,761,000 | | 81,642,770 |
| Roche Holding AG, ADR | Switzerland | 1,500,000 | | 55,485,000 |
| aWaters Corp. | United States | 575,000 | | 56,994,000 |
| | | | | 1,448,303,079 |
| Real Estate 0.6% | | | | |
| American Tower Corp. | United States | 715,000 | | 66,945,450 |
| Retailing 1.4% | | | | |
| aAmazon.com Inc. | United States | 320,000 | | 103,180,800 |
| Expedia Inc. | United States | 200,000 | | 17,524,000 |
70 | Annual Report franklintempleton.com
FRANKLIN CUSTODIAN FUNDS
STATEMENT OF INVESTMENTS
| | | | |
| Franklin Growth Fund (continued) | | | | |
| | Country | Shares | | Value |
| Common Stocks (continued) | | | | |
| Retailing (continued) | | | | |
| HSN Inc. | United States | 100,000 | $ | 6,137,000 |
| aTripAdvisor Inc. | United States | 200,000 | | 18,284,000 |
| | | | | 145,125,800 |
| Semiconductors & Semiconductor Equipment 0.8% | | | | |
| ASML Holding NV, N.Y. shs | Netherlands | 250,000 | | 24,705,000 |
| Intel Corp. | United States | 1,100,000 | | 38,302,000 |
| aSunPower Corp. | United States | 133,873 | | 4,535,617 |
| Texas Instruments Inc. | United States | 250,000 | | 11,922,500 |
| | | | | 79,465,117 |
| Software & Services 10.8% | | | | |
| aAlibaba Group Holding Ltd., ADR | China | 480,400 | | 42,683,540 |
| aAutodesk Inc. | United States | 800,000 | | 44,080,000 |
| Automatic Data Processing Inc. | United States | 700,000 | | 58,156,000 |
| aCheck Point Software Technologies Ltd. | Israel | 525,000 | | 36,351,000 |
| Computer Sciences Corp. | United States | 1,400,000 | | 85,610,000 |
| aFacebook Inc., A | United States | 400,000 | | 31,616,000 |
| aFortinet Inc. | United States | 1,500,000 | | 37,897,500 |
| Google Inc., A | United States | 150,000 | | 88,261,500 |
| aGoogle Inc., C | United States | 150,000 | | 86,604,000 |
| IAC/InterActiveCorp | United States | 300,000 | | 19,770,000 |
| aInformatica Corp. | United States | 800,000 | | 27,392,000 |
| International Business Machines Corp. | United States | 600,000 | | 113,898,000 |
| Intuit Inc. | United States | 1,000,000 | | 87,650,000 |
| MasterCard Inc., A | United States | 1,000,000 | | 73,920,000 |
| Microsoft Corp. | United States | 1,300,000 | | 60,268,000 |
| Oracle Corp. | United States | 2,400,000 | | 91,872,000 |
| Visa Inc., A | United States | 300,000 | | 64,011,000 |
| aYahoo! Inc. | United States | 1,700,000 | | 69,275,000 |
| | | | | 1,119,315,540 |
| Technology Hardware & Equipment 7.6% | | | | |
| Apple Inc. | United States | 4,025,000 | | 405,518,750 |
| Cisco Systems Inc. | United States | 2,945,000 | | 74,125,650 |
| EMC Corp. | United States | 2,700,000 | | 79,002,000 |
| Hewlett-Packard Co. | United States | 1,156,250 | | 41,012,188 |
| QUALCOMM Inc. | United States | 660,000 | | 49,348,200 |
| TE Connectivity Ltd. | United States | 1,250,000 | | 69,112,500 |
| aTrimble Navigation Ltd. | United States | 2,400,000 | | 73,200,000 |
| | | | | 791,319,288 |
| Transportation 6.9% | | | | |
| Alaska Air Group Inc. | United States | 3,200,000 | | 139,328,000 |
| Allegiant Travel Co. | United States | 200,000 | | 24,732,000 |
| ArcBest Corp. | United States | 260,000 | | 9,698,000 |
| C.H. Robinson Worldwide Inc. | United States | 267,300 | | 17,727,336 |
| Canadian National Railway Co. | Canada | 1,000,000 | | 70,960,000 |
| Canadian Pacific Railway Ltd. | Canada | 500,000 | | 103,735,000 |
| Expeditors International of Washington Inc. | United States | 600,000 | | 24,348,000 |
| Forward Air Corp. | United States | 500,000 | | 22,415,000 |
| Heartland Express Inc. | United States | 600,000 | | 14,376,000 |
| aInternational Consolidated Airlines Group SA, ADR | United Kingdom | 1,400,000 | | 41,734,000 |
franklintempleton.com Annual Report | 71
FRANKLIN CUSTODIAN FUNDS
STATEMENT OF INVESTMENTS
| | | | | |
| Franklin Growth Fund (continued) | | | | | |
| | Country | | Shares | | Value |
| Common Stocks (continued) | | | | | |
| Transportation (continued) | | | | | |
| Kansas City Southern | United States | | 400,000 | $ | 48,480,000 |
| aRyanair Holdings PLC, ADR | Ireland | | 239,200 | | 13,498,056 |
| Union Pacific Corp. | United States | | 1,200,000 | | 130,104,000 |
| aUnited Continental Holdings Inc. | United States | | 1,050,000 | | 49,129,500 |
| | | | | | 710,264,892 |
| Utilities 0.6% | | | | | |
| American Water Works Co. Inc. | United States | | 700,000 | | 33,761,000 |
| NextEra Energy Inc. | United States | | 250,000 | | 23,470,000 |
| | | | | | 57,231,000 |
| Total Common Stocks (Cost $3,855,533,924) | | | | | 9,343,603,597 |
| Short Term Investments 6.0% | | | | | |
| Money Market Funds (Cost $520,027,951) 5.0% | | | | | |
| a,bInstitutional Fiduciary Trust Money Market Portfolio | United States | | 520,027,951 | | 520,027,951 |
| |
| | | | Principal | | |
| | | | Amount | | |
| Repurchase Agreements (Cost $102,946,023) 1.0% | | | | | |
| cJoint Repurchase Agreement, 0.006%, 10/01/14 | | | | | |
| (Maturity Value $102,946,040) | United States | $ | 102,946,023 | | 102,946,023 |
| BNP Paribas Securities Corp. (Maturity Value $14,398,034) | | | | | |
| HSBC Securities (USA) Inc. (Maturity Value $60,471,533) | | | | | |
| Merrill Lynch, Pierce, Fenner & Smith Inc. (Maturity Value $28,076,473) | | | | | |
| Collateralized by U.S. Government Agency Securities, 0.125% - 5.50%, | | | | | |
| 12/29/14 - 12/17/29; dU.S. Government Agency Discount Notes, | | | | | |
| 11/17/14 - 3/19/15; U.S. Government Agency Securities, zero cpn., | | | | | |
| 12/11/25 - 12/17/29; and U.S. Government Agency Securities, Strips, | | | | | |
| 6/01/17 (valued at $105,031,366) | | | | | |
| Total Investments (Cost $4,478,507,898) 96.2% | | | | | 9,966,577,571 |
| Other Assets, less Liabilities 3.8% | | | | | 395,544,822 |
| Net Assets 100.0% | | | | $ | 10,362,122,393 |
See Abbreviations on page 143.
aNon-income producing.
bSee Note 3(f) regarding investments in Institutional Fiduciary Trust Money Market Portfolio.
cSee Note 1(c) regarding joint repurchase agreement.
dThe security is traded on a discount basis with no stated coupon rate.
72 | Annual Report | The accompanying notes are an integral part of these financial statements. franklintempleton.com
FRANKLIN CUSTODIAN FUNDS
| | | | | | | | | | | | | | | |
| Financial Highlights | | | | | | | | | | | | | | | |
| Franklin Income Fund | | | | | | | | | | | | | | | |
| | | | | | Year Ended September 30, | | | | |
| | | 2014 | | | 2013 | | | 2012 | | | 2011 | | | 2010 | |
| Class A | | | | | | | | | | | | | | | |
| Per share operating performance | | | | | | | | | | | | | | | |
| (for a share outstanding throughout the year) | | | | | | | | | | | | | | | |
| Net asset value, beginning of year | $ | 2.33 | | $ | 2.23 | | $ | 1.98 | | $ | 2.11 | | $ | 1.99 | |
| Income from investment operationsa: | | | | | | | | | | | | | | | |
| Net investment incomeb | | 0.11 | | | 0.11 | | | 0.13 | | | 0.13 | | | 0.13 | |
| Net realized and unrealized gains (losses) | | 0.16 | | | 0.12 | | | 0.26 | | | (0.12 | ) | | 0.14 | |
| Total from investment operations | | 0.27 | | | 0.23 | | | 0.39 | | | 0.01 | | | 0.27 | |
| Less distributions from net investment income | | (0.12 | ) | | (0.13 | ) | | (0.14 | ) | | (0.14 | ) | | (0.15 | ) |
| Net asset value, end of year | $ | 2.48 | | $ | 2.33 | | $ | 2.23 | | $ | 1.98 | | $ | 2.11 | |
| |
| Total returnc | | 11.86 | % | | 10.72 | % | | 20.38 | % | | 0.01 | % | | 13.90 | % |
| |
| Ratios to average net assets | | | | | | | | | | | | | | | |
| Expensesd | | 0.61 | %e | | 0.62 | % | | 0.64 | % | | 0.63 | % | | 0.65 | % |
| Net investment income | | 4.28 | % | | 4.98 | % | | 5.90 | % | | 6.03 | % | | 6.40 | % |
| |
| Supplemental data | | | | | | | | | | | | | | | |
| Net assets, end of year (000’s) | $ | 53,823,921 | | $ | 48,320,611 | | $ | 41,280,437 | | $ | 32,847,934 | | $ | 32,281,991 | |
| Portfolio turnover rate | | 36.03 | % | | 37.60 | % | | 33.44 | % | | 35.83 | % | | 46.85 | % |
aThe amount shown for a share outstanding throughout the period may not correlate with the Statement of Operations for the period due to the timing of sales and
repurchases of the Fund shares in relation to income earned and/or fluctuating fair value of the investments of the Fund.
bBased on average daily shares outstanding.
cTotal return does not reflect sales commissions or contingent deferred sales charges, if applicable.
dBenefit of expense reduction rounds to less than 0.01%.
eBenefit of waiver and payments by affiliates rounds to less than 0.01%.
franklintempleton.com The accompanying notes are an integral part of these financial statements. | Annual Report | 73
FRANKLIN CUSTODIAN FUNDS
FINANCIAL HIGHLIGHTS
| | | | | | | | | | | | | | | |
| Franklin Income Fund (continued) | | | | | | | | | | | | | | | |
| | | | | | Year Ended September 30, | | | | |
| | | 2014 | | | 2013 | | | 2012 | | | 2011 | | | 2010 | |
| Class C | | | | | | | | | | | | | | | |
| Per share operating performance | | | | | | | | | | | | | | | |
| (for a share outstanding throughout the year) | | | | | | | | | | | | | | | |
| Net asset value, beginning of year | $ | 2.35 | | $ | 2.25 | | $ | 2.00 | | $ | 2.13 | | $ | 2.00 | |
| Income from investment operationsa: | | | | | | | | | | | | | | | |
| Net investment incomeb | | 0.09 | | | 0.10 | | | 0.12 | | | 0.12 | | | 0.12 | |
| Net realized and unrealized gains (losses) | | 0.17 | | | 0.12 | | | 0.26 | | | (0.12 | ) | | 0.15 | |
| Total from investment operations | | 0.26 | | | 0.22 | | | 0.38 | | | — | | | 0.27 | |
| Less distributions from net investment income | | (0.11 | ) | | (0.12 | ) | | (0.13 | ) | | (0.13 | ) | | (0.14 | ) |
| Net asset value, end of year | $ | 2.50 | | $ | 2.35 | | $ | 2.25 | | $ | 2.00 | | $ | 2.13 | |
| |
| Total returnc | | 11.19 | % | | 10.07 | % | | 19.58 | % | | (0.48 | )% | | 13.76 | % |
| |
| Ratios to average net assets | | | | | | | | | | | | | | | |
| Expensesd | | 1.11 | %e | | 1.12 | % | | 1.14 | % | | 1.13 | % | | 1.15 | % |
| Net investment income | | 3.78 | % | | 4.48 | % | | 5.40 | % | | 5.53 | % | | 5.90 | % |
| |
| Supplemental data | | | | | | | | | | | | | | | |
| Net assets, end of year (000’s) | $ | 28,802,209 | | $ | 24,016,797 | | $ | 20,220,114 | | $ | 16,217,805 | | $ | 15,605,055 | |
| Portfolio turnover rate | | 36.03 | % | | 37.60 | % | | 33.44 | % | | 35.83 | % | | 46.85 | % |
aThe amount shown for a share outstanding throughout the period may not correlate with the Statement of Operations for the period due to the timing of sales and
repurchases of the Fund shares in relation to income earned and/or fluctuating fair value of the investments of the Fund.
bBased on average daily shares outstanding.
cTotal return does not reflect sales commissions or contingent deferred sales charges, if applicable.
dBenefit of expense reduction rounds to less than 0.01%.
eBenefit of waiver and payments by affiliates rounds to less than 0.01%.
74 | Annual Report | The accompanying notes are an integral part of these financial statements. franklintempleton.com
FRANKLIN CUSTODIAN FUNDS
FINANCIAL HIGHLIGHTS
| | | | | | | | | | | | | | | |
| Franklin Income Fund (continued) | | | | | | | | | | | | | | | |
| | | | | | Year Ended September 30, | | | | |
| | | 2014 | | | 2013 | | | 2012 | | | 2011 | | | 2010 | |
| Class R | | | | | | | | | | | | | | | |
| Per share operating performance | | | | | | | | | | | | | | | |
| (for a share outstanding throughout the year) | | | | | | | | | | | | | | | |
| Net asset value, beginning of year | $ | 2.29 | | $ | 2.20 | | $ | 1.96 | | $ | 2.09 | | $ | 1.96 | |
| Income from investment operationsa: | | | | | | | | | | | | | | | |
| Net investment incomeb | | 0.10 | | | 0.11 | | | 0.12 | | | 0.12 | | | 0.12 | |
| Net realized and unrealized gains (losses) | | 0.16 | | | 0.10 | | | 0.25 | | | (0.12 | ) | | 0.15 | |
| Total from investment operations | | 0.26 | | | 0.21 | | | 0.37 | | | — | | | 0.27 | |
| Less distributions from net investment income | | (0.11 | ) | | (0.12 | ) | | (0.13 | ) | | (0.13 | ) | | (0.14 | ) |
| Net asset value, end of year | $ | 2.44 | | $ | 2.29 | | $ | 2.20 | | $ | 1.96 | | $ | 2.09 | |
| |
| Total return | | 11.66 | % | | 10.03 | % | | 19.66 | % | | (0.32 | )% | | 14.23 | % |
| |
| Ratios to average net assets | | | | | | | | | | | | | | | |
| Expensesc | | 0.96 | %d | | 0.97 | % | | 0.99 | % | | 0.98 | % | | 1.00 | % |
| Net investment income | | 3.93 | % | | 4.63 | % | | 5.55 | % | | 5.68 | % | | 6.05 | % |
| |
| Supplemental data | | | | | | | | | | | | | | | |
| Net assets, end of year (000’s) | $ | 514,892 | | $ | 446,463 | | $ | 426,525 | | $ | 360,907 | | $ | 370,564 | |
| Portfolio turnover rate | | 36.03 | % | | 37.60 | % | | 33.44 | % | | 35.83 | % | | 46.85 | % |
aThe amount shown for a share outstanding throughout the period may not correlate with the Statement of Operations for the period due to the timing of sales and
repurchases of the Fund shares in relation to income earned and/or fluctuating fair value of the investments of the Fund.
bBased on average daily shares outstanding.
cBenefit of expense reduction rounds to less than 0.01%.
dBenefit of waiver and payments by affiliates rounds to less than 0.01%.
franklintempleton.com The accompanying notes are an integral part of these financial statements. | Annual Report | 75
FRANKLIN CUSTODIAN FUNDS
FINANCIAL HIGHLIGHTS
| | | | | | |
| Franklin Income Fund (continued) | | | | | | |
| | | Year Ended | |
| | | September 30, | |
| | | 2014 | | | 2013 | a |
| Class R6 | | | | | | |
| Per share operating performance | | | | | | |
| (for a share outstanding throughout the year) | | | | | | |
| Net asset value, beginning of year | $ | 2.31 | | $ | 2.33 | |
| Income from investment operationsb: | | | | | | |
| Net investment incomec | | 0.11 | | | 0.04 | |
| Net realized and unrealized gains (losses) | | 0.17 | | | (0.02 | ) |
| Total from investment operations | | 0.28 | | | 0.02 | |
| Less distributions from net investment income | | (0.13 | ) | | (0.04 | ) |
| Net asset value, end of year | $ | 2.46 | | $ | 2.31 | |
| |
| Total returnd | | 12.19 | % | | 1.06 | % |
| |
| Ratios to average net assetse | | | | | | |
| Expensesf | | 0.38 | %g | | 0.39 | % |
| Net investment income | | 4.50 | % | | 5.21 | % |
| |
| Supplemental data | | | | | | |
| Net assets, end of year (000’s) | $ | 2,108,076 | | $ | 1,921,084 | |
| Portfolio turnover rate | | 36.03 | % | | 37.60 | % |
aFor the period May 1, 2013 (effective date) to September 30, 2013.
bThe amount shown for a share outstanding throughout the period may not correlate with the Statement of Operations for the period due to the timing of sales and
repurchases of the Fund shares in relation to income earned and/or fluctuating fair value of the investments of the Fund.
cBased on average daily shares outstanding.
dTotal return is not annualized for periods less than one year.
eRatios are annualized for periods less than one year.
fBenefit of expense reduction rounds to less than 0.01%.
gBenefit of waiver and payments by affiliates rounds to less than 0.01%.
76 | Annual Report | The accompanying notes are an integral part of these financial statements. franklintempleton.com
FRANKLIN CUSTODIAN FUNDS
FINANCIAL HIGHLIGHTS
| | | | | | | | | | | | | | | |
| Franklin Income Fund (continued) | | | | | | | | | | | | | | | |
| | | | | | Year Ended September 30, | | | | |
| | | 2014 | | | 2013 | | | 2012 | | | 2011 | | | 2010 | |
| Advisor Class | | | | | | | | | | | | | | | |
| Per share operating performance | | | | | | | | | | | | | | | |
| (for a share outstanding throughout the year) | | | | | | | | | | | | | | | |
| Net asset value, beginning of year | $ | 2.31 | | $ | 2.22 | | $ | 1.97 | | $ | 2.10 | | $ | 1.98 | |
| Income from investment operationsa: | | | | | | | | | | | | | | | |
| Net investment incomeb | | 0.11 | | | 0.12 | | | 0.13 | | | 0.13 | | | 0.13 | |
| Net realized and unrealized gains (losses) | | 0.17 | | | 0.11 | | | 0.26 | | | (0.12 | ) | | 0.14 | |
| Total from investment operations | | 0.28 | | | 0.23 | | | 0.39 | | | 0.01 | | | 0.27 | |
| Less distributions from net investment income | | (0.13 | ) | | (0.14 | ) | | (0.14 | ) | | (0.14 | ) | | (0.15 | ) |
| Net asset value, end of year | $ | 2.46 | | $ | 2.31 | | $ | 2.22 | | $ | 1.97 | | $ | 2.10 | |
| |
| Total return | | 12.12 | % | | 10.49 | % | | 20.69 | % | | 0.16 | % | | 14.15 | % |
| |
| Ratios to average net assets | | | | | | | | | | | | | | | |
| Expensesc | | 0.46 | %d | | 0.47 | % | | 0.49 | % | | 0.48 | % | | 0.50 | % |
| Net investment income | | 4.43 | % | | 5.13 | % | | 6.05 | % | | 6.18 | % | | 6.55 | % |
| |
| Supplemental data | | | | | | | | | | | | | | | |
| Net assets, end of year (000’s) | $ | 9,096,269 | | $ | 5,903,701 | | $ | 6,444,763 | | $ | 5,032,128 | | $ | 4,593,709 | |
| Portfolio turnover rate | | 36.03 | % | | 37.60 | % | | 33.44 | % | | 35.83 | % | | 46.85 | % |
aThe amount shown for a share outstanding throughout the period may not correlate with the Statement of Operations for the period due to the timing of sales and
repurchases of the Fund shares in relation to income earned and/or fluctuating fair value of the investments of the Fund.
bBased on average daily shares outstanding.
cBenefit of expense reduction rounds to less than 0.01%.
dBenefit of waiver and payments by affiliates rounds to less than 0.01%.
franklintempleton.com The accompanying notes are an integral part of these financial statements. | Annual Report | 77
FRANKLIN CUSTODIAN FUNDS
| | | | |
| Statement of Investments, September 30, 2014 | | | | |
| |
| Franklin Income Fund | | | | |
| | | Shares/ | | |
| | Country | Warrants | | Value |
| Common Stocks and Other Equity Interests 47.1% | | | | |
| Consumer Discretionary 2.9% | | | | |
| CBS Outdoor Americas Inc. | United States | 5,000,000 | $ | 149,700,000 |
| a,bDex Media Inc. | United States | 2,048,551 | | 19,584,148 |
| Ford Motor Co. | United States | 35,185,000 | | 520,386,150 |
| General Motors Co. | United States | 23,500,000 | | 750,590,000 |
| Target Corp. | United States | 20,000,000 | | 1,253,600,000 |
| | | | | 2,693,860,298 |
| Consumer Staples 0.6% | | | | |
| PepsiCo Inc. | United States | 6,500,000 | | 605,085,000 |
| Energy 8.4% | | | | |
| BP PLC, ADR | United Kingdom | 33,000,000 | | 1,450,350,000 |
| Canadian Oil Sands Ltd. | Canada | 20,000,000 | | 369,060,379 |
| Chevron Corp. | United States | 9,000,000 | | 1,073,880,000 |
| Diamond Offshore Drilling Inc. | United States | 4,000,000 | | 137,080,000 |
| Eni SpA | Italy | 15,000,000 | | 357,463,859 |
| Ensco PLC, A | United States | 2,000,000 | | 82,620,000 |
| Exxon Mobil Corp. | United States | 5,000,000 | | 470,250,000 |
| aHalcon Resources Corp. | United States | 301,159 | | 1,192,590 |
| Occidental Petroleum Corp. | United States | 2,750,000 | | 264,412,500 |
| Royal Dutch Shell PLC, A, ADR | United Kingdom | 24,000,000 | | 1,827,120,000 |
| Spectra Energy Corp. | United States | 10,000,000 | | 392,600,000 |
| Total SA, B, ADR | France | 14,000,000 | | 902,300,000 |
| Transocean Ltd. | United States | 7,000,000 | | 223,790,000 |
| The Williams Cos. Inc. | United States | 3,500,000 | | 193,725,000 |
| Woodside Petroleum Ltd. | Australia | 4,000,000 | | 142,189,323 |
| | | | | 7,888,033,651 |
| Financials 2.7% | | | | |
| Banco Santander SA | Spain | 20,777,624 | | 199,713,115 |
| Commonwealth Bank of Australia | Australia | 3,500,000 | | 230,720,564 |
| Digital Realty Trust Inc. | United States | 2,500,000 | | 155,950,000 |
| HSBC Holdings PLC | United Kingdom | 40,000,000 | | 406,038,369 |
| JPMorgan Chase & Co. | United States | 8,000,000 | | 481,920,000 |
| MetLife Inc. | United States | 5,170,000 | | 277,732,400 |
| Royal Bank of Canada | Canada | 4,000,000 | | 285,994,998 |
| Wells Fargo & Co. | United States | 10,000,000 | | 518,700,000 |
| | | | | 2,556,769,446 |
| Health Care 5.0% | | | | |
| AstraZeneca PLC | United Kingdom | 1,000,000 | | 72,010,039 |
| Bristol-Myers Squibb Co. | United States | 2,510,000 | | 128,461,800 |
| Eli Lilly & Co. | United States | 12,000,000 | | 778,200,000 |
| Johnson & Johnson | United States | 5,000,000 | | 532,950,000 |
| Merck & Co. Inc. | United States | 18,000,000 | | 1,067,040,000 |
| Pfizer Inc. | United States | 45,000,000 | | 1,330,650,000 |
| Sanofi, ADR | France | 14,000,000 | | 790,020,000 |
| | | | | 4,699,331,839 |
| Industrials 4.0% | | | | |
| The Boeing Co. | United States | 2,000,000 | | 254,760,000 |
| a,bCEVA Holdings LLC | United Kingdom | 91,371 | | 100,508,166 |
| Deere & Co. | United States | 4,150,165 | | 340,272,028 |
78 | Annual Report franklintempleton.com
FRANKLIN CUSTODIAN FUNDS
STATEMENT OF INVESTMENTS
| | | | |
| Franklin Income Fund (continued) | | | | |
| | | Shares/ | | |
| | Country | Warrants | | Value |
| Common Stocks and Other Equity Interests (continued) | | | | |
| Industrials (continued) | | | | |
| General Electric Co. | United States | 48,500,000 | $ | 1,242,570,000 |
| Lockheed Martin Corp. | United States | 3,500,000 | | 639,730,000 |
| Raytheon Co. | United States | 2,500,000 | | 254,050,000 |
| Republic Services Inc. | United States | 9,500,000 | | 370,690,000 |
| Waste Management Inc. | United States | 12,500,000 | | 594,125,000 |
| | | | | 3,796,705,194 |
| Information Technology 2.2% | | | | |
| Cisco Systems Inc. | United States | 20,994,425 | | 528,429,677 |
| a,cFirst Data Holdings Inc., B | United States | 21,666,666 | | 86,184,148 |
| Intel Corp. | United States | 25,000,000 | | 870,500,000 |
| Microsoft Corp. | United States | 8,383,900 | | 388,677,604 |
| QUALCOMM Inc. | United States | 2,000,000 | | 149,540,000 |
| | | | | 2,023,331,429 |
| Materials 6.9% | | | | |
| bAgrium Inc. | Canada | 7,500,000 | | 667,500,000 |
| Barrick Gold Corp. | Canada | 12,000,000 | | 175,920,000 |
| BHP Billiton PLC | Australia | 37,500,000 | | 1,042,698,557 |
| The Dow Chemical Co. | United States | 20,000,000 | | 1,048,800,000 |
| E. I. du Pont de Nemours and Co. | United States | 15,000,000 | | 1,076,400,000 |
| Freeport-McMoRan Inc., B | United States | 9,000,000 | | 293,850,000 |
| Goldcorp Inc. | Canada | 10,450,000 | | 240,663,500 |
| LyondellBasell Industries NV, A | United States | 6,000,000 | | 651,960,000 |
| The Mosaic Co. | United States | 6,000,000 | | 266,460,000 |
| Rio Tinto PLC, ADR | United Kingdom | 21,000,000 | | 1,032,780,000 |
| | | | | 6,497,032,057 |
| Telecommunication Services 3.0% | | | | |
| AT&T Inc. | United States | 30,000,000 | | 1,057,200,000 |
| BCE Inc. | Canada | 4,250,000 | | 181,790,372 |
| CenturyLink Inc. | United States | 6,500,000 | | 265,785,000 |
| China Mobile Ltd. | China | 10,000,000 | | 115,459,164 |
| Deutsche Telekom AG | Germany | 2,000,000 | | 30,309,601 |
| Telstra Corp. Ltd. | Australia | 30,000,000 | | 139,212,453 |
| Telus Corp. | Canada | 3,000,000 | | 102,465,166 |
| Verizon Communications Inc. | United States | 15,000,000 | | 749,850,000 |
| Vodafone Group PLC | United Kingdom | 62,727,271 | | 207,874,236 |
| | | | | 2,849,945,992 |
| Utilities 11.4% | | | | |
| AGL Resources Inc. | United States | 2,000,000 | | 102,680,000 |
| Ameren Corp. | United States | 8,000,000 | | 306,640,000 |
| American Electric Power Co. Inc. | United States | 6,500,000 | | 339,365,000 |
| Dominion Resources Inc. | United States | 6,000,000 | | 414,540,000 |
| DTE Energy Co. | United States | 1,250,000 | | 95,100,000 |
| Duke Energy Corp. | United States | 14,000,000 | | 1,046,780,000 |
| a,b,dDynegy Inc. | United States | 16,000,000 | | 461,760,000 |
| a,b,dDynegy Inc., wts., 10/02/17 | United States | 1,143,273 | | 4,733,150 |
| Edison International | United States | 8,000,000 | | 447,360,000 |
| Entergy Corp. | United States | 7,500,000 | | 579,975,000 |
| Exelon Corp. | United States | 33,750,000 | | 1,150,537,500 |
franklintempleton.com Annual Report | 79
FRANKLIN CUSTODIAN FUNDS
STATEMENT OF INVESTMENTS
| | | | | |
| Franklin Income Fund (continued) | | | | | |
| | | | Shares/ | | |
| | | Country | Warrants | | Value |
| Common Stocks and Other Equity Interests (continued) | | | | | |
| Utilities (continued) | | | | | |
| FirstEnergy Corp. | | United States | 6,500,000 | $ | 218,205,000 |
| eHK Electric Investments & HK Electric Investments Ltd., 144A | | Hong Kong | 70,000,000 | | 46,067,756 |
| NextEra Energy Inc. | | United States | 4,000,000 | | 375,520,000 |
| PG&E Corp. | | United States | 23,000,000 | | 1,035,920,000 |
| Pinnacle West Capital Corp. | | United States | 4,500,000 | | 245,880,000 |
| PPL Corp. | | United States | 18,000,000 | | 591,120,000 |
| Public Service Enterprise Group Inc. | | United States | 18,000,000 | | 670,320,000 |
| Sempra Energy | | United States | 4,500,000 | | 474,210,000 |
| The Southern Co. | | United States | 27,500,000 | | 1,200,375,000 |
| SSE PLC | | United Kingdom | 6,000,000 | | 150,489,065 |
| TECO Energy Inc. | | United States | 7,000,000 | | 121,660,000 |
| Xcel Energy Inc. | | United States | 23,000,000 | | 699,200,000 |
| | | | | | 10,778,437,471 |
| Total Common Stocks and Other Equity Interests | | | | | |
| (Cost $38,098,023,374) | | | | | 44,388,532,377 |
| fEquity-Linked Securities 8.4% | | | | | |
| Consumer Discretionary 0.6% | | | | | |
| eBarclays Bank PLC into Comcast Corp., 5.50%, 144A | | United States | 2,255,000 | | 119,650,525 |
| eCitigroup Inc. into Ford Motor Co., 6.00%, 144A | | United States | 9,063,000 | | 135,548,041 |
| eCitigroup Inc. into General Motors Co., 8.00%, 144A | | United States | 2,940,000 | | 94,401,342 |
| eJPMorgan Chase & Co. into General Motors Co., 7.50%, 144A | | United States | 3,055,000 | | 99,521,513 |
| eMorgan Stanley into Ford Motor Co., 7.00%, 144A | | United States | 10,000,000 | | 155,437,000 |
| | | | | | 604,558,421 |
| Consumer Staples 0.2% | | | | | |
| eDeutsche Bank AG/London into Whole Foods Market Inc., 7.00%, | | | | | |
| 144A | | United States | 2,720,000 | | 104,111,536 |
| eWells Fargo & Co. into Whole Foods Market Inc., 7.00%, 144A | | United States | 2,825,000 | | 108,290,160 |
| | | | | | 212,401,696 |
| Energy 1.4% | | | | | |
| eCitigroup Inc. into Anadarko Petroleum Corp., 8.00%, 144A | | United States | 300,000 | | 31,105,800 |
| eCitigroup Inc. into Anadarko Petroleum Corp., 8.00%, 144A | | United States | 905,000 | | 93,538,085 |
| eCitigroup Inc. into Cabot Oil & Gas Corp., 7.00%, 144A | | United States | 3,478,000 | | 115,827,486 |
| eCredit Suisse New York into Anadarko Petroleum Corp., 6.50%, | | | | | |
| 144A | | United States | 2,410,000 | | 219,334,823 |
| eCredit Suisse New York into Peabody Energy Corp., 9.00%, 144A | | United States | 6,773,000 | | 84,653,695 |
| eDeutsche Bank AG/London into Noble Corp. PLC, 8.50%, 144A | | United States | 1,528,000 | | 35,531,348 |
| eDeutsche Bank AG/London into Peabody Energy Corp., 10.00%, | | | | | |
| 144A | | United States | 5,500,000 | | 74,500,250 |
| eThe Goldman Sachs Group Inc. into Cabot Oil & Gas Corp., 7.00%, | | | | | |
| 144A | | United States | 2,969,000 | | 98,775,067 |
| eJPMorgan Chase & Co. into Devon Energy Corp., 6.00%, 144A | | United States | 1,560,000 | | 103,824,396 |
| eJPMorgan Chase & Co. into The Williams Cos. Inc., 7.50%, 144A | | United States | 4,420,000 | | 191,279,920 |
| eJPMorgan Chase & Co. into The Williams Cos. Inc., 8.50%, 144A | | United States | 4,750,000 | | 217,146,250 |
| | | | | | 1,265,517,120 |
| Financials 1.0% | | | | | |
| eBarclays Bank PLC into Bank of America Corp., 5.50%, 144A | | United States | 6,565,000 | | 108,466,930 |
| eBarclays Bank PLC into Bank of America Corp., 6.00%, 144A | | United States | 6,135,000 | | 104,623,223 |
| eCitigroup Inc. into Morgan Stanley, 6.50%, 144A | | United States | 3,300,000 | | 171,425,760 |
80 | Annual Report franklintempleton.com
FRANKLIN CUSTODIAN FUNDS
STATEMENT OF INVESTMENTS
| | | | | |
| Franklin Income Fund (continued) | | | | | |
| | | | Shares/ | | |
| | | Country | Warrants | | Value |
| fEquity-Linked Securities (continued) | | | | | |
| Financials (continued) | | | | | |
| eCredit Suisse New York into Metlife Inc., 6.00%, 144A | | United States | 2,500,000 | $ | 136,591,750 |
| eThe Goldman Sachs Group Inc. into Bank of America Corp., 7.00%, | | | | | |
| 144A | | United States | 7,900,000 | | 137,057,100 |
| eThe Goldman Sachs Group Inc. into Citigroup Inc., 5.00%, 144A | | United States | 2,900,000 | | 145,918,720 |
| eJPMorgan Chase & Co. into Metlife Inc., 6.00%, 144A | | United States | 3,040,000 | | 163,139,472 |
| | | | | | 967,222,955 |
| Health Care 0.1% | | | | | |
| eThe Goldman Sachs Group Inc. into Bristol-Myers Squibb Co., 6.00%, | | | | | |
| 144A | | United States | 2,049,000 | | 103,077,814 |
| Information Technology 2.5% | | | | | |
| eBank of America Corp. into Apple Inc., 8.00%, 144A | | United States | 195,000 | | 122,756,790 |
| eBank of America Corp. into Intel Corp., 7.00%, 144A | | United States | 9,942,000 | | 286,315,681 |
| eBank of America Corp. into Texas Instruments Inc., 6.00%, 144A | | United States | 2,870,000 | | 135,813,853 |
| eBank of America Corp. into Xilinx Inc., 6.00%, 144A | | United States | 3,425,000 | | 144,367,860 |
| eBarclays Bank PLC into Broadcom Corp., 6.50%, 144A | | United States | 3,035,000 | | 105,668,684 |
| eBarclays Bank PLC into EMC Corp., 6.00%, 144A | | United States | 4,281,000 | | 123,952,074 |
| eCredit Suisse New York into Broadcom Corp., 6.00%, 144A | | United States | 4,000,000 | | 158,670,800 |
| eCredit Suisse New York into Cisco Systems Inc., 6.50%, 144A | | United States | 6,180,000 | | 150,177,708 |
| eCredit Suisse New York into Freescale Semiconductor Ltd., 7.00%, | | | | | |
| 144A | | United States | 2,350,000 | | 46,822,105 |
| eDeutsche Bank AG/London into Cisco Systems Inc., 7.00%, 144A | | United States | 4,217,000 | | 107,648,624 |
| eDeutsche Bank AG/London into Cisco Systems Inc., 6.50%, 144A | | United States | 7,900,000 | | 202,217,090 |
| eDeutsche Bank AG/London into Texas Instruments Inc., 6.00%, | | | | | |
| 144A | | United States | 1,455,000 | | 67,567,727 |
| eThe Goldman Sachs Group Inc. into Cisco Systems Inc., 6.50%, | | | | | |
| 144A | | United States | 6,486,000 | | 159,508,252 |
| eThe Goldman Sachs Group Inc. into EMC Corp., 6.00%, 144A | | United States | 4,000,000 | | 107,003,200 |
| eThe Goldman Sachs Group Inc. into Microsoft Corp., 6.25%, 144A | | United States | 5,600,000 | | 239,384,320 |
| eJPMorgan Chase & Co. into Apple Inc., 7.00%, 144A | | United States | 303,000 | | 179,284,191 |
| | | | | | 2,337,158,959 |
| Materials 2.5% | | | | | |
| eBarclays Bank PLC into Barrick Gold Corp., 8.00%, 144A | | Canada | 8,265,000 | | 131,212,660 |
| eBarclays Bank PLC into The Mosaic Co., 6.50%, 144A | | United States | 2,046,000 | | 92,894,129 |
| eCitigroup Inc. into Freeport-McMoRan Inc., 7.00%, 144A | | United States | 4,213,000 | | 139,610,394 |
| eCredit Suisse New York into The Dow Chemical Co., 7.50%, 144A | | United States | 5,810,000 | | 281,611,281 |
| eDeutsche Bank AG/London into AngloGold Ashanti Ltd., 10.00%, | | | | | |
| 144A | | South Africa | 6,000,000 | | 80,217,000 |
| eDeutsche Bank AG/London into Freeport-McMoRan Inc., 8.00%, | | | | | |
| 144A | | United States | 6,150,000 | | 202,744,590 |
| eDeutsche Bank AG/London into Goldcorp Inc., 9.00%, 144A | | Canada | 4,053,000 | | 94,767,246 |
| eDeutsche Bank AG/London into Newmont Mining Corp., 7.50%, | | | | | |
| 144A | | United States | 4,050,000 | | 98,059,410 |
| eDeutsche Bank AG/London into Newmont Mining Corp., 7.00%, | | | | | |
| 144A | | United States | 6,060,000 | | 144,317,082 |
| eDeutsche Bank AG/London into Rio Tinto PLC, 8.50%, 144A | | United Kingdom | 3,800,000 | | 189,137,020 |
| eThe Goldman Sachs Group Inc. into AngloGold Ashanti Ltd., 9.00%, | | | | | |
| 144A | | South Africa | 2,318,000 | | 28,692,668 |
franklintempleton.com Annual Report | 81
FRANKLIN CUSTODIAN FUNDS
STATEMENT OF INVESTMENTS
| | | | | |
| Franklin Income Fund (continued) | | | | | |
| | | | Shares/ | | |
| | | Country | Warrants | | Value |
| fEquity-Linked Securities (continued) | | | | | |
| Materials (continued) | | | | | |
| eThe Goldman Sachs Group Inc. into LyondellBasell Industries NV, | | | | | |
| 6.00%, 144A | | United States | 2,750,000 | $ | 274,460,725 |
| eJPMorgan Chase & Co. into Barrick Gold Corp., 10.00%, 144A | | Canada | 5,123,000 | | 80,010,502 |
| eMorgan Stanley into Newmont Mining Corp., 7.00%, 144A | | United States | 4,000,000 | | 92,930,400 |
| eMorgan Stanley into Rio Tinto PLC, 7.50%, 144A | | United Kingdom | 2,400,000 | | 122,208,000 |
| eRoyal Bank of Canada into LyondellBasell Industries NV, 7.00%, | | | | | |
| 144A | | United States | 1,282,000 | | 114,022,746 |
| eWells Fargo & Co. into Freeport-McMoRan Inc., 7.50%, 144A | | United States | 4,500,000 | | 154,764,000 |
| | | | | | 2,321,659,853 |
| Utilities 0.1% | | | | | |
| eMorgan Stanley into Exelon Corp., 6.00%, 144A | | United States | 2,790,000 | | 95,560,569 |
| Total Equity-Linked Securities | | | | | |
| (Cost $7,827,455,022) | | | | | 7,907,157,387 |
| Convertible Preferred Stocks 3.5% | | | | | |
| Energy 0.7% | | | | | |
| eChesapeake Energy Corp., 5.75%, cvt. pfd., 144A | | United States | 165,500 | | 184,015,312 |
| eChesapeake Energy Corp., 5.75%, cvt. pfd., 144A | | United States | 110,000 | | 122,306,250 |
| Halcon Resources Corp., 5.75%, cvt. pfd., A | | United States | 108,000 | | 87,507,000 |
| ePenn Virginia Corp., 6.00%, cvt. pfd., 144A | | United States | 700,000 | | 69,566,000 |
| aRex Energy Corp., 6.00%, cvt. pfd., A | | United States | 350,000 | | 33,915,560 |
| Sanchez Energy Corp., 6.50%, cvt. pfd., B | | United States | 1,200,000 | | 85,812,000 |
| SandRidge Energy Inc., 7.00%, cvt. pfd. | | United States | 800,000 | | 68,013,280 |
| | | | | | 651,135,402 |
| Financials 1.9% | | | | | |
| Bank of America Corp., 7.25%, cvt. pfd., L | | United States | 714,118 | | 818,736,287 |
| FelCor Lodging Trust Inc., 7.80%, cvt. pfd., A | | United States | 2,800,000 | | 72,268,000 |
| aFNMA, 5.375%, cvt. pfd. | | United States | 4,250 | | 131,750,000 |
| MetLife Inc., 5.00%, cvt. pfd. | | United States | 3,750,000 | | 115,462,500 |
| Wells Fargo & Co., 7.50%, cvt. pfd., A | | United States | 520,000 | | 625,305,200 |
| | | | | | 1,763,521,987 |
| Industrials 0.1% | | | | | |
| a,bCEVA Holdings LLC, cvt. pfd., A-1 | | United Kingdom | 2,897 | | 4,490,738 |
| a,bCEVA Holdings LLC, cvt. pfd., A-2 | | United Kingdom | 110,565 | | 121,621,588 |
| | | | | | 126,112,326 |
| Materials 0.2% | | | | | |
| Alcoa Inc., 5.375%, cvt. pfd. | | United States | 2,716,375 | | 135,547,112 |
| ArcelorMittal, 6.00%, cvt. pfd. | | Luxembourg | 1,200,000 | | 25,356,000 |
| | | | | | 160,903,112 |
| Utilities 0.6% | | | | | |
| Dominion Resources Inc., 6.125%, cvt. pfd., A | | United States | 1,490,000 | | 83,529,400 |
| Dominion Resources Inc., 6.375%, cvt. pfd., A | | United States | 2,220,000 | | 110,778,000 |
| Dominion Resources Inc., 6.00%, cvt. pfd., B | | United States | 1,490,000 | | 83,812,500 |
| Exelon Corp., 6.50%, cvt. pfd. | | United States | 2,000,000 | | 101,600,000 |
| NextEra Energy Inc., 5.599%, cvt. pfd. | | United States | 2,000,000 | | 123,550,000 |
82 | Annual Report franklintempleton.com
FRANKLIN CUSTODIAN FUNDS
STATEMENT OF INVESTMENTS
| | | | | |
| Franklin Income Fund (continued) | | | | | |
| | | Shares/ | | | |
| | Country | Warrants | | | Value |
| Convertible Preferred Stocks (continued) | | | | | |
| Utilities (continued) | | | | | |
| NextEra Energy Inc., 5.889%, cvt. pfd. | United States | 956,500 | | $ | 57,303,915 |
| NextEra Energy Inc., 5.799%, cvt. pfd. | United States | 1,000,000 | | | 54,590,000 |
| | | | | | 615,163,815 |
| Total Convertible Preferred Stocks | | | | | |
| (Cost $3,057,593,268) | | | | | 3,316,836,642 |
| Preferred Stocks 0.7% | | | | | |
| Financials 0.7% | | | | | |
| eAlly Financial Inc., 7.00%, pfd., 144A | United States | 125,000 | | | 125,937,500 |
| aFHLMC, 8.375%, pfd., Z | United States | 16,608,000 | | | 171,062,400 |
| aFNMA, 6.75%, pfd. | United States | 3,000,000 | | | 23,040,000 |
| aFNMA, 7.625%, pfd., R | United States | 2,399,400 | | | 18,835,290 |
| aFNMA, 8.25%, pfd. | United States | 11,784,000 | | | 108,412,800 |
| GMAC Capital Trust I, 8.125%, pfd. | United States | 4,550,000 | | | 121,075,500 |
| Morgan Stanley, 6.375%, pfd., I | United States | 4,500,000 | | | 112,815,000 |
| Total Preferred Stocks (Cost $1,087,460,852) | | | | | 681,178,490 |
| |
| | | Principal | | | |
| | | Amount* | | | |
| |
| Convertible Bonds 0.9% | | | | | |
| Consumer Discretionary 0.3% | | | | | |
| eVolkswagen International Finance, cvt., sub. note, 144A, 5.50%, | | | | | |
| 11/09/15 | Germany | 220,000,000 | EUR | | 288,441,699 |
| Energy 0.4% | | | | | |
| Alpha Natural Resources Inc., cvt., senior note, | | | | | |
| 3.75%, 12/15/17 | United States | 40,000,000 | | | 28,625,000 |
| 4.875%, 12/15/20 | United States | 40,000,000 | | | 23,775,000 |
| Cobalt International Energy Inc., cvt., | | | | | |
| senior bond, 3.125%, 5/15/24 | United States | 300,000,000 | | | 269,250,000 |
| senior note, 2.625%, 12/01/19 | United States | 70,000,000 | | | 58,056,250 |
| Peabody Energy Corp., cvt., junior sub. bond, 4.75%, 12/15/66 | United States | 40,000,000 | | | 27,600,000 |
| | | | | | 407,306,250 |
| Industrials 0.1% | | | | | |
| Meritor Inc., cvt., senior bond, 7.875%, 3/01/26 | United States | 35,000,000 | | | 50,771,875 |
| Materials 0.1% | | | | | |
| dCemex SAB de CV, cvt., sub. note, | | | | | |
| 3.25%, 3/15/16 | Mexico | 23,610,000 | | | 33,219,506 |
| 3.75%, 3/15/18 | Mexico | 37,300,000 | | | 54,952,411 |
| Molycorp Inc., cvt., senior note, 6.00%, 9/01/17 | United States | 60,000,000 | | | 21,600,000 |
| | | | | | 109,771,917 |
| Total Convertible Bonds (Cost $899,096,233) | | | | | 856,291,741 |
| Corporate Bonds 34.8% | | | | | |
| Consumer Discretionary 6.1% | | | | | |
| e,g1011778 BC ULC/New Red Finance Inc., secured note, second lien, | | | | | |
| 144A, 6.00%, 4/01/22 | Canada | 70,000,000 | | | 69,912,500 |
| e24 Hour Holdings III LLC, senior note, 144A, 8.00%, 6/01/22 | United States | 46,000,000 | | | 42,780,000 |
| eAcademy Ltd./Finance Corp., senior note, 144A, 9.25%, 8/01/19 | United States | 67,900,000 | | | 72,143,750 |
franklintempleton.com Annual Report | 83
FRANKLIN CUSTODIAN FUNDS
STATEMENT OF INVESTMENTS
| | | | |
| Franklin Income Fund (continued) | | | | |
| | | Principal | | |
| | Country | Amount* | | Value |
| Corporate Bonds (continued) | | | | |
| Consumer Discretionary (continued) | | | | |
| eAltice Financing SA, secured note, first lien, 144A, 6.50%, 1/15/22 | Luxembourg | 24,100,000 | $ | 24,762,750 |
| eAltice SA, senior secured note, 144A, 7.75%, 5/15/22 | Luxembourg | 25,000,000 | | 25,843,750 |
| AMC Networks Inc., 4.75%, 12/15/22 | United States | 40,000,000 | | 39,700,000 |
| Best Buy Co. Inc., senior note, 5.50%, 3/15/21 | United States | 25,000,000 | | 25,937,500 |
| Cablevision Systems Corp., senior note, | | | | |
| 8.625%, 9/15/17 | United States | 70,000,000 | | 77,962,500 |
| 7.75%, 4/15/18 | United States | 120,000,000 | | 130,500,000 |
| Caesars Entertainment Operating Co. Inc., senior secured note, | | | | |
| 11.25%, 6/01/17 | United States | 82,500,000 | | 64,040,625 |
| eCBS Outdoor Americas Capital LLC/CBS Outdoor Americas Capital | | | | |
| Corp., | | | | |
| senior bond, 144A, 5.625%, 2/15/24 | United States | 22,700,000 | | 22,813,500 |
| gsenior bond, 144A, 5.875%, 3/15/25 | United States | 30,000,000 | | 30,225,000 |
| gsenior note, 144A, 5.25%, 2/15/22 | United States | 23,000,000 | | 23,028,750 |
| CCO Holdings LLC/CCO Holdings Capital Corp., | | | | |
| senior bond, 5.25%, 9/30/22 | United States | 50,000,000 | | 49,125,000 |
| senior bond, 5.125%, 2/15/23 | United States | 170,000,000 | | 163,837,500 |
| senior bond, 5.75%, 9/01/23 | United States | 67,000,000 | | 66,916,250 |
| senior bond, 5.75%, 1/15/24 | United States | 185,000,000 | | 184,768,750 |
| senior note, 7.375%, 6/01/20 | United States | 60,000,000 | | 63,600,000 |
| senior note, 5.25%, 3/15/21 | United States | 31,000,000 | | 30,496,250 |
| senior note, 6.50%, 4/30/21 | United States | 94,500,000 | | 98,870,625 |
| Chrysler Group LLC/CG Co-Issuer Inc., senior secured note, | | | | |
| 8.00%, 6/15/19 | United States | 200,000,000 | | 213,250,000 |
| 8.25%, 6/15/21 | United States | 145,000,000 | | 158,775,000 |
| Cinemark USA Inc., | | | | |
| senior bond, 4.875%, 6/01/23 | United States | 23,000,000 | | 22,022,500 |
| senior note, 5.125%, 12/15/22 | United States | 50,000,000 | | 49,375,000 |
| Clear Channel Worldwide Holdings Inc., senior sub. note, 7.625%, | | | | |
| 3/15/20 | United States | 142,500,000 | | 148,556,250 |
| CSC Holdings LLC, senior note, | | | | |
| 6.75%, 11/15/21 | United States | 12,800,000 | | 13,682,560 |
| e144A, 5.25%, 6/01/24 | United States | 26,600,000 | | 25,602,500 |
| Cumulus Media Holdings Inc., senior note, 7.75%, 5/01/19 | United States | 50,000,000 | | 51,437,500 |
| b,hDex Media Inc., senior sub. note, PIK, 14.00%, 1/29/17 | United States | 41,400,812 | | 26,910,528 |
| DISH DBS Corp., | | | | |
| senior bond, 5.00%, 3/15/23 | United States | 240,000,000 | | 230,850,000 |
| senior note, 5.125%, 5/01/20 | United States | 45,000,000 | | 45,225,000 |
| senior note, 5.875%, 7/15/22 | United States | 158,000,000 | | 161,555,000 |
| Dollar General Corp., | | | | |
| senior bond, 3.25%, 4/15/23 | United States | 150,000,000 | | 134,273,250 |
| senior note, 1.875%, 4/15/18 | United States | 10,323,000 | | 9,952,251 |
| The Goodyear Tire & Rubber Co., senior note, | | | | |
| 8.25%, 8/15/20 | United States | 101,800,000 | | 109,435,000 |
| 6.50%, 3/01/21 | United States | 62,900,000 | | 65,730,500 |
| HD Supply Inc., senior note, 7.50%, 7/15/20 | United States | 60,000,000 | | 62,550,000 |
| iHeartCommunications Inc., | | | | |
| senior note, 10.00%, 1/15/18 | United States | 50,000,000 | | 42,089,000 |
| hsenior note, PIK, 14.00%, 2/01/21 | United States | 125,607,438 | | 114,868,253 |
| senior secured bond, first lien, 9.00%, 3/01/21 | United States | 339,775,000 | | 339,350,281 |
| esenior secured note, 144A, 9.00%, 9/15/22 | United States | 109,400,000 | | 108,853,000 |
84 | Annual Report franklintempleton.com
FRANKLIN CUSTODIAN FUNDS
STATEMENT OF INVESTMENTS
| | | | | |
| Franklin Income Fund (continued) | | | | | |
| | | Principal | | | |
| | Country | Amount* | | | Value |
| Corporate Bonds (continued) | | | | | |
| Consumer Discretionary (continued) | | | | | |
| iHeartCommunications Inc., (continued) | | | | | |
| senior secured note, first lien, 9.00%, 12/15/19 | United States | 225,000,000 | | $ | 227,531,250 |
| senior secured note, first lien, 11.25%, 3/01/21 | United States | 50,000,000 | | | 53,437,500 |
| eJaguar Land Rover Automotive PLC, | | | | | |
| 144A, 8.125%, 5/15/21 | United Kingdom | 20,000,000 | | | 21,975,000 |
| senior note, 144A, 8.25%, 3/15/20 | United Kingdom | 40,000,000 | GBP | | 72,026,252 |
| KB Home, | | | | | |
| senior bond, 7.50%, 9/15/22 | United States | 35,000,000 | | | 37,625,000 |
| senior note, 9.10%, 9/15/17 | United States | 49,000,000 | | | 55,615,000 |
| senior note, 7.25%, 6/15/18 | United States | 70,500,000 | | | 75,787,500 |
| senior note, 8.00%, 3/15/20 | United States | 20,000,000 | | | 22,100,000 |
| senior note, 7.00%, 12/15/21 | United States | 40,000,000 | | | 41,800,000 |
| Lamar Media Corp., senior sub. bond, 5.00%, 5/01/23 | United States | 29,500,000 | | | 28,541,250 |
| eLaureate Education Inc., 144A, 9.25%, 9/01/19 | United States | 25,000,000 | | | 25,250,000 |
| MGM Resorts International, senior note, | | | | | |
| 10.00%, 11/01/16 | United States | 90,000,000 | | | 101,925,000 |
| 8.625%, 2/01/19 | United States | 44,800,000 | | | 50,740,480 |
| 5.25%, 3/31/20 | United States | 60,000,000 | | | 60,150,000 |
| 6.75%, 10/01/20 | United States | 27,450,000 | | | 29,302,875 |
| 7.75%, 3/15/22 | United States | 80,000,000 | | | 89,200,000 |
| e,hNew Academy Finance Co. LLC/Corp., senior note, 144A, PIK, 8.00%, | | | | | |
| 6/15/18 | United States | 20,000,000 | | | 20,000,000 |
| Nielsen Finance LLC/Co., senior note, | | | | | |
| 4.50%, 10/01/20 | United States | 15,000,000 | | | 14,587,500 |
| e144A, 5.00%, 4/15/22 | United States | 73,000,000 | | | 71,311,875 |
| eNumericable Group SA, | | | | | |
| first lien, 144A, 4.875%, 5/15/19 | France | 50,000,000 | | | 49,943,000 |
| senior bond, first lien, 144A, 6.25%, 5/15/24 | France | 40,000,000 | | | 39,950,000 |
| senior note, first lien, 144A, 6.00%, 5/15/22 | France | 65,000,000 | | | 65,384,150 |
| Quebecor Media Inc., senior bond, 5.75%, 1/15/23 | Canada | 75,300,000 | | | 75,111,750 |
| Regal Entertainment Group, senior note, 5.75%, 3/15/22 | United States | 50,000,000 | | | 50,375,000 |
| Shea Homes LP/Funding Corp., senior secured note, 8.625%, | | | | | |
| 5/15/19 | United States | 93,200,000 | | | 98,792,000 |
| eSirius XM Radio Inc., | | | | | |
| senior bond, 144A, 6.00%, 7/15/24 | United States | 134,100,000 | | | 136,446,750 |
| senior note, 144A, 4.25%, 5/15/20 | United States | 18,000,000 | | | 17,280,000 |
| senior note, 144A, 5.875%, 10/01/20 | United States | 50,000,000 | | | 50,750,000 |
| senior note, 144A, 5.75%, 8/01/21 | United States | 30,000,000 | | | 30,300,000 |
| senior note, 144A, 4.625%, 5/15/23 | United States | 94,400,000 | | | 88,264,000 |
| Time Warner Cable Inc., senior note, 4.00%, 9/01/21 | United States | 20,000,000 | | | 21,100,780 |
| eUnitymedia Hessen GmbH & Co. KG/Unitymedia NRW GmbH, | | | | | |
| senior secured bond, 144A, 5.50%, 1/15/23 | Germany | 20,000,000 | | | 20,187,500 |
| eUnivision Communications Inc., | | | | | |
| senior note, 144A, 8.50%, 5/15/21 | United States | 65,000,000 | | | 69,062,500 |
| senior secured note, 144A, 6.875%, 5/15/19 | United States | 80,000,000 | | | 83,600,000 |
| senior secured note, 144A, 5.125%, 5/15/23 | United States | 84,500,000 | | | 85,978,750 |
| eUPCB Finance III Ltd., senior secured note, 144A, 6.625%, 7/01/20 | Netherlands | 50,000,000 | | | 52,505,000 |
| Videotron Ltd., senior note, 5.00%, 7/15/22 | Canada | 10,000,000 | | | 9,950,000 |
| eVirgin Media Secured Finance PLC, senior secured bond, first lien, | | | | | |
| 144A, 5.50%, 1/15/25 | United Kingdom | 80,000,000 | | | 80,050,000 |
| Visant Corp., senior note, 10.00%, 10/01/17 | United States | 51,066,000 | | | 45,831,735 |
franklintempleton.com Annual Report | 85
FRANKLIN CUSTODIAN FUNDS
STATEMENT OF INVESTMENTS
| | | | |
| Franklin Income Fund (continued) | | | | |
| | | Principal | | |
| | Country | Amount* | | Value |
| Corporate Bonds (continued) | | | | |
| Consumer Discretionary (continued) | | | | |
| eWeyerhaeuser Real Estate Co., senior bond, 144A, 5.875%, | | | | |
| 6/15/24 | United States | 30,000,000 | $ | 29,962,500 |
| eWynn Las Vegas LLC/Capital Corp., senior bond, 144A, 4.25%, | | | | |
| 5/30/23 | United States | 28,300,000 | | 26,955,750 |
| eWynn Macau Ltd., senior note, 144A, 5.25%, 10/15/21 | Macau | 25,000,000 | | 24,109,375 |
| | | | | 5,792,405,395 |
| Consumer Staples 0.6% | | | | |
| Alliance One International Inc., secured note, second lien, 9.875%, | | | | |
| 7/15/21 | United States | 60,000,000 | | 58,800,000 |
| eESAL GmbH, senior note, 144A, 6.25%, 2/05/23 | Brazil | 50,000,000 | | 49,050,000 |
| eInnovation Ventures LLC/Finance Corp., secured note, 144A, 9.50%, | | | | |
| 8/15/19 | United States | 16,250,000 | | 16,006,250 |
| eJBS USA LLC/Finance Inc., | | | | |
| senior bond, 144A, 5.875%, 7/15/24 | United States | 68,400,000 | | 66,476,250 |
| senior note, 144A, 8.25%, 2/01/20 | United States | 50,100,000 | | 53,607,000 |
| senior note, 144A, 7.25%, 6/01/21 | United States | 148,100,000 | | 156,245,500 |
| ePost Holdings Inc., senior note, 144A, 6.75%, 12/01/21 | United States | 19,000,000 | | 18,050,000 |
| Spectrum Brands Inc., senior note, 6.625%, 11/15/22 | United States | 15,000,000 | | 15,825,000 |
| SUPERVALU Inc., senior note, 8.00%, 5/01/16 | United States | 32,500,000 | | 35,140,625 |
| U.S. Foods Inc., 8.50%, 6/30/19 | United States | 80,000,000 | | 84,900,000 |
| | | | | 554,100,625 |
| Energy 8.3% | | | | |
| Access Midstream Partner LP/ACMP Finance Corp., senior note, | | | | |
| 4.875%, 5/15/23 | United States | 76,000,000 | | 78,375,000 |
| Alpha Natural Resources Inc., | | | | |
| esecond lien, 144A, 7.50%, 8/01/20 | United States | 21,600,000 | | 19,386,000 |
| senior note, 6.00%, 6/01/19 | United States | 43,000,000 | | 26,230,000 |
| isenior note, 6.25%, 6/01/21 | United States | 110,000,000 | | 64,487,500 |
| eAmerican Energy-Permian Basin LLC/AEPB Finance Corp., | | | | |
| senior note, 144A, | | | | |
| 7.125%, 11/01/20 | United States | 5,000,000 | | 4,600,000 |
| 7.375%, 11/01/21 | United States | 20,000,000 | | 18,400,000 |
| eAmerican Energy-Woodford LLC/Finance Corp., senior note, 144A, | | | | |
| 9.00%, 9/15/22 | United States | 50,000,000 | | 46,750,000 |
| Antero Resources Finance Corp., senior note, 5.375%, 11/01/21 | United States | 33,000,000 | | 32,958,750 |
| Arch Coal Inc., | | | | |
| esecured note, second lien, 144A, 8.00%, 1/15/19 | United States | 20,000,000 | | 17,250,000 |
| senior note, 7.00%, 6/15/19 | United States | 111,000,000 | | 59,523,750 |
| senior note, 7.25%, 6/15/21 | United States | 130,000,000 | | 63,375,000 |
| Atlas Energy Holdings Operating Co. LLC/Atlas Resource Finance | | | | |
| Corp., senior note, 9.25%, 8/15/21 | United States | 35,000,000 | | 35,875,000 |
| jATP Oil & Gas Corp., senior secured note, 11.875%, 5/01/15 | United States | 50,000,000 | | 675,000 |
| Berry Petroleum Co., senior bond, 6.375%, 9/15/22 | United States | 28,000,000 | | 27,580,000 |
| Bill Barrett Corp., senior note, 7.00%, 10/15/22 | United States | 37,000,000 | | 36,907,500 |
| Bonanza Creek Energy Inc., senior note, 5.75%, 2/01/23 | United States | 25,000,000 | | 24,062,500 |
| BreitBurn Energy Partners LP/BreitBurn Finance Corp., senior bond, | | | | |
| 7.875%, 4/15/22 | United States | 28,800,000 | | 29,304,000 |
| e,gCalifornia Resources Corp., | | | | |
| senior bond, 144A, 6.00%, 11/15/24 | United States | 63,000,000 | | 64,890,000 |
| senior note, 144A, 5.50%, 9/15/21 | United States | 63,300,000 | | 64,328,625 |
86 | Annual Report franklintempleton.com
FRANKLIN CUSTODIAN FUNDS
STATEMENT OF INVESTMENTS
| | | | |
| Franklin Income Fund (continued) | | | | |
| | | Principal | | |
| | Country | Amount* | | Value |
| Corporate Bonds (continued) | | | | |
| Energy (continued) | | | | |
| Calumet Specialty Products Partners LP/Calumet Finance Corp., | | | | |
| senior note, | | | | |
| 7.625%, 1/15/22 | United States | 20,000,000 | $ | 20,400,000 |
| e144A, 6.50%, 4/15/21 | United States | 50,000,000 | | 47,750,000 |
| Carrizo Oil & Gas Inc., senior note, | | | | |
| 8.625%, 10/15/18 | United States | 44,800,000 | | 46,676,000 |
| 7.50%, 9/15/20 | United States | 21,300,000 | | 22,258,500 |
| CGG SA, senior note, | | | | |
| 6.50%, 6/01/21 | France | 120,000,000 | | 106,200,000 |
| e144A, 6.875%, 1/15/22 | France | 65,800,000 | | 58,726,500 |
| Chaparral Energy Inc., senior note, 7.625%, 11/15/22 | United States | 35,400,000 | | 36,462,000 |
| CHC Helicopter SA, | | | | |
| senior note, 9.375%, 6/01/21 | Canada | 52,400,000 | | 55,544,000 |
| senior secured note, first lien, 9.25%, 10/15/20 | Canada | 130,500,000 | | 139,064,062 |
| Chesapeake Energy Corp., senior note, | | | | |
| 6.50%, 8/15/17 | United States | 100,000,000 | | 109,000,000 |
| 7.25%, 12/15/18 | United States | 178,065,000 | | 203,884,425 |
| 6.875%, 11/15/20 | United States | 30,500,000 | | 34,160,000 |
| 5.375%, 6/15/21 | United States | 50,000,000 | | 51,437,500 |
| 4.875%, 4/15/22 | United States | 100,000,000 | | 101,000,000 |
| 5.75%, 3/15/23 | United States | 203,150,000 | | 217,431,445 |
| Clayton Williams Energy Inc., senior note, 7.75%, 4/01/19 | United States | 75,000,000 | | 77,437,500 |
| Concho Resources Inc., senior bond, 5.50%, 4/01/23 | United States | 27,000,000 | | 28,215,000 |
| CONSOL Energy Inc., senior note, | | | | |
| 8.25%, 4/01/20 | United States | 55,850,000 | | 58,851,937 |
| e144A, 5.875%, 4/15/22 | United States | 214,400,000 | | 211,988,000 |
| Denbury Resources Inc., | | | | |
| senior note, 5.50%, 5/01/22 | United States | 85,000,000 | | 84,468,750 |
| senior sub. note, 4.625%, 7/15/23 | United States | 175,000,000 | | 162,750,000 |
| eDiamondback Energy Inc., senior note, 144A, 7.625%, 10/01/21 | United States | 30,000,000 | | 32,475,000 |
| El Paso Corp., senior note, MTN, 7.75%, 1/15/32 | United States | 123,000,000 | | 151,597,500 |
| Energy Transfer Equity LP, senior bond, 5.875%, 1/15/24 | United States | 108,300,000 | | 111,278,250 |
| Energy Transfer Partners LP, senior bond, 3.60%, 2/01/23 | United States | 25,000,000 | | 24,384,600 |
| Energy XXI Gulf Coast Inc., senior note, | | | | |
| 9.25%, 12/15/17 | United States | 70,075,000 | | 73,053,187 |
| e144A, 6.875%, 3/15/24 | United States | 80,000,000 | | 75,400,000 |
| eEnQuest PLC, senior note, 144A, 7.00%, 4/15/22 | United Kingdom | 51,900,000 | | 49,110,375 |
| EP Energy LLC/Finance Inc., senior note, 9.375%, 5/01/20 | United States | 35,000,000 | | 38,325,000 |
| EXCO Resources Inc., senior note, 7.50%, 9/15/18 | United States | 80,000,000 | | 76,800,000 |
| eGibson Energy Inc., senior note, 144A, 6.75%, 7/15/21 | Canada | 35,000,000 | | 37,275,000 |
| Halcon Resources Corp., senior note, | | | | |
| 9.75%, 7/15/20 | United States | 100,000,000 | | 102,250,000 |
| 8.875%, 5/15/21 | United States | 28,000,000 | | 27,720,000 |
| 9.25%, 2/15/22 | United States | 63,100,000 | | 62,626,750 |
| eHercules Offshore Inc., senior note, 144A, | | | | |
| 10.25%, 4/01/19 | United States | 40,000,000 | | 38,300,000 |
| 8.75%, 7/15/21 | United States | 45,000,000 | | 39,375,000 |
| 7.50%, 10/01/21 | United States | 29,000,000 | | 23,490,000 |
| 6.75%, 4/01/22 | United States | 30,000,000 | | 23,512,500 |
franklintempleton.com Annual Report | 87
| | | | |
| FRANKLIN CUSTODIAN FUNDS | | | | |
| STATEMENT OF INVESTMENTS | | | | |
| |
| |
| |
| |
| Franklin Income Fund (continued) | | | | |
| | | Principal | | |
| | Country | Amount* | | Value |
| Corporate Bonds (continued) | | | | |
| Energy (continued) | | | | |
| eKinder Morgan Inc., | | | | |
| senior secured bond, first lien, 144A, 5.625%, 11/15/23 | United States | 130,300,000 | $ | 139,095,250 |
| senior secured note, 144A, 5.00%, 2/15/21 | United States | 36,500,000 | | 38,233,750 |
| Laredo Petroleum Inc., senior note, 5.625%, 1/15/22 | United States | 15,000,000 | | 14,775,000 |
| eLightstream Resources Ltd., senior note, 144A, 8.625%, 2/01/20 | Canada | 30,000,000 | | 29,850,000 |
| Linn Energy LLC/Finance Corp., senior note, | | | | |
| 6.50%, 5/15/19 | United States | 5,000,000 | | 4,925,000 |
| 6.25%, 11/01/19 | United States | 130,000,000 | | 127,562,500 |
| 8.625%, 4/15/20 | United States | 72,500,000 | | 75,309,375 |
| 7.75%, 2/01/21 | United States | 75,000,000 | | 75,937,500 |
| 6.50%, 9/15/21 | United States | 49,300,000 | | 48,314,000 |
| Magnum Hunter Resources Corp., senior note, 9.75%, 5/15/20 | United States | 60,000,000 | | 63,750,000 |
| eMEG Energy Corp., senior bond, 144A, 7.00%, 3/31/24 | Canada | 100,000,000 | | 103,750,000 |
| eMemorial Production Partners LP/Memorial Production Finance Corp., | | | | |
| senior note, 144A, 6.875%, 8/01/22 | United States | 40,000,000 | | 38,400,000 |
| Midstates Petroleum Co. Inc./LLC, senior note, | | | | |
| 10.75%, 10/01/20 | United States | 55,000,000 | | 57,612,500 |
| 9.25%, 6/01/21 | United States | 38,100,000 | | 38,195,250 |
| NFR Energy LLC/NFR Finance Corp., 9.75%, 2/15/17 | United States | 25,000,000 | | 25,375,000 |
| eNGPL PipeCo LLC, secured note, 144A, 7.119%, 12/15/17 | United States | 75,000,000 | | 75,375,000 |
| eNiska Gas Storage Canada ULC/Finance Corp., senior note, 144A, | | | | |
| 6.50%, 4/01/19 | United States | 75,000,000 | | 65,906,250 |
| eOcean Rig UDW Inc., senior note, 144A, 7.25%, 4/01/19 | United States | 75,000,000 | | 68,578,125 |
| Offshore Group Investment Ltd., | | | | |
| senior bond, first lien, 7.125%, 4/01/23 | United States | 48,950,000 | | 43,381,938 |
| senior secured note, first lien, 7.50%, 11/01/19 | United States | 110,000,000 | | 102,575,000 |
| eParagon Offshore PLC, | | | | |
| senior bond, 144A, 7.25%, 8/15/24 | United States | 20,000,000 | | 17,000,000 |
| senior note, 144A, 6.75%, 7/15/22 | United States | 20,000,000 | | 16,950,000 |
| Peabody Energy Corp., senior note, | | | | |
| 6.00%, 11/15/18 | United States | 100,000,000 | | 98,500,000 |
| 6.25%, 11/15/21 | United States | 165,000,000 | | 154,068,750 |
| Penn Virginia Corp., senior note, 8.50%, 5/01/20 | United States | 150,700,000 | | 158,988,500 |
| Penn Virginia Resource Partners LP/Penn Virginia Resource Finance | | | | |
| Corp., senior note, 6.50%, 5/15/21 | United States | 28,000,000 | | 29,470,000 |
| Petrobras Global Finance BV, senior note, | | | | |
| 4.375%, 5/20/23 | Brazil | 85,000,000 | | 79,519,200 |
| 6.25%, 3/17/24 | Brazil | 50,000,000 | | 52,413,000 |
| Petrobras International Finance Co., senior note, 5.375%, 1/27/21 | Brazil | 65,000,000 | | 66,127,425 |
| PetroQuest Energy Inc., senior note, 10.00%, 9/01/17 | United States | 60,000,000 | | 62,775,000 |
| Plains Exploration & Production Co., senior note, | | | | |
| 6.50%, 11/15/20 | United States | 12,316,000 | | 13,518,288 |
| 6.875%, 2/15/23 | United States | 14,084,000 | | 16,020,550 |
| Quicksilver Resources Inc., senior note, | | | | |
| 9.125%, 8/15/19 | United States | 90,000,000 | | 56,700,000 |
| 11.00%, 7/01/21 | United States | 86,000,000 | | 57,190,000 |
| Range Resources Corp., senior sub. note, 5.00%, 3/15/23 | United States | 12,500,000 | | 12,937,500 |
| Regency Energy Partners LP/Regency Energy Finance Corp., | | | | |
| senior bond, 5.50%, 4/15/23 | United States | 46,000,000 | | 46,920,000 |
| senior note, 5.875%, 3/01/22 | United States | 15,400,000 | | 16,131,500 |
| senior note, 4.50%, 11/01/23 | United States | 62,000,000 | | 60,295,000 |
| |
| |
| 88 | Annual Report | | | | franklintempleton.com |
| | | | |
| | | FRANKLIN CUSTODIAN FUNDS |
| | | STATEMENT OF INVESTMENTS |
| |
| |
| |
| |
| Franklin Income Fund (continued) | | | | |
| | | Principal | | |
| | Country | Amount* | | Value |
| Corporate Bonds (continued) | | | | |
| Energy (continued) | | | | |
| eRex Energy Corp., senior note, 144A, 6.25%, 8/01/22 | United States | 50,000,000 | $ | 48,437,500 |
| eRice Energy Inc., senior note, 144A, 6.25%, 5/01/22 | United States | 35,900,000 | | 35,182,000 |
| eRockies Express Pipeline LLC, | | | | |
| senior bond, 144A, 6.85%, 7/15/18 | United States | 25,000,000 | | 26,875,000 |
| senior note, 144A, 6.00%, 1/15/19 | United States | 32,200,000 | | 33,810,000 |
| Sabine Pass Liquefaction LLC, | | | | |
| first lien, 5.625%, 2/01/21 | United States | 126,200,000 | | 130,301,500 |
| first lien, 5.625%, 4/15/23 | United States | 108,800,000 | | 110,432,000 |
| efirst lien, 144A, 6.25%, 3/15/22 | United States | 90,000,000 | | 94,837,500 |
| esenior secured note, 144A, 5.625%, 4/15/23 | United States | 91,200,000 | | 92,568,000 |
| esenior secured note, first lien, 144A, 5.75%, 5/15/24 | United States | 131,900,000 | | 134,373,125 |
| Sabine Pass LNG LP, | | | | |
| first lien, 6.50%, 11/01/20 | United States | 30,000,000 | | 31,050,000 |
| senior secured note, 7.50%, 11/30/16 | United States | 141,000,000 | | 150,179,100 |
| Samson Investment Co., senior note, 9.75%, 2/15/20 | United States | 199,200,000 | | 181,770,000 |
| Sanchez Energy Corp., senior note, | | | | |
| 7.75%, 6/15/21 | United States | 74,200,000 | | 79,765,000 |
| e144A, 6.125%, 1/15/23 | United States | 76,100,000 | | 75,635,790 |
| SandRidge Energy Inc., senior note, | | | | |
| 8.75%, 1/15/20 | United States | 100,000,000 | | 103,000,000 |
| 7.50%, 3/15/21 | United States | 120,000,000 | | 117,600,000 |
| 8.125%, 10/15/22 | United States | 46,250,000 | | 46,423,438 |
| 7.50%, 2/15/23 | United States | 50,000,000 | | 48,812,500 |
| eSeventy Seven Energy Inc., senior note, 144A, 6.50%, 7/15/22 | United States | 15,000,000 | | 14,812,500 |
| Stone Energy Corp., senior bond, 7.50%, 11/15/22 | United States | 125,000,000 | | 129,412,500 |
| Transocean Inc., senior bond, 6.50%, 11/15/20 | United States | 25,000,000 | | 26,604,425 |
| eUltra Petroleum Corp., senior bond, 144A, 6.125%, 10/01/24 | United States | 47,000,000 | | 45,120,000 |
| W&T Offshore Inc., senior note, 8.50%, 6/15/19 | United States | 128,400,000 | | 133,536,000 |
| The Williams Cos. Inc., senior bond, 3.70%, 1/15/23 | United States | 65,000,000 | | 61,523,865 |
| WPX Energy Inc., senior note, 6.00%, 1/15/22 | United States | 48,500,000 | | 50,076,250 |
| | | | | 7,830,201,550 |
| Financials 4.1% | | | | |
| Ally Financial Inc., senior note, 6.25%, 12/01/17 | United States | 36,600,000 | | 39,345,000 |
| eAnna Merger Sub Inc., senior note, 144A, 7.75%, 10/01/22 | United States | 50,000,000 | | 50,375,000 |
| eAshtead Capital Inc., second lien, 144A, 5.625%, 10/01/24 | United Kingdom | 40,000,000 | | 40,250,000 |
| kBank of America Corp., junior sub. bond, | | | | |
| M, 8.125% to 5/15/18, FRN thereafter, Perpetual | United States | 100,000,000 | | 108,759,300 |
| U, 5.20% to 6/01/23, FRN thereafter, Perpetual | United States | 52,000,000 | | 49,140,000 |
| X, 6.25% to 9/05/24, FRN thereafter, Perpetual | United States | 85,000,000 | | 84,893,750 |
| kBarclays PLC, sub. bond, 8.25% to 12/15/18, FRN thereafter, | | | | |
| Perpetual | United Kingdom | 75,000,000 | | 77,280,375 |
| eCeridian LLC/Comdata Inc., senior note, 144A, 8.125%, 11/15/17 | United States | 35,000,000 | | 35,131,250 |
| CIT Group Inc., senior bond, 5.00%, 8/01/23 | United States | 60,000,000 | | 59,700,000 |
| kCitigroup Inc., | | | | |
| junior sub. bond, 5.35% to 5/15/23, FRN thereafter, Perpetual | United States | 179,195,000 | | 168,311,233 |
| junior sub. bond, 5.95% to 1/30/23, FRN thereafter, Perpetual | United States | 165,000,000 | | 165,154,770 |
| junior sub. bond, M, 6.30% to 5/15/24, FRN thereafter, | | | | |
| Perpetual | United States | 270,000,000 | | 268,421,040 |
| junior sub. note, 5.90% to 2/15/23, FRN thereafter, Perpetual | United States | 33,000,000 | | 32,257,500 |
| Crown Castle International Corp., senior bond, 5.25%, 1/15/23 | United States | 21,000,000 | | 20,895,000 |
| |
| |
| franklintempleton.com | | | | Annual Report | 89 |
| | | | |
| FRANKLIN CUSTODIAN FUNDS | | | | |
| STATEMENT OF INVESTMENTS | | | | |
| |
| |
| |
| |
| Franklin Income Fund (continued) | | | | |
| | | Principal | | |
| | Country | Amount* | | Value |
| Corporate Bonds (continued) | | | | |
| Financials (continued) | | | | |
| E*TRADE Financial Corp., senior note, 6.00%, 11/15/17 | United States | 49,900,000 | $ | 51,646,500 |
| kFifth Third Bancorp, junior sub. bond, 5.10% to 6/30/23, FRN thereafter, | | | | |
| Perpetual | United States | 54,000,000 | | 51,030,000 |
| kGeneral Electric Capital Corp., junior sub. bond, C, 5.25% to 6/15/23, | | | | |
| FRN thereafter, Perpetual | United States | 82,400,000 | | 82,709,000 |
| General Motors Financial Co. Inc., senior bond, 4.25%, 5/15/23 | United States | 65,209,000 | | 65,616,556 |
| kThe Goldman Sachs Group Inc., junior sub. note, 5.70% to 5/10/19, | | | | |
| FRN thereafter, Perpetual | United States | 30,000,000 | | 30,582,480 |
| kHSBC Holdings PLC, junior sub. bond, 6.375% to 9/17/24, | | | | |
| FRN thereafter, Perpetual | United Kingdom | 40,000,000 | | 40,047,600 |
| International Lease Finance Corp., senior note, | | | | |
| 8.75%, 3/15/17 | United States | 130,000,000 | | 145,275,000 |
| 8.875%, 9/01/17 | United States | 63,300,000 | | 72,003,750 |
| iStar Financial Inc., senior note, 5.00%, 7/01/19 | United States | 88,500,000 | | 85,623,750 |
| kJPMorgan Chase & Co., | | | | |
| junior sub. bond, 6.00% to 8/01/23, FRN thereafter, Perpetual | United States | 105,000,000 | | 103,818,750 |
| junior sub. bond, 6.125% to 4/30/24, FRN thereafter, Perpetual | United States | 60,000,000 | | 59,670,000 |
| junior sub. bond, 6.75% to 2/01/24, FRN thereafter, Perpetual | United States | 100,000,000 | | 105,950,000 |
| junior sub. bond, Q, 5.15% to 5/01/23, FRN thereafter, | | | | |
| Perpetual | United States | 100,000,000 | | 95,500,000 |
| junior sub. bond, V, 5.00% to 7/30/19, FRN thereafter, | | | | |
| Perpetual | United States | 188,000,000 | | 183,978,868 |
| junior sub. note, I, 7.90% to 4/30/19, FRN thereafter, Perpetual | United States | 815,000,000 | | 888,757,500 |
| junior sub. note, X, 6.10% to 10/01/24, FRN thereafter, | | | | |
| Perpetual | United States | 80,000,000 | | 79,439,440 |
| Kinetic Concepts Inc./USA, senior note, 12.50%, 11/01/19 | United States | 32,000,000 | | 35,760,000 |
| Morgan Stanley, | | | | |
| kjunior sub. bond, H, 5.45% to 7/15/19, FRN thereafter, | | | | |
| Perpetual | United States | 25,000,000 | | 24,843,750 |
| senior note, 5.50%, 1/26/20 | United States | 70,000,000 | | 78,597,120 |
| Nationstar Mortgage LLC/Nationstar Capital Corp., senior note, | | | | |
| 9.625%, 5/01/19 | United States | 30,000,000 | | 32,925,000 |
| eNuveen Investments Inc., senior note, 144A, | | | | |
| 9.125%, 10/15/17 | United States | 50,000,000 | | 53,750,000 |
| 9.50%, 10/15/20 | United States | 50,000,000 | | 58,250,000 |
| kPNC Financial Services Group Inc., junior sub. note, 4.85% to 6/01/23, | | | | |
| FRN thereafter, Perpetual | United States | 54,000,000 | | 51,300,000 |
| Royal Bank of Scotland Group PLC, sub. note, 5.125%, 5/28/24 | United Kingdom | 41,100,000 | | 40,509,188 |
| SLM Corp., senior note, 6.125%, 3/25/24 | United States | 50,000,000 | | 48,875,000 |
| kWells Fargo & Co., junior sub. bond, S, 5.90% to 6/15/24, | | | | |
| FRN thereafter, Perpetual | United States | 129,500,000 | | 132,251,875 |
| | | | | 3,898,625,345 |
| Health Care 2.7% | | | | |
| Alere Inc., senior note, 7.25%, 7/01/18 | United States | 20,800,000 | | 21,892,000 |
| eAmSurg Corp., senior note, 144A, 5.625%, 7/15/22 | United States | 27,700,000 | | 27,561,500 |
| CHS/Community Health Systems Inc., senior note, | | | | |
| 8.00%, 11/15/19 | United States | 129,100,000 | | 138,162,820 |
| e144A, 5.125%, 8/01/21 | United States | 48,750,000 | | 48,871,875 |
| e144A, 6.875%, 2/01/22 | United States | 89,000,000 | | 93,227,500 |
| DaVita HealthCare Partners Inc., senior bond, 5.125%, 7/15/24 | United States | 76,000,000 | | 74,812,500 |
| |
| |
| 90 | Annual Report | | | | franklintempleton.com |
| | | | |
| | | FRANKLIN CUSTODIAN FUNDS |
| | | STATEMENT OF INVESTMENTS |
| |
| |
| |
| |
| Franklin Income Fund (continued) | | | | |
| | | Principal | | |
| | Country | Amount* | | Value |
| Corporate Bonds (continued) | | | | |
| Health Care (continued) | | | | |
| eGrifols Worldwide Operations Ltd., senior note, 144A, 5.25%, | | | | |
| 4/01/22 | United States | 11,500,000 | $ | 11,385,000 |
| HCA Holdings Inc., senior note, 6.25%, 2/15/21 | United States | 47,200,000 | | 49,560,000 |
| HCA Inc., | | | | |
| senior note, 6.50%, 2/15/16 | United States | 25,550,000 | | 26,731,687 |
| senior note, 8.00%, 10/01/18 | United States | 60,000,000 | | 68,400,000 |
| senior note, 7.50%, 2/15/22 | United States | 150,000,000 | | 169,125,000 |
| senior note, 5.875%, 5/01/23 | United States | 110,000,000 | | 112,750,000 |
| senior secured bond, first lien, 4.75%, 5/01/23 | United States | 85,000,000 | | 83,300,000 |
| senior secured note, 6.50%, 2/15/20 | United States | 114,300,000 | | 125,015,625 |
| senior secured note, first lien, 5.00%, 3/15/24 | United States | 148,900,000 | | 146,852,625 |
| e,hJaguar Holding Co. I, senior note, 144A, PIK, 9.375%, 10/15/17 | United States | 145,400,000 | | 147,217,500 |
| eMallinckrodt International Finance SA/Mallinckrodt CB LLC, senior note, | | | | |
| 144A, 5.75%, 8/01/22 | United States | 25,000,000 | | 25,281,250 |
| Tenet Healthcare Corp., | | | | |
| 4.375%, 10/01/21 | United States | 150,000,000 | | 144,375,000 |
| first lien, 6.25%, 11/01/18 | United States | 88,211,775 | | 94,055,805 |
| senior note, 8.00%, 8/01/20 | United States | 190,000,000 | | 200,925,000 |
| senior note, 8.125%, 4/01/22 | United States | 360,000,000 | | 396,000,000 |
| esenior note, 144A, 5.00%, 3/01/19 | United States | 35,450,000 | | 35,095,500 |
| esenior note, 144A, 5.50%, 3/01/19 | United States | 35,800,000 | | 36,068,500 |
| senior secured note, first lien, 4.50%, 4/01/21 | United States | 85,000,000 | | 83,193,750 |
| eValeant Pharmaceuticals International Inc., senior note, 144A, | | | | |
| 6.75%, 8/15/18 | United States | 58,900,000 | | 62,286,750 |
| 7.50%, 7/15/21 | United States | 53,900,000 | | 57,875,125 |
| 5.625%, 12/01/21 | United States | 25,650,000 | | 25,617,938 |
| eVPI Escrow Corp., senior note, 144A, 6.375%, 10/15/20 | United States | 42,900,000 | | 44,240,625 |
| | | | | 2,549,880,875 |
| Industrials 1.9% | | | | |
| eAbengoa Finance SAU, senior note, 144A, | | | | |
| 8.875%, 11/01/17 | Spain | 100,000,000 | | 109,000,000 |
| 7.75%, 2/01/20 | Spain | 36,600,000 | | 39,299,250 |
| eAbengoa Greenfield SA, senior note, 144A, 6.50%, 10/01/19 | Spain | 40,000,000 | | 39,850,000 |
| The ADT Corp., | | | | |
| senior bond, 4.125%, 6/15/23 | United States | 105,000,000 | | 93,712,500 |
| senior note, 3.50%, 7/15/22 | United States | 58,500,000 | | 50,748,750 |
| eAhern Rentals Inc., secured note, second lien, 144A, 9.50%, | | | | |
| 6/15/18 | United States | 40,000,000 | | 42,900,000 |
| eAlgeco Scotsman Global Finance PLC, | | | | |
| senior note, 144A, 10.75%, 10/15/19 | United Kingdom | 40,000,000 | | 38,600,000 |
| senior secured note, first lien, 144A, 8.50%, 10/15/18 | United Kingdom | 98,500,000 | | 101,270,313 |
| eAviation Capital Group Corp., 144A, 6.75%, 4/06/21 | United States | 28,520,000 | | 32,584,100 |
| eBlueline Rental Finance Corp., second lien, 144A, 7.00%, 2/01/19 | United States | 10,800,000 | | 11,124,000 |
| eBombardier Inc., | | | | |
| senior bond, 144A, 6.125%, 1/15/23 | Canada | 81,300,000 | | 81,808,125 |
| senior note, 144A, 6.00%, 10/15/22 | Canada | 35,000,000 | | 34,868,750 |
| b,eCEVA Group PLC, | | | | |
| first lien, 144A, 7.00%, 3/01/21 | United Kingdom | 15,000,000 | | 15,075,000 |
| secured note, 144A, 9.00%, 9/01/21 | United Kingdom | 20,000,000 | | 20,187,500 |
| senior note, first lien, 144A, 4.00%, 5/01/18 | United Kingdom | 186,778,982 | | 172,303,611 |
| |
| |
| franklintempleton.com | | | | Annual Report | 91 |
| | | | |
| FRANKLIN CUSTODIAN FUNDS | | | | |
| STATEMENT OF INVESTMENTS | | | | |
| |
| |
| |
| |
| Franklin Income Fund (continued) | | | | |
| | | Principal | | |
| | Country | Amount* | | Value |
| Corporate Bonds (continued) | | | | |
| Industrials (continued) | | | | |
| Hertz Corp., senior note, | | | | |
| 6.75%, 4/15/19 | United States | 125,775,000 | $ | 130,491,562 |
| 5.875%, 10/15/20 | United States | 12,150,000 | | 12,393,000 |
| 7.375%, 1/15/21 | United States | 30,000,000 | | 31,800,000 |
| Icahn Enterprises LP/Finance Corp., senior note, 5.875%, 2/01/22 | United States | 40,000,000 | | 40,100,000 |
| Iron Mountain Inc., senior sub. bond, 5.75%, 8/15/24 | United States | 78,000,000 | | 76,927,500 |
| Navistar International Corp., senior note, 8.25%, 11/01/21 | United States | 147,975,000 | | 152,229,281 |
| eStena AB, senior bond, 144A, 7.00%, 2/01/24 | Sweden | 51,600,000 | | 53,793,000 |
| eStena International SA, secured bond, 144A, 5.75%, 3/01/24 | Sweden | 60,650,000 | | 60,877,438 |
| TransDigm Inc., | | | | |
| esenior sub. bond, 144A, 6.50%, 7/15/24 | United States | 26,500,000 | | 26,433,750 |
| senior sub. note, 5.50%, 10/15/20 | United States | 59,500,000 | | 58,012,500 |
| esenior sub. note, 144A, 6.00%, 7/15/22 | United States | 26,800,000 | | 26,498,500 |
| United Continental Holdings Inc., senior bond, | | | | |
| A, 6.00%, 7/15/26 | United States | 40,000,000 | | 37,500,000 |
| B, 6.00%, 7/15/28 | United States | 40,000,000 | | 37,000,000 |
| United Rentals North America Inc., | | | | |
| senior bond, 5.75%, 11/15/24 | United States | 69,700,000 | | 70,787,320 |
| senior sub. note, 8.375%, 9/15/20 | United States | 45,000,000 | | 48,600,000 |
| eXPO Logistics Inc., senior note, 144A, 7.875%, 9/01/19 | United States | 30,000,000 | | 31,125,000 |
| | | | | 1,777,900,750 |
| Information Technology 2.9% | | | | |
| eAlcatel-Lucent USA Inc., senior note, 144A, 6.75%, 11/15/20 | France | 55,900,000 | | 57,157,750 |
| eBelden Inc., senior sub. note, 144A, 5.50%, 9/01/22 | United States | 40,000,000 | | 40,700,000 |
| eBMC Software Finance Inc., senior note, 144A, 8.125%, 7/15/21 | United States | 97,500,000 | | 94,087,500 |
| e,hBoxer Parent Co. Inc., senior note, 144A, PIK, 9.00%, 10/15/19 | United States | 50,000,000 | | 46,250,000 |
| CDW LLC/Finance Corp., senior note, 8.50%, 4/01/19 | United States | 101,874,000 | | 108,495,810 |
| eCeridian Corp., secured note, 144A, 8.875%, 7/15/19 | United States | 36,100,000 | | 40,116,125 |
| e,hCommScope Holdings Co. Inc., senior note, 144A, PIK, 6.625%, | | | | |
| 6/01/20 | United States | 44,400,000 | | 45,954,000 |
| eCommScope Inc., | | | | |
| senior bond, 144A, 5.50%, 6/15/24 | United States | 55,000,000 | | 54,312,500 |
| senior note, 144A, 5.00%, 6/15/21 | United States | 22,000,000 | | 21,670,000 |
| First Data Corp., | | | | |
| senior bond, 12.625%, 1/15/21 | United States | 580,000,000 | | 696,000,000 |
| senior note, 10.625%, 6/15/21 | United States | 40,780,000 | | 46,591,150 |
| esenior secured bond, 144A, 8.25%, 1/15/21 | United States | 425,000,000 | | 452,625,000 |
| e,hsenior secured note, 144A, PIK, 8.75%, 1/15/22 | United States | 208,158,000 | | 221,688,270 |
| esenior secured note, first lien, 144A, 6.75%, 11/01/20 | United States | 69,726,000 | | 74,083,875 |
| Freescale Semiconductor Inc., | | | | |
| esecured note, 144A, 5.00%, 5/15/21 | United States | 59,450,000 | | 58,706,875 |
| senior note, 8.05%, 2/01/20 | United States | 116,894,000 | | 124,492,110 |
| senior note, 10.75%, 8/01/20 | United States | 119,258,000 | | 132,674,525 |
| esenior secured note, 144A, 6.00%, 1/15/22 | United States | 41,850,000 | | 42,582,375 |
| IAC/InterActiveCorp, senior note, 4.75%, 12/15/22 | United States | 45,000,000 | | 43,425,000 |
| e,hInfor Software Parent LLC/Inc., senior note, 144A, PIK, 7.125%, | | | | |
| 5/01/21 | United States | 22,000,000 | | 21,890,000 |
| Infor U.S. Inc., senior note, 9.375%, 4/01/19 | United States | 40,800,000 | | 44,217,000 |
| eInmarsat Finance PLC, senior note, 144A, 4.875%, 5/15/22 | United Kingdom | 40,000,000 | | 39,075,000 |
| |
| |
| |
| 92 | Annual Report | | | | franklintempleton.com |
| | | | |
| | | FRANKLIN CUSTODIAN FUNDS |
| | | STATEMENT OF INVESTMENTS |
| |
| |
| |
| |
| Franklin Income Fund (continued) | | | | |
| | | Principal | | |
| | Country | Amount* | | Value |
| Corporate Bonds (continued) | | | | |
| Information Technology (continued) | | | | |
| NCR Corp., senior note, | | | | |
| 4.625%, 2/15/21 | United States | 35,000,000 | $ | 34,475,000 |
| 5.00%, 7/15/22 | United States | 50,000,000 | | 49,125,000 |
| 6.375%, 12/15/23 | United States | 70,000,000 | | 73,675,000 |
| e,jNII International Telecom SCA, senior note, 144A, 11.375%, | | | | |
| 8/15/19 | United States | 25,000,000 | | 16,937,500 |
| Sterling International Inc., senior note, 11.00%, 10/01/19 | United States | 36,400,000 | | 38,948,000 |
| | | | | 2,719,955,365 |
| Materials 2.9% | | | | |
| AngloGold Ashanti Holdings PLC, senior note, 8.50%, 7/30/20 | South Africa | 35,000,000 | | 38,653,125 |
| eArdagh Packaging Finance PLC/Ardagh MP Holdings USA Inc., | | | | |
| senior note, 144A, 6.25%, 1/31/19 | Luxembourg | 20,700,000 | | 20,544,750 |
| senior note, 144A, 7.00%, 11/15/20 | Luxembourg | 10,588,235 | | 10,601,471 |
| senior note, 144A, 6.75%, 1/31/21 | Luxembourg | 22,600,000 | | 22,741,250 |
| senior note, 144A, 6.00%, 6/30/21 | Luxembourg | 40,000,000 | | 38,675,000 |
| lsenior secured note, 144A, FRN, 3.234%, 12/15/19 | Luxembourg | 25,000,000 | | 24,281,250 |
| Ball Corp., senior bond, 4.00%, 11/15/23 | United States | 95,000,000 | | 88,825,000 |
| eBeverage Packaging Holdings Luxembourg II SA, senior note, 144A, | | | | |
| 5.625%, 12/15/16 | United States | 33,000,000 | | 32,835,000 |
| eBWAY Holding Co., senior note, 144A, 9.125%, 8/15/21 | United States | 55,000,000 | | 55,550,000 |
| eCemex Finance LLC, senior secured note, 144A, | | | | |
| 9.375%, 10/12/22 | Mexico | 56,300,000 | | 63,759,750 |
| 6.00%, 4/01/24 | Mexico | 88,400,000 | | 88,068,500 |
| d,eCemex SAB de CV, | | | | |
| first lien, 144A, 5.70%, 1/11/25 | Mexico | 75,000,000 | | 72,515,625 |
| secured note, 144A, 5.875%, 3/25/19 | Mexico | 18,800,000 | | 19,023,250 |
| secured note, 144A, 7.25%, 1/15/21 | Mexico | 111,000,000 | | 117,729,375 |
| senior secured note, 144A, 9.00%, 1/11/18 | Mexico | 79,163,000 | | 83,912,780 |
| senior secured note, 144A, 9.50%, 6/15/18 | Mexico | 105,000,000 | | 116,943,750 |
| senior secured note, 144A, 6.50%, 12/10/19 | Mexico | 40,000,000 | | 41,350,000 |
| eConsolidated Minerals Ltd., senior secured note, 144A, 8.00%, | | | | |
| 5/15/20 | Jersey Islands | 30,000,000 | | 25,500,000 |
| Crown Americas LLC/Crown Americas Capital Corp. IV, senior bond, | | | | |
| 4.50%, 1/15/23 | United States | 150,000,000 | | 142,500,000 |
| Dynacast International LLC/Finance Inc., 9.25%, 7/15/19 | United States | 50,000,000 | | 53,750,000 |
| eFirst Quantum Minerals Ltd., senior note, 144A, | | | | |
| 6.75%, 2/15/20 | Canada | 41,630,000 | | 42,566,675 |
| 7.00%, 2/15/21 | Canada | 63,630,000 | | 64,823,062 |
| 7.25%, 5/15/22 | Canada | 28,000,000 | | 28,700,000 |
| eFMG Resources (August 2006) Pty. Ltd., senior note, 144A, | | | | |
| 6.875%, 2/01/18 | Australia | 70,600,000 | | 72,718,000 |
| i8.25%, 11/01/19 | Australia | 80,000,000 | | 83,000,000 |
| i6.875%, 4/01/22 | Australia | 60,000,000 | | 61,275,000 |
| HudBay Minerals Inc., senior note, | | | | |
| 9.50%, 10/01/20 | Canada | 89,600,000 | | 96,544,000 |
| e144A, 9.50%, 10/01/20 | Canada | 15,000,000 | | 16,162,500 |
| eImperial Metals Corp., senior note, 144A, 7.00%, 3/15/19 | Canada | 20,000,000 | | 18,900,000 |
| eIneos Finance PLC, senior secured note, 144A, 8.375%, 2/15/19 | Switzerland | 42,800,000 | | 46,090,250 |
| eIneos Group Holdings SA, senior note, 144A, | | | | |
| 5.75%, 2/15/19 | Switzerland | 45,200,000 | EUR | 57,404,175 |
| 5.875%, 2/15/19 | Switzerland | 25,700,000 | | 25,603,625 |
| |
| franklintempleton.com | | | Annual Report | 93 |
| | | | | |
| FRANKLIN CUSTODIAN FUNDS | | | | | |
| STATEMENT OF INVESTMENTS | | | | | |
| |
| |
| |
| |
| Franklin Income Fund (continued) | | | | | |
| | | Principal | | | |
| | Country | Amount* | | | Value |
| Corporate Bonds (continued) | | | | | |
| Materials (continued) | | | | | |
| eKerling PLC, senior secured note, 144A, 10.625%, 2/01/17 | United Kingdom | 53,700,000 | EUR | $ | 70,618,605 |
| Molycorp Inc., first lien, 10.00%, 6/01/20 | United States | 65,000,000 | | | 45,500,000 |
| Reynolds Group Issuer Inc./LLC/SA, | | | | | |
| first lien, 5.75%, 10/15/20 | United States | 70,800,000 | | | 72,393,000 |
| senior note, 8.50%, 5/15/18 | United States | 99,900,000 | | | 103,521,375 |
| senior note, 9.00%, 4/15/19 | United States | 100,100,000 | | | 104,729,625 |
| senior note, 9.875%, 8/15/19 | United States | 127,000,000 | | | 137,318,750 |
| senior note, 8.25%, 2/15/21 | United States | 45,000,000 | | | 47,812,500 |
| senior secured note, 7.875%, 8/15/19 | United States | 65,000,000 | | | 69,225,000 |
| senior secured note, 6.875%, 2/15/21 | United States | 32,500,000 | | | 34,450,000 |
| eSealed Air Corp., senior bond, 144A, 5.25%, 4/01/23 | United States | 48,000,000 | | | 47,280,000 |
| United States Steel Corp., senior note, 7.375%, 4/01/20 | United States | 35,000,000 | | | 39,068,750 |
| Walter Energy Inc., | | | | | |
| efirst lien, 144A, 9.50%, 10/15/19 | United States | 110,000,000 | | | 99,550,000 |
| e,hsecond lien, 144A, PIK, 11.00%, 4/01/20 | United States | 24,250,000 | | | 11,155,000 |
| senior note, 9.875%, 12/15/20 | United States | 45,000,000 | | | 14,625,000 |
| senior note, 8.50%, 4/15/21 | United States | 66,725,000 | | | 20,684,750 |
| eWise Metals Group LLC/Wise Alloys Finance Corp., senior secured | | | | | |
| note, 144A, 8.75%, 12/15/18 | United States | 25,000,000 | | | 26,812,500 |
| eWR Grace & Co-Conn, senior note, 144A, 5.125%, 10/01/21 | United States | 30,000,000 | | | 30,600,000 |
| | | | | | 2,746,892,018 |
| Telecommunication Services 3.9% | | | | | |
| CenturyLink Inc., | | | | | |
| senior bond, 6.75%, 12/01/23 | United States | 47,600,000 | | | 51,110,500 |
| senior note, 5.80%, 3/15/22 | United States | 63,000,000 | | | 64,890,000 |
| Frontier Communications Corp., | | | | | |
| senior bond, 7.625%, 4/15/24 | United States | 75,000,000 | | | 78,187,500 |
| senior note, 8.50%, 4/15/20 | United States | 51,150,000 | | | 57,032,250 |
| senior note, 9.25%, 7/01/21 | United States | 63,600,000 | | | 72,901,500 |
| senior note, 8.75%, 4/15/22 | United States | 48,900,000 | | | 55,257,000 |
| senior note, 7.125%, 1/15/23 | United States | 130,000,000 | | | 133,250,000 |
| Intelsat Jackson Holdings SA, senior bond, 5.50%, 8/01/23 | Luxembourg | 170,000,000 | | | 162,987,500 |
| eMillicom International Cellular SA, senior note, 144A, 6.625%, | | | | | |
| 10/15/21 | Luxembourg | 37,900,000 | | | 39,510,750 |
| eSoftBank Corp., senior note, 144A, 4.50%, 4/15/20 | Japan | 70,000,000 | | | 70,000,000 |
| Sprint Capital Corp., senior bond, 6.875%, 11/15/28 | United States | 126,000,000 | | | 120,960,000 |
| eSprint Corp., | | | | | |
| senior bond, 144A, 7.125%, 6/15/24 | United States | 245,650,000 | | | 248,413,562 |
| senior note, 144A, 7.875%, 9/15/23 | United States | 187,350,000 | | | 199,527,750 |
| Sprint Nextel Corp., | | | | | |
| 6.00%, 12/01/16 | United States | 164,000,000 | | | 172,815,000 |
| 11.50%, 11/15/21 | United States | 200,000,000 | | | 257,000,000 |
| senior note, 9.125%, 3/01/17 | United States | 80,000,000 | | | 90,400,000 |
| senior note, 8.375%, 8/15/17 | United States | 182,700,000 | | | 204,852,375 |
| senior note, 7.00%, 8/15/20 | United States | 30,000,000 | | | 31,425,000 |
| senior note, 6.00%, 11/15/22 | United States | 158,000,000 | | | 153,852,500 |
| esenior note, 144A, 9.00%, 11/15/18 | United States | 180,000,000 | | | 208,575,000 |
| T-Mobile USA Inc., | | | | | |
| senior bond, 6.625%, 4/01/23 | United States | 50,000,000 | | | 51,375,000 |
| senior bond, 6.50%, 1/15/24 | United States | 32,300,000 | | | 32,784,500 |
| senior bond, 6.375%, 3/01/25 | United States | 43,000,000 | | | 43,000,000 |
| |
| 94 | Annual Report | | | | | franklintempleton.com |
| | | | | |
| | | | FRANKLIN CUSTODIAN FUNDS |
| | | | STATEMENT OF INVESTMENTS |
| |
| |
| |
| |
| Franklin Income Fund (continued) | | | | | |
| | | | Principal | | |
| | | Country | Amount* | | Value |
| Corporate Bonds (continued) | | | | | |
| Telecommunication Services (continued) | | | | | |
| T-Mobile USA Inc., (continued) | | | | | |
| senior note, 6.464%, 4/28/19 | | United States | 125,000,000 | $ | 130,156,250 |
| senior note, 6.542%, 4/28/20 | | United States | 45,000,000 | | 46,293,750 |
| senior note, 6.25%, 4/01/21 | | United States | 100,000,000 | | 101,375,000 |
| senior note, 6.633%, 4/28/21 | | United States | 50,000,000 | | 51,437,500 |
| senior note, 6.125%, 1/15/22 | | United States | 18,300,000 | | 18,460,125 |
| senior note, 6.731%, 4/28/22 | | United States | 50,000,000 | | 51,312,500 |
| senior note, 6.00%, 3/01/23 | | United States | 30,000,000 | | 30,075,000 |
| senior note, 6.836%, 4/28/23 | | United States | 50,000,000 | | 51,562,500 |
| eTelecom Italia SpA, senior note, 144A, 5.303%, 5/30/24 | | Italy | 70,000,000 | | 68,993,750 |
| Verizon Communications Inc., | | | | | |
| senior bond, 6.55%, 9/15/43 | | United States | 70,000,000 | | 87,584,420 |
| senior note, 5.15%, 9/15/23 | | United States | 92,700,000 | | 102,605,644 |
| eWind Acquisition Finance SA, | | | | | |
| senior note, 144A, 7.375%, 4/23/21 | | Italy | 290,000,000 | | 291,812,500 |
| senior secured note, 144A, 4.75%, 7/15/20 | | Italy | 50,000,000 | | 48,031,250 |
| | | | | | 3,679,807,876 |
| Utilities 1.4% | | | | | |
| The AES Corp., senior bond, | | | | | |
| 4.875%, 5/15/23 | | United States | 110,000,000 | | 105,050,000 |
| 5.50%, 3/15/24 | | United States | 50,000,000 | | 48,875,000 |
| Calpine Corp., | | | | | |
| senior bond, 5.75%, 1/15/25 | | United States | 250,000,000 | | 242,812,500 |
| senior note, 5.375%, 1/15/23 | | United States | 200,000,000 | | 194,250,000 |
| esenior secured bond, first lien, 144A, 5.875%, 1/15/24 | | United States | 58,700,000 | | 61,048,000 |
| esenior secured note, 144A, 7.875%, 1/15/23 | | United States | 60,920,000 | | 66,859,700 |
| esenior secured note, first lien, 144A, 6.00%, 1/15/22 | | United States | 28,200,000 | | 29,821,500 |
| bDynegy Inc., senior note, 5.875%, 6/01/23 | | United States | 105,000,000 | | 98,437,500 |
| GenOn Energy Inc., senior note, 7.875%, 6/15/17 | | United States | 110,000,000 | | 112,475,000 |
| eInterGen NV, | | | | | |
| secured bond, 144A, 7.00%, 6/30/23 | | Netherlands | 143,700,000 | | 138,131,625 |
| secured note, 144A, 7.50%, 6/30/21 | | Netherlands | 35,800,000 | GBP | 59,457,327 |
| eNGL Energy Partners LP/NGL Energy Finance Corp., senior note, | | | | | |
| 144A, | | | | | |
| 5.125%, 7/15/19 | | United States | 23,200,000 | | 22,823,000 |
| 6.875%, 10/15/21 | | United States | 30,000,000 | | 31,350,000 |
| NRG Energy Inc., | | | | | |
| senior bond, 6.625%, 3/15/23 | | United States | 20,000,000 | | 20,750,000 |
| esenior note, 144A, 6.25%, 7/15/22 | | United States | 25,000,000 | | 25,765,625 |
| eNRG Yield Operating LLC, senior bond, 144A, 5.375%, 8/15/24 | | United States | 39,900,000 | | 40,199,250 |
| | | | | | 1,298,106,027 |
| Total Corporate Bonds (Cost $31,752,857,302) | | | | | 32,847,875,826 |
| l,mSenior Floating Rate Interests 3.4% | | | | | |
| Consumer Discretionary 1.3% | | | | | |
| 24 Hour Fitness Worldwide Inc., Term Loan, 4.75%, 5/30/21 | | United States | 29,925,000 | | 29,887,414 |
| Altice Financing SA, Loans, 5.50%, 6/24/19 | | Luxembourg | 49,625,000 | | 50,183,281 |
| Caesars Entertainment Operating Co. Inc., Term B-4-B Loans, 10.25%, | | | | | |
| 10/31/16 | | United States | 42,782,450 | | 41,146,022 |
| |
| |
| |
| franklintempleton.com | | | | Annual Report | 95 |
| | | | |
| FRANKLIN CUSTODIAN FUNDS | | | | |
| STATEMENT OF INVESTMENTS | | | | |
| |
| |
| |
| |
| Franklin Income Fund (continued) | | | | |
| | | Principal | | |
| | Country | Amount* | | Value |
| l,mSenior Floating Rate Interests (continued) | | | | |
| Consumer Discretionary (continued) | | | | |
| bDex Media West LLC, Term Loan B, 8.00%, 12/30/16 | United States | 1,482,107 | $ | 1,374,654 |
| iHeartCommunications Inc., | | | | |
| Tranche B Term Loan, 3.804%, 1/29/16 | United States | 5,265,949 | | 5,227,397 |
| Tranche D Term Loan, 6.904%, 1/30/19 | United States | 727,373,595 | | 695,778,668 |
| Tranche E Term Loan, 7.654%, 7/30/19 | United States | 200,744,256 | | 196,729,371 |
| Numericable, | | | | |
| Dollar Denominated Tranche B-1 Loans, 4.50%, 5/08/20 | France | 26,807,692 | | 26,623,389 |
| Dollar Denominated Tranche B-2 Loans, 4.50%, 5/08/20 | France | 23,192,308 | | 23,032,861 |
| bR.H. Donnelley Inc., Term Loan B, 9.75%, 12/30/16 | United States | 22,277,846 | | 16,429,911 |
| SuperMedia Inc., Exit Term Loan, 11.60%, 12/31/16 | United States | 6,805,195 | | 5,591,407 |
| TWCC Holding Corp., | | | | |
| Second Lien Term Loan, 7.00%, 6/26/20 | United States | 50,000,000 | | 49,208,350 |
| Term Loan, 3.50%, 2/11/17 | United States | 10,000,000 | | 9,860,940 |
| Visant Corp. (Jostens), Initial Term Loan, 7.00%, 9/23/21 | United States | 100,000,000 | | 98,791,700 |
| | | | | 1,249,865,365 |
| Consumer Staples 0.1% | | | | |
| U.S. Foods Inc., Term Loan, 4.50%, 3/31/19 | United States | 98,750,000 | | 98,472,315 |
| Energy 0.8% | | | | |
| hAmerican Energy - Utica LLC, Second Lien Loans, PIK, 11.00%, | | | | |
| 9/30/18 | United States | 35,488,862 | | 36,780,763 |
| Drillships Financing Holding Inc., Tranche B-1 Term Loan, 6.00%, | | | | |
| 3/31/21 | Marshall Islands | 248,246,231 | | 238,523,171 |
| Drillships Ocean Ventures Inc. and Drillships Vent, Term Loan, 5.50%, | | | | |
| 7/25/21 | United States | 50,000,000 | | 48,343,750 |
| Fieldwood Energy LLC, Second Lien Closing Date Loans, 8.375%, | | | | |
| 9/30/20 | United States | 219,261,084 | | 220,448,821 |
| gNGPL PipeCo LLC, Term Loan B, 6.75%, 9/15/17 | United States | 106,923,436 | | 106,745,195 |
| Quicksilver Resources Inc., Second Lien Loans, 7.00%, 6/21/19 | United States | 150,000,000 | | 136,125,000 |
| | | | | 786,966,700 |
| Health Care 0.1% | | | | |
| Community Health Systems Inc., 2021 Term D Loan, 4.25%, | | | | |
| 1/27/21 | United States | 49,625,000 | | 49,541,283 |
| Industrials 0.2% | | | | |
| bCEVA Group PLC, Pre-Funded L/C, 6.50%, 3/19/21 | United States | 20,320,197 | | 19,744,465 |
| CEVA Intercompany BV, Dutch BV Term Loan, 6.50%, 3/19/21 | Netherlands | 21,321,429 | | 20,717,329 |
| CEVA Logistics Canada ULC, Canadian Term Loan, 6.50%, | | | | |
| 3/19/21 | Canada | 3,676,108 | | 3,571,953 |
| CEVA Logistics U.S. Holdings Inc., U.S. Term Loan, 6.50%, 3/19/21 | United States | 29,408,867 | | 28,575,626 |
| Navistar Inc., Tranche B Term Loan, 5.75%, 8/17/17 | United States | 36,555,232 | | 36,806,257 |
| Stena International SA, Loans, 4.00%, 3/03/21 | Sweden | 99,500,000 | | 97,945,312 |
| | | | | 207,360,942 |
| Information Technology 0.6% | | | | |
| First Data Corp., | | | | |
| 2018 New Dollar Term Loan, 3.655%, 3/24/18 | United States | 402,993,460 | | 395,857,252 |
| Second New Dollar Term Loan, 3.655%, 3/24/17 | United States | 128,000,000 | | 126,064,000 |
| SRA International Inc., Term Loan, 6.50%, 7/20/18 | United States | 42,428,571 | | 42,481,607 |
| | | | | 564,402,859 |
| |
| |
| |
| 96 | Annual Report | | | | franklintempleton.com |
FRANKLIN CUSTODIAN FUNDS
STATEMENT OF INVESTMENTS
| | | | |
| Franklin Income Fund (continued) | | | | |
| | | Principal | | |
| | Country | Amount* | | Value |
| l,mSenior Floating Rate Interests (continued) | | | | |
| Materials 0.2% | | | | |
| Ardagh Holdings USA Inc., New Term Loan, 4.00%, 12/17/19 | United States | 19,900,000 | $ | 19,626,375 |
| Walter Energy Inc., B Term Loan, 7.25%, 4/01/18 | United States | 204,400,000 | | 181,149,500 |
| | | | | 200,775,875 |
| Utilities 0.1% | | | | |
| Intergen NV, Term Advance, 5.50%, 6/13/20 | Netherlands | 44,425,125 | | 44,619,485 |
| Total Senior Floating Rate Interests | | | | |
| (Cost $3,193,836,462) | | | | 3,202,004,824 |
| |
| | | Shares | | |
| Escrows and Litigation Trusts 0.0%† | | | | |
| a,b,nDynegy Holdings Inc., Escrow Account | United States | 1,024,235,000 | | — |
| a,b,nDynegy Roseton Danskammer Pass Through Trust, | | | | |
| Escrow Account, B | United States | 40,000,000 | | — |
| aMotors Liquidation Co., Escrow Account | United States | 400,000,000 | | 40,000 |
| aMotors Liquidation Co., Escrow Account, cvt. pfd., C | United States | 11,000,000 | | 110,000 |
| a,nSuperMedia Inc., Litigation Trust | United States | 30,326,101 | | — |
| Total Escrows and Litigation Trusts | | | | |
| (Cost $2,757,417) | | | | 150,000 |
| Total Investments before Short Term Investments | | | | |
| (Cost $85,919,079,930) | | | | 93,200,027,287 |
| |
| | | Principal | | |
| | | Amount* | | |
| Short Term Investments 0.8% | | | | |
| U.S. Government and Agency Securities (Cost $99,999,978) 0.1% | | | | |
| oFHLB, 10/08/14 | United States | 100,000,000 | | 100,000,000 |
| Total Investments before Money Market Funds | | | | |
| (Cost $86,019,079,908) | | | | 93,300,027,287 |
| |
| | | Shares | | |
| Money Market Funds (Cost $584,780,335) 0.6% | | | | |
| a,pInstitutional Fiduciary Trust Money Market Portfolio | United States | 584,780,335 | | 584,780,335 |
| qInvestments from Cash Collateral Received for Loaned | | | | |
| Securities (Cost $36,744,420) 0.1% | | | | |
| Money Market Funds 0.1% | | | | |
| rBNY Mellon Overnight Government Fund, 0.026% | United States | 36,744,420 | | 36,744,420 |
| Total Investments (Cost $86,640,604,663) 99.6% | | | | 93,921,552,042 |
| Other Assets, less Liabilities 0.4% | | | | 423,815,552 |
| Net Assets 100.0% | | | $ | 94,345,367,594 |
franklintempleton.com Annual Report | 97
FRANKLIN CUSTODIAN FUNDS
STATEMENT OF INVESTMENTS
Franklin Income Fund (continued)
See Abbreviations on page 143.
†Rounds to less than 0.1% of net assets.
*The principal amount is stated in U.S. dollars unless otherwise indicated.
aNon-income producing.
bSee Note 10 regarding holdings of 5% voting securities.
cSee Note 8 regarding restricted securities.
dAt September 30, 2014, pursuant to the Fund’s policies and the requirements of applicable securities law, the Fund may be restricted from trading these securities for a
limited or extended period of time.
eSecurity was purchased pursuant to Rule 144A under the Securities Act of 1933 and may be sold in transactions exempt from registration only to qualified institutional
buyers or in a public offering registered under the Securities Act of 1933. These securities have been deemed liquid under guidelines approved by the Trust’s Board of
Trustees. At September 30, 2014, the aggregate value of these securities was $19,183,513,748, representing 20.33% of net assets.
fSee Note 1(f) regarding equity-linked securities.
gA portion or all of the security purchased on a when-issued or delayed delivery basis. See Note 1(d).
hIncome may be received in additional securities and/or cash.
iA portion or all of the security is on loan at September 30, 2014. See Note 1(g).
jSee Note 7 regarding defaulted securities.
kPerpetual security with no stated maturity date.
lThe coupon rate shown represents the rate at period end.
mSee Note 1(i) regarding senior floating rate interests.
nSecurity has been deemed illiquid because it may not be able to be sold within seven days. At September 30, 2014, the aggregate value of these securities was $–.
oThe security is traded on a discount basis with no stated coupon rate.
pSee Note 3(f) regarding investments in Institutional Fiduciary Trust Money Market Portfolio.
qSee Note 1(g) regarding securities on loan.
rThe rate shown is the annualized seven-day yield at period end.
98 | Annual Report | The accompanying notes are an integral part of these financial statements. franklintempleton.com
FRANKLIN CUSTODIAN FUNDS
| | | | | | | | | | | | | | | |
| Financial Highlights | | | | | | | | | | | | | | | |
| Franklin U.S. Government Securities Fund | | | | | | | | | | | | | | | |
| | | | | | Year Ended September 30, | | | | |
| | | 2014 | | | 2013 | | | 2012 | | | 2011 | | | 2010 | |
| Class A | | | | | | | | | | | | | | | |
| Per share operating performance | | | | | | | | | | | | | | | |
| (for a share outstanding throughout the year) | | | | | | | | | | | | | | | |
| Net asset value, beginning of year | $ | 6.53 | | $ | 6.91 | | $ | 6.92 | | $ | 6.81 | | $ | 6.69 | |
| Income from investment operationsa: | | | | | | | | | | | | | | | |
| Net investment incomeb | | 0.17 | | | 0.15 | | | 0.20 | | | 0.24 | | | 0.25 | |
| Net realized and unrealized gains (losses) | | 0.01 | | | (0.29 | ) | | 0.04 | | | 0.15 | | | 0.14 | |
| Total from investment operations | | 0.18 | | | (0.14 | ) | | 0.24 | | | 0.39 | | | 0.39 | |
| Less distributions from net investment income | | (0.23 | ) | | (0.24 | ) | | (0.25 | ) | | (0.28 | ) | | (0.27 | ) |
| Net asset value, end of year | $ | 6.48 | | $ | 6.53 | | $ | 6.91 | | $ | 6.92 | | $ | 6.81 | |
| |
| Total returnc | | 2.80 | % | | (2.03 | )% | | 3.49 | % | | 5.93 | % | | 5.94 | % |
| |
| Ratios to average net assets | | | | | | | | | | | | | | | |
| Expenses | | 0.75 | %d | | 0.73 | % | | 0.73 | % | | 0.72 | % | | 0.73 | % |
| Net investment income | | 2.62 | % | | 2.17 | % | | 2.86 | % | | 3.55 | % | | 3.70 | % |
| |
| Supplemental data | | | | | | | | | | | | | | | |
| Net assets, end of year (000’s) | $ | 4,323,990 | | $ | 5,138,613 | | $ | 6,861,193 | | $ | 6,423,821 | | $ | 6,771,471 | |
| Portfolio turnover rate | | 69.73 | % | | 46.16 | % | | 40.15 | % | | 20.23 | % | | 47.41 | % |
| Portfolio turnover rate excluding mortgage dollar rollse | | 38.79 | % | | 40.83 | % | | 40.15 | % | | 20.23 | % | | 47.41 | % |
aThe amount shown for a share outstanding throughout the period may not correlate with the Statement of Operations for the period due to the timing of sales and
repurchases of the Fund shares in relation to income earned and/or fluctuating fair value of the investments of the Fund.
bBased on average daily shares outstanding.
cTotal return does not reflect sales commissions or contingent deferred sales charges, if applicable.
dBenefit of waiver and payments by affiliates and expense reduction rounds to less than 0.01%.
eSee Note 1(h) regarding mortgage dollar rolls.
franklintempleton.com The accompanying notes are an integral part of these financial statements. | Annual Report | 99
| | | | | | | | | | | | | | | |
| FRANKLIN CUSTODIAN FUNDS | | | | | | | | | | | | | | | |
| FINANCIAL HIGHLIGHTS | | | | | | | | | | | | | | | |
| |
| |
| |
| Franklin U.S. Government Securities Fund (continued) | | | | | | | | | | | | | | | |
| | | | | | Year Ended September 30, | | | | |
| | | 2014 | | | 2013 | | | 2012 | | | 2011 | | | 2010 | |
| Class C | | | | | | | | | | | | | | | |
| Per share operating performance | | | | | | | | | | | | | | | |
| (for a share outstanding throughout the year) | | | | | | | | | | | | | | | |
| Net asset value, beginning of year | $ | 6.49 | | $ | 6.86 | | $ | 6.88 | | $ | 6.77 | | $ | 6.66 | |
| Income from investment operationsa: | | | | | | | | | | | | | | | |
| Net investment incomeb | | 0.14 | | | 0.11 | | | 0.16 | | | 0.21 | | | 0.21 | |
| Net realized and unrealized gains (losses) | | 0.01 | | | (0.28 | ) | | 0.03 | | | 0.15 | | | 0.14 | |
| Total from investment operations | | 0.15 | | | (0.17 | ) | | 0.19 | | | 0.36 | | | 0.35 | |
| Less distributions from net investment income | | (0.20 | ) | | (0.20 | ) | | (0.21 | ) | | (0.25 | ) | | (0.24 | ) |
| Net asset value, end of year | $ | 6.44 | | $ | 6.49 | | $ | 6.86 | | $ | 6.88 | | $ | 6.77 | |
| |
| Total returnc | | 2.30 | % | | (2.45 | )% | | 2.85 | % | | 5.44 | % | | 5.28 | % |
| |
| Ratios to average net assets | | | | | | | | | | | | | | | |
| Expenses | | 1.25 | %d | | 1.23 | % | | 1.23 | % | | 1.23 | % | | 1.24 | % |
| Net investment income | | 2.12 | % | | 1.67 | % | | 2.36 | % | | 3.04 | % | | 3.19 | % |
| |
| Supplemental data | | | | | | | | | | | | | | | |
| Net assets, end of year (000’s) | $ | 1,190,720 | | $ | 1,640,787 | | $ | 2,981,724 | | $ | 2,294,707 | | $ | 2,484,847 | |
| Portfolio turnover rate | | 69.73 | % | | 46.16 | % | | 40.15 | % | | 20.23 | % | | 47.41 | % |
| Portfolio turnover rate excluding mortgage dollar rollse | | 38.79 | % | | 40.83 | % | | 40.15 | % | | 20.23 | % | | 47.41 | % |
aThe amount shown for a share outstanding throughout the period may not correlate with the Statement of Operations for the period due to the timing of sales and
repurchases of the Fund shares in relation to income earned and/or fluctuating fair value of the investments of the Fund.
bBased on average daily shares outstanding.
cTotal return does not reflect sales commissions or contingent deferred sales charges, if applicable.
dBenefit of waiver and payments by affiliates and expense reduction rounds to less than 0.01%.
eSee Note 1(h) regarding mortgage dollar rolls.
100 | Annual Report | The accompanying notes are an integral part of these financial statements. franklintempleton.com
| | | | | | | | | | | | | | | |
| | | | | | | | | FRANKLIN CUSTODIAN FUNDS | |
| | | | | | | | | FINANCIAL HIGHLIGHTS | |
| |
| |
| |
| Franklin U.S. Government Securities Fund (continued) | | | | | | | | | | | | | | | |
| | | | | | Year Ended September 30, | | | | |
| | | 2014 | | | 2013 | | | 2012 | | | 2011 | | | 2010 | |
| Class R | | | | | | | | | | | | | | | |
| Per share operating performance | | | | | | | | | | | | | | | |
| (for a share outstanding throughout the year) | | | | | | | | | | | | | | | |
| Net asset value, beginning of year | $ | 6.53 | | $ | 6.90 | | $ | 6.91 | | $ | 6.81 | | $ | 6.69 | |
| Income from investment operationsa: | | | | | | | | | | | | | | | |
| Net investment incomeb | | 0.15 | | | 0.12 | | | 0.17 | | | 0.22 | | | 0.23 | |
| Net realized and unrealized gains (losses) | | 0.01 | | | (0.27 | ) | | 0.04 | | | 0.14 | | | 0.13 | |
| Total from investment operations | | 0.16 | | | (0.15 | ) | | 0.21 | | | 0.36 | | | 0.36 | |
| Less distributions from net investment income | | (0.21 | ) | | (0.22 | ) | | (0.22 | ) | | (0.26 | ) | | (0.24 | ) |
| Net asset value, end of year | $ | 6.48 | | $ | 6.53 | | $ | 6.90 | | $ | 6.91 | | $ | 6.81 | |
| |
| Total return | | 2.44 | % | | (2.27 | )% | | 3.13 | % | | 5.41 | % | | 5.55 | % |
| |
| Ratios to average net assets | | | | | | | | | | | | | | | |
| Expenses | | 1.10 | %c | | 1.08 | % | | 1.08 | % | | 1.08 | % | | 1.09 | % |
| Net investment income | | 2.27 | % | | 1.82 | % | | 2.51 | % | | 3.19 | % | | 3.34 | % |
| |
| Supplemental data | | | | | | | | | | | | | | | |
| Net assets, end of year (000’s) | $ | 74,442 | | $ | 94,110 | | $ | 141,140 | | $ | 131,692 | | $ | 140,147 | |
| Portfolio turnover rate | | 69.73 | % | | 46.16 | % | | 40.15 | % | | 20.23 | % | | 47.41 | % |
| Portfolio turnover rate excluding mortgage dollar rollsd | | 38.79 | % | | 40.83 | % | | 40.15 | % | | 20.23 | % | | 47.41 | % |
aThe amount shown for a share outstanding throughout the period may not correlate with the Statement of Operations for the period due to the timing of sales and
repurchases of the Fund shares in relation to income earned and/or fluctuating fair value of the investments of the Fund.
bBased on average daily shares outstanding.
cBenefit of waiver and payments by affiliates and expense reduction rounds to less than 0.01%.
dSee Note 1(h) regarding mortgage dollar rolls.
franklintempleton.com The accompanying notes are an integral part of these financial statements. | Annual Report | 101
| | | | | | |
| FRANKLIN CUSTODIAN FUNDS | | | | | | |
| FINANCIAL HIGHLIGHTS | | | | | | |
| |
| |
| |
| Franklin U.S. Government Securities Fund (continued) | | | | | | |
| | | Year Ended | |
| | | September 30, | |
| | | 2014 | | | 2013 | a |
| Class R6 | | | | | | |
| Per share operating performance | | | | | | |
| (for a share outstanding throughout the year) | | | | | | |
| Net asset value, beginning of year | $ | 6.55 | | $ | 6.76 | |
| Income from investment operationsb: | | | | | | |
| Net investment incomec | | 0.19 | | | 0.07 | |
| Net realized and unrealized gains (losses) | | 0.01 | | | (0.17 | ) |
| Total from investment operations | | 0.20 | | | (0.10 | ) |
| Less distributions from net investment income | | (0.25 | ) | | (0.11 | ) |
| Net asset value, end of year | $ | 6.50 | | $ | 6.55 | |
| |
| Total returnd | | 3.08 | % | | (1.53 | )% |
| |
| Ratios to average net assetse | | | | | | |
| Expenses | | 0.47 | %f | | 0.46 | % |
| Net investment income | | 2.90 | % | | 2.44 | % |
| |
| Supplemental data | | | | | | |
| Net assets, end of year (000’s) | $ | 497,246 | | $ | 480,590 | |
| Portfolio turnover rate | | 69.73 | % | | 46.16 | % |
| Portfolio turnover rate excluding mortgage dollar rollsg | | 38.79 | % | | 40.83 | % |
aFor the period May 1, 2013 (effective date) to September 30, 2013.
bThe amount shown for a share outstanding throughout the period may not correlate with the Statement of Operations for the period due to the timing of sales and
repurchases of the Fund shares in relation to income earned and/or fluctuating fair value of the investments of the Fund.
cBased on average daily shares outstanding.
dTotal return is not annualized for periods less than one year.
eRatios are annualized for periods less than one year.
fBenefit of waiver and payments by affiliates and expense reduction rounds to less than 0.01%.
gSee Note 1(h) regarding mortgage dollar rolls.
102 | Annual Report | The accompanying notes are an integral part of these financial statements. franklintempleton.com
| | | | | | | | | | | | | | | |
| | | | | | | | | FRANKLIN CUSTODIAN FUNDS | |
| | | | | | | | | FINANCIAL HIGHLIGHTS | |
| |
| |
| |
| Franklin U.S. Government Securities Fund (continued) | | | | | | | | | | | | | | | |
| | | | | | Year Ended September 30, | | | | |
| | | 2014 | | | 2013 | | | 2012 | | | 2011 | | | 2010 | |
| Advisor Class | | | | | | | | | | | | | | | |
| Per share operating performance | | | | | | | | | | | | | | | |
| (for a share outstanding throughout the year) | | | | | | | | | | | | | | | |
| Net asset value, beginning of year | $ | 6.55 | | $ | 6.93 | | $ | 6.94 | | $ | 6.83 | | $ | 6.71 | |
| Income from investment operationsa: | | | | | | | | | | | | | | | |
| Net investment incomeb | | 0.18 | | | 0.16 | | | 0.21 | | | 0.25 | | | 0.26 | |
| Net realized and unrealized gains (losses) | | 0.01 | | | (0.29 | ) | | 0.04 | | | 0.15 | | | 0.14 | |
| Total from investment operations | | 0.19 | | | (0.13 | ) | | 0.25 | | | 0.40 | | | 0.40 | |
| Less distributions from net investment income | | (0.24 | ) | | (0.25 | ) | | (0.26 | ) | | (0.29 | ) | | (0.28 | ) |
| Net asset value, end of year | $ | 6.50 | | $ | 6.55 | | $ | 6.93 | | $ | 6.94 | | $ | 6.83 | |
| |
| Total return | | 2.94 | % | | (1.86 | )% | | 3.63 | % | | 6.08 | % | | 6.06 | % |
| |
| Ratios to average net assets | | | | | | | | | | | | | | | |
| Expenses | | 0.60 | %c | | 0.58 | % | | 0.58 | % | | 0.58 | % | | 0.59 | % |
| Net investment income | | 2.77 | % | | 2.32 | % | | 3.01 | % | | 3.69 | % | | 3.84 | % |
| |
| Supplemental data | | | | | | | | | | | | | | | |
| Net assets, end of year (000’s) | $ | 652,737 | | $ | 949,085 | | $ | 1,586,928 | | $ | 1,478,504 | | $ | 1,193,213 | |
| Portfolio turnover rate | | 69.73 | % | | 46.16 | % | | 40.15 | % | | 20.23 | % | | 47.41 | % |
| Portfolio turnover rate excluding mortgage dollar rollsd | | 38.79 | % | | 40.83 | % | | 40.15 | % | | 20.23 | % | | 47.41 | % |
aThe amount shown for a share outstanding throughout the period may not correlate with the Statement of Operations for the period due to the timing of sales and
repurchases of the Fund shares in relation to income earned and/or fluctuating fair value of the investments of the Fund.
bBased on average daily shares outstanding.
cBenefit of waiver and payments by affiliates and expense reduction rounds to less than 0.01%.
dSee Note 1(h) regarding mortgage dollar rolls.
franklintempleton.com The accompanying notes are an integral part of these financial statements. | Annual Report | 103
| | | | |
| FRANKLIN CUSTODIAN FUNDS | | | | |
| |
| |
| |
| |
| Statement of Investments, September 30, 2014 | | | | |
| |
| Franklin U.S. Government Securities Fund | | | | |
| | | Principal | | |
| | | Amount | | Value |
| Mortgage-Backed Securities 101.1% | | | | |
| aGovernment National Mortgage Association (GNMA) Adjustable Rate 2.6% | | | | |
| GNMA, 1.625%, 9/20/27 - 6/20/35 | $ | 64,128,760 | $ | 66,658,421 |
| GNMA, 1.625%, 7/20/35 - 3/20/40 | | 62,993,057 | | 65,552,370 |
| GNMA, 1.625% - 4.00%, 10/20/37 - 2/20/42 | | 40,000,224 | | 41,637,899 |
| | | | | 173,848,690 |
| Government National Mortgage Association (GNMA) Fixed Rate 98.5% | | | | |
| GNMA GP 30 Year, 8.25%, 3/15/17 - 5/15/17 | | 19,458 | | 19,546 |
| GNMA GP 30 Year, 9.25%, 5/15/16 - 12/15/16 | | 59,837 | | 60,567 |
| GNMA GP 30 Year, 11.25%, 10/15/15 - 12/15/15 | | 11,667 | | 11,737 |
| GNMA I SF 15 Year, 6.50%, 5/15/18 | | 98,331 | | 101,987 |
| GNMA I SF 30 Year, 3.50%, 4/15/43 - 5/15/43 | | 47,685,163 | | 49,640,275 |
| GNMA I SF 30 Year, 4.00%, 3/15/39 - 12/15/40 | | 63,207,609 | | 67,278,113 |
| GNMA I SF 30 Year, 4.00%, 1/15/41 - 9/15/41 | | 8,777,826 | | 9,387,796 |
| GNMA I SF 30 Year, 4.50%, 2/15/39 - 6/15/39 | | 57,146,635 | | 62,611,454 |
| GNMA I SF 30 Year, 4.50%, 6/15/39 - 10/15/39 | | 58,486,256 | | 63,641,547 |
| GNMA I SF 30 Year, 4.50%, 10/15/39 - 1/15/40 | | 51,752,060 | | 56,485,681 |
| GNMA I SF 30 Year, 4.50%, 1/15/40 - 4/15/40 | | 55,559,138 | | 60,536,610 |
| GNMA I SF 30 Year, 4.50%, 4/15/40 - 6/15/40 | | 53,745,432 | | 58,516,182 |
| GNMA I SF 30 Year, 4.50%, 6/15/40 | | 38,266,603 | | 41,814,427 |
| GNMA I SF 30 Year, 4.50%, 6/15/40 - 7/15/40 | | 46,454,455 | | 50,863,848 |
| GNMA I SF 30 Year, 4.50%, 7/15/40 | | 33,788,712 | | 36,770,768 |
| GNMA I SF 30 Year, 4.50%, 7/15/40 | | 33,686,255 | | 36,864,439 |
| GNMA I SF 30 Year, 4.50%, 7/15/40 - 8/15/40 | | 50,226,196 | | 54,703,535 |
| GNMA I SF 30 Year, 4.50%, 8/15/40 - 4/15/41 | | 61,423,936 | | 66,914,006 |
| GNMA I SF 30 Year, 4.50%, 4/15/41 - 6/15/41 | | 32,888,995 | | 36,103,773 |
| GNMA I SF 30 Year, 5.00%, 2/15/33 - 9/15/33 | | 60,106,490 | | 66,667,584 |
| GNMA I SF 30 Year, 5.00%, 9/15/33 - 12/15/33 | | 60,388,560 | | 66,949,666 |
| GNMA I SF 30 Year, 5.00%, 12/15/33 - 8/15/35 | | 59,973,334 | | 66,346,251 |
| GNMA I SF 30 Year, 5.00%, 8/15/35 - 7/15/39 | | 58,254,257 | | 64,402,653 |
| GNMA I SF 30 Year, 5.00%, 7/15/39 - 8/15/39 | | 18,516,771 | | 20,469,214 |
| GNMA I SF 30 Year, 5.00%, 8/15/39 - 9/15/39 | | 58,320,369 | | 64,641,420 |
| GNMA I SF 30 Year, 5.00%, 9/15/39 - 10/15/39 | | 60,017,993 | | 66,487,155 |
| GNMA I SF 30 Year, 5.00%, 10/15/39 | | 49,197,587 | | 54,545,300 |
| GNMA I SF 30 Year, 5.00%, 10/15/39 - 11/15/39 | | 56,443,163 | | 62,656,596 |
| GNMA I SF 30 Year, 5.00%, 11/15/39 | | 25,104,743 | | 27,864,743 |
| GNMA I SF 30 Year, 5.00%, 11/15/39 - 12/15/39 | | 59,327,104 | | 65,846,326 |
| GNMA I SF 30 Year, 5.00%, 12/15/39 - 2/15/40 | | 59,360,681 | | 65,791,686 |
| GNMA I SF 30 Year, 5.00%, 2/15/40 - 3/15/40 | | 51,148,356 | | 56,799,115 |
| GNMA I SF 30 Year, 5.00%, 3/15/40 - 5/15/40 | | 58,029,673 | | 64,365,497 |
| GNMA I SF 30 Year, 5.00%, 5/15/40 - 6/15/40 | | 59,299,938 | | 65,826,105 |
| GNMA I SF 30 Year, 5.00%, 6/15/40 | | 38,772,065 | | 43,040,947 |
| GNMA I SF 30 Year, 5.00%, 9/15/40 | | 51,139,993 | | 56,769,890 |
| GNMA I SF 30 Year, 5.50%, 5/15/28 - 4/15/33 | | 60,144,742 | | 67,301,703 |
| GNMA I SF 30 Year, 5.50%, 4/15/33 - 7/15/33 | | 60,140,408 | | 67,300,054 |
| GNMA I SF 30 Year, 5.50%, 7/15/33 - 3/15/35 | | 59,495,088 | | 66,660,174 |
| GNMA I SF 30 Year, 5.50%, 3/15/35 - 2/15/38 | | 59,730,128 | | 66,786,770 |
| GNMA I SF 30 Year, 5.50%, 5/15/38 - 1/15/39 | | 51,186,345 | | 57,050,764 |
| GNMA I SF 30 Year, 5.50%, 2/15/39 - 12/15/39 | | 59,745,882 | | 66,576,847 |
| GNMA I SF 30 Year, 5.50%, 2/15/40 | | 4,250,913 | | 4,767,526 |
| GNMA I SF 30 Year, 6.00%, 10/15/23 - 8/15/32 | | 58,837,245 | | 67,354,734 |
| GNMA I SF 30 Year, 6.00%, 8/15/32 - 11/15/35 | | 56,361,377 | | 64,873,741 |
| |
| |
| 104 | Annual Report | | franklintempleton.com |
FRANKLIN CUSTODIAN FUNDS
STATEMENT OF INVESTMENTS
| | | | |
| Franklin U.S. Government Securities Fund (continued) | | | | |
| | | Principal | | |
| | | Amount | | Value |
| Mortgage-Backed Securities (continued) | | | | |
| Government National Mortgage Association (GNMA) Fixed Rate (continued) | | | | |
| GNMA I SF 30 Year, 6.00%, 12/15/35 - 1/15/37 | $ | 58,041,399 | $ | 67,001,161 |
| GNMA I SF 30 Year, 6.00%, 1/15/37 - 12/15/37 | | 58,888,439 | | 67,018,817 |
| GNMA I SF 30 Year, 6.00%, 12/15/37 - 11/15/38 | | 43,237,996 | | 48,966,848 |
| GNMA I SF 30 Year, 6.00%, 11/15/38 - 12/15/39 | | 43,624,227 | | 49,197,430 |
| GNMA I SF 30 Year, 6.50%, 5/15/23 - 11/15/31 | | 59,122,793 | | 67,327,579 |
| GNMA I SF 30 Year, 6.50%, 11/15/31 - 8/15/37 | | 33,799,235 | | 38,854,218 |
| GNMA I SF 30 Year, 6.75%, 3/15/26 | | 11,720 | | 13,291 |
| GNMA I SF 30 Year, 7.00%, 4/15/26 - 5/15/32 | | 60,200,309 | | 67,273,631 |
| GNMA I SF 30 Year, 7.00%, 5/15/32 - 9/15/32 | | 2,927,522 | | 3,385,924 |
| GNMA I SF 30 Year, 7.25%, 12/15/25 - 1/15/26 | | 290,190 | | 315,590 |
| GNMA I SF 30 Year, 7.50%, 7/15/16 - 8/15/33 | | 20,135,590 | | 22,361,891 |
| GNMA I SF 30 Year, 7.70%, 1/15/21 - 1/15/22 | | 129,580 | | 130,528 |
| GNMA I SF 30 Year, 8.00%, 11/15/15 - 9/15/30 | | 10,087,429 | | 10,702,551 |
| GNMA I SF 30 Year, 8.50%, 6/15/16 - 5/15/25 | | 2,132,440 | | 2,283,483 |
| GNMA I SF 30 Year, 9.00%, 11/15/15 - 7/15/23 | | 2,522,073 | | 2,658,133 |
| GNMA I SF 30 Year, 9.50%, 5/15/16 - 8/15/22 | | 1,912,024 | | 1,973,530 |
| GNMA I SF 30 Year, 10.00%, 2/15/16 - 3/15/25 | | 1,932,936 | | 2,008,488 |
| GNMA I SF 30 Year, 10.50%, 9/15/15 - 10/15/21 | | 1,176,076 | | 1,220,870 |
| GNMA I SF 30 Year, 11.00%, 7/15/15 - 5/15/21 | | 317,969 | | 326,809 |
| GNMA I SF 30 Year, 11.50%, 9/15/15 - 2/15/16 | | 26,952 | | 27,227 |
| GNMA I SF 30 Year, 12.00%, 1/15/15 - 12/15/15 | | 87,842 | | 88,349 |
| GNMA I SF 30 Year, 12.50%, 12/15/14 - 10/15/15 | | 33,336 | | 33,509 |
| GNMA I SF 30 Year, 13.00%, 10/15/14 - 9/15/15 | | 10,874 | | 10,923 |
| GNMA II GP 30 Year, 8.75%, 3/20/17 - 7/20/17 | | 14,100 | | 14,235 |
| GNMA II SF 30 Year, 3.50%, 10/20/40 - 6/20/42 | | 28,702,572 | | 29,733,025 |
| GNMA II SF 30 Year, 3.50%, 7/20/42 | | 118,236,585 | | 122,481,147 |
| GNMA II SF 30 Year, 3.50%, 8/20/42 | | 43,818,245 | | 45,411,551 |
| GNMA II SF 30 Year, 3.50%, 9/20/42 | | 254,440,285 | | 263,574,541 |
| GNMA II SF 30 Year, 3.50%, 10/20/42 | | 53,055,950 | | 54,960,631 |
| GNMA II SF 30 Year, 3.50%, 11/20/42 - 2/20/43 | | 61,140,777 | | 63,361,315 |
| GNMA II SF 30 Year, 3.50%, 2/20/43 - 3/20/43 | | 18,258,510 | | 18,909,509 |
| GNMA II SF 30 Year, 3.50%, 4/20/43 - 5/20/43 | | 59,045,195 | | 61,157,054 |
| GNMA II SF 30 Year, 3.50%, 5/20/43 | | 73,241,685 | | 75,858,359 |
| GNMA II SF 30 Year, 3.50%, 6/20/43 | | 84,450,593 | | 87,467,722 |
| GNMA II SF 30 Year, 3.50%, 8/20/43 - 12/20/43 | | 62,605,460 | | 64,842,138 |
| GNMA II SF 30 Year, 3.50%, 1/20/44 - 3/20/44 | | 42,995,706 | | 44,531,795 |
| GNMA II SF 30 Year, 3.50%, 4/20/44 | | 53,229,780 | | 55,131,497 |
| GNMA II SF 30 Year, 3.50%, 5/20/44 | | 49,156,118 | | 50,912,297 |
| GNMA II SF 30 Year, 3.50%, 6/20/44 | | 49,552,656 | | 51,323,002 |
| GNMA II SF 30 Year, 3.50%, 8/20/44 | | 44,906,710 | | 46,554,817 |
| GNMA II SF 30 Year, 4.00%, 5/20/40 - 7/20/40 | | 4,505,318 | | 4,794,198 |
| bGNMA II SF 30 Year, 4.00%, 10/01/40 | | 166,000,000 | | 175,934,041 |
| GNMA II SF 30 Year, 4.00%, 10/20/40 | | 23,676,347 | | 25,204,414 |
| GNMA II SF 30 Year, 4.00%, 11/20/40 | | 84,153,935 | | 89,593,864 |
| GNMA II SF 30 Year, 4.00%, 12/20/40 | | 49,113,599 | | 52,288,407 |
| GNMA II SF 30 Year, 4.00%, 1/20/41 - 6/20/41 | | 53,877,684 | | 57,364,565 |
| GNMA II SF 30 Year, 4.00%, 7/20/41 | | 73,057,488 | | 77,670,990 |
| GNMA II SF 30 Year, 4.00%, 9/20/41 | | 83,947,643 | | 89,201,215 |
franklintempleton.com Annual Report | 105
| | | | |
| FRANKLIN CUSTODIAN FUNDS | | | | |
| STATEMENT OF INVESTMENTS | | | | |
| |
| |
| |
| |
| Franklin U.S. Government Securities Fund (continued) | | | | |
| | | Principal | | |
| | | Amount | | Value |
| Mortgage-Backed Securities (continued) | | | | |
| Government National Mortgage Association (GNMA) Fixed Rate (continued) | | | | |
| GNMA II SF 30 Year, 4.00%, 10/20/41 | $ | 100,403,809 | $ | 106,667,847 |
| GNMA II SF 30 Year, 4.00%, 11/20/41 | | 89,549,563 | | 95,133,434 |
| GNMA II SF 30 Year, 4.00%, 2/20/44 | | 57,095,006 | | 61,168,766 |
| GNMA II SF 30 Year, 4.00%, 6/20/44 | | 127,850,001 | | 135,814,239 |
| GNMA II SF 30 Year, 4.00%, 7/20/44 | | 73,510,842 | | 78,090,097 |
| GNMA II SF 30 Year, 4.00%, 8/20/44 | | 110,017,333 | | 116,870,710 |
| GNMA II SF 30 Year, 4.50%, 5/20/33 - 11/20/39 | | 44,912,867 | | 48,961,492 |
| GNMA II SF 30 Year, 4.50%, 12/20/39 | | 62,544,913 | | 68,105,917 |
| GNMA II SF 30 Year, 4.50%, 1/20/40 - 6/20/40 | | 44,531,856 | | 48,497,573 |
| GNMA II SF 30 Year, 4.50%, 7/20/40 | | 24,995,571 | | 27,254,759 |
| GNMA II SF 30 Year, 4.50%, 5/20/41 | | 81,406,948 | | 88,708,679 |
| GNMA II SF 30 Year, 4.50%, 6/20/41 | | 24,206,988 | | 26,371,403 |
| GNMA II SF 30 Year, 4.50%, 6/20/41 | | 99,107,647 | | 107,969,140 |
| GNMA II SF 30 Year, 4.50%, 7/20/41 | | 105,083,947 | | 114,450,198 |
| GNMA II SF 30 Year, 4.50%, 8/20/41 | | 13,107,477 | | 14,272,070 |
| GNMA II SF 30 Year, 4.50%, 9/20/41 | | 136,854,705 | | 148,975,648 |
| GNMA II SF 30 Year, 4.50%, 10/20/41 | | 102,217,182 | | 111,258,196 |
| GNMA II SF 30 Year, 4.50%, 8/20/42 | | 5,058,845 | | 5,515,084 |
| GNMA II SF 30 Year, 4.50%, 2/20/44 | | 70,134,919 | | 76,245,378 |
| GNMA II SF 30 Year, 5.00%, 7/20/33 - 9/20/33 | | 53,568,806 | | 60,051,204 |
| GNMA II SF 30 Year, 5.00%, 10/20/33 - 12/20/35 | | 57,295,625 | | 63,893,821 |
| GNMA II SF 30 Year, 5.00%, 1/20/36 - 12/20/39 | | 55,538,028 | | 61,762,930 |
| GNMA II SF 30 Year, 5.00%, 4/20/40 - 5/20/40 | | 37,402,009 | | 41,618,830 |
| GNMA II SF 30 Year, 5.00%, 6/20/40 - 9/20/41 | | 46,969,603 | | 52,270,992 |
| GNMA II SF 30 Year, 5.50%, 6/20/34 - 11/20/34 | | 49,940,021 | | 56,718,358 |
| GNMA II SF 30 Year, 5.50%, 12/20/34 - 1/20/35 | | 49,775,774 | | 56,537,000 |
| GNMA II SF 30 Year, 5.50%, 2/20/35 - 2/20/36 | | 51,620,551 | | 58,625,031 |
| GNMA II SF 30 Year, 5.50%, 4/20/36 - 4/20/40 | | 45,791,048 | | 51,775,798 |
| GNMA II SF 30 Year, 6.00%, 10/20/23 - 5/20/35 | | 58,439,131 | | 67,032,695 |
| GNMA II SF 30 Year, 6.00%, 6/20/35 - 1/20/38 | | 53,793,654 | | 60,965,549 |
| GNMA II SF 30 Year, 6.00%, 7/20/38 - 7/20/39 | | 31,476,268 | | 35,508,620 |
| GNMA II SF 30 Year, 6.50%, 6/20/24 - 1/20/39 | | 48,661,458 | | 55,496,216 |
| GNMA II SF 30 Year, 7.00%, 2/20/28 - 7/20/33 | | 9,544,659 | | 11,365,743 |
| GNMA II SF 30 Year, 7.50%, 10/20/22 - 4/20/32 | | 2,341,121 | | 2,765,439 |
| GNMA II SF 30 Year, 8.00%, 8/20/16 - 6/20/30 | | 1,142,028 | | 1,359,987 |
| GNMA II SF 30 Year, 8.50%, 4/20/16 - 6/20/25 | | 447,023 | | 479,778 |
| GNMA II SF 30 Year, 9.00%, 8/20/16 - 11/20/21 | | 99,342 | | 108,128 |
| GNMA II SF 30 Year, 9.50%, 3/20/18 - 4/20/25 | | 115,216 | | 125,923 |
| GNMA II SF 30 Year, 10.00%, 8/20/15 - 3/20/21 | | 170,901 | | 191,424 |
| GNMA II SF 30 Year, 10.50% 8/20/15 - 1/20/21 | | 297,250 | | 311,181 |
| GNMA II SF 30 Year, 11.00%, 10/20/15 - 1/20/21 | | 54,960 | | 55,717 |
| GNMA II SF 30 Year, 11.50%, 7/20/15 - 1/20/18 | | 6,028 | | 6,163 |
| GNMA II SF 30 Year, 12.00%, 2/20/15 - 12/20/15 | | 7,744 | | 7,812 |
| GNMA II SF 30 Year, 12.50%, 5/20/15 - 11/20/15 | | 2,176 | | 2,198 |
| GNMA II SF 30 Year, 13.00%, 3/20/15 | | 338 | | 340 |
| | | | | 6,641,293,368 |
| Total Mortgage-Backed Securities (Cost $6,571,262,713) | | | | 6,815,142,058 |
| |
| |
| |
| |
| 106 | Annual Report | | franklintempleton.com |
FRANKLIN CUSTODIAN FUNDS
STATEMENT OF INVESTMENTS
| | | | |
| Franklin U.S. Government Securities Fund (continued) | | | | |
| | Shares | | Value | |
| Short Term Investments (Cost $93,769,881) 1.4% | | | | |
| Money Market Funds 1.4% | | | | |
| c,dInstitutional Fiduciary Trust Money Market Portfolio | 93,769,881 | $ | 93,769,881 | |
| Total Investments (Cost $6,665,032,594) 102.5% | | | 6,908,911,939 | |
| Other Assets, less Liabilities (2.5)% | | | (169,776,089 | ) |
| Net Assets 100.0% | | $ | 6,739,135,850 | |
See Abbreviations on page 143.
aThe coupon rate shown represents the rate at period end.
bSecurity purchased on a to-be-announced (TBA) basis. See Note 1(d).
cNon-income producing.
dSee Note 3(f) regarding investments in Institutional Fiduciary Trust Money Market Portfolio.
franklintempleton.com The accompanying notes are an integral part of these financial statements. | Annual Report | 107
FRANKLIN CUSTODIAN FUNDS
| | | | | | | | | | | | | | | |
| Financial Highlights | | | | | | | | | | | | | | | |
| Franklin Utilities Fund | | | | | | | | | | | | | | | |
| | | | | | Year Ended September 30, | | | | |
| | | 2014 | | | 2013 | | | 2012 | | | 2011 | | | 2010 | |
| Class A | | | | | | | | | | | | | | | |
| Per share operating performance | | | | | | | | | | | | | | | |
| (for a share outstanding throughout the year) | | | | | | | | | | | | | | | |
| Net asset value, beginning of year | $ | 14.62 | | $ | 14.04 | | $ | 12.42 | | $ | 11.44 | | $ | 10.74 | |
| Income from investment operationsa: | | | | | | | | | | | | | | | |
| Net investment incomeb | | 0.49 | | | 0.49 | | | 0.48 | | | 0.44 | | | 0.43 | |
| Net realized and unrealized gains (losses) | | 2.00 | | | 0.60 | | | 1.60 | | | 0.97 | | | 0.88 | |
| Total from investment operations | | 2.49 | | | 1.09 | | | 2.08 | | | 1.41 | | | 1.31 | |
| Less distributions from: | | | | | | | | | | | | | | | |
| Net investment income | | (0.49 | ) | | (0.51 | ) | | (0.46 | ) | | (0.43 | ) | | (0.45 | ) |
| Net realized gains | | (0.04 | ) | | — | | | — | | | — | | | (0.16 | ) |
| Total distributions | | (0.53 | ) | | (0.51 | ) | | (0.46 | ) | | (0.43 | ) | | (0.61 | ) |
| Net asset value, end of year | $ | 16.58 | | $ | 14.62 | | $ | 14.04 | | $ | 12.42 | | $ | 11.44 | |
| |
| Total returnc | | 17.24 | % | | 7.92 | % | | 16.99 | % | | 12.50 | % | | 12.69 | % |
| |
| Ratios to average net assets | | | | | | | | | | | | | | | |
| Expenses | | 0.75 | %d,e | | 0.75 | %e | | 0.76 | % | | 0.76 | % | | 0.78 | % |
| Net investment income | | 3.05 | % | | 3.34 | % | | 3.61 | % | | 3.67 | % | | 3.91 | % |
| |
| Supplemental data | | | | | | | | | | | | | | | |
| Net assets, end of year (000’s) | $ | 3,717,397 | | $ | 3,275,129 | | $ | 3,076,131 | | $ | 2,220,083 | | $ | 1,823,972 | |
| Portfolio turnover rate | | 8.10 | % | | 4.57 | % | | 1.27 | % | | 5.21 | % | | 5.27 | % |
aThe amount shown for a share outstanding throughout the period may not correlate with the Statement of Operations for the period due to the timing of sales and
repurchases of the Fund shares in relation to income earned and/or fluctuating fair value of the investments of the Fund.
bBased on average daily shares outstanding.
cTotal return does not reflect sales commissions or contingent deferred sales charges, if applicable.
dBenefit of waiver and payments by affiliates rounds to less than 0.01%.
eBenefit of expense reduction rounds to less than 0.01%.
108 | Annual Report | The accompanying notes are an integral part of these financial statements. franklintempleton.com
FRANKLIN CUSTODIAN FUNDS
FINANCIAL HIGHLIGHTS
| | | | | | | | | | | | | | | |
| Franklin Utilities Fund (continued) | | | | | | | | | | | | | | | |
| | | | | | Year Ended September 30, | | | | |
| | | 2014 | | | 2013 | | | 2012 | | | 2011 | | | 2010 | |
| Class C | | | | | | | | | | | | | | | |
| Per share operating performance | | | | | | | | | | | | | | | |
| (for a share outstanding throughout the year) | | | | | | | | | | | | | | | |
| Net asset value, beginning of year | $ | 14.56 | | $ | 13.98 | | $ | 12.37 | | $ | 11.40 | | $ | 10.71 | |
| Income from investment operationsa: | | | | | | | | | | | | | | | |
| Net investment incomeb | | 0.41 | | | 0.41 | | | 0.42 | | | 0.38 | | | 0.37 | |
| Net realized and unrealized gains (losses) | | 1.98 | | | 0.61 | | | 1.58 | | | 0.96 | | | 0.88 | |
| Total from investment operations | | 2.39 | | | 1.02 | | | 2.00 | | | 1.34 | | | 1.25 | |
| Less distributions from: | | | | | | | | | | | | | | | |
| Net investment income | | (0.41 | ) | | (0.44 | ) | | (0.39 | ) | | (0.37 | ) | | (0.40 | ) |
| Net realized gains | | (0.04 | ) | | — | | | — | | | — | | | (0.16 | ) |
| Total distributions | | (0.45 | ) | | (0.44 | ) | | (0.39 | ) | | (0.37 | ) | | (0.56 | ) |
| Net asset value, end of year | $ | 16.50 | | $ | 14.56 | | $ | 13.98 | | $ | 12.37 | | $ | 11.40 | |
| |
| Total returnc | | 16.61 | % | | 7.40 | % | | 16.32 | % | | 12.00 | % | | 12.08 | % |
| |
| Ratios to average net assets | | | | | | | | | | | | | | | |
| Expenses | | 1.25 | %d,e | | 1.25 | %e | | 1.26 | % | | 1.26 | % | | 1.28 | % |
| Net investment income | | 2.55 | % | | 2.84 | % | | 3.11 | % | | 3.17 | % | | 3.41 | % |
| |
| Supplemental data | | | | | | | | | | | | | | | |
| Net assets, end of year (000’s) | $ | 986,318 | | $ | 845,173 | | $ | 774,711 | | $ | 528,391 | | $ | 405,024 | |
| Portfolio turnover rate | | 8.10 | % | | 4.57 | % | | 1.27 | % | | 5.21 | % | | 5.27 | % |
aThe amount shown for a share outstanding throughout the period may not correlate with the Statement of Operations for the period due to the timing of sales and
repurchases of the Fund shares in relation to income earned and/or fluctuating fair value of the investments of the Fund.
bBased on average daily shares outstanding.
cTotal return does not reflect sales commissions or contingent deferred sales charges, if applicable.
dBenefit of waiver and payments by affiliates rounds to less than 0.01%.
eBenefit of expense reduction rounds to less than 0.01%.
franklintempleton.com The accompanying notes are an integral part of these financial statements. | Annual Report | 109
| | | | | | | | | | | | | | | |
| FRANKLIN CUSTODIAN FUNDS | | | | | | | | | | | | | | | |
| FINANCIAL HIGHLIGHTS | | | | | | | | | | | | | | | |
| |
| |
| |
| Franklin Utilities Fund (continued) | | | | | | | | | | | | | | | |
| | | | | | Year Ended September 30, | | | | |
| | | 2014 | | | 2013 | | | 2012 | | | 2011 | | | 2010 | |
| Class R | | | | | | | | | | | | | | | |
| Per share operating performance | | | | | | | | | | | | | | | |
| (for a share outstanding throughout the year) | | | | | | | | | | | | | | | |
| Net asset value, beginning of year | $ | 14.58 | | $ | 14.00 | | $ | 12.39 | | $ | 11.41 | | $ | 10.71 | |
| Income from investment operationsa: | | | | | | | | | | | | | | | |
| Net investment incomeb | | 0.43 | | | 0.44 | | | 0.44 | | | 0.40 | | | 0.39 | |
| Net realized and unrealized gains (losses) | | 1.99 | | | 0.60 | | | 1.58 | | | 0.97 | | | 0.88 | |
| Total from investment operations | | 2.42 | | | 1.04 | | | 2.02 | | | 1.37 | | | 1.27 | |
| Less distributions from: | | | | | | | | | | | | | | | |
| Net investment income | | (0.44 | ) | | (0.46 | ) | | (0.41 | ) | | (0.39 | ) | | (0.41 | ) |
| Net realized gains | | (0.04 | ) | | — | | | — | | | — | | | (0.16 | ) |
| Total distributions | | (0.48 | ) | | (0.46 | ) | | (0.41 | ) | | (0.39 | ) | | (0.57 | ) |
| Net asset value, end of year | $ | 16.52 | | $ | 14.58 | | $ | 14.00 | | $ | 12.39 | | $ | 11.41 | |
| |
| Total return | | 16.75 | % | | 7.56 | % | | 16.55 | % | | 12.14 | % | | 12.33 | % |
| |
| Ratios to average net assets | | | | | | | | | | | | | | | |
| Expenses | | 1.10 | %c,d | | 1.10 | %d | | 1.11 | % | | 1.11 | % | | 1.13 | % |
| Net investment income | | 2.70 | % | | 2.99 | % | | 3.26 | % | | 3.32 | % | | 3.56 | % |
| |
| Supplemental data | | | | | | | | | | | | | | | |
| Net assets, end of year (000’s) | $ | 95,498 | | $ | 86,216 | | $ | 80,478 | | $ | 51,732 | | $ | 42,285 | |
| Portfolio turnover rate | | 8.10 | % | | 4.57 | % | | 1.27 | % | | 5.21 | % | | 5.27 | % |
aThe amount shown for a share outstanding throughout the period may not correlate with the Statement of Operations for the period due to the timing of sales and
repurchases of the Fund shares in relation to income earned and/or fluctuating fair value of the investments of the Fund.
bBased on average daily shares outstanding.
cBenefit of waiver and payments by affiliates rounds to less than 0.01%.
dBenefit of expense reduction rounds to less than 0.01%.
110 | Annual Report | The accompanying notes are an integral part of these financial statements. franklintempleton.com
FRANKLIN CUSTODIAN FUNDS
FINANCIAL HIGHLIGHTS
| | | | | | |
| Franklin Utilities Fund (continued) | | | | | | |
| | | Year Ended | |
| | | September 30, | |
| | | 2014 | | | 2013 | a |
| Class R6 | | | | | | |
| Per share operating performance | | | | | | |
| (for a share outstanding throughout the year) | | | | | | |
| Net asset value, beginning of year | $ | 14.71 | | $ | 15.88 | |
| Income from investment operationsb: | | | | | | |
| Net investment incomec | | 0.53 | | | 0.25 | |
| Net realized and unrealized gains (losses) | | 2.01 | | | (1.17 | ) |
| Total from investment operations | | 2.54 | | | (0.92 | ) |
| Less distributions from: | | | | | | |
| Net investment income | | (0.53 | ) | | (0.25 | ) |
| Net realized gains | | (0.04 | ) | | — | |
| Total distributions | | (0.57 | ) | | (0.25 | ) |
| Net asset value, end of year | $ | 16.68 | | $ | 14.71 | |
| |
| Total returnd | | 17.51 | % | | (5.79 | )% |
| |
| Ratios to average net assetse | | | | | | |
| Expenses | | 0.48 | %f,g | | 0.48 | %g |
| Net investment income | | 3.32 | % | | 3.61 | % |
| |
| Supplemental data | | | | | | |
| Net assets, end of year (000’s) | $ | 236,437 | | $ | 218,746 | |
| Portfolio turnover rate | | 8.10 | % | | 4.57 | % |
aFor the period May 1, 2013 (effective date) to September 30, 2013.
bThe amount shown for a share outstanding throughout the period may not correlate with the Statement of Operations for the period due to the timing of sales and
repurchases of the Fund shares in relation to income earned and/or fluctuating fair value of the investments of the Fund.
cBased on average daily shares outstanding.
dTotal return is not annualized for periods less than one year.
eRatios are annualized for periods less than one year.
fBenefit of waiver and payments by affiliates rounds to less than 0.01%.
gBenefit of expense reduction rounds to less than 0.01%.
franklintempleton.com The accompanying notes are an integral part of these financial statements. | Annual Report | 111
| | | | | | | | | | | | | | | |
| FRANKLIN CUSTODIAN FUNDS | | | | | | | | | | | | | | | |
| FINANCIAL HIGHLIGHTS | | | | | | | | | | | | | | | |
| |
| |
| |
| Franklin Utilities Fund (continued) | | | | | | | | | | | | | | | |
| | | | | | Year Ended September 30, | | | | |
| | | 2014 | | | 2013 | | | 2012 | | | 2011 | | | 2010 | |
| Advisor Class | | | | | | | | | | | | | | | |
| Per share operating performance | | | | | | | | | | | | | | | |
| (for a share outstanding throughout the year) | | | | | | | | | | | | | | | |
| Net asset value, beginning of year | $ | 14.71 | | $ | 14.12 | | $ | 12.49 | | $ | 11.50 | | $ | 10.79 | |
| Income from investment operationsa: | | | | | | | | | | | | | | | |
| Net investment incomeb | | 0.52 | | | 0.50 | | | 0.51 | | | 0.46 | | | 0.45 | |
| Net realized and unrealized gains (losses) | | 2.00 | | | 0.62 | | | 1.60 | | | 0.97 | | | 0.89 | |
| Total from investment operations | | 2.52 | | | 1.12 | | | 2.11 | | | 1.43 | | | 1.34 | |
| Less distributions from: | | | | | | | | | | | | | | | |
| Net investment income | | (0.51 | ) | | (0.53 | ) | | (0.48 | ) | | (0.44 | ) | | (0.47 | ) |
| Net realized gains | | (0.04 | ) | | — | | | — | | | — | | | (0.16 | ) |
| Total distributions | | (0.55 | ) | | (0.53 | ) | | (0.48 | ) | | (0.44 | ) | | (0.63 | ) |
| Net asset value, end of year | $ | 16.68 | | $ | 14.71 | | $ | 14.12 | | $ | 12.49 | | $ | 11.50 | |
| |
| Total return | | 17.37 | % | | 8.11 | % | | 17.15 | % | | 12.68 | % | | 12.89 | % |
| |
| Ratios to average net assets | | | | | | | | | | | | | | | |
| Expenses | | 0.60 | %c,d | | 0.60 | %d | | 0.61 | % | | 0.61 | % | | 0.63 | % |
| Net investment income | | 3.20 | % | | 3.49 | % | | 3.76 | % | | 3.82 | % | | 4.06 | % |
| |
| Supplemental data | | | | | | | | | | | | | | | |
| Net assets, end of year (000’s) | $ | 562,202 | | $ | 343,082 | | $ | 574,803 | | $ | 347,983 | | $ | 222,788 | |
| Portfolio turnover rate | | 8.10 | % | | 4.57 | % | | 1.27 | % | | 5.21 | % | | 5.27 | % |
aThe amount shown for a share outstanding throughout the period may not correlate with the Statement of Operations for the period due to the timing of sales and
repurchases of the Fund shares in relation to income earned and/or fluctuating fair value of the investments of the Fund.
bBased on average daily shares outstanding.
cBenefit of waiver and payments by affiliates rounds to less than 0.01%.
dBenefit of expense reduction rounds to less than 0.01%.
112 | Annual Report | The accompanying notes are an integral part of these financial statements. franklintempleton.com
| | | | |
| | FRANKLIN CUSTODIAN FUNDS |
| |
| |
| |
| |
| Statement of Investments, September 30, 2014 | | | | |
| |
| Franklin Utilities Fund | | | | |
| | Country | Shares | | Value |
| Common Stocks 96.7% | | | | |
| Diversified Telecommunication Services 2.1% | | | | |
| AT&T Inc. | United States | 2,000,000 | $ | 70,480,000 |
| Verizon Communications Inc. | United States | 900,000 | | 44,991,000 |
| | | | | 115,471,000 |
| Electric Utilities 46.8% | | | | |
| ALLETE Inc. | United States | 1,000,000 | | 44,390,001 |
| American Electric Power Co. Inc. | United States | 4,100,000 | | 214,061,000 |
| Cleco Corp. | United States | 700,000 | | 33,705,000 |
| Duke Energy Corp. | United States | 3,550,000 | | 265,433,500 |
| Edison International | United States | 4,750,000 | | 265,620,000 |
| Entergy Corp. | United States | 1,500,000 | | 115,995,000 |
| Exelon Corp. | United States | 5,500,000 | | 187,495,000 |
| FirstEnergy Corp. | United States | 2,300,000 | | 77,211,000 |
| Great Plains Energy Inc. | United States | 4,200,000 | | 101,514,000 |
| aHawaiian Electric Industries Inc. | United States | 1,800,000 | | 47,790,000 |
| IDACORP Inc. | United States | 400,000 | | 21,444,000 |
| NextEra Energy Inc. | United States | 2,800,000 | | 262,864,000 |
| Northeast Utilities | United States | 1,700,000 | | 75,310,000 |
| OGE Energy Corp. | United States | 1,400,000 | | 51,954,000 |
| Pinnacle West Capital Corp. | United States | 1,800,000 | | 98,352,000 |
| PNM Resources Inc. | United States | 3,300,000 | | 82,203,000 |
| Portland General Electric Co. | United States | 2,000,000 | | 64,240,000 |
| PPL Corp. | United States | 4,000,000 | | 131,360,000 |
| The Southern Co. | United States | 4,300,000 | | 187,695,000 |
| SSE PLC | United Kingdom | 1,200,000 | | 30,097,813 |
| UIL Holdings Corp. | United States | 1,360,000 | | 48,144,000 |
| Westar Energy Inc. | United States | 2,200,000 | | 75,064,000 |
| Xcel Energy Inc. | United States | 4,500,000 | | 136,800,000 |
| | | | | 2,618,742,314 |
| Gas Utilities 2.2% | | | | |
| The Laclede Group Inc. | United States | 1,200,000 | | 55,680,000 |
| Northwest Natural Gas Co. | United States | 300,000 | | 12,675,000 |
| ONE Gas Inc. | United States | 500,000 | | 17,125,000 |
| Questar Corp. | United States | 1,705,300 | | 38,011,137 |
| | | | | 123,491,137 |
| Independent Power & Renewable Electricity Producers 1.2% | | | | |
| Drax Group PLC | United Kingdom | 6,000,000 | | 62,890,227 |
| TerraForm Power Inc., A | United States | 150,000 | | 4,329,000 |
| | | | | 67,219,227 |
| Multi-Utilities 31.2% | | | | |
| Alliant Energy Corp. | United States | 1,500,000 | | 83,115,000 |
| Ameren Corp. | United States | 600,000 | | 22,998,000 |
| CenterPoint Energy Inc. | United States | 4,400,000 | | 107,668,000 |
| CMS Energy Corp. | United States | 4,000,000 | | 118,640,000 |
| Consolidated Edison Inc. | United States | 1,000,000 | | 56,660,000 |
| Dominion Resources Inc. | United States | 3,600,000 | | 248,724,000 |
| |
| |
| |
| |
| franklintempleton.com | | Annual Report | 113 |
FRANKLIN CUSTODIAN FUNDS
STATEMENT OF INVESTMENTS
| | | | | | |
| | Franklin Utilities Fund (continued) | | | | | |
| | | Country | | Shares | | Value |
| | Common Stocks (continued) | | | | | |
| | Multi-Utilities (continued) | | | | | |
| | DTE Energy Co. | United States | | 1,300,000 | $ | 98,904,000 |
| | MDU Resources Group Inc. | United States | | 3,000,000 | | 83,430,000 |
| | National Grid PLC | United Kingdom | | 11,000,000 | | 158,368,583 |
| | NiSource Inc. | United States | | 1,400,000 | | 57,372,000 |
| | PG&E Corp. | United States | | 4,300,000 | | 193,672,000 |
| | Public Service Enterprise Group Inc. | United States | | 3,300,000 | | 122,892,000 |
| | Sempra Energy | United States | | 2,400,000 | | 252,912,000 |
| | TECO Energy Inc. | United States | | 1,700,000 | | 29,546,000 |
| | Vectren Corp. | United States | | 925,100 | | 36,911,490 |
| | Wisconsin Energy Corp. | United States | | 1,800,000 | | 77,400,000 |
| | | | | | | 1,749,213,073 |
| | Oil, Gas & Consumable Fuels 9.8% | | | | | |
| | Enbridge Inc. | Canada | | 400,000 | | 19,153,269 |
| | aKinder Morgan Inc. | United States | | 3,500,000 | | 134,190,000 |
| | Plains GP Holdings LP, A | United States | | 1,500,000 | | 45,975,000 |
| | SemGroup Corp., A | United States | | 262,737 | | 21,878,110 |
| | Spectra Energy Corp. | United States | | 1,800,000 | | 70,668,000 |
| | TransCanada Corp. | Canada | | 1,800,000 | | 92,733,119 |
| | The Williams Cos. Inc. | United States | | 3,000,000 | | 166,050,000 |
| | | | | | | 550,647,498 |
| | Water Utilities 3.4% | | | | | |
| | American Water Works Co. Inc. | United States | | 2,000,000 | | 96,460,000 |
| | United Utilities Group PLC | United Kingdom | | 7,000,000 | | 91,700,727 |
| | | | | | | 188,160,727 |
| | Total Common Stocks (Cost $3,477,629,635) | | | | | 5,412,944,976 |
| |
| | | | | Principal | | |
| | | | | Amount | | |
| |
| | Corporate Bonds 0.9% | | | | | |
| | Electric Utilities 0.8% | | | | | |
| | MidAmerican Energy Holdings Co., senior note, 8.48%, 9/15/28 | United States | $ | 25,000,000 | | 36,480,575 |
| | Northeast Generation Co., senior secured note, B-1, 8.812%, 10/15/26 | United States | | 6,284,180 | | 6,812,786 |
| | | | | | | 43,293,361 |
| Multi-Utilities 0.1% | | | | | |
| | Aquila Inc., senior note, 8.27%, 11/15/21 | United States | | 6,100,000 | | 7,647,789 |
| | Total Corporate Bonds (Cost $37,539,803) | | | | | 50,941,150 |
| | b,cSenior Floating Rate Interests (Cost $26,965,679) 0.5% | | | | | |
| | Electric Utilities 0.5% | | | | | |
| | Energy Future Intermediate Holding Co. LLC, DIP Term Loan, FRN, 6.50%, | | | | | |
| | 6/19/16 | United States | | 26,781,949 | | 26,698,255 |
| | Total Investments before Short Term Investments | | | | | |
| | (Cost $3,542,135,117) | | | | | 5,490,584,381 |
114 | Annual Report franklintempleton.com
FRANKLIN CUSTODIAN FUNDS
STATEMENT OF INVESTMENTS
| | | | | |
| Franklin Utilities Fund (continued) | | | | | |
| | Country | Shares | | Value | |
| Short Term Investments 4.4% | | | | | |
| Money Market Funds (Cost $70,794,082) 1.2% | | | | | |
| d,eInstitutional Fiduciary Trust Money Market Portfolio | United States | 70,794,082 | $ | 70,794,082 | |
| fInvestments from Cash Collateral Received for Loaned Securities | | | | | |
| (Cost $177,935,000) 3.2% | | | | | |
| Money Market Funds 3.2% | | | | | |
| gBNY Mellon Overnight Government Fund, 0.026% | United States | 177,935,000 | | 177,935,000 | |
| Total Investments (Cost $3,790,864,199) 102.5% | | | | 5,739,313,463 | |
| Other Assets, less Liabilities (2.5)% | | | | (141,461,669 | ) |
| Net Assets 100.0% | | | $ | 5,597,851,794 | |
See Abbreviations on page 143.
aA portion or all of the security is on loan at September 30, 2014. See Note 1(g).
bSee Note 1(i) regarding senior floating rate interests.
cThe coupon rate shown represents the rate at period end.
dNon-income producing.
eSee Note 3(f) regarding investments in Institutional Fiduciary Trust Money Market Portfolio.
fSee Note 1(g) regarding securities on loan.
gThe rate shown is the annualized seven-day yield at period end.
franklintempleton.com The accompanying notes are an integral part of these financial statements. | Annual Report | 115
| | | | | | | | | |
| FRANKLIN CUSTODIAN FUNDS | | | | | | | | | |
| |
| |
| |
| |
| Financial Statements | | | | | | | | | |
| |
| Statements of Assets and Liabilities | | | | | | | | | |
| September 30, 2014 | | | | | | | | | |
| |
| | | Franklin | | | Franklin | | | Franklin | |
| | | DynaTech Fund | | | Growth Fund | | | Income Fund | |
| Assets: | | | | | | | | | |
| Investments in securities: | | | | | | | | | |
| Cost - Unaffiliated issuers | $ | 1,261,029,889 | | $ | 3,855,533,924 | | $ | 83,063,170,857 | |
| Cost - Non-controlled affiliated issuers (Note 10) | | — | | | — | | | 2,992,653,471 | |
| Cost - Sweep Money Fund (Note 3f) | | 63,171,650 | | | 520,027,951 | | | 584,780,335 | |
| Cost - Repurchase agreements | | — | | | 102,946,023 | | | — | |
| Total cost of investments | $ | 1,324,201,539 | | $ | 4,478,507,898 | | $ | 86,640,604,663 | |
| Value - Unaffiliated issuers | $ | 2,205,796,561 | | $ | 9,343,603,597 | | $ | 91,586,110,748 | |
| Value - Non-controlled affiliated issuers (Note 10) | | — | | | — | | | 1,750,660,959 | |
| Value - Sweep Money Fund (Note 3f) | | 63,171,650 | | | 520,027,951 | | | 584,780,335 | |
| Value - Repurchase agreements | | — | | | 102,946,023 | | | — | |
| Total value of investmentsa | | 2,268,968,211 | | | 9,966,577,571 | | | 93,921,552,042 | |
| Cash | | — | | | 400,464,596 | | | 7,714,104 | |
| Receivables: | | | | | | | | | |
| Investment securities sold | | — | | | — | | | 31,223,743 | |
| Capital shares sold | | 6,036,436 | | | 13,707,117 | | | 192,740,400 | |
| Dividends and interest | | 667,031 | | | 7,888,826 | | | 823,828,670 | |
| Other assets | | 572 | | | 18,466 | | | 23,733 | |
| Total assets | | 2,275,672,250 | | | 10,388,656,576 | | | 94,977,082,692 | |
| Liabilities: | | | | | | | | | |
| Payables: | | | | | | | | | |
| Investment securities purchased | | 5,999,381 | | | 4,997,090 | | | 376,617,577 | |
| Capital shares redeemed | | 3,033,960 | | | 10,217,681 | | | 128,358,756 | |
| Management fees | | 865,994 | | | 3,839,708 | | | 28,795,048 | |
| Distribution fees | | 1,019,351 | | | 4,349,092 | | | 45,893,069 | |
| Transfer agent fees | | 432,909 | | | 2,621,537 | | | 11,736,622 | |
| Payable upon return of securities loaned | | — | | | — | | | 36,744,420 | |
| Accrued expenses and other liabilities | | 146,032 | | | 509,075 | | | 3,569,606 | |
| Total liabilities | | 11,497,627 | | | 26,534,183 | | | 631,715,098 | |
| Net assets, at value | $ | 2,264,174,623 | | $ | 10,362,122,393 | | $ | 94,345,367,594 | |
| Net assets consist of: | | | | | | | | | |
| Paid-in capital | $ | 1,256,677,557 | | $ | 4,923,778,356 | | $ | 89,914,597,949 | |
| Undistributed net investment income (loss) | | (6,251,480 | ) | | 25,192,235 | | | — | |
| Distributions in excess of net investment income | | — | | | — | | | (9,047,026 | ) |
| Net unrealized appreciation (depreciation) | | 944,766,532 | | | 5,488,069,673 | | | 7,278,676,045 | |
| Accumulated net realized gain (loss) | | 68,982,014 | | | (74,917,871 | ) | | (2,838,859,374 | ) |
| Net assets, at value | $ | 2,264,174,623 | | $ | 10,362,122,393 | | $ | 94,345,367,594 | |
| |
| |
| |
| aIncludes securities loaned | $ | — | | $ | — | | $ | 35,056,522 | |
116 | Annual Report | The accompanying notes are an integral part of these financial statements. franklintempleton.com
| | | | | | | | |
| | | | | | | FRANKLIN CUSTODIAN FUNDS |
| | | | | | | FINANCIAL STATEMENTS |
| |
| |
| Statements of Assets and Liabilities (continued) | | | | | | | | |
| September 30, 2014 | | | | | | | | |
| |
| | | | Franklin | | | Franklin | | Franklin |
| | | | DynaTech Fund | | | Growth Fund | | Income Fund |
| Class A: | | | | | | | | |
| Net assets, at value | $ | | 1,504,338,421 | $ | | 6,611,073,488 | $ | 53,823,921,106 |
| Shares outstanding | | | 32,643,092 | | | 93,761,493 | | 21,712,249,549 |
| Net asset value per sharea | | $ | 46.08 | | $ | 70.51 | $ | 2.48 |
| Maximum offering price per share (net asset value per share ÷ 94.25%, | | | | | | | | |
| 94.25% and 95.75%, respectively) | | $ | 48.89 | | $ | 74.81 | $ | 2.59 |
| Class C: | | | | | | | | |
| Net assets, at value | $ | | 212,960,587 | $ | | 662,547,663 | $ | 28,802,209,436 |
| Shares outstanding | | | 5,253,809 | | | 10,077,087 | | 11,499,177,881 |
| Net asset value and maximum offering price per sharea | | $ | 40.53 | | $ | 65.75 | $ | 2.50 |
| Class R: | | | | | | | | |
| Net assets, at value | $ | | 45,229,583 | $ | | 565,634,357 | $ | 514,891,904 |
| Shares outstanding | | | 997,417 | | | 8,074,295 | | 210,991,859 |
| Net asset value and maximum offering price per share | | $ | 45.35 | | $ | 70.05 | $ | 2.44 |
| Class R6: | | | | | | | | |
| Net assets, at value | $ | | 342,465,555 | $ | | 1,107,887,195 | $ | 2,108,075,976 |
| Shares outstanding | | | 7,290,561 | | | 15,657,058 | | 856,518,117 |
| Net asset value and maximum offering price per share | | $ | 46.97 | | $ | 70.76 | $ | 2.46 |
| Advisor Class: | | | | | | | | |
| Net assets, at value | $ | | 159,180,477 | $ | | 1,414,979,690 | $ | 9,096,269,172 |
| Shares outstanding | | | 3,396,521 | | | 19,999,129 | | 3,697,013,812 |
| Net asset value and maximum offering price per share | | $ | 46.87 | | $ | 70.75 | $ | 2.46 |
aRedemption price is equal to net asset value less contingent deferred sales charges, if applicable.
franklintempleton.com The accompanying notes are an integral part of these financial statements. | Annual Report | 117
| | | | | |
| FRANKLIN CUSTODIAN FUNDS | | | | | |
| FINANCIAL STATEMENTS | | | | | |
| |
| |
| Statements of Assets and Liabilities (continued) | | | | | |
| September 30, 2014 | | | | | |
| |
| | | Franklin | | | |
| | | U.S. Government | | | Franklin |
| | | Securities Fund | | | Utilities Fund |
| Assets: | | | | | |
| Investments in securities: | | | | | |
| Cost - Unaffiliated issuers | $ | 6,571,262,713 | | $ | 3,720,070,117 |
| Cost - Sweep Money Fund (Note 3f) | | 93,769,881 | | | 70,794,082 |
| Total cost of investments | $ | 6,665,032,594 | | $ | 3,790,864,199 |
| Value - Unaffiliated issuers | $ | 6,815,142,058 | | $ | 5,668,519,381 |
| Value - Sweep Money Fund (Note 3f) | | 93,769,881 | | | 70,794,082 |
| Total value of investmentsa | | 6,908,911,939 | | | 5,739,313,463 |
| Cash | | 371 | | | — |
| Receivables: | | | | | |
| Investment securities sold | | — | | | 26,589,010 |
| Capital shares sold | | 7,726,723 | | | 7,378,328 |
| Dividends and interest | | 22,829,696 | | | 14,470,958 |
| Due from brokers | | 250,000 | | | — |
| Other assets | | 3,596 | | | 1,378 |
| Total assets | | 6,939,722,325 | | | 5,787,753,137 |
| Liabilities: | | | | | |
| Payables: | | | | | |
| Investment securities purchased | | 176,359,293 | | | — |
| Capital shares redeemed | | 14,893,403 | | | 6,494,995 |
| Management fees | | 2,532,519 | | | 2,115,398 |
| Distribution fees | | 2,460,524 | | | 2,098,831 |
| Transfer agent fees | | 1,251,612 | | | 953,258 |
| Distributions to shareholders | | 2,702,133 | | | — |
| Payable upon return of securities loaned | | — | | | 177,935,000 |
| Accrued expenses and other liabilities | | 386,991 | | | 303,861 |
| Total liabilities | | 200,586,475 | | | 189,901,343 |
| Net assets, at value | $ | 6,739,135,850 | | $ | 5,597,851,794 |
| Net assets consist of: | | | | | |
| Paid-in capital | $ | 6,865,749,833 | | $ | 3,504,951,578 |
| Undistributed net investment income | | 199,705 | | | 7,533,397 |
| Net unrealized appreciation (depreciation) | | 243,879,345 | | | 1,948,337,148 |
| Accumulated net realized gain (loss) | | (370,693,033 | ) | | 137,029,671 |
| Net assets, at value | $ | 6,739,135,850 | | $ | 5,597,851,794 |
| |
| |
| aIncludes securities loaned | $ | — | | $ | 172,881,000 |
118 | Annual Report | The accompanying notes are an integral part of these financial statements. franklintempleton.com
| | | | | |
| | | | FRANKLIN CUSTODIAN FUNDS |
| | | | FINANCIAL STATEMENTS |
| |
| |
| Statements of Assets and Liabilities (continued) | | | | | |
| September 30, 2014 | | | | | |
| |
| | | | Franklin | | |
| | | | U.S. Government | | Franklin |
| | | | Securities Fund | | Utilities Fund |
| Class A: | | | | | |
| Net assets, at value | $ | | 4,323,989,890 | $ | 3,717,397,239 |
| Shares outstanding | | | 666,841,255 | | 224,275,624 |
| Net asset value per sharea | | $ | 6.48 | $ | 16.58 |
| Maximum offering price per share (net asset value per share ÷ 95.75%) | | $ | 6.77 | $ | 17.32 |
| Class C: | | | | | |
| Net assets, at value | $ | | 1,190,720,168 | $ | 986,317,825 |
| Shares outstanding | | | 184,810,660 | | 59,768,773 |
| Net asset value and maximum offering price per sharea | | $ | 6.44 | $ | 16.50 |
| Class R: | | | | | |
| Net assets, at value | $ | | 74,442,405 | $ | 95,497,561 |
| Shares outstanding | | | 11,488,193 | | 5,780,652 |
| Net asset value and maximum offering price per share | | $ | 6.48 | $ | 16.52 |
| Class R6: | | | | | |
| Net assets, at value | $ | | 497,246,160 | $ | 236,437,105 |
| Shares outstanding | | | 76,459,046 | | 14,176,450 |
| Net asset value and maximum offering price per share | | $ | 6.50 | $ | 16.68 |
| Advisor Class: | | | | | |
| Net assets, at value | $ | | 652,737,227 | $ | 562,202,064 |
| Shares outstanding | | | 100,360,188 | | 33,706,462 |
| Net asset value and maximum offering price per share | | $ | 6.50 | $ | 16.68 |
aRedemption price is equal to net asset value less contingent deferred sales charges, if applicable.
franklintempleton.com The accompanying notes are an integral part of these financial statements. | Annual Report | 119
|
| FRANKLIN CUSTODIAN FUNDS |
| FINANCIAL STATEMENTS |
Statements of Operations
for the year ended September 30, 2014
| | | | | | | | | |
| | | Franklin | | | Franklin | | | Franklin | |
| | | DynaTech Fund | | | Growth Fund | | | Income Fund | |
| Investment income: | | | | | | | | | |
| Dividends: | | | | | | | | | |
| Unaffiliated issuers | $ | 9,921,106 | | $ | 125,677,070 | | $ | 1,833,058,791 | |
| Non-controlled affiliated issuers (Note 10) | | — | | | — | | | 19,125,000 | |
| Interest: | | | | | | | | | |
| Unaffiliated issuers | | — | | | 212,972 | | | 2,507,135,429 | |
| Non-controlled affiliated issuers (Note 10) | | — | | | — | | | 26,611,645 | |
| Income from securities loaned | | — | | | 56,198 | | | 5,696,278 | |
| Total investment income | | 9,921,106 | | | 125,946,240 | | | 4,391,627,143 | |
| Expenses: | | | | | | | | | |
| Management fees (Note 3a) | | 9,738,604 | | | 44,233,042 | | | 333,602,823 | |
| Distribution fees: (Note 3c) | | | | | | | | | |
| Class A | | 3,377,390 | | | 15,575,254 | | | 79,377,716 | |
| Class C | | 2,023,127 | | | 6,184,273 | | | 176,744,920 | |
| Class R | | 219,271 | | | 2,860,707 | | | 2,476,796 | |
| Transfer agent fees: (Note 3e) | | | | | | | | | |
| Class A | | 2,043,436 | | | 11,169,988 | | | 39,702,375 | |
| Class C | | 306,252 | | | 1,108,706 | | | 20,382,561 | |
| Class R | | 66,407 | | | 1,025,688 | | | 371,459 | |
| Class R6 | | 191 | | | 872 | | | 1,502 | |
| Advisor Class | | 216,986 | | | 2,324,396 | | | 5,449,185 | |
| Custodian fees (Note 4) | | 34,128 | | | 130,507 | | | 1,275,011 | |
| Reports to shareholders | | 201,895 | | | 916,020 | | | 5,958,279 | |
| Registration and filing fees | | 152,279 | | | 269,451 | | | 2,424,922 | |
| Professional fees | | 56,241 | | | 122,494 | | | 804,758 | |
| Trustees’ fees and expenses | | 7,706 | | | 36,604 | | | 341,111 | |
| Other | | 29,556 | | | 125,002 | | | 1,209,897 | |
| Total expenses | | 18,473,469 | | | 86,083,004 | | | 670,123,315 | |
| Expense reductions (Note 4) | | (36 | ) | | (1,791 | ) | | (12,937 | ) |
| Expenses waived/paid by affiliates (Note 3f) | | (43,268 | ) | | (396,822 | ) | | (414,545 | ) |
| Net expenses | | 18,430,165 | | | 85,684,391 | | | 669,695,833 | |
| Net investment income (loss) | | (8,509,059 | ) | | 40,261,849 | | | 3,721,931,310 | |
| Realized and unrealized gains (losses): | | | | | | | | | |
| Net realized gain (loss) from: | | | | | | | | | |
| Investments: | | | | | | | | | |
| Unaffiliated issuers | | 105,190,273 | | | (18,134,849 | ) | | 3,897,614,851 | |
| Non-controlled affiliated issuers (Note 10) | | — | | | — | | | (110,434,552 | ) |
| Written options | | — | | | — | | | 7,164,495 | |
| Foreign currency transactions | | 116,427 | | | (5,162 | ) | | (2,983,421 | ) |
| Net realized gain (loss) | | 105,306,700 | | | (18,140,011 | ) | | 3,791,361,373 | |
| Net change in unrealized appreciation (depreciation) on: | | | | | | | | | |
| Investments | | 154,337,258 | | | 1,629,272,278 | | | 2,073,672,475 | |
| Translation of other assets and liabilities denominated in foreign | | | | | | | | | |
| currencies | | (479 | ) | | — | | | (3,599,625 | ) |
| Net change in unrealized appreciation (depreciation) | | 154,336,779 | | | 1,629,272,278 | | | 2,070,072,850 | |
| Net realized and unrealized gain (loss) | | 259,643,479 | | | 1,611,132,267 | | | 5,861,434,223 | |
| Net increase (decrease) in net assets resulting from operations | $ | 251,134,420 | | $ | 1,651,394,116 | | $ | 9,583,365,533 | |
120 | Annual Report | The accompanying notes are an integral part of these financial statements.
franklintempleton.com
| | | | | | |
| | | FRANKLIN CUSTODIAN FUNDS | |
| | | FINANCIAL STATEMENTS | |
| |
| |
| Statements of Operations (continued) | | | | | | |
| for the year ended September 30, 2014 | | | | | | |
| |
| | | Franklin | | | | |
| | | U.S. Government | | | Franklin | |
| | | Securities Fund | | | Utilities Fund | |
| Investment income: | | | | | | |
| Dividends | $ | — | | $ | 194,568,494 | |
| Interest | | 299,279,852 | | | 5,005,325 | |
| Paydown loss | | (54,885,581 | ) | | — | |
| Income from securities loaned | | — | | | 571,767 | |
| Total investment income | | 244,394,271 | | | 200,145,586 | |
| Expenses: | | | | | | |
| Management fees (Note 3a) | | 32,565,357 | | | 24,246,660 | |
| Distribution fees: (Note 3c) | | | | | | |
| Class A | | 6,733,492 | | | 5,317,608 | |
| Class C | | 8,817,247 | | | 6,016,951 | |
| Class R | | 400,902 | | | 460,021 | |
| Transfer agent fees: (Note 3e) | | | | | | |
| Class A | | 6,151,719 | | | 4,142,713 | |
| Class C | | 1,825,173 | | | 1,081,321 | |
| Class R | | 107,791 | | | 107,541 | |
| Class R6 | | 241 | | | 569 | |
| Advisor Class | | 1,011,071 | | | 548,045 | |
| Custodian fees (Note 4) | | 64,552 | | | 75,581 | |
| Reports to shareholders | | 592,438 | | | 494,237 | |
| Registration and filing fees | | 183,322 | | | 186,052 | |
| Professional fees | | 87,370 | | | 64,797 | |
| Trustees’ fees and expenses | | 30,517 | | | 20,106 | |
| Other | | 495,396 | | | 74,949 | |
| Total expenses | | 59,066,588 | | | 42,837,151 | |
| Expense reductions (Note 4) | | (528 | ) | | (623 | ) |
| Expenses waived/paid by affiliates (Note 3f) | | (86,252 | ) | | (50,167 | ) |
| Net expenses | | 58,979,808 | | | 42,786,361 | |
| Net investment income (loss) | | 185,414,463 | | | 157,359,225 | |
| Realized and unrealized gains (losses): | | | | | | |
| Net realized gain (loss) from: | | | | | | |
| Investments | | (2,377,827 | ) | | 144,242,455 | |
| Foreign currency transactions | | — | | | (170,278 | ) |
| Net realized gain (loss) | | (2,377,827 | ) | | 144,072,177 | |
| Net change in unrealized appreciation (depreciation) on: | | | | | | |
| Investments | | 13,162,088 | | | 507,533,673 | |
| Translation of other assets and liabilities denominated in foreign currencies | | — | | | (131,913 | ) |
| Net change in unrealized appreciation (depreciation) | | 13,162,088 | | | 507,401,760 | |
| Net realized and unrealized gain (loss) | | 10,784,261 | | | 651,473,937 | |
| Net increase (decrease) in net assets resulting from operations | $ | 196,198,724 | | $ | 808,833,162 | |
franklintempleton.com The accompanying notes are an integral part of these financial statements. | Annual Report | 121
| | | | | | | | | | | | |
| FRANKLIN CUSTODIAN FUNDS | | | | | | | | | | | | |
| FINANCIAL STATEMENTS | | | | | | | | | | | | |
| |
| |
| Statements of Changes in Net Assets | | | | | | | | | | | | |
| |
| | | Franklin DynaTech Fund | | | Franklin Growth Fund | |
| | | Year Ended September 30, | | | Year Ended September 30, | |
| | | 2014 | | | 2013 | | | 2014 | | | 2013 | |
| Increase (decrease) in net assets: | | | | | | | | | | | | |
| Operations: | | | | | | | | | | | | |
| Net investment income (loss) | $ | (8,509,059 | ) | $ | (5,047,830 | ) | $ | 40,261,849 | | $ | 36,230,429 | |
| Net realized gain (loss) from investments and foreign | | | | | | | | | | | | |
| currency transactions | | 105,306,700 | | | 90,567,698 | | | (18,140,011 | ) | | (30,028,806 | ) |
| Net change in unrealized appreciation (depreciation) | | | | | | | | | | | | |
| on investments and translation of other assets and | | | | | | | | | | | | |
| liabilities denominated in foreign currencies | | 154,336,779 | | | 241,969,090 | | | 1,629,272,278 | | | 1,308,857,085 | |
| Net increase (decrease) in net assets resulting | | | | | | | | | | | | |
| from operations | | 251,134,420 | | | 327,488,958 | | | 1,651,394,116 | | | 1,315,058,708 | |
| Distributions to shareholders from: | | | | | | | | | | | | |
| Net investment income: | | | | | | | | | | | | |
| Class A | | — | | | — | | | (27,683,049 | ) | | (11,734,418 | ) |
| Class R | | — | | | — | | | (887,842 | ) | | (557,179 | ) |
| Class R6 | | — | | | — | | | (8,353,795 | ) | | — | |
| Advisor Class | | — | | | — | | | (8,082,884 | ) | | (6,710,810 | ) |
| Net realized gains: | | | | | | | | | | | | |
| Class A | | (47,796,268 | ) | | — | | | — | | | — | |
| Class C | | (8,696,764 | ) | | — | | | — | | | — | |
| Class R | | (1,742,295 | ) | | — | | | — | | | — | |
| Class R6 | | (13,471,107 | ) | | — | | | — | | | — | |
| Advisor Class | | (5,233,437 | ) | | — | | | — | | | — | |
| Total distributions to shareholders | | (76,939,871 | ) | | — | | | (45,007,570 | ) | | (19,002,407 | ) |
| Capital share transactions: (Note 2) | | | | | | | | | | | | |
| Class A | | 320,357,428 | | | (33,153,460 | ) | | 275,723,858 | | | 362,579,689 | |
| Class B | | — | | | (1,458,659 | ) | | — | | | (5,066,975 | ) |
| Class C | | 21,692,026 | | | 1,112,173 | | | 16,016,618 | | | (2,375,722 | ) |
| Class R | | (395,246 | ) | | 506,847 | | | (84,447,235 | ) | | (1,449,595 | ) |
| Class R6 | | (7,436,944 | ) | | 271,926,068 | | | 70,430,935 | | | 794,804,450 | |
| Advisor Class | | 24,965,632 | | | (172,026,848 | ) | | 122,013,386 | | | (561,844,719 | ) |
| Total capital share transactions | | 359,182,896 | | | 66,906,121 | | | 399,737,562 | | | 586,647,128 | |
| Net increase (decrease) in net assets | | 533,377,445 | | | 394,395,079 | | | 2,006,124,108 | | | 1,882,703,429 | |
| Net assets: | | | | | | | | | | | | |
| Beginning of year | | 1,730,797,178 | | | 1,336,402,099 | | | 8,355,998,285 | | | 6,473,294,856 | |
| End of year | $ | 2,264,174,623 | | $ | 1,730,797,178 | | $ | 10,362,122,393 | | $ | 8,355,998,285 | |
| Undistributed net investment income (loss) included in | | | | | | | | | | | | |
| net assets: | | | | | | | | | | | | |
| End of year | $ | (6,251,480 | ) | $ | (4,034,718 | ) | $ | 25,192,235 | | $ | 29,943,120 | |
122 | Annual Report | The accompanying notes are an integral part of these financial statements.
franklintempleton.com
| | | | | | | | | | | | |
| | | | | | | | | FRANKLIN CUSTODIAN FUNDS | |
| | | | | | | | | FINANCIAL STATEMENTS | |
| |
| |
| Statements of Changes in Net Assets (continued) | | | | | | | | | | | | |
| |
| | | | | | | | | Franklin U.S. Government | |
| | | Franklin Income Fund | | | Securities Fund | |
| | | Year Ended September 30, | | | Year Ended September 30, | |
| | | 2014 | | | 2013 | | | 2014 | | | 2013 | |
| Increase (decrease) in net assets: | | | | | | | | | | | | |
| Operations: | | | | | | | | | | | | |
| Net investment income | $ | 3,721,931,310 | | $ | 3,621,491,585 | | $ | 185,414,463 | | $ | 212,843,224 | |
| Net realized gain (loss) from investments, written | | | | | | | | | | | | |
| options and foreign currency transactions | | 3,791,361,373 | | | 738,643,556 | | | (2,377,827 | ) | | 3,975,468 | |
| Net change in unrealized appreciation (depreciation) | | | | | | | | | | | | |
| on investments and translation of other assets | | | | | | | | | | | | |
| and liabilities denominated in foreign currencies | | 2,070,072,850 | | | 2,916,825,699 | | | 13,162,088 | | | (451,958,268 | ) |
| Net increase (decrease) in net assets resulting | | | | | | | | | | | | |
| from operations | | 9,583,365,533 | | | 7,276,960,840 | | | 196,198,724 | | | (235,139,576 | ) |
| Distributions to shareholders from: | | | | | | | | | | | | |
| Net investment income: | | | | | | | | | | | | |
| Class A | | (2,604,340,271 | ) | | (2,581,779,889 | ) | | (160,609,100 | ) | | (217,743,401 | ) |
| Class B | | — | | | (3,299,297 | ) | | — | | | (57,447 | ) |
| Class B1 | | — | | | (45,851 | ) | | — | | | — | |
| Class C | | (1,185,274,983 | ) | | (1,146,093,750 | ) | | (40,859,974 | ) | | (72,223,410 | ) |
| Class R | | (22,900,570 | ) | | (24,003,134 | ) | | (2,541,019 | ) | | (3,733,005 | ) |
| Class R6 | | (108,240,006 | ) | | (36,053,887 | ) | | (18,975,768 | ) | | (8,646,493 | ) |
| Advisor Class | | (366,385,613 | ) | | (383,247,978 | ) | | (27,139,385 | ) | | (50,301,976 | ) |
| Total distributions to shareholders | | (4,287,141,443 | ) | | (4,174,523,786 | ) | | (250,125,246 | ) | | (352,705,732 | ) |
| Capital share transactions: (Note 2) | | | | | | | | | | | | |
| Class A | | 2,315,349,376 | | | 5,168,627,116 | | | (780,787,234 | ) | | (1,372,889,422 | ) |
| Class B | | — | | | (231,175,994 | ) | | — | | | (10,085,431 | ) |
| Class B1 | | — | | | (2,709,559 | ) | | — | | | — | |
| Class C | | 3,192,666,235 | | | 2,870,279,161 | | | (439,991,270 | ) | | (1,200,126,017 | ) |
| Class R | | 39,402,467 | | | 2,058,283 | | | (19,028,290 | ) | | (40,235,627 | ) |
| Class R6 | | 59,293,823 | | | 1,935,471,675 | | | 20,086,199 | | | 499,369,403 | |
| Advisor Class | | 2,833,775,583 | | | (840,701,139 | ) | | (290,403,556 | ) | | (566,223,853 | ) |
| Total capital share transactions | | 8,440,487,484 | | | 8,901,849,543 | | | (1,510,124,151 | ) | | (2,690,190,947 | ) |
| Net increase (decrease) in net assets | | 13,736,711,574 | | | 12,004,286,597 | | | (1,564,050,673 | ) | | (3,278,036,255 | ) |
| Net assets: | | | | | | | | | | | | |
| Beginning of year | | 80,608,656,020 | | | 68,604,369,423 | | | 8,303,186,523 | | | 11,581,222,778 | |
| End of year | $ | 94,345,367,594 | | $ | 80,608,656,020 | | $ | 6,739,135,850 | | $ | 8,303,186,523 | |
| Undistributed net investment income (distributions in | | | | | | | | | | | | |
| excess of net investment income) included in | | | | | | | | | | | | |
| net assets: | | | | | | | | | | | | |
| End of year | $ | (9,047,026 | ) | $ | (82,214,549 | ) | $ | 199,705 | | $ | (405,854 | ) |
franklintempleton.com
The accompanying notes are an integral part of these financial statements. | Annual Report | 123
| | | | | | |
| FRANKLIN CUSTODIAN FUNDS | | | | | | |
| FINANCIAL STATEMENTS | | | | | | |
| |
| |
| Statements of Changes in Net Assets (continued) | | | | | | |
| |
| | | Franklin Utilities Fund | |
| | | Year Ended September 30, | |
| | | 2014 | | | 2013 | |
| Increase (decrease) in net assets: | | | | | | |
| Operations: | | | | | | |
| Net investment income | $ | 157,359,225 | | $ | 154,477,618 | |
| Net realized gain (loss) from investments and foreign currency transactions | | 144,072,177 | | | 27,935,185 | |
| Net change in unrealized appreciation (depreciation) on investments and translation of other assets | | | | | | |
| and liabilities denominated in foreign currencies | | 507,401,760 | | | 159,562,892 | |
| Net increase (decrease) in net assets resulting from operations | | 808,833,162 | | | 341,975,695 | |
| Distributions to shareholders from: | | | | | | |
| Net investment income: | | | | | | |
| Class A | | (108,592,280 | ) | | (112,514,473 | ) |
| Class B | | — | | | (46,771 | ) |
| Class C | | (24,014,791 | ) | | (24,633,189 | ) |
| Class R | | (2,519,737 | ) | | (2,651,385 | ) |
| Class R6 | | (7,920,985 | ) | | (3,625,610 | ) |
| Advisor Class | | (15,163,367 | ) | | (17,207,024 | ) |
| Net realized gains: | | | | | | |
| Class A | | (8,070,905 | ) | | — | |
| Class C | | (2,099,362 | ) | | — | |
| Class R | | (208,818 | ) | | — | |
| Class R6 | | (542,905 | ) | | — | |
| Advisor Class | | (948,180 | ) | | — | |
| Total distributions to shareholders | | (170,081,330 | ) | | (160,678,452 | ) |
| Capital share transactions: (Note 2) | | | | | | |
| Class A | | 10,997,734 | | | 73,721,098 | |
| Class B | | — | | | (7,142,943 | ) |
| Class C | | 29,377,765 | | | 38,952,527 | |
| Class R | | (1,938,388 | ) | | 2,935,479 | |
| Class R6 | | (12,216,873 | ) | | 235,836,017 | |
| Advisor Class | | 164,532,653 | | | (270,560,838 | ) |
| Total capital share transactions | | 190,752,891 | | | 73,741,340 | |
| Net increase (decrease) in net assets | | 829,504,723 | | | 255,038,583 | |
| Net assets: | | | | | | |
| Beginning of year | | 4,768,347,071 | | | 4,513,308,488 | |
| End of year | $ | 5,597,851,794 | | $ | 4,768,347,071 | |
| Undistributed net investment income included in net assets: | | | | | | |
| End of year | $ | 7,533,397 | | $ | 6,689,811 | |
124 | Annual Report | The accompanying notes are an integral part of these financial statements.
franklintempleton.com
FRANKLIN CUSTODIAN FUNDS
Notes to Financial Statements
1. Organization and Significant Accounting Policies
Franklin Custodian Funds (Trust) is registered under the Investment Company Act of 1940, as amended, (1940 Act) as an open-end management investment company, consisting of five separate funds (Funds). The Funds offer five classes of shares: Class A, Class C, Class R, Class R6, and Advisor Class. Each class of shares differs by its initial sales load, contingent deferred sales charges, voting rights on matters affecting a single class, its exchange privilege and fees primarily due to differing arrangements for distribution and transfer agent fees.
The following summarizes the Funds’ significant accounting policies.
a. Financial Instrument Valuation
The Funds’ investments in financial instruments are carried at fair value daily. Fair value is the price that would be received to sell an asset or paid to transfer a liability in an orderly transaction between market participants on the measurement date. The Funds calculate the net asset value (NAV) per share at the close of the New York Stock Exchange (NYSE), generally at 4 p.m. Eastern time (NYSE close) on each day the NYSE is open for trading. Under compliance policies and procedures approved by the Trust’s Board of Trustees (the Board), the Funds’ administrator has responsibility for oversight of valuation, including leading the cross-functional Valuation and Liquidity Oversight Committee (VLOC). The VLOC provides administration and oversight of the Funds’ valuation policies and procedures, which are approved annually by the Board. Among other things, these procedures allow the Funds to utilize independent pricing services, quotations from securities and financial instrument dealers, and other market sources to determine fair value.
Equity securities and derivative financial instruments (derivatives) listed on an exchange or on the NASDAQ National Market System are valued at the last quoted sale price or the official closing price of the day, respectively. Foreign equity securities are valued as of the close of trading on the foreign stock exchange on which the security is primarily traded or as of the NYSE close, whichever is earlier. The value is then converted into its U.S. dollar equivalent at the foreign exchange rate in effect at the NYSE close on the day that the value of the security is determined. Over-the-counter (OTC) securities are valued within the range of the most recent quoted bid and ask prices. Securities that trade in multiple markets or on multiple exchanges are valued according to the broadest and most representative market. Certain equity securities are valued based upon fundamental characteristics or relationships to similar securities. Investments in open-end mutual funds and non-registered money market funds are valued at the closing net asset value.
Debt securities generally trade in the OTC market rather than on a securities exchange. The Funds’ pricing services use multiple valuation techniques to determine fair value. In instances where sufficient market activity exists, the pricing services may utilize a market-based approach through which quotes from market makers are used to determine fair value. In instances where sufficient market activity may not exist or is limited, the pricing services also utilize proprietary valuation models which may consider market characteristics such as benchmark yield curves, credit spreads, estimated default rates, anticipated market interest rate volatility, coupon rates, anticipated timing of principal repayments, underlying collateral, and other unique security features in order to estimate the relevant cash flows, which are then discounted to calculate the fair value. Securities denominated in a foreign currency are converted into their U.S. dollar equivalent at the foreign exchange rate in effect at the NYSE close on the date that the values of the foreign debt securities are determined. Repurchase agreements are valued at cost, which approximates fair value.
The Funds have procedures to determine the fair value of financial instruments for which market prices are not reliable or readily available. Under these procedures, the VLOC convenes on a regular basis to review such financial instruments and considers a number of factors, including significant unobservable valuation inputs, when arriving at fair value. The VLOC primarily employs a market-based approach which may use related or comparable assets or liabilities, recent transactions, market multiples, book values, and other relevant information for the investment to determine the fair value of the investment. An income-based valuation approach may also be used in which the anticipated future cash flows of the investment are discounted to calculate fair value. Discounts may also be applied due to the nature or duration of any restrictions on the disposition of the investments. Due to the inherent uncertainty of valuations of such investments, the fair values may differ significantly from the values that would have been used had an active market existed. The VLOC employs various methods for calibrating these valuation approaches including a regular review of key inputs and assumptions, transactional back-testing or disposition analysis, and reviews of any related market activity.
franklintempleton.com Annual Report | 125
FRANKLIN CUSTODIAN FUNDS
NOTES TO FINANCIAL STATEMENTS
1. Organization and Significant Accounting
Policies (continued)
a. Financial Instrument Valuation (continued)
Trading in securities on foreign securities stock exchanges and OTC markets may be completed before the daily NYSE close. In addition, trading in certain foreign markets may not take place on every NYSE business day. Occasionally, events occur between the time at which trading in a foreign security is completed and the close of the NYSE that might call into question the reliability of the value of a portfolio security held by the fund. As a result, differences may arise between the value of the Funds’ portfolio securities as determined at the foreign market close and the latest indications of value at the close of the NYSE. In order to minimize the potential for these differences, the VLOC monitors price movements following the close of trading in foreign stock markets through a series of country specific market proxies (such as baskets of American Depositary Receipts, futures contracts and exchange traded funds). These price movements are measured against established trigger thresholds for each specific market proxy to assist in determining if an event has occurred that may call into question the reliability of the values of the foreign securities held by the Funds. If such an event occurs, the securities may be valued using fair value procedures, which may include the use of independent pricing services.
Also, when the last day of the reporting period is a non-business day, certain foreign markets may be open on those days that the NYSE is closed, which could result in differences between the value of the Funds’ portfolio securities on the last business day and the last calendar day of the reporting period. Any significant security valuation changes due to an open foreign market are adjusted and reflected by the Funds for financial reporting purposes.
b. Foreign Currency Translation
Portfolio securities and other assets and liabilities denominated in foreign currencies are translated into U.S. dollars based on the exchange rate of such currencies against U.S. dollars on the date of valuation. The Funds may enter into foreign currency exchange contracts to facilitate transactions denominated in a foreign currency. Purchases and sales of securities, income and expense items denominated in foreign currencies are translated into U.S. dollars at the exchange rate in effect on the transaction date. Portfolio securities and assets and liabilities denominated in foreign currencies contain risks that those currencies will decline in value relative to the U.S. dollar. Occasionally, events may impact the availability or reliability of foreign exchange rates used to convert the U.S. dollar equivalent value. If such an event occurs, the foreign exchange rate will be valued at fair value using procedures established and approved by the Board.
The Funds do not separately report the effect of changes in foreign exchange rates from changes in market prices on securities held. Such changes are included in net realized and unrealized gain or loss from investments on the Statements of Operations.
Realized foreign exchange gains or losses arise from sales of foreign currencies, currency gains or losses realized between the trade and settlement dates on securities transactions and the difference between the recorded amounts of dividends, interest, and foreign withholding taxes and the U.S. dollar equivalent of the amounts actually received or paid. Net unrealized foreign exchange gains and losses arise from changes in foreign exchange rates on foreign denominated assets and liabilities other than investments in securities held at the end of the reporting period.
c. Joint Repurchase Agreement
Franklin Growth Fund enters into a joint repurchase agreement whereby its uninvested cash balance is deposited into a joint cash account with other funds managed by the investment manager or an affiliate of the investment manager and is used to invest in one or more repurchase agreements. The value and face amount of the joint repurchase agreement are allocated to the funds based on their pro-rata interest. A repurchase agreement is accounted for as a loan by the fund to the seller, collateralized by securities which are delivered to the fund’s custodian. The fair value, including accrued interest, of the initial collateralization is required to be at least 102% of the dollar amount invested by the funds, with the value of the underlying securities marked to market daily to maintain coverage of at least 100%. Repurchase agreements are subject to the terms of Master Repurchase Agreements (MRAs) with approved counterparties (sellers). The MRAs contain various provisions, including but not limited to events of default and maintenance of collateral for repurchase agreements. In the event of default by either seller or the fund, certain MRAs may permit the non-defaulting party to net and close out all transactions, if any, traded under such agreements. The fund may sell securities it holds as collateral and apply the proceeds towards the repurchase price and any other amounts owed by the seller to the fund in the event of default by the seller. This could involve costs or delays in addition to a loss on the securities if their value falls below the repurchase price owed by the seller.
126 | Annual Report franklintempleton.com
FRANKLIN CUSTODIAN FUNDS
NOTES TO FINANCIAL STATEMENTS
The joint repurchase agreement held by the fund at year end, as indicated in the Statement of Investments, had been entered into on September 30, 2014.
d. Securities Purchased on a When-Issued, Delayed Delivery and TBA Basis
Certain funds purchase securities on a when-issued, delayed delivery and to-be-announced (TBA) basis, with payment and delivery scheduled for a future date. These transactions are subject to market fluctuations and are subject to the risk that the value at delivery may be more or less than the trade date purchase price. Although the funds will generally purchase these securities with the intention of holding the securities, they may sell the securities before the settlement date. Sufficient assets have been segregated for these securities and collateral has been pledged and/or received for open TBA trades.
e. Derivative Financial Instruments
Franklin Income Fund invested in derivatives in order to manage risk or gain exposure to various other investments or markets. Derivatives are financial contracts based on an underlying or notional amount, require no initial investment or an initial net investment that is smaller than would normally be required to have a similar response to changes in market factors, and require or permit net settlement. Derivatives contain various risks including the potential inability of the counter-party to fulfill their obligations under the terms of the contract, the potential for an illiquid secondary market, and/or the potential for market movements which expose the fund to gains or losses in excess of the amounts shown on the Statements of Assets and Liabilities. Realized gain and loss and unrealized appreciation and depreciation on these contracts for the period are included in the Statements of Operations.
Collateral requirements differ by type of derivative. Collateral or initial margin requirements are set by the broker or exchange clearing house for exchange traded and centrally cleared derivatives. Initial margin deposited is held at the exchange and can be in the form of cash and/or securities.
Franklin Income Fund purchased or wrote exchange traded option contracts primarily to manage exposure to equity price risk. An option is a contract entitling the holder to purchase or sell a specific amount of shares or units of an asset or notional amount of a swap (swaption), at a specified price. Options purchased are recorded as an asset while options written are recorded as a liability. Upon exercise of an option, the acquisition cost or sales proceeds of the underlying investment is adjusted by any premium received or paid. Upon expiration of an option, any premium received or paid is recorded as a realized gain or loss. Upon closing an option other than through expiration or exercise, the difference between the premium and the cost to close the position is recorded as a realized gain or loss.
See Notes 6 and 9 regarding investment transactions and other derivative information, respectively.
f. Equity-Linked Securities
Franklin Income Fund invests in equity-linked securities. Equity-linked securities are hybrid financial instruments that generally combine both debt and equity characteristics into a single note form. Income received from equity-linked securities is recorded as realized gains in the Statement of Operations and may be based on the performance of an underlying equity security, an equity index, or an option position. The risks of investing in equity-linked securities include unfavorable price movements in the underlying security and the credit risk of the issuing financial institution. There may be no guarantee of a return of principal with equity-linked securities and the appreciation potential may be limited. Equity-linked securities may be more volatile and less liquid than other investments held by the fund.
g. Securities Lending
Certain funds participate in an agency based securities lending program. The fund receives cash collateral against the loaned securities in an amount equal to at least 102% of the fair value of the loaned securities. Collateral is maintained over the life of the loan in an amount not less than 100% of the fair value of loaned securities, as determined at the close of fund business each day; any additional collateral required due to changes in security values is delivered to the fund on the next business day. The collateral is invested in a non-registered money fund as indicated on the Statements of Investments. The fund receives income from the investment of cash collateral, in addition to lending fees and rebates paid by the borrower. The fund bears the market risk with respect to the collateral investment, securities loaned, and the risk that the agent may default on its obligations to the fund. The securities lending agent has agreed to indemnify the fund in the event of default by a third party borrower.
h. Mortgage Dollar Rolls
Franklin U.S. Government Securities Fund enters into mortgage dollar rolls, typically on a TBA basis. Mortgage dollar rolls are agreements between the fund and a financial
franklintempleton.com Annual Report | 127
FRANKLIN CUSTODIAN FUNDS
NOTES TO FINANCIAL STATEMENTS
1. Organization and Significant Accounting
Policies (continued)
h. Mortgage Dollar Rolls (continued)
institution to simultaneously sell and repurchase mortgage-backed securities at a future date. Gains or losses are realized on the initial sale, and the difference between the repurchase price and the sale price is recorded as an unrealized gain or loss to the fund upon entering into the mortgage dollar roll. In addition, the fund may invest the cash proceeds that are received from the initial sale. During the period between the sale and repurchase, the fund is not entitled to principal and interest paid on the mortgage backed securities. The risks of mortgage dollar roll transactions include the potential inability of the counterparty to fulfill its obligations.
i. Senior Floating Rate Interests
Certain funds invest in senior secured corporate loans that pay interest at rates which are periodically reset by reference to a base lending rate plus a spread. These base lending rates are generally the prime rate offered by a designated U.S. bank or the London InterBank Offered Rate (LIBOR). Senior secured corporate loans often require prepayment of principal from excess cash flows or at the discretion of the borrower. As a result, actual maturity may be substantially less than the stated maturity. Senior secured corporate loans in which the funds invest are generally readily marketable, but may be subject to certain restrictions on resale.
j. Income and Deferred Taxes
It is each fund’s policy to qualify as a regulated investment company under the Internal Revenue Code. Each fund intends to distribute to shareholders substantially all of its taxable income and net realized gains to relieve it from federal income and excise taxes. As a result, no provision for U.S. federal income taxes is required.
The Funds may be subject to foreign taxation related to income received, capital gains on the sale of securities and certain foreign currency transactions in the foreign jurisdictions in which it invests. Foreign taxes, if any, are recorded based on the tax regulations and rates that exist in the foreign markets in which the Funds invest. When a capital gain tax is determined to apply the Funds record an estimated deferred tax liability in an amount that would be payable if the securities were disposed of on the valuation date.
Each fund recognizes the tax benefits of uncertain tax positions only when the position is “more likely than not” to be sustained upon examination by the tax authorities based on the technical merits of the tax position. As of September 30, 2014, and for all open tax years, each fund has determined that no liability for unrecognized tax benefits is required in each fund’s financial statements related to uncertain tax positions taken on a tax return (or expected to be taken on future tax returns). Open tax years are those that remain subject to examination and are based on each tax jurisdiction statute of limitation.
k. Security Transactions, Investment Income, Expenses and Distributions
Security transactions are accounted for on trade date. Realized gains and losses on security transactions are determined on a specific identification basis. Interest income and estimated expenses are accrued daily. Amortization of premium and accretion of discount on debt securities are included in interest income. Paydown gains and losses are recorded separately on the Statements of Operations. Facility fees are recognized as income over the expected term of the loan. Dividend income recorded on the ex-dividend date except that certain dividends from foreign securities are recognized as soon as the Funds are notified of the ex-dividend date. Distributions to shareholders are recorded on the ex-dividend date and are determined according to income tax regulations (tax basis). Distributable earnings determined on a tax basis may differ from earnings recorded in accordance with accounting principles generally accepted in the United States of America. These differences may be permanent or temporary. Permanent differences are reclassified among capital accounts to reflect their tax character. These reclassifications have no impact on net assets or the results of operations. Temporary differences are not reclassified, as they may reverse in subsequent periods.
Common expenses incurred by the Trust are allocated among the Funds based on the ratio of net assets of each fund to the combined net assets of the Trust. Fund specific expenses are charged directly to the fund that incurred the expense.
128 | Annual Report franklintempleton.com
FRANKLIN CUSTODIAN FUNDS
NOTES TO FINANCIAL STATEMENTS
Realized and unrealized gains and losses and net investment income, not including class specific expenses, are allocated daily to each class of shares based upon the relative proportion of net assets of each class. Differences in per share distributions, by class, are generally due to differences in class specific expenses.
l. Accounting Estimates
The preparation of financial statements in accordance with accounting principles generally accepted in the United States of America requires management to make estimates and assumptions that affect the reported amounts of assets and liabilities at the date of the financial statements and the amounts of income and expenses during the reporting period. Actual results could differ from those estimates.
m. Guarantees and Indemnifications
Under the Trust’s organizational documents, its officers and trustees are indemnified by the Trust against certain liabilities arising out of the performance of their duties to the Trust. Additionally, in the normal course of business, the Trust, on behalf of the Funds, enters into contracts with service providers that contain general indemnification clauses. The Trust’s maximum exposure under these arrangements is unknown as this would involve future claims that may be made against the Trust that have not yet occurred. Currently, the Trust expects the risk of loss to be remote.
2. Shares of Beneficial Interest
At September 30, 2014, there were an unlimited number of shares authorized (without par value). Transactions in the Funds’ shares were as follows:
| | | | | | | | | | | |
| | Franklin DynaTech Fund | | Franklin Growth Fund | |
| | Shares | | | Amount | | Shares | | | | Amount | |
| Class A Shares: | | | | | | | | | | | |
| Year ended September 30, 2014 | | | | | | | | | | | |
| Shares sold | 19,957,583 | | $ | 893,692,093 | | 22,635,844 | | $ | 1,476,657,042 | |
| Shares issued in reinvestment of distributions | 1,036,302 | | | 44,498,813 | | 384,777 | | | | 24,402,538 | |
| Shares redeemed | (13,817,735 | ) | | (617,833,478 | ) | (18,426,891 | ) | | (1,225,335,722 | ) |
| Net increase (decrease) | 7,176,150 | | $ | 320,357,428 | | 4,593,730 | | | $ | 275,723,858 | |
| Year ended September 30, 2013 | | | | | | | | | | | |
| Shares sold | 6,576,949 | | $ | 238,431,019 | | 22,371,828 | | $ | 1,210,290,819 | |
| Shares issued in reinvestment of distributions | — | | | — | | 214,908 | | | | 10,708,868 | |
| Shares redeemed | (7,538,010 | ) | | (271,584,479 | ) | (15,920,869 | ) | | | (858,419,998 | ) |
| Net increase (decrease) | (961,061 | ) | $ | (33,153,460 | ) | 6,665,867 | | | $ | 362,579,689 | |
| Class B Shares:a | | | | | | | | | | | |
| Year ended September 30, 2013 | | | | | | | | | | | |
| Shares sold | 412 | | $ | 12,633 | | 1,048 | | | $ | 50,973 | |
| Shares redeemed | (48,454 | ) | | (1,471,292 | ) | (105,705 | ) | | | (5,117,948 | ) |
| Net increase (decrease) | (48,042 | ) | $ | (1,458,659 | ) | (104,657 | ) | | $ | (5,066,975 | ) |
| Class C Shares: | | | | | | | | | | | |
| Year ended September 30, 2014 | | | | | | | | | | | |
| Shares sold | 1,329,394 | | $ | 52,341,287 | | 1,755,572 | | | $ | 109,225,881 | |
| Shares issued in reinvestment of distributions | 212,392 | | | 8,070,893 | | — | | | | — | |
| Shares redeemed | (992,766 | ) | | (38,720,154 | ) | (1,501,516 | ) | | | (93,209,263 | ) |
| Net increase (decrease) | 549,020 | | $ | 21,692,026 | | 254,056 | | | $ | 16,016,618 | |
| Year ended September 30, 2013 | | | | | | | | | | | |
| Shares sold | 995,690 | | $ | 32,192,314 | | 1,812,922 | | | $ | 92,585,282 | |
| Shares redeemed | (973,159 | ) | | (31,080,141 | ) | (1,887,761 | ) | | | (94,961,004 | ) |
| Net increase (decrease) | 22,531 | | $ | 1,112,173 | | (74,839 | ) | | $ | (2,375,722 | ) |
| |
| |
| franklintempleton.com | | | | | | Annual Report | 129 | |
FRANKLIN CUSTODIAN FUNDS
NOTES TO FINANCIAL STATEMENTS
| | | | | | | | | | | | |
| 2. Shares of Beneficial Interest (continued) | | | | | | | | | | | | |
| | Franklin DynaTech Fund | | Franklin Growth Fund | |
| | Shares | | | | Amount | | Shares | | | | Amount | |
| |
| Class R Shares: | | | | | | | | | | | | |
| Year ended September 30, 2014 | | | | | | | | | | | | |
| Shares sold | 223,778 | | | $ | 9,798,197 | | 1,259,033 | | | $ | 82,452,020 | |
| Shares issued in reinvestment of distributions | 40,870 | | | | 1,730,443 | | 13,715 | | | | 865,946 | |
| Shares redeemed | (273,168 | ) | | | (11,923,886 | ) | (2,549,245 | ) | | | (167,765,201 | ) |
| Net increase (decrease) | (8,520 | ) | | $ | (395,246 | ) | (1,276,497 | ) | | $ | (84,447,235 | ) |
| Year ended September 30, 2013 | | | | | | | | | | | | |
| Shares sold | 358,720 | | | $ | 12,574,327 | | 2,181,451 | | | $ | 116,200,527 | |
| Shares issued in reinvestment of distributions | — | | | | — | | 10,963 | | | | 543,551 | |
| Shares redeemed | (343,631 | ) | | | (12,067,480 | ) | (2,214,268 | ) | | | (118,193,673 | ) |
| Net increase (decrease) | 15,089 | | | $ | 506,847 | | (21,854 | ) | | $ | (1,449,595 | ) |
| Class R6 Shares: | | | | | | | | | | | | |
| Year ended September 30, 2014 | | | | | | | | | | | | |
| Shares sold | 392,771 | | | $ | 17,760,072 | | 1,963,079 | | | $ | 130,998,376 | |
| Shares issued on reinvestment of distributions | 308,823 | | | | 13,470,860 | | 131,722 | | | | 8,353,795 | |
| Shares redeemed | (835,479 | ) | | | (38,667,876 | ) | (1,028,486 | ) | | | (68,921,236 | ) |
| Net increase (decrease) | (133,885 | ) | | $ | (7,436,944 | ) | 1,066,315 | | | $ | 70,430,935 | |
| Year ended September 30, 2013b | | | | | | | | | | | | |
| Shares sold | 7,558,399 | | $ | 277,192,794 | | 15,563,644 | | | $ | 850,142,284 | |
| Shares redeemed | (133,953 | ) | | | (5,266,726 | ) | (972,901 | ) | | | (55,337,834 | ) |
| Net increase (decrease) | 7,424,446 | | $ | 271,926,068 | | 14,590,743 | | | $ | 794,804,450 | |
| Advisor Class Shares: | | | | | | | | | | | | |
| Year ended September 30, 2014 | | | | | | | | | | | | |
| Shares sold | 1,513,116 | | | $ | 68,768,455 | | 6,902,426 | | | $ | 453,057,572 | |
| Shares issued in reinvestment of distributions | 113,735 | | | | 4,955,439 | | 117,373 | | | | 7,454,331 | |
| Shares redeemed | (1,093,743 | ) | | | (48,758,262 | ) | (5,135,737 | ) | | | (338,498,517 | ) |
| Net increase (decrease) | 533,108 | | | $ | 24,965,632 | | 1,884,062 | | | $ | 122,013,386 | |
| Year ended September 30, 2013 | | | | | | | | | | | | |
| Shares sold | 3,706,126 | | $ | 133,447,083 | | 10,652,415 | | | $ | 549,715,154 | |
| Shares issued in reinvestment of distributions | — | | | | — | | 127,618 | | | | 6,364,288 | |
| Shares redeemed | (8,404,125 | ) | | | (305,473,931 | ) | (20,517,250 | ) | | | (1,117,924,161 | ) |
| Net increase (decrease) | (4,697,999 | ) | $ | (172,026,848 | ) | (9,737,217 | ) | | $ | (561,844,719 | ) |
| |
| | | | | | | | Franklin U.S. Government | |
| | Franklin Income Fund | | Securities Fund | |
| | Shares | | | Amount | | Shares | | | | Amount | |
| |
| Class A Shares: | | | | | | | | | | | | |
| Year ended September 30, 2014 | | | | | | | | | | | | |
| Shares sold | 3,713,448,419 | | $ | 9,155,988,584 | | 71,829,810 | | | $ | 468,017,184 | |
| Shares issued in reinvestment of distributions | 947,331,186 | | | 2,322,103,838 | | 20,519,832 | | | | 133,500,755 | |
| Shares redeemed | (3,708,820,886 | ) | | (9,162,743,046 | ) | (212,106,767 | ) | | (1,382,305,173 | ) |
| Net increase (decrease) | 951,958,719 | | $ | 2,315,349,376 | | (119,757,125 | ) | $ | (780,787,234 | ) |
| Year ended September 30, 2013 | | | | | | | | | | | | |
| Shares sold | 4,354,381,598 | | $ | 9,978,907,189 | | 112,895,641 | | | $ | 760,106,465 | |
| Shares issued in reinvestment of distributions | 992,227,951 | | | 2,260,869,608 | | 26,744,178 | | | | 178,796,132 | |
| Shares redeemed | (3,092,977,833 | ) | | (7,071,149,681 | ) | (346,540,853 | ) | | | (2,311,792,019 | ) |
| Net increase (decrease) | 2,253,631,716 | | $ | 5,168,627,116 | | (206,901,034 | ) | $ | (1,372,889,422 | ) |
130 | Annual Report franklintempleton.com
FRANKLIN CUSTODIAN FUNDS
NOTES TO FINANCIAL STATEMENTS
| | | | | | | | | | | | |
| | | | | | | | Franklin U.S. Government | |
| | Franklin Income Fund | | Securities Fund | |
| | Shares | | | Amount | | Shares | | | | Amount | |
| |
| Class B Shares:a | | | | | | | | | | | | |
| Year ended September 30, 2013 | | | | | | | | | | | | |
| Shares sold | 522,287 | | | $ | 1,162,670 | | 21,355 | | | $ | 146,093 | |
| Shares issued in reinvestment of distributions | 1,145,697 | | | | 2,538,261 | | 6,365 | | | | 43,518 | |
| Shares redeemed | (105,172,170 | ) | | (234,876,925 | ) | (1,510,613 | ) | | | (10,275,042 | ) |
| Net increase (decrease) | (103,504,186 | ) | $ | (231,175,994 | ) | (1,482,893 | ) | | $ | (10,085,431 | ) |
| Class B1 Shares:a | | | | | | | | | | | | |
| Year ended September 30, 2013 | | | | | | | | | | | | |
| Shares sold | 3,551 | | | $ | 7,945 | | | | | | | |
| Shares issued in reinvestment of distributions | 14,310 | | | | 32,007 | | | | | | | |
| Shares redeemed | (1,216,864 | ) | | | (2,749,511 | ) | | | | | | |
| Net increase (decrease) | (1,199,003 | ) | | $ | (2,709,559 | ) | | | | | | |
| Class C Shares: | | | | | | | | | | | | |
| Year ended September 30, 2014 | | | | | | | | | | | | |
| Shares sold | 2,337,404,601 | | $ | 5,828,986,276 | | 12,474,550 | | | $ | 80,745,279 | |
| Shares issued in reinvestment of distributions | 403,069,357 | | | 999,703,501 | | 5,546,252 | | | | 35,857,816 | |
| Shares redeemed | (1,458,897,007 | ) | | (3,636,023,542 | ) | (85,939,596 | ) | | | (556,594,365 | ) |
| Net increase (decrease) | 1,281,576,951 | | $ | 3,192,666,235 | | (67,918,794 | ) | | $ | (439,991,270 | ) |
| Year ended September 30, 2013 | | | | | | | | | | | | |
| Shares sold | 2,239,214,060 | | $ | 5,189,545,214 | | 42,121,213 | | | $ | 283,323,130 | |
| Shares issued in reinvestment of distributions | 412,200,480 | | | 948,590,529 | | 9,486,707 | | | | 63,134,088 | |
| Shares redeemed | (1,414,653,251 | ) | | (3,267,856,582 | ) | (233,443,498 | ) | | (1,546,583,235 | ) |
| Net increase (decrease) | 1,236,761,289 | | $ | 2,870,279,161 | | (181,835,578 | ) | $ | (1,200,126,017 | ) |
| Class R Shares: | | | | | | | | | | | | |
| Year ended September 30, 2014 | | | | | | | | | | | | |
| Shares sold | 54,226,242 | | $ | 131,788,544 | | 2,650,032 | | | $ | 17,247,466 | |
| Shares issued in reinvestment of distributions | 8,980,499 | | | | 21,708,289 | | 373,462 | | | | 2,428,996 | |
| Shares redeemed | (46,938,172 | ) | | (114,094,366 | ) | (5,950,807 | ) | | | (38,704,752 | ) |
| Net increase (decrease) | 16,268,569 | | | $ | 39,402,467 | | (2,927,313 | ) | | $ | (19,028,290 | ) |
| Year ended September 30, 2013 | | | | | | | | | | | | |
| Shares sold | 52,111,312 | | $ | 117,676,371 | | 4,467,517 | | | $ | 29,986,017 | |
| Shares issued in reinvestment of distributions | 10,136,058 | | | | 22,738,383 | | 539,404 | | | | 3,604,935 | |
| Shares redeemed | (61,456,372 | ) | | (138,356,471 | ) | (11,047,893 | ) | | | (73,826,579 | ) |
| Net increase (decrease) | 790,998 | | | $ | 2,058,283 | | (6,040,972 | ) | | $ | (40,235,627 | ) |
| Class R6 Shares: | | | | | | | | | | | | |
| Year ended September 30, 2014 | | | | | | | | | | | | |
| Shares sold | 40,517,766 | | | $ | 97,896,117 | | 8,007,305 | | | $ | 52,198,801 | |
| Shares issued on reinvestment of distributions | 44,205,466 | | | 107,593,287 | | 2,880,560 | | | | 18,796,291 | |
| Shares redeemed | (59,362,751 | ) | | (146,195,581 | ) | (7,784,399 | ) | | | (50,908,893 | ) |
| Net increase (decrease) | 25,360,481 | | | $ | 59,293,823 | | 3,103,466 | | | $ | 20,086,199 | |
| Year ended September 30, 2013b | | | | | | | | | | | | |
| Shares sold | 815,412,903 | | $ | 1,899,422,821 | | 90,670,716 | | | $ | 611,873,567 | |
| Shares issued in reinvestment of distributions | 15,746,891 | | | | 36,053,817 | | 1,320,809 | | | | 8,646,447 | |
| Shares redeemed | (2,158 | ) | | | (4,963 | ) | (18,635,945 | ) | | | (121,150,611 | ) |
| Net increase (decrease) | 831,157,636 | | $ | 1,935,471,675 | | 73,355,580 | | | $ | 499,369,403 | |
franklintempleton.com Annual Report | 131
FRANKLIN CUSTODIAN FUNDS
NOTES TO FINANCIAL STATEMENTS
| | | | | | | | | | |
| 2. Shares of Beneficial Interest (continued) | | | | | | | | | | |
| | | | | | | Franklin U.S. Government | |
| | Franklin Income Fund | | Securities Fund | |
| | Shares | | | Amount | | Shares | | | Amount | |
| |
| Advisor Class Shares: | | | | | | | | | | |
| Year ended September 30, 2014 | | | | | | | | | | |
| Shares sold | 1,562,121,375 | | $ | 3,859,740,670 | | 27,080,227 | | $ | 176,904,592 | |
| Shares issued in reinvestment of distributions | 125,980,982 | | | 307,395,314 | | 3,666,095 | | | 23,923,798 | |
| Shares redeemed | (545,540,026 | ) | | (1,333,360,401 | ) | (75,256,361 | ) | | (491,231,946 | ) |
| Net increase (decrease) | 1,142,562,331 | | $ | 2,833,775,583 | | (44,510,039 | ) | $ | (290,403,556 | ) |
| Year ended September 30, 2013 | | | | | | | | | | |
| Shares sold | 913,751,325 | | $ | 2,083,044,126 | | 59,088,551 | | $ | 398,312,984 | |
| Shares issued in reinvestment of distributions | 147,677,613 | | | 333,712,924 | | 6,572,267 | | | 44,179,978 | |
| Shares redeemed | (1,415,345,182 | ) | | (3,257,458,189 | ) | (149,894,868 | ) | (1,008,716,815 | ) |
| Net increase (decrease) | (353,916,244 | ) | $ | (840,701,139 | ) | (84,234,050 | ) | $ | (566,223,853 | ) |
| |
| | Franklin Utilities Fund | | | | | | |
| | Shares | | | Amount | | | | | | |
| |
| Class A Shares: | | | | | | | | | | |
| Year ended September 30, 2014 | | | | | | | | | | |
| Shares sold | 39,649,168 | | $ | 636,235,264 | | | | | | |
| Shares issued in reinvestment of distributions | 6,698,177 | | | 105,396,539 | | | | | | |
| Shares redeemed | (46,046,709 | ) | | (730,634,069 | ) | | | | | |
| Net increase (decrease) | 300,636 | | $ | 10,997,734 | | | | | | |
| Year ended September 30, 2013 | | | | | | | | | | |
| Shares sold | 48,622,807 | | $ | 709,536,347 | | | | | | |
| Shares issued in reinvestment of distributions | 7,063,755 | | | 100,091,748 | | | | | | |
| Shares redeemed | (50,828,151 | ) | | (735,906,997 | ) | | | | | |
| Net increase (decrease) | 4,858,411 | | $ | 73,721,098 | | | | | | |
| Class B Shares:a | | | | | | | | | | |
| Year ended September 30, 2013 | | | | | | | | | | |
| Shares sold | 600 | | $ | 8,432 | | | | | | |
| Shares issued in reinvestment of distributions | 2,747 | | | 37,416 | | | | | | |
| Shares redeemed | (514,258 | ) | | (7,188,791 | ) | | | | | |
| Net increase (decrease) | (510,911 | ) | $ | (7,142,943 | ) | | | | | |
| Class C Shares: | | | | | | | | | | |
| Year ended September 30, 2014 | | | | | | | | | | |
| Shares sold | 9,642,854 | | $ | 153,687,794 | | | | | | |
| Shares issued in reinvestment of distributions | 1,349,832 | | | 21,125,954 | | | | | | |
| Shares redeemed | (9,258,751 | ) | | (145,435,983 | ) | | | | | |
| Net increase (decrease) | 1,733,935 | | $ | 29,377,765 | | | | | | |
| Year ended September 30, 2013 | | | | | | | | | | |
| Shares sold | 13,688,790 | | $ | 199,242,995 | | | | | | |
| Shares issued in reinvestment of distributions | 1,376,485 | | | 19,419,779 | | | | | | |
| Shares redeemed | (12,436,518 | ) | | (179,710,247 | ) | | | | | |
| Net increase (decrease) | 2,628,757 | | $ | 38,952,527 | | | | | | |
132 | Annual Report franklintempleton.com
FRANKLIN CUSTODIAN FUNDS
NOTES TO FINANCIAL STATEMENTS
| | | | | | |
| | Franklin Utilities Fund | |
| | Shares | | | | Amount | |
| |
| Class R Shares: | | | | | | |
| Year ended September 30, 2014 | | | | | | |
| Shares sold | 2,212,911 | | | $ | 35,338,931 | |
| Shares issued in reinvestment of distributions | 168,631 | | | | 2,642,310 | |
| Shares redeemed | (2,515,315 | ) | | | (39,919,629 | ) |
| Net increase (decrease) | (133,773 | ) | | $ | (1,938,388 | ) |
| Year ended September 30, 2013 | | | | | | |
| Shares sold | 2,559,482 | | | $ | 37,361,769 | |
| Shares issued in reinvestment of distributions | 181,816 | | | | 2,566,649 | |
| Shares redeemed | (2,576,752 | ) | | | (36,992,939 | ) |
| Net increase (decrease) | 164,546 | | | $ | 2,935,479 | |
| Class R6 Shares: | | | | | | |
| Year ended September 30, 2014 | | | | | | |
| Shares sold | 1,158,712 | | | $ | 18,704,736 | |
| Shares issued on reinvestment of distributions | 534,709 | | | | 8,463,891 | |
| Shares redeemed | (2,387,364 | ) | | | (39,385,500 | ) |
| Net increase (decrease) | (693,943 | ) | $ | (12,216,873 | ) |
| Year ended September 30, 2013b | | | | | | |
| Shares sold | 14,907,633 | | $ | 236,472,707 | |
| Shares issued in reinvestment of distributions | 248,572 | | | | 3,625,571 | |
| Shares redeemed | (285,812 | ) | | | (4,262,261 | ) |
| Net increase (decrease) | 14,870,393 | | $ | 235,836,017 | |
| Advisor Class Shares: | | | | | | |
| Year ended September 30, 2014 | | | | | | |
| Shares sold | 17,575,665 | | $ | 278,956,564 | |
| Shares issued in reinvestment of distributions | 912,471 | | | | 14,538,476 | |
| Shares redeemed | (8,103,315 | ) | | | (128,962,387 | ) |
| Net increase (decrease) | 10,384,821 | | $ | 164,532,653 | |
| Year ended September 30, 2013 | | | | | | |
| Shares sold | 12,293,683 | | $ | 180,230,567 | |
| Shares issued in reinvestment of distributions | 1,093,603 | | | | 15,491,381 | |
| Shares redeemed | (30,778,092 | ) | | | (466,282,786 | ) |
| Net increase (decrease) | (17,390,806 | ) | $ | (270,560,838 | ) |
aEffective March 21, 2013, all Class B and B1 shares were converted to Class A.
bFor the period May 1, 2013 (effective date) to September 30, 2013.
3. Transactions with Affiliates
Franklin Resources, Inc. is the holding company for various subsidiaries that together are referred to as Franklin Templeton Investments. Certain officers and trustees of the Trust are also officers and/or directors of the following subsidiaries:
| |
| Subsidiary | Affiliation |
| Franklin Advisers, Inc. (Advisers) | Investment manager |
| Franklin Investment Advisory Services, LLC (Investment Advisory) | Investment manager |
| Templeton Investment Counsel, LLC (TIC) | Investment manager |
| Franklin Templeton Services, LLC (FT Services) | Administrative manager |
| Franklin Templeton Distributors, Inc. (Distributors) | Principal underwriter |
| Franklin Templeton Investor Services, LLC (Investor Services) | Transfer agent |
franklintempleton.com Annual Report | 133
FRANKLIN CUSTODIAN FUNDS
NOTES TO FINANCIAL STATEMENTS
| 3. | Transactions with Affiliates (continued) |
| a. | Management Fees |
Franklin Income Fund and Franklin Utilities Fund pay an investment management fee to Advisers based on the month-end net assets of each of the funds as follows:
| |
| Annualized Fee Rate | Net Assets |
| 0.625% | Up to and including $100 million |
| 0.500% | Over $100 million, up to and including $250 million |
| 0.450% | Over $250 million, up to and including $7.5 billion |
| 0.440% | Over $7.5 billion, up to and including $10 billion |
| 0.430% | Over $10 billion, up to and including $12.5 billion |
| 0.420% | Over $12.5 billion, up to and including $15 billion |
| 0.400% | Over $15 billion, up to and including $17.5 billion |
| 0.380% | Over $17.5 billion, up to and including $20 billion |
| 0.360% | Over $20 billion, up to and including $35 billion |
| 0.355% | Over $35 billion, up to and including $50 billion |
| 0.350% | Over $50 billion, up to and including $65 billion |
| 0.345% | Over $65 billion, up to and including $80 billion |
| 0.340% | In excess of $80 billion |
Franklin DynaTech Fund, Franklin Growth Fund, and Franklin U.S. Government Securities Fund pay an investment management fee to Advisers based on the month-end net assets of each of the funds as follows:
| |
| Annualized Fee Rate | Net Assets |
| 0.625% | Up to and including $100 million |
| 0.500% | Over $100 million, up to and including $250 million |
| 0.450% | Over $250 million, up to and including $7.5 billion |
| 0.440% | Over $7.5 billion, up to and including $10 billion |
| 0.430% | Over $10 billion, up to and including $12.5 billion |
| 0.420% | Over $12.5 billion, up to and including $15 billion |
| 0.400% | Over $15 billion, up to and including $17.5 billion |
| 0.380% | Over $17.5 billion, up to and including $20 billion |
| 0.360% | Over $20 billion, up to and including $35 billion |
| 0.355% | Over $35 billion, up to and including $50 billion |
| 0.350% | In excess of $50 billion |
Under a subadvisory agreement, Investment Advisory, an affiliate of Advisers, provided subadvisory services to Franklin Growth Fund. The subadvisory fee was paid by Advisers based on average monthly net assets, and was not an additional expense of the fund. Effective April 14, 2014, the subadvisory agreement was terminated.
Under a subadvisory agreement, TIC, an affiliate of Advisers, provided subadvisory services to Franklin Income Fund. The subadvisory fee was paid by Advisers based on the average monthly net assets, and was not an additional expense of the fund. Effective February 1, 2014, the subadvisory agreement was terminated.
134 | Annual Report franklintempleton.com
FRANKLIN CUSTODIAN FUNDS
NOTES TO FINANCIAL STATEMENTS
b. Administrative Fees
Under an agreement with Advisers, FT Services provides administrative services to the Funds. The fee is paid by Advisers based on each of the Funds’ average daily net assets, and is not an additional expense of the Funds.
c. Distribution Fees
The Board has adopted distribution plans for each share class, with the exception of Class R6 and Advisor Class shares, pursuant to Rule 12b-1 under the 1940 Act. Distribution fees are not charged on shares held by affiliates. Under the Funds’ Class A reimbursement distribution plans, the Funds reimburse Distributors for costs incurred in connection with the servicing, sale and distribution of each fund’s shares up to the maximum annual plan rate for each class. Under the Class A reimbursement distribution plans, costs exceeding the maximum for the current plan year cannot be reimbursed in subsequent periods. In addition, under the Funds’ Class C and R compensation distribution plans, the Funds pay Distributors for costs incurred in connection with the servicing, sale and distribution of each fund’s shares up to the maximum annual plan rate for each class. The plan year, for purposes of monitoring compliance with the maximum annual plan rates, is February 1 through January 31 for each fund.
The maximum annual plan rates, based on the average daily net assets, for each class, are as follows:
| | | | | | | | | | |
| | | | | | | | Franklin U.S. | | | |
| | Franklin | | Franklin | | Franklin | | Government | | Franklin | |
| | DynaTech Fund | | Growth Fund | | Income Fund | | Securities Fund | | Utilities Fund | |
| Reimbursement Plans: | | | | | | | | | | |
| Class A | 0.25 | % | 0.25 | % | 0.15 | % | 0.15 | % | 0.15 | % |
| Compensation Plans: | | | | | | | | | | |
| Class C | 1.00 | % | 1.00 | % | 0.65 | % | 0.65 | % | 0.65 | % |
| Class R | 0.50 | % | 0.50 | % | 0.50 | % | 0.50 | % | 0.50 | % |
d. Sales Charges/Underwriting Agreements
Front-end sales charges and contingent deferred sales charges (CDSC) do not represent expenses of the Funds. These charges are deducted from the proceeds of sales of fund shares prior to investment or from redemption proceeds prior to remittance, as applicable. Distributors has advised the Funds of the following commission transactions related to the sales and redemptions of the Funds’ shares for the year:
| | | | | | | | | | |
| | | | | | | | | Franklin U.S. | | |
| | | Franklin | | Franklin | | Franklin | | Government | | Franklin |
| | | DynaTech Fund | | Growth Fund | | Income Fund | | Securities Fund | | Utilities Fund |
| Sales charges retained net of commissions | | | | | | | | | | |
| paid to unaffiliated broker/dealers | $ | 975,529 | $ | 3,690,368 | $ | 24,325,939 | $ | 688,048 | $ | 1,105,246 |
| CDSC retained | $ | 22,224 | $ | 78,057 | $ | 2,529,679 | $ | 202,563 | $ | 72,566 |
| |
| |
| e. Transfer Agent Fees | | | | | | | | | | |
Each class of shares, except for Class R6, pays transfer agent fees to Investor Services for its performance of shareholder servicing obligations and reimburses Investor Services for out of pocket expenses incurred, including shareholding servicing fees paid to third parties. These fees are allocated daily based upon their relative proportion of such classes’ aggregate net assets. Class R6 pays Investor Services transfer agent fees specific to that class.
franklintempleton.com Annual Report | 135
FRANKLIN CUSTODIAN FUNDS
NOTES TO FINANCIAL STATEMENTS
3. Transactions with Affiliates (continued)
e. Transfer Agent Fees (continued)
For the year ended September 30, 2014, the Funds paid transfer agent fees as noted in the Statements of Operations of which the following amounts were retained by Investor Services:
| | | | | | | | | | |
| | | | | | | | | Franklin U.S. | | |
| | | Franklin | | Franklin | | Franklin | | Government | | Franklin |
| | | DynaTech Fund | | Growth Fund | | Income Fund | | Securities Fund | | Utilities Fund |
| |
| Transfer agent fees | $ | 1,339,607 | $ | 6,647,596 | $ | 23,304,173 | $ | 4,664,333 | $ | 2,588,579 |
f. Investments in Institutional Fiduciary Trust Money Market Portfolio
The Funds invest in Institutional Fiduciary Trust Money Market Portfolio (Sweep Money Fund), an affiliated open-end management investment company. Management fees paid by the Funds are waived on assets invested in the Sweep Money Fund, as noted on the Statements of Operations, in an amount not to exceed the management and administrative fees paid directly or indirectly by the Sweep Money Fund. Prior to October 1, 2013, the waiver was accounted for as a reduction to management fees.
g. Waiver and Expense Reimbursements
Investor Services has contractually agreed in advance to waive or limit its fees so that the Class R6 transfer agent fees do not exceed 0.01% until January 31, 2015. There were no Class R6 transfer agent fees waived during the year ended September 30, 2014.
h. Other Affiliated Transactions
At September 30, 2014, one or more of the funds in Franklin Fund Allocator Series owned a percentage of the following funds’ outstanding shares:
| | | | | | | | | |
| | | | | | | Franklin U.S. | | | |
| Franklin | | Franklin | | Franklin | | Government | | Franklin | |
| DynaTech Fund | | Growth Fund | | Income Fund | | Securities Fund | | Utilities Fund | |
| |
| 14.65 | % | 9.72 | % | 2.15 | % | 6.84 | % | 4.05 | % |
4. Expense Offset Arrangement
The Funds have entered into an arrangement with their custodian whereby credits realized as a result of uninvested cash balances are used to reduce a portion of the Funds’ custodian expenses. During the year ended September 30, 2014, the custodian fees were reduced as noted in the Statements of Operations.
5. Income Taxes
For tax purposes, capital losses may be carried over to offset future capital gains. Capital loss carryforwards with no expiration, if any, must be fully utilized before those losses with expiration dates.
136 | Annual Report franklintempleton.com
FRANKLIN CUSTODIAN FUNDS
NOTES TO FINANCIAL STATEMENTS
| | | | | | | | | | | |
| At September 30, 2014, the capital loss carryforwards were as follows: | | | | | | | | |
| |
| | | | | | | | | | | | Franklin U.S. |
| | | | Franklin | | | Franklin | | | Franklin | | Government |
| | | DynaTech Fund | | | Growth Fund | | | Income Fund | | Securities Fund |
| Capital loss carryforwards subject to expiration: | | | | | | | | | | | |
| 2015 | | $ | — | | $ | — | | $ | — | $ | 28,034,940 |
| 2016 | | | — | | | 13,543,792 | | | — | | 20,514,778 |
| 2017 | | | 10,234,999 | | | — | | | — | | 18,668,917 |
| 2018 | | | — | | | — | | | 2,672,493,978 | | 16,923,309 |
| 2019 | | | — | | | — | | | — | | 4,445,156 |
| Capital loss carryforwards not subject to expiration: | | | | | | | | | | | |
| Short term | | | — | | | 14,372,615 | | | — | | 112,026,737 |
| Long term | | | — | | | 47,914,506 | | | — | | 170,079,195 |
| Total capital loss carryforwards | $ | 10,234,999 | a | $ | 75,830,913 | b | $ | 2,672,493,978 | $ | 370,693,032 |
aIncludes $10,234,999 from the merged Franklin Global Communications Fund and Franklin Technology Fund, which may be carried over to offset future capital gains,
subject to certain limitations.
bIncludes $13,543,792 from the merged Franklin Capital Growth Fund, which may be carried over to offset future capital gains, subject to certain limitations.
During the year ended September 30, 2014, Franklin DynaTech Fund and Franklin Income Fund utilized $4,357,269 and $3,170,534,717, respectively, of capital loss carryforwards.
On September 30, 2014, Franklin U.S. Government Securities Fund had expired capital loss carryforwards of $47,763,112, which were reclassified to paid-in capital.
For tax purposes, the Funds may elect to defer any portion of a post-October capital loss or late-year ordinary loss to the first day of the following fiscal year. At September 30, 2014, Franklin DynaTech Fund deferred late-year ordinary losses of $6,251,481.
The tax character of distributions paid during the years ended September 30, 2014 and 2013, was as follows:
| | | | | | | | | |
| | | Franklin | | Franklin |
| | | DynaTech Fund | | Growth Fund |
| | | 2014 | | | 2013 | | 2014 | | 2013 |
| Distributions paid from: | | | | | | | | | |
| Ordinary income | $ | — | | $ | — | $ | 45,007,570 | $ | 19,002,407 |
| Long term capital gain | | 76,939,871 | | | — | | — | | — |
| | $ | 76,939,871 | | $ | — | $ | 45,007,570 | $ | 19,002,407 |
| |
| | | | | | | | Franklin |
| | | Franklin | | | U.S. Government |
| | | Income Fund | | Securities Fund |
| | | 2014 | | | 2013 | | 2014 | | 2013 |
| Distributions paid from: | | | | | | | | | |
| Ordinary income | $ | 4,287,141,443 | $ | 4,174,523,786 | $ | 250,125,246 | $ | 352,705,732 |
| |
| | | Franklin Utilities Fund | | | | |
| | | 2014 | | | 2013 | | | | |
| Distributions paid from: | | | | | | | | | |
| Ordinary income | $ | 158,635,095 | | $ | 160,678,452 | | | | |
| Long term capital gain | | 11,446,235 | | | — | | | | |
| | $ | 170,081,330 | | $ | 160,678,452 | | | | |
franklintempleton.com Annual Report | 137
FRANKLIN CUSTODIAN FUNDS
NOTES TO FINANCIAL STATEMENTS
5. Income Taxes (continued)
At September 30, 2014, the cost of investments, net unrealized appreciation (depreciation), undistributed ordinary income and undistributed long term capital gains for income tax purposes were as follows:
| | | | | | | | | |
| | | Franklin | | | Franklin | | | Franklin | |
| | | DynaTech Fund | | | Growth Fund | | | Income Fund | |
| Cost of investments | $ | 1,324,979,979 | | $ | 4,483,306,855 | | $ | 86,819,268,927 | |
| |
| Unrealized appreciation | $ | 956,540,063 | | $ | 5,508,055,825 | | $ | 11,238,203,182 | |
| Unrealized depreciation | | (12,551,831 | ) | | (24,785,109 | ) | | (4,135,920,067 | ) |
| Net unrealized appreciation (depreciation) | $ | 943,988,232 | | $ | 5,483,270,716 | | $ | 7,102,283,115 | |
| |
| Undistributed ordinary income | $ | — | | $ | 30,904,232 | | $ | 6,435,501 | |
| Undistributed long term capital gains | | 79,995,454 | | | — | | | — | |
| Distributable earnings | $ | 79,995,454 | | $ | 30,904,232 | | $ | 6,435,501 | |
| |
| | | Franklin U.S. | | | | | | | |
| | | Government | | | Franklin | | | | |
| | | Securities Fund | | | Utilities Fund | | | | |
| Cost of investments | $ | 6,665,341,290 | | $ | 3,790,697,225 | | | | |
| |
| Unrealized appreciation | $ | 283,404,871 | | $ | 1,949,413,840 | | | | |
| Unrealized depreciation | | (39,834,222 | ) | | (797,602 | ) | | | |
| Net unrealized appreciation (depreciation) | $ | 243,570,649 | | $ | 1,948,616,238 | | | | |
| |
| Undistributed ordinary income | $ | 3,210,532 | | $ | 25,098,665 | | | | |
| Undistributed long term capital gains | | — | | | 119,297,436 | | | | |
| Distributable earnings | $ | 3,210,532 | | $ | 144,396,101 | | | | |
Differences between income and/or capital gains as determined on a book basis and a tax basis are primarily due to differing treatments of paydown losses, bond discount and premiums, corporate actions and equity-linked securities.
6. Investment Transactions
Purchases and sales of investments (excluding short term securities) for the year ended September 30, 2014, were as follows:
| | | | | | | | | | |
| | | | | | | | | Franklin U.S. | | |
| | | Franklin | | Franklin | | Franklin | | Government | | Franklin |
| | | DynaTech Fund | | Growth Fund | | Income Fund | | Securities Fund | | Utilities Fund |
| Purchases | $ | 755,654,437 | $ | 431,866,920 | $ | 39,622,581,734 | $ | 5,185,026,649 | $ | 516,716,247 |
| Sales | $ | 534,857,171 | $ | 129,390,803 | $ | 31,881,337,152 | $ | 6,982,767,018 | $ | 422,131,649 |
| |
| Transactions in options written during the year ended September 30, 2014, were as follows: | | | | |
| | | | | |
| | Number of | | | Premiums | |
| | Contracts | | | Received | |
| Franklin Income Fund | | | | | |
| Options outstanding at September 30, 2013 | — | | $ | — | |
| Options written | 97,433 | | | 10,368,275 | |
| Options expired | (57,433 | ) | | (5,930,608 | ) |
| Options exercised | (35,000 | ) | | (4,339,904 | ) |
| Options closed | (5,000 | ) | | (97,763 | ) |
| Options outstanding at September 30, 2014 | — | | $ | — | |
See Notes 1(e) and 9 regarding derivative financial instruments and other derivative information, respectively.
138 | Annual Report franklintempleton.com
FRANKLIN CUSTODIAN FUNDS
NOTES TO FINANCIAL STATEMENTS
7. Credit Risk and Defaulted Securities
At September 30, 2014, Franklin Income Fund had 35.43% of its portfolio invested in high yield, senior secured floating rate notes, or other securities rated below investment grade. These securities may be more sensitive to economic conditions causing greater price volatility and are potentially subject to a greater risk of loss due to default than higher rated securities.
Franklin Income Fund held defaulted securities and/or other securities for which the income has been deemed uncollectible. At September 30, 2014, the aggregate value of these securities represents less than 0.05% of the fund’s net assets. The fund discontinues accruing income on securities for which income has been deemed uncollectible and provide an estimate for losses on interest receivable. The securities have been identified on the accompanying Statement of Investments.
8. Restricted Securities
The Funds invest in securities that are restricted under the Securities Act of 1933 (1933 Act) or which are subject to legal, contractual, or other agreed upon restrictions on resale. Restricted securities are often purchased in private placement transactions, and cannot be sold without prior registration unless the sale is pursuant to an exemption under the 1933 Act. Disposal of these securities may require greater effort and expense, and prompt sale at an acceptable price may be difficult. The Funds may have registration rights for restricted securities. The issuer generally incurs all registration costs.
At September 30, 2014, Franklin Income Fund held investments in restricted securities, excluding certain securities exempt from registration under the 1933 Act deemed to be liquid, as follows:
| | | | | | |
| | | Acquisition | | | | |
| Shares | Issuer | Date | | Cost | | Value |
| |
| 21,666,666 | First Data Holdings Inc., B (Value is 0.09% of Net Assets) | 6/26/14 | | $86,666,664 | $ | 86,184,148 |
9. Other Derivative Information
For the year ended September 30, 2014, the effect of derivative contracts on Franklin Income Fund’s Statements of Operations was as follows:
| | | | |
| | | | | Change in |
| | | | | Unrealized |
| Derivative Contracts | | | Realized | Appreciation |
| Not Accounted for as | | | Gain (Loss) | (Depreciation) |
| Hedging Instruments | Statement of Operations Locations | | for the Year | for the Year |
| Equity contracts | Net realized gain (loss) from written options | $ | 7,164,495 | $ — |
For the year ended September 30, 2014, the average month end fair value of derivatives represented less than 0.01% of average month end net assets. The average month end number of open derivative contracts for the year was 1.
See Notes 1(e) and 6 regarding derivative financial instruments and investment transactions, respectively.
franklintempleton.com Annual Report | 139
FRANKLIN CUSTODIAN FUNDS
NOTES TO FINANCIAL STATEMENTS
10. Holdings of 5% Voting Securities of Portfolio Companies
The 1940 Act defines “affiliated companies” to include investments in portfolio companies in which a fund owns 5% or more of the outstanding voting securities. Investments in “affiliated companies” for Franklin Income Fund for the year ended September 30, 2014, were as shown below.
| | | | | | | | | | | | |
| | Number of | | | | Number of | | | | | | | |
| | Shares/ | | | | Shares/ | | | | | | | |
| | Warrants/ | | | | Warrants/ | | | | | | | |
| | Principal | | | | Principal | | | | | | | |
| | Amount* | | | | Amount* | | | | | | | |
| | Held at | | | | Held at | | | | | | | |
| | Beginning | Gross | Gross | | End | | Value at | | Investment | | Realized | |
| Name of Issuer | of Year | Additions | Reductions | | of Year | | End of Year | | Income | | Gain (Loss) | |
| Non-Controlled Affiliates | | | | | | | | | | | | |
| Agrium Inc. | 7,500,000 | — | — | | 7,500,000 | $ | 667,500,000 | $ | 19,125,000 | $ | — | |
| Callon Petroleum Co. | 2,957,000 | — | (2,957,000 | ) | — | | — | | — | | 14,310,882 | |
| Callon Petroleum Co., senior secured note, | | | | | | | | | | | | |
| 13.00%, 9/15/16 | 55,135,500 | — | (55,135,500 | ) | — | | — | | 2,667,328 | | 504,178 | |
| CEVA Group PLC, Dollar Tranche B L/C, | | | | | | | | | | | | |
| 5.247%, 8/31/16 | 13,684,211 | — | (13,684,211 | ) | — | | — | | 400,263 | | 261,140 | |
| CEVA Group PLC, first lien, 144A, 7.00%, | | | | | | | | | | | | |
| 3/01/21 | — | 15,000,000 | — | | 15,000,000 | | 15,075,000 | | 557,083 | | — | |
| CEVA Group PLC, Pre-Funded L/C, 6.50%, | | | | | | | | | | | | |
| 3/19/21 | — | 20,320,197 | — | | 20,320,197 | | 19,744,465 | | 642,062 | | — | |
| CEVA Group PLC, secured note, 144A, | | | | | | | | | | | | |
| 9.00%, 9/01/21 | — | 20,000,000 | — | | 20,000,000 | | 20,187,500 | | 955,000 | | — | |
| CEVA Group PLC, senior note, first lien, | | | | | | | | | | | | |
| 144A, 4.00%, 5/01/18 | 261,778,982 | — | (75,000,000 | ) | 186,778,982 | | 172,303,611 | | 8,797,035 | | (5,758,487 | ) |
| CEVA Holdings LLC | 91,371 | — | — | | 91,371 | | 100,508,166 | | — | | — | |
| CEVA Holdings LLC, cvt. pfd., A-1 | 2,897 | — | — | | 2,897 | | 4,490,738 | | — | | — | |
| CEVA Holdings LLC, cvt. pfd., A-2 | 112,565 | — | (2,000 | ) | 110,565 | | 121,621,588 | | — | | (1,084,686 | ) |
| Dex Media Inc. | 2,048,551 | — | — | | 2,048,551 | | 19,584,148 | | — | | — | |
| Dex Media Inc., senior sub. note, PIK, | | | | | | | | | | | | |
| 14.00%, 1/29/17 | 38,640,842 | 2,759,970 | — | | 41,400,812 | | 26,910,528 | | 2,752,194 | | — | |
| Dex Media West LLC, Term Loan B, 8.00%, | | | | | | | | | | | | |
| 12/30/16 | 3,865,349 | — | (2,383,242 | ) | 1,482,107 | | 1,374,654 | | 106,850 | | (21,356 | ) |
| Dynegy Holdings Inc., Escrow Account | 1,024,235,000 | — | — | | 1,024,235,000 | | — | | — | | — | |
| Dynegy Inc. | 25,058,906 | — | (9,058,906 | ) | 16,000,000 | | 461,760,000 | | — | | (118,159,009 | ) |
| Dynegy Inc., senior note, 5.875%, 6/01/23 | 75,000,000 | 30,000,000 | — | | 105,000,000 | | 98,437,500 | | 6,013,715 | | — | |
| Dynegy Inc., wts., 10/02/17 | 1,143,273 | — | — | | 1,143,273 | | 4,733,150 | | — | | — | |
| Dynegy Roseton Danskammer Pass Through | | | | | | | | | | | | |
| Trust, Escrow Account, B | 40,000,000 | — | — | | 40,000,000 | | — | | — | | — | |
| aR.H. Donnelley Inc., Term Loan B, 9.75%, | | | | | | | | | | | | |
| 12/30/16 | 40,152,231 | — | (17,874,385 | ) | 22,277,846 | | 16,429,911 | | 3,720,115 | | (487,214 | ) |
| Total Affiliated Securities (Value is 1.86% of Net Assets) | | | | | $ | 1,750,660,959 | $ | 45,736,645 | $ | (110,434,552 | ) |
*In U.S. dollars unless otherwise indicated.
aCompany is a wholly owned subsidiary of Dex Media Inc.
140 | Annual Report franklintempleton.com
FRANKLIN CUSTODIAN FUNDS
NOTES TO FINANCIAL STATEMENTS
11. Credit Facility
The Funds, together with other U.S. registered and foreign investment funds (collectively, Borrowers), managed by Franklin Templeton Investments, are borrowers in a joint syndicated senior unsecured credit facility totaling $1.5 billion (Global Credit Facility) which matures on February 13, 2015. This Global Credit Facility provides a source of funds to the Borrowers for temporary and emergency purposes, including the ability to meet future unanticipated or unusually large redemption requests.
Under the terms of the Global Credit Facility, the Funds shall, in addition to interest charged on any borrowings made by the Funds and other costs incurred by the Funds, pay their share of fees and expenses incurred in connection with the implementation and maintenance of the Global Credit Facility, based upon their relative share of the aggregate net assets of all of the Borrowers, including an annual commitment fee of 0.07% based upon the unused portion of the Global Credit Facility. These fees are reflected in other expenses on the Statements of Operations. During the year ended September 30, 2014, the Funds did not use the Global Credit Facility.
12. Fair Value Measurements
The Funds follow a fair value hierarchy that distinguishes between market data obtained from independent sources (observable inputs) and the Funds’ own market assumptions (unobservable inputs). These inputs are used in determining the value of the Funds’ financial instruments and are summarized in the following fair value hierarchy:
- Level 1 – quoted prices in active markets for identical financial instruments
- Level 2 – other significant observable inputs (including quoted prices for similar financial instruments, interest rates, prepayment speed, credit risk, etc.)
- Level 3 – significant unobservable inputs (including the Funds’ own assumptions in determining the fair value of financial instruments)
The input levels are not necessarily an indication of the risk or liquidity associated with financial instruments at that level.
For movements between the levels within the fair value hierarchy, the Funds have adopted a policy of recognizing the transfers as of the date of the underlying event which caused the movement.
A summary of inputs used as of September 30, 2014, in valuing the Funds’ assets and liabilities carried at fair value, is as follows:
| | | | | | | | |
| | | Level 1 | | Level 2 | | Level 3 | | Total |
| Franklin DynaTech Fund | | | | | | | | |
| Assets: | | | | | | | | |
| Investments in Securities: | | | | | | | | |
| Equity Investmentsa | $ | 2,205,796,561 | $ | — | $ | — | $ | 2,205,796,561 |
| Short Term Investments | | 63,171,650 | | — | | — | | 63,171,650 |
| Total Investments in Securities | $ | 2,268,968,211 | $ | — | $ | — | $ | 2,268,968,211 |
| Franklin Growth Fund | | | | | | | | |
| Assets: | | | | | | | | |
| Investments in Securities: | | | | | | | | |
| Equity Investmentsa | $ | 9,343,603,597 | $ | — | $ | — | $ | 9,343,603,597 |
| Short Term Investments | | 520,027,951 | | 102,946,023 | | — | | 622,973,974 |
| Total Investments in Securities | $ | 9,863,631,548 | $ | 102,946,023 | $ | — | $ | 9,966,577,571 |
franklintempleton.com Annual Report | 141
| | | | | | | | | |
| FRANKLIN CUSTODIAN FUNDS | | | | | | | | | |
| NOTES TO FINANCIAL STATEMENTS | | | | | | | | | |
| |
| |
| |
| |
| 12. Fair Value Measurements (continued) | | | | | | | | | |
| | | Level 1 | | Level 2 | | Level 3 | | | Total |
| Franklin Income Fund | | | | | | | | | |
| Assets: | | | | | | | | | |
| Investments in Securities: | | | | | | | | | |
| Equity Investments:b | | | | | | | | | |
| Energy | $ | 7,888,033,651 | $ | 651,135,402 | $ | — | | $ | 8,539,169,053 |
| Financials | | 4,743,782,423 | | 257,687,500 | | — | | | 5,001,469,923 |
| Industrials | | 3,696,197,028 | | 226,620,492 | | — | | | 3,922,817,520 |
| Information Technology | | 1,937,147,281 | | — | | 86,184,148 | | | 2,023,331,429 |
| Utilities | | 11,270,051,286 | | 123,550,000 | | — | | | 11,393,601,286 |
| All Other Equity Investmentsa | | 17,506,158,298 | | — | | — | | | 17,506,158,298 |
| Equity-Linked Securities | | — | | 7,907,157,387 | | — | | | 7,907,157,387 |
| Convertible Bonds | | — | | 856,291,741 | | — | | | 856,291,741 |
| Corporate Bonds | | — | | 32,847,875,826 | | — | | | 32,847,875,826 |
| Senior Floating Rate Interests | | — | | 3,202,004,824 | | — | | | 3,202,004,824 |
| Escrows and Litigation Trusts | | — | | — | | 150,000 | c | | 150,000 |
| Short Term Investments | | 584,780,335 | | 136,744,420 | | — | | | 721,524,755 |
| Total Investments in Securities | $ | 47,626,150,302 | $ | 46,209,067,592 | $ | 86,334,148 | | $ | 93,921,552,042 |
| Franklin U.S. Government Securities Fund | | | | | | | | | |
| Assets: | | | | | | | | | |
| Investments in Securities: | | | | | | | | | |
| Mortgage-Backed Securities | $ | — | $ | 6,815,142,058 | $ | — | | $ | 6,815,142,058 |
| Short Term Investments | | 93,769,881 | | — | | — | | | 93,769,881 |
| Total Investments in Securities | $ | 93,769,881 | $ | 6,815,142,058 | $ | — | | $ | 6,908,911,939 |
| Franklin Utilities Fund | | | | | | | | | |
| Assets: | | | | | | | | | |
| Investments in Securities: | | | | | | | | | |
| Equity Investmentsa | $ | 5,412,944,976 | $ | — | $ | — | | $ | 5,412,944,976 |
| Corporate Bonds | | — | | 50,941,150 | | — | | | 50,941,150 |
| Senior Floating Rate Interests | | — | | 26,698,255 | | — | | | 26,698,255 |
| Short Term Investments | | 70,794,082 | | 177,935,000 | | — | | | 248,729,082 |
| Total Investments in Securities | $ | 5,483,739,058 | $ | 255,574,405 | $ | — | | $ | 5,739,313,463 |
aFor detailed categories, see the accompanying Statement of Investments.
bIncludes common, preferred and convertible preferred stocks as well as other equity investments.
cIncludes securities determined to have no value at September 30, 2014.
A reconciliation of assets in which Level 3 inputs are used in determining fair value is presented when there are significant Level 3 financial instruments at the end of the year.
13. New Accounting Pronouncements
In June 2013, the Financial Accounting Standards Board (FASB) issued Accounting Standards Update (ASU) No. 2013-08, Investment Companies (Topic 946): Amendments to the Scope, Measurement, and Disclosure Requirements. The ASU modifies the criteria used in defining an investment company under U.S. Generally Accepted Accounting Principles and also sets forth certain measurement and disclosure requirements. Under the ASU, an entity that is registered under the 1940 Act automatically qualifies as an investment company. The ASU is effective for interim and annual reporting periods beginning after December 15, 2013. Management has reviewed the requirements and believes the adoption of this ASU will not have a material impact on the financial statements.
142 | Annual Report franklintempleton.com
FRANKLIN CUSTODIAN FUNDS
NOTES TO FINANCIAL STATEMENTS
In June 2014, FASB issued ASU No. 2014-11, Transfers and Servicing (Topic 860), Repurchase-to-Maturity Transactions, Repurchase Financings, and Disclosures. The ASU changes the accounting for certain repurchase agreements and expands disclosure requirements related to repurchase agreements, securities lending, repurchase-to-maturity and similar transactions. The ASU is effective for interim and annual reporting periods beginning after December 15, 2014. Management is currently evaluating the impact, if any, of applying this provision.
14. Subsequent Events
The Funds have evaluated subsequent events through the issuance of the financial statements and determined that no events have occurred that require disclosure.
| | |
| Abbreviations | | |
| Currency | Selected Portfolio |
| EUR Euro | ADR | American Depositary Receipt |
| GBP British Pound | DIP | Debtor-In-Possession |
| | FHLB | Federal Home Loan Bank |
| | FHLMC | Federal Home Loan Mortgage Corp. |
| | FNMA | Federal National Mortgage Association |
| | FRN | Floating Rate Note |
| | GP | Graduated Payment |
| | L/C | Letter of Credit |
| | MTN | Medium Term Note |
| | PIK | Payment-In-Kind |
| | SF | Single Family |
franklintempleton.com Annual Report | 143
FRANKLIN CUSTODIAN FUNDS
Report of Independent Registered Public Accounting Firm
To the Board of Trustees and Shareholders of The Franklin Custodian Funds
In our opinion, the accompanying statements of assets and liabilities, including the statements of investments, and the related statements of operations and of changes in net assets and the financial highlights present fairly, in all material respects, the financial position of Franklin DynaTech Fund, Franklin Growth Fund, Franklin Income Fund, Franklin U.S. Government Securities Fund and Franklin Utilities Fund (constituting The Franklin Custodian Funds, hereafter referred to as the “Funds”) at September 30, 2014, the results of each of their operations for the year then ended, the changes in each of their net assets for each of the two years in the period then ended and the financial highlights for each of the periods presented, in conformity with accounting principles generally accepted in the United States of America. These financial statements and financial highlights (hereafter referred to as “financial statements”) are the responsibility of the Funds’ management. Our responsibility is to express an opinion on these financial statements based on our audits. We conducted our audits of these financial statements in accordance with the standards of the Public Company Accounting Oversight Board (United States). Those standards require that we plan and perform the audit to obtain reasonable assurance about whether the financial statements are free of material misstatement. An audit includes examining, on a test basis, evidence supporting the amounts and disclosures in the financial statements, assessing the accounting principles used and significant estimates made by management, and evaluating the overall financial statement presentation. We believe that our audits, which included confirmation of securities at September 30, 2014 by correspondence with the custodian and brokers, provide a reasonable basis for our opinion.
PricewaterhouseCoopers LLP
San Francisco, California
November 17, 2014
144 | Annual Report franklintempleton.com
FRANKLIN CUSTODIAN FUNDS
Tax Information (unaudited)
Under Section 852(b)(3)(C) of the Internal Revenue Code (Code), the Funds hereby report the maximum amount allowable but no less than the following amounts as long term capital gain dividends for the fiscal year ended September 30, 2014:
| | | |
| | Franklin | | Franklin |
| | DynaTech Fund | | Utilities Fund |
| $ | 76,939,871 | $ | 11,446,235 |
Under Section 871(k)(2)(C) of the Code, Franklin Utilities Fund hereby reports the maximum amount allowable but no less than $423,935 as short term capital gain dividends for purposes of the tax imposed under Section 871(a)(1)(A) of the Code for the fiscal year ended September 30, 2014.
Under Section 854(b)(1)(A) of the Code, the Funds hereby report the following percentage amounts of the ordinary income dividends as income qualifying for the dividends received deduction for the fiscal year ended September 30, 2014:
| | | | | |
| Franklin | | Franklin | | Franklin | |
| Growth Fund | | Income Fund | | Utilities Fund | |
| 100.00 | % | 28.49 | % | 100.00 | % |
Under Section 854(b)(1)(B) of the Code, the Funds hereby report the maximum amount allowable but no less than the following amounts as qualified dividends for purposes of the maximum rate under Section 1(h)(11) of the Code for the fiscal year ended September 30, 2014:
| | | | | | | |
| | Franklin | | Franklin | | Franklin | | Franklin |
| | DynaTech Fund | | Growth Fund | | Income Fund | | Utilities Fund |
| $ | 9,496,052 | $ | 123,781,357 | $ | 1,771,067,151 | $ | 191,696,119 |
Distributions, including qualified dividend income, paid during calendar year 2014 will be reported to shareholders on Form 1099-DIV by mid-February 2015. Shareholders are advised to check with their tax advisors for information on the treatment of these amounts on their individual income tax returns.
Under Section 871(k)(1)(C) of the Code, the Funds hereby report the maximum amount allowable but no less than the following amounts as interest related dividends for purposes of the tax imposed under Section 871(a)(1)(A) of the Code for the fiscal year ended September 30, 2014:
| | | | | |
| | | | Franklin | | |
| | Franklin | | U.S. Government | | Franklin |
| | Income Fund | | Securities Fund | | Utilities Fund |
| $ | 1,770,106,215 | $ | 244,083,932 | $ | 4,943,978 |
franklintempleton.com Annual Report | 145
FRANKLIN CUSTODIAN FUNDS
Board Members and Officers
The name, year of birth and address of the officers and board members, as well as their affiliations, positions held with the Trust, principal occupations during at least the past five years and number of portfolios overseen in the Franklin Templeton Investments fund complex are shown below. Generally, each board member serves until that person’s successor is elected and qualified.
| | | | |
| Independent Board Members | | | |
| |
| | | | Number of Portfolios in | |
| Name, Year of Birth | | Length of | Fund Complex Overseen | Other Directorships Held |
| and Address | Position | Time Served | by Board Member* | During at Least the Past 5 Years |
| |
| Harris J. Ashton (1932) | Trustee | Since 1976 | 138 | Bar-S Foods (meat packing company) |
| One Franklin Parkway | | | | (1981-2010). |
| San Mateo, CA 94403-1906 | | | | |
| Principal Occupation During at Least the Past 5 Years: | | |
| Director of various companies; and formerly, Director, RBC Holdings, Inc. (bank holding company) (until 2002); and President, Chief Executive |
| Officer and Chairman of the Board, General Host Corporation (nursery and craft centers) (until 1998). | |
| |
| Mary C. Choksi (1950) | Trustee | Since | 112 | Avis Budget Group Inc. (car rental), |
| One Franklin Parkway | | October 2014 | | Omnicom Group Inc. (advertising and |
| San Mateo, CA 94403-1906 | | | | marketing communications services) |
| | | | | and H.J. Heinz Company (processed |
| | | | | foods and allied products) (1998-2006). |
| |
| Principal Occupation During at Least the Past 5 Years: | | |
| Founding Partner and Senior Managing Director, Strategic Investment Group (investment management group) (1987-present); director of |
| various companies; and formerly, Founding Partner and Managing Director, Emerging Markets Management LLC (investment management |
| firm) (1987-2011); Loan Officer/Senior Loan Officer/Senior Pension Investment Officer, World Bank Group (international financial institution) |
| (1977-1987). | | | | |
| |
| Sam Ginn (1937) | Trustee | Since 2007 | 112 | ICO Global Communications |
| One Franklin Parkway | | | | (Holdings) Limited (satellite company) |
| San Mateo, CA 94403-1906 | | | | (2006-2010), Chevron Corporation |
| | | | | (global energy company) (1989-2009), |
| | | | | Hewlett-Packard Company (technology |
| | | | | company) (1996-2002), Safeway, Inc. |
| | | | | (grocery retailer) (1991-1998) and |
| | | | | TransAmerica Corporation (insurance |
| | | | | company) (1989-1999). |
| |
| Principal Occupation During at Least the Past 5 Years: | | |
| Private investor; and formerly, Chairman, First Responder Network Authority (FirstNet) (interoperable wireless broadband network) (2012-2014); |
| Chairman of the Board, Vodafone AirTouch, PLC (wireless company) (1999-2000); Chairman of the Board and Chief Executive Officer, AirTouch |
| Communications (cellular communications) (1993-1998) and Pacific Telesis Group (telephone holding company) (1988-1994). |
| |
| Edith E. Holiday (1952) | Trustee | Since 1998 | 138 | Hess Corporation (exploration and |
| One Franklin Parkway | | | | refining of oil and gas), H.J. Heinz |
| San Mateo, CA 94403-1906 | | | | Company (processed foods and |
| | | | | allied products) (1994-2013), RTI |
| | | | | International Metals, Inc. (manufacture |
| | | | | and distribution of titanium), Canadian |
| | | | | National Railway (railroad) and White |
| | | | | Mountains Insurance Group, Ltd. |
| | | | | (holding company). |
| |
| Principal Occupation During at Least the Past 5 Years: | | |
| Director or Trustee of various companies and trusts; and formerly, Assistant to the President of the United States and Secretary of the |
| Cabinet (1990-1993); General Counsel to the United States Treasury Department (1989-1990); and Counselor to the Secretary and Assistant |
| Secretary for Public Affairs and Public Liaison – United States Treasury Department (1988-1989). | |
| |
| |
| |
| |
| 146 | Annual Report | | | | franklintempleton.com |
FRANKLIN CUSTODIAN FUNDS
| | | | |
| Independent Board Members (continued) | | |
| |
| | | | Number of Portfolios in | |
| Name, Year of Birth | | Length of | Fund Complex Overseen | Other Directorships Held |
| and Address | Position | Time Served | by Board Member* | During at Least the Past 5 Years |
| |
| J. Michael Luttig (1954) | Trustee | Since 2009 | 138 | Boeing Capital Corporation |
| One Franklin Parkway | | | | (aircraft financing) (2006-2013). |
| San Mateo, CA 94403-1906 | | | | |
| |
| Principal Occupation During at Least the Past 5 Years: | | |
| Executive Vice President, General Counsel and member of the Executive Council, The Boeing Company (aerospace company); and formerly, |
| Federal Appeals Court Judge, U.S. Court of Appeals for the Fourth Circuit (1991-2006). | |
| |
| Frank A. Olson (1932) | Trustee | Since 2005 | 138 | Hess Corporation (exploration and |
| One Franklin Parkway | | | | refining of oil and gas) (1998-2013). |
| San Mateo, CA 94403-1906 | | | | |
| |
| Principal Occupation During at Least the Past 5 Years: | | |
| Director of various companies; and formerly, Chairman of the Board, The Hertz Corporation (car rental) (1980-2000) and Chief Executive |
| Officer (1977-1999); and Chairman of the Board, President and Chief Executive Officer, UAL Corporation (airlines) (June-December 1987). |
| |
| Larry D. Thompson (1945) | Trustee | Since 2007 | 138 | Cbeyond, Inc. (business communi- |
| One Franklin Parkway | | | | cations provider) (2010-2012), The |
| San Mateo, CA 94403-1906 | | | | Southern Company (energy company) |
| | | | | (2010-2012) and Graham Holdings |
| | | | | Company (formerly, The Washington |
| | | | | Post Company) (education and media |
| | | | | organization). |
| Principal Occupation During at Least the Past 5 Years: | | |
| Executive Vice President – Government Affairs, General Counsel and Corporate Secretary, PepsiCo, Inc. (consumer products) (2012-present); |
| and formerly, John A. Sibley Professor of Corporate and Business Law, University of Georgia School of Law (2011-2012); Senior Vice |
| President – Government Affairs, General Counsel and Secretary, PepsiCo, Inc. (2004-2011); Senior Fellow of The Brookings Institution |
| (2003-2004); Visiting Professor, University of Georgia School of Law (2004); and Deputy Attorney General, U.S. Department of Justice |
| (2001-2003). | | | | |
| |
| John B. Wilson (1959) | Lead | Trustee since | 112 | None |
| One Franklin Parkway | Independent | 2007 and Lead | | |
| San Mateo, CA 94403-1906 | Trustee | Independent | | |
| | | Trustee since 2008 | | |
| Principal Occupation During at Least the Past 5 Years: | | |
| President, Staples Europe (office supplies) (2012-present); President and Founder, Hyannis Port Capital, Inc. (real estate and private equity |
| investing); serves on private and non-profit boards; and formerly, Chief Operating Officer and Executive Vice President, Gap, Inc. (retail) |
| (1996-2000); Chief Financial Officer and Executive Vice President – Finance and Strategy, Staples, Inc. (1992-1996); Senior Vice President – |
| Corporate Planning, Northwest Airlines, Inc. (airlines) (1990-1992); and Vice President and Partner, Bain & Company (consulting firm) |
| (1986-1990). | | | | |
| |
| |
| |
| |
| franklintempleton.com | | | | Annual Report | 147 |
| | | | |
| FRANKLIN CUSTODIAN FUNDS | | | |
| |
| |
| |
| |
| Interested Board Members and Officers | | |
| |
| | | | Number of Portfolios in | |
| Name, Year of Birth | | Length of | Fund Complex Overseen | Other Directorships Held |
| and Address | Position | Time Served | by Board Member* | During at Least the Past 5 Years |
| |
| **Gregory E. Johnson (1961) | Trustee | Since 2013 | 148 | None |
| One Franklin Parkway | | | | |
| San Mateo, CA 94403-1906 | | | | |
| |
| Principal Occupation During at Least the Past 5 Years: | | |
| Chairman of the Board, Member – Office of the Chairman, Director, President and Chief Executive Officer, Franklin Resources, Inc.; officer |
| and/or director or trustee, as the case may be, of some of the other subsidiaries of Franklin Resources, Inc. and of 44 of the investment |
| companies in Franklin Templeton Investments; and Chairman, Investment Company Institute. | |
| |
| **Rupert H. Johnson, Jr. (1940) Trustee and | Chairman of the | 138 | None |
| One Franklin Parkway | Vice President | Board since 2013, | | |
| San Mateo, CA 94403-1906 | | Trustee since 1983 | | |
| | | and Vice President | | |
| | | since 1982 | | |
| |
| Principal Occupation During at Least the Past 5 Years: | | |
| Vice Chairman, Member – Office of the Chairman and Director, Franklin Resources, Inc.; Director, Franklin Advisers, Inc.; Senior Vice |
| President, Franklin Advisory Services, LLC; and officer and/or director or trustee, as the case may be, of some of the other subsidiaries |
| of Franklin Resources, Inc. and of 41 of the investment companies in Franklin Templeton Investments. | |
| |
| Alison E. Baur (1964) | Vice President | Since 2012 | Not Applicable | Not Applicable |
| One Franklin Parkway | | | | |
| San Mateo, CA 94403-1906 | | | | |
| |
| Principal Occupation During at Least the Past 5 Years: | | |
| Deputy General Counsel, Franklin Templeton Investments; and officer of some of the other subsidiaries of Franklin Resources, Inc. and of |
| 46 of the investment companies in Franklin Templeton Investments. | | |
| |
| Laura F. Fergerson (1962) | Chief Executive Since 2009 | Not Applicable | Not Applicable |
| One Franklin Parkway | Officer – | | | |
| San Mateo, CA 94403-1906 | Finance and | | | |
| | Administration | | | |
| Principal Occupation During at Least the Past 5 Years: | | |
| Senior Vice President, Franklin Templeton Services, LLC; and officer of 46 of the investment companies in Franklin Templeton Investments. |
| |
| Gaston Gardey (1967) | Treasurer, | Since 2009 | Not Applicable | Not Applicable |
| One Franklin Parkway | Chief Financial | | | |
| San Mateo, CA 94403-1906 | Officer and | | | |
| | Chief | | | |
| | Accounting | | | |
| | Officer | | | |
| Principal Occupation During at Least the Past 5 Years: | | |
| Director, Fund Accounting, Franklin Templeton Investments; and officer of 27 of the investment companies in Franklin Templeton Investments. |
148 | Annual Report franklintempleton.com
FRANKLIN CUSTODIAN FUNDS
| | | | |
| Interested Board Members and Officers (continued) | |
| |
| | | | Number of Portfolios in | |
| Name, Year of Birth | | Length of | Fund Complex Overseen | Other Directorships Held |
| and Address | Position | Time Served | by Board Member* | During at Least the Past 5 Years |
| |
| Aliya S. Gordon (1973) | Vice President | Since 2009 | Not Applicable | Not Applicable |
| One Franklin Parkway | | | | |
| San Mateo, CA 94403-1906 | | | | |
| |
| Principal Occupation During at Least the Past 5 Years: | | |
| Senior Associate General Counsel, Franklin Templeton Investments; officer of 46 of the investment companies in Franklin Templeton |
| Investments; and formerly, Litigation Associate, Steefel, Levitt & Weiss, LLP (2000-2004). | |
| |
| Steven J. Gray (1955) | Vice President | Since 2009 | Not Applicable | Not Applicable |
| One Franklin Parkway | | | | |
| San Mateo, CA 94403-1906 | | | | |
| |
| Principal Occupation During at Least the Past 5 Years: | | |
| Senior Associate General Counsel, Franklin Templeton Investments; Vice President, Franklin Templeton Distributors, Inc. and Franklin |
| Alternative Strategies Advisers, LLC; and officer of 46 of the investment companies in Franklin Templeton Investments. |
| |
| Selena L. Holmes (1965) | Vice President | Since 2012 | Not Applicable | Not Applicable |
| 100 Fountain Parkway | – AML | | | |
| St. Petersburg, FL 33716-1205 | Compliance | | | |
| |
| Principal Occupation During at Least the Past 5 Years: | | |
| Director, Global Compliance Monitoring; Chief Compliance Officer, Franklin Alternative Strategies Advisers, LLC; Vice President, Franklin |
| Templeton Companies, LLC; and officer of 46 of the investment companies in Franklin Templeton Investments. |
| |
| Edward B. Jamieson (1948) | President and | Since 2010 | Not Applicable | Not Applicable |
| One Franklin Parkway | Chief Executive | | | |
| San Mateo, CA 94403-1906 | Officer – | | | |
| | Investment | | | |
| | Management | | | |
| |
| Principal Occupation During at Least the Past 5 Years: | | |
| President, Chief Investment Officer and Director, Franklin Advisers, Inc.; Executive Vice President, Franklin Templeton Institutional, LLC; |
| and officer and/or trustee, as the case may be, of some of the other subsidiaries of Franklin Resources, Inc. and of 10 of the investment |
| companies in Franklin Templeton Investments. | | | |
| |
| Kimberly H. Novotny (1972) | Vice President | Since 2013 | Not Applicable | Not Applicable |
| 300 S.E. 2nd Street | | | | |
| Fort Lauderdale, FL 33301-1923 | | | | |
| |
| Principal Occupation During at Least the Past 5 Years: | | |
| Associate General Counsel, Franklin Templeton Investments; Vice President and Secretary, Fiduciary Trust International of the South; Vice |
| President, Templeton Investment Counsel, LLC; Assistant Secretary, Franklin Resources, Inc.; and officer of 46 of the investment companies |
| in Franklin Templeton Investments. | | | |
| |
| Robert C. Rosselot (1960) | Chief | Since 2013 | Not Applicable | Not Applicable |
| 300 S.E. 2nd Street | Compliance | | | |
| Fort Lauderdale, FL 33301-1923 | Officer | | | |
| |
| Principal Occupation During at Least the Past 5 Years: | | |
| Director, Global Compliance, Franklin Templeton Investments; Vice President, Franklin Templeton Companies, LLC; officer of 46 of the |
| investment companies in Franklin Templeton Investments; and formerly, Senior Associate General Counsel, Franklin Templeton Investments |
| (2007-2013); and Secretary and Vice President, Templeton Group of Funds (2004-2013). | |
franklintempleton.com Annual Report | 149
FRANKLIN CUSTODIAN FUNDS
| | | | |
| Interested Board Members and Officers (continued) | |
| |
| | | | Number of Portfolios in | |
| Name, Year of Birth | | Length of | Fund Complex Overseen | Other Directorships Held |
| and Address | Position | Time Served | by Board Member* | During at Least the Past 5 Years |
| |
| Karen L. Skidmore (1952) | Vice President | Since 2006 | Not Applicable | Not Applicable |
| One Franklin Parkway | and Secretary | | | |
| San Mateo, CA 94403-1906 | | | | |
| |
| Principal Occupation During at Least the Past 5 Years: | | |
| Senior Associate General Counsel, Franklin Templeton Investments; and officer of 46 of the investment companies in Franklin Templeton |
| Investments. | | | | |
| |
| Craig S. Tyle (1960) | Vice President | Since 2005 | Not Applicable | Not Applicable |
| One Franklin Parkway | | | | |
| San Mateo, CA 94403-1906 | | | | |
| |
| Principal Occupation During at Least the Past 5 Years: | | |
| General Counsel and Executive Vice President, Franklin Resources, Inc.; and officer of some of the other subsidiaries of Franklin Resources, |
| Inc. and of 46 of the investment companies in Franklin Templeton Investments. | |
| |
| Lori A. Weber (1964) | Vice President | Since 2011 | Not Applicable | Not Applicable |
| 300 S.E. 2nd Street | | | | |
| Fort Lauderdale, FL 33301-1923 | | | | |
| Principal Occupation During at Least the Past 5 Years: | | |
| Senior Associate General Counsel, Franklin Templeton Investments; Assistant Secretary, Franklin Resources, Inc.; Vice President and |
| Secretary, Templeton Investment Counsel, LLC; Vice President, Fiduciary Trust International of the South; and officer of 46 of the investment |
| companies in Franklin Templeton Investments. | | | |
*We base the number of portfolios on each separate series of the U.S. registered investment companies within the Franklin Templeton Investments fund complex. These
portfolios have a common investment manager or affiliated investment managers.
**Gregory E. Johnson is considered to be an interested person of the Fund under the federal securities laws due to his position as an officer and director of Franklin
Resources, Inc. (Resources), which is the parent company of the Fund’s investment manager and distributor. Rupert H. Johnson, Jr. is considered to be an interested
person of the Fund under the federal securities laws due to his position as officer and director and major shareholder of Resources.
Note 1: Rupert H. Johnson, Jr. is the uncle of Gregory E. Johnson.
Note 2: Officer information is current as of the date of this report. It is possible that after this date, information about officers may change.
The Sarbanes-Oxley Act of 2002 and Rules adopted by the Securities and Exchange Commission require the Fund to disclose whether the Fund’s Audit Committee
includes at least one member who is an audit committee financial expert within the meaning of such Act and Rules. The Fund’s Board has determined that there
is at least one such financial expert on the Audit Committee and has designated John B. Wilson as its audit committee financial expert. The Board believes that
Mr. Wilson qualifies as such an expert in view of his extensive business background and experience, including service as chief financial officer of Staples, Inc.
from 1992 to 1996. Mr. Wilson has been a Member and Chairman of the Fund’s Audit Committee since 2007. As a result of such background and experience, the
Board believes that Mr. Wilson has acquired an understanding of generally accepted accounting principles and financial statements, the general application of
such principles in connection with the accounting estimates, accruals and reserves, and analyzing and evaluating financial statements that present a breadth
and level of complexity of accounting issues generally comparable to those of the Fund, as well as an understanding of internal controls and procedures for
financial reporting and an understanding of audit committee functions. Mr. Wilson is an independent Board member as that term is defined under the relevant
Securities and Exchange Commission Rules and Releases.
The Statement of Additional Information (SAI) includes additional information about the board members and is available, without charge, upon request.
Shareholders may call (800) DIAL BEN/342-5236 to request the SAI.
150 | Annual Report franklintempleton.com
FRANKLIN CUSTODIAN FUNDS
Shareholder Information
Proxy Voting Policies and Procedures
The Trust’s investment manager has established Proxy Voting Policies and Procedures (Policies) that the Trust uses to determine how to vote proxies relating to portfolio securities. Shareholders may view the Trust’s complete Policies online at franklintempleton.com. Alternatively, shareholders may request copies of the Policies free of charge by calling the Proxy Group collect at (954) 527-7678 or by sending a written request to: Franklin Templeton Companies, LLC, 300 S.E. 2nd Street, Fort Lauderdale, FL 33301, Attention: Proxy Group. Copies of the Trust’s proxy voting records are also made available online at franklintempleton.com and posted on the U.S. Securities and Exchange Commission’s website at sec.gov and reflect the most recent 12-month period ended June 30.
Quarterly Statement of Investments
The Trust files a complete statement of investments with the U.S. Securities and Exchange Commission for the first and third quarters for each fiscal year on Form N-Q. Shareholders may view the filed Form N-Q by visiting the Commission’s website at sec.gov. The filed form may also be viewed and copied at the Commission’s Public Reference Room in Washington, DC. Information regarding the operations of the Public Reference Room may be obtained by calling (800) SEC-0330.
Householding of Reports and Prospectuses
You will receive each Fund’s financial reports every six months as well as an annual updated summary prospectus (prospectus available upon request). To reduce Fund expenses, we try to identify related shareholders in a household and send only one copy of the financial reports and summary prospectus. This process, called “householding,” will continue indefinitely unless you instruct us otherwise. If you prefer not to have these documents householded, please call us at (800) 632-2301. At any time you may view current prospectuses/summary prospectuses and financial reports on our website. If you choose, you may receive these documents through electronic delivery.
franklintempleton.com Annual Report | 151
This page intentionally left blank.
Item 2. Code of Ethics.
(a) The Registrant has adopted a code of ethics that applies to its principal executive officers and principal financial and accounting officer.
(c) N/A
(d) N/A
(f) Pursuant to Item 12(a)(1), the Registrant is attaching as an exhibit a copy of its code of ethics that applies to its principal executive officers and principal financial and accounting officer.
Item 3. Audit Committee Financial Expert.
(a)(1) The Registrant has an audit committee financial expert serving on its audit committee.
(2) The audit committee financial expert is John B. Wilson and he is "independent" as defined under the relevant Securities and Exchange Commission Rules and Releases.
Item 4. Principal Accountant Fees and Services.
(a) Audit Fees
The aggregate fees paid to the principal accountant for professional services rendered by the principal accountant for the audit of the registrant’s annual financial statements or for services that are normally provided by the principal accountant in connection with statutory and regulatory filings or engagements were $403,943 for the fiscal year ended September 30, 2014 and $473,888 for the fiscal year ended September 30, 2013.
(b) Audit-Related Fees
The aggregate fees paid to the principal accountant for assurance and related services rendered by the principal accountant to the registrant that are reasonably related to the performance of the audit of the registrant's financial statements and are not reported under paragraph (a) of Item 4 were $8,682 for the fiscal year ended September 30, 2014 and $8,682 for the fiscal year ended September 30, 2013. The services for which these fees were paid included attestation services.
There were no fees paid to the principal accountant for assurance and related services rendered by the principal accountant to the registrant's investment adviser and any entity controlling, controlled by or under common control with the investment adviser that provides ongoing services to the registrant that are reasonably related to the performance of the audit of their financial statements.
(c) Tax Fees
There were no fees paid to the principal accountant for professional services rendered by the principal accountant to the registrant for tax compliance, tax advice and tax planning.
The aggregate fees paid to the principal accountant for professional services rendered by the principal accountant to the registrant’s investment adviser and any entity controlling, controlled by or under common control with the investment adviser that provides ongoing services to the registrant for tax compliance, tax advice and tax planning were $0 for the fiscal year ended September 30, 2014 and $6,930 for the fiscal year ended September 30, 2013. The services for which these fees were paid included technical tax consultation for capital gain tax and withholding tax reporting for foreign governments and requirements on local country’s self-certification forms.
(d) All Other Fees
The aggregate fees paid to the principal accountant for products and services rendered by the principal accountant to the registrant not reported in paragraphs (a)-(c) of Item 4 were $33,912 for the fiscal year ended September 30, 2014 and $0 for the fiscal year ended September 30, 2013. The services for which these fees were paid include review of materials provided to the fund Board in connection with the investment management contract renewal process.
The aggregate fees paid to the principal accountant for products and services rendered by the principal accountant to the registrant’s investment adviser and any entity controlling, controlled by or under common control with the investment adviser that provides ongoing services to the registrant not reported in paragraphs (a)-(c) of Item 4 were $125,824 for the fiscal year ended September 30, 2014 and $39,194 for the fiscal year ended September 30, 2013. The services for which these fees were paid included preparation and review of materials provided to the fund Board in connection with the investment management contract renewal process.
(e)(1) The registrant’s audit committee is directly responsible for approving the services to be provided by the auditors, including:
(i) pre-approval of all audit and audit related services;
(ii) pre-approval of all non-audit related services to be provided to the Fund by the auditors;
(iii) pre-approval of all non-audit related services to be provided to the registrant by the auditors to the registrant’s investment adviser or to any entity that controls, is controlled by or is under common control with the registrant’s investment adviser and that provides ongoing services to the registrant where the non-audit services relate directly to the operations or financial reporting of the registrant; and
(iv) establishment by the audit committee, if deemed necessary or appropriate, as an alternative to committee pre-approval of services to be provided by the auditors, as required by paragraphs (ii) and (iii) above, of policies and procedures to permit such services to be pre-approved by other means, such as through establishment of guidelines or by action of a designated member or members of the committee; provided the policies and procedures are detailed as to the particular service and the committee is informed of each service and such policies and procedures do not include delegation of audit committee responsibilities, as contemplated under the Securities Exchange Act of 1934, to management; subject, in the case of (ii) through (iv), to any waivers, exceptions or exemptions that may be available under applicable law or rules.
(e) (2) None of the services provided to the registrant described in paragraphs (b)-(d) of Item 4 were approved by the audit committee pursuant to paragraph (c)(7)(i)(C) of Rule 2-01 of regulation S-X.
(f) No disclosures are required by this Item 4(f).
(g) The aggregate non-audit fees paid to the principal accountant for services rendered by the principal accountant to the registrant and the registrant’s investment adviser and any entity controlling, controlled by or under common control with the investment adviser that provides ongoing services to the registrant were $168,418 for the fiscal year ended September 30, 2014 and $54,806 for the fiscal year ended September 30, 2013.
(h) The registrant’s audit committee of the board has considered whether the provision of non-audit services that were rendered to the registrant’s investment adviser (not including any sub-adviser whose role is primarily portfolio management and is subcontracted with or overseen by another investment adviser), and any entity controlling, controlled by, or under common control with the investment adviser that provides ongoing services to the registrant that were not pre-approved pursuant to paragraph (c)(7)(ii) of Rule 2-01 of Regulation S-X is compatible with maintaining the principal accountant’s independence.
Item 5. Audit Committee of Listed Registrants. N/A
Item 6. Schedule of Investments. N/A
Item 7. Disclosure of Proxy Voting Policies and Procedures for Closed-End Management Investment Companies. N/A
Item 8. Portfolio Managers of Closed-End Management Investment Companies. N/A
Item 9. Purchases of Equity Securities by Closed-End Management Investment Company and Affiliated Purchasers. N/A
Item 10. Submission of Matters to a Vote of Security Holders.
There have been no changes to the procedures by which shareholders may recommend nominees to the Registrant's Board of Trustees that would require disclosure herein.
Item 11. Controls and Procedures.
(a) Evaluation of Disclosure Controls and Procedures. The Registrant maintains disclosure controls and procedures that are designed to ensure that information required to be disclosed in the Registrant’s filings under the Securities Exchange Act of 1934 and the Investment Company Act of 1940 is recorded, processed, summarized and reported within the periods specified in the rules and forms of the Securities and Exchange Commission. Such information is accumulated and communicated to the Registrant’s management, including its principal executive officer and principal financial officer, as appropriate, to allow timely decisions regarding required disclosure. The Registrant’s management, including the principal executive officer and the principal financial officer, recognizes that any set of controls and procedures, no matter how well designed and operated, can provide only reasonable assurance of achieving the desired control objectives.
Within 90 days prior to the filing date of this Shareholder Report on Form N-CSR, the Registrant had carried out an evaluation, under the supervision and with the participation of the Registrant’s management, including the Registrant’s principal executive officer and the Registrant’s principal financial officer, of the effectiveness of the design and operation of the Registrant’s disclosure controls and procedures. Based on such evaluation, the Registrant’s principal executive officer and principal financial officer concluded that the Registrant’s disclosure controls and procedures are effective.
(b) Changes in Internal Controls. There have been no changes in the Registrant’s internal controls or in other factors that could materially affect the internal controls over financial reporting subsequent to the date of their evaluation in connection with the preparation of this Shareholder Report on Form N-CSR.
Item 12. Exhibits.
(a)(1) Code of Ethics
(a)(2) Certifications pursuant to Section 302 of the Sarbanes-Oxley Act of 2002 of Laura F. Fergerson, Chief Executive Officer - Finance and Administration, and Gaston Gardey, Chief Financial Officer and Chief Accounting Officer
(b) Certifications pursuant to Section 906 of the Sarbanes-Oxley Act of 2002 of Laura F. Fergerson, Chief Executive Officer - Finance and Administration, and Gaston Gardey, Chief Financial Officer and Chief Accounting Officer
SIGNATURES
Pursuant to the requirements of the Securities Exchange Act of 1934 and the Investment Company Act of 1940, the registrant has duly caused this report to be signed on its behalf by the undersigned, thereunto duly authorized.
FRANKLIN CUSTODIAN FUNDS
By /s/Laura F. Fergerson
Laura F. Fergerson
Chief Executive Officer - Finance and Administration
Date November 25, 2014
Pursuant to the requirements of the Securities Exchange Act of 1934 and the Investment Company Act of 1940, this report has been signed below by the following persons on behalf of the registrant and in the capacities and on the dates indicated.
By /s/Laura F. Fergerson
Laura F. Fergerson
Chief Executive Officer - Finance and Administration
Date November 25, 2014
By /s/Gaston Gardey
Gaston Gardey
Chief Financial Officer and Chief Accounting Officer
Date November 25, 2014