UNITED STATES
SECURITIES AND EXCHANGE COMMISSION
Washington, DC 20549
FORM N-CSR
CERTIFIED SHAREHOLDER REPORT OF REGISTERED
MANAGEMENT INVESTMENT COMPANIES
Investment Company Act file number 811-00537
Franklin Custodian Funds
(Exact name of registrant as specified in charter)
One Franklin Parkway, San Mateo, CA 94403-1906
(Address of principal executive offices) (Zip code)
Craig S. Tyle, One Franklin Parkway, San Mateo, CA 94403-1906
(Name and address of agent for service)
Registrant’s telephone number, including area code: 650 312-2000
Date of fiscal year end: 9/30
Date of reporting period: 9/30/17
| Item 1. | Reports to Stockholders. |

Franklin Templeton Investments
Gain From Our Perspective®
At Franklin Templeton Investments, we’re dedicated to one goal: delivering exceptional asset management for our clients. By bringing together multiple, world-class investment teams in a single firm, we’re able to offer specialized expertise across styles and asset classes, all supported by the strength and resources of one of the world’s largest asset managers. This has helped us to become a trusted partner to individual and institutional investors across the globe.
Dear Fellow Shareholder:
During the 12 months ended September 30, 2017, the US economy expanded due to growth in consumer spending, business investment, exports and federal government spending. The US Federal Reserve increased its target range by 0.25% three times during the period, noting improved employment and business spending. Within this environment, US stocks, as measured by the Standard & Poor’s 500® Index, generated a +18.61% total return for the 12-month period.1 Investment-grade bonds, as measured by the Bloomberg Barclays US Aggregate Bond Index, posted a +0.07% total return.1 The 10-year US Treasury yield began the period at 1.60% and ended the period at 2.33%.
We are committed to our long-term perspective and disciplined investment approach as we conduct rigorous, fundamental analysis of securities with a regular emphasis on investment risk management.
We believe active, professional investment management serves investors well. We also recognize the important role of financial advisors in today’s markets and encourage investors to continue to seek their advice. Amid changing markets and economic conditions, we are confident investors with a well-diversified portfolio and a patient, long-term outlook will be well positioned for the years ahead.
Franklin Custodian Funds’ annual report includes more detail about prevailing conditions and a discussion about investment decisions during the period. Please remember all securities markets fluctuate, as do mutual fund share prices.
We thank you for investing with Franklin Templeton, welcome your questions and comments, and look forward to serving your future investment needs.
Sincerely,

Rupert H. Johnson, Jr.
Chairman
Franklin Custodian Funds
This letter reflects our analysis and opinions as of September 30, 2017, unless otherwise indicated. The information is not a complete analysis of every aspect of any market, country, industry, security or fund. Statements of fact are from sources considered reliable.
1. Source: Morningstar.
See: www.franklintempletondatasources.com for additional data provider information.
| | |
| | Not FDIC Insured | May Lose Value | No Bank Guarantee |
| | | | |
| franklintempleton.com | | Not part of the annual report | | 1 |
| | |
|
| Visit franklintempleton.com for fund updates, to access your account, or to find helpful financial planning tools. |
| | | | |
| 2 | | Annual Report | | franklintempleton.com |
Annual Report
Economic and Market Overview
The US economy expanded during the 12-month period ended September 30, 2017. The economy strengthened in 2017’s second and third quarters after moderating in the previous two quarters, largely due to growth in consumer spending, business investment, exports and federal government spending. The manufacturing and services sectors expanded during the period. The unemployment rate decreased from 4.9% in September 2016 to 4.2% at period-end.1 Monthly retail sales were volatile, but were positive during most of the period. Annual inflation, as measured by the Consumer Price Index, increased from 1.5% in September 2016 to 2.2% at period-end.1
The US Federal Reserve (Fed) raised its target range for the federal funds rate by 0.25% three times during the period, amid signs of a growing US economy, strengthening labor market and improving business spending. At its July and September 2017 meetings, the Fed kept its target range unchanged. Furthermore in September, the Fed mentioned that it would begin implementing its balance sheet reduction in October.
US equity markets rose during the 12-month period, benefiting from mostly upbeat economic data, better US corporate earnings, and signs of improvement in the Chinese and European economies. The markets were also supported by investor optimism arising from pro-growth and pro-business policy plans in the US; Emmanuel Macron’s victory in France’s presidential election; comments from the US Fed chair indicating optimism about the US economy and the likelihood of gradual rate hikes; and the Republican tax reform plan. However, concerns about the terms of the UK’s exit from the European Union (also known as “Brexit”), uncertainty about President Trump’s ability to implement reforms, and geopolitical tensions in the Middle East and the Korean Peninsula curbed market sentiment. The broad US stock market, as measured by the Standard & Poor’s 500 Index, generated a +18.61% total return for the period.2
The foregoing information reflects our analysis and opinions as of September 30, 2017. The information is not a complete analysis of every aspect of any market, country, industry, security or fund. Statements of fact are from sources considered reliable.
1. Source: Bureau of Labor Statistics.
2. Source: Morningstar.
See www.franklintempletondatasources.com for additional data provider information.
| | | | |
| franklintempleton.com | | Annual Report | | 3 |
Franklin DynaTech Fund
We are pleased to bring you Franklin DynaTech Fund’s annual report for the fiscal year ended September 30, 2017.
Your Fund’s Goal and Main Investments
The Fund seeks capital appreciation by investing primarily in equity securities of companies that emphasize innovation and new technologies, have superior management and that benefit from new industry conditions in the dynamically changing global economy.
Performance Overview
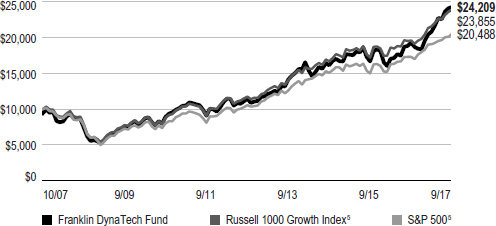
The Fund’s Class A shares delivered a +25.67% cumulative total return for the 12 months under review. In comparison, the Russell 1000® Growth Index, which measures performance of the largest companies in the Russell 3000® Index with higher price-to-book ratios and higher forecasted growth values, generated a total return of +21.94%.1 Also for comparison, the broad US stock market, as measured by the Standard & Poor’s 500 Index (S&P 500®), produced a +18.61% return.1 You can find the Fund’s long-term performance data in the Performance Summary beginning on page 7.
Performance data represent past performance, which does not guarantee future results. Investment return and principal value will fluctuate, and you may have a gain or loss when you sell your shares. Current performance may differ from figures shown. For most recent month-end performance, go to franklintempleton.com or call (800) 342-5236.
Investment Strategy
We use fundamental, bottom-up research to seek companies meeting our criteria of growth potential, quality and valuation. In seeking sustainable growth characteristics, we look for companies we believe can produce sustainable earnings and cash flow growth, evaluating the long-term market opportunity and competitive structure of an industry to target leaders and emerging leaders. We define quality companies as those with strong and improving competitive positions in attractive markets. We also believe important attributes of quality are experienced and talented management teams as well as financial strength reflected in the capital structure, gross and
operating margins, free cash flow generation and returns on capital employed. Our valuation analysis includes a range of potential outcomes based on an assessment of multiple scenarios. In assessing value, we consider whether security prices fully reflect the balance of the sustainable growth opportunities relative to business and financial risks.
We may invest in companies in any economic sector or of any market capitalization and may invest in companies both inside and outside of the US. Although we search for investments across a large number of sectors, we expect to have significant positions in particular sectors including, for example, technology and health care.
Manager’s Discussion
Several of the Fund’s information technology (IT) holdings contributed significantly to absolute performance during the reporting period.2 The Fund’s position in social media company Facebook helped IT results. Facebook’s user base and engagement continued to grow, thanks in part to the site’s use of video. Advertisers also responded well to the company’s ad format innovations, which improved targeting capabilities. Revenue and user engagement growth for Instagram, which is owned by Facebook, also helped the company’s stock performance.
The growth of Alphabet, Google’s parent company, was due to a number of factors. Alphabet increased its share of the global advertising market due to strong performance in mobile search and YouTube, while Android’s status as a leading mobile operating system helped the company gain mobile users. The company continued to invest in potential new product lines such as self-driving car technology Waymo. Google continues to face regulatory scrutiny in Europe, but we believe the complaints will not have a meaningful negative impact on the business.
Mastercard benefited from accelerating revenue growth, which was the result of better cross-border volumes. The weakness in the British pound has led to increased inbound travel to the UK, which is benefiting cross-border payments. The company continued to generate significant operating leverage over its
1. Source: Morningstar.
The indexes are unmanaged and include reinvestment of any income or distributions. They do not reflect any fees, expenses or sales charges. One cannot invest directly in an index, and an index is not representative of the Fund’s portfolio.
Russell Investment Group is the source and owner of the trademarks, service marks and copyrights related to the Russell Indexes. Russell® is a trademark of Russell Investment Group.
2. The IT sector comprises communications equipment; electronic equipment, instruments and components; internet software and services; IT services; semiconductors and semiconductor equipment; software; and technology hardware, storage and peripherals in the SOI.
The dollar value, number of shares or principal amount, and names of all portfolio holdings are listed in the Fund’s Statement of Investments (SOI). The SOI begins on page 44.
| | | | |
| 4 | | Annual Report | | franklintempleton.com |
FRANKLIN DYNATECH FUND
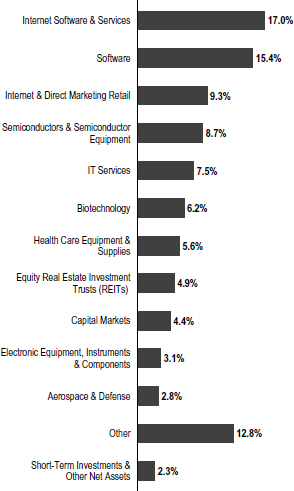
Portfolio Composition
Based on Total Net Assets as of 9/30/17
fixed-cost infrastructure. At its most recent investor day, it increased its long-term outlook. Management expects earnings per share to grow significantly over the next few years, up from the previous guidance.
NVIDIA is the market leader in semiconductor graphics processors. Due to the increasing demand for this functionality, the company has been able to generate strong revenue growth and profitability. In its recently ended fiscal year in January 2017, NVIDIA’s revenues grew significantly. The company’s most recent quarterly operating profit margin was quite high. NVIDIA’s growth, increasing profitability and scarcity of
parallel processing IP enabled the company’s shares to perform well during the period.
The health care sector also contributed to the Fund’s absolute results.3 Celgene is a fully integrated biotechnology company with a broad pipeline across hematology/oncology and inflammation/immunology. The stock performed well during the period due to steady and positive changes in fundamentals. Revenues and earnings were up, with its Revlimid product’s sales growing significantly due to label expansions in the US and Europe. With its late-stage pipeline producing positive data, and the company’s early stage pipeline progressing well, the company has been enjoying steady execution across all fronts. UnitedHealth Group also performed well during the period. In managed care, the company was successful in growing its membership base, while executing on medical management. Its Optum Care business continued to grow, and its Optum Rx offering continued to gain traction with a combined medical and pharmacy benefit management offering.
In the consumer discretionary sector, global e-commerce company Amazon.com’s rapid growth was driven by its Prime member benefit program, which creates more loyal shoppers who increase their spending on the platform.4 Amazon also made many investments that, in our view, should benefit the company in the long term. The company aggressively increased its logistical capabilities to shorten delivery times and meet user demands, while its acquisition of Whole Foods Market dramatically increased its presence in the grocery category. Amazon also benefited from strong sales of the company’s “smart home” Echo device as well as the continued success of Amazon Web Services, its highly-profitable cloud computing platform.
In contrast, the energy sector was a detractor from the Fund’s performance during the period.5 Schlumberger, a company that provides project management solutions to the international oil and gas exploration and production industries, detracted from performance.
Although the health care sector as a whole contributed to Fund performance, several stocks in that sector detracted. Edwards Lifesciences’ stock declined as its sales growth rate matured during the reporting period. This trend followed what had been an acceleration of sales growth in the wake of the release of results from Edwards’ “PARTNER 2A” trial in April 2016.
3. The health care sector comprises biotechnology, health care equipment and supplies, health care providers and services, health care technology, life sciences tools and services, and pharmaceuticals in the SOI.
4. The consumer discretionary sector comprises automobiles; internet and direct marketing retail; media; and textiles, apparel and luxury goods in the SOI.
5. The energy sector comprises energy equipment and services in the SOI.
| | | | |
| franklintempleton.com | | Annual Report | | 5 |
FRANKLIN DYNATECH FUND
Dexcom’s stock suffered as its sales growth rate matured during the period.6 This deceleration followed what had been a three-year period of high sales growth that began with the October 2012 launch of Dexcom’s G4 Platinum system and the September 2015 launch of Dexcom’s G5 Mobile system. Illumina, which develops, manufactures and markets integrated systems for the analysis of genetic variation and function, also detracted from performance.
Top 10 Holdings
9/30/17
| | |
Company Sector/Industry | | % of Total
Net Assets |
Amazon.com Inc. Internet & Direct Marketing Retail | | 5.4% |
Alphabet Inc. Internet Software & Services | | 5.0% |
Facebook Inc. Internet Software & Services | | 4.6% |
Mastercard Inc. IT Services | | 3.4% |
Tencent Holdings Ltd. Internet Software & Services | | 2.6% |
Visa Inc. IT Services | | 2.6% |
Celgene Corp. Biotechnology | | 2.3% |
Equinix Inc. Equity Real Estate Investment Trusts (REITs) | | 2.2% |
Salesforce.com Inc. Software | | 1.9% |
Adobe Systems Inc. Software | | 1.8% |
Palo Alto Networks, in the IT sector, is another example of a firm that detracted from a sector that had positive overall performance.6 The company, a provider of enterprise cloud applications for finance and human resources, struggled over the past year partly due to increased competition and a poorly executed reorganization of its sales force.
In industrials,7 LED lighting manufacturer Acuity Brands missed earnings for two quarters due to slower revenue growth.6 Additionally, investors seemed to be concerned that the nonresidential market may be slowing, leading to reduced estimates and a compressed valuation multiple.
Thank you for your continued participation in Franklin DynaTech Fund. We look forward to serving your future investment needs.
| | |

| | 
Matthew J. Moberg, CPA |
| | |

| | 
Rupert H. Johnson, Jr. |
| |
| |
| | Portfolio Management Team |
The foregoing information reflects our analysis, opinions and portfolio holdings as of September 30, 2017, the end of the reporting period. The way we implement our main investment strategies and the resulting portfolio holdings may change depending on factors such as market and economic conditions. These opinions may not be relied upon as investment advice or an offer for a particular security. The information is not a complete analysis of every aspect of any market, country, industry, security or the Fund. Statements of fact are from sources considered reliable, but the investment manager makes no representation or warranty as to their completeness or accuracy. Although historical performance is no guarantee of future results, these insights may help you understand our investment management philosophy.
6. No longer held by period-end.
7. The industrials sector comprises aerospace and defense, air freight and logistics, commercial services and supplies, electrical equipment and machinery in the SOI.
See www.franklintempletondatasources.com for additional data provider information.
| | | | |
| 6 | | Annual Report | | franklintempleton.com |
FRANKLIN DYNATECH FUND
Performance Summary as of September 30, 2017
The performance table and graphs do not reflect any taxes that a shareholder would pay on Fund dividends, capital gain distributions, if any, or any realized gains on the sale of Fund shares. Total return reflects reinvestment of the Fund’s dividends and capital gain distributions, if any, and any unrealized gains or losses. Your dividend income will vary depending on dividends or interest paid by securities in the Fund’s portfolio, adjusted for operating expenses of each class. Capital gain distributions are net profits realized from the sale of portfolio securities.
Performance as of 9/30/171
Cumulative total return excludes sales charges. Average annual total return includes maximum sales charges. Sales charges will vary depending on the size of the investment and the class of share purchased. The maximum is 5.75% and the minimum is 0%. Class A: 5.75% maximum initial sales charge; Advisor Class: no sales charges. For other share classes, visit franklintempleton.com.
| | | | |
| Share Class | | Cumulative
Total Return2 | | Average Annual
Total Return3 |
| | |
A | | | | |
| | |
1-Year | | +25.67% | | +18.45% |
5-Year | | +112.37% | | +14.89% |
10-Year | | +156.84% | | +9.24% |
| | |
Advisor4 | | | | |
| | |
1-Year | | +25.98% | | +25.98% |
5-Year | | +114.98% | | +16.54% |
10-Year | | +162.89% | | +10.15% |
Performance data represent past performance, which does not guarantee future results. Investment return and principal value will fluctuate, and you may have a gain or loss when you sell your shares. Current performance may differ from figures shown. For most recent month-end performance, go to franklintempleton.com or call (800) 342-5236.
See page 9 for Performance Summary footnotes.
| | | | |
| franklintempleton.com | | Annual Report | | 7 |
FRANKLIN DYNATECH FUND
PERFORMANCE SUMMARY
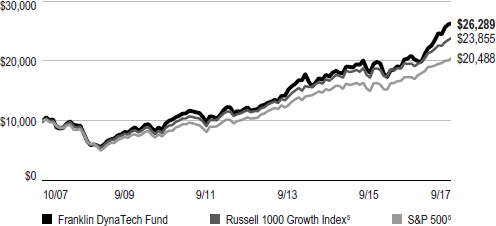
Total Return Index Comparison for a Hypothetical $10,000 Investment1
Total return represents the change in value of an investment over the periods shown. It includes any applicable maximum sales charge, Fund expenses, account fees and reinvested distributions. The unmanaged indexes include reinvestment of any income or distributions. They differ from the Fund in composition and do not pay management fees or expenses. One cannot invest directly in an index.
Class A (10/1/07–9/30/17)
Advisor Class (10/1/07–9/30/17)
See page 9 for Performance Summary footnotes.
| | | | |
| 8 | | Annual Report | | franklintempleton.com |
FRANKLIN DYNATECH FUND
PERFORMANCE SUMMARY
Distributions (10/1/16–9/30/17)
| | | | |
| Share Class | | Long-Term Capital Gain | |
A | | | $1.6945 | |
C | | | $1.6945 | |
R | | | $1.6945 | |
R6 | | | $1.6945 | |
Advisor | | | $1.6945 | |
Total Annual Operating Expenses6
| | | | | | | | |
| Share Class | | With Waiver | | | Without Waiver | |
A | | | 0.91% | | | | 0.92% | |
Advisor | | | 0.66% | | | | 0.67% | |
Each class of shares is available to certain eligible investors and has different annual fees and expenses, as described in the prospectus.
All investments involve risks, including possible loss of principal. Stocks historically have outperformed other asset classes over the long term, but tend to fluctuate more dramatically over the short term. Investments in fast-growing industries, like the technology and health care sectors (which have historically been volatile) could result in increased price fluctuation, especially over the short term, due to the rapid pace of product change and development and changes in government regulation of companies emphasizing scientific or technological advancement or regulatory approval for new drugs and medical instruments. The Fund may also invest in small- and mid-capitalization companies, which can be particularly sensitive to changing economic conditions, and their prospects for growth are less certain than those of larger, more established companies. The Fund is actively managed but there is no guarantee that the manager’s investment decisions will produce the desired results. The Fund’s prospectus also includes a description of the main investment risks.
1. The Fund has a fee waiver associated with any investment it makes in a Franklin Templeton money fund and/or other Franklin Templeton fund, contractually guaranteed through 1/31/18. Fund investment results reflect the fee waiver; without this waiver, the results would have been lower.
2. Cumulative total return represents the change in value of an investment over the periods indicated.
3. Average annual total return represents the average annual change in value of an investment over the periods indicated. Return for less than one year, if any, has not been annualized.
4. Effective 5/15/08, the Fund began offering Advisor Class shares, which do not have sales charges or a Rule 12b-1 plan. Performance quotations for this class reflect the following methods of calculation: (a) For periods prior to 5/15/08, a restated figure is used based upon the Fund’s Class A performance, excluding the effect of Class A’s maximum initial sales charge, but reflecting the effect of the Class A Rule 12b-1 fees; and (b) for periods after 5/15/08, actual Advisor Class performance is used reflecting all charges and fees applicable to that class. Since 5/15/08 (commencement of sales), the cumulative and average annual total returns of Advisor Class shares were +164.78% and +10.94%.
5. Source: Morningstar. The Russell 1000 Growth Index is market capitalization-weighted and measures performance of those Russell 1000 Index companies with higher price-to-book ratios and higher forecasted growth values. The S&P 500 is a market capitalization-weighted index of 500 stocks designed to measure total US equity market performance.
6. Figures are as stated in the Fund’s current prospectus and may differ from the expense ratios disclosed in the Your Fund’s Expenses and Financial Highlights sections in this report. In periods of market volatility, assets may decline significantly, causing total annual Fund operating expenses to become higher than the figures shown.
See www.franklintempletondatasources.com for additional data provider information.
| | | | |
| franklintempleton.com | | Annual Report | | 9 |
FRANKLIN DYNATECH FUND
Your Fund’s Expenses
As a Fund shareholder, you can incur two types of costs: (1) transaction costs, including sales charges (loads) on Fund purchases and redemptions; and (2) ongoing Fund costs, including management fees, distribution and service (12b-1) fees, and other Fund expenses. All mutual funds have ongoing costs, sometimes referred to as operating expenses. The table below shows ongoing costs of investing in the Fund and can help you understand these costs and compare them with those of other mutual funds. The table assumes a $1,000 investment held for the six months indicated.
Actual Fund Expenses
The table below provides information about actual account values and actual expenses in the columns under the heading “Actual.” In these columns the Fund’s actual return, which includes the effect of Fund expenses, is used to calculate the “Ending Account Value” for each class of shares. You can estimate the expenses you paid during the period by following these steps (of course, your account value and expenses will differ from those in this illustration): Divide your account value by $1,000 (if your account had an $8,600 value, then $8,600 ÷ $1,000 = 8.6). Then multiply the result by the number in the row for your class of shares under the headings “Actual” and “Expenses Paid During Period” (if Actual Expenses Paid During Period were $7.50, then 8.6 x $7.50 = $64.50). In this illustration, the actual expenses paid this period are $64.50.
Hypothetical Example for Comparison with Other Funds
Under the heading “Hypothetical” in the table, information is provided about hypothetical account values and hypothetical expenses based on the Fund’s actual expense ratio and an assumed rate of return of 5% per year before expenses, which is not the Fund’s actual return. This information may not be used to estimate the actual ending account balance or expenses you paid for the period, but it can help you compare ongoing costs of investing in the Fund with those of other funds. To do so, compare this 5% hypothetical example for the class of shares you hold with the 5% hypothetical examples that appear in the shareholder reports of other funds.
Please note that expenses shown in the table are meant to highlight ongoing costs and do not reflect any transactional costs. Therefore, information under the heading “Hypothetical” is useful in comparing ongoing costs only, and will not help you compare total costs of owning different funds. In addition, if transactional costs were included, your total costs would have been higher.
| | | | | | | | | | | | | | | | | | | | | | | | | | | | | | | | | | | | |
| | | | | | | Actual (actual return after expenses) | | | | Hypothetical (5% annual return before expenses) | | | | |
| | | | | | | | | |
Share Class | | Beginning Account Value 4/1/17 | | | | Ending Account Value 9/30/17 | | Expenses Paid During Period 4/1/17–9/30/171,2 | | | | Ending Account Value 9/30/17 | | Expenses Paid During Period 4/1/17–9/30/171,2 | | | | Net Annualized Expense Ratio2 |
| | | | | | | | | |
A | | | $ | 1,000 | | | | | | $ | 1,165.30 | | | | $ | 4.89 | | | | | | $ | 1,020.56 | | | | $ | 4.56 | | | | | 0.90% |
C | | | $ | 1,000 | | | | | | $ | 1,160.80 | | | | $ | 8.94 | | | | | | $ | 1,016.80 | | | | $ | 8.34 | | | | | 1.65% |
R | | | $ | 1,000 | | | | | | $ | 1,163.60 | | | | $ | 6.24 | | | | | | $ | 1,019.30 | | | | $ | 5.82 | | | | | 1.15% |
R6 | | | $ | 1,000 | | | | | | $ | 1,167.40 | | | | $ | 2.61 | | | | | | $ | 1,022.66 | | | | $ | 2.43 | | | | | 0.48% |
Advisor | | | $ | 1,000 | | | | | | $ | 1,166.60 | | | | $ | 3.53 | | | | | | $ | 1,021.81 | | | | $ | 3.29 | | | | | 0.65% |
1. Expenses are equal to the annualized expense ratio for the six-month period as indicated above—in the far right column—multiplied by the simple average account value over the period indicated, and then multiplied by 183/365 to reflect the one-half year period.
2. Reflects expenses after fee waivers and expense reimbursements. Does not include acquired fund fees and expenses.
| | | | |
| 10 | | Annual Report | | franklintempleton.com |
Franklin Growth Fund
We are pleased to bring you Franklin Growth Fund’s annual report for the fiscal year ended September 30, 2017.
Your Fund’s Goal and Main Investments
The Fund seeks capital appreciation by investing substantially in equity securities of companies that are leaders in their industries.
Performance Overview
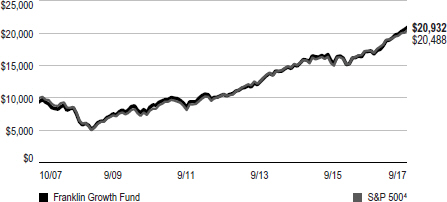
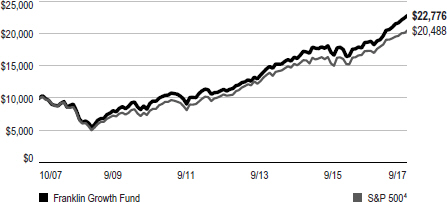
The Fund’s Class A shares delivered a +21.12% cumulative total return for the 12 months under review. In comparison, the Standard & Poor’s 500 Index (S&P 500), which is a broad measure of US stock performance, generated a +18.61% total return.1 You can find the Fund’s long-term performance data in the Performance Summary beginning on page 14.
Performance data represent past performance, which does not guarantee future results. Investment return will fluctuate. Current performance may differ from figures shown. For most recent month-end performance, go to franklintempleton.com or call (800) 342-5236.
Investment Strategy
We use fundamental, bottom-up research to seek companies meeting our criteria of growth potential, quality and valuation. In seeking sustainable growth characteristics, we look for companies we believe can produce sustainable earnings and cash flow growth, evaluating the long-term market opportunity and competitive structure of an industry to target leaders and emerging leaders. We define quality companies as those with strong and improving competitive positions in attractive markets. We also believe important attributes of quality are experienced and talented management teams as well as financial strength reflected in the capital structure, gross and operating margins, free cash flow generation and returns on capital employed. Our valuation analysis includes a range of potential outcomes based on an assessment of multiple scenarios. In assessing value, we consider whether security prices fully reflect the balance of the sustainable growth opportunities relative to business and financial risks.
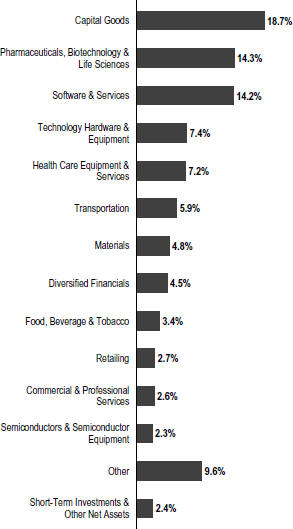
Portfolio Composition
Based on Total Net Assets as of 9/30/17
Manager’s Discussion
Franklin Growth Fund owned shares of 155 companies at period-end. We continue to invest in a broad array of companies of all sizes and in varied industries.
During the period under review, most investment sectors contributed to absolute performance, including information
1. Source: Morningstar.
The index is unmanaged and includes reinvestment of any income or distributions. It does not reflect any fees, expenses or sales charges. One cannot invest directly in an index, and an index is not representative of the Fund’s portfolio.
The dollar value, number of shares or principal amount, and names of all portfolio holdings are listed in the Fund’s Statement of Investments (SOI). The SOI begins on page 53.
| | | | |
| franklintempleton.com | | Annual Report | | 11 |
FRANKLIN GROWTH FUND
Top 10 Holdings
9/30/17
| | |
Company Sector/Industry | | % of Total
Net Assets |
Apple Inc. Technology Hardware & Equipment | | 4.5% |
Amazon.com Inc. Retailing | | 2.4% |
Northrop Grumman Corp. Capital Goods | | 2.3% |
Alphabet Inc. Software & Services | | 2.2% |
The Boeing Co. Capital Goods | | 2.0% |
Mettler-Toledo International Inc. Pharmaceuticals, Biotechnology & Life Sciences | | 1.9% |
Microsoft Corp. Software & Services | | 1.8% |
Alaska Air Group Inc. Transportation | | 1.7% |
Union Pacific Corp. Transportation | | 1.7% |
General Dynamics Corp. Capital Goods | | 1.5% |
technology (IT), industrials and health care.2 In the IT sector, software and equipment company Apple benefited from solid iPhone 7 sales and anticipation of strong iPhone 8 and iPhone X sales starting in the fall of 2017. The Fund’s position in Microsoft, a software and IT services company, also helped results. Microsoft contributed to performance amid a stabilization in the PC market. Investors responded well to Microsoft’s transitioning its Office productivity suite to a software-as-a-service product, as well as its Azure cloud infrastructure platform. The company also did a good job managing expenses.
In the industrials sector, General Dynamics benefited from the strong defense spending backdrop further augmented by the steady recovery in the large-business jet market. The company should begin deliveries of its new business jet models late this year. Northrop Grumman enjoys a very strong position in the defense industry thanks to its electronic warfare and unmanned aircraft portfolios. Investors also appeared to be taking a favorable view toward the company’s proposed acquisition of Orbital ATK.3 Boeing benefited from record airline travel and
profits. Additionally, it has been realizing a cash windfall as the 787 began contributing to profits.
In health care, company initiatives and macroeconomic factors drove record performance for Mettler-Toledo International, which sells precision instruments used in several industries. Robust earnings and revenue growth, aided by sales and services improvements, enabled the company to exceed investor expectations. In contrast to prior reporting periods, Mettler-Toledo benefited from its presence in emerging markets that previously hurt company performance.
In contrast, the energy sector detracted from absolute performance during the period. Within the sector, shares of Anadarko Petroleum declined significantly during the period. The company’s shares declined in April 2017 following a house explosion in Firestone, Colorado. Market fears that the incident could lead to tougher drilling regulations in Colorado and potential fines against the company hurt its shares. The company had to pay out large settlements for both its passive stake in the Macondo oil spill in the Gulf of Mexico in 2010 and for the environmental liabilities of bankrupt chemical maker Tronox.3 Although the current Firestone incident is unlikely, in our view, to lead to a similar multi-billion dollar fine, the market is penalizing the company given the uncertain time and unknown amount of damages related to the incident. Anadarko recently announced a share buyback, which has lifted the stock toward period-end, though not yet enough to make up for the poor performance since the Firestone accident. UK service and equipment provider TechnipFMC also detracted from performance. The outlook for long-cycle business investment in the oil and gas industry remains challenging in the short-to-intermediate term due to oil price volatility and limited cash flow and spending growth from producers. In particular, offshore spending remained depressed as producers focused on onshore short-cycle projects, such as those in US shale plays, though offshore spending does appear to us to have bottomed and we believe project awards should pick up over the next year.
Although the industrials sector as a whole contributed to Fund performance, several stocks within the sector detracted. W.W. Grainger (no longer held by period-end) faced an extremely challenging environment over the past year, as intense competition from online retailers such as Amazon.com4 forced
2. The IT sector comprises semiconductors and semiconductor equipment, software and services, and technology hardware and equipment in the SOI. The industrials sector comprises capital goods, commercial and professional services, and transportation in the SOI. The health care sector comprises health care equipment and services and pharmaceuticals, biotechnology and life sciences in the SOI.
3. Not a Fund holding.
4. Also a Fund holding.
See www.franklintempletondatasources.com for additional data provider information.
| | | | |
| 12 | | Annual Report | | franklintempleton.com |
FRANKLIN GROWTH FUND
the company to take dramatic price decreases. As a result, gross profit margins and earnings estimates for 2017 declined significantly. The company’s objective of increasing volumes through price cuts has not yet been successful, and the stock’s valuation continued to reflect that uncertainty. Risk management solutions provider Dun & Bradstreet (D&B) is pursuing a multi-year organic growth enhancement strategy by leveraging the company’s unique commercial credit and contact data in new-use cases. This strategy had shown good progress early in 2016, but a sequential deceleration in third-quarter results and the disclosure of a change in its distribution arrangement with partner Salesforce.com were both setbacks.4 2017 guidance was weaker than expected partly due to investments the business has been making to offset the slowing growth from the Salesforce.com partnership. In addition, D&B acquired a business in the first quarter that resulted in a credit rating downgrade by S&P and higher-than-expected interest expense in 2017.
Also in the industrials sector, Equifax was a significant detractor from the Fund’s performance. Following the US presidential election in November 2016, the increase in mortgage interest rates led to a reduced outlook for the company’s mortgage services business. In addition, post-election uncertainty surrounding health care reform reduced the revenue outlook. More recently, on September 7, 2017, Equifax disclosed a data breach that is perhaps the most severe in US history. The cost of numerous lawsuits, consumer remediation, and enhanced data security combined with the potential for regulatory reform created uncertainty for the company, which led to substantial declines since the announcement.
In the IT sector, Fortinet detracted from results. Fortinet, a network security solutions provider, struggled over the past year as competition increased and workloads transitioned to the cloud. We no longer own the company’s shares at period-end.
Thank you for your participation in Franklin Growth Fund. We look forward to serving your future investment needs.
| | |
 | |  |
| | Serena Perin Vinton, CFA |
| |
| | John Anderson |
| | Robert Rendler, CFA |
| |
| | Portfolio Management Team |
The foregoing information reflects our analysis, opinions and portfolio holdings as of September 30, 2017, the end of the reporting period. The way we implement our main investment strategies and the resulting portfolio holdings may change depending on factors such as market and economic conditions. These opinions may not be relied upon as investment advice or an offer for a particular security. The information is not a complete analysis of every aspect of any market, country, industry, security or the Fund. Statements of fact are from sources considered reliable, but the investment manager makes no representation or warranty as to their completeness or accuracy. Although historical performance is no guarantee of future results, these insights may help you understand our investment management philosophy.
CFA® is a trademark owned by CFA Institute.
| | | | |
| franklintempleton.com | | Annual Report | | 13 |
FRANKLIN GROWTH FUND
Performance Summary as of September 30, 2017
The performance table and graphs do not reflect any taxes that a shareholder would pay on Fund dividends, capital gain distributions, if any, or any realized gains on the sale of Fund shares. Total return reflects reinvestment of the Fund’s dividends and capital gain distributions, if any, and any unrealized gains or losses. Your dividend income will vary depending on dividends or interest paid by securities in the Fund’s portfolio, adjusted for operating expenses of each class. Capital gain distributions are net profits realized from the sale of portfolio securities.
Performance as of 9/30/171
Cumulative total return excludes sales charges. Average annual total return includes maximum sales charges. Sales charges will vary depending on the size of the investment and the class of share purchased. The maximum is 5.75% and the minimum is 0%. Class A: 5.75% maximum initial sales charge; Advisor Class: no sales charges. For other share classes, visit franklintempleton.com.
| | | | |
| Share Class | | Cumulative Total Return2 | | Average Annual
Total Return3 |
| | |
A | | | | |
1-Year | | +21.12% | | +14.16% |
5-Year | | +98.89% | | +13.39% |
10-Year | | +122.10% | | +7.67% |
| | |
Advisor | | | | |
1-Year | | +21.43% | | +21.43% |
5-Year | | +101.37% | | +15.03% |
10-Year | | +127.76% | | +8.58% |
Performance data represent past performance, which does not guarantee future results. Investment return and principal value will fluctuate, and you may have a gain or loss when you sell your shares. Current performance may differ from figures shown. For most recent month-end performance, go to franklintempleton.com or call (800) 342-5236.
See page 16 for Performance Summary footnotes.
| | | | |
| 14 | | Annual Report | | franklintempleton.com |
FRANKLIN GROWTH FUND
PERFORMANCE SUMMARY
Total Return Index Comparison for a Hypothetical $10,000 Investment1
Total return represents the change in value of an investment over the periods shown. It includes any applicable maximum sales charge, Fund expenses, account fees and reinvested distributions. The unmanaged index includes reinvestment of any income or distributions. It differs from the Fund in composition and does not pay management fees or expenses. One cannot invest directly in an index.
Class A (10/1/07–9/30/17)
Advisor Class (10/1/07–9/30/17)
See page 16 for Performance Summary footnotes.
| | | | |
| franklintempleton.com | | Annual Report | | 15 |
FRANKLIN GROWTH FUND
PERFORMANCE SUMMARY
Distributions (10/1/16–9/30/17)
| | | | | | | | | | | | |
| Share Class | | Net Investment
Income | | | Long-Term
Capital Gain | | | Total | |
A | | | $0.3928 | | | | $2.4961 | | | | $2.8889 | |
C | | | — | | | | $2.4961 | | | | $2.4961 | |
R | | | $0.2050 | | | | $2.4961 | | | | $2.7011 | |
R6 | | | $0.7176 | | | | $2.4961 | | | | $3.2137 | |
Advisor | | | $0.6071 | | | | $2.4961 | | | | $3.1032 | |
Total Annual Operating Expenses5
| | | | | | |
| Share Class | | With Waiver | | | Without Waiver |
A | | | 0.88% | | | 0.90% |
Advisor | | | 0.63% | | | 0.65% |
Each class of shares is available to certain eligible investors and has different annual fees and expenses, as described in the prospectus.
All investments involve risks, including possible loss of principal. Historically, the Fund has focused on larger companies. The Fund may also invest in small, relatively new and/or unseasoned companies, which involves additional risks, as the price of these securities can be volatile, particularly over the short term. The Fund may focus on particular sectors of the market from time to time, which can carry greater risks of adverse developments in such sectors. In addition, the Fund may invest up to 40% of its net assets in stocks of foreign companies, which involve special risks, including currency fluctuations and economic as well as political uncertainty. The Fund is actively managed but there is no guarantee that the manager’s investment decisions will produce the desired results. The Fund’s prospectus also includes a description of the main investment risks.
1. The Fund has a fee waiver associated with any investment it makes in a Franklin Templeton money fund and/or other Franklin Templeton fund, contractually guaranteed through 1/31/18. Fund investment results reflect the fee waiver; without this waiver, the results would have been lower.
2. Cumulative total return represents the change in value of an investment over the periods indicated.
3. Average annual total return represents the average annual change in value of an investment over the periods indicated. Return for less than one year, if any, has not been annualized.
4. Source: Morningstar. The S&P 500 is a market capitalization-weighted index of 500 stocks designed to measure total US equity market performance.
5. Figures are as stated in the Fund’s current prospectus and may differ from the expense ratios disclosed in the Your Fund’s Expenses and Financial Highlights sections in this report. In periods of market volatility, assets may decline significantly, causing total annual Fund operating expenses to become higher than the figures shown.
See www.franklintempletondatasources.com for additional provider information.
| | | | |
| 16 | | Annual Report | | franklintempleton.com |
FRANKLIN GROWTH FUND
Your Fund’s Expenses
As a Fund shareholder, you can incur two types of costs: (1) transaction costs, including sales charges (loads) on Fund purchases and redemptions; and (2) ongoing Fund costs, including management fees, distribution and service (12b-1) fees, and other Fund expenses. All mutual funds have ongoing costs, sometimes referred to as operating expenses. The table below shows ongoing costs of investing in the Fund and can help you understand these costs and compare them with those of other mutual funds. The table assumes a $1,000 investment held for the six months indicated.
Actual Fund Expenses
The table below provides information about actual account values and actual expenses in the columns under the heading “Actual.” In these columns the Fund’s actual return, which includes the effect of Fund expenses, is used to calculate the “Ending Account Value” for each class of shares. You can estimate the expenses you paid during the period by following these steps (of course, your account value and expenses will differ from those in this illustration): Divide your account value by $1,000 (if your account had an $8,600 value, then $8,600 ÷ $1,000 = 8.6). Then multiply the result by the number in the row for your class of shares under the headings “Actual” and “Expenses Paid During Period” (if Actual Expenses Paid During Period were $7.50, then 8.6 x $7.50 = $64.50). In this illustration, the actual expenses paid this period are $64.50.
Hypothetical Example for Comparison with Other Funds
Under the heading “Hypothetical” in the table, information is provided about hypothetical account values and hypothetical expenses based on the Fund’s actual expense ratio and an assumed rate of return of 5% per year before expenses, which is not the Fund’s actual return. This information may not be used to estimate the actual ending account balance or expenses you paid for the period, but it can help you compare ongoing costs of investing in the Fund with those of other funds. To do so, compare this 5% hypothetical example for the class of shares you hold with the 5% hypothetical examples that appear in the shareholder reports of other funds.
Please note that expenses shown in the table are meant to highlight ongoing costs and do not reflect any transactional costs. Therefore, information under the heading “Hypothetical” is useful in comparing ongoing costs only, and will not help you compare total costs of owning different funds. In addition, if transactional costs were included, your total costs would have been higher.
| | | | | | | | | | | | | | | | | | |
| | | | | | | Actual
(actual return after expenses) | | | | Hypothetical
(5% annual return before expenses) | | | | |
Share
Class | | Beginning
Account
Value 4/1/17 | | | | Ending
Account
Value 9/30/17 | | Expenses
Paid During
Period
4/1/17–9/30/171,2 | | | | Ending Account
Value 9/30/17 | | Expenses
Paid During
Period
4/1/17–9/30/171,2 | | | | Net
Annualized
Expense
Ratio2 |
| A | | $1,000 | | | | $1,105.10 | | $4.54 | | | | $1,020.76 | | $4.36 | | | | 0.86% |
| C | | $1,000 | | | | $1,100.90 | | $8.48 | | | | $1,017.00 | | $8.14 | | | | 1.61% |
| R | | $1,000 | | | | $1,103.70 | | $5.85 | | | | $1,019.50 | | $5.62 | | | | 1.11% |
| R6 | | $1,000 | | | | $1,107.40 | | $2.38 | | | | $1,022.81 | | $2.28 | | | | 0.45% |
| Advisor | | $1,000 | | | | $1,106.60 | | $3.22 | | | | $1,022.01 | | $3.09 | | | | 0.61% |
1. Expenses are equal to the annualized expense ratio for the six-month period as indicated above—in the far right column—multiplied by the simple average account value over the period indicated, and then multiplied by 183/365 to reflect the one-half year period.
2. Reflects expenses after fee waivers and expense reimbursements. Does not include acquired fund fees and expenses.
| | | | |
| franklintempleton.com | | Annual Report | | 17 |
Franklin Income Fund
This annual report for Franklin Income Fund covers the fiscal year ended September 30, 2017.
Your Fund’s Goal and Main Investments
The Fund seeks to maximize income, while maintaining prospects for capital appreciation by investing, under normal market conditions, in a diversified portfolio of debt and equity securities.
Performance Overview
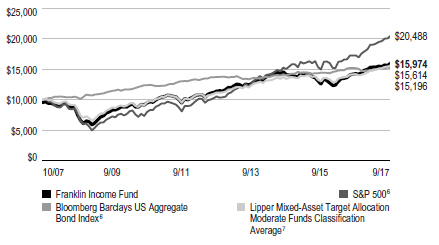
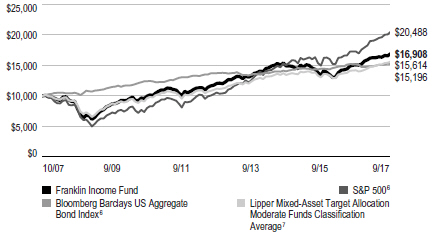
The Fund’s Class A shares delivered a cumulative total return of +11.86% for the 12 months under review. In comparison, the Fund’s equity benchmark, the Standard & Poor’s 500 Index (S&P 500), which is a broad measure of US stock performance, returned +18.61%.1 The Fund’s fixed income benchmark, the Bloomberg Barclays US Aggregate Bond Index, which tracks the US investment-grade, taxable bond market, posted a +0.07% total return.1 The Fund’s peers, as measured by the Lipper Mixed-Asset Target Allocation Moderate Funds Classification Average, which consists of funds chosen by Lipper that, by practice, maintain a mix of 40% to 60% equity securities, with the remainder in bonds and cash, returned +10.08%.2 You can find the Fund’s long-term performance data in the Performance Summary beginning on page 22.
Performance data represent past performance, which does not guarantee future results. Investment return will fluctuate. Current performance may differ from figures shown. For most recent month-end performance, go to franklintempleton.com or call
(800) 342-5236.
Investment Strategy
By generally performing independent analysis of debt, convertible and equity securities, we search for undervalued or out-of-favor securities we believe offer opportunities for income today and significant growth tomorrow. We consider such factors as a company’s experience and managerial strength; its cash flow potential and profitability; its competitive positioning and advantages; its responsiveness to changes in interest rates and business conditions; debt maturity schedules and borrowing requirements; a company’s changing financial condition and market recognition of the change; and a
Dividend Distributions*
10/1/16–9/30/17
| | | | | | | | | | | | | | | | | | | | |
| | | Dividend per Share (cents) | |
Month | | | Class A | | | | Class C | | | | Class R | | | | Class R6 | | |
| Advisor
Class |
|
October | | | 1.00 | | | | 0.90 | | | | 0.93 | | | | 1.03 | | | | 1.02 | |
November | | | 1.00 | | | | 0.90 | | | | 0.93 | | | | 1.03 | | | | 1.02 | |
December | | | 1.00 | | | | 0.90 | | | | 0.93 | | | | 1.03 | | | | 1.02 | |
January | | | 1.00 | | | | 0.90 | | | | 0.93 | | | | 1.03 | | | | 1.02 | |
February | | | 1.00 | | | | 0.90 | | | | 0.93 | | | | 1.03 | | | | 1.02 | |
March | | | 1.00 | | | | 0.90 | | | | 0.93 | | | | 1.03 | | | | 1.02 | |
April | | | 1.00 | | | | 0.90 | | | | 0.93 | | | | 1.03 | | | | 1.02 | |
May | | | 1.00 | | | | 0.90 | | | | 0.93 | | | | 1.03 | | | | 1.02 | |
June | | | 1.00 | | | | 0.90 | | | | 0.93 | | | | 1.03 | | | | 1.02 | |
July | | | 1.00 | | | | 0.90 | | | | 0.93 | | | | 1.03 | | | | 1.02 | |
August | | | 1.00 | | | | 0.90 | | | | 0.93 | | | | 1.03 | | | | 1.02 | |
September | | | 1.00 | | | | 0.90 | | | | 0.93 | | | | 1.04 | | | | 1.03 | |
Total | | | 12.00 | | | | 10.80 | | | | 11.16 | | | | 12.37 | | | | 12.25 | |
*The distribution amount is the sum of all net investment income distributions for the period shown. All Fund distributions will vary depending upon current market conditions, and past distributions are not indicative of future trends.
security’s relative value based on such factors as anticipated cash flow, interest or dividend coverage, asset coverage and earnings.
Manager’s Discussion
During the period under review, our equity weighting decreased from 57.8% to 54.9%, while our fixed income weighting decreased from 40.5% to 39.0%. The Fund’s cash position increased from 1.7% to 6.1% of total net assets.
As we actively continued to manage the Fund’s multi-asset strategy, our portfolio decisions were made in relation to other opportunities available to us, with a focus on individual security selection. Our view has been that the investment performance of securities within the Fund should be driven primarily by company-specific initiatives and opportunities, and secondarily by broader market or interest-rate movements. As strong market fundamentals compressed relative value within the high-yield asset class, we were able to effectively reduce some of the Fund’s company exposures and increase our allocations to those we considered more attractive. As a result,
1. Source: Morningstar.
2. Source: Lipper, a Thomson Reuters Company. For the 12-month period ended 9/30/17, this category consisted of 546 funds. Lipper calculations do not include sales charges or expense subsidization by a fund’s manager. The Fund’s performance relative to the average may have differed if these and other factors had been considered.
The indexes are unmanaged and include reinvestment of any income or distributions. They do not reflect any fees, expenses or sales charges. One cannot invest directly in an index, and an index is not representative of the Fund’s portfolio.
The dollar value, number of shares or principal amount, and names of all portfolio holdings are listed in the Fund’s Statement of Investments (SOI). The SOI begins on page 63.
| | | | |
| 18 | | Annual Report | | franklintempleton.com |
FRANKLIN INCOME FUND
the Fund held fewer bond issuers at period-end than it did in early 2017 as we implemented larger position weightings. We also aimed for bond-specific positioning in short- to intermediate-term maturities, which in our opinion offered better risk/reward potential at this point of the economic, business and credit cycles.
Our exposure to equities at period-end reflected our view that corporate fundamentals remained healthy and that equities remained fairly attractive compared to more interest rate-sensitive asset classes, given the potential for eventual higher interest rates and the risk this might entail for the broader fixed income market. Dividends remained a core focus of the Fund’s equity allocation.
Among equities, our view during the period was that financials, and US banks in particular, were well positioned to generate some of their strongest dividend growth going forward, while other sectors might also see steady payouts. Financials were led primarily by our holdings in large-cap US banks. JPMorgan Chase, Wells Fargo and Bank of America were among the Fund’s top contributors as generally rising interest rates and an improving regulatory environment bolstered company results.
Fund performance benefited from holdings in several companies in the materials sector, including DowDuPont, Rio Tinto and BASF. Dow and DuPont completed their merger in August 2017, and the fundamentals of these companies’ core chemical and agriculture businesses remained robust. Cost and revenue synergies from the merger and clarity on the planned composition of their material science, specialty products and agricultural segments further supported company returns.
The information technology sector was another source of positive Fund returns during the period. Microsoft and Apple were major contributors to Fund performance and continued to grow their dividends at a near double-digit percentage pace.
All equity sectors the Fund invested in during the period delivered positive performance. However, some individual holdings detracted from Fund results.
Several energy sector holdings, including Anadarko Petroleum, Baker Hughes (a General Electric company) and Occidental Petroleum, detracted from Fund results. Uneven commodity prices put downward pressure on share prices, before recovering to some extent near period-end.
General Electric detracted from industrials sector returns as the company reported depressed cash flow and underwent a management change. New Chief Executive Officer (CEO) John Flannery took over from outgoing CEO Jeff Immelt in August.
Portfolio Composition
9/30/17
| | | | |
| | |
| % of Total
Net Assets |
|
Equity* | | | 54.9% | |
Energy | | | 8.3% | |
Health Care | | | 7.4% | |
Financials** | | | 7.0% | |
Utilities | | | 5.9% | |
Industrials | | | 5.5% | |
Information Technology | | | 5.3% | |
Consumer Discretionary | | | 4.9% | |
Materials | | | 4.8% | |
Consumer Staples | | | 3.7% | |
Telecommunication Services | | | 1.4% | |
Real Estate | | | 0.7% | |
Fixed Income*** | | | 39.0% | |
Health Care | | | 9.5% | |
Energy | | | 7.5% | |
Consumer Discretionary | | | 6.0% | |
Financials | | | 4.1% | |
Utilities | | | 2.7% | |
Telecommunication Services | | | 2.6% | |
Materials | | | 2.0% | |
Industrials | | | 1.9% | |
Information Technology | | | 1.8% | |
Real Estate | | | 0.5% | |
Consumer Staples | | | 0.4% | |
Short-Term Investments & Other Net Assets | | | 6.1% | |
*Includes convertible bonds.
**Includes options purchased.
***Includes senior floating rate interests.
|
What is an option? |
|
An option is a contract to buy or sell a specific financial product known
as the option’s underlying instrument at a specific price. The buyer of an option has the right, but not the obligation, to buy or sell the underlying instrument at or until a specified expiration date. Conversely, the seller (“writer”) of an option who opens a transaction is obligated to buy or sell the underlying instrument should the option holder exercise that right. |
Target detracted from results in the consumer discretionary sector as the general retailer’s results and stock performance suffered from weaker in-store traffic trends and increased brick and mortar and online competition.
The Fund’s fixed income weighting at period-end reflected our view that bond returns might be more characterized by income
| | | | |
| franklintempleton.com | | Annual Report | | 19 |
FRANKLIN INCOME FUND
Top Five Equity Holdings
9/30/17
| | | | |
Company Sector/Industry | |
| % of Total
Net Assets |
|
Royal Dutch Shell PLC Energy | | | 2.3% | |
General Electric Co. Industrials | | | 2.0% | |
Wells Fargo & Co. Financials | | | 1.9% | |
BASF SE Materials | | | 1.5% | |
Ford Motor Co. Consumer Discretionary | | | 1.5% | |
generation, as opposed to capital appreciation, given an upward move in bond prices during the period. This positioning also reflected our view at period-end that corporate fundamentals for high-yield issuers remained healthy. Toward period-end, we managed risk within our high-yield exposure with emphasis on individual security selection. We focused on eliminating asset class allocation risk for more targeted and concentrated risk exposures within investment opportunities that we continued to find compelling.
We decreased the portfolio’s overall energy exposure by reducing our equity positions. Our shift away from equities and into bonds dampened some of the volatility that may have come with any dramatic moves in oil prices. We also decreased allocation in communications, which included trimming our exposure to Sprint Communications, a well-known cell phone provider.3 Additionally, we increased our exposure to consumer non-cyclicals, which included hospitals and pharmaceuticals.4
Energy was a major performer within fixed income during the period. Chesapeake Energy and Weatherford International benefited from our shift from equities to bonds within the energy sector. In addition, both Chesapeake and Weatherford benefited from their abilities to access the capital markets to pay down debt, with Chesapeake also selling some non-core assets to address near-term maturities.
Within communications, our fixed income position in Sprint was a strong performer during the period, benefiting from strong operating performance and increased merger speculation. As a result, we thought it made sense to reduce some of our exposure and take some profits given the strong
rally. As of period-end, all of our Sprint bond holdings traded at meaningful premiums to par.
The consumer non-cyclical sector was also a strong fixed income performer, especially with regard to our health care holdings, as concerns about the potential repeal of the Affordable Care Act eased and it became clear that much of the Act would remain in place. We increased our exposure to Tenet Healthcare—a significant contributor during the period. Tenet continued to post solid earnings and took another step toward becoming the premier operator of surgery centers in the US. Similarly, we increased our exposure to CHS/Community Health Systems. Community Health results had been relatively weak over the last couple of quarters. Despite this, we continue to believe that asset sales will improve management’s ability to manage the remaining portfolio of hospitals while also allowing for significant debt reduction. Similar to some of our other top performers, both companies also demonstrated an ability to tap the debt markets to refinance near-term maturities, which helped performance during the period.
Top Five Fixed Income Holdings
and Senior Floating Rate Interests*
9/30/17
| | | | |
Company Sector/Industry | |
| % of Total
Net Assets |
|
CHS/Community Health Systems Inc. Health Care | | | 2.9% | |
Chesapeake Energy Corp. Energy | | | 2.7% | |
Tenet Healthcare Corp. Health Care | | | 1.7% | |
Weatherford International Ltd. Energy | | | 1.7% | |
JPMorgan Chase & Co. Financials | | | 1.4% | |
*Does not include convertible bonds.
Within the pharmaceuticals industry in the fixed income consumer non-cyclical sector, Valeant Pharmaceuticals International was a strong contributor to performance as we increased our exposure over the period. Market sentiment dramatically changed during the second half of the review period as some of its core business segments such as Salix and Bausch & Lomb displayed stability and the potential for future growth. Our position also benefited from the management team’s exceeding its commitment to repay a meaningful
3. Communications holdings are in the consumer discretionary and telecommunication services in the fixed income section of the SOI.
4. Consumer non-cyclicals are in consumer discretionary, consumer staples, health care, materials and telecommunication services in the fixed income section of the SOI.
| | | | |
| 20 | | Annual Report | | franklintempleton.com |
FRANKLIN INCOME FUND
amount of debt on its balance sheet through divestitures and cash flow, while continuing to focus on this as a top priority. One of our largest fixed income detractors was also within pharmaceuticals, Concordia International. Concordia underperformed with weak earnings, showing declines in its US business followed by a dampened outlook for the second half of 2017, while regulatory fears in the UK also weighed on performance. Declines stemmed from increased competition for a few of its larger products. We exited the position during the period under review.
All fixed income sectors the Fund invested in during the period delivered positive performance. However, some individual holdings detracted from Fund results.
Although consumer cyclicals5 contributed, a few retail holdings in various segments detracted, including Academy Sports.6 Investors worried about the meaningful decline in sales over the period and the higher fixed cost structure with traditional brick-and-mortar retailers, given the shift toward online consumption. The Fund’s exposure was very limited with a preference for senior secured debt, where a claim on assets and the company’s collateral could limit some of the downside.
Thank you for your continued participation in Franklin Income Fund. We look forward to serving your future investment needs.
| | |
 | | 
|
| | Edward Perks, CFA |
| |
| | Matthew Quinlan |
| | Richard S. Hsu, CFA |
| | Todd Brighton, CFA |
| |
| | Portfolio Management Team |
The foregoing information reflects our analysis, opinions and portfolio holdings as of September 30, 2017, the end of the reporting period. The way we implement our main investment strategies and the resulting portfolio holdings may change depending on factors such as market and economic conditions. These opinions may not be relied upon as investment advice or an offer for a particular security. The information is not a complete analysis of every aspect of any market, country, industry, security or the Fund. Statements of fact are from sources considered reliable, but the investment manager makes no representation or warranty as to their completeness or accuracy. Although historical performance is no guarantee of future results, these insights may help you understand our investment management philosophy.
5. Consumer cyclicals are in consumer discretionary and real estate in the fixed income section of the SOI.
6. Academy in the fixed income section of the SOI.
See www.franklintempletondatsources.com for additional provider information.
| | | | |
| franklintempleton.com | | Annual Report | | 21 |
FRANKLIN INCOME FUND
Performance Summary as of September 30, 2017
The performance tables and graphs do not reflect any taxes that a shareholder would pay on Fund dividends, capital gain distributions, if any, or any realized gains on the sale of Fund shares. Total return reflects reinvestment of the Fund’s dividends and capital gain distributions, if any, and any unrealized gains or losses. Your dividend income will vary depending on dividends or interest paid by securities in the Fund’s portfolio, adjusted for operating expenses of each class. Capital gain distributions are net profits realized from the sale of portfolio securities.
Performance as of 9/30/171
Cumulative total return excludes sales charges. Average annual total return includes maximum sales charges. Sales charges will vary depending on the size of the investment and the class of share purchased. The maximum is 4.25% and the minimum is 0%. Class A: 4.25% maximum initial sales charge; Advisor Class: no sales charges. For other share classes, visit franklintempleton.com.
| | | | | | | | |
| Share Class | | Cumulative Total Return2 | | | Average Annual Total Return3 | |
| | |
A | | | | | | | | |
1-Year | | | +11.86% | | | | +7.10% | |
5-Year | | | +39.84% | | | | +6.00% | |
10-Year | | | +66.73% | | | | +4.80% | |
| | |
Advisor | | | | | | | | |
1-Year | | | +12.09% | | | | +12.09% | |
5-Year | | | +40.57% | | | | +7.05% | |
10-Year | | | +69.08% | | | | +5.39% | |
| | | | | | | | | | | | |
| | | Distribution | | | 30-Day Standardized Yield5 | |
| Share Class | | Rate4 | | | (with waiver) | | | (without waiver) | |
A | | | 4.80% | | | | 3.59% | | | | 3.57% | |
Advisor | | | 5.22% | | | | 3.90% | | | | 3.89% | |
Performance data represent past performance, which does not guarantee future results. Investment return and principal value will fluctuate, and you may have a gain or loss when you sell your shares. Current performance may differ from figures shown. For most recent month-end performance, go to franklintempleton.com or call (800) 342-5236.
| | | | |
| 22 | | Annual Report | | franklintempleton.com |
FRANKLIN INCOME FUND
PERFORMANCE SUMMARY
Total Return Index Comparison for a Hypothetical $10,000 Investment
Total return represents the change in value of an investment over the periods shown. It includes any applicable maximum sales charge, Fund expenses, account fees and reinvested distributions. The unmanaged indexes include reinvestment of any income or distributions. They differ from the Fund in composition and do not pay management fees or expenses. One cannot invest directly in an index.
Class A (10/1/07–9/30/17)
Advisor Class (10/1/07–9/30/17)
| | | | |
| franklintempleton.com | | Annual Report | | 23 |
FRANKLIN INCOME FUND
PERFORMANCE SUMMARY
Net Asset Value
| | | | | | |
| Share Class (Symbol) | | 9/30/17 | | 9/30/16 | | Change |
| A (FKINX) | | $2.39 | | $2.25 | | +$0.14 |
| C (FCISX) | | $2.42 | | $2.27 | | +$0.15 |
| R (FISRX) | | $2.35 | | $2.21 | | +$0.14 |
| R6 (FNCFX) | | $2.37 | | $2.23 | | +$0.14 |
| Advisor (FRIAX) | | $2.37 | | $2.23 | | +$0.14 |
Distributions (10/1/16–9/30/17)
| | | | |
| Share Class | | Net Investment
Income | |
| A | | | $0.1200 | |
| C | | | $0.1080 | |
| R | | | $0.1116 | |
| R6 | | | $0.1237 | |
| Advisor | | | $0.1225 | |
Total Annual Operating Expenses8
| | | | |
| Share Class | | | | |
| A | | | 0.61% | |
| Advisor | | | 0.46% | |
| | | | |
| 24 | | Annual Report | | franklintempleton.com |
FRANKLIN INCOME FUND
PERFORMANCE SUMMARY
Each class of shares is available to certain investors and has different annual fees and expenses, as described in the prospectus.
All investments involve risks, including possible loss of principal. The Fund’s share price and yield will be affected by interest rate movements. Bond prices generally move in the opposite direction of interest rates. Thus, as prices of bonds in the Fund adjust to a rise in interest rates, the Fund’s share price may decline. Changes in the financial strength of a bond issuer or in a bond’s credit rating may affect its value. The Fund’s portfolio includes a substantial portion of higher yielding, lower rated corporate bonds because of the relatively higher yields they offer. Floating-rate loans are lower rated, higher yielding instruments, which are subject to increased risk of default and can potentially result in loss of principal. These securities carry a greater degree of credit risk relative to investment-grade securities. Stock prices fluctuate, sometimes rapidly and dramatically, due to factors affecting individual companies, particular industries or sectors, or general market conditions. The Fund is actively managed but there is no guarantee that the manager’s investment decisions will produce the desired results. The Fund’s prospectus also includes a description of the main investment risks.
1. The Fund has a fee waiver associated with any investment it makes in a Franklin Templeton money fund and/or other Franklin Templeton fund, contractually guaranteed through 1/31/18. Fund investment results reflect the fee waiver; without this waiver, the results would have been lower.
2.Cumulative total return represents the change in value of an investment over the periods indicated.
3. Average annual total return represents the average annual change in value of an investment over the periods indicated. Return for less than one year, if any, has not been annualized.
4. Distribution rate is based on an annualization of the respective class’s September dividend and the maximum offering price (NAV for Advisor Class) per share on 9/30/17.
5. The Fund’s 30-day standardized yield is calculated over a trailing 30-day period using the yield to maturity on bonds and/or the dividends accrued on stocks. It may not equal the Fund’s actual income distribution rate, which reflects the Fund’s past dividends paid to shareholders.
6. Source: Morningstar. The S&P 500 is a market capitalization-weighted index of 500 stocks designed to measure total US equity market performance. The Bloomberg Barclays US Aggregate Bond Index is a market capitalization-weighted index representing the U.S. investment-grade, fixed-rate, taxable bond market with index components for government and corporate, mortgage pass-through and asset-backed securities. All issues included are SEC registered, taxable, dollar denominated and nonconvertible, must have at least one year to final maturity and must be rated investment grade (Baa3/BBB-/BBB- or higher) using the middle rating of Moody’s, S&P and Fitch, respectively.
7. Source: Lipper, a Thomas Reuters Company. The Lipper Mixed-Asset Target Allocation Moderate Funds Classification Average is calculated by averaging the total returns of all funds within the Lipper Mixed-Asset Target Allocation Moderate Funds classification in the Lipper Open-End underlying funds universe. Lipper Mixed-Asset Target Allocation Moderate Funds are defined as funds that, by portfolio practice, maintain a mix of between 40%–60% equity securities, with the remainder invested in bonds, cash and cash equivalents. For the 12-month period ended 9/30/17, there were 546 funds in this category. Lipper calculations do not include sales charges or expense subsidization by a fund’s manager. The Fund’s performance relative to the average may have differed if these and other factors had been considered.
8. Figures are as stated in the Fund’s current prospectus and may differ from the expense ratios disclosed in the Your Fund’s Expenses and Financial Highlights sections in this report. In periods of market volatility, assets may decline significantly, causing total annual Fund operating expenses to become higher than the figures shown.
See www.franklintempletondatasources.com for additional provider information.
| | | | |
| franklintempleton.com | | Annual Report | | 25 |
FRANKLIN INCOME FUND
Your Fund’s Expenses
As a Fund shareholder, you can incur two types of costs: (1) transaction costs, including sales charges (loads) on Fund purchases and redemptions; and (2) ongoing Fund costs, including management fees, distribution and service (12b-1) fees, and other Fund expenses. All mutual funds have ongoing costs, sometimes referred to as operating expenses. The table below shows ongoing costs of investing in the Fund and can help you understand these costs and compare them with those of other mutual funds. The table assumes a $1,000 investment held for the six months indicated.
Actual Fund Expenses
The table below provides information about actual account values and actual expenses in the columns under the heading “Actual.” In these columns the Fund’s actual return, which includes the effect of Fund expenses, is used to calculate the “Ending Account Value” for each class of shares. You can estimate the expenses you paid during the period by following these steps (of course, your account value and expenses will differ from those in this illustration): Divide your account value by $1,000 (if your account had an $8,600 value, then $8,600 ÷ $1,000 = 8.6). Then multiply the result by the number in the row for your class of shares under the headings “Actual” and “Expenses Paid During Period” (if Actual Expenses Paid During Period were $7.50, then 8.6 x $7.50 = $64.50). In this illustration, the actual expenses paid this period are $64.50.
Hypothetical Example for Comparison with Other Funds
Under the heading “Hypothetical” in the table, information is provided about hypothetical account values and hypothetical expenses based on the Fund’s actual expense ratio and an assumed rate of return of 5% per year before expenses, which is not the Fund’s actual return. This information may not be used to estimate the actual ending account balance or expenses you paid for the period, but it can help you compare ongoing costs of investing in the Fund with those of other funds. To do so, compare this 5% hypothetical example for the class of shares you hold with the 5% hypothetical examples that appear in the shareholder reports of other funds.
Please note that expenses shown in the table are meant to highlight ongoing costs and do not reflect any transactional costs. Therefore, information under the heading “Hypothetical” is useful in comparing ongoing costs only, and will not help you compare total costs of owning different funds. In addition, if transactional costs were included, your total costs would have been higher.
| | | | | | | | | | | | | | | | | | |
| | | | | | | Actual
(actual return after expenses) | | | | Hypothetical
(5% annual return before expenses) | | | | |
Share Class | | Beginning
Account
Value 4/1/17 | | | | Ending Account Value 9/30/17 | | Expenses Paid During
Period
4/1/17–9/30/171,2 | | | | Ending
Account
Value 9/30/17 | | Expenses Paid During
Period 4/1/17–9/30/171,2 | | | | Net
Annualized
Expense
Ratio2 |
A | | $1,000 | | | | $1,038.90 | | $3.07 | | | | $1,022.06 | | $3.04 | | | | 0.60% |
C | | $1,000 | | | | $1,040.10 | | $5.63 | | | | $1,019.55 | | $5.57 | | | | 1.10% |
R | | $1,000 | | | | $1,042.20 | | $4.81 | | | | $1,020.31 | | $4.81 | | | | 0.95% |
R6 | | $1,000 | | | | $1,040.00 | | $1.89 | | | | $1,023.21 | | $1.88 | | | | 0.37% |
Advisor | | $1,000 | | | | $1,039.80 | | $2.30 | | | | $1,022.81 | | $2.28 | | | | 0.45% |
1. Expenses are equal to the annualized expense ratio for the six-month period as indicated above—in the far right column—multiplied by the simple average account value over the period indicated, and then multiplied by 183/365 to reflect the one-half year period.
2. Reflects expenses after fee waivers and expense reimbursements. Does not include acquired fund fees and expenses.
| | | | |
| 26 | | Annual Report | | franklintempleton.com |
Franklin U.S. Government Securities Fund
This annual report for Franklin U.S. Government Securities Fund covers the fiscal year ended September 30, 2017.
Your Fund’s Goal and Main Investments
The Fund seeks income by investing at least 80% of its net assets in U.S. government securities. The Fund presently invests substantially all of its assets in Government National Mortgage Association obligations (Ginnie Maes).
Since 1983, the Fund has invested substantially in Ginnie Mae securities, which carry a guarantee backed by the full faith and credit of the U.S. government as to the timely payment of interest and principal.1 Issued by the Government National Mortgage Association (GNMA), Ginnie Maes have been among the highest yielding U.S. government obligations available.
Portfolio Composition
| | | | |
Based on Total Net Assets as of 9/30/17 | | | | |
GNMA | | | 97.2% | |
U.S. Government & Agency Securities | | | 1.5% | |
Short-Term Investments & Other Net Assets | | | 1.3% | |
Performance Overview
The Fund’s Class A shares had a -0.45% cumulative total return for the 12 months under review. In comparison, the Bloomberg Barclays US Government Index: Intermediate Component, the intermediate component of the Bloomberg Barclays US Government Index, had -0.66% total return.2 The Fund’s peers, as measured by the Lipper GNMA Funds Classification Average, which consists of funds chosen by Lipper that invest primarily in GNMAs, had a -0.28% total return for the same period.3 You can find the Fund’s long-term performance data in the Performance Summary beginning on page 29.
Performance data represent past performance, which does not guarantee future results. Investment return and principal value will fluctuate, and you may have a gain or loss when you sell your shares. Current performance may differ from figures shown. For most recent month-end performance, go to franklintempleton.com or call (800) 342-5236.
Investment Strategy
We currently invest the Fund’s assets substantially in GNMA obligations. We analyze securities using proprietary models to help us identify attractive investment opportunities. The Fund’s short-term investments may include short-term government securities and cash.
Dividend Distributions*
10/1/16–9/30/17
| | | | | | | | | | | | | | | | | | | | |
| | | Dividend per Share (cents) | |
| Month | | Class A | | | Class C | | | Class R | | | Class R6 | | | Advisor
Class | |
October | | | 1.69 | | | | 1.42 | | | | 1.50 | | | | 1.84 | | | | 1.77 | |
November | | | 1.51 | | | | 1.25 | | | | 1.34 | | | | 1.66 | | | | 1.59 | |
December | | | 1.61 | | | | 1.35 | | | | 1.43 | | | | 1.76 | | | | 1.69 | |
January | | | 1.60 | | | | 1.34 | | | | 1.41 | | | | 1.75 | | | | 1.68 | |
February | | | 1.63 | | | | 1.39 | | | | 1.46 | | | | 1.77 | | | | 1.70 | |
March | | | 1.59 | | | | 1.33 | | | | 1.38 | | | | 1.74 | | | | 1.67 | |
April | | | 1.53 | | | | 1.28 | | | | 1.36 | | | | 1.68 | | | | 1.61 | |
May | | | 1.63 | | | | 1.36 | | | | 1.44 | | | | 1.78 | | | | 1.71 | |
June | | | 1.57 | | | | 1.32 | | | | 1.39 | | | | 1.72 | | | | 1.65 | |
July | | | 1.56 | | | | 1.30 | | | | 1.38 | | | | 1.71 | | | | 1.64 | |
August | | | 1.55 | | | | 1.29 | | | | 1.36 | | | | 1.71 | | | | 1.63 | |
September | | | 1.54 | | | | 1.29 | | | | 1.36 | | | | 1.69 | | | | 1.62 | |
Total | | | 19.01 | | | | 15.92 | | | | 16.81 | | | | 20.81 | | | | 19.96 | |
*The distribution amount is the sum of all net investment income distributions for the period shown. All Fund distributions will vary depending upon current market conditions, and past distributions are not indicative of future trends.
Manager’s Discussion
The overall mortgage market provided mixed results during the period as Treasuries outperformed mortgage-backed securities (MBS). In contrast, asset-backed securities, US agency securities and commercial MBS outpaced Treasuries. US economic indicators were generally encouraging during the reporting period. Steady growth in the services sector created new jobs and boosted employment levels. Retail sales grew for most of the period. Low energy prices pulled inflation lower. In
1. Securities owned by the Fund, but not shares of the Fund, are guaranteed by the US government, its agencies or instrumentalities as to timely payment of principal and interest. The Fund’s yield and share price are not guaranteed and will vary with market conditions.
2. Source: Morningstar.
3. Source: Lipper, a Thomson Reuters Company. For the 12-month period ended 9/30/17, there were 58 funds in this category. Lipper calculations do not include sales charges or expense subsidization by a fund’s manager. The Fund’s performance relative to the average may have differed if these or other factors had been considered.
The indexes are unmanaged and include reinvestment of any income or distributions. They do not reflect any fees, expenses or sales charges. One cannot invest directly in an index, and an index is not representative of the Fund’s portfolio.
See www.franklintempletondatasources.com for additional data provider information.
The dollar value, number of shares or principal amount, and names of all portfolio holdings are listed in the Fund’s Statement of Investments (SOI).
The SOI begins on page 83.
| | | | |
| franklintempleton.com | | Annual Report | | 27 |
FRANKLIN U.S. GOVERNMENT SECURITIES FUND
this environment, home sales grew early in the period, but slowed by period-end because of low supply levels and rising prices.
GNMAs produced negative excess returns and underperformed Treasuries.
In our view, agency MBS remained fully valued. The Fed’s participation in agency MBS has, in our view, kept mortgage valuations high. Questions persist about the demand source for agency MBS once the Fed moves closer to ceasing reinvestment in MBS. We felt demand from banks, mortgage real estate investment trusts, overseas investors and domestic money managers would need to rise to compensate for the Fed’s reduced presence in the MBS sector. We believed prepayment levels could moderate with mortgage rates staying in the same range and underwriting standards remaining tight.
Within the agency mortgage pass-through sector, GNMAs underperformed their Freddie Mac and Fannie Mae counterparts. On a total return basis, GNMA 6.0% coupons were the best performers, while 4.5% and 5.0% coupons generally lagged.
The Fund maintains a conservative, disciplined investment strategy and invests entirely in GNMA mortgage pass-throughs, which remain the only MBS that are backed by the full faith and credit of the US government—the same guarantee applicable to US Treasuries.1 We believe our collateral-intensive research approach can allow us to uncover dislocations across the GNMA markets and associated misvaluation of prepayment risk. We continue to focus on specified pools where we believe our experience and continual investment in new technologies help us uncover these discrepancies.
During the period, we were more weighted toward GNMA IIs (pools of mortgages from multiple issuers) than GNMA Is (pools of mortgages from single issuers). Over the period, we added to GNMA II 3.0% and 3.5% coupons, while reducing exposure to 4.0% coupons. Our heaviest allocation was in 3.5%, 4.0% and 4.5% coupons at period-end. The Fund’s position in 3.5% coupon GNMA securities generally benefited performance, while our allocation to 4.0% coupon GNMAs detracted from performance.
Thank you for your continued participation in Franklin U.S. Government Securities Fund. We welcome your comments and questions and look forward to serving your investment needs in the years ahead.
| | |

| | 
|
| | Roger A. Bayston, CFA |
| | |

| | 
Paul Varunok |
| |
| |
| | Portfolio Management Team |
The foregoing information reflects our analysis, opinions and portfolio holdings as of September 30, 2017, the end of the reporting period. The way we implement our main investment strategies and the resulting portfolio holdings may change depending on factors such as market and economic conditions. These opinions may not be relied upon as investment advice or an offer for a particular security. The information is not a complete analysis of every aspect of any market, country, industry, security or the Fund. Statements of fact are from sources considered reliable, but the investment manager makes no representation or warranty as to their completeness or accuracy. Although historical performance is no guarantee of future results, these insights may help you understand our investment management philosophy.
| | | | |
| 28 | | Annual Report | | franklintempleton.com |
FRANKLIN U.S. GOVERNMENT SECURITIES FUND
Performance Summary as of September 30, 2017
The performance tables and graphs do not reflect any taxes that a shareholder would pay on Fund dividends, capital gain distributions, if any, or any realized gains on the sale of Fund shares. Total return reflects reinvestment of the Fund’s dividends and capital gain distributions, if any, and any unrealized gains or losses. Your dividend income will vary depending on dividends or interest paid by securities in the Fund’s portfolio, adjusted for operating expenses of each class. Capital gain distributions are net profits realized from the sale of portfolio securities.
Performance as of 9/30/171
Cumulative total return excludes sales charges. Average annual total return include maximum sales charges. Sales charges will vary depending on the size of the investment and the class of share purchased. The maximum is 4.25% and the minimum is 0%. Class A: 4.25% maximum initial sales charge; Advisor Class: no sales charges. For other share classes, visit franklintempleton.com.
| | | | | | | | |
| Share Class | |
| Cumulative
Total Return |
2 | |
| Average Annual
Total Return3 |
|
| | |
A | | | | | | | | |
1-Year | | | -0.45% | | | | -4.66% | |
5-Year | | | +4.74% | | | | +0.05% | |
10-Year | | | +39.90% | | | | +2.97% | |
| | |
Advisor | | | | | | | | |
1-Year | | | -0.30% | | | | -0.30% | |
5-Year | | | +5.52% | | | | +1.08% | |
10-Year | | | +41.81% | | | | +3.55% | |
| | | | | | | | | | | | |
| | | | | | | |
| | | Distribution | | | 30-Day Standardized Yield5 | |
| Share Class | | Rate4 | | | (with waiver) | | | (without waiver) | |
A | | | 2.89% | | | | 2.12% | | | | 2.12% | |
Advisor | | | 3.16% | | | | 2.36% | | | | 2.35% | |
Performance data represent past performance, which does not guarantee future results. Investment return and principal value will fluctuate, and you may have a gain or loss when you sell your shares. Current performance may differ from figures shown. For most recent month-end performance, go to franklintempleton.com or call (800) 342-5236.
See page 31 for Performance Summary footnotes.
| | | | |
| franklintempleton.com | | Annual Report | | 29 |
FRANKLIN U.S. GOVERNMENT SECURITIES FUND
PERFORMANCE SUMMARY
Total Return Index Comparison for a Hypothetical $10,000 Investment1
Total return represents the change in value of an investment over the periods shown. It includes any applicable maximum sales charge, Fund expenses, account fees and reinvested distributions. The unmanaged indexes include reinvestment of any income or distributions. They differ from the Fund in composition and do not pay management fees or expenses. One cannot invest directly in an index.
Class A (10/1/07–9/30/17)

Advisor Class (10/1/07–9/30/17)
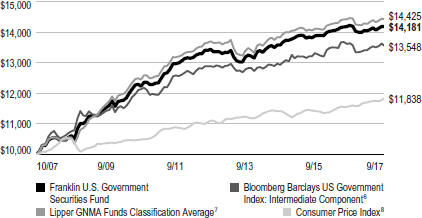
See page 31 for Performance Summary footnotes.
| | | | |
| 30 | | Annual Report | | franklintempleton.com |
FRANKLIN U.S. GOVERNMENT SECURITIES FUND
PERFORMANCE SUMMARY
Distributions (10/1/16–9/30/17)
| | | | |
| Share Class | | Net Investment
Income | |
A | | | $0.1901 | |
C | | | $0.1592 | |
R | | | $0.1681 | |
R6 | | | $0.2081 | |
Advisor | | | $0.1996 | |
Total Annual Operating Expenses9
| | | | | | |
| Share Class | | With Waiver | | | Without Waiver |
A | | | 0.77% | | | 0.78% |
Advisor | | | 0.62% | | | 0.63% |
Each class of shares is available to certain eligible investors and has different annual fees and expenses, as described in the prospectus.
All investments involve risks, including possible loss of principal. The Fund’s share price and yield will be affected by interest rate movements and mortgage prepayments. Bond prices generally move in the opposite direction of interest rates. Thus, as prices of bonds in the Fund adjust to a rise in interest rates, the Fund’s share price may decline. Changes in the financial strength of a bond issuer or in a bond’s credit rating may affect its value. The Fund is actively managed but there is no guarantee that the manager’s investment decisions will produce the desired results. The Fund’s prospectus also includes a description of the main investment risks.
1. The Fund has a fee waiver associated with any investment it makes in a Franklin Templeton money fund and/or other Franklin Templeton fund, contractually guaranteed through 1/31/18. Fund investment results reflect the fee waiver; without this waiver, the results would have been lower.
2. Cumulative total return represents the change in value of an investment over the periods indicated.
3. Average annual total return represents the average annual change in value of an investment over the periods indicated. Return for less than one year, if any, has not been annualized.
4. Distribution rate is based on an annualization of the respective class’s September dividend and the maximum offering price (NAV for Advisor Class) per share on 9/30/17.
5. The Fund’s 30-day standardized yield is calculated over a trailing 30-day period using the yield to maturity on bonds and/or the dividends accrued on stocks. It may not equal the Fund’s actual income distribution rate, which reflects the Fund’s past dividends paid to shareholders.
6. Source: Bloomberg Barclays US Government Index; Intermediate Component is the intermediate component of the Bloomberg Barclays US Government Index, which includes public obligations of the US Treasury with at least one year to final maturity and publicly issued debt of US government agencies, quasi-federal corporations, and corporate or foreign debt guaranteed by the US government.
7. Source: Lipper, a Thomson Reuters Company. The Lipper GNMA Funds Classification Average is calculated by averaging the total sum for all funds within the Lipper GNMA Funds classification in the Lipper Open-End underlying funds universe for the period indicated. Lipper GNMA Funds are defined as funds that invest primarily in Government National Mortgage Association securities. For the 12-month period ended 9/30/17, there were 58 funds in this category. Lipper calculations do not include sales charges or expense subsidization by a fund’s manager. The Fund’s performance relative to the average may have differed if these or other factors had been considered.
8. Source: Bureau of Labor Statistics, bls.gov/cpi. The Consumer Price Index (CPI) is a commonly used measure of the inflation rate.
9. Figures are as stated in the Fund’s current prospectus and may differ from the expense ratios disclosed in the Your Fund’s Expenses and Financial Highlights sections in this report. In periods of market volatility, assets may decline significantly, causing total annual Fund operating expenses to become higher than the figures shown.
See www.franklintempletondatasources.com for additional data provider information.
| | | | |
| franklintempleton.com | | Annual Report | | 31 |
FRANKLIN U.S . GOVERNMENT SECURITIES FUND
Your Fund’s Expenses
As a Fund shareholder, you can incur two types of costs: (1) transaction costs, including sales charges (loads) on Fund purchases and redemptions; and (2) ongoing Fund costs, including management fees, distribution and service (12b-1) fees, and other Fund expenses. All mutual funds have ongoing costs, sometimes referred to as operating expenses. The table below shows ongoing costs of investing in the Fund and can help you understand these costs and compare them with those of other mutual funds. The table assumes a $1,000 investment held for the six months indicated.
Actual Fund Expenses
The table below provides information about actual account values and actual expenses in the columns under the heading “Actual.” In these columns the Fund’s actual return, which includes the effect of Fund expenses, is used to calculate the “Ending Account Value” for each class of shares. You can estimate the expenses you paid during the period by following these steps (of course, your account value and expenses will differ from those in this illustration): Divide your account value by $1,000 (if your account had an $8,600 value, then $8,600 ÷ $1,000 = 8.6). Then multiply the result by the number in the row for your class of shares under the headings “Actual” and “Expenses Paid During Period” (if Actual Expenses Paid During Period were $7.50, then 8.6 x $7.50 = $64.50). In this illustration, the actual expenses paid this period are $64.50.
Hypothetical Example for Comparison with Other Funds
Under the heading “Hypothetical” in the table, information is provided about hypothetical account values and hypothetical expenses based on the Fund’s actual expense ratio and an assumed rate of return of 5% per year before expenses, which is not the Fund’s actual return. This information may not be used to estimate the actual ending account balance or expenses you paid for the period, but it can help you compare ongoing costs of investing in the Fund with those of other funds. To do so, compare this 5% hypothetical example for the class of shares you hold with the 5% hypothetical examples that appear in the shareholder reports of other funds.
Please note that expenses shown in the table are meant to highlight ongoing costs and do not reflect any transactional costs. Therefore, information under the heading “Hypothetical” is useful in comparing ongoing costs only, and will not help you compare total costs of owning different funds. In addition, if transactional costs were included, your total costs would have been higher.
| | | | | | | | | | | | | | | | | | |
| | | | | | | Actual
(actual return after expenses) | | | | Hypothetical
(5% annual return before expenses) | | | | |
Share
Class | | Beginning
Account
Value 4/1/17 | | | | Ending
Account
Value 9/30/17 | | Expenses
Paid During
Period
4/1/17–9/30/171,2 | | | | Ending
Account
Value 9/30/17 | | Expenses
Paid During
Period
4/1/17–9/30/171,2 | | | | Net
Annualized
Expense
Ratio2 |
A | | $1,000 | | | | $1,010.40 | | $4.03 | | | | $1,021.06 | | $4.05 | | | | 0.80% |
C | | $1,000 | | | | $1,006.30 | | $6.54 | | | | $1,018.55 | | $6.58 | | | | 1.30% |
R | | $1,000 | | | | $1,007.00 | | $5.79 | | | | $1,019.30 | | $5.82 | | | | 1.15% |
R6 | | $1,000 | | | | $1,011.90 | | $2.42 | | | | $1,022.66 | | $2.43 | | | | 0.48% |
Advisor | | $1,000 | | | | $1,009.50 | | $3.27 | | | | $1,021.81 | | $3.29 | | | | 0.65% |
1. Expenses are equal to the annualized expense ratio for the six-month period as indicated above—in the far right column—multiplied by the simple average account value over the period indicated, and then multiplied by 183/365 to reflect the one-half year period.
2. Reflects expenses after fee waivers and expense reimbursements. Does not include acquired fund fees and expenses.
| | | | |
| 32 | | Annual Report | | franklintempleton.com |
Franklin Utilities Fund
This annual report for Franklin Utilities Fund covers the fiscal year ended September 30, 2017.
Your Fund’s Goal and Main Investments
The Fund seeks both capital appreciation and current income by investing at least 80% of its net assets in public utility company securities.
Performance Overview
The Fund’s Class A shares delivered a +10.38% cumulative total return for the 12 months under review. In comparison, the Standard & Poor’s 500 Index (S&P 500), which is a broad measure of US stock performance, generated a +18.61% total return, and the S&P 500 Utilities Index, which measures the performance of all utilities stocks in the S&P 500, produced a +12.03% total return.1 You can find the Fund’s long-term performance data in the Performance Summary beginning on page 35.
Performance data represent past performance, which does not guarantee future results. Investment return will fluctuate. Current performance may differ from figures shown. For most recent month-end performance, go to franklintempleton.com or call (800) 342-5236.
Investment Strategy
We search for the best return opportunities available in the global utilities arena with a specific focus on the US electricity and gas sector. Generally, we look for companies producing a high percentage of earnings from their regulated operations.
Manager’s Discussion
During the 12 months under review, the Fund’s utilities sector holdings contributed to its absolute performance.2 Within the sector, our positions in NextEra Energy, PG&E and CenterPoint Energy helped results.
NextEra’s strong growth is partly due to its recent history of exceeding expectations in earnings and dividend growth, which has increased investor confidence in the company. NextEra also operates one of North America’s largest renewables businesses,
Portfolio Composition
Based on Total Net Assets as of 9/30/17
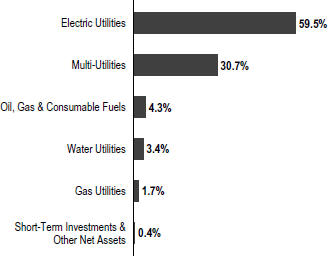
and the company continues to capture a significant percentage of new business in the growing renewables marketplace.
Investors responded positively to PG&E’s dividend increases in mid-2016 and mid-2017, which signaled confidence in the company’s ability to maintain consistent earnings and dividend growth for the foreseeable future. In our opinion, California has significant investment opportunities for infrastructure, and we believe PG&E can benefit from this potential growth.
CenterPoint benefited from increased drilling and investment in US oil and gas assets, which signaled an improvement in the fundamentals of the company’s ownership position in Enable Midstream (not a Fund holding), a publicly traded company that owns, operates and develops natural gas and crude oil infrastructure. CenterPoint stated that it is looking for ways to monetize its position in Enable, while directing the proceeds toward needed investments in its regulated businesses.
In contrast, the energy sector detracted from the Fund’s absolute results.3 Within the sector, Kinder Morgan underperformed expectations as the company continued to make slow progress improving its balance sheet. The company fared poorly compared with the strong performance of regulated electric utilities.
1. Source: Morningstar.
The indexes are unmanaged and include reinvested dividends. They do not reflect any fees, expenses or sales charges. One cannot invest directly in an index, and an index is not representative of the Fund’s portfolio.
2. The utilities sector comprises electric utilities, gas utilities, multi-utilities and water utilities in the SOI.
3. The energy sector comprises oil, gas and consumable fuels in the SOI.
See www.franklintempletondatasources.com for additional data provider information.
The dollar value, number of shares or principal amount, and names of all portfolio holdings are listed in the Fund’s Statement of Investments (SOI). The SOI begins on page 91.
| | | | |
| franklintempleton.com | | Annual Report | | 33 |
FRANKLIN UTILITIES FUND
In the utilities sector, National Grid was negatively affected by increased political disruption in the UK following the Brexit vote and the negotiations between the UK and the European Union (EU) on the terms of the UK’s exit from the EU. This political uncertainty caused investors to worry about future changes in regulatory oversight. Westar’s performance was hurt when Kansas regulators rejected a proposed acquisition of the company by its neighboring utility, Great Plains Energy (also a Fund holding). The rejection led to the two companies negotiating an alternate merger of equals, which implied that the value of Westar’s equity was lower, leading to the stock’s underperformance. We view the longer term outlook of the combined Great Plains/Westar company to be positive.
Top 10 Holdings
9/30/17
| | | | |
Company Sector/Industry | | % of Total
Net Assets | |
NextEra Energy Inc. Electric Utilities | | | 6.6% | |
Dominion Energy Inc. Multi-Utilities | | | 5.0% | |
Sempra Energy Multi-Utilities | | | 4.9% | |
PG&E Corp. Electric Utilities | | | 4.9% | |
Edison International Electric Utilities | | | 4.8% | |
Duke Energy Corp. Electric Utilities | | | 4.4% | |
American Electric Power Co. Inc. Electric Utilities | | | 4.2% | |
Exelon Corp. Electric Utilities | | | 3.9% | |
CMS Energy Corp. Multi-Utilities | | | 3.5% | |
The Southern Co. Electric Utilities | | | 3.4% | |
Thank you for your continued participation in Franklin Utilities Fund. We look forward to serving your future investment needs.
| | |

| | 
|
| | John C. Kohli, CFA |
| |

| | 
|
| | J. Blair Schmicker, CFA |
| |
| | Portfolio Management Team |
The foregoing information reflects our analysis, opinions and portfolio holdings as of September 30, 2017, the end of the reporting period. The way we implement our main investment strategies and the resulting portfolio holdings may change depending on factors such as market and economic conditions. These opinions may not be relied upon as investment advice or an offer for a particular security. The information is not a complete analysis of every aspect of any market, country, industry, security or the Fund. Statements of fact are from sources considered reliable, but the investment manager makes no representation or warranty as to their completeness or accuracy. Although historical performance is no guarantee of future results, these insights may help you understand our investment management philosophy.
| | | | |
| 34 | | Annual Report | | franklintempleton.com |
FRANKLIN UTILITIES FUND
Performance Summary as of September 30, 2017
The performance tables and graphs do not reflect any taxes that a shareholder would pay on Fund dividends, capital gain distributions, if any, or any realized gains on the sale of Fund shares. Total return reflects reinvestment of the Fund’s dividends and capital gain distributions, if any, and any unrealized gains or losses. Your dividend income will vary depending on dividends or interest paid by securities in the Fund’s portfolio, adjusted for operating expenses of each class. Capital gain distributions are net profits realized from the sale of portfolio securities.
Performance as of 9/30/171
Cumulative total return excludes sales charges. Average annual total return includes maximum sales charges. Sales charges will vary depending on the size of the investment and the class of share purchased. The maximum is 4.25% and the minimum is 0%. Class A: 4.25% maximum initial sales charge; Advisor Class: no sales charges. For other share classes, visit franklintempleton.com.
| | | | | | | | |
| Share Class | | Cumulative Total Return2 | | | Average Annual Total Return3 | |
| | |
A | | | | | | | | |
1-Year | | | +10.38% | | | | +5.70% | |
5-Year | | | +68.73% | | | | +10.07% | |
10-Year | | | +109.63% | | | | +7.21% | |
| | |
Advisor | | | | | | | | |
1-Year | | | +10.64% | | | | +10.64% | |
5-Year | | | +70.12% | | | | +11.21% | |
10-Year | | | +112.98% | | | | +7.85% | |
| | | | | | | | | | | | |
| | | Distribution | | | 30-Day Standardized Yield5 | |
| Share Class | | Rate4 | | | (with waiver) | | | (without waiver) | |
A | | | 2.40 | % | | | 2.58 | % | | | 2.58 | % |
Advisor | | | 2.63 | % | | | 2.84 | % | | | 2.84 | % |
Performance data represent past performance, which does not guarantee future results. Investment return and principal value will fluctuate, and you may have a gain or loss when you sell your shares. Current performance may differ from figures shown. For most recent month-end performance, go to franklintempleton.com or call (800) 342-5236.
See page 37 for Performance Summary footnotes.
| | | | |
| franklintempleton.com | | Annual Report | | 35 |
FRANKLIN UTILITIES FUND
PERFORMANCE SUMMARY
Total Return Index Comparison for a Hypothetical $10,000 Investment
Total return represents the change in value of an investment over the periods shown. It includes any applicable maximum sales charge, Fund expenses, account fees and reinvested distributions. The unmanaged indexes include reinvestment of any income or distributions. They differ from the Fund in composition and do not pay management fees or expenses. One cannot invest directly in an index.
Class A (10/1/07–9/30/17)
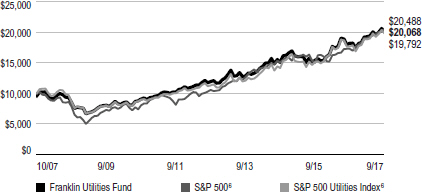
Advisor Class (10/1/07–9/30/17)
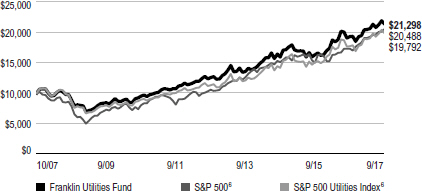
| | | | |
| 36 | | Annual Report | | franklintempleton.com |
FRANKLIN UTILITIES FUND
PERFORMANCE SUMMARY
Net Asset Value
| | | | | | | | | | | | |
| Share Class (Symbol) | | 9/30/17 | | | 9/30/16 | | | Change | |
A (FKUTX) | | | $19.18 | | | | $17.85 | | | | +$1.33 | |
C (FRUSX) | | | $19.09 | | | | $17.76 | | | | +$1.33 | |
R (FRURX) | | | $19.11 | | | | $17.78 | | | | +$1.33 | |
R6 (FUFRX) | | | $19.32 | | | | $17.97 | | | | +$1.35 | |
Advisor (FRUAX) | | | $19.32 | | | | $17.97 | | | | +$1.35 | |
Distributions (10/1/16–9/30/17)
| | | | | | | | | | | | |
| Share Class | | Net Investment
Income | | | Short-Term
Capital Gain | | | Total | |
A | | | $0.4866 | | | | $0.0102 | | | | $0.4968 | |
C | | | $0.3949 | | | | $0.0102 | | | | $0.4051 | |
R | | | $0.4222 | | | | $0.0102 | | | | $0.4324 | |
R6 | | | $0.5336 | | | | $0.0102 | | | | $0.5438 | |
Advisor | | | $0.5142 | | | | $0.0102 | | | | $0.5244 | |
Total Annual Operating Expenses7
| | | | |
| Share Class | | | |
A | | | 0.73% | |
Advisor | | | 0.58% | |
Each class of shares is available to certain eligible investors and has different annual fees and expenses, as described in the prospectus.
All investments involve risks, including possible loss of principal. Investing in a fund concentrating in the utilities sector involves special risks, including increased susceptibility to adverse economic and regulatory developments affecting the sector. Stocks historically have outperformed other asset classes over the long term, but tend to fluctuate more dramatically over the short term. Securities issued by utility companies have been historically sensitive to interest rate changes. When interest rates fall, utility securities prices, and thus a utilities fund’s share price, tend to rise; when interest rates rise, their prices generally fall. The Fund is actively managed but there is no guarantee that the manager’s investment decisions will produce the desired results. The Fund’s prospectus also includes a description of the main investment risks.
1. The Fund has a fee waiver associated with any investment it makes in a Franklin Templeton money fund and/or other Franklin Templeton fund, contractually guaranteed through 1/31/18. Fund investment results reflect the fee waiver; without this waiver, the results would have been lower.
2. Cumulative total return represents the change in value of an investment over the periods indicated.
3. Average annual total return represents the average annual change in value of an investment over the periods indicated. Return for less than one year, if any, has not been annualized.
4. Distribution rate is based on an annualization of the respective class’s current quarterly dividend and the maximum offering price (NAV for Advisor Class) per share on 9/30/17.
5. The Fund’s 30-day standardized yield is calculated over a trailing 30-day period using the yield to maturity on bonds and/or the dividends accrued on stocks. It may not equal the Fund’s actual income distribution rate, which reflects the Fund’s past dividends paid to shareholders.
6. Source: Morningstar. The S&P 500 is a market capitalization-weighted index of 500 stocks designed to measure total U.S. equity market performance. The S&P 500 Utilities Index is market capitalization weighted and consists of all utility stocks in the S&P 500.
7. Figures are as stated in the Fund’s current prospectus and may differ from the expense ratios disclosed in the Your Fund’s Expenses and Financial Highlights sections in this report. In periods of market volatility, assets may decline significantly, causing total annual Fund operating expenses to become higher than the figures shown.
See www.franklintempletondatasources.com for additional provider information.
| | | | |
| franklintempleton.com | | Annual Report | | 37 |
FRANKLIN UTILITIES FUND
Your Fund’s Expenses
As a Fund shareholder, you can incur two types of costs: (1) transaction costs, including sales charges (loads) on Fund purchases and redemptions; and (2) ongoing Fund costs, including management fees, distribution and service (12b-1) fees, and other Fund expenses. All mutual funds have ongoing costs, sometimes referred to as operating expenses. The table below shows ongoing costs of investing in the Fund and can help you understand these costs and compare them with those of other mutual funds. The table assumes a $1,000 investment held for the six months indicated.
Actual Fund Expenses
The table below provides information about actual account values and actual expenses in the columns under the heading “Actual.” In these columns the Fund’s actual return, which includes the effect of Fund expenses, is used to calculate the “Ending Account Value” for each class of shares. You can estimate the expenses you paid during the period by following these steps (of course, your account value and expenses will differ from those in this illustration): Divide your account value by $1,000 (if your account had an $8,600 value, then $8,600 ÷ $1,000 = 8.6). Then multiply the result by the number in the row for your class of shares under the headings “Actual” and “Expenses Paid During Period” (if Actual Expenses Paid During Period were $7.50, then 8.6 x $7.50 = $64.50). In this illustration, the actual expenses paid this period are $64.50.
Hypothetical Example for Comparison with Other Funds
Under the heading “Hypothetical” in the table, information is provided about hypothetical account values and hypothetical expenses based on the Fund’s actual expense ratio and an assumed rate of return of 5% per year before expenses, which is not the Fund’s actual return. This information may not be used to estimate the actual ending account balance or expenses you paid for the period, but it can help you compare ongoing costs of investing in the Fund with those of other funds. To do so, compare this 5% hypothetical example for the class of shares you hold with the 5% hypothetical examples that appear in the shareholder reports of other funds.
Please note that expenses shown in the table are meant to highlight ongoing costs and do not reflect any transactional costs. Therefore, information under the heading “Hypothetical” is useful in comparing ongoing costs only, and will not help you compare total costs of owning different funds. In addition, if transactional costs were included, your total costs would have been higher.
| | | | | | | | | | | | | | | | | | |
| | | | | | | Actual
(actual return after expenses) | | | | Hypothetical
(5% annual return before expenses) | | | | |
Share
Class | | Beginning
Account
Value 4/1/17 | | | | Ending
Account
Value 9/30/17 | | Expenses
Paid During
Period
4/1/17–9/30/171,2 | | | | Ending
Account
Value 9/30/17 | | Expenses
Paid During
Period
4/1/17–9/30/171,2 | | | | Net
Annualized
Expense
Ratio2 |
A | | $1,000 | | | | $1,042.20 | | $3.84 | | | | $1,021.31 | | $3.80 | | | | 0.75% |
C | | $1,000 | | | | $1,039.90 | | $6.39 | | | | $1,018.80 | | $6.33 | | | | 1.25% |
R | | $1,000 | | | | $1,040.00 | | $5.63 | | | | $1,019.55 | | $5.57 | | | | 1.10% |
R6 | | $1,000 | | | | $1,043.20 | | $2.46 | | | | $1,022.66 | | $2.43 | | | | 0.48% |
Advisor | | $1,000 | | | | $1,043.20 | | $3.07 | | | | $1,022.06 | | $3.04 | | | | 0.60% |
1. Expenses are equal to the annualized expense ratio for the six-month period as indicated above—in the far right column—multiplied by the simple average account value over the period indicated, and then multiplied by 183/365 to reflect the one-half year period.
2. Reflects expenses after fee waivers and expense reimbursements. Does not include acquired fund fees and expenses.
| | | | |
| 38 | | Annual Report | | franklintempleton.com |
FRANKLIN CUSTODIAN FUNDS
Financial Highlights
Franklin DynaTech Fund
| | | | | | | | | | | | | | | | | | | | |
| | | Year Ended September 30, | |
| | | 2017 | | | 2016 | | | 2015 | | | 2014 | | | 2013 | |
Class A | | | | | | | | | | | | | | | | | | | | |
| | | | | |
Per share operating performance (for a share outstanding throughout the year) | | | | | | | | | | | | | | | | | | | | |
Net asset value, beginning of year | | | $52.05 | | | | $46.04 | | | | $46.08 | | | | $42.13 | | | | $34.00 | |
Income from investment operationsa: | | | | | | | | | | | | | | | | | | | | |
Net investment income (loss)b | | | (0.18 | ) | | | (0.14 | ) | | | (0.21 | ) | | | (0.18 | ) | | | (0.12 | ) |
Net realized and unrealized gains (losses) | | | 12.92 | | | | 7.35 | | | | 1.78 | | | | 5.94 | | | | 8.25 | |
Total from investment operations | | | 12.74 | | | | 7.21 | | | | 1.57 | | | | 5.76 | | | | 8.13 | |
Less distributions from net realized gains | | | (1.69 | ) | | | (1.20 | ) | | | (1.61 | ) | | | (1.81 | ) | | | — | |
Net asset value, end of year | | | $63.10 | | | | $52.05 | | | | $46.04 | | | | $46.08 | | | | $42.13 | |
| | | | | |
Total returnc | | | 25.67% | | | | 15.73% | | | | 3.40% | | | | 13.98% | | | | 23.91% | |
| | | | | |
Ratios to average net assets | | | | | | | | | | | | | | | | | | | | |
Expenses before waiver and payments by affiliates | | | 0.92% | | | | 0.91% | | | | 0.89% | | | | 0.89% | | | | 0.94% | |
Expenses net of waiver and payments by affiliates | | | 0.91% | d | | | 0.90% | | | | 0.89% | e | | | 0.89% | d,e | | | 0.94% | |
Net investment income (loss) | | | (0.33)% | | | | (0.30)% | | | | (0.44)% | | | | (0.41)% | | | | (0.34)% | |
| | | | | |
Supplemental data | | | | | | | | | | | | | | | | | | | | |
Net assets, end of year (000’s) | | | $2,498,393 | | | | $2,123,082 | | | | $1,857,570 | | | | $1,504,338 | | | | $1,072,814 | |
Portfolio turnover rate | | | 19.85% | | | | 22.42% | | | | 31.02% | | | | 26.43% | | | | 35.40% | |
aThe amount shown for a share outstanding throughout the period may not correlate with the Statement of Operations for the period due to the timing of sales and repurchases of the Fund’s shares in relation to income earned and/or fluctuating fair value of the investments of the Fund.
bBased on average daily shares outstanding.
cTotal return does not reflect sales commissions or contingent deferred sales charges, if applicable.
dBenefit of expense reduction rounds to less than 0.01%.
eBenefit of waiver and payments by affiliates rounds to less than 0.01%.
| | | | | | |
| franklintempleton.com | | The accompanying notes are an integral part of these financial statements. | Annual Report | | | 39 | |
FRANKLIN CUSTODIAN FUNDS
FINANCIAL HIGHLIGHTS
Franklin DynaTech Fund (continued)
| | | | | | | | | | | | | | | | | | | | |
| | | Year Ended September 30, | |
| | | 2017 | | | 2016 | | | 2015 | | | 2014 | | | 2013 | |
Class C | | | | | | | | | | | | | | | | | | | | |
| | | | | |
Per share operating performance
(for a share outstanding throughout the year) | | | | | | | | | | | | | | | | | | | | |
Net asset value, beginning of year | | | $44.71 | | | | $40.00 | | | | $40.53 | | | | $37.53 | | | | $30.52 | |
Income from investment operationsa: | | | | | | | | | | | | | | | | | | | | |
Net investment income (loss)b | | | (0.50 | ) | | | (0.43 | ) | | | (0.50 | ) | | | (0.46 | ) | | | (0.35 | ) |
Net realized and unrealized gains (losses) | | | 10.97 | | | | 6.34 | | | | 1.58 | | | | 5.27 | | | | 7.36 | |
Total from investment operations | | | 10.47 | | | | 5.91 | | | | 1.08 | | | | 4.81 | | | | 7.01 | |
Less distributions from net realized gains | | | (1.69 | ) | | | (1.20 | ) | | | (1.61 | ) | | | (1.81 | ) | | | — | |
Net asset value, end of year | | | $53.49 | | | | $44.71 | | | | $40.00 | | | | $40.53 | | | | $37.53 | |
| | | | | |
Total returnc | | | 24.72% | | | | 14.86% | | | | 2.63% | | | | 13.13% | | | | 22.97% | |
| | | | | |
Ratios to average net assets | | | | | | | | | | | | | | | | | | | | |
Expenses before waiver and payments by affiliates | | | 1.67% | | | | 1.66% | | | | 1.64% | | | | 1.64% | | | | 1.69% | |
Expenses net of waiver and payments by affiliates | | | 1.66% | d | | | 1.65% | | | | 1.64% | e | | | 1.64% | d,e | | | 1.69% | |
Net investment income (loss) | | | (1.08)% | | | | (1.05)% | | | | (1.19)% | | | | (1.16)% | | | | (1.09)% | |
| | | | | |
Supplemental data | | | | | | | | | | | | | | | | | | | | |
Net assets, end of year (000’s) | | | $374,502 | | | | $318,896 | | | | $270,961 | | | | $212,961 | | | | $176,556 | |
Portfolio turnover rate | | | 19.85% | | | | 22.42% | | | | 31.02% | | | | 26.43% | | | | 35.40% | |
aThe amount shown for a share outstanding throughout the period may not correlate with the Statement of Operations for the period due to the timing of sales and repurchases of the Fund’s shares in relation to income earned and/or fluctuating fair value of the investments of the Fund.
bBased on average daily shares outstanding.
cTotal return does not reflect sales commissions or contingent deferred sales charges, if applicable.
dBenefit of expense reduction rounds to less than 0.01%.
eBenefit of waiver and payments by affiliates rounds to less than 0.01%.
| | | | |
| 40 | | Annual Report | The accompanying notes are an integral part of these financial statements. | | franklintempleton.com |
FRANKLIN CUSTODIAN FUNDS
FINANCIAL HIGHLIGHTS
Franklin DynaTech Fund (continued)
| | | | | | | | | | | | | | | | | | | | |
| | | Year Ended September 30, | |
| | | 2017 | | | 2016 | | | 2015 | | | 2014 | | | 2013 | |
Class R | | | | | | | | | | | | | | | | | | | | |
| | | | | |
Per share operating performance
(for a share outstanding throughout the year) | | | | | | | | | | | | | | | | | | | | |
Net asset value, beginning of year | | | $50.90 | | | | $45.16 | | | | $45.35 | | | | $41.58 | | | | $33.65 | |
Income from investment operationsa: | | | | | | | | | | | | | | | | | | | | |
Net investment income (loss)b | | | (0.31 | ) | | | (0.26 | ) | | | (0.32 | ) | | | (0.29 | ) | | | (0.21 | ) |
Net realized and unrealized gains (losses) | | | 12.61 | | | | 7.20 | | | | 1.74 | | | | 5.87 | | | | 8.14 | |
Total from investment operations | | | 12.30 | | | | 6.94 | | | | 1.42 | | | | 5.58 | | | | 7.93 | |
Less distributions from net realized gains | | | (1.69 | ) | | | (1.20 | ) | | | (1.61 | ) | | | (1.81 | ) | | | — | |
Net asset value, end of year | | | $61.51 | | | | $50.90 | | | | $45.16 | | | | $45.35 | | | | $41.58 | |
| | | | | |
Total return | | | 25.36% | | | | 15.43% | | | | 3.11% | | | | 13.72% | | | | 23.57% | |
| | | | | |
Ratios to average net assets | | | | | | | | | | | | | | | | | | | | |
Expenses before waiver and payments by affiliates | | | 1.17% | | | | 1.16% | | | | 1.14% | | | | 1.14% | | | | 1.19% | |
Expenses net of waiver and payments by affiliates | | | 1.16% | c | | | 1.15% | | | | 1.14% | d | | | 1.14% | c,d | | | 1.19% | |
Net investment income (loss) | | | (0.58)% | | | | (0.55)% | | | | (0.69)% | | | | (0.66)% | | | | (0.59)% | |
| | | | | |
Supplemental data | | | | | | | | | | | | | | | | | | | | |
Net assets, end of year (000’s) | | | $47,860 | | | | $38,862 | | | | $43,001 | | | | $45,230 | | | | $41,825 | |
Portfolio turnover rate | | | 19.85% | | | | 22.42% | | | | 31.02% | | | | 26.43% | | | | 35.40% | |
aThe amount shown for a share outstanding throughout the period may not correlate with the Statement of Operations for the period due to the timing of sales and repurchases of the Fund’s shares in relation to income earned and/or fluctuating fair value of the investments of the Fund.
bBased on average daily shares outstanding.
cBenefit of expense reduction rounds to less than 0.01%.
dBenefit of waiver and payments by affiliates rounds to less than 0.01%.
| | | | | | |
| franklintempleton.com | | The accompanying notes are an integral part of these financial statements. | Annual Report | | | 41 | |
FRANKLIN CUSTODIAN FUNDS
FINANCIAL HIGHLIGHTS
Franklin DynaTech Fund (continued)
| | | | | | | | | | | | | | | | | | | | |
| | | Year Ended September 30, | |
| | | | 2017 | | | | 2016 | | | | 2015 | | | | 2014 | | | | 2013 | a |
Class R6 | | | | | | | | | | | | | | | | | | | | |
| | | | | |
Per share operating performance (for a share outstanding throughout the year) | | | | | | | | | | | | | | | | | | | | |
Net asset value, beginning of year | | | $53.56 | | | | $47.15 | | | | $46.97 | | | | $42.74 | | | | $36.56 | |
Income from investment operationsb: | | | | | | | | | | | | | | | | | | | | |
Net investment income (loss)c | | | 0.06 | | | | 0.06 | | | | (0.01 | ) | | | (0.01 | ) | | | 0.01 | |
Net realized and unrealized gains (losses) | | | 13.35 | | | | 7.55 | | | | 1.80 | | | | 6.05 | | | | 6.17 | |
Total from investment operations | | | 13.41 | | | | 7.61 | | | | 1.79 | | | | 6.04 | | | | 6.18 | |
Less distributions from net realized gains | | | (1.69 | ) | | | (1.20 | ) | | | (1.61 | ) | | | (1.81 | ) | | | — | |
Net asset value, end of year. | | | $65.28 | | | | $53.56 | | | | $47.15 | | | | $46.97 | | | | $42.74 | |
| | | | | |
Total returnd | | | 26.17% | | | | 16.21% | | | | 3.81% | | | | 14.45% | | | | 16.90% | |
| | | | | |
Ratios to average net assetse | | | | | | | | | | | | | | | | | | | | |
Expenses before waiver and payments by affiliates | | | 0.49% | | | | 0.49% | | | | 0.48% | | | | 0.49% | | | | 0.52% | |
Expenses net of waiver and payments by affiliates | | | 0.48% | f | | | 0.48% | | | | 0.48% | g | | | 0.49% | f,g | | | 0.52% | |
Net investment income (loss) | | | 0.10% | | | | 0.12% | | | | (0.03 | )% | | | (0.01 | )% | | | 0.08% | |
| | | | | |
Supplemental data | | | | | | | | | | | | | | | | | | | | |
Net assets, end of year (000’s) | | | $457,846 | | | | $359,505 | | | | $362,627 | | | | $342,466 | | | | $317,315 | |
Portfolio turnover rate | | | 19.85% | | | | 22.42% | | | | 31.02% | | | | 26.43% | | | | 35.40% | |
aFor the period May 1, 2013 (effective date) to September 30, 2013.
bThe amount shown for a share outstanding throughout the period may not correlate with the Statement of Operations for the period due to the timing of sales and repurchases of the Fund’s shares in relation to income earned and/or fluctuating fair value of the investments of the Fund.
cBased on average daily shares outstanding.
dTotal return is not annualized for periods less than one year.
eRatios are annualized for periods less than one year.
fBenefit of expense reduction rounds to less than 0.01%.
gBenefit of waiver and payments by affiliates rounds to less than 0.01%.
| | | | |
| 42 | | Annual Report | The accompanying notes are an integral part of these financial statements. | | franklintempleton.com |
FRANKLIN CUSTODIAN FUNDS
FINANCIAL HIGHLIGHTS
Franklin DynaTech Fund (continued)
| | | | | | | | | | | | | | | | | | | | |
| | | Year Ended September 30, | |
| | | | 2017 | | | | 2016 | | | | 2015 | | | | 2014 | | | | 2013 | |
Advisor Class | | | | | | | | | | | | | | | | | | | | |
| | | | | |
Per share operating performance (for a share outstanding throughout the year) | | | | | | | | | | | | | | | | | | | | |
Net asset value, beginning of year | | | $53.25 | | | | $46.96 | | | | $46.87 | | | | $42.71 | | | | $34.39 | |
Income from investment operationsa: | | | | | | | | | | | | | | | | | | | | |
Net investment income (loss)b | | | (0.04 | ) | | | (0.03 | ) | | | (0.09 | ) | | | (0.07 | ) | | | (0.03 | ) |
Net realized and unrealized gains (losses) | | | 13.26 | | | | 7.52 | | | | 1.79 | | | | 6.04 | | | | 8.35 | |
Total from investment operations | | | 13.22 | | | | 7.49 | | | | 1.70 | | | | 5.97 | | | | 8.32 | |
Less distributions from net realized gains | | | (1.69 | ) | | | (1.20 | ) | | | (1.61 | ) | | | (1.81 | ) | | | — | |
Net asset value, end of year | | | $64.78 | | | | $53.25 | | | | $46.96 | | | | $46.87 | | | | $42.71 | |
| | | | | |
Total return | | | 25.98% | | | | 16.02% | | | | 3.62% | | | | 14.29% | | | | 24.19% | |
| | | | | |
Ratios to average net assets | | | | | | | | | | | | | | | | | | | | |
Expenses before waiver and payments by affiliates | | | 0.67% | | | | 0.66% | | | | 0.64% | | | | 0.64% | | | | 0.69% | |
Expenses net of waiver and payments by affiliates | | | 0.66% | c | | | 0.65% | | | | 0.64% | d | | | 0.64% | c,d | | | 0.69% | |
Net investment income (loss) | | | (0.08)% | | | | (0.05)% | | | | (0.19)% | | | | (0.16)% | | | | (0.09)% | |
| | | | | |
Supplemental data | | | | | | | | | | | | | | | | | | | | |
Net assets, end of year (000’s) | | | $712,762 | | | | $203,443 | | | | $176,090 | | | | $159,180 | | | | $122,287 | |
Portfolio turnover rate | | | 19.85% | | | | 22.42% | | | | 31.02% | | | | 26.43% | | | | 35.40% | |
aThe amount shown for a share outstanding throughout the period may not correlate with the Statement of Operations for the period due to the timing of sales and repurchases of the Fund’s shares in relation to income earned and/or fluctuating fair value of the investments of the Fund.
bBased on average daily shares outstanding.
cBenefit of expense reduction rounds to less than 0.01%.
dBenefit of waiver and payments by affiliates rounds to less than 0.01%.
| | | | | | |
| franklintempleton.com | | The accompanying notes are an integral part of these financial statements. | Annual Report | | | 43 | |
FRANKLIN CUSTODIAN FUNDS
Statement of Investments, September 30, 2017
Franklin DynaTech Fund
| | | | | | | | | | | | | | |
| | | | | | Country | | | | Shares | | | | Value | |
| | Common Stocks 97.7% | | | | | | | | | | | | |
| | Aerospace & Defense 2.8% | | | | | | | | | | | | |
| | The Boeing Co. | | | United States | | | | 200,000 | | | $ | 50,842,000 | |
| | Heico Corp. | | | United States | | | | 60,000 | | | | 5,388,600 | |
a | | Mercury Systems Inc. | | | United States | | | | 40,000 | | | | 2,075,200 | |
| | Raytheon Co. | | | United States | | | | 300,000 | | | | 55,974,000 | |
| | | | | | | | | | | | | 114,279,800 | |
| | Air Freight & Logistics 1.1% | | | | | | | | | | | | |
| | FedEx Corp. | | | United States | | | | 200,000 | | | | 45,116,000 | |
| | Automobiles 0.2% | | | | | | | | | | | | |
a | | Tesla Inc. | | | United States | | | | 30,000 | | | | 10,233,000 | |
| | Biotechnology 6.2% | | | | | | | | | | | | |
a | | Alexion Pharmaceuticals Inc. | | | United States | | | | 10,000 | | | | 1,402,900 | |
| | Amgen Inc. | | | United States | | | | 80,000 | | | | 14,916,000 | |
a | | Biogen Inc. | | | United States | | | | 80,000 | | | | 25,049,600 | |
a | | Bioverativ Inc. | | | United States | | | | 60,000 | | | | 3,424,200 | |
a | | Bluebird Bio Inc. | | | United States | | | | 52,000 | | | | 7,142,200 | |
a | | Celgene Corp. | | | United States | | | | 650,000 | | | | 94,783,000 | |
a | | Incyte Corp. | | | United States | | | | 300,000 | | | | 35,022,000 | |
a | | Neurocrine Biosciences Inc. | | | United States | | | | 100,000 | | | | 6,128,000 | |
a | | Regeneron Pharmaceuticals Inc. | | | United States | | | | 110,000 | | | | 49,183,200 | |
a | | Tesaro Inc. | | | United States | | | | 125,000 | | | | 16,137,500 | |
| | | | | | | | | | | | | 253,188,600 | |
| | Capital Markets 4.4% | | | | | | | | | | | | |
| | CBOE Holdings Inc. | | | United States | | | | 50,000 | | | | 5,381,500 | |
| | The Charles Schwab Corp. | | | United States | | | | 500,000 | | | | 21,870,000 | |
| | Intercontinental Exchange Inc. | | | United States | | | | 750,000 | | | | 51,525,000 | |
| | MarketAxess Holdings Inc. | | | United States | | | | 200,000 | | | | 36,902,000 | |
| | Moody’s Corp. | | | United States | | | | 300,000 | | | | 41,763,000 | |
| | MSCI Inc. | | | United States | | | | 200,000 | | | | 23,380,000 | |
| | | | | | | | | | | | | 180,821,500 | |
| | Chemicals 0.0%† | | | | | | | | | | | | |
| | Albemarle Corp. | | | United States | | | | 10,000 | | | | 1,363,100 | |
| | Commercial Services & Supplies 0.0%† | | | | | | | | | | | | |
| | Novus Holdings Ltd. | | | South Africa | | | | 38,046 | | | | 18,338 | |
| | Communications Equipment 0.5% | | | | | | | | | | | | |
a | | Arista Networks Inc. | | | United States | | | | 100,000 | | | | 18,961,000 | |
| | Electrical Equipment 0.6% | | | | | | | | | | | | |
| | Rockwell Automation Inc. | | | United States | | | | 135,000 | | | | 24,058,350 | |
| | Electronic Equipment, Instruments & Components 3.1% | | | | | | | | | | | | |
| | Amphenol Corp., A | | | United States | | | | 500,000 | | | | 42,320,000 | |
| | Cognex Corp. | | | United States | | | | 255,000 | | | | 28,121,400 | |
a | | Coherent Inc. | | | United States | | | | 90,000 | | | | 21,165,300 | |
a | | Control4 Corp. | | | United States | | | | 10,000 | | | | 294,600 | |
| | Keyence Corp. | | | Japan | | | | 60,000 | | | | 31,841,194 | |
| | Universal Display Corp. | | | United States | | | | 10,000 | | | | 1,288,500 | |
| | | | | | | | | | | | | 125,030,994 | |
| | Energy Equipment & Services 0.9% | | | | | | | | | | | | |
| | Schlumberger Ltd. | | | United States | | | | 500,000 | | | | 34,880,000 | |
| | | | |
| 44 | | Annual Report | | franklintempleton.com |
FRANKLIN CUSTODIAN FUNDS
STATEMENT OF INVESTMENTS
Franklin DynaTech Fund (continued)
| | | | | | | | | | | | | | |
| | | | | | Country | | | | Shares | | | | Value | |
| | Common Stocks (continued) | | | | | | | | | | | | |
| | Equity Real Estate Investment Trusts (REITs) 4.9% | | | | | | | | | | | | |
| | American Tower Corp. | | | United States | | | | 400,000 | | | $ | 54,672,000 | |
| | Equinix Inc. | | | United States | | | | 200,000 | | | | 89,260,000 | |
a | | SBA Communications Corp., A | | | United States | | | | 400,000 | | | | 57,620,000 | |
| | | | | | | | | | | | | 201,552,000 | |
| | Health Care Equipment & Supplies 5.6% | | | | | | | | | | | | |
| | Abbott Laboratories | | | United States | | | | 250,000 | | | | 13,340,000 | |
a | | ABIOMED Inc. | | | United States | | | | 15,000 | | | | 2,529,000 | |
a | | Align Technology Inc. | | | United States | | | | 65,000 | | | | 12,107,550 | |
| | Becton, Dickinson and Co. | | | United States | | | | 100,000 | | | | 19,595,000 | |
| | Danaher Corp. | | | United States | | | | 100,000 | | | | 8,578,000 | |
a | | Edwards Lifesciences Corp. | | | United States | | | | 400,000 | | | | 43,724,000 | |
a | | IDEXX Laboratories Inc. | | | United States | | | | 380,000 | | | | 59,086,200 | |
a | | Intuitive Surgical Inc. | | | United States | | | | 20,000 | | | | 20,917,600 | |
a | | iRhythm Technologies Inc. | | | United States | | | | 65,000 | | | | 3,372,200 | |
a | | Nevro Corp. | | | United States | | | | 130,000 | | | | 11,814,400 | |
| | Stryker Corp. | | | United States | | | | 250,000 | | | | 35,505,000 | |
| | | | | | | | | | | | | 230,568,950 | |
| | Health Care Providers & Services 1.7% | | | | | | | | | | | | |
| | UnitedHealth Group Inc. | | | United States | | | | 350,000 | | | | 68,547,500 | |
| | Health Care Technology 0.8% | | | | | | | | | | | | |
a | | Veeva Systems Inc. | | | United States | | | | 600,000 | | | | 33,846,000 | |
| | Internet & Direct Marketing Retail 9.3% | | | | | | | | | | | | |
a | | Amazon.com Inc. | | | United States | | | | 230,000 | | | | 221,110,500 | |
a | | Despegar.com Corp. | | | Argentina | | | | 100,000 | | | | 3,200,000 | |
a | | JD.com Inc., ADR | | | China | | | | 20,000 | | | | 764,000 | |
a | | Liberty Expedia Holdings Inc. | | | United States | | | | 220,000 | | | | 11,684,200 | |
a | | Liberty Ventures, A | | | United States | | | | 330,000 | | | | 18,991,500 | |
a | | Netflix Inc. | | | United States | | | | 200,000 | | | | 36,270,000 | |
a | | The Priceline Group Inc. | | | United States | | | | 30,000 | | | | 54,924,600 | |
| | Start Today Co. Ltd. | | | Japan | | | | 1,100,000 | | | | 34,829,914 | |
| | | | | | | | | | | | | 381,774,714 | |
| | Internet Software & Services 17.0% | | | | | | | | | | | | |
a | | 2U Inc. | | | United States | | | | 350,000 | | | | 19,614,000 | |
a | | Alarm.com Holdings Inc. | | | United States | | | | 220,000 | | | | 9,939,600 | |
a | | Alibaba Group Holding Ltd., ADR | | | China | | | | 330,000 | | | | 56,994,300 | |
a | | Alphabet Inc., A | | | United States | | | | 150,000 | | | | 146,058,000 | |
a | | Alphabet Inc., C | | | United States | | | | 62,170 | | | | 59,627,869 | |
a | | Baidu Inc., ADR | | | China | | | | 25,000 | | | | 6,192,250 | |
a | | CommerceHub Inc., A | | | United States | | | | 350,000 | | | | 7,899,500 | |
a | | CommerceHub Inc., C | | | United States | | | | 110,000 | | | | 2,348,500 | |
a | | CoStar Group Inc. | | | United States | | | | 35,000 | | | | 9,388,750 | |
a,b | | Delivery Hero AG, 144A | | | Germany | | | | 100,000 | | | | 3,958,527 | |
a | | Facebook Inc., A | | | United States | | | | 1,100,000 | | | | 187,957,000 | |
| | LogMeIn Inc. | | | United States | | | | 10,000 | | | | 1,100,500 | |
| | MercadoLibre Inc. | | | Argentina | | | | 100,000 | | | | 25,893,000 | |
| | NetEase Inc., ADR | | | China | | | | 100,000 | | | | 26,381,000 | |
a | | Q2 Holdings Inc. | | | United States | | | | 250,000 | | | | 10,412,500 | |
a | | Shopify Inc., A | | | Canada | | | | 100,000 | | | | 11,631,467 | |
| | Tencent Holdings Ltd. | | | China | | | | 2,500,000 | | | | 107,595,707 | |
| | | | |
| franklintempleton.com | | Annual Report | | 45 |
FRANKLIN CUSTODIAN FUNDS
STATEMENT OF INVESTMENTS
Franklin DynaTech Fund (continued)
| | | | | | | | | | | | | | |
| | | | | | Country | | | | Shares | | | | Value | |
| | Common Stocks (continued) | | | | | | | | | | | | |
| | Internet Software & Services (continued) | | | | | | | | | | | | |
a | | Weibo Corp., ADR | | | China | | | | 10,000 | | | $ | 989,400 | |
| | | | | | | | | | | | | 693,981,870 | |
| | IT Services 7.5% | | | | | | | | | | | | |
| | DXC Technology Co. | | | United States | | | | 65,000 | | | | 5,582,200 | |
a | | Fiserv Inc. | | | United States | | | | 300,000 | | | | 38,688,000 | |
a | | InterXion Holding NV | | | Netherlands | | | | 100,000 | | | | 5,093,000 | |
| | Mastercard Inc., A | | | United States | | | | 1,000,000 | | | | 141,200,000 | |
a | | PayPal Holdings Inc. | | | United States | | | | 10,000 | | | | 640,300 | |
a | | Square Inc., A | | | United States | | | | 400,000 | | | | 11,524,000 | |
| | Visa Inc., A | | | United States | | | | 1,000,000 | | | | 105,240,000 | |
| | | | | | | | | | | | | 307,967,500 | |
| | Life Sciences Tools & Services 1.9% | | | | | | | | | | | | |
a | | Illumina Inc. | | | United States | | | | 105,000 | | | | 20,916,000 | |
| | Thermo Fisher Scientific Inc. | | | United States | | | | 200,000 | | | | 37,840,000 | |
a | | Waters Corp. | | | United States | | | | 100,000 | | | | 17,952,000 | |
| | | | | | | | | | | | | 76,708,000 | |
| | Machinery 1.0% | | | | | | | | | | | | |
| | Fortive Corp. | | | United States | | | | 300,000 | | | | 21,237,000 | |
| | KUKA AG | | | Germany | | | | 100,000 | | | | 18,670,069 | |
| | | | | | | | | | | | | 39,907,069 | |
| | Media 1.8% | | | | | | | | | | | | |
a | | Liberty Broadband Corp., A | | | United States | | | | 400,000 | | | | 37,672,000 | |
a | | Liberty Broadband Corp., C | | | United States | | | | 130,907 | | | | 12,475,437 | |
| | Naspers Ltd., N | | | South Africa | | | | 110,000 | | | | 23,708,034 | |
| | | | | | | | | | | | | 73,855,471 | |
| | Pharmaceuticals 0.5% | | | | | | | | | | | | |
| | Merck KGaA | | | Germany | | | | 200,000 | | | | 22,243,379 | |
| | Real Estate Management & Development 0.0%† | | | | | | | | | | | | |
a | | Redfin Corp. | | | United States | | | | 20,400 | | | | 511,836 | |
| | Semiconductors & Semiconductor Equipment 8.7% | | | | | | | | | | | | |
| | Analog Devices Inc. | | | United States | | | | 260,000 | | | | 22,404,200 | |
| | Applied Materials Inc. | | | United States | | | | 255,000 | | | | 13,282,950 | |
| | ASML Holding NV, N.Y. shs | | | Netherlands | | | | 200,000 | | | | 34,240,000 | |
| | Broadcom Ltd. | | | United States | | | | 300,000 | | | | 72,762,000 | |
| | Intel Corp. | | | United States | | | | 800,000 | | | | 30,464,000 | |
| | KLA-Tencor Corp. | | | United States | | | | 135,000 | | | | 14,310,000 | |
| | Lam Research Corp. | | | United States | | | | 350,000 | | | | 64,764,000 | |
| | Monolithic Power Systems | | | United States | | | | 200,000 | | | | 21,310,000 | |
| | NVIDIA Corp. | | | United States | | | | 350,000 | | | | 62,569,500 | |
| | Xilinx Inc. | | | United States | | | | 275,000 | | | | 19,478,250 | |
| | | | | | | | | | | | | 355,584,900 | |
| | Software 15.4% | | | | | | | | | | | | |
| | Activision Blizzard Inc. | | | United States | | | | 500,000 | | | | 32,255,000 | |
a | | Adobe Systems Inc. | | | United States | | | | 500,000 | | | | 74,590,000 | |
a | | ANSYS Inc. | | | United States | | | | 200,000 | | | | 24,546,000 | |
a | | Appian Corp. | | | United States | | | | 55,800 | | | | 1,588,068 | |
a | | Aspen Technology Inc. | | | United States | | | | 500,000 | | | | 31,405,000 | |
a | | Atlassian Corp. PLC | | | Australia | | | | 300,000 | | | | 10,545,000 | |
a | | Autodesk Inc. | | | United States | | | | 350,000 | | | | 39,291,000 | |
| | | | |
| 46 | | Annual Report | | franklintempleton.com |
FRANKLIN CUSTODIAN FUNDS
STATEMENT OF INVESTMENTS
Franklin DynaTech Fund (continued)
| | | | | | | | | | | | | | |
| | | | | | Country | | | | Shares | | | | Value | |
| | Common Stocks (continued) | | | | | | | | | | | | |
| | Software (continued) | | | | | | | | | | | | |
a | | Blackline Inc. | | | United States | | | | 170,000 | | | $ | 5,800,400 | |
a | | Cadence Design Systems Inc. | | | United States | | | | 375,000 | | | | 14,801,250 | |
a | | Electronic Arts Inc. | | | United States | | | | 450,000 | | | | 53,127,000 | |
a | | Guidewire Software Inc. | | | United States | | | | 10,000 | | | | 778,600 | |
a | | Hubspot Inc. | | | United States | | | | 250,000 | | | | 21,012,500 | |
| | Intuit Inc. | | | United States | | | | 250,000 | | | | 35,535,000 | |
| | Microsoft Corp. | | | United States | | | | 750,000 | | | | 55,867,500 | |
a | | Salesforce.com Inc. | | | United States | | | | 850,000 | | | | 79,407,000 | |
a | | ServiceNow Inc. | | | United States | | | | 500,000 | | | | 58,765,000 | |
a | | Splunk Inc. | | | United States | | | | 155,000 | | | | 10,296,650 | |
a | | Tyler Technologies Inc. | | | United States | | | | 100,000 | | | | 17,432,000 | |
a | | Ultimate Software Group Inc. | | | United States | | | | 100,000 | | | | 18,960,000 | |
a | | Workday Inc., A | | | United States | | | | 320,000 | | | | 33,724,800 | |
a | | Zendesk Inc. | | | United States | | | | 300,000 | | | | 8,733,000 | |
| | | | | | | | | | | | | 628,460,768 | |
| | Technology Hardware, Storage & Peripherals 1.5% | | | | | | | | | | | | |
| | Apple Inc. | | | United States | | | | 400,000 | | | | 61,648,000 | |
| | Textiles, Apparel & Luxury Goods 0.3% | | | | | | | | | | | | |
| | NIKE Inc., B | | | United States | | | | 200,000 | | | | 10,370,000 | |
| | Total Common Stocks (Cost $2,005,307,715) | | | | | | | | | | | 3,995,478,639 | |
| | | | |
| | Short Term Investments (Cost $90,584,258) 2.2% | | | | | | | | | | | | |
| | Money Market Funds 2.2% | | | | | | | | | | | | |
c,d | | Institutional Fiduciary Trust Money Market Portfolio, 0.67% | | | United States | | | | 90,584,258 | | | | 90,584,258 | |
| | Total Investments (Cost $2,095,891,973) 99.9% | | | | | | | | | | | 4,086,062,897 | |
| | Other Assets, less Liabilities 0.1% | | | | | | | | | | | 5,300,400 | |
| | Net Assets 100.0% | | | | | | | | | | $ | 4,091,363,297 | |
See Abbreviations on page 124.
†Rounds to less than 0.1% of net assets.
aNon-income producing.
bSecurity was purchased pursuant to Rule 144A under the Securities Act of 1933 and may be sold in transactions exempt from registration only to qualified institutional buyers or in a public offering registered under the Securities Act of 1933. This security has been deemed liquid under guidelines approved by the Trust’s Board of Trustees. At September 30, 2017, the value of this security was $3,958,527, representing 0.1% of net assets.
cSee Note 3(f) regarding investments in affiliated management investment companies.
dThe rate shown is the annualized seven-day yield at period end.
| | | | | | |
| franklintempleton.com | | The accompanying notes are an integral part of these financial statements. | Annual Report | | | 47 | |
FRANKLIN CUSTODIAN FUNDS
Financial Highlights
Franklin Growth Fund
| | | | | | | | | | | | | | | | | | | | |
| | | Year Ended September 30, | |
| | | | 2017 | | | | 2016 | | | | 2015 | | | | 2014 | | | | 2013 | |
| | | | | |
Class A | | | | | | | | | | | | | | | | | | | | |
| | | | | |
Per share operating performance (for a share outstanding throughout the year) | | | | | | | | | | | | | | | | | | | | |
Net asset value, beginning of year | | | $78.54 | | | | $72.40 | | | | $70.51 | | | | $59.49 | | | | $50.13 | |
Income from investment operationsa: | | | | | | | | | | | | | | | | | | | | |
Net investment incomeb | | | 0.40 | | | | 0.47 | c | | | 0.29 | | | | 0.26 | | | | 0.26 | |
Net realized and unrealized gains (losses) | | | 15.56 | | | | 8.51 | | | | 1.79 | | | | 11.06 | | | | 9.24 | |
Total from investment operations | | | 15.96 | | | | 8.98 | | | | 2.08 | | | | 11.32 | | | | 9.50 | |
Less distributions from: | | | | | | | | | | | | | | | | | | | | |
Net investment income | | | (0.39 | ) | | | (0.47 | ) | | | (0.19 | ) | | | (0.30 | ) | | | (0.14 | ) |
Net realized gains | | | (2.50 | ) | | | (2.37 | ) | | | — | | | | — | | | | — | |
Total distributions | | | (2.89 | ) | | | (2.84 | ) | | | (0.19 | ) | | | (0.30 | ) | | | (0.14 | ) |
Net asset value, end of year | | | $91.61 | | | | $78.54 | | | | $72.40 | | | | $70.51 | | | | $59.49 | |
| | | | | |
Total returnd | | | 21.12% | | | | 12.57% | | | | 2.94% | | | | 19.08% | | | | 19.01% | |
| | | | | |
Ratios to average net assets | | | | | | | | | | | | | | | | | | | | |
Expenses before waiver and payments by affiliates | | | 0.88% | | | | 0.88% | | | | 0.88% | | | | 0.90% | | | | 0.91% | |
Expenses net of waiver and payments by affiliatese | | | 0.87% | | | | 0.86% | | | | 0.88% | f | | | 0.90% | f | | | 0.91% | |
Net investment income | | | 0.47% | | | | 0.63% | c | | | 0.38% | | | | 0.40% | | | | 0.49% | |
| | | | | |
Supplemental data | | | | | | | | | | | | | | | | | | | | |
Net assets, end of year (000’s) | | | $8,051,641 | | | | $7,628,523 | | | | $7,185,665 | | | | $6,611,073 | | | | $5,305,031 | |
Portfolio turnover rate | | | 5.60% | | | | 7.53% | | | | 5.05% | | | | 1.50% | | | | 0.83% | |
aThe amount shown for a share outstanding throughout the period may not correlate with the Statement of Operations for the period due to the timing of sales and repurchases of the Fund’s shares in relation to income earned and/or fluctuating fair value of the investments of the Fund.
bBased on average daily shares outstanding.
cNet investment income per share includes approximately $0.10 per share related to income received in the form of special dividends in connection with certain Fund holdings. Excluding this amount, the ratio of net investment income to average net assets would have been 0.50%.
dTotal return does not reflect sales commissions or contingent deferred sales charges, if applicable.
eBenefit of expense reduction rounds to less than 0.01%.
fBenefit of waiver and payments by affiliates rounds to less than 0.01%.
| | | | |
| 48 | | Annual Report | The accompanying notes are an integral part of these financial statements. | | franklintempleton.com |
FRANKLIN CUSTODIAN FUNDS
FINANCIAL HIGHLIGHTS
Franklin Growth Fund (continued)
| | | | | | | | | | | | | | | | | | | | |
| | | Year Ended September 30, | |
| | | | 2017 | | | | 2016 | | | | 2015 | | | | 2014 | | | | 2013 | |
| | | | | |
Class C | | | | | | | | | | | | | | | | | | | | |
| | | | | |
Per share operating performance (for a share outstanding throughout the year) | | | | | | | | | | | | | | | | | | | | |
Net asset value, beginning of year | | | $72.60 | | | | $67.17 | | | | $65.75 | | | | $55.64 | | | | $47.10 | |
Income from investment operationsa: | | | | | | | | | | | | | | | | | | | | |
Net investment income (loss)b | | | (0.21 | ) | | | (0.08 | )c | | | (0.26 | ) | | | (0.22 | ) | | | (0.13 | ) |
Net realized and unrealized gains (losses) | | | 14.36 | | | | 7.88 | | | | 1.68 | | | | 10.33 | | | | 8.67 | |
Total from investment operations | | | 14.15 | | | | 7.80 | | | | 1.42 | | | | 10.11 | | | | 8.54 | |
Less distributions from net realized gains | | | (2.50 | ) | | | (2.37 | ) | | | — | | | | — | | | | — | |
Net asset value, end of year | | | $84.25 | | | | $72.60 | | | | $67.17 | | | | $65.75 | | | | $55.64 | |
| | | | | |
Total returnd | | | 20.21% | | | | 11.74% | | | | 2.16% | | | | 18.17% | | | | 18.13% | |
| | | | | |
Ratios to average net assets | | | | | | | | | | | | | | | | | | | | |
Expenses before waiver and payments by affiliates | | | 1.63% | | | | 1.63% | | | | 1.63% | | | | 1.65% | | | | 1.66% | |
Expenses net of waiver and payments by affiliatese | | | 1.62% | | | | 1.61% | | | | 1.63% | f | | | 1.65% | f | | | 1.66% | |
Net investment income (loss) | | | (0.28)% | | | | (0.12)%c | | | | (0.37 | )% | | | (0.35)% | | | | (0.26)% | |
| | | | | |
Supplemental data | | | | | | | | | | | | | | | | | | | | |
Net assets, end of year (000’s) | | | $930,751 | | | | $846,965 | | | | $777,570 | | | | $662,548 | | | | $546,505 | |
Portfolio turnover rate | | | 5.60% | | | | 7.53% | | | | 5.05% | | | | 1.50% | | | | 0.83% | |
aThe amount shown for a share outstanding throughout the period may not correlate with the Statement of Operations for the period due to the timing of sales and repurchases of the Fund’s shares in relation to income earned and/or fluctuating fair value of the investments of the Fund.
bBased on average daily shares outstanding.
cNet investment income per share includes approximately $0.10 per share related to income received in the form of special dividends in connection with certain Fund holdings. Excluding this amount, the ratio of net investment income to average net assets would have been (0.25)%.
dTotal return does not reflect sales commissions or contingent deferred sales charges, if applicable.
eBenefit of expense reduction rounds to less than 0.01%.
fBenefit of waiver and payments by affiliates rounds to less than 0.01%.
| | | | | | |
| franklintempleton.com | | The accompanying notes are an integral part of these financial statements. | Annual Report | | | 49 | |
FRANKLIN CUSTODIAN FUNDS
FINANCIAL HIGHLIGHTS
Franklin Growth Fund (continued)
| | | | | | | | | | | | | | | | | | | | |
| | | Year Ended September 30, | |
| | | | 2017 | | | | 2016 | | | | 2015 | | | | 2014 | | | | 2013 | |
Class R | | | | | | | | | | | | | | | | | | | | |
| | | | | |
Per share operating performance (for a share outstanding throughout the year) | | | | | | | | | | | | | | | | | | | | |
Net asset value, beginning of year | | | $78.14 | | | | $71.93 | | | | $70.05 | | | | $59.07 | | | | $49.82 | |
Income from investment operationsa: | | | | | | | | | | | | | | | | | | | | |
Net investment incomeb | | | 0.19 | | | | 0.29 | c | | | 0.10 | | | | 0.10 | | | | 0.13 | |
Net realized and unrealized gains (losses) | | | 15.51 | | | | 8.45 | | | | 1.78 | | | | 10.98 | | | | 9.18 | |
Total from investment operations | | | 15.70 | | | | 8.74 | | | | 1.88 | | | | 11.08 | | | | 9.31 | |
Less distributions from: | | | | | | | | | | | | | | | | | | | | |
Net investment income | | | (0.21 | ) | | | (0.16 | ) | | | — | | | | (0.10 | ) | | | (0.06 | ) |
Net realized gains | | | (2.50 | ) | | | (2.37 | ) | | | — | | | | — | | | | — | |
Total distributions | | | (2.71 | ) | | | (2.53 | ) | | | — | | | | (0.10 | ) | | | (0.06 | ) |
Net asset value, end of year | | | $91.13 | | | | $78.14 | | | | $71.93 | | | | $70.05 | | | | $59.07 | |
| | | | | |
Total return | | | 20.81% | | | | 12.29% | | | | 2.68% | | | | 18.77% | | | | 18.71% | |
| | | | | |
Ratios to average net assets | | | | | | | | | | | | | | | | | | | | |
Expenses before waiver and payments by affiliates | | | 1.13% | | | | 1.13% | | | | 1.13% | | | | 1.15% | | | | 1.16% | |
Expenses net of waiver and payments by affiliatesd | | | 1.12% | | | | 1.11% | | | | 1.13% | e | | | 1.15% | e | | | 1.16% | |
Net investment income | | | 0.22% | | | | 0.38% | c | | | 0.13% | | | | 0.15% | | | | 0.24% | |
| | | | | |
Supplemental data | | | | | | | | | | | | | | | | | | | | |
Net assets, end of year (000’s) | | | $510,317 | | | | $477,221 | | | | $501,813 | | | | $565,634 | | | | $552,391 | |
Portfolio turnover rate | | | 5.60% | | | | 7.53% | | | | 5.05% | | | | 1.50% | | | | 0.83% | |
aThe amount shown for a share outstanding throughout the period may not correlate with the Statement of Operations for the period due to the timing of sales and repurchases of the Fund’s shares in relation to income earned and/or fluctuating fair value of the investments of the Fund.
bBased on average daily shares outstanding.
cNet investment income per share includes approximately $0.10 per share related to income received in the form of special dividends in connection with certain Fund holdings. Excluding this amount, the ratio of net investment income to average net assets would have been 0.25%.
dBenefit of expense reduction rounds to less than 0.01%.
eBenefit of waiver and payments by affiliates rounds to less than 0.01%.
| | | | |
| 50 | | Annual Report | The accompanying notes are an integral part of these financial statements. | | franklintempleton.com |
FRANKLIN CUSTODIAN FUNDS
FINANCIAL HIGHLIGHTS
Franklin Growth Fund (continued)
| | | | | | | | | | | | | | | | | | | | |
| | | Year Ended September 30, | |
| | 2017 | | | 2016 | | | 2015 | | | 2014 | | | 2013a | |
| | | | | |
Class R6 | | | | | | | | | | | | | | | | | | | | |
| | | | | |
Per share operating performance (for a share outstanding throughout the year) | | | | | | | | | | | | | | | | | | | | |
Net asset value, beginning of year | | | $78.79 | | | | $72.69 | | | | $70.76 | | | | $59.71 | | | | $54.58 | |
Income from investment operationsb: | | | | | | | | | | | | | | | | | | | | |
Net investment incomec | | | 0.74 | | | | 0.78 | d | | | 0.61 | | | | 0.55 | | | | 0.24 | |
Net realized and unrealized gains (losses) | | | 15.59 | | | | 8.56 | | | | 1.79 | | | | 11.08 | | | | 4.89 | |
Total from investment operations | | | 16.33 | | | | 9.34 | | | | 2.40 | | | | 11.63 | | | | 5.13 | |
Less distributions from: | | | | | | | | | | | | | | | | | | | | |
Net investment income | | | (0.72 | ) | | | (0.87 | ) | | | (0.47 | ) | | | (0.58 | ) | | | — | |
Net realized gains | | | (2.50 | ) | | | (2.37 | ) | | | — | | | | — | | | | — | |
Total distributions | | | (3.22 | ) | | | (3.24 | ) | | | (0.47 | ) | | | (0.58 | ) | | | — | |
Net asset value, end of year | | | $91.90 | | | | $78.79 | | | | $72.69 | | | | $70.76 | | | | $59.71 | |
| | | | | |
Total returne | | | 21.61% | | | | 13.05% | | | | 3.37% | | | | 19.59% | | | | 9.40% | |
| | | | | |
Ratios to average net assetsf | | | | | | | | | | | | | | | | | | | | |
Expenses before waiver and payments by affiliates | | | 0.46% | | | | 0.46% | | | | 0.46% | | | | 0.47% | | | | 0.48% | |
Expenses net of waiver and payments by affiliatesg | | | 0.45% | | | | 0.44% | | | | 0.46% | h | | | 0.47% | h | | | 0.48% | |
Net investment income | | | 0.89% | | | | 1.05% | d | | | 0.80% | | | | 0.83% | | | | 0.92% | |
| | | | | |
Supplemental data | | | | | | | | | | | | | | | | | | | | |
Net assets, end of year (000’s) | | | $1,700,993 | | | | $1,247,825 | | | | $1,163,362 | | | | $1,107,887 | | | | $871,260 | |
Portfolio turnover rate | | | 5.60% | | | | 7.53% | | | | 5.05% | | | | 1.50% | | | | 0.83% | |
aFor the period May 1, 2013 (effective date) to September 30, 2013.
bThe amount shown for a share outstanding throughout the period may not correlate with the Statement of Operations for the period due to the timing of sales and repurchases of the Fund’s shares in relation to income earned and/or fluctuating fair value of the investments of the Fund.
cBased on average daily shares outstanding.
dNet investment income per share includes approximately $0.10 per share related to income received in the form of special dividends in connection with certain Fund holdings. Excluding this amount, the ratio of net investment income to average net assets would have been 0.92%.
eTotal return is not annualized for periods less than one year.
fRatios are annualized for periods less than one year.
gBenefit of expense reduction rounds to less than 0.01%.
hBenefit of waiver and payments by affiliates rounds to less than 0.01%.
| | | | | | |
| franklintempleton.com | | The accompanying notes are an integral part of these financial statements. | Annual Report | | | 51 | |
FRANKLIN CUSTODIAN FUNDS
FINANCIAL HIGHLIGHTS
Franklin Growth Fund (continued)
| | | | | | | | | | | | | | | | | | | | |
| | | Year Ended September 30, | |
| | 2017 | | | 2016 | | | 2015 | | | 2014 | | | 2013 | |
| | | | | |
Advisor Class | | | | | | | | | | | | | | | | | | | | |
| | | | | |
Per share operating performance (for a share outstanding throughout the year) | | | | | | | | | | | | | | | | | | | | |
Net asset value, beginning of year | | | $78.80 | | | | $72.67 | | | | $70.75 | | | | $59.66 | | | | $50.24 | |
Income from investment operationsa: | | | | | | | | | | | | | | | | | | | | |
Net investment incomeb | | | 0.60 | | | | 0.65 | c | | | 0.48 | | | | 0.43 | | | | 0.39 | |
Net realized and unrealized gains (losses) | | | 15.61 | | | | 8.56 | | | | 1.79 | | | | 11.08 | | | | 9.26 | |
Total from investment operations | | | 16.21 | | | | 9.21 | | | | 2.27 | | | | 11.51 | | | | 9.65 | |
Less distributions from: | | | | | | | | | | | | | | | | | | | | |
Net investment income | | | (0.61 | ) | | | (0.71 | ) | | | (0.35 | ) | | | (0.42 | ) | | | (0.23 | ) |
Net realized gains | | | (2.50 | ) | | | (2.37 | ) | | | — | | | | — | | | | — | |
Total distributions | | | (3.11 | ) | | | (3.08 | ) | | | (0.35 | ) | | | (0.42 | ) | | | (0.23 | ) |
Net asset value, end of year | | | $91.90 | | | | $78.80 | | | | $72.67 | | | | $70.75 | | | | $59.66 | |
| | | | | |
Total return | | | 21.43% | | | | 12.85% | | | | 3.20% | | | | 19.37% | | | | 19.29% | |
| | | | | |
Ratios to average net assets | | | | | | | | | | | | | | | | | | | | |
Expenses before waiver and payments by affiliates | | | 0.63% | | | | 0.63% | | | | 0.63% | | | | 0.65% | | | | 0.66% | |
Expenses net of waiver and payments by affiliatesd | | | 0.62% | | | | 0.61% | | | | 0.63% | e | | | 0.65% | e | | | 0.66% | |
Net investment income | | | 0.72% | | | | 0.88% | c | | | 0.63% | | | | 0.65% | | | | 0.74% | |
| | | | | |
Supplemental data | | | | | | | | | | | | | | | | | | | | |
Net assets, end of year (000’s) | | | $2,801,153 | | | | $1,998,483 | | | | $1,514,492 | | | | $1,414,980 | | | | $1,080,811 | |
Portfolio turnover rate | | | 5.60% | | | | 7.53% | | | | 5.05% | | | | 1.50% | | | | 0.83% | |
aThe amount shown for a share outstanding throughout the period may not correlate with the Statement of Operations for the period due to the timing of sales and repurchases of the Fund’s shares in relation to income earned and/or fluctuating fair value of the investments of the Fund.
bBased on average daily shares outstanding.
cNet investment income per share includes approximately $0.10 per share related to income received in the form of special dividends in connection with certain Fund holdings. Excluding this amount, the ratio of net investment income to average net assets would have been 0.75%.
dBenefit of expense reduction rounds to less than 0.01%.
eBenefit of waiver and payments by affiliates rounds to less than 0.01%.
| | | | |
| 52 | | Annual Report | The accompanying notes are an integral part of these financial statements. | | franklintempleton.com |
FRANKLIN CUSTODIAN FUNDS
Statement of Investments, September 30, 2017
Franklin Growth Fund
| | | | | | | | | | | | | | |
| | | | | | Country | | | | Shares | | | | Value | |
| | Common Stocks 96.8% | | | | | | | | | | | | |
| | Automobiles & Components 0.7% | | | | | | | | | | | | |
| | Adient PLC | | | United States | | | | 133,712 | | | $ | 11,230,471 | |
| | BorgWarner Inc. | | | United States | | | | 1,650,000 | | | | 84,529,500 | |
| | | | | | | | | | | | | 95,759,971 | |
| | Banks 0.3% | | | | | | | | | | | | |
| | U.S. Bancorp | | | United States | | | | 100,000 | | | | 5,359,000 | |
| | Wells Fargo & Co. | | | United States | | | | 750,000 | | | | 41,362,500 | |
| | | | | | | | | | | | | 46,721,500 | |
| | Capital Goods 18.7% | | | | | | | | | | | | |
| | 3M Co. | | | United States | | | | 855,000 | | | | 179,464,500 | |
| | Allegion PLC | | | United States | | | | 700,000 | | | | 60,529,000 | |
| | AMETEK Inc. | | | United States | | | | 700,000 | | | | 46,228,000 | |
| | The Boeing Co. | | | United States | | | | 1,100,000 | | | | 279,631,000 | |
| | BWX Technologies Inc. | | | United States | | | | 700,000 | | | | 39,214,000 | |
| | Caterpillar Inc. | | | United States | | | | 550,000 | | | | 68,590,500 | |
| | Deere & Co. | | | United States | | | | 500,000 | | | | 62,795,000 | |
| | Emerson Electric Co. | | | United States | | | | 1,100,000 | | | | 69,124,000 | |
| | Fortive Corp. | | | United States | | | | 525,000 | | | | 37,164,750 | |
| | General Dynamics Corp. | | | United States | | | | 1,000,000 | | | | 205,580,000 | |
| | General Electric Co. | | | United States | | | | 4,000,000 | | | | 96,720,000 | |
| | Huntington Ingalls Industries Inc. | | | United States | | | | 425,000 | | | | 96,237,000 | |
| | Illinois Tool Works Inc. | | | United States | | | | 1,000,000 | | | | 147,960,000 | |
| | Ingersoll-Rand PLC | | | United States | | | | 1,100,000 | | | | 98,087,000 | |
| | Johnson Controls International PLC | | | United States | | | | 1,337,120 | | | | 53,872,565 | |
| | Lockheed Martin Corp. | | | United States | | | | 500,000 | | | | 155,145,000 | |
| | Northrop Grumman Corp. | | | United States | | | | 1,100,000 | | | | 316,492,000 | |
| | Raytheon Co. | | | United States | | | | 600,000 | | | | 111,948,000 | |
| | Rockwell Collins Inc. | | | United States | | | | 350,000 | | | | 45,748,500 | |
a | | Sensata Technologies Holding NV | | | United States | | | | 3,200,000 | | | | 153,824,000 | |
| | Stanley Black & Decker Inc. | | | United States | | | | 650,000 | | | | 98,130,500 | |
| | Textron Inc. | | | United States | | | | 1,600,000 | | | | 86,208,000 | |
| | United Technologies Corp. | | | United States | | | | 930,000 | | | | 107,954,400 | |
| | | | | | | | | | | | | 2,616,647,715 | |
| | Commercial & Professional Services 2.6% | | | | | | | | | | | | |
| | Dun & Bradstreet Corp. | | | United States | | | | 675,000 | | | | 78,576,750 | |
| | Equifax Inc. | | | United States | | | | 550,000 | | | | 58,294,500 | |
a | | IHS Markit Ltd. | | | United States | | | | 3,556,600 | | | | 156,774,928 | |
a | | Verisk Analytics Inc. | | | United States | | | | 850,000 | | | | 70,711,500 | |
| | | | | | | | | | | | | 364,357,678 | |
| | Consumer Durables & Apparel 0.7% | | | | | | | | | | | | |
| | NIKE Inc., B | | | United States | | | | 1,880,000 | | | | 97,478,000 | |
| | Consumer Services 1.4% | | | | | | | | | | | | |
| | Carnival Corp. | | | United States | | | | 1,200,000 | | | | 77,484,000 | |
| | Graham Holdings Co., B | | | United States | | | | 80,000 | | | | 46,808,000 | |
| | Marriott International Inc., A | | | United States | | | | 200,000 | | | | 22,052,000 | |
| | Starbucks Corp. | | | United States | | | | 900,000 | | | | 48,339,000 | |
| | | | | | | | | | | | | 194,683,000 | |
| | | | |
| franklintempleton.com | | Annual Report | | 53 |
FRANKLIN CUSTODIAN FUNDS
STATEMENT OF INVESTMENTS
Franklin Growth Fund (continued)
| | | | | | | | | | | | | | |
| | | | | | Country | | | | Shares | | | | Value | |
| | Common Stocks (continued) | | | | | | | | | | | | |
| | Diversified Financials 3.7% | | | | | | | | | | | | |
| | American Express Co. | | | United States | | | | 600,000 | | | $ | 54,276,000 | |
a | | Berkshire Hathaway Inc., A | | | United States | | | | 184 | | | | 50,552,160 | |
| | BlackRock Inc. | | | United States | | | | 225,000 | | | | 100,595,250 | |
| | The Charles Schwab Corp. | | | United States | | | | 3,000,000 | | | | 131,220,000 | |
| | Intercontinental Exchange Inc. | | | United States | | | | 1,400,000 | | | | 96,180,000 | |
| | T. Rowe Price Group Inc. | | | United States | | | | 900,000 | | | | 81,585,000 | |
| | | | | | | | | | | | | 514,408,410 | |
| | Energy 1.8% | | | | | | | | | | | | |
| | Anadarko Petroleum Corp. | | | United States | | | | 1,250,000 | | | | 61,062,500 | |
| | Cabot Oil & Gas Corp., A | | | United States | | | | 1,700,000 | | | | 45,475,000 | |
| | Halliburton Co. | | | United States | | | | 850,000 | | | | 39,125,500 | |
| | Royal Dutch Shell PLC, A, ADR | | | United Kingdom | | | | 345,000 | | | | 20,900,100 | |
| | Schlumberger Ltd. | | | United States | | | | 573,700 | | | | 40,021,312 | |
a | | TechnipFMC PLC | | | United Kingdom | | | | 1,500,000 | | | | 41,880,000 | |
| | | | | | | | | | | | | 248,464,412 | |
| | Food & Staples Retailing 0.4% | | | | | | | | | | | | |
| | CVS Health Corp. | | | United States | | | | 656,000 | | | | 53,345,920 | |
| | Food, Beverage & Tobacco 3.4% | | | | | | | | | | | | |
| | Anheuser-Busch InBev SA/NV, ADR | | | Belgium | | | | 350,000 | | | | 41,755,000 | |
| | Brown-Forman Corp., B | | | United States | | | | 1,300,000 | | | | 70,590,000 | |
| | Constellation Brands Inc., A | | | United States | | | | 400,000 | | | | 79,780,000 | |
| | Mondelez International Inc., A | | | United States | | | | 1,500,000 | | | | 60,990,000 | |
a | | Monster Beverage Corp. | | | United States | | | | 2,700,000 | | | | 149,175,000 | |
| | PepsiCo Inc. | | | United States | | | | 650,000 | | | | 72,429,500 | |
| | | | | | | | | | | | | 474,719,500 | |
| | Health Care Equipment & Services 7.2% | | | | | | | | | | | | |
| | Abbott Laboratories | | | United States | | | | 1,350,000 | | | | 72,036,000 | |
| | Aetna Inc. | | | United States | | | | 650,000 | | | | 103,356,500 | |
| | Baxter International Inc. | | | United States | | | | 400,000 | | | | 25,100,000 | |
| | Becton, Dickinson and Co. | | | United States | | | | 77,700 | | | | 15,225,315 | |
| | Cardinal Health Inc. | | | United States | | | | 300,000 | | | | 20,076,000 | |
| | Danaher Corp. | | | United States | | | | 1,050,000 | | | | 90,069,000 | |
a | | Edwards Lifesciences Corp. | | | United States | | | | 400,000 | | | | 43,724,000 | |
a | | Haemonetics Corp. | | | United States | | | | 1,000,000 | | | | 44,870,000 | |
| | Hill-Rom Holdings Inc. | | | United States | | | | 300,000 | | | | 22,200,000 | |
a | | Intuitive Surgical Inc. | | | United States | | | | 150,000 | | | | 156,882,000 | |
a | | Laboratory Corp. of America Holdings | | | United States | | | | 500,000 | | | | 75,485,000 | |
| | Medtronic PLC | | | United States | | | | 406,300 | | | | 31,597,951 | |
| | Quest Diagnostics Inc. | | | United States | | | | 900,000 | | | | 84,276,000 | |
| | Stryker Corp. | | | United States | | | | 400,000 | | | | 56,808,000 | |
| | Teleflex Inc. | | | United States | | | | 500,000 | | | | 120,985,000 | |
a | | Varex Imaging Corp. | | | United States | | | | 120,000 | | | | 4,060,800 | |
a | | Varian Medical Systems Inc. | | | United States | | | | 300,000 | | | | 30,018,000 | |
| | Zimmer Biomet Holdings Inc. | | | United States | | | | 100,000 | | | | 11,709,000 | |
| | | | | | | | | | | | | 1,008,478,566 | |
| | Household & Personal Products 0.2% | | | | | | | | | | | | |
| | The Procter & Gamble Co. | | | United States | | | | 335,000 | | | | 30,478,300 | |
| | Insurance 0.3% | | | | | | | | | | | | |
| | Aflac Inc. | | | United States | | | | 600,000 | | | | 48,834,000 | |
| | | | |
| 54 | | Annual Report | | franklintempleton.com |
FRANKLIN CUSTODIAN FUNDS
STATEMENT OF INVESTMENTS
Franklin Growth Fund (continued)
| | | | | | | | | | | | | | |
| | | | | | Country | | | | Shares | | | | Value | |
| | Common Stocks (continued) | | | | | | | | | | | | |
| | Materials 4.8% | | | | | | | | | | | | |
| | Air Products and Chemicals Inc. | | | United States | | | | 500,000 | | | $ | 75,610,000 | |
| | Albemarle Corp. | | | United States | | | | 550,000 | | | | 74,970,500 | |
a | | Axalta Coating Systems Ltd. | | | United States | | | | 3,400,000 | | | | 98,328,000 | |
| | Celanese Corp., A | | | United States | | | | 1,250,000 | | | | 130,337,500 | |
| | DowDuPont Inc. | | | United States | | | | 90,000 | | | | 6,230,700 | |
| | Ecolab Inc. | | | United States | | | | 920,000 | | | | 118,321,200 | |
| | Martin Marietta Materials Inc. | | | United States | | | | 400,000 | | | | 82,492,000 | |
| | Praxair Inc. | | | United States | | | | 575,000 | | | | 80,350,500 | |
| | | | | | | | | | | | | 666,640,400 | |
| | Media 1.6% | | | | | | | | | | | | |
| | Cable One Inc. | | | United States | | | | 80,000 | | | | 57,769,600 | |
| | Comcast Corp., A | | | United States | | | | 110,000 | | | | 4,232,800 | |
| | The Walt Disney Co. | | | United States | | | | 1,724,290 | | | | 169,963,265 | |
| | | | | | | | | | | | | 231,965,665 | |
| | Pharmaceuticals, Biotechnology & Life Sciences 14.3% | | | | | | | | | | | | |
| | AbbVie Inc. | | | United States | | | | 460,000 | | | | 40,875,600 | |
| | Agilent Technologies Inc. | | | United States | | | | 1,300,000 | | | | 83,460,000 | |
| | Allergan PLC | | | United States | | | | 400,000 | | | | 81,980,000 | |
| | Amgen Inc. | | | United States | | | | 1,000,000 | | | | 186,450,000 | |
a | | Biogen Inc. | | | United States | | | | 500,000 | | | | 156,560,000 | |
a | | Bioverativ Inc. | | | United States | | | | 250,000 | | | | 14,267,500 | |
a | | Bluebird Bio Inc. | | | United States | | | | 200,000 | | | | 27,470,000 | |
a | | Catalent Inc. | | | United States | | | | 3,400,000 | | | | 135,728,000 | |
a | | Celgene Corp. | | | United States | | | | 1,300,000 | | | | 189,566,000 | |
| | Eli Lilly & Co. | | | United States | | | | 1,450,000 | | | | 124,033,000 | |
| | Gilead Sciences Inc. | | | United States | | | | 650,000 | | | | 52,663,000 | |
a | | Illumina Inc. | | | United States | | | | 525,000 | | | | 104,580,000 | |
| | Johnson & Johnson | | | United States | | | | 1,200,100 | | | | 156,025,001 | |
| | Merck & Co. Inc. | | | United States | | | | 1,000,000 | | | | 64,030,000 | |
a | | Mettler-Toledo International Inc. | | | United States | | | | 425,000 | | | | 266,118,000 | |
a | | Neurocrine Biosciences Inc. | | | United States | | | | 500,000 | | | | 30,640,000 | |
| | Pfizer Inc. | | | United States | | | | 2,761,000 | | | | 98,567,700 | |
| | Roche Holding AG, ADR | | | Switzerland | | | | 1,700,000 | | | | 54,400,000 | |
a | | Tesaro Inc. | | | United States | | | | 200,000 | | | | 25,820,000 | |
a | | Waters Corp. | | | United States | | | | 625,000 | | | | 112,200,000 | |
| | | | | | | | | | | | | 2,005,433,801 | |
| | Real Estate 1.5% | | | | | | | | | | | | |
| | American Tower Corp. | | | United States | | | | 900,000 | | | | 123,012,000 | |
| | Equinix Inc. | | | United States | | | | 200,000 | | | | 89,260,000 | |
| | | | | | | | | | | | | 212,272,000 | |
| | Retailing 2.7% | | | | | | | | | | | | |
a | | Amazon.com Inc. | | | United States | | | | 350,000 | | | | 336,472,500 | |
| | Expedia Inc. | | | United States | | | | 200,000 | | | | 28,788,000 | |
| | Lowe’s Cos. Inc. | | | United States | | | | 60,000 | | | | 4,796,400 | |
| | The TJX Cos. Inc. | | | United States | | | | 40,000 | | | | 2,949,200 | |
| | | | | | | | | | | | | 373,006,100 | |
| | Semiconductors & Semiconductor Equipment 2.3% | | | | | | | | | | | | |
| | ASML Holding NV, N.Y. shs | | | Netherlands | | | | 650,000 | | | | 111,280,000 | |
| | Broadcom Ltd. | | | United States | | | | 20,000 | | | | 4,850,800 | |
| | Intel Corp. | | | United States | | | | 1,100,000 | | | | 41,888,000 | |
| | | | |
| franklintempleton.com | | Annual Report | | 55 |
FRANKLIN CUSTODIAN FUNDS
STATEMENT OF INVESTMENTS
Franklin Growth Fund (continued)
| | | | | | | | | | | | | | |
| | | | | | Country | | | | Shares | | | | Value | |
| | Common Stocks (continued) | | | | | | | | | | | | |
| | Semiconductors & Semiconductor Equipment (continued) | | | | | | | | | | | | |
| | Lam Research Corp. | | | United States | | | | 30,000 | | | $ | 5,551,200 | |
| | Microchip Technology Inc. | | | United States | | | | 45,000 | | | | 4,040,100 | |
| | Monolithic Power Systems | | | United States | | | | 200,000 | | | | 21,310,000 | |
| | Texas Instruments Inc. | | | United States | | | | 1,400,000 | | | | 125,496,000 | |
| | Versum Materials Inc. | | | United States | | | | 250,000 | | | | 9,705,000 | |
| | | | | | | | | | | | | 324,121,100 | |
| | Software & Services 14.2% | | | | | | | | | | | | |
a | | Alibaba Group Holding Ltd., ADR | | | China | | | | 480,400 | | | | 82,969,884 | |
a | | Alphabet Inc., A | | | United States | | | | 165,000 | | | | 160,663,800 | |
a | | Alphabet Inc., C | | | United States | | | | 158,432 | | | | 151,953,716 | |
a | | Autodesk Inc. | | | United States | | | | 800,000 | | | | 89,808,000 | |
| | Automatic Data Processing Inc. | | | United States | | | | 700,000 | | | | 76,524,000 | |
| | CDK Global LLC | | | United States | | | | 233,333 | | | | 14,720,979 | |
a | | Check Point Software Technologies Ltd. | | | Israel | | | | 525,000 | | | | 59,860,500 | |
| | CSRA Inc. | | | United States | | | | 2,300,000 | | | | 74,221,000 | |
| | DXC Technology Co. | | | United States | | | | 1,400,000 | | | | 120,232,000 | |
a | | Facebook Inc., A | | | United States | | | | 750,000 | | | | 128,152,500 | |
a | | IAC/InterActiveCorp | | | United States | | | | 300,000 | | | | 35,274,000 | |
| | International Business Machines Corp. | | | United States | | | | 600,000 | | | | 87,048,000 | |
| | Intuit Inc. | | | United States | | | | 1,000,000 | | | | 142,140,000 | |
| | Mastercard Inc., A | | | United States | | | | 1,400,000 | | | | 197,680,000 | |
| | Microsoft Corp. | | | United States | | | | 3,400,000 | | | | 253,266,000 | |
| | Oracle Corp. | | | United States | | | | 1,000,000 | | | | 48,350,000 | |
a | | Salesforce.com Inc. | | | United States | | | | 61,000 | | | | 5,698,620 | |
a | | ServiceNow Inc. | | | United States | | | | 1,000,000 | | | | 117,530,000 | |
| | Visa Inc., A | | | United States | | | | 1,400,000 | | | | 147,336,000 | |
| | | | | | | | | | | | | 1,993,428,999 | |
| | Technology Hardware & Equipment 7.4% | | | | | | | | | | | | |
| | Apple Inc. | | | United States | | | | 4,086,000 | | | | 629,734,320 | |
| | Cisco Systems Inc. | | | United States | | | | 2,945,000 | | | | 99,040,350 | |
a | | Keysight Technologies Inc. | | | United States | | | | 650,000 | | | | 27,079,000 | |
| | TE Connectivity Ltd. | | | United States | | | | 1,650,000 | | | | 137,049,000 | |
a | | Trimble Inc. | | | United States | | | | 2,700,000 | | | | 105,975,000 | |
a | | ViaSat Inc. | | | United States | | | | 600,000 | | | | 38,592,000 | |
| | | | | | | | | | | | | 1,037,469,670 | |
| | Transportation 5.9% | | | | | | | | | | | | |
| | Alaska Air Group Inc. | | | United States | | | | 3,200,000 | | | | 244,064,000 | |
| | Allegiant Travel Co. | | | United States | | | | 200,000 | | | | 26,340,000 | |
| | Canadian National Railway Co. | | | Canada | | | | 1,000,000 | | | | 82,850,000 | |
| | Canadian Pacific Railway Ltd. | | | Canada | | | | 500,000 | | | | 84,015,000 | |
| | J.B. Hunt Transport Services Inc. | | | United States | | | | 400,000 | | | | 44,432,000 | |
| | Kansas City Southern | | | United States | | | | 750,000 | | | | 81,510,000 | |
a | | Ryanair Holdings PLC, ADR | | | Ireland | | | | 233,220 | | | | 24,586,052 | |
| | Union Pacific Corp. | | | United States | | | | 2,030,000 | | | | 235,419,100 | |
| | | | | | | | | | | | | 823,216,152 | |
| | Utilities 0.7% | | | | | | | | | | | | |
| | American Water Works Co. Inc. | | | United States | | | | 700,000 | | | | 56,637,000 | |
| | NextEra Energy Inc. | | | United States | | | | 250,000 | | | | 36,637,500 | |
| | | | | | | | | | | | | 93,274,500 | |
| | Total Common Stocks (Cost $5,295,410,912) | | | | | | | | | | | 13,555,205,359 | |
| | | | |
| 56 | | Annual Report | | franklintempleton.com |
FRANKLIN CUSTODIAN FUNDS
STATEMENT OF INVESTMENTS
Franklin Growth Fund (continued)
| | | | | | | | | | | | | | |
| | | | | | Country | | | | Shares | | | | Value | |
| | Management Investment Companies (Cost $10,148,164) 0.8% | | | | | | | | | |
| | Diversified Financials 0.8% | | | | | | | | | | | | |
a | | Altaba Inc. | | | United States | | | | 1,700,000 | | | $ | 112,608,000 | |
| | Total Investments before Short Term Investments (Cost $5,305,559,076) | | | | | | | | | | | 13,667,813,359 | |
| | | | |
| | Short Term Investments (Cost $331,780,723) 2.4% | | | | | | | | | | | | |
| | | | |
| | Money Market Funds 2.4% | | | | | | | | | | | | |
b,c | | Institutional Fiduciary Trust Money Market Portfolio, 0.67% | | | United States | | | | 331,780,723 | | | | 331,780,723 | |
| | Total Investments (Cost $5,637,339,799) 100.0% | | | | | | | | | | | 13,999,594,082 | |
| | Other Assets, less Liabilities (0.0)%† | | | | | | | | | | | (4,738,986 | ) |
| | Net Assets 100.0% | | | | | | | | | | $ | 13,994,855,096 | |
See Abbreviations on page 124.
†Rounds to less than 0.1% of net assets.
aNon-income producing.
bSee Note 3(f) regarding investments in affiliated management investment companies.
cThe rate shown is the annualized seven-day yield at period end.
| | | | | | |
| franklintempleton.com | | The accompanying notes are an integral part of these financial statements. | Annual Report | | | 57 | |
FRANKLIN CUSTODIAN FUNDS
Financial Highlights
Franklin Income Fund
| | | | | | | | | | | | | | | | | | | | |
| | | Year Ended September 30, | |
| | | | 2017 | | | | 2016 | | | | 2015 | | | | 2014 | | | | 2013 | |
Class A | | | | | | | | | | | | | | | | | | | | |
| | | | | |
Per share operating performance | | | | | | | | | | | | | | | | | | | | |
(for a share outstanding throughout the year) | | | | | | | | | | | | | | | | | | | | |
Net asset value, beginning of year | | | $ 2.25 | | | | $ 2.10 | | | | $ 2.48 | | | | $ 2.33 | | | | $ 2.23 | |
Income from investment operationsa: | | | | | | | | | | | | | | | | | | | | |
Net investment incomeb | | | 0.10 | | | | 0.10 | | | | 0.10 | | | | 0.11 | | | | 0.11 | |
Net realized and unrealized gains (losses) | | | 0.16 | | | | 0.17 | | | | (0.36 | ) | | | 0.16 | | | | 0.12 | |
Total from investment operations | | | 0.26 | | | | 0.27 | | | | (0.26 | ) | | | 0.27 | | | | 0.23 | |
Less distributions from net investment income | | | (0.12 | ) | | | (0.12 | ) | | | (0.12 | ) | | | (0.12 | ) | | | (0.13 | ) |
Net asset value, end of year | | | $ 2.39 | | | | $ 2.25 | | | | $ 2.10 | | | | $ 2.48 | | | | $ 2.33 | |
| | | | | |
Total returnc | | | 11.86% | | | | 13.31% | | | | (10.93)% | | | | 11.86% | | | | 10.72% | |
| | | | | |
Ratios to average net assets | | | | | | | | | | | | | | | | | | | | |
Expenses before waiver and payments by affiliates | | | 0.62% | | | | 0.61% | | | | 0.61% | | | | 0.61% | | | | 0.62% | |
Expenses net of waiver and payments by affiliatesd | | | 0.61% | | | | 0.61% | e | | | 0.61% | e | | | 0.61% | e | | | 0.62% | |
Net investment income | | | 4.22% | | | | 4.57% | | | | 4.43% | | | | 4.28% | | | | 4.98% | |
| | | | | |
Supplemental data | | | | | | | | | | | | | | | | | | | | |
Net assets, end of year (000’s) | | | $46,505,632 | | | | $45,515,127 | | | | $44,886,127 | | | | $53,823,921 | | | | $48,320,611 | |
Portfolio turnover rate | | | 34.12% | | | | 61.26% | | | | 44.81% | | | | 36.03% | | | | 37.60% | |
aThe amount shown for a share outstanding throughout the period may not correlate with the Statement of Operations for the period due to the timing of sales and repurchases of the Fund’s shares in relation to income earned and/or fluctuating fair value of the investments of the Fund.
bBased on average daily shares outstanding.
cTotal return does not reflect sales commissions or contingent deferred sales charges, if applicable.
dBenefit of expense reduction rounds to less than 0.01%.
eBenefit of waiver and payments by affiliates rounds to less than 0.01%.
| | | | |
| 58 | | Annual Report | The accompanying notes are an integral part of these financial statements. | | franklintempleton.com |
FRANKLIN CUSTODIAN FUNDS
FINANCIAL HIGHLIGHTS
Franklin Income Fund (continued)
| | | | | | | | | | | | | | | | | | | | |
| | | Year Ended September 30, | |
| | | | 2017 | | | | 2016 | | | | 2015 | | | | 2014 | | | | 2013 | |
Class C | | | | | | | | | | | | | | | | | | | | |
| | | | | |
Per share operating performance | | | | | | | | | | | | | | | | | | | | |
(for a share outstanding throughout the year) | | | | | | | | | | | | | | | | | | | | |
Net asset value, beginning of year | | | $ 2.27 | | | | $ 2.13 | | | | $ 2.50 | | | | $ 2.35 | | | | $ 2.25 | |
Income from investment operationsa: | | | | | | | | | | | | | | | | | | | | |
Net investment incomeb | | | 0.09 | | | | 0.09 | | | | 0.09 | | | | 0.09 | | | | 0.10 | |
Net realized and unrealized gains (losses) | | | 0.17 | | | | 0.16 | | | | (0.35 | ) | | | 0.17 | | | | 0.12 | |
Total from investment operations | | | 0.26 | | | | 0.25 | | | | (0.26 | ) | | | 0.26 | | | | 0.22 | |
Less distributions from net investment income | | | (0.11 | ) | | | (0.11 | ) | | | (0.11 | ) | | | (0.11 | ) | | | (0.12 | ) |
Net asset value, end of year | | | $ 2.42 | | | | $ 2.27 | | | | $ 2.13 | | | | $ 2.50 | | | | $ 2.35 | |
| | | | | |
Total returnc | | | 11.63% | | | | 12.07% | | | | (10.89)% | | | | 11.19% | | | | 10.07% | |
| | | | | |
Ratios to average net assets | | | | | | | | | | | | | | | | | | | | |
Expenses before waiver and payments by affiliates | | | 1.12% | | | | 1.11% | | | | 1.11% | | | | 1.11% | | | | 1.12% | |
Expenses net of waiver and payments by affiliatesd | | | 1.11% | | | | 1.11% | e | | | 1.11% | e | | | 1.11% | e | | | 1.12% | |
Net investment income | | | 3.72% | | | | 4.07% | | | | 3.93% | | | | 3.78% | | | | 4.48% | |
| | | | | |
Supplemental data | | | | | | | | | | | | | | | | | | | | |
Net assets, end of year (000’s) | | | $23,036,875 | | | | $23,841,466 | | | | $24,091,638 | | | | $28,802,209 | | | | $24,016,797 | |
Portfolio turnover rate | | | 34.12% | | | | 61.26% | | | | 44.81% | | | | 36.03% | | | | 37.60% | |
aThe amount shown for a share outstanding throughout the period may not correlate with the Statement of Operations for the period due to the timing of sales and repurchases of the Fund’s shares in relation to income earned and/or fluctuating fair value of the investments of the Fund.
bBased on average daily shares outstanding.
cTotal return does not reflect sales commissions or contingent deferred sales charges, if applicable.
dBenefit of expense reduction rounds to less than 0.01%.
eBenefit of waiver and payments by affiliates rounds to less than 0.01%.
| | | | |
| franklintempleton.com | | The accompanying notes are an integral part of these financial statements. | Annual Report | | 59 |
FRANKLIN CUSTODIAN FUNDS
FINANCIAL HIGHLIGHTS
Franklin Income Fund (continued)
| | | | | | | | | | | | | | | | | | | | |
| | | Year Ended September 30, | |
| | | | 2017 | | | | 2016 | | | | 2015 | | | | 2014 | | | | 2013 | |
Class R | | | | | | | | | | | | | | | | | | | | |
| | | | | |
Per share operating performance | | | | | | | | | | | | | | | | | | | | |
(for a share outstanding throughout the year) | | | | | | | | | | | | | | | | | | | | |
Net asset value, beginning of year | | | $ 2.21 | | | | $ 2.07 | | | | $ 2.44 | | | | $ 2.29 | | | | $ 2.20 | |
Income from investment operationsa: | | | | | | | | | | | | | | | | | | | | |
Net investment incomeb | | | 0.09 | | | | 0.09 | | | | 0.10 | | | | 0.10 | | | | 0.11 | |
Net realized and unrealized gains (losses) | | | 0.16 | | | | 0.16 | | | | (0.36 | ) | | | 0.16 | | | | 0.10 | |
Total from investment operations | | | 0.25 | | | | 0.25 | | | | (0.26 | ) | | | 0.26 | | | | 0.21 | |
Less distributions from net investment income | | | (0.11 | ) | | | (0.11 | ) | | | (0.11 | ) | | | (0.11 | ) | | | (0.12 | ) |
Net asset value, end of year | | | $ 2.35 | | | | $ 2.21 | | | | $ 2.07 | | | | $ 2.44 | | | | $ 2.29 | |
| | | | | |
Total return | | | 11.67% | | | | 12.62% | | | | (10.99)% | | | | 11.66% | | | | 10.03% | |
| | | | | |
Ratios to average net assets | | | | | | | | | | | | | | | | | | | | |
Expenses before waiver and payments by affiliates | | | 0.97% | | | | 0.96% | | | | 0.96% | | | | 0.96% | | | | 0.97% | |
Expenses net of waiver and payments by affiliatesc | | | 0.96% | | | | 0.96% | d | | | 0.96% | d | | | 0.96% | d | | | 0.97% | |
Net investment income | | | 3.87% | | | | 4.22% | | | | 4.08% | | | | 3.93% | | | | 4.63% | |
| | | | | |
Supplemental data | | | | | | | | | | | | | | | | | | | | |
Net assets, end of year (000’s) | | | $361,603 | | | | $396,107 | | | | $416,653 | | | | $514,892 | | | | $446,463 | |
Portfolio turnover rate | | | 34.12% | | | | 61.26% | | | | 44.81% | | | | 36.03% | | | | 37.60% | |
aThe amount shown for a share outstanding throughout the period may not correlate with the Statement of Operations for the period due to the timing of sales and repurchases of the Fund’s shares in relation to income earned and/or fluctuating fair value of the investments of the Fund.
bBased on average daily shares outstanding.
cBenefit of expense reduction rounds to less than 0.01%.
dBenefit of waiver and payments by affiliates rounds to less than 0.01%.
| | | | |
| 60 | | Annual Report | The accompanying notes are an integral part of these financial statements. | | franklintempleton.com |
FRANKLIN CUSTODIAN FUNDS
FINANCIAL HIGHLIGHTS
Franklin Income Fund (continued)
| | | | | | | | | | | | | | | | | | | | |
| | | Year Ended September 30, | |
| | 2017 | | | 2016 | | | 2015 | | | 2014 | | | 2013a | |
| | | | | |
Class R6 | | | | | | | | | | | | | | | | | | | | |
| | | | | |
Per share operating performance (for a share outstanding throughout the year) | | | | | | | | | | | | | | | | | | | | |
Net asset value, beginning of year | | | $ 2.23 | | | | $ 2.09 | | | | $ 2.46 | | | | $ 2.31 | | | | $ 2.33 | |
Income from investment operationsb: | | | | | | | | | | | | | | | | | | | | |
Net investment incomec | | | 0.11 | | | | 0.10 | | | | 0.11 | | | | 0.11 | | | | 0.04 | |
Net realized and unrealized gains (losses) | | | 0.15 | | | | 0.16 | | | | (0.35 | ) | | | 0.17 | | | | (0.02 | ) |
Total from investment operations | | | 0.26 | | | | 0.26 | | | | (0.24 | ) | | | 0.28 | | | | 0.02 | |
Less distributions from net investment income | | | (0.12 | ) | | | (0.12 | ) | | | (0.13 | ) | | | (0.13 | ) | | | (0.04 | ) |
Net asset value, end of year | | | $ 2.37 | | | | $ 2.23 | | | | $ 2.09 | | | | $ 2.46 | | | | $ 2.31 | |
| | | | | |
Total returnd | | | 12.15% | | | | 13.15% | | | | (10.39)% | | | | 12.19% | | | | 1.06% | |
| | | | | |
Ratios to average net assetse | | | | | | | | | | | | | | | | | | | | |
Expenses before waiver and payments by affiliates | | | 0.39% | | | | 0.38% | | | | 0.38% | | | | 0.38% | | | | 0.39% | |
Expenses net of waiver and payments by affiliatesf | | | 0.38% | | | | 0.38% | g | | | 0.38% | g | | | 0.38% | g | | | 0.39% | |
Net investment income | | | 4.45% | | | | 4.80% | | | | 4.66% | | | | 4.50% | | | | 5.21% | |
| | | | | |
Supplemental data | | | | | | | | | | | | | | | | | | | | |
Net assets, end of year (000’s) | | | $1,815,977 | | | | $1,737,577 | | | | $1,744,718 | | | | $2,108,076 | | | | $1,921,084 | |
Portfolio turnover rate | | | 34.12% | | | | 61.26% | | | | 44.81% | | | | 36.03% | | | | 37.60% | |
aFor the period May 1, 2013 (effective date) to September 30, 2013.
bThe amount shown for a share outstanding throughout the period may not correlate with the Statement of Operations for the period due to the timing of sales and repurchases of the Fund’s shares in relation to income earned and/or fluctuating fair value of the investments of the Fund.
cBased on average daily shares outstanding.
dTotal return is not annualized for periods less than one year.
eRatios are annualized for periods less than one year.
fBenefit of expense reduction rounds to less than 0.01%.
gBenefit of waiver and payments by affiliates rounds to less than 0.01%.
| | | | | | |
| franklintempleton.com | | The accompanying notes are an integral part of these financial statements. | Annual Report | | | 61 | |
FRANKLIN CUSTODIAN FUNDS
FINANCIAL HIGHLIGHTS
Franklin Income Fund (continued)
| | | | | | | | | | | | | | | | | | | | |
| | | Year Ended September 30, | |
| | 2017 | | | 2016 | | | 2015 | | | 2014 | | | 2013 | |
| | | | | |
Advisor Class | | | | | | | | | | | | | | | | | | | | |
| | | | | |
Per share operating performance (for a share outstanding throughout the year) | | | | | | | | | | | | | | | | | | | | |
Net asset value, beginning of year | | | $ 2.23 | | | | $ 2.09 | | | | $ 2.46 | | | | $ 2.31 | | | | $ 2.22 | |
Income from investment operationsa: | | | | | | | | | | | | | | | | | | | | |
Net investment incomeb | | | 0.10 | | | | 0.10 | | | | 0.11 | | | | 0.11 | | | | 0.12 | |
Net realized and unrealized gains (losses) | | | 0.16 | | | | 0.16 | | | | (0.36 | ) | | | 0.17 | | | | 0.11 | |
Total from investment operations | | | 0.26 | | | | 0.26 | | | | (0.25 | ) | | | 0.28 | | | | 0.23 | |
Less distributions from net investment income | | | (0.12 | ) | | | (0.12 | ) | | | (0.12 | ) | | | (0.13 | ) | | | (0.14 | ) |
Net asset value, end of year | | | $ 2.37 | | | | $ 2.23 | | | | $ 2.09 | | | | $ 2.46 | | | | $ 2.31 | |
| | | | | |
Total return | | | 12.09% | | | | 13.06% | | | | (10.46)% | | | | 12.12% | | | | 10.49% | |
| | | | | |
Ratios to average net assets | | | | | | | | | | | | | | | | | | | | |
Expenses before waiver and payments by affiliates | | | 0.47% | | | | 0.46% | | | | 0.46% | | | | 0.46% | | | | 0.47% | |
Expenses net of waiver and payments by affiliatesc | | | 0.46% | | | | 0.46% | d | | | 0.46% | d | | | 0.46% | d | | | 0.47% | |
Net investment income | | | 4.37% | | | | 4.72% | | | | 4.58% | | | | 4.43% | | | | 5.13% | |
| | | | | |
Supplemental data | | | | | | | | | | | | | | | | | | | | |
Net assets, end of year (000’s) | | | $11,671,173 | | | | $8,143,479 | | | | $7,754,475 | | | | $9,096,269 | | | | $5,903,701 | |
Portfolio turnover rate | | | 34.12% | | | | 61.26% | | | | 44.81% | | | | 36.03% | | | | 37.60% | |
aThe amount shown for a share outstanding throughout the period may not correlate with the Statement of Operations for the period due to the timing of sales and repurchases of the Fund’s shares in relation to income earned and/or fluctuating fair value of the investments of the Fund.
bBased on average daily shares outstanding.
cBenefit of expense reduction rounds to less than 0.01%.
dBenefit of waiver and payments by affiliates rounds to less than 0.01%.
| | | | |
| 62 | | Annual Report | The accompanying notes are an integral part of these financial statements. | | franklintempleton.com |
FRANKLIN CUSTODIAN FUNDS
Statement of Investments, September 30, 2017
Franklin Income Fund
| | | | | | | | | | | | | | |
| | | | | | Country | | | | Shares | | | | Value | |
| | Common Stocks 39.4% | | | | | | | | | | | | |
| | Consumer Discretionary 2.3% | | | | | | | | | | | | |
| | Daimler AG | | | Germany | | | | 8,000,000 | | | $ | 637,807,387 | |
| | Ford Motor Co. | | | United States | | | | 38,399,601 | | | | 459,643,223 | |
a | | General Motors Co. | | | United States | | | | 1,500,000 | | | | 60,570,000 | |
| | Newell Brands Inc. | | | United States | | | | 500,000 | | | | 21,335,000 | |
a | | Target Corp. | | | United States | | | | 12,971,000 | | | | 765,418,710 | |
| | | | | | | | | | | | | 1,944,774,320 | |
| | Consumer Staples 3.4% | | | | | | | | | | | | |
a | | Anheuser-Busch InBev SA/NV, ADR | | | Belgium | | | | 4,450,000 | | | | 530,885,000 | |
| | The Coca-Cola Co. | | | United States | | | | 25,000,000 | | | | 1,125,250,000 | |
| | PepsiCo Inc. | | | United States | | | | 5,500,000 | | | | 612,865,000 | |
a | | Philip Morris International Inc. | | | United States | | | | 5,500,000 | | | | 610,555,000 | |
| | | | | | | | | | | | | 2,879,555,000 | |
| | Energy 6.5% | | | | | | | | | | | | |
| | Anadarko Petroleum Corp. | | | United States | | | | 5,000,000 | | | | 244,250,000 | |
| | Baker Hughes a GE Co., A | | | United States | | | | 10,000,000 | | | | 366,200,000 | |
| | BP PLC, ADR | | | United Kingdom | | | | 14,000,000 | | | | 538,020,000 | |
| | Chevron Corp. | | | United States | | | | 8,000,000 | | | | 940,000,000 | |
b,c | | Energy XXI Gulf Coast Inc. | | | United States | | | | 7,000,000 | | | | 72,380,000 | |
| | Exxon Mobil Corp. | | | United States | | | | 3,056,588 | | | | 250,579,084 | |
b,c | | Goodrich Petroleum Corp. | | | United States | | | | 2,260,859 | | | | 21,952,941 | |
b,c | | Halcon Resources Corp. | | | United States | | | | 22,500,000 | | | | 153,000,000 | |
| | Halliburton Co. | | | United States | | | | 824,162 | | | | 37,936,177 | |
| | Occidental Petroleum Corp. | | | United States | | | | 7,000,000 | | | | 449,470,000 | |
a | | Royal Dutch Shell PLC, A, ADR | | | United Kingdom | | | | 32,000,000 | | | | 1,938,560,000 | |
b,c | | Stone Energy Corp. | | | United States | | | | 6,151,402 | | | | 178,759,742 | |
b,c | | W&T Offshore Inc. | | | United States | | | | 10,000,000 | | | | 30,500,000 | |
b | | Weatherford International PLC | | | United States | | | | 45,000,000 | | | | 206,100,000 | |
| | | | | | | | | | | | | 5,427,707,944 | |
| | Financials 5.2% | | | | | | | | | | | | |
| | AXA SA | | | France | | | | 22,000,000 | | | | 665,245,300 | |
| | Bank of America Corp. | | | United States | | | | 7,500,000 | | | | 190,050,000 | |
b | | Brighthouse Financial Inc. | | | United States | | | | 1,000,000 | | | | 60,800,000 | |
| | HSBC Holdings PLC | | | United Kingdom | | | | 45,000,000 | | | | 444,504,451 | |
| | JPMorgan Chase & Co. | | | United States | | | | 6,000,000 | | | | 573,060,000 | |
| | MetLife Inc. | | | United States | | | | 11,000,000 | | | | 571,450,000 | |
| | U.S. Bancorp | | | United States | | | | 10,500,000 | | | | 562,695,000 | |
| | Wells Fargo & Co. | | | United States | | | | 22,500,000 | | | | 1,240,875,000 | |
| | | | | | | | | | | | | 4,308,679,751 | |
| | Health Care 5.1% | | | | | | | | | | | | |
| | AstraZeneca PLC | | | United Kingdom | | | | 10,000,000 | | | | 664,019,523 | |
| | Bristol-Myers Squibb Co. | | | United States | | | | 4,000,000 | | | | 254,960,000 | |
b | | Community Health Systems Inc. | | | United States | | | | 5,000,000 | | | | 38,400,000 | |
| | Eli Lilly & Co. | | | United States | | | | 3,430,000 | | | | 293,402,200 | |
| | Medtronic PLC | | | United States | | | | 5,430,098 | | | | 422,298,721 | |
| | Merck & Co. Inc. | | | United States | | | | 2,000,000 | | | | 128,060,000 | |
b | | Mylan NV | | | United States | | | | 6,817,400 | | | | 213,861,838 | |
| | Pfizer Inc. | | | United States | | | | 25,000,000 | | | | 892,500,000 | |
| | Roche Holding AG | | | Switzerland | | | | 1,297,022 | | | | 331,086,161 | |
| | Sanofi, ADR | | | France | | | | 18,000,000 | | | | 896,220,000 | |
| | | | |
| franklintempleton.com | | Annual Report | | 63 |
FRANKLIN CUSTODIAN FUNDS
STATEMENT OF INVESTMENTS
Franklin Income Fund (continued)
| | | | | | | | | | | | | | |
| | | | | | Country | | | | Shares | | | | Value | |
| | Common Stocks (continued) | | | | | | | | | | | | |
| | Health Care (continued) | | | | | | | | | | | | |
b | | Tenet Healthcare Corp. | | | United States | | | | 5,000,000 | | | $ | 82,150,000 | |
| | | | | | | | | | | | | 4,216,958,443 | |
| | Industrials 3.5% | | | | | | | | | | | | |
b,c | | CEVA Holdings LLC | | | United States | | | | 81,371 | | | | 36,616,977 | |
| | Cummins Inc. | | | United States | | | | 1,500,000 | | | | 252,045,000 | |
| | Deere & Co. | | | United States | | | | 2,285,000 | | | | 286,973,150 | |
| | General Electric Co. | | | United States | | | | 50,000,000 | | | | 1,209,000,000 | |
| | Republic Services Inc. | | | United States | | | | 6,000,000 | | | | 396,360,000 | |
| | Stanley Black & Decker Inc. | | | United States | | | | 500,000 | | | | 75,485,000 | |
| | Union Pacific Corp. | | | United States | | | | 3,474,000 | | | | 402,879,780 | |
| | United Technologies Corp. | | | United States | | | | 1,919,300 | | | | 222,792,344 | |
| | | | | | | | | | | | | 2,882,152,251 | |
| | Information Technology 2.2% | | | | | | | | | | | | |
a | | Analog Devices Inc. | | | United States | | | | 3,500,000 | | | | 301,595,000 | |
| | Apple Inc. | | | United States | | | | 2,110,000 | | | | 325,193,200 | |
| | Cisco Systems Inc. | | | United States | | | | 134,717 | | | | 4,530,533 | |
| | Intel Corp. | | | United States | | | | 10,803,245 | | | | 411,387,569 | |
a | | Microsoft Corp. | | | United States | | | | 9,000,000 | | | | 670,410,000 | |
| | Oracle Corp. | | | United States | | | | 2,479,000 | | | | 119,859,650 | |
| | | | | | | | | | | | | 1,832,975,952 | |
| | Materials 3.5% | | | | | | | | | | | | |
| | BASF SE | | | Germany | | | | 12,000,000 | | | | 1,276,749,158 | |
| | DowDuPont Inc. | | | United States | | | | 16,650,000 | | | | 1,152,679,500 | |
a | | Rio Tinto PLC, ADR | | | United Kingdom | | | | 11,055,000 | | | | 521,685,450 | |
| | | | | | | | | | | | | 2,951,114,108 | |
| | Real Estate 0.7% | | | | | | | | | | | | |
| | Host Hotels & Resorts Inc. | | | United States | | | | 30,000,000 | | | | 554,700,000 | |
| | Telecommunication Services 1.4% | | | | | | | | | | | | |
| | BCE Inc. | | | Canada | | | | 6,000,000 | | | | 281,136,537 | |
| | TELUS Corp. | | | Canada | | | | 2,500,000 | | | | 89,929,066 | |
| | Verizon Communications Inc. | | | United States | | | | 16,000,000 | | | | 791,840,000 | |
| | | | | | | | | | | | | 1,162,905,603 | |
| | Utilities 5.6% | | | | | | | | | | | | |
| | Dominion Energy Inc. | | | United States | | | | 13,568,500 | | | | 1,043,824,705 | |
| | Duke Energy Corp. | | | United States | | | | 5,000,000 | | | | 419,600,000 | |
| | Exelon Corp. | | | United States | | | | 3,219,525 | | | | 121,279,507 | |
| | Great Plains Energy Inc. | | | United States | | | | 4,667,500 | | | | 141,425,250 | |
| | NextEra Energy Inc. | | | United States | | | | 1,500,000 | | | | 219,825,000 | |
| | PG&E Corp. | | | United States | | | | 10,000,000 | | | | 680,900,000 | |
| | PPL Corp. | | | United States | | | | 7,000,000 | | | | 265,650,000 | |
| | Public Service Enterprise Group Inc. | | | United States | | | | 4,000,000 | | | | 185,000,000 | |
| | Sempra Energy | | | United States | | | | 4,500,000 | | | | 513,585,000 | |
| | The Southern Co. | | | United States | | | | 15,000,000 | | | | 737,100,000 | |
| | Xcel Energy Inc. | | | United States | | | | 7,000,000 | | | | 331,240,000 | |
| | | | | | | | | | | | | 4,659,429,462 | |
| | Total Common Stocks (Cost $27,696,828,289) | | | | | | | | | | | 32,820,952,834 | |
| | | | |
| 64 | | Annual Report | | franklintempleton.com |
FRANKLIN CUSTODIAN FUNDS
STATEMENT OF INVESTMENTS
Franklin Income Fund (continued)
| | | | | | | | | | | | | | |
| | | | | | Country | | | | Shares | | | | Value | |
d | | Equity-Linked Securities 12.0% | | | | | | | | | | | | |
| | Consumer Discretionary 2.6% | | | | | | | | | | | | |
e | | Citigroup Global Markets Holdings Inc. into Ford Motor Co., 9.00%, 144A | | | United States | | | | 17,100,000 | | | $ | 203,525,397 | |
e | | Citigroup Global Markets Holdings Inc. into General Motors Co., 9.00%, 144A | | | United States | | | | 6,785,000 | | | | 272,631,613 | |
e | | Credit Suisse AG into General Motors Co., 9.50%, 144A | | | United States | | | | 6,687,000 | | | | 271,367,855 | |
e,f | | Credit Suisse AG London into Newell Brands Inc., 7.00%, 144A | | | United States | | | | 3,940,000 | | | | 165,354,740 | |
e | | Goldman Sachs International into General Motors Co., 8.00%, 144A | | | United States | | | | 4,130,000 | | | | 164,488,153 | |
e | | Goldman Sachs International into Target Corp., 8.00%, 144A | | | United States | | | | 4,650,000 | | | | 270,338,910 | |
e | | Merrill Lynch International & Co. CV into Ford Motor Co., 9.00%, 144A | | | United States | | | | 26,270,000 | | | | 312,419,758 | |
e | | Merrill Lynch International & Co. CV into Ford Motor Co., 9.50%, 144A | | | United States | | | | 20,300,000 | | | | 251,053,023 | |
e | | UBS AG London into General Motors Co., 8.00%, 144A | | | United States | | | | 6,793,000 | | | | 266,781,285 | |
| | | | | | | | | | | | | 2,177,960,734 | |
| | Consumer Staples 0.3% | | | | | | | | | | | | |
e | | Royal Bank of Canada into Anheuser-Busch Cos. Inc., 6.50%, 144A | | | Belgium | | | | 2,100,000 | | | | 252,123,554 | |
| | Energy 1.3% | | | | | | | | | | | | |
e | | Barclays Bank PLC into Halliburton Co., 7.00%, 144A | | | United States | | | | 5,680,000 | | | | 258,803,151 | |
e | | Deutsche Bank AG/London into Schlumberger Ltd., 6.00%, 144A | | | United States | | | | 3,032,000 | | | | 211,164,935 | |
e | | JPMorgan Chase & Co. into Anadarko Petroleum Corp., 9.00%, 144A | | | United States | | | | 3,475,000 | | | | 180,871,807 | |
e | | Morgan Stanley into Halliburton Co., 6.50%, 144A | | | United States | | | | 6,305,000 | | | | 273,092,752 | |
e | | Wells Fargo Bank National Assn. into Anadarko Petroleum Corp., 8.00%, 144A | | | United States | | | | 2,807,000 | | | | 140,974,906 | |
| | | | | | | | | | | | | 1,064,907,551 | |
| | Financials 0.2% | | | | | | | | | | | | |
e | | BNP Paribas into Bank of America Corp., 8.00%, 144A | | | United States | | | | 6,465,000 | | | | 162,024,265 | |
| | Health Care 1.3% | | | | | | | | | | | | |
e | | Barclays Bank PLC into Gilead Sciences Inc., 8.50%, 144A | | | United States | | | | 3,333,000 | | | | 284,912,012 | |
e | | Credit Suisse AG into Merck & Co. Inc., 7.50%, 144A | | | United States | | | | 4,008,000 | | | | 259,149,665 | |
e | | Deutsche Bank AG into Medtronic PLC, 6.00%, 144A | | | United States | | | | 1,858,000 | | | | 148,912,366 | |
e | | Morgan Stanley into Eli Lilly & Co., 6.00%, 144A | | | United States | | | | 2,380,000 | | | | 204,255,120 | |
e | | Royal Bank of Canada into Eli Lilly & Co., 6.50%, 144A | | | United States | | | | 2,600,000 | | | | 218,478,255 | |
| | | | | | | | | | | | | 1,115,707,418 | |
| | Industrials 1.9% | | | | | | | | | | | | |
e | | Citigroup Global Markets Holdings Inc. into Deere & Co., 6.50%, 144A | | | United States | | | | 1,988,000 | | | | 238,571,274 | |
e | | Citigroup Global Markets Holdings Inc. into Union Pacific Corp., 6.50%, 144A | | | United States | | | | 2,284,000 | | | | 261,625,750 | |
e | | Goldman Sachs International into Union Pacific Corp., 6.00%, 144A | | | United States | | | | 1,450,000 | | | | 162,366,766 | |
e | | Merrill Lynch International & Co. CV into Deere & Co., 7.00%, 144A | | | United States | | | | 1,887,000 | | | | 220,186,137 | |
e | | Merrill Lynch International & Co. CV into General Electric Co., 6.00%, 144A | | | United States | | | | 8,932,000 | | | | 219,479,203 | |
e | | Morgan Stanley into Union Pacific Corp., 6.50%, 144A | | | United States | | | | 910,000 | | | | 104,874,238 | |
e | | Royal Bank of Canada into General Electric Co., 6.00%, 144A | | | United States | | | | 8,330,000 | | | | 202,874,134 | |
e | | UBS AG London into Cummins Inc., 7.00%, 144A | | | United States | | | | 1,061,000 | | | | 171,427,133 | |
| | | | | | | | | | | | | 1,581,404,635 | |
| | Information Technology 3.1% | | | | | | | | | | | | |
e | | Citigroup Global Markets Holdings Inc. into Intel Corp., 7.00%, 144A | | | United States | | | | 6,797,000 | | | | 260,510,495 | |
e | | Credit Suisse AG London into Apple Inc., 6.50%, 144A | | | United States | | | | 2,274,000 | | | | 306,823,382 | |
e | | Goldman Sachs International into Mylan NV, 6.00%, 144A | | | United States | | | | 2,530,000 | | | | 83,057,527 | |
e | | JP Morgan Chase Bank National Assn. into Apple Inc., 6.50%, 144A | | | United States | | | | 1,840,000 | | | | 267,344,480 | |
e | | JPMorgan Chase & Co. into Intel Corp., 6.50%, 144A | | | United States | | | | 7,040,000 | | | | 266,107,586 | |
e | | JPMorgan Chase & Co. into Microsoft Corp., 6.00%, 144A | | | United States | | | | 3,891,000 | | | | 272,689,249 | |
e | | Merrill Lynch International & Co. CV into Cisco Systems Inc., 6.50%, 144A | | | United States | | | | 11,110,000 | | | | 364,560,885 | |
e | | Morgan Stanley into Analog Devices Inc., 6.50%, 144A | | | United States | | | | 2,030,000 | | | | 164,493,618 | |
| | | | |
| franklintempleton.com | | Annual Report | | 65 |
FRANKLIN CUSTODIAN FUNDS
STATEMENT OF INVESTMENTS
Franklin Income Fund (continued)
| | | | | | | | | | | | | | |
| | | | | | Country | | | | Shares | | | | Value | |
d | | Equity-Linked Securities (continued) | | | | | | | | | | | | |
| | Information Technology (continued) | | | | | | | | | | | | |
e | | Royal Bank of Canada into Apple Inc., 7.00%, 144A | | | United States | | | | 1,703,000 | | | $ | 224,113,206 | |
e,f | | UBS AG London into Broadcom Ltd., 8.00%, 144A | | | United States | | | | 757,000 | | | | 183,131,437 | |
e | | Wells Fargo Bank National Assn. into Oracle Corp., 6.00%, 144A | | | United States | | | | 3,925,000 | | | | 192,259,236 | |
| | | | | | | | | | | | | 2,585,091,101 | |
| | Materials 1.3% | | | | | | | | | | | | |
e | | Citigroup Global Markets Holdings Inc. into The Mosaic Co., 12.00%, 144A | | | United States | | | | 6,405,000 | | | | 142,399,861 | |
e | | Deutsche Bank AG into The Dow Chemical Co., 7.00%, 144A | | | United States | | | | 3,166,000 | | | | 219,936,543 | |
e | | The Goldman Sachs Group Inc. into Rio Tinto PLC, 11.00%, 144A | | | United Kingdom | | | | 4,900,000 | | | | 228,857,607 | |
e | | Royal Bank of Canada into Barrick Gold Corp., 7.50%, 144A | | | Canada | | | | 7,936,000 | | | | 133,074,340 | |
e | | Wells Fargo Bank National Assn. into Rio Tinto PLC, 9.00%, 144A | | | United Kingdom | | | | 4,238,000 | | | | 201,560,750 | |
e | | Wells Fargo Bank National Assn. into The Mosaic Co., 10.00%, 144A | | | United States | | | | 6,620,000 | | | | 151,788,371 | |
| | | | | | | | | | | | | 1,077,617,472 | |
| | Total Equity-Linked Securities (Cost $9,872,600,360) | | | | | | | | | | | 10,016,836,730 | |
| | Convertible Preferred Stocks 2.5% | | | | | | | | | | | | |
| | Energy 0.1% | | | | | | | | | | | | |
| | Chesapeake Energy Corp., 5.75%, cvt. pfd | | | United States | | | | 86,150 | | | | 54,274,500 | |
| | Financials 1.4% | | | | | | | | | | | | |
| | Bank of America Corp., 7.25%, cvt. pfd., L | | | United States | | | | 570,218 | | | | 742,121,621 | |
b | | FNMA, 5.375%, cvt. pfd | | | United States | | | | 4,250 | | | | 91,375,000 | |
| | Wells Fargo & Co., 7.50%, cvt. pfd., A | | | United States | | | | 235,097 | | | | 309,152,555 | |
| | | | | | | | | | | | | 1,142,649,176 | |
| | Health Care 0.6% | | | | | | | | | | | | |
| | Allergan PLC, 5.50%, cvt. pfd | | | United States | | | | 200,000 | | | | 147,564,000 | |
| | Becton Dickinson and Co., 6.125%, cvt. pfd., A | | | United States | | | | 3,000,000 | | | | 165,780,000 | |
| | Teva Pharmaceutical Industries Ltd., 7.00%, cvt. pfd | | | Israel | | | | 525,000 | | | | 180,936,000 | |
| | | | | | | | | | | | | 494,280,000 | |
| | Industrials 0.1% | | | | | | | | | | | | |
b,c | | CEVA Holdings LLC, cvt. pfd., A-1 | | | United States | | | | 2,897 | | | | 1,796,295 | |
b,c | | CEVA Holdings LLC, cvt. pfd., A-2 | | | United States | | | | 110,565 | | | | 49,754,286 | |
| | Stanley Black & Decker Inc., 5.375%, cvt. pfd | | | United States | | | | 540,000 | | | | 61,911,000 | |
| | | | | | | | | | | | | 113,461,581 | |
| | Real Estate 0.0%† | | | | | | | | | | | | |
| | RLJ Lodging Trust, 1.95%, cvt. pfd | | | United States | | | | 800,000 | | | | 22,256,000 | |
| | Utilities 0.3% | | | | | | | | | | | | |
| | NextEra Energy Inc., 6.371%, cvt. pfd | | | United States | | | | 3,650,000 | | | | 242,031,500 | |
| | Total Convertible Preferred Stocks
(Cost $2,280,785,482) | | | | | | | | | | | 2,068,952,757 | |
| | Preferred Stocks 0.2% | | | | | | | | | | | | |
| | Financials 0.2% | | | | | | | | | | | | |
b | | FHLMC, 8.375%, pfd., Z | | | United States | | | | 8,132,009 | | | | 55,541,621 | |
b | | FNMA, 8.25%, pfd., S | | | United States | | | | 6,000,000 | | | | 41,820,000 | |
| | Morgan Stanley, 6.375%, pfd., I | | | United States | | | | 1,977,655 | | | | 56,046,743 | |
| | Total Preferred Stocks (Cost $390,689,948) | | | | | | | | | | | 153,408,364 | |
| | | | |
| 66 | | Annual Report | | franklintempleton.com |
FRANKLIN CUSTODIAN FUNDS
STATEMENT OF INVESTMENTS
Franklin Income Fund (continued)
| | | | | | | | | | | | | | | | | | |
| | | | | | Country | | |
| Principal
Amount |
* | | | | | | | Value | |
| | Convertible Bonds 0.8% | | | | | | | | | | | | | | | | |
| | Energy 0.4% | | | | | | | | | | | | | | | | |
e | | Chesapeake Energy Corp., cvt., senior note, 144A, 5.50%, 9/15/26 | | | United States | | | | 85,000,000 | | | | | | | $ | 78,412,500 | |
| | Cobalt International Energy Inc., cvt., senior bond, 3.125%, 5/15/24 | | | United States | | | | 39,954,000 | | | | | | | | 7,791,030 | |
| | Weatherford International Ltd., cvt., senior note, 5.875%, 7/01/21 | | | United States | | | | 220,000,000 | | | | | | | | 240,762,500 | |
| | | | | | | | | | | | | | | | | 326,966,030 | |
| | Health Care 0.4% | | | | | | | | | | | | | | | | |
e | | Bayer Capital Corp BV, cvt., junior sub. note, 144A, 5.625%, 11/22/19 | | | Germany | | | | 180,000,000 | | | | EUR | | | | 259,843,410 | |
| | Impax Laboratories Inc., cvt., senior note, 2.00%, 6/15/22 | | | United States | | | | 60,000,000 | | | | | | | | 54,225,000 | |
| | | | | | | | | | | | | | | | | 314,068,410 | |
| | Total Convertible Bonds (Cost $594,879,821) | | | | | | | | | | | | | | | 641,034,440 | |
| | Corporate Bonds 35.0% | | | | | | | | | | | | | | | | |
| | Consumer Discretionary 4.3% | | | | | | | | | | | | | | | | |
e | | 24 Hour Holdings III LLC, senior note, 144A, 8.00%, 6/01/22 | | | United States | | | | 110,000,000 | | | | | | | | 102,575,000 | |
e | | Altice Financing SA, secured bond, 144A, 7.50%, 5/15/26 | | | Luxembourg | | | | 50,000,000 | | | | | | | | 55,125,000 | |
| | AMC Entertainment Holdings Inc., | | | | | | | | | | | | | | | | |
| | senior sub. bond, 5.75%, 6/15/25 | | | United States | | | | 41,325,000 | | | | | | | | 40,808,437 | |
| | senior sub. note, 5.875%, 11/15/26 | | | United States | | | | 44,400,000 | | | | | | | | 43,734,000 | |
e,g | | Avantor Inc., senior note, 144A, 9.00%, 10/01/25 | | | United States | | | | 75,000,000 | | | | | | | | 76,781,250 | |
| | CCO Holdings LLC/CCO Holdings Capital Corp., | | | | | | | | | | | | | | | | |
| | senior bond, 5.125%, 2/15/23 | | | United States | | | | 105,000,000 | | | | | | | | 108,675,000 | |
| | senior bond, 5.75%, 9/01/23 | | | United States | | | | 67,000,000 | | | | | | | | 69,680,000 | |
| | senior bond, 5.75%, 1/15/24 | | | United States | | | | 105,000,000 | | | | | | | | 109,331,250 | |
| | e senior bond, 144A, 5.50%, 5/01/26 | | | United States | | | | 50,000,000 | | | | | | | | 51,937,500 | |
| | e senior bond, 144A, 5.125%, 5/01/27 | | | United States | | | | 50,000,000 | | | | | | | | 50,812,500 | |
| | e senior bond, 144A, 5.00%, 2/01/28 | | | United States | | | | 65,500,000 | | | | | | | | 65,827,500 | |
| | Cinemark USA Inc., senior note, 5.125%, 12/15/22 | | | United States | | | | 50,000,000 | | | | | | | | 51,562,500 | |
e | | CSC Holdings LLC, senior note, 144A, 10.125%, 1/15/23 | | | United States | | | | 75,000,000 | | | | | | | | 86,550,000 | |
| | DISH DBS Corp., | | | | | | | | | | | | | | | | |
| | senior bond, 5.00%, 3/15/23 | | | United States | | | | 300,000,000 | | | | | | | | 308,812,500 | |
| | senior note, 6.75%, 6/01/21 | | | United States | | | | 75,000,000 | | | | | | | | 82,687,500 | |
| | senior note, 5.875%, 7/15/22 | | | United States | | | | 322,500,000 | | | | | | | | 343,462,500 | |
| | senior note, 5.875%, 11/15/24 | | | United States | | | | 128,200,000 | | | | | | | | 134,795,890 | |
| | Fiat Chrysler Automobiles NV, senior note, 5.25%, 4/15/23 | | | United Kingdom | | | | 67,600,000 | | | | | | | | 72,221,474 | |
| | iHeartCommunications Inc., senior secured note, first lien, 9.00%, 12/15/19 | | | United States | | | | 328,800,000 | | | | | | | | 252,354,000 | |
e | | International Game Technology PLC, senior secured note, 144A, 6.25%, 2/15/22 | | | United States | | | | 46,600,000 | | | | | | | | 51,584,802 | |
| | KB Home, | | | | | | | | | | | | | | | | |
| | senior bond, 7.50%, 9/15/22 | | | United States | | | | 50,000,000 | | | | | | | | 57,500,000 | |
| | senior note, 7.00%, 12/15/21 | | | United States | | | | 50,000,000 | | | | | | | | 56,312,500 | |
e | | Landry’s Inc., senior note, 144A, 6.75%, 10/15/24 | | | United States | | | | 50,000,000 | | | | | | | | 50,687,500 | |
e | | PetSmart Inc., | | | | | | | | | | | | | | | | |
| | senior note, 144A, 7.125%, 3/15/23 | | | United States | | | | 54,600,000 | | | | | | | | 42,740,880 | |
| | senior note, 144A, 8.875%, 6/01/25 | | | United States | | | | 50,000,000 | | | | | | | | 39,812,500 | |
| | senior secured note, first lien, 144A, 5.875%, 6/01/25 | | | United States | | | | 72,700,000 | | | | | | | | 63,794,250 | |
| | Quebecor Media Inc., senior bond, 5.75%, 1/15/23 | | | Canada | | | | 70,300,000 | | | | | | | | 76,714,875 | |
e | | Shea Homes LP/Shea Homes Funding Corp., | | | | | | | | | | | | | | | | |
| | senior bond, 144A, 6.125%, 4/01/25 | | | United States | | | | 90,000,000 | | | | | | | | 93,375,000 | |
| | senior note, 144A, 5.875%, 4/01/23 | | | United States | | | | 80,000,000 | | | | | | | | 82,600,000 | |
e | | Sirius XM Radio Inc., | | | | | | | | | | | | | | | | |
| | senior bond, 144A, 6.00%, 7/15/24 | | | United States | | | | 50,000,000 | | | | | | | | 53,937,500 | |
| | senior note, 144A, 4.625%, 5/15/23 | | | United States | | | | 88,400,000 | | | | | | | | 91,052,000 | |
| | | | |
| franklintempleton.com | | Annual Report | | 67 |
FRANKLIN CUSTODIAN FUNDS
STATEMENT OF INVESTMENTS
Franklin Income Fund (continued)
| | | | | | | | | | | | | | |
| | | | | | Country | | |
| Principal
Amount |
* | | | Value | |
| | Corporate Bonds (continued) | | | | | | | | | | | | |
| | Consumer Discretionary (continued) | | | | | | | | | | | | |
e | | Tesla Inc., senior note, 144A, 5.30%, 8/15/25 | | | United States | | | | 50,000,000 | | | $ | 48,952,500 | |
e | | Univision Communications Inc., | | | | | | | | | | | | |
| | senior secured note, first lien, 144A, 5.125%, 5/15/23 | | | United States | | | | 137,000,000 | | | | 140,082,500 | |
| | senior secured note, first lien, 144A, 5.125%, 2/15/25 | | | United States | | | | 109,020,000 | | | | 110,246,475 | |
e | | Virgin Media Secured Finance PLC, senior secured bond, first lien, 144A, 5.50%, 1/15/25 | | | United Kingdom | | | | 80,000,000 | | | | 83,900,000 | |
e | | Wynn Las Vegas LLC/Wynn Las Vegas Capital Corp., | | | | | | | | | | | | |
| | senior bond, 144A, 4.25%, 5/30/23 | | | United States | | | | 84,000,000 | | | | 86,835,000 | |
| | senior bond, 144A, 5.50%, 3/01/25 | | | United States | | | | 107,000,000 | | | | 111,681,250 | |
| | senior bond, 144A, 5.25%, 5/15/27 | | | United States | | | | 62,000,000 | | | | 63,239,380 | |
e | | Wynn Macau Ltd., senior bond, 144A, 5.50%, 10/01/27 | | | Macau | | | | 25,000,000 | | | | 25,343,750 | |
e | | Ziggo Secured Finance BV, secured bond, 144A, 5.50%, 1/15/27 | | | Netherlands | | | | 35,000,000 | | | | 35,875,000 | |
| | | | | | | | | | | | | 3,574,001,463 | |
| | Consumer Staples 0.3% | | | | | | | | | | | | |
e | | JBS USA LLC/Finance Inc., | | | | | | | | | | | | |
| | senior bond, 144A, 5.875%, 7/15/24 | | | United States | | | | 101,180,000 | | | | 101,938,850 | |
| | senior note, 144A, 7.25%, 6/01/21 | | | United States | | | | 98,500,000 | | | | 100,962,500 | |
| | senior note, 144A, 5.75%, 6/15/25 | | | United States | | | | 55,000,000 | | | | 55,068,750 | |
| | | | | | | | | | | | | 257,970,100 | |
| | Energy 7.2% | | | | | | | | | | | | |
e | | Ascent Resources Utica Holdings LLC/ARU Finance Corp., senior note, 144A, 10.00%, 4/01/22 | | | United States | | | | 225,000,000 | | | | 242,437,500 | |
| | Bill Barrett Corp., | | | | | | | | | | | | |
| | senior bond, 7.00%, 10/15/22 | | | United States | | | | 206,512,000 | | | | 199,284,080 | |
| | senior note, 8.75%, 6/15/25 | | | United States | | | | 142,000,000 | | | | 137,030,000 | |
| | Calumet Specialty Products Partners LP/Calumet Finance Corp., | | | | | | | | | | | | |
| | senior note, 6.50%, 4/15/21 | | | United States | | | | 214,750,000 | | | | 210,991,875 | |
| | senior note, 7.75%, 4/15/23 | | | United States | | | | 60,000,000 | | | | 58,800,000 | |
| | e senior note, 144A, 11.50%, 1/15/21 | | | United States | | | | 32,200,000 | | | | 37,472,750 | |
| | Chesapeake Energy Corp., | | | | | | | | | | | | |
| | e secured note, second lien, 144A, 8.00%, 12/15/22 | | | United States | | | | 577,192,000 | | | | 624,810,340 | |
| | senior bond, 6.875%, 11/15/20 | | | United States | | | | 95,000,000 | | | | 98,325,000 | |
| | senior bond, 6.125%, 2/15/21 | | | United States | | | | 226,000,000 | | | | 228,260,000 | |
| | e,f,h senior bond, 144A, 8.00%, 6/15/27 | | | United States | | | | 216,000,000 | | | | 214,380,000 | |
| | senior note, 6.625%, 8/15/20 | | | United States | | | | 192,500,000 | | | | 199,237,500 | |
| | senior note, 5.375%, 6/15/21 | | | United States | | | | 75,000,000 | | | | 71,812,500 | |
| | senior note, 4.875%, 4/15/22 | | | United States | | | | 83,710,000 | | | | 78,268,850 | |
| | senior note, 5.75%, 3/15/23 | | | United States | | | | 93,500,000 | | | | 86,721,250 | |
| | e,h senior note, 144A, 8.00%, 1/15/25 | | | United States | | | | 340,000,000 | | | | 344,250,000 | |
| | i senior note, FRN, 4.554%, (3-month USD LIBOR + 3.25%), 4/15/19 | | | United States | | | | 154,000,000 | | | | 153,615,000 | |
e | | Denbury Resources Inc., senior secured note, 144A, 9.00%, 5/15/21 | | | United States | | | | 78,936,000 | | | | 77,455,950 | |
| | Energy Transfer Equity LP, senior secured bond, first lien, 5.50%, 6/01/27 | | | United States | | | | 100,000,000 | | | | 105,750,000 | |
| | Ferrellgas LP/Ferrellgas Finance Corp., | | | | | | | | | | | | |
| | senior note, 6.50%, 5/01/21 | | | United States | | | | 78,795,000 | | | | 76,825,125 | |
| | senior note, 6.75%, 1/15/22 | | | United States | | | | 70,000,000 | | | | 68,075,000 | |
| | senior note, 6.75%, 6/15/23 | | | United States | | | | 52,900,000 | | | | 51,180,750 | |
| | Gulfport Energy Corp., senior note, 6.375%, 5/15/25 | | | United States | | | | 50,000,000 | | | | 50,812,500 | |
c,e | | Halcon Resources Corp., senior note, 144A, 6.75%, 2/15/25 | | | United States | | | | 108,000,000 | | | | 112,320,000 | |
| | Kinder Morgan Inc., | | | | | | | | | | | | |
| | senior bond, 7.75%, 1/15/32 | | | United States | | | | 118,000,000 | | | | 151,905,956 | |
| | e senior secured bond, first lien, 144A, 5.625%, 11/15/23 | | | United States | | | | 100,000,000 | | | | 111,485,789 | |
| | | | |
| 68 | | Annual Report | | franklintempleton.com |
FRANKLIN CUSTODIAN FUNDS
STATEMENT OF INVESTMENTS
Franklin Income Fund (continued)
| | | | | | | | | | | | | | |
| | | | | | Country | | |
| Principal
Amount |
* | | | Value | |
| | Corporate Bonds (continued) | | | | | | | | | | | | |
| | Energy (continued) | | | | | | | | | | | | |
e | | McDermott International Inc., second lien, 144A, 8.00%, 5/01/21 | | | United States | | | | 145,270,000 | | | $ | 150,717,625 | |
| | Oasis Petroleum Inc., senior note, 6.875%, 3/15/22 | | | United States | | | | 62,000,000 | | | | 63,395,000 | |
| | Petroquest Energy Inc., | | | | | | | | | | | | |
| | second lien, 10.00%, 2/15/21 | | | United States | | | | 12,093,000 | | | | 9,130,215 | |
| | j secured note, second lien, PIK, 10.00% (incl. cash 1.00%), 2/15/21 | | | United States | | | | 63,484,807 | | | | 47,931,029 | |
| | Rex Energy Corp., second lien, 1.00% to 10/01/17, 8.00% thereafter, 10/01/20 | | | United States | | | | 109,000,000 | | | | 55,045,000 | |
| | Sabine Pass Liquefaction LLC, | | | | | | | | | | | | |
| | senior secured note, first lien, 5.625%, 4/15/23 | | | United States | | | | 114,450,000 | | | | 126,958,455 | |
| | senior secured note, first lien, 5.75%, 5/15/24 | | | United States | | | | 75,000,000 | | | | 83,663,570 | |
| | Sanchez Energy Corp., | | | | | | | | | | | | |
| | senior note, 7.75%, 6/15/21 | | | United States | | | | 224,790,000 | | | | 214,112,475 | |
| | senior note, 6.125%, 1/15/23 | | | United States | | | | 90,000,000 | | | | 77,850,000 | |
e | | Sesi LLC, senior note, 144A, 7.75%, 9/15/24 | | | United States | | | | 50,000,000 | | | | 51,875,000 | |
c | | Stone Energy Corp., senior note, 7.50%, 5/31/22 | | | United States | | | | 72,845,556 | | | | 70,660,189 | |
c | | W&T Offshore Inc., | | | | | | | | | | | | |
| | e,j secured note, second lien, 144A, PIK, 10.75%, 5/15/20 | | | United States | | | | 75,645,453 | | | | 64,734,187 | |
| | senior note, 8.50%, 6/15/19 | | | United States | | | | 15,568,000 | | | | 13,777,680 | |
| | e,j senior secured note, third lien, 144A, PIK, 10.00%, 6/15/21 | | | United States | | | | 67,697,026 | | | | 49,018,203 | |
| | Weatherford International Ltd., | | | | | | | | | | | | |
| | senior note, 5.125%, 9/15/20 | | | United States | | | | 91,000,000 | | | | 90,152,790 | |
| | senior note, 7.75%, 6/15/21 | | | United States | | | | 320,000,000 | | | | 334,000,000 | |
| | senior note, 4.50%, 4/15/22 | | | United States | | | | 250,000,000 | | | | 233,750,000 | |
| | senior note, 8.25%, 6/15/23 | | | United States | | | | 255,100,000 | | | | 263,390,750 | |
| | e senior note, 144A, 9.875%, 2/15/24 | | | United States | | | | 195,000,000 | | | | 215,475,000 | |
| | | | | | | | | | | | | 6,007,144,883 | |
| | Financials 3.9% | | | | | | | | | | | | |
k | | Bank of America Corp., | | | | | | | | | | | | |
| | junior sub. bond, AA, 6.10% to 3/17/25, FRN thereafter, Perpetual | | | United States | | | | 80,000,000 | | | | 88,300,000 | |
| | junior sub. bond, M, 8.125% to 5/15/18, FRN thereafter, Perpetual | | | United States | | | | 100,000,000 | | | | 103,250,000 | |
| | junior sub. bond, U, 5.20% to 6/01/23, FRN thereafter, Perpetual | | | United States | | | | 80,000,000 | | | | 82,700,000 | |
| | junior sub. bond, X, 6.25% to 9/05/24, FRN thereafter, Perpetual | | | United States | | | | 85,000,000 | | | | 93,818,750 | |
k | | Barclays PLC, junior sub. bond, 8.25% to 12/15/18, FRN thereafter, Perpetual | | | United Kingdom | | | | 75,000,000 | | | | 79,402,500 | |
k | | Citigroup Inc., | | | | | | | | | | | | |
| | junior sub. bond, 5.35% to 5/15/23, FRN thereafter, Perpetual | | | United States | | | | 179,195,000 | | | | 186,282,162 | |
| | junior sub. bond, 5.90% to 2/15/23, FRN thereafter, Perpetual | | | United States | | | | 33,000,000 | | | | 35,640,000 | |
| | junior sub. bond, 5.95% to 1/30/23, FRN thereafter, Perpetual | | | United States | | | | 230,000,000 | | | | 247,825,000 | |
| | junior sub. bond, M, 6.30% to 5/15/24, FRN thereafter, Perpetual | | | United States | | | | 250,000,000 | | | | 271,562,500 | |
| | junior sub. bond, O, 5.875% to 3/27/20, FRN thereafter, Perpetual | | | United States | | | | 160,000,000 | | | | 167,320,000 | |
| | junior sub. bond, P, 5.95% to 5/15/25, FRN thereafter, Perpetual | | | United States | | | | 25,000,000 | | | | 27,062,500 | |
| | junior sub. bond, Q, 5.95% to 8/15/20, FRN thereafter, Perpetual | | | United States | | | | 120,000,000 | | | | 126,675,000 | |
| | junior sub. bond, T, 6.25% to 8/15/26, FRN thereafter, Perpetual | | | United States | | | | 50,000,000 | | | | 56,312,500 | |
k | | Fifth Third Bancorp, junior sub. bond, 5.10% to 6/30/23, FRN thereafter, Perpetual | | | United States | | | | 54,000,000 | | | | 55,485,000 | |
k | | The Goldman Sachs Group Inc., junior sub. note, 5.70% to 5/10/19, FRN thereafter, Perpetual | | | United States | | | | 30,000,000 | | | | 31,050,000 | |
k | | JPMorgan Chase & Co., | | | | | | | | | | | | |
| | junior sub. bond, 6.125% to 4/30/24, FRN thereafter, Perpetual | | | United States | | | | 60,000,000 | | | | 66,150,000 | |
| | junior sub. bond, 6.75% to 2/01/24, FRN thereafter, Perpetual | | | United States | | | | 100,000,000 | | | | 114,506,000 | |
| | junior sub. bond, I, 7.90% to 4/30/19, FRN thereafter, Perpetual | | | United States | | | | 600,000,000 | | | | 618,750,000 | |
| | | | |
| franklintempleton.com | | Annual Report | | 69 |
FRANKLIN CUSTODIAN FUNDS
STATEMENT OF INVESTMENTS
Franklin Income Fund (continued)
| | | | | | | | | | | | | | |
| | | | | | Country | | |
| Principal
Amount |
* | | | Value | |
| | Corporate Bonds (continued) | | | | | | | | | | | | |
| | Financials (continued) | | | | | | | | | | | | |
k | | JPMorgan Chase & Co., (continued) | | | | | | | | | | | | |
| | junior sub. bond, Q, 5.15% to 5/01/23, FRN thereafter, Perpetual | | | United States | | | | 100,000,000 | | | $ | 104,000,000 | |
| | junior sub. bond, R, 6.00% to 8/01/23, FRN thereafter, Perpetual | | | United States | | | | 105,000,000 | | | | 114,056,250 | |
| | junior sub. bond, V, 5.00% to 7/30/19, FRN thereafter, Perpetual | | | United States | | | | 200,000,000 | | | | 203,650,000 | |
| | junior sub. bond, X, 6.10% to 10/01/24, FRN thereafter, Perpetual | | | United States | | | | 80,000,000 | | | | 88,399,200 | |
k | | Morgan Stanley, junior sub. bond, 5.55% to 7/15/20, FRN thereafter, Perpetual | | | United States | | | | 58,000,000 | | | | 60,501,250 | |
e | | OneMain Financial Holdings Inc., | | | | | | | | | | | | |
| | senior note, 144A, 6.75%, 12/15/19 | | | United States | | | | 50,000,000 | | | | 52,000,000 | |
| | senior note, 144A, 7.25%, 12/15/21 | | | United States | | | | 45,700,000 | | | | 47,813,625 | |
k | | PNC Financial Services Group Inc., junior sub. note, 4.85% to 6/01/23, FRN thereafter, Perpetual | | | United States | | | | 11,900,000 | | | | 12,257,000 | |
k | | Wells Fargo & Co., junior sub. bond, S, 5.90% to 6/15/24, FRN thereafter, Perpetual | | | United States | | | | 129,500,000 | | | | 141,155,000 | |
| | | | | | | | | | | | | 3,275,924,237 | |
| | Health Care 9.0% | | | | | | | | | | | | |
e | | AMAG Pharmaceuticals Inc., senior note, 144A, 7.875%, 9/01/23 | | | United States | | | | 55,600,000 | | | | 56,573,000 | |
| | CHS/Community Health Systems Inc., | | | | | | | | | | | | |
| | senior note, 8.00%, 11/15/19 | | | United States | | | | 938,000,000 | | | | 916,895,000 | |
| | senior note, 7.125%, 7/15/20 | | | United States | | | | 539,000,000 | | | | 488,468,750 | |
| | senior note, 6.875%, 2/01/22 | | | United States | | | | 934,100,000 | | | | 736,771,375 | |
| | senior secured note, 5.125%, 8/01/21 | | | United States | | | | 20,000,000 | | | | 19,800,000 | |
| | senior secured note, first lien, 6.25%, 3/31/23 | | | United States | | | | 245,000,000 | | | | 242,856,250 | |
| | DaVita Inc., | | | | | | | | | | | | |
| | senior bond, 5.125%, 7/15/24 | | | United States | | | | 96,000,000 | | | | 95,760,000 | |
| | senior bond, 5.00%, 5/01/25 | | | United States | | | | 110,000,000 | | | | 108,762,500 | |
e | | Endo DAC/Endo Finance LLC/Endo Finco Inc., | | | | | | | | | | | | |
| | senior bond, 144A, 6.00%, 2/01/25 | | | United States | | | | 108,700,000 | | | | 88,590,500 | |
| | senior note, 144A, 6.00%, 7/15/23 | | | United States | | | | 218,025,000 | | | | 180,960,750 | |
e | | Endo Finance LLC, senior note, 144A, 5.75%, 1/15/22 | | | United States | | | | 126,000,000 | | | | 111,195,000 | |
e | | Endo Finance LLC/Endo Finco Inc., senior note, 144A, 5.375%, 1/15/23 | | | United States | | | | 35,000,000 | | | | 28,700,000 | |
| | HCA Inc., | | | | | | | | | | | | |
| | senior bond, 5.875%, 5/01/23 | | | United States | �� | | | 120,000,000 | | | | 130,800,000 | |
| | senior note, 7.50%, 2/15/22 | | | United States | | | | 150,000,000 | | | | 172,453,500 | |
| | senior secured note, first lien, 5.00%, 3/15/24 | | | United States | | | | 134,800,000 | | | | 143,899,000 | |
| | Horizon Pharma Inc., senior note, 6.625%, 5/01/23 | | | United States | | | | 105,012,000 | | | | 102,911,760 | |
e | | Horizon Pharma Inc./Horizon Pharma USA Inc., senior note, 144A, 8.75%, 11/01/24 | | | United States | | | | 33,303,000 | | | | 35,051,408 | |
e | | Jaguar Holding Co. II/Pharmaceutical Product Development LLC, senior note, 144A, 6.375%, 8/01/23 | | | United States | | | | 54,265,000 | | | | 56,910,419 | |
| | Kindred Healthcare Inc., | | | | | | | | | | | | |
| | senior note, 8.00%, 1/15/20 | | | United States | | | | 33,845,000 | | | | 33,411,446 | |
| | senior note, 8.75%, 1/15/23 | | | United States | | | | 50,000,000 | | | | 46,870,000 | |
| | Mallinckrodt International Finance SA, senior bond, 4.75%, 4/15/23 | | | United States | | | | 66,000,000 | | | | 56,595,000 | |
e | | Mallinckrodt International Finance SA/Mallinckrodt CB LLC, | | | | | | | | | | | | |
| | senior note, 144A, 4.875%, 4/15/20 | | | United States | | | | 187,027,000 | | | | 187,027,000 | |
| | senior note, 144A, 5.75%, 8/01/22 | | | United States | | | | 303,775,000 | | | | 298,458,937 | |
| | senior note, 144A, 5.625%, 10/15/23 | | | United States | | | | 280,350,000 | | | | 262,477,687 | |
| | senior note, 144A, 5.50%, 4/15/25 | | | United States | | | | 137,500,000 | | | | 124,609,375 | |
| | | | |
| 70 | | Annual Report | | franklintempleton.com |
FRANKLIN CUSTODIAN FUNDS
STATEMENT OF INVESTMENTS
Franklin Income Fund (continued)
| | | | | | | | | | | | | | |
| | | | | | Country | | |
| Principal
Amount |
* | | | Value | |
| | Corporate Bonds (continued) | | | | | | | | | | | | |
| | Health Care (continued) | | | | | | | | | | | | |
| | Tenet Healthcare Corp., | | | | | | | | | | | | |
| | 4.375%, 10/01/21 | | | United States | | | | 140,000,000 | | | $ | 142,625,000 | |
| | e secured note, second lien, 144A, 5.125%, 5/01/25 | | | United States | | | | 72,000,000 | | | | 71,190,000 | |
| | senior note, 5.50%, 3/01/19 | | | United States | | | | 50,000,000 | | | | 51,187,500 | |
| | senior note, 8.125%, 4/01/22 | | | United States | | | | 652,500,000 | | | | 665,550,000 | |
| | h senior note, 6.75%, 6/15/23 | | | United States | | | | 550,000,000 | | | | 528,687,500 | |
| | e senior note, 144A, 7.00%, 8/01/25 | | | United States | | | | 140,000,000 | | | | 131,950,000 | |
| | e senior secured note, second lien, 144A, 7.50%, 1/01/22 | | | United States | | | | 36,700,000 | | | | 38,947,875 | |
e | | Valeant Pharmaceuticals International, senior note, 144A, 6.375%, 10/15/20 | | | United States | | | | 308,500,000 | | | | 309,561,240 | |
e | | Valeant Pharmaceuticals International Inc., | | | | | | | | | | | | |
| | first lien, 144A, 6.50%, 3/15/22 | | | United States | | | | 50,500,000 | | | | 53,403,750 | |
| | senior bond, 144A, 6.125%, 4/15/25 | | | United States | | | | 122,400,000 | | | | 107,865,000 | |
| | senior note, 144A, 5.375%, 3/15/20 | | | United States | | | | 320,000,000 | | | | 320,800,000 | |
| | senior note, 144A, 7.50%, 7/15/21 | | | United States | | | | 110,000,000 | | | | 110,000,000 | |
| | senior note, 144A, 5.875%, 5/15/23 | | | United States | | | | 178,500,000 | | | | 158,195,625 | |
| | senior note, first lien, 144A, 7.00%, 3/15/24 | | | United States | | | | 77,300,000 | | | | 82,517,750 | |
| | | | | | | | | | | | | 7,499,289,897 | |
| | Industrials 1.5% | | | | | | | | | | | | |
e | | Ahern Rentals Inc., secured note, second lien, 144A, 7.375%, 5/15/23 | | | United States | | | | 20,000,000 | | | | 18,400,000 | |
e | | Bombardier Inc., | | | | | | | | | | | | |
| | senior bond, 144A, 6.125%, 1/15/23 | | | Canada | | | | 73,300,000 | | | | 71,430,850 | |
| | senior note, 144A, 6.00%, 10/15/22 | | | Canada | | | | 35,000,000 | | | | 34,168,750 | |
e,j | | CEVA Group PLC, senior secured note, first lien, PIK, 144A, 6.00% (all cash), 9/01/20 | | | United Kingdom | | | | 162,748,457 | | | | 165,799,991 | |
e | | Cloud Crane LLC, secured note, second lien, 144A, 10.125%, 8/01/24 | | | United States | | | | 29,500,000 | | | | 32,818,750 | |
k | | General Electric Co., junior sub. bond, 5.00% to 1/21/21, FRN thereafter, Perpetual | | | United States | | | | 90,153,000 | | | | 95,467,519 | |
| | Navistar International Corp., senior bond, 8.25%, 11/01/21 | | | United States | | | | 80,000,000 | | | | 80,502,000 | |
| | TransDigm Inc., | | | | | | | | | | | | |
| | senior sub. bond, 6.50%, 7/15/24 | | | United States | | | | 58,300,000 | | | | 60,340,500 | |
| | senior sub. bond, 6.375%, 6/15/26 | | | United States | | | | 80,900,000 | | | | 83,074,592 | |
| | senior sub. note, 6.00%, 7/15/22 | | | United States | | | | 107,800,000 | | | | 112,112,000 | |
| | United Rentals North America Inc., senior bond, 5.75%, 11/15/24 | | | United States | | | | 106,700,000 | | | | 113,635,500 | |
e | | Vertiv Group Corp., senior note, 144A, 9.25%, 10/15/24 | | | United States | | | | 41,200,000 | | | | 46,556,000 | |
e | | XPO Logistics Inc., senior note, 144A, 6.50%, 6/15/22 | | | United States | | | | 330,000,000 | | | | 347,737,500 | |
| | | | | | | | | | | | | 1,262,043,952 | |
| | Information Technology 1.5% | | | | | | | | | | | | |
e | | BMC Software Finance Inc., senior note, 144A, 8.125%, 7/15/21 | | | United States | | | | 130,805,000 | | | | 134,565,644 | |
e | | CommScope Inc., senior bond, 144A, 5.50%, 6/15/24 | | | United States | | | | 100,000,000 | | | | 105,000,000 | |
e | | CommScope Technologies LLC, senior bond, 144A, 6.00%, 6/15/25 | | | United States | | | | 74,200,000 | | | | 79,672,250 | |
e | | Dell International LLC/EMC Corp., | | | | | | | | | | | | |
| | senior secured bond, first lien, 144A, 6.02%, 6/15/26 | | | United States | | | | 26,150,000 | | | | 29,079,115 | |
| | senior secured note, first lien, 144A, 4.42%, 6/15/21 | | | United States | | | | 41,400,000 | | | | 43,498,231 | |
| | senior secured note, first lien, 144A, 5.45%, 6/15/23 | | | United States | | | | 69,750,000 | | | | 76,591,487 | |
e | | First Data Corp., | | | | | | | | | | | | |
| | secured note, second lien, 144A, 5.75%, 1/15/24 | | | United States | | | | 70,000,000 | | | | 73,500,000 | |
| | senior note, 144A, 7.00%, 12/01/23 | | | United States | | | | 200,000,000 | | | | 214,060,000 | |
| | NCR Corp., | | | | | | | | | | | | |
| | senior note, 5.00%, 7/15/22 | | | United States | | | | 40,000,000 | | | | 41,100,000 | |
| | senior note, 6.375%, 12/15/23 | | | United States | | | | 35,000,000 | | | | 37,418,500 | |
| | | | |
| franklintempleton.com | | Annual Report | | 71 |
FRANKLIN CUSTODIAN FUNDS
STATEMENT OF INVESTMENTS
Franklin Income Fund (continued)
| | | | | | | | | | | | | | |
| | | | | | Country | | |
| Principal
Amount |
* | | | Value | |
| | Corporate Bonds (continued) | | | | | | | | | | | | |
| | Information Technology (continued) | | | | | | | | | | | | |
| | Western Digital Corp., | | | | | | | | | | | | |
| | senior note, 10.50%, 4/01/24 | | | United States | | | | 240,000,000 | | | $ | 282,600,000 | |
| | e senior secured note, 144A, 7.375%, 4/01/23 | | | United States | | | | 100,000,000 | | | | 109,800,000 | |
| | | | | | | | | | | | | 1,226,885,227 | |
| | Materials 1.9% | | | | | | | | | | | | |
e | | Ardagh Packaging Finance PLC/Ardagh MP Holdings USA Inc., | | | | | | | | | | | | |
| | senior note, 144A, 4.625%, 5/15/23 | | | Luxembourg | | | | 44,900,000 | | | | 46,303,125 | |
| | senior note, 144A, 7.25%, 5/15/24 | | | Luxembourg | | | | 46,500,000 | | | | 51,150,000 | |
| | Ball Corp., senior bond, 4.00%, 11/15/23 | | | United States | | | | 100,000,000 | | | | 102,625,000 | |
e | | BWAY Holding Co., | | | | | | | | | | | | |
| | secured note, 144A, 5.50%, 4/15/24 | | | United States | | | | 75,000,000 | | | | 78,468,750 | |
| | senior note, 144A, 7.25%, 4/15/25 | | | United States | | | | 176,800,000 | | | | 182,546,000 | |
e | | Cemex Finance LLC, senior secured note, first lien, 144A, 6.00%, 4/01/24 | | | Mexico | | | | 88,400,000 | | | | 93,910,414 | |
e | | Cemex SAB de CV, | | | | | | | | | | | | |
| | secured note, 144A, 7.25%, 1/15/21 | | | Mexico | | | | 111,000,000 | | | | 117,193,245 | |
| | senior secured bond, 144A, 7.75%, 4/16/26 | | | Mexico | | | | 55,100,000 | | | | 63,395,030 | |
| | senior secured bond, first lien, 144A, 5.70%, 1/11/25 | | | Mexico | | | | 70,000,000 | | | | 74,744,950 | |
| | Crown Americas LLC/Crown Americas Capital Corp. IV, senior bond, 4.50%, 1/15/23 | | | United States | | | | 105,000,000 | | | | 110,775,000 | |
e | | FMG Resources (August 2006) Pty. Ltd., | | | | | | | | | | | | |
| | senior note, 144A, 4.75%, 5/15/22 | | | Australia | | | | 17,900,000 | | | | 18,164,025 | |
| | senior note, 144A, 5.125%, 5/15/24 | | | Australia | | | | 44,400,000 | | | | 46,120,500 | |
| | senior secured note, 144A, 9.75%, 3/01/22 | | | Australia | | | | 500,000,000 | | | | 564,375,000 | |
e | | Platform Specialty Products Corp., senior note, 144A, 6.50%, 2/01/22 | | | United States | | | | 35,000,000 | | | | 36,356,250 | |
| | | | | | | | | | | | | 1,586,127,289 | |
| | Real Estate 0.5% | | | | | | | | | | | | |
e | | Crescent Communities LLC/Crescent Ventures Inc., secured note, 144A, 8.875%, 10/15/21 | | | United States | | | | 35,000,000 | | | | 37,275,000 | |
| | Equinix Inc., senior bond, 5.375%, 5/15/27 | | | United States | | | | 150,000,000 | | | | 163,500,000 | |
| | Iron Mountain Inc., senior sub. bond, 5.75%, 8/15/24 | | | United States | | | | 80,000,000 | | | | 82,900,000 | |
| | iStar Inc., senior note, 5.00%, 7/01/19 | | | United States | | | | 100,000,000 | | | | 101,375,000 | |
| | | | | | | | | | | | | 385,050,000 | |
| | Telecommunication Services 2.4% | | | | | | | | | | | | |
| | CenturyLink Inc., | | | | | | | | | | | | |
| | senior note, 5.80%, 3/15/22 | | | United States | | | | 73,000,000 | | | | 73,000,000 | |
| | senior note, 7.50%, 4/01/24 | | | United States | | | | 41,600,000 | | | | 43,168,736 | |
| | Consolidated Communications Inc., senior note, 6.50%, 10/01/22 | | | United States | | | | 74,200,000 | | | | 71,695,750 | |
e | | Digicel Ltd., senior note, 144A, 6.75%, 3/01/23 | | | Bermuda | | | | 68,300,000 | | | | 67,248,180 | |
| | Frontier Communications Corp., | | | | | | | | | | | | |
| | senior bond, 8.75%, 4/15/22 | | | United States | | | | 36,400,000 | | | | 29,848,000 | |
| | senior note, 9.25%, 7/01/21 | | | United States | | | | 43,600,000 | | | | 38,381,625 | |
| | senior note, 7.125%, 1/15/23 | | | United States | | | | 85,850,000 | | | | 66,104,500 | |
e | | SFR Group SA, secured bond, 144A, 7.375%, 5/01/26 | | | France | | | | 50,000,000 | | | | 54,187,500 | |
| | Sprint Capital Corp., senior note, 6.90%, 5/01/19 | | | United States | | | | 200,000,000 | | | | 213,750,000 | |
| | Sprint Communications Inc., | | | | | | | | | | | | |
| | 11.50%, 11/15/21 | | | United States | | | | 200,000,000 | | | | 255,212,000 | |
| | senior note, 7.00%, 8/15/20 | | | United States | | | | 102,500,000 | | | | 112,249,800 | |
| | senior note, 6.00%, 11/15/22 | | | United States | | | | 193,000,000 | | | | 208,382,100 | |
| | e senior note, 144A, 9.00%, 11/15/18 | | | United States | | | | 70,000,000 | | | | 75,250,000 | |
| | | | |
| 72 | | Annual Report | | franklintempleton.com |
FRANKLIN CUSTODIAN FUNDS
STATEMENT OF INVESTMENTS
Franklin Income Fund (continued)
| | | | | | | | | | | | | | | | | | |
| | | | | | Country | | |
| Principal
Amount |
* | | | | | | | Value | |
| | Corporate Bonds (continued) | | | | | | | | | | | | | | | | |
| | Telecommunication Services (continued) | | | | | | | | | | | | | | | | |
| | Sprint Corp., | | | | | | | | | | | | | | | | |
| | senior bond, 7.875%, 9/15/23 | | | United States | | | | 187,350,000 | | | | | | | $ | 217,794,375 | |
| | senior bond, 7.125%, 6/15/24 | | | United States | | | | 190,650,000 | | | | | | | | 214,957,875 | |
| | senior note, 7.625%, 2/15/25 | | | United States | | | | 14,200,000 | | | | | | | | 16,365,500 | |
e | | Wind Acquisition Finance SA, secured note, second lien, 144A, 7.375%, 4/23/21 | | | Italy | | | | 170,000,000 | | | | | | | | 177,099,200 | |
| | Zayo Group LLC/Zayo Capital Inc., senior note, 6.00%, 4/01/23 | | | United States | | | | 77,000,000 | | | | | | | | 81,885,650 | |
| | | | | | | | | | | | | | | | | 2,016,580,791 | |
| | Utilities 2.5% | | | | | | | | | | | | | | | | |
| | The AES Corp., | | | | | | | | | | | | | | | | |
| | senior bond, 4.875%, 5/15/23 | | | United States | | | | 75,000,000 | | | | | | | | 77,250,000 | |
| | senior bond, 5.50%, 3/15/24 | | | United States | | | | 50,000,000 | | | | | | | | 52,437,500 | |
| | Calpine Corp., | | | | | | | | | | | | | | | | |
| | senior bond, 5.75%, 1/15/25 | | | United States | | | | 237,000,000 | | | | | | | | 224,261,250 | |
| | senior note, 5.375%, 1/15/23 | | | United States | | | | 340,000,000 | | | | | | | | 332,401,000 | |
| | senior note, 5.50%, 2/01/24 | | | United States | | | | 186,500,000 | | | | | | | | 178,340,625 | |
| | Dynegy Inc., | | | | | | | | | | | | | | | | |
| | senior bond, 8.034%, 2/02/24 | | | United States | | | | 81,983,928 | | | | | | | | 81,574,008 | |
| | senior note, 6.75%, 11/01/19 | | | United States | | | | 355,302,000 | | | | | | | | 368,625,825 | |
| | senior note, 7.375%, 11/01/22 | | | United States | | | | 376,500,000 | | | | | | | | 394,383,750 | |
| | senior note, 5.875%, 6/01/23 | | | United States | | | | 130,000,000 | | | | | | | | 130,000,000 | |
| | e senior note, 144A, 8.00%, 1/15/25 | | | United States | | | | 58,300,000 | | | | | | | | 60,777,750 | |
| | Ferrellgas Partners LP/Ferrellgas Partners Finance Corp., senior note, 8.625%, 6/15/20 | | | United States | | | | 49,900,000 | | | | | | | | 47,654,500 | |
e | | InterGen NV, | | | | | | | | | | | | | | | | |
| | secured bond, 144A, 7.00%, 6/30/23 | | | Netherlands | | | | 143,700,000 | | | | | | | | 140,136,959 | |
| | secured note, 144A, 7.50%, 6/30/21 | | | Netherlands | | | | 35,800,000 | | | | GBP | | | | 46,696,069 | |
| | | | | | | | | | | | | | | | | 2,134,539,236 | |
| | Total Corporate Bonds (Cost $27,790,577,184) | | | | | | | | | | | | | | | 29,225,557,075 | |
| | | | | |
i,l | | Senior Floating Rate Interests 4.0% | | | | | | | | | | | | | | | | |
| | Consumer Discretionary 1.7% | | | | | | | | | | | | | | | | |
| | 24 Hour Fitness Worldwide Inc., Term Loan, 5.046%, (LIBOR + 3.75%), 5/28/21 | | | United States | | | | 54,812,635 | | | | | | | | 54,897,595 | |
| | Academy Ltd., Initial Term Loan, 5.232% - 5.318%, (LIBOR + 4.00%), 7/02/22 | | | United States | | | | 112,085,995 | | | | | | | | 76,498,692 | |
| | Belk Inc., Closing Date Term Loan, 6.054%, (LIBOR + 4.75%), 12/12/22 | | | United States | | | | 246,160,161 | | | | | | | | 207,351,535 | |
| | BJ’s Wholesale Club Inc., | | | | | | | | | | | | | | | | |
| | Second Lien Initial Term Loans, 8.732%, (LIBOR + 7.50%), 3/24/25 | | | United States | | | | 38,817,949 | | | | | | | | 37,265,231 | |
| | Tranche B Term Loans, 4.982%, (LIBOR + 3.75%), 3/27/24 | | | United States | | | | 19,950,000 | | | | | | | | 19,167,581 | |
| | Global Eagle Entertainment Inc., Initial Term Loans, 8.456%, (LIBOR + 7.00%), 1/06/23 | | | United States | | | | 106,600,625 | | | | | | | | 104,268,736 | |
| | iHeartCommunications Inc., | | | | | | | | | | | | | | | | |
| | Tranche D Term Loan, 8.083%, (LIBOR + 6.75%), 1/30/19 | | | United States | | | | 918,185,547 | | | | | | | | 710,675,613 | |
| | Tranche E Term Loan, 8.833%, (LIBOR + 7.50%), 7/30/19 | | | United States | | | | 241,744,256 | | | | | | | | 186,143,077 | |
| | Neiman Marcus Group Ltd. Inc., Term Loan, 4.481%, (LIBOR + 3.25%), 10/25/20 | | | United States | | | | 70,717,557 | | | | | | | | 52,927,707 | |
| | | | | | | | | | | | | | | | | 1,449,195,767 | |
| | | | |
| franklintempleton.com | | Annual Report | | 73 |
FRANKLIN CUSTODIAN FUNDS
STATEMENT OF INVESTMENTS
Franklin Income Fund (continued)
| | | | | | | | | | | | | | |
| | | | | | Country | | |
| Principal
Amount |
* | | | Value | |
i,l | | Senior Floating Rate Interests (continued) | | | | | | | | | | | | |
| | Consumer Staples 0.1% | | | | | | | | | | | | |
| | Almonde Inc., | | | | | | | | | | | | |
| | 2nd Lien Dollar Term Loan, 8.567%, (LIBOR + 7.25%), 6/13/25 | | | United States | | | | 15,000,000 | | | $ | 15,332,145 | |
| | Dollar Term Loan, 4.817%, (LIBOR + 3.50%), 6/13/24 | | | United States | | | | 60,000,000 | | | | 60,318,900 | |
| | | | | | | | | | | | | 75,651,045 | |
| | Energy 0.3% | | | | | | | | | | | | |
m | | PetroQuest Energy Inc., Multidraw Term Loan Facility, 10.00%, 10/17/20 | | | United States | | | | 30,000,000 | | | | 30,000,000 | |
c | | W&T Offshore Inc., | | | | | | | | | | | | |
| | Second Lien Term Loan, 9.00%, 5/15/20 | | | United States | | | | 161,850,000 | | | | 145,665,000 | |
| | senior secured, 1.5 Lien Term Loan, 11.00%, 11/15/19 | | | United States | | | | 75,000,000 | | | | 76,875,000 | |
| | | | | | | | | | | | | 252,540,000 | |
| | Financials 0.2% | | | | | | | | | | | | |
| | First Eagle Holdings Inc., Initial Term Loans, 4.833%, (LIBOR + 3.50%), 12/01/22 | | | United States | | | | 74,812,500 | | | | 75,635,438 | |
| | Russell Investments US Institutional Holdco Inc., Term Loan B, 5.485%, (LIBOR + 4.25%), 6/01/23 | | | United States | | | | 64,261,935 | | | | 65,065,209 | |
| | | | | | | | | | | | | 140,700,647 | |
| | Health Care 0.5% | | | | | | | | | | | | |
| | Air Medical Group Holdings Inc., 2016 New Term Loan, 5.237%, (LIBOR + 4.00%), 4/28/22 | | | United States | | | | 49,747,983 | | | | 49,648,487 | |
| | Community Health Systems Inc., Term Loan H, 4.317%, (LIBOR + 3.00%), 1/15/21 | | | United States | | | | 19,566,174 | | | | 19,490,081 | |
| | Endo Luxembourg Finance Co. I S.A.R.L. and Endo LLC, Initial Term Loans, 5.50%, (LIBOR + 4.25%), 4/29/24 | | | United States | | | | 79,800,000 | | | | 80,697,750 | |
| | Horizon Pharma Inc., Second Amendment Refinancing Term Loans, 5.00%, (LIBOR + 3.75%), 3/29/24 | | | United States | | | | 54,725,000 | | | | 55,238,047 | |
| | Lannett Co. Inc., Initial Tranche B Term Loans, 6.61%, (LIBOR + 5.375%), 11/25/22 | | | United States | | | | 59,312,500 | | | | 59,139,486 | |
| | Vizient Inc., Term B-3 Loans, 4.735%, (LIBOR + 3.50%), 5/02/24 | | | United States | | | | 147,606,154 | | | | 149,497,431 | |
| | | | | | | | | | | | | 413,711,282 | |
| | Industrials 0.4% | | | | | | | | | | | | |
| | CEVA Group PLC, Pre-Funded L/C, 6.50%, (LIBOR + 5.50%), 3/19/21 | | | United Kingdom | | | | 18,246,603 | | | | 17,699,205 | |
| | CEVA Intercompany BV, Dutch BV Term Loan, 6.814%, (LIBOR + 5.50%), 3/19/21 | | | United Kingdom | | | | 18,568,407 | | | | 18,011,355 | |
| | CEVA Logistics Canada ULC, Canadian Term Loan, 6.814%, (LIBOR + 5.50%), 3/19/21 | | | Canada | | | | 3,201,450 | | | | 3,105,406 | |
| | CEVA Logistics U.S. Holdings Inc., U.S. Term Loan, 6.814%, (LIBOR + 5.50%), 3/19/21 | | | United Kingdom | | | | 25,611,596 | | | | 24,843,248 | |
| | Commercial Barge Line Co., Initial Term Loan, 9.985%, (LIBOR + 8.75%), 11/12/20 | | | United States | | | | 129,500,000 | | | | 103,373,375 | |
| | Navistar Inc., Tranche B Term Loans, 5.24%, (LIBOR + 4.00%), 8/07/20 | | | United States | | | | 35,950,438 | | | | 36,272,482 | |
| | Vertiv Group Corp., Term B Loans, 5.239%, (LIBOR + 4.00%), 11/30/23 | | | United States | | | | 147,086,207 | | | | 148,189,354 | |
| | | | | | | | | | | | | 351,494,425 | |
| | Information Technology 0.3% | | | | | | | | | | | | |
| | BMC Software Finance Inc., Initial B-1 US Term Loans, 5.235%, (LIBOR + 4.00%), 9/10/22 | | | United States | | | | 75,713,638 | | | | 76,221,449 | |
f,n | | Digicert Inc., | | | | | | | | | | | | |
| | First Lien Term Loan, TBD, 9/18/24 | | | United States | | | | 45,000,000 | | | | 45,489,375 | |
| | Second Lien Term Loan, TBD, 9/18/25 | | | United States | | | | 10,000,000 | | | | 10,112,500 | |
| | | | |
| 74 | | Annual Report | | franklintempleton.com |
FRANKLIN CUSTODIAN FUNDS
STATEMENT OF INVESTMENTS
Franklin Income Fund (continued)
| | | | | | | | | | | | | | | | |
| | | | | | Country | | | | |
| Principal
Amount |
* | | | Value | |
i,l | | Senior Floating Rate Interests (continued) | | | | | | | | | | | | | | |
| | Information Technology (continued) | | | | | | | | | | | | | | |
| | MH Sub I LLC and Micro Holding Corp., | | | | | | | | | | | | | | |
| | Amendment No. 2 Initial Term Loan, 4.82%, (LIBOR + 3.50%), 9/15/24 | | | United States | | | | | | 40,000,000 | | | $ | 39,839,280 | |
| | f,nSecond Lien Initial Term Loan, TBD, 9/15/25 | | | United States | | | | | | 30,000,000 | | | | 29,943,750 | |
| | Uber Technologies Inc., Term Loan, 5.237%, (LIBOR + 4.00%), 7/13/23 | | | United States | | | | | | 54,450,000 | | | | 54,660,994 | |
| | | | | | | | | | | | | | | 256,267,348 | |
| | Materials 0.1% | | | | | | | | | | | | | | |
| | Avantor Performance Materials Holdings Inc., | | | | | | | | | | | | | | |
| | Initial Term Loans, 5.24%, (LIBOR + 4.00%), 3/10/24 | | | United States | | | | | | 49,750,000 | | | | 49,694,031 | |
| | Second Lien Initial Term Loans, 9.49%, (LIBOR + 8.25%), 3/10/25 | | | United States | | | | | | 38,000,000 | | | | 38,095,000 | |
| | | | | | | | | | | | | | | 87,789,031 | |
| | Telecommunication Services 0.2% | | | | | | | | | | | | | | |
| | Digicel International Finance Ltd., Initial Term B Loans, 5.07%, (LIBOR + 3.75%), 5/25/24 | | | United States | | | | | | 60,000,000 | | | | 60,468,780 | |
f,n | | Securus Technologies Holdings Inc., | | | | | | | | | | | | | | |
| | Second Lien Term Loan, TBD, 6/30/25 | | | United States | | | | | | 30,000,000 | | | | 30,271,890 | |
| | Term Loan B, TBD, 6/30/24 | | | United States | | | | | | 45,000,000 | | | | 45,428,895 | |
| | | | | | | | | | | | | | | 136,169,565 | |
| | Utilities 0.2% | | | | | | | | | | | | | | |
| | Intergen NV, Term Advance, 5.84%, (LIBOR + 4.50%), 6/13/20 | | | Netherlands | | | | | | 66,898,486 | | | | 66,919,425 | |
| | Talen Energy Supply LLC, | | | | | | | | | | | | | | |
| | Term B-1 Loans, 5.235%, (LIBOR + 4.00%), 7/15/23 | | | United States | | | | | | 64,538,187 | | | | 63,355,009 | |
| | Tranche B-2 Term Loan, 5.235%, (LIBOR + 4.00%), 4/13/24 | | | United States | | | | | | 59,640,000 | | | | 58,559,025 | |
| | | | | | | | | | | | | | | 188,833,459 | |
| | Total Senior Floating Rate Interests
(Cost $3,614,428,750) | | | | | | | | | | | | | 3,352,352,569 | |
| | | | | |
| | | | | | | | | | Shares | | | | |
| | Escrows and Litigation Trusts 0.0% | | | | | | | | | | | | | | |
b,o | | Motors Liquidation Co., Escrow Account | | | United States | | | | | | 400,000,000 | | | | — | |
b,o | | Motors Liquidation Co., Escrow Account, cvt. pfd., C | | | United States | | | | | | 11,000,000 | | | | — | |
| | Total Escrows and Litigation Trusts
(Cost $2,416,248) | | | | | | | | | | | | | — | |
| | | | | |
| | | |
| Number of
Contracts |
| | | |
| Notional
Amount |
* | | | | |
| | Options Purchased (Cost $22,245,230) 0.0%† | | | | | | | | | | | | | | |
| | Calls - Exchange-Traded | | | | | | | | | | | | | | |
| | CBOE SPX Volatility Index, December Strike Price $15, Expires 12/20/17 | | | 100,000 | | | | | | 10,000,000 | | | | 16,000,000 | |
| | Total Investments before Short Term Investments
(Cost $72,265,451,312) | | | | | | | | | | | | | 78,295,094,769 | |
| | | | |
| franklintempleton.com | | Annual Report | | 75 |
FRANKLIN CUSTODIAN FUNDS
STATEMENT OF INVESTMENTS
Franklin Income Fund (continued)
| | | | | | | | | | | | | | | | |
| | | | | | Country | | | | |
| Principal
Amount |
* | | | Value | |
| | Short Term Investments 5.9% | | | | | | | | | | | | | | |
| | U.S. Government and Agency Securities (Cost $699,339,556) 0.8% | | | | | | | | | | | | | | |
p,q | | U.S. Treasury Bill, 10/12/17 - 12/07/17 | | | United States | | | | | | 700,000,000 | | | $ | 699,403,241 | |
| | Total Investments before Money Market Funds and Repurchase Agreement
(Cost $72,964,790,868) | | | | | | | | | | | | | 78,994,498,010 | |
| | | | | |
| | | | | | | | | | | Shares | | | | | |
| | Money Market Funds (Cost $4,154,803,331) 5.0% | | | | | | | | | | | | | | |
r,s | | Institutional Fiduciary Trust Money Market Portfolio, 0.67% | | | United States | | | | | | 4,154,803,331 | | | | 4,154,803,331 | |
t | | Investments from Cash Collateral Received for Loaned Securities 0.1% | | | | | | | | | | | | | | |
| | Money Market Funds (Cost $53,652,000) 0.1% | | | | | | | | | | | | | | |
r,s | | Institutional Fiduciary Trust Money Market Portfolio, 0.67% | | | United States | | | | | | 53,652,000 | | | | 53,652,000 | |
| | | | | |
| | | | | | | | | |
| Principal
Amount |
* | | | | |
| | Repurchase Agreement (Cost $8,589,837) 0.0%† | | | | | | | | | | | | | | |
u | | Joint Repurchase Agreement, 1.04%, 10/02/17 (Maturity Value $8,590,581) | | | | | | | | | | | | | | |
| | BNP Paribas Securities Corp. | | | | | | | | | | | | | | |
| | Collateralized by pU.S. Treasury Bill, 3/08/18; U.S. Treasury Note,
1.75%, 12/31/20; U.S. Treasury Strip, 5/15/19 - 5/15/22 (valued at
$8,761,634) | | | United States | | | | | | 8,589,837 | | | | 8,589,837 | |
| | Total Investments from Cash Collateral Received for Loaned Securities (Cost $62,241,837) | | | | | | | | | | | | | 62,241,837 | |
| | Total Investments (Cost $77,181,836,036) 99.8% | | | | | | | | | | | | | 83,211,543,178 | |
| | Options Written (0.0)%† | | | | | | | | | | | | | (15,015,000 | ) |
| | Other Assets, less Liabilities 0.2% | | | | | | | | | | | | | 194,732,289 | |
| | Net Assets 100.0% | | | | | | | | | | | | $ | 83,391,260,467 | |
| | | | | |
| | | |
| Number of
Contracts |
| | | |
| Notional
Amount |
* | | | | |
v | | Options Written (0.0)%† | | | | | | | | | | | | | | |
| | Calls - Exchange-Traded | | | | | | | | | | | | | | |
| | Analog Devices Inc., October Strike Price $87.50, Expires 10/20/17 | | | 10,000 | | | | | | 1,000,000 | | | | (900,000 | ) |
| | Anheuser-Busch InBev SA/NV, October Strike Price $120, Expires 10/20/17 | | | 5,000 | | | | | | 500,000 | | | | (700,000 | ) |
| | Anheuser-Busch InBev SA/NV, October Strike Price $125, Expires 10/20/17 | | | 10,000 | | | | | | 1,000,000 | | | | (290,000 | ) |
| | General Motors Co., October Strike Price $38, Expires 10/20/17 | | | 15,000 | | | | | | 1,500,000 | | | | (3,645,000 | ) |
| | Microsoft Corp., October Strike Price $77.50, Expires 10/20/17 | | | 10,000 | | | | | | 1,000,000 | | | | (150,000 | ) |
| | Philip Morris International Inc., October Strike Price $120, Expires 10/20/17 | | | 5,000 | | | | | | 500,000 | | | | (30,000 | ) |
| | Rio Tinto PLC, October Strike Price $52.50, Expires 10/20/17 | | | 10,000 | | | | | | 1,000,000 | | | | (30,000 | ) |
| | Royal Dutch Shell PLC, A, November Strike Price $60, Expires 11/17/17 | | | 5,000 | | | | | | 500,000 | | | | (820,000 | ) |
| | Royal Dutch Shell PLC, A, October Strike Price $57.50, Expires 10/20/17 | | | 10,000 | | | | | | 1,000,000 | | | | (3,270,000 | ) |
| | Target Corp., October Strike Price $60, Expires 10/20/17 | | | 20,000 | | | | | | 2,000,000 | | | | (1,480,000 | ) |
| | | | | | | | | | | | | | | (11,315,000 | ) |
| | | | |
| 76 | | Annual Report | | franklintempleton.com |
FRANKLIN CUSTODIAN FUNDS
STATEMENT OF INVESTMENTS
Franklin Income Fund (continued)
| | | | | | | | | | | | | | |
| | |
| Number of
Contracts |
| |
| Notional
Amount |
* | | | | | Value | |
| vOptions Written (continued) | | | | | | | | | | | | | | |
| Puts - Exchange-Traded | | | | | | | | | | | | | | |
| Apple Inc., October Strike Price $150, Expires 10/20/17 | | | 10,000 | | | | 1,000,000 | | | | | $ | (1,090,000 | ) |
| Bank of America Corp., October Strike Price $22, Expires 10/20/17 | | | 10,000 | | | | 1,000,000 | | | | | | (20,000 | ) |
| General Electric Co., October Strike Price $24, Expires 10/20/17 | | | 70,000 | | | | 7,000,000 | | | | | | (2,520,000 | ) |
| JPMorgan Chase & Co., October Strike Price $85, Expires 10/20/17 | | | 10,000 | | | | 1,000,000 | | | | | | (70,000 | ) |
| | | | | | | | | | | | | (3,700,000 | ) |
| Total Options Written (Premiums received $11,895,315) | | | | | | | | | | | | $ | (15,015,000 | ) |
See Abbreviations on page 124.
†Rounds to less than 0.1% of net assets.
*The principal/notional amount is stated in U.S. dollars unless otherwise indicated.
aA portion or all of the security is held in connection with written option contracts open at year end.
bNon-income producing.
cSee Note 10 regarding holdings of 5% voting securities.
dSee Note 1(f) regarding equity-linked securities.
eSecurity was purchased pursuant to Rule 144A under the Securities Act of 1933 and may be sold in transactions exempt from registration only to qualified institutional buyers or in a public offering registered under the Securities Act of 1933. These securities have been deemed liquid under guidelines approved by the Trust’s Board of Trustees. At September 30, 2017, the aggregate value of these securities was $21,203,719,577, representing 25.4% of net assets.
fA portion or all of the security purchased on a delayed delivery basis. See Note 1(d).
gSecurity purchased on a when-issued basis. See Note 1(d).
hA portion or all of the security is on loan at September 30, 2017. See Note 1(g).
iThe coupon rate shown represents the rate at period end.
jIncome may be received in additional securities and/or cash.
kPerpetual security with no stated maturity date.
lSee Note 1(i) regarding senior floating rate interests.
mSee Note 8 regarding unfunded loan commitments.
nA portion or all of the security represents an unsettled loan commitment. The coupon rate is to-be determined (TBD) at the time of settlement and will be based upon a reference index/floor plus a spread.
oFair valued using significant unobservable inputs. See Note 12 regarding fair value measurements.
pThe security was issued on a discount basis with no stated coupon rate.
qA portion or all the security has been segregated as collateral for open written option contracts. At September 30, 2017, the aggregate value of these securities pledged amounted to $447,426,227, representing 0.5% of net assets.
rSee Note 3(f) regarding investments in affiliated management investment companies.
sThe rate shown is the annualized seven-day yield at period end.
tSee Note 1(g) regarding securities on loan.
uSee Note 1(c) regarding joint repurchase agreement.
vSee Note 1(e) regarding written options.
| | | | | | |
| franklintempleton.com | | The accompanying notes are an integral part of these financial statements. | Annual Report | | | 77 | |
FRANKLIN CUSTODIAN FUNDS
Financial Highlights
Franklin U.S. Government Securities Fund
| | | | | | | | | | | | | | | | | | | | |
| | | Year Ended September 30, | |
| | 2017 | | | 2016 | | | 2015 | | | 2014 | | | 2013 | |
| | | | | |
Class A | | | | | | | | | | | | | | | | | | | | |
| | | | | |
Per share operating performance (for a share outstanding throughout the year) | | | | | | | | | | | | | | | | | | | | |
Net asset value, beginning of year | | | $ 6.35 | | | | $ 6.40 | | | | $ 6.48 | | | | $ 6.53 | | | | $ 6.91 | |
Income from investment operationsa: | | | | | | | | | | | | | | | | | | | | |
Net investment incomeb | | | 0.13 | | | | 0.14 | | | | 0.15 | | | | 0.17 | | | | 0.15 | |
Net realized and unrealized gains (losses) | | | (0.16 | ) | | | 0.01 | | | | (0.02 | ) | | | 0.01 | | | | (0.29 | ) |
Total from investment operations | | | (0.03 | ) | | | 0.15 | | | | 0.13 | | | | 0.18 | | | | (0.14 | ) |
Less distributions from net investment income | | | (0.19 | ) | | | (0.20 | ) | | | (0.21 | ) | | | (0.23 | ) | | | (0.24 | ) |
Net asset value, end of year | | | $ 6.13 | | | | $ 6.35 | | | | $ 6.40 | | | | $ 6.48 | | | | $ 6.53 | |
| | | | | |
Total returnc | | | (0.45)% | | | | 2.35% | | | | 2.07% | | | | 2.80% | | | | (2.03)% | |
| | | | | |
Ratios to average net assets | | | | | | | | | | | | | | | | | | | | |
Expenses | | | 0.79% | d | | | 0.76% | d | | | 0.76% | d | | | 0.75% | d | | | 0.73% | |
Net investment income | | | 2.17% | | | | 2.21% | | | | 2.28% | | | | 2.62% | | | | 2.17% | |
| | | | | |
Supplemental data | | | | | | | | | | | | | | | | | | | | |
Net assets, end of year (000’s) | | | $3,581,769 | | | | $4,235,819 | | | | $4,167,639 | | | | $4,323,990 | | | | $5,138,613 | |
Portfolio turnover rate | | | 86.72% | | | | 92.18% | | | | 69.10% | | | | 69.73% | | | | 46.16% | |
Portfolio turnover rate excluding mortgage dollar rollse | | | 86.72% | | | | 92.18% | | | | 58.70% | | | | 38.79% | | | | 40.83% | |
aThe amount shown for a share outstanding throughout the period may not correlate with the Statement of Operations for the period due to the timing of sales and repurchases of the Fund’s shares in relation to income earned and/or fluctuating fair value of the investments of the Fund.
bBased on average daily shares outstanding.
cTotal return does not reflect sales commissions or contingent deferred sales charges, if applicable.
dBenefit of waiver and payments by affiliates and expense reduction rounds to less than 0.01%.
eSee Note 1(h) regarding mortgage dollar rolls.
| | | | |
| 78 | | Annual Report | The accompanying notes are an integral part of these financial statements. | | franklintempleton.com |
FRANKLIN CUSTODIAN FUNDS
FINANCIAL HIGHLIGHTS
Franklin U.S. Government Securities Fund (continued)
| | | | | | | | | | | | | | | | | | | | |
| | | Year Ended September 30, | |
| | 2017 | | | 2016 | | | 2015 | | | 2014 | | | 2013 | |
| | | | | |
Class C | | | | | | | | | | | | | | | | | | | | |
| | | | | |
Per share operating performance (for a share outstanding throughout the year) | | | | | | | | | | | | | | | | | | | | |
Net asset value, beginning of year | | | $ 6.30 | | | | $ 6.36 | | | | $ 6.44 | | | | $ 6.49 | | | | $ 6.86 | |
Income from investment operationsa: | | | | | | | | | | | | | | | | | | | | |
Net investment incomeb | | | 0.10 | | | | 0.11 | | | | 0.11 | | | | 0.14 | | | | 0.11 | |
Net realized and unrealized gains (losses) | | | (0.16 | ) | | | — | c | | | (0.01 | ) | | | 0.01 | | | | (0.28 | ) |
Total from investment operations | | | (0.06 | ) | | | 0.11 | | | | 0.10 | | | | 0.15 | | | | (0.17 | ) |
Less distributions from net investment income | | | (0.16 | ) | | | (0.17 | ) | | | (0.18 | ) | | | (0.20 | ) | | | (0.20 | ) |
Net asset value, end of year | | | $ 6.08 | | | | $ 6.30 | | | | $ 6.36 | | | | $ 6.44 | | | | $ 6.49 | |
| | | | | |
Total returnd | | | (0.96)% | | | | 1.70% | | | | 1.57% | | | | 2.30% | | | | (2.45)% | |
| | | | | |
Ratios to average net assets | | | | | | | | | | | | | | | | | | | | |
Expenses | | | 1.29% | e | | | 1.26% | e | | | 1.26% | e | | | 1.25% | e | | | 1.23% | |
Net investment income | | | 1.67% | | | | 1.71% | | | | 1.78% | | | | 2.12% | | | | 1.67% | |
| | | | | |
Supplemental data | | | | | | | | | | | | | | | | | | | | |
Net assets, end of year (000’s) | | | $797,394 | | | | $1,034,410 | | | | $1,040,294 | | | | $1,190,720 | | | | $1,640,787 | |
Portfolio turnover rate | | | 86.72% | | | | 92.18% | | | | 69.10% | | | | 69.73% | | | | 46.16% | |
Portfolio turnover rate excluding mortgage dollar rollsf | | | 86.72% | | | | 92.18% | | | | 58.70% | | | | 38.79% | | | | 40.83% | |
aThe amount shown for a share outstanding throughout the period may not correlate with the Statement of Operations for the period due to the timing of sales and repurchases of the Fund’s shares in relation to income earned and/or fluctuating fair value of the investments of the Fund.
bBased on average daily shares outstanding.
cAmount rounds to less than $0.01 per share.
dTotal return does not reflect sales commissions or contingent deferred sales charges, if applicable.
eBenefit of waiver and payments by affiliates and expense reduction rounds to less than 0.01%.
fSee Note 1(h) regarding mortgage dollar rolls.
| | | | | | |
| franklintempleton.com | | The accompanying notes are an integral part of these financial statements. | Annual Report | | | 79 | |
FRANKLIN CUSTODIAN FUNDS
FINANCIAL HIGHLIGHTS
Franklin U.S. Government Securities Fund (continued)
| | | | | | | | | | | | | | | | | | | | |
| | | Year Ended September 30, | |
| | 2017 | | | 2016 | | | 2015 | | | 2014 | | | 2013 | |
| | | | | |
Class R | | | | | | | | | | | | | | | | | | | | |
| | | | | |
Per share operating performance (for a share outstanding throughout the year) | | | | | | | | | | | | | | | | | | | | |
Net asset value, beginning of year | | | $ 6.34 | | | | $ 6.40 | | | | $ 6.48 | | | | $ 6.53 | | | | $ 6.90 | |
Income from investment operationsa: | | | | | | | | | | | | | | | | | | | | |
Net investment incomeb | | | 0.11 | | | | 0.12 | | | | 0.13 | | | | 0.15 | | | | 0.12 | |
Net realized and unrealized gains (losses) | | | (0.16 | ) | | | — | c | | | (0.02 | ) | | | 0.01 | | | | (0.27 | ) |
Total from investment operations | | | (0.05 | ) | | | 0.12 | | | | 0.11 | | | | 0.16 | | | | (0.15 | ) |
Less distributions from net investment income | | | (0.17 | ) | | | (0.18 | ) | | | (0.19 | ) | | | (0.21 | ) | | | (0.22 | ) |
Net asset value, end of year | | | $ 6.12 | | | | $ 6.34 | | | | $ 6.40 | | | | $ 6.48 | | | | $ 6.53 | |
| | | | | |
Total return | | | (0.81)% | | | | 1.84% | | | | 1.71% | | | | 2.44% | | | | (2.27)% | |
| | | | | |
Ratios to average net assets | | | | | | | | | | | | | | | | | | | | |
Expenses | | | 1.13% | d | | | 1.11% | d | | | 1.11% | d | | | 1.10% | d | | | 1.08% | |
Net investment income | | | 1.83% | | | | 1.86% | | | | 1.93% | | | | 2.27% | | | | 1.82% | |
| | | | | |
Supplemental data | | | | | | | | | | | | | | | | | | | | |
Net assets, end of year (000’s) | | | $38,363 | | | | $59,785 | | | | $64,689 | | | | $74,442 | | | | $94,110 | |
Portfolio turnover rate | | | 86.72% | | | | 92.18% | | | | 69.10% | | | | 69.73% | | | | 46.16% | |
Portfolio turnover rate excluding mortgage dollar rollse | | | 86.72% | | | | 92.18% | | | | 58.70% | | | | 38.79% | | | | 40.83% | |
aThe amount shown for a share outstanding throughout the period may not correlate with the Statement of Operations for the period due to the timing of sales and repurchases of the Fund’s shares in relation to income earned and/or fluctuating fair value of the investments of the Fund.
bBased on average daily shares outstanding.
cAmount rounds to less than $0.01 per share.
dBenefit of waiver and payments by affiliates and expense reduction rounds to less than 0.01%.
eSee Note 1(h) regarding mortgage dollar rolls.
| | | | |
| 80 | | Annual Report | The accompanying notes are an integral part of these financial statements. | | franklintempleton.com |
FRANKLIN CUSTODIAN FUNDS
FINANCIAL HIGHLIGHTS
Franklin U.S. Government Securities Fund (continued)
| | | | | | | | | | | | | | | | | | | | |
| | | Year Ended September 30, | |
| | 2017 | | | 2016 | | | 2015 | | | 2014 | | | 2013a | |
| | | | | |
Class R6 | | | | | | | | | | | | | | | | | | | | |
| | | | | |
Per share operating performance (for a share outstanding throughout the year) | | | | | | | | | | | | | | | | | | | | |
Net asset value, beginning of year | | | $ 6.37 | | | | $ 6.42 | | | | $ 6.50 | | | | $ 6.55 | | | | $ 6.76 | |
Income from investment operationsb: | | | | | | | | | | | | | | | | | | | | |
Net investment incomec | | | 0.15 | | | | 0.16 | | | | 0.17 | | | | 0.19 | | | | 0.07 | |
Net realized and unrealized gains (losses) | | | (0.16 | ) | | | 0.01 | | | | (0.02 | ) | | | 0.01 | | | | (0.17 | ) |
Total from investment operations | | | (0.01 | ) | | | 0.17 | | | | 0.15 | | | | 0.20 | | | | (0.10 | ) |
Less distributions from net investment income | | | (0.21 | ) | | | (0.22 | ) | | | (0.23 | ) | | | (0.25 | ) | | | (0.11 | ) |
Net asset value, end of year | | | $ 6.15 | | | | $ 6.37 | | | | $ 6.42 | | | | $ 6.50 | | | | $ 6.55 | |
| | | | | |
Total returnd | | | (0.16)% | | | | 2.63% | | | | 2.35% | | | | 3.08% | | | | (1.53)% | |
| | | | | |
Ratios to average net assetse | | | | | | | | | | | | | | | | | | | | |
Expenses | | | 0.48% | f | | | 0.48% | f | | | 0.47% | f | | | 0.47% | f | | | 0.46% | |
Net investment income | | | 2.48% | | | | 2.49% | | | | 2.57% | | | | 2.90% | | | | 2.44% | |
| | | | | |
Supplemental data | | | | | | | | | | | | | | | | | | | | |
Net assets, end of year (000’s) | | | $446,174 | | | | $624,619 | | | | $375,644 | | | | $497,246 | | | | $480,590 | |
Portfolio turnover rate | | | 86.72% | | | | 92.18% | | | | 69.10% | | | | 69.73% | | | | 46.16% | |
Portfolio turnover rate excluding mortgage dollar rollsg | | | 86.72% | | | | 92.18% | | | | 58.70% | | | | 38.79% | | | | 40.83% | |
aFor the period May 1, 2013 (effective date) to September 30, 2013.
bThe amount shown for a share outstanding throughout the period may not correlate with the Statement of Operations for the period due to the timing of sales and repurchases of the Fund’s shares in relation to income earned and/or fluctuating fair value of the investments of the Fund.
cBased on average daily shares outstanding.
dTotal return is not annualized for periods less than one year.
eRatios are annualized for periods less than one year.
fBenefit of waiver and payments by affiliates and expense reduction rounds to less than 0.01%.
gSee Note 1(h) regarding mortgage dollar rolls.
| | | | | | |
| franklintempleton.com | | The accompanying notes are an integral part of these financial statements. | Annual Report | | | 81 | |
FRANKLIN CUSTODIAN FUNDS
FINANCIAL HIGHLIGHTS
Franklin U.S. Government Securities Fund (continued)
| | | | | | | | | | | | | | | | | | | | |
| | | Year Ended September 30, | |
| | | 2017 | | | 2016 | | | 2015 | | | 2014 | | | 2013 | |
Advisor Class | | | | | | | | | | | | | | | | | | | | |
| | | | | |
Per share operating performance (for a share outstanding throughout the year) | | | | | | | | | | | | | | | | | | | | |
Net asset value, beginning of year | | | $ 6.37 | | | | $ 6.42 | | | | $ 6.50 | | | | $ 6.55 | | | | $ 6.93 | |
Income from investment operationsa: | | | | | | | | | | | | | | | | | | | | |
Net investment incomeb | | | 0.15 | | | | 0.15 | | | | 0.16 | | | | 0.18 | | | | 0.16 | |
Net realized and unrealized gains (losses) | | | (0.17 | ) | | | 0.01 | | | | (0.02 | ) | | | 0.01 | | | | (0.29 | ) |
Total from investment operations | | | (0.02 | ) | | | 0.16 | | | | 0.14 | | | | 0.19 | | | | (0.13 | ) |
Less distributions from net investment income | | | (0.20 | ) | | | (0.21 | ) | | | (0.22 | ) | | | (0.24 | ) | | | (0.25 | ) |
Net asset value, end of year | | | $ 6.15 | | | | $ 6.37 | | | | $ 6.42 | | | | $ 6.50 | | | | $ 6.55 | |
| | | | | |
Total return | | | (0.30)% | | | | 2.49% | | | | 2.21% | | | | 2.94% | | | | (1.86)% | |
| | | | | |
Ratios to average net assets | | | | | | | | | | | | | | | | | | | | |
Expenses | | | 0.64% | c | | | 0.61% | c | | | 0.61% | c | | | 0.60% | c | | | 0.58% | |
Net investment income | | | 2.32% | | | | 2.36% | | | | 2.43% | | | | 2.77% | | | | 2.32% | |
| | | | | |
Supplemental data | | | | | | | | | | | | | | | | | | | | |
Net assets, end of year (000’s) | | $ | 854,640 | | | $ | 718,975 | | | $ | 622,339 | | | $ | 652,737 | | | $ | 949,085 | |
Portfolio turnover rate | | | 86.72% | | | | 92.18% | | | | 69.10% | | | | 69.73% | | | | 46.16% | |
Portfolio turnover rate excluding mortgage dollar rollsd | | | 86.72% | | | | 92.18% | | | | 58.70% | | | | 38.79% | | | | 40.83% | |
aThe amount shown for a share outstanding throughout the period may not correlate with the Statement of Operations for the period due to the timing of sales and repurchases of the Fund’s shares in relation to income earned and/or fluctuating fair value of the investments of the Fund.
bBased on average daily shares outstanding.
cBenefit of waiver and payments by affiliates and expense reduction rounds to less than 0.01%.
dSee Note 1(h) regarding mortgage dollar rolls.
| | | | |
| 82 | | Annual Report | The accompanying notes are an integral part of these financial statements. | | franklintempleton.com |
FRANKLIN CUSTODIAN FUNDS
Statement of Investments, September 30, 2017
Franklin U.S. Government Securities Fund
| | | | | | | | | | |
| | | | |
| Principal
Amount |
| | | Value | |
| | Mortgage-Backed Securities 97.2% | | | | | | | | |
| | Government National Mortgage Association (GNMA) Fixed Rate 97.2% | | | | | | | | |
| | GNMA I SF 15 Year, 6.50%, 5/15/18 | | | $ 43 | | | | $ 43 | |
| | GNMA I SF 30 Year, 3.50%, 4/15/43 - 5/15/43 | | | 32,137,490 | | | | 33,699,911 | |
| | GNMA I SF 30 Year, 4.00%, 10/15/40 - 1/15/45 | | | 53,252,582 | | | | 56,564,642 | |
| | GNMA I SF 30 Year, 4.00%, 8/15/44 | | | 19,733,043 | | | | 20,960,985 | |
| | GNMA I SF 30 Year, 4.00%, 1/15/45 - 7/15/46 | | | 53,345,042 | | | | 56,662,401 | |
| | GNMA I SF 30 Year, 4.00%, 7/15/46 - 8/15/46 | | | 3,243,515 | | | | 3,446,471 | |
| | GNMA I SF 30 Year, 4.50%, 2/15/39 - 12/15/39 | | | 52,357,647 | | | | 56,618,353 | |
| | GNMA I SF 30 Year, 4.50%, 3/15/39 | | | 19,921,282 | | | | 21,583,448 | |
| | GNMA I SF 30 Year, 4.50%, 12/15/39 - 5/15/40 | | | 52,358,895 | | | | 56,428,678 | |
| | GNMA I SF 30 Year, 4.50%, 5/15/40 - 8/15/40 | | | 46,441,860 | | | | 50,043,914 | |
| | GNMA I SF 30 Year, 4.50%, 6/15/40 | | | 16,143,836 | | | | 17,596,743 | |
| | GNMA I SF 30 Year, 4.50%, 7/15/40 | | | 13,372,582 | | | | 14,469,443 | |
| | GNMA I SF 30 Year, 4.50%, 7/15/40 | | | 17,051,235 | | | | 18,329,591 | |
| | GNMA I SF 30 Year, 4.50%, 8/15/40 - 6/15/41 | | | 43,119,452 | | | | 46,767,481 | |
| | GNMA I SF 30 Year, 5.00%, 2/15/33 - 10/15/33 | | | 51,371,446 | | | | 56,636,863 | |
| | GNMA I SF 30 Year, 5.00%, 10/15/33 - 10/15/38 | | | 51,296,958 | | | | 56,496,786 | |
| | GNMA I SF 30 Year, 5.00%, 10/15/38 - 10/15/39 | | | 48,864,512 | | | | 53,854,615 | |
| | GNMA I SF 30 Year, 5.00%, 8/15/39 | | | 23,759,098 | | | | 26,165,943 | |
| | GNMA I SF 30 Year, 5.00%, 10/15/39 | | | 16,399,330 | | | | 18,234,274 | |
| | GNMA I SF 30 Year, 5.00%, 10/15/39 | | | 22,470,517 | | | | 24,953,420 | |
| | GNMA I SF 30 Year, 5.00%, 10/15/39 - 1/15/40 | | | 51,166,049 | | | | 56,731,205 | |
| | GNMA I SF 30 Year, 5.00%, 11/15/39 | | | 28,927,165 | | | | 32,158,355 | |
| | GNMA I SF 30 Year, 5.00%, 2/15/40 | | | 15,792,166 | | | | 17,564,623 | |
| | GNMA I SF 30 Year, 5.00%, 2/15/40 - 5/15/40 | | | 47,123,751 | | | | 52,165,958 | |
| | GNMA I SF 30 Year, 5.00%, 3/15/40 | | | 18,846,343 | | | | 20,965,256 | |
| | GNMA I SF 30 Year, 5.00%, 5/15/40 - 6/15/40 | | | 37,947,453 | | | | 42,028,086 | |
| | GNMA I SF 30 Year, 5.00%, 9/15/40 | | | 24,760,045 | | | | 27,263,936 | |
| | GNMA I SF 30 Year, 5.50%, 5/15/28 - 5/15/33 | | | 50,644,867 | | | | 57,020,892 | |
| | GNMA I SF 30 Year, 5.50%, 5/15/33 - 4/15/35 | | | 48,548,446 | | | | 54,586,906 | |
| | GNMA I SF 30 Year, 5.50%, 4/15/35 - 1/15/39 | | | 50,210,774 | | | | 56,652,405 | |
| | GNMA I SF 30 Year, 5.50%, 2/15/39 - 2/15/40 | | | 31,268,799 | | | | 35,086,460 | |
| | GNMA I SF 30 Year, 6.00%, 10/15/23 - 4/15/33 | | | 50,336,402 | | | | 57,091,138 | |
| | GNMA I SF 30 Year, 6.00%, 4/15/33 - 3/15/37 | | | 48,287,893 | | | | 55,174,574 | |
| | GNMA I SF 30 Year, 6.00%, 4/15/37 - 11/15/38 | | | 42,106,318 | | | | 47,819,659 | |
| | GNMA I SF 30 Year, 6.00%, 11/15/38 - 12/15/39 | | | 19,209,088 | | | | 21,665,178 | |
| | GNMA I SF 30 Year, 6.50%, 5/15/23 - 8/15/37 | | | 50,408,711 | | | | 56,208,231 | |
| | GNMA I SF 30 Year, 7.00%, 3/15/22 - 9/15/32 | | | 34,967,582 | | | | 38,584,605 | |
| | GNMA I SF 30 Year, 7.25%, 12/15/25 - 1/15/26 | | | 91,177 | | | | 93,280 | |
| | GNMA I SF 30 Year, 7.50%, 6/15/21 - 8/15/33 | | | 9,924,087 | | | | 10,802,276 | |
| | GNMA I SF 30 Year, 7.70%, 1/15/21 - 10/15/21 | | | 52,260 | | | | 52,430 | |
| | GNMA I SF 30 Year, 8.00%, 2/15/20 - 9/15/30 | | | 3,967,964 | | | | 4,124,927 | |
| | GNMA I SF 30 Year, 8.50%, 4/15/18 - 5/15/25 | | | 766,560 | | | | 800,428 | |
| | GNMA I SF 30 Year, 9.00%, 12/15/17 - 7/15/23 | | | 655,181 | | | | 673,281 | |
| | GNMA I SF 30 Year, 9.50%, 10/15/17 - 8/15/22 | | | 633,564 | | | | 641,630 | |
| | GNMA I SF 30 Year, 10.00%, 11/15/17 - 3/15/25 | | | 352,041 | | | | 355,958 | |
| | GNMA I SF 30 Year, 10.50%, 11/15/17 - 10/15/21 | | | 162,356 | | | | 164,104 | |
| | GNMA I SF 30 Year, 11.00%, 12/15/17 - 5/15/21 | | | 23,804 | | | | 24,046 | |
| | GNMA II SF 30 Year, 3.00%, 2/20/45 | | | 10,346,240 | | | | 10,502,549 | |
| | GNMA II SF 30 Year, 3.00%, 7/20/47 | | | 266,165,319 | | | | 270,177,103 | |
| | GNMA II SF 30 Year, 3.00%, 9/20/47 | | | 60,000,000 | | | | 60,904,352 | |
a | | GNMA II SF 30 Year, 3.00%, 10/01/47 | | | 25,785,000 | | | | 26,137,530 | |
| | | | |
| franklintempleton.com | | Annual Report | | 83 |
FRANKLIN CUSTODIAN FUNDS
STATEMENT OF INVESTMENTS
Franklin U.S. Government Securities Fund (continued)
| | | | | | | | | | |
| | | | |
| Principal
Amount |
| | | Value | |
| | Mortgage-Backed Securities (continued) | | | | | | | | |
| | Government National Mortgage Association (GNMA) Fixed Rate (continued) | | | | | | | | |
| | GNMA II SF 30 Year, 3.50%, 10/20/40 - 2/20/47 | | $ | 39,110,739 | | | $ | 40,908,531 | |
| | GNMA II SF 30 Year, 3.50%, 7/20/42 | | | 60,699,610 | | | | 63,456,162 | |
| | GNMA II SF 30 Year, 3.50%, 8/20/42 | | | 20,938,642 | | | | 21,889,539 | |
| | GNMA II SF 30 Year, 3.50%, 9/20/42 | | | 138,853,363 | | | | 145,159,239 | |
| | GNMA II SF 30 Year, 3.50%, 10/20/42 | | | 28,628,343 | | | | 29,928,471 | |
| | GNMA II SF 30 Year, 3.50%, 11/20/42 | | | 23,798,624 | | | | 24,879,427 | |
| | GNMA II SF 30 Year, 3.50%, 4/20/43 | | | 29,381,704 | | | | 30,716,128 | |
| | GNMA II SF 30 Year, 3.50%, 5/20/43 | | | 39,642,511 | | | | 41,442,952 | |
| | GNMA II SF 30 Year, 3.50%, 6/20/43 | | | 45,811,657 | | | | 47,892,323 | |
| | GNMA II SF 30 Year, 3.50%, 8/20/43 | | | 32,815,880 | | | | 34,306,365 | |
| | GNMA II SF 30 Year, 3.50%, 5/20/47 | | | 764,214,896 | | | | 795,528,892 | |
| | GNMA II SF 30 Year, 3.50%, 7/20/47 | | | 275,178,015 | | | | 286,453,539 | |
| | GNMA II SF 30 Year, 3.50%, 9/20/47 | | | 817,877,981 | | | | 851,390,842 | |
| | GNMA II SF 30 Year, 4.00%, 5/20/40 - 2/20/44 | | | 25,770,464 | | | | 27,322,813 | |
| | GNMA II SF 30 Year, 4.00%, 11/20/40 | | | 40,330,290 | | | | 42,702,363 | |
| | GNMA II SF 30 Year, 4.00%, 12/20/40 | | | 23,714,113 | | | | 25,169,257 | |
| | GNMA II SF 30 Year, 4.00%, 1/20/41 | | | 26,043,388 | | | | 27,659,836 | |
| | GNMA II SF 30 Year, 4.00%, 7/20/41 | | | 32,482,965 | | | | 34,455,090 | |
| | GNMA II SF 30 Year, 4.00%, 9/20/41 | | | 38,338,943 | | | | 40,666,655 | |
| | GNMA II SF 30 Year, 4.00%, 10/20/41 | | | 47,158,935 | | | | 50,023,558 | |
| | GNMA II SF 30 Year, 4.00%, 11/20/41 | | | 43,204,068 | | | | 45,828,378 | |
| | GNMA II SF 30 Year, 4.00%, 2/20/44 | | | 25,523,124 | | | | 27,102,886 | |
| | GNMA II SF 30 Year, 4.00%, 3/20/47 | | | 251,588,826 | | | | 265,688,711 | |
| | GNMA II SF 30 Year, 4.50%, 5/20/33 - 8/20/41 | | | 51,746,452 | | | | 55,732,826 | |
| | GNMA II SF 30 Year, 4.50%, 11/20/39 | | | 14,877,906 | | | | 16,031,403 | |
| | GNMA II SF 30 Year, 4.50%, 12/20/39 | | | 27,428,973 | | | | 29,608,816 | |
| | GNMA II SF 30 Year, 4.50%, 5/20/41 | | | 35,886,434 | | | | 38,598,461 | |
| | GNMA II SF 30 Year, 4.50%, 6/20/41 | | | 43,380,931 | | | | 46,659,373 | |
| | GNMA II SF 30 Year, 4.50%, 7/20/41 | | | 47,161,388 | | | | 50,725,557 | |
| | GNMA II SF 30 Year, 4.50%, 9/20/41 | | | 63,306,945 | | | | 68,093,616 | |
| | GNMA II SF 30 Year, 4.50%, 10/20/41 | | | 47,231,246 | | | | 50,800,771 | |
| | GNMA II SF 30 Year, 4.50%, 8/20/42 | | | 2,287,799 | | | | 2,461,190 | |
| | GNMA II SF 30 Year, 4.50%, 2/20/44 | | | 25,664,620 | | | | 27,409,477 | |
| | GNMA II SF 30 Year, 5.00%, 7/20/33 - 4/20/40 | | | 48,275,520 | | | | 52,961,304 | |
| | GNMA II SF 30 Year, 5.00%, 9/20/33 | | | 26,102,332 | | | | 28,884,779 | |
| | GNMA II SF 30 Year, 5.00%, 7/20/39 | | | 15,611,282 | | | | 17,132,416 | |
| | GNMA II SF 30 Year, 5.00%, 5/20/40 - 9/20/41 | | | 10,715,584 | | | | 11,716,017 | |
| | GNMA II SF 30 Year, 5.00%, 6/20/40 | | | 18,547,868 | | | | 20,461,676 | |
| | GNMA II SF 30 Year, 5.50%, 6/20/34 - 5/20/35 | | | 46,571,889 | | | | 52,047,142 | |
| | GNMA II SF 30 Year, 5.50%, 12/20/34 | | | 16,714,701 | | | | 18,698,655 | |
| | GNMA II SF 30 Year, 5.50%, 6/20/35 - 4/20/40 | | | 36,609,429 | | | | 40,574,934 | |
| | GNMA II SF 30 Year, 6.00%, 10/20/23 - 3/20/36 | | | 47,685,915 | | | | 54,552,289 | |
| | GNMA II SF 30 Year, 6.00%, 4/20/36 - 7/20/39 | | | 26,468,162 | | | | 30,026,719 | |
| | GNMA II SF 30 Year, 6.50%, 6/20/24 - 1/20/39 | | | 25,289,877 | | | | 29,213,207 | |
| | GNMA II SF 30 Year, 7.00%, 2/20/28 - 7/20/33 | | | 5,976,952 | | | | 7,097,078 | |
| | GNMA II SF 30 Year, 7.50%, 10/20/22 - 4/20/32 | | | 1,297,852 | | | | 1,475,407 | |
| | GNMA II SF 30 Year, 8.00%, 5/20/24 - 6/20/30 | | | 625,652 | | | | 730,695 | |
| | GNMA II SF 30 Year, 8.50%, 5/20/19 - 6/20/25 | | | 169,490 | | | | 177,808 | |
| | GNMA II SF 30 Year, 9.00%, 11/20/17 - 11/20/21 | | | 32,709 | | | | 34,861 | |
| | GNMA II SF 30 Year, 9.50%, 6/20/18 - 4/20/25 | | | 59,501 | | | | 61,695 | |
| | GNMA II SF 30 Year, 10.00%, 10/20/17 - 3/20/21 | | | 54,140 | | | | 57,162 | |
| | | | |
| 84 | | Annual Report | | franklintempleton.com |
FRANKLIN CUSTODIAN FUNDS
STATEMENT OF INVESTMENTS
Franklin U.S. Government Securities Fund (continued)
| | | | | | | | | | |
| | | | |
| Principal
Amount |
| | | Value | |
| | Mortgage-Backed Securities (continued) | | | | | | | | |
| | Government National Mortgage Association (GNMA) Fixed Rate (continued) | | | | | | | | |
| | GNMA II SF 30 Year, 10.50%, 8/20/18 - 1/20/21 | | $ | 51,017 | | | $ | 51,430 | |
| | GNMA II SF 30 Year, 11.00%, 7/20/18 - 1/20/21 | | | 9,091 | | | | 9,137 | |
| | Total Mortgage-Backed Securities (Cost $5,447,891,671) | | | | | | | 5,556,393,224 | |
| | | |
| | U.S. Government and Agency Securities (Cost $90,930,869) 1.5% | | | | | | | | |
| | U.S. Treasury Bond, 4.75%, 2/15/37 | | | 67,500,000 | | | | 89,614,160 | |
| | Total Investments before Short Term Investments
(Cost $5,538,822,540) | | | | | | | 5,646,007,384 | |
| | | |
| | | | | Shares | | | | | |
| | Short Term Investments (Cost $90,681,295) 1.6% | | | | | | | | |
| | Money Market Funds 1.6% | | | | | | | | |
b,c | | Institutional Fiduciary Trust Money Market Portfolio, 0.67% | | | 90,681,295 | | | | 90,681,295 | |
| | Total Investments (Cost $5,629,503,835) 100.3% | | | | | | | 5,736,688,679 | |
| | Other Assets, less Liabilities (0.3)% | | | | | | | (18,349,505 | ) |
| | Net Assets 100.0% | | | | | | $ | 5,718,339,174 | |
See Abbreviations on page 124.
aSecurity purchased on a to-be-announced (TBA) basis. See Note 1(d).
bSee Note 3(f) regarding investments in affiliated management investment companies.
cThe rate shown is the annualized seven-day yield at period end.
| | | | |
| franklintempleton.com | | The accompanying notes are an integral part of these financial statements. | Annual Report | | 85 |
FRANKLIN CUSTODIAN FUNDS
Financial Highlights
Franklin Utilities Fund
| | | | | | | | | | | | | | | | | | | | |
| | | Year Ended September 30, | |
| | | | 2017 | | | | 2016 | | | | 2015 | | | | 2014 | | | | 2013 | |
Class A | | | | | | | | | | | | | | | | | | | | |
| | | | | |
Per share operating performance | | | | | | | | | | | | | | | | | | | | |
(for a share outstanding throughout the year) | | | | | | | | | | | | | | | | | | | | |
Net asset value, beginning of year | | | $17.85 | | | | $16.08 | | | | $16.58 | | | | $14.62 | | | | $14.04 | |
Income from investment operationsa: | | | | | | | | | | | | | | | | | | | | |
Net investment incomeb | | | 0.53 | | | | 0.48 | | | | 0.49 | | | | 0.49 | | | | 0.49 | |
Net realized and unrealized gains (losses) | | | 1.30 | | | | 2.31 | | | | (0.09 | ) | | | 2.00 | | | | 0.60 | |
Total from investment operations | | | 1.83 | | | | 2.79 | | | | 0.40 | | | | 2.49 | | | | 1.09 | |
Less distributions from: | | | | | | | | | | | | | | | | | | | | |
Net investment income | | | (0.49 | ) | | | (0.50 | ) | | | (0.48 | ) | | | (0.49 | ) | | | (0.51 | ) |
Net realized gains | | | (0.01 | ) | | | (0.52 | ) | | | (0.42 | ) | | | (0.04 | ) | | | — | |
Total distributions | | | (0.50 | ) | | | (1.02 | ) | | | (0.90 | ) | | | (0.53 | ) | | | (0.51 | ) |
Net asset value, end of year | | | $19.18 | | | | $17.85 | | | | $16.08 | | | | $16.58 | | | | $14.62 | |
| | | | | |
Total returnc | | | 10.38% | | | | 18.23% | | | | 2.19% | | | | 17.24% | | | | 7.92% | |
| | | | | |
Ratios to average net assets | | | | | | | | | | | | | | | | | | | | |
Expenses | | | 0.75% | d,e | | | 0.73% | d,e | | | 0.73% | e | | | 0.75% | d,e | | | 0.75% | d |
Net investment income | | | 2.86% | | | | 2.81% | | | | 2.88% | | | | 3.05% | | | | 3.34% | |
| | | | | |
Supplemental data | | | | | | | | | | | | | | | | | | | | |
Net assets, end of year (000’s) | | | $4,182,780 | | | | $4,180,124 | | | | $3,524,835 | | | | $3,717,397 | | | | $3,275,129 | |
Portfolio turnover rate | | | 0.89% | | | | 7.17% | | | | 9.55% | | | | 8.10% | | | | 4.57% | |
aThe amount shown for a share outstanding throughout the period may not correlate with the Statement of Operations for the period due to the timing of sales and repurchases of the Fund’s shares in relation to income earned and/or fluctuating fair value of the investments of the Fund.
bBased on average daily shares outstanding.
cTotal return does not reflect sales commissions or contingent deferred sales charges, if applicable.
dBenefit of expense reduction rounds to less than 0.01%.
eBenefit of waiver and payments by affiliates rounds to less than 0.01%.
| | | | |
| 86 | | Annual Report | The accompanying notes are an integral part of these financial statements. | | franklintempleton.com |
FRANKLIN CUSTODIAN FUNDS
FINANCIAL HIGHLIGHTS
Franklin Utilities Fund (continued)
| | | | | | | | | | | | | | | | | | | | |
| | | Year Ended September 30, | |
| | | | 2017 | | | | 2016 | | | | 2015 | | | | 2014 | | | | 2013 | |
Class C | | | | | | | | | | | | | | | | | | | | |
| | | | | |
Per share operating performance | | | | | | | | | | | | | | | | | | | | |
(for a share outstanding throughout the year) | | | | | | | | | | | | | | | | | | | | |
Net asset value, beginning of year | | | $17.76 | | | | $16.01 | | | | $16.50 | | | | $14.56 | | | | $13.98 | |
Income from investment operationsa: | | | | | | | | | | | | | | | | | | | | |
Net investment incomeb | | | 0.43 | | | | 0.39 | | | | 0.40 | | | | 0.41 | | | | 0.41 | |
Net realized and unrealized gains (losses) | | | 1.30 | | | | 2.30 | | | | (0.08 | ) | | | 1.98 | | | | 0.61 | |
Total from investment operations | | | 1.73 | | | | 2.69 | | | | 0.32 | | | | 2.39 | | | | 1.02 | |
Less distributions from: | | | | | | | | | | | | | | | | | | | | |
Net investment income | | | (0.39 | ) | | | (0.42 | ) | | | (0.39 | ) | | | (0.41 | ) | | | (0.44 | ) |
Net realized gains | | | (0.01 | ) | | | (0.52 | ) | | | (0.42 | ) | | | (0.04 | ) | | | — | |
Total distributions | | | (0.40 | ) | | | (0.94 | ) | | | (0.81 | ) | | | (0.45 | ) | | | (0.44 | ) |
Net asset value, end of year | | | $19.09 | | | | $17.76 | | | | $16.01 | | | | $16.50 | | | | $14.56 | |
| | | | | |
Total returnc | | | 9.88% | | | | 17.59% | | | | 1.74% | | | | 16.61% | | | | 7.40% | |
| | | | | |
Ratios to average net assets | | | | | | | | | | | | | | | | | | | | |
Expenses | | | 1.25% | d,e | | | 1.23% | d,e | | | 1.23% | e | | | 1.25% | d,e | | | 1.25% | d |
Net investment income | | | 2.36% | | | | 2.31% | | | | 2.38% | | | | 2.55% | | | | 2.84% | |
| | | | | |
Supplemental data | | | | | | | | | | | | | | | | | | | | |
Net assets, end of year (000’s) | | | $981,515 | | | | $1,064,065 | | | | $931,800 | | | | $986,318 | | | | $845,173 | |
Portfolio turnover rate | | | 0.89% | | | | 7.17% | | | | 9.55% | | | | 8.10% | | | | 4.57% | |
aThe amount shown for a share outstanding throughout the period may not correlate with the Statement of Operations for the period due to the timing of sales and repurchases of the Fund’s shares in relation to income earned and/or fluctuating fair value of the investments of the Fund.
bBased on average daily shares outstanding.
cTotal return does not reflect sales commissions or contingent deferred sales charges, if applicable.
dBenefit of expense reduction rounds to less than 0.01%.
eBenefit of waiver and payments by affiliates rounds to less than 0.01%.
| | | | | | |
| franklintempleton.com | | The accompanying notes are an integral part of these financial statements. | Annual Report | | | 87 | |
FRANKLIN CUSTODIAN FUNDS
FINANCIAL HIGHLIGHTS
Franklin Utilities Fund (continued)
| | | | | | | | | | | | | | | | | | | | |
| | | Year Ended September 30, | |
| | | | 2017 | | | | 2016 | | | | 2015 | | | | 2014 | | | | 2013 | |
Class R | | | | | | | | | | | | | | | | | | | | |
| | | | | |
Per share operating performance | | | | | | | | | | | | | | | | | | | | |
(for a share outstanding throughout the year) | | | | | | | | | | | | | | | | | | | | |
Net asset value, beginning of year | | | $17.78 | | | | $16.02 | | | | $16.52 | | | | $14.58 | | | | $14.00 | |
Income from investment operationsa: | | | | | | | | | | | | | | | | | | | | |
Net investment incomeb | | | 0.46 | | | | 0.42 | | | | 0.42 | | | | 0.43 | | | | 0.44 | |
Net realized and unrealized gains (losses) | | | 1.30 | | | | 2.30 | | | | (0.09 | ) | | | 1.99 | | | | 0.60 | |
Total from investment operations | | | 1.76 | | | | 2.72 | | | | 0.33 | | | | 2.42 | | | | 1.04 | |
Less distributions from: | | | | | | | | | | | | | | | | | | | | |
Net investment income | | | (0.42 | ) | | | (0.44 | ) | | | (0.41 | ) | | | (0.44 | ) | | | (0.46 | ) |
Net realized gains | | | (0.01 | ) | | | (0.52 | ) | | | (0.42 | ) | | | (0.04 | ) | | | — | |
Total distributions | | | (0.43 | ) | | | (0.96 | ) | | | (0.83 | ) | | | (0.48 | ) | | | (0.46 | ) |
Net asset value, end of year | | | $19.11 | | | | $17.78 | | | | $16.02 | | | | $16.52 | | | | $14.58 | |
| | | | | |
Total return | | | 10.04% | | | | 17.81% | | | | 1.83% | | | | 16.75% | | | | 7.56% | |
| | | | | |
Ratios to average net assets | | | | | | | | | | | | | | | | | | | | |
Expenses | | | 1.10% | c,d | | | 1.08% | c,d | | | 1.08% | d | | | 1.10% | c,d | | | 1.10% | c |
Net investment income | | | 2.51% | | | | 2.46% | | | | 2.53% | | | | 2.70% | | | | 2.99% | |
| | | | | |
Supplemental data | | | | | | | | | | | | | | | | | | | | |
Net assets, end of year (000’s) | | | $94,465 | | | | $103,247 | | | | $83,271 | | | | $95,498 | | | | $86,216 | |
Portfolio turnover rate | | | 0.89% | | | | 7.17% | | | �� | 9.55% | | | | 8.10% | | | | 4.57% | |
aThe amount shown for a share outstanding throughout the period may not correlate with the Statement of Operations for the period due to the timing of sales and repurchases of the Fund’s shares in relation to income earned and/or fluctuating fair value of the investments of the Fund.
bBased on average daily shares outstanding.
cBenefit of expense reduction rounds to less than 0.01%.
dBenefit of waiver and payments by affiliates rounds to less than 0.01%.
| | | | |
| 88 | | Annual Report | The accompanying notes are an integral part of these financial statements. | | franklintempleton.com |
FRANKLIN CUSTODIAN FUNDS
FINANCIAL HIGHLIGHTS
Franklin Utilities Fund (continued)
| | | | | | | | | | | | | | | | | | | | |
| | | Year Ended September 30, | |
| | | | 2017 | | | | 2016 | | | | 2015 | | | | 2014 | | | | 2013 | a |
Class R6 | | | | | | | | | | | | | | | | | | | | |
| | | | | |
Per share operating performance | | | | | | | | | | | | | | | | | | | | |
(for a share outstanding throughout the year) | | | | | | | | | | | | | | | | | | | | |
Net asset value, beginning of year | | | $17.97 | | | | $16.18 | | | | $16.68 | | | | $14.71 | | | | $15.88 | |
Income from investment operationsb: | | | | | | | | | | | | | | | | | | | | |
Net investment incomec | | | 0.58 | | | | 0.53 | | | | 0.53 | | | | 0.53 | | | | 0.25 | |
Net realized and unrealized gains (losses) | | | 1.31 | | | | 2.32 | | | | (0.09 | ) | | | 2.01 | | | | (1.17 | ) |
Total from investment operations | | | 1.89 | | | | 2.85 | | | | 0.44 | | | | 2.54 | | | | (0.92 | ) |
Less distributions from: | | | | | | | | | | | | | | | | | | | | |
Net investment income | | | (0.53 | ) | | | (0.54 | ) | | | (0.52 | ) | | | (0.53 | ) | | | (0.25 | ) |
Net realized gains | | | (0.01 | ) | | | (0.52 | ) | | | (0.42 | ) | | | (0.04 | ) | | | — | |
Total distributions | | | (0.54 | ) | | | (1.06 | ) | | | (0.94 | ) | | | (0.57 | ) | | | (0.25 | ) |
Net asset value, end of year | | | $19.32 | | | | $17.97 | | | | $16.18 | | | | $16.68 | | | | $14.71 | |
| | | | | |
Total returnd | | | 10.70% | | | | 18.55% | | | | 2.45% | | | | 17.51% | | | | (5.79 | )% |
| | | | | |
Ratios to average net assetse | | | | | | | | | | | | | | | | | | | | |
Expenses | | | 0.48% | f,g | | | 0.47% | f,g | | | 0.47% | g | | | 0.48% | f,g | | | 0.48% | f |
Net investment income | | | 3.13% | | | | 3.07% | | | | 3.14% | | | | 3.32% | | | | 3.61% | |
| | | | | |
Supplemental data | | | | | | | | | | | | | | | | | | | | |
Net assets, end of year (000’s) | | | $241,455 | | | | $219,587 | | | | $201,225 | | | | $236,437 | | | | $218,746 | |
Portfolio turnover rate | | | 0.89% | | | | 7.17% | | | | 9.55% | | | | 8.10% | | | | 4.57% | |
aFor the period May 1, 2013 (effective date) to September 30, 2013.
bThe amount shown for a share outstanding throughout the period may not correlate with the Statement of Operations for the period due to the timing of sales and repurchases of the Fund’s shares in relation to income earned and/or fluctuating fair value of the investments of the Fund.
cBased on average daily shares outstanding.
dTotal return is not annualized for periods less than one year.
eRatios are annualized for periods less than one year.
fBenefit of expense reduction rounds to less than 0.01%.
gBenefit of waiver and payments by affiliates rounds to less than 0.01%.
| | | | | | |
| franklintempleton.com | | The accompanying notes are an integral part of these financial statements. | Annual Report | | | 89 | |
FRANKLIN CUSTODIAN FUNDS
FINANCIAL HIGHLIGHTS
Franklin Utilities Fund (continued)
| | | | | | | | | | | | | | | | | | | | |
| | | Year Ended September 30, | |
| | | | 2017 | | | | 2016 | | | | 2015 | | | | 2014 | | | | 2013 | |
Advisor Class | | | | | | | | | | | | | | | | | | | | |
| | | | | |
Per share operating performance | | | | | | | | | | | | | | | | | | | | |
(for a share outstanding throughout the year) | | | | | | | | | | | | | | | | | | | | |
Net asset value, beginning of year | | | $17.97 | | | | $16.19 | | | | $16.68 | | | | $14.71 | | | | $14.12 | |
Income from investment operationsa: | | | | | | | | | | | | | | | | | | | | |
Net investment incomeb | | | 0.57 | | | | 0.51 | | | | 0.52 | | | | 0.52 | | | | 0.50 | |
Net realized and unrealized gains (losses) | | | 1.30 | | | | 2.32 | | | | (0.09 | ) | | | 2.00 | | | | 0.62 | |
Total from investment operations | | | 1.87 | | | | 2.83 | | | | 0.43 | | | | 2.52 | | | | 1.12 | |
Less distributions from: | | | | | | | | | | | | | | | | | | | | |
Net investment income | | | (0.51 | ) | | | (0.53 | ) | | | (0.50 | ) | | | (0.51 | ) | | | (0.53 | ) |
Net realized gains | | | (0.01 | ) | | | (0.52 | ) | | | (0.42 | ) | | | (0.04 | ) | | | — | |
Total distributions | | | (0.52 | ) | | | (1.05 | ) | | | (0.92 | ) | | | (0.55 | ) | | | (0.53 | ) |
Net asset value, end of year | | | $19.32 | | | | $17.97 | | | | $16.19 | | | | $16.68 | | | | $14.71 | |
| | | | | |
Total return | | | 10.64% | | | | 18.34% | | | | 2.40% | | | | 17.37% | | | | 8.11% | |
| | | | | |
Ratios to average net assets | | | | | | | | | | | | | | | | | | | | |
Expenses | | | 0.60% | c,d | | | 0.58% | c,d | | | 0.58% | d | | | 0.60% | c,d | | | 0.60% | c |
Net investment income | | | 3.01% | | | | 2.96% | | | | 3.03% | | | | 3.20% | | | | 3.49% | |
| | | | | |
Supplemental data | | | | | | | | | | | | | | | | | | | | |
Net assets, end of year (000’s) | | | $963,228 | | | | $755,484 | | | | $549,371 | | | | $562,202 | | | | $343,082 | |
Portfolio turnover rate | | | 0.89% | | | | 7.17% | | | | 9.55% | | | | 8.10% | | | | 4.57% | |
aThe amount shown for a share outstanding throughout the period may not correlate with the Statement of Operations for the period due to the timing of sales and repurchases of the Fund’s shares in relation to income earned and/or fluctuating fair value of the investments of the Fund.
bBased on average daily shares outstanding.
cBenefit of expense reduction rounds to less than 0.01%.
dBenefit of waiver and payments by affiliates rounds to less than 0.01%.
| | | | |
| 90 | | Annual Report | The accompanying notes are an integral part of these financial statements. | | franklintempleton.com |
FRANKLIN CUSTODIAN FUNDS
Statement of Investments, September 30, 2017
Franklin Utilities Fund
| | | | | | | | | | | | | | |
| | | | Country | | | Shares | | | Value | |
| | Common Stocks 98.8% | | | | | | | | | | | | |
| | Electric Utilities 59.4% | | | | | | | | | | | | |
| | ALLETE Inc. | | | United States | | | | 600,000 | | | $ | 46,374,000 | |
| | Alliant Energy Corp. | | | United States | | | | 3,800,000 | | | | 157,966,000 | |
| | American Electric Power Co. Inc. | | | United States | | | | 3,900,000 | | | | 273,936,000 | |
| | Duke Energy Corp. | | | United States | | | | 3,400,000 | | | | 285,328,000 | |
| | Edison International | | | United States | | | | 4,000,000 | | | | 308,680,000 | |
| | Emera Inc. | | | Canada | | | | 2,000,000 | | | | 75,758,426 | |
| | Entergy Corp. | | | United States | | | | 1,400,000 | | | | 106,904,000 | |
| | Eversource Energy | | | United States | | | | 2,200,000 | | | | 132,968,000 | |
| | Exelon Corp. | | | United States | | | | 6,700,000 | | | | 252,389,000 | |
| | FirstEnergy Corp. | | | United States | | | | 5,200,000 | | | | 160,316,000 | |
| | Great Plains Energy Inc. | | | United States | | | | 5,100,000 | | | | 154,530,000 | |
a | | Hydro One Ltd., 144A | | | Canada | | | | 2,000,000 | | | | 36,420,470 | |
| | NextEra Energy Inc. | | | United States | | | | 2,900,000 | | | | 424,995,000 | |
| | OGE Energy Corp. | | | United States | | | | 1,872,000 | | | | 67,448,160 | |
| | PG&E Corp. | | | United States | | | | 4,600,000 | | | | 313,214,000 | |
| | Pinnacle West Capital Corp. | | | United States | | | | 1,800,000 | | | | 152,208,000 | |
| | PNM Resources Inc. | | | United States | | | | 3,000,000 | | | | 120,900,000 | |
| | Portland General Electric Co. | | | United States | | | | 1,800,000 | | | | 82,152,000 | |
| | PPL Corp. | | | United States | | | | 4,200,000 | | | | 159,390,000 | |
| | The Southern Co. | | | United States | | | | 4,500,000 | | | | 221,130,000 | |
| | Westar Energy Inc. | | | United States | | | | 1,800,000 | | | | 89,280,000 | |
| | Xcel Energy Inc. | | | United States | | | | 4,600,000 | | | | 217,672,000 | |
| | | | | | | | | | | | | 3,839,959,056 | |
| | Gas Utilities 1.7% | | | | | | | | | | | | |
| | ONE Gas Inc. | | | United States | | | | 438,181 | | | | 32,267,649 | |
| | Spire Inc. | | | United States | | | | 1,000,000 | | | | 74,650,000 | |
| | | | | | | | | | | | | 106,917,649 | |
| | Multi-Utilities 30.0% | | | | | | | | | | | | |
| | Ameren Corp. | | | United States | | | | 900,000 | | | | 52,056,000 | |
| | Black Hills Corp. | | | United States | | | | 500,000 | | | | 34,435,000 | |
| | CenterPoint Energy Inc. | | | United States | | | | 5,300,000 | | | | 154,813,000 | |
| | CMS Energy Corp. | | | United States | | | | 4,865,000 | | | | 225,346,800 | |
| | Consolidated Edison Inc. | | | United States | | | | 1,250,000 | | | | 100,850,000 | |
| | Dominion Energy Inc. | | | United States | | | | 4,200,000 | | | | 323,106,000 | |
| | DTE Energy Co. | | | United States | | | | 1,800,000 | | | | 193,248,000 | |
| | National Grid PLC | | | United Kingdom | | | | 10,083,333 | | | | 124,938,184 | |
| | NiSource Inc. | | | United States | | | | 2,000,000 | | | | 51,180,000 | |
| | NorthWestern Corp. | | | United States | | | | 596,800 | | | | 33,981,792 | |
| | Public Service Enterprise Group Inc. | | | United States | | | | 2,900,000 | | | | 134,125,000 | |
| | Sempra Energy | | | United States | | | | 2,800,000 | | | | 319,564,000 | |
| | Vectren Corp. | | | United States | | | | 925,100 | | | | 60,843,827 | |
| | WEC Energy Group Inc. | | | United States | | | | 2,100,000 | | | | 131,838,000 | |
| | | | | | | | | | | | | 1,940,325,603 | |
| | Oil, Gas & Consumable Fuels 4.3% | | | | | | | | | | | | |
b | | Cheniere Energy Inc. | | | United States | | | | 300,000 | | | | 13,512,000 | |
| | Enbridge Inc. (CAD Traded) | | | Canada | | | | 847,200 | | | | 35,391,387 | |
| | Enbridge Inc. (USD Traded) | | | Canada | | | | 984,000 | | | | 41,170,560 | |
| | Kinder Morgan Inc. | | | United States | | | | 3,700,000 | | | | 70,966,000 | |
| | Plains GP Holdings LP, A | | | United States | | | | 551,042 | | | | 12,051,289 | |
| | TransCanada Corp. | | | Canada | | | | 1,000,000 | | | | 49,428,926 | |
| | | | |
| franklintempleton.com | | Annual Report | | 91 |
FRANKLIN CUSTODIAN FUNDS
STATEMENT OF INVESTMENTS
Franklin Utilities Fund (continued)
| | | | | | | | | | | | | | |
| | | | | Country | | | Shares | | | Value | |
| | Common Stocks (continued) | | | | | | | | | | | | |
| | Oil, Gas & Consumable Fuels (continued) | | | | | | | | | | | | |
| | The Williams Cos. Inc. | | | United States | | | | 1,800,000 | | | $ | 54,018,000 | |
| | | | | | | | | | | | | 276,538,162 | |
| | Water Utilities 3.4% | | | | | | | | | | | | |
| | American Water Works Co. Inc. | | | United States | | | | 1,800,000 | | | | 145,638,000 | |
| | United Utilities Group PLC | | | United Kingdom | | | | 6,700,000 | | | | 76,722,732 | |
| | | | | | | | | | | | | 222,360,732 | |
| | Total Common Stocks (Cost $3,540,647,941) | | | | | | | | | | | 6,386,101,202 | |
| | | | |
| | | | | | | | Principal
Amount | | | | |
| | Corporate Bonds 0.8% | | | | | | | | | | | | |
| | Electric Utilities 0.1% | | | | | | | | | | | | |
| | Northeast Generation Co., senior secured note, B-1, 8.812%, 10/15/26 | | | United States | | | $ | 5,789,062 | | | | 6,047,867 | |
| | Multi-Utilities 0.7% | | | | | | | | | | | | |
| | Aquila Inc., senior note, 8.27%, 11/15/21 | | | United States | | | | 6,100,000 | | | | 7,122,477 | |
| | MidAmerican Energy Holdings Co., senior note, 8.48%, 9/15/28 | | | United States | | | | 25,000,000 | | | | 36,642,090 | |
| | | | | | | | | | | | | 43,764,567 | |
| | Total Corporate Bonds (Cost $36,984,076) | | | | | | | | | | | 49,812,434 | |
| | Total Investments before Short Term Investments
(Cost $3,577,632,017) | | | | | | | | | | | 6,435,913,636 | |
| | | | |
| | | | | | | | | Shares | | | | | |
| | Short Term Investments (Cost $21,127,106) 0.3% | | | | | | | | | | | | |
| | Money Market Funds 0.3% | | | | | | | | | | | | |
c,d | | Institutional Fiduciary Trust Money Market Portfolio, 0.67% | | | United States | | | | 21,127,106 | | | | 21,127,106 | |
| | Total Investments (Cost $3,598,759,123) 99.9% | | | | | | | | | | | 6,457,040,742 | |
| | Other Assets, less Liabilities 0.1% | | | | | | | | | | | 6,401,379 | |
| | Net Assets 100.0% | | | | | | | | | | $ | 6,463,442,121 | |
See Abbreviations on page 124.
aSecurity was purchased pursuant to Rule 144A under the Securities Act of 1933 and may be sold in transactions exempt from registration only to qualified institutional buyers or in a public offering registered under the Securities Act of 1933. This security has been deemed liquid under guidelines approved by the Trust’s Board of Trustees. At September 30, 2017, the value of this security was $36,420,470, representing 0.6% of net assets.
bNon-income producing.
cSee Note 3(f) regarding investments in affiliated management investment companies.
dThe rate shown is the annualized seven-day yield at period end.
| | | | | | |
| 92 | | Annual Report | The accompanying notes are an integral part of these financial statements. | | | franklintempleton.com | |
FRANKLIN CUSTODIAN FUNDS
Financial Statements
Statements of Assets and Liabilities
September 30, 2017
| | | | | | | | | | | | |
| | | Franklin
DynaTech Fund | | | Franklin Growth Fund | | | Franklin Income Fund | |
Assets: | | | | | | | | | | | | |
*Investments in securities: | | | | | | | | | | | | |
Cost - Unaffiliated issuers | | | $2,005,307,715 | | | $ | 5,305,559,076 | | | $ | 71,229,905,224 | |
Cost - Controlled affiliates (Note 3f and 10) | | | — | | | | — | | | | 299,450,538 | |
Cost - Non-controlled affiliates (Note 3f and 10) | | | 90,584,258 | | | | 331,780,723 | | | | 5,643,890,437 | |
Cost - Unaffiliated repurchase agreements | | | — | | | | — | | | | 8,589,837 | |
Value - Unaffiliated issuers | | | $3,995,478,639 | | | $ | 13,667,813,359 | | | $ | 77,916,687,510 | |
Value - Controlled affiliates (Note 3f and 10) | | | — | | | | — | | | | 249,419,931 | |
Value - Non-controlled affiliates (Note 3f and 10) | | | 90,584,258 | | | | 331,780,723 | | | | 5,036,845,900 | |
Value - Unaffiliated repurchase agreements | | | — | | | | — | | | | 8,589,837 | |
Cash | | | — | | | | 886,966 | | | | 18,200,501 | |
Receivables: | | | | | | | | | | | | |
Investment securities sold | | | — | | | | — | | | | 426,886,134 | |
Capital shares sold | | | 13,767,489 | | | | 32,972,519 | | | | 73,292,784 | |
Dividends and interest | | | 1,303,830 | | | | 7,401,031 | | | | 722,538,539 | |
Other assets | | | 1,154 | | | | 4,710 | | | | 1,822,986 | |
Total assets | | | 4,101,135,370 | | | | 14,040,859,308 | | | | 84,454,284,122 | |
Liabilities: | | | | | | | | | | | | |
Payables: | | | | | | | | | | | | |
Investment securities purchased | | | — | | | | — | | | | 806,027,427 | |
Capital shares redeemed | | | 4,904,971 | | | | 30,590,591 | | | | 97,268,756 | |
Management fees | | | 1,527,403 | | | | 5,056,106 | | | | 24,609,134 | |
Distribution fees | | | 1,670,431 | | | | 5,284,611 | | | | 36,705,195 | |
Transfer agent fees | | | 1,444,429 | | | | 4,543,018 | | | | 15,881,299 | |
Options written, at value (premiums received $—, $— and $11,895,315, respectively) | | | — | | | | — | | | | 15,015,000 | |
Payable upon return of securities loaned | | | — | | | | — | | | | 62,241,837 | |
Unrealized depreciation on unfunded loan commitments (Note 8) | | | — | | | | — | | | | 1,875,000 | |
Accrued expenses and other liabilities | | | 224,839 | | | | 529,886 | | | | 3,400,007 | |
Total liabilities | | | 9,772,073 | | | | 46,004,212 | | | | 1,063,023,655 | |
Net assets, at value | | | $4,091,363,297 | | | $ | 13,994,855,096 | | | $ | 83,391,260,467 | |
Net assets consist of: | | | | | | | | | | | | |
Paid-in capital | | | $2,039,048,264 | | | $ | 5,342,910,800 | | | $ | 83,103,075,830 | |
Accumulated net investment loss | | | (8,477,093 | ) | | | — | | | | — | |
Undistributed net investment income | | | — | | | | 37,243,783 | | | | — | |
Distributions in excess of net investment income | | | — | | | | — | | | | (74,871,430 | ) |
Net unrealized appreciation (depreciation) | | | 1,990,174,138 | | | | 8,362,254,254 | | | | 6,025,763,482 | |
Accumulated net realized gain (loss) | | | 70,617,988 | | | | 252,446,259 | | | | (5,662,707,415 | ) |
Net assets, at value | | | $4,091,363,297 | | | $ | 13,994,855,096 | | | $ | 83,391,260,467 | |
| | | |
*Includes securities loaned | | | $ — | | | $ | — | | | $ | 60,273,483 | |
| | | | |
| franklintempleton.com | | The accompanying notes are an integral part of these financial statements. | Annual Report | | 93 |
FRANKLIN CUSTODIAN FUNDS
FINANCIAL STATEMENTS
Statements of Assets and Liabilities (continued)
September 30, 2017
| | | | | | | | | | | | |
| | | Franklin
DynaTech Fund | | | Franklin Growth Fund | | | Franklin Income Fund | |
| Class A: | | | | | | | | | |
Net assets, at value | | | $2,498,393,358 | | | | $8,051,641,230 | | | | $46,505,632,307 | |
Shares outstanding | | | 39,594,287 | | | | 87,889,713 | | | | 19,446,004,976 | |
Net asset value per sharea | | | $63.10 | | | | $91.61 | | | | $2.39 | |
Maximum offering price per share (net asset value per share ÷ 94.25%, 94.25% and 95.75%, respectively) | | | $66.95 | | | | $97.20 | | | | $2.50 | |
| Class C: | | | | | | | | | |
Net assets, at value | | | $ 374,502,022 | | | | $ 930,751,467 | | | | $23,036,875,378 | |
Shares outstanding | | | 7,001,396 | | | | 11,046,994 | | | | 9,511,982,117 | |
Net asset value and maximum offering price per sharea | | | $53.49 | | | | $84.25 | | | | $2.42 | |
| Class R: | | | | | | | | | |
Net assets, at value | | | $ 47,859,940 | | | | $ 510,316,553 | | | | $ 361,603,109 | |
Shares outstanding | | | 778,096 | | | | 5,599,950 | | | | 153,948,483 | |
Net asset value and maximum offering price per share | | | $61.51 | | | | $91.13 | | | | $2.35 | |
| Class R6: | | | | | | | | | |
Net assets, at value | | | $ 457,845,630 | | | | $1,700,992,712 | | | | $ 1,815,976,673 | |
Shares outstanding | | | 7,013,872 | | | | 18,508,496 | | | | 765,086,210 | |
Net asset value and maximum offering price per share | | | $65.28 | | | | $91.90 | | | | $2.37 | |
| Advisor Class: | | | | | | | | | |
Net assets, at value | | | $ 712,762,347 | | | | $2,801,153,134 | | | | $11,671,173,000 | |
Shares outstanding | | | 11,003,291 | | | | 30,480,223 | | | | 4,919,769,903 | |
Net asset value and maximum offering price per share | | | $64.78 | | | | $91.90 | | | | $2.37 | |
aRedemption price is equal to net asset value less contingent deferred sales charges, if applicable.
| | | | | | |
| 94 | | Annual Report | The accompanying notes are an integral part of these financial statements. | | | franklintempleton.com | |
FRANKLIN CUSTODIAN FUNDS
FINANCIAL STATEMENTS
Statements of Assets and Liabilities (continued)
September 30, 2017
| | | | | | | | |
| | | Franklin U.S. Government Securities Fund | | | Franklin Utilities Fund | |
Assets: | | | | | | | | |
Investments in securities: | | | | | | | | |
Cost - Unaffiliated issuers | | | $5,538,822,540 | | | | $3,577,632,017 | |
Cost - Non-controlled affiliates (Note 3f and 10) | | | 90,681,295 | | | | 21,127,106 | |
Value - Unaffiliated issuers | | | $5,646,007,384 | | | | $6,435,913,636 | |
Value - Non-controlled affiliates (Note 3f and 10) | | | 90,681,295 | | | | 21,127,106 | |
Receivables: | | | | | | | | |
Capital shares sold | | | 5,198,045 | | | | 6,536,138 | |
Dividends and interest | | | 17,705,079 | | | | 14,505,121 | |
Other assets | | | 2,385 | | | | 2,347 | |
Total assets | | | 5,759,594,188 | | | | 6,478,084,348 | |
Liabilities: | | | | | | | | |
Payables: | | | | | | | | |
Investment securities purchased | | | 26,189,838 | | | | — | |
Capital shares redeemed | | | 6,797,566 | | | | 7,738,234 | |
Management fees | | | 2,134,470 | | | | 2,437,849 | |
Distribution fees | | | 1,799,765 | | | | 2,249,666 | |
Transfer agent fees | | | 2,129,784 | | | | 1,928,982 | |
Distributions to shareholders | | | 1,732,665 | | | | — | |
Accrued expenses and other liabilities | | | 470,926 | | | | 287,496 | |
Total liabilities | | | 41,255,014 | | | | 14,642,227 | |
Net assets, at value | | | $5,718,339,174 | | | | $6,463,442,121 | |
Net assets consist of: | | | | | | | | |
Paid-in capital | | | $6,137,076,121 | | | | $3,509,010,987 | |
Undistributed net investment income | | | — | | | | 19,836,444 | |
Distributions in excess of net investment income | | | (1,086,491 | ) | | | — | |
Net unrealized appreciation (depreciation) | | | 107,184,844 | | | | 2,858,281,432 | |
Accumulated net realized gain (loss) | | | (524,835,300 | ) | | | 76,313,258 | |
Net assets, at value | | | $5,718,339,174 | | | | $6,463,442,121 | |
| | | | | | |
| franklintempleton.com | | The accompanying notes are an integral part of these financial statements. | Annual Report | | | 95 | |
FRANKLIN CUSTODIAN FUNDS
FINANCIAL STATEMENTS
Statements of Assets and Liabilities (continued)
September 30, 2017
| | | | | | | | |
| | | Franklin U.S. Government Securities Fund | | | Franklin Utilities Fund | |
Class A: | | | | | | | | |
Net assets, at value | | | $3,581,768,716 | | | | $4,182,779,606 | |
Shares outstanding | | | 584,685,172 | | | | 218,034,029 | |
Net asset value per sharea | | | $6.13 | | | | $19.18 | |
Maximum offering price per share (net asset value per share ÷ 95.75%) | | | $6.40 | | | | $20.03 | |
Class C: | | | | | | | | |
Net assets, at value | | | $ 797,393,799 | | | | $ 981,514,902 | |
Shares outstanding | | | 131,085,703 | | | | 51,420,940 | |
Net asset value and maximum offering price per sharea | | | $6.08 | | | | $19.09 | |
Class R: | | | | | | | | |
Net assets, at value | | | $ 38,363,018 | | | | $ 94,464,623 | |
Shares outstanding | | | 6,266,296 | | | | 4,942,452 | |
Net asset value and maximum offering price per share | | | $6.12 | | | | $19.11 | |
Class R6: | | | | | | | | |
Net assets, at value | | | $ 446,173,537 | | | | $ 241,455,442 | |
Shares outstanding | | | 72,597,405 | | | | 12,495,641 | |
Net asset value and maximum offering price per share | | | $6.15 | | | | $19.32 | |
Advisor Class: | | | | | | | | |
Net assets, at value | | | $ 854,640,104 | | | | $ 963,227,548 | |
Shares outstanding | | | 139,037,815 | | | | 49,844,364 | |
Net asset value and maximum offering price per share | | | $6.15 | | | | $19.32 | |
aRedemption price is equal to net asset value less contingent deferred sales charges, if applicable.
| | | | |
| 96 | | Annual Report | The accompanying notes are an integral part of these financial statements. | | franklintempleton.com |
FRANKLIN CUSTODIAN FUNDS
FINANCIAL STATEMENTS
Statements of Operations
for the year ended September 30, 2017
| | | | | | | | | | | | |
| | | Franklin DynaTech Fund | | | Franklin Growth Fund | | | Franklin Income Fund | |
Investment income: | | | | | | | | | | | | |
Dividends: | | | | | | | | | | | | |
Unaffiliated issuers | | | $ 19,461,639 | | | | $171,382,005 | | | | $1,525,662,981 | |
Non-controlled affiliates (Note 3f and 10) | | | 283,808 | | | | 1,394,451 | | | | 9,671,724 | |
Interest: | | | | | | | | | | | | |
Unaffiliated issuers: | | | | | | | | | | | | |
Payment-in-kind | | | — | | | | — | | | | 115,518,557 | |
Paid in cash | | | — | | | | — | | | | 2,237,573,401 | |
Controlled affiliates: (Note 10) | | | | | | | | | | | | |
Payment-in-kind | | | — | | | | — | | | | 11,505,833 | |
Paid in cash | | | — | | | | — | | | | 3,156,641 | |
Non-controlled affiliates: (Note 10) | | | | | | | | | | | | |
Paid in cash | | | — | | | | — | | | | 45,452,264 | |
Income from securities loaned (net of fees and rebates) | | | — | | | | — | | | | 2,362,586 | |
Total investment income | | | 19,745,447 | | | | 172,776,456 | | | | 3,950,903,987 | |
Expenses: | | | | | | | | | | | | |
Management fees (Note 3a) | | | 15,614,635 | | | | 57,517,599 | | | | 303,943,763 | |
Distribution fees: (Note 3c) | | | | | | | | | | | | |
Class A | | | 5,454,004 | | | | 19,176,481 | | | | 68,906,177 | |
Class C | | | 3,263,162 | | | | 8,821,564 | | | | 153,336,882 | |
Class R | | | 199,707 | | | | 2,447,993 | | | | 1,912,246 | |
Transfer agent fees: (Note 3e) | | | | | | | | | | | | |
Class A | | | 3,962,490 | | | | 12,985,362 | | | | 38,807,897 | |
Class C | | | 593,670 | | | | 1,493,348 | | | | 19,929,304 | |
Class R | | | 72,677 | | | | 830,196 | | | | 323,969 | |
Class R6 | | | 2,583 | | | | 9,666 | | | | 22,668 | |
Advisor Class | | | 749,483 | | | | 4,004,580 | | | | 8,444,694 | |
Custodian fees (Note 4) | | | 63,529 | | | | 162,787 | | | | 1,106,871 | |
Reports to shareholders | | | 344,131 | | | | 864,385 | | | | 4,448,597 | |
Registration and filing fees | | | 284,129 | | | | 352,215 | | | | 1,104,754 | |
Professional fees | | | 68,758 | | | | 171,970 | | | | 4,135,221 | |
Trustees’ fees and expenses | | | 12,262 | | | | 48,615 | | | | 326,686 | |
Other | | | 61,416 | | | | 224,202 | | | | 2,019,614 | |
Total expenses | | | 30,746,636 | | | | 109,110,963 | | | | 608,769,343 | |
Expense reductions (Note 4) | | | (18 | ) | | | (425 | ) | | | (95,246 | ) |
Expenses waived/paid by affiliates (Note 3f) | | | (227,720 | ) | | | (1,699,908 | ) | | | (8,430,876 | ) |
Net expenses | | | 30,518,898 | | | | 107,410,630 | | | | 600,243,221 | |
Net investment income (loss) | | | (10,773,451 | ) | | | 65,365,826 | | | | 3,350,660,766 | |
Realized and unrealized gains (losses): | | | | | | | | | | | | |
Net realized gain (loss) from: | | | | | | | | | | | | |
Investments: | | | | | | | | | | | | |
Unaffiliated issuers | | | 110,308,000 | | | | 281,253,486 | | | | 2,075,992,476 | |
Non-controlled affiliates (Note 3f and 10) | | | — | | | | — | | | | (280,796,304 | ) |
Written options | | | — | | | | — | | | | 63,267,270 | |
Foreign currency transactions | | | 43,134 | | | | 29,194 | | | | 1,932,458 | |
Net realized gain (loss) | | | 110,351,134 | | | | 281,282,680 | | | | 1,860,395,900 | |
| | | | | | |
| franklintempleton.com | | The accompanying notes are an integral part of these financial statements. | Annual Report | | | 97 | |
FRANKLIN CUSTODIAN FUNDS
FINANCIAL STATEMENTS
Statements of Operations (continued)
for the year ended September 30, 2017
| | | | | | | | | | | | |
| | | Franklin DynaTech Fund | | | Franklin Growth Fund | | | Franklin Income Fund | |
Net change in unrealized appreciation (depreciation) on: | | | | | | | | | | | | |
Investments: | | | | | | | | | | | | |
Unaffiliated issuers | | | $687,870,931 | | | | $2,130,736,345 | | | | $4,031,266,921 | |
Controlled affiliates (Note 3f and 10) | | | — | | | | — | | | | (50,030,607 | ) |
Non-controlled affiliates (Note 3f and 10) | | | — | | | | — | | | | 7,816,700 | |
Translation of other assets and liabilities denominated in foreign currencies | | | 3,061 | | | | 781 | | | | 1,244,129 | |
Written options | | | — | | | | — | | | | (11,689,377 | ) |
Net change in unrealized appreciation (depreciation) | | | 687,873,992 | | | | 2,130,737,126 | | | | 3,978,607,766 | |
Net realized and unrealized gain (loss) | | | 798,225,126 | | | | 2,412,019,806 | | | | 5,839,003,666 | |
Net increase (decrease) in net assets resulting from operations | | | $787,451,675 | | | | $2,477,385,632 | | | | $9,189,664,432 | |
| | | | |
| 98 | | Annual Report | The accompanying notes are an integral part of these financial statements. | | franklintempleton.com |
FRANKLIN CUSTODIAN FUNDS
FINANCIAL STATEMENTS
Statements of Operations (continued)
for the year ended September 30, 2017
| | | | | | | | |
| | | Franklin U.S. Government Securities Fund | | | Franklin Utilities Fund | |
Investment income: | | | | | | | | |
Dividends: | | | | | | | | |
Unaffiliated issuers | | | $ — | | | | $224,828,323 | |
Non-controlled affiliates (Note 3f and 10) | | | 264,427 | | | | 93,338 | |
Interest: | | | | | | | | |
Unaffiliated issuers: | | | | | | | | |
Paydown gain (loss) | | | (51,219,680 | ) | | | — | |
Paid in cash | | | 231,173,433 | | | | 3,123,687 | |
Total investment income. | | | 180,218,180 | | | | 228,045,348 | |
Expenses: | | | | | | | | |
Management fees (Note 3a) | | | 27,475,385 | | | | 28,816,733 | |
Distribution fees: (Note 3c) | | | | | | | | |
Class A | | | 5,724,929 | | | | 6,180,115 | |
Class C | | | 5,876,910 | | | | 6,610,997 | |
Class R | | | 238,864 | | | | 489,289 | |
Transfer agent fees: (Note 3e) | | | | | | | | |
Class A | | | 6,135,194 | | | | 5,204,583 | |
Class C | | | 1,440,681 | | | | 1,284,856 | |
Class R | | | 76,844 | | | | 123,747 | |
Class R6 | | | 3,637 | | | | 16,956 | |
Advisor Class | | | 1,252,956 | | | | 1,059,016 | |
Custodian fees (Note 4) | | | 52,105 | | | | 83,284 | |
Reports to shareholders | | | 408,979 | | | | 444,830 | |
Registration and filing fees | | | 186,170 | | | | 180,668 | |
Professional fees | | | 97,313 | | | | 89,828 | |
Trustees’ fees and expenses | | | 24,608 | | | | 24,610 | |
Other | | | 1,102,517 | | | | 108,059 | |
Total expenses | | | 50,097,092 | | | | 50,717,571 | |
Expense reductions (Note 4) | | | (1,258 | ) | | | (2,009 | ) |
Expenses waived/paid by affiliates (Note 3f) | | | (284,700 | ) | | | (93,495 | ) |
Net expenses | | | 49,811,134 | | | | 50,622,067 | |
Net investment income | | | 130,407,046 | | | | 177,423,281 | |
Realized and unrealized gains (losses): | | | | | | | | |
Net realized gain (loss) from: | | | | | | | | |
Investments: | | | | | | | | |
Unaffiliated issuers | | | (63,379,288 | ) | | | 88,670,184 | |
Foreign currency transactions | | | — | | | | (184,079 | ) |
Net realized gain (loss) | | | (63,379,288 | ) | | | 88,486,105 | |
Net change in unrealized appreciation (depreciation) on: | | | | | | | | |
Investments: | | | | | | | | |
Unaffiliated issuers | | | (107,534,558 | ) | | | 349,741,899 | |
Translation of other assets and liabilities denominated in foreign currencies | | | — | | | | (2,799 | ) |
Net change in unrealized appreciation (depreciation) | | | (107,534,558 | ) | | | 349,739,100 | |
Net realized and unrealized gain (loss) | | | (170,913,846 | ) | | | 438,225,205 | |
Net increase (decrease) in net assets resulting from operations | | | $ (40,506,800 | ) | | | $615,648,486 | |
| | | | | | |
| franklintempleton.com | | The accompanying notes are an integral part of these financial statements. | Annual Report | | | 99 | |
FRANKLIN CUSTODIAN FUNDS
FINANCIAL STATEMENTS
Statements of Changes in Net Assets
| | | | | | | | | | | | | | | | |
| | | Franklin DynaTech Fund | | | Franklin Growth Fund | |
| | | Year Ended September 30, | | | Year Ended September 30, | |
| | | 2017 | | | 2016 | | | 2017 | | | 2016 | |
Increase (decrease) in net assets: | | | | | | | | | | | | | | | | |
Operations: | | | | | | | | | | | | | | | | |
Net investment income (loss) | | $ | (10,773,451 | ) | | $ | (9,206,276 | ) | | $ | 65,365,826 | | | $ | 75,775,891 | |
Net realized gain (loss) | | | 110,351,134 | | | | 60,919,154 | | | | 281,282,680 | | | | 403,618,703 | |
Net change in unrealized appreciation (depreciation) | | | 687,873,992 | | | | 365,745,675 | | | | 2,130,737,126 | | | | 915,148,381 | |
Net increase (decrease) in net assets resulting from operations | | | 787,451,675 | | | | 417,458,553 | | | | 2,477,385,632 | | | | 1,394,542,975 | |
Distributions to shareholders from: | | | | | | | | | | | | | | | | |
Net investment income: | | | | | | | | | | | | | | | | |
Class A | | | — | | | | — | | | | (36,895,906 | ) | | | (47,314,338 | ) |
Class R | | | — | | | | — | | | | (1,230,882 | ) | | | (1,070,343 | ) |
Class R6 | | | — | | | | — | | | | (11,177,576 | ) | | | (13,934,302 | ) |
Advisor Class | | | — | | | | — | | | | (15,699,120 | ) | | | (14,692,811 | ) |
Net realized gains: | | | | | | | | | | | | | | | | |
Class A | | | (67,256,053 | ) | | | (50,280,433 | ) | | | (234,479,371 | ) | | | (236,451,446 | ) |
Class C | | | (11,758,906 | ) | | | (8,550,949 | ) | | | (28,670,653 | ) | | | (27,988,492 | ) |
Class R | | | (1,284,067 | ) | | | (1,147,436 | ) | | | (14,987,347 | ) | | | (15,909,617 | ) |
Class R6 | | | (11,046,724 | ) | | | (9,395,944 | ) | | | (38,880,082 | ) | | | (38,078,959 | ) |
Advisor Class | | | (7,824,210 | ) | | | (4,536,946 | ) | | | (64,547,148 | ) | | | (49,398,589 | ) |
Total distributions to shareholders | | | (99,169,960 | ) | | | (73,911,708 | ) | | | (446,568,085 | ) | | | (444,838,897 | ) |
Capital share transactions: (Note 2) | | | | | | | | | | | | | | | | |
Class A | | | (58,619,051 | ) | | | 22,189,136 | | | | (775,062,897 | ) | | | (162,965,732 | ) |
Class C | | | (5,464,905 | ) | | | 15,466,910 | | | | (50,580,939 | ) | | | 6,510,834 | |
Class R | | | 1,319,443 | | | | (8,874,020 | ) | | | (43,562,140 | ) | | | (63,665,280 | ) |
Class R6 | | | 11,234,886 | | | | (47,875,928 | ) | | | 215,211,021 | | | | (12,272,599 | ) |
Advisor Class | | | 410,822,596 | | | | 9,087,518 | | | | 419,014,663 | | | | 338,804,621 | |
Total capital share transactions | | | 359,292,969 | | | | (10,006,384 | ) | | | (234,980,292 | ) | | | 106,411,844 | |
Net increase (decrease) in net assets | | | 1,047,574,684 | | | | 333,540,461 | | | | 1,795,837,255 | | | | 1,056,115,922 | |
Net assets: | | | | | | | | | | | | | | | | |
Beginning of year | | | 3,043,788,613 | | | | 2,710,248,152 | | | | 12,199,017,841 | | | | 11,142,901,919 | |
End of year | | $ | 4,091,363,297 | | | $ | 3,043,788,613 | | | $ | 13,994,855,096 | | | $ | 12,199,017,841 | |
Undistributed net investment income (loss) included in net assets: | | | | | | | | | | | | | | | | |
End of year | | $ | — | | | $ | — | | | $ | 37,243,783 | | | $ | 36,852,247 | |
Accumulated net investment loss included in net assets: | | | | | | | | | | | | | | | | |
End of year | | $ | (8,477,093 | ) | | $ | (7,486,842 | ) | | $ | — | | | $ | — | |
| | | | |
| 100 | | Annual Report | The accompanying notes are an integral part of these financial statements. | | franklintempleton.com |
FRANKLIN CUSTODIAN FUNDS
FINANCIAL STATEMENTS
Statements of Changes in Net Assets (continued)
| | | | | | | | | | | | | | | | |
| | | Franklin Income Fund | | | Franklin U.S. Government Securities Fund | |
| | | Year Ended September 30, | | | Year Ended September 30, | |
| | | 2017 | | | 2016 | | | 2017 | | | 2016 | |
Increase (decrease) in net assets: | | | | | | | | | | | | | | | | |
Operations: | | | | | | | | | | | | | | | | |
Net investment income | | $ | 3,350,660,766 | | | $ | 3,438,938,686 | | | | $ 130,407,046 | | | | $ 139,492,462 | |
Net realized gain (loss) | | | 1,860,395,900 | | | | (1,282,009,421 | ) | | | (63,379,288 | ) | | | 10,586,197 | |
Net change in unrealized appreciation (depreciation) | | | 3,978,607,766 | | | | 7,225,707,762 | | | | (107,534,558 | ) | | | (6,613,115 | ) |
Net increase (decrease) in net assets resulting from operations | | | 9,189,664,432 | | | | 9,382,637,027 | | | | (40,506,800 | ) | | | 143,465,544 | |
Distributions to shareholders from: | | | | | | | | | | | | | | | | |
Net investment income: | | | | | | | | | | | | | | | | |
Class A | | | (2,378,392,172 | ) | | | (2,485,275,665 | ) | | | (117,543,709 | ) | | | (131,450,457 | ) |
Class C | | | (1,087,030,360 | ) | | | (1,181,223,007 | ) | | | (23,194,188 | ) | | | (27,370,513 | ) |
Class R | | | (18,864,554 | ) | | | (21,375,115 | ) | | | (1,294,613 | ) | | | (1,712,479 | ) |
Class R6 | | | (95,303,179 | ) | | | (101,566,652 | ) | | | (16,694,015 | ) | | | (16,335,592 | ) |
Advisor Class | | | (524,726,253 | ) | | | (434,811,841 | ) | | | (25,402,172 | ) | | | (21,257,710 | ) |
Total distributions to shareholders | | | (4,104,316,518 | ) | | | (4,224,252,280 | ) | | | (184,128,697 | ) | | | (198,126,751 | ) |
Capital share transactions: (Note 2) | | | | | | | | | | | | | | | | |
Class A | | | (1,869,610,539 | ) | | | (2,328,656,181 | ) | | | (511,968,136 | ) | | | 103,644,563 | |
Class C | | | (2,293,654,717 | ) | | | (1,818,661,369 | ) | | | (202,855,335 | ) | | | 3,123,563 | |
Class R | | | (58,209,535 | ) | | | (46,109,223 | ) | | | (19,433,072 | ) | | | (4,370,596 | ) |
Class R6 | | | (32,346,017 | ) | | | (116,842,625 | ) | | | (159,062,673 | ) | | | 253,127,815 | |
Advisor Class | | | 2,925,976,903 | | | | (107,969,590 | ) | | | 162,685,038 | | | | 102,139,643 | |
Total capital share transactions | | | (1,327,843,905 | ) | | | (4,418,238,988 | ) | | | (730,634,178 | ) | | | 457,664,988 | |
Net increase (decrease) in net assets | | | 3,757,504,009 | | | | 740,145,759 | | | | (955,269,675 | ) | | | 403,003,781 | |
Net assets: | | | | | | | | | | | | | | | | |
Beginning of year | | | 79,633,756,458 | | | | 78,893,610,699 | | | | 6,673,608,849 | | | | 6,270,605,068 | |
End of year | | $ | 83,391,260,467 | | | $ | 79,633,756,458 | | | | $5,718,339,174 | | | | $6,673,608,849 | |
Undistributed net investment income included in net assets: | | | | | | | | | | | | | | | | |
End of year | | $ | — | | | $ | — | | | | $ — | | | | $ 367,575 | |
Distributions in excess of net investment income included in net assets: | | | | | | | | | | | | | | | | |
End of year | | $ | (74,871,430 | ) | | $ | (70,346,158 | ) | | | $ (1,086,491 | ) | | | $ — | |
| | | | | | |
| franklintempleton.com | | The accompanying notes are an integral part of these financial statements. | Annual Report | | | 101 | |
FRANKLIN CUSTODIAN FUNDS
FINANCIAL STATEMENTS
Statements of Changes in Net Assets (continued)
| | | | | | | | |
| | | Franklin Utilities Fund | |
| | | Year Ended September 30, | |
| | | 2017 | | | 2016 | |
Increase (decrease) in net assets: | | | | | | | | |
Operations: | | | | | | | | |
Net investment income | | $ | 177,423,281 | | | $ | 160,415,989 | |
Net realized gain (loss) | | | 88,486,105 | | | | 10,054,627 | |
Net change in unrealized appreciation (depreciation) | | | 349,739,100 | | | | 775,675,049 | |
Net increase (decrease) in net assets resulting from operations | | | 615,648,486 | | | | 946,145,665 | |
Distributions to shareholders from: | | | | | | | | |
Net investment income: | | | | | | | | |
Class A | | | (108,430,003 | ) | | | (112,834,284 | ) |
Class C | | | (21,699,670 | ) | | | (24,515,967 | ) |
Class R | | | (2,242,163 | ) | | | (2,379,943 | ) |
Class R6 | | | (6,694,467 | ) | | | (7,365,000 | ) |
Advisor Class | | | (23,372,926 | ) | | | (19,769,621 | ) |
Net realized gains: | | | | | | | | |
Class A | | | (2,346,125 | ) | | | (112,737,319 | ) |
Class C | | | (595,960 | ) | | | (29,873,670 | ) |
Class R | | | (58,199 | ) | | | (2,659,792 | ) |
Class R6 | | | (124,605 | ) | | | (6,346,334 | ) |
Advisor Class | | | (418,502 | ) | | | (17,570,610 | ) |
Total distributions to shareholders | | | (165,982,620 | ) | | | (336,052,540 | ) |
Capital share transactions: (Note 2) | | | | | | | | |
Class A | | | (289,671,581 | ) | | | 250,100,796 | |
Class C | | | (156,252,743 | ) | | | 26,911,855 | |
Class R | | | (15,638,722 | ) | | | 10,837,743 | |
Class R6 | | | 4,295,848 | | | | (5,556,096 | ) |
Advisor Class | | | 148,535,428 | | | | 139,619,686 | |
Total capital share transactions | | | (308,731,770 | ) | | | 421,913,984 | |
Net increase (decrease) in net assets | | | 140,934,096 | | | | 1,032,007,109 | |
Net assets: | | | | | | | | |
Beginning of year | | | 6,322,508,025 | | | | 5,290,500,916 | |
End of year | | $ | 6,463,442,121 | | | $ | 6,322,508,025 | |
Undistributed net investment income included in net assets: | | | | | | | | |
End of year | | $ | 19,836,444 | | | $ | 5,048,906 | |
| | | | |
| 102 | | Annual Report | The accompanying notes are an integral part of these financial statements. | | franklintempleton.com |
FRANKLIN CUSTODIAN FUNDS
Notes to Financial Statements
1. Organization and Significant Accounting Policies
Franklin Custodian Funds (Trust) is registered under the Investment Company Act of 1940 (1940 Act) as an open-end management investment company, consisting of six separate funds, five of which are included in this report (Funds) and applies the specialized accounting and reporting guidance in U.S. Generally Accepted Accounting Principles (U.S. GAAP). The Funds offer five classes of shares: Class A, Class C, Class R, Class R6, and Advisor Class. Each class of shares may differ by its initial sales load, contingent deferred sales charges, voting rights on matters affecting a single class, its exchange privilege and fees due to differing arrangements for distribution and transfer agent fees.
The following summarizes the Funds’ significant accounting policies.
a. Financial Instrument Valuation
The Funds’ investments in financial instruments are carried at fair value daily. Fair value is the price that would be received to sell an asset or paid to transfer a liability in an orderly transaction between market participants on the measurement date. The Funds calculate the net asset value (NAV) per share as of 4 p.m. Eastern time each day the New York Stock Exchange (NYSE) is open for trading. Under compliance policies and procedures approved by the Trust’s Board of Trustees (the Board), the Funds’ administrator has responsibility for oversight of valuation, including leading the cross-functional Valuation Committee (VC). The VC provides administration and oversight of the Funds’ valuation policies and procedures, which are approved annually by the Board. Among other things, these procedures allow the Funds to utilize independent pricing services, quotations from securities and financial instrument dealers, and other market sources to determine fair value.
Equity securities and derivative financial instruments listed on an exchange or on the NASDAQ National Market System are valued at the last quoted sale price or the official closing price of the day, respectively. Foreign equity securities are valued as of the close of trading on the foreign stock exchange on which the security is primarily traded, or as of 4 p.m. Eastern time. The value is then converted into its U.S. dollar equivalent at the foreign exchange rate in effect at 4 p.m. Eastern time on the day that the value of the security is determined. Over-the-counter (OTC) securities are valued within the range of the most recent
quoted bid and ask prices. Securities that trade in multiple markets or on multiple exchanges are valued according to the broadest and most representative market. Certain equity securities are valued based upon fundamental characteristics or relationships to similar securities.
Debt securities generally trade in the OTC market rather than on a securities exchange. The Funds’ pricing services use multiple valuation techniques to determine fair value. In instances where sufficient market activity exists, the pricing services may utilize a market-based approach through which quotes from market makers are used to determine fair value. In instances where sufficient market activity may not exist or is limited, the pricing services also utilize proprietary valuation models which may consider market characteristics such as benchmark yield curves, credit spreads, estimated default rates, anticipated market interest rate volatility, coupon rates, anticipated timing of principal repayments, underlying collateral, and other unique security features in order to estimate the relevant cash flows, which are then discounted to calculate the fair value. Securities denominated in a foreign currency are converted into their U.S. dollar equivalent at the foreign exchange rate in effect at 4 p.m. Eastern time on the date that the values of the foreign debt securities are determined.
Investments in open-end mutual funds are valued at the closing NAV. Investments in repurchase agreements are valued at cost, which approximates fair value.
The Funds have procedures to determine the fair value of financial instruments for which market prices are not reliable or readily available. Under these procedures, the VC convenes on a regular basis to review such financial instruments and considers a number of factors, including significant unobservable valuation inputs, when arriving at fair value. The VC primarily employs a market-based approach which may use related or comparable assets or liabilities, recent transactions, market multiples, book values, and other relevant information for the investment to determine the fair value of the investment. An income-based valuation approach may also be used in which the anticipated future cash flows of the investment are discounted to calculate fair value. Discounts may also be applied due to the nature or duration of any restrictions on the disposition of the investments. Due to the inherent uncertainty of valuations of such investments, the fair values may differ significantly from the values that would have been used had an active market existed. The VC employs various methods for calibrating these valuation approaches including a regular
| | | | |
| franklintempleton.com | | Annual Report | | 103 |
FRANKLIN CUSTODIAN FUNDS
NOTES TO FINANCIAL STATEMENTS
1. Organization and Significant Accounting Policies (continued)
a. Financial Instrument Valuation (continued)
review of key inputs and assumptions, transactional back-testing or disposition analysis, and reviews of any related market activity.
Trading in securities on foreign securities stock exchanges and OTC markets may be completed before 4 p.m. Eastern time. In addition, trading in certain foreign markets may not take place on every Funds’ business day. Occasionally, events occur between the time at which trading in a foreign security is completed and 4 p.m. Eastern time that might call into question the reliability of the value of a portfolio security held by the Fund. As a result, differences may arise between the value of the Funds’ portfolio securities as determined at the foreign market close and the latest indications of value at 4 p.m. Eastern time. In order to minimize the potential for these differences, the VC monitors price movements following the close of trading in foreign stock markets through a series of country specific market proxies (such as baskets of American Depositary Receipts, futures contracts and exchange traded funds). These price movements are measured against established trigger thresholds for each specific market proxy to assist in determining if an event has occurred that may call into question the reliability of the values of the foreign securities held by the Funds. If such an event occurs, the securities may be valued using fair value procedures, which may include the use of independent pricing services.
When the last day of the reporting period is a non-business day, certain foreign markets may be open on those days that the Funds’ NAV is not calculated, which could result in differences between the value of the Funds’ portfolio securities on the last business day and the last calendar day of the reporting period. Any significant security valuation changes due to an open foreign market are adjusted and reflected by the Funds for financial reporting purposes.
b. Foreign Currency Translation
Portfolio securities and other assets and liabilities denominated in foreign currencies are translated into U.S. dollars based on the exchange rate of such currencies against U.S. dollars on the date of valuation. The Funds may enter into foreign currency exchange contracts to facilitate transactions denominated in a foreign currency. Purchases and sales of securities, income and
expense items denominated in foreign currencies are translated into U.S. dollars at the exchange rate in effect on the transaction date. Portfolio securities and assets and liabilities denominated in foreign currencies contain risks that those currencies will decline in value relative to the U.S. dollar. Occasionally, events may impact the availability or reliability of foreign exchange rates used to convert the U.S. dollar equivalent value. If such an event occurs, the foreign exchange rate will be valued at fair value using procedures established and approved by the Board.
The Funds do not separately report the effect of changes in foreign exchange rates from changes in market prices on securities held. Such changes are included in net realized and unrealized gain or loss from investments in the Statements of Operations.
Realized foreign exchange gains or losses arise from sales of foreign currencies, currency gains or losses realized between the trade and settlement dates on securities transactions and the difference between the recorded amounts of dividends, interest, and foreign withholding taxes and the U.S. dollar equivalent of the amounts actually received or paid. Net unrealized foreign exchange gains and losses arise from changes in foreign exchange rates on foreign denominated assets and liabilities other than investments in securities held at the end of the reporting period.
c. Joint Repurchase Agreement
Certain or all Funds enter into a joint repurchase agreement whereby their uninvested cash balance is deposited into a joint cash account with other funds managed by the investment manager or an affiliate of the investment manager and is used to invest in one or more repurchase agreements. The value and face amount of the joint repurchase agreement are allocated to the funds based on their pro-rata interest. A repurchase agreement is accounted for as a loan by the Fund to the seller, collateralized by securities which are delivered to the Funds’ custodian. The fair value, including accrued interest, of the initial collateralization is required to be at least 102% of the dollar amount invested by the funds, with the value of the underlying securities marked to market daily to maintain coverage of at least 100%. Repurchase agreements are subject to the terms of Master Repurchase Agreements (MRAs) with approved counterparties (sellers). The MRAs contain various provisions, including but not limited to events of default and maintenance of collateral for repurchase agreements. In the event of default by either the seller or the Funds, certain MRAs
| | | | |
| 104 | | Annual Report | | franklintempleton.com |
FRANKLIN CUSTODIAN FUNDS
NOTES TO FINANCIAL STATEMENTS
may permit the non-defaulting party to net and close-out all transactions, if any, traded under such agreements. The Funds may sell securities it holds as collateral and apply the proceeds towards the repurchase price and any other amounts owed by the seller to the Funds in the event of default by the seller. This could involve costs or delays in addition to a loss on the securities if their value falls below the repurchase price owed by the seller. The joint repurchase agreement held by the Funds at year end, as indicated in the Statements of Investments, had been entered into on September 29, 2017.
d. Securities Purchased on a When-Issued or Delayed Delivery and TBA Basis
Certain or all Funds purchase securities on a when-issued or delayed delivery and to-be-announced (TBA) basis, with payment and delivery scheduled for a future date. These transactions are subject to market fluctuations and are subject to the risk that the value at delivery may be more or less than the trade date purchase price. Although the Funds will generally purchase these securities with the intention of holding the securities, they may sell the securities before the settlement date. Sufficient assets have been segregated for these securities.
e. Derivative Financial Instruments
Certain or all Funds invested in derivative financial instruments in order to manage risk or gain exposure to various other investments or markets. Derivatives are financial contracts based on an underlying or notional amount, require no initial investment or an initial net investment that is smaller than would normally be required to have a similar response to changes in market factors, and require or permit net settlement. Derivatives contain various risks including the potential inability of the counterparty to fulfill their obligations under the terms of the contract, the potential for an illiquid secondary market, and/or the potential for market movements which expose the Fund to gains or losses in excess of the amounts shown in the Statements of Assets and Liabilities. Realized gain and loss and unrealized appreciation and depreciation on these contracts for the period are included in the Statements of Operations.
Collateral requirements differ by type of derivative. Collateral or initial margin requirements are set by the broker or exchange clearing house for exchange traded and centrally cleared derivatives. Initial margin deposited is held at the exchange and can be in the form of cash and/or securities.
Certain or all Funds purchased or wrote exchange traded option contracts primarily to manage exposure to equity price risk. An option is a contract entitling the holder to purchase or sell a specific amount of shares or units of an asset or notional amount of a swap (swaption), at a specified price. When an option is purchased or written, an amount equal to the premium paid or received is recorded as an asset or liability, respectively. Upon exercise of an option, the acquisition cost or sales proceeds of the underlying investment is adjusted by any premium received or paid. Upon expiration of an option, any premium received or paid is recorded as a realized gain or loss. Upon closing an option other than through expiration or exercise, the difference between the premium received or paid and the cost to close the position is recorded as a realized gain or loss.
See Note 9 regarding other derivative information.
f. Equity-Linked Securities
Certain or all Funds invest in equity-linked securities. Equity-linked securities are hybrid financial instruments that generally combine both debt and equity characteristics into a single note form. Income received from equity-linked securities is recorded as realized gains in the Statements of Operations and may be based on the performance of an underlying equity security, an equity index, or an option position. The risks of investing in equity-linked securities include unfavorable price movements in the underlying security and the credit risk of the issuing financial institution. There may be no guarantee of a return of principal with equity-linked securities and the appreciation potential may be limited. Equity-linked securities may be more volatile and less liquid than other investments held by the Funds.
g. Securities Lending
Certain or all Funds participate in an agency based securities lending program to earn additional income. The Fund receives cash collateral against the loaned securities in an amount equal to at least 102% of the fair value of the loaned securities. Collateral is maintained over the life of the loan in an amount not less than 100% of the fair value of loaned securities, as determined at the close of Fund business each day; any additional collateral required due to changes in security values is delivered to the Fund on the next business day. The collateral is deposited into a joint cash account with other funds and is used to invest in a money market fund managed by Franklin Advisers, Inc., an affiliate of the Funds, and/or a joint repurchase agreement. The Fund may receive income from the
| | | | |
| franklintempleton.com | | Annual Report | | 105 |
FRANKLIN CUSTODIAN FUNDS
NOTES TO FINANCIAL STATEMENTS
1. Organization and Significant Accounting Policies (continued)
g. Securities Lending (continued)
investment of cash collateral, in addition to lending fees and rebates paid by the borrower. Income from securities loaned, net of fees paid to the securities lending agent and/or third-party vendor, is reported separately in the Statements of Operations. The Fund bears the market risk with respect to the collateral investment, securities loaned, and the risk that the agent may default on its obligations to the Fund. If the borrower defaults on its obligation to return the securities loaned, the Fund has the right to repurchase the securities in the open market using the collateral received. The securities lending agent has agreed to indemnify the Fund in the event of default by a third party borrower.
h. Mortgage Dollar Rolls
Certain or all Funds enter into mortgage dollar rolls, typically on a TBA basis. Mortgage dollar rolls are agreements between the Fund and a financial institution where the Fund sells (or buys) mortgage-backed securities for delivery on a specified date and simultaneously contracts to repurchase (or sell) substantially similar (same type, coupon, and maturity) securities at a future date and at a predetermined price. Gains or losses are realized on the initial sale, and the difference between the repurchase price and the sale price is recorded as an unrealized gain or loss to the Fund upon entering into the mortgage dollar roll. In addition, the Fund may invest the cash proceeds that are received from the initial sale. During the period between the sale and repurchase, the Fund is not entitled to principal and interest paid on the mortgage backed securities. Transactions in mortgage dollar rolls are accounted for as purchases and sales and may result in an increase to the Fund’s portfolio turnover rate. The risks of mortgage dollar roll transactions include the potential inability of the counterparty to fulfill its obligations.
i. Senior Floating Rate Interests
Certain or all Funds invest in senior secured corporate loans that pay interest at rates which are periodically reset by reference to a base lending rate plus a spread. These base lending rates are generally the prime rate offered by a designated U.S. bank or the London InterBank Offered Rate (LIBOR). Senior secured corporate loans often require prepayment of principal from excess cash flows or at the discretion of the borrower. As a
result, actual maturity may be substantially less than the stated maturity. Senior secured corporate loans in which the Funds invest are generally readily marketable, but may be subject to certain restrictions on resale.
j. Income and Deferred Taxes
It is each Fund’s policy to qualify as a regulated investment company under the Internal Revenue Code. Each Fund intends to distribute to shareholders substantially all of its taxable income and net realized gains to relieve it from federal income and excise taxes. As a result, no provision for U.S. federal income taxes is required.
The Funds may be subject to foreign taxation related to income received, capital gains on the sale of securities and certain foreign currency transactions in the foreign jurisdictions in which the Funds invest. Foreign taxes, if any, are recorded based on the tax regulations and rates that exist in the foreign markets in which the Funds invest. When a capital gain tax is determined to apply, certain or all Funds record an estimated deferred tax liability in an amount that would be payable if the securities were disposed of on the valuation date.
As a result of several court cases, in certain countries across the European Union, certain or all Funds filed additional tax reclaims for previously withheld taxes on dividends earned in those countries (EU reclaims). These additional filings are subject to various administrative proceedings by the local jurisdictions’ tax authorities within the European Union, as well as a number of related judicial proceedings. Income recognized, if any, for EU reclaims is reflected as other income in the Statements of Operations and any related receivable, if any, is reflected as European Union tax reclaims in the Statements of Assets and Liabilities. When uncertainty exists as to the ultimate resolution of these proceedings, the likelihood of receipt of these EU reclaims, and the potential timing of payment, no amounts are reflected in the financial statements. For U.S. income tax purposes, EU reclaims received by the Funds, if any, reduce the amounts of foreign taxes Fund shareholders can use as tax credits in their individual income tax returns.
Each Fund may recognize an income tax liability related to its uncertain tax positions under U.S. GAAP when the uncertain tax position has a less than 50% probability that it will be sustained upon examination by the tax authorities based on its technical merits. As of September 30, 2017, each Fund has
| | | | |
| 106 | | Annual Report | | franklintempleton.com |
FRANKLIN CUSTODIAN FUNDS
NOTES TO FINANCIAL STATEMENTS
determined that no tax liability is required in its financial statements related to uncertain tax positions for any open tax years (or expected to be taken in future tax years). Open tax years are those that remain subject to examination and are based on the statute of limitations in each jurisdiction in which the Fund invests.
k. Security Transactions, Investment Income, Expenses and Distributions
Security transactions are accounted for on trade date. Realized gains and losses on security transactions are determined on a specific identification basis. Interest income and estimated expenses are accrued daily. Amortization of premium and accretion of discount on debt securities are included in interest income. Paydown gains and losses are recorded separately in the Statements of Operations. Facility fees are recognized as income over the expected term of the loan. Dividend income is recorded on the ex-dividend date except for certain dividends from securities where the dividend rate is not available. In such cases, the dividend is recorded as soon as the information is received by the Funds. Distributions to shareholders are recorded on the ex-dividend date. Distributable earnings are determined according to income tax regulations (tax basis) and may differ from earnings recorded in accordance with U.S. GAAP. These differences may be permanent or temporary. Permanent differences are reclassified among capital accounts to reflect their tax character. These reclassifications have no impact on net assets or the results of operations. Temporary differences are not reclassified, as they may reverse in subsequent periods.
Common expenses incurred by the Trust are allocated among the Funds based on the ratio of net assets of each Fund to the combined net assets of the Trust. Fund specific expenses are charged directly to the Fund that incurred the expense.
Realized and unrealized gains and losses and net investment income, excluding class specific expenses, are allocated daily to each class of shares based upon the relative proportion of net assets of each class. Differences in per share distributions by class are generally due to differences in class specific expenses.
l. Accounting Estimates
The preparation of financial statements in accordance with U.S. GAAP requires management to make estimates and assumptions that affect the reported amounts of assets and liabilities at the date of the financial statements and the amounts of income and expenses during the reporting period. Actual results could differ from those estimates.
m. Guarantees and Indemnifications
Under the Trust’s organizational documents, its officers and trustees are indemnified by the Trust against certain liabilities arising out of the performance of their duties to the Trust. Additionally, in the normal course of business, the Trust, on behalf of the Funds, enters into contracts with service providers that contain general indemnification clauses. The Trust’s maximum exposure under these arrangements is unknown as this would involve future claims that may be made against the Trust that have not yet occurred. Currently, the Trust expects the risk of loss to be remote.
| | | | |
| franklintempleton.com | | Annual Report | | 107 |
FRANKLIN CUSTODIAN FUNDS
NOTES TO FINANCIAL STATEMENTS
2. Shares of Beneficial Interest
At September 30, 2017, there were an unlimited number of shares authorized (without par value). Transactions in the Funds’ shares were as follows:
| | | | | | | | | | | | | | | | |
| | | Franklin | | | Franklin | |
| | | DynaTech Fund | | | Growth Fund | |
| | | Shares | | | Amount | | | Shares | | | Amount | |
| | | | |
Class A Shares: | | | | | | | | | | | | | | | | |
Year ended September 30, 2017 | | | | | | | | | | | | | | | | |
Shares sold | | | 9,362,267 | | | $ | 523,007,968 | | | | 14,162,348 | | | $ | 1,174,286,495 | |
Shares issued in reinvestment of distributions | | | 1,325,934 | | | | 62,305,651 | | | | 3,311,489 | | | | 249,918,049 | |
Shares redeemed | | | (11,882,951 | ) | | | (643,932,670 | ) | | | (26,713,031 | ) | | | (2,199,267,441 | ) |
| | | | |
Net increase (decrease) | | | (1,194,750 | ) | | $ | (58,619,051 | ) | | | (9,239,194 | ) | | $ | (775,062,897 | ) |
| | | | |
Year ended September 30, 2016 | | | | | | | | | | | | | | | | |
Shares sold | | | 11,719,604 | | | $ | 557,476,346 | | | | 14,730,591 | | | $ | 1,091,538,193 | |
Shares issued in reinvestment of distributions | | | 934,047 | | | | 46,730,383 | | | | 3,458,561 | | | | 261,017,574 | |
Shares issued on reorganization | | | — | | | | — | | | | 314,663 | | | | 18,982,031 | |
Shares redeemed | | | (12,214,975 | ) | | | (582,017,593 | ) | | | (20,629,135 | ) | | | (1,534,503,530 | ) |
| | | | |
Net increase (decrease) | | | 438,676 | | | $ | 22,189,136 | | | | (2,125,320 | ) | | $ | (162,965,732 | ) |
| | | | |
Class C Shares: | | | | | | | | | | | | | | | | |
Year ended September 30, 2017 | | | | | | | | | | | | | | | | |
Shares sold | | | 1,608,949 | | | $ | 76,923,384 | | | | 2,061,309 | | | $ | 157,211,473 | |
Shares issued in reinvestment of distributions | | | 278,097 | | | | 11,146,149 | | | | 378,292 | | | | 26,423,730 | |
Shares redeemed | | | (2,017,425 | ) | | | (93,534,438 | ) | | | (3,058,986 | ) | | | (234,216,142 | ) |
| | | | |
Net increase (decrease) | | | (130,379 | ) | | $ | (5,464,905 | ) | | | (619,385 | ) | | $ | (50,580,939 | ) |
| | | | |
Year ended September 30, 2016 | | | | | | | | | | | | | | | | |
Shares sold | | | 2,087,492 | | | $ | 85,801,474 | | | | 2,416,582 | | | $ | 166,119,695 | |
Shares issued in reinvestment of distributions | | | 187,219 | | | | 8,097,222 | | | | 364,920 | | | | 25,617,358 | |
Shares issued on reorganization | | | — | | | | — | | | | 57,203 | | | | 3,204,287 | |
Shares redeemed | | | (1,917,133 | ) | | | (78,431,786 | ) | | | (2,748,828 | ) | | | (188,430,506 | ) |
| | | | |
Net increase (decrease) | | | 357,578 | | | $ | 15,466,910 | | | | 89,877 | | | $ | 6,510,834 | |
| | | | |
Class R Shares: | | | | | | | | | | | | | | | | |
Year ended September 30, 2017 | | | | | | | | | | | | | | | | |
Shares sold | | | 267,584 | | | $ | 14,852,690 | | | | 912,197 | | | $ | 76,231,533 | |
Shares issued in reinvestment of distributions | | | 27,272 | | | | 1,251,781 | | | | 210,204 | | | | 15,813,630 | |
Shares redeemed | | | (280,176 | ) | | | (14,785,028 | ) | | | (1,629,437 | ) | | | (135,607,303 | ) |
| | | | |
Net increase (decrease) | | | 14,680 | | | $ | 1,319,443 | | | | (507,036 | ) | | $ | (43,562,140 | ) |
| | | | |
Year ended September 30, 2016 | | | | | | | | | | | | | | | | |
Shares sold | | | 165,591 | | | $ | 7,698,887 | | | | 922,209 | | | $ | 67,929,360 | |
Shares issued in reinvestment of distributions | | | 23,085 | | | | 1,131,862 | | | | 220,024 | | | | 16,556,807 | |
Shares issued on reorganization | | | — | | | | — | | | | 137 | | | | 7,135 | |
Shares redeemed | | | (377,470 | ) | | | (17,704,769 | ) | | | (2,012,219 | ) | | | (148,158,582 | ) |
| | | | |
Net increase (decrease) | | | (188,794 | ) | | $ | (8,874,020 | ) | | | (869,849 | ) | | $ | (63,665,280 | ) |
| | | | |
| 108 | | Annual Report | | franklintempleton.com |
FRANKLIN CUSTODIAN FUNDS
NOTES TO FINANCIAL STATEMENTS
| | | | | | | | | | | | | | | | |
| | | Franklin | | | Franklin | |
| | | DynaTech Fund | | | Growth Fund | |
| | | Shares | | | Amount | | | Shares | | | Amount | |
Class R6 Shares: | | | | | | | | | | | | | | | | |
Year ended September 30, 2017 | | | | | | | | | | | | | | | | |
Shares sold | | | 1,671,232 | | | $ | 92,675,376 | | | | 6,556,890 | | | $ | 547,502,376 | |
Shares issued in reinvestment of distributions | | | 228,050 | | | | 11,046,724 | | | | 613,371 | | | | 46,278,808 | |
Shares redeemed | | | (1,597,410 | ) | | | (92,487,214 | ) | | | (4,499,648 | ) | | | (378,570,163 | ) |
| | | | |
Net increase (decrease) | | | 301,872 | | | $ | 11,234,886 | | | | 2,670,613 | | | $ | 215,211,021 | |
| | | | |
Year ended September 30, 2016 | | | | | | | | | | | | | | | | |
Shares sold | | | 1,005,677 | | | $ | 48,126,111 | | | | 2,209,612 | | | $ | 166,757,883 | |
Shares issued in reinvestment of distributions | | | 183,157 | | | | 9,395,944 | | | | 637,359 | | | | 48,088,702 | |
Shares redeemed | | | (2,168,287 | ) | | | (105,397,983 | ) | | | (3,013,600 | ) | | | (227,119,184 | ) |
| | | | |
Net increase (decrease) | | | (979,453 | ) | | $ | (47,875,928 | ) | | | (166,629 | ) | | $ | (12,272,599 | ) |
| | | | |
Advisor Class Shares: | | | | | | | | | | | | | | | | |
Year ended September 30, 2017 | | | | | | | | | | | | | | | | |
Shares sold | | | 9,006,379 | | | $ | 514,535,401 | | | | 11,853,956 | | | $ | 980,377,887 | |
Shares issued in reinvestment of distributions | | | 155,933 | | | | 7,506,593 | | | | 998,990 | | | | 75,473,718 | |
Shares redeemed | | | (1,979,331 | ) | | | (111,219,398 | ) | | | (7,733,627 | ) | | | (636,836,942 | ) |
| | | | |
Net increase (decrease) | | | 7,182,981 | | | $ | 410,822,596 | | | | 5,119,319 | | | $ | 419,014,663 | |
| | | | |
Year ended September 30, 2016 | | | | | | | | | | | | | | | | |
Shares sold | | | 2,188,873 | | | $ | 109,144,348 | | | | 6,862,211 | | | $ | 545,996,733 | |
Shares issued in reinvestment of distributions | | | 84,067 | | | | 4,294,126 | | | | 801,298 | | | | 60,554,117 | |
Shares issued on reorganization | | | — | | | | — | | | | 2,254,565 | | | | 136,327,485 | |
Shares redeemed | | | (2,202,327 | ) | | | (104,350,956 | ) | | | (5,398,462 | ) | | | (404,073,714 | ) |
| | | | |
Net increase (decrease) | | | 70,613 | | | $ | 9,087,518 | | | | 4,519,612 | | | $ | 338,804,621 | |
| | | |
| | | | | | | | | Franklin | |
| | | Franklin | | | U.S. Government | |
| | | Income Fund | | | Securities Fund | |
| | | Shares | | | Amount | | | Shares | | | Amount | |
Class A Shares: | | | | | | | | | | | | | | | | |
Year ended September 30, 2017 | | | | | | | | | | | | | | | | |
Shares sold | | | 2,326,579,530 | | | $ | 5,409,263,110 | | | | 88,315,020 | | | $ | 547,846,708 | |
Shares issued in reinvestment of distributions | | | 942,817,065 | | | | 2,180,859,371 | | | | 16,155,083 | | | | 99,906,202 | |
Shares redeemed | | | (4,077,035,296 | ) | | | (9,459,733,020 | ) | | | (187,133,417 | ) | | | (1,159,721,046 | ) |
| | | | |
Net increase (decrease) | | | (807,638,701 | ) | | $ | (1,869,610,539 | ) | | | (82,663,314 | ) | | $ | (511,968,136 | ) |
| | | | |
Year ended September 30, 2016 | | | | | | | | | | | | | | | | |
Shares sold | | | 2,296,688,306 | | | $ | 4,899,239,525 | | | | 129,588,253 | | | $ | 826,285,803 | |
Shares issued in reinvestment of distributions | | | 1,066,919,722 | | | | 2,280,635,347 | | | | 17,544,573 | | | | 111,672,956 | |
Shares redeemed | | | (4,454,843,889 | ) | | | (9,508,531,053 | ) | | | (130,888,179 | ) | | | (834,314,196 | ) |
| | | | |
Net increase (decrease) | | | (1,091,235,861 | ) | | $ | (2,328,656,181 | ) | | | 16,244,647 | | | $ | 103,644,563 | |
| | | | |
| franklintempleton.com | | Annual Report | | 109 |
FRANKLIN CUSTODIAN FUNDS
NOTES TO FINANCIAL STATEMENTS
2. Shares of Beneficial Interest (continued)
| | | | | | | | | | | | | | | | |
| | | | | | | | | Franklin | |
| | | Franklin | | | U.S. Government | |
| | | Income Fund | | | Securities Fund | |
| | | Shares | | | Amount | | | Shares | | | Amount | |
Class C Shares: | | | | | | | | | | | | | | | | |
Year ended September 30, 2017 | | | | | | | | | | | | | | | | |
Shares sold | | | 911,767,616 | | | $ | 2,142,426,105 | | | | 14,550,091 | | | $ | 89,797,342 | |
Shares issued in reinvestment of distributions | | | 413,154,940 | | | | 967,759,461 | | | | 3,401,372 | | | | 20,890,746 | |
Shares redeemed | | | (2,297,260,192 | ) | | | (5,403,840,283 | ) | | | (50,952,421 | ) | | | (313,543,423 | ) |
| | | | |
Net increase (decrease) | | | (972,337,636 | ) | | $ | (2,293,654,717 | ) | | | (33,000,958 | ) | | $ | (202,855,335 | ) |
| | | | |
Year ended September 30, 2016 | | | | | | | | | | | | | | | | |
Shares sold | | | 1,068,954,930 | | | $ | 2,309,517,092 | | | | 36,439,976 | | | $ | 230,732,462 | |
Shares issued in reinvestment of distributions | | | 475,083,681 | | | | 1,027,055,245 | | | | 3,842,286 | | | | 24,293,961 | |
Shares redeemed | | | (2,389,581,028 | ) | | | (5,155,233,706 | ) | | | (39,789,996 | ) | | | (251,902,860 | ) |
| | | | |
Net increase (decrease) | | | (845,542,417 | ) | | $ | (1,818,661,369 | ) | | | 492,266 | | | $ | 3,123,563 | |
| | | | |
Class R Shares: | | | | | | | | | | | | | | | | |
Year ended September 30, 2017 | | | | | | | | | | | | | | | | |
Shares sold | | | 29,390,834 | | | $ | 67,078,836 | | | | 2,216,203 | | | $ | 13,791,777 | |
Shares issued in reinvestment of distributions | | | 7,822,410 | | | | 17,773,811 | | | | 199,172 | | | | 1,231,596 | |
Shares redeemed | | | (62,623,063 | ) | | | (143,062,182 | ) | | | (5,574,593 | ) | | | (34,456,445 | ) |
| | | | |
Net increase (decrease) | | | (25,409,819 | ) | | $ | (58,209,535 | ) | | | (3,159,218 | ) | | $ | (19,433,072 | ) |
| | | | |
Year ended September 30, 2016 | | | | | | | | | | | | | | | | |
Shares sold | | | 32,442,666 | | | $ | 68,219,741 | | | | 4,014,644 | | | $ | 25,582,929 | |
Shares issued in reinvestment of distributions | | | 9,659,507 | | | | 20,294,130 | | | | 256,237 | | | | 1,629,788 | |
Shares redeemed | | | (64,184,548 | ) | | | (134,623,094 | ) | | | (4,958,227 | ) | | | (31,583,313 | ) |
| | | | |
Net increase (decrease) | | | (22,082,375 | ) | | $ | (46,109,223 | ) | | | (687,346 | ) | | $ | (4,370,596 | ) |
| | | | |
Class R6 Shares: | | | | | | | | | | | | | | | | |
Year ended September 30, 2017 | | | | | | | | | | | | | | | | |
Shares sold | | | 45,238,070 | | | $ | 104,748,463 | | | | 7,989,421 | | | $ | 49,592,166 | |
Shares issued in reinvestment of distributions | | | 39,448,905 | | | | 90,547,964 | | | | 2,685,559 | | | | 16,667,699 | |
Shares redeemed | | | (98,936,238 | ) | | | (227,642,444 | ) | | | (36,176,783 | ) | | | (225,322,538 | ) |
| | | | |
Net increase (decrease) | | | (14,249,263 | ) | | $ | (32,346,017 | ) | | | (25,501,803 | ) | | $ | (159,062,673 | ) |
| | | | |
Year ended September 30, 2016 | | | | | | | | | | | | | | | | |
Shares sold | | | 27,601,182 | | | $ | 58,603,240 | | | | 56,484,578 | | | $ | 361,101,116 | |
Shares issued in reinvestment of distributions | | | 45,946,719 | | | | 97,311,080 | | | | 2,472,810 | | | | 15,785,553 | |
Shares redeemed | | | (130,160,220 | ) | | | (272,756,945 | ) | | | (19,368,048 | ) | | | (123,758,854 | ) |
| | | | |
Net increase (decrease) | | | (56,612,319 | ) | | $ | (116,842,625 | ) | | | 39,589,340 | | | $ | 253,127,815 | |
| | | | |
| 110 | | Annual Report | | franklintempleton.com |
FRANKLIN CUSTODIAN FUNDS
NOTES TO FINANCIAL STATEMENTS
| | | | | | | | | | | | | | | | |
| | | | | | | | | Franklin | |
| | | Franklin | | | U.S. Government | |
| | | Income Fund | | | Securities Fund | |
| | | Shares | | | Amount | | | Shares | | | Amount | |
Advisor Class Shares: | | | | | | | | | | | | | | | | |
Year ended September 30, 2017 | | | | | | | | | | | | | | | | |
Shares sold | | | 2,163,722,071 | | | $ | 4,992,265,330 | | | | 63,438,736 | | | $ | 394,713,677 | |
Shares issued in reinvestment of distributions | | | 201,275,423 | | | | 462,952,027 | | | | 3,720,638 | | | | 23,067,829 | |
Shares redeemed | | | (1,099,054,643 | ) | | | (2,529,240,454 | ) | | | (41,027,662 | ) | | | (255,096,468 | ) |
| | | | |
Net increase (decrease) | | | 1,265,942,851 | | | $ | 2,925,976,903 | | | | 26,131,712 | | | $ | 162,685,038 | |
Year ended September 30, 2016 | | | | | | | | | | | | | | | | |
Shares sold | | | 1,067,594,317 | | | $ | 2,275,707,421 | | | | 40,939,883 | | | $ | 261,734,567 | |
Shares issued in reinvestment of distributions | | | 178,298,784 | | | | 377,867,092 | | | | 2,904,764 | | | | 18,546,418 | |
Shares redeemed | | | (1,308,652,167 | ) | | | (2,761,544,103 | ) | | | (27,863,916 | ) | | | (178,141,342 | ) |
| | | | |
Net increase (decrease) | | | (62,759,066 | ) | | $ | (107,969,590 | ) | | | 15,980,731 | | | $ | 102,139,643 | |
| | | | | | | | |
| |
| | | Franklin | |
| | | Utilities Fund | |
| | | Shares | | | Amount | |
Class A Shares: | | | | | | | | |
Year ended September 30, 2017 | | | | | | | | |
Shares sold | | | 33,746,244 | | | $ | 620,365,753 | |
Shares issued in reinvestment of distributions | | | 5,477,068 | | | | 100,790,068 | |
Shares redeemed | | | (55,404,028 | ) | | | (1,010,827,402 | ) |
| | |
Net increase (decrease) | | | (16,180,716 | ) | | $ | (289,671,581 | ) |
| | |
Year ended September 30, 2016 | | | | | | | | |
Shares sold | | | 50,469,532 | | | $ | 868,419,143 | |
Shares issued in reinvestment of distributions | | | 13,069,421 | | | | 208,694,820 | |
Shares redeemed | | | (48,540,425 | ) | | | (827,013,167 | ) |
| | |
Net increase (decrease) | | | 14,998,528 | | | $ | 250,100,796 | |
| | |
Class C Shares: | | | | | | | | |
Year ended September 30, 2017 | | | | | | | | |
Shares sold | | | 5,503,753 | | | $ | 100,721,777 | |
Shares issued in reinvestment of distributions | | | 1,083,738 | | | | 19,834,562 | |
Shares redeemed | | | (15,075,669 | ) | | | (276,809,082 | ) |
| | |
Net increase (decrease) | | | (8,488,178 | ) | | $ | (156,252,743 | ) |
| | |
Year ended September 30, 2016 | | | | | | | | |
Shares sold | | | 10,472,053 | | | $ | 177,587,549 | |
Shares issued in reinvestment of distributions | | | 2,911,810 | | | | 46,120,996 | |
Shares redeemed | | | (11,691,443 | ) | | | (196,796,690 | ) |
| | |
Net increase (decrease) | | | 1,692,420 | | | $ | 26,911,855 | |
| | | | |
| franklintempleton.com | | Annual Report | | 111 |
FRANKLIN CUSTODIAN FUNDS
NOTES TO FINANCIAL STATEMENTS
2. Shares of Beneficial Interest (continued)
| | | | | | | | |
| | | Franklin Utilities Fund | |
| | |
| | | Shares | | | Amount | |
Class R Shares: | | | | | | | | |
Year ended September 30, 2017 | | | | | | | | |
Shares sold | | | 1,609,833 | | | $ | 29,215,041 | |
Shares issued in reinvestment of distributions | | | 121,708 | | | | 2,225,505 | |
Shares redeemed | | | (2,594,910 | ) | | | (47,079,268 | ) |
Net increase (decrease) | | | (863,369 | ) | | $ | (15,638,722 | ) |
Year ended September 30, 2016 | | | | | | | | |
Shares sold | | | 2,558,079 | | | $ | 44,212,218 | |
Shares issued in reinvestment of distributions | | | 307,591 | | | | 4,887,986 | |
Shares redeemed | | | (2,256,335 | ) | | | (38,262,461 | ) |
Net increase (decrease) | | | 609,335 | | | $ | 10,837,743 | |
| | |
Class R6 Shares: | | | | | | | | |
Year ended September 30, 2017 | | | | | | | | |
Shares sold | | | 3,378,291 | | | $ | 61,987,731 | |
Shares issued in reinvestment of distributions | | | 367,045 | | | | 6,819,073 | |
Shares redeemed | | | (3,469,190 | ) | | | (64,510,956 | ) |
Net increase (decrease) | | | 276,146 | | | $ | 4,295,848 | |
Year ended September 30, 2016 | | | | | | | | |
Shares sold | | | 4,569,794 | | | $ | 80,441,620 | |
Shares issued in reinvestment of distributions | | | 849,533 | | | | 13,711,334 | |
Shares redeemed | | | (5,632,978 | ) | | | (99,709,050 | ) |
Net increase (decrease) | | | (213,651 | ) | | $ | (5,556,096 | ) |
| | |
Advisor Class Shares: | | | | | | | | |
Year ended September 30, 2017 | | | | | | | | |
Shares sold | | | 21,268,414 | | | $ | 394,510,240 | |
Shares issued in reinvestment of distributions | | | 1,182,297 | | | | 22,042,770 | |
Shares redeemed | | | (14,639,265 | ) | | | (268,017,582 | ) |
Net increase (decrease) | | | 7,811,446 | | | $ | 148,535,428 | |
Year ended September 30, 2016 | | | | | | | | |
Shares sold | | | 17,376,033 | | | $ | 302,116,278 | |
Shares issued in reinvestment of distributions | | | 2,161,976 | | | | 34,915,765 | |
Shares redeemed | | | (11,446,675 | ) | | | (197,412,357 | ) |
Net increase (decrease) | | | 8,091,334 | | | $ | 139,619,686 | |
| | | | |
| 112 | | Annual Report | | franklintempleton.com |
FRANKLIN CUSTODIAN FUNDS
NOTES TO FINANCIAL STATEMENTS
3. Transactions with Affiliates
Franklin Resources, Inc. is the holding company for various subsidiaries that together are referred to as Franklin Templeton Investments. Certain officers and trustees of the Trust are also officers and/or directors of the following subsidiaries:
| | |
| Subsidiary | | Affiliation |
| Franklin Advisers, Inc. (Advisers) | | Investment manager |
| Franklin Templeton Services, LLC (FT Services) | | Administrative manager |
| Franklin Templeton Distributors, Inc. (Distributors) | | Principal underwriter |
| Franklin Templeton Investor Services, LLC (Investor Services) | | Transfer agent |
a. Management Fees
Franklin Income Fund and Franklin Utilities Fund pay an investment management fee to Advisers based on the month-end net assets of each of the Funds as follows:
| | |
| Annualized Fee Rate | | Net Assets |
0.625% | | Up to and including $100 million |
0.500% | | Over $100 million, up to and including $250 million |
0.450% | | Over $250 million, up to and including $7.5 billion |
0.440% | | Over $7.5 billion, up to and including $10 billion |
0.430% | | Over $10 billion, up to and including $12.5 billion |
0.420% | | Over $12.5 billion, up to and including $15 billion |
0.400% | | Over $15 billion, up to and including $17.5 billion |
0.380% | | Over $17.5 billion, up to and including $20 billion |
0.360% | | Over $20 billion, up to and including $35 billion |
0.355% | | Over $35 billion, up to and including $50 billion |
0.350% | | Over $50 billion, up to and including $65 billion |
0.345% | | Over $65 billion, up to and including $80 billion |
0.340% | | In excess of $80 billion |
Franklin DynaTech Fund, Franklin Growth Fund and Franklin U.S. Government Securities Fund pay an investment management fee to Advisers based on the month-end net assets of each of the Funds as follows:
| | |
| Annualized Fee Rate | | Net Assets |
0.625% | | Up to and including $100 million |
0.500% | | Over $100 million, up to and including $250 million |
0.450% | | Over $250 million, up to and including $7.5 billion |
0.440% | | Over $7.5 billion, up to and including $10 billion |
0.430% | | Over $10 billion, up to and including $12.5 billion |
0.420% | | Over $12.5 billion, up to and including $15 billion |
0.400% | | Over $15 billion, up to and including $17.5 billion |
0.380% | | Over $17.5 billion, up to and including $20 billion |
0.360% | | Over $20 billion, up to and including $35 billion |
0.355% | | Over $35 billion, up to and including $50 billion |
0.350% | | In excess of $50 billion |
| | | | |
| franklintempleton.com | | Annual Report | | 113 |
FRANKLIN CUSTODIAN FUNDS
NOTES TO FINANCIAL STATEMENTS
3. Transactions with Affiliates (continued)
a. Management Fees (continued)
For the year ended September 30, 2017, each Fund’s effective investment management fee rate based on average daily net assets was as follows:
| | | | | | | | |
Franklin DynaTech Fund | | Franklin Growth Fund | | Franklin Income Fund | | Franklin U.S. Government Securities Fund | | Franklin Utilities Fund |
| 0.463% | | 0.447% | | 0.372% | | 0.450% | | 0.456% |
b. Administrative Fees
Under an agreement with Advisers, FT Services provides administrative services to the Funds. The fee is paid by Advisers based on each of the Funds’ average daily net assets, and is not an additional expense of the Funds.
c. Distribution Fees
The Board has adopted distribution plans for each share class, with the exception of Class R6 and Advisor Class shares, pursuant to Rule 12b-1 under the 1940 Act. Under the Funds’ Class A reimbursement distribution plans, the Funds reimburse Distributors for costs incurred in connection with the servicing, sale and distribution of each Fund’s shares up to the maximum annual plan rate for each class. Under the Class A reimbursement distribution plans, costs exceeding the maximum for the current plan year cannot be reimbursed in subsequent periods. In addition, under the Funds’ Class C and R compensation distribution plans, the Funds pay Distributors for costs incurred in connection with the servicing, sale and distribution of each Fund’s shares up to the maximum annual plan rate for each class. The plan year, for purposes of monitoring compliance with the maximum annual plan rates, is February 1 through January 31 for each Fund.
The maximum annual plan rates, based on the average daily net assets, for each class, are as follows:
| | | | | | | | | | |
| | | Franklin
DynaTech Fund | | Franklin Growth Fund | | Franklin Income Fund | | Franklin
U.S. Government Securities Fund | | Franklin Utilities Fund |
Reimbursement Plans: | | | | | | | | | | |
Class A | | 0.25% | | 0.25% | | 0.15% | | 0.15% | | 0.15% |
Compensation Plans: | | | | | | | | | | |
Class C | | 1.00% | | 1.00% | | 0.65% | | 0.65% | | 0.65% |
Class R | | 0.50% | | 0.50% | | 0.50% | | 0.50% | | 0.50% |
d. Sales Charges/Underwriting Agreements
Front-end sales charges and contingent deferred sales charges (CDSC) do not represent expenses of the Funds. These charges are deducted from the proceeds of sales of fund shares prior to investment or from redemption proceeds prior to remittance, as applicable. Distributors has advised the Funds of the following commission transactions related to the sales and redemptions of the Funds’ shares for the year:
| | | | | | | | | | |
| | | Franklin
DynaTech Fund | | Franklin Growth Fund | | Franklin Income Fund | | Franklin
U.S. Government Securities Fund | | Franklin Utilities Fund |
Sales charges retained net of commissions paid to unaffiliated brokers/dealers | | $970,373 | | $2,026,430 | | $12,439,788 | | $612,632 | | $747,975 |
CDSC retained | | $ 57,416 | | $ 114,191 | | $ 1,219,620 | | $136,674 | | $ 61,187 |
| | | | |
| 114 | | Annual Report | | franklintempleton.com |
FRANKLIN CUSTODIAN FUNDS
NOTES TO FINANCIAL STATEMENTS
e. Transfer Agent Fees
Each class of shares, except for Class R6, pays transfer agent fees to Investor Services for its performance of shareholder servicing obligations and reimburses Investor Services for out of pocket expenses incurred, including shareholder servicing fees paid to third parties. These fees are allocated daily based upon their relative proportion of such classes’ aggregate net assets. Class R6 pays Investor Services transfer agent fees specific to that class.
For the year ended September 30, 2017, the Funds paid transfer agent fees as noted in the Statements of Operations of which the following amounts were retained by Investor Services:
| | | | | | | | | | | | | | | | | | | | |
| | | Franklin
DynaTech Fund | | | Franklin
Growth Fund | | | Franklin
Income Fund | | | Franklin
U.S. Government
Securities Fund | | | Franklin
Utilities Fund | |
| | | | | |
Transfer agent fees | | | $2,007,405 | | | | $7,201,990 | | | | $20,782,677 | | | | $3,841,315 | | | | $2,748,211 | |
f. Investments in Affiliated Management Investment Companies
Certain or all Funds invest in one or more affiliated management investment companies for purposes other than exercising a controlling influence over the management or policies. Management fees paid by the Funds are waived on assets invested in the affiliated management investment companies, as noted in the Statements of Operations, in an amount not to exceed the management and administrative fees paid directly or indirectly by each affiliate. Prior to October 1, 2013, the waiver was accounted for as a reduction to management fees. During the year ended September 30, 2017, investments in affiliated management investment companies were as follows:
| | | | | | | | | | | | | | | | | | | | | | | | | | | | | | | | |
| | | Number of
Shares Held at Beginning
of Year | | | Gross Additions | | | Gross Reductions | | | Number of
Shares Held at End of Year | | | Value at End of Year | | | Dividend
Income | | | Realized
Gain (Loss) | | | Net Change in Unrealized
Appreciation
(Depreciation) | |
| | | | | | | | |
Franklin DynaTech Fund | | | | | | | | | | | | | | | | | | | | | | | | | | | | | | | | |
Non-Controlled Affiliates | | | | | | | | | | | | | | | | | | | | | | | | | | | | | | | | |
Institutional
Fiduciary Trust
Money Market
Portfolio, 0.67% | | | 17,719,400 | | | | 589,879,975 | | | | (517,015,117 | ) | | | 90,584,258 | | | | $ 90,584,258 | | | | $ 283,808 | | | | $ — | | | | $ — | |
Franklin Growth Fund | | | | | | | | | | | | | | | | | | | | | | | | | | | | | | | | |
Non-Controlled Affiliates | | | | | | | | | | | | | | | | | | | | | | | | | | | | | | | | |
Institutional
Fiduciary Trust
Money Market
Portfolio, 0.67% | | | 856,457,573 | | | | 818,781,420 | | | | (1,343,458,270 | ) | | | 331,780,723 | | | | $ 331,780,723 | | | | $1,394,451 | | | | $ — | | | | $ — | |
Franklin Income Fund | | | | | | | | | | | | | | | | | | | | | | | | | | | | | | | | |
Non-Controlled Affiliates | | | | | | | | | | | | | | | | | | | | | | | | | | | | | | | | |
Institutional Fiduciary Trust Money Market
Portfolio, 0.67% | | | 1,087,361,640 | | | | 17,432,460,205 | | | | (14,311,366,514 | ) | | | 4,208,455,331 | | | | $4,208,455,331 | | | | $9,671,724 | | | | $ — | | | | $ — | |
Franklin U.S. Government Securities Fund | | | | | | | | | | | | | | | | | | | | | | | | | | | | | | | | |
Non-Controlled Affiliates | | | | | | | | | | | | | | | | | | | | | | | | | | | | | | | | |
Institutional
Fiduciary Trust
Money Market
Portfolio, 0.67% | | | 100,549,302 | | | | 1,092,824,532 | | | | (1,102,692,539 | ) | | | 90,681,295 | | | | $ 90,681,295 | | | | $ 264,427 | | | | $ — | | | | $ — | |
| | | | |
| franklintempleton.com | | Annual Report | | 115 |
FRANKLIN CUSTODIAN FUNDS
NOTES TO FINANCIAL STATEMENTS
3. Transactions with Affiliates (continued)
f. Investments in Affiliated Management Investment Companies (continued)
| | | | | | | | | | | | | | | | |
| | | Number of Shares Held at Beginning of Year | | Gross Additions | | Gross Reductions | | Number of Shares Held at End of Year | | Value at End of Year | | Dividend Income | | Realized Gain (Loss) | | Net Change
in
Unrealized Appreciation (Depreciation) |
| Franklin Utilities Fund | | | | | | | | | | | | | | | | |
| Non-Controlled Affiliates | | | | | | | | | | | | | | | | |
Institutional Fiduciary Trust Money Market Portfolio, 0.67% | | 35,157,723 | | 358,140,085 | | (372,170,702) | | 21,127,106 | | $ 21,127,106 | | $ 93,338 | | $ — | | $ — |
g. Other Affiliated Transactions
At September 30, 2017, one or more of the funds in Franklin Fund Allocator Series owned a percentage of the following Funds’ outstanding shares:
| | | | | | | | |
Franklin DynaTech Fund | | Franklin Growth Fund | | Franklin Income Fund | | Franklin
U.S. Government
Securities Fund | | Franklin Utilities Fund |
9.6% | | 6.4% | | 2.0% | | 5.8% | | 2.3% |
h. Interfund Transactions
Franklin Income Fund engaged in purchases and sales of investments with funds or other accounts that have common investment managers (or affiliated investment managers), directors, trustees or officers. During the year ended September 30, 2017, these purchase and sale transactions aggregated $33,356,508 and $0, respectively.
4. Expense Offset Arrangement
The Funds have entered into an arrangement with their custodian whereby credits realized as a result of uninvested cash balances are used to reduce a portion of the Funds’ custodian expenses. During the year ended September 30, 2017, the custodian fees were reduced as noted in the Statements of Operations.
5. Income Taxes
For tax purposes, capital losses may be carried over to offset future capital gains. Capital loss carryforwards with no expiration, if any, must be fully utilized before those losses with expiration dates.
| | | | |
| 116 | | Annual Report | | franklintempleton.com |
FRANKLIN CUSTODIAN FUNDS
NOTES TO FINANCIAL STATEMENTS
At September 30, 2017, the capital loss carryforwards were as follows:
| | | | | | | | |
| | |
| Franklin
Income Fund |
| |
| Franklin
U.S. Government
Securities Fund |
|
Capital loss carryforwards subject to expiration: | | | | | | | | |
2018 | | $ | 2,298,838,256 | | | | $16,923,310 | |
2019 | | | — | | | | 4,445,156 | |
Capital loss carryforwards not subject to expiration: | | | | | | | | |
Short term | | | 1,089,744,756 | | | | 204,034,009 | |
Long term | | | 2,019,665,347 | | | | 299,432,828 | |
Total capital loss carryforwards | | $ | 5,408,248,359 | | | $ | 524,835,303 | |
During the year ended September 30, 2017, Franklin Income Fund utilized $1,141,906,564 of capital loss carryforwards.
On September 30, 2017, Franklin U.S. Government Securities Fund had expired capital loss carryforwards of $18,668,917, which were reclassified to paid-in capital.
For tax purposes, the Funds may elect to defer any portion of a late-year ordinary loss to the first day of the following fiscal year. At September 30, 2017, Franklin DynaTech Fund deferred late-year ordinary losses of $8,477,090.
The tax character of distributions paid during the years ended September 30, 2017 and 2016, was as follows:
| | | | | | | | | | | | | | | | |
| |
| Franklin
DynaTech Fund |
| |
| Franklin
Growth Fund |
|
| | | | 2017 | | | | 2016 | | | | 2017 | | | | 2016 | |
Distributions paid from: | | | | | | | | | | | | | | | | |
Ordinary income | | $ | — | | | $ | — | | | $ | 65,003,484 | | | $ | 77,011,794 | |
Long term capital gain | | | 99,169,960 | | | | 73,911,708 | | | | 381,564,601 | | | | 367,827,103 | |
| | $ | 99,169,960 | | | $ | 73,911,708 | | | $ | 446,568,085 | | | $ | 444,838,897 | |
| | | | | | | | | | | | | | | | |
| |
| Franklin
Income Fund |
| |
| Franklin
U.S. Government Securities Fund |
|
| | | | 2017 | | | | 2016 | | | | 2017 | | | | 2016 | |
Distributions paid from: | | | | | | | | | | | | | | | | |
Ordinary income | | | $4,104,316,518 | | | | $4,224,252,280 | | | | $184,128,697 | | | | $198,126,751 | |
| | | | | | | | |
| | | Franklin Utilities Fund | |
| | | 2017 | | | 2016 | |
Distributions paid from: | | | | | | | | |
Ordinary income | | $ | 165,982,620 | | | $ | 177,871,270 | |
Long term capital gain | | | — | | | | 158,181,270 | |
| | $ | 165,982,620 | | | $ | 336,052,540 | |
| | | | |
| franklintempleton.com | | Annual Report | | 117 |
FRANKLIN CUSTODIAN FUNDS
NOTES TO FINANCIAL STATEMENTS
5. Income Taxes (continued)
At September 30, 2017, the cost of investments, net unrealized appreciation (depreciation), undistributed ordinary income and undistributed long term capital gains for income tax purposes were as follows:
| | | | | | | | | | | | |
| | | Franklin
DynaTech Fund | | | Franklin
Growth Fund | | | Franklin
Income Fund | |
Cost of investments | | $ | 2,096,761,444 | | | $ | 5,648,940,398 | | | $ | 77,550,402,123 | |
| | | |
Unrealized appreciation | | $ | 1,990,611,812 | | | $ | 8,449,218,719 | | | $ | 9,281,152,014 | |
Unrealized depreciation | | | (1,310,359 | ) | | | (98,565,035 | ) | | | (3,635,025,959 | ) |
Net unrealized appreciation (depreciation) | | $ | 1,989,301,453 | | | $ | 8,350,653,684 | | | $ | 5,646,126,055 | |
| | | |
Undistributed ordinary income | | $ | — | | | $ | 48,778,249 | | | $ | 96,586,913 | |
Undistributed long term capital gains | | | 71,487,459 | | | | 252,512,397 | | | | — | |
Distributable earnings | | $ | 71,487,459 | | | $ | 301,290,646 | | | $ | 96,586,913 | |
| | | | | | | | |
| | |
| | | Franklin
U.S. Government
Securities Fund | | | Franklin
Utilities Fund | |
| | |
Cost of investments | | $ | 5,629,763,326 | | | $ | 3,597,726,903 | |
| | |
Unrealized appreciation | | $ | 133,518,447 | | | $ | 2,923,790,972 | |
Unrealized depreciation | | | (26,593,094 | ) | | | (64,477,133 | ) |
Net unrealized appreciation (depreciation) | | $ | 106,925,353 | | | $ | 2,859,313,839 | |
| | |
Undistributed ordinary income | | $ | 905,665 | | | $ | 18,572,415 | |
Undistributed long term capital gains | | | — | | | | 76,545,072 | |
Distributable earnings | | $ | 905,665 | | | $ | 95,117,487 | |
Differences between income and/or capital gains as determined on a book basis and a tax basis are primarily due to differing treatments of paydown losses, bond discounts and premiums, corporate actions, equity-linked securities and wash sales.
Franklin Growth Fund and Franklin Utilities Fund utilized a tax accounting practice to treat a portion of the proceeds from capital shares redeemed as a distribution from realized capital gains.
6. Investment Transactions
Purchases and sales of investments (excluding short term securities) for the year ended September 30, 2017, were as follows:
| | | | | | | | | | | | | | | | | | | | |
| | | Franklin
DynaTech Fund | | | Franklin
Growth Fund | | | Franklin
Income Fund | | | Franklin
U.S. Government
Securities Fund | | | Franklin
Utilities Fund | |
Purchases | | | $828,622,520 | | | | $691,949,506 | | | | $26,684,120,509 | | | | $5,222,269,690 | | | | $ 56,250,375 | |
Sales | | | $658,405,478 | | | | $802,572,617 | | | | $32,083,370,995 | | | | $5,920,302,083 | | | | $359,861,678 | |
At September 30, 2017, in connection with securities lending transactions, Franklin Income Fund loaned corporate bonds and notes and received $62,241,837 of cash collateral. The gross amount of recognized liability for such transactions is included in payable upon return of securities loaned in the Statements of Assets and Liabilities. The agreements can be terminated at any time.
| | | | |
| 118 | | Annual Report | | franklintempleton.com |
FRANKLIN CUSTODIAN FUNDS
NOTES TO FINANCIAL STATEMENTS
7. Credit Risk
At September 30, 2017, Franklin Income Fund had 35.7% of its portfolio invested in high yield securities, senior secured floating rate notes, or other securities rated below investment grade and unrated securities, if any. These securities may be more sensitive to economic conditions causing greater price volatility and are potentially subject to a greater risk of loss due to default than higher rated securities.
8. Unfunded Loan Commitments
Certain or all Funds enter into certain credit agreements, all or a portion of which may be unfunded. The Funds are obligated to fund these loan commitments at the borrowers’ discretion. Unfunded loan commitments and funded portions of credit agreements are marked to market daily and any unrealized appreciation or depreciation is included in the Statements of Assets and Liabilities and the Statements of Operations. Funded portions of credit agreements are presented in the Statements of Investments.
At September 30, 2017, unfunded commitments were as follows:
| | | | |
| Borrower | | Unfunded
Commitment | |
Franklin Income Fund | | | | |
Avantor Performance Materials Holdings Inc., Unsecured Bridge Loan | | $ | 250,000,000 | |
PetroQuest Energy Inc., Mutlidraw Term Loan Facility | | | 20,000,000 | |
| | $ | 270,000,000 | |
9. Other Derivative Information
At September 30, 2017, Franklin Income Fund’s investments in derivative contracts are reflected in the Statements of Assets and Liabilities as follows:
| | | | | | | | | | | | |
| | | Asset Derivatives | | | | | Liability Derivatives | | | |
Derivative Contracts Not Accounted for as Hedging Instruments | | Statement of Assets and Liabilities Location | | Fair Value | | | Statement of Assets and Liabilities Location | | Fair Value | |
Equity contracts | | Investments in securities, at value | | | $16,000,000a | | | Options written, at value | | | $15,015,000 | |
aPurchased option contracts are included in investments in securities, at value in the Statements of Assets and Liabilities.
For the year ended September 30, 2017, the effect of derivative contracts in Franklin Income Fund’s Statements of Operations was as follows:
| | | | | | | | | | | | |
Derivative Contracts Not Accounted for as Hedging Instruments | | Statement of Operations Location | | Net Realized
Gain (Loss) for
the Year | | | Statement of Operations Location | | Net Change in
Unrealized
Appreciation
(Depreciation)
for the Year | |
| | Net realized gain (loss) from: | | | | | | Net change in unrealized appreciation (depreciation) on: | | | | |
Equity contracts | | Investments | | $ | (127,627,544 | )a | | Investments | | $ | 32,093,770a | |
| | Written options | | | 63,267,270 | | | Written options | | | (11,689,377) | |
Totals | | | | $ | (64,360,274 | ) | | | | $ | 20,404,393 | |
aPurchased option contracts are included in net realized gain (loss) from investments and net change in unrealized appreciation (depreciation) on investments in the Statements of Operations.
| | | | |
| franklintempleton.com | | Annual Report | | 119 |
FRANKLIN CUSTODIAN FUNDS
NOTES TO FINANCIAL STATEMENTS
9. Other Derivative Information (continued)
See Note 1(e) regarding derivative financial instruments.
10. Holdings of 5% Voting Securities of Portfolio Companies
The 1940 Act defines “affiliated companies” to include investments in portfolio companies in which a fund owns 5% or more of the outstanding voting securities. During the year ended September 30, 2017, investments in “affiliated companies” were as follows:
| | | | | | | | | | | | | | | | | | | | | | | | | | | | | | | | |
| Name of Issuer | | Number of
Shares/
Principal
Amount* Held
at Beginning
of Year | | | Gross
Additions | | | Gross
Reductions | | | Number of
Shares/
Principal
Amount* Held
at End of Year | | | Value at End of Year | | | Investment
Income | | | Realized Gain (Loss) | | | Net Change in Unrealized
Appreciation
(Depreciation) | |
Franklin Income Fund | | | | | | | | | | | | | | | | | | | | | | | | | | | | | |
Controlled Affiliatesa | | | | | | | | | | | | | | | | | | | | | | | | | | | | | |
| | | | | | | | |
| | | | | | | | | | | | | | | | | | | | | | | Dividends | | | | | | | | | |
Stone Energy Corp. | | | — | | | | 6,151,402 | b | | | — | | | | 6,151,402 | | | $ | 178,759,742 | | | $ | — | | | $ | — | | | $ | (46,273,623 | ) |
| | | | | | | | |
| | | | | | | | | | | | | | | | | | | | | | | Interest | | | | | | | | | |
Stone Energy Corp., senior note, 7.50%, 5/31/22 | | | — | | | | 72,845,556 | b | | | — | | | | 72,845,556 | | | | 70,660,189 | | | | 14,662,474 | c | | | — | | | | (3,756,984 | ) |
Total Controlled Affiliates | | | | | | | | | | | $ | 249,419,931 | | | $ | 14,662,474 | | | $ | — | | | $ | (50,030,607 | ) |
| | | | | | | |
Non-Controlled Affiliates | | | | | | | | | | | | | | | | | | | | | | | | | | | | | |
| | | | | | | | |
| | | | | | | | | | | | | | | | | | | | | | | Dividends | | | | | | | | | |
CEVA Holdings LLC | | | 91,371 | | | | — | | | | (10,000 | ) | | | 81,371 | | | $ | 36,616,977 | | | $ | — | | | $ | (24,859,813 | ) | | $ | 33,746,821 | |
CEVA Holdings LLC, cvt. pfd., A-1, 2/20/49 | | | 2,897 | | | | — | | | | — | | | | 2,897 | | | | 1,796,295 | | | | — | | | | — | | | | 347,670 | |
CEVA Holdings LLC, cvt. pfd., A-2, 2/20/49 | | | 110,565 | | | | — | | | | — | | | | 110,565 | | | | 49,754,286 | | | | — | | | | — | | | | 11,056,508 | |
Energy XXI Gulf Coast Inc. | | | — | | | | 7,259,184 | b | | | (259,184 | ) | | | 7,000,000 | | | | 72,380,000 | | | | — | | | | (26,391,050 | ) | | | (244,184,332 | ) |
Goodrich Petroleum Corp. | | | — | | | | 2,303,000 | b | | | (42,141 | ) | | | 2,260,859 | | | | 21,952,941 | | | | — | | | | 215,729 | | | | 1,960,199 | |
Halcon Resources Corp. | | | 28,306,773 | | | | — | | | | (5,806,773 | ) | | | 22,500,000 | | | | 153,000,000 | | | | — | | | | (69,103,783 | ) | | | 25,601,383 | |
PetroQuest Energy Inc. | | | 1,283,318 | | | | — | | | | (1,283,318 | ) | | | — | | | | — | | | | — | | | | 347,113 | | | | — | |
Rex Energy Corp. | | | 6,194,262 | | | | 2,520,000 | b | | | (8,714,262 | ) | | | — | | | | — | | | | — | | | | (137,389,987 | ) | | | — | |
Rex Energy Corp. | | | 2,520,000 | | | | — | | | | (2,520,000 | )b | | | — | | | | — | | | | — | | | | — | | | | — | |
W&T Offshore Inc. | | | 28,041,726 | | | | — | | | | (18,041,726 | ) | | | 10,000,000 | | | | 30,500,000 | | | | — | | | | (49,380,362 | ) | | | 71,746,215 | |
| | | | | | | | | | | | | | | | | | $ | 366,000,499 | | | $ | — | | | $ | (306,562,153 | ) | | $ | (99,725,536 | ) |
| | | | |
| 120 | | Annual Report | | franklintempleton.com |
FRANKLIN CUSTODIAN FUNDS
NOTES TO FINANCIAL STATEMENTS
| | | | | | | | | | | | | | | | | | | | | | | | | | | | | | | | |
| Name of Issuer | | Number of
Shares/
Principal
Amount* Held
at Beginning
of Year | | | Gross
Additions | | | Gross
Reductions | | | Number of
Shares/
Principal
Amount* Held
at End
of Year | | | Value at End of Year | | | Investment
Income | | | Realized
Gain (Loss) | | | Net Change in
Unrealized
Appreciation
(Depreciation) | |
Franklin Income Fund (continued) | | | | | | | | | | | | | | | | | | | | | | | | | |
Non-Controlled Affiliates (continued) | | | | | | | | | | | | | | | | | | | | | |
| | | | | | | | | | | | | | | | | | | | | | | Interest | | | | | | | | | |
Halcon Resources Corp., secured note, second lien, 144A, 8.625%, 2/01/20 | | | 190,000,000 | | | | — | | | | (190,000,000 | )b | | | — | | | $ | — | | | $ | 7,693,021 | | | $ | 25,380,040 | | | $ | — | |
Halcon Resources Corp., senior note, 144A, 6.75%, 2/15/25 | | | — | | | | 108,000,000 | b | | | — | | | | 108,000,000 | | | | 112,320,000 | | | | 4,906,500 | | | | — | | | | 6,616,715 | |
PetroQuest Energy Inc., secured note, second lien, 144A, 10.00%, 2/15/21 | | | — | | | | 12,093,000 | | | | (12,093,000 | )b | | | — | | | | — | | | | — | | | | — | | | | — | |
PetroQuest Energy Inc., secured note, second lien, 144A, PIK, 10.00%, 2/15/21 | | | 58,725,000 | | | | 2,026,012 | | | | (60,751,012 | )b | | | — | | | | — | | | | — | | | | — | | | | — | |
Rex Energy Corp., second lien, 1.00% to 10/01/17, 8.00% thereafter, 10/01/20 | | | 110,000,000 | | | | — | | | | (1,000,000 | ) | | | 109,000,000 | | | | — | d | | | — | | | | 385,809 | | | | — | d |
W&T Offshore Inc., Second Lien Term Loan, 5/15/20 | | | 151,850,000 | | | | 10,000,000 | | | | — | | | | 161,850,000 | | | | 145,665,000 | | | | 14,165,033 | | | | — | | | | 36,825,379 | |
W&T Offshore Inc., secured note, second lien, 144A, PIK, 10.75%, 5/15/20 | | | 74,140,000 | | | | 1,505,453 | b | | | — | | | | 75,645,453 | | | | 64,734,187 | | | | 5,994,312 | c | | | — | | | | 41,662,727 | |
W&T Offshore Inc., senior note, 8.50%, 6/15/19 | | | — | | | | 15,568,000 | | | | — | | | | 15,568,000 | | | | 13,777,680 | | | | 155,875 | | | | — | | | | 1,351,099 | |
W&T Offshore Inc., senior secured note, third lien, 144A, PIK, 10.00%, 6/15/21 | | | 65,903,000 | | | | 1,794,026 | b | | | — | | | | 67,697,026 | | | | 49,018,203 | | | | 4,293,205 | c | | | — | | | | 19,609,566 | |
W&T Offshore Inc., senior secured, 1.5 Lien Term Loan, 11/15/19 | | | 75,000,000 | | | | — | | | | — | | | | 75,000,000 | | | | 76,875,000 | | | | 8,244,318 | | | | — | | | | 1,476,750 | |
| | | | | | | | | | | | | | | | | | $ | 462,390,070 | | | $ | 45,452,264 | | | $ | 25,765,849 | | | $ | 107,542,236 | |
Total Non-Controlled Affiliates | | | | | | | | | | | $ | 828,390,569 | | | $ | 45,452,264 | | | $ | (280,796,304 | ) | | $ | 7,816,700 | |
Total Affiliated Securities (Value is 1.3% of Net Assets) | | | | | | | $ | 1,077,810,500 | | | $ | 60,114,738 | | | $ | (280,796,304 | ) | | $ | (42,213,907 | ) |
| | | | |
| franklintempleton.com | | Annual Report | | 121 |
FRANKLIN CUSTODIAN FUNDS
NOTES TO FINANCIAL STATEMENTS
10. Holdings of 5% Voting Securities of Portfolio Companies (continued)
*In U.S. dollars unless otherwise indicated.
aIssuer in which the Fund owns 25% or more of the outstanding voting securities.
bGross addition/reduction was the result of various corporate actions.
cIncludes non-cash dividend/interest received.
dAs of September 30, 2017, no longer an affiliate.
11. Credit Facility
The Funds, together with other U.S. registered and foreign investment funds (collectively, Borrowers), managed by Franklin Templeton Investments, are borrowers in a joint syndicated senior unsecured credit facility totaling $2 billion (Global Credit Facility) which matures on February 9, 2018. This Global Credit Facility provides a source of funds to the Borrowers for temporary and emergency purposes, including the ability to meet future unanticipated or unusually large redemption requests.
Under the terms of the Global Credit Facility, the Funds shall, in addition to interest charged on any borrowings made by the Funds and other costs incurred by the Funds, pay their share of fees and expenses incurred in connection with the implementation and maintenance of the Global Credit Facility, based upon their relative share of the aggregate net assets of all of the Borrowers, including an annual commitment fee of 0.15% based upon the unused portion of the Global Credit Facility. These fees are reflected in other expenses in the Statements of Operations. During the year ended September 30, 2017, the Funds did not use the Global Credit Facility.
12. Fair Value Measurements
The Funds follow a fair value hierarchy that distinguishes between market data obtained from independent sources (observable inputs) and the Funds’ own market assumptions (unobservable inputs). These inputs are used in determining the value of the Funds’ financial instruments and are summarized in the following fair value hierarchy:
| | • | | Level 1 – quoted prices in active markets for identical financial instruments |
| | • | | Level 2 – other significant observable inputs (including quoted prices for similar financial instruments, interest rates, prepayment speed, credit risk, etc.) |
| | • | | Level 3 – significant unobservable inputs (including the Funds’ own assumptions in determining the fair value of financial instruments) |
The input levels are not necessarily an indication of the risk or liquidity associated with financial instruments at that level.
For movements between the levels within the fair value hierarchy, the Funds have adopted a policy of recognizing the transfers as of the date of the underlying event which caused the movement.
A summary of inputs used as of September 30, 2017, in valuing the Funds’ assets and liabilities carried at fair value, is as follows:
| | | | | | | | | | | | | | | | |
| | | Level 1 | | | Level 2 | | | Level 3 | | | Total | |
Franklin DynaTech Fund | | | | | | | | | | | | | | | | |
Assets: | | | | | | | | | | | | | | | | |
Investments in Securities: | | | | | | | | | | | | | | | | |
Equity Investmentsa | | $ | 3,995,478,639 | | | $ | — | | | $ | — | | | $ | 3,995,478,639 | |
Short Term Investments | | | 90,584,258 | | | | — | | | | — | | | | 90,584,258 | |
Total Investments in Securities | | $ | 4,086,062,897 | | | $ | — | | | $ | — | | | $ | 4,086,062,897 | |
| | | | |
| 122 | | Annual Report | | franklintempleton.com |
FRANKLIN CUSTODIAN FUNDS
NOTES TO FINANCIAL STATEMENTS
| | | | | | | | | | | | | | | | |
| | | Level 1 | | | Level 2 | | | Level 3 | | | Total | |
Franklin Growth Fund | | | | | | | | | | | | | | | | |
Assets: | | | | | | | | | | | | | | | | |
Investments in Securities: | | | | | | | | | | | | | | | | |
Equity Investmentsa,b | | $ | 13,667,813,359 | | | $ | — | | | $ | — | | | $ | 13,667,813,359 | |
Short Term Investments | | | 331,780,723 | | | | — | | | | — | | | | 331,780,723 | |
Total Investments in Securities | | $ | 13,999,594,082 | | | $ | — | | | $ | — | | | $ | 13,999,594,082 | |
| | | | |
Franklin Income Fund | | | | | | | | | | | | | | | | |
Assets: | | | | | | | | | | | | | | | | |
Investments in Securities: | | | | | | | | | | | | | | | | |
Equity Investments:b | | | | | | | | | | | | | | | | |
Financials | | $ | 5,513,362,291 | | | $ | 91,375,000 | | | $ | — | | | $ | 5,604,737,291 | |
Industrials | | | 2,907,446,274 | | | | 88,167,558 | | | | — | | | | 2,995,613,832 | |
All Other Equity Investmentsa | | | 26,442,962,832 | | | | — | | | | — | | | | 26,442,962,832 | |
Equity-Linked Securities | | | — | | | | 10,016,836,730 | | | | — | | | | 10,016,836,730 | |
Convertible Bonds | | | — | | | | 641,034,440 | | | | — | | | | 641,034,440 | |
Corporate Bonds | | | — | | | | 29,225,557,075 | | | | — | | | | 29,225,557,075 | |
Senior Floating Rate Interests | | | — | | | | 3,352,352,569 | | | | — | | | | 3,352,352,569 | |
Escrows and Litigation Trusts | | | — | | | | — | | | | — | c | | | — | |
Options Purchased | | | 16,000,000 | | | | — | | | | — | | | | 16,000,000 | |
Short Term Investments | | | 4,907,858,572 | | | | 8,589,837 | | | | — | | | | 4,916,448,409 | |
Total Investments in Securities | | $ | 39,787,629,969 | | | $ | 43,423,913,209 | | | $ | — | | | $ | 83,211,543,178 | |
| | | | |
Liabilities: | | | | | | | | | | | | | | | | |
Other Financial Instruments: | | | | | | | | | | | | | | | | |
Options Written | | $ | 15,015,000 | | | $ | — | | | $ | — | | | $ | 15,015,000 | |
Unfunded Loan Commitments | | | — | | | | 1,875,000 | | | | — | | | | 1,875,000 | |
Total Other Financial Instruments | | $ | 15,015,000 | | | $ | 1,875,000 | | | $ | — | | | $ | 16,890,000 | |
| | | | |
Franklin U.S. Government Securities Fund | | | | | | | | | | | | | | | | |
Assets: | | | | | | | | | | | | | | | | |
Investments in Securities: | | | | | | | | | | | | | | | | |
Mortgage-Backed Securities | | $ | — | | | $ | 5,556,393,224 | | | $ | — | | | $ | 5,556,393,224 | |
U.S. Government and Agency Securities | | | — | | | | 89,614,160 | | | | — | | | | 89,614,160 | |
Short Term Investments | | | 90,681,295 | | | | — | | | | — | | | | 90,681,295 | |
Total Investments in Securities | | $ | 90,681,295 | | | $ | 5,646,007,384 | | | $ | — | | | $ | 5,736,688,679 | |
| | | | |
Franklin Utilities Fund | | | | | | | | | | | | | | | | |
Assets: | | | | | | | | | | | | | | | | |
Investments in Securities: | | | | | | | | | | | | | | | | |
Equity Investmentsa | | $ | 6,386,101,202 | | | $ | — | | | $ | — | | | $ | 6,386,101,202 | |
Corporate Bonds | | | — | | | | 49,812,434 | | | | — | | | | 49,812,434 | |
Short Term Investments | | | 21,127,106 | | | | — | | | | — | | | | 21,127,106 | |
Total Investments in Securities | | $ | 6,407,228,308 | | | $ | 49,812,434 | | | $ | — | | | $ | 6,457,040,742 | |
aFor detailed categories, see the accompanying Statement of Investments.
bIncludes common, preferred and convertible preferred stocks and management investment companies.
cIncludes securities determined to have no value at September 30, 2017.
A reconciliation of assets in which Level 3 inputs are used in determining fair value is presented when there are significant Level 3 financial instruments at the beginning and/or end of the year.
| | | | |
| franklintempleton.com | | Annual Report | | 123 |
FRANKLIN CUSTODIAN FUNDS
NOTES TO FINANCIAL STATEMENTS
| 13. | New Accounting Pronouncements |
In March 2017, the Financial Accounting Standards Board issued Accounting Standards Update (ASU) No. 2017-08, Receivables—Nonrefundable Fees and Other Costs (Subtopic 310-20): Premium Amortization on Purchased Callable Debt Securities. The amendments in the ASU shorten the amortization period for certain callable debt securities acquired at a premium, to be amortized to the earliest call date. The ASU does not require an accounting change for securities acquired at a discount, which continues to be amortized to maturity. The ASU is effective for fiscal years and interim periods within those fiscal years beginning after December 15, 2018. Management is currently evaluating the impact, if any, of applying this provision.
The Funds have evaluated subsequent events through the issuance of the financial statements and determined that no events have occurred that require disclosure.
Abbreviations
| | | | | | | | | | |
| Exchange | | Currency | | Selected Portfolio |
| CBOE | | Chicago Board Options Exchange | | CAD | | Canadian Dollar | | ADR | | American Depositary Receipt |
| | | | EUR | | Euro | | FHLMC | | Federal Home Loan Mortgage Corp. |
| | | | GBP | | British Pound | | FNMA | | Federal National Mortgage Association |
| | | | USD | | United States Dollar | | FRN | | Floating Rate Note |
| | | | | | | | L/C | | Letter of Credit |
| | | | | | | | LIBOR | | London InterBank Offered Rate |
| | | | | | | | PIK | | Payment-In-Kind |
| | | | | | | | SF | | Single Family |
| | | | |
| 124 | | Annual Report | | franklintempleton.com |
FRANKLIN CUSTODIAN FUNDS
Report of Independent Registered Public Accounting Firm
To the Board of Trustees of Franklin Custodian Funds and Shareholders of the Franklin DynaTech Fund, Franklin Growth Fund, Franklin Income Fund, Franklin U.S. Government Securities Fund, and Franklin Utilities Fund:
In our opinion, the accompanying statements of assets and liabilities, including the statements of investments, and the related statements of operations and of changes in net assets and the financial highlights present fairly, in all material respects, the financial position of the Franklin DynaTech Fund, Franklin Growth Fund, Franklin Income Fund, Franklin U.S. Government Securities Fund and Franklin Utilities Fund (the “Funds”) as of September 30, 2017, the results of each of their operations for the year then ended, the changes in each of their net assets for each of the two years in the period then ended and the financial highlights for each of the periods indicated, in conformity with accounting principles generally accepted in the United States of America. These financial statements and financial highlights (hereafter referred to as “financial statements”) are the responsibility of the Funds’ management. Our responsibility is to express an opinion on these financial statements based on our audits. We conducted our audits of these financial statements in accordance with the standards of the Public Company Accounting Oversight Board (United States). Those standards require that we plan and perform the audit to obtain reasonable assurance about whether the financial statements are free of material misstatement. An audit includes examining, on a test basis, evidence supporting the amounts and disclosures in the financial statements, assessing the accounting principles used and significant estimates made by management, and evaluating the overall financial statement presentation. We believe that our audits, which included confirmation of securities as of September 30, 2017 by correspondence with the custodian, transfer agent and brokers, provide a reasonable basis for our opinion.
PricewaterhouseCoopers LLP
San Francisco, California
November 15, 2017
| | | | |
| franklintempleton.com | | Annual Report | | 125 |
FRANKLIN CUSTODIAN FUNDS
Tax Information (unaudited)
Under Section 852(b)(3)(C) of the Internal Revenue Code (Code), the Funds hereby report the maximum amount allowable but no less than the following amounts as long term capital gain dividends for the fiscal year ended September 30, 2017:
| | | | | | | | | | |
Franklin DynaTech Fund | | | Franklin Growth Fund | | | Franklin Utilities Fund | |
| | $99,169,960 | | | | $404,787,633 | | | | $10,374,417 | |
Under Section 871(k)(2)(C) of the Code, Franklin Utilities Fund hereby reports the maximum amount allowable but no less than $3,519,273 as short term capital gain dividends for purposes of the tax imposed under Section 871(a)(1)(A) of the Code for the fiscal year ended September 30, 2017.
Under Section 854(b)(1)(A) of the Code, the Funds hereby report the following percentage amounts of the ordinary income dividends as income qualifying for the dividends received deduction for the fiscal year ended September 30, 2017:
| | | | | | | | | | |
Franklin Growth Fund | | | Franklin Income Fund | | | Franklin Utilities Fund | |
| | 100% | | | | 23.52% | | | | 100% | |
Under Section 854(b)(1)(B) of the Code, the Funds hereby report the maximum amount allowable but no less than the following amounts as qualified dividends for purposes of the maximum rate under Section 1(h)(11) of the Code for the fiscal year ended September 30, 2017:
| | | | | | | | | | | | | | |
Franklin DynaTech Fund | | | Franklin Growth Fund | | | Franklin Income Fund | | | Franklin Utilities Fund | |
| | $15,786,828 | | | | $166,384,461 | | | | $1,515,032,068 | | | | $226,142,398 | |
Distributions, including qualified dividend income, paid during calendar year 2017 will be reported to shareholders on Form 1099-DIV by mid-February 2018. Shareholders are advised to check with their tax advisors for information on the treatment of these amounts on their individual income tax returns.
Under Section 871(k)(1)(C) of the Code, the Funds hereby report the maximum amount allowable but no less than the following amounts as interest related dividends for purposes of the tax imposed under Section 871(a)(1)(A) of the Code for the fiscal year ended September 30, 2017:
| | | | | | |
Franklin Income Fund | | | Franklin U.S. Government Securities Fund | |
| | $1,726,415,450 | | | | $182,706,463 | |
| | | | |
| 126 | | Annual Report | | franklintempleton.com |
FRANKLIN CUSTODIAN FUNDS
Board Members and Officers
The name, year of birth and address of the officers and board members, as well as their affiliations, positions held with the Trust, principal occupations during at least the past five years and number of US registered portfolios overseen in the Franklin Templeton Investments fund complex, are shown below. Generally, each board member serves until that person’s successor is elected and qualified.
Independent Board Members
| | | | | | | | |
Name, Year of Birth
and Address | | Position | | Length of
Time Served | | Number of Portfolios in
Fund Complex Overseen
by Board Member* | | Other Directorships Held During at Least the Past 5 Years |
| | | | |
Harris J. Ashton (1932) One Franklin Parkway San Mateo, CA 94403-1906 | | Trustee | | Since 1976 | | 140 | | Bar-S Foods (meat packing company) (1981-2010). |
|
Principal Occupation During at Least the Past 5 Years: Director of various companies; and formerly, Director, RBC Holdings, Inc. (bank holding company) (until 2002); and President, Chief Executive Officer and Chairman of the Board, General Host Corporation (nursery and craft centers) (until 1998). |
| | | | |
Mary C. Choksi (1950) One Franklin Parkway San Mateo, CA 94403-1906 | | Trustee | | Since 2014 | | 134 | | Avis Budget Group Inc. (car rental) (2007-present), Omnicom Group Inc. (advertising and marketing communications services) (2011-present) and White Mountains Insurance Group, Ltd. (holding company) August 2017-present). |
|
Principal Occupation During at Least the Past 5 Years: Director of various companies; and formerly, Founder and Senior Advisor, Strategic Investment Group (investment management group) (2015-2017); Founding Partner and Senior Managing Director, Strategic Investment Group (1987–2015); Founding Partner and Managing Director, Emerging Markets Management LLC (investment management firm) (1987-2011); and Loan Officer/Senior Loan Officer/Senior Pension Investment Officer, World Bank Group (international financial institution) (1977-1987). |
| | | | |
Edith E. Holiday (1952) One Franklin Parkway San Mateo, CA 94403-1906 | | Trustee | | Since 1998 | | 140 | | Hess Corporation (exploration of oil and gas) (1993-present), Canadian National Railway (railroad) (2001-present), White Mountains Insurance Group, Ltd. (holding company) (2004-present), Santander Consumer USA Holdings, Inc. (consumer finance) (2016-present), RTI International Metals, Inc. (manufacture and distribution of titanium) (1999-2015) and H.J. Heinz Company (processed foods and allied products) (1994-2013). |
|
Principal Occupation During at Least the Past 5 Years: Director or Trustee of various companies and trusts; and formerly, Assistant to the President of the United States and Secretary of the Cabinet (1990-1993); General Counsel to the United States Treasury Department (1989-1990); and Counselor to the Secretary and Assistant Secretary for Public Affairs and Public Liaison-United States Treasury Department (1988-1989). |
| | | | |
J. Michael Luttig (1954) One Franklin Parkway San Mateo, CA 94403-1906 | | Trustee | | Since 2009 | | 140 | | Boeing Capital Corporation (aircraft financing) (2006-2013). |
|
Principal Occupation During at Least the Past 5 Years: Executive Vice President, General Counsel and member of the Executive Council, The Boeing Company (aerospace company) (2006- present); and formerly, Federal Appeals Court Judge, U.S. Court of Appeals for the Fourth Circuit (1991-2006). |
| | | | | | |
| franklintempleton.com | | Annual Report | | | 127 | |
FRANKLIN CUSTODIAN FUNDS
Independent Board Members (continued)
| | | | | | | | |
Name, Year of Birth
and Address | | Position | | Length of
Time Served | | Number of Portfolios in
Fund Complex Overseen
by Board Member* | | Other Directorships Held During at Least the Past 5 Years |
| | | | |
Larry D. Thompson (1945) One Franklin Parkway San Mateo, CA 94403-1906 | | Trustee | | Since 2007 | | 140 | | The Southern Company (energy company) (2014-present; previously 2010-2012), Graham Holdings Company (education and media organization) (2011-present) and Cbeyond, Inc. (business communications provider) (2010-2012). |
|
Principal Occupation During at Least the Past 5 Years: Director of various companies; Counsel, Finch McCranie, LLP (law firm) (2015-present); Independent Compliance Monitor and Auditor, Volkswagen AG (manufacture of automobiles and commercial vehicles) (April 2017 – present); John A. Sibley Professor of Corporate and Business Law, University of Georgia School of Law (2015-present; previously 2011-2012); and formerly, Executive Vice President - Government Affairs, General Counsel and Corporate Secretary, PepsiCo, Inc. (consumer products) (2012-2014); Senior Vice President - Government Affairs, General Counsel and Secretary, PepsiCo, Inc. (2004-2011); Senior Fellow of The Brookings Institution (2003-2004); Visiting Professor, University of Georgia School of Law (2004); and Deputy Attorney General, U.S. Department of Justice (2001-2003). |
| | | | |
John B. Wilson (1959) One Franklin Parkway San Mateo, CA 94403-1906 | | Lead Independent Trustee | | Trustee since 2007 and Lead Independent Trustee since 2008 | | 114 | | None |
|
Principal Occupation During at Least the Past 5 Years: President and Founder, Hyannis Port Capital, Inc. (real estate and private equity investing)(2002-present); serves on private and non-profit boards; and formerly, President, Staples International and Head of Global Transformation (office supplies) (2012-2016); Chief Operating Officer and Executive Vice President, Gap, Inc. (retail) (1996-2000); Chief Financial Officer and Executive Vice President – Finance and Strategy, Staples, Inc. (1992-1996); Senior Vice President – Corporate Planning, Northwest Airlines, Inc. (airlines) (1990-1992); and Vice President and Partner, Bain & Company (consulting firm) (1986-1990) |
|
Interested Board Members and Officers |
Name, Year of Birth
and Address | | Position | | Length of
Time Served | | Number of Portfolios in
Fund Complex Overseen
by Board Member* | | Other Directorships Held During at Least the Past 5 Years |
| | | | |
**Gregory E. Johnson (1961) One Franklin Parkway San Mateo, CA 94403-1906 | | Trustee | | Since 2013 | | 156 | | None |
|
Principal Occupation During at Least the Past 5 Years: Chairman of the Board, Member - Office of the Chairman, Director and Chief Executive Officer, Franklin Resources, Inc.; officer and/or director or trustee, as the case may be, of some of the other subsidiaries of Franklin Resources, Inc. and of 44 of the investment companies in Franklin Templeton Investments; Vice Chairman, Investment Company Institute; and formerly, President, Franklin Resources, Inc. (1994-2015). |
| | | | |
**Rupert H. Johnson, Jr. (1940) One Franklin Parkway San Mateo, CA 94403-1906 | | Chairman of the Board, Trustee and Vice President | | Chairman of the Board since 2013, Trustee since 1983 and Vice President since 1982 | | 140 | | None |
|
Principal Occupation During at Least the Past 5 Years: Vice Chairman, Member - Office of the Chairman and Director, Franklin Resources, Inc.; Director, Franklin Advisers, Inc.; Senior Vice President, Franklin Advisory Services, LLC; and officer and/or director or trustee, as the case may be, of some of the other subsidiaries of Franklin Resources, Inc. and of 42 of the investment companies in Franklin Templeton Investments. |
| | | | |
Alison E. Baur (1964) One Franklin Parkway San Mateo, CA 94403-1906 | | Vice President | | Since 2012 | | Not Applicable | | Not Applicable |
|
Principal Occupation During at Least the Past 5 Years: Deputy General Counsel, Franklin Templeton Investments; and officer of some of the other subsidiaries of Franklin Resources, Inc. and of 45 of the investment companies in Franklin Templeton Investments. |
| | | | |
| 128 | | Annual Report | | franklintempleton.com |
FRANKLIN CUSTODIAN FUNDS
Interested Board Members and Officers (continued)
| | | | | | | | |
Name, Year of Birth
and Address | | Position | | Length of
Time Served | | Number of Portfolios in
Fund Complex Overseen
by Board Member* | | Other Directorships Held During at Least the Past 5 Years |
| | | | |
Gaston Gardey (1967) One Franklin Parkway San Mateo, CA 94403-1906 | | Chief Financial Officer, Chief Accounting Officer and Treasurer | | Since 2009 | | Not Applicable | | Not Applicable |
|
Principal Occupation During at Least the Past 5 Years: Treasurer, U.S. Fund Administration & Reporting, Franklin Templeton Investments; and officer of 27 of the investment companies in Franklin Templeton Investments. |
| | | | |
Aliya S. Gordon (1973) One Franklin Parkway San Mateo, CA 94403-1906 | | Vice President | | Since 2009 | | Not Applicable | | Not Applicable |
|
Principal Occupation During at Least the Past 5 Years: Senior Associate General Counsel, Franklin Templeton Investments; and officer of 45 of the investment companies in Franklin Templeton Investments. |
| | | | |
Steven J. Gray (1955) One Franklin Parkway San Mateo, CA 94403-1906 | | Vice President | | Since 2009 | | Not Applicable | | Not Applicable |
|
Principal Occupation During at Least the Past 5 Years: Senior Associate General Counsel, Franklin Templeton Investments; Vice President, Franklin Templeton Distributors, Inc. and FT AlphaParity, LLC; and officer of 45 of the investment companies in Franklin Templeton Investments. |
| | | | |
Matthew T. Hinkle (1971) One Franklin Parkway San Mateo, CA 94403-1906 | | Chief Executive Officer – Finance and Administration | | Since June 2017 | | Not Applicable | | Not Applicable |
|
Principal Occupation During at Least the Past 5 Years: Senior Vice President U.S. Fund Administration Reporting & Fund Tax, Franklin Templeton Investments; officer of 45 of the investment companies in Franklin Templeton Investments; and formerly, Vice President, Global Tax (2012-April 2017) and Treasurer/Assistant Treasurer, Franklin Templeton Investments (2009-2017). |
| | | | |
Edward B. Jamieson (1948) One Franklin Parkway San Mateo, CA 94403-1906 | | President and Chief Executive Officer – Investment Management | | Since 2010 | | Not Applicable | | Not Applicable |
|
Principal Occupation During at Least the Past 5 Years: President, and Director, Franklin Advisers, Inc.; Executive Vice President, Franklin Templeton Institutional, LLC; and officer and/or trustee, as the case may be, of some of the other subsidiaries of Franklin Resources, Inc. and of 10 of the investment companies in Franklin Templeton Investments. |
| | | | |
Robert Lim (1948) One Franklin Parkway San Mateo, CA 94403-1906 | | Vice President – AML Compliance | | Since 2016 | | Not Applicable | | Not Applicable |
|
Principal Occupation During at Least the Past 5 Years: Vice President, Franklin Templeton Companies, LLC; Chief Compliance Officer, Franklin Templeton Distributors, Inc. and Franklin Templeton Investor Services, LLC; and officer of 45 of the investment companies in Franklin Templeton Investments. |
| | | | |
Kimberly H. Novotny (1972) 300 S.E. 2nd Street Fort Lauderdale, FL 33301-1923 | | Vice President | | Since 2013 | | Not Applicable | | Not Applicable |
|
Principal Occupation During at Least the Past 5 Years: Associate General Counsel, Franklin Templeton Investments; Vice President and Corporate Secretary, Fiduciary Trust International of the South; Vice President, Templeton Investment Counsel, LLC; Assistant Secretary, Franklin Resources, Inc.; and officer of 45 of the investment companies in Franklin Templeton Investments. |
| | | | | | |
| franklintempleton.com | | Annual Report | | | 129 | |
FRANKLIN CUSTODIAN FUNDS
Interested Board Members and Officers (continued)
| | | | | | | | |
Name, Year of Birth
and Address | | Position | | Length of
Time Served | | Number of Portfolios in
Fund Complex Overseen
by Board Member* | | Other Directorships Held During at Least the Past 5 Years |
| | | | |
Robert C. Rosselot (1960) 300 S.E. 2nd Street Fort Lauderdale, FL 33301-1923 | | Chief Compliance Officer | | Since 2013 | | Not Applicable | | Not Applicable |
|
Principal Occupation During at Least the Past 5 Years: Director, Global Compliance, Franklin Templeton Investments; Vice President, Franklin Templeton Companies, LLC; officer of 45 of the investment companies in Franklin Templeton Investments; and formerly, Senior Associate General Counsel, Franklin Templeton Investments (2007-2013); and Secretary and Vice President, Templeton Group of Funds (2004-2013). |
| | | | |
Karen L. Skidmore (1952) One Franklin Parkway San Mateo, CA 94403-1906 | | Vice President and Secretary | | Since 2006 | | Not Applicable | | Not Applicable |
|
Principal Occupation During at Least the Past 5 Years: Senior Associate General Counsel, Franklin Templeton Investments; and officer of 45 of the investment companies in Franklin Templeton Investments. |
| | | | |
Navid J. Tofigh (1972) One Franklin Parkway San Mateo, CA 94403-1906 | | Vice President | | Since 2015 | | Not Applicable | | Not Applicable |
|
Principal Occupation During at Least the Past 5 Years: Associate General Counsel, Franklin Templeton Investments; and officer of 45 of the investment companies in Franklin Templeton Investments. |
| | | | |
Craig S. Tyle (1960) One Franklin Parkway San Mateo, CA 94403-1906 | | Vice President | | Since 2005 | | Not Applicable | | Not Applicable |
|
Principal Occupation During at Least the Past 5 Years: General Counsel and Executive Vice President, Franklin Resources, Inc.; and officer of some of the other subsidiaries of Franklin Resources, Inc. and of 45 of the investment companies in Franklin Templeton Investments. |
| | | | |
Lori A. Weber (1964) 300 S.E. 2nd Street Fort Lauderdale, FL 33301-1923 | | Vice President | | Since 2013 | | Not Applicable | | Not Applicable |
|
Principal Occupation During at Least the Past 5 Years: Senior Associate General Counsel, Franklin Templeton Investments; Assistant Secretary, Franklin Resources, Inc.; Vice President and Secretary, Templeton Investment Counsel, LLC; and officer of 45 of the investment companies in Franklin Templeton Investments. |
*We base the number of portfolios on each separate series of the US registered investment companies within the Franklin Templeton Investments fund complex. These portfolios have a common investment manager or affiliated investment managers.
**Gregory E. Johnson is considered to be an interested person of the Fund under the federal securities laws due to his position as an officer and director of Franklin Resources, Inc. (Resources), which is the parent company of the Fund’s investment manager and distributor. Rupert H. Johnson, Jr. is considered to be an interested person of the Fund under the federal securities laws due to his position as officer and director and major shareholder of Resources.
Note 1: Rupert H. Johnson, Jr. is the uncle of Gregory E. Johnson.
Note 2: Officer information is current as of the date of this report. It is possible that after this date, information about officers may change.
Note 3: Effective November 1, 2016, Frank A. Olsen ceased to be a trustee of the Trust.
The Sarbanes-Oxley Act of 2002 and Rules adopted by the Securities and Exchange Commission require the Fund to disclose whether the Fund’s Audit Committee includes at least one member who is an audit committee financial expert within the meaning of such Act and Rules. The Fund’s Board has determined that there is at least one such financial expert on the Audit Committee and has designated John B. Wilson as its audit committee financial expert. The Board believes that Mr. Wilson qualifies as such an expert in view of his extensive business background and experience, including service as chief financial officer of Staples, Inc. from 1992 to 1996. Mr. Wilson has been a Member and Chairman of the Fund’s Audit Committee since 2006. As a result of such background and experience, the Board believes that Mr. Wilson has acquired an understanding of generally accepted accounting principles and financial statements, the general application of such principles in connection with the accounting estimates, accruals and reserves, and analyzing and evaluating financial statements that present a breadth and level of complexity of accounting issues generally comparable to those of the Fund, as well as an understanding of internal controls and procedures for financial reporting and an understanding of audit committee functions. Mr. Wilson is an independent Board member as that term is defined under the relevant Securities and Exchange Commission Rules and Releases.
The Statement of Additional Information (SAI) includes additional information about the board members and is available, without charge, upon request. Shareholders may call (800) DIAL BEN/342-5236 to request the SAI.
| | | | |
| 130 | | Annual Report | | franklintempleton.com |
FRANKLIN CUSTODIAN FUNDS
Shareholder Information
Proxy Voting Policies and Procedures
The Trust’s investment manager has established Proxy Voting Policies and Procedures (Policies) that the Trust uses to determine how to vote proxies relating to portfolio securities. Shareholders may view the Trust’s complete Policies online at franklintempleton.com. Alternatively, shareholders may request copies of the Policies free of charge by calling the Proxy Group collect at (954) 527-7678 or by sending a written request to: Franklin Templeton Companies, LLC, 300 S.E. 2nd Street, Fort Lauderdale, FL 33301, Attention: Proxy Group. Copies of the Trust’s proxy voting records are also made available online at franklintempleton.com and posted on the US Securities and Exchange Commission’s website at sec.gov and reflect the most recent 12-month period ended June 30.
Quarterly Statement of Investments
The Trust files a complete statement of investments with the US Securities and Exchange Commission for the first and third quarters for each fiscal year on Form N-Q. Shareholders may view the filed Form N-Q by visiting the Commission’s website at sec.gov. The filed form may also be viewed and copied at the Commission’s Public Reference Room in Washington, DC. Information regarding the operations of the Public Reference Room may be obtained by calling (800) SEC-0330.
Householding of Reports and Prospectuses
You will receive each Fund’s financial reports every six months as well as an annual updated summary prospectus (prospectus available upon request). To reduce Fund expenses, we try to identify related shareholders in a household and send only one copy of the financial reports and summary prospectus. This process, called “householding,” will continue indefinitely unless you instruct us otherwise. If you prefer not to have these documents householded, please call us at (800) 632-2301. At any time you may view current prospectuses/summary prospectuses and financial reports on our website. If you choose, you may receive these documents through electronic delivery.
| | | | | | |
| franklintempleton.com | | Annual Report | | | 131 | |
This page intentionally left blank.
| | | | |
 | | Annual Report and Shareholder Letter Franklin Custodian Funds Investment Manager Franklin Advisers, Inc. Distributor Franklin Templeton Distributors, Inc. (800) DIAL BEN® / 342-5236 franklintempleton.com Shareholder Services (800) 632-2301 | | |
| | | | |
Authorized for distribution only when accompanied or preceded by a summary prospectus and/or prospectus. Investors should carefully consider a fund’s investment goals, risks, charges and expenses before investing. A prospectus contains this and other information; please read it carefully before investing.
To help ensure we provide you with quality service, all calls to and from our service areas are monitored and/or recorded.
| | |
| © 2017 Franklin Templeton Investments. All rights reserved. | | FCF A 11/17 |
Contents
Annual Report
Franklin Focused Growth Fund
We are pleased to bring you Franklin Focused Growth Fund’s annual report for the fiscal year ended September 30, 2017.
Your Fund’s Goal and Main Investments
The Fund seeks capital appreciation by investing in a focused portfolio of approximately 20–50 stocks that the investment manager believes have favorable growth, quality and valuation characteristics.
Performance Overview
For the period under review, the Fund’s Advisor Class shares delivered a +22.78% cumulative total return. In comparison, the Russell 1000® Growth Index, which measures performance of those Russell 1000® Index companies with higher price-to-book ratios and higher forecasted growth values, generated a +21.94% total return.1 You can find more of the Fund’s performance data in the Performance Summary beginning on page 6.
Performance data represent past performance, which does not guarantee future results. Investment return and principal value will fluctuate, and you may have a gain or loss when you sell your shares. Current performance may differ from figures shown.
Economic and Market Overview
The US economy expanded during the 12-month period ended September 30, 2017. The economy strengthened in 2017’s second and third quarters after moderating in the previous two quarters, largely due to growth in consumer spending, business investment, exports and federal government spending. The manufacturing and services sectors expanded during the period. The unemployment rate decreased from 4.9% in September 2016 to 4.2% at period-end.2 Monthly retail sales were volatile, but were positive during most of the period. Annual inflation, as measured by the Consumer Price Index, increased from 1.5% in September 2016 to 2.2% at period-end.2
Portfolio Composition
Based on Total Net Assets as of 9/30/17
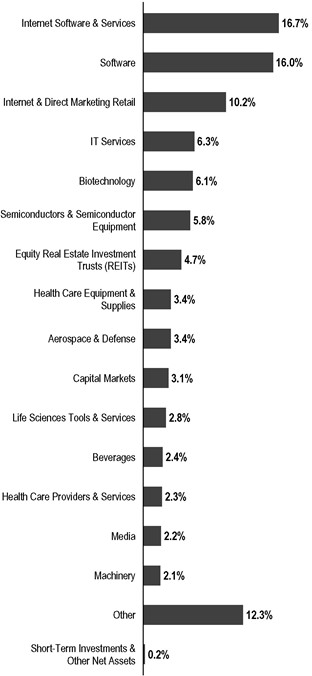
1. Source: Morningstar. Russell Investment Group is the source and owner of the trademarks, service marks and copyrights related to the Russell Indexes. Russell® is a trademark of Russell Investment Group.
The index is unmanaged and includes reinvestment of any income or distributions. It does not reflect any fees, expenses or sales charges. One cannot invest directly in an index, and an index is not representative of the Fund’s portfolio.
2. Source: Bureau of Labor Statistics.
The dollar value, number of shares or principal amount, and names of all portfolio holdings are listed in the Fund’s Statement of Investments (SOI).
The SOI begins on page 11.
FRANKLIN FOCUSED GROWTH FUND
The US Federal Reserve (Fed) raised its target range for the federal funds rate by 0.25% three times during the period, amid signs of a growing US economy, strengthening labor market and improving business spending. At its July and September 2017 meetings, the Fed kept its target range unchanged. Furthermore in September, the Fed mentioned that it would begin implementing its balance sheet reduction in October.
US equity markets rose during the 12-month period, benefiting from mostly upbeat economic data, better US corporate earnings, and signs of improvement in the Chinese and European economies. The markets were also supported by investor optimism arising from pro-growth and pro-business policy plans in the US; Emmanuel Macron’s victory in France’s presidential election; comments from the US Fed chair indicating optimism about the US economy and the likelihood of gradual rate hikes; and the Republican tax reform plan. However, concerns about the terms of the UK’s exit from the European Union (also known as “Brexit”), uncertainty about President Trump’s ability to implement reforms, and geopolitical tensions in the Middle East and the Korean Peninsula curbed market sentiment. The broad US stock market, as measured by the Standard & Poor’s® 500 Index, generated a +18.61% total return for the period.3
Investment Strategy
We are research-driven, bottom-up, fundamental investors. Under normal market conditions, we will invest predominantly in equity securities of companies that we believe offer compelling growth opportunities. The equity securities in which we will invest are predominantly common stock. We may invest in companies of any size, including small and medium capitalization companies. In addition to our main investments, we may invest a portion (up to 25%) of net assets in foreign securities. We will generally seek to maintain a portfolio consisting of securities of approximately 20–50 companies. Although we seek investments across a number of sectors, from time to time, based on economic conditions, we may have significant positions in particular sectors.
Manager’s Discussion
During the period under review, most investment sectors contributed to the Fund’s absolute performance, including information technology (IT), health care and consumer discretionary.4
Top 10 Holdings
9/30/17
| | |
Company Sector/Industry | | % of Total Net Assets |
Amazon.com Inc. Internet & Direct Marketing Retail | | 6.3% |
Visa Inc. IT Services | | 6.3% |
Facebook Inc. Internet Software & Services | | 6.1% |
Alphabet Inc. Internet Software & Services | | 5.8% |
Microsoft Corp. Software | | 4.5% |
Celgene Corp. Biotechnology | | 4.4% |
Adobe Systems Inc. Software | | 3.6% |
Salesforce.com Inc. Software | | 3.4% |
Raytheon Co. Aerospace & Defense | | 3.4% |
Tencent Holdings Ltd. Internet Software & Services | | 3.2% |
In IT, the Fund’s position in social media company Facebook helped results. Facebook’s user base and engagement continued to grow, thanks in part to the site’s use of video. Advertisers also responded well to the company’s ad format innovations, which improved targeting capabilities. Revenue and user engagement growth for Instagram, which is owned by Facebook, also helped the company’s stock performance.
Payments technology company Visa performed well partly due to better-than-expected revenue growth, which was aided by the company’s decision to push out certain client incentives into future periods. The company also benefited from its 2016 acquisition of Visa Europe. An increase in international travel drove growth in Visa Europe’s cross-border volumes, Visa’s highest margin product, while the company also held costs associated with the acquisition in check.
Microsoft contributed to performance amid a stabilization in the PC market. Investors responded well to Microsoft’s
3. Source: Morningstar.
4. The IT sector comprises internet software and services, IT services, semiconductors and semiconductor equipment, and software in the SOI. The health care sector comprises biotechnology, health care equipment and supplies, health care providers and services, and life sciences tools and services in the SOI. The consumer discretionary sector comprises internet and direct marketing retail; media; and textiles, apparel and luxury goods in the SOI.
FRANKLIN FOCUSED GROWTH FUND
transitioning its Office productivity suite to a software-as-a-service product, as well as its Azure cloud infrastructure platform. The company also did a solid job managing expense growth.
The growth of Alphabet, Google’s parent company, was due to a number of factors. Alphabet increased its share of the global advertising market due to strong performance in mobile search and YouTube, while Android’s status as a leading mobile operating system helped the company gain mobile users. The company continued to invest in potential new product lines such as self-driving car technology Waymo. Google continues to face regulatory scrutiny in Europe, but we believe the complaints will not have a meaningful negative impact on the business.
In health care, Celgene is a fully integrated, biotechnology company with a broad pipeline across hematology/oncology and inflammation/immunology. The stock performed well during the period due to steady and positive changes in fundamentals. Revenues and earnings were up, with its Revlimid product’s sales growing significantly due to label expansions in both the US and Europe. With its late-stage pipeline producing positive data, and the company’s early-stage pipeline progressing well, the company has been enjoying steady execution across all fronts. Company initiatives and favorable macroeconomic factors drove record performance for Mettler-Toledo International, which makes and markets precision instruments used in several industries. Strong earnings and revenue growth, aided by sales and services improvements, enabled the company to exceed investor expectations. In contrast to prior reporting periods, Mettler-Toledo benefited from its presence in emerging markets that previously hurt company performance, such as Brazil, Russia and China.
In consumer discretionary, global e-commerce company Amazon.com’s rapid growth was driven by its Prime member benefit program, which creates more loyal shoppers who increase their spending on the platform. Amazon also made many investments that, in our view, should benefit the company in the long term. The company aggressively increased its logistical capabilities to shorten delivery times and meet user demands, while its acquisition of Whole Foods Market dramatically increased its presence in the grocery category. Amazon also benefited from strong sales of the company’s
“smart home” Echo device as well as the continued success of Amazon Web Services, its highly-profitable cloud computing platform.
Within the industrials sector, a key contributor to Fund performance was defense company Raytheon.5 Raytheon’s strong performance during the review period was partly due to an anticipated increase in the Department of Defense’s budget. Additionally, Raytheon’s missile defense platform looked, in our opinion, increasingly attractive given the North Korean nuclear tests. The company’s cybersecurity and international defense businesses also exceeded expectations.
In contrast, the energy and materials sectors detracted from the Fund’s absolute performance during the reporting period.6 In energy, shares of Concho Resources, which develops and explores oil and natural gas properties, declined. The company was hurt by a decline in crude oil prices and fears that increasing US oil production could reverse the modest growth in global demand, though in our analysis these fears were exaggerated. We believe the company’s strong balance sheet and hedges should insulate the company’s cash flows from any further deterioration in oil prices.
In materials, construction materials provider Martin Marietta Materials was hurt by multiple factors.7 Investors lost confidence that the US government would pass a major infrastructure package, and disruptive weather events such as Hurricane Harvey delayed shipments of construction materials.
Elsewhere, Palo Alto Networks and Workday detracted from results in the IT sector.7 Palo Alto Networks, a provider of enterprise cloud applications for finance and human resources, struggled over the past year partly due to increased competition and a poorly executed reorganization of its sales force. Workday, which provides enterprise cloud applications for finance and human resources, was hampered by the 2016 US election, which led potential European customers to delay purchasing decisions.
Although the health care sector was, as a whole, a contributor to Fund performance, several stocks in that sector detracted. Edwards Lifesciences’ stock declined as its sales growth rate matured during the reporting period.7 This trend followed what had been an acceleration of sales growth in the wake of the release of results from Edwards’ “PARTNER 2A” trial in April
5. The industrials sector comprises aerospace and defense, electrical equipment, industrial conglomerates, machinery and professional services in the SOI.
6. The energy sector comprises oil, gas and consumable fuels in the SOI. The materials sector comprises chemicals in the SOI.
7. No longer held by period-end.
See www.franklintempletondatasources.com for additional data provider information.
FRANKLIN FOCUSED GROWTH FUND
2016. Dexcom’s stock suffered as its sales growth rate matured during the period.7 This deceleration followed what had been a three-year period of high sales growth that began with the October 2012 launch of Dexcom’s G4 Platinum system and the September 2015 launch of Dexcom’s G5 Mobile system. Drug developer Incyte was hurt by the Federal Drug Administration’s rejection of baricitinib, the company’s rheumatoid arthritis medication. In our view, the drug had the potential to become a popular arthritis treatment. If the company is required to run another trial, ultimate approval could take up to three years.
| | |
 | |  |
| | Matthew J. Moberg, CPA Portfolio Manager |
The foregoing information reflects our analysis, opinions and portfolio holdings as of September 30, 2017, the end of the reporting period. The way we implement our main investment strategies and the resulting portfolio holdings may change depending on factors such as market and economic conditions. These opinions may not be relied upon as investment advice or an offer for a particular security. The information is not a complete analysis of every aspect of any market, country, industry, security or the Fund. Statements of fact are from sources considered reliable, but the investment manager makes no representation or warranty as to their completeness or accuracy. Although historical performance is no guarantee of future results, these insights may help you understand our investment management philosophy.
FRANKLIN FOCUSED GROWTH FUND
Performance Summary as of September 30, 2017
The performance table and graph do not reflect any taxes that a shareholder would pay on Fund dividends, capital gain distributions, if any, or any realized gains on the sale of Fund shares. Total return reflects reinvestment of the Fund’s dividends and capital gain distributions, if any, and any unrealized gains or losses. Your dividend income will vary depending on dividends or interest paid by securities in the Fund’s portfolio, adjusted for operating expenses. Capital gain distributions are net profits realized from the sale of portfolio securities.
Performance as of 9/30/171
Cumulative total return excludes sales charges. Average annual total return includes maximum sales charges. Sales charges will vary depending on the size of the investment and the class of share purchased. Advisor Class shares are offered without sales charges.
| | | | | | |
| Share Class | | Cumulative
Total Return2 | | | Average Annual
Total Return3 |
| | |
Advisor | | | | | | |
| 1-Year | | | +22.78% | | | +22.78% |
| Since Inception (4/12/16) | | | +34.07% | | | +22.10% |
Performance data represent past performance, which does not guarantee future results. Investment return and principal value will fluctuate, and you may have a gain or loss when you sell your shares. Current performance may differ from figures shown.
See page 8 for Performance Summary footnotes.
FRANKLIN FOCUSED GROWTH FUND
PERFORMANCE SUMMARY
Total Return Index Comparison for a Hypothetical $10,000 Investment1
Total return represents the change in value of an investment over the periods shown. It includes any applicable maximum sales charge, Fund expenses, account fees and reinvested distributions. The unmanaged index includes reinvestment of any income or distributions. It differs from the Fund in composition and does not pay management fees or expenses. One cannot invest directly in an index.
Advisor Class (4/12/16–9/30/17)
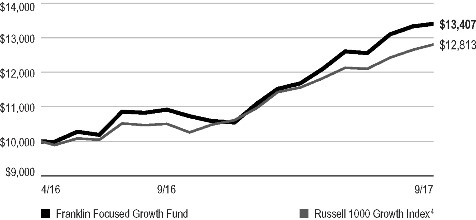
See page 8 for Performance Summary footnotes.
FRANKLIN FOCUSED GROWTH FUND
PERFORMANCE SUMMARY
Distributions (10/1/16–9/30/17)
| | | | | | |
| Share Class | | Net Investment
Income | | Short-Term
Capital Gain | | Total |
| Advisor | | $0.0103 | | $0.0276 | | $0.0379 |
Total Annual Operating Expenses5
| | | | |
| Share Class | | With Waiver | | Without Waiver |
| Advisor | | 1.00% | | 4.76% |
All investments involve risks, including possible loss of principal. The market values of securities or other investments owned by the Fund will go up or down, sometimes rapidly or unpredictably. Growth stock prices reflect projections of future earnings or revenues, and can, therefore, fall dramatically if the company fails to meet those projections. To the extent the Fund focuses on particular countries, regions, industries, sectors or types of investment from time to time, it may be subject to greater risks of adverse developments in such areas of focus than a fund that invests in a wider variety of countries, regions, industries, sectors or investments. Investments in fast-growing industries such as the information technology and health care sectors (which have historically been volatile) could result in increased price fluctuation, especially over the short term, due to the rapid pace of product change and development and changes in government regulation of companies emphasizing scientific or technological advancement or regulatory approval for new drugs and medical instruments. The Fund may also invest in small- and mid-capitalization companies, which can be particularly sensitive to changing economic conditions, and their prospects for growth are less certain than those of larger, more established companies. Foreign securities involve special risks, including currency fluctuations and economic and political uncertainties. The Fund is actively managed but there is no guarantee that the manager’s investment decisions will produce the desired results. The Fund’s prospectus also includes a description of the main investment risks.
1. The Fund has an expense reduction contractually guaranteed through 1/31/18. Fund investment results reflect the expense reduction; without this reduction the results would have been lower.
2. Cumulative total return represents the change in value of an investment over the periods indicated.
3. Average annual total return represents the average annual change in value of an investment over the periods indicated. Return for less than one year, if any, has not been annualized.
4. Source: Morningstar. Russell Investment Group is the source and owner of the trademarks, service marks and copyrights related to the Russell Indexes. Russell® is a trademark of Russell Investment Group. The Russell 1000 Growth Index is market capitalization weighted and measures performance of those Russell 1000® Index companies with higher price-to-book ratios and higher forecasted growth values.
5. Figures are as stated in the Fund’s current prospectus and may differ from the expense ratios disclosed in the Your Fund’s Expenses and Financial Highlights sections in this report. In periods of market volatility, assets may decline significantly, causing total annual Fund operating expenses to become higher than the figures shown.
See www.franklintempletondatasources.com for additional data provider information.
FRANKLIN FOCUSED GROWTH FUND
Your Fund’s Expenses
As a Fund shareholder, you can incur two types of costs: (1) transaction costs, including sales charges (loads) on Fund purchases and redemptions; and (2) ongoing Fund costs, including management fees, distribution and service (12b-1) fees, and other Fund expenses. All mutual funds have ongoing costs, sometimes referred to as operating expenses. The table below shows ongoing costs of investing in the Fund and can help you understand these costs and compare them with those of other mutual funds. The table assumes a $1,000 investment held for the six months indicated.
Actual Fund Expenses
The table below provides information about actual account values and actual expenses in the columns under the heading “Actual.” In these columns the Fund’s actual return, which includes the effect of Fund expenses, is used to calculate the “Ending Account Value.” You can estimate the expenses you paid during the period by following these steps (of course, your account value and expenses will differ from those in this illustration): Divide your account value by $1,000 (if your account had an $8,600 value, then $8,600 ÷ $1,000 = 8.6). Then multiply the result by the number in the row for your class of shares under the headings “Actual” and “Expenses Paid During Period” (if Actual Expenses Paid During Period were $7.50, then 8.6 x $7.50 = $64.50). In this illustration, the actual expenses paid this period are $64.50.
Hypothetical Example for Comparison with Other Funds
Under the heading “Hypothetical” in the table, information is provided about hypothetical account values and hypothetical expenses based on the Fund’s actual expense ratio and an assumed rate of return of 5% per year before expenses, which is not the Fund’s actual return. This information may not be used to estimate the actual ending account balance or expenses you paid for the period, but it can help you compare ongoing costs of investing in the Fund with those of other funds. To do so, compare this 5% hypothetical example for the class of shares you hold with the 5% hypothetical examples that appear in the shareholder reports of other funds.
Please note that expenses shown in the table are meant to highlight ongoing costs and do not reflect any transactional costs. Therefore, information under the heading “Hypothetical” is useful in comparing ongoing costs only, and will not help you compare total costs of owning different funds. In addition, if transactional costs were included, your total costs would have been higher.
| | | | | | | | | | | | |
| | | | | Actual | | Hypothetical | | |
| | | | | (actual return after expenses) | | (5% annual return before expenses) | | |
| | | | | | | | |
Share Class | | Beginning
Account
Value | | Ending Account Value 9/30/17 | | Expenses Paid During Period 4/1/17–9/30/171,2 | | Ending Account Value 9/30/17 | | Expenses Paid During Period 4/1/17–9/30/171,2 | | Net
Annualized
Expense
Ratio2 |
| | | | | | |
Advisor | | $1,000 | | $1,147.80 | | $5.38 | | $1,020.05 | | $5.06 | | 1.00% |
1. Expenses are equal to the annualized expense ratio for the six-month period as indicated above—in the far right column—multiplied by the simple average account value over the period indicated, and then multiplied by 183/365 to reflect the one-half year period.
2. Reflects expenses after fee waivers and expense reimbursements. Does not include acquired fund fees and expenses.
FRANKLIN CUSTODIAN FUNDS
Financial Highlights
Franklin Focused Growth Fund
| | | | | | | | |
| | | Year Ended September 30, | |
| | | 2017 | | | 2016a | |
Advisor Class | | | | | | | | |
| | |
Per share operating performance | | | | | | | | |
(for a share outstanding throughout the year) | | | | | | | | |
Net asset value, beginning of year | | | $10.93 | | | | $10.00 | |
| | |
Income from investment operationsb: | | | | | | | | |
Net investment income (loss)c | | | (0.02 | ) | | | (0.01 | ) |
Net realized and unrealized gains (losses) | | | 2.49 | | | | 0.94 | |
| | |
Total from investment operations | | | 2.47 | | | | 0.93 | |
| | |
Less distributions from: | | | | | | | | |
Net investment income | | | (0.01 | ) | | | — | |
Net realized gains | | | (0.03 | ) | | | — | |
Total distributions | | | (0.04 | ) | | | — | |
Net asset value, end of year. | | | $13.36 | | | | $10.93 | |
| | |
Total returnd | | | 22.78% | | | | 9.30% | |
| | |
Ratios to average net assetse | | | | | | | | |
Expenses before waiver and payments by affiliates | | | 2.31% | | | | 4.76% | |
Expenses net of waiver and payments by affiliates | | | 1.00% | f | | | 1.00% | |
Net investment income (loss) | | | (0.20)% | | | | (0.18)% | |
| | |
Supplemental data | | | | | | | | |
Net assets, end of year (000’s) | | | $3,341 | | | | $2,732 | |
Portfolio turnover rate | | | 28.48% | | | | 7.46% | |
aFor the period April 12, 2016 (commencement of operations) to September 30, 2016.
bThe amount shown for a share outstanding throughout the period may not correlate with the Statement of Operations for the period due to the timing of sales and repurchases of the Fund’s shares in relation to income earned and/or fluctuating fair value of the investments of the Fund.
cBased on average daily shares outstanding.
dTotal return is not annualized for periods less than one year.
eRatios are annualized for periods less than one year, except for non-recurring expenses, if any.
fBenefit of expense reduction rounds to less than 0.01%.
| | | | | | |
| | | The accompanying notes are an integral part of these financial statements. | Annual Report | | | 10 | |
FRANKLIN CUSTODIAN FUNDS
Statement of Investments, September 30, 2017
Franklin Focused Growth Fund
| | | | | | | | | | | | | | |
| | | | | Country | | | Shares | | | Value | |
| | Common Stocks 99.8% | | | | | | | | | | | | |
| | Aerospace & Defense 3.4% | | | | | | | | | | | | |
| | Raytheon Co. | | | United States | | | | 600 | | | $ | 111,948 | |
| | Banks 1.2% | | | | | | | | | | | | |
| | First Republic Bank/CA | | | United States | | | | 400 | | | | 41,784 | |
| | Beverages 2.4% | | | | | | | | | | | | |
| | Constellation Brands Inc., A | | | United States | | | | 400 | | | | 79,780 | |
| | Biotechnology 6.1% | | | | | | | | | | | | |
a | | Alexion Pharmaceuticals Inc. | | | United States | | | | 250 | | | | 35,072 | |
a | | Celgene Corp. | | | United States | | | | 1,000 | | | | 145,820 | |
a | | Incyte Corp. | | | United States | | | | 200 | | | | 23,348 | |
| | | | | | | | | | | | | 204,240 | |
| | Capital Markets 3.1% | | | | | | | | | | | | |
| | The Charles Schwab Corp. | | | United States | | | | 1,500 | | | | 65,610 | |
| | MarketAxess Holdings Inc. | | | United States | | | | 200 | | | | 36,902 | |
| | | | | | | | | | | | | 102,512 | |
| | Chemicals 1.0% | | | | | | | | | | | | |
| | Albemarle Corp. | | | United States | | | | 250 | | | | 34,078 | |
| | Electrical Equipment 1.1% | | | | | | | | | | | | |
| | Rockwell Automation Inc. | | | United States | | | | 200 | | | | 35,642 | |
| | Equity Real Estate Investment Trusts (REITs) 4.7% | | | | | | | | | | | | |
| | American Tower Corp. | | | United States | | | | 500 | | | | 68,340 | |
| | Equinix Inc. | | | United States | | | | 200 | | | | 89,260 | |
| | | | | | | | | | | | | 157,600 | |
| | Food & Staples Retailing 1.7% | | | | | | | | | | | | |
| | Costco Wholesale Corp. | | | United States | | | | 350 | | | | 57,502 | |
| | Health Care Equipment & Supplies 3.4% | | | | | | | | | | | | |
| | Danaher Corp. | | | United States | | | | 700 | | | | 60,046 | |
a | | IDEXX Laboratories Inc. | | | United States | | | | 350 | | | | 54,421 | |
| | | | | | | | | | | | | 114,467 | |
| | Health Care Providers & Services 2.3% | | | | | | | | | | | | |
| | UnitedHealth Group Inc. | | | United States | | | | 400 | | | | 78,340 | |
| | Industrial Conglomerates 1.9% | | | | | | | | | | | | |
| | 3M Co. | | | United States | | | | 300 | | | | 62,970 | |
| | Internet & Direct Marketing Retail 10.2% | | | | | | | | | | | | |
a | | Amazon.com Inc. | | | United States | | | | 220 | | | | 211,497 | |
a | | Despegar.com Corp. | | | Argentina | | | | 100 | | | | 3,200 | |
a | | Netflix Inc. | | | United States | | | | 300 | | | | 54,405 | |
a | | The Priceline Group Inc. | | | United States | | | | 40 | | | | 73,233 | |
| | | | | | | | | | | | | 342,335 | |
| | Internet Software & Services 16.7% | | | | | | | | | | | | |
a | | Alibaba Group Holding Ltd., ADR | | | China | | | | 300 | | | | 51,813 | |
a | | Alphabet Inc., A | | | United States | | | | 200 | | | | 194,744 | |
a | | Facebook Inc., A | | | United States | | | | 1,200 | | | | 205,044 | |
| | Tencent Holdings Ltd. | | | China | | | | 2,500 | | | | 107,596 | |
| | | | | | | | | | | | | 559,197 | |
| | IT Services 6.3% | | | | | | | | | | | | |
| | Visa Inc., A | | | United States | | | | 2,000 | | | | 210,480 | |
FRANKLIN CUSTODIAN FUNDS
STATEMENT OF INVESTMENTS
Franklin Focused Growth Fund (continued)
| | | | | | | | | | | | | | |
| | | | | Country | | | Shares | | | Value | |
| | Common Stocks (continued) | | | | | | | | | | | | |
| | Life Sciences Tools & Services 2.8% | | | | | | | | | | | | |
| a | | Mettler-Toledo International Inc. | | | United States | | | | 150 | | | $ | 93,924 | |
| | Machinery 2.1% | | | | | | | | | | | | |
| | Fortive Corp. | | | United States | | | | 1,000 | | | | 70,790 | |
| | Media 2.2% | | | | | | | | | | | | |
| a | | Charter Communications Inc., A | | | United States | | | | 200 | | | | 72,684 | |
| | Oil, Gas & Consumable Fuels 1.6% | | | | | | | | | | | | |
| a | | Concho Resources Inc. | | | United States | | | | 400 | | | | 52,688 | |
| | Personal Products 1.1% | | | | | | | | | | | | |
| | Estee Lauder Cos. Inc., A | | | United States | | | | 330 | | | | 35,587 | |
| | Professional Services 0.9% | | | | | | | | | | | | |
| a | | Verisk Analytics Inc. | | | United States | | | | 350 | | | | 29,117 | |
| | Semiconductors & Semiconductor Equipment 5.8% | | | | | | | | | | | | |
| | Analog Devices Inc. | | | United States | | | | 800 | | | | 68,936 | |
| | NVIDIA Corp. | | | United States | | | | 300 | | | | 53,631 | |
| | Xilinx Inc. | | | United States | | | | 1,000 | | | | 70,830 | |
| | | | |
| | | | | | | | | | | | | 193,397 | |
| | Software 16.0% | | | | | | | | | | | | |
| | Activision Blizzard Inc. | | | United States | | | | 1,200 | | | | 77,412 | |
| a | | Adobe Systems Inc. | | | United States | | | | 800 | | | | 119,344 | |
| | Microsoft Corp. | | | United States | | | | 2,000 | | | | 148,980 | |
| a | | Salesforce.com Inc. | | | United States | | | | 1,200 | | | | 112,104 | |
| a | | ServiceNow Inc. | | | United States | | | | 650 | | | | 76,394 | |
| | | | |
| | | | | | | | | | | | | 534,234 | |
| | Textiles, Apparel & Luxury Goods 0.8% | | | | | | | | | | | | |
| | NIKE Inc., B | | | United States | | | | 500 | | | | 25,925 | |
| | Tobacco 1.0% | | | | | | | | | | | | |
| | Philip Morris International Inc. | | | United States | | | | 300 | | | | 33,303 | |
| | | | |
| | Total Common Stocks (Cost $2,467,709) | | | | | | | | | | | 3,334,524 | |
| | | | |
| | Short Term Investments (Cost $25,993) 0.8% | | | | | | | | | | | | |
| | Money Market Funds 0.8% | | | | | | | | | | | | |
| b,c | | Institutional Fiduciary Trust Money Market Portfolio, 0.67% | | | United States | | | | 25,993 | | | | 25,993 | |
| | Total Investments (Cost $2,493,702) 100.6% | | | | | | | | | | | 3,360,517 | |
| | Other Assets, less Liabilities (0.6)% | | | | | | | | | | | (19,992 | ) |
| | | | |
| | Net Assets 100.0% | | | | | | | | | | $ | 3,340,525 | |
See Abbreviations on page 22.
aNon-income producing.
bSee Note 3(e) regarding investments in affiliated management investment companies.
cThe rate shown is the annualized seven-day yield at period end.
| | | | | | |
| | | The accompanying notes are an integral part of these financial statements. | Annual Report | | | 12 | |
FRANKLIN CUSTODIAN FUNDS
Financial Statements
Statement of Assets and Liabilities
September 30, 2017
Franklin Focused Growth Fund
| | | | |
| Assets: | | | | |
| Investments in securities: | | | | |
| Cost - Unaffiliated issuers | | | $2,467,709 | |
| Cost - Non-controlled affiliates (Note 3e) | | | 25,993 | |
| Value - Unaffiliated issuers | | | $3,334,524 | |
| Value - Non-controlled affiliates (Note 3e) | | | 25,993 | |
| Receivables: | | | | |
| Dividends | | | 839 | |
| Affiliates. | | | 13,698 | |
| Total assets | | | 3,375,054 | |
| Liabilities: | | | | |
| Payables: | | | | |
| Reports to shareholders. | | | 2,285 | |
| Professional fees | | | 31,958 | |
| Accrued expenses and other liabilities | | | 286 | |
| Total liabilities | | | 34,529 | |
| Net assets, at value | | | $3,340,525 | |
| Net assets consist of: | | | | |
| Paid-in capital | | | $2,495,234 | |
| Distributions in excess of net investment income | | | (6,008 | ) |
| Net unrealized appreciation (depreciation) | | | 866,815 | |
| Accumulated net realized gain (loss) | | | (15,516 | ) |
| Net assets, at value | | | $3,340,525 | |
| Shares outstanding | | | 250,000 | |
| Net asset value and maximum offering price per share | | | $13.36 | |
| | | | |
| 13 | | Annual Report | ��The accompanying notes are an integral part of these financial statements. | | |
FRANKLIN CUSTODIAN FUNDS
FINANCIAL STATEMENTS
Statement of Operations
for the year ended September 30, 2017
Franklin Focused Growth Fund
| | | | |
| Investment income: | | | | |
| Dividends: | | | | |
| Unaffiliated issuers. | | | $ 23,301 | |
| Non-controlled affiliates (Note 3e) | | | 189 | |
| |
| Total investment income | | | 23,490 | |
| |
| Expenses: | | | | |
| Management fees (Note 3a) | | | 25,060 | |
| Transfer agent fees (Note 3d) | | | 18 | |
| Custodian fees (Note 4) | | | 220 | |
| Reports to shareholders | | | 8,379 | |
| Professional fees | | | 36,772 | |
| Amortization of offering costs (Note 1e) | | | (6,716 | ) |
| Other | | | 4,543 | |
| |
| Total expenses | | | 68,276 | |
| Expense reductions (Note 4) | | | (6 | ) |
| Expenses waived/paid by affiliates (Note 3e and 3f) | | | (38,776 | ) |
| |
| Net expenses | | | 29,494 | |
| |
| Net investment income (loss) | | | (6,004 | ) |
| Realized and unrealized gains (losses): | | | | |
| Net realized gain (loss) from: | | | | |
| Investments: | | | | |
| Unaffiliated issuers | | | (15,516 | ) |
| Foreign currency transactions | | | (6 | ) |
| |
| Net realized gain (loss) | | | (15,522 | ) |
| |
| Net change in unrealized appreciation (depreciation) on: | | | | |
| Investments: | | | | |
| Unaffiliated issuers | | | 639,454 | |
| |
| Net realized and unrealized gain (loss) | | | 623,932 | |
| |
| Net increase (decrease) in net assets resulting from operations | | | $617,928 | |
| | | | | | |
| | | The accompanying notes are an integral part of these financial statements. | Annual Report | | | 14 | |
FRANKLIN CUSTODIAN FUNDS
FINANCIAL STATEMENTS
Statements of Changes in Net Assets
Franklin Focused Growth Fund
| | | | | | | | |
| | | Year Ended September 30, | |
| | | 2017 | | | 2016a | |
Increase (decrease) in net assets: | | | | | | | | |
Operations: | | | | | | | | |
Net investment income (loss) | | $ | (6,004 | ) | | $ | (2,200 | ) |
Net realized gain (loss) | | | (15,522 | ) | | | 6,911 | |
Net change in unrealized appreciation (depreciation) | | | 639,454 | | | | 227,361 | |
Net increase (decrease) in net assets resulting from operations | | | 617,928 | | | | 232,072 | |
Distributions to shareholders from: | | | | | | | | |
Net investment income. | | | (2,575 | ) | | | — | |
Net realized gains | | | (6,900 | ) | | | — | |
Total distributions to shareholders | | | (9,475 | ) | | | — | |
Capital share transactions (Note 2) | | | — | | | | 2,500,000 | |
Net increase (decrease) in net assets | | | 608,453 | | | | 2,732,072 | |
Net assets: | | | | | | | | |
Beginning of year | | | 2,732,072 | | | | — | |
End of year | | $ | 3,340,525 | | | $ | 2,732,072 | |
Undistributed net investment income included in net assets: | | | | | | | | |
End of year | | $ | — | | | $ | 2,576 | |
Distributions in excess of net investment income included in net assets: | | | | | | | | |
End of year | | $ | (6,008 | ) | | $ | — | |
aFor the period April 12, 2016 (commencement of operations) to September 30, 2016.
| | | | |
| 15 | | Annual Report | The accompanying notes are an integral part of these financial statements. | | |
FRANKLIN CUSTODIAN FUNDS
Notes to Financial Statements
Franklin Focused Growth Fund
1. Organization and Significant Accounting Policies
Franklin Custodian Funds (Trust) is registered under the Investment Company Act of 1940 (1940 Act) as an open-end management investment company, consisting of six separate funds and applies the specialized accounting and reporting guidance in U.S. Generally Accepted Accounting Principles (U.S. GAAP). Franklin Focused Growth Fund (Fund) is included in this report. The Fund has five classes of shares: Class A, Class C, Class R, Class R6, and Advisor Class. Each class of shares may differ by its initial sales load, contingent deferred sales charges, voting rights on matters affecting a single class, its exchange privilege and fees due to differing arrangements for distribution and transfer agent fees.
The Fund currently operates with one class of shares, Advisor Class.
The following summarizes the Fund’s significant accounting policies.
a. Financial Instrument Valuation
The Fund’s investments in financial instruments are carried at fair value daily. Fair value is the price that would be received to sell an asset or paid to transfer a liability in an orderly transaction between market participants on the measurement date. The Fund calculates the net asset value (NAV) per share as of 4 p.m. Eastern time each day the New York Stock Exchange (NYSE) is open for trading. Under compliance policies and procedures approved by the Fund’s Board of Trustees (the Board), the Fund’s administrator has responsibility for oversight of valuation, including leading the cross-functional Valuation Committee (VC). The VC provides administration and oversight of the Fund’s valuation policies and procedures, which are approved annually by the Board. Among other things, these procedures allow the Fund to utilize independent pricing services, quotations from securities and financial instrument dealers, and other market sources to determine fair value.
Equity securities listed on an exchange or on the NASDAQ National Market System are valued at the last quoted sale price or the official closing price of the day, respectively. Foreign equity securities are valued as of the close of trading on the foreign stock exchange on which the security is primarily traded, or as of 4 p.m. Eastern time. The value is then converted into its U.S. dollar equivalent at the foreign exchange rate in
effect at 4 p.m. Eastern time on the day that the value of the security is determined. Over-the-counter (OTC) securities are valued within the range of the most recent quoted bid and ask prices. Securities that trade in multiple markets or on multiple exchanges are valued according to the broadest and most representative market. Certain equity securities are valued based upon fundamental characteristics or relationships to similar securities.
Investments in open-end mutual funds are valued at the closing NAV.
The Fund has procedures to determine the fair value of financial instruments for which market prices are not reliable or readily available. Under these procedures, the VC convenes on a regular basis to review such financial instruments and considers a number of factors, including significant unobservable valuation inputs, when arriving at fair value. The VC primarily employs a market-based approach which may use related or comparable assets or liabilities, recent transactions, market multiples, book values, and other relevant information for the investment to determine the fair value of the investment. An income-based valuation approach may also be used in which the anticipated future cash flows of the investment are discounted to calculate fair value. Discounts may also be applied due to the nature or duration of any restrictions on the disposition of the investments. Due to the inherent uncertainty of valuations of such investments, the fair values may differ significantly from the values that would have been used had an active market existed. The VC employs various methods for calibrating these valuation approaches including a regular review of key inputs and assumptions, transactional back-testing or disposition analysis, and reviews of any related market activity.
Trading in securities on foreign securities stock exchanges and OTC markets may be completed before 4 p.m. Eastern time. In addition, trading in certain foreign markets may not take place on every Fund’s business day. Occasionally, events occur between the time at which trading in a foreign security is completed and 4 p.m. Eastern time that might call into question the reliability of the value of a portfolio security held by the Fund. As a result, differences may arise between the value of the Fund’s portfolio securities as determined at the foreign market close and the latest indications of value at 4 p.m. Eastern time. In order to minimize the potential for these differences, the VC monitors price movements following the close of trading in foreign stock markets through a series of country specific market proxies (such as baskets of American
FRANKLIN CUSTODIAN FUNDS
NOTES TO FINANCIAL STATEMENTS
Franklin Focused Growth Fund (continued)
1. Organization and Significant Accounting Policies (continued)
a. Financial Instrument Valuation (continued)
Depositary Receipts, futures contracts and exchange traded funds). These price movements are measured against established trigger thresholds for each specific market proxy to assist in determining if an event has occurred that may call into question the reliability of the values of the foreign securities held by the Fund. If such an event occurs, the securities may be valued using fair value procedures, which may include the use of independent pricing services.
When the last day of the reporting period is a non-business day, certain foreign markets may be open on those days that the Fund’s NAV is not calculated, which could result in differences between the value of the Fund’s portfolio securities on the last business day and the last calendar day of the reporting period. Any significant security valuation changes due to an open foreign market are adjusted and reflected by the Fund for financial reporting purposes.
b. Foreign Currency Translation
Portfolio securities and other assets and liabilities denominated in foreign currencies are translated into U.S. dollars based on the exchange rate of such currencies against U.S. dollars on the date of valuation. The Fund may enter into foreign currency exchange contracts to facilitate transactions denominated in a foreign currency. Purchases and sales of securities, income and expense items denominated in foreign currencies are translated into U.S. dollars at the exchange rate in effect on the transaction date. Portfolio securities and assets and liabilities denominated in foreign currencies contain risks that those currencies will decline in value relative to the U.S. dollar. Occasionally, events may impact the availability or reliability of foreign exchange rates used to convert the U.S. dollar equivalent value. If such an event occurs, the foreign exchange rate will be valued at fair value using procedures established and approved by the Board.
The Fund does not separately report the effect of changes in foreign exchange rates from changes in market prices on securities held. Such changes are included in net realized and unrealized gain or loss from investments in the Statement of Operations.
Realized foreign exchange gains or losses arise from sales of foreign currencies, currency gains or losses realized between the trade and settlement dates on securities transactions and the
difference between the recorded amounts of dividends, interest, and foreign withholding taxes and the U.S. dollar equivalent of the amounts actually received or paid. Net unrealized foreign exchange gains and losses arise from changes in foreign exchange rates on foreign denominated assets and liabilities other than investments in securities held at the end of the reporting period.
c. Income and Deferred Taxes
It is the Fund’s policy to qualify as a regulated investment company under the Internal Revenue Code. The Fund intends to distribute to shareholders substantially all of its taxable income and net realized gains to relieve it from federal income and excise taxes. As a result, no provision for U.S. federal income taxes is required.
The Fund may be subject to foreign taxation related to income received, capital gains on the sale of securities and certain foreign currency transactions in the foreign jurisdictions in which it invests. Foreign taxes, if any, are recorded based on the tax regulations and rates that exist in the foreign markets in which the Fund invests. When a capital gain tax is determined to apply, the Fund records an estimated deferred tax liability in an amount that would be payable if the securities were disposed of on the valuation date.
The Fund may recognize an income tax liability related to its uncertain tax positions under U.S. GAAP when the uncertain tax position has a less than 50% probability that it will be sustained upon examination by the tax authorities based on its technical merits. As of September 30, 2017, the Fund has determined that no tax liability is required in its financial statements related to uncertain tax positions for any open tax years (or expected to be taken in future tax years). Open tax years are those that remain subject to examination and are based on the statute of limitations in each jurisdiction in which the Fund invests.
d. Security Transactions, Investment Income, Expenses and Distributions
Security transactions are accounted for on trade date. Realized gains and losses on security transactions are determined on a specific identification basis. Estimated expenses are accrued daily. Dividend income is recorded on the ex-dividend date except for certain dividends from securities where the dividend rate is not available. In such cases, the dividend is recorded as soon as the information is received by the Fund. Distributions to
FRANKLIN CUSTODIAN FUNDS
NOTES TO FINANCIAL STATEMENTS
Franklin Focused Growth Fund (continued)
shareholders are recorded on the ex-dividend date. Distributable earnings are determined according to income tax regulations (tax basis) and may differ from earnings recorded in accordance with U.S. GAAP. These differences may be permanent or temporary. Permanent differences are reclassified among capital accounts to reflect their tax character. These reclassifications have no impact on net assets or the results of operations. Temporary differences are not reclassified, as they may reverse in subsequent periods.
Common expenses incurred by the Trust are allocated among the Funds based on the ratio of net assets of each Fund to the combined net assets of the Trust. Fund specific expenses are charged directly to the Fund that incurred the expense.
Realized and unrealized gains and losses and net investment income, excluding class specific expenses, are allocated daily to each class of shares based upon the relative proportion of net assets of each class. Differences in per share distributions by class are generally due to differences in class specific expenses.
e. Offering Costs
Offering costs are amortized on a straight line basis over twelve months. The costs are estimated prior to inception of the Fund and may be revised based on the actual costs incurred.
f. Accounting Estimates
The preparation of financial statements in accordance with U.S. GAAP requires management to make estimates and assumptions that affect the reported amounts of assets and liabilities at the date of the financial statements and the amounts of income and expenses during the reporting period. Actual results could differ from those estimates.
g. Guarantees and Indemnifications
Under the Trust’s organizational documents, its officers and trustees are indemnified by the Trust against certain liabilities arising out of the performance of their duties to the Trust. Additionally, in the normal course of business, the Trust, on behalf of the Fund, enters into contracts with service providers that contain general indemnification clauses. The Trust’s maximum exposure under these arrangements is unknown as this would involve future claims that may be made against the Trust that have not yet occurred. Currently, the Trust expects the risk of loss to be remote.
2. Shares of Beneficial Interest
At September 30, 2017, there were an unlimited number of shares authorized (without par value). Transactions in the Fund’s shares were as follows:
| | | | | | | | |
| | | Year Ended September 30, |
| | | 2017 | | 2016a |
| | | Shares | | Amount | | Shares | | Amount |
| Shares sold | | — | | $— | | 250,000 | | $2,500,000 |
aFor the period April 12, 2016 (commencement of operations) to September 30, 2016.
3. Transactions with Affiliates
Franklin Resources, Inc. is the holding company for various subsidiaries that together are referred to as Franklin Templeton Investments. Certain officers and trustees of the Trust are also officers and/or directors of the following subsidiaries:
| | |
| Subsidiary | | Affiliation |
| Franklin Advisers, Inc. (Advisers) | | Investment manager |
| Franklin Templeton Services, LLC (FT Services) | | Administrative manager |
| Franklin Templeton Distributors, Inc. (Distributors) | | Principal underwriter |
| Franklin Templeton Investor Services, LLC (Investor Services) | | Transfer agent |
FRANKLIN CUSTODIAN FUNDS
NOTES TO FINANCIAL STATEMENTS
Franklin Focused Growth Fund (continued)
3. Transactions with Affiliates (continued)
a. Management Fees
The Fund pays an investment management fee to Advisers based on the average daily net assets of the Fund as follows:
| | |
| Annualized Fee Rate | | Net Assets |
| 0.850% | | Up to and including $500 million |
| 0.800% | | Over $500 million, up to and including $1 billion |
| 0.750% | | Over $1 billion, up to and including $3 billion |
| 0.730% | | Over $3 billion, up to and including $5 billion |
| 0.700% | | In excess of $5 billion |
For the year ended September 30, 2017, the effective investment management fee rate was 0.850% of the Fund’s average daily net assets.
b. Administrative Fees
Under an agreement with Advisers, FT Services provides administrative services to the Fund. The fee is paid by Advisers based on the Fund’s average daily net assets, and is not an additional expense of the Fund.
c. Distribution Fees
The Board has adopted distribution plans for each share class, with the exception of Class R6 and Advisor Class shares, pursuant to Rule 12b-1 under the 1940 Act. Under the Fund’s Class A reimbursement distribution plan, the Fund reimburses Distributors for costs incurred in connection with the servicing, sale and distribution of the Fund’s shares up to the maximum annual plan rate. Under the Class A reimbursement distribution plan, costs exceeding the maximum for the current plan year cannot be reimbursed in subsequent periods. In addition, under the Fund’s Class C and R compensation distribution plans, the Fund pays Distributors for costs incurred in connection with the servicing, sale and distribution of the Fund’s shares up to the maximum annual plan rate for each class. The plan year, for purposes of monitoring compliance with the maximum annual plan rates, is February 1 through January 31.
The maximum annual plan rates, based on the average daily net assets, for each class, are as follows:
| | | | |
Class A | | | 0.25 | % |
Class C | | | 1.00 | % |
Class R | | | 0.50 | % |
d. Transfer Agent Fees
Each class of shares, except for Class R6, pays transfer agent fees to Investor Services for its performance of shareholder servicing obligations and reimburses Investor Services for out of pocket expenses incurred, including shareholder servicing fees paid to third parties. These fees are allocated daily based upon their relative proportion of such classes’ aggregate net assets. Class R6 pays Investor Services transfer agent fees specific to that class.
FRANKLIN CUSTODIAN FUNDS
NOTES TO FINANCIAL STATEMENTS
Franklin Focused Growth Fund (continued)
e. Investments in Affiliated Management Investment Companies
The Fund invests in one or more affiliated management investment companies for purposes other than exercising a controlling influence over the management or policies. Management fees paid by the Fund are waived on assets invested in the affiliated management investment companies, as noted in the Statement of Operations, in an amount not to exceed the management and administrative fees paid directly or indirectly by each affiliate. During the year ended September 30, 2017, the Fund held investments in affiliated management investment companies as follows:
| | | | | | | | | | | | | | | | | | | | | | | | | | | | | | | | |
| | | Number of
Shares Held
at Beginning
of Year | | | Gross
Additions | | | Gross
Reductions | | | Number of
Shares Held at End
of Year | | | Value at End
of Year | | | Dividend
Income | | | Realized Gain (Loss) | | | Net Change
in Unrealized
Appreciation
(Depreciation) | |
Non-Controlled Affiliates | | | | | | | | | | | | | | | | | | | | | | | | | | | | | | | | |
Institutional Fiduciary Trust Money Market Portfolio, 0.67% | | | — | | | | 112,723 | | | | (86,730 | ) | | | 25,993 | | | | $25,993 | | | | $189 | | | | $ — | | | | $ — | |
f. Waiver and Expense Reimbursements
Advisers contractually agreed in advance to waive or limit its respective fees and to assume as its own expense certain expenses otherwise payable by the Fund so that the expenses (excluding distribution fees and acquired fund fees and expenses) of the Fund do not exceed 1.00% based on the average net assets of each class (other than certain non-routine expenses or costs, including those relating to litigation, indemnification, reorganizations, and liquidations) until January 31, 2018. Total expenses waived or paid are not subject to recapture subsequent to the Fund’s fiscal year end.
g. Other Affiliated Transactions
At September 30, 2017, Franklin Resources Inc. owned 100% of the Fund’s outstanding shares. Investment activities of this shareholder could have a material impact on the Fund.
4. Expense Offset Arrangement
The Fund has entered into an arrangement with its custodian whereby credits realized as a result of uninvested cash balances are used to reduce a portion of the Fund’s custodian expenses. During the year ended September 30, 2017, the custodian fees were reduced as noted in the Statement of Operations.
5. Income Taxes
For tax purposes, capital losses may be carried over to offset future capital gains, if any. At September 30, 2017, the Fund had short-term capital loss carryforwards of $15,516.
For tax purposes, the Fund may elect to defer any portion of a late-year ordinary loss to the first day of the following fiscal year. At September 30, 2017, the Fund deferred late-year ordinary losses of $6,009.
The tax character of distributions paid during the years ended September 30, 2017 and 2016, was as follows:
| | | | | | | | |
| | | 2017 | | | 2016 | |
| | | | |
Distributions paid from ordinary income | | $ | 9,463 | | | $ | — | |
| | | | |
FRANKLIN CUSTODIAN FUNDS
NOTES TO FINANCIAL STATEMENTS
Franklin Focused Growth Fund (continued)
5. Income Taxes (continued)
At September 30, 2017, the cost of investments and net unrealized appreciation (depreciation) for income tax purposes were as follows:
| | | | |
| Cost of investments | | $ | 2,493,702 | |
| |
| Unrealized appreciation | | $ | 880,550 | |
| Unrealized depreciation | | | (13,735 | ) |
| Net unrealized appreciation (depreciation) | | $ | 866,815 | |
Differences between income and/or capital gains as determined on a book basis and a tax basis are primarily due to differing treatment of foreign currency transactions.
6. Investment Transactions
Purchases and sales of investments (excluding short term securities) for the year ended September 30, 2017, aggregated $870,097 and $825,985, respectively.
7. Credit Facility
The Fund, together with other U.S. registered and foreign investment funds (collectively, Borrowers), managed by Franklin Templeton Investments, are borrowers in a joint syndicated senior unsecured credit facility totaling $2 billion (Global Credit Facility) which matures on February 9, 2018. This Global Credit Facility provides a source of funds to the Borrowers for temporary and emergency purposes, including the ability to meet future unanticipated or unusually large redemption requests. The Fund began participating in the Global Credit Facility on February 10, 2017.
Under the terms of the Global Credit Facility, the Fund shall, in addition to interest charged on any borrowings made by the Fund and other costs incurred by the Fund, pay its share of fees and expenses incurred in connection with the implementation and maintenance of the Global Credit Facility, based upon its relative share of the aggregate net assets of all of the Borrowers, including an annual commitment fee of 0.15% based upon the unused portion of the Global Credit Facility. These fees are reflected in other expenses in the Statement of Operations. During the year ended September 30, 2017, the Fund did not use the Global Credit Facility.
8. Fair Value Measurements
The Fund follows a fair value hierarchy that distinguishes between market data obtained from independent sources (observable inputs) and the Fund’s own market assumptions (unobservable inputs). These inputs are used in determining the value of the Fund’s financial instruments and are summarized in the following fair value hierarchy:
| | • | | Level 1 – quoted prices in active markets for identical financial instruments |
| | • | | Level 2 – other significant observable inputs (including quoted prices for similar financial instruments, interest rates, prepayment speed, credit risk, etc.) |
| | • | | Level 3 – significant unobservable inputs (including the Fund’s own assumptions in determining the fair value of financial instruments) |
The input levels are not necessarily an indication of the risk or liquidity associated with financial instruments at that level.
FRANKLIN CUSTODIAN FUNDS
.NOTES TO FINANCIAL STATEMENTS
Franklin Focused Growth Fund (continued)
For movements between the levels within the fair value hierarchy, the Fund has adopted a policy of recognizing the transfers as of the date of the underlying event which caused the movement.
At September 30, 2017, all of the Fund’s investments in financial instruments carried at fair value were valued using Level 1 inputs.
9. Subsequent Events
The Fund has evaluated subsequent events through the issuance of the financial statements and determined that no events have occurred that require disclosure.
| | |
| Abbreviations | | |
| |
| Selected Portfolio | | |
ADR American Depository Receipt | | |
FRANKLIN CUSTODIAN FUNDS
Report of Independent Registered Public Accounting Firm
To the Board of Trustees of Franklin Custodian Funds and Shareholders of the Franklin Focused Growth Fund:
In our opinion, the accompanying statement of assets and liabilities, including the statement of investments, and the related statements of operations and of changes in net assets and the financial highlights present fairly, in all material respects, the financial position of the Franklin Focused Growth Fund (the “Fund”) as of September 30, 2017, the results of its operations, the changes in its net assets and the financial highlights for each of the periods indicated, in conformity with accounting principles generally accepted in the United States of America. These financial statements and financial highlights (hereafter referred to as “financial statements”) are the responsibility of the Fund’s management. Our responsibility is to express an opinion on these financial statements based on our audits. We conducted our audits of these financial statements in accordance with the standards of the Public Company Accounting Oversight Board (United States). Those standards require that we plan and perform the audit to obtain reasonable assurance about whether the financial statements are free of material misstatement. An audit includes examining, on a test basis, evidence supporting the amounts and disclosures in the financial statements, assessing the accounting principles used and significant estimates made by management, and evaluating the overall financial statement presentation. We believe that our audits, which included confirmation of securities as of September 30, 2017 by correspondence with the custodian, transfer agent and brokers, provide a reasonable basis for our opinion.
PricewaterhouseCoopers LLP
San Francisco, California
November 15, 2017
FRANKLIN CUSTODIAN FUNDS
Tax Information (unaudited)
Franklin Focused Growth Fund
Under Section 871(k)(2)(C) of the Internal Revenue Code (Code), the Fund hereby reports the maximum amount allowable but no less than $6,888 as a short term capital gain dividend for purposes of the tax imposed under Section 871(a)(1)(A) of the Code for the fiscal year ended September 30, 2017.
Under Section 854(b)(1)(A) of the Code, the Fund hereby reports 100% of the ordinary income dividends as income qualifying for the dividends received deduction for the fiscal year ended September 30, 2017.
Under Section 854(b)(1)(B) of the Code, the Fund hereby reports the maximum amount allowable but no less than $20,253 as qualified dividends for purposes of the maximum rate under Section 1(h)(11) of the Code for the fiscal year ended September 30, 2017.
Distributions, including qualified dividend income, paid during calendar year 2017 will be reported to shareholders on Form 1099-DIV by mid-February 2018. Shareholders are advised to check with their tax advisors for information on the treatment of these amounts on their individual income tax returns.
FRANKLIN CUSTODIAN FUNDS
Board Members and Officers
The name, year of birth and address of the officers and board members, as well as their affiliations, positions held with the Trust, principal occupations during at least the past five years and number of US registered portfolios overseen in the Franklin Templeton Investments fund complex, are shown below. Generally, each board member serves until that person’s successor is elected and qualified.
Independent Board Members
| | | | | | | | |
Name, Year of Birth and Address | | Position | | Length of
Time Served | | Number of Portfolios in
Fund Complex Overseen by Board Member* | | Other Directorships Held
During at Least the Past 5 Years |
| | | | |
Harris J. Ashton (1932) One Franklin Parkway San Mateo, CA 94403-1906 | | Trustee | | Since 1976 | | 140 | | Bar-S Foods (meat packing company) (1981-2010). |
| | |
| Principal Occupation During at Least the Past 5 Years: | | | | |
| Director of various companies; and formerly, Director, RBC Holdings, Inc. (bank holding company) (until 2002); and President, Chief Executive Officer and Chairman of the Board, General Host Corporation (nursery and craft centers) (until 1998). |
| | | | |
Mary C. Choksi (1950) One Franklin Parkway San Mateo, CA 94403-1906 | | Trustee | | Since 2014 | | 134 | | Avis Budget Group Inc. (car rental) (2007-present), Omnicom Group Inc. (advertising and marketing communications services) (2011-present) and White Mountains Insurance Group, Ltd. (holding company) August 2017-present). |
|
Principal Occupation During at Least the Past 5 Years: Director of various companies; and formerly, Founder and Senior Advisor, Strategic Investment Group (investment management group) (2015-2017); Founding Partner and Senior Managing Director, Strategic Investment Group (1987–2015); Founding Partner and Managing Director, Emerging Markets Management LLC (investment management firm) (1987-2011); and Loan Officer/Senior Loan Officer/Senior Pension Investment Officer, World Bank Group (international financial institution) (1977-1987). |
| | | | |
Edith E. Holiday (1952) One Franklin Parkway San Mateo, CA 94403-1906 | | Trustee | | Since 1998 | | 140 | | Hess Corporation (exploration of oil and gas) (1993-present), Canadian National Railway (railroad) (2001-present), White Mountains Insurance Group, Ltd. (holding company) (2004-present), Santander Consumer USA Holdings, Inc. (consumer finance) (2016-present),RTI International Metals, Inc. (manufacture and distribution of titanium) (1999-2015) and H.J. Heinz Company (processed foods and allied products) (1994-2013). |
Principal Occupation During at Least the Past 5 Years: Director or Trustee of various companies and trusts; and formerly, Assistant to the President of the United States and Secretary of the Cabinet (1990-1993); General Counsel to the United States Treasury Department (1989-1990); and Counselor to the Secretary and Assistant Secretary for Public Affairs and Public Liaison-United States Treasury Department (1988-1989). |
| | | | |
J. Michael Luttig (1954) One Franklin Parkway San Mateo, CA 94403-1906 | | Trustee | | Since 2009 | | 140 | | Boeing Capital Corporation (aircraft financing) (2006-2013). |
|
Principal Occupation During at Least the Past 5 Years: Executive Vice President, General Counsel and member of the Executive Council, The Boeing Company (aerospace company) (2006-present); and formerly, Federal Appeals Court Judge, U.S. Court of Appeals for the Fourth Circuit (1991-2006). |
FRANKLIN CUSSTODIAN FUNDS
Independent Board Members (continued)
| | | | | | | | |
Name, Year of Birth and Address | | Position | | Length of
Time Served | | Number of Portfolios in
Fund Complex Overseen
by Board Member* | | Other Directorships Held During at Least the Past 5 Years |
| | | | |
Larry D. Thompson (1945) One Franklin Parkway San Mateo, CA 94403-1906 | | Trustee | | Since 2007 | | 140 | | The Southern Company (energy company) (2014-present; previously 2010-2012), Graham Holdings Company (education and media organization) (2011-present) and Cbeyond, Inc. (business communications provider) (2010-2012). |
Principal Occupation During at Least the Past 5 Years: Director of various companies; Counsel, Finch McCranie, LLP (law firm) (2015-present); Independent Compliance Monitor and Auditor, Volkswagen AG (manufacture of automobiles and commercial vehicles) (April 2017 – present); John A. Sibley Professor of Corporate and Business Law, University of Georgia School of Law (2015-present; previously 2011-2012); and formerly, Executive Vice President - Government Affairs, General Counsel and Corporate Secretary, PepsiCo, Inc. (consumer products) (2012-2014); Senior Vice President - Government Affairs, General Counsel and Secretary, PepsiCo, Inc. (2004-2011); Senior Fellow of The Brookings Institution (2003-2004); Visiting Professor, University of Georgia School of Law (2004); and Deputy Attorney General, U.S. Department of Justice (2001-2003). |
| | | | |
John B. Wilson (1959) One Franklin Parkway San Mateo, CA 94403-1906 | | Lead Independent Trustee | | Trustee since 2007 and Lead Independent Trustee since 2008 | | 114 | | None |
|
Principal Occupation During at Least the Past 5 Years: President and Founder, Hyannis Port Capital, Inc. (real estate and private equity investing)(2002-present); serves on private and non-profit boards; and formerly, President, Staples International and Head of Global Transformation (office supplies) (2012-2016); Chief Operating Officer and Executive Vice President, Gap, Inc. (retail) (1996-2000); Chief Financial Officer and Executive Vice President – Finance and Strategy, Staples, Inc. (1992-1996); Senior Vice President – Corporate Planning, Northwest Airlines, Inc. (airlines) (1990-1992); and Vice President and Partner, Bain & Company (consulting firm) (1986-1990) |
|
| Interested Board Members and Officers |
| | | | |
Name, Year of Birth and Address | | Position | | Length of Time Served | | Number of Portfolios in
Fund Complex Overseen
by Board Member* | | Other Directorships Held During at Least the Past 5 Years |
| | | | |
**Gregory E. Johnson (1961) One Franklin Parkway San Mateo, CA 94403-1906 | | Trustee | | Since 2013 | | 156 | | None |
|
Principal Occupation During at Least the Past 5 Years: Chairman of the Board, Member - Office of the Chairman, Director and Chief Executive Officer, Franklin Resources, Inc.; officer and/or director or trustee, as the case may be, of some of the other subsidiaries of Franklin Resources, Inc. and of 44 of the investment companies in Franklin Templeton Investments; Vice Chairman, Investment Company Institute; and formerly, President, Franklin Resources, Inc. (1994-2015). |
| | | | |
**Rupert H. Johnson, Jr. (1940) One Franklin Parkway San Mateo, CA 94403-1906 | | Chairman of the Board, Trustee and Vice President | | Chairman of the Board since 2013, Trustee since 1983 and Vice President since 1982 | | 140 | | None |
|
Principal Occupation During at Least the Past 5 Years: Vice Chairman, Member - Office of the Chairman and Director, Franklin Resources, Inc.; Director, Franklin Advisers, Inc.; Senior Vice President, Franklin Advisory Services, LLC; and officer and/or director or trustee, as the case may be, of some of the other subsidiaries of Franklin Resources, Inc. and of 42 of the investment companies in Franklin Templeton Investments. |
| | | | |
Alison E. Baur (1964) One Franklin Parkway San Mateo, CA 94403-1906 | | Vice President | | Since 2012 | | Not Applicable | | Not Applicable |
|
Principal Occupation During at Least the Past 5 Years: Deputy General Counsel, Franklin Templeton Investments; and officer of some of the other subsidiaries of Franklin Resources, Inc. and of 45 of the investment companies in Franklin Templeton Investments. |
FRANKLIN CUSSTODIAN FUNDS
Interested Board Members and Officers (continued)
| | | | | | | | |
Name, Year of Birth and Address | | Position | | Length of
Time Served | | Number of Portfolios in
Fund Complex Overseen
by Board Member* | | Other Directorships Held During at Least the Past 5 Years |
| | | | |
Gaston Gardey (1967) One Franklin Parkway San Mateo, CA 94403-1906 | | Chief Financial Officer, Chief Accounting Officer and Treasurer | | Since 2009 | | Not Applicable | | Not Applicable |
|
Principal Occupation During at Least the Past 5 Years: Treasurer, U.S. Fund Administration & Reporting, Franklin Templeton Investments; and officer of 27 of the investment companies in Franklin Templeton Investments. |
| | | | |
Aliya S. Gordon (1973) One Franklin Parkway San Mateo, CA 94403-1906 | | Vice President | | Since 2009 | | Not Applicable | | Not Applicable |
|
Principal Occupation During at Least the Past 5 Years: Senior Associate General Counsel, Franklin Templeton Investments; and officer of 45 of the investment companies in Franklin Templeton Investments. |
| | | | |
Steven J. Gray (1955) One Franklin Parkway San Mateo, CA 94403-1906 | | Vice President | | Since 2009 | | Not Applicable | | Not Applicable |
|
Principal Occupation During at Least the Past 5 Years: Senior Associate General Counsel, Franklin Templeton Investments; Vice President, Franklin Templeton Distributors, Inc. and FT AlphaParity, LLC; and officer of 45 of the investment companies in Franklin Templeton Investments. |
| | | | |
Matthew T. Hinkle (1971) One Franklin Parkway San Mateo, CA 94403-1906 | | Chief Executive Officer – Finance and Administration | | Since June 2017 | | Not Applicable | | Not Applicable |
|
Principal Occupation During at Least the Past 5 Years: Senior Vice President U.S. Fund Administration Reporting & Fund Tax, Franklin Templeton Investments; officer of 45 of the investment companies in Franklin Templeton Investments; and formerly, Vice President, Global Tax (2012-April 2017) and Treasurer/Assistant Treasurer, Franklin Templeton Investments (2009-2017). |
| | | | |
Edward B. Jamieson (1948) One Franklin Parkway San Mateo, CA 94403-1906 | | President and Chief Executive Officer – Investment Management | | Since 2010 | | Not Applicable | | Not Applicable |
|
Principal Occupation During at Least the Past 5 Years: President, and Director, Franklin Advisers, Inc.; Executive Vice President, Franklin Templeton Institutional, LLC; and officer and/or trustee, as the case may be, of some of the other subsidiaries of Franklin Resources, Inc. and of 10 of the investment companies in Franklin Templeton Investments. |
| | | | |
Robert Lim (1948) One Franklin Parkway San Mateo, CA 94403-1906 | | Vice President –AML Compliance | | Since 2016 | | Not Applicable | | Not Applicable |
|
Principal Occupation During at Least the Past 5 Years: Vice President, Franklin Templeton Companies, LLC; Chief Compliance Officer, Franklin Templeton Distributors, Inc. and Franklin Templeton Investor Services, LLC; and officer of 45 of the investment companies in Franklin Templeton Investments. |
| | | | |
Kimberly H. Novotny (1972) 300 S.E. 2nd Street Fort Lauderdale, FL 33301-1923 | | Vice President | | Since 2013 | | Not Applicable | | Not Applicable |
|
Principal Occupation During at Least the Past 5 Years: Associate General Counsel, Franklin Templeton Investments; Vice President and Corporate Secretary, Fiduciary Trust International of the South; Vice President, Templeton Investment Counsel, LLC; Assistant Secretary, Franklin Resources, Inc.; and officer of 45 of the investment companies in Franklin Templeton Investments. |
FRANKLIN CUSSTODIAN FUNDS
Interested Board Members and Officers (continued)
| | | | | | | | |
Name, Year of Birth and Address | | Position | | Length of
Time Served | | Number of Portfolios in
Fund Complex Overseen
by Board Member* | | Other Directorships Held During at Least the Past 5 Years |
| | | | |
Robert C. Rosselot (1960) 300 S.E. 2nd Street Fort Lauderdale, FL 33301-1923 | | Chief Compliance Officer | | Since 2013 | | Not Applicable | | Not Applicable |
|
Principal Occupation During at Least the Past 5 Years: Director, Global Compliance, Franklin Templeton Investments; Vice President, Franklin Templeton Companies, LLC; officer of 45 of the investment companies in Franklin Templeton Investments; and formerly, Senior Associate General Counsel, Franklin Templeton Investments (2007-2013); and Secretary and Vice President, Templeton Group of Funds (2004-2013). |
| | | | |
Karen L. Skidmore (1952) One Franklin Parkway San Mateo, CA 94403-1906 | | Vice President and Secretary | | Since 2006 | | Not Applicable | | Not Applicable |
|
Principal Occupation During at Least the Past 5 Years: Senior Associate General Counsel, Franklin Templeton Investments; and officer of 45 of the investment companies in Franklin Templeton Investments. |
| | | | |
Navid J. Tofigh (1972) One Franklin Parkway San Mateo, CA 94403-1906 | | Vice President | | Since 2015 | | Not Applicable | | Not Applicable |
|
Principal Occupation During at Least the Past 5 Years: Associate General Counsel, Franklin Templeton Investments; and officer of 45 of the investment companies in Franklin Templeton Investments. |
| | | | |
Craig S. Tyle (1960) One Franklin Parkway San Mateo, CA 94403-1906 | | Vice President | | Since 2005 | | Not Applicable | | Not Applicable |
|
Principal Occupation During at Least the Past 5 Years: General Counsel and Executive Vice President, Franklin Resources, Inc.; and officer of some of the other subsidiaries of Franklin Resources, Inc. and of 45 of the investment companies in Franklin Templeton Investments. |
| | | | |
Lori A. Weber (1964) 300 S.E. 2nd Street Fort Lauderdale, FL 33301-1923 | | Vice President | | Since 2013 | | Not Applicable | | Not Applicable |
|
Principal Occupation During at Least the Past 5 Years: Senior Associate General Counsel, Franklin Templeton Investments; Assistant Secretary, Franklin Resources, Inc.; Vice President and Secretary, Templeton Investment Counsel, LLC; and officer of 45 of the investment companies in Franklin Templeton Investments. |
*We base the number of portfolios on each separate series of the US registered investment companies within the Franklin Templeton Investments fund complex. These portfolios have a common investment manager or affiliated investment managers.
**Gregory E. Johnson is considered to be an interested person of the Fund under the federal securities laws due to his position as an officer and director of Franklin Resources, Inc. (Resources), which is the parent company of the Fund’s investment manager and distributor. Rupert H. Johnson, Jr. is considered to be an interested person of the Fund under the federal securities laws due to his position as officer and director and major shareholder of Resources.
Note 1: Rupert H. Johnson, Jr. is the uncle of Gregory E. Johnson.
Note 2: Officer information is current as of the date of this report. It is possible that after this date, information about officers may change.
Note 3: Effective November 1, 2016, Frank A. Olsen ceased to be a trustee of the Trust.
The Sarbanes-Oxley Act of 2002 and Rules adopted by the Securities and Exchange Commission require the Fund to disclose whether the Fund’s Audit Committee includes at least one member who is an audit committee financial expert within the meaning of such Act and Rules. The Fund’s Board has determined that there is at least one such financial expert on the Audit Committee and has designated John B. Wilson as its audit committee financial expert. The Board believes that Mr. Wilson qualifies as such an expert in view of his extensive business background and experience, including service as chief financial officer of Staples, Inc. from 1992 to 1996. Mr. Wilson has been a Member and Chairman of the Fund’s Audit Committee since 2007. As a result of such background and experience, the Board believes that Mr. Wilson has acquired an understanding of generally accepted accounting principles and financial statements, the general application of such principles in connection with the accounting estimates, accruals and reserves, and analyzing and evaluating financial statements that present a breadth and level of complexity of accounting issues generally comparable to those of the Fund, as well as an understanding of internal controls and procedures for financial reporting and an understanding of audit committee functions. Mr. Wilson is an independent Board member as that term is defined under the relevant Securities and Exchange Commission Rules and Releases.
The Statement of Additional Information (SAI) includes additional information about the board members and is available, without charge, upon request. Shareholders may call (800) DIAL BEN/342-5236 to request the SAI.
FRANKLIN CUSTODIAN FUNDS
FRANKLIN FOCUSED GROWTH FUND
Shareholder Information
Proxy Voting Policies and Procedures
The Fund’s investment manager has established Proxy Voting Policies and Procedures (Policies) that the Fund uses to determine how to vote proxies relating to portfolio securities. Shareholders may view the Fund’s complete Policies online at franklintempleton.com. Alternatively, shareholders may request copies of the Policies free of charge by calling the Proxy Group collect at (954) 527-7678 or by sending a written request to: Franklin Templeton Companies, LLC, 300 S.E. 2nd Street, Fort Lauderdale, FL 33301, Attention: Proxy Group. Copies of the Fund’s proxy voting records are also made available online at franklintempleton.com and posted on the US Securities and Exchange Commission’s website at sec.gov and reflect the most recent 12-month period ended June 30.
Quarterly Statement of Investments
The Trust, on behalf of the Fund, files a complete statement of investments with the US Securities and Exchange Commission for the first and third quarters for each fiscal year on Form N-Q. Shareholders may view the filed Form N-Q by visiting the Commission’s website at sec.gov. The filed form may also be viewed and copied at the Commission’s Public Reference Room in Washington, DC. Information regarding the operations of the Public Reference Room may be obtained by calling (800) SEC-0330.
(a) The Registrant has adopted a code of ethics that applies to its principal executive officers and principal financial and accounting officer.
(c) N/A
(d) N/A
(f) Pursuant to Item 12(a)(1), the Registrant is attaching as an exhibit a copy of its code of ethics that applies to its principal executive officers and principal financial and accounting officer.
| Item 3. | Audit Committee Financial Expert. |
(a)(1) The Registrant has an audit committee financial expert serving on its audit committee.
(2) The audit committee financial expert is John B. Wilson and he is “independent” as defined under the relevant Securities and Exchange Commission Rules and Releases.
| Item 4. | Principal Accountant Fees and Services. |
(a) Audit Fees
The aggregate fees paid to the principal accountant for professional services rendered by the principal accountant for the audit of the registrant’s annual financial statements or for services that are normally provided by the principal accountant in connection with statutory and regulatory filings or engagements were $476,149 for the fiscal year ended September 30, 2017 and $427,123 for the fiscal year ended September 30, 2016.
(b) Audit-Related Fees
The aggregate fees paid to the principal accountant for assurance and related services rendered by the principal accountant to the registrant that are reasonably related to the performance of the audit of the registrant’s financial statements and are not reported under paragraph (a) of Item 4 were $9,213 for the fiscal year ended September 30, 2017 and $9,033 for the fiscal year ended September 30, 2016. The services for which these fees were paid included attestation services.
There were no fees paid to the principal accountant for assurance and related services rendered by the principal accountant to the registrant’s investment adviser and any entity controlling, controlled by or under common control with the investment adviser that provides ongoing services to the registrant that are reasonably related to the performance of the audit of their financial statements.
(c) Tax Fees
There were no fees paid to the principal accountant for professional services rendered by the principal accountant to the registrant for tax compliance, tax advice and tax planning.
There were no fees paid to the principal accountant for professional services rendered by the principal accountant to the registrant’s investment adviser and any entity controlling, controlled by or under common control with the investment adviser that provides ongoing services to the registrant for tax compliance, tax advice and tax planning.
(d) All Other Fees
There were no fees paid to the principal accountant for products and services rendered by the principal accountant to the registrant not reported in paragraphs (a)-(c) of Item 4.
The aggregate fees paid to the principal accountant for products and services rendered by the principal accountant to the registrant’s investment adviser and any entity controlling, controlled by or under common control with the investment adviser that provides ongoing services to the registrant not reported in paragraphs (a)-(c) of Item 4 were $14,000 for the fiscal year ended September 30, 2017 and $539,168 for the fiscal year ended September 30, 2016. The services for which these fees were paid included review of materials provided to the fund Board in connection with the investment management contract renewal process and derivatives assessments, review of system processes related to fixed income securities, and benchmarking services in connection with the 2015 ICI TA Survey.
(e) (1) The registrant’s audit committee is directly responsible for approving the services to be provided by the auditors, including:
(i) pre-approval of all audit and audit related services;
(ii) pre-approval of all non-audit related services to be provided to the Fund by the auditors;
(iii) pre-approval of all non-audit related services to be provided to the registrant by the auditors to the registrant’s investment adviser or to any entity that controls, is controlled by or is under common control with the registrant’s investment adviser and that provides ongoing services to the registrant where the non-audit services relate directly to the operations or financial reporting of the registrant; and
(iv) establishment by the audit committee, if deemed necessary or appropriate, as an alternative to committee pre-approval of services to be provided by the auditors, as required by paragraphs (ii) and (iii) above, of policies and procedures to permit such services to be pre-approved by other means, such as through establishment of guidelines or by action of a designated member or members of the committee; provided the policies and procedures are detailed as to the particular service and the committee is informed of each service and such policies and procedures do not include delegation of audit committee responsibilities, as contemplated under the Securities Exchange Act of 1934, to management; subject, in the case of
(ii) through (iv), to any waivers, exceptions or exemptions that may be available under applicable law or rules.
(e) (2) None of the services provided to the registrant described in paragraphs (b)-(d) of Item 4 were approved by the audit committee pursuant to paragraph (c)(7)(i)(C) of Rule 2-01 of regulation S-X.
(f) No disclosures are required by this Item 4(f).
(g) The aggregate non-audit fees paid to the principal accountant for services rendered by the principal accountant to the registrant and the registrant’s investment adviser and any entity controlling, controlled by or under common control with the investment adviser that provides ongoing services to the registrant were $23,213 for the fiscal year ended September 30, 2017 and $548,201 for the fiscal year ended September 30, 2016.
(h) The registrant’s audit committee of the board has considered whether the provision of non-audit services that were rendered to the registrant’s investment adviser (not including any sub-adviser whose role is primarily portfolio management and is subcontracted with or overseen by another investment adviser), and any entity controlling, controlled by, or under common control with the investment adviser that provides ongoing services to the registrant that were not pre-approved pursuant to paragraph (c)(7)(ii) of Rule 2-01 of Regulation S-X is compatible with maintaining the principal accountant’s independence.
| Item 5. | Audit Committee of Listed Registrants. N/A |
| Item 6. | Schedule of Investments. N/A |
Item 7. Disclosure of Proxy Voting Policies and Procedures for Closed-End Management Investment Companies. N/A
Item 8. Portfolio Managers of Closed-End Management Investment Companies. N/A
Item 9. Purchases of Equity Securities by Closed-End Management Investment Company and Affiliated Purchasers. N/A
| Item 10. | Submission of Matters to a Vote of Security Holders. |
There have been no changes to the procedures by which shareholders may recommend nominees to the Registrant’s Board of Trustees that would require disclosure herein.
| Item 11. | Controls and Procedures. |
(a) Evaluation of Disclosure Controls and Procedures. The Registrant maintains disclosure controls and procedures that are designed to ensure that information required to be disclosed in the Registrant’s filings under the Securities Exchange Act of 1934 and the Investment
Company Act of 1940 is recorded, processed, summarized and reported within the periods specified in the rules and forms of the Securities and Exchange Commission. Such information is accumulated and communicated to the Registrant’s management, including its principal executive officer and principal financial officer, as appropriate, to allow timely decisions regarding required disclosure. The Registrant’s management, including the principal executive officer and the principal financial officer, recognizes that any set of controls and procedures, no matter how well designed and operated, can provide only reasonable assurance of achieving the desired control objectives.
Within 90 days prior to the filing date of this Shareholder Report on Form N-CSR, the Registrant had carried out an evaluation, under the supervision and with the participation of the Registrant’s management, including the Registrant’s principal executive officer and the Registrant’s principal financial officer, of the effectiveness of the design and operation of the Registrant’s disclosure controls and procedures. Based on such evaluation, the Registrant’s principal executive officer and principal financial officer concluded that the Registrant’s disclosure controls and procedures are effective.
(b) Changes in Internal Controls. There have been no changes in the Registrant’s internal controls or in other factors that could materially affect the internal controls over financial reporting subsequent to the date of their evaluation in connection with the preparation of this Shareholder Report on Form N-CSR.
(a)(1) Code of Ethics
(a)(2) Certifications pursuant to Section 302 of the Sarbanes-Oxley Act of 2002 of Matthew T. Hinkle , Chief Executive Officer - Finance and Administration, and Gaston Gardey, Chief Financial Officer and Chief Accounting Officer
(b) Certifications pursuant to Section 906 of the Sarbanes-Oxley Act of 2002 of Matthew T. Hinkle , Chief Executive Officer - Finance and Administration, and Gaston Gardey, Chief Financial Officer and Chief Accounting Officer
SIGNATURES
Pursuant to the requirements of the Securities Exchange Act of 1934 and the Investment Company Act of 1940, the registrant has duly caused this report to be signed on its behalf by the undersigned, thereunto duly authorized.
FRANKLIN CUSTODIAN FUNDS
| | |
| By | | /s/ Matthew T. Hinkle |
| | Matthew T. Hinkle |
| | Chief Executive Officer - Finance and Administration |
| Date | | November 27, 2017 |
Pursuant to the requirements of the Securities Exchange Act of 1934 and the Investment Company Act of 1940, this report has been signed below by the following persons on behalf of the registrant and in the capacities and on the dates indicated.
| | |
| By | | /s/ Matthew T. Hinkle |
| | Matthew T. Hinkle |
| | Chief Executive Officer - Finance and Administration |
| Date | | November 27, 2017 |
| |
| By | | /s/ Gaston Gardey |
| | Gaston Gardey |
| | Chief Financial Officer and Chief Accounting Officer |
| Date | | November 27, 2017 |