UNITED STATES
SECURITIES AND EXCHANGE COMMISSION
Washington, DC 20549
FORMN-CSR
CERTIFIED SHAREHOLDER REPORT OF REGISTERED
MANAGEMENT INVESTMENT COMPANIES
Investment Company Act file number811-00537
Franklin Custodian Funds
(Exact name of registrant as specified in charter)
One Franklin Parkway, San Mateo, CA 94403-1906
(Address of principal executive offices) (Zip code)
Craig S. Tyle, One Franklin Parkway, San Mateo, CA 94403-1906
(Name and address of agent for service)
Registrant’s telephone number, including area code: 650312-2000
Date of fiscal year end: 9/30
Date of reporting period: 9/30/19
| Item 1. | Reports to Stockholders. |

| | | | | | |
| | Franklin DynaTech Fund | | | | Franklin U.S. Government Securities Fund |
| | | | | | |
| | | |
| | Franklin Growth Fund | | | | Franklin Utilities Fund |
| | | | | | |
| | | |
| | Franklin Income Fund | | | | |
| | | | | | |
Sign up for electronic delivery at franklintempleton.com/edelivery
Internet Delivery of Fund Reports Unless You Request Paper Copies: Effective January 1, 2021, as permitted by the SEC, paper copies of the Fund’s shareholder reports will no longer be sent by mail, unless you specifically request them from the Fund or your financial intermediary. Instead, the reports will be made available on a website, and you will be notified by mail each time a report is posted and provided with a website link to access the report.
If you already elected to receive shareholder reports electronically, you will not be affected by this change and you need not take any action. If you have not signed up for electronic delivery, we would encourage you to join fellow shareholders who have. You may elect to receive shareholder reports and other communications electronically from the Fund by calling (800)632-2301 or by contacting your financial intermediary.
You may elect to continue to receive paper copies of all your future shareholder reports free of charge by contacting your financial intermediary or, if you invest directly with a Fund, calling (800)632-2301 to let the Fund know of your request. Your election to receive reports in paper will apply to all funds held in your account.
SHAREHOLDER LETTER
Dear Shareholder:
During the 12 months ended September 30, 2019, the U.S. economy continued to grow, but at a more moderate pace due to concerns about trade and geopolitical stress. The U.S. Federal Reserve (Fed) raised its federal funds rate by 0.25% at its December 2018 meeting, bringing the rate from 2.25% to 2.50%, but lowered it by 0.25% at both its July and September 2019 meetings, resulting in a rate of 2.00% byperiod-end. The Fed cited muted inflation pressures and the potential effects of global trade tensions on economic growth as rationale for easing the rate. The10-year U.S. Treasury yield began the period at 3.05% and decreased to 1.68% atperiod-end. In this environment, the prices of U.S. stocks, as measured by the Standard & Poor’s® 500 Index (S&P 500®), rose 2.15%, (the index increasing from 2,913.98 to 2,976.74).1,2 Investment-grade bonds, as measured by the Bloomberg Barclays U.S. Aggregate Bond Index (Bloomberg Index), posted a +10.30% total return (an index increase from 2,013.67 to 2,221.00), which includes reinvestment of income and distributions.3
After the reporting period, in a further effort to sustain economic expansion, while fostering a strong labor market and stable inflation, the Fed lowered the federal funds rate by 0.25%, to 1.75% at its October meeting.
We are committed to our long-term perspective and disciplined investment approach as we conduct a rigorous, fundamental analysis of securities with a regular emphasis on investment risk management.
We believe active, professional investment management serves investors well. We also recognize the important role of financial advisors in today’s markets and encourage investors to continue to seek their advice. Amid changing
markets and economic conditions, we are confident investors with a well-diversified portfolio and a patient, long-term outlook should be well positioned for the years ahead.
Franklin Custodian Funds’ annual report, covering Franklin DynaTech Fund, Franklin Growth Fund, Franklin Income Fund, Franklin U.S. Government Securities Fund and Franklin Utilities Fund, includes more detail about prevailing conditions and a discussion about investment decisions during the period. Please remember all securities markets fluctuate, as do mutual fund share prices.
We thank you for investing with Franklin, welcome your questions and comments, and look forward to serving your future investment needs.
Sincerely,

Rupert H. Johnson, Jr.
Chairman
Franklin Custodian Funds
This letter reflects our analysis and opinions as of September 30, 2019, unless otherwise indicated. The information is not a complete analysis of every aspect of any market, country, industry, security or fund. Statements of fact are from sources considered reliable.
1. Source: Copyright © 2019, S&P Dow Jones Indices LLC. All rights reserved.
2. Source: Morningstar. The changes in index prices shown for the S&P 500 do not include reinvestments of income and distributions, which are included in their total returns, which were: S&P 500 +4.25% (index total return resulting in an increase from 5,763.42 to 6,008.59).
3. Sources: Morningstar and Bloomberg Barclays Indices. For the Bloomberg Index, only total return as shown is available, not price change without the inclusion of reinvested income and distributions.
See www.franklintempletondatasources.com for additional data provider information.
| | |
| | Not FDIC Insured | May Lose Value | No Bank Guarantee |
| | | | |
| | | |
| franklintempleton.com | | Not part of the annual report | | 1 |
Contents
| | |
| | | Visitfranklintempleton.comfor fund updates, to access your account, or to find helpful financial planning tools. |
| | | | |
| | | |
2 | | Annual Report | | franklintempleton.com |
ANNUAL REPORT
Economic and Market Overview
The U.S. economy expanded during the 12 months ended September 30, 2019. After moderating for two consecutive quarters, the economy grew significantly faster in 2019’s first quarter. However, the economy moderated in the second and third quarters, due partly to weakness in inventory and business investment. The manufacturing sector expanded during most of the period, but contracted in August and September 2019. The services sector continued to expand throughout the period, although the rate of expansion slowed in September. The unemployment rate decreased from 3.7% in September 2018 to 3.5% atperiod-end.1 The annual inflation rate, as measured by the Consumer Price Index, decreased from 2.3% in September 2018 to 1.7% atperiod-end.1
The U.S. Federal Reserve (Fed) raised its target range for the federal funds rate by 0.25% at its December 2018 meeting, to 2.25%–2.50%. However, at its July 2019 meeting, the Fed lowered the federal funds target rate range for the first time since December 2008, to 2.00%–2.25%, citing muted inflation pressures and the potential effects of global trade tensions on economic growth. Furthermore, the Fed ended its balance sheet normalization program earlier than previously indicated. In September, the Fed further lowered the federal funds target rate range to 1.75%–2.00%, reiterating the rationale cited at the July meeting.
U.S. equity markets overall rose during the period, benefiting from upbeat economic data and U.S. corporate earnings, the Fed’s rate cuts and investor optimism about further monetary easing. However, markets reflected concerns about tighter regulation of technology companies, the Fed’s 2018 interest-rate path, political uncertainties in the U.S. (including the impeachment inquiry into President Donald Trump), geopolitical tensions in certain regions, and the impact of U.S. trade disputes with China and other trading partners on global growth and corporate earnings. These concerns were partly alleviated at certain points during the period by easing trade tensions and optimism about a potential U.S.-China trade deal. The broad U.S. stock market, as measured by the Standard & Poor’s 500 Index (S&P 500), sold off sharply in 2018’s fourth quarter, but generally trended higher in 2019’s first seven months, reaching a newall-time high in July. Stocks retreated in August, due to escalating trade tensions and heightened concerns about
U.S. and global economic growth, but recovered in September amid easing trade tensions and investor optimism about the upcoming U.S.-China trade negotiations in October 2019. Overall, the S&P 500 posted a +4.25% total return for the12-month period.2
1. Source: Bureau of Labor Statistics.
2. Source: Morningstar.
See www.franklintempletondatasources.com for additional data provider information.
| | | | |
| | | |
| franklintempleton.com | | Annual Report | | 3 |
Franklin DynaTech Fund
This annual report for Franklin DynaTech Fund covers the fiscal year ended September 30, 2019.
Your Fund’s Goal and Main Investments
The Fund seeks capital appreciation by investing primarily in equity securities of companies that emphasize innovation and new technologies, have superior management and that benefit from new industry conditions in the dynamically changing global economy.
Performance Overview
The Fund’s Class A shares posted a +4.77% cumulative total return for the 12 months under review. In comparison, the Russell 1000® Growth Index, which measures performance of the largest companies in the Russell 3000® Index with higherprice-to-book ratios and higher forecasted growth values, posted a total return of +3.71%.1 Also for comparison, the broad U.S. stock market as measured by the Standard & Poor’s 500 Index (S&P 500), posted a +4.25% return.1 You can find the Fund’s long-term performance data in the Performance Summary beginning on page 7.
Performance data represent past performance, which does not guarantee future results. Investment return and principal value will fluctuate, and you may have a gain or loss when you sell your shares. Current performance may differ from figures shown. For most recentmonth-end performance, go tofranklintempleton.comor call(800)342-5236.
Investment Strategy
We use fundamental,bottom-up research to seek companies meeting our criteria of growth potential, quality and valuation. In seeking sustainable growth characteristics, we look for companies we believe can produce sustainable earnings and cash flow growth, evaluating the long-term market opportunity and competitive structure of an industry to target leaders and emerging leaders. We define quality companies as those with strong and improving competitive positions in attractive markets. We also believe important attributes of quality are experienced and talented management teams as well as financial strength reflected in
Portfolio Composition
Based on Total Net Assets as of 9/30/19
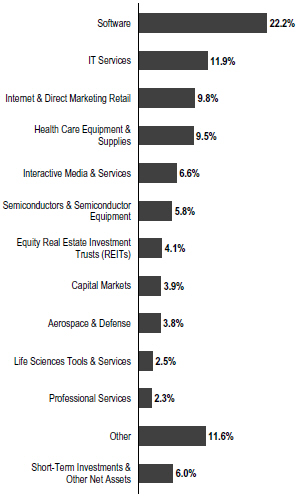
the capital structure, gross and operating margins, free cash flow generation and returns on capital employed. Our valuation analysis includes a range of potential outcomes based on an assessment of multiple scenarios. In assessing value, we consider whether security prices fully reflect the balance of the sustainable growth opportunities relative to business and financial risks.
1. Source: Morningstar.
The indexes are unmanaged and include reinvestment of any income or distributions. They do not reflect any fees, expenses or sales charges. One cannot invest directly in an index, and an index is not representative of the Fund’s portfolio.
Frank Russell Company is the source and owner of the trademarks, service marks and copyrights related to the Russell Indexes. Russell® is a trademark of Frank Russell Company.
The dollar value, number of shares or principal amount, and names of all portfolio holdings are listed in the Fund’s Statement of Investments (SOI). The SOI begins on page 44.
| | | | |
| | | |
4 | | Annual Report | | franklintempleton.com |
FRANKLIN DYNATECH FUND
We may invest in companies in any economic sector or of any market capitalization and may invest in companies both inside and outside of the U.S. Although we search for investments across a large number of sectors, we expect to have significant positions in particular sectors including, for example, technology and health care.
Manager’s Discussion
During the reporting period, the investment sectors that most notably contributed to performance were information technology (IT) and real estate.2 Within IT, Cloud-based commerce platform Shopify had a strong start to 2019, reporting better-than-expected first-quarter revenue and earnings, led by growth in subscriptions and merchant solutions. The company continued to execute on multiple business fronts, growing its Shopify Plus business, expanding internationally and investing in product developments and partnerships that could potentially benefit its broad merchant base. Furthermore, the company reported stronger-than-expected second-quarter revenues and earnings, driven by robust demand for its online and offline retail operating solutions.
Information software and services firm Microsoft is a beneficiary of strong sales execution, a positive enterprise IT spending environment, its status as a critical partner to IT departments in this time of digital transformation, and a large installed base that is successfully moving to higher-value cloud andService-as-a-Software deployments. The company saw sustained strength in its enterprise cloud computing platform Azure, solid growth in its traditional server products and particularly strong growth in commercial bookings. Furthermore, the company continued to expand gross profit margins and control operational expenses.
ServiceNow, a leader in enabling digital transformation, provides cloud-based IT service management for enterprise customers and has been steadily growing into a multi-product company providing an integrated platform to clients. We believe its strong productline-up and a relatively benign competitive environment could potentially lead to strong growth as the company increases its market share and seeks to become the workflow platform for larger enterprises. Mastercard, a leading global payment network
benefitted from acash-to-digital payments secular trend and also boosted returns.
Within the real estate sector, wireless communications operator American Tower was a major contributor to the Fund’s results. Wireless communications infrastructure company SBA Communications also contributed. Individual contributor MercadoLibre, an online commerce company also benefited results.
In contrast, health care, consumer discretionary and communication services sectors detracted from the Fund’s performance.3 Within health care, research, development and medical device company ABIOMED and product-basedbio-pharmaceutical company Neurocrine Bioscineces detracted from results (not held atperiod-end).
Within the consumer discretionary sector, online marketplace Amazon.com delivered a mixed third quarter with growing revenue that exceeded company guidance but was lower than investors expected, due to slower international retail revenue growth and weak results from acquired businesses. Amazon’s fourth quarter revenue and earnings exceeded all expectations, but guidance indicating slower first-quarter revenue growth hindered the stock. Online and mobile platform company Grubhub also detracted (not held atperiod-end).
Individual holdings that detracted from the Fund’s performance included semiconductor company Nvidia after it lowered its fiscal fourth-quarter 2019 revenue guideline due to a decline in gaming revenues, the launch delay of the Turing next-generation graphic cards and a decline in the company’s datacenter segment due to hyperscale capital expenditure deceleration.
Within the communication services sector, Activision Blizzard’s shares (not held atperiod-end), which reached anall-time high in October, declined after disappointment that the company did not announce Diabolo 4’s launch at its annual gaming convention and due to the negative response to its Diabolo mobile expansion. However, the company has a good portfolio of wholly owned intellectual properties, plans to release promising new products in 2019 and could benefit from the shift to digital entertainment, extension to mobile and expanding player base. Payment and
2. The information technology sector comprises electronic equipment; instruments and components; IT services; semiconductors and semiconductor equipment; software and technology hardware, storage and peripherals in the SOI. The real estate sector comprises equity real estate investment trusts (REITS) in the SOI.
3. The health care sector comprises biotechnology, health care equipment and supplies, health care providers and services, health care technology, life sciences tools and services, and pharmaceuticals in the SOI. The consumer discretionary sector comprises diversified consumer services; internet and direct marketing retail; and textiles, apparel and luxury goods in the SOI. The communication services sector comprises entertainment, interactive media and services and media in the SOI.
See www.franklintempletondatasources.com for additional data provider information.
| | | | |
| | | |
| franklintempleton.com | | Annual Report | | 5 |
FRANKLIN DYNATECH FUND
Top 10 Holdings
9/30/19
| | |
Company Sector/Industry | | % of Total
Net Assets |
| |
Amazon.com Inc. Internet & Direct Marketing Retail | | 6.4% |
| |
Microsoft Corp. Software | | 3.9% |
| |
Alphabet Inc. Interactive Media & Services | | 3.6% |
| |
Mastercard Inc. IT Services | | 3.1% |
| |
Visa Inc. IT Services | | 2.4% |
| |
ServiceNow Inc. Software | | 2.0% |
| |
salesforce.com Inc. Software | | 1.7% |
| |
Adobe Inc. Software | | 1.6% |
| |
Veeva Systems Inc. Health Care Technology | | 1.5% |
| |
IDEXX Laboratories Inc. Health Care Equipment & Supplies | | 1.5% |
point-of-sale solutions provider, Square also detracted from results (not held atperiod-end).
Thank you for your continued participation in Franklin Dynatech Fund. We look forward to serving your future investment needs.
| | |
| | | |

| | 
Matthew J. Moberg, CPA |
 | | 
Rupert H. Johnson, Jr. Portfolio Management Team |
The foregoing information reflects our analysis, opinions and portfolio holdings as of September 30, 2019, the end of the reporting period. The way we implement our main investment strategies and the resulting portfolio holdings may change depending on factors such as market and economic conditions. These opinions may not be relied upon as investment advice or an offer for a particular security. The information is not a complete analysis of every aspect of any market, country, industry, security or the Fund. Statements of fact are from sources considered reliable, but the investment manager makes no representation or warranty as to their completeness or accuracy. Although historical performance is no guarantee of future results, these insights may help you understand our investment management philosophy.
| | | | |
| | | |
6 | | Annual Report | | franklintempleton.com |
FRANKLIN DYNATECH FUND
Performance Summary as of September 30, 2019
The performance table and graphs do not reflect any taxes that a shareholder would pay on Fund dividends, capital gain distributions, if any, or any realized gains on the sale of Fund shares. Total return reflects reinvestment of the Fund’s dividends and capital gain distributions, if any, and any unrealized gains or losses. Your dividend income will vary depending on dividends or interest paid by securities in the Fund’s portfolio, adjusted for operating expenses of each class. Capital gain distributions are net profits realized from the sale of portfolio securities.
Performance as of 9/30/191
Cumulative total return excludes sales charges. Average annual total return includes maximum sales charges. Sales charges will vary depending on the size of the investment and the class of share purchased. The maximum is 5.50% and the minimum is 0%.Class A:5.50% maximum initial sales charge;Advisor Class:no sales charges. For other share classes, visitfranklintempleton.com.
| | | | | | |
| Share Class | | Cumulative Total Return2 | | | | Average Annual Total Return3 |
| | | |
A4 | | | | | | |
1-Year | | +4.77% | | | | -0.99% |
5-Year | | +106.18% | | | | +14.27% |
10-Year | | +336.02% | | | | +15.21% |
| | | |
Advisor | | | | | | |
1-Year | | +5.04% | | | | +5.04% |
5-Year | | +108.76% | | | | +15.86% |
10-Year | | +347.14% | | | | +16.16% |
Performance data represent past performance, which does not guarantee future results. Investment return and principal value will fluctuate, and you may have a gain or loss when you sell your shares. Current performance may differ from figures shown. For most recentmonth-end performance, go tofranklintempleton.comor call(800)342-5236.
See page 9 for Performance Summary footnotes.
| | | | |
| | | |
| franklintempleton.com | | Annual Report | | 7 |
FRANKLIN DYNATECH FUND
PERFORMANCE SUMMARY
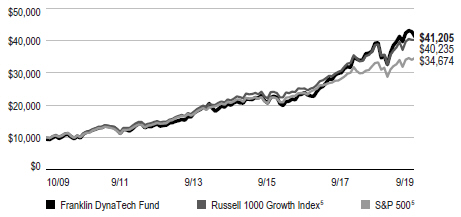
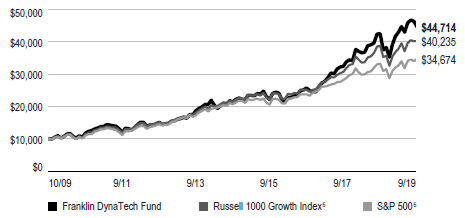
Total Return Index Comparison for a Hypothetical $10,000 Investment1
Total return represents the change in value of an investment over the periods shown. It includes any applicable maximum sales charge, Fund expenses, account fees and reinvested distributions. The unmanaged indexes include reinvestment of any income or distributions. They differ from the Fund in composition and do not pay management fees or expenses. One cannot invest directly in an index.
Class A (10/1/09–9/30/19)
Advisor Class (10/1/09–9/30/19)
See page 9 for Performance Summary footnotes.
| | | | |
| | | |
8 | | Annual Report | | franklintempleton.com |
FRANKLIN DYNATECH FUND
PERFORMANCE SUMMARY
Distributions(10/1/18–9/30/19)
| | | | |
| Share Class | | Long-Term Capital Gain | |
| A | | | $1.9118 | |
| C | | | $1.9118 | |
| R | | | $1.9118 | |
| R6 | | | $1.9118 | |
| Advisor | | | $1.9118 | |
Total Annual Operating Expenses6
| | | | | | |
| Share Class | | With Fee
Waiver | | | | Without Fee
Waiver |
| A | | 0.87% | | | | 0.87% |
| Advisor | | 0.62% | | | | 0.62% |
Each class of shares is available to certain eligible investors and has different annual fees and expenses, as described in the prospectus.
All investments involve risks, including possible loss of principal. Stocks historically have outperformed other asset classes over the long term, but tend to fluctuate more dramatically over the short term. Investments in fast-growing industries, like the technology and health care sectors (which have historically been volatile) could result in increased price fluctuation, especially over the short term, due to the rapid pace of product change and development and changes in government regulation of companies emphasizing scientific or technological advancement or regulatory approval for new drugs and medical instruments. The Fund may also invest in small- andmid-capitalization companies, which can be particularly sensitive to changing economic conditions, and their prospects for growth are less certain than those of larger, more established companies. The Fund is actively managed but there is no guarantee that the manager’s investment decisions will produce the desired results. The Fund’s prospectus also includes a description of the main investment risks.
1. The Fund has a fee waiver associated with any investment it makes in a Franklin Templeton money fund and/or other Franklin Templeton fund, contractually guaranteed through 1/31/20. Fund investment results reflect the fee waiver; without this waiver, the results would have been lower.
2. Cumulative total return represents the change in value of an investment over the periods indicated.
3. Average annual total return represents the average annual change in value of an investment over the periods indicated. Return for less than one year, if any, has not been annualized.
4. Prior to 9/10/18, these shares were offered at a higher initial sales charge of 5.75%, thus actual returns (with sales charges) would have differed. Average annual total returns (with sales charges) have been restated to reflect the current maximum initial sales charge of 5.50%.
5. Source: Morningstar. The Russell 1000 Growth Index is market capitalization-weighted and measures performance of those Russell 1000 Index companies with higherprice-to-book ratios and higher forecasted growth values. The S&P 500 is a market capitalization-weighted index of 500 stocks designed to measure total U.S. equity market performance.
6. Figures are as stated in the Fund’s current prospectus and may differ from the expense ratios disclosed in the Your Fund’s Expenses and Financial Highlights sections in this report. In periods of market volatility, assets may decline significantly, causing total annual Fund operating expenses to become higher than the figures shown.
See www.franklintempletondatasources.com for additional data provider information.
| | | | |
| | | |
| franklintempleton.com | | Annual Report | | 9 |
FRANKLIN DYNATECH FUND
Your Fund’s Expenses
As a Fund shareholder, you can incur two types of costs: (1) transaction costs, including sales charges (loads) on Fund purchases and redemptions; and (2) ongoing Fund costs, including management fees, distribution and service(12b-1) fees, and other Fund expenses. All mutual funds have ongoing costs, sometimes referred to as operating expenses. The table below shows ongoing costs of investing in the Fund and can help you understand these costs and compare them with those of other mutual funds. The table assumes a $1,000 investment held for the six months indicated.
Actual Fund Expenses
The table below provides information about actual account values and actual expenses in the columns under the heading “Actual.” In these columns the Fund’s actual return, which includes the effect of Fund expenses, is used to calculate the “Ending Account Value” for each class of shares. You can estimate the expenses you paid during the period by following these steps (of course, your account value and expenses will differ from those in this illustration): Divide your account value by $1,000 (if your account had an $8,600 value, then $8,600÷ $1,000 = 8.6). Then multiply the result by the number in the row for your class of shares under the headings “Actual” and “Expenses Paid During Period” (if Actual Expenses Paid During Period were $7.50, then 8.6 x $7.50 = $64.50). In this illustration, the actual expenses paid this period are $64.50.
Hypothetical Example for Comparison with Other Funds
Under the heading “Hypothetical” in the table, information is provided about hypothetical account values and hypothetical expenses based on the Fund’s actual expense ratio and an assumed rate of return of 5% per year before expenses, which is not the Fund’s actual return. This information may not be used to estimate the actual ending account balance or expenses you paid for the period, but it can help you compare ongoing costs of investing in the Fund with those of other funds. To do so, compare this 5% hypothetical example for the class of shares you hold with the 5% hypothetical examples that appear in the shareholder reports of other funds.
Please note that expenses shown in the table are meant to highlight ongoing costs and do not reflect any transactional costs. Therefore, information under the heading “Hypothetical” is useful in comparing ongoing costs only, and will not help you compare total costs of owning different funds. In addition, if transactional costs were included, your total costs would have been higher.
| | | | | | | | | | | | |
| | | | | Actual (actual return after expenses) | | Hypothetical (5% annual return before expenses) | | |
| | | | | | | | |
Share
Class | | Beginning
Account
Value 4/1/19 | | Ending
Account
Value 9/30/19 | | Expenses Paid During
Period 4/1/19–9/30/191, 2 | | Ending
Account
Value 9/30/19 | | Expenses Paid During
Period 4/1/19–9/30/191,2 | | Net
Annualized
Expense
Ratio2 |
| | | | | | |
A | | $1,000 | | $1,038.00 | | $4.39 | | $1,020.76 | | $4.36 | | 0.86% |
C | | $1,000 | | $1,034.20 | | $8.21 | | $1,017.00 | | $8.14 | | 1.61% |
R | | $1,000 | | $1,036.80 | | $5.67 | | $1,019.50 | | $5.62 | | 1.11% |
R6 | | $1,000 | | $1,039.90 | | $2.56 | | $1,022.56 | | $2.54 | | 0.50% |
Advisor | | $1,000 | | $1,039.40 | | $3.12 | | $1,022.01 | | $3.09 | | 0.61% |
1. Expenses are equal to the annualized expense ratio for thesix-month period as indicated above—in the far right column—multiplied by the simple average account value over the period indicated, and then multiplied by 183/365 to reflect theone-half year period.
2. Reflects expenses after fee waivers and expense reimbursements. Does not include acquired fund fees and expenses.
| | | | |
| | | |
10 | | Annual Report | | franklintempleton.com |
Franklin Growth Fund
This annual report for Franklin Growth Fund covers the fiscal year ended September 30, 2019.
Your Fund’s Goal and Main Investments
The Fund seeks capital appreciation by investing substantially in equity securities of companies that are leaders in their industries.
Performance Overview
The Fund’s Class A shares posted a +3.79% cumulative total return for the 12 months under review. In comparison, the Standard & Poor’s 500 Index (S&P 500), which is a broad measure of U.S. stock performance, posted a +4.25% total return.1 You can find the Fund’s long-term performance data in the Performance Summary beginning on page 14.
Performance data represent past performance, which does not guarantee future results. Investment return will fluctuate. Current performance may differ from figures shown. For most recentmonth-end performance, go tofranklintempleton.comor call(800)342-5236.
Investment Strategy
We use fundamental,bottom-up research to seek companies meeting our criteria of growth potential, quality and valuation. In seeking sustainable growth characteristics, we look for companies we believe can produce sustainable earnings and cash flow growth, evaluating the long-term market opportunity and competitive structure of an industry to target leaders and emerging leaders. We define quality companies as those with strong and improving competitive positions in attractive markets. We also believe important attributes of quality are experienced and talented management teams as well as financial strength reflected in the capital structure, gross and operating margins, free cash flow generation and returns on capital employed. Our valuation analysis includes a range of potential outcomes based on an assessment of multiple scenarios. In assessing value, we consider whether security prices fully reflect the balance of the sustainable growth opportunities relative to business and financial risks.
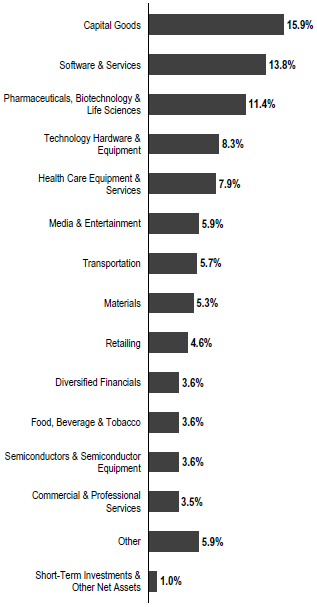
Portfolio Composition
Based on Total Net Assets as of 9/30/19
Manager’s Discussion
Franklin Growth Fund owned shares of 131 companies atperiod-end. We continue to invest in a broad array of companies of all sizes and in varied industries.
1. Source: Morningstar.
The index is unmanaged and includes reinvestment of any income or distributions. It does not reflect any fees, expenses or sales charges. One cannot invest directly in an index, and an index is not representative of the Fund’s portfolio.
The dollar value, number of shares or principal amount, and names of all portfolio holdings are listed in the Fund’s Statement of Investments (SOI). The SOI begins on page 54.
| | | | |
| | | |
| franklintempleton.com | | Annual Report | | 11 |
FRANKLIN GROWTH FUND
Top 10 Holdings
9/30/19
| | |
Company Sector/Industry | | % of Total
Net Assets |
| |
Apple Inc. Technology Hardware & Equipment | | 4.3% |
| |
Amazon.com Inc. Retailing | | 3.8% |
| |
Microsoft Corp. Software & Services | | 2.9% |
| |
The Boeing Co. Capital Goods | | 2.6% |
| |
Northrop Grumman Corp. Capital Goods | | 2.6% |
| |
Alphabet Inc. Media & Entertainment | | 2.4% |
| |
Mastercard Inc. Software & Services | | 2.3% |
| |
Union Pacific Corp. Transportation | | 2.0% |
| |
Mettler-Toledo International Inc. Pharmaceuticals, Biotechnology & Life Sciences | | 1.9% |
| |
Intuit Inc. Software & Services | | 1.6% |
During the period under review, the information technology (IT), materials and industrials sectors notably contributed to performance.2 Within the IT sector, information software and services firm Microsoft is a beneficiary of strong sales execution, a positive enterprise IT spending environment, its status as a critical partner to IT departments in this time of digital transformation, and a large installed base that is successfully moving to higher-value cloud andService-as-a-Software deployments. The company saw sustained strength in its enterprise cloud computing platform Azure, solid growth in its traditional server products and particularly strong growth in commercial bookings. Furthermore, the company continued to expand gross profit margins and control operational expenses.
Mastercard continues to perform very well, meeting revenue and earnings expectations amid continued strong volume, transaction and cross border growth rates. The company announced several growth initiatives, partnerships, acquisition of capabilities that expand its global network,
investment in emerging regions and expansion into new payment flows. Mastercard has shown an ability to both invest for the long term and deliver solidquarter-to-quarter execution, which we believe is supported by a strong organic growth profile. ServiceNow, a leader in enabling digital transformation, provides cloud-based IT service management for enterprise customers and has been steadily growing into a multi-product company providing an integrated platform to clients. We believe its strong productline-up and a relatively benign competitive environment could potentially lead to strong growth as the company increases its market share and seeks to become the workflow platform for larger enterprises.
Within the materials sector, Ecolab, which engages in the provision of products and services in the field of water, hygiene and energy also contributed to Fund results. In industrials, holding company Verisk Analytics, which engages in the provision of data analytics for customers in insurance, energy and financial services and global security company Northrup Grumman also boosted results.
Individual contributor American Tower, a wireless communications operator, contributed to the Fund’s results. The company had a strong first quarter 2019 led by accelerating strength in the U.S. despite some headwinds in India.
In contrast, the consumer discretionary, energy and health care sectors detracted from Fund performance.3 Within consumer discretionary, online marketplace Amazon.com detracted from results as it delivered a mixed third quarter 2018 report with growing revenue that exceeded company guidance but was lower than investors expected, due to slower international retail and weak results from acquired businesses. Amazon’s fourth-quarter 2018 revenue and earnings exceeded all expectations, but guidance indicating slower first-quarter 2019 revenue growth hindered the stock.
Within the energy sector, Concho Resources, which engages in the acquisition, development and exploration of oil and natural gas properties, also detracted from results.
In the health care sector, biotechnology company Biogen (not held atperiod-end) hindered performance as it suffered a major setback with the recent failure of the drug
2. The IT sector comprises semiconductors and semiconductor equipment, software and services, and technology hardware and equipment in the SOI. The industrials sector comprises capital goods, commercial and professional services, and transportation in the SOI.
3. The consumer discretionary sector comprises automobile and components, consumer durables and apparel, consumer services and retailing in the SOI. The health care sector comprises health care equipment and services and pharmaceuticals, biotechnology and life sciences in the SOI.
See www.franklintempletondatasources.com for additional data provider information.
| | | | |
| | | |
12 | | Annual Report | | franklintempleton.com |
FRANKLIN GROWTH FUND
Aducanumab during its trial phase. The drug was to be utilized in the treatment of Alzheimer’s.
ABIOMED, a research, development and medical device company, also detracted from results as the company was forced to cut its guidance when a U.S. Food and Drug Administration (FDA) letter issued in February 2019 incorrectly addressed the safety of the Impella PR heart pump. Although the FDA clarified matters and stated the device was safe and effective, the company’s financial results were negatively impacted. We believe company fundamentals remain strong and there is an extensive market opportunity for ABIOMED’s minimally invasive heart pump.
Other detractors included multi-industry company Textron (not held atperiod-end), which leverages a global network of aircraft, defense, industrial and finance businesses as well as DXC Technology, a technology and support services company, and 3M, a technology and manufacturing company.
Thank you for your continued participation in Franklin Growth Fund. We look forward to serving your future investment needs.
| | |
 | | 
Serena Perin Vinton, CFA |
| |
| | John Anderson |
| | Robert Rendler, CFA |
| |
| | Portfolio Management Team |
The foregoing information reflects our analysis, opinions and portfolio holdings as of September 30, 2019, the end of the reporting period. The way we implement our main investment strategies and the resulting portfolio holdings may change depending on factors such as market and economic conditions. These opinions may not be relied upon as investment advice or an offer for a particular security. The information is not a complete analysis of every aspect of any market, country, industry, security or the Fund. Statements of fact are from sources considered reliable, but the investment manager makes no representation or warranty as to their completeness or accuracy. Although historical performance is no guarantee of future results, these insights may help you understand our investment management philosophy.
| | | | |
| | |
CFA® is a trademark owned by CFA Institute. | | | | |
| | | |
| franklintempleton.com | | Annual Report | | 13 |
FRANKLIN GROWTH FUND
Performance Summary as of September 30, 2019
The performance table and graphs do not reflect any taxes that a shareholder would pay on Fund dividends, capital gain distributions, if any, or any realized gains on the sale of Fund shares. Total return reflects reinvestment of the Fund’s dividends and capital gain distributions, if any, and any unrealized gains or losses. Your dividend income will vary depending on dividends or interest paid by securities in the Fund’s portfolio, adjusted for operating expenses of each class. Capital gain distributions are net profits realized from the sale of portfolio securities.
Performance as of 9/30/191
Cumulative total return excludes sales charges. Average annual total return includes maximum sales charges. Sales charges will vary depending on the size of the investment and the class of share purchased. The maximum is 5.50% and the minimum is 0%.Class A:5.50% maximum initial sales charge;Advisor Class:no sales charges. For other share classes, visitfranklintempleton.com.
| | | | |
| Share Class | | Cumulative
Total Return2 | | Average Annual
Total Return3 |
| | |
A4 | | | | |
1-Year | | +3.79% | | -1.92% |
5-Year | | +75.85% | | +10.69% |
10-Year | | +248.55% | | +12.66% |
| | |
Advisor | | | | |
1-Year | | +4.05% | | +4.05% |
5-Year | | +78.07% | | +12.23% |
10-Year | | +257.40% | | +13.58% |
Performance data represent past performance, which does not guarantee future results. Investment return and principal value will fluctuate, and you may have a gain or loss when you sell your shares. Current performance may differ from figures shown. For most recentmonth-end performance, go tofranklintempleton.comor call(800)342-5236.
See page 16 for Performance Summary footnotes.
| | | | |
| | | |
14 | | Annual Report | | franklintempleton.com |
FRANKLIN GROWTH FUND
PERFORMANCE SUMMARY
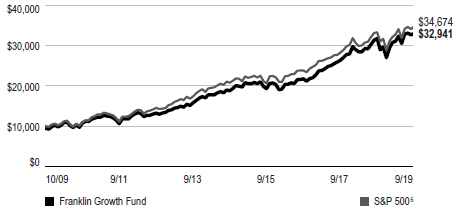
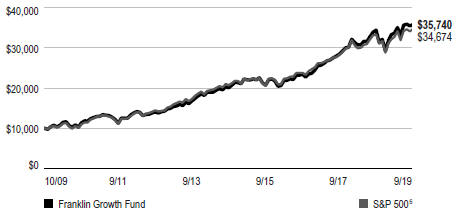
Total Return Index Comparison for a Hypothetical $10,000 Investment1
Total return represents the change in value of an investment over the periods shown. It includes any applicable maximum sales charge, Fund expenses, account fees and reinvested distributions. The unmanaged index includes reinvestment of any income or distributions. It differs from the Fund in composition and does not pay management fees or expenses. One cannot invest directly in an index.
Class A (10/1/09–9/30/19)
Advisor Class (10/1/09–9/30/19)
See page 16 for Performance Summary footnotes.
| | | | |
| | | |
| franklintempleton.com | | Annual Report | | 15 |
FRANKLIN GROWTH FUND
PERFORMANCE SUMMARY
Distributions (10/1/18–9/30/19)
| | | | | | | | |
| Share Class | | Net Investment
Income | | | Long-Term
Capital Gain | | Total |
A | | $ | 0.4377 | | | $1.0435 | | $1.4812 |
| C | | $ | — | | | $1.0435 | | $1.0435 |
| R | | $ | 0.1413 | | | $1.0435 | | $1.1848 |
| R6 | | $ | 0.7873 | | | $1.0435 | | $1.8308 |
| Advisor | | $ | 0.6908 | | | $1.0435 | | $1.7343 |
Total Annual Operating Expenses6 | | | | | |
| Share Class | | With Fee
Waiver | | | Without Fee Waiver | | |
A | | | 0.84% | | | 0.84% | | |
| Advisor | | | 0.59% | | | 0.59% | | |
Each class of shares is available to certain eligible investors and has different annual fees and expenses, as described in the prospectus.
All investments involve risks, including possible loss of principal. Historically, the Fund has focused on larger companies. The Fund may also invest in small, relatively new and/or unseasoned companies, which involves additional risks, as the price of these securities can be volatile, particularly over the short term. The Fund may focus on particular sectors of the market from time to time, which can carry greater risks of adverse developments in such sectors. In addition, the Fund may invest up to 40% of its net assets in stocks of foreign companies, which involve special risks, including currency fluctuations and economic as well as political uncertainty. The Fund is actively managed but there is no guarantee that the manager’s investment decisions will produce the desired results. The Fund’s prospectus also includes a description of the main investment risks.
1. The Fund has a fee waiver associated with any investment it makes in a Franklin Templeton money fund and/or other Franklin Templeton fund, contractually guaranteed through 1/31/20. Fund investment results reflect the fee waiver; without this waiver, the results would have been lower.
2. Cumulative total return represents the change in value of an investment over the periods indicated.
3. Average annual total return represents the average annual change in value of an investment over the periods indicated. Return for less than one year, if any, has not been annualized.
4. Prior to 9/10/18, these shares were offered at a higher initial sales charge of 5.75%, thus actual returns (with sales charges) would have differed. Average annual total returns (with sales charges) have been restated to reflect the current maximum initial sales charge of 5.50%.
5. Source: Morningstar. The S&P 500 is a market capitalization-weighted index of 500 stocks designed to measure total U.S. equity market performance.
6. Figures are as stated in the Fund’s current prospectus and may differ from the expense ratios disclosed in the Your Fund’s Expenses and Financial Highlights sections in this report. In periods of market volatility, assets may decline significantly, causing total annual Fund operating expenses to become higher than the figures shown.
See www.franklintempletondatasources.com for additional data provider information.
| | | | |
| | | |
16 | | Annual Report | | franklintempleton.com |
FRANKLIN GROWTH FUND
Your Fund’s Expenses
As a Fund shareholder, you can incur two types of costs: (1) transaction costs, including sales charges (loads) on Fund purchases and redemptions; and (2) ongoing Fund costs, including management fees, distribution and service(12b-1) fees, and other Fund expenses. All mutual funds have ongoing costs, sometimes referred to as operating expenses. The table below shows ongoing costs of investing in the Fund and can help you understand these costs and compare them with those of other mutual funds. The table assumes a $1,000 investment held for the six months indicated.
Actual Fund Expenses
The table below provides information about actual account values and actual expenses in the columns under the heading “Actual.” In these columns the Fund’s actual return, which includes the effect of Fund expenses, is used to calculate the “Ending Account Value” for each class of shares. You can estimate the expenses you paid during the period by following these steps (of course, your account value and expenses will differ from those in this illustration): Divide your account value by $1,000 (if your account had an $8,600 value, then $8,600÷ $1,000 = 8.6). Then multiply the result by the number in the row for your class of shares under the headings “Actual” and “Expenses Paid During Period” (if Actual Expenses Paid During Period were $7.50, then 8.6 x $7.50 = $64.50). In this illustration, the actual expenses paid this period are $64.50.
Hypothetical Example for Comparison with Other Funds
Under the heading “Hypothetical” in the table, information is provided about hypothetical account values and hypothetical expenses based on the Fund’s actual expense ratio and an assumed rate of return of 5% per year before expenses, which is not the Fund’s actual return. This information may not be used to estimate the actual ending account balance or expenses you paid for the period, but it can help you compare ongoing costs of investing in the Fund with those of other funds. To do so, compare this 5% hypothetical example for the class of shares you hold with the 5% hypothetical examples that appear in the shareholder reports of other funds.
Please note that expenses shown in the table are meant to highlight ongoing costs and do not reflect any transactional costs. Therefore, information under the heading “Hypothetical” is useful in comparing ongoing costs only, and will not help you compare total costs of owning different funds. In addition, if transactional costs were included, your total costs would have been higher.
| | | | | | | | | | | | |
| | | | | Actual (actual return after expenses) | | Hypothetical (5% annual return before expenses) | | |
| | | | | | | | |
Share Class | | Beginning
Account
Value 4/1/19 | | Ending
Account
Value 9/30/19 | | Expenses Paid During Period 4/1/19–9/30/191, 2 | | Ending Account
Value 9/30/19 | | Expenses Paid During Period 4/1/19–9/30/191,2 | | Net
Annualized
Expense
Ratio2 |
| | | | | | |
A | | $1,000 | | $1,061.50 | | $4.29 | | $1,020.91 | | $4.20 | | 0.83% |
C | | $1,000 | | $1,057.50 | | $8.15 | | $1,017.15 | | $7.99 | | 1.58% |
R | | $1,000 | | $1,060.20 | | $5.58 | | $1,019.65 | | $5.47 | | 1.08% |
R6 | | $1,000 | | $1,063.50 | | $2.43 | | $1,022.71 | | $2.38 | | 0.47% |
Advisor | | $1,000 | | $1,062.90 | | $3.00 | | $1,022.16 | | $2.94 | | 0.58% |
1. Expenses are equal to the annualized expense ratio for thesix-month period as indicated above—in the far right column—multiplied by the simple average account value over the period indicated, and then multiplied by 183/365 to reflect theone-half year period.
2. Reflects expenses after fee waivers and expense reimbursements. Does not include acquired fund fees and expenses.
| | | | |
| | | |
| franklintempleton.com | | Annual Report | | 17 |
Franklin Income Fund
This annual report for Franklin Income Fund covers the fiscal year ended September 30, 2019.
Your Fund’s Goal and Main Investments
The Fund seeks to maximize income, while maintaining prospects for capital appreciation by investing, under normal market conditions, in a diversified portfolio of debt and equity securities.
Performance Overview
The Fund’s Class A shares posted a cumulative total return of +4.40% for the 12 months under review. In comparison, the Fund’s equity benchmark, the Standard & Poor’s 500 Index (S&P 500), which is a broad measure of U.S. stock performance, posted a +4.25% total return.1,2 The Fund’s new secondarybenchmark, the blended 50% MSCI USD High Dividend Yield Index + 25% Bloomberg Barclays High Yield Very Liquid Index + 25% Bloomberg Barclays U.S. Aggregate Index (Blended Benchmark), which is a combination of leading stock and bond indexes that better reflect the asset allocation of the Fund’s portfolio, posted a +7.94% total return.3 The Fund’s prior fixed income benchmark, the Bloomberg Barclays U.S. Aggregate Bond Index, which tracks the U.S. investment-grade, taxable bond market, posted a +10.30% total return.1 The Fund’s peers, as measured by the Lipper Mixed-Asset Target Allocation Moderate Funds Classification Average, which consists of funds chosen by Lipper that, by practice, maintain a mix of 40% to 60% equity securities, with the remainder in bonds and cash, posted a +3.92% total return.4 You can find the Fund’s long-term performance data in the Performance Summary beginning on page 21.
Performance data represent past performance, which does not guarantee future results. Investment return will fluctuate. Current performance may differ from figures shown. For
most recentmonth-end performance, go tofranklintempleton.comor call(800)342-5236.
Dividend Distributions*
10/1/18–9/30/19
| | | | | | | | | | | | | | | | | | | | | | | | |
| | | Dividend per Share (cents) | |
| Month | | Class
A | | | Class
A1 | | | Class
C | | | Class
R | | | Class
R6 | | | Advisor
Class | |
| | | | | | |
October | | | 0.98 | | | | 1.00 | | | | 0.90 | | | | 0.93 | | | | 1.03 | | | | 1.02 | |
| | | | | | |
November | | | 0.98 | | | | 1.00 | | | | 0.90 | | | | 0.93 | | | | 1.03 | | | | 1.02 | |
| | | | | | |
December | | | 0.98 | | | | 1.00 | | | | 0.90 | | | | 0.93 | | | | 1.03 | | | | 1.02 | |
| | | | | | |
January | | | 0.98 | | | | 1.00 | | | | 0.90 | | | | 0.93 | | | | 1.03 | | | | 1.02 | |
| | | | | | |
February | | | 0.98 | | | | 1.00 | | | | 0.90 | | | | 0.93 | | | | 1.03 | | | | 1.02 | |
| | | | | | |
March | | | 0.98 | | | | 1.00 | | | | 0.90 | | | | 0.93 | | | | 1.03 | | | | 1.02 | |
| | | | | | |
April | | | 0.98 | | | | 1.00 | | | | 0.90 | | | | 0.93 | | | | 1.03 | | | | 1.02 | |
| | | | | | |
May | | | 0.98 | | | | 1.00 | | | | 0.90 | | | | 0.93 | | | | 1.03 | | | | 1.02 | |
| | | | | | |
June | | | 0.98 | | | | 1.00 | | | | 0.90 | | | | 0.93 | | | | 1.03 | | | | 1.02 | |
| | | | | | |
July | | | 0.98 | | | | 1.00 | | | | 0.90 | | | | 0.93 | | | | 1.03 | | | | 1.02 | |
| | | | | | |
August | | | 0.98 | | | | 1.00 | | | | 0.90 | | | | 0.93 | | | | 1.03 | | | | 1.02 | |
| | | | | | |
September | | | 0.98 | | | | 1.00 | | | | 0.90 | | | | 0.93 | | | | 1.03 | | | | 1.02 | |
| | | | | | |
Total | | | 11.76 | | | | 12.00 | | | | 10.80 | | | | 11.16 | | | | 12.36 | | | | 12.24 | |
* The distribution amount is the sum of all net investment income distributions for the period shown. All Fund distributions will vary depending upon current market conditions, and past distributions are not indicative of future trends.
Investment Strategy
In analyzing debt and equity securities, we consider such factors as a company’s experience and managerial strength; responsiveness to changes in interest rates and business conditions; debt maturity schedules and borrowing requirements; changing financial condition and market recognition of the change; and a security’s relative value based on such factors as anticipated cash flow, interest or dividend coverage, asset coverage and earnings. When choosing investments for the Fund, we apply abottom-up, value oriented, long-term approach, focusing on the market
1. Source: Morningstar.
2. Effective 9/10/18, Class A shares closed to new investors, were renamed Class A1 shares, and a new Class A share with a different expense structure became available. Class A performance shown has been calculated as follows: (a) for periods prior to 9/10/18, a restated figure is used based on the Fund’s Class A1 performance that includes any Rule12b-1 rate differential that exists between Class A1 and Class A; and (b) for periods after 9/10/18, actual Class A performance is used, reflecting all charges and fees applicable to that class.
3. Source: Factset. The Fund’s Blended Benchmark was calculated internally and rebalanced monthly.
4. Source: Lipper, a Thomson Reuters Company. For the12-month period ended 9/30/19, this category consisted of 600 funds. Lipper calculations do not include sales charges or expense subsidization by a fund’s manager. The Fund’s performance relative to the average may have differed if these and other factors had been considered. The indexes are unmanaged and include reinvestment of any income or distributions. They do not reflect any fees, expenses or sales charges. One cannot invest directly in an index, and an index is not representative of the Fund’s portfolio.
See www.franklintempletondatasources.com for additional data provider information.
The dollar value, number of shares or principal amount, and names of all portfolio holdings are listed in the Fund’s Statement of Investments (SOI).
The SOI begins on page 65.
| | | | |
| | | |
18 | | Annual Report | | franklintempleton.com |
FRANKLIN INCOME FUND
price of a company’s securities relative to the investment manager’s evaluation of the company’s long-term earning, asset value and cash flow potential.
Manager’s Discussion
During the period under review, our equity weighting decreased from 50.0% to 47.8%, and our fixed income weighting increased from 47.9% to 50.0%. The Fund’s cash position increased from 2.1% to 2.2% of total net assets.
The primary driver of returns in financial markets over the period was the significant decline in long-term interest-rates as evidenced by the decline in yields for10-year U.S. Treasury securities where the yield declined from over 3% at the start of the period to near 1.6% atperiod-end. This decline was highly beneficial for returns from higher quality long-duration fixed income assets. Key themes driving this move included slowing global growth, the absence of inflationary pressures, and reduced sentiment related to trade policy uncertainty.
Equity markets started the period with a significant decline in the fourth quarter of 2018 as investors worried about deceleration in global GDP growth, trade policy disruptions, monetary policy tightening, and slowing earnings growth. The U.S. Federal Reserve (Fed) raised its target range for the federal funds rate in December, but then cut the rate in July, which reversed the increase and fueled the market to new highs. The Fed then cut the rate one more time in September.
In addition to a more supportive monetary policy globally, equities benefited from the belief that U.S. consumers and strong domestic labor market conditions (lowest unemployment rate in 50 years) remained robust enough to sustain moderate economic growth going forward.
While overall equity market gains were relatively modest during the period, sector total return dispersion was fairly significant with strong positive returns from the utilities, information technology and consumer staples sectors. The most significant contributors to performance within the utility sector included electric utility companies The Southern Company, Sempra Energy, and Dominion Energy. Top contributors within the information technology sector included Texas Instruments and Microsoft Corp. Consumer staples also contributed as our holdings in Procter & Gamble performed well due to improved fundamentals and favorable market sentiment.
Within equities, the energy, materials, and industrial sectors were key detractors from performance. Most notably weak energy sector fundamentals hampered our stock holdings in
Portfolio Composition
9/30/19
| | |
| | | % of Total
Net Assets |
Equity* | | 47.8% |
Financials | | 8.4% |
Information Technology | | 8.0% |
Energy | | 6.5% |
Health Care | | 6.2% |
Utilities | | 6.0% |
Consumer Discretionary | | 3.5% |
Materials | | 2.9% |
Industrials | | 2.2% |
Communication Services | | 2.1% |
Consumer Staples | | 1.5% |
Real Estate | | 0.5% |
Fixed Income** | | 50.0% |
Financials | | 17.1% |
Health Care | | 12.9% |
Energy | | 6.0% |
Communication Services | | 5.8% |
Consumer Discretionary | | 2.9% |
Materials | | 1.4% |
Utilities | | 1.2% |
Consumer Staples | | 0.9% |
Industrials | | 0.7% |
Information Technology | | 0.5% |
Real Estate | | 0.6% |
Short-Term Investments & Other Net Assets | | 2.2% |
*Includes convertible bonds.
**Includes senior floating rate interests and index-linked notes.
Occidental Petroleum, which was under pressure due to the acquisition of Anadarko Petroleum (not a Fund holding), as well as Halliburton and a convertible security in Weatherford International.
The Fund experienced modest overall gains from fixed income securities, which lagged the strong returns of the broad Bloomberg Barclays U.S. Aggregate Bond Index. The Fund’s overweight position in relatively short duration credit exposures and generally underweight position in higher-quality, longer duration assets were the primary contributors to underperformance. While failing to deliver attractive relative total return during the period, the Fund’s positioning did provide a higher level of income consistent with the investment strategy’s primary objective.
In fixed income, all sectors were positive excluding energy, which broadly struggled with rising credit spreads. Key detractors in the energy sector included oilfield services and
| | | | |
| | | |
| franklintempleton.com | | Annual Report | | 19 |
FRANKLIN INCOME FUND
equipment company Weatherford International, which struggled from weakening demand for upstream services, and oil and gas exploration and production company Chesapeake Energy, which struggled in part due to weak expectations for commodity oil and natural gas prices.
Top Five Equity Holdings*
9/30/19
| | |
Company Sector/Industry | | % of Total
Net Assets |
| |
The Southern Co. Utilities | | 2.0% |
| |
Wells Fargo & Co. Financials | | 1.9% |
| |
Bank of America Corp. Financials | | 1.7% |
| |
Dominion Energy Inc. Utilities | | 1.6% |
| |
Occidental Petroleum Corp. Energy | | 1.4% |
* Includes convertible bonds.
Specialty pharmaceutical companies Mallinckrodt International and Endo also detracted in part due to concerns around potential liabilities related to opioid settlements.
Within fixed income, holdings of U.S. Treasury securities boosted returns during the period as did holdings in hospital management companies Community Health Systems and Tenet Healthcare amid improved fundamentals in the sector and modest deleveraging. In the communications sector, bond holdings from Sprint Corp. and DISH Corp. aided overall returns.
Top Five Fixed Income Holdings*
9/30/19
| | |
Company Sector/Industry | | % of Total
Net Assets |
| |
U.S. Treasury Note Financials | | 8.7% |
| |
CHS/Community Health Systems Inc. Health Care | | 4.9% |
| |
Tenet Healthcare Corp. Health Care | | 2.8% |
| |
U.S. Treasury Bond Financials | | 2.2% |
| |
Chesapeake Energy Corp. Energy | | 1.7% |
*Includes senior floating rate interests and index-linked notes.
Thank you for your continued participation in Franklin Income Fund. We look forward to serving your future investment needs.
| | |
 | | 
Edward Perks, CFA Lead Portfolio Manager |
| |
| | Matthew Quinlan |
| | Richard S. Hsu, CFA |
| | Todd Brighton, CFA |
| | Brendan Circle, CFA |
| |
| | Portfolio Management Team |
The foregoing information reflects our analysis, opinions and portfolio holdings as of September 30, 2019, the end of the reporting period. The way we implement our main investment strategies and the resulting portfolio holdings may change depending on factors such as market and economic conditions. These opinions may not be relied upon as investment advice or an offer for a particular security. The information is not a complete analysis of every aspect of any market, country, industry, security or the Fund. Statements of fact are from sources considered reliable, but the investment manager makes no representation or warranty as to their completeness or accuracy. Although historical performance is no guarantee of future results, these insights may help you understand our investment management philosophy.
| | | | |
| | | |
20 | | Annual Report | | franklintempleton.com |
FRANKLIN INCOME FUND
Performance Summary as of September 30, 2019
The performance tables and graphs do not reflect any taxes that a shareholder would pay on Fund dividends, capital gain distributions, if any, or any realized gains on the sale of Fund shares. Total return reflects reinvestment of the Fund’s dividends and capital gain distributions, if any, and any unrealized gains or losses. Your dividend income will vary depending on dividends or interest paid by securities in the Fund’s portfolio, adjusted for operating expenses of each class. Capital gain distributions are net profits realized from the sale of portfolio securities.
Performance as of 9/30/191
Cumulative total return excludes sales charges. Average annual total return includes maximum sales charges. Sales charges will vary depending on the size of the investment and the class of share purchased. The maximum is 3.75% and the minimum is 0%.Class A:3.75% maximum initial sales charge;Advisor Class:no sales charges. For other share classes, visitfranklintempleton.com.
| | | | |
| Share Class | | Cumulative
Total Return2
| | Average Annual
Total Return3 |
| | |
A4,5 | | | | |
1-Year | | +4.40% | | +0.49% |
| | |
5-Year | | +20.42% | | +3.00% |
| | |
10-Year | | +104.43% | | +7.00% |
| | |
Advisor | | | | |
1-Year | | +4.65% | | +4.65% |
| | |
5-Year | | +21.54% | | +3.98% |
| | |
10-Year | | +107.77% | | +7.59% |
| | | | | | | | |
| | | Distribution | | | | 30-Day Standardized Yield7 |
| Share Class | | Rate6 | | | | (with fee waiver) | | (without fee waiver) |
| | | | |
A | | 4.92% | | | | 3.56% | | 3.55% |
| | | | |
Advisor | | 5.37% | | | | 3.95% | | 3.95% |
Performance data represent past performance, which does not guarantee future results. Investment return and principal value will fluctuate, and you may have a gain or loss when you sell your shares. Current performance may differ from figures shown. For most recentmonth-end performance, go tofranklintempleton.comor call(800)342-5236.
See page 24 for Performance Summary footnotes.
| | | | |
| | | |
| franklintempleton.com | | Annual Report | | 21 |
FRANKLIN INCOME FUND
PERFORMANCE SUMMARY
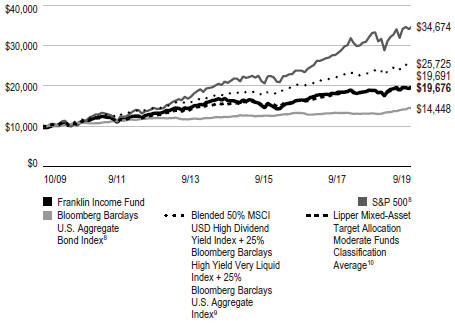
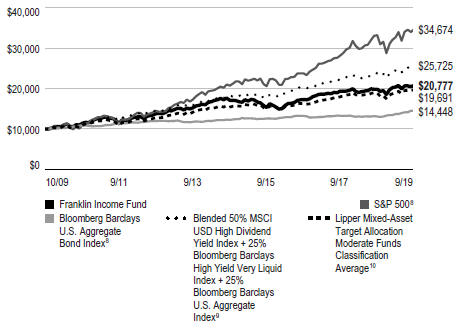
Total Return Index Comparison for a Hypothetical $10,000 Investment1
Total return represents the change in value of an investment over the periods shown. It includes any applicable maximum sales charge, Fund expenses, account fees and reinvested distributions. The unmanaged indexes include reinvestment of any income or distributions. They differ from the Fund in composition and do not pay management fees or expenses. One cannot invest directly in an index.
Class A (10/1/09–9/30/19)
Advisor Class (10/1/09–9/30/19)
See page 24 for Performance Summary footnotes.
| | | | |
| | | |
22 | | Annual Report | | franklintempleton.com |
FRANKLIN INCOME FUND
PERFORMANCE SUMMARY
Net Asset Value
| | | | | | |
| Share Class(Symbol) | | 9/30/19 | | 9/30/18 | | Change |
| | | |
| A (FKIQX) | | $2.30 | | $2.32 | | -$0.02 |
| | | |
| A1(FKINX) | | $2.30 | | $2.32 | | -$0.02 |
| | | |
| C (FCISX) | | $2.34 | | $2.35 | | -$0.01 |
| | | |
| R (FISRX) | | $2.26 | | $2.28 | | -$0.02 |
| | | |
| R6(FNCFX) | | $2.29 | | $2.30 | | -$0.01 |
| | | |
| Advisor(FRIAX) | | $2.28 | | $2.30 | | -$0.02 |
|
| Distributions(10/1/18–9/30/19) |
| | | |
| Share Class | | Net Investment
Income | | | | |
| | | |
| A | | $0.1176 | | | | |
| | | |
| A1 | | $0.1200 | | | | |
| | | |
| C | | $0.1080 | | | | |
| | | |
| R | | $0.1116 | | | | |
| | | |
| R6 | | $0.1236 | | | | |
| | | |
| Advisor | | $0.1224 | | | | |
|
| Total Annual Operating Expenses11 |
| | | |
| Share Class | | With Fee Waiver | | Without Fee Waiver | | |
| | | |
| A | | 0.72% | | 0.72% | | |
| | | |
| Advisor | | 0.47% | | 0.47% | | |
See page 24 for Performance Summary footnotes.
| | | | |
| | | |
| franklintempleton.com | | Annual Report | | 23 |
FRANKLIN INCOME FUND
PERFORMANCE SUMMARY
Each class of shares is available to certain investors and has different annual fees and expenses, as described in the prospectus.
All investments involve risks, including possible loss of principal. The Fund’s portfolio includes a substantial portion of higher-yielding, lower-rated corporate bonds and some floating rate loans, which are also higher yielding and lower rated. These investments have more credit risk than investment-grade securities and are subject to increased risk of default and potential loss of principal. The Fund’s share price and yield will be affected by interest rate movements. Bond prices generally move in the opposite direction of interest rates. Thus, as prices of bonds in the Fund adjust to a rise in interest rates, the Fund’s share price may decline. Changes in the financial strength of a bond issuer or in a bond’s credit rating may affect its value. Stock prices fluctuate, sometimes rapidly and dramatically, due to factors affecting individual companies, particular industries or sectors, or general market conditions. Foreign investing involves additional risks such as currency and market volatility, as well as political and social instability. The Fund is actively managed but there is no guarantee that the manager’s investment decisions will produce the desired results. The Fund’s prospectus also includes a description of the main investment risks.
1. The Fund has a fee waiver associated with any investment it makes in a Franklin Templeton money fund and/or other Franklin Templeton fund, contractually guaranteed through 1/31/20. Fund investment results reflect the fee waiver; without this waiver, the results would have been lower.
2. Cumulative total return represents the change in value of an investment over the periods indicated.
3. Average annual total return represents the average annual change in value of an investment over the periods indicated. Return for less than one year, if any, has not been annualized.
4. Effective 9/10/18, Class A shares closed to new investors, were renamed Class A1 shares, and a new Class A share with a different expense structure became available. Class A performance shown has been calculated as follows: (a) for periods prior to 9/10/18, a restated figure is used based on the Fund’s Class A1 performance that includes any Rule12b-1 rate differential that exists between Class A1 and Class A; and (b) for periods after 9/10/18, actual Class A performance is used, reflecting all charges and fees applicable to that class.
5. Prior to 3/1/19, these shares were offered at a higher initial sales charge of 4.25%, thus actual returns (with sales charges) would have differed. Average annual total returns (with sales charges) have been restated to reflect the current maximum initial sales charge of 3.75%.
6. Distribution rate is based on an annualization of the respective class’s September dividend and the maximum offering price (NAV for Advisor Class) per share on 9/30/19.
7. The Fund’s30-day standardized yield is calculated over a trailing30-day period using the yield to maturity on bonds and/or the dividends accrued on stocks. It may not equal the Fund’s actual income distribution rate, which reflects the Fund’s past dividends paid to shareholders.
8. Source: Morningstar. The S&P 500 is a market capitalization-weighted index of 500 stocks designed to measure total U.S. equity market performance. The Bloomberg Barclays U.S. Aggregate Bond Index is a market capitalization-weighted index representing the U.S. investment-grade, fixed-rate, taxable bond market with index components for government and corporate, mortgage pass-through and asset-backed securities. All issues included are SEC registered, taxable, dollar denominated and nonconvertible, must have at least one year to final maturity and must be rated investment grade(Baa3/BBB-/BBB- or higher) using the middle rating of Moody’s, S&P and Fitch, respectively.
9. Source: Factset. The Blended 50% MSCI USD High Dividend Yield Index + 25% Bloomberg Barclays High Yield Very Liquid Index + 25% Bloomberg Barclays U.S. Aggregate Index measures performance of high dividend-paying global and developed and emerging stocks, noninvestment-grade corporate bonds and tracks performance of the U.S. investment-grade bond market.
10. Source: Lipper, a Thomas Reuters Company. The Lipper Mixed-Asset Target Allocation Moderate Funds Classification Average is calculated by averaging the total returns of all funds within the Lipper Mixed-Asset Target Allocation Moderate Funds classification in the Lipper Open-End underlying funds universe. Lipper Mixed-Asset Target Allocation Moderate Funds are defined as funds that, by portfolio practice, maintain a mix of between 40%–60% equity securities, with the remainder invested in bonds, cash and cash equivalents. For theone-year period ended 9/30/19, there were 600 funds in this category. Lipper calculations do not include sales charges or expense subsidization by a fund’s manager. The Fund’s performance relative to the average may have differed if these and other factors had been considered.
11. Figures are as stated in the Fund’s current prospectus and may differ from the expense ratios disclosed in the Your Fund’s Expenses and Financial Highlights sections in this report. In periods of market volatility, assets may decline significantly, causing total annual Fund operating expenses to become higher than the figures shown.
See www.franklintempletondatasources.com for additional data provider information.
| | | | |
| | | |
24 | | Annual Report | | franklintempleton.com |
FRANKLIN INCOME FUND
Your Fund’s Expenses
As a Fund shareholder, you can incur two types of costs: (1) transaction costs, including sales charges (loads) on Fund purchases and redemptions; and (2) ongoing Fund costs, including management fees, distribution and service(12b-1) fees, and other Fund expenses. All mutual funds have ongoing costs, sometimes referred to as operating expenses. The table below shows ongoing costs of investing in the Fund and can help you understand these costs and compare them with those of other mutual funds. The table assumes a $1,000 investment held for the six months indicated.
Actual Fund Expenses
The table below provides information about actual account values and actual expenses in the columns under the heading “Actual.” In these columns the Fund’s actual return, which includes the effect of Fund expenses, is used to calculate the “Ending Account Value” for each class of shares. You can estimate the expenses you paid during the period by following these steps (of course, your account value and expenses will differ from those in this illustration): Divide your account value by $1,000 (if your account had an $8,600 value, then $8,600÷ $1,000 = 8.6). Then multiply the result by the number in the row for your class of shares under the headings “Actual” and “Expenses Paid During Period” (if Actual Expenses Paid During Period were $7.50, then 8.6 x $7.50 = $64.50). In this illustration, the actual expenses paid this period are $64.50.
Hypothetical Example for Comparison with Other Funds
Under the heading “Hypothetical” in the table, information is provided about hypothetical account values and hypothetical expenses based on the Fund’s actual expense ratio and an assumed rate of return of 5% per year before expenses, which is not the Fund’s actual return. This information may not be used to estimate the actual ending account balance or expenses you paid for the period, but it can help you compare ongoing costs of investing in the Fund with those of other funds. To do so, compare this 5% hypothetical example for the class of shares you hold with the 5% hypothetical examples that appear in the shareholder reports of other funds.
Please note that expenses shown in the table are meant to highlight ongoing costs and do not reflect any transactional costs. Therefore, information under the heading “Hypothetical” is useful in comparing ongoing costs only, and will not help you compare total costs of owning different funds. In addition, if transactional costs were included, your total costs would have been higher.
| | | | | | | | | | | | |
| | | | | Actual (actual return after expenses) | | Hypothetical
(5% annual return before expenses) | | |
| | | | | | |
Share Class | | Beginning
Account
Value 4/1/19 | | Ending
Account
Value 9/30/19 | | Expenses Paid During
Period 4/1/19–9/30/191, 2 | | Ending Account Value 9/30/19 | | Expenses Paid During
Period 4/1/19–9/30/191, 2 | | Net
Annualized
Expense
Ratio2 |
| | | | | | |
A | | $1,000 | | $1,021.50 | | $3.60 | | $1,021.51 | | $3.60 | | 0.71% |
A1 | | $1,000 | | $1,017.60 | | $3.09 | | $1,022.01 | | $3.09 | | 0.61% |
C | | $1,000 | | $1,019.10 | | $5.62 | | $1,019.50 | | $5.62 | | 1.11% |
R | | $1,000 | | $1,016.10 | | $4.85 | | $1,020.26 | | $4.86 | | 0.96% |
R6 | | $1,000 | | $1,023.00 | | $1.98 | | $1,023.11 | | $1.98 | | 0.39% |
Advisor | | $1,000 | | $1,018.30 | | $2.33 | | $1,022.76 | | $2.33 | | 0.46% |
1. Expenses are equal to the annualized expense ratio for thesix-month period as indicated above—in the far right column—multiplied by the simple average account value over the period indicated, and then multiplied by 183/365 to reflect theone-half year period.
2. Reflects expenses after fee waivers and expense reimbursements. Does not include acquired fund fees and expenses.
| | | | |
| | | |
| franklintempleton.com | | Annual Report | | 25 |
Franklin U.S. Government Securities Fund
This annual report for Franklin U.S. Government Securities Fund covers the fiscal year ended September 30, 2019.
Your Fund’s Goal and Main Investments
The Fund seeks income by investing at least 80% of its net assets in U.S. government securities. The Fund presently invests substantially all of its assets in Government National Mortgage Association obligations (Ginnie Maes).
Since 1983, the Fund has invested substantially in Ginnie Mae securities, which carry a guarantee backed by the full faith and credit of the U.S. government as to the timely payment of interest and principal.1 Issued by the Government National Mortgage Association (GNMA), Ginnie Maes have been among the highest yielding U.S. government obligations available.
Portfolio Composition
Based on Total Net Assets as of 9/30/19
| | |
GNMA | | 97.7% |
U.S. Government and Agency Securities | | 0.4% |
Short-Term Investments & Other Net Assets | | 1.9% |
Performance Overview
The Fund’s Class A shares posted a +6.70% cumulative total return for the 12 months under review. In comparison, the Bloomberg Barclays U.S. Government Intermediate Index, the intermediate component of the Bloomberg Barclays U.S. Government Index, posted a +7.52% total return.2 The Fund’s peers, as measured by the Lipper GNMA Funds Classification Average, which consists of funds chosen by Lipper that invest primarily in GNMAs, posted a +6.90% total return for the same period.3 You can find the Fund’s long-term performance data in the Performance Summary beginning on page 28.
Performance data represent past performance, which does not guarantee future results. Investment return and principal
value will fluctuate, and you may have a gain or loss when you sell your shares. Current performance may differ from figures shown. For most recentmonth-end performance, go tofranklintempleton.comor call(800)342-5236.
Investment Strategy
We currently invest the Fund’s assets substantially in GNMA obligations. We analyze securities using proprietary models to help us identify attractive investment opportunities.
Dividend Distributions*
10/1/18–9/30/19
| | | | | | | | | | | | | | | | | | | | | | | | |
| | | Dividend per Share (cents) | |
| Month | | Class A | | | Class
A1 | | | Class
C | | | Class
R | | | Class
R6 | | | Advisor
Class | |
October | | | 1.62 | | | | 1.54 | | | | 1.25 | | | | 1.37 | | | | 1.67 | | | | 1.62 | |
November | | | 1.49 | | | | 1.54 | | | | 1.31 | | | | 1.38 | | | | 1.68 | | | | 1.62 | |
December | | | 1.50 | | | | 1.53 | | | | 1.28 | | | | 1.36 | | | | 1.66 | | | | 1.60 | |
January | | | 1.50 | | | | 1.54 | | | | 1.29 | | | | 1.37 | | | | 1.68 | | | | 1.62 | |
February | | | 1.51 | | | | 1.55 | | | | 1.32 | | | | 1.39 | | | | 1.68 | | | | 1.61 | |
March | | | 1.43 | | | | 1.47 | | | | 1.22 | | | | 1.30 | | | | 1.61 | | | | 1.55 | |
April | | | 1.46 | | | | 1.50 | | | | 1.25 | | | | 1.32 | | | | 1.63 | | | | 1.57 | |
May | | | 1.44 | | | | 1.48 | | | | 1.23 | | | | 1.31 | | | | 1.62 | | | | 1.56 | |
June | | | 1.43 | | | | 1.47 | | | | 1.22 | | | | 1.30 | | | | 1.61 | | | | 1.55 | |
July | | | 1.40 | | | | 1.44 | | | | 1.18 | | | | 1.26 | | | | 1.59 | | | | 1.52 | |
August | | | 1.38 | | | | 1.42 | | | | 1.17 | | | | 1.24 | | | | 1.57 | | | | 1.50 | |
September | | | 1.49 | | | | 1.51 | | | | 1.25 | | | | 1.34 | | | | 1.65 | | | | 1.59 | |
Total | | | 17.65 | | | | 17.99 | | | | 14.97 | | | | 15.94 | | | | 19.65 | | | | 18.91 | |
*The distribution amount is the sum of all net investment income distributions for the period shown. All Fund distributions will vary depending upon current market conditions, and past distributions are not indicative of future trends.
Manager’s Discussion
During the period, GNMA mortgage-backed securities (MBS) produced negative excess returns and underperformed Treasuries.
1. Securities owned by the Fund, but not shares of the Fund, are guaranteed by the U.S. government, its agencies or instrumentalities as to the timely payment of principal and interest. The Fund’s yield and share price are not guaranteed and will vary with market conditions.
2. Source: Morningstar.
3. Source: Lipper, a Thomson Reuters Company. For the12-month period ended 9/30/19, there were 52 funds in this category. Lipper calculations do not include sales charges or expense subsidization by a fund’s manager. The Fund’s performance relative to the average may have differed if these and other factors had been considered. The indexes are unmanaged and include reinvestment of any income or distributions. They do not reflect any fees, expenses or sales charges. One cannot invest directly in an index, and an index is not representative of the Fund’s portfolio.
See www.franklintempletondatasources.com for additional data provider information.
The dollar value, number of shares or principal amount, and names of all portfolio holdings are listed in the Fund’s Statement of Investments (SOI).
The SOI begins on page 88.
| | | | |
| | | |
26 | | Annual Report | | franklintempleton.com |
FRANKLIN U.S. GOVERNMENT SECURITIES FUND
MBS conditions remain supportive and the prepayment outlook fairly benign. With this backdrop, despite tight overall valuations, we are constructive on MBS fundamentals. The continued wind down of the Federal Reserve’s (Fed’s) System Open Market Account stands to be a key influence on the market as we move into the later part of the year. Despite relatively constant net supply, the Fed’s winding down of the balance sheet and an investor base that is mainly even-weighted could pressure the sector.
Within the agency mortgage pass-through sector, GNMAs underperformed their Freddie Mac and Fannie Mae counterparts. All coupons produced negative excess returns. GNMA I 4.0%, GNMA I 4.5% and GNMA I 3.0% were the worst performers.
The Fund maintains a conservative, disciplined investment strategy and invests primarily in GNMA mortgage pass-throughs, which remain the only MBS that are backed by the full faith and credit of the U.S. government—the same guarantee applicable to U.S. Treasuries.1 We believe our collateral-intensive research approach can allow us to uncover dislocations across the GNMA markets and associated misvaluation of prepayment risk. We continue to focus on specified pools where we believe our experience and continual investment in new technologies help us uncover these discrepancies.
During the period, we were more weighted toward GNMA IIs (pools of mortgages from multiple issuers) than GNMA Is (pools of mortgages from single issuers). Over the period, we added to GNMA II 3.0% and 4.0% coupons, while reducing exposure to 3.5%, 4.5% and 5.0% coupons. Our heaviest allocation was in 3.5%, 4.0% and 3.0% coupons atperiod-end. The Fund’s position in 4.0%, 5.0% and 6.0% coupon GNMA securities benefited performance, while our allocation to 3.5%, 3.0% and 4.5% coupon GNMAs detracted from performance.
In October 2019, afterperiod-end, Roger Bayston stepped off as Portfolio Manager of the Fund, while Neil Dhruv was added as a Portfolio Manager.
Thank you for your continued participation in Franklin U.S. Government Securities Fund. We welcome your comments and questions and look forward to serving your investment needs in the years ahead.
| | | | |

| | | | 
|
|
|
|
| | | | Roger A. Bayston, CFA |
| | | | |
 | | | | 
Paul Varunok |
|
|
|
|
|
| | |
| | | | Portfolio Management Team |
The foregoing information reflects our analysis, opinions and portfolio holdings as of September 30, 2019, the end of the reporting period. The way we implement our main investment strategies and the resulting portfolio holdings may change depending on factors such as market and economic conditions. These opinions may not be relied upon as investment advice or an offer for a particular security. The information is not a complete analysis of every aspect of any market, country, industry, security or the Fund. Statements of fact are from sources considered reliable, but the investment manager makes no representation or warranty as to their completeness or accuracy. Although historical performance is no guarantee of future results, these insights may help you understand our investment management philosophy.
| | | | |
| | | |
| franklintempleton.com | | Annual Report | | 27 |
FRANKLIN U.S. GOVERNMENT SECURITIES FUND
Performance Summary as of September 30, 2019
The performance tables and graphs do not reflect any taxes that a shareholder would pay on Fund dividends, capital gain distributions, if any, or any realized gains on the sale of Fund shares. Total return reflects reinvestment of the Fund’s dividends and capital gain distributions, if any, and any unrealized gains or losses. Your dividend income will vary depending on dividends or interest paid by securities in the Fund’s portfolio, adjusted for operating expenses of each class. Capital gain distributions are net profits realized from the sale of portfolio securities.
Performance as of 9/30/191
Cumulative total return excludes sales charges. Average annual total return includes maximum sales charges. Sales charges will vary depending on the size of the investment and the class of share purchased. The maximum is 3.75% and the minimum is 0%.Class A:3.75% maximum initial sales charge;Advisor Class:no sales charges. For other share classes, visitfranklintempleton.com.
| | | | |
| Share Class | | Cumulative
Total Return2
| | Average Annual
Total Return3 |
| | |
A4,5 | | | | |
1-Year | | +6.70% | | +2.70% |
| | |
5-Year | | +9.36% | | +1.03% |
| | |
10-Year | | +27.88% | | +2.10% |
| | |
Advisor | | | | |
1-Year | | +7.08% | | +7.08% |
| | |
5-Year | | +10.22% | | +1.97% |
| | |
10-Year | | +29.83% | | +2.64% |
| | | | | | | | |
| | | Distribution | | | | 30-Day Standardized Yield7 |
| Share Class | | Rate6 | | | | (with fee waiver) | | (without fee waiver) |
| | | | |
A | | 2.83% | | | | 1.91% | | 1.90% |
| | | | |
Advisor | | 3.13% | | | | 2.24% | | 2.23% |
Performance data represent past performance, which does not guarantee future results. Investment return and principal value will fluctuate, and you may have a gain or loss when you sell your shares. Current performance may differ from figures shown. For most recentmonth-end performance, go tofranklintempleton.comor call(800)342-5236.
See page 30 for Performance Summary footnotes.
| | | | |
| | | |
28 | | Annual Report | | franklintempleton.com |
FRANKLIN U.S. GOVERNMENT SECURITIES FUND
PERFORMANCE SUMMARY
Total Return Index Comparison for a Hypothetical $10,000 Investment1
Total return represents the change in value of an investment over the periods shown. It includes any applicable maximum sales charge, Fund expenses, account fees and reinvested distributions. The unmanaged indexes include reinvestment of any income or distributions. They differ from the Fund in composition and do not pay management fees or expenses. One cannot invest directly in an index.
Class A (10/1/09–9/30/19)
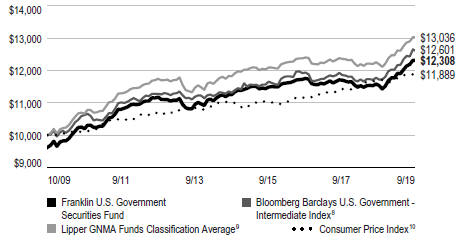
Advisor Class (10/1/09–9/30/19)
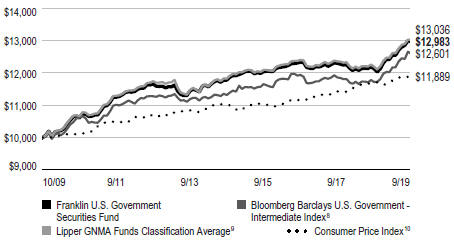
See page 30 for Performance Summary footnotes.
| | | | |
| | | |
| franklintempleton.com | | Annual Report | | 29 |
FRANKLIN U.S. GOVERNMENT SECURITIES FUND
PERFORMANCE SUMMARY
Distributions(10/1/18–9/30/19)
| | |
| Share Class | | Net Investment
Income |
A | | $0.1765 |
| A1 | | $0.1799 |
| C | | $0.1497 |
| R | | $0.1594 |
| R6 | | $0.1965 |
| Advisor | | $0.1891 |
Total Annual Operating Expenses11
| | | | | | | | |
| Share Class | | With Fee
Waiver | | | Without Fee
Waiver | |
| A | | | 0.87% | | | | 0.87% | |
| Advisor | | | 0.62% | | | | 0.62% | |
Each class of shares is available to certain eligible investors and has different annual fees and expenses, as described in the prospectus.
All investments involve risks, including possible loss of principal. The Fund’s share price and yield will be affected by interest rate movements and mortgage prepayments. Bond prices generally move in the opposite direction of interest rates. Thus, as prices of bonds in the Fund adjust to a rise in interest rates, the Fund’s share price may decline. Changes in the financial strength of a bond issuer or in a bond’s credit rating may affect its value. The Fund is actively managed but there is no guarantee that the manager’s investment decisions will produce the desired results. The Fund’s prospectus also includes a description of the main investment risks.
1. The Fund has a fee waiver associated with any investment it makes in a Franklin Templeton money fund and/or other Franklin Templeton fund, contractually guaranteed through 1/31/20. Fund investment results reflect the fee waiver; without this waiver, the results would have been lower.
2. Cumulative total return represents the change in value of an investment over the periods indicated.
3. Average annual total return represents the average annual change in value of an investment over the periods indicated. Return for less than one year, if any, has not been annualized.
4. Effective 9/10/18, Class A shares closed to new investors, were renamed Class A1 shares, and a new Class A share with a different expense structure became available. Class A performance shown has been calculated as follows: (a) for periods prior to 9/10/18, a restated figure is used based on the Fund’s Class A1 performance that includes any Rule12b-1 rate differential that exists between Class A1 and Class A; and (b) for periods after 9/10/18, actual Class A performance is used, reflecting all charges and fees applicable to that class.
5. Prior to 3/1/19, these shares were offered at a higher initial sales charge of 4.25%, thus actual returns (with sales charges) would have differed. Average annual total returns (with sales charges) have been restated to reflect the current maximum initial sales charge of 3.75%.
6. Distribution rate is based on an annualization of the respective class’s September dividend and the maximum offering price (NAV for Advisor Class) per share on 9/30/19.
7. The Fund’s30-day standardized yield is calculated over a trailing30-day period using the yield to maturity on bonds and/or the dividends accrued on stocks. It may not equal the Fund’s actual income distribution rate, which reflects the Fund’s past dividends paid to shareholders.
8. Source: Morningstar. Bloomberg Barclays U.S. Government Intermediate Index, the intermediate component of the Bloomberg Barclays U.S. Government Index, which includes public obligations of the U.S. Treasury with at least one year to final maturity and publicly issued debt of U.S. government agencies, quasi-federal corporations, and corporate or foreign debt guaranteed by the U.S. government.
9. Source: Lipper, a Thomson Reuters Company. The Lipper GNMA Funds Classification Average is calculated by averaging the total sum for all funds within the Lipper GNMA Funds classification in the LipperOpen-End underlying funds universe for the period indicated. Lipper GNMA Funds are defined as funds that invest primarily in Government National Mortgage Association securities. For theone-year period ended 9/30/19, there were 52 funds in this category. Lipper calculations do not include sales charges or expense subsidization by a fund’s manager. The Fund’s performance relative to the average may have differed if these or other factors had been considered.
10. Source: Bureau of Labor Statistics, bls.gov/cpi. The Consumer Price Index (CPI) is a commonly used measure of the inflation rate.
11. Figures are as stated in the Fund’s current prospectus and may differ from the expense ratios disclosed in the Your Fund’s Expenses and Financial Highlights sections in this report. In periods of market volatility, assets may decline significantly, causing total annual Fund operating expenses to become higher than the figures shown.
See www.franklintempletondatasources.com for additional data provider information.
| | | | |
| | | |
30 | | Annual Report | | franklintempleton.com |
FRANKLIN U.S. GOVERNMENT SECURITIES FUND
Your Fund’s Expenses
As a Fund shareholder, you can incur two types of costs: (1) transaction costs, including sales charges (loads) on Fund purchases and redemptions; and (2) ongoing Fund costs, including management fees, distribution and service(12b-1) fees, and other Fund expenses. All mutual funds have ongoing costs, sometimes referred to as operating expenses. The table below shows ongoing costs of investing in the Fund and can help you understand these costs and compare them with those of other mutual funds. The table assumes a $1,000 investment held for the six months indicated.
Actual Fund Expenses
The table below provides information about actual account values and actual expenses in the columns under the heading “Actual.” In these columns the Fund’s actual return, which includes the effect of Fund expenses, is used to calculate the “Ending Account Value” for each class of shares. You can estimate the expenses you paid during the period by following these steps (of course, your account value and expenses will differ from those in this illustration): Divide your account value by $1,000 (if your account had an $8,600 value, then $8,600÷ $1,000 = 8.6). Then multiply the result by the number in the row for your class of shares under the headings “Actual” and “Expenses Paid During Period” (if Actual Expenses Paid During Period were $7.50, then 8.6 x $7.50 = $64.50). In this illustration, the actual expenses paid this period are $64.50.
Hypothetical Example for Comparison with Other Funds
Under the heading “Hypothetical” in the table, information is provided about hypothetical account values and hypothetical expenses based on the Fund’s actual expense ratio and an assumed rate of return of 5% per year before expenses, which is not the Fund’s actual return. This information may not be used to estimate the actual ending account balance or expenses you paid for the period, but it can help you compare ongoing costs of investing in the Fund with those of other funds. To do so, compare this 5% hypothetical example for the class of shares you hold with the 5% hypothetical examples that appear in the shareholder reports of other funds.
Please note that expenses shown in the table are meant to highlight ongoing costs and do not reflect any transactional costs. Therefore, information under the heading “Hypothetical” is useful in comparing ongoing costs only, and will not help you compare total costs of owning different funds. In addition, if transactional costs were included, your total costs would have been higher.
| | | | | | | | | | | | |
| | | | | Actual (actual return after expenses) | | Hypothetical (5% annual return before expenses) | | |
| | | | | | | | |
Share Class | | Beginning
Account Value 4/1/19 | | Ending Account Value 9/30/19 | | Expenses Paid During
Period 4/1/19–9/30/191, 2 | | Ending Account Value 9/30/19 | | Expenses Paid During
Period 4/1/19–9/30/191, 2 | | Net Annualized
Expense Ratio2 |
| | | | | | |
A | | $1,000 | | $1,033.10 | | $4.49 | | $1,020.66 | | $4.46 | | 0.88% |
A1 | | $1,000 | | $1,033.50 | | $3.98 | | $1,021.16 | | $3.95 | | 0.78% |
C | | $1,000 | | $1,031.10 | | $6.52 | | $1,018.65 | | $6.48 | | 1.28% |
R | | $1,000 | | $1,031.70 | | $5.76 | | $1,019.40 | | $5.72 | | 1.13% |
R6 | | $1,000 | | $1,036.50 | | $2.55 | | $1,022.56 | | $2.54 | | 0.50% |
Advisor | | $1,000 | | $1,034.10 | | $3.21 | | $1,021.91 | | $3.19 | | 0.63% |
1. Expenses are equal to the annualized expense ratio for thesix-month period as indicated above—in the far right column—multiplied by the simple average account value over the period indicated, and then multiplied by 183/365 to reflect theone-half year period.
2. Reflects expenses after fee waivers and expense reimbursements. Does not include acquired fund fees and expenses.
| | | | |
| | | |
| franklintempleton.com | | Annual Report | | 31 |
Franklin Utilities Fund
This annual report for Franklin Utilities Fund covers the fiscal year ended September 30, 2019.
Your Fund’s Goal and Main Investments
The Fund seeks both capital appreciation and current income by investing at least 80% of its net assets in the securities of public utility companies. These are companies that provide electricity, natural gas, water, and communications services to the public and companies that provide services to public utilities companies. The Fund concentrates (invests more than 25% of its total assets) in companies operating in the utilities industry. The Fund invests primarily in equity securities, which consist mainly of common stocks.
Performance Overview
The Fund’s Class A shares posted a +27.43% cumulative total return for the 12 months under review. In comparison, the Standard & Poor’s 500 Index (S&P 500), which is a broad measure of U.S. stock performance, posted a +4.25% total return, and the S&P 500 Utilities Index, which measures the performance of all utilities stocks in the S&P 500, posted a +27.10% total return.1 You can find the Fund’s long-term performance data in the Performance Summary beginning on page 34.
Performance data represent past performance, which does not guarantee future results. Investment return will fluctuate. Current performance may differ from figures shown. For most recentmonth-end performance, go tofranklintempleton.comor call(800)342-5236.
Investment Strategy
We search for the best return opportunities available in the global utilities arena with a specific focus on the U.S. electricity and gas sector. Generally, we seek to invest in companies producing a high percentage of earnings from their regulated operations.
Manager’s Discussion
During the 12 months under review, the utilities sector contributed to the Fund’s performance.2 Notable contributors
Portfolio Composition
Based on Total Net Assets as of 9/30/19
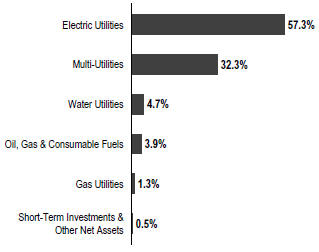
within utilities include NextEra Energy, American Electric Power and Xcel Energy. NextEra Energy, an electric power and energy infrastructure company, benefited from superior organic growth potential as well as modest value from expected investment opportunities related to future acquisitions. The company’s renewable energy goals and additional cost-cutting initiatives are slated to line up with a strengthenedearnings-per-share plan to drive growth. We believe American Electric Power, a public utility holding company with operations across several states, has a strong balance sheet and recently increased investment in regulated renewable generation assets, which we believe could provide better-than-expected long-term earnings growth potential. Utility holding company Xcel Energy also contributed to Fund results.
In contrast, a key individual detractor was utility company PG&E. Shares in the company were heavily impacted by the 2017–2018 Northern California fires. Although the company was absolved of responsibility for the 2017 Tubbs fire, it continues to face potential liabilities and years of litigation. As a result, the company filed for bankruptcy in January 2019.
1. Source: Morningstar.
The indexes are unmanaged and include reinvestment of any income or distributions. They do not reflect any fees, expenses or sales charges. One cannot invest directly in an index, and an index is not representative of the Fund’s portfolio.
2. The utilities sector comprises electric utilities, gas utilities, multi-utilities and water utilities in the SOI.
See www.franklintempletondatasources.com for additional data provider information.
The dollar value, number of shares or principal amount, and names of all portfolio holdings are listed in the Fund’s Statement of Investments (SOI).
The SOI begins on page 97.
| | | | |
| | | |
32 | | Annual Report | | franklintempleton.com |
FRANKLIN UTILITIES FUND
Other individual detractors included our holdings in Cheniere Energy (not held atperiod-end), a liquefied natural gas company, and energy infrastructure company The Williams Companies.
Top 10 Holdings
9/30/19
| | |
Company Sector/Industry | | % of Total Net Assets |
| |
NextEra Energy Inc. Electric Utilities | | 8.7% |
| |
American Electric Power Co. Inc. Electric Utilities | | 5.1% |
| |
Dominion Energy Inc. Multi-Utilities | | 4.9% |
| |
Sempra Energy Multi-Utilities | | 4.6% |
| |
CMS Energy Corp. Multi-Utilities | | 4.6% |
| |
Exelon Corp. Electric Utilities | | 4.6% |
| |
Duke Energy Corp. Electric Utilities | | 4.1% |
| |
Edison International Electric Utilities | | 4.1% |
| |
Xcel Energy Inc. Electric Utilities | | 4.0% |
| |
Evergy Inc. Electric Utilities | | 3.9% |
Thank you for your continued participation in Franklin Utilities Fund. We look forward to serving your future investment needs.
| | |

| | 
John C. Kohli, CFA |

| | 
J. Blair Schmicker, CFA |
| |
| | Portfolio Management Team |
The foregoing information reflects our analysis, opinions and portfolio holdings as of September 30, 2019, the end of the reporting period. The way we implement our main investment strategies and the resulting portfolio holdings may change depending on factors such as market and economic conditions. These opinions may not be relied upon as investment advice or an offer for a particular security. The information is not a complete analysis of every aspect of any market, country, industry, security or the Fund. Statements of fact are from sources considered reliable, but the investment manager makes no representation or warranty as to their completeness or accuracy. Although historical performance is no guarantee of future results, these insights may help you understand our investment management philosophy.
| | | | |
| | | |
| franklintempleton.com | | Annual Report | | 33 |
FRANKLIN UTILITIES FUND
Performance Summary as of September 30, 2019
The performance tables and graphs do not reflect any taxes that a shareholder would pay on Fund dividends, capital gain distributions, if any, or any realized gains on the sale of Fund shares. Total return reflects reinvestment of the Fund’s dividends and capital gain distributions, if any, and any unrealized gains or losses. Your dividend income will vary depending on dividends or interest paid by securities in the Fund’s portfolio, adjusted for operating expenses of each class. Capital gain distributions are net profits realized from the sale of portfolio securities.
Performance as of 9/30/191
Cumulative total return excludes sales charges. Average annual total return includes maximum sales charges. Sales charges will vary depending on the size of the investment and the class of share purchased. The maximum is 3.75% and the minimum is 0%.Class A:3.75% maximum initial sales charge;Advisor Class:no sales charges. For other share classes, visitfranklintempleton.com.
| | | | |
| Share Class | | Cumulative
Total Return2 | | Average Annual
Total Return3 |
| | |
A4,5 | | | | |
| | |
1-Year | | +27.43% | | +22.65% |
| | |
5-Year | | +72.76% | | +10.71% |
| | |
10-Year | | +224.08% | | +12.05% |
| | |
Advisor | | | | |
1-Year | | +27.78% | | +27.78% |
| | |
5-Year | | +74.44% | | +11.77% |
| | |
10-Year | | +229.84% | | +12.68% |
| | | | | | | | | | |
| | | Distribution | | | | | 30-Day Standardized Yield7 |
| Share Class | | Rate6 | | | | | (with fee waiver) | | (without fee waiver) |
| | | | |
A | | 1.96% | | | | | | 2.16% | | 2.16% |
| | | | |
Advisor | | 2.25% | | | | | | 2.49% | | 2.49% |
Performance data represent past performance, which does not guarantee future results. Investment return and principal value will fluctuate, and you may have a gain or loss when you sell your shares. Current performance may differ from figures shown. For most recentmonth-end performance, go tofranklintempleton.comor call(800)342-5236.
See page 37 for Performance Summary footnotes.
| | | | |
| | | |
34 | | Annual Report | | franklintempleton.com |
FRANKLIN UTILITIES FUND
PERFORMANCE SUMMARY
Total Return Index Comparison for a Hypothetical $10,000 Investment1
Total return represents the change in value of an investment over the periods shown. It includes any applicable maximum sales charge, Fund expenses, account fees and reinvested distributions. The unmanaged indexes include reinvestment of any income or distributions. They differ from the Fund in composition and do not pay management fees or expenses. One cannot invest directly in an index.
Class A(10/1/09–9/30/19)
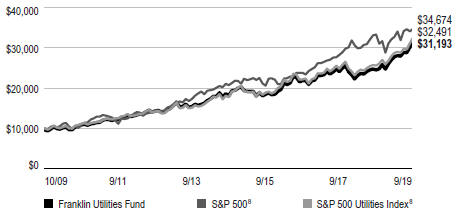
Advisor Class(10/1/09–9/30/19)
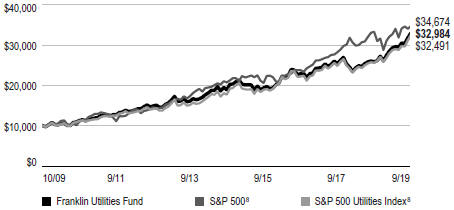
See page 37 for Performance Summary footnotes.
| | | | |
| | | |
| franklintempleton.com | | Annual Report | | 35 |
FRANKLIN UTILITIES FUND
PERFORMANCE SUMMARY
Net Asset Value
| | | | | | | | | | | | | | |
| Share Class(Symbol) | | 9/30/19 | | | 9/30/18 | | | Change | | | |
| | | | |
| A (FKUQX) | | | $22.53 | | | | $18.66 | | | | +$3.87 | | | |
| | | | |
| A1(FKUTX) | | | $22.54 | | | | $18.66 | | | | +$3.88 | | | |
| | | | |
| C (FRUSX) | | | $22.42 | | | | $18.57 | | | | +$3.85 | | | |
| | | | |
| R (FRURX) | | | $22.45 | | | | $18.59 | | | | +$3.86 | | | |
| | | | |
| R6(FUFRX) | | | $22.73 | | | | $18.81 | | | | +$3.92 | | | |
| | | | |
| Advisor(FRUAX) | | | $22.73 | | | | $18.81 | | | | +$3.92 | | | |
Distributions(10/1/18–9/30/19) | | | |
| Share Class | | Net Investment
Income | | | Short-Term
Capital Gain | | | Long-Term
Capital Gain | | | Total |
| | | | |
| A | | | $0.4942 | | | | $0.0112 | | | | $0.5657 | | | $1.0711 |
| | | | |
| A1 | | | $0.5143 | | | | $0.0112 | | | | $0.5657 | | | $1.0912 |
| | | | |
| C | | | $0.4156 | | | | $0.0112 | | | | $0.5657 | | | $0.9925 |
| | | | |
| R | | | $0.4451 | | | | $0.0112 | | | | $0.5657 | | | $1.0220 |
| | | | |
| R6 | | | $0.5611 | | | | $0.0112 | | | | $0.5657 | | | $1.1380 |
| | | | |
| Advisor | | | $0.5438 | | | | $0.0112 | | | | $0.5657 | | | $1.1207 |
Total Annual Operating Expenses9 | | | |
| Share Class | | With Fee
Waiver | | | Without Fee
Waiver | | | | | | |
| | | | |
| A | | | 0.84% | | | | 0.84% | | | | | | | |
| | | | |
| Advisor | | | 0.59% | | | | 0.59% | | | | | | | |
See page 37 for Performance Summary footnotes.
| | | | |
| | | |
36 | | Annual Report | | franklintempleton.com |
FRANKLIN UTILITIES FUND
PERFORMANCE SUMMARY
Each class of shares is available to certain eligible investors and has different annual fees and expenses, as described in the prospectus.
All investments involve risks, including possible loss of principal. Investing in a fund concentrating in the utilities sector involves special risks, including increased susceptibility to adverse economic and regulatory developments affecting the sector. Stocks historically have outperformed other asset classes over the long term, but tend to fluctuate more dramatically over the short term. Securities issued by utility companies have been historically sensitive to interest rate changes. When interest rates fall, utility securities prices, and thus a utilities fund’s share price, tend to rise; when interest rates rise, their prices generally fall. The Fund is actively managed but there is no guarantee that the manager’s investment decisions will produce the desired results. The Fund’s prospectus also includes a description of the main investment risks.
1. The Fund has a fee waiver associated with any investment it makes in a Franklin Templeton money fund and/or other Franklin Templeton fund, contractually guaranteed through 1/31/20. Fund investment results reflect the fee waiver; without this waiver, the results would have been lower.
2. Cumulative total return represents the change in value of an investment over the periods indicated.
3. Average annual total return represents the average annual change in value of an investment over the periods indicated. Return for less than one year, if any, has not been annualized.
4. Effective 9/10/18, Class A shares closed to new investors, were renamed Class A1 shares, and a new Class A share with a different expense structure became available. Class A performance shown has been calculated as follows: (a) for periods prior to 9/10/18, a restated figure is used based on the Fund’s Class A1 performance that includes any Rule12b-1 rate differential that exists between Class A1 and Class A; and (b) for periods after 9/10/18, actual Class A performance is used, reflecting all charges and fees applicable to that class.
5. Prior to 3/1/19, these shares were offered at a higher initial sales charge of 4.25%, thus actual returns (with sales charges) would have differed. Average annual total returns (with sales charges) have been restated to reflect the current maximum initial sales charge of 3.75%.
6. Distribution rate is based on an annualization of the respective class’s current quarterly dividend and the maximum offering price (NAV for Advisor Class) per share on 9/30/19.
7. The Fund’s30-day standardized yield is calculated over a trailing30-day period using the yield to maturity on bonds and/or the dividends accrued on stocks. It may not equal the Fund’s actual income distribution rate, which reflects the Fund’s past dividends paid to shareholders.
8. Morningstar. The S&P 500 is a market capitalization-weighted index of 500 stocks designed to measure total U.S. equity market performance. The S&P 500 Utilities Index is market capitalization weighted and consists of all utility stocks in the S&P 500.
9. Figures are as stated in the Fund’s current prospectus and may differ from the expense ratios disclosed in the Your Fund’s Expenses and Financial Highlights sections in this report. In periods of market volatility, assets may decline significantly, causing total annual Fund operating expenses to become higher than the figures shown.
See www.franklintempletondatasources.com for additional data provider information.
| | | | |
| | | |
| franklintempleton.com | | Annual Report | | 37 |
FRANKLIN UTILITIES FUND
Your Fund’s Expenses
As a Fund shareholder, you can incur two types of costs: (1) transaction costs, including sales charges (loads) on Fund purchases and redemptions; and (2) ongoing Fund costs, including management fees, distribution and service(12b-1) fees, and other Fund expenses. All mutual funds have ongoing costs, sometimes referred to as operating expenses. The table below shows ongoing costs of investing in the Fund and can help you understand these costs and compare them with those of other mutual funds. The table assumes a $1,000 investment held for the six months indicated.
Actual Fund Expenses
The table below provides information about actual account values and actual expenses in the columns under the heading “Actual.” In these columns the Fund’s actual return, which includes the effect of Fund expenses, is used to calculate the “Ending Account Value” for each class of shares. You can estimate the expenses you paid during the period by following these steps (of course, your account value and expenses will differ from those in this illustration): Divide your account value by $1,000 (if your account had an $8,600 value, then $8,600÷ $1,000 = 8.6). Then multiply the result by the number in the row for your class of shares under the headings “Actual” and “Expenses Paid During Period” (if Actual Expenses Paid During Period were $7.50, then 8.6 x $7.50 = $64.50). In this illustration, the actual expenses paid this period are $64.50.
Hypothetical Example for Comparison with Other Funds
Under the heading “Hypothetical” in the table, information is provided about hypothetical account values and hypothetical expenses based on the Fund’s actual expense ratio and an assumed rate of return of 5% per year before expenses, which is not the Fund’s actual return. This information may not be used to estimate the actual ending account balance or expenses you paid for the period, but it can help you compare ongoing costs of investing in the Fund with those of other funds. To do so, compare this 5% hypothetical example for the class of shares you hold with the 5% hypothetical examples that appear in the shareholder reports of other funds.
Please note that expenses shown in the table are meant to highlight ongoing costs and do not reflect any transactional costs. Therefore, information under the heading “Hypothetical” is useful in comparing ongoing costs only, and will not help you compare total costs of owning different funds. In addition, if transactional costs were included, your total costs would have been higher.
| | | | | | | | | | | | |
| | | | | Actual (actual return after expenses) | | Hypothetical (5% annual return before expenses) | | |
| | | | | | | | |
Share
Class | | Beginning
Account
Value 4/1/19 | | Ending
Account
Value 9/30/19 | | Expenses Paid During
Period 4/1/19–9/30/191, 2 | | Ending
Account
Value 9/30/19 | | Expenses Paid During
Period 4/1/19–9/30/191,2 | | Net
Annualized
Expense
Ratio2 |
| | | | | | |
A | | $1,000 | | $1,123.00 | | $4.36 | | $1,020.96 | | $4.15 | | 0.82% |
A1 | | $1,000 | | $1,124.00 | | $3.83 | | $1,021.46 | | $3.65 | | 0.72% |
C | | $1,000 | | $1,121.50 | | $6.49 | | $1,018.95 | | $6.17 | | 1.22% |
R | | $1,000 | | $1,122.10 | | $5.69 | | $1,019.70 | | $5.42 | | 1.07% |
R6 | | $1,000 | | $1,125.80 | | $2.66 | | $1,022.56 | | $2.54 | | 0.50% |
Advisor | | $1,000 | | $1,124.80 | | $3.04 | | $1,022.21 | | $2.89 | | 0.57% |
1. Expenses are equal to the annualized expense ratio for thesix-month period as indicated above—in the far right column—multiplied by the simple average account value over the period indicated, and then multiplied by 183/365 to reflect theone-half year period.
2. Reflects expenses after fee waivers and expense reimbursements. Does not include acquired fund fees and expenses.
| | | | |
| | | |
38 | | Annual Report | | franklintempleton.com |
FRANKLIN CUSTODIAN FUNDS
Financial Highlights
Franklin DynaTech Fund
| | | | | | | | | | | | | | | | | | | | |
| | | Year Ended September 30, | |
| | | 2019 | | | 2018 | | | 2017 | | | 2016 | | | 2015 | |
| |
| | | | | |
Class A | | | | | | | | | | | | | | | | | | | | |
| | | | | |
Per share operating performance (for a share outstanding throughout the year) | | | | | | | | | | | | | | | | | | | | |
| | | | | |
Net asset value, beginning of year | | | $81.16 | | | | $63.10 | | | | $52.05 | | | | $46.04 | | | | $46.08 | |
| | | | |
| | | | | |
Income from investment operationsa: | | | | | | | | | | | | | | | | | | | | |
| | | | | |
Net investment income (loss)b | | | (0.20 | ) | | | (0.23 | ) | | | (0.18 | ) | | | (0.14 | ) | | | (0.21) | |
| | | | | |
Net realized and unrealized gains (losses) | | | 3.79 | | | | 19.45 | | | | 12.92 | | | | 7.35 | | | | 1.78 | |
| | | | |
| | | | | |
Total from investment operations | | | 3.59 | | | | 19.22 | | | | 12.74 | | | | 7.21 | | | | 1.57 | |
| | | | |
| | | | | |
Less distributions from: | | | | | | | | | | | | | | | | | | | | |
| | | | | |
Net realized gains | | | (1.91 | ) | | | (1.16 | ) | | | (1.69 | ) | | | (1.20 | ) | | | (1.61) | |
| | | | |
| | | | | |
Net asset value, end of year | | | $82.84 | | | | $81.16 | | | | $63.10 | | | | $52.05 | | | | $46.04 | |
| | | | |
| | | | | |
Total returnc | | | 4.77% | | | | 30.88% | | | | 25.67% | | | | 15.73% | | | | 3.40% | |
| | | | | |
Ratios to average net assets | | | | | | | | | | | | | | | | | | | | |
| | | | | |
Expenses before waiver and payments by affiliates | | | 0.86% | | | | 0.86% | | | | 0.92% | | | | 0.91% | | | | 0.89% | |
| | | | | |
Expenses net of waiver and payments by affiliates | | | 0.85% | d | | | 0.86% | d,e | | | 0.91% | d | | | 0.90% | | | | 0.89%e | |
| | | | | |
Net investment income (loss) | | | (0.26)% | | | | (0.32)% | | | | (0.33)% | | | | (0.30)% | | | | (0.44)% | |
| | | | | |
Supplemental data | | | | | | | | | | | | | | | | | | | | |
| | | | | |
Net assets, end of year (000’s) | | | $4,504,434 | | | | $3,741,562 | | | | $2,498,393 | | | | $2,123,082 | | | | $1,857,570 | |
| | | | | |
Portfolio turnover rate | | | 20.01% | | | | 17.22% | | | | 19.85% | | | | 22.42% | | | | 31.02% | |
aThe amount shown for a share outstanding throughout the period may not correlate with the Statement of Operations for the period due to the timing of sales and repurchases of the Fund’s shares in relation to income earned and/or fluctuating fair value of the investments of the Fund.
bBased on average daily shares outstanding.
cTotal return does not reflect sales commissions or contingent deferred sales charges, if applicable.
dBenefit of expense reduction rounds to less than 0.01%.
eBenefit of waiver and payments by affiliates rounds to less than 0.01%.
| | | | |
| | | |
| franklintempleton.com | | The accompanying notes are an integral part of these financial statements. | Annual Report | | 39 |
FRANKLIN CUSTODIAN FUNDS
FINANCIAL HIGHLIGHTS
Franklin DynaTech Fund(continued)
| | | | | | | | | | | | | | | | | | | | |
| | | Year Ended September 30, | |
| | | 2019 | | | 2018 | | | 2017 | | | 2016 | | | 2015 | |
| |
| | | | | |
Class C | | | | | | | | | | | | | | | | | | | | |
| | | | | |
Per share operating performance (for a share outstanding throughout the year) | | | | | | | | | | | | | | | | | | | | |
| | | | | |
Net asset value, beginning of year | | | $68.07 | | | | $53.49 | | | | $44.71 | | | | $40.00 | | | | $40.53 | |
| | | | |
| | | | | |
Income from investment operationsa: | | | | | | | | | | | | | | | | | | | | |
| | | | | |
Net investment income (loss)b | | | (0.66 | ) | | | (0.65 | ) | | | (0.50 | ) | | | (0.43 | ) | | | (0.50) | |
| | | | | |
Net realized and unrealized gains (losses) | | | 3.10 | | | | 16.39 | | | | 10.97 | | | | 6.34 | | | | 1.58 | |
| | | | |
| | | | | |
Total from investment operations | | | 2.44 | | | | 15.74 | | | | 10.47 | | | | 5.91 | | | | 1.08 | |
| | | | |
| | | | | |
Less distributions from: | | | | | | | | | | | | | | | | | | | | |
| | | | | |
Net realized gains | | | (1.91 | ) | | | (1.16 | ) | | | (1.69 | ) | | | (1.20 | ) | | | (1.61) | |
| | | | |
| | | | | |
Net asset value, end of year | | | $68.60 | | | | $68.07 | | | | $53.49 | | | | $44.71 | | | | $40.00 | |
| | | | |
| | | | | |
Total returnc | | | 3.97% | | | | 29.93% | | | | 24.72% | | | | 14.86% | | | | 2.63% | |
| | | | | |
Ratios to average net assets | | | | | | | | | | | | | | | | | | | | |
| | | | | |
Expenses before waiver and payments by affiliates | | | 1.61% | | | | 1.61% | | | | 1.67% | | | | 1.66% | | | | 1.64% | |
| | | | | |
Expenses net of waiver and payments by affiliates | | | 1.60% | d | | | 1.61% | d,e | | | 1.66% | d | | | 1.65% | | | | 1.64%e | |
| | | | | |
Net investment income (loss) | | | (1.01)% | | | | (1.07)% | | | | (1.08)% | | | | (1.05)% | | | | (1.19)% | |
| | | | | |
Supplemental data | | | | | | | | | | | | | | | | | | | | |
| | | | | |
Net assets, end of year (000’s) | | | $597,927 | | | | $611,221 | | | | $374,502 | | | | $318,896 | | | | $270,961 | |
| | | | | |
Portfolio turnover rate | | | 20.01% | | | | 17.22% | | | | 19.85% | | | | 22.42% | | | | 31.02% | |
aThe amount shown for a share outstanding throughout the period may not correlate with the Statement of Operations for the period due to the timing of sales and repurchases of the Fund’s shares in relation to income earned and/or fluctuating fair value of the investments of the Fund.
bBased on average daily shares outstanding.
cTotal return does not reflect sales commissions or contingent deferred sales charges, if applicable.
dBenefit of expense reduction rounds to less than 0.01%.
eBenefit of waiver and payments by affiliates rounds to less than 0.01%.
| | | | |
| | | |
40 | | Annual Report | The accompanying notes are an integral part of these financial statements. | | franklintempleton.com |
FRANKLIN CUSTODIAN FUNDS
FINANCIAL HIGHLIGHTS
Franklin DynaTech Fund(continued)
| | | | | | | | | | | | | | | | | | | | |
| | | Year Ended September 30, | |
| | | 2019 | | | 2018 | | | 2017 | | | 2016 | | | 2015 | |
| |
| | | | | |
Class R | | | | | | | | | | | | | | | | | | | | |
| | | | | |
Per share operating performance (for a share outstanding throughout the year) | | | | | | | | | | | | | | | | | | | | |
| | | | | |
Net asset value, beginning of year | | | $78.88 | | | | $61.51 | | | | $50.90 | | | | $45.16 | | | | $45.35 | |
| | | | |
| | | | | |
Income from investment operationsa: | | | | | | | | | | | | | | | | | | | | |
| | | | | |
Net investment income (loss)b | | | (0.39 | ) | | | (0.40 | ) | | | (0.31 | ) | | | (0.26 | ) | | | (0.32) | |
| | | | | |
Net realized and unrealized gains (losses) | | | 3.68 | | | | 18.93 | | | | 12.61 | | | | 7.20 | | | | 1.74 | |
| | | | |
| | | | | |
Total from investment operations | | | 3.29 | | | | 18.53 | | | | 12.30 | | | | 6.94 | | | | 1.42 | |
| | | | |
| | | | | |
Less distributions from: | | | | | | | | | | | | | | | | | | | | |
| | | | | |
Net realized gains | | | (1.91 | ) | | | (1.16 | ) | | | (1.69 | ) | | | (1.20 | ) | | | (1.61) | |
| | | | |
| | | | | |
Net asset value, end of year | | | $80.26 | | | | $78.88 | | | | $61.51 | | | | $50.90 | | | | $45.16 | |
| | | | |
| | | | | |
Total return | | | 4.52% | | | | 30.57% | | | | 25.36% | | | | 15.43% | | | | 3.11% | |
| | | | | |
Ratios to average net assets | | | | | | | | | | | | | | | | | | | | |
| | | | | |
Expenses before waiver and payments by affiliates | | | 1.11% | | | | 1.11% | | | | 1.17% | | | | 1.16% | | | | 1.14% | |
| | | | | |
Expenses net of waiver and payments by affiliates | | | 1.10% | c | | | 1.11% | c,d | | | 1.16% | c | | | 1.15% | | | | 1.14%d | |
| | | | | |
Net investment income (loss) | | | (0.51)% | | | | (0.57)% | | | | (0.58)% | | | | (0.55)% | | | | (0.69)% | |
| | | | | |
Supplemental data | | | | | | | | | | | | | | | | | | | | |
| | | | | |
Net assets, end of year (000’s) | | | $123,721 | | | | $95,925 | | | | $47,860 | | | | $38,862 | | | | $43,001 | |
| | | | | |
Portfolio turnover rate | | | 20.01% | | | | 17.22% | | | | 19.85% | | | | 22.42% | | | | 31.02% | |
aThe amount shown for a share outstanding throughout the period may not correlate with the Statement of Operations for the period due to the timing of sales and repurchases of the Fund’s shares in relation to income earned and/or fluctuating fair value of the investments of the Fund.
bBased on average daily shares outstanding.
cBenefit of expense reduction rounds to less than 0.01%.
dBenefit of waiver and payments by affiliates rounds to less than 0.01%.
| | | | |
| | | |
| franklintempleton.com | | The accompanying notes are an integral part of these financial statements. | Annual Report | | 41 |
FRANKLIN CUSTODIAN FUNDS
FINANCIAL HIGHLIGHTS
Franklin DynaTech Fund(continued)
| | | | | | | | | | | | | | | | | | | | |
| | | Year Ended September 30, | |
| | | 2019 | | | 2018 | | | 2017 | | | 2016 | | | 2015 | |
| |
| | | | | |
Class R6 | | | | | | | | | | | | | | | | | | | | |
| | | | | |
Per share operating performance (for a share outstanding throughout the year) | | | | | | | | | | | | | | | | | | | | |
| | | | | |
Net asset value, beginning of year | | | $84.31 | | | | $65.28 | | | | $53.56 | | | | $47.15 | | | | $46.97 | |
| | | | |
| | | | | |
Income from investment operationsa: | | | | | | | | | | | | | | | | | | | | |
| | | | | |
Net investment income (loss)b | | | 0.07 | | | | 0.04 | | | | 0.06 | | | | 0.06 | | | | (0.01) | |
| | | | | |
Net realized and unrealized gains (losses) | | | 3.99 | | | | 20.15 | | | | 13.35 | | | | 7.55 | | | | 1.80 | |
| | | | |
| | | | | |
Total from investment operations | | | 4.06 | | | | 20.19 | | | | 13.41 | | | | 7.61 | | | | 1.79 | |
| | | | |
| | | | | |
Less distributions from: | | | | | | | | | | | | | | | | | | | | |
| | | | | |
Net realized gains | | | (1.91 | ) | | | (1.16 | ) | | | (1.69 | ) | | | (1.20 | ) | | | (1.61) | |
| | | | |
| | | | | |
Net asset value, end of year | | | $86.46 | | | | $84.31 | | | | $65.28 | | | | $53.56 | | | | $47.15 | |
| | | | |
| | | | | |
Total return | | | 5.15% | | | | 31.38% | | | | 26.17% | | | | 16.21% | | | | 3.81% | |
| | | | | |
Ratios to average net assets | | | | | | | | | | | | | | | | | | | | |
| | | | | |
Expenses before waiver and payments by affiliates | | | 0.51% | | | | 0.50% | | | | 0.49% | | | | 0.49% | | | | 0.48% | |
| | | | | |
Expenses net of waiver and payments by affiliates | | | 0.50% | c | | | 0.50% | c,d | | | 0.48% | c | | | 0.48% | | | | 0.48%d | |
| | | | | |
Net investment income (loss) | | | 0.09% | | | | 0.04% | | | | 0.10% | | | | 0.12% | | | | (0.03)% | |
| | | | | |
Supplemental data | | | | | | | | | | | | | | | | | | | | |
| | | | | |
Net assets, end of year (000’s) | | | $2,473,942 | | | | $1,688,595 | | | | $457,846 | | | | $359,505 | | | | $362,627 | |
| | | | | |
Portfolio turnover rate | | | 20.01% | | | | 17.22% | | | | 19.85% | | | | 22.42% | | | | 31.02% | |
aThe amount shown for a share outstanding throughout the period may not correlate with the Statement of Operations for the period due to the timing of sales and repurchases of the Fund’s shares in relation to income earned and/or fluctuating fair value of the investments of the Fund.
bBased on average daily shares outstanding.
cBenefit of expense reduction rounds to less than 0.01%.
dBenefit of waiver and payments by affiliates rounds to less than 0.01%.
| | | | |
| | | |
42 | | Annual Report | The accompanying notes are an integral part of these financial statements. | | franklintempleton.com |
FRANKLIN CUSTODIAN FUNDS
FINANCIAL HIGHLIGHTS
Franklin DynaTech Fund(continued)
| | | | | | | | | | | | | | | | | | | | |
| | | Year Ended September 30, | |
| | | 2019 | | | 2018 | | | 2017 | | | 2016 | | | 2015 | |
| |
| | | | | |
Advisor Class | | | | | | | | | | | | | | | | | | | | |
| | | | | |
Per share operating performance (for a share outstanding throughout the year) | | | | | | | | | | | | | | | | | | | | |
| | | | | |
Net asset value, beginning of year | | | $83.56 | | | | $64.78 | | | | $53.25 | | | | $46.96 | | | | $46.87 | |
| | | | |
| | | | | |
Income from investment operationsa: | | | | | | | | | | | | | | | | | | | | |
| | | | | |
Net investment income (loss)b | | | (0.01 | ) | | | (0.06 | ) | | | (0.04 | ) | | | (0.03 | ) | | | (0.09) | |
| | | | | |
Net realized and unrealized gains (losses) | | | 3.94 | | | | 20.00 | | | | 13.26 | | | | 7.52 | | | | 1.79 | |
| | | | |
| | | | | |
Total from investment operations | | | 3.93 | | | | 19.94 | | | | 13.22 | | | | 7.49 | | | | 1.70 | |
| | | | |
| | | | | |
Less distributions from: | | | | | | | | | | | | | | | | | | | | |
| | | | | |
Net realized gains | | | (1.91 | ) | | | (1.16 | ) | | | (1.69 | ) | | | (1.20 | ) | | | (1.61) | |
| | | | |
| | | | | |
Net asset value, end of year | | | $85.58 | | | | $83.56 | | | | $64.78 | | | | $53.25 | | | | $46.96 | |
| | | | |
| | | | | |
Total return | | | 5.04% | | | | 31.21% | | | | 25.98% | | | | 16.02% | | | | 3.62% | |
| | | | | |
Ratios to average net assets | | | | | | | | | | | | | | | | | | | | |
| | | | | |
Expenses before waiver and payments by affiliates | | | 0.61% | | | | 0.61% | | | | 0.67% | | | | 0.66% | | | | 0.64% | |
| | | | | |
Expenses net of waiver and payments by affiliates | | | 0.60% | c | | | 0.61% | c,d | | | 0.66% | c | | | 0.65% | | | | 0.64%d | |
| | | | | |
Net investment income (loss) | | | (0.01)% | | | | (0.07)% | | | | (0.08)% | | | | (0.05)% | | | | (0.19)% | |
| | | | | |
Supplemental data | | | | | | | | | | | | | | | | | | | | |
| | | | | |
Net assets, end of year (000’s) | | | $1,154,604 | | | | $680,066 | | | | $712,762 | | | | $203,443 | | | | $176,090 | |
| | | | | |
Portfolio turnover rate | | | 20.01% | | | | 17.22% | | | | 19.85% | | | | 22.42% | | | | 31.02% | |
aThe amount shown for a share outstanding throughout the period may not correlate with the Statement of Operations for the period due to the timing of sales and repurchases of the Fund’s shares in relation to income earned and/or fluctuating fair value of the investments of the Fund.
bBased on average daily shares outstanding.
cBenefit of expense reduction rounds to less than 0.01%.
dBenefit of waiver and payments by affiliates rounds to less than 0.01%.
| | | | |
| | | |
| franklintempleton.com | | The accompanying notes are an integral part of these financial statements. | Annual Report | | 43 |
FRANKLIN CUSTODIAN FUNDS
Statement of Investments, September 30, 2019
Franklin DynaTech Fund
| | | | | | | | | | | | | | | | |
| | | Country | | | Shares | | | | | | Value | |
| | | | |
Common Stocks 94.0% | | | | | | | | | | | | | | | | |
Aerospace & Defense 3.8% | | | | | | | | | | | | | | | | |
The Boeing Co. | | | United States | | | | 300,000 | | | | | | | $ | 114,141,000 | |
Heico Corp. | | | United States | | | | 950,000 | | | | | | | | 118,636,000 | |
aMercury Systems Inc. | | | United States | | | | 100,000 | | | | | | | | 8,117,000 | |
Raytheon Co. | | | United States | | | | 500,000 | | | | | | | | 98,095,000 | |
| | | | | | | | | | | | | | | | |
| | | | |
| | | | | | | | | | | | | | | 338,989,000 | |
| | | | | | | | | | | | | | | | |
Biotechnology 0.4% | | | | | | | | | | | | | | | | |
aNeurocrine Biosciences Inc. | | | United States | | | | 350,000 | | | | | | | | 31,538,500 | |
aRepligen Corp. | | | United States | | | | 10,000 | | | | | | | | 766,900 | |
aVeracyte Inc. | | | United States | | | | 100,000 | | | | | | | | 2,400,000 | |
| | | | | | | | | | | | | | | | |
| | | | |
| | | | | | | | | | | | | | | 34,705,400 | |
| | | | | | | | | | | | | | | | |
Capital Markets 3.9% | | | | | | | | | | | | | | | | |
aAssetmark Financial Holdings Inc. | | | United States | | | | 147,000 | | | | | | | | 3,829,350 | |
CME Group Inc. | | | United States | | | | 200,000 | | | | | | | | 42,268,000 | |
Intercontinental Exchange Inc. | | | United States | | | | 1,000,000 | | | | | | | | 92,270,000 | |
Moody’s Corp. | | | United States | | | | 350,000 | | | | | | | | 71,690,500 | |
MSCI Inc. | | | United States | | | | 500,000 | | | | | | | | 108,875,000 | |
Tradeweb Markets Inc. | | | United States | | | | 600,000 | | | | | | | | 22,188,000 | |
| | | | | | | | | | | | | | | | |
| | | | |
| | | | | | | | | | | | | | | 341,120,850 | |
| | | | | | | | | | | | | | | | |
Diversified Consumer Services 0.6% | | | | | | | | | | | | | | | | |
aBright Horizons Family Solutions Inc. | | | United States | | | | 350,000 | | | | | | | | 53,375,000 | |
| | | | | | | | | | | | | | | | |
Electronic Equipment, Instruments & Components 1.9% | | | | | | | | | | | | | | | | |
Amphenol Corp., A | | | United States | | | | 850,000 | | | | | | | | 82,025,000 | |
Keyence Corp. | | | Japan | | | | 50,000 | | | | | | | | 30,939,278 | |
aKeysight Technologies Inc. | | | United States | | | | 525,000 | | | | | | | | 51,056,250 | |
| | | | | | | | | | | | | | | | |
| | | | |
| | | | | | | | | | | | | | | 164,020,528 | |
| | | | | | | | | | | | | | | | |
Entertainment 0.5% | | | | | | | | | | | | | | | | |
aNetflix Inc. | | | United States | | | | 100,000 | | | | | | | | 26,762,000 | |
aSea Ltd., ADR | | | Taiwan | | | | 600,000 | | | | | | | | 18,570,000 | |
| | | | | | | | | | | | | | | | |
| | | | |
| | | | | | | | | | | | | | | 45,332,000 | |
| | | | | | | | | | | | | | | | |
Equity Real Estate Investment Trusts (REITs) 4.1% | | | | | | | | | | | | | | | | |
American Tower Corp. | | | United States | | | | 500,000 | | | | | | | | 110,565,000 | |
Crown Castle International Corp. | | | United States | | | | 500,000 | | | | | | | | 69,505,000 | |
Equinix Inc. | | | United States | | | | 105,000 | | | | | | | | 60,564,000 | |
SBA Communications Corp., A | | | United States | | | | 500,000 | | | | | | | | 120,575,000 | |
| | | | | | | | | | | | | | | | |
| | | | |
| | | | | | | | | | | | | | | 361,209,000 | |
| | | | | | | | | | | | | | | | |
Health Care Equipment & Supplies 9.5% | | | | | | | | | | | | | | | | |
Abbott Laboratories | | | United States | | | | 1,250,000 | | | | | | | | 104,587,500 | |
aAlcon Inc. | | | Switzerland | | | | 270,000 | | | | | | | | 15,738,300 | |
Baxter International Inc. | | | United States | | | | 50,000 | | | | | | | | 4,373,500 | |
Becton, Dickinson and Co. | | | United States | | | | 250,000 | | | | | | | | 63,240,000 | |
Danaher Corp. | | | United States | | | | 900,000 | | | | | | | | 129,987,000 | |
aEdwards Lifesciences Corp. | | | United States | | | | 450,000 | | | | | | | | 98,959,500 | |
aIDEXX Laboratories Inc. | | | United States | | | | 500,000 | | | | | | | | 135,965,000 | |
aIntuitive Surgical Inc. | | | United States | | | | 165,000 | | | | | | | | 89,088,450 | |
| | | | |
| | | |
44 | | Annual Report | | franklintempleton.com |
FRANKLIN CUSTODIAN FUNDS
STATEMENT OF INVESTMENTS
Franklin DynaTech Fund(continued)
| | | | | | | | | | | | | | | | |
| | | Country | | | Shares | | | | | | Value | |
| | | | |
Common Stocks(continued) | | | | | | | | | | | | | | | | |
Health Care Equipment & Supplies(continued) | | | | | | | | | | | | | | | | |
a iRhythm Technologies Inc. | | | United States | | | | 350,000 | | | | | | | $ | 25,938,500 | |
ResMed Inc. | | | United States | | | | 300,000 | | | | | | | | 40,533,000 | |
Siemens Healthineers AG | | | Germany | | | | 425,000 | | | | | | | | 16,719,474 | |
STERIS PLC | | | United States | | | | 50,000 | | | | | | | | 7,224,500 | |
Stryker Corp. | | | United States | | | | 500,000 | | | | | | | | 108,150,000 | |
| | | | | | | | | | | | | | | | |
| | | | |
| | | | | | | | | | | | | | | 840,504,724 | |
| | | | | | | | | | | | | | | | |
Health Care Providers & Services 0.6% | | | | | | | | | | | | | | | | |
aGuardant Health Inc. | | | United States | | | | 100,000 | | | | | | | | 6,383,000 | |
UnitedHealth Group Inc. | | | United States | | | | 200,000 | | | | | | | | 43,464,000 | |
| | | | | | | | | | | | | | | | |
| | | | |
| | | | | | | | | | | | | | | 49,847,000 | |
| | | | | | | | | | | | | | | | |
Health Care Technology 1.9% | | | | | | | | | | | | | | | | |
aInspire Medical Systems Inc. | | | United States | | | | 550,000 | | | | | | | | 33,561,000 | |
aVeeva Systems Inc. | | | United States | | | | 900,000 | | | | | | | | 137,421,000 | |
| | | | | | | | | | | | | | | | |
| | | | |
| | | | | | | | | | | | | | | 170,982,000 | |
| | | | | | | | | | | | | | | | |
Industrial Conglomerates 1.0% | | | | | | | | | | | | | | | | |
| | | | |
Roper Technologies Inc. | | | United States | | | | 250,000 | | | | | | | | 89,150,000 | |
| | | | | | | | | | | | | | | | |
Interactive Media & Services 6.6% | | | | | | | | | | | | | | | | |
aAdevinta ASA, A | | | France | | | | 1,000,000 | | | | | | | | 11,584,263 | |
aAlphabet Inc., A | | | United States | | | | 200,000 | | | | | | | | 244,228,000 | |
aAlphabet Inc., C | | | United States | | | | 62,170 | | | | | | | | 75,785,230 | |
aFacebook Inc., A | | | United States | | | | 450,000 | | | | | | | | 80,136,000 | |
Match Group Inc. | | | United States | | | | 725,000 | | | | | | | | 51,794,000 | |
aPinterest Inc., A | | | United States | | | | 1,000,000 | | | | | | | | 26,450,000 | |
Tencent Holdings Ltd. | | | China | | | | 2,250,000 | | | | | | | | 94,789,421 | |
aTwitter Inc. | | | United States | | | | 50,000 | | | | | | | | 2,060,000 | |
| | | | | | | | | | | | | | | | |
| | | | |
| | | | | | | | | | | | | | | 586,826,914 | |
| | | | | | | | | | | | | | | | |
Internet & Direct Marketing Retail 9.8% | | | | | | | | | | | | | | | | |
aAlibaba Group Holding Ltd., ADR | | | China | | | | 550,000 | | | | | | | | 91,976,500 | |
aAmazon.com Inc. | | | United States | | | | 325,000 | | | | | | | | 564,170,750 | |
aBooking Holdings Inc. | | | United States | | | | 20,000 | | | | | | | | 39,252,200 | |
aChewy Inc., A | | | United States | | | | 33,100 | | | | | | | | 813,598 | |
aDelivery Hero SE | | | Germany | | | | 350,000 | | | | | | | | 15,548,513 | |
aEtsy Inc. | | | United States | | | | 850,000 | | | | | | | | 48,025,000 | |
aMercadoLibre Inc. | | | Argentina | | | | 200,000 | | | | | | | | 110,246,000 | |
a,bZalando SE, 144A | | | Germany | | | | 25,000 | | | | | | | | 1,141,125 | |
| | | | | | | | | | | | | | | | |
| | | | |
| | | | | | | | | | | | | | | 871,173,686 | |
| | | | | | | | | | | | | | | | |
IT Services 11.9% | | | | | | | | | | | | | | | | |
aAdyen NV | | | Netherlands | | | | 100,000 | | | | | | | | 65,873,554 | |
aFiserv Inc. | | | United States | | | | 525,000 | | | | | | | | 54,384,750 | |
aInterXion Holding NV | | | Netherlands | | | | 650,000 | | | | | | | | 52,949,000 | |
Mastercard Inc., A | | | United States | | | | 1,000,000 | | | | | | | | 271,570,000 | |
aMongoDB Inc. | | | United States | | | | 500,000 | | | | | | | | 60,240,000 | |
aNetwork International Holdings Ltd. | | | United Arab Emirates | | | | 1,000,000 | | | | | | | | 6,577,290 | |
aOkta Inc., A | | | United States | | | | 300,000 | | | | | | | | 29,538,000 | |
aPagSeguro Digital Ltd., A | | | Brazil | | | | 25,000 | | | | | | | | 1,157,750 | |
| | | | |
| | | |
| franklintempleton.com | | Annual Report | | 45 |
FRANKLIN CUSTODIAN FUNDS
STATEMENT OF INVESTMENTS
Franklin DynaTech Fund(continued)
| | | | | | | | | | | | | | | | |
| | | Country | | | Shares | | | | | | Value | |
| | | | |
Common Stocks(continued) | | | | | | | | | | | | | | | | |
IT Services(continued) | | | | | | | | | | | | | | | | |
a PayPal Holdings Inc. | | | United States | | | | 1,200,000 | | | | | | | $ | 124,308,000 | |
aShopify Inc., A | | | Canada | | | | 400,000 | | | | | | | | 124,533,716 | |
aTwilio Inc., A | | | United States | | | | 340,000 | | | | | | | | 37,386,400 | |
Visa Inc., A | | | United States | | | | 1,250,000 | | | | | | | | 215,012,500 | |
aWix.com Ltd. | | | Israel | | | | 100,000 | | | | | | | | 11,674,000 | |
| | | | | | | | | | | | | | | | |
| | | | |
| | | | | | | | | | | | | | | 1,055,204,960 | |
| | | | | | | | | | | | | | | | |
Life Sciences Tools & Services 2.5% | | | | | | | | | | | | | | | | |
a10X Genomics Inc., A | | | United States | | | | 30,200 | | | | | | | | 1,522,080 | |
aEvotec SE | | | Germany | | | | 300,000 | | | | | | | | 6,676,727 | |
aIllumina Inc. | | | United States | | | | 250,000 | | | | | | | | 76,055,000 | |
aIQVIA Holdings Inc. | | | United States | | | | 200,000 | | | | | | | | 29,876,000 | |
Thermo Fisher Scientific Inc. | | | United States | | | | 300,000 | | | | | | | | 87,381,000 | |
aWaters Corp. | | | United States | | | | 100,000 | | | | | | | | 22,323,000 | |
| | | | | | | | | | | | | | | | |
| | | | |
| | | | | | | | | | | | | | | 223,833,807 | |
| | | | | | | | | | | | | | | | |
Machinery 0.8% | | | | | | | | | | | | | | | | |
Fortive Corp. | | | United States | | | | 1,000,000 | | | | | | | | 68,560,000 | |
| | | | | | | | | | | | | | | | |
Media 0.9% | | | | | | | | | | | | | | | | |
aLiberty Broadband Corp., A | | | United States | | | | 750,000 | | | | | | | | 78,390,000 | |
| | | | | | | | | | | | | | | | |
Pharmaceuticals 1.8% | | | | | | | | | | | | | | | | |
AstraZeneca PLC | | | United Kingdom | | | | 800,000 | | | | | | | | 71,413,388 | |
aCatalent Inc. | | | United States | | | | 125,000 | | | | | | | | 5,957,500 | |
aElanco Animal Health Inc. | | | United States | | | | 1,000,000 | | | | | | | | 26,590,000 | |
Merck KGaA | | | Germany | | | | 450,000 | | | | | | | | 50,688,523 | |
Zoetis Inc. | | | United States | | | | 50,000 | | | | | | | | 6,229,500 | |
| | | | | | | | | | | | | | | | |
| | | | |
| | | | | | | | | | | | | | | 160,878,911 | |
| | | | | | | | | | | | | | | | |
Professional Services 2.3% | | | | | | | | | | | | | | | | |
aCoStar Group Inc. | | | United States | | | | 160,000 | | | | | | | | 94,912,000 | |
TransUnion | | | United States | | | | 425,000 | | | | | | | | 34,471,750 | |
Verisk Analytics Inc. | | | United States | | | | 475,000 | | | | | | | | 75,116,500 | |
| | | | | | | | | | | | | | | | |
| | | | |
| | | | | | | | | | | | | | | 204,500,250 | |
| | | | | | | | | | | | | | | | |
Semiconductors & Semiconductor Equipment 5.8% | | | | | | | | | | | | | | | | |
Analog Devices Inc. | | | United States | | | | 600,000 | | | | | | | | 67,038,000 | |
ASML Holding NV, N.Y. shs | | | Netherlands | | | | 200,000 | | | | | | | | 49,684,000 | |
Intel Corp. | | | United States | | | | 800,000 | | | | | | | | 41,224,000 | |
KLA Corp. | | | United States | | | | 260,000 | | | | | | | | 41,457,000 | |
Lam Research Corp. | | | United States | | | | 350,000 | | | | | | | | 80,888,500 | |
Monolithic Power Systems | | | United States | | | | 400,000 | | | | | | | | 62,252,000 | |
NVIDIA Corp. | | | United States | | | | 450,000 | | | | | | | | 78,331,500 | |
Xilinx Inc. | | | United States | | | | 1,000,000 | | | | | | | | 95,900,000 | |
| | | | | | | | | | | | | | | | |
| | | | |
| | | | | | | | | | | | | | | 516,775,000 | |
| | | | | | | | | | | | | | | | |
Software 22.2% | | | | | | | | | | | | | | | | |
aAdobe Inc. | | | United States | | | | 500,000 | | | | | | | | 138,125,000 | |
aAltair Engineering Inc. | | | United States | | | | 500,000 | | | | | | | | 17,310,000 | |
aAlteryx Inc. | | | United States | | | | 575,000 | | | | | | | | 61,772,250 | |
aAnaplan Inc. | | | United States | | | | 450,000 | | | | | | | | 21,150,000 | |
| | | | |
| | | |
46 | | Annual Report | | franklintempleton.com |
FRANKLIN CUSTODIAN FUNDS
STATEMENT OF INVESTMENTS
Franklin DynaTech Fund(continued)
| | | | | | | | | | | | | | | | |
| | | Country | | | Shares | | | | | | Value | |
| | | | |
Common Stocks(continued) | | | | | | | | | | | | | | | | |
Software(continued) | | | | | | | | | | | | | | | | |
a ANSYS Inc. | | | United States | | | | 275,000 | | | | | | | $ | 60,874,000 | |
aAspen Technology Inc. | | | United States | | | | 500,000 | | | | | | | | 61,540,000 | |
aAtlassian Corp. PLC | | | United States | | | | 500,000 | | | | | | | | 62,720,000 | |
aAutodesk Inc. | | | United States | | | | 500,000 | | | | | | | | 73,850,000 | |
aCadence Design Systems Inc. | | | United States | | | | 700,000 | | | | | | | | 46,256,000 | |
Constellation Software Inc. | | | Canada | | | | 50,000 | | | | | | | | 49,956,581 | |
aCoupa Software Inc. | | | United States | | | | 500,000 | | | | | | | | 64,785,000 | |
aGuidewire Software Inc. | | | United States | | | | 500,000 | | | | | | | | 52,690,000 | |
aHubspot Inc. | | | United States | | | | 500,000 | | | | | | | | 75,805,000 | |
Intuit Inc. | | | United States | | | | 500,000 | | | | | | | | 132,970,000 | |
aLightspeed POS Inc. | | | Canada | | | | 350,000 | | | | | | | | 8,097,863 | |
Microsoft Corp. | | | United States | | | | 2,500,000 | | | | | | | | 347,575,000 | |
aQ2 Holdings Inc. | | | United States | | | | 600,000 | | | | | | | | 47,322,000 | |
aRealPage Inc. | | | United States | | | | 100,000 | | | | | | | | 6,286,000 | |
aRingCentral Inc., A | | | United States | | | | 200,000 | | | | | | | | 25,132,000 | |
asalesforce.com Inc. | | | United States | | | | 1,000,000 | | | | | | | | 148,440,000 | |
aServiceNow Inc. | | | United States | | | | 700,000 | | | | | | | | 177,695,000 | |
aSmartsheet Inc. A | | | United States | | | | 550,000 | | | | | | | | 19,816,500 | |
aSynopsys Inc. | | | United States | | | | 500,000 | | | | | | | | 68,625,000 | |
aTyler Technologies Inc. | | | United States | | | | 165,000 | | | | | | | | 43,312,500 | |
aWorkday Inc., A | | | United States | | | | 600,000 | | | | | | | | 101,976,000 | |
aZendesk Inc. | | | United States | | | | 650,000 | | | | | | | | 47,372,000 | |
| | | | | | | | | | | | | | | | |
| | | | |
| | | | | | | | | | | | | | | 1,961,453,694 | |
| | | | | | | | | | | | | | | | |
Technology Hardware, Storage & Peripherals 1.0% | | | | | | | | | | | | | | | | |
Apple Inc. | | | United States | | | | 400,000 | | | | | | | | 89,588,000 | |
| | | | | | | | | | | | | | | | |
Textiles, Apparel & Luxury Goods 0.2% | | | | | | | | | | | | | | | | |
NIKE Inc., B | | | United States | | | | 200,000 | | | | | | | | 18,784,000 | |
| | | | | | | | | | | | | | | | |
| | | | |
Total Common Stocks (Cost $4,736,572,428) | | | | | | | | | | | | | | | 8,325,204,724 | |
| | | | | | | | | | | | | | | | |
| | | | |
Short Term Investments 5.9% | | | | | | | | | | | | | | | | |
| | | | |
Money Market Funds (Cost $439,351,721) 5.0% | | | | | | | | | | | | | | | | |
c,dInstitutional Fiduciary Trust Money Market Portfolio, 1.71% | | | United States | | | | 439,351,721 | | | | | | | | 439,351,721 | |
| | | | | | | | | | | | | | | | |
| | | | |
| | | |
| franklintempleton.com | | Annual Report | | 47 |
FRANKLIN CUSTODIAN FUNDS
STATEMENT OF INVESTMENTS
Franklin DynaTech Fund(continued)
| | | | | | | | | | | | | | | | |
| | | Country | | | Principal
Amount | | | | | | Value | |
| | | | |
Short Term Investments(continued) | | | | | | | | | | | | | | | | |
Repurchase Agreements (Cost $77,855,135) 0.9% | | | | | | | | | | | | | | | | |
eJoint Repurchase Agreement, 2.343%, 10/01/19 (Maturity Value $77,860,203)
BNP Paribas Securities Corp. (Maturity Value $38,388,973)
Deutsche Bank Securities Inc. (Maturity Value $13,878,581)
HSBC Securities (USA) Inc. (Maturity Value $25,592,649)
Collateralized byfU.S. Treasury Bills, 11/19/19; U.S. Treasury Notes,
1.375% - 3.125%, 1/31/20 - 7/31/26; and U.S. Treasury Strips, 2/15/24 -
5/15/35 (valued at $79,441,896) | | | United States | | | $ | 77,855,135 | | | | | | | $ | 77,855,135 | |
| | | | | | | | | | | | | | | | |
| | | | |
Total Investments (Cost $5,253,779,284) 99.9% | | | | | | | | | | | | | | | 8,842,411,580 | |
Other Assets, less Liabilities 0.1% | | | | | | | | | | | | | | | 12,216,003 | |
| | | | | | | | | | | | | | | | |
| | | | |
Net Assets 100.0% | | | | | | | | | | | | | | $ | 8,854,627,583 | |
| | | | | | | | | | | | | | | | |
See Abbreviations on page 133.
aNon-income producing.
bSecurity was purchased pursuant to Rule 144A under the Securities Act of 1933 and may be sold in transactions exempt from registration only to qualified institutional buyers or in a public offering registered under the Securities Act of 1933. This security has been deemed liquid under guidelines approved by the Trust’s Board of Trustees. At September 30, 2019, the value of this security was $1,141,125, representing less than 0.1% of net assets.
cSee Note 3(f) regarding investments in affiliated management investment companies.
dThe rate shown is the annualizedseven-day effective yield at period end.
eSee Note 1(c) regarding joint repurchase agreement.
fThe security was issued on a discount basis with no stated coupon rate.
| | | | |
| | | |
48 | | Annual Report | The accompanying notes are an integral part of these financial statements. | | franklintempleton.com |
FRANKLIN CUSTODIAN FUNDS
Financial Highlights
Franklin Growth Fund
| | | | | | | | | | | | | | | | | | | | |
| | | Year Ended September 30, | |
| | | 2019 | | | 2018 | | | 2017 | | | 2016 | | | 2015 | |
| |
| | | | | |
Class A | | | | | | | | | | | | | | | | | | | | |
| | | | | |
Per share operating performance (for a share outstanding throughout the year) | | | | | | | | | | | | | | | | | | | | |
| | | | | |
Net asset value, beginning of year | | | $107.59 | | | | $ 91.61 | | | | $78.54 | | | | $72.40 | | | | $70.51 | |
| | | | |
| | | | | |
Income from investment operationsa: | | | | | | | | | | | | | | | | | | | | |
| | | | | |
Net investment incomeb | | | 0.46 | | | | 0.41 | | | | 0.40 | | | | 0.47 | c | | | 0.29 | |
| | | | | |
Net realized and unrealized gains (losses) | | | 3.47 | | | | 18.18 | | | | 15.56 | | | | 8.51 | | | | 1.79 | |
| | | | |
| | | | | |
Total from investment operations | | | 3.93 | | | | 18.59 | | | | 15.96 | | | | 8.98 | | | | 2.08 | |
| | | | |
| | | | | |
Less distributions from: | | | | | | | | | | | | | | | | | | | | |
| | | | | |
Net investment income | | | (0.44 | ) | | | (0.36 | ) | | | (0.39 | ) | | | (0.47 | ) | | | (0.19) | |
| | | | | |
Net realized gains | | | (1.04 | ) | | | (2.25 | ) | | | (2.50 | ) | | | (2.37 | ) | | | — | |
| | | | |
| | | | | |
Total distributions | | | (1.48 | ) | | | (2.61 | ) | | | (2.89 | ) | | | (2.84 | ) | | | (0.19) | |
| | | | |
| | | | | |
Net asset value, end of year | | | $110.04 | | | | $107.59 | | | | $91.61 | | | | $78.54 | | | | $72.40 | |
| | | | |
| | | | | |
Total returnd | | | 3.79% | | | | 20.72% | | | | 21.12% | | | | 12.57% | | | | 2.94% | |
| | | | | |
Ratios to average net assets | | | | | | | | | | | | | | | | | | | | |
| | | | | |
Expenses before waiver and payments by affiliates | | | 0.83% | | | | 0.83% | | | | 0.88% | | | | 0.88% | | | | 0.88% | |
| | | | | |
Expenses net of waiver and payments by affiliatese | | | 0.83% | f | | | 0.83% | f | | | 0.87% | | | | 0.86% | | | | 0.88%f | |
| | | | | |
Net investment income | | | 0.45% | | | | 0.41% | | | | 0.47% | | | | 0.63% | c | | | 0.38% | |
| | | | | |
Supplemental data | | | | | | | | | | | | | | | | | | | | |
| | | | | |
Net assets, end of year (000’s) | | | $9,157,154 | | | | $9,044,834 | | | | $8,051,641 | | | | $7,628,523 | | | | $7,185,665 | |
| | | | | |
Portfolio turnover rate | | | 4.91% | g | | | 6.05% | g | | | 5.60% | | | | 7.53% | | | | 5.05% | |
aThe amount shown for a share outstanding throughout the period may not correlate with the Statement of Operations for the period due to the timing of sales and repurchases of the Fund’s shares in relation to income earned and/or fluctuating fair value of the investments of the Fund.
bBased on average daily shares outstanding.
cNet investment income per share includes approximately $0.10 per share related to income received in the form of special dividends in connection with certain Fund holdings. Excluding this amount, the ratio of net investment income to average net assets would have been 0.50%.
dTotal return does not reflect sales commissions or contingent deferred sales charges, if applicable.
eBenefit of expense reduction rounds to less than 0.01%.
fBenefit of waiver and payments by affiliates rounds to less than 0.01%.
gExcludes the value of portfolio securities delivered as a result of a redemptionin-kind. See Note 11.
| | | | |
| | | |
| franklintempleton.com | | The accompanying notes are an integral part of these financial statements. | Annual Report | | 49 |
FRANKLIN CUSTODIAN FUNDS
FINANCIAL HIGHLIGHTS
Franklin Growth Fund(continued)
| | | | | | | | | | | | | | | | | | | | |
| | | Year Ended September 30, | |
| | | 2019 | | | 2018 | | | 2017 | | | 2016 | | | 2015 | |
| |
| | | | | |
Class C | | | | | | | | | | | | | | | | | | | | |
| | | | | |
Per share operating performance (for a share outstanding throughout the year) | | | | | | | | | | | | | | | | | | | | |
| | | | | |
Net asset value, beginning of year | | | $ 98.38 | | | | $84.25 | | | | $72.60 | | | | $67.17 | | | | $65.75 | |
| | | | |
| | | | | |
Income from investment operationsa: | | | | | | | | | | | | | | | | | | | | |
| | | | | |
Net investment income (loss)b | | | (0.29 | ) | | | (0.30 | ) | | | (0.21 | ) | | | (0.08 | )c | | | (0.26) | |
| | | | | |
Net realized and unrealized gains (losses) | | | 3.16 | | | | 16.68 | | | | 14.36 | | | | 7.88 | | | | 1.68 | |
| | | | |
| | | | | |
Total from investment operations | | | 2.87 | | | | 16.38 | | | | 14.15 | | | | 7.80 | | | | 1.42 | |
| | | | |
| | | | | |
Less distributions from: | | | | | | | | | | | | | | | | | | | | |
| | | | | |
Net realized gains | | | (1.04 | ) | | | (2.25 | ) | | | (2.50 | ) | | | (2.37 | ) | | | — | |
| | | | |
| | | | | |
Net asset value, end of year | | | $100.21 | | | | $98.38 | | | | $84.25 | | | | $72.60 | | | | $67.17 | |
| | | | |
| | | | | |
Total returnd | | | 3.02% | | | | 19.82% | | | | 20.21% | | | | 11.74% | | | | 2.16% | |
| | | | | |
Ratios to average net assets | | | | | | | | | | | | | | | | | | | | |
| | | | | |
Expenses before waiver and payments by affiliates | | | 1.58% | | | | 1.58% | | | | 1.63% | | | | 1.63% | | | | 1.63% | |
| | | | | |
Expenses net of waiver and payments by affiliatese | | | 1.58% | f | | | 1.58% | f | | | 1.62% | | | | 1.61% | | | | 1.63%f | |
| | | | | |
Net investment income (loss) | | | (0.30)% | | | | (0.34)% | | | | (0.28)% | | | | (0.12)% | c | | | (0.37)% | |
| | | | | |
Supplemental data | | | | | | | | | | | | | | | | | | | | |
| | | | | |
Net assets, end of year (000’s) | | | $704,217 | | | | $1,060,258 | | | | $930,751 | | | | $846,965 | | | | $777,570 | |
| | | | | |
Portfolio turnover rate | | | 4.91% | g | | | 6.05% | g | | | 5.60% | | | | 7.53% | | | | 5.05% | |
aThe amount shown for a share outstanding throughout the period may not correlate with the Statement of Operations for the period due to the timing of sales and repurchases of the Fund’s shares in relation to income earned and/or fluctuating fair value of the investments of the Fund.
bBased on average daily shares outstanding.
cNet investment income per share includes approximately $0.10 per share related to income received in the form of special dividends in connection with certain Fund holdings. Excluding this amount, the ratio of net investment income to average net assets would have been (0.25)%.
dTotal return does not reflect sales commissions or contingent deferred sales charges, if applicable.
eBenefit of expense reduction rounds to less than 0.01%.
fBenefit of waiver and payments by affiliates rounds to less than 0.01%.
gExcludes the value of portfolio securities delivered as a result of a redemptionin-kind. See Note 11.
| | | | |
| | | |
50 | | Annual Report | The accompanying notes are an integral part of these financial statements. | | franklintempleton.com |
FRANKLIN CUSTODIAN FUNDS
FINANCIAL HIGHLIGHTS
Franklin Growth Fund(continued)
| | | | | | | | | | | | | | | | | | | | |
| | | Year Ended September 30, | |
| | | 2019 | | | 2018 | | | 2017 | | | 2016 | | | 2015 | |
| |
| | | | | |
Class R | | | | | | | | | | | | | | | | | | | | |
| | | | | |
Per share operating performance (for a share outstanding throughout the year) | | | | | | | | | | | | | | | | | | | | |
| | | | | |
Net asset value, beginning of year | | | $107.00 | | | | $ 91.13 | | | | $78.14 | | | | $71.93 | | | | $70.05 | |
| | | | |
| | | | | |
Income from investment operationsa: | | | | | | | | | | | | | | | | | | | | |
| | | | | |
Net investment incomeb | | | 0.21 | | | | 0.16 | | | | 0.19 | | | | 0.29 | c | | | 0.10 | |
| | | | | |
Net realized and unrealized gains (losses) | | | 3.46 | | | | 18.09 | | | | 15.51 | | | | 8.45 | | | | 1.78 | |
| | | | |
| | | | | |
Total from investment operations | | | 3.67 | | | | 18.25 | | | | 15.70 | | | | 8.74 | | | | 1.88 | |
| | | | |
| | | | | |
Less distributions from: | | | | | | | | | | | | | | | | | | | | |
| | | | | |
Net investment income | | | (0.14 | ) | | | (0.13 | ) | | | (0.21 | ) | | | (0.16 | ) | | | — | |
| | | | | |
Net realized gains | | | (1.04 | ) | | | (2.25 | ) | | | (2.50 | ) | | | (2.37 | ) | | | — | |
| | | | |
| | | | | |
Total distributions | | | (1.18 | ) | | | (2.38 | ) | | | (2.71 | ) | | | (2.53 | ) | | | — | |
| | | | |
| | | | | |
Net asset value, end of year | | | $109.49 | | | | $107.00 | | | | $91.13 | | | | $78.14 | | | | $71.93 | |
| | | | |
| | | | | |
Total return | | | 3.54% | | | | 20.42% | | | | 20.81% | | | | 12.29% | | | | 2.68% | |
| | | | | |
Ratios to average net assets | | | | | | | | | | | | | | | | | | | | |
| | | | | |
Expenses before waiver and payments by affiliates | | | 1.08% | | | | 1.08% | | | | 1.13% | | | | 1.13% | | | | 1.13% | |
| | | | | |
Expenses net of waiver and payments by affiliatesd | | | 1.08% | e | | | 1.08% | e | | | 1.12% | | | | 1.11% | | | | 1.13%e | |
| | | | | |
Net investment income | | | 0.20% | | | | 0.16% | | | | 0.22% | | | | 0.38% | c | | | 0.13% | |
| | | | | |
Supplemental data | | | | | | | | | | | | | | | | | | | | |
| | | | | |
Net assets, end of year (000’s) | | | $435,331 | | | | $524,960 | | | | $510,317 | | | | $477,221 | | | | $501,813 | |
| | | | | |
Portfolio turnover rate | | | 4.91% | f | | | 6.05% | f | | | 5.60% | | | | 7.53% | | | | 5.05% | |
aThe amount shown for a share outstanding throughout the period may not correlate with the Statement of Operations for the period due to the timing of sales and repurchases of the Fund’s shares in relation to income earned and/or fluctuating fair value of the investments of the Fund.
bBased on average daily shares outstanding.
cNet investment income per share includes approximately $0.10 per share related to income received in the form of special dividends in connection with certain Fund holdings. Excluding this amount, the ratio of net investment income to average net assets would have been 0.25%.
dBenefit of expense reduction rounds to less than 0.01%.
eBenefit of waiver and payments by affiliates rounds to less than 0.01%.
fExcludes the value of portfolio securities delivered as a result of a redemptionin-kind. See Note 11.
| | | | |
| | | |
| franklintempleton.com | | The accompanying notes are an integral part of these financial statements. | Annual Report | | 51 |
FRANKLIN CUSTODIAN FUNDS
FINANCIAL HIGHLIGHTS
Franklin Growth Fund(continued)
| | | | | | | | | | | | | | | | | | | | |
| | | Year Ended September 30, | |
| | | 2019 | | | 2018 | | | 2017 | | | 2016 | | | 2015 | |
| |
| | | | | |
Class R6 | | | | | | | | | | | | | | | | | | | | |
| | | | | |
Per share operating performance (for a share outstanding throughout the year) | | | | | | | | | | | | | | | | | | | | |
| | | | | |
Net asset value, beginning of year | | | $107.90 | | | | $ 91.90 | | | | $78.79 | | | | $72.69 | | | | $70.76 | |
| | | | |
| | | | | |
Income from investment operationsa: | | | | | | | | | | | | | | | | | | | | |
| | | | | |
Net investment incomeb | | | 0.83 | | | | 0.77 | | | | 0.74 | | | | 0.78 | c | | | 0.61 | |
| | | | | |
Net realized and unrealized gains (losses) | | | 3.47 | | | | 18.22 | | | | 15.59 | | | | 8.56 | | | | 1.79 | |
| | | | |
| | | | | |
Total from investment operations | | | 4.30 | | | | 18.99 | | | | 16.33 | | | | 9.34 | | | | 2.40 | |
| | | | |
| | | | | |
Less distributions from: | | | | | | | | | | | | | | | | | | | | |
| | | | | |
Net investment income | | | (0.79 | ) | | | (0.74 | ) | | | (0.72 | ) | | | (0.87 | ) | | | (0.47) | |
| | | | | |
Net realized gains | | | (1.04 | ) | | | (2.25 | ) | | | (2.50 | ) | | | (2.37 | ) | | | — | |
| | | | |
| | | | | |
Total distributions | | | (1.83 | ) | | | (2.99 | ) | | | (3.22 | ) | | | (3.24 | ) | | | (0.47) | |
| | | | |
| | | | | |
Net asset value, end of year | | | $110.37 | | | | $107.90 | | | | $91.90 | | | | $78.79 | | | | $72.69 | |
| | | | |
| | | | | |
Total return | | | 4.16% | | | | 21.17% | | | | 21.61% | | | | 13.05% | | | | 3.37% | |
| | | | | |
Ratios to average net assets | | | | | | | | | | | | | | | | | | | | |
| | | | | |
Expenses before waiver and payments by affiliates | | | 0.48% | | | | 0.47% | | | | 0.46% | | | | 0.46% | | | | 0.46% | |
| | | | | |
Expenses net of waiver and payments by affiliatesd | | | 0.48% | e | | | 0.46% | | | | 0.45% | | | | 0.44% | | | | 0.46%e | |
| | | | | |
Net investment income | | | 0.80% | | | | 0.78% | | | | 0.89% | | | | 1.05% | c | | | 0.80% | |
| | | | | |
Supplemental data | | | | | | | | | | | | | | | | | | | | |
| | | | | |
Net assets, end of year (000’s) | | | $2,545,800 | | | | $2,634,455 | | | | $1,700,993 | | | | $1,247,825 | | | | $1,163,362 | |
| | | | | |
Portfolio turnover rate | | | 4.91% | f | | | 6.05% | f | | | 5.60% | | | | 7.53% | | | | 5.05% | |
aThe amount shown for a share outstanding throughout the period may not correlate with the Statement of Operations for the period due to the timing of sales and repurchases of the Fund’s shares in relation to income earned and/or fluctuating fair value of the investments of the Fund.
bBased on average daily shares outstanding.
cNet investment income per share includes approximately $0.10 per share related to income received in the form of special dividends in connection with certain Fund holdings. Excluding this amount, the ratio of net investment income to average net assets would have been 0.92%.
dBenefit of expense reduction rounds to less than 0.01%.
eBenefit of waiver and payments by affiliates rounds to less than 0.01%.
fExcludes the value of portfolio securities delivered as a result of a redemptionin-kind. See Note 11.
| | | | |
| | | |
52 | | Annual Report | The accompanying notes are an integral part of these financial statements. | | franklintempleton.com |
FRANKLIN CUSTODIAN FUNDS
FINANCIAL HIGHLIGHTS
Franklin Growth Fund(continued)
| | | | | | | | | | | | | | | | | | | | |
| | | Year Ended September 30, | |
| | | 2019 | | | 2018 | | | 2017 | | | 2016 | | | 2015 | |
| |
| | | | | |
Advisor Class | | | | | | | | | | | | | | | | | | | | |
| | | | | |
Per share operating performance (for a share outstanding throughout the year) | | | | | | | | | | | | | | | | | | | | |
| | | | | |
Net asset value, beginning of year | | | $107.95 | | | | $ 91.90 | | | | $78.80 | | | | $72.67 | | | | $70.75 | |
| | | | |
| | | | | |
Income from investment operationsa: | | | | | | | | | | | | | | | | | | | | |
| | | | | |
Net investment incomeb | | | 0.72 | | | | 0.66 | | | | 0.60 | | | | 0.65 | c | | | 0.48 | |
| | | | | |
Net realized and unrealized gains (losses) | | | 3.47 | | | | 18.23 | | | | 15.61 | | | | 8.56 | | | | 1.79 | |
| | | | |
| | | | | |
Total from investment operations | | | 4.19 | | | | 18.89 | | | | 16.21 | | | | 9.21 | | | | 2.27 | |
| | | | |
| | | | | |
Less distributions from: | | | | | | | | | | | | | | | | | | | | |
| | | | | |
Net investment income | | | (0.69 | ) | | | (0.59 | ) | | | (0.61 | ) | | | (0.71 | ) | | | (0.35) | |
| | | | | |
Net realized gains | | | (1.04 | ) | | | (2.25 | ) | | | (2.50 | ) | | | (2.37 | ) | | | — | |
| | | | |
| | | | | |
Total distributions | | | (1.73 | ) | | | (2.84 | ) | | | (3.11 | ) | | | (3.08 | ) | | | (0.35) | |
| | | | |
| | | | | |
Net asset value, end of year | | | $110.41 | | | | $107.95 | | | | $91.90 | | | | $78.80 | | | | $72.67 | |
| | | | |
| | | | | |
Total return | | | 4.05% | | | | 21.02% | | | | 21.43% | | | | 12.85% | | | | 3.20% | |
| | | | | |
Ratios to average net assets | | | | | | | | | | | | | | | | | | | | |
| | | | | |
Expenses before waiver and payments by affiliates | | | 0.58% | | | | 0.58% | | | | 0.63% | | | | 0.63% | | | | 0.63% | |
| | | | | |
Expenses net of waiver and payments by affiliatesd | | | 0.58% | e | | | 0.58% | e | | | 0.62% | | | | 0.61% | | | | 0.63%e | |
| | | | | |
Net investment income | | | 0.70% | | | | 0.66% | | | | 0.72% | | | | 0.88% | c | | | 0.63% | |
| | | | | |
Supplemental data | | | | | | | | | | | | | | | | | | | | |
| | | | | |
Net assets, end of year (000’s) | | | $3,154,342 | | | | $3,139,208 | | | | $2,801,153 | | | | $1,998,483 | | | | $1,514,492 | |
| | | | | |
Portfolio turnover rate | | | 4.91% | f | | | 6.05% | f | | | 5.60% | | | | 7.53% | | | | 5.05% | |
aThe amount shown for a share outstanding throughout the period may not correlate with the Statement of Operations for the period due to the timing of sales and repurchases of the Fund’s shares in relation to income earned and/or fluctuating fair value of the investments of the Fund.
bBased on average daily shares outstanding.
cNet investment income per share includes approximately $0.10 per share related to income received in the form of special dividends in connection with certain Fund holdings. Excluding this amount, the ratio of net investment income to average net assets would have been 0.75%.
dBenefit of expense reduction rounds to less than 0.01%.
eBenefit of waiver and payments by affiliates rounds to less than 0.01%.
fExcludes the value of portfolio securities delivered as a result of a redemptionin-kind. See Note 11.
| | | | |
| | | |
| franklintempleton.com | | The accompanying notes are an integral part of these financial statements. | Annual Report | | 53 |
FRANKLIN CUSTODIAN FUNDS
Statement of Investments, September 30, 2019
Franklin Growth Fund
| | | | | | | | | | | | | | |
| | | Country | | Shares | | | | | | Value | |
| | | | |
Common Stocks 99.0% | | | | | | | | | | | | | | |
Automobiles & Components 0.4% | | | | | | | | | | | | | | |
BorgWarner Inc. | | United States | | | 1,633,318 | | | | | | | $ | 59,910,104 | |
| | | | | | | | | | | | | | |
Capital Goods 15.9% | | | | | | | | | | | | | | |
3M Co. | | United States | | | 846,356 | | | | | | | | 139,140,927 | |
Allegion PLC | | United States | | | 692,923 | | | | | | | | 71,821,469 | |
AMETEK Inc. | | United States | | | 692,923 | | | | | | | | 63,624,190 | |
The Boeing Co. | | United States | | | 1,088,879 | | | | | | | | 414,285,793 | |
BWX Technologies Inc. | | United States | | | 1,689,412 | | | | | | | | 96,651,260 | |
Caterpillar Inc. | | United States | | | 544,440 | | | | | | | | 68,768,216 | |
Deere & Co. | | United States | | | 494,945 | | | | | | | | 83,487,323 | |
Emerson Electric Co. | | United States | | | 1,088,879 | | | | | | | | 72,802,450 | |
Fortive Corp. | | United States | | | 519,692 | | | | | | | | 35,630,084 | |
General Dynamics Corp. | | United States | | | 989,889 | | | | | | | | 180,882,417 | |
Huntington Ingalls Industries Inc. | | United States | | | 296,967 | | | | | | | | 62,894,641 | |
Illinois Tool Works Inc. | | United States | | | 989,889 | | | | | | | | 154,907,730 | |
Ingersoll-Rand PLC | | United States | | | 1,088,879 | | | | | | | | 134,160,782 | |
Lockheed Martin Corp. | | United States | | | 494,945 | | | | | | | | 193,058,247 | |
Northrop Grumman Corp. | | United States | | | 1,088,879 | | | | | | | | 408,100,960 | |
Raytheon Co. | | United States | | | 593,934 | | | | | | | | 116,523,911 | |
Stanley Black & Decker Inc. | | United States | | | 745,329 | | | | | | | | 107,632,961 | |
United Technologies Corp. | | United States | | | 1,050,607 | | | | | | | | 143,428,868 | |
| | | | | | | | | | | | | | |
| | | | |
| | | | | | | | | | | | | 2,547,802,229 | |
| | | | | | | | | | | | | | |
Commercial & Professional Services 3.5% | | | | | | | | | | | | | | |
Equifax Inc. | | United States | | | 544,440 | | | | | | | | 76,586,375 | |
aIHS Markit Ltd. | | United States | | | 3,520,639 | | | | | | | | 235,460,336 | |
Republic Services Inc. | | United States | | | 184,700 | | | | | | | | 15,985,785 | |
Verisk Analytics Inc. | | United States | | | 1,484,834 | | | | | | | | 234,811,649 | |
| | | | | | | | | | | | | | |
| | | | |
| | | | | | | | | | | | | 562,844,145 | |
| | | | | | | | | | | | | | |
Consumer Durables & Apparel 1.1% | | | | | | | | | | | | | | |
NIKE Inc., B | | United States | | | 1,860,992 | | | | | | | | 174,784,369 | |
| | | | | | | | | | | | | | |
Consumer Services 0.7% | | | | | | | | | | | | | | |
Carnival Corp. | | United States | | | 1,187,867 | | | | | | | | 51,921,667 | |
Graham Holdings Co., B | | United States | | | 79,192 | | | | | | | | 52,539,932 | |
| | | | | | | | | | | | | | |
| | | | |
| | | | | | | | | | | | | 104,461,599 | |
| | | | | | | | | | | | | | |
Diversified Financials 3.6% | | | | | | | | | | | | | | |
American Express Co. | | United States | | | 593,934 | | | | | | | | 70,250,513 | |
aBerkshire Hathaway Inc., A | | United States | | | 183 | | | | | | | | 57,065,256 | |
BlackRock Inc. | | United States | | | 222,726 | | | | | | | | 99,255,615 | |
The Charles Schwab Corp. | | United States | | | 2,969,667 | | | | | | | | 124,221,171 | |
Intercontinental Exchange Inc. | | United States | | | 1,385,845 | | | | | | | | 127,871,918 | |
T. Rowe Price Group Inc. | | United States | | | 890,901 | | | | | | | | 101,785,439 | |
| | | | | | | | | | | | | | |
| | | | |
| | | | | | | | | | | | | 580,449,912 | |
| | | | | | | | | | | | | | |
Energy 0.6% | | | | | | | | | | | | | | |
Cabot Oil & Gas Corp., A | | United States | | | 3,365,622 | | | | | | | | 59,133,978 | |
Concho Resources Inc. | | United States | | | 593,934 | | | | | | | | 40,328,119 | |
| | | | | | | | | | | | | | |
| | | | |
| | | | | | | | | | | | | 99,462,097 | |
| | | | | | | | | | | | | | |
| | | | |
| | | |
54 | | Annual Report | | franklintempleton.com |
FRANKLIN CUSTODIAN FUNDS
STATEMENT OF INVESTMENTS
Franklin Growth Fund(continued)
| | | | | | | | | | | | | | |
| | | Country | | Shares | | | | | | Value | |
| | | | |
Common Stocks(continued) | | | | | | | | | | | | | | |
Food, Beverage & Tobacco 3.6% | | | | | | | | | | | | | | |
Brown-Forman Corp., B | | United States | | | 1,608,570 | | | | | | | $ | 100,986,025 | |
Constellation Brands Inc., A | | United States | | | 544,440 | | | | | | | | 112,851,523 | |
Lamb Weston Holdings Inc. | | United States | | | 520,000 | | | | | | | | 37,814,400 | |
Mondelez International Inc., A | | United States | | | 1,484,834 | | | | | | | | 82,141,017 | |
aMonster Beverage Corp. | | United States | | | 2,672,700 | | | | | | | | 155,176,962 | |
PepsiCo Inc. | | United States | | | 643,429 | | | | | | | | 88,214,116 | |
| | | | | | | | | | | | | | |
| | | | |
| | | | | | | | | | | | | 577,184,043 | |
| | | | | | | | | | | | | | |
Health Care Equipment & Services 7.9% | | | | | | | | | | | | | | |
Abbott Laboratories | | United States | | | 1,336,351 | | | | | | | | 111,812,488 | |
aABIOMED Inc. | | United States | | | 197,979 | | | | | | | | 35,218,484 | |
Baxter International Inc. | | United States | | | 395,957 | | | | | | | | 34,634,359 | |
Becton, Dickinson and Co. | | United States | | | 76,915 | | | | | | | | 19,456,418 | |
Danaher Corp. | | United States | | | 1,039,384 | | | | | | | | 150,118,231 | |
aEdwards Lifesciences Corp. | | United States | | | 395,957 | | | | | | | | 87,074,904 | |
aHaemonetics Corp. | | United States | | | 989,889 | | | | | | | | 124,864,599 | |
aIntuitive Surgical Inc. | | United States | | | 445,451 | | | | | | | | 240,512,358 | |
aLaboratory Corp. of America Holdings | | United States | | | 494,945 | | | | | | | | 83,150,760 | |
Quest Diagnostics Inc. | | United States | | | 890,901 | | | | | | | | 95,353,134 | |
Stryker Corp. | | United States | | | 395,957 | | | | | | | | 85,645,499 | |
Teleflex Inc. | | United States | | | 494,945 | | | | | | | | 168,157,564 | |
aVarian Medical Systems Inc. | | United States | | | 296,967 | | | | | | | | 35,365,800 | |
| | | | | | | | | | | | | | |
| | | | |
| | | | | | | | | | | | | 1,271,364,598 | |
| | | | | | | | | | | | | | |
Materials 5.3% | | | | | | | | | | | | | | |
Air Products and Chemicals Inc. | | United States | | | 494,945 | | | | | | | | 109,808,498 | |
Albemarle Corp. | | United States | | | 544,440 | | | | | | | | 37,849,469 | |
aAxalta Coating Systems Ltd. | | United States | | | 3,365,622 | | | | | | | | 101,473,503 | |
Celanese Corp. | | United States | | | 1,237,362 | | | | | | | | 151,316,999 | |
Ecolab Inc. | | United States | | | 910,699 | | | | | | | | 180,354,830 | |
International Flavors & Fragrances Inc. | | United States | | | 400,000 | | | | | | | | 49,076,000 | |
Linde PLC | | United Kingdom | | | 569,187 | | | | | | | | 110,262,905 | |
Martin Marietta Materials Inc. | | United States | | | 395,957 | | | | | | | | 108,531,814 | |
| | | | | | | | | | | | | | |
| | | | |
| | | | | | | | | | | | | 848,674,018 | |
| | | | | | | | | | | | | | |
Media & Entertainment 5.9% | | | | | | | | | | | | | | |
aAlphabet Inc., A | | United States | | | 163,333 | | | | | | | | 199,452,460 | |
aAlphabet Inc., C | | United States | | | 156,831 | | | | | | | | 191,176,989 | |
Cable One Inc. | | United States | | | 79,192 | | | | | | | | 99,362,202 | |
Comcast Corp., A | | United States | | | 795,018 | | | | | | | | 35,839,411 | |
aFacebook Inc., A | | United States | | | 750,000 | | | | | | | | 133,560,000 | |
aIAC/InterActiveCorp. | | United States | | | 296,967 | | | | | | | | 64,729,897 | |
The Walt Disney Co. | | United States | | | 1,706,856 | | | | | | | | 222,437,474 | |
| | | | | | | | | | | | | | |
| | | | |
| | | | | | | | | | | | | 946,558,433 | |
| | | | | | | | | | | | | | |
Pharmaceuticals, Biotechnology & Life Sciences 11.4% | | | | | | | | | | | | | | |
a10X Genomics Inc., A | | United States | | | 54,500 | | | | | | | | 2,746,800 | |
AbbVie Inc. | | United States | | | 455,350 | | | | | | | | 34,479,102 | |
Agilent Technologies Inc. | | United States | | | 1,286,856 | | | | | | | | 98,611,775 | |
Amgen Inc. | | United States | | | 989,889 | | | | | | | | 191,553,420 | |
| | | | |
| | | |
| franklintempleton.com | | Annual Report | | 55 |
FRANKLIN CUSTODIAN FUNDS
STATEMENT OF INVESTMENTS
Franklin Growth Fund(continued)
| | | | | | | | | | | | | | |
| | | Country | | Shares | | | | | | Value | |
| | | | |
Common Stocks(continued) | | | | | | | | | | | | | | |
Pharmaceuticals, Biotechnology & Life Sciences(continued) | | | | | | | | | | | | | | |
AstraZeneca PLC, ADR | | United Kingdom | | | 1,979,778 | | | | | | | $ | 88,238,705 | |
aCatalent Inc. | | United States | | | 3,365,622 | | | | | | | | 160,405,545 | |
aElanco Animal Health Inc. | | United States | | | 1,487,105 | | | | | | | | 39,542,122 | |
Eli Lilly & Co. | | United States | | | 1,240,175 | | | | | | | | 138,688,770 | |
Gilead Sciences Inc. | | United States | | | 643,429 | | | | | | | | 40,780,530 | |
aGW Pharmaceuticals PLC, ADR | | United Kingdom | | | 204,657 | | | | | | | | 23,541,695 | |
aIllumina Inc. | | United States | | | 519,692 | | | | | | | | 158,100,700 | |
Johnson & Johnson | | United States | | | 1,187,967 | | | | | | | | 153,699,171 | |
Merck & Co. Inc. | | United States | | | 989,889 | | | | | | | | 83,328,856 | |
aMettler-Toledo International Inc. | | United States | | | 420,704 | | | | | | | | 296,343,898 | |
aNeurocrine Biosciences Inc. | | United States | | | 494,945 | | | | | | | | 44,599,494 | |
Pfizer Inc. | | United States | | | 2,733,084 | | | | | | | | 98,199,708 | |
aPTC Therapeutics Inc. | | United States | | | 971,300 | | | | | | | | 32,849,366 | |
aWaters Corp. | | United States | | | 618,682 | | | | | | | | 138,108,383 | |
| | | | | | | | | | | | | | |
| | | | |
| | | | | | | | | | | | | 1,823,818,040 | |
| | | | | | | | | | | | | | |
| | | | |
Real Estate 1.8% | | | | | | | | | | | | | | |
American Tower Corp. | | United States | | | 615,000 | | | | | | | | 135,994,950 | |
Crown Castle International Corp. | | United States | | | 218,900 | | | | | | | | 30,429,289 | |
Equinix Inc. | | United States | | | 198,755 | | | | | | | | 114,641,884 | |
| | | | | | | | | | | | | | |
| | | | |
| | | | | | | | | | | | | 281,066,123 | |
| | | | | | | | | | | | | | |
| | | | |
Retailing 4.6% | | | | | | | | | | | | | | |
aAlibaba Group Holding Ltd., ADR | | China | | | 475,544 | | | | | | | | 79,525,223 | |
aAmazon.com Inc. | | United States | | | 346,462 | | | | | | | | 601,426,851 | |
Expedia Group Inc. | | United States | | | 346,462 | | | | | | | | 46,567,957 | |
| | | | | | | | | | | | | | |
| | | | |
| | | | | | | | | | | | | 727,520,031 | |
| | | | | | | | | | | | | | |
| | | | |
Semiconductors & Semiconductor Equipment 3.6% | | | | | | | | | | | | | | |
ASML Holding NV, N.Y. shs | | Netherlands | | | 643,429 | | | | | | | | 159,840,632 | |
Intel Corp. | | United States | | | 1,088,879 | | | | | | | | 56,109,935 | |
Lam Research Corp. | | United States | | | 29,697 | | | | | | | | 6,863,274 | |
Monolithic Power Systems | | United States | | | 445,451 | | | | | | | | 69,325,539 | |
NVIDIA Corp. | | United States | | | 500,000 | | | | | | | | 87,035,000 | |
Texas Instruments Inc. | | United States | | | 1,385,845 | | | | | | | | 179,106,608 | |
Versum Materials Inc. | | United States | | | 247,473 | | | | | | | | 13,098,746 | |
| | | | | | | | | | | | | | |
| | | | |
| | | | | | | | | | | | | 571,379,734 | |
| | | | | | | | | | | | | | |
| | | | |
Software & Services 13.8% | | | | | | | | | | | | | | |
aAdobe Inc. | | United States | | | 150,000 | | | | | | | | 41,437,500 | |
aAdyen NV | | Netherlands | | | 59,592 | | | | | | | | 39,255,368 | |
aAtlassian Corp. PLC | | United States | | | 122,600 | | | | | | | | 15,378,944 | |
aAutodesk Inc. | | United States | | | 791,912 | | | | | | | | 116,965,402 | |
Automatic Data Processing Inc. | | United States | | | 692,923 | | | | | | | | 111,851,631 | |
Intuit Inc. | | United States | | | 989,889 | | | | | | | | 263,251,081 | |
Mastercard Inc., A | | United States | | | 1,385,845 | | | | | | | | 376,353,927 | |
Microsoft Corp. | | United States | | | 3,365,622 | | | | | | | | 467,922,427 | |
aPTC Inc. | | United States | | | 928,128 | | | | | | | | 63,279,767 | |
asalesforce.com Inc. | | United States | | | 544,440 | | | | | | | | 80,816,673 | |
aServiceNow Inc. | | United States | | | 989,889 | | | | | | | | 251,283,323 | |
| | | | |
| | | |
56 | | Annual Report | | franklintempleton.com |
FRANKLIN CUSTODIAN FUNDS
STATEMENT OF INVESTMENTS
Franklin Growth Fund(continued)
| | | | | | | | | | | | | | |
| | | Country | | Shares | | | | | | Value | |
| | | | |
Common Stocks(continued) | | | | | | | | | | | | | | |
Software & Services(continued) | | | | | | | | | | | | | | |
aTwilio Inc., A | | United States | | | 397,509 | | | | | | | $ | 43,710,089 | |
aTyler Technologies Inc. | | United States | | | 173,232 | | | | | | | | 45,473,400 | |
Visa Inc., A | | United States | | | 1,385,845 | | | | | | | | 238,379,198 | |
aWorkday Inc., A | | United States | | | 340,228 | | | | | | | | 57,825,151 | |
| | | | | | | | | | | | | | |
| | | | |
| | | | | | | | | | | | | 2,213,183,881 | |
| | | | | | | | | | | | | | |
| | | | |
Technology Hardware & Equipment 8.3% | | | | | | | | | | | | | | |
Amphenol Corp., A | | United States | | | 894,395 | | | | | | | | 86,309,118 | |
Apple Inc. | | United States | | | 3,042,195 | | | | | | | | 681,360,414 | |
Cisco Systems Inc. | | United States | | | 2,915,223 | | | | | | | | 144,041,168 | |
Cognex Corp. | | United States | | | 385,906 | | | | | | | | 18,959,562 | |
aKeysight Technologies Inc. | | United States | | | 643,429 | | | | | | | | 62,573,470 | |
TE Connectivity Ltd. | | United States | | | 1,850,000 | | | | | | | | 172,383,000 | |
aTrimble Inc. | | United States | | | 2,672,700 | | | | | | | | 103,727,487 | |
aViaSat Inc. | | United States | | | 692,923 | | | | | | | | 52,190,960 | |
| | | | | | | | | | | | | | |
| | | | |
| | | | | | | | | | | | | 1,321,545,179 | |
| | | | | | | | | | | | | | |
| | | | |
Transportation 5.7% | | | | | | | | | | | | | | |
Alaska Air Group Inc. | | United States | | | 3,167,645 | | | | | | | | 205,611,837 | |
Canadian National Railway Co. | | Canada | | | 989,889 | | | | | | | | 88,951,426 | |
Canadian Pacific Railway Ltd. | | Canada | | | 494,945 | | | | | | | | 110,105,465 | |
J.B. Hunt Transport Services Inc. | | United States | | | 494,945 | | | | | | | | 54,765,664 | |
Kansas City Southern | | United States | | | 742,417 | | | | | | | | 98,748,885 | |
aLyft Inc., A | | United States | | | 301,800 | | | | | | | | 12,325,512 | |
aUber Technologies Inc. | | United States | | | 705,700 | | | | | | | | 21,502,679 | |
Union Pacific Corp. | | United States | | | 2,009,475 | | | | | | | | 325,494,760 | |
| | | | | | | | | | | | | | |
| | | | |
| | | | | | | | | | | | | 917,506,228 | |
| | | | | | | | | | | | | | |
| | | | |
Utilities 1.3% | | | | | | | | | | | | | | |
American Water Works Co. Inc. | | United States | | | 692,923 | | | | | | | | 86,081,824 | |
NextEra Energy Inc. | | United States | | | 494,945 | | | | | | | | 115,317,236 | |
| | | | | | | | | | | | | | |
| | | | |
| | | | | | | | | | | | | 201,399,060 | |
| | | | | | | | | | | | | | |
| | | | |
Total Common Stocks (Cost $5,327,027,738) | | | | | | | | | | | | | 15,830,913,823 | |
| | | | | | | | | | | | | | |
| | | | |
| | | |
| franklintempleton.com | | Annual Report | | 57 |
FRANKLIN CUSTODIAN FUNDS
STATEMENT OF INVESTMENTS
Franklin Growth Fund(continued)
| | | | | | | | | | | | | | |
| | | Country | | Shares | | | | | | Value | |
| | | | |
Short Term Investments (Cost $195,726,982) 1.2% | | | | | | | | | | | | | | |
| | | | |
Money Market Funds 1.2% | | | | | | | | | | | | | | |
b,cInstitutional Fiduciary Trust Money Market Portfolio, 1.71% | | United States | | | 195,726,982 | | | | | | | $ | 195,726,982 | |
| | | | | | | | | | | | | | |
Total Investments (Cost $5,522,754,720) 100.2% | | | | | | | | | | | | | 16,026,640,805 | |
Other Assets, less Liabilities (0.2)% | | | | | | | | | | | | | (29,796,831 | ) |
| | | | | | | | | | | | | | |
| | | | |
Net Assets 100.0% | | | | | | | | | | | | $ | 15,996,843,974 | |
| | | | | | | | | | | | | | |
See Abbreviations on page 133.
aNon-income producing.
bSee Note 3(f) regarding investments in affiliated management investment companies.
cThe rate shown is the annualizedseven-day effective yield at period end.
| | | | |
| | | |
58 | | Annual Report | The accompanying notes are an integral part of these financial statements. | | franklintempleton.com |
FRANKLIN CUSTODIAN FUNDS
Financial Highlights
Franklin Income Fund
| | | | | | | | |
| | | Year Ended September 30, | |
| | | 2019 | | | 2018a | |
| | |
Class A | | | | | | | | |
| | |
Per share operating performance (for a share outstanding throughout the year) | | | | | | | | |
| | |
Net asset value, beginning of year | | | $ 2.32 | | | | $ 2.31 | |
| | |
Income from investment operationsb: | | | | | | | | |
| | |
Net investment income (loss)c | | | 0.08 | | | | (0.04 | ) |
| | |
Net realized and unrealized gains (losses) | | | 0.02 | | | | 0.05 | |
| | |
Total from investment operations | | | 0.10 | | | | 0.01 | |
| | |
Less distributions from: | | | | | | | | |
| | |
Net investment income | | | (0.12 | ) | | | — | |
| | |
Net asset value, end of year | | | $ 2.30 | | | | $ 2.32 | |
| | |
Total returnd | | | 4.40% | | | | 0.43% | |
| | |
Ratios to average net assetse | | | | | | | | |
| | |
Expensesf | | | 0.72% | | | | 0.71% | |
| | |
Net investment income | | | 3.92% | | | | 3.89% | |
| | |
Supplemental data | | | | | | | | |
| | |
Net assets, end of year (000’s) | | | $7,427,468 | | | | $107,057 | |
| | |
Portfolio turnover rate | | | 43.63% | | | | 49.95% | |
aFor the period September 10, 2018 (effective date) to September 30, 2018.
bThe amount shown for a share outstanding throughout the period may not correlate with the Statement of Operations for the period due to the timing of sales and repurchases of the Fund’s shares in relation to income earned and/or fluctuating fair value of the investments of the Fund.
cBased on average daily shares outstanding.
dTotal return does not reflect sales commissions or contingent deferred sales charges, if applicable, and is not annualized for periods less than one year.
eRatios are annualized for periods less than one year.
fBenefit of waiver and payments by affiliates and expense reduction rounds to less than 0.01%.
| | | | |
| | | |
| franklintempleton.com | | The accompanying notes are an integral part of these financial statements. | Annual Report | | 59 |
FRANKLIN CUSTODIAN FUNDS
FINANCIAL HIGHLIGHTS
Franklin Income Fund(continued)
| | | | | | | | | | | | | | | | | | | | |
| | | Year Ended September 30, | |
| | | 2019 | | | 2018 | | | 2017 | | | 2016 | | | 2015 | |
| | | | | |
Class A1 | | | | | | | | | | | | | | | | | | | | |
| | | | | |
Per share operating performance (for a share outstanding throughout the year) | | | | | | | | | | | | | | | | | | | | |
| | | | | |
Net asset value, beginning of year | | | $ 2.32 | | | | $ 2.39 | | | | $ 2.25 | | | | $ 2.10 | | | | $ 2.48 | |
| | | | | |
Income from investment operationsa: | | | | | | | | | | | | | | | | | | | | |
| | | | | |
Net investment incomeb | | | 0.09 | | | | 0.09 | | | | 0.10 | | | | 0.10 | | | | 0.10 | |
| | | | | |
Net realized and unrealized gains (losses) | | | 0.01 | | | | (0.04 | ) | | | 0.16 | | | | 0.17 | | | | (0.36 | ) |
| | | | | |
Total from investment operations | | | 0.10 | | | | 0.05 | | | | 0.26 | | | | 0.27 | | | | (0.26 | ) |
| | | | | |
Less distributions from: | | | | | | | | | | | | | | | | | | | | |
| | | | | |
Net investment income | | | (0.12 | ) | | | (0.12 | ) | | | (0.12 | ) | | | (0.12 | ) | | | (0.12 | ) |
| | | | | |
Net asset value, end of year | | | $ 2.30 | | | | $ 2.32 | | | | $ 2.39 | | | | $ 2.25 | | | | $ 2.10 | |
| | | | | |
| Total returnc | | | 4.50% | | | | 2.18% | | | | 11.86% | | | | 13.31% | | | | (10.93)% | |
| | | | | |
Ratios to average net assets | | | | | | | | | | | | | | | | | | | | |
| | | | | |
Expenses before waiver and payments by affiliates | | | 0.62% | | | | 0.61% | | | | 0.62% | | | | 0.61% | | | | 0.61% | |
| | | | | |
Expenses net of waiver and payments by affiliatesd | | | 0.62% | e | | | 0.61% | e | | | 0.61% | | | | 0.61% | e | | | 0.61% | e |
| | | | | |
Net investment income | | | 4.02% | | | | 3.99% | | | | 4.22% | | | | 4.57% | | | | 4.43% | |
| | | | | |
Supplemental data | | | | | | | | | | | | | | | | | | | | |
| | | | | |
Net assets, end of year (000’s) | | | $39,625,649 | | | | $42,929,573 | | | | $46,505,632 | | | | $45,515,127 | | | | $44,886,127 | |
| | | | | |
Portfolio turnover rate | | | 43.63% | | | | 49.95% | | | | 34.12% | | | | 61.26% | | | | 44.81% | |
aThe amount shown for a share outstanding throughout the period may not correlate with the Statement of Operations for the period due to the timing of sales and repurchases of the Fund’s shares in relation to income earned and/or fluctuating fair value of the investments of the Fund.
bBased on average daily shares outstanding.
cTotal return does not reflect sales commissions or contingent deferred sales charges, if applicable.
dBenefit of expense reduction rounds to less than 0.01%.
eBenefit of waiver and payments by affiliates rounds to less than 0.01%.
| | | | |
| | | |
60 | | Annual Report | The accompanying notes are an integral part of these financial statements. | | franklintempleton.com |
FRANKLIN CUSTODIAN FUNDS
FINANCIAL HIGHLIGHTS
Franklin Income Fund(continued)
| | | | | | | | | | | | | | | | | | | | |
| | | Year Ended September 30, | |
| | | 2019 | | | 2018 | | | 2017 | | | 2016 | | | 2015 | |
| | | | | |
Class C | | | | | | | | | | | | | | | | | | | | |
| | | | | |
Per share operating performance (for a share outstanding throughout the year) | | | | | | | | | | | | | | | | | | | | |
| | | | | |
Net asset value, beginning of year | | | $ 2.35 | | | | $ 2.42 | | | | $ 2.27 | | | | $ 2.13 | | | | $ 2.50 | |
| | | | | |
Income from investment operationsa: | | | | | | | | | | | | | | | | | | | | |
| | | | | |
Net investment incomeb | | | 0.08 | | | | 0.08 | | | | 0.09 | | | | 0.09 | | | | 0.09 | |
| | | | | |
Net realized and unrealized gains (losses) | | | 0.02 | | | | (0.04 | ) | | | 0.17 | | | | 0.16 | | | | (0.35 | ) |
| | | | | |
Total from investment operations | | | 0.10 | | | | 0.04 | | | | 0.26 | | | | 0.25 | | | | (0.26 | ) |
| | | | | |
Less distributions from: | | | | | | | | | | | | | | | | | | | | |
| | | | | |
Net investment income | | | (0.11 | ) | | | (0.11 | ) | | | (0.11 | ) | | | (0.11 | ) | | | (0.11 | ) |
| | | | | |
Net asset value, end of year | | | $ 2.34 | | | | $ 2.35 | | | | $ 2.42 | | | | $ 2.27 | | | | $ 2.13 | |
| | | | | |
| Total returnc | | | 4.35% | | | | 1.61% | | | | 11.63% | | | | 12.07% | | | | (10.89)% | |
| | | | | |
Ratios to average net assets | | | | | | | | | | | | | | | | | | | | |
| | | | | |
Expenses before waiver and payments by affiliates | | | 1.12% | | | | 1.11% | | | | 1.12% | | | | 1.11% | | | | 1.11% | |
| | | | | |
Expenses net of waiver and payments by affiliatesd | | | 1.12% | e | | | 1.11% | e | | | 1.11% | | | | 1.11% | e | | | 1.11% | e |
| | | | | |
Net investment income | | | 3.52% | | | | 3.49% | | | | 3.72% | | | | 4.07% | | | | 3.93% | |
| | | | | |
Supplemental data | | | | | | | | | | | | | | | | | | | | |
| | | | | |
Net assets, end of year (000’s) | | | $13,488,627 | | | | $19,895,441 | | | | $23,036,875 | | | | $23,841,466 | | | | $24,091,638 | |
| | | | | |
Portfolio turnover rate | | | 43.63% | | | | 49.95% | | | | 34.12% | | | | 61.26% | | | | 44.81% | |
aThe amount shown for a share outstanding throughout the period may not correlate with the Statement of Operations for the period due to the timing of sales and repurchases of the Fund’s shares in relation to income earned and/or fluctuating fair value of the investments of the Fund.
bBased on average daily shares outstanding.
cTotal return does not reflect sales commissions or contingent deferred sales charges, if applicable.
dBenefit of expense reduction rounds to less than 0.01%.
eBenefit of waiver and payments by affiliates rounds to less than 0.01%.
| | | | |
| | | |
| franklintempleton.com | | The accompanying notes are an integral part of these financial statements. | Annual Report | | 61 |
FRANKLIN CUSTODIAN FUNDS
FINANCIAL HIGHLIGHTS
Franklin Income Fund(continued)
| | | | | | | | | | | | | | | | | | | | |
| | | Year Ended September 30, | |
| | | 2019 | | | 2018 | | | 2017 | | | 2016 | | | 2015 | |
| | | | | |
Class R | | | | | | | | | | | | | | | | | | | | |
| | | | | |
Per share operating performance (for a share outstanding throughout the year) | | | | | | | | | | | | | | | | | | | | |
| | | | | |
Net asset value, beginning of year | | | $ 2.28 | | | | $ 2.35 | | | | $ 2.21 | | | | $ 2.07 | | | | $ 2.44 | |
| | | | | |
Income from investment operationsa: | | | | | | | | | | | | | | | | | | | | |
| | | | | |
Net investment incomeb | | | 0.08 | | | | 0.08 | | | | 0.09 | | | | 0.09 | | | | 0.10 | |
| | | | | |
Net realized and unrealized gains (losses) | | | 0.01 | | | | (0.04 | ) | | | 0.16 | | | | 0.16 | | | | (0.36 | ) |
| | | | | |
Total from investment operations | | | 0.09 | | | | 0.04 | | | | 0.25 | | | | 0.25 | | | | (0.26 | ) |
| | | | | |
Less distributions from: | | | | | | | | | | | | | | | | | | | | |
| | | | | |
Net investment income | | | (0.11 | ) | | | (0.11 | ) | | | (0.11 | ) | | | (0.11 | ) | | | (0.11 | ) |
| | | | | |
Net asset value, end of year | | | $ 2.26 | | | | $ 2.28 | | | | $ 2.35 | | | | $ 2.21 | | | | $ 2.07 | |
| | | | | |
| Total return | | | 4.20% | | | | 1.86% | | | | 11.67% | | | | 12.62% | | | | (10.99)% | |
| | | | | |
Ratios to average net assets | | | | | | | | | | | | | | | | | | | | |
| | | | | |
Expenses before waiver and payments by affiliates | | | 0.97% | | | | 0.96% | | | | 0.97% | | | | 0.96% | | | | 0.96% | |
| | | | | |
Expenses net of waiver and payments by affiliatesc | | | 0.97% | d | | | 0.96% | d | | | 0.96% | | | | 0.96% | d | | | 0.96% | d |
| | | | | |
Net investment income | | | 3.67% | | | | 3.64% | | | | 3.87% | | | | 4.22% | | | | 4.08% | |
| | | | | |
Supplemental data | | | | | | | | | | | | | | | | | | | | |
| | | | | |
Net assets, end of year (000’s) | | | $265,531 | | | | $296,098 | | | | $361,603 | | | | $396,107 | | | | $416,653 | |
| | | | | |
Portfolio turnover rate | | | 43.63% | | | | 49.95% | | | | 34.12% | | | | 61.26% | | | | 44.81% | |
aThe amount shown for a share outstanding throughout the period may not correlate with the Statement of Operations for the period due to the timing of sales and repurchases of the Fund’s shares in relation to income earned and/or fluctuating fair value of the investments of the Fund.
bBased on average daily shares outstanding.
cBenefit of expense reduction rounds to less than 0.01%.
dBenefit of waiver and payments by affiliates rounds to less than 0.01%.
| | | | |
| | | |
62 | | Annual Report | The accompanying notes are an integral part of these financial statements. | | franklintempleton.com |
FRANKLIN CUSTODIAN FUNDS
FINANCIAL HIGHLIGHTS
Franklin Income Fund(continued)
| | | | | | | | | | | | | | | | | | | | |
| | | Year Ended September 30, | |
| | | 2019 | | | 2018 | | | 2017 | | | 2016 | | | 2015 | |
| | | | | |
Class R6 | | | | | | | | | | | | | | | | | | | | |
| | | | | |
Per share operating performance (for a share outstanding throughout the year) | | | | | | | | | | | | | | | | | | | | |
| | | | | |
Net asset value, beginning of year | | | $ 2.30 | | | | $ 2.37 | | | | $ 2.23 | | | | $ 2.09 | | | | $ 2.46 | |
| | | | | |
Income from investment operationsa: | | | | | | | | | | | | | | | | | | | | |
| | | | | |
Net investment incomeb | | | 0.10 | | | | 0.10 | | | | 0.11 | | | | 0.10 | | | | 0.11 | |
| | | | | |
Net realized and unrealized gains (losses) | | | 0.01 | | | | (0.05 | ) | | | 0.15 | | | | 0.16 | | | | (0.35 | ) |
| | | | | |
Total from investment operations | | | 0.11 | | | | 0.05 | | | | 0.26 | | | | 0.26 | | | | (0.24 | ) |
| | | | | |
Less distributions from: | | | | | | | | | | | | | | | | | | | | |
| | | | | |
Net investment income | | | (0.12 | ) | | | (0.12 | ) | | | (0.12 | ) | | | (0.12 | ) | | | (0.13 | ) |
| | | | | |
Net asset value, end of year | | | $ 2.29 | | | | $ 2.30 | | | | $ 2.37 | | | | $ 2.23 | | | | $ 2.09 | |
| | | | | |
| Total return | | | 5.17% | | | | 2.40% | | | | 12.15% | | | | 13.15% | | | | (10.39)% | |
| | | | | |
Ratios to average net assets | | | | | | | | | | | | | | | | | | | | |
| | | | | |
Expenses before waiver and payments by affiliates | | | 0.41% | | | | 0.39% | | | | 0.39% | | | | 0.38% | | | | 0.38% | |
| | | | | |
Expenses net of waiver and payments by affiliatesc | | | 0.40% | | | | 0.39% | d | | | 0.38% | | | | 0.38% | d | | | 0.38% | d |
| | | | | |
Net investment income | | | 4.24% | | | | 4.21% | | | | 4.45% | | | | 4.80% | | | | 4.66% | |
| | | | | |
Supplemental data | | | | | | | | | | | | | | | | | | | | |
| | | | | |
Net assets, end of year (000’s) | | | $1,902,027 | | | | $2,062,334 | | | | $1,815,977 | | | | $1,737,577 | | | | $1,744,718 | |
| | | | | |
Portfolio turnover rate | | | 43.63% | | | | 49.95% | | | | 34.12% | | | | 61.26% | | | | 44.81% | |
aThe amount shown for a share outstanding throughout the period may not correlate with the Statement of Operations for the period due to the timing of sales and repurchases of the Fund’s shares in relation to income earned and/or fluctuating fair value of the investments of the Fund.
bBased on average daily shares outstanding.
cBenefit of expense reduction rounds to less than 0.01%.
dBenefit of waiver and payments by affiliates rounds to less than 0.01%.
| | | | |
| | | |
| franklintempleton.com | | The accompanying notes are an integral part of these financial statements. | Annual Report | | 63 |
FRANKLIN CUSTODIAN FUNDS
FINANCIAL HIGHLIGHTS
Franklin Income Fund(continued)
| | | | | | | | | | | | | | | | | | | | |
| | | Year Ended September 30, | |
| | | 2019 | | | 2018 | | | 2017 | | | 2016 | | | 2015 | |
| | | | | |
Advisor Class | | | | | | | | | | | | | | | | | | | | |
| | | | | |
Per share operating performance (for a share outstanding throughout the year) | | | | | | | | | | | | | | | | | | | | |
| | | | | |
Net asset value, beginning of year | | | $ 2.30 | | | | $ 2.37 | | | | $ 2.23 | | | | $ 2.09 | | | | $ 2.46 | |
| | | | | |
Income from investment operationsa: | | | | | | | | | | | | | | | | | | | | |
| | | | | |
Net investment incomeb | | | 0.09 | | | | 0.10 | | | | 0.10 | | | | 0.10 | | | | 0.11 | |
| | | | | |
Net realized and unrealized gains (losses) | | | 0.01 | | | | (0.05 | ) | | | 0.16 | | | | 0.16 | | | | (0.36 | ) |
| | | | | |
Total from investment operations | | | 0.10 | | | | 0.05 | | | | 0.26 | | | | 0.26 | | | | (0.25 | ) |
| | | | | |
Less distributions from: | | | | | | | | | | | | | | | | | | | | |
| | | | | |
Net investment income | | | (0.12 | ) | | | (0.12 | ) | | | (0.12 | ) | | | (0.12 | ) | | | (0.12 | ) |
| | | | | |
Net asset value, end of year | | | $ 2.28 | | | | $ 2.30 | | | | $ 2.37 | | | | $ 2.23 | | | | $ 2.09 | |
| | | | | |
| Total return | | | 4.65% | | | | 2.34% | | | | 12.09% | | | | 13.06% | | | | (10.46)% | |
| | | | | |
Ratios to average net assets | | | | | | | | | | | | | | | | | | | | |
| | | | | |
Expenses before waiver and payments by affiliates | | | 0.47% | | | | 0.46% | | | | 0.47% | | | | 0.46% | | | | 0.46% | |
| | | | | |
Expenses net of waiver and payments by affiliatesc | | | 0.47% | d | | | 0.46% | d | | | 0.46% | | | | 0.46% | d | | | 0.46% | d |
| | | | | |
Net investment income | | | 4.17% | | | | 4.14% | | | | 4.37% | | | | 4.72% | | | | 4.58% | |
| | | | | |
Supplemental data | | | | | | | | | | | | | | | | | | | | |
| | | | | |
Net assets, end of year (000’s) | | | $11,816,599 | | | | $11,328,761 | | | | $11,671,173 | | | | $8,143,479 | | | | $7,754,475 | |
| | | | | |
Portfolio turnover rate | | | 43.63% | | | | 49.95% | | | | 34.12% | | | | 61.26% | | | | 44.81% | |
aThe amount shown for a share outstanding throughout the period may not correlate with the Statement of Operations for the period due to the timing of sales and repurchases of the Fund’s shares in relation to income earned and/or fluctuating fair value of the investments of the Fund.
bBased on average daily shares outstanding.
cBenefit of expense reduction rounds to less than 0.01%.
dBenefit of waiver and payments by affiliates rounds to less than 0.01%.
| | | | |
| | | |
64 | | Annual Report | The accompanying notes are an integral part of these financial statements. | | franklintempleton.com |
FRANKLIN CUSTODIAN FUNDS
Statement of Investments, September 30, 2019
Franklin Income Fund
| | | | | | | | | | | | | | | | |
| | | Country | | | Shares | | | | | | Value | |
Common Stocks 29.5% | | | | | | | | | | | | | | | | |
Communication Services 1.3% | | | | | | | | | | | | | | | | |
aAlphabet Inc., A | | | United States | | | | 24,100 | | | | | | | $ | 29,429,474 | |
BCE Inc. | | | Canada | | | | 5,000,000 | | | | | | | | 241,939,138 | |
Verizon Communications Inc. | | | United States | | | | 10,000,200 | | | | | | | | 603,612,072 | |
Vodafone Group PLC | | | United Kingdom | | | | 50,000,000 | | | | | | | | 99,581,401 | |
| | | | | | | | | | | | | | | | |
| | | | |
| | | | | | | | | | | | | | | 974,562,085 | |
| | | | | | | | | | | | | | | | |
Consumer Discretionary 0.8% | | | | | | | | | | | | | | | | |
Daimler AG | | | Germany | | | | 5,000,000 | | | | | | | | 248,606,182 | |
Ford Motor Co. | | | United States | | | | 7,500,000 | | | | | | | | 68,700,000 | |
bGeneral Motors Co. | | | United States | | | | 8,200,000 | | | | | | | | 307,336,000 | |
| | | | | | | | | | | | | | | | |
| | | | |
| | | | | | | | | | | | | | | 624,642,182 | |
| | | | | | | | | | | | | | | | |
Consumer Staples 1.5% | | | | | | | | | | | | | | | | |
Anheuser-Busch InBev SA/NV, ADR | | | Belgium | | | | 2,500,000 | | | | | | | | 237,875,000 | |
The Coca-Cola Co. | | | United States | | | | 2,500,000 | | | | | | | | 136,100,000 | |
PepsiCo Inc. | | | United States | | | | 3,500,000 | | | | | | | | 479,850,000 | |
Philip Morris International Inc. | | | United States | | | | 2,501,700 | | | | | | | | 189,954,081 | |
Unilever PLC | | | United Kingdom | | | | 1,000,000 | | | | | | | | 60,117,661 | |
| | | | | | | | | | | | | | | | |
| | | | |
| | | | | | | | | | | | | | | 1,103,896,742 | |
| | | | | | | | | | | | | | | | |
Energy 5.8% | | | | | | | | | | | | | | | | |
Baker Hughes Co., A | | | United States | | | | 11,609,247 | | | | | | | | 269,334,530 | |
a,cChesapeake Energy Corp. | | | United States | | | | 231,000,000 | | | | | | | | 325,710,000 | |
bChevron Corp. | | | United States | | | | 3,000,000 | | | | | | | | 355,800,000 | |
Exxon Mobil Corp. | | | United States | | | | 6,500,000 | | | | | | | | 458,965,000 | |
Halliburton Co. | | | United States | | | | 15,000,000 | | | | | | | | 282,750,000 | |
Occidental Petroleum Corp. | | | United States | | | | 17,500,000 | | | | | | | | 778,225,000 | |
Royal Dutch Shell PLC, A, ADR | | | United Kingdom | | | | 15,000,000 | | | | | | | | 882,750,000 | |
Schlumberger Ltd. | | | United States | | | | 14,152,970 | | | | | | | | 483,606,985 | |
TC Energy Corp. | | | Canada | | | | 4,500,000 | | | | | | | | 233,055,000 | |
The Williams Cos. Inc. | | | United States | | | | 12,000,000 | | | | | | | | 288,720,000 | |
| | | | | | | | | | | | | | | | |
| | | | |
| | | | | | | | | | | | | | | 4,358,916,515 | |
| | | | | | | | | | | | | | | | |
Financials 4.7% | | | | | | | | | | | | | | | | |
Bank of America Corp. | | | United States | | | | 10,740,000 | | | | | | | | 313,285,800 | |
Barclays PLC | | | United Kingdom | | | | 200,000,000 | | | | | | | | 369,803,526 | |
BB&T Corp. | | | United States | | | | 3,500,000 | | | | | | | | 186,795,000 | |
JPMorgan Chase & Co. | | | United States | | | | 6,108,000 | | | | | | | | 718,850,520 | |
bMetLife Inc. | | | United States | | | | 5,341,404 | | | | | | | | 251,900,613 | |
Morgan Stanley | | | United States | | | | 5,000,000 | | | | | | | | 213,350,000 | |
Owl Rock Capital Corp. | | | United States | | | | 1,633,986 | | | | | | | | 25,767,959 | |
bWells Fargo & Co. | | | United States | | | | 28,362,229 | | | | | | | | 1,430,590,831 | |
| | | | | | | | | | | | | | | | |
| | | | |
| | | | | | | | | | | | | | | 3,510,344,249 | |
| | | | | | | | | | | | | | | | |
Health Care 5.0% | | | | | | | | | | | | | | | | |
AstraZeneca PLC | | | United Kingdom | | | | 7,500,000 | | | | | | | | 669,500,516 | |
Bayer AG | | | Germany | | | | 2,000,000 | | | | | | | | 141,011,257 | |
bBristol-Myers Squibb Co. | | | United States | | | | 12,000,000 | | | | | | | | 608,520,000 | |
bCVS Health Corp. | | | United States | | | | 7,500,000 | | | | | | | | 473,025,000 | |
bGilead Sciences Inc. | | | United States | | | | 1,000,000 | | | | | | | | 63,380,000 | |
| | | | |
| | | |
| franklintempleton.com | | Annual Report | | 65 |
FRANKLIN CUSTODIAN FUNDS
STATEMENT OF INVESTMENTS
Franklin Income Fund(continued)
| | | | | | | | | | | | | | | | |
| | | Country | | | Shares | | | | | | Value | |
Common Stocks(continued) | | | | | | | | | | | | | | | | |
Health Care(continued) | | | | | | | | | | | | | | | | |
Johnson & Johnson | | | United States | | | | 4,000,000 | | | | | | | $ | 517,520,000 | |
bMerck & Co. Inc. | | | United States | | | | 8,000,000 | | | | | | | | 673,440,000 | |
aMylan NV | | | United States | | | | 2,421,000 | | | | | | | | 47,887,380 | |
Pfizer Inc. | | | United States | | | | 15,000,000 | | | | | | | | 538,950,000 | |
| | | | | | | | | | | | | | | | |
| | | | |
| | | | | | | | | | | | | | | 3,733,234,153 | |
| | | | | | | | | | | | | | | | |
Industrials 0.9% | | | | | | | | | | | | | | | | |
3M Co. | | | United States | | | | 3,930,000 | | | | | | | | 646,092,000 | |
| | | | | | | | | | | | | | | | |
Information Technology 1.5% | | | | | | | | | | | | | | | | |
bAnalog Devices Inc. | | | United States | | | | 1,000,000 | | | | | | | | 111,730,000 | |
Intel Corp. | | | United States | | | | 6,000,000 | | | | | | | | 309,180,000 | |
bInternational Business Machines Corp. | | | United States | | | | 1,429,689 | | | | | | | | 207,905,374 | |
bTexas Instruments Inc. | | | United States | | | | 3,764,000 | | | | | | | | 486,459,360 | |
| | | | | | | | | | | | | | | | |
| | | | |
| | | | | | | | | | | | | | | 1,115,274,734 | |
| | | | | | | | | | | | | | | | |
Materials 1.8% | | | | | | | | | | | | | | | | |
BASF SE | | | Germany | | | | 11,000,000 | | | | | | | | 768,728,241 | |
BHP Group PLC | | | United Kingdom | | | | 5,000,000 | | | | | | | | 106,490,630 | |
Corteva Inc. | | | United States | | | | 1,172,674 | | | | | | | | 32,834,872 | |
Dow Inc. | | | United States | | | | 1,172,674 | | | | | | | | 55,877,916 | |
DuPont de Nemours Inc. | | | United States | | | | 1,172,674 | | | | | | | | 83,623,383 | |
Rio Tinto PLC, ADR | | | Australia | | | | 5,800,000 | | | | | | | | 302,122,000 | |
| | | | | | | | | | | | | | | | |
| | | | |
| | | | | | | | | | | | | | | 1,349,677,042 | |
| | | | | | | | | | | | | | | | |
Real Estate 0.5% | | | | | | | | | | | | | | | | |
Host Hotels & Resorts Inc. | | | United States | | | | 20,000,000 | | | | | | | | 345,800,000 | |
| | | | | | | | | | | | | | | | |
Utilities 5.7% | | | | | | | | | | | | | | | | |
Dominion Energy Inc. | | | United States | | | | 15,000,000 | | | | | | | | 1,215,600,000 | |
Duke Energy Corp. | | | United States | | | | 7,500,000 | | | | | | | | 718,950,000 | |
bSempra Energy | | | United States | | | | 4,000,000 | | | | | | | | 590,440,000 | |
bThe Southern Co. | | | United States | | | | 23,000,000 | | | | | | | | 1,420,710,000 | |
Xcel Energy Inc. | | | United States | | | | 4,500,000 | | | | | | | | 292,005,000 | |
| | | | | | | | | | | | | | | | |
| | | | |
| | | | | | | | | | | | | | | 4,237,705,000 | |
| | | | | | | | | | | | | | | | |
| | | | |
Total Common Stocks (Cost $19,082,382,338) | | | | | | | | | | | | | | | 22,000,144,702 | |
| | | | | | | | | | | | | | | | |
| | | | |
dEquity-Linked Securities 15.0% | | | | | | | | | | | | | | | | |
Communication Services 0.8% | | | | | | | | | | | | | | | | |
eGoldman Sachs International into Alphabet Inc., 7.00%, A, 144A | | | United States | | | | 285,000 | | | | | | | | 336,248,748 | |
eMorgan Stanley BV into Comcast Corp., 7.00%, A, 144A | | | United States | | | | 6,475,000 | | | | | | | | 269,857,487 | |
| | | | | | | | | | | | | | | | |
| | | | |
| | | | | | | | | | | | | | | 606,106,235 | |
| | | | | | | | | | | | | | | | |
Consumer Discretionary 2.7% | | | | | | | | | | | | | | | | |
eCitigroup Global Markets Holdings Inc. into Amazon.com Inc., 9.00%, 144A | | | United States | | | | 277,000 | | | | | | | | 490,423,698 | |
eCitigroup Global Markets Holdings Inc. into Ford Motor Co., 10.00%, 144A | | | United States | | | | 49,600,000 | | | | | | | | 461,757,747 | |
eJP Morgan Chase Financial Co. LLC into Amazon.com Inc., 9.00%, 144A | | | United States | | | | 171,000 | | | | | | | | 298,583,298 | |
eMerrill Lynch International & Co. CV into Target Corp., 8.00%, 144A | | | United States | | | | 3,075,000 | | | | | | | | 279,098,316 | |
eWells Fargo Bank NA into General Motors Co., 9.00%, 144A | | | United States | | | | 13,580,000 | | | | | | | | 506,798,770 | |
| | | | | | | | | | | | | | | | |
| | | | |
| | | | | | | | | | | | | | | 2,036,661,829 | |
| | | | | | | | | | | | | | | | |
| | | | |
| | | |
66 | | Annual Report | | franklintempleton.com |
FRANKLIN CUSTODIAN FUNDS
STATEMENT OF INVESTMENTS
Franklin Income Fund(continued)
| | | | | | | | | | | | | | | | |
| | | Country | | | Shares | | | | | | Value | |
| | | | |
dEquity-Linked Securities(continued) | | | | | | | | | | | | | | | | |
Energy 0.4% | | | | | | | | | | | | | | | | |
eWells Fargo Bank National Assn. into Occidental Petroleum Corp., 9.00%, 144A | | | United States | | | | 5,685,000 | | | | | | | $ | 300,223,037 | |
| | | | | | | | | | | | | | | | |
Financials 1.8% | | | | | | | | | | | | | | | | |
eCitigroup Global Markets Holdings Inc. into MetLife Inc., 7.50%, 144A | | | United States | | | | 5,575,000 | | | | | | | | 258,298,442 | |
eCredit Suisse AG into Bank of America Corp., 7.00%, 144A | | | United States | | | | 10,400,000 | | | | | | | | 307,262,571 | |
eRoyal Bank of Canada into MetLife Inc., 7.50%, 144A | | | United States | | | | 5,350,000 | | | | | | | | 251,199,272 | |
eSociete Generale SA into JPMorgan Chase & Co., 7.00%, 144A | | | United States | | | | 2,175,000 | | | | | | | | 258,225,781 | |
eWells Fargo Bank NA into CVS Health Corp., 9.50%, 144A | | | United States | | | | 4,600,000 | | | | | | | | 280,289,992 | |
| | | | | | | | | | | | | | | | |
| | | | |
| | | | | | | | | | | | | | | 1,355,276,058 | |
| | | | | | | | | | | | | | | | |
Health Care 1.0% | | | | | | | | | | | | | | | | |
eCitigroup Global Markets Holdings Inc. into AbbVie Inc., 10.00%, 144A | | | United States | | | | 3,520,000 | | | | | | | | 261,067,882 | |
eCredit Suisse AG into CVS Health Corp., 8.50%, 144A | | | United States | | | | 4,000,000 | | | | | | | | 244,399,500 | |
eCredit Suisse AG London into Bristol-Myers Squibb Co., 8.50%, 144A | | | United States | | | | 5,405,000 | | | | | | | | 262,768,599 | |
| | | | | | | | | | | | | | | | |
| | | | |
| | | | | | | | | | | | | | | 768,235,981 | |
| | | | | | | | | | | | | | | | |
Industrials 1.3% | | | | | | | | | | | | | | | | |
eCredit Suisse AG/London into Cummins Inc., 8.00%, 144A | | | United States | | | | 1,700,000 | | | | | | | | 281,073,247 | |
eMerrill Lynch International & Co. CV into Deere & Co., 9.00%, 144A | | | United States | | | | 2,100,000 | | | | | | | | 338,390,417 | |
eRoyal Bank of Canada into Boeing Co., 8.50%, 144A | | | United States | | | | 847,000 | | | | | | | | 314,394,408 | |
| | | | | | | | | | | | | | | | |
| | | | |
| | | | | | | | | | | | | | | 933,858,072 | |
| | | | | | | | | | | | | | | | |
Information Technology 5.9% | | | | | | | | | | | | | | | | |
eBarclays Bank PLC into Analog Devices Inc., 7.00%, 144A | | | United States | | | | 2,635,000 | | | | | | | | 277,326,354 | |
eGoldman Sachs International into Microsoft Corp., 6.50%, 144A | | | United States | | | | 4,750,000 | | | | | | | | 579,791,693 | |
eGoldman Sachs International into Texas Instruments Inc., 7.00%, 144A | | | United States | | | | 2,312,000 | | | | | | | | 287,422,381 | |
eJP Morgan Chase Financial Co. LLC into Broadcom Inc., 10.00%, 144A | | | United States | | | | 1,120,000 | | | | | | | | 303,526,132 | |
eJPMorgan Chase Bank NA into NVIDIA Corp., 10.00%, 144A | | | United States | | | | 1,786,000 | | | | | | | | 307,198,480 | |
eJPMorgan Chase Bank NA into Texas Instruments Inc., 9.00%, 144A | | | United States | | | | 2,236,000 | | | | | | | | 274,478,080 | |
eMerrill Lynch International & Co. CV into Apple Inc., 7.50%, 144A | | | United States | | | | 1,475,000 | | | | | | | | 307,083,876 | |
eMerrill Lynch International & Co. CV into Apple Inc., 8.50%, 144A | | | United States | | | | 1,725,000 | | | | | | | | 345,682,201 | |
eMerrill Lynch International & Co. CV into Applied Materials Inc., 8.50%, 144A | | | United States | | | | 6,750,000 | | | | | | | | 292,518,837 | |
eMorgan Stanley BV into Lam Research Corp., 9.00%, 144A | | | United States | | | | 1,530,000 | | | | | | | | 282,413,549 | |
eMorgan Stanley BV into Microchip Technology Inc., 9.00%, 144A | | | United States | | | | 3,325,000 | | | | | | | | 276,746,719 | |
eMorgan Stanley Finance LLC into Intel Corp., 8.50%, 144A | | | United States | | | | 7,300,000 | | | | | | | | 367,748,107 | |
eRoyal Bank of Canada into Analog Devices Inc., 8.00%, 144A | | | United States | | | | 2,230,000 | | | | | | | | 226,102,960 | |
eWells Fargo Bank National Assn. into Intel Corp., 8.00%, 144A | | | United States | | | | 5,200,000 | | | | | | | | 270,458,136 | |
| | | | | | | | | | | | | | | | |
| | | | |
| | | | | | | | | | | | | | | 4,398,497,505 | |
| | | | | | | | | | | | | | | | |
Materials 1.1% | | | | | | | | | | | | | | | | |
eBarclays Bank PLC into International Paper Co., 9.00%, 144A | | | United States | | | | 5,634,000 | | | | | | | | 230,137,266 | |
eCredit Suisse AG into Rio Tinto PLC, 10.00%, 144A | | | Australia | | | | 5,180,000 | | | | | | | | 277,218,194 | |
eUBS AG London into Newmont Goldcorp Corp., 8.00%, 144A | | | United States | | | | 7,266,000 | | | | | | | | 270,692,861 | |
| | | | | | | | | | | | | | | | |
| | | | |
| | | | | | | | | | | | | | | 778,048,321 | |
| | | | | | | | | | | | | | | | |
Total Equity-Linked Securities (Cost $10,532,415,800) | | | | | | | | | | | | | | | 11,176,907,038 | |
| | | | | | | | | | | | | | | | |
| | | | |
| | | |
| franklintempleton.com | | Annual Report | | 67 |
FRANKLIN CUSTODIAN FUNDS
STATEMENT OF INVESTMENTS
Franklin Income Fund(continued)
| | | | | | | | | | | | | | | | |
| | | Country | | | Shares | | | | | | Value | |
| | | | |
Convertible Preferred Stocks 2.1% | | | | | | | | | | | | | | | | |
Energy 0.1% | | | | | | | | | | | | | | | | |
cChesapeake Energy Corp., 5.75%, cvt. pfd | | | United States | | | | 112,980 | | | | | | | $ | 44,721,438 | |
| | | | | | | | | | | | | | | | |
Financials 1.1% | | | | | | | | | | | | | | | | |
Bank of America Corp., 7.25%, cvt. pfd., L | | | United States | | | | 435,218 | | | | | | | | 652,483,178 | |
aFNMA, 5.375%, cvt. pfd | | | United States | | | | 4,250 | | | | | | | | 188,912,500 | |
| | | | | | | | | | | | | | | | |
| | | | |
| | | | | | | | | | | | | | | 841,395,678 | |
| | | | | | | | | | | | | | | | |
Industrials 0.0%† | | | | | | | | | | | | | | | | |
Fortive Corp., 5.00%, cvt. pfd., A | | | United States | | | | 31,266 | | | | | | | | 28,205,997 | |
| | | | | | | | | | | | | | | | |
Information Technology 0.6% | | | | | | | | | | | | | | | | |
aBroadcom Inc, 8.00%, cvt. pfd., A | | | United States | | | | 420,000 | | | | | | | | 430,662,036 | |
| | | | | | | | | | | | | | | | |
Utilities 0.3% | | | | | | | | | | | | | | | | |
Sempra Energy, 6.00%, cvt. pfd., A | | | United States | | | | 400,000 | | | | | | | | 47,280,000 | |
Sempra Energy, 6.75%, cvt. pfd., B | | | United States | | | | 739,000 | | | | | | | | 86,950,740 | |
aThe Southern Co., 6.75%, cvt. pfd | | | United States | | | | 1,600,000 | | | | | | | | 85,616,000 | |
| | | | | | | | | | | | | | | | |
| | | | |
| | | | | | | | | | | | | | | 219,846,740 | |
| | | | | | | | | | | | | | | | |
| | | | |
Total Convertible Preferred Stocks (Cost $1,407,590,057) | | | | | | | | | | | | | | | 1,564,831,889 | |
| | | | | | | | | | | | | | | | |
| | | | |
Preferred Stocks 0.3% | | | | | | | | | | | | | | | | |
Financials 0.3% | | | | | | | | | | | | | | | | |
aFHLMC, 8.375%, pfd., Z | | | United States | | | | 7,632,009 | | | | | | | | 99,902,998 | |
aFNMA, 8.25%, pfd., S | | | United States | | | | 5,500,000 | | | | | | | | 73,425,000 | |
JPMorgan Chase & Co., 6.00%, pfd., EE | | | United States | | | | 3,000,000 | | | | | | | | 84,420,000 | |
| | | | | | | | | | | | | | | | |
| | | | |
Total Preferred Stocks (Cost $391,153,851) | | | | | | | | | | | | | | | 257,747,998 | |
| | | | | | | | | | | | | | | | |
| | | | |
| | | | | | Units | | | | | | | |
fIndex-Linked Notes 0.3% | | | | | | | | | | | | | | | | |
Financials 0.3% | | | | | | | | | | | | | | | | |
e,gCredit Suisse AG, senior note, 144A, 8.29%, 2/08/21 | | | United States | | | | 33,000 | | | | | | | | 96,101,323 | |
e,hMorgan Stanley Finance LLC, senior note, 144A, 6.07%, 10/03/19 | | | United States | | | | 755,000 | | | | | | | | 101,215,300 | |
| | | | | | | | | | | | | | | | |
| | | | |
Total Index-Linked Notes (Cost $199,585,600) | | | | | | | | | | | | | | | 197,316,623 | |
| | | | | | | | | | | | | | | | |
| | | | |
| | | | | | Principal Amount* | | | | | | | |
Convertible Bonds 0.4% | | | | | | | | | | | | | | | | |
Energy 0.2% | | | | | | | | | | | | | | | | |
cChesapeake Energy Corp., cvt., senior note, 5.50%, 9/15/26 | | | United States | | | | 10,000,000 | | | | | | | | 6,075,000 | |
iWeatherford International Ltd., cvt., senior note, 5.875%, 7/01/21 | | | United States | | | | 505,000,000 | | | | | | | | 178,012,500 | |
| | | | | | | | | | | | | | | | |
| | | | |
| | | | | | | | | | | | | | | 184,087,500 | |
| | | | | | | | | | | | | | | | |
Health Care 0.2% | | | | | | | | | | | | | | | | |
eBayer Capital Corp. BV, cvt., junior sub. note, 144A, 5.625%, 11/22/19 | | | Germany | | | | 150,000,000 | | | | EUR | | | | 132,593,360 | |
| | | | | | | | | | | | | | | | |
| | | | |
Total Convertible Bonds (Cost $614,311,527) | | | | | | | | | | | | | | | 316,680,860 | |
| | | | | | | | | | | | | | | | |
| | | | |
| | | |
68 | | Annual Report | | franklintempleton.com |
FRANKLIN CUSTODIAN FUNDS
STATEMENT OF INVESTMENTS
Franklin Income Fund(continued)
| | | | | | | | | | | | | | | | |
| | | Country | | | Principal Amount* | | | | | | Value | |
| | | | |
Corporate Bonds 36.2% | | | | | | | | | | | | | | | | |
Communication Services 5.4% | | | | | | | | | | | | | | | | |
AMC Entertainment Holdings Inc., | | | | | | | | | | | | | | | | |
senior sub. bond, 5.75%, 6/15/25 | | | United States | | | | 37,325,000 | | | | | | | $ | 35,716,293 | |
senior sub. note, 5.875%, 11/15/26 | | | United States | | | | 59,300,000 | | | | | | | | 54,165,658 | |
AT&T Inc., | | | | | | | | | | | | | | | | |
senior bond, 4.125%, 2/17/26 | | | United States | | | | 100,000,000 | | | | | | | | 108,088,762 | |
senior note, 3.00%, 6/30/22 | | | United States | | | | 100,000,000 | | | | | | | | 102,153,870 | |
CCO Holdings LLC/CCO Holdings Capital Corp., | | | | | | | | | | | | | | | | |
senior bond, 5.125%, 2/15/23 | | | United States | | | | 105,000,000 | | | | | | | | 106,968,750 | |
senior bond, 5.75%, 9/01/23 | | | United States | | | | 67,000,000 | | | | | | | | 68,507,500 | |
senior bond, 5.75%, 1/15/24 | | | United States | | | | 105,000,000 | | | | | | | | 107,625,000 | |
esenior bond, 144A, 5.50%, 5/01/26 | | | United States | | | | 60,000,000 | | | | | | | | 62,994,000 | |
esenior bond, 144A, 5.125%, 5/01/27 | | | United States | | | | 50,000,000 | | | | | | | | 52,312,500 | |
Comcast Corp., senior note, 3.95%, 10/15/25 | | | United States | | | | 50,000,000 | | | | | | | | 54,481,472 | |
eDiamond Sports Group LLC/Diamond Sports Finance Co., first lien, 144A, 5.375%, 8/15/26 | | | United States | | | | 40,000,000 | | | | | | | | 41,600,000 | |
senior note, 144A, 6.625%, 8/15/27 | | | United States | | | | 50,000,000 | | | | | | | | 51,927,500 | |
DISH DBS Corp., | | | | | | | | | | | | | | | | |
senior bond, 5.875%, 7/15/22 | | | United States | | | | 391,500,000 | | | | | | | | 408,628,125 | |
senior bond, 5.00%, 3/15/23 | | | United States | | | | 300,000,000 | | | | | | | | 304,215,000 | |
senior note, 5.875%, 11/15/24 | | | United States | | | | 128,200,000 | | | | | | | | 127,559,000 | |
Netflix Inc., | | | | | | | | | | | | | | | | |
senior bond, 4.375%, 11/15/26 | | | United States | | | | 105,000,000 | | | | | | | | 106,632,750 | |
senior bond, 4.875%, 4/15/28 | | | United States | | | | 84,300,000 | | | | | | | | 85,981,785 | |
senior bond, 5.875%, 11/15/28 | | | United States | | | | 60,000,000 | | | | | | | | 65,328,000 | |
esenior bond, 144A, 6.375%, 5/15/29 | | | United States | | | | 40,000,000 | | | | | | | | 44,200,000 | |
eSirius XM Radio Inc., senior note, 144A, 4.625%, 5/15/23 | | | United States | | | | 88,400,000 | | | | | | | | 90,530,440 | |
Sprint Communications Inc., | | | | | | | | | | | | | | | | |
senior bond, 11.50%, 11/15/21 | | | United States | | | | 200,000,000 | | | | | | | | 233,250,000 | |
senior note, 7.00%, 8/15/20 | | | United States | | | | 102,500,000 | | | | | | | | 106,057,775 | |
senior note, 6.00%, 11/15/22 | | | United States | | | | 367,700,000 | | | | | | | | 391,600,500 | |
Sprint Corp., | | | | | | | | | | | | | | | | |
senior bond, 7.875%, 9/15/23 | | | United States | | | | 187,350,000 | | | | | | | | 206,264,856 | |
senior bond, 7.125%, 6/15/24 | | | United States | | | | 190,650,000 | | | | | | | | 205,959,195 | |
senior note, 7.625%, 3/01/26 | | | United States | | | | 96,300,000 | | | | | | | | 106,531,875 | |
eSprint Spectrum Co. LLC, senior secured bond, first lien, 144A, 5.152%, 9/20/29 | | | United States | | | | 220,000,000 | | | | | | | | 239,250,000 | |
eUnivision Communications Inc., | | | | | | | | | | | | | | | | |
senior secured note, first lien, 144A, 5.125%, 5/15/23 | | | United States | | | | 175,000,000 | | | | | | | | 175,437,500 | |
senior secured note, first lien, 144A, 5.125%, 2/15/25 | | | United States | | | | 160,020,000 | | | | | | | | 156,219,525 | |
Verizon Communications Inc., | | | | | | | | | | | | | | | | |
senior bond, 3.50%, 11/01/24 | | | United States | | | | 50,000,000 | | | | | | | | 52,910,460 | |
senior bond, 2.625%, 8/15/26 | | | United States | | | | 25,000,000 | | | | | | | | 25,345,889 | |
| | | | | | | | | | | | | | | | |
| | | | |
| | | | | | | | | | | | | | | 3,978,443,980 | |
| | | | | | | | | | | | | | | | |
| | | | |
| | | |
| franklintempleton.com | | | Annual Report | | 69 |
FRANKLIN CUSTODIAN FUNDS
STATEMENT OF INVESTMENTS
Franklin Income Fund(continued)
| | | | | | | | | | | | | | | | |
| | | Country | | | Principal Amount* | | | | | | Value | |
| | | | |
Corporate Bonds(continued) | | | | | | | | | | | | | | | | |
Consumer Discretionary 2.4% | | | | | | | | | | | | | | | | |
e24 Hour Holdings III LLC, senior note, 144A, 8.00%, 6/01/22 | | | United States | | | | 162,959,000 | | | | | | | $ | 136,274,464 | |
Alibaba Group Holding Ltd., senior note, 3.40%, 12/06/27 | | | China | | | | 50,000,000 | | | | | | | | 52,000,250 | |
eAllison Transmission Inc., senior bond, 144A, 5.875%, 6/01/29 | | | United States | | | | 45,000,000 | | | | | | | | 48,937,500 | |
Ford Motor Co., | | | | | | | | | | | | | | | | |
senior bond, 4.75%, 1/15/43 | | | United States | | | | 67,500,000 | | | | | | | | 58,620,931 | |
senior note, 4.346%, 12/08/26 | | | United States | | | | 140,000,000 | | | | | | | | 140,336,784 | |
Ford Motor Credit Co. LLC, senior note, 3.336%, 3/18/21 | | | United States | | | | 48,000,000 | | | | | | | | 48,236,501 | |
senior note, 4.134%, 8/04/25 | | | United States | | | | 145,000,000 | | | | | | | | 143,597,035 | |
senior note, 4.389%, 1/08/26 | | | United States | | | | 16,365,000 | | | | | | | | 16,302,056 | |
senior note, 5.113%, 5/03/29 | | | United States | | | | 115,000,000 | | | | | | | | 115,932,135 | |
General Motors Co., senior bond, 5.15%, 4/01/38 | | | United States | | | | 165,000,000 | | | | | | | | 166,900,219 | |
General Motors Financial Co. Inc., senior note, 4.15%, 6/19/23 | | | United States | | | | 75,000,000 | | | | | | | | 78,040,433 | |
eGolden Nugget Inc., senior note, 144A, 6.75%, 10/15/24 | | | United States | | | | 60,000,000 | | | | | | | | 61,650,000 | |
eHanesbrands Inc., | | | | | | | | | | | | | | | | |
senior bond, 144A, 4.875%, 5/15/26 | | | United States | | | | 54,000,000 | | | | | | | | 57,321,000 | |
senior note, 144A, 4.625%, 5/15/24 | | | United States | | | | 38,000,000 | | | | | | | | 40,232,880 | |
MGM Resorts International, senior note, 5.50%, 4/15/27 | | | United States | | | | 75,000,000 | | | | | | | | 82,376,250 | |
eShea Homes LP/Shea Homes Funding Corp., | | | | | | | | | | | | | | | | |
senior bond, 144A, 6.125%, 4/01/25 | | | United States | | | | 100,500,000 | | | | | | | | 103,515,000 | |
senior note, 144A, 5.875%, 4/01/23 | | | United States | | | | 100,975,000 | | | | | | | | 103,751,812 | |
eWynn Las Vegas LLC/Wynn Las Vegas Capital Corp., | | | | | | | | | | | | | | | | |
senior bond, 144A, 4.25%, 5/30/23 | | | United States | | | | 84,000,000 | | | | | | | | 86,625,000 | |
senior bond, 144A, 5.50%, 3/01/25 | | | United States | | | | 147,500,000 | | | | | | | | 155,243,750 | |
senior bond, 144A, 5.25%, 5/15/27 | | | United States | | | | 99,827,000 | | | | | | | | 102,697,026 | |
| | | | | | | | | | | | | | | | |
| | | | |
| | | | | | | | | | | | | | | 1,798,591,026 | |
| | | | | | | | | | | | | | | | |
Consumer Staples 0.9% | | | | | | | | | | | | | | | | |
Anheuser-Busch Cos. LLC/InBev Worldwide Inc., senior bond, 4.90%, 2/01/46 | | | Belgium | | | | 25,000,000 | | | | | | | | 29,786,319 | |
Anheuser-Busch InBev Worldwide Inc., senior bond, 4.00%, 4/13/28 | | | Belgium | | | | 25,000,000 | | | | | | | | 27,621,965 | |
BAT Capital Corp., | | | | | | | | | | | | | | | | |
senior note, 3.222%, 8/15/24 | | | United Kingdom | | | | 88,500,000 | | | | | | | | 89,629,967 | |
senior note, 3.557%, 8/15/27 | | | United Kingdom | | | | 170,000,000 | | | | | | | | 171,094,239 | |
Kraft Heinz Foods Co., | | | | | | | | | | | | | | | | |
senior bond, 3.95%, 7/15/25 | | | United States | | | | 60,000,000 | | | | | | | | 62,859,380 | |
senior bond, 4.625%, 1/30/29 | | | United States | | | | 40,000,000 | | | | | | | | 43,342,302 | |
ePost Holdings Inc., | | | | | | | | | | | | | | | | |
senior bond, 144A, 5.00%, 8/15/26 | | | United States | | | | 87,000,000 | | | | | | | | 90,553,950 | |
senior bond, 144A, 5.625%, 1/15/28 | | | United States | | | | 65,000,000 | | | | | | | | 69,143,750 | |
Walmart Inc., senior note, 3.40%, 6/26/23 | | | United States | | | | 50,000,000 | | | | | | | | 52,678,005 | |
senior note, 3.55%, 6/26/25 | | | United States | | | | 50,000,000 | | | | | | | | 54,026,280 | |
| | | | | | | | | | | | | | | | |
| | | | |
| | | | | | | | | | | | | | | 690,736,157 | |
| | | | | | | | | | | | | | | | |
| | | | |
| | | |
70 | | Annual Report | | franklintempleton.com |
FRANKLIN CUSTODIAN FUNDS
STATEMENT OF INVESTMENTS
Franklin Income Fund(continued)
| | | | | | | | | | | | | | | | |
| | | Country | | | Principal Amount* | | | | | | Value | |
Corporate Bonds(continued) | | | | | | | | | | | | | | | | |
Energy 5.2% | | | | | | | | | | | | | | | | |
Antero Resources Corp., | | | | | | | | | | | | | | | | |
senior note, 5.125%, 12/01/22 | | | United States | | | | 35,000,000 | | | | | | | $ | 30,887,500 | |
jsenior note, 5.625%, 6/01/23 | | | United States | | | | 42,000,000 | | | | | | | | 36,540,000 | |
eAscent Resources Utica Holdings LLC/ARU Finance Corp., senior note, 144A, 10.00%, 4/01/22 | | | United States | | | | 79,490,000 | | | | | | | | 79,863,603 | |
Brazos Valley Longhorn LLC/Brazos Valley Longhorn Finance Corp., senior note, 6.875%, 2/01/25 | | | United States | | | | 92,181,000 | | | | | | | | 79,967,018 | |
Calumet Specialty Products Partners LP/Calumet Finance Corp., | | | | | | | | | | | | | | | | |
senior note, 6.50%, 4/15/21 | | | United States | | | | 446,754,000 | | | | | | | | 447,290,105 | |
jsenior note, 7.625%, 1/15/22 | | | United States | | | | 161,165,000 | | | | | | | | 156,330,050 | |
jsenior note, 7.75%, 4/15/23 | | | United States | | | | 127,085,000 | | | | | | | | 118,506,763 | |
e,ksenior note, 144A, 11.00%, 4/15/25 | | | United States | | | | 285,000,000 | | | | | | | | 285,712,500 | |
cChesapeake Energy Corp., | | | | | | | | | | | | | | | | |
senior bond, 8.00%, 6/15/27 | | | United States | | | | 200,000,000 | | | | | | | | 135,500,000 | |
senior note, 7.00%, 10/01/24 | | | United States | | | | 295,143,000 | | | | | | | | 212,871,889 | |
senior note, 8.00%, 1/15/25 | | | United States | | | | 545,000,000 | | | | | | | | 396,487,500 | |
senior note, 7.50%, 10/01/26 | | | United States | | | | 129,200,000 | | | | | | | | 88,502,000 | |
esenior note, 144A, 8.00%, 3/15/26 | | | United States | | | | 650,000,000 | | | | | | | | 448,500,000 | |
eCNX Resources Corp., senior note, 144A, 7.25%, 3/14/27 | | | United States | | | | 85,000,000 | | | | | | | | 70,975,000 | |
HighPoint Operating Corp., | | | | | | | | | | | | | | | | |
senior bond, 7.00%, 10/15/22 | | | United States | | | | 205,783,000 | | | | | | | | 187,262,530 | |
senior note, 8.75%, 6/15/25 | | | United States | | | | 175,845,000 | | | | | | | | 158,260,500 | |
Kinder Morgan Inc., | | | | | | | | | | | | | | | | |
senior bond, 7.75%, 1/15/32 | | | United States | | | | 118,000,000 | | | | | | | | 162,597,886 | |
esenior secured bond, first lien, 144A, 5.625%, 11/15/23 | | | United States | | | | 86,200,000 | | | | | | | | 95,796,033 | |
Matador Resources Co., senior note, 5.875%, 9/15/26 | | | United States | | | | 72,000,000 | | | | | | | | 72,496,800 | |
Sunoco LP/Sunoco Finance Corp., senior note, 5.50%, 2/15/26 | | | United States | | | | 74,775,000 | | | | | | | | 78,227,362 | |
Valaris PLC, | | | | | | | | | | | | | | | | |
senior bond, 5.75%, 10/01/44 | | | United States | | | | 50,000,000 | | | | | | | | 21,625,000 | |
senior note, 7.75%, 2/01/26 | | | United States | | | | 50,000,000 | | | | | | | | 27,010,000 | |
i Weatherford International Ltd., | | | | | | | | | | | | | | | | |
senior bond, 4.50%, 4/15/22 | | | United States | | | | 185,250,000 | | | | | | | | 64,374,375 | |
senior note, 5.125%, 9/15/20 | | | United States | | | | 131,343,000 | | | | | | | | 45,970,050 | |
senior note, 7.75%, 6/15/21 | | | United States | | | | 605,829,000 | | | | | | | | 219,613,012 | |
senior note, 8.25%, 6/15/23 | | | United States | | | | 226,600,000 | | | | | | | | 81,576,000 | |
senior note, 9.875%, 2/18/24 | | | United States | | | | 105,200,000 | | | | | | | | 38,135,000 | |
The Williams Cos. Inc., senior note, 4.55%, 6/24/24 | | | United States | | | | 46,858,000 | | | | | | | | 50,483,891 | |
| | | | | | | | | | | | | | | | |
| | | | |
| | | | | | | | | | | | | | | 3,891,362,367 | |
| | | | | | | | | | | | | | | | |
Financials 5.4% | | | | | | | | | | | | | | | | |
eAshtead Capital Inc., secured bond, second lien, 144A, 4.375%, 8/15/27 | | | United Kingdom | | | | 42,500,000 | | | | | | | | 43,760,337 | |
Bank of America Corp., | | | | | | | | | | | | | | | | |
ljunior sub. bond, AA, 6.10% to 3/17/25, FRN thereafter, Perpetual | | | United States | | | | 80,000,000 | | | | | | | | 87,457,200 | |
ljunior sub. bond, U, 5.20% to 6/01/23, FRN thereafter, Perpetual | | | United States | | | | 75,000,000 | | | | | | | | 77,491,125 | |
ljunior sub. bond, X, 6.25% to 9/05/24, FRN thereafter, Perpetual | | | United States | | | | 85,000,000 | | | | | | | | 92,857,230 | |
senior bond, 3.419% to 12/20/27, FRN thereafter, 12/20/28 | | | United States | | | | 135,000,000 | | | | | | | | 140,977,201 | |
senior note, 3.004% to 12/20/22, FRN thereafter, 12/20/23 | | | United States | | | | 100,000,000 | | | | | | | | 102,184,099 | |
| | | | |
| | | |
| franklintempleton.com | | Annual Report | | 71 |
FRANKLIN CUSTODIAN FUNDS
STATEMENT OF INVESTMENTS
Franklin Income Fund(continued)
| | | | | | | | | | | | | | | | |
| | | Country | | | Principal Amount* | | | | | | Value | |
| | | | |
Corporate Bonds(continued) | | | | | | | | | | | | | | | | |
Financials(continued) | | | | | | | | | | | | | | | | |
Barclays PLC, | | | | | | | | | | | | | | | | |
senior note, 3.65%, 3/16/25 | | | United Kingdom | | | | 50,000,000 | | | | | | | $ | 51,340,750 | |
senior note, 4.375%, 1/12/26 | | | United Kingdom | | | | 125,000,000 | | | | | | | | 132,360,625 | |
senior note, 4.61% to 2/14/22, FRN thereafter, 2/15/23 | | | United Kingdom | | | | 50,000,000 | | | | | | | | 51,909,500 | |
senior note, 3.932% to 5/07/24, FRN thereafter, 5/07/25 | | | United Kingdom | | | | 50,000,000 | | | | | | | | 51,646,750 | |
Capital One Financial Corp., | | | | | | | | | | | | | | | | |
senior sub. note, 4.20%, 10/29/25 | | | United States | | | | 123,000,000 | | | | | | | | 131,192,056 | |
sub. note, 3.75%, 7/28/26 | | | United States | | | | 110,200,000 | | | | | | | | 114,707,560 | |
Citigroup Inc., | | | | | | | | | | | | | | | | |
ljunior sub. bond, 5.35% to 5/15/23, FRN thereafter, Perpetual | | | United States | | | | 156,195,000 | | | | | | | | 159,361,073 | |
ljunior sub. bond, 5.90% to 2/15/23, FRN thereafter, Perpetual | | | United States | | | | 30,400,000 | | | | | | | | 31,637,736 | |
ljunior sub. bond, 5.95% to 1/30/23, FRN thereafter, Perpetual | | | United States | | | | 209,000,000 | | | | | | | | 213,544,391 | |
ljunior sub. bond, M, 6.30% to 5/15/24, FRN thereafter, Perpetual | | | United States | | | | 217,300,000 | | | | | | | | 230,997,505 | |
ljunior sub. bond, O, 5.875% to 3/27/20, FRN thereafter, Perpetual | | | United States | | | | 177,000,000 | | | | | | | | 178,609,815 | |
ljunior sub. bond, Q, 5.95% to 8/15/20, FRN thereafter, Perpetual | | | United States | | | | 120,000,000 | | | | | | | | 122,555,400 | |
sub. bond, 4.125%, 7/25/28 | | | United States | | | | 165,000,000 | | | | | | | | 177,793,353 | |
sub. note, 3.50%, 5/15/23 | | | United States | | | | 45,000,000 | | | | | | | | 46,664,238 | |
The Goldman Sachs Group Inc., | | | | | | | | | | | | | | | | |
senior note, 3.50%, 11/16/26 | | | United States | | | | 65,000,000 | | | | | | | | 67,665,270 | |
senior note, 2.876% to 10/31/21, FRN thereafter, 10/31/22 | | | United States | | | | 125,000,000 | | | | | | | | 126,477,995 | |
senior note, 3.272% to 9/29/24, FRN thereafter, 9/29/25 | | | United States | | | | 100,000,000 | | | | | | | | 103,285,010 | |
HSBC Holdings PLC, | | | | | | | | | | | | | | | | |
senior note, 3.40%, 3/08/21 | | | United Kingdom | | | | 25,000,000 | | | | | | | | 25,386,625 | |
senior note, 4.292% to 9/12/25, FRN thereafter, 9/12/26 | | | United Kingdom | | | | 125,000,000 | | | | | | | | 134,219,375 | |
lJPMorgan Chase & Co., | | | | | | | | | | | | | | | | |
junior sub. bond, 6.125% to 4/30/24, FRN thereafter, Perpetual | | | United States | | | | 60,000,000 | | | | | | | | 65,057,100 | |
junior sub. bond, 6.75% to 2/01/24, FRN thereafter, Perpetual | | | United States | | | | 100,000,000 | | | | | | | | 111,071,500 | |
mjunior sub. bond, FRN, 5.736%,(3-month USD LIBOR + 3.47%), Perpetual | | | United States | | | | 369,616,000 | | | | | | | | 371,910,207 | |
junior sub. bond, Q, 5.15% to 5/01/23, FRN thereafter, Perpetual | | | United States | | | | 100,000,000 | | | | | | | | 102,946,500 | |
junior sub. bond, R, 6.00% to 8/01/23, FRN thereafter, Perpetual | | | United States | | | | 105,000,000 | | | | | | | | 112,274,925 | |
junior sub. bond, V, 5.00% to 7/30/19, FRN thereafter, Perpetual | | | United States | | | | 200,000,000 | | | | | | | | 200,250,000 | |
junior sub. bond, X, 6.10% to 10/01/24, FRN thereafter, Perpetual | | | United States | | | | 80,000,000 | | | | | | | | 86,793,200 | |
lMorgan Stanley, junior sub. bond, 5.55% to 7/15/20, FRN thereafter, Perpetual | | | United States | | | | 58,000,000 | | | | | | | | 58,816,640 | |
Prudential Financial Inc., junior sub. bond, 5.70% to 9/15/28, FRN thereafter, 9/15/48 | | | United States | | | | 100,000,000 | | | | | | | | 110,992,000 | |
lWells Fargo & Co., junior sub. bond, S, 5.90% to 6/15/24, FRN thereafter, Perpetual | | | United States | | | | 125,000,000 | | | | | | | | 134,269,062 | |
| | | | | | | | | | | | | | | | |
| | | | |
| | | | | | | | | | | | | | | 4,050,463,353 | |
| | | | | | | | | | | | | | | | |
Health Care 12.7% | | | | | | | | | | | | | | | | |
AbbVie Inc., | | | | | | | | | | | | | | | | |
senior bond, 3.20%, 5/14/26 | | | United States | | | | 35,000,000 | | | | | | | | 35,668,409 | |
senior note, 2.90%, 11/06/22 | | | United States | | | | 35,000,000 | | | | | | | | 35,695,575 | |
| | | | |
| | | |
72 | | Annual Report | | franklintempleton.com |
FRANKLIN CUSTODIAN FUNDS
STATEMENT OF INVESTMENTS
Franklin Income Fund(continued)
| | | | | | | | | | | | | | | | |
| | | Country | | | Principal Amount* | | | | | | Value | |
| | | | |
Corporate Bonds(continued) | | | | | | | | | | | | | | | | |
Health Care(continued) | | | | | | | | | | | | | | | | |
Allergan Funding SCS, senior bond, 3.80%, 3/15/25 | | | United States | | | | 100,000,000 | | | | | | | $ | 104,641,700 | |
AstraZeneca PLC, | | | | | | | | | | | | | | | | |
senior note, 2.375%, 11/16/20 | | | United Kingdom | | | | 25,000,000 | | | | | | | | 25,082,125 | |
senior note, 2.375%, 6/12/22 | | | United Kingdom | | | | 31,500,000 | | | | | | | | 31,700,497 | |
eBausch Health Americas Inc., senior note, 144A, 9.25%, 4/01/26 | | | United States | | | | 200,000,000 | | | | | | | | 227,748,000 | |
e Bausch Health Cos. Inc., | | | | | | | | | | | | | | | | |
senior bond, 144A, 6.125%, 4/15/25 | | | United States | | | | 122,400,000 | | | | | | | | 127,296,000 | |
senior bond, 144A, 7.25%, 5/30/29 | | | United States | | | | 40,000,000 | | | | | | | | 43,792,000 | |
senior note, 144A, 5.50%, 3/01/23 | | | United States | | | | 70,526,000 | | | | | | | | 71,672,047 | |
senior note, 144A, 5.875%, 5/15/23 | | | United States | | | | 407,700,000 | | | | | | | | 414,325,125 | |
senior note, 144A, 9.00%, 12/15/25 | | | United States | | | | 105,000,000 | | | | | | | | 118,256,250 | |
senior note, 144A, 8.50%, 1/31/27 | | | United States | | | | 50,000,000 | | | | | | | | 56,240,000 | |
senior note, 144A, 7.00%, 1/15/28 | | | United States | | | | 40,000,000 | | | | | | | | 43,184,000 | |
senior note, first lien, 144A, 7.00%, 3/15/24 | | | United States | | | | 77,300,000 | | | | | | | | 81,432,458 | |
senior secured note, first lien, 144A, 6.50%, 3/15/22 | | | United States | | | | 50,500,000 | | | | | | | | 52,267,500 | |
senior secured note, first lien, 144A, 5.50%, 11/01/25 | | | United States | | | | 91,000,000 | | | | | | | | 95,559,100 | |
eBayer U.S. Finance II LLC, senior note, 144A, 4.25%, 12/15/25 | | | Germany | | | | 75,000,000 | | | | | | | | 80,133,488 | |
e Bristol-Myers Squibb Co., | | | | | | | | | | | | | | | | |
senior bond, 144A, 3.40%, 7/26/29 | | | United States | | | | 60,000,000 | | | | | | | | 64,208,192 | |
senior bond, 144A, 4.25%, 10/26/49 | | | United States | | | | 40,000,000 | | | | | | | | 46,649,310 | |
CHS/Community Health Systems Inc., | | | | | | | | | | | | | | | | |
senior note, 7.125%, 7/15/20 | | | United States | | | | 39,980,000 | | | | | | | | 38,580,700 | |
senior note, 6.875%, 2/01/22 | | | United States | | | | 1,961,775,000 | | | | | | | | 1,498,305,656 | |
esenior note, 144A, 9.875%, 6/30/23 | | | United States | | | | 1,425,000,000 | | | | | | | | 1,218,375,000 | |
esenior note, 144A, 8.125%, 6/30/24 | | | United States | | | | 716,006,000 | | | | | | | | 571,014,785 | |
esenior secured note, 144A, 8.00%, 3/15/26 | | | United States | | | | 50,000,000 | | | | | | | | 50,000,000 | |
senior secured note, first lien, 6.25%, 3/31/23 | | | United States | | | | 330,000,000 | | | | | | | | 329,043,000 | |
Cigna Corp., | | | | | | | | | | | | | | | | |
senior note, 3.75%, 7/15/23 | | | United States | | | | 60,000,000 | | | | | | | | 62,801,632 | |
senior note, 4.125%, 11/15/25 | | | United States | | | | 60,000,000 | | | | | | | | 64,692,764 | |
CVS Health Corp., | | | | | | | | | | | | | | | | |
senior bond, 4.30%, 3/25/28 | | | United States | | | | 125,000,000 | | | | | | | | 135,314,582 | |
senior bond, 5.05%, 3/25/48 | | | United States | | | | 75,000,000 | | | | | | | | 85,426,876 | |
senior note, 4.10%, 3/25/25 | | | United States | | | | 75,000,000 | | | | | | | | 80,136,387 | |
DaVita Inc., | | | | | | | | | | | | | | | | |
senior bond, 5.125%, 7/15/24 | | | United States | | | | 190,700,000 | | | | | | | | 194,275,625 | |
senior bond, 5.00%, 5/01/25 | | | United States | | | | 129,500,000 | | | | | | | | 129,500,000 | |
e Endo DAC/Endo Finance LLC/Endo Finco Inc., | | | | | | | | | | | | | | | | |
senior bond, 144A, 6.00%, 2/01/25 | | | United States | | | | 82,900,000 | | | | | | | | 49,118,250 | |
senior note, 144A, 6.00%, 7/15/23 | | | United States | | | | 162,025,000 | | | | | | | | 100,188,159 | |
HCA Inc., | | | | | | | | | | | | | | | | |
senior bond, 5.875%, 5/01/23 | | | United States | | | | 110,000,000 | | | | | | | | 121,275,000 | |
senior bond, 5.625%, 9/01/28 | | | United States | | | | 127,500,000 | | | | | | | | 142,392,000 | |
senior note, 7.50%, 2/15/22 | | | United States | | | | 70,000,000 | | | | | | | | 77,756,000 | |
senior secured note, first lien, 5.00%, 3/15/24 | | | United States | | | | 124,800,000 | | | | | | | | 136,425,351 | |
| | | | |
| | | |
| franklintempleton.com | | Annual Report | | 73 |
FRANKLIN CUSTODIAN FUNDS
STATEMENT OF INVESTMENTS
Franklin Income Fund(continued)
| | | | | | | | | | | | | | | | |
| | | Country | | | Principal Amount* | | | | | | Value | |
| | | | |
Corporate Bonds(continued) | | | | | | | | | | | | | | | | |
Health Care(continued) | | | | | | | | | | | | | | | | |
e Mallinckrodt International Finance SA/Mallinckrodt CB LLC, | | | | | | | | | | | | | | | | |
senior note, 144A, 4.875%, 4/15/20 | | | United States | | | | 184,252,000 | | | | | | | $ | 115,157,500 | |
senior note, 144A, 5.75%, 8/01/22 | | | United States | | | | 263,610,000 | | | | | | | | 98,853,750 | |
senior note, 144A, 5.625%, 10/15/23 | | | United States | | | | 285,350,000 | | | | | | | | 95,592,250 | |
senior note, 144A, 5.50%, 4/15/25 | | | United States | | | | 137,500,000 | | | | | | | | 41,250,000 | |
Mylan NV, senior note, 3.95%, 6/15/26 | | | United States | | | | 150,000,000 | | | | | | | | 155,286,750 | |
ePar Pharmaceutical Inc., senior secured note, 144A, 7.50%, 4/01/27 | | | United States | | | | 90,000,000 | | | | | | | | 82,125,000 | |
Tenet Healthcare Corp., | | | | | | | | | | | | | | | | |
secured note, second lien, 5.125%, 5/01/25 | | | United States | | | | 133,300,000 | | | | | | | | 135,472,790 | |
senior note, 8.125%, 4/01/22 | | | United States | | | | 883,311,000 | | | | | | | | 959,496,574 | |
senior note, 6.75%, 6/15/23 | | | United States | | | | 565,000,000 | | | | | | | | 595,470,450 | |
senior note, 7.00%, 8/01/25 | | | United States | | | | 155,000,000 | | | | | | | | 158,203,850 | |
senior note, 6.875%, 11/15/31 | | | United States | | | | 48,840,000 | | | | | | | | 44,688,600 | |
esenior note, second lien, 144A, 6.25%, 2/01/27 | | | United States | | | | 50,000,000 | | | | | | | | 52,057,500 | |
senior secured note, first lien, 4.625%, 7/15/24 | | | United States | | | | 95,200,000 | | | | | | | | 98,294,000 | |
| | | | | | | | | | | | | | | | |
| | | | |
| | | | | | | | | | | | | | | 9,472,122,557 | |
| | | | | | | | | | | | | | | | |
Industrials 0.5% | | | | | | | | | | | | | | | | |
United Rentals North America Inc., | | | | | | | | | | | | | | | | |
senior bond, 4.875%, 1/15/28 | | | United States | | | | 116,000,000 | | | | | | | | 121,075,000 | |
senior note, 6.50%, 12/15/26 | | | United States | | | | 40,000,000 | | | | | | | | 43,730,000 | |
United Technologies Corp., | | | | | | | | | | | | | | | | |
senior bond, 4.50%, 6/01/42 | | | United States | | | | 40,000,000 | | | | | | | | 48,072,623 | |
senior note, 3.95%, 8/16/25 | | | United States | | | | 25,000,000 | | | | | | | | 27,388,627 | |
senior note, 3.125%, 5/04/27 | | | United States | | | | 40,000,000 | | | | | | | | 42,020,251 | |
eXPO Logistics Inc., senior note, 144A, 6.50%, 6/15/22 | | | United States | | | | 50,000,000 | | | | | | | | 51,000,000 | |
| | | | | | | | | | | | | | | | |
| | | | |
| | | | | | | | | | | | | | | 333,286,501 | |
| | | | | | | | | | | | | | | | |
Information Technology 0.5% | | | | | | | | | | | | | | | | |
Broadcom Corp./Broadcom Cayman Finance Ltd., senior bond, 3.50%, 1/15/28 | | | United States | | | | 40,000,000 | | | | | | | | 39,062,937 | |
eCommScope Inc., senior bond, 144A, 5.50%, 6/15/24 | | | United States | | | | 80,000,000 | | | | | | | | 75,574,400 | |
e Dell International LLC/EMC Corp., | | | | | | | | | | | | | | | | |
senior secured note, first lien, 144A, 5.45%, 6/15/23 | | | United States | | | | 60,000,000 | | | | | | | | 65,374,467 | |
senior secured note, first lien, 144A, 4.90%, 10/01/26 | | | United States | | | | 65,000,000 | | | | | | | | 69,687,259 | |
Microchip Technology Inc., senior secured note, 4.333%, 6/01/23 | | | United States | | | | 69,000,000 | | | | | | | | 72,514,336 | |
NCR Corp., | | | | | | | | | | | | | | | | |
senior note, 5.00%, 7/15/22 | | | United States | | | | 40,000,000 | | | | | | | | 40,650,000 | |
senior note, 6.375%, 12/15/23 | | | United States | | | | 35,000,000 | | | | | | | | 36,050,000 | |
| | | | | | | | | | | | | | | | |
| | | | |
| | | | | | | | | | | | | | | 398,913,399 | |
| | | | | | | | | | | | | | | | |
Materials 1.4% | | | | | | | | | | | | | | | | |
Ball Corp., senior bond, 4.00%, 11/15/23 | | | United States | | | | 60,000,000 | | | | | | | | 62,925,000 | |
eCemex Finance LLC, senior secured note, first lien, 144A, 6.00%, 4/01/24 | | | Mexico | | | | 88,400,000 | | | | | | | | 91,037,414 | |
e Cemex SAB de CV, | | | | | | | | | | | | | | | | |
senior secured bond, 144A, 7.75%, 4/16/26 | | | Mexico | | | | 55,100,000 | | | | | | | | 59,929,239 | |
senior secured bond, first lien, 144A, 5.70%, 1/11/25 | | | Mexico | | | | 70,000,000 | | | | | | | | 72,108,750 | |
| | | | |
| | | |
74 | | Annual Report | | franklintempleton.com |
FRANKLIN CUSTODIAN FUNDS
STATEMENT OF INVESTMENTS
Franklin Income Fund(continued)
| | | | | | | | | | | | | | | | |
| | | Country | | | Principal Amount* | | | | | | Value | |
| | | | |
Corporate Bonds(continued) | | | | | | | | | | | | | | | | |
Materials(continued) | | | | | | | | | | | | | | | | |
DuPont de Nemours Inc., senior note, 4.493%, 11/15/25 | | | United States | | | | 50,000,000 | | | | | | | $ | 55,271,405 | |
eFMG Resources (August 2006) Pty. Ltd., | | | | | | | | | | | | | | | | |
senior note, 144A, 4.75%, 5/15/22 | | | Australia | | | | 40,200,000 | | | | | | | | 41,355,750 | |
senior note, 144A, 5.125%, 3/15/23 | | | Australia | | | | 25,000,000 | | | | | | | | 25,843,750 | |
senior note, 144A, 5.125%, 5/15/24 | | | Australia | | | | 60,540,000 | | | | | | | | 63,134,139 | |
Freeport-McMoRan Inc., | | | | | | | | | | | | | | | | |
senior bond, 3.875%, 3/15/23 | | | United States | | | | 50,000,000 | | | | | | | | 50,500,000 | |
senior bond, 5.25%, 9/01/29 | | | United States | | | | 40,000,000 | | | | | | | | 39,991,600 | |
International Paper Co., | | | | | | | | | | | | | | | | |
senior bond, 3.00%, 2/15/27 | | | United States | | | | 50,000,000 | | | | | | | | 50,929,819 | |
senior bond, 4.40%, 8/15/47 | | | United States | | | | 40,000,000 | | | | | | | | 41,670,478 | |
LYB International Finance II BV, senior note, 3.50%, 3/02/27 | | | United States | | | | 50,000,000 | | | | | | | | 51,653,867 | |
eMauser Packaging Solutions Holding Co., | | | | | | | | | | | | | | | | |
secured note, 144A, 5.50%, 4/15/24 | | | United States | | | | 75,000,000 | | | | | | | | 77,610,000 | |
senior note, 144A, 7.25%, 4/15/25 | | | United States | | | | 189,500,000 | | | | | | | | 179,844,975 | |
eSyngenta Finance NV, | | | | | | | | | | | | | | | | |
senior note, 144A, 4.441%, 4/24/23 | | | Switzerland | | | | 25,000,000 | | | | | | | | 26,121,625 | |
senior note, 144A, 5.182%, 4/24/28 | | | Switzerland | | | | 50,000,000 | | | | | | | | 53,063,125 | |
| | | | | | | | | | | | | | | | |
| | | | |
| | | | | | | | | | | | | | | 1,042,990,936 | |
| | | | | | | | | | | | | | | | |
Real Estate 0.6% | | | | | | | | | | | | | | | | |
American Tower Corp., senior bond, 3.375%, 10/15/26 | | | United States | | | | 50,000,000 | | | | | | | | 52,102,903 | |
Equinix Inc., senior bond, 5.375%, 5/15/27 | | | United States | | | | 80,000,000 | | | | | | | | 86,450,000 | |
Iron Mountain Inc., | | | | | | | | | | | | | | | | |
esenior note, 144A, 4.875%, 9/15/27 | | | United States | | | | 135,610,000 | | | | | | | | 139,363,685 | |
senior sub. bond, 5.75%, 8/15/24 | | | United States | | | | 129,254,000 | | | | | | | | 130,869,675 | |
| | | | | | | | | | | | | | | | |
| | | | |
| | | | | | | | | | | | | | | 408,786,263 | |
| | | | | | | | | | | | | | | | |
Utilities 1.2% | | | | | | | | | | | | | | | | |
Calpine Corp., | | | | | | | | | | | | | | | | |
senior note, 5.375%, 1/15/23 | | | United States | | | | 300,000,000 | | | | | | | | 304,500,000 | |
senior note, 5.50%, 2/01/24 | | | United States | | | | 186,500,000 | | | | | | | | 189,064,375 | |
Ferrellgas LP/Ferrellgas Finance Corp., | | | | | | | | | | | | | | | | |
senior note, 6.50%, 5/01/21 | | | United States | | | | 39,295,000 | | | | | | | | 33,597,225 | |
senior note, 6.75%, 1/15/22 | | | United States | | | | 92,500,000 | | | | | | | | 78,740,625 | |
senior note, 6.75%, 6/15/23 | | | United States | | | | 88,500,000 | | | | | | | | 75,003,750 | |
Sempra Energy, senior bond, 3.40%, 2/01/28 | | | United States | | | | 50,000,000 | | | | | | | | 51,704,870 | |
The Southern Co., junior sub. bond, 5.50% to 3/14/22, FRN thereafter, 3/15/57 | | | United States | | | | 46,857,000 | | | | | | | | 48,773,050 | |
Vistra Energy Corp., senior note, 5.875%, 6/01/23 | | | United States | | | | 100,000,000 | | | | | | | | 102,525,000 | |
| | | | | | | | | | | | | | | | |
| | | | |
| | | | | | | | | | | | | | | 883,908,895 | |
| | | | | | | | | | | | | | | | |
| | | | |
Total Corporate Bonds (Cost $27,820,363,368) | | | | | | | | | | | | | | | 26,949,605,434 | |
| | | | | | | | | | | | | | | | |
| | | | |
| | | |
| franklintempleton.com | | Annual Report | | 75 |
FRANKLIN CUSTODIAN FUNDS
STATEMENT OF INVESTMENTS
Franklin Income Fund(continued)
| | | | | | | | | | | | | | | | |
| | | Country | | | Principal Amount* | | | | | | Value | |
| | | | |
m,nSenior Floating Rate Interests 2.1% | | | | | | | | | | | | | | | | |
Communication Services 0.4% | | | | | | | | | | | | | | | | |
Diamond Sports Group LLC, Term Loan, 5.30%,(1-month USD LIBOR + 3.25%), 8/24/26 | | | United States | | | | 25,000,000 | | | | | | | $ | 25,179,750 | |
Global Eagle Entertainment Inc., Initial Term Loans, 9.699% - 9.71%,(6-month USD LIBOR + 7.50%), 1/06/23 | | | United States | | | | 101,471,014 | | | | | | | | 94,410,154 | |
Securus Technologies Holdings Inc., Second Lien Initial Loan, 10.29%,(1-month USD LIBOR + 8.25%), 11/01/25 | | | United States | | | | 26,000,000 | | | | | | | | 23,026,250 | |
Sprint Communications Inc., 2018 Incremental Term Loans, 5.06%,(1-month USD LIBOR + 3.00%), 2/03/24 | | | United States | | | | 99,250,000 | | | | | | | | 99,187,175 | |
Univision Communications Inc., Term Loan, 4.794%,(1-month USD LIBOR + 2.75%), 3/15/24 | | | United States | | | | 62,809,206 | | | | | | | | 61,149,221 | |
| | | | | | | | | | | | | | | | |
| | | | |
| | | | | | | | | | | | | | | 302,952,550 | |
| | | | | | | | | | | | | | | | |
Consumer Discretionary 0.5% | | | | | | | | | | | | | | | | |
24 Hour Fitness Worldwide Inc., Term Loan, 5.54%,(1-month USD LIBOR + 3.50%), 5/30/25 | | | United States | | | | 96,680,052 | | | | | | | | 93,497,635 | |
Academy Ltd., Initial Term Loan, 6.10%,(1-month USD LIBOR + 4.00%), 7/02/22 | | | United States | | | | 30,156,214 | | | | | | | | 21,209,860 | |
Belk Inc., Closing Date Term Loan, 6.80%,(3-month USD LIBOR + 4.75%), 12/12/22 | | | United States | | | | 140,867,482 | | | | | | | | 103,615,781 | |
Stars Group Holdings BV, Stars Group (US), USD Term Loan, 5.60%,(3-month USD LIBOR + 3.50%), 7/10/25 | | | United States | | | | 97,956,100 | | | | | | | | 98,512,001 | |
Tenneco Inc., Tranche B Term Loan, 5.04%,(1-month USD LIBOR + 3.00%), 10/01/25 | | | United States | | | | 22,193,996 | | | | | | | | 20,910,916 | |
| | | | | | | | | | | | | | | | |
| | | | |
| | | | | | | | | | | | | | | 337,746,193 | |
| | | | | | | | | | | | | | | | |
Energy 0.8% | | | | | | | | | | | | | | | | |
Weatherford International ltd, DIP Term, 5.07%,(1-month USD LIBOR + 3.00%), 7/03/20 | | | United States | | | | 615,071,055 | | | | | | | | 615,071,055 | |
| | | | | | | | | | | | | | | | |
Health Care 0.2% | | | | | | | | | | | | | | | | |
Amneal Pharmaceuticals LLC, Initial Term Loans, 5.56%,(1-month USD LIBOR + 3.50%), 5/04/25 | | | United States | | | | 29,311,908 | | | | | | | | 25,171,601 | |
Endo Luxembourg Finance Co. I S.A.R.L. and Endo LLC, Initial Term Loans, 6.31%,(1-month USD LIBOR + 4.25%), 4/29/24 | | | United States | | | | 78,200,000 | | | | | | | | 71,318,400 | |
Valeant Pharmaceuticals International, First Incremental Term Loan, 4.79%,(1-month USD LIBOR + 2.75%), 11/27/25 | | | United States | | | | 43,750,000 | | | | | | | | 43,886,719 | |
| | | | | | | | | | | | | | | | |
| | | | |
| | | | | | | | | | | | | | | 140,376,720 | |
| | | | | | | | | | | | | | | | |
Industrials 0.2% | | | | | | | | | | | | | | | | |
Commercial Barge Line Co., Initial Term Loan, 10.79%,(1-month USD LIBOR + 8.75%), 11/12/20 | | | United States | | | | 35,612,164 | | | | | | | | 20,316,740 | |
Vertiv Group Corp., Term B Loans, 6.04%,(1-month USD LIBOR + 4.00%), 11/30/23 | | | United States | | | | 62,189,440 | | | | | | | | 59,261,374 | |
West Corp., Term B Loans, 6.04%,(1-month USD LIBOR + 4.00%), 10/10/24 | | | United States | | | | 39,508,316 | | | | | | | | 35,294,083 | |
| | | | | | | | | | | | | | | | |
| | | | |
| | | | | | | | | | | | | | | 114,872,197 | |
| | | | | | | | | | | | | | | | |
Information Technology 0.0%† | | | | | | | | | | | | | | | | |
Microchip Technology Inc., Initial Term Loan, 4.05%,(1-month USD LIBOR + 2.00%), 5/29/25 | | | United States | | | | 30,181,810 | | | | | | | | 30,370,205 | |
| | | | | | | | | | | | | | | | |
| | | | |
| | | |
76 | | Annual Report | | franklintempleton.com |
FRANKLIN CUSTODIAN FUNDS
STATEMENT OF INVESTMENTS
Franklin Income Fund(continued)
| | | | | | | | | | | | | | | | |
| | | Country | | | Principal Amount* | | | | | | Value | |
| | | | |
m,nSenior Floating Rate Interests(continued) | | | | | | | | | | | | | | | | |
Materials 0.0%† | | | | | | | | | | | | | | | | |
BWAY Holding Co. Inc., Term Loan B, 5.59%,(3-month USD LIBOR + 3.25%), 4/03/24 | | | United States | | | | 28,131,944 | | | | | | | $ | 27,598,618 | |
| | | | | | | | | | | | | | | | |
| | | | |
Total Senior Floating Rate Interests
(Cost $1,627,336,175) | | | | | | | | | | | | | | | 1,568,987,538 | |
| | | | | | | | | | | | | | | | |
| | | | |
U.S. Government and Agency Securities 10.9% | | | | | | | | | | | | | | | | |
U.S. Treasury Bond, | | | | | | | | | | | | | | | | |
7.50%, 11/15/24 | | | United States | | | | 350,000,000 | | | | | | | | 452,156,250 | |
6.875%, 8/15/25 | | | United States | | | | 400,000,000 | | | | | | | | 518,203,124 | |
6.125%, 11/15/27 | | | United States | | | | 300,000,000 | | | | | | | | 402,316,407 | |
6.125%, 8/15/29 | | | United States | | | | 100,000,000 | | | | | | | | 140,398,438 | |
6.25%, 5/15/30 | | | United States | | | | 100,000,000 | | | | | | | | 144,308,594 | |
U.S. Treasury Note, | | | | | | | | | | | | | | | | |
1.875%, 12/31/19 | | | United States | | | | 750,000,000 | | | | | | | | 749,926,755 | |
2.25%, 3/31/20 | | | United States | | | | 1,000,000,000 | | | | | | | | 1,001,855,470 | |
2.50%, 5/31/20 | | | United States | | | | 750,000,000 | | | | | | | | 753,046,875 | |
2.50%, 6/30/20 | | | United States | | | | 500,000,000 | | | | | | | | 502,343,750 | |
2.50%, 2/28/21 | | | United States | | | | 500,000,000 | | | | | | | | 505,185,545 | |
2.375%, 3/15/21 | | | United States | | | | 750,000,000 | | | | | | | | 756,767,580 | |
2.625%, 6/15/21 | | | United States | | | | 500,000,000 | | | | | | | | 507,714,845 | |
2.75%, 8/15/21 | | | United States | | | | 350,000,000 | | | | | | | | 356,904,296 | |
2.75%, 4/30/23 | | | United States | | | | 500,000,000 | | | | | | | | 520,390,625 | |
2.75%, 5/31/23 | | | United States | | | | 500,000,000 | | | | | | | | 520,869,140 | |
2.875%, 5/31/25 | | | United States | | | | 250,000,000 | | | | | | | | 267,294,923 | |
| | | | | | | | | | | | | | | | |
| | | | |
Total U.S. Government and Agency Securities
(Cost $7,969,743,019) | | | | | | | | | | | | | | | 8,099,682,617 | |
| | | | | | | | | | | | | | | | |
| | | | |
Mortgage-Backed Securities 0.5% | | | | | | | | | | | | | | | | |
Federal National Mortgage Association (FNMA) Fixed Rate 0.1% | | | | | | | | | | | | | | | | |
FNMA 30 Year, 4.00%, 6/01/49 | | | United States | | | | 76,451,329 | | | | | | | | 79,418,439 | |
| | | | | | | | | | | | | | | | |
Government National Mortgage Association (GNMA) Fixed Rate 0.4% | | | | | | | | | | | | | | | | |
GNMA II SF 30 Year, 3.50%, 9/20/49 | | | United States | | | | 161,650,000 | | | | | | | | 167,800,351 | |
GNMA II SF 30 Year, 4.00%, 9/20/49 | | | United States | | | | 83,750,000 | | | | | | | | 87,753,589 | |
| | | | | | | | | | | | | | | | |
| | | | |
Total Mortgage-Backed Securities
(Cost $334,536,027) | | | | | | | | | | | | | | | 334,972,379 | |
| | | | | | | | | | | | | | | | |
| | | | |
| | | Country | | | Shares | | | | | | | |
| | | | |
Escrows and Litigation Trusts 0.0% | | | | | | | | | | | | | | | | |
a,oMotors Liquidation Co., Escrow Account | | | United States | | | | 400,000,000 | | | | | | | | — | |
a,oMotors Liquidation Co., Escrow Account, cvt. pfd., C | | | United States | | | | 11,000,000 | | | | | | | | — | |
| | | | | | | | | | | | | | | | |
Total Escrows and Litigation Trusts
(Cost $2,416,248) | | | | | | | | | | | | | | | — | |
| | | | | | | | | | | | | | | | |
| | | | |
| | | |
| franklintempleton.com | | Annual Report | | 77 |
FRANKLIN CUSTODIAN FUNDS
STATEMENT OF INVESTMENTS
Franklin Income Fund(continued)
| | | | | | | | | | | | | | | | |
| | | Number of
Contracts | | | Notional
Amount | | | | | | Value | |
| | | | |
Options Purchased 0.5% | | | | | | | | | | | | | | | | |
Puts - Exchange-Traded | | | | | | | | | | | | | | | | |
S&P 500 Index, December Strike Price $2,700.00, Expires 12/18/20 | | | 5,000 | | | | 500,000 | | | | | | | $ | 69,250,000 | |
S&P 500 Index, June Strike Price $2,700.00, Expires 6/19/20 | | | 5,000 | | | | 500,000 | | | | | | | | 45,200,000 | |
S&P 500 Index, March Strike Price $2,900.00, Expires 3/20/20 | | | 5,000 | | | | 500,000 | | | | | | | | 53,350,000 | |
S&P 500 Index, September Strike Price $3,000.00, Expires 9/18/20 | | | 10,000 | | | | 1,000,000 | | | | | | | | 201,400,000 | |
| | | | | | | | | | | | | | | | |
| | | | |
Total Options Purchased
(Cost $471,950,951) | | | | | | | | | | | | | | | 369,200,000 | |
| | | | | | | | | | | | | | | | |
| | | | |
Total Investments before Short Term Investments
(Cost $70,453,784,961) | | | | | | | | | | | | | | | 72,836,077,078 | |
| | | | | | | | | | | | | | | | |
| | | | |
| | | Country | | | Principal
Amount* | | | | | | | |
| | | | |
Short Term Investments 1.9% | | | | | | | | | | | | | | | | |
| | | | |
Corporate Bonds (Cost $19,750,889) 0.0%† | | | | | | | | | | | | | | | | |
CHS/Community Health Systems Inc., senior note, 8.00%, 11/15/19 | | | United States | | | | 19,819,000 | | | | | | | | 19,831,387 | |
| | | | | | | | | | | | | | | | |
| | | | |
Total Investments before Money Market Funds and Repurchase Agreement
(Cost $70,473,535,850) | | | | | | | | | | | | | | | 72,855,908,465 | |
| | | | | | | | | | | | | | | | |
| | | | |
| | | | | | Shares | | | | | | | |
| | | | |
Money Market Funds (Cost $1,386,045,053) 1.9% | | | | | | | | | | | | | | | | |
p,qInstitutional Fiduciary Trust Money Market Portfolio, 1.71% | | | United States | | | | 1,386,045,053 | | | | | | | | 1,386,045,053 | |
| | | | | | | | | | | | | | | | |
| | | | |
rInvestments from Cash Collateral Received for Loaned Securities 0.0%† | | | | | | | | | | | | | | | | |
Money Market Funds (Cost $23,902,000) 0.0%† | | | | | | | | | | | | | | | | |
p,qInstitutional Fiduciary Trust Money Market Portfolio, 1.71% | | | United States | | | | 23,902,000 | | | | | | | | 23,902,000 | |
| | | | | | | | | | | | | | | | |
| | | | |
| | | |
78 | | Annual Report | | franklintempleton.com |
FRANKLIN CUSTODIAN FUNDS
STATEMENT OF INVESTMENTS
Franklin Income Fund(continued)
| | | | | | | | | | | | |
| | | Country | | | Principal
Amount* | | | Value | |
Short Term Investments(continued) | | | | | | | | | | | | |
Investments from Cash Collateral Received for Loaned Securities(continued) | | | | | | | | | | | | |
Repurchase Agreement (Cost $5,976,422) 0.0%† | | | | | | | | | | | | |
sJoint Repurchase Agreement, 2.30%, 10/01/19 (Maturity Value $5,976,804) | | | | | | | | | | | | |
BofA Securities Inc. | | | | | | | | | | | | |
Collateralized by U.S. Treasury Notes, Index Linked, 1.25%, 7/15/20
(valued at $6,095,956) | | | United States | | | | 5,976,422 | | | $ | 5,976,422 | |
| | | | | | | | | | | | |
Total Investments from Cash Collateral Received for Loaned Securities (Cost $29,878,422) | | | | | | | | | | | 29,878,422 | |
| | | | | | | | | | | | |
Total Investments (Cost $71,889,459,325) 99.7% | | | | | | | | | | | 74,271,831,940 | |
Options Written (0.2)% | | | | | | | | | | | (119,615,000 | ) |
Other Assets, less Liabilities 0.5% | | | | | | | | | | | 373,684,651 | |
| | | | | | | | | | | | |
| | | |
Net Assets 100.0% | | | | | | | | | | $ | 74,525,901,591 | |
| | | | | | | | | | | | |
| | | Number of
Contracts | | | Notional
Amount | | | | |
tOptions Written (0.2)% | | | | | | | | | | | | |
Calls - Exchange-Traded | | | | | | | | | | | | |
Analog Devices Inc., December Strike Price $125.00, Expires 12/20/19 | | | 10,000 | | | | 1,000,000 | | | | (1,250,000 | ) |
Bristol-Myers Squibb Co., October Strike Price $50.00, Expires 10/18/19 | | | 20,000 | | | | 2,000,000 | | | | (2,340,000 | ) |
Chevron Corp., December Strike Price $130.00, Expires 12/20/19 | | | 10,000 | | | | 1,000,000 | | | | (580,000 | ) |
CVS Health Corp., November Strike Price $67.50, Expires 11/15/19 | | | 25,000 | | | | 2,500,000 | | | | (1,800,000 | ) |
General Motors Co., December Strike Price $42.00, Expires 12/20/19 | | | 40,000 | | | | 4,000,000 | | | | (1,440,000 | ) |
Gilead Sciences Inc., November Strike Price $72.50, Expires 11/15/19 | | | 10,000 | | | | 1,000,000 | | | | (190,000 | ) |
International Business Machines Corp., October Strike Price $145.00, Expires 10/18/19 | | | 7,000 | | | | 700,000 | | | | (3,129,000 | ) |
International Business Machines Corp., October Strike Price $150.00, Expires 10/18/19 | | | 7,000 | | | | 700,000 | | | | (1,421,000 | ) |
Merck & Co. Inc., October Strike Price $87.50, Expires 10/18/19 | | | 10,000 | | | | 1,000,000 | | | | (320,000 | ) |
Metlife Inc., November Strike Price $50.00, Expires 11/15/19 | | | 20,000 | | | | 2,000,000 | | | | (820,000 | ) |
Sempra Energy, October Strike Price $145.00, Expires 10/18/19 | | | 10,000 | | | | 1,000,000 | | | | (3,800,000 | ) |
The Southern Co., October Strike Price $60.00, Expires 10/18/19 | | | 30,000 | | | | 3,000,000 | | | | (6,390,000 | ) |
Texas Instruments Inc., October Strike Price $125.00, Expires 10/18/19 | | | 10,000 | | | | 1,000,000 | | | | (5,500,000 | ) |
Wells Fargo & Co., October Strike Price $50.00, Expires 10/18/19 | | | 40,000 | | | | 4,000,000 | | | | (5,120,000 | ) |
Wells Fargo & Co., November Strike Price $50.00, Expires 11/15/19 | | | 20,000 | | | | 2,000,000 | | | | (3,800,000 | ) |
Wells Fargo & Co., November Strike Price $52.50, Expires 11/15/19 | | | 10,000 | | | | 1,000,000 | | | | (650,000 | ) |
Wells Fargo & Co., December Strike Price $55.00, Expires 12/20/19 | | | 10,000 | | | | 1,000,000 | | | | (440,000 | ) |
| | | | | | | | | | | | |
| | | |
| | | | | | | | | | | (38,990,000 | ) |
| | | | | | | | | | | | |
Puts - Exchange-Traded | | | | | | | | | | | | |
Analog Devices Inc., December Strike Price $100.00, Expires 12/20/19 | | | 10,000 | | | | 1,000,000 | | | | (2,250,000 | ) |
The Boeing Co., October Strike Price $340.00, Expires 10/18/19 | | | 5,000 | | | | 500,000 | | | | (510,000 | ) |
Bristol-Myers Squibb Co., October Strike Price $45.00, Expires 10/18/19 | | | 30,000 | | | | 3,000,000 | | | | (210,000 | ) |
Broadcom Inc., November Strike Price $250.00, Expires 11/15/19 | | | 10,000 | | | | 1,000,000 | | | | (3,420,000 | ) |
General Motors Co., December Strike Price $33.00, Expires 12/20/19 | | | 40,000 | | | | 4,000,000 | | | | (2,520,000 | ) |
Gilead Sciences Inc., November Strike Price $62.50, Expires 11/15/19 | | | 10,000 | | | | 1,000,000 | | | | (1,850,000 | ) |
Home Depot Inc., November Strike Price $210.00, Expires 11/15/19 | | | 10,000 | | | | 1,000,000 | | | | (1,030,000 | ) |
| | | | |
| | | |
| franklintempleton.com | | Annual Report | | 79 |
FRANKLIN CUSTODIAN FUNDS
STATEMENT OF INVESTMENTS
Franklin Income Fund(continued)
| | | | | | | | | | | | |
| | | Number of
Contracts | | | Notional
Amount | | | Value | |
tOptions Written(continued) | | | | | | | | | | | | |
Puts - Exchange-Traded(continued) | | | | | | | | | | | | |
The Home Depot Inc., November Strike Price $215.00, Expires 11/15/19 | | | 10,000 | | | | 1,000,000 | | | $ | (1,460,000 | ) |
Merck & Co. Inc., October Strike Price $75.00, Expires 10/18/19 | | | 10,000 | | | | 1,000,000 | | | | (100,000 | ) |
Morgan Stanley, November Strike Price $36.00, Expires 11/15/19 | | | 20,000 | | | | 2,000,000 | | �� | | (440,000 | ) |
The Procter & Gamble Co., November Strike Price $110.00, Expires 11/15/19 | | | 20,000 | | | | 2,000,000 | | | | (1,200,000 | ) |
S&P 500 Index, December Strike Price $2,450.00, Expires 12/20/19 | | | 5,000 | | | | 500,000 | | | | (3,850,000 | ) |
S&P 500 Index, June Strike Price $2,400.00, Expires 6/19/20 | | | 15,000 | | | | 1,500,000 | | | | (61,785,000 | ) |
| | | | | | | | | | | | |
| | | | | | | | | | | (80,625,000 | ) |
| | | | | | | | | | | | |
| | | |
Total Options Written (Premiums received $156,672,971) | | | | | | | | | | $ | (119,615,000 | ) |
| | | | | | | | | | | | |
†Rounds to less than 0.1% of net assets.
*The principal amount is stated in U.S. dollars unless otherwise indicated.
aNon-income producing.
bA portion or all of the security is held in connection with written option contracts open at year end.
cSee Note 9 regarding holdings of 5% voting securities.
dSee Note 1(g) regarding equity-linked securities.
eSecurity was purchased pursuant to Rule 144A under the Securities Act of 1933 and may be sold in transactions exempt from registration only to qualified institutional buyers or in a public offering registered under the Securities Act of 1933. These securities have been deemed liquid under guidelines approved by the Trust’s Board of Trustees. At September 30, 2019, the aggregate value of these securities was $19,589,386,333, representing 26.3% of net assets.
fSee Note 1(f) regarding index-linked notes.
gSecurity pays variable interest based on the distribution of the SPXDIV Index and proceeds earned from related equity derivatives. The interest rate shown represents the rate at period end. Cash payment at maturity or upon early redemption is based on the performance of the S&P 500 Index.
hSecurity pays a fixed 2.00% coupon rate and a variable coupon based on the distribution of the Morgan Stanley Custom Enhanced SPX B DT Index 20 Delta. The coupon rate shown represents the combined rate at period end. Cash payment at maturity or upon early redemption is based on the performance of the Morgan Stanley Custom Enhanced SPX B Index 20 Delta.
iSee Note 7 regarding defaulted securities.
jA portion or all of the security is on loan at September 30, 2019. See Note 1(h).
kSecurity purchased on a when-issued basis. See Note 1(d).
lPerpetual security with no stated maturity date.
mThe coupon rate shown represents the rate at period end.
nSee Note 1(j) regarding senior floating rate interests.
oFair valued using significant unobservable inputs. See Note 13 regarding fair value measurements.
pSee Note 3(f) regarding investments in affiliated management investment companies.
qThe rate shown is the annualizedseven-day effective yield at period end.
rSee Note 1(h) regarding securities on loan.
sSee Note 1(c) regarding joint repurchase agreement.
tSee Note 1(e) regarding written options.
| | | | |
| | | |
80 | | Annual Report | | franklintempleton.com |
FRANKLIN CUSTODIAN FUNDS
STATEMENT OF INVESTMENTS
Franklin Income Fund(continued)
At September 30, 2019, the Fund had the following futures contracts outstanding. See Note 1(e).
Futures Contracts
| | | | | | | | | | | | | | | | | | | | |
| Description | | Type | | | Number of
Contracts | | | Notional Amount* | | | Expiration
Date | | | Value/
Unrealized
Appreciation
(Depreciation) | |
| | | | | |
| Interest Rate Contracts | | | | | | | | | | | | | | | | | | | | |
| U.S. Treasury 10 Yr. Note | | | Short | | | | 11,500 | | | | $1,498,593,750 | | | | 12/19/19 | | | | $15,254,808 | |
| | | | | | | | | | | | | | | | | | | | |
*As of period end.
See Note 8 regarding other derivative information.
See Abbreviations on page 133.
| | | | |
| | | |
| franklintempleton.com | | The accompanying notes are an integral part of these financial statements. | Annual Report | | 81 |
FRANKLIN CUSTODIAN FUNDS
Financial Highlights
Franklin U.S. Government Securities Fund
| | | | | | | | |
| | | Year Ended September 30, | |
| | | 2019 | | | 2018a | |
| | |
Class A | | | | | | | | |
| | |
Per share operating performance (for a share outstanding throughout the year) | | | | | | | | |
| | |
Net asset value, beginning of year | | | $ 5.86 | | | | $ 5.89 | |
| | | | |
| | |
Income from investment operationsb: | | | | | | | | |
| | |
Net investment incomec | | | 0.14 | | | | 0.01 | |
| | |
Net realized and unrealized gains (losses) | | | 0.25 | | | | (0.02) | |
| | | | |
| | |
Total from investment operations | | | 0.39 | | | | (0.01) | |
| | | | |
| | |
Less distributions from: | | | | | | | | |
| | |
Net investment income | | | (0.18) | | | | (0.02) | |
| | | | |
| | |
Net asset value, end of year | | | $ 6.07 | | | | $ 5.86 | |
| | | | |
| | |
Total returnd | | | 6.70% | | | | (0.23)% | |
| | |
Ratios to average net assetse | | | | | | | | |
| | |
Expenses before waiver and payments by affiliates | | | 0.89% | | | | 0.86% | |
| | |
Expenses net of waiver and payments by affiliatesf | | | 0.88% | | | | 0.86% | g |
| | |
Net investment income | | | 2.36% | | | | 2.40% | |
| | |
Supplemental data | | | | | | | | |
| | |
Net assets, end of year (000’s) | | | $336,646 | | | | $4,472 | |
| | |
Portfolio turnover rate | | | 41.34% | | | | 44.67% | |
| | |
Portfolio turnover rate excluding mortgage dollar rollsh | | | 41.34% | | | | 44.67% | |
aFor the period September 10, 2018 (effective date) to September 30, 2018.
bThe amount shown for a share outstanding throughout the period may not correlate with the Statement of Operations for the period due to the timing of sales and repurchases of the Fund’s shares in relation to income earned and/or fluctuating fair value of the investments of the Fund.
cBased on average daily shares outstanding.
dTotal return does not reflect sales commissions or contingent deferred sales charges, if applicable, and is not annualized for periods less than one year.
eRatios are annualized for periods less than one year.
fBenefit of expense reduction rounds to less than 0.01%.
gBenefit of waiver and payments by affiliates rounds to less than 0.01%.
hSee Note 1(i) regarding mortgage dollar rolls.
| | | | |
| | | |
82 | | Annual Report | The accompanying notes are an integral part of these financial statements. | | franklintempleton.com |
FRANKLIN CUSTODIAN FUNDS
FINANCIAL HIGHLIGHTS
Franklin U.S. Government Securities Fund(continued)
| | | | | | | | | | | | | | | | | | | | |
| | | Year Ended September 30, | |
| | | 2019 | | | 2018 | | | 2017 | | | 2016 | | | 2015 | |
| | | | | |
Class A1 | | | | | | | | | | | | | | | | | | | | |
| | | | | |
Per share operating performance (for a share outstanding throughout the year) | | | | | | | | | | | | | | | | | | | | |
| | | | | |
Net asset value, beginning of year | | | $ 5.85 | | | | $ 6.13 | | | | $ 6.35 | | | | $ 6.40 | | | | $ 6.48 | |
| | | | |
| | | | | |
Income from investment operationsa: | | | | | | | | | | | | | | | | | | | | |
| | | | | |
Net investment incomeb | | | 0.15 | | | | 0.15 | | | | 0.13 | | | | 0.14 | | | | 0.15 | |
| | | | | |
Net realized and unrealized gains (losses) | | | 0.25 | | | | (0.25 | ) | | | (0.16 | ) | | | 0.01 | | | | (0.02) | |
| | | | |
| | | | | |
Total from investment operations | | | 0.40 | | | | (0.10 | ) | | | (0.03 | ) | | | 0.15 | | | | 0.13 | |
| | | | |
| | | | | |
Less distributions from: | | | | | | | | | | | | | | | | | | | | |
| | | | | |
Net investment income | | | (0.18 | ) | | | (0.18 | ) | | | (0.19 | ) | | | (0.20 | ) | | | (0.21) | |
| | | | |
| | | | | |
Net asset value, end of year | | | $ 6.07 | | | | $ 5.85 | | | | $ 6.13 | | | | $ 6.35 | | | | $ 6.40 | |
| | | | |
| | | | | |
Total returnc | | | 6.94% | | | | (1.60 | )% | | | (0.45 | )% | | | 2.35% | | | | 2.07% | |
| | | | | |
Ratios to average net assets | | | | | | | | | | | | | | | | | | | | |
| | | | | |
Expenses before waiver and payments by affiliates | | | 0.79% | | | | 0.76% | | | | 0.79% | | | | 0.76% | | | | 0.76% | |
| | | | | |
Expenses net of waiver and payments by affiliatesd | | | 0.78% | | | | 0.76% | e | | | 0.79% | e | | | 0.76% | e | | | 0.76% | e |
| | | | | |
Net investment income | | | 2.46% | | | | 2.50% | | | | 2.17% | | | | 2.21% | | | | 2.28% | |
| | | | | |
Supplemental data | | | | | | | | | | | | | | | | | | | | |
| | | | | |
Net assets, end of year (000’s) | | | $2,885,194 | | | | $3,099,373 | | | | $3,581,769 | | | | $4,235,819 | | | | $4,167,639 | |
| | | | | |
Portfolio turnover rate | | | 41.34% | | | | 44.67% | | | | 86.72% | | | | 92.18% | | | | 69.10% | |
| | | | | |
Portfolio turnover rate excluding mortgage dollar rollsf | | | 41.34% | | | | 44.67% | | | | 86.72% | | | | 92.18% | | | | 58.70% | |
aThe amount shown for a share outstanding throughout the period may not correlate with the Statement of Operations for the period due to the timing of sales and repurchases of the Fund’s shares in relation to income earned and/or fluctuating fair value of the investments of the Fund.
bBased on average daily shares outstanding.
cTotal return does not reflect sales commissions or contingent deferred sales charges, if applicable.
dBenefit of expense reduction rounds to less than 0.01%.
eBenefit of waiver and payments by affiliates rounds to less than 0.01%.
fSee Note 1(i) regarding mortgage dollar rolls.
| | | | |
| | | |
| franklintempleton.com | | The accompanying notes are an integral part of these financial statements. | Annual Report | | 83 |
FRANKLIN CUSTODIAN FUNDS
FINANCIAL HIGHLIGHTS
Franklin U.S. Government Securities Fund(continued)
| | | | | | | | | | | | | | | | | | | | |
| | | Year Ended September 30, | |
| | | 2019 | | | 2018 | | | 2017 | | | 2016 | | | 2015 | |
| | | | | |
Class C | | | | | | | | | | | | | | | | | | | | |
| | | | | |
Per share operating performance (for a share outstanding throughout the year) | | | | | | | | | | | | | | | | | | | | |
| | | | | |
Net asset value, beginning of year | | | $ 5.81 | | | | $ 6.08 | | | | $ 6.30 | | | | $ 6.36 | | | | $ 6.44 | |
| | | | |
| | | | | |
Income from investment operationsa: | | | | | | | | | | | | | | | | | | | | |
| | | | | |
Net investment incomeb | | | 0.12 | | | | 0.12 | | | | 0.10 | | | | 0.11 | | | | 0.11 | |
| | | | | |
Net realized and unrealized gains (losses) | | | 0.25 | | | | (0.24 | ) | | | (0.16 | ) | | | — | c | | | (0.01) | |
| | | | |
| | | | | |
Total from investment operations | | | 0.37 | | | | (0.12 | ) | | | (0.06 | ) | | | 0.11 | | | | 0.10 | |
| | | | |
| | | | | |
Less distributions from: | | | | | | | | | | | | | | | | | | | | |
| | | | | |
Net investment income | | | (0.15 | ) | | | (0.15 | ) | | | (0.16 | ) | | | (0.17 | ) | | | (0.18) | |
| | | | |
| | | | | |
Net asset value, end of year | | | $ 6.03 | | | | $ 5.81 | | | | $ 6.08 | | | | $ 6.30 | | | | $ 6.36 | |
| | | | |
| | | | | |
Total returnd | | | 6.45% | | | | (1.94 | )% | | | (0.96 | )% | | | 1.70% | | | | 1.57% | |
| | | | | |
Ratios to average net assets | | | | | | | | | | | | | | | | | | | | |
| | | | | |
Expenses before waiver and payments by affiliates | | | 1.29% | | | | 1.26% | | | | 1.29% | | | | 1.26% | | | | 1.26% | |
| | | | | |
Expenses net of waiver and payments by affiliatese | | | 1.28% | | | | 1.26% | f | | | 1.29% | f | | | 1.26% | f | | | 1.26%f | |
| | | | | |
Net investment income | | | 1.96% | | | | 2.00% | | | | 1.67% | | | | 1.71% | | | | 1.78% | |
| | | | | |
Supplemental data | | | | | | | | | | | | | | | | | | | | |
| | | | | |
Net assets, end of year (000’s) | | | $389,021 | | | | $571,525 | | | | $797,394 | | | | $1,034,410 | | | | $1,040,294 | |
| | | | | |
Portfolio turnover rate | | | 41.34% | | | | 44.67% | | | | 86.72% | | | | 92.18% | | | | 69.10% | |
| | | | | |
Portfolio turnover rate excluding mortgage dollar rollsg | | | 41.34% | | | | 44.67% | | | | 86.72% | | | | 92.18% | | | | 58.70% | |
aThe amount shown for a share outstanding throughout the period may not correlate with the Statement of Operations for the period due to the timing of sales and repurchases of the Fund’s shares in relation to income earned and/or fluctuating fair value of the investments of the Fund.
bBased on average daily shares outstanding.
cAmount rounds to less than $0.01 per share.
dTotal return does not reflect sales commissions or contingent deferred sales charges, if applicable.
eBenefit of expense reduction rounds to less than 0.01%.
fBenefit of waiver and payments by affiliates rounds to less than 0.01%.
gSee Note 1(i) regarding mortgage dollar rolls.
| | | | |
| | | |
84 | | Annual Report | The accompanying notes are an integral part of these financial statements. | | franklintempleton.com |
FRANKLIN CUSTODIAN FUNDS
FINANCIAL HIGHLIGHTS
Franklin U.S. Government Securities Fund(continued)
| | | | | | | | | | | | | | | | | | | | |
| | | Year Ended September 30, | |
| | | 2019 | | | 2018 | | | 2017 | | | 2016 | | | 2015 | |
| | | | | |
Class R | | | | | | | | | | | | | | | | | | | | |
| | | | | |
Per share operating performance (for a share outstanding throughout the year) | | | | | | | | | | | | | | | | | | | | |
| | | | | |
Net asset value, beginning of year | | | $ 5.85 | | | | $ 6.12 | | | | $ 6.34 | | | | $ 6.40 | | | | $ 6.48 | |
| | | | |
| | | | | |
Income from investment operationsa: | | | | | | | | | | | | | | | | | | | | |
| | | | | |
Net investment incomeb | | | 0.13 | | | | 0.13 | | | | 0.11 | | | | 0.12 | | | | 0.13 | |
| | | | | |
Net realized and unrealized gains (losses) | | | 0.25 | | | | (0.24 | ) | | | (0.16 | ) | | | — | c | | | (0.02) | |
| | | | |
| | | | | |
Total from investment operations | | | 0.38 | | | | (0.11 | ) | | | (0.05 | ) | | | 0.12 | | | | 0.11 | |
| | | | |
| | | | | |
Less distributions from: | | | | | | | | | | | | | | | | | | | | |
| | | | | |
Net investment income | | | (0.16 | ) | | | (0.16 | ) | | | (0.17 | ) | | | (0.18 | ) | | | (0.19) | |
| | | | |
| | | | | |
Net asset value, end of year | | | $ 6.07 | | | | $ 5.85 | | | | $ 6.12 | | | | $ 6.34 | | | | $ 6.40 | |
| | | | |
| | | | | |
Total return | | | 6.58% | | | | (1.78 | )% | | | (0.81 | )% | | | 1.84% | | | | 1.71% | |
| | | | | |
Ratios to average net assets | | | | | | | | | | | | | | | | | | | | |
| | | | | |
Expenses before waiver and payments by affiliates | | | 1.14% | | | | 1.11% | | | | 1.13% | | | | 1.11% | | | | 1.11% | |
| | | | | |
Expenses net of waiver and payments by affiliatesd | | | 1.13% | | | | 1.11% | e | | | 1.13% | e | | | 1.11% | e | | | 1.11%e | |
| | | | | |
Net investment income | | | 2.11% | | | | 2.15% | | | | 1.83% | | | | 1.86% | | | | 1.93% | |
| | | | | |
Supplemental data | | | | | | | | | | | | | | | | | | | | |
| | | | | |
Net assets, end of year (000’s) | | | $32,906 | | | | $31,144 | | | | $38,363 | | | | $59,785 | | | | $64,689 | |
| | | | | |
Portfolio turnover rate | | | 41.34% | | | | 44.67% | | | | 86.72% | | | | 92.18% | | | | 69.10% | |
| | | | | |
Portfolio turnover rate excluding mortgage dollar rollsf | | | 41.34% | | | | 44.67% | | | | 86.72% | | | | 92.18% | | | | 58.70% | |
aThe amount shown for a share outstanding throughout the period may not correlate with the Statement of Operations for the period due to the timing of sales and repurchases of the Fund’s shares in relation to income earned and/or fluctuating fair value of the investments of the Fund.
bBased on average daily shares outstanding.
cAmount rounds to less than $0.01 per share.
dBenefit of expense reduction rounds to less than 0.01%.
eBenefit of waiver and payments by affiliates rounds to less than 0.01%.
fSee Note 1(i) regarding mortgage dollar rolls.
| | | | |
| | | |
| franklintempleton.com | | The accompanying notes are an integral part of these financial statements. | Annual Report | | 85 |
FRANKLIN CUSTODIAN FUNDS
FINANCIAL HIGHLIGHTS
Franklin U.S. Government Securities Fund(continued)
| | | | | | | | | | | | | | | | | | | | |
| | | Year Ended September 30, | |
| | | 2019 | | | 2018 | | | 2017 | | | 2016 | | | 2015 | |
| | | | | |
Class R6 | | | | | | | | | | | | | | | | | | | | |
| | | | | |
Per share operating performance (for a share outstanding throughout the year) | | | | | | | | | | | | | | | | | | | | |
| | | | | |
Net asset value, beginning of year | | | $ 5.87 | | | | $ 6.15 | | | | $ 6.37 | | | | $ 6.42 | | | | $ 6.50 | |
| | | | |
| | | | | |
Income from investment operationsa: | | | | | | | | | | | | | | | | | | | | |
| | | | | |
Net investment incomeb | | | 0.16 | | | | 0.17 | | | | 0.15 | | | | 0.16 | | | | 0.17 | |
| | | | | |
Net realized and unrealized gains (losses) | | | 0.27 | | | | (0.25 | ) | | | (0.16 | ) | | | 0.01 | | | | (0.02) | |
| | | | |
| | | | | |
Total from investment operations | | | 0.43 | | | | (0.08 | ) | | | (0.01 | ) | | | 0.17 | | | | 0.15 | |
| | | | |
| | | | | |
Less distributions from: | | | | | | | | | | | | | | | | | | | | |
| | | | | |
Net investment income | | | (0.20 | ) | | | (0.20 | ) | | | (0.21 | ) | | | (0.22 | ) | | | (0.23) | |
| | | | |
| | | | | |
Net asset value, end of year | | | $ 6.10 | | | | $ 5.87 | | | | $ 6.15 | | | | $ 6.37 | | | | $ 6.42 | |
| | | | |
| | | | | |
Total return | | | 7.39% | | | | (1.33 | )% | | | (0.16 | )% | | | 2.63% | | | | 2.35% | |
| | | | | |
Ratios to average net assets | | | | | | | | | | | | | | | | | | | | |
| | | | | |
Expenses before waiver and payments by affiliates | | | 0.51% | | | | 0.49% | | | | 0.48% | | | | 0.48% | | | | 0.47% | |
| | | | | |
Expenses net of waiver and payments by affiliatesc | | | 0.50% | | | | 0.48% | | | | 0.48% | d | | | 0.48% | d | | | 0.47%d | |
| | | | | |
Net investment income | | | 2.74% | | | | 2.78% | | | | 2.48% | | | | 2.49% | | | | 2.57% | |
| | | | | |
Supplemental data | | | | | | | | | | | | | | | | | | | | |
| | | | | |
Net assets, end of year (000’s) | | | $573,957 | | | | $694,813 | | | | $446,174 | | | | $624,619 | | | | $375,644 | |
| | | | | |
Portfolio turnover rate | | | 41.34% | | | | 44.67% | | | | 86.72% | | | | 92.18% | | | | 69.10% | |
| | | | | |
Portfolio turnover rate excluding mortgage dollar rollse | | | 41.34% | | | | 44.67% | | | | 86.72% | | | | 92.18% | | | | 58.70% | |
aThe amount shown for a share outstanding throughout the period may not correlate with the Statement of Operations for the period due to the timing of sales and repurchases of the Fund’s shares in relation to income earned and/or fluctuating fair value of the investments of the Fund.
bBased on average daily shares outstanding.
cBenefit of expense reduction rounds to less than 0.01%.
dBenefit of waiver and payments by affiliates rounds to less than 0.01%.
eSee Note 1(i) regarding mortgage dollar rolls.
| | | | |
| | | |
86 | | Annual Report | The accompanying notes are an integral part of these financial statements. | | franklintempleton.com |
FRANKLIN CUSTODIAN FUNDS
FINANCIAL HIGHLIGHTS
Franklin U.S. Government Securities Fund(continued)
| | | | | | | | | | | | | | | | | | | | |
| | | Year Ended September 30, | |
| | | 2019 | | | 2018 | | | 2017 | | | 2016 | | | 2015 | |
| |
| | | | | |
Advisor Class | | | | | | | | | | | | | | | | | | | | |
| | | | | |
Per share operating performance (for a share outstanding throughout the year) | | | | | | | | | | | | | | | | | | | | |
| | | | | |
Net asset value, beginning of year | | | $ 5.87 | | | | $ 6.15 | | | | $ 6.37 | | | | $ 6.42 | | | | $ 6.50 | |
| | | | |
| | | | | |
Income from investment operationsa: | | | | | | | | | | | | | | | | | | | | |
| | | | | |
Net investment incomeb | | | 0.16 | | | | 0.16 | | | | 0.15 | | | | 0.15 | | | | 0.16 | |
| | | | | |
Net realized and unrealized gains (losses) | | | 0.26 | | | | (0.25 | ) | | | (0.17 | ) | | | 0.01 | | | | (0.02) | |
| | | | |
| | | | | |
Total from investment operations | | | 0.42 | | | | (0.09 | ) | | | (0.02 | ) | | | 0.16 | | | | 0.14 | |
| | | | |
| | | | | |
Less distributions from: | | | | | | | | | | | | | | | | | | | | |
| | | | | |
Net investment income | | | (0.19 | ) | | | (0.19 | ) | | | (0.20 | ) | | | (0.21 | ) | | | (0.22) | |
| | | | |
| | | | | |
Net asset value, end of year | | | $ 6.10 | | | | $ 5.87 | | | | $ 6.15 | | | | $ 6.37 | | | | $ 6.42 | |
| | | | |
| | | | | |
Total return | | | 7.08% | | | | (1.45)% | | | | (0.30)% | | | | 2.49% | | | | 2.21% | |
| | | | | |
Ratios to average net assets | | | | | | | | | | | | | | | | | | | | |
| | | | | |
Expenses before waiver and payments by affiliates | | | 0.64% | | | | 0.61% | | | | 0.64% | | | | 0.61% | | | | 0.61% | |
| | | | | |
Expenses net of waiver and payments by affiliatesc | | | 0.63% | | | | 0.61% | d | | | 0.64% | d | | | 0.61% | d | | | 0.61%d | |
| | | | | |
Net investment income | | | 2.61% | | | | 2.65% | | | | 2.32% | | | | 2.36% | | | | 2.43% | |
| | | | | |
Supplemental data | | | | | | | | | | | | | | | | | | | | |
| | | | | |
Net assets, end of year (000’s) | | | $946,318 | | | | $720,281 | | | | $854,640 | | | | $718,975 | | | | $622,339 | |
| | | | | |
Portfolio turnover rate | | | 41.34% | | | | 44.67% | | | | 86.72% | | | | 92.18% | | | | 69.10% | |
| | | | | |
Portfolio turnover rate excluding mortgage dollar rollse | | | 41.34% | | | | 44.67% | | | | 86.72% | | | | 92.18% | | | | 58.70% | |
aThe amount shown for a share outstanding throughout the period may not correlate with the Statement of Operations for the period due to the timing of sales and repurchases of the Fund’s shares in relation to income earned and/or fluctuating fair value of the investments of the Fund.
bBased on average daily shares outstanding.
cBenefit of expense reduction rounds to less than 0.01%.
dBenefit of waiver and payments by affiliates rounds to less than 0.01%.
eSee Note 1(i) regarding mortgage dollar rolls.
| | | | |
| | | |
| franklintempleton.com | | The accompanying notes are an integral part of these financial statements. | Annual Report | | 87 |
FRANKLIN CUSTODIAN FUNDS
Statement of Investments, September 30, 2019
Franklin U.S. Government Securities Fund
| | | | | | | | |
| | | Principal
Amount | | | Value | |
| | |
Mortgage-Backed Securities 97.7% | | | | | | | | |
Government National Mortgage Association (GNMA) Fixed Rate 97.7% | | | | | | | | |
GNMA I SF 30 Year, 3.50%, 4/15/43 - 5/15/43 | | $ | 24,003,366 | | | $ | 25,398,821 | |
GNMA I SF 30 Year, 4.00%, 10/15/40 - 2/15/45 | | | 46,075,368 | | | | 49,426,797 | |
GNMA I SF 30 Year, 4.00%, 8/15/44 | | | 15,242,982 | | | | 16,417,840 | |
GNMA I SF 30 Year, 4.00%, 2/15/45 - 8/15/46 | | | 31,826,201 | | | | 34,091,169 | |
GNMA I SF 30 Year, 4.50%, 2/15/39 - 10/15/39 | | | 44,538,463 | | | | 48,760,378 | |
GNMA I SF 30 Year, 4.50%, 11/15/39 - 5/15/40 | | | 46,434,541 | | | | 50,782,786 | |
GNMA I SF 30 Year, 4.50%, 6/15/40 - 7/15/40 | | | 46,079,458 | | | | 50,216,801 | |
GNMA I SF 30 Year, 4.50%, 7/15/40 - 6/15/41 | | | 43,588,866 | | | | 47,645,211 | |
GNMA I SF 30 Year, 5.00%, 2/15/33 - 12/15/33 | | | 46,742,920 | | | | 51,599,590 | |
GNMA I SF 30 Year, 5.00%, 1/15/34 - 9/15/39 | | | 45,860,702 | | | | 50,966,362 | |
GNMA I SF 30 Year, 5.00%, 8/15/39 | | | 16,789,819 | | | | 18,864,820 | |
GNMA I SF 30 Year, 5.00%, 9/15/39 - 11/15/39 | | | 42,430,813 | | | | 47,589,019 | |
GNMA I SF 30 Year, 5.00%, 10/15/39 | | | 15,390,269 | | | | 17,298,438 | |
GNMA I SF 30 Year, 5.00%, 11/15/39 | | | 19,927,735 | | | | 22,388,245 | |
GNMA I SF 30 Year, 5.00%, 11/15/39 - 3/15/40 | | | 45,738,551 | | | | 51,321,115 | |
GNMA I SF 30 Year, 5.00%, 3/15/40 - 6/15/40 | | | 39,997,871 | | | | 44,866,822 | |
GNMA I SF 30 Year, 5.00%, 6/15/40 | | | 12,819,795 | | | | 14,400,629 | |
GNMA I SF 30 Year, 5.00%, 9/15/40 | | | 17,361,022 | | | | 19,522,973 | |
GNMA I SF 30 Year, 5.50%, 5/15/28 - 7/15/33 | | | 46,376,027 | | | | 51,618,347 | |
GNMA I SF 30 Year, 5.50%, 7/15/33 - 6/15/38 | | | 44,447,412 | | | | 49,770,501 | |
GNMA I SF 30 Year, 5.50%, 6/15/38 - 2/15/40 | | | 35,316,347 | | | | 39,924,906 | |
GNMA I SF 30 Year, 6.00%, 10/15/23 - 11/15/35 | | | 45,334,425 | | | | 50,890,135 | |
GNMA I SF 30 Year, 6.00%, 12/15/35 - 9/15/38 | | | 44,951,182 | | | | 51,213,403 | |
GNMA I SF 30 Year, 6.00%, 9/15/38 - 12/15/39 | | | 20,340,017 | | | | 23,371,411 | |
GNMA I SF 30 Year, 6.50%, 5/15/23 - 8/15/37 | | | 33,942,777 | | | | 37,990,578 | |
GNMA I SF 30 Year, 7.00%, 4/15/22 - 9/15/32 | | | 22,934,727 | | | | 25,253,111 | |
GNMA I SF 30 Year, 7.25%, 12/15/25 - 1/15/26 | | | 69,767 | | | | 70,959 | |
GNMA I SF 30 Year, 7.50%, 6/15/21 - 8/15/33 | | | 5,938,640 | | | | 6,400,200 | |
GNMA I SF 30 Year, 7.70%, 1/15/21 - 10/15/21 | | | 12,341 | | | | 12,366 | |
GNMA I SF 30 Year, 8.00%, 2/15/20 - 9/15/30 | | | 1,990,269 | | | | 2,036,991 | |
GNMA I SF 30 Year, 8.50%, 11/15/19 - 5/15/25 | | | 282,120 | | | | 287,016 | |
GNMA I SF 30 Year, 9.00%, 10/15/19 - 7/15/23 | | | 170,876 | | | | 173,072 | |
GNMA I SF 30 Year, 9.50%, 11/15/19 - 8/15/22 | | | 137,984 | | | | 138,587 | |
GNMA I SF 30 Year, 10.00%, 3/15/20 - 3/15/25 | | | 54,983 | | | | 55,205 | |
GNMA I SF 30 Year, 10.50%, 8/15/20 - 10/15/21 | | | 7,336 | | | | 7,358 | |
GNMA I SF 30 Year, 11.00%, 4/15/21 | | | 13 | | | | 13 | |
GNMA II SF 30 Year, 3.00%, 2/20/45 - 5/20/49 | | | 38,024,687 | | | | 39,220,693 | |
GNMA II SF 30 Year, 3.00%, 4/20/46 | | | 69,784,513 | | | | 72,004,690 | |
GNMA II SF 30 Year, 3.00%, 7/20/47 | | | 217,537,246 | | | | 223,716,778 | |
GNMA II SF 30 Year, 3.00%, 9/20/47 | | | 60,775,848 | | | | 62,622,598 | |
GNMA II SF 30 Year, 3.00%, 10/20/47 | | | 105,895,767 | | | | 108,900,925 | |
GNMA II SF 30 Year, 3.00%, 11/20/47 | | | 17,716,437 | | | | 18,222,915 | |
GNMA II SF 30 Year, 3.00%, 1/20/48 | | | 32,397,449 | | | | 33,305,271 | |
GNMA II SF 30 Year, 3.00%, 2/20/48 | | | 54,341,211 | | | | 55,857,676 | |
GNMA II SF 30 Year, 3.00%, 4/20/48 | | | 18,609,197 | | | | 19,129,327 | |
GNMA II SF 30 Year, 3.00%, 6/20/49 | | | 54,092,354 | | | | 55,596,237 | |
| | | | |
| | | |
88 | | Annual Report | | franklintempleton.com |
FRANKLIN CUSTODIAN FUNDS
STATEMENT OF INVESTMENTS
Franklin U.S. Government Securities Fund(continued)
| | | | | | | | |
| | | Principal
Amount | | | Value | |
| | |
Mortgage-Backed Securities(continued) | | | | | | | | |
Government National Mortgage Association (GNMA) Fixed Rate(continued) | | | | | | | | |
GNMA II SF 30 Year, 3.00%, 7/20/49 | | $ | 20,203,728 | | | $ | 20,755,368 | |
GNMA II SF 30 Year, 3.00%, 8/20/49 | | | 47,671,971 | | | | 48,973,600 | |
GNMA II SF 30 Year, 3.50%, 10/20/40 - 11/20/48 | | | 47,928,560 | | | | 50,715,031 | |
GNMA II SF 30 Year, 3.50%, 7/20/42 | | | 43,000,722 | | | | 45,687,105 | |
GNMA II SF 30 Year, 3.50%, 9/20/42 | | | 99,357,600 | | | | 105,564,920 | |
GNMA II SF 30 Year, 3.50%, 10/20/42 | | | 20,509,138 | | | | 21,790,458 | |
GNMA II SF 30 Year, 3.50%, 11/20/42 | | | 17,209,794 | | | | 18,285,000 | |
GNMA II SF 30 Year, 3.50%, 4/20/43 | | | 20,910,873 | | | | 22,217,391 | |
GNMA II SF 30 Year, 3.50%, 5/20/43 | | | 28,385,047 | | | | 30,158,558 | |
GNMA II SF 30 Year, 3.50%, 6/20/43 | | | 32,788,590 | | | | 34,837,260 | |
GNMA II SF 30 Year, 3.50%, 8/20/43 | | | 22,953,789 | | | | 24,338,535 | |
GNMA II SF 30 Year, 3.50%, 9/20/47 | | | 619,659,243 | | | | 644,890,200 | |
GNMA II SF 30 Year, 3.50%, 11/20/47 | | | 612,645,326 | | | | 636,689,456 | |
GNMA II SF 30 Year, 3.50%, 12/20/48 - 7/20/49 | | | 7,172,193 | | | | 7,436,097 | |
GNMA II SF 30 Year, 3.50%, 2/20/49 | | | 16,170,312 | | | | 16,765,113 | |
GNMA II SF 30 Year, 3.50%, 8/20/49 | | | 270,788,478 | | | | 281,174,440 | |
GNMA II SF 30 Year, 4.00%, 5/20/40 - 4/20/49 | | | 31,328,679 | | | | 33,048,320 | |
GNMA II SF 30 Year, 4.00%, 11/20/40 | | | 28,199,187 | | | | 30,059,608 | |
GNMA II SF 30 Year, 4.00%, 12/20/40 | | | 16,713,691 | | | | 17,818,097 | |
GNMA II SF 30 Year, 4.00%, 1/20/41 | | | 18,394,236 | | | | 19,611,682 | |
GNMA II SF 30 Year, 4.00%, 7/20/41 | | | 22,330,442 | | | | 23,822,515 | |
GNMA II SF 30 Year, 4.00%, 9/20/41 | | | 26,546,927 | | | | 28,189,558 | |
GNMA II SF 30 Year, 4.00%, 10/20/41 | | | 32,631,779 | | | | 34,810,310 | |
GNMA II SF 30 Year, 4.00%, 11/20/41 | | | 30,086,057 | | | | 32,094,145 | |
GNMA II SF 30 Year, 4.00%, 2/20/44 | | | 18,709,078 | | | | 19,806,310 | |
GNMA II SF 30 Year, 4.00%, 12/20/48 | | | 35,331,040 | | | | 36,821,309 | |
GNMA II SF 30 Year, 4.00%, 5/20/49 | | | 414,484,635 | | | | 431,802,616 | |
GNMA II SF 30 Year, 4.00%, 7/20/49 | | | 93,528,939 | | | | 97,583,489 | |
GNMA II SF 30 Year, 4.50%, 5/20/33 - 8/20/42 | | | 47,212,944 | | | | 51,452,637 | |
GNMA II SF 30 Year, 4.50%, 12/20/39 | | | 18,836,142 | | | | 20,545,819 | |
GNMA II SF 30 Year, 4.50%, 5/20/41 | | | 24,528,627 | | | | 26,846,133 | |
GNMA II SF 30 Year, 4.50%, 6/20/41 | | | 29,424,693 | | | | 32,186,554 | |
GNMA II SF 30 Year, 4.50%, 7/20/41 | | | 32,197,805 | | | | 35,210,096 | |
GNMA II SF 30 Year, 4.50%, 9/20/41 | | | 43,536,595 | | | | 47,660,748 | |
GNMA II SF 30 Year, 4.50%, 10/20/41 | | | 32,418,803 | | | | 35,413,026 | |
GNMA II SF 30 Year, 4.50%, 2/20/44 | | | 17,382,077 | | | | 18,643,922 | |
GNMA II SF 30 Year, 4.50%, 12/20/48 | | | 16,710,460 | | | | 17,523,698 | |
GNMA II SF 30 Year, 4.50%, 1/20/49 | | | 306,205 | | | | 320,483 | |
GNMA II SF 30 Year, 5.00%, 7/20/33 - 4/20/40 | | | 43,585,289 | | | | 48,236,696 | |
GNMA II SF 30 Year, 5.00%, 9/20/33 | | | 18,416,087 | | | | 20,413,694 | |
GNMA II SF 30 Year, 5.00%, 5/20/40 - 9/20/41 | | | 19,748,434 | | | | 21,852,566 | |
GNMA II SF 30 Year, 5.50%, 6/20/34 - 5/20/35 | | | 44,730,647 | | | | 50,571,507 | |
GNMA II SF 30 Year, 5.50%, 6/20/35 - 4/20/40 | | | 25,340,913 | | | | 28,452,876 | |
GNMA II SF 30 Year, 6.00%, 10/20/23 - 1/20/38 | | | 43,344,148 | | | | 49,879,269 | |
GNMA II SF 30 Year, 6.00%, 7/20/38 - 7/20/39 | | | 9,474,908 | | | | 10,905,567 | |
GNMA II SF 30 Year, 6.50%, 6/20/24 - 1/20/39 | | | 17,658,962 | | | | 20,280,075 | |
| | | | |
| | | |
| franklintempleton.com | | Annual Report | | 89 |
FRANKLIN CUSTODIAN FUNDS
STATEMENT OF INVESTMENTS
Franklin U.S. Government Securities Fund(continued)
| | | | | | | | |
| | | Principal
Amount | | | Value | |
| | |
Mortgage-Backed Securities(continued) | | | | | | | | |
Government National Mortgage Association (GNMA) Fixed Rate(continued) | | | | | | | | |
GNMA II SF 30 Year, 7.00%, 2/20/28 - 7/20/33 | | | $ 4,549,147 | | | $ | 5,329,820 | |
GNMA II SF 30 Year, 7.50%, 10/20/22 - 4/20/32 | | | 820,173 | | | | 917,690 | |
GNMA II SF 30 Year, 8.00%, 5/20/24 - 6/20/30 | | | 419,477 | | | | 479,701 | |
GNMA II SF 30 Year, 8.50%, 7/20/21 - 6/20/25 | | | 54,524 | | | | 55,391 | |
GNMA II SF 30 Year, 9.00%, 10/20/21 - 11/20/21 | | | 8,308 | | | | 8,397 | |
GNMA II SF 30 Year, 9.50%, 9/20/20 - 4/20/25 | | | 21,283 | | | | 21,443 | |
GNMA II SF 30 Year, 10.00%, 7/20/20 - 3/20/21 | | | 15,124 | | | | 15,269 | |
GNMA II SF 30 Year, 10.50%, 6/20/20 - 1/20/21 | | | 8,177 | | | | 8,200 | |
GNMA II SF 30 Year, 11.00%, 1/20/21 | | | 1,414 | | | | 1,418 | |
| | | | | | | | |
| | |
Total Mortgage-Backed Securities (Cost $4,940,470,691) | | | | | | | 5,048,328,271 | |
| | | | | | | | |
| | |
U.S. Government and Agency Securities (Cost $19,227,065) 0.4% | | | | | | | | |
U.S. Treasury Bond, 4.75%, 2/15/37 | | | 14,500,000 | | | | 20,796,455 | |
| | | | | | | | |
| | |
Total Investments before Short Term Investments
(Cost $4,959,697,756) | | | | | | | 5,069,124,726 | |
| | |
| | | Shares | | | | | |
| | | | | | | | |
| | |
Short Term Investments (Cost $86,808,469) 1.7% | | | | | | | | |
| | |
Money Market Funds 1.7% | | | | | | | | |
a,bInstitutional Fiduciary Trust Money Market Portfolio, 1.71% | | | 86,808,469 | | | | 86,808,469 | |
| | | | | | | | |
| | |
Total Investments (Cost $5,046,506,225) 99.8% | | | | | | | 5,155,933,195 | |
Other Assets, less Liabilities 0.2% | | | | | | | 8,109,360 | |
| | | | | | | | |
Net Assets 100.0% | | | | | | $ | 5,164,042,555 | |
| | | | | | | | |
See Abbreviations on page 133.
aSee Note 3(f) regarding investments in affiliated management investment companies.
bThe rate shown is the annualizedseven-day effective yield at period end.
| | | | |
| | | |
90 | | Annual Report | The accompanying notes are an integral part of these financial statements. | | franklintempleton.com |
FRANKLIN CUSTODIAN FUNDS
Financial Highlights
Franklin Utilities Fund
| | | | | | | | |
| | | Year Ended September 30, | |
| | |
| | | 2019 | | | 2018a | |
| | |
Class A | | | | | | | | |
| | |
Per share operating performance (for a share outstanding throughout the year) | | | | | | | | |
| | |
Net asset value, beginning of year | | | $18.66 | | | | $19.16 | |
| | | | |
| | |
Income from investment operationsb: | | | | | | | | |
| | |
Net investment incomec | | | 0.53 | | | | 0.02 | |
| | |
Net realized and unrealized gains (losses) | | | 4.41 | | | | (0.52) | |
| | | | |
| | |
Total from investment operations | | | 4.94 | | | | (0.50) | |
| | | | |
| | |
Less distributions from: | | | | | | | | |
| | |
Net investment income | | | (0.49 | ) | | | — | |
| | |
Net realized gains | | | (0.58 | ) | | | — | |
| | | | |
| | |
Total distributions | | | (1.07 | ) | | | — | |
| | | | |
| | |
Net asset value, end of year | | | $22.53 | | | | $18.66 | |
| | | | |
| | |
Total returnd | | | 27.43% | | | | (2.61)% | |
| | |
Ratios to average net assetse | | | | | | | | |
| | |
Expensesf | | | 0.83% | | | | 0.84% | |
| | |
Net investment income | | | 2.51% | | | | 2.62% | |
| | |
Supplemental data | | | | | | | | |
| | |
Net assets, end of year (000’s) | | | $521,782 | | | | $3,536 | |
| | |
Portfolio turnover rate | | | 7.90% | | | | 4.58% | |
aFor the period September 10, 2018 (effective date) to September 30, 2018.
bThe amount shown for a share outstanding throughout the period may not correlate with the Statement of Operations for the period due to the timing of sales and repurchases of the Fund’s shares in relation to income earned and/or fluctuating fair value of the investments of the Fund.
cBased on average daily shares outstanding.
dTotal return does not reflect sales commissions or contingent deferred sales charges, if applicable, and is not annualized for periods less than one year.
eRatios are annualized for periods less than one year.
fBenefit of waiver and payments by affiliates and expense reduction rounds to less than 0.01%.
| | | | |
| | | |
| franklintempleton.com | | The accompanying notes are an integral part of these financial statements. | Annual Report | | 91 |
FRANKLIN CUSTODIAN FUNDS
FINANCIAL HIGHLIGHTS
Franklin Utilities Fund(continued)
| | | | | | | | | | | | | | | | | | | | |
| | | Year Ended September 30, | |
| | | 2019 | | | 2018 | | | 2017 | | | 2016 | | | 2015 | |
| |
| | | | | |
Class A1 | | | | | | | | | | | | | | | | | | | | |
| | | | | |
Per share operating performance (for a share outstanding throughout the year) | | | | | | | | | | | | | | | | | | | | |
| | | | | |
Net asset value, beginning of year | | | $18.66 | | | | $19.18 | | | | $17.85 | | | | $16.08 | | | | $16.58 | |
| | | | |
| | | | | |
Income from investment operationsa: | | | | | | | | | | | | | | | | | | | | |
| | | | | |
Net investment incomeb | | | 0.53 | | | | 0.50 | | | | 0.53 | | | | 0.48 | | | | 0.49 | |
| | | | | |
Net realized and unrealized gains (losses) | | | 4.44 | | | | (0.17 | ) | | | 1.30 | | | | 2.31 | | | | (0.09) | |
| | | | |
| | | | | |
Total from investment operations | | | 4.97 | | | | 0.33 | | | | 1.83 | | | | 2.79 | | | | 0.40 | |
| | | | |
| | | | | |
Less distributions from: | | | | | | | | | | | | | | | | | | | | |
| | | | | |
Net investment income | | | (0.51 | ) | | | (0.54 | ) | | | (0.49 | ) | | | (0.50 | ) | | | (0.48) | |
| | | | | |
Net realized gains | | | (0.58 | ) | | | (0.31 | ) | | | (0.01 | ) | | | (0.52 | ) | | | (0.42) | |
| | | | |
| | | | | |
Total distributions | | | (1.09 | ) | | | (0.85 | ) | | | (0.50 | ) | | | (1.02 | ) | | | (0.90) | |
| | | | |
| | | | | |
Net asset value, end of year | | | $22.54 | | | | $18.66 | | | | $19.18 | | | | $17.85 | | | | $16.08 | |
| | | | |
| | | | | |
Total returnc | | | 27.61% | | | | 1.68% | | | | 10.38% | | | | 18.23% | | | | 2.19% | |
| | | | | |
Ratios to average net assets | | | | | | | | | | | | | | | | | | | | |
| | | | | |
Expensesd | | | 0.73% | e | | | 0.74% | e | | | 0.75% | e | | | 0.73% | e | | | 0.73% | |
| | | | | |
Net investment income | | | 2.61% | | | | 2.72% | | | | 2.86% | | | | 2.81% | | | | 2.88% | |
| | | | | |
Supplemental data | | | | | | | | | | | | | | | | | | | | |
| | | | | |
Net assets, end of year (000’s) | | | $4,176,487 | | | | $3,654,795 | | | | $4,182,780 | | | | $4,180,124 | | | | $3,524,835 | |
| | | | | |
Portfolio turnover rate | | | 7.90% | | | | 4.58% | | | | 0.89% | | | | 7.17% | | | | 9.55% | |
aThe amount shown for a share outstanding throughout the period may not correlate with the Statement of Operations for the period due to the timing of sales and repurchases of the Fund’s shares in relation to income earned and/or fluctuating fair value of the investments of the Fund.
bBased on average daily shares outstanding.
cTotal return does not reflect sales commissions or contingent deferred sales charges, if applicable.
dBenefit of waiver and payments by affiliates rounds to less than 0.01%.
eBenefit of expense reduction rounds to less than 0.01%.
| | | | |
| | | |
92 | | Annual Report | The accompanying notes are an integral part of these financial statements. | | franklintempleton.com |
FRANKLIN CUSTODIAN FUNDS
FINANCIAL HIGHLIGHTS
Franklin Utilities Fund(continued)
| | | | | | | | | | | | | | | | | | | | |
| | | Year Ended September 30, | |
| | | 2019 | | | 2018 | | | 2017 | | | 2016 | | | 2015 | |
| |
| | | | | |
Class C | | | | | | | | | | | | | | | | | | | | |
| | | | | |
Per share operating performance (for a share outstanding throughout the year) | | | | | | | | | | | | | | | | | | | | |
| | | | | |
Net asset value, beginning of year | | | $18.57 | | | | $19.09 | | | | $17.76 | | | | $16.01 | | | | $16.50 | |
| | | | |
| | | | | |
Income from investment operationsa: | | | | | | | | | | | | | | | | | | | | |
| | | | | |
Net investment incomeb | | | 0.42 | | | | 0.41 | | | | 0.43 | | | | 0.39 | | | | 0.40 | |
| | | | | |
Net realized and unrealized gains (losses) | | | 4.43 | | | | (0.18 | ) | | | 1.30 | | | | 2.30 | | | | (0.08) | |
| | | | |
| | | | | |
Total from investment operations | | | 4.85 | | | | 0.23 | | | | 1.73 | | | | 2.69 | | | | 0.32 | |
| | | | |
| | | | | |
Less distributions from: | | | | | | | | | | | | | | | | | | | | |
| | | | | |
Net investment income | | | (0.42 | ) | | | (0.44 | ) | | | (0.39 | ) | | | (0.42 | ) | | | (0.39) | |
| | | | | |
Net realized gains | | | (0.58 | ) | | | (0.31 | ) | | | (0.01 | ) | | | (0.52 | ) | | | (0.42) | |
| | | | |
| | | | | |
Total distributions | | | (1.00 | ) | | | (0.75 | ) | | | (0.40 | ) | | | (0.94 | ) | | | (0.81) | |
| | | | |
| | | | | |
Net asset value, end of year | | | $22.42 | | | | $18.57 | | | | $19.09 | | | | $17.76 | | | | $16.01 | |
| | | | |
| | | | | |
Total returnc | | | 26.96% | | | | 1.18% | | | | 9.88% | | | | 17.59% | | | | 1.74% | |
| | | | | |
Ratios to average net assets | | | | | | | | | | | | | | | | | | | | |
| | | | | |
Expensesd | | | 1.23% | e | | | 1.24% | e | | | 1.25% | e | | | 1.23% | e | | | 1.23% | |
| | | | | |
Net investment income | | | 2.11% | | | | 2.22% | | | | 2.36% | | | | 2.31% | | | | 2.38% | |
| | | | | |
Supplemental data | | | | | | | | | | | | | | | | | | | | |
| | | | | |
Net assets, end of year (000’s) | | | $767,363 | | | | $834,070 | | | | $981,515 | | | | $1,064,065 | | | | $931,800 | |
| | | | | |
Portfolio turnover rate | | | 7.90% | | | | 4.58% | | | | 0.89% | | | | 7.17% | | | | 9.55% | |
aThe amount shown for a share outstanding throughout the period may not correlate with the Statement of Operations for the period due to the timing of sales and repurchases of the Fund’s shares in relation to income earned and/or fluctuating fair value of the investments of the Fund.
bBased on average daily shares outstanding.
cTotal return does not reflect sales commissions or contingent deferred sales charges, if applicable.
dBenefit of waiver and payments by affiliates rounds to less than 0.01%.
eBenefit of expense reduction rounds to less than 0.01%.
| | | | |
| | | |
| franklintempleton.com | | The accompanying notes are an integral part of these financial statements. | Annual Report | | 93 |
FRANKLIN CUSTODIAN FUNDS
FINANCIAL HIGHLIGHTS
Franklin Utilities Fund(continued)
| | | | | | | | | | | | | | | | | | | | |
| | | Year Ended September 30, | |
| | | 2019 | | | 2018 | | | 2017 | | | 2016 | | | 2015 | |
| |
| | | | | |
Class R | | | | | | | | | | | | | | | | | | | | |
| | | | | |
Per share operating performance (for a share outstanding throughout the year) | | | | | | | | | | | | | | | | | | | | |
| | | | | |
Net asset value, beginning of year | | | $18.59 | | | | $19.11 | | | | $17.78 | | | | $16.02 | | | | $16.52 | |
| | | | |
| | | | | |
Income from investment operationsa: | | | | | | | | | | | | | | | | | | | | |
| | | | | |
Net investment incomeb | | | 0.45 | | | | 0.44 | | | | 0.46 | | | | 0.42 | | | | 0.42 | |
| | | | | |
Net realized and unrealized gains (losses) | | | 4.44 | | | | (0.18 | ) | | | 1.30 | | | | 2.30 | | | | (0.09) | |
| | | | |
| | | | | |
Total from investment operations | | | 4.89 | | | | 0.26 | | | | 1.76 | | | | 2.72 | | | | 0.33 | |
| | | | |
| | | | | |
Less distributions from: | | | | | | | | | | | | | | | | | | | | |
| | | | | |
Net investment income | | | (0.45 | ) | | | (0.47 | ) | | | (0.42 | ) | | | (0.44 | ) | | | (0.41) | |
| | | | | |
Net realized gains | | | (0.58 | ) | | | (0.31 | ) | | | (0.01 | ) | | | (0.52 | ) | | | (0.42) | |
| | | | |
| | | | | |
Total distributions | | | (1.03 | ) | | | (0.78 | ) | | | (0.43 | ) | | | (0.96 | ) | | | (0.83) | |
| | | | |
| | | | | |
Net asset value, end of year | | | $22.45 | | | | $18.59 | | | | $19.11 | | | | $17.78 | | | | $16.02 | |
| | | | |
| | | | | |
Total return | | | 27.17% | | | | 1.33% | | | | 10.04% | | | | 17.81% | | | | 1.83% | |
| | | | | |
Ratios to average net assets | | | | | | | | | | | | | | | | | | | | |
| | | | | |
Expensesc | | | 1.08% | d | | | 1.09% | d | | | 1.10% | d | | | 1.08% | d | | | 1.08% | |
| | | | | |
Net investment income | | | 2.26% | | | | 2.37% | | | | 2.51% | | | | 2.46% | | | | 2.53% | |
| | | | | |
Supplemental data | | | | | | | | | | | | | | | | | | | | |
| | | | | |
Net assets, end of year (000’s) | | | $103,376 | | | | $72,927 | | | | $94,465 | | | | $103,247 | | | | $83,271 | |
| | | | | |
Portfolio turnover rate | | | 7.90% | | | | 4.58% | | | | 0.89% | | | | 7.17% | | | | 9.55% | |
aThe amount shown for a share outstanding throughout the period may not correlate with the Statement of Operations for the period due to the timing of sales and repurchases of the Fund’s shares in relation to income earned and/or fluctuating fair value of the investments of the Fund.
bBased on average daily shares outstanding.
cBenefit of waiver and payments by affiliates rounds to less than 0.01%.
dBenefit of expense reduction rounds to less than 0.01%.
| | | | |
| | | |
94 | | Annual Report | The accompanying notes are an integral part of these financial statements. | | franklintempleton.com |
FRANKLIN CUSTODIAN FUNDS
FINANCIAL HIGHLIGHTS
Franklin Utilities Fund(continued)
| | | | | | | | | | | | | | | | | | | | |
| | | Year Ended September 30, | |
| | | 2019 | | | 2018 | | | 2017 | | | 2016 | | | 2015 | |
| |
| | | | | |
Class R6 | | | | | | | | | | | | | | | | | | | | |
| | | | | |
Per share operating performance (for a share outstanding throughout the year) | | | | | | | | | | | | | | | | | | | | |
| | | | | |
Net asset value, beginning of year | | | $18.81 | | | | $19.32 | | | | $17.97 | | | | $16.18 | | | | $16.68 | |
| | | | |
| | | | | |
Income from investment operationsa: | | | | | | | | | | | | | | | | | | | | |
| | | | | |
Net investment incomeb | | | 0.56 | | | | 0.55 | | | | 0.58 | | | | 0.53 | | | | 0.53 | |
| | | | | |
Net realized and unrealized gains (losses) | | | 4.50 | | | | (0.17 | ) | | | 1.31 | | | | 2.32 | | | | (0.09) | |
| | | | |
| | | | | |
Total from investment operations | | | 5.06 | | | | 0.38 | | | | 1.89 | | | | 2.85 | | | | 0.44 | |
| | | | |
| | | | | |
Less distributions from: | | | | | | | | | | | | | | | | | | | | |
| | | | | |
Net investment income | | | (0.56 | ) | | | (0.58 | ) | | | (0.53 | ) | | | (0.54 | ) | | | (0.52) | |
| | | | | |
Net realized gains | | | (0.58 | ) | | | (0.31 | ) | | | (0.01 | ) | | | (0.52 | ) | | | (0.42) | |
| | | | |
| | | | | |
Total distributions | | | (1.14 | ) | | | (0.89 | ) | | | (0.54 | ) | | | (1.06 | ) | | | (0.94) | |
| | | | |
| | | | | |
Net asset value, end of year | | | $22.73 | | | | $18.81 | | | | $19.32 | | | | $17.97 | | | | $16.18 | |
| | | | |
| | | | | |
Total return | | | 27.89% | | | | 1.97% | | | | 10.70% | | | | 18.55% | | | | 2.45% | |
| | | | | |
Ratios to average net assets | | | | | | | | | | | | | | | | | | | | |
| | | | | |
Expenses before waiver and payments by affiliates | | | 0.53% | | | | 0.52% | | | | 0.48% | | | | 0.47% | | | | 0.47% | |
| | | | | |
Expenses net of waiver and payments by affiliates | | | 0.50% | c | | | 0.48% | c | | | 0.48% | c,d | | | 0.47% | c,d | | | 0.47%d | |
| | | | | |
Net investment income | | | 2.84% | | | | 2.98% | | | | 3.13% | | | | 3.07% | | | | 3.14% | |
| | | | | |
Supplemental data | | | | | | | | | | | | | | | | | | | | |
| | | | | |
Net assets, end of year (000’s) | | | $150,244 | | | | $230,393 | | | | $241,455 | | | | $219,587 | | | | $201,225 | |
| | | | | |
Portfolio turnover rate | | | 7.90% | | | | 4.58% | | | | 0.89% | | | | 7.17% | | | | 9.55% | |
aThe amount shown for a share outstanding throughout the period may not correlate with the Statement of Operations for the period due to the timing of sales and repurchases of the Fund’s shares in relation to income earned and/or fluctuating fair value of the investments of the Fund.
bBased on average daily shares outstanding.
cBenefit of expense reduction rounds to less than 0.01%.
dBenefit of waiver and payments by affiliates rounds to less than 0.01%.
| | | | |
| | | |
| franklintempleton.com | | The accompanying notes are an integral part of these financial statements. | Annual Report | | 95 |
FRANKLIN CUSTODIAN FUNDS
FINANCIAL HIGHLIGHTS
Franklin Utilities Fund(continued)
| | | | | | | | | | | | | | | | | | | | |
| | | Year Ended September 30, | |
| | | 2019 | | | 2018 | | | 2017 | | | 2016 | | | 2015 | |
| |
| | | | | |
Advisor Class | | | | | | | | | | | | | | | | | | | | |
| | | | | |
Per share operating performance (for a share outstanding throughout the year) | | | | | | | | | | | | | | | | | | | | |
| | | | | |
Net asset value, beginning of year | | | $18.81 | | | | $19.32 | | | | $17.97 | | | | $16.19 | | | | $16.68 | |
| | | | |
| | | | | |
Income from investment operationsa: | | | | | | | | | | | | | | | | | | | | |
| | | | | |
Net investment incomeb | | | 0.56 | | | | 0.54 | | | | 0.57 | | | | 0.51 | | | | 0.52 | |
| | | | | |
Net realized and unrealized gains (losses) | | | 4.48 | | | | (0.18 | ) | | | 1.30 | | | | 2.32 | | | | (0.09) | |
| | | | |
| | | | | |
Total from investment operations | | | 5.04 | | | | 0.36 | | | | 1.87 | | | | 2.83 | | | | 0.43 | |
| | | | |
| | | | | |
Less distributions from: | | | | | | | | | | | | | | | | | | | | |
| | | | | |
Net investment income | | | (0.54 | ) | | | (0.56 | ) | | | (0.51 | ) | | | (0.53 | ) | | | (0.50) | |
| | | | | |
Net realized gains | | | (0.58 | ) | | | (0.31 | ) | | | (0.01 | ) | | | (0.52 | ) | | | (0.42) | |
| | | | |
| | | | | |
Total distributions | | | (1.12 | ) | | | (0.87 | ) | | | (0.52 | ) | | | (1.05 | ) | | | (0.92) | |
| | | | |
| | | | | |
Net asset value, end of year | | | $22.73 | | | | $18.81 | | | | $19.32 | | | | $17.97 | | | | $16.19 | |
| | | | |
| | | | | |
Total return | | | 27.78% | | | | 1.82% | | | | 10.64% | | | | 18.34% | | | | 2.40% | |
| | | | | |
Ratios to average net assets | | | | | | | | | | | | | | | | | | | | |
| | | | | |
Expensesc | | | 0.58% | d | | | 0.59% | d | | | 0.60% | d | | | 0.58% | d | | | 0.58% | |
| | | | | |
Net investment income | | | 2.76% | | | | 2.87% | | | | 3.01% | | | | 2.96% | | | | 3.03% | |
| | | | | |
Supplemental data | | | | | | | | | | | | | | | | | | | | |
| | | | | |
Net assets, end of year (000’s) | | | $1,262,883 | | | | $927,845 | | | | $963,228 | | | | $755,484 | | | | $549,371 | |
| | | | | |
Portfolio turnover rate | | | 7.90% | | | | 4.58% | | | | 0.89% | | | | 7.17% | | | | 9.55% | |
aThe amount shown for a share outstanding throughout the period may not correlate with the Statement of Operations for the period due to the timing of sales and repurchases of the Fund’s shares in relation to income earned and/or fluctuating fair value of the investments of the Fund.
bBased on average daily shares outstanding.
cBenefit of waiver and payments by affiliates rounds to less than 0.01%.
dBenefit of expense reduction rounds to less than 0.01%.
| | | | |
| | | |
96 | | Annual Report | The accompanying notes are an integral part of these financial statements. | | franklintempleton.com |
FRANKLIN CUSTODIAN FUNDS
Statement of Investments, September 30, 2019
Franklin Utilities Fund
| | | | | | | | | | |
| | | Country | | Shares | | | Value | |
| | | |
Common Stocks 99.4% | | | | | | | | | | |
Electric Utilities 57.3% | | | | | | | | | | |
Alliant Energy Corp. | | United States | | | 3,856,870 | | | $ | 208,000,999 | |
American Electric Power Co. Inc. | | United States | | | 3,800,000 | | | | 356,022,000 | |
Duke Energy Corp. | | United States | | | 3,000,000 | | | | 287,580,000 | |
Edison International | | United States | | | 3,800,000 | | | | 286,596,000 | |
Emera Inc. | | Canada | | | 2,000,000 | | | | 87,835,083 | |
Entergy Corp. | | United States | | | 2,100,000 | | | | 246,456,000 | |
Evergy Inc. | | United States | | | 4,100,000 | | | | 272,896,000 | |
Eversource Energy | | United States | | | 2,650,000 | | | | 226,495,500 | |
Exelon Corp. | | United States | | | 6,600,000 | | | | 318,846,000 | |
FirstEnergy Corp. | | United States | | | 4,500,000 | | | | 217,035,000 | |
NextEra Energy Inc. | | United States | | | 2,600,000 | | | | 605,774,000 | |
OGE Energy Corp. | | United States | | | 1,400,000 | | | | 63,532,000 | |
aPG&E Corp. | | United States | | | 400,000 | | | | 4,000,000 | |
Pinnacle West Capital Corp. | | United States | | | 1,350,000 | | | | 131,044,500 | |
PNM Resources Inc. | | United States | | | 2,000,070 | | | | 104,163,646 | |
PPL Corp. | | United States | | | 2,200,000 | | | | 69,278,000 | |
The Southern Co. | | United States | | | 3,800,000 | | | | 234,726,000 | |
Xcel Energy Inc. | | United States | | | 4,300,000 | | | | 279,027,000 | |
| | | | | | | | | | |
| | | |
| | | | | | | | | 3,999,307,728 | |
| | | | | | | | | | |
Gas Utilities 1.3% | | | | | | | | | | |
Atmos Energy Corp. | | United States | | | 250,000 | | | | 28,472,500 | |
Southwest Gas Holdings Inc. | | United States | | | 43,346 | | | | 3,946,220 | |
Spire Inc. | | United States | | | 700,000 | | | | 61,068,000 | |
| | | | | | | | | | |
| | | |
| | | | | | | | | 93,486,720 | |
| | | | | | | | | | |
Multi-Utilities 32.2% | | | | | | | | | | |
Ameren Corp. | | United States | | | 1,100,000 | | | | 88,055,000 | |
Black Hills Corp. | | United States | | | 500,000 | | | | 38,365,000 | |
CenterPoint Energy Inc. | | United States | | | 5,700,000 | | | | 172,026,000 | |
CMS Energy Corp. | | United States | | | 5,000,000 | | | | 319,750,000 | |
Consolidated Edison Inc. | | United States | | | 1,400,000 | | | | 132,258,000 | |
Dominion Energy Inc. | | United States | | | 4,250,000 | | | | 344,420,000 | |
DTE Energy Co. | | United States | | | 1,600,000 | | | | 212,736,000 | |
E.ON SE | | Germany | | | 4,000,000 | | | | 38,883,271 | |
National Grid PLC | | United Kingdom | | | 5,999,933 | | | | 65,051,747 | |
NiSource Inc. | | United States | | | 3,800,000 | | | | 113,696,000 | |
NorthWestern Corp. | | United States | | | 596,800 | | | | 44,789,840 | |
Public Service Enterprise Group Inc. | | United States | | | 3,000,000 | | | | 186,240,000 | |
Sempra Energy | | United States | | | 2,200,000 | | | | 324,742,000 | |
WEC Energy Group Inc. | | United States | | | 1,750,000 | | | | 166,425,000 | |
| | | | | | | | | | |
| | | |
| | | | | | | | | 2,247,437,858 | |
| | | | | | | | | | |
Oil, Gas & Consumable Fuels 3.9% | | | | | | | | | | |
aCheniere Energy Inc. | | United States | | | 900,000 | | | | 56,754,000 | |
Kinder Morgan Inc. | | United States | | | 1,800,000 | | | | 37,098,000 | |
ONEOK Inc. | | United States | | | 568,200 | | | | 41,870,658 | |
Targa Resources Corp. | | United States | | | 800,000 | | | | 32,136,000 | |
| | | | |
| | | |
| franklintempleton.com | | Annual Report | | 97 |
FRANKLIN CUSTODIAN FUNDS
STATEMENT OF INVESTMENTS
Franklin Utilities Fund(continued)
| | | | | | | | | | |
| | | Country | | Shares | | | Value | |
| | | |
Common Stocks (continued) | | | | | | | | | | |
Oil, Gas & Consumable Fuels(continued) | | | | | | | | | | |
The Williams Cos. Inc. | | United States | | | 4,400,000 | | | $ | 105,864,000 | |
| | | | | | | | | | |
| | | |
| | | | | | | | | 273,722,658 | |
| | | | | | | | | | |
| | | |
Water Utilities 4.7% | | | | | | | | | | |
American Water Works Co. Inc. | | United States | | | 1,500,000 | | | | 186,345,000 | |
Aqua America Inc. | | United States | | | 1,750,000 | | | | 78,452,500 | |
United Utilities Group PLC | | United Kingdom | | | 6,000,000 | | | | 60,914,312 | |
| | | | | | | | | | |
| | | |
| | | | | | | | | 325,711,812 | |
| | | | | | | | | | |
| | | |
Total Common Stocks (Cost $3,126,206,972) | | | | | | | | | 6,939,666,776 | |
| | | | | | | | | | |
| | | |
| | | | | Principal
Amount | | | | |
Corporate Bonds (Cost $6,089,472) 0.1% | | | | | | | | | | |
Multi-Utilities 0.1% | | | | | | | | | | |
Aquila Inc., senior note, 8.27%, 11/15/21 | | United States | | $ | 6,100,000 | | | | 6,837,079 | |
| | | | | | | | | | |
| | | |
Total Investments before Short Term Investments
(Cost $3,132,296,444) | | | | | | | | | 6,946,503,855 | |
| | | | | | | | | | |
| | | |
| | | | | Shares | | | | |
| | | |
Short Term Investments (Cost $35,371,057) 0.5% | | | | | | | | | | |
| | | |
Money Market Funds 0.5% | | | | | | | | | | |
b,cInstitutional Fiduciary Trust Money Market Portfolio, 1.71% | | United States | | | 35,371,057 | | | | 35,371,057 | |
| | | | | | | | | | |
| | | |
Total Investments (Cost $3,167,667,501) 100.0% | | | | | | | | | 6,981,874,912 | |
Other Assets, less Liabilities 0.0%† | | | | | | | | | 259,205 | |
| | | | | | | | | | |
| | | |
Net Assets 100.0% | | | | | | | | $ | 6,982,134,117 | |
| | | | | | | | | | |
†Rounds to less than 0.1% of net assets.
aNon-income producing.
bSee Note 3(f) regarding investments in affiliated management investment companies.
cThe rate shown is the annualizedseven-day effective yield at period end.
| | | | |
| | | |
98 | | Annual Report | The accompanying notes are an integral part of these financial statements. | | franklintempleton.com |
FRANKLIN CUSTODIAN FUNDS
FINANCIAL STATEMENTS
Statements of Assets and Liabilities
September 30, 2019
| | | | | | | | | | | | |
| | | Franklin DynaTech Fund | | | Franklin Growth Fund | | | Franklin Income Fund | |
| | | |
Assets: | | | | | | | | | | | | |
+Investments in securities: | | | | | | | | | | | | |
Cost - Unaffiliated issuers | | | $4,736,572,428 | | | | $ 5,327,027,738 | | | | $68,163,651,536 | |
Cost -Non-controlled affiliates (Note 3f and 9) | | | 439,351,721 | | | | 195,726,982 | | | | 3,719,831,367 | |
Cost - Unaffiliated repurchase agreements | | | 77,855,135 | | | | — | | | | 5,976,422 | |
| | | | |
| | | |
Value - Unaffiliated issuers | | | $8,325,204,724 | | | | $15,830,913,823 | | | | $71,197,540,638 | |
Value -Non-controlled affiliates (Note 3f and 9) | | | 439,351,721 | | | | 195,726,982 | | | | 3,068,314,880 | |
Value - Unaffiliated repurchase agreements | | | 77,855,135 | | | | — | | | | 5,976,422 | |
Cash | | | — | | | | 1,204,958 | | | | 48,810,386 | |
Receivables: | | | | | | | | | | | | |
Investment securities sold | | | — | | | | — | | | | 132,333,147 | |
Capital shares sold | | | 30,039,800 | | | | 14,892,624 | | | | 60,864,948 | |
Dividends and interest | | | 1,814,713 | | | | 8,159,147 | | | | 596,667,813 | |
Variation margin on futures contracts | | | — | | | | — | | | | 898,495 | |
Other assets | | | 2,771 | | | | 6,178 | | | | 53,853 | |
| | | | |
| | | |
Total assets | | | 8,874,268,864 | | | | 16,050,903,712 | | | | 75,111,460,582 | |
| | | | |
| | | |
Liabilities: | | | | | | | | | | | | |
Payables: | | | | | | | | | | | | |
Investment securities purchased | | | — | | | | — | | | | 298,972,439 | |
Capital shares redeemed | | | 11,717,153 | | | | 38,863,386 | | | | 72,787,491 | |
Management fees | | | 3,200,816 | | | | 5,826,890 | | | | 22,931,773 | |
Distribution fees | | | 3,037,157 | | | | 5,385,820 | | | | 28,106,912 | |
Transfer agent fees | | | 1,262,706 | | | | 3,390,327 | | | | 10,126,075 | |
Options written, at value (premiums received $—, $— and $156,672,971, respectively) | | | — | | | | — | | | | 119,615,000 | |
Payable upon return of securities loaned | | | — | | | | — | | | | 29,878,422 | |
Accrued expenses and other liabilities | | | 423,449 | | | | 593,315 | | | | 3,140,879 | |
| | | | |
| | | |
Total liabilities | | | 19,641,281 | | | | 54,059,738 | | | | 585,558,991 | |
| | | | |
| | | |
Net assets, at value | | | $8,854,627,583 | | | | $15,996,843,974 | | | | $74,525,901,591 | |
| | | | |
| | | |
Net assets consist of: | | | | | | | | | | | | |
Paid-in capital | | | $5,211,748,006 | | | | $ 4,718,009,853 | | | | $74,971,736,256 | |
Total distributable earnings (loss) | | | 3,642,879,577 | | | | 11,278,834,121 | | | | (445,834,665 | ) |
| | | | |
| | | |
Net assets, at value | | | $8,854,627,583 | | | | $15,996,843,974 | | | | $74,525,901,591 | |
| | | | |
| | | | | | | | | | | | |
| | | | | | | | | | | | |
| | | | | | | | | | | | |
| | | | | | | | | | | | |
| | | | | | | | | | | | |
| | | | | | | | | | | | |
| | | | | | | | | | | | |
| | | | | | | | | | | | |
| | | | | | | | | | | | |
| | | | | | | | | | | | |
| +Includes securities loaned | | | $ — | | | | $ — | | | | $ 29,018,559 | |
| | | | |
| | | |
| franklintempleton.com | | The accompanying notes are an integral part of these financial statements. | Annual Report | | 99 |
FRANKLIN CUSTODIAN FUNDS
FINANCIAL STATEMENTS
Statements of Assets and Liabilities(continued)
September 30, 2019
| | | | | | | | | | | | |
| | | Franklin DynaTech Fund | | | Franklin Growth Fund | | | Franklin Income Fund | |
| | | |
| Class A: | | | | | | | | | | | | |
Net assets, at value | | | $4,504,433,747 | | | | $9,157,153,548 | | | | $ 7,427,467,722 | |
| | | | |
Shares outstanding | | | 54,372,823 | | | | 83,219,133 | | | | 3,231,941,018 | |
| | | | |
Net asset value per sharea | | | $82.84 | | | | $110.04 | | | | $2.30 | |
| | | | |
Maximum offering price per share (net asset value per share ÷ 94.50%, 94.50% and 96.25%, respectively) | | | $87.66 | | | | $116.44 | | | | $2.39 | |
| | | | |
Class A1: | | | | | | | | | | | | |
Net assets, at value | | | | | | | | | | | $39,625,648,843 | |
| | | | | | | | | | | | |
Shares outstanding | | | | | | | | | | | 17,199,182,611 | |
| | | | | | | | | | | | |
Net asset value and maximum offering price per sharea | | | | | | | | | | | $2.30 | |
| | | | | | | | | | | | |
Maximum offering price per share (net asset value per share ÷ 96.25%) | | | | | | | | | | | $2.39 | |
| | | | | | | | | | | | |
Class C: | | | | | | | | | | | | |
Net assets, at value | | | $ 597,926,958 | | | | $ 704,217,257 | | | | $13,488,626,968 | |
| | | | |
Shares outstanding | | | 8,715,583 | | | | 7,027,465 | | | | 5,772,286,501 | |
| | | | |
Net asset value and maximum offering price per sharea | | | $68.60 | | | | $100.21 | | | | $2.34 | |
| | | | |
Class R: | | | | | | | | | | | | |
Net assets, at value | | | $ 123,720,918 | | | | $ 435,331,486 | | | | $ 265,531,332 | |
| | | | |
Shares outstanding | | | 1,541,567 | | | | 3,976,085 | | | | 117,536,532 | |
| | | | |
Net asset value and maximum offering price per share | | | $80.26 | | | | $109.49 | | | | $2.26 | |
| | | | |
Class R6: | | | | | | | | | | | | |
Net assets, at value | | | $2,473,941,589 | | | | $2,545,799,527 | | | | $ 1,902,027,235 | |
| | | | |
Shares outstanding | | | 28,613,601 | | | | 23,066,923 | | | | 831,907,025 | |
| | | | |
Net asset value and maximum offering price per share | | | $86.46 | | | | $110.37 | | | | $2.29 | |
| | | | |
Advisor Class: | | | | | | | | | | | | |
Net assets, at value | | | $1,154,604,371 | | | | $3,154,342,156 | | | | $11,816,599,491 | |
| | | | |
Shares outstanding | | | 13,491,778 | | | | 28,568,948 | | | | 5,172,814,118 | |
| | | | |
Net asset value and maximum offering price per share | | | $85.58 | | | | $110.41 | | | | $2.28 | |
| | | | |
aRedemption price is equal to net asset value less contingent deferred sales charges, if applicable.
| | | | |
| | | |
100 | | Annual Report | The accompanying notes are an integral part of these financial statements. | | franklintempleton.com |
FRANKLIN CUSTODIAN FUNDS
FINANCIAL STATEMENTS
Statements of Assets and Liabilities(continued)
September 30, 2019
| | | | | | | | |
| | | Franklin U.S. Government Securities Fund | | | Franklin
Utilities Fund | |
| | |
Assets: | | | | | | | | |
Investments in securities: | | | | | | | | |
Cost - Unaffiliated issuers | | | $4,959,697,756 | | | | $3,132,296,444 | |
Cost -Non-controlled affiliates (Note 3f and 9) | | | 86,808,469 | | | | 35,371,057 | |
| | | | |
| | |
Value - Unaffiliated issuers | | | $5,069,124,726 | | | | $6,946,503,855 | |
Value -Non-controlled affiliates (Note 3f and 9) | | | 86,808,469 | | | | 35,371,057 | |
Foreign currency, at value (cost $— and $240, respectively) | | | — | | | | 239 | |
Receivables: | | | | | | | | |
Capital shares sold | | | 3,544,897 | | | | 10,663,552 | |
Dividends and interest | | | 15,256,800 | | | | 9,220,926 | |
Other assets | | | 2,140 | | | | 2,480 | |
| | | | |
| | |
Total assets | | | 5,174,737,032 | | | | 7,001,762,109 | |
| | | | |
| | |
Liabilities: | | | | | | | | |
Payables: | | | | | | | | |
Investment securities purchased | | | — | | | | 6,294,579 | |
Capital shares redeemed | | | 4,346,986 | | | | 7,456,048 | |
Management fees | | | 1,901,432 | | | | 2,628,968 | |
Distribution fees | | | 1,308,882 | | | | 2,113,613 | |
Transfer agent fees | | | 1,092,690 | | | | 835,806 | |
Distributions to shareholders | | | 1,533,853 | | | | — | |
Accrued expenses and other liabilities | | | 510,634 | | | | 298,978 | |
| | | | |
| | |
Total liabilities | | | 10,694,477 | | | | 19,627,992 | |
| | | | |
| | |
Net assets, at value | | | $5,164,042,555 | | | | $6,982,134,117 | |
| | | | |
| | |
Net assets consist of: | | | | | | | | |
Paid-in capital | | | $5,617,364,187 | | | | $3,057,037,664 | |
Total distributable earnings (loss) | | | (453,321,632 | ) | | | 3,925,096,453 | |
| | | | |
Net assets, at value | | | $5,164,042,555 | | | | $6,982,134,117 | |
| | | | |
| | | | |
| | | |
| franklintempleton.com | | The accompanying notes are an integral part of these financial statements. | Annual Report | | 101 |
FRANKLIN CUSTODIAN FUNDS
FINANCIAL STATEMENTS
Statements of Assets and Liabilities(continued)
September 30, 2019
| | | | | | | | |
| | | Franklin U.S. Government Securities Fund | | | Franklin
Utilities Fund | |
| | |
Class A: | | | | | | | | |
Net assets, at value | | | $ 336,646,484 | | | | $ 521,781,716 | |
| | | | |
Shares outstanding | | | 55,433,783 | | | | 23,155,727 | |
| | | | |
Net asset value per sharea | | | $6.07 | | | | $22.53 | |
| | | | |
Maximum offering price per share (net asset value per share ÷ 96.25%) | | | $6.31 | | | | $23.41 | |
| | | | |
Class A1: | | | | | | | | |
Net assets, at value | | | $ 2,885,193,954 | | | | $4,176,487,047 | |
| | | | |
Shares outstanding | | | 474,992,880 | | | | 185,267,842 | |
| | | | |
Net asset value and maximum offering price per sharea | | | $6.07 | | | | $22.54 | |
| | | | |
Maximum offering price per share (net asset value per share ÷ 96.25%) | | | $6.31 | | | | $23.42 | |
| | | | |
Class C: | | | | | | | | |
Net assets, at value | | | $ 389,020,900 | | | | $ 767,362,656 | |
| | | | |
Shares outstanding | | | 64,527,266 | | | | 34,230,299 | |
| | | | |
Net asset value and maximum offering price per sharea | | | $6.03 | | | | $22.42 | |
| | | | |
Class R: | | | | | | | | |
Net assets, at value | | | $ 32,905,726 | | | | $ 103,375,705 | |
| | | | |
Shares outstanding | | | 5,420,502 | | | | 4,604,868 | |
| | | | |
Net asset value and maximum offering price per share | | | $6.07 | | | | $22.45 | |
| | | | |
Class R6: | | | | | | | | |
Net assets, at value | | | $ 573,957,473 | | | | $ 150,244,004 | |
| | | | |
Shares outstanding | | | 94,143,869 | | | | 6,611,061 | |
| | | | |
Net asset value and maximum offering price per share | | | $6.10 | | | | $22.73 | |
| | | | |
Advisor Class: | | | | | | | | |
Net assets, at value | | | $ 946,318,018 | | | | $1,262,882,989 | |
| | | | |
Shares outstanding | | | 155,261,060 | | | | 55,568,188 | |
| | | | |
Net asset value and maximum offering price per share | | | $6.10 | | | | $22.73 | |
| | | | |
aRedemption price is equal to net asset value less contingent deferred sales charges, if applicable.
| | | | |
| | | |
102 | | Annual Report | The accompanying notes are an integral part of these financial statements. | | franklintempleton.com |
FRANKLIN CUSTODIAN FUNDS
FINANCIAL STATEMENTS
Statements of Operations
for the year ended September 30, 2019
| | | | | | | | | | | | |
| | | Franklin
DynaTech Fund | | | Franklin Growth Fund | | | Franklin Income Fund |
| | | |
| Investment income: | | | | | | | | | | | | |
Dividends: (net of foreign taxes)* | | | | | | | | | | | | |
Unaffiliated issuers | | $ | 38,661,339 | | | $ | 193,098,833 | | | $ | 991,498,948 | |
Non-controlled affiliates (Note 3f and 9) | | | 5,244,134 | | | | 4,811,993 | | | | 27,523,561 | |
Interest: | | | | | | | | | | | | |
Unaffiliated issuers | | | 26,435 | | | | — | | | | 2,284,700,725 | |
Non-controlled affiliates (Note 9) | | | — | | | | — | | | | 126,424,405 | |
Income from securities loaned: | | | | | | | | | | | | |
Unaffiliated issuers (net of fees and rebates) | | | — | | | | — | | | | 70,930 | |
Non-controlled affiliates (Note 3f) | | | — | | | | — | | | | 115,507 | |
| | | | |
| | | |
Total investment income | | | 43,931,908 | | | | 197,910,826 | | | | 3,430,334,076 | |
| | | | |
Expenses: | | | | | | | | | | | | |
Management fees (Note 3a) | | | 34,410,620 | | | | 68,263,939 | | | | 276,116,188 | |
Distribution fees: (Note 3c) | | | | | | | | | | | | |
Class A | | | 9,945,036 | | | | 21,974,870 | | | | 12,165,991 | |
Class A1 | | | — | | | | — | | | | 60,741,626 | |
Class C | | | 5,446,398 | | | | 7,318,116 | | | | 97,889,818 | |
Class R | | | 530,560 | | | | 2,283,762 | | | | 1,363,295 | |
Transfer agent fees: (Note 3e) | | | | | | | | | | | | |
Class A | | | 5,105,428 | | | | 11,471,589 | | | | 4,329,488 | |
Class A1 | | | — | | | | — | | | | 36,088,623 | |
Class C | | | 699,115 | | | | 957,322 | | | | 13,426,182 | |
Class R | | | 136,381 | | | | 597,616 | | | | 244,170 | |
Class R6 | | | 504,554 | | | | 682,462 | | | | 494,757 | |
Advisor Class | | | 1,102,031 | | | | 3,938,875 | | | | 10,042,288 | |
Custodian fees (Note 4) | | | 107,820 | | | | 127,600 | | | | 871,034 | |
Reports to shareholders | | | 957,900 | | | | 944,110 | | | | 3,904,626 | |
Registration and filing fees | | | 453,131 | | | | 324,484 | | | | 996,617 | |
Professional fees | | | 81,071 | | | | 124,512 | | | | 243,406 | |
Trustees’ fees and expenses | | | 33,863 | | | | 76,459 | | | | 368,087 | |
Other | | | 88,992 | | | | 271,591 | | | | 1,318,845 | |
| | | | |
| | | |
Total expenses | | | 59,602,900 | | | | 119,357,307 | | | | 520,605,041 | |
Expense reductions (Note 4) | | | (264 | ) | | | (10,810 | ) | | | (1,101,739 | ) |
Expenses waived/paid by affiliates (Note 3f and 3g) | | | (952,070 | ) | | | (874,084 | ) | | | (3,873,737 | ) |
| | | | |
| | | |
Net expenses | | | 58,650,566 | | | | 118,472,413 | | | | 515,629,565 | |
| | | | |
| | | |
Net investment income (loss) | | | (14,718,658 | ) | | | 79,438,413 | | | | 2,914,704,511 | |
| | | | |
| | | |
Realized and unrealized gains (losses): | | | | | | | | | | | | |
Net realized gain (loss) from: | | | | | | | | | | | | |
Investments:+ | | | | | | | | | | | | |
Unaffiliated issuers | | | 70,621,713 | | | | 840,081,266 | | | | 207,658,243 | |
Non-controlled affiliates (Note 3f and 9) | | | — | | | | — | | | | (71,492,802 | ) |
Written options | | | — | | | | — | | | | 157,184,184 | |
Foreign currency transactions | | | 108,121 | | | | 4,701 | | | | (917,150 | ) |
Futures contracts | | | — | | | | — | | | | (78,797,490 | ) |
Swap contracts | | | — | | | | — | | | | 1,944,731 | |
| | | | |
| | | |
Net realized gain (loss) | | | 70,729,834 | | | | 840,085,967 | | | | 215,579,716 | |
| | | | |
| | | |
Net change in unrealized appreciation (depreciation) on: | | | | | | | | | | | | |
Investments: | | | | | | | | | | | | |
| | | | |
| | | |
| franklintempleton.com | | The accompanying notes are an integral part of these financial statements. | Annual Report | | 103 |
FRANKLIN CUSTODIAN FUNDS
FINANCIAL STATEMENTS
Statements of Operations(continued)
for the year ended September 30, 2019
| | | | | | | | | | | | |
| | | Franklin
DynaTech Fund | | | Franklin Growth Fund | | | Franklin Income Fund | |
Unaffiliated issuers | | $ | 345,438,844 | | | $ | (346,522,216) | | | $ | 679,780,841 | |
Non-controlled affiliates (Note 3f and 9) | | | — | | | | — | | | | (675,424,682) | |
Translation of other assets and liabilities denominated in foreign currencies | | | 2,644 | | | | — | | | | (91,848) | |
Written options | | | — | | | | — | | | | 33,247,542 | |
Futures contracts | | | — | | | | — | | | | 15,254,808 | |
| | | | |
| | | |
Net change in unrealized appreciation (depreciation) | | | 345,441,488 | | | | (346,522,216) | | | | 52,766,661 | |
| | | | |
| | | |
Net realized and unrealized gain (loss) | | | 416,171,322 | | | | 493,563,751 | | | | 268,346,377 | |
| | | | |
| | | |
Net increase (decrease) in net assets resulting from operations | | $ | 401,452,664 | | | $ | 573,002,164 | | | $ | 3,183,050,888 | |
| | | | |
| | | |
| | | | | | | | | | | | |
*Foreign taxes withheld on dividends | | $ | 267,514 | | | $ | 680,616 | | | $ | 27,147,601 | |
+Includes gains from a redemptionin-kind (Note 12) | | $ | — | | | $ | 52,349,028 | | | $ | — | |
| | | | |
| | | |
104 | | Annual Report | The accompanying notes are an integral part of these financial statements. | | franklintempleton.com |
FRANKLIN CUSTODIAN FUNDS
FINANCIAL STATEMENTS
Statements of Operations(continued)
for the year ended September 30, 2019
| | | | | | | | |
| | | Franklin U.S. Government
Securities Fund | | | Franklin Utilities Fund | |
| | |
| Investment income: | | | | | | | | |
Dividends: (net of foreign taxes)* | | | | | | | | |
Unaffiliated issuers | | $ | — | | | $ | 206,785,002 | |
Non-controlled affiliates (Note 3f and 9) | | | 2,940,395 | | | | 860,141 | |
Interest: | | | | | | | | |
Unaffiliated issuers: | | | | | | | | |
Paydown gain (loss) | | | (26,699,873 | ) | | | — | |
Paid in cash | | | 192,450,577 | | | | 506,115 | |
Income from securities loaned: | | | | | | | | |
Non-controlled affiliates (Note 3f) | | | — | | | | 10,604 | |
| | | | |
| | |
Total investment income | | | 168,691,099 | | | | 208,161,862 | |
| | | | |
| | |
Expenses: | | | | | | | | |
Management fees (Note 3a) | | | 23,565,933 | | | | 28,494,642 | |
Distribution fees: (Note 3c) | | | | | | | | |
Class A | | | 452,357 | | | | 696,435 | |
Class A1 | | | 4,368,787 | | | | 5,798,577 | |
Class C | | | 2,863,675 | | | | 4,820,073 | |
Class R | | | 154,034 | | | | 421,851 | |
Transfer agent fees: (Note 3e) | | | | | | | | |
Class A | | | 280,814 | | | | 295,666 | |
Class A1 | | | 4,591,222 | | | | 4,108,925 | |
Class C | | | 685,573 | | | | 788,337 | |
Class R | | | 48,211 | | | | 89,815 | |
Class R6 | | | 201,769 | | | | 133,443 | |
Advisor Class | | | 1,282,602 | | | | 1,104,198 | |
Custodian fees (Note 4) | | | 39,620 | | | | 66,433 | |
Reports to shareholders | | | 349,247 | | | | 373,040 | |
Registration and filing fees | | | 185,554 | | | | 196,246 | |
Professional fees | | | 81,820 | | | | 81,109 | |
Trustees’ fees and expenses | | | 25,213 | | | | 29,693 | |
Other | | | 946,719 | | | | 71,713 | |
| | | | |
| | |
Total expenses | | | 40,123,150 | | | | 47,570,196 | |
Expense reductions (Note 4) | | | (1,073 | ) | | | (8,986 | ) |
Expenses waived/paid by affiliates (Note 3f and 3g) | | | (522,049 | ) | | | (229,658 | ) |
| | | | |
| | |
Net expenses | | | 39,600,028 | | | | 47,331,552 | |
| | | | |
| | |
Net investment income | | | 129,091,071 | | | | 160,830,310 | |
| | | | |
| | |
| Realized and unrealized gains (losses): | | | | | | |
Net realized gain (loss) from: | | | | | | | | |
Investments: | | | | | | | | |
Unaffiliated issuers | | | 16,617,504 | | | | 124,018,133 | |
Foreign currency transactions | | | — | | | | 7,418 | |
| | | | |
| | |
Net realized gain (loss) | | | 16,617,504 | | | | 124,025,551 | |
| | | | |
| | |
| Net change in unrealized appreciation (depreciation) on: | | | | | | |
Investments: | | | | | | | | |
Unaffiliated issuers | | | 206,765,016 | | | | 1,246,307,577 | |
Translation of other assets and liabilities denominated in foreign currencies | | | — | | | | (3,208 | ) |
| | | | |
| | | | |
| | | |
| franklintempleton.com | | The accompanying notes are an integral part of these financial statements. | Annual Report | | 105 |
FRANKLIN CUSTODIAN FUNDS
FINANCIAL STATEMENTS
Statements of Operations(continued)
for the year ended September 30, 2019
| | | | | | | | |
| | | Franklin U.S. Government
Securities Fund | | | Franklin Utilities Fund | |
| | |
Net change in unrealized appreciation (depreciation) | | | $206,765,016 | | | | $1,246,304,369 | |
| | | | |
| | |
Net realized and unrealized gain (loss) | | | 223,382,520 | | | | 1,370,329,920 | |
| | | | |
| | |
Net increase (decrease) in net assets resulting from operations | | | $352,473,591 | | | | $1,531,160,230 | |
| | | | |
| | |
*Foreign taxes withheld on dividends | | | $ — | | | | $ 1,107,994 | |
| | | | |
| | | |
106 | | Annual Report | The accompanying notes are an integral part of these financial statements. | | franklintempleton.com |
FRANKLIN CUSTODIAN FUNDS
FINANCIAL STATEMENTS
Statements of Changes in Net Assets
| | | | | | | | | | | | | | | | |
| | | Franklin DynaTech Fund | | | Franklin Growth Fund | |
| | | | |
| | | Year Ended September 30, | | | Year Ended September 30, | |
| | | | |
| | | 2019 | | | 2018 | | | 2019 | | | 2018 |
| |
| | | | |
| Increase (decrease) in net assets: | | | | | | | | | | | | | | | | |
Operations: | | | | | | | | | | | | | | | | |
Net investment income (loss) | | | $ (14,718,658 | ) | | | $ (15,041,017 | ) | | | $ 79,438,413 | | | | $ 69,469,770 | |
Net realized gain (loss) | | | 70,729,834 | | | | 176,786,945 | | | | 840,085,967 | | | | 307,934,328 | |
Net change in unrealized appreciation (depreciation) | | | 345,441,488 | | | | 1,253,016,993 | | | | (346,522,216 | ) | | | 2,488,154,018 | |
| | | | |
| | | | |
Net increase (decrease) in net assets resulting from operations | | | 401,452,664 | | | | 1,414,762,921 | | | | 573,002,164 | | | | 2,865,558,116 | |
| | | | |
| | | | |
Distributions to shareholders: | | | | | | | | | | | | | | | | |
Class A | | | (92,155,284 | ) | | | (46,020,971 | ) | | | (127,214,618 | ) | | | (226,847,781 | ) |
Class C | | | (14,892,611 | ) | | | (8,263,863 | ) | | | (8,201,337 | ) | | | (24,694,013 | ) |
Class R | | | (2,378,516 | ) | | | (916,852 | ) | | | (5,605,930 | ) | | | (13,125,428 | ) |
Class R6 | | | (41,995,760 | ) | | | (16,654,639 | ) | | | (45,185,076 | ) | | | (66,654,737 | ) |
Advisor Class | | | (16,868,687 | ) | | | (5,793,931 | ) | | | (50,860,743 | ) | | | (76,869,802 | ) |
| | | | |
| | | | |
Total distributions to shareholders | | | (168,290,858 | ) | | | (77,650,256 | ) | | | (237,067,704 | ) | | | (408,191,761 | ) |
| | | | |
| | | | |
Capital share transactions: (Note 2) | | | | | | | | | | | | | | | | |
Class A | | | 650,491,224 | | | | 479,666,303 | | | | (100,470,621 | ) | | | (384,147,638 | ) |
Class C | | | (11,971,946 | ) | | | 121,107,638 | | | | (348,123,281 | ) | | | (26,004,014 | ) |
Class R | | | 24,484,953 | | | | 32,046,631 | | | | (95,495,550 | ) | | | (68,853,353 | ) |
Class R6 | | | 696,883,004 | | | | 912,918,385 | | | | (144,735,583 | ) | | | 556,753,865 | |
Advisor Class | | | 444,209,154 | | | | (156,845,531 | ) | | | (53,980,770 | ) | | | (126,254,992 | ) |
| | | | |
| | | | |
Total capital share transactions | | | 1,804,096,389 | | | | 1,388,893,426 | | | | (742,805,805 | ) | | | (48,506,132 | ) |
| | | | |
| | | | |
Net increase (decrease) in net assets | | | 2,037,258,195 | | | | 2,726,006,091 | | | | (406,871,345 | ) | | | 2,408,860,223 | |
Net assets: | | | | | | | | | | | | | | | | |
Beginning of year | | | 6,817,369,388 | | | | 4,091,363,297 | | | | 16,403,715,319 | | | | 13,994,855,096 | |
| | | | |
| | | | |
End of year | | | $8,854,627,583 | | | | $6,817,369,388 | | | | $15,996,843,974 | | | | $16,403,715,319 | |
| | | | |
| | | | |
| | | |
| franklintempleton.com | | The accompanying notes are an integral part of these financial statements. | Annual Report | | 107 |
FRANKLIN CUSTODIAN FUNDS
FINANCIAL STATEMENTS
Statements of Changes in Net Assets(continued)
| | | | | | | | | | | | | | | | |
| | | Franklin Income Fund | | | Franklin U.S. Government Securities Fund | |
| | | | |
| | | Year Ended September 30, | | | Year Ended September 30, | |
| | | | |
| | | 2019 | | | 2018 | | | 2019 | | | 2018 | |
| |
| | | | |
| Increase (decrease) in net assets: | | | | | | | | | | | | | | | | |
Operations: | | | | | | | | | | | | | | | | |
Net investment income | | $ | 2,914,704,511 | | | $ | 3,098,037,753 | | | | $ 129,091,071 | | | | $ 135,106,995 | |
Net realized gain (loss) | | | 215,579,716 | | | | 2,139,515,312 | | | | 16,617,504 | | | | (17,091,870 | ) |
Net change in unrealized appreciation (depreciation) | | | 52,766,661 | | | | (3,644,189,158 | ) | | | 206,765,016 | | | | (204,522,890 | ) |
| | | | |
| | | | |
Net increase (decrease) in net assets resulting from operations | | | 3,183,050,888 | | | | 1,593,363,907 | | | | 352,473,591 | | | | (86,507,765 | ) |
| | | | |
| | | | |
Distributions to shareholders: | | | | | | | | | | | | | | | | |
Class A | | | (238,921,964 | ) | | | — | | | | (5,700,515 | ) | | | (12,054 | ) |
Class A1 | | | (2,139,823,753 | ) | | | (2,288,960,635 | ) | | | (88,940,105 | ) | | | (102,662,505 | ) |
Class M | | | — | | | | (106 | ) | | | — | | | | (67 | ) |
Class C | | | (713,887,824 | ) | | | (972,575,550 | ) | | | (10,975,833 | ) | | | (17,064,880 | ) |
Class R | | | (13,702,246 | ) | | | (15,730,910 | ) | | | (832,535 | ) | | | (917,007 | ) |
Class R6 | | | (105,925,119 | ) | | | (112,761,533 | ) | | | (24,763,152 | ) | | | (20,832,132 | ) |
Advisor Class | | | (609,231,978 | ) | | | (597,750,735 | ) | | | (26,064,423 | ) | | | (23,153,769 | ) |
| | | | |
| | | | |
Total distributions to shareholders | | | (3,821,492,884 | ) | | | (3,987,779,469 | ) | | | (157,276,563 | ) | | | (164,642,414 | ) |
| | | | |
| | | | |
Capital share transactions: (Note 2) | | | | | | | | | | | | | | | | |
Class A | | | 7,250,036,688 | | | | 107,124,173 | | | | 324,210,864 | | | | 4,483,084 | |
Class A1 | | | (2,920,848,622 | ) | | | (2,231,639,649 | ) | | | (323,855,335 | ) | | | (326,093,441 | ) |
Class M | | | — | | | | 229 | | | | — | | | | 108 | |
Class C | | | (6,197,626,508 | ) | | | (2,505,402,882 | ) | | | (197,618,270 | ) | | | (194,350,252 | ) |
Class R | | | (27,415,311 | ) | | | (55,588,036 | ) | | | 615,002 | | | | (5,634,672 | ) |
Class R6 | | | (140,374,274 | ) | | | 309,451,485 | | | | (150,358,443 | ) | | | 276,619,775 | |
Advisor Class | | | 581,307,127 | | | | (1,525,738 | ) | | | 194,243,684 | | | | (100,605,572 | ) |
| | | | |
| | | | |
Total capital share transactions | | | (1,454,920,900 | ) | | | (4,377,580,418 | ) | | | (152,762,498 | ) | | | (345,580,970 | ) |
| | | | |
| | | | |
Net increase (decrease) in net assets | | | (2,093,362,896 | ) | | | (6,771,995,980 | ) | | | 42,434,530 | | | | (596,731,149 | ) |
Net assets: | | | | | | | | | | | | | | | | |
Beginning of year | | | 76,619,264,487 | | | | 83,391,260,467 | | | | 5,121,608,025 | | | | 5,718,339,174 | |
| | | | |
| | | | |
End of year | | $ | 74,525,901,591 | | | $ | 76,619,264,487 | | | | $5,164,042,555 | | | | $5,121,608,025 | |
| | | | |
| | | | |
| | | |
108 | | Annual Report | The accompanying notes are an integral part of these financial statements. | | franklintempleton.com |
FRANKLIN CUSTODIAN FUNDS
FINANCIAL STATEMENTS
Statements of Changes in Net Assets(continued)
| | | | | | | | |
| | | Franklin Utilities Fund | |
| | | Year Ended September 30, | |
| | | 2019 | | | 2018 | |
| |
| | |
Increase (decrease) in net assets: | | | | | | | | |
Operations: | | | | | | | | |
Net investment income | | $ | 160,830,310 | | | $ | 160,329,904 | |
Net realized gain (loss) | | | 124,025,551 | | | | 202,141,838 | |
Net change in unrealized appreciation (depreciation) | | | 1,246,304,369 | | | | (290,378,391 | ) |
| | | | |
| | |
Net increase (decrease) in net assets resulting from operations | | | 1,531,160,230 | | | | 72,093,351 | |
| | | | |
| | |
Distributions to shareholders: | | | | | | | | |
Class A | | | (12,003,162 | ) | | | — | |
Class A1 | | | (210,886,943 | ) | | | (177,065,549 | ) |
Class M | | | — | | | | (70 | ) |
Class C | | | (36,435,738 | ) | | | (37,179,447 | ) |
Class R | | | (4,121,777 | ) | | | (3,557,682 | ) |
Class R6 | | | (12,677,551 | ) | | | (10,987,844 | ) |
Advisor Class | | | (56,945,571 | ) | | | (43,572,165 | ) |
| | | | |
| | |
Total distributions to shareholders | | | (333,070,742 | ) | | | (272,362,757 | ) |
| | | | |
| | |
Capital share transactions: (Note 2) | | | | | | | | |
Class A | | | 460,752,617 | | | | 3,570,602 | |
Class A1 | | | (216,801,580 | ) | | | (400,697,038 | ) |
Class M | | | — | | | | 262 | |
Class C | | | (211,431,033 | ) | | | (115,788,847 | ) |
Class R | | | 13,908,640 | | | | (18,460,504 | ) |
Class R6 | | | (118,348,388 | ) | | | (4,300,346 | ) |
Advisor Class | | | 132,397,828 | | | | (3,930,299 | ) |
| | | | |
| | |
Total capital share transactions | | | 60,478,084 | | | | (539,606,170 | ) |
| | | | |
| | |
Net increase (decrease) in net assets | | | 1,258,567,572 | | | | (739,875,576 | ) |
Net assets: | | | | | | | | |
Beginning of year | | | 5,723,566,545 | | | | 6,463,442,121 | |
| | | | |
| | |
End of year | | $ | 6,982,134,117 | | | $ | 5,723,566,545 | |
| | | | |
| | | | |
| | | |
| franklintempleton.com | | The accompanying notes are an integral part of these financial statements. | Annual Report | | 109 |
FRANKLIN CUSTODIAN FUNDS
Notes to Financial Statements
1. Organization and Significant Accounting Policies
Franklin Custodian Funds (Trust) is registered under the Investment Company Act of 1940 (1940 Act) as anopen-end management investment company, consisting of six separate funds, five of which are included in this report (Funds) and applies the specialized accounting and reporting guidance in U.S. Generally Accepted Accounting Principles (U.S. GAAP). The classes of shares offered within each of the Funds are indicated below. Beginning on October 19, 2018, Class C shares automatically convert to Class A shares after they have been held for 10 years. Each class of shares may differ by its initial sales load, contingent deferred sales charges, voting rights on matters affecting a single class, its exchange privilege and fees due to differing arrangements for distribution and transfer agent fees.
Class A, Class C, Class R, Class R6 & Advisor Class
Franklin DynaTech Fund
Franklin Growth Fund
Class A, Class A1, Class C, Class R, Class R6 & Advisor Class
Franklin Income Fund
Franklin U.S. Government Securities Fund
Franklin Utilities Fund
The following summarizes the Funds’ significant accounting policies.
a. Financial Instrument Valuation
The Funds’ investments in financial instruments are carried at fair value daily. Fair value is the price that would be received to sell an asset or paid to transfer a liability in an orderly transaction between market participants on the measurement date. The Funds calculate the net asset value (NAV) per share each business day as of 4 p.m. Eastern time or the regularly scheduled close of the New York Stock Exchange (NYSE), whichever is earlier. Under compliance policies and procedures approved by the Trust’s Board of Trustees (the Board), the Funds’ administrator has responsibility for oversight of valuation, including leading the cross-functional Valuation Committee (VC). The Funds may utilize independent pricing services, quotations from securities and financial instrument dealers, and other market sources to determine fair value.
Equity securities and derivative financial instruments listed on an exchange or on the NASDAQ National Market System are valued at the last quoted sale price or the official closing price of the day, respectively. Foreign equity securities are valued as of the close of trading on the foreign stock exchange on which the security is primarily traded, or as of 4 p.m. Eastern time. The value is then converted into its U.S. dollar equivalent at the foreign exchange rate in effect at 4 p.m. Eastern time on the day that the value of the security is determined.Over-the-counter (OTC) securities are valued within the range of the most recent quoted bid and ask prices. Securities that trade in multiple markets or on multiple exchanges are valued according to the broadest and most representative market. Certain equity securities are valued based upon fundamental characteristics or relationships to similar securities.
Debt securities generally trade in the OTC market rather than on a securities exchange. The Funds’ pricing services use multiple valuation techniques to determine fair value. In instances where sufficient market activity exists, the pricing services may utilize a market-based approach through which quotes from market makers are used to determine fair value. In instances where sufficient market activity may not exist or is limited, the pricing services also utilize proprietary valuation models which may consider market characteristics such as benchmark yield curves, credit spreads, estimated default rates, anticipated market interest rate volatility, coupon rates, anticipated timing of principal repayments, underlying collateral, and other unique security features in order to estimate the relevant cash flows, which are then discounted to calculate the fair value. Securities denominated in a foreign currency are converted into their U.S. dollar equivalent at the foreign exchange rate in effect at 4 p.m. Eastern time on the date that the values of the foreign debt securities are determined.
Investments inopen-end mutual funds are valued at the closing NAV. Investments in repurchase agreements are valued at cost, which approximates fair value.
The Funds have procedures to determine the fair value of financial instruments for which market prices are not reliable or readily available. Under these procedures, the Funds primarily employ a market-based approach which may use related or comparable assets or liabilities, recent transactions, market multiples, book values, and other relevant information for the investment to determine the fair value of the investment. An income-based valuation approach may
| | | | |
| | | |
110 | | Annual Report | | franklintempleton.com |
FRANKLIN CUSTODIAN FUNDS
NOTES TO FINANCIAL STATEMENTS
also be used in which the anticipated future cash flows of the investment are discounted to calculate fair value. Discounts may also be applied due to the nature or duration of any restrictions on the disposition of the investments. Due to the inherent uncertainty of valuations of such investments, the fair values may differ significantly from the values that would have been used had an active market existed.
Trading in securities on foreign securities stock exchanges and OTC markets may be completed before 4 p.m. Eastern time. In addition, trading in certain foreign markets may not take place on every Funds’ business day. Occasionally, events occur between the time at which trading in a foreign security is completed and 4 p.m. Eastern time that might call into question the reliability of the value of a portfolio security held by the Fund. As a result, differences may arise between the value of the Funds’ portfolio securities as determined at the foreign market close and the latest indications of value at 4 p.m. Eastern time. In order to minimize the potential for these differences, the VC monitors price movements following the close of trading in foreign stock markets through a series of country specific market proxies (such as baskets of American Depositary Receipts, futures contracts and exchange traded funds). These price movements are measured against established trigger thresholds for each specific market proxy to assist in determining if an event has occurred that may call into question the reliability of the values of the foreign securities held by the Funds. If such an event occurs, the securities may be valued using fair value procedures, which may include the use of independent pricing services.
When the last day of the reporting period is anon-business day, certain foreign markets may be open on those days that the Funds’ NAV is not calculated, which could result in differences between the value of the Funds’ portfolio securities on the last business day and the last calendar day of the reporting period. Any significant security valuation changes due to an open foreign market are adjusted and reflected by the Funds for financial reporting purposes.
b. Foreign Currency Translation
Portfolio securities and other assets and liabilities denominated in foreign currencies are translated into U.S. dollars based on the exchange rate of such currencies against U.S. dollars on the date of valuation. The Funds may enter into foreign currency exchange contracts to facilitate transactions denominated in a foreign currency. Purchases
and sales of securities, income and expense items denominated in foreign currencies are translated into U.S. dollars at the exchange rate in effect on the transaction date. Portfolio securities and assets and liabilities denominated in foreign currencies contain risks that those currencies will decline in value relative to the U.S. dollar. Occasionally, events may impact the availability or reliability of foreign exchange rates used to convert the U.S. dollar equivalent value. If such an event occurs, the foreign exchange rate will be valued at fair value using procedures established and approved by the Board.
The Funds do not separately report the effect of changes in foreign exchange rates from changes in market prices on securities held. Such changes are included in net realized and unrealized gain or loss from investments in the Statements of Operations.
Realized foreign exchange gains or losses arise from sales of foreign currencies, currency gains or losses realized between the trade and settlement dates on securities transactions and the difference between the recorded amounts of dividends, interest, and foreign withholding taxes and the U.S. dollar equivalent of the amounts actually received or paid. Net unrealized foreign exchange gains and losses arise from changes in foreign exchange rates on foreign denominated assets and liabilities other than investments in securities held at the end of the reporting period.
c. Joint Repurchase Agreement
Certain or all Funds enter into a joint repurchase agreement whereby their uninvested cash balance is deposited into a joint cash account with other funds managed by the investment manager or an affiliate of the investment manager and is used to invest in one or more repurchase agreements. The value and face amount of the joint repurchase agreement are allocated to the funds based on theirpro-rata interest. A repurchase agreement is accounted for as a loan by the Fund to the seller, collateralized by securities which are delivered to the Funds’ custodian. The fair value, including accrued interest, of the initial collateralization is required to be at least 102% of the dollar amount invested by the funds, with the value of the underlying securities marked to market daily to maintain coverage of at least 100%. Repurchase agreements are subject to the terms of Master Repurchase Agreements (MRAs) with approved counterparties (sellers). The MRAs contain various provisions, including but not limited to events of default and maintenance of collateral for
| | | | |
| | | |
| franklintempleton.com | | Annual Report | | 111 |
FRANKLIN CUSTODIAN FUNDS
NOTES TO FINANCIAL STATEMENTS
1. Organization and Significant Accounting
Policies(continued)
c. Joint Repurchase Agreement(continued)
repurchase agreements. In the event of default by either the seller or the Funds, certain MRAs may permit thenon-defaulting party to net andclose-out all transactions, if any, traded under such agreements. The Funds may sell securities it holds as collateral and apply the proceeds towards the repurchase price and any other amounts owed by the seller to the Funds in the event of default by the seller. This could involve costs or delays in addition to a loss on the securities if their value falls below the repurchase price owed by the seller. The joint repurchase agreement held by the Funds at year end, as indicated in the Statements of Investments, had been entered into on September 30, 2019.
d. Securities Purchased on a When-Issued Basis
Certain or all Funds purchase securities on a when-issued basis, with payment and delivery scheduled for a future date. These transactions are subject to market fluctuations and are subject to the risk that the value at delivery may be more or less than the trade date purchase price. Although the Funds will generally purchase these securities with the intention of holding the securities, they may sell the securities before the settlement date. Sufficient assets have been segregated for these securities.
e. Derivative Financial Instruments
Certain or all Funds invested in derivative financial instruments in order to manage risk or gain exposure to various other investments or markets. Derivatives are financial contracts based on an underlying or notional amount, require no initial investment or an initial net investment that is smaller than would normally be required to have a similar response to changes in market factors, and require or permit net settlement. Derivatives contain various risks including the potential inability of the counterparty to fulfill their obligations under the terms of the contract, the potential for an illiquid secondary market, and/or the potential for market movements which expose the Fund to gains or losses in excess of the amounts shown in the Statements of Assets and Liabilities. Realized gain and loss and unrealized appreciation and depreciation on these contracts for the period are included in the Statements of Operations.
Collateral requirements differ by type of derivative. Collateral or initial margin requirements are set by the broker or exchange clearing house for exchange traded and centrally cleared derivatives. Initial margin deposited is held at the exchange and can be in the form of cash and/or securities.
Certain or all Funds entered into exchange traded futures contracts primarily to manage exposure to interest rate risk. A futures contract is an agreement between the Fund and a counterparty to buy or sell an asset at a specified price on a future date. Required initial margins are pledged by the Fund, and the daily change in fair value is accounted for as a variation margin payable or receivable in the Statements of Assets and Liabilities.
Certain or all Funds entered into credit default swap contracts primarily to manage exposure to credit risk. A credit default swap is an agreement between the Fund and a counterparty whereby the buyer of the contract receives credit protection and the seller of the contract guarantees the credit worthiness of a referenced debt obligation. These agreements may be privately negotiated in theover-the-counter market (OTC credit default swaps) or may be executed in a multilateral trade facility platform, such as a registered exchange (centrally cleared credit default swaps). The underlying referenced debt obligation may be a single issuer of corporate or sovereign debt, a credit index, a basket of issuers or indices, or a tranche of a credit index or basket of issuers or indices. In the event of a default of the underlying referenced debt obligation, the buyer is entitled to receive the notional amount of the credit default swap contract from the seller in exchange for the referenced debt obligation, a net settlement amount equal to the notional amount of the credit default swap less the recovery value of the referenced debt obligation, or other agreed upon amount. For centrally cleared credit default swaps, required initial margins are pledged by the Fund, and the daily change in fair value is accounted for as a variation margin payable or receivable in the Statements of Assets and Liabilities. Over the term of the contract, the buyer pays the seller a periodic stream of payments, provided that no event of default has occurred. Such periodic payments are accrued daily as an unrealized appreciation or depreciation until the payments are made, at which time they are realized. Upfront payments and receipts are reflected in the Statements of Assets and Liabilities and represent compensating factors between stated terms of the credit default swap agreement and prevailing market conditions (credit spreads and other
| | | | |
| | | |
112 | | Annual Report | | franklintempleton.com |
FRANKLIN CUSTODIAN FUNDS
NOTES TO FINANCIAL STATEMENTS
relevant factors). These upfront payments and receipts are amortized over the term of the contract as a realized gain or loss in the Statements of Operations.
Certain or all Funds purchased or wrote exchange traded option contracts primarily to manage exposure to equity price risk. An option is a contract entitling the holder to purchase or sell a specific amount of shares or units of an asset or notional amount of a swap (swaption), at a specified price. When an option is purchased or written, an amount equal to the premium paid or received is recorded as an asset or liability, respectively. Upon exercise of an option, the acquisition cost or sales proceeds of the underlying investment is adjusted by any premium received or paid. Upon expiration of an option, any premium received or paid is recorded as a realized gain or loss. Upon closing an option other than through expiration or exercise, the difference between the premium received or paid and the cost to close the position is recorded as a realized gain or loss.
See Note 8 regarding other derivative information.
f. Index-Linked Notes
Certain or all Funds invest in index-linked notes. Index-linked notes are senior, unsecured, subordinated debt securities issued by a financial institution, and the value is based on the price movements of the underlying index. Index-linked notes are designed to provide investors access to the returns of various market benchmarks and intended to replicate the economic effects that would apply had the Fund directly purchased the underlying referenced asset or basket of assets. The risks of investing in index-linked notes include unfavorable price movements in the underlying index and the credit risk of the issuing financial institution. There may be no guarantee of a return of principal with index-linked notes and the appreciation potential may be limited. Index-linked notes may be more volatile and less liquid than other investments held by the Funds.
g. Equity-Linked Securities
Certain or all Funds invest in equity-linked securities. Equity-linked securities are hybrid financial instruments that generally combine both debt and equity characteristics into a single note form. Income received from equity-linked securities is recorded as realized gains in the Statements of Operations and may be based on the performance of an underlying equity security, an equity index, or an option position. The risks of investing in equity-linked securities
include unfavorable price movements in the underlying security and the credit risk of the issuing financial institution. There may be no guarantee of a return of principal with equity-linked securities and the appreciation potential may be limited. Equity-linked securities may be more volatile and less liquid than other investments held by the Funds.
h. Securities Lending
Certain or all Funds participate in an agency based securities lending program to earn additional income. The Fund receives cash collateral against the loaned securities in an amount equal to at least 102% of the fair value of the loaned securities. Collateral is maintained over the life of the loan in an amount not less than 100% of the fair value of loaned securities, as determined at the close of Fund business each day; any additional collateral required due to changes in security values is delivered to the Fund on the next business day. The collateral is deposited into a joint cash account with other funds and is used to invest in a money market fund managed by Franklin Advisers, Inc., an affiliate of the Funds, and/or a joint repurchase agreement. The Fund may receive income from the investment of cash collateral, in addition to lending fees and rebates paid by the borrower. Income from securities loaned, net of fees paid to the securities lending agent and/or third-party vendor, is reported separately in the Statements of Operations. The Fund bears the market risk with respect to the collateral investment, securities loaned, and the risk that the agent may default on its obligations to the Fund. If the borrower defaults on its obligation to return the securities loaned, the Fund has the right to repurchase the securities in the open market using the collateral received. The securities lending agent has agreed to indemnify the Fund in the event of default by a third party borrower. At September 30, 2019, the Franklin Utilities Fund had no securities on loan.
i. Mortgage Dollar Rolls
Certain or all Funds enter into mortgage dollar rolls, typically on a TBA basis. Mortgage dollar rolls are agreements between the Fund and a financial institution where the Fund sells (or buys) mortgage-backed securities for delivery on a specified date and simultaneously contracts to repurchase (or sell) substantially similar (same type, coupon, and maturity) securities at a future date and at a predetermined price. Gains or losses are realized on the initial sale, and the difference between the repurchase price and the sale price is recorded as an unrealized gain or loss to the Fund upon
| | | | |
| | | |
| franklintempleton.com | | Annual Report | | 113 |
FRANKLIN CUSTODIAN FUNDS
NOTES TO FINANCIAL STATEMENTS
1. Organization and Significant Accounting
Policies(continued)
i. Mortgage Dollar Rolls(continued)
entering into the mortgage dollar roll. In addition, the Fund may invest the cash proceeds that are received from the initial sale. During the period between the sale and repurchase, the Fund is not entitled to principal and interest paid on the mortgage backed securities. Transactions in mortgage dollar rolls are accounted for as purchases and sales and may result in an increase to the Fund’s portfolio turnover rate. The risks of mortgage dollar roll transactions include the potential inability of the counterparty to fulfill its obligations.
j. Senior Floating Rate Interests
Certain or all Funds invest in senior secured corporate loans that pay interest at rates which are periodically reset by reference to a base lending rate plus a spread. These base lending rates are generally the prime rate offered by a designated U.S. bank or the London InterBank Offered Rate (LIBOR). Senior secured corporate loans often require prepayment of principal from excess cash flows or at the discretion of the borrower. As a result, actual maturity may be substantially less than the stated maturity. Senior secured corporate loans in which the Funds invest are generally readily marketable, but may be subject to certain restrictions on resale. On July 27, 2017, the United Kingdom’s Financial Conduct Authority announced its intention to cease sustaining LIBOR after 2021. There remains uncertainty regarding the future utilization of LIBOR and the nature of any replacement rate. As such, the potential effect of a transition away from LIBOR on the Fund or the Fund’s investments that use or may use a floating rate based on LIBOR cannot yet be determined.
k. Income and Deferred Taxes
It is each Fund’s policy to qualify as a regulated investment company under the Internal Revenue Code. Each Fund intends to distribute to shareholders substantially all of its taxable income and net realized gains to relieve it from federal income and excise taxes. As a result, no provision for U.S. federal income taxes is required.
The Funds may be subject to foreign taxation related to income received, capital gains on the sale of securities and certain foreign currency transactions in the foreign jurisdictions in which the Funds invest. Foreign taxes, if any,
are recorded based on the tax regulations and rates that exist in the foreign markets in which the Funds invest. When a capital gain tax is determined to apply, certain or all Funds record an estimated deferred tax liability in an amount that would be payable if the securities were disposed of on the valuation date.
As a result of several court cases, in certain countries across the European Union, certain or all Funds filed additional tax reclaims for previously withheld taxes on dividends earned in those countries (EU reclaims). These additional filings are subject to various administrative proceedings by the local jurisdictions’ tax authorities within the European Union, as well as a number of related judicial proceedings. Income recognized, if any, for EU reclaims is reflected as other income in the Statements of Operations and any related receivable, if any, is reflected as European Union tax reclaims in the Statements of Assets and Liabilities. When uncertainty exists as to the ultimate resolution of these proceedings, the likelihood of receipt of these EU reclaims, and the potential timing of payment, no amounts are reflected in the financial statements. For U.S. income tax purposes, EU reclaims received by the Funds, if any, reduce the amounts of foreign taxes Fund shareholders can use as tax credits in their individual income tax returns.
Each Fund may recognize an income tax liability related to its uncertain tax positions under U.S. GAAP when the uncertain tax position has a less than 50% probability that it will be sustained upon examination by the tax authorities based on its technical merits. As of September 30, 2019, each Fund has determined that no tax liability is required in its financial statements related to uncertain tax positions for any open tax years (or expected to be taken in future tax years). Open tax years are those that remain subject to examination and are based on the statute of limitations in each jurisdiction in which the Fund invests.
l. Security Transactions, Investment Income, Expenses and Distributions
Security transactions are accounted for on trade date. Realized gains and losses on security transactions are determined on a specific identification basis. Interest income and estimated expenses are accrued daily. Amortization of premium and accretion of discount on debt securities are included in interest income. Paydown gains and losses are recorded separately on the Statements of Operations. Facility fees are recognized as income over the expected term of the
| | | | |
| | | |
114 | | Annual Report | | franklintempleton.com |
FRANKLIN CUSTODIAN FUNDS
NOTES TO FINANCIAL STATEMENTS
loan. Dividend income is recorded on theex-dividend date except for certain dividends from securities where the dividend rate is not available. In such cases, the dividend is recorded as soon as the information is received by the Funds. Distributions to shareholders are recorded on theex-dividend date. Distributable earnings are determined according to income tax regulations (tax basis) and may differ from earnings recorded in accordance with U.S. GAAP. These differences may be permanent or temporary. Permanent differences are reclassified among capital accounts to reflect their tax character. These reclassifications have no impact on net assets or the results of operations. Temporary differences are not reclassified, as they may reverse in subsequent periods.
Common expenses incurred by the Trust are allocated among the Funds based on the ratio of net assets of each Fund to the combined net assets of the Trust or based on the ratio of number of shareholders of each Fund to the combined number of shareholders of the Trust. Fund specific expenses are charged directly to the Fund that incurred the expense.
Realized and unrealized gains and losses and net investment income, excluding class specific expenses, are allocated daily to each class of shares based upon the relative proportion of
net assets of each class. Differences in per share distributions by class are generally due to differences in class specific expenses.
m. Accounting Estimates
The preparation of financial statements in accordance with U.S. GAAP requires management to make estimates and assumptions that affect the reported amounts of assets and liabilities at the date of the financial statements and the amounts of income and expenses during the reporting period. Actual results could differ from those estimates.
n. Guarantees and Indemnifications
Under the Trust’s organizational documents, its officers and trustees are indemnified by the Trust against certain liabilities arising out of the performance of their duties to the Trust. Additionally, in the normal course of business, the Trust, on behalf of the Funds, enters into contracts with service providers that contain general indemnification clauses. The Trust’s maximum exposure under these arrangements is unknown as this would involve future claims that may be made against the Trust that have not yet occurred. Currently, the Trust expects the risk of loss to be remote.
2. Shares of Beneficial Interest
At September 30, 2019, there were an unlimited number of shares authorized (without par value). Transactions in the Funds’ shares were as follows:
| | | | | | | | | | | | | | | | |
| | | Franklin | | | Franklin | |
| | | DynaTech Fund | | | Growth Fund | |
| | | Shares | | | Amount | | | Shares | | | Amount | |
Class A Shares: | | | | | | | | | | | | | | | | |
Year ended September 30, 2019 | | | | | | | | | | | | | | | | |
Shares solda | | | 18,045,630 | | | $ | 1,406,354,947 | | | | 12,734,660 | | | $ | 1,294,982,995 | |
Shares issued in reinvestment of distributions | | | 1,181,936 | | | | 85,513,056 | | | | 1,182,058 | | | | 118,489,471 | |
Shares redeemed | | | (10,956,984 | ) | | | (841,376,779 | ) | | | (14,767,957 | ) | | | (1,513,943,087 | ) |
| | | | |
Net increase (decrease) | | | 8,270,582 | | | $ | 650,491,224 | | | | (851,239 | ) | | $ | (100,470,621 | ) |
| | | | |
Year ended September 30, 2018 | | | | | | | | | | | | | | | | |
Shares sold | | | 14,831,366 | | | $ | 1,079,518,288 | | | | 11,280,920 | | | $ | 1,109,298,387 | |
Shares issued in reinvestment of distributions | | | 649,398 | | | | 42,412,146 | | | | 2,241,557 | | | | 209,293,239 | |
Shares redeemed | | | (8,972,810 | ) | | | (642,264,131 | ) | | | (17,341,818 | ) | | | (1,702,739,264 | ) |
| | | | |
Net increase (decrease) | | | 6,507,954 | | | $ | 479,666,303 | | | | (3,819,341 | ) | | $ | (384,147,638 | ) |
| | | | |
| | | |
| franklintempleton.com | | Annual Report | | 115 |
FRANKLIN CUSTODIAN FUNDS
NOTES TO FINANCIAL STATEMENTS
2. Shares of Beneficial Interest(continued)
| | | | | | | | | | | | | | | | |
| | | Franklin | | | Franklin | |
| | | DynaTech Fund | | | Growth Fund | |
| | | Shares | | | Amount | | | Shares | | | Amount | |
Class C Shares: | | | | | | | | | | | | | | | | |
Year ended September 30, 2019 | | | | | | | | | | | | | | | | |
Shares sold | | | 3,070,856 | | | $ | 199,977,771 | | | | 1,283,911 | | | $ | 119,568,065 | |
Shares issued in reinvestment of distributions | | | 239,761 | | | | 14,455,228 | | | | 84,225 | | | | 7,736,874 | |
Shares redeemeda | | | (3,574,686 | ) | | | (226,404,945 | ) | | | (5,118,036 | ) | | | (475,428,220 | ) |
Net increase (decrease) | | | (264,069 | ) | | $ | (11,971,946 | ) | | | (3,749,900 | ) | | $ | (348,123,281 | ) |
Year ended September 30, 2018 | | | | | | | | | | | | | | | | |
Shares sold | | | 3,541,513 | | | $ | 216,395,204 | | | | 2,015,126 | | | $ | 182,547,090 | |
Shares issued in reinvestment of distributions | | | 145,521 | | | | 8,019,671 | | | | 273,473 | | | | 23,494,117 | |
Shares redeemed | | | (1,708,778 | ) | | | (103,307,237 | ) | | | (2,558,228 | ) | | | (232,045,221 | ) |
Net increase (decrease) | | | 1,978,256 | | | $ | 121,107,638 | | | | (269,629 | ) | | $ | (26,004,014 | ) |
Class R Shares: | | | | | | | | | | | | | | | | |
Year ended September 30, 2019 | | | | | | | | | | | | | | | | |
Shares sold | | | 718,232 | | | $ | 54,816,432 | | | | 386,516 | | | $ | 39,100,757 | |
Shares issued in reinvestment of distributions | | | 33,480 | | | | 2,351,628 | | | | 54,920 | | | | 5,489,301 | |
Shares redeemed | | | (426,266 | ) | | | (32,683,107 | ) | | | (1,371,370 | ) | | | (140,085,608 | ) |
Net increase (decrease) | | | 325,446 | | | $ | 24,484,953 | | | | (929,934 | ) | | $ | (95,495,550 | ) |
Year ended September 30, 2018 | | | | | | | | | | | | | | | | |
Shares sold | | | 728,247 | | | $ | 52,135,875 | | | | 646,523 | | | $ | 63,137,515 | |
Shares issued in reinvestment of distributions | | | 14,081 | | | | 895,541 | | | | 137,299 | | | | 12,777,077 | |
Shares redeemed | | | (304,303 | ) | | | (20,984,785 | ) | | | (1,477,753 | ) | | | (144,767,945 | ) |
Net increase (decrease) | | | 438,025 | | | $ | 32,046,631 | | | | (693,931 | ) | | $ | (68,853,353 | ) |
Class R6 Shares: | | | | | | | | | | | | | | | | |
Year ended September 30, 2019 | | | | | | | | | | | | | | | | |
Shares sold | | | 14,600,444 | | | $ | 1,197,778,037 | | | | 5,242,855 | | | $ | 533,528,077 | |
Shares issued in reinvestment of distributions | | | 557,220 | | | | 41,953,067 | | | | 416,642 | | | | 41,768,390 | |
Shares redeemed | | | (6,571,287 | ) | | | (542,848,100 | ) | | | (7,008,411 | ) | | | (720,032,050 | ) |
Net increase (decrease) | | | 8,586,377 | | | $ | 696,883,004 | | | | (1,348,914 | ) | | $ | (144,735,583 | ) |
Year ended September 30, 2018 | | | | | | | | | | | | | | | | |
Shares sold | | | 17,913,232 | | | $ | 1,294,331,619 | | | | 11,217,056 | | | $ | 1,090,829,917 | |
Shares issued in reinvestment of distributions | | | 246,188 | | | | 16,654,639 | | | | 664,503 | | | | 62,044,590 | |
Shares redeemedin-kind (Note 12) | | | — | | | | — | | | | (596,870 | ) | | | (64,204,995 | ) |
Shares redeemed | | | (5,146,068 | ) | | | (398,067,873 | ) | | | (5,377,348 | ) | | | (531,915,647 | ) |
Net increase (decrease) | | | 13,013,352 | | | $ | 912,918,385 | | | | 5,907,341 | | | $ | 556,753,865 | |
| | | | |
| | | |
116 | | Annual Report | | franklintempleton.com |
FRANKLIN CUSTODIAN FUNDS
NOTES TO FINANCIAL STATEMENTS
| | | | | | | | | | | | | | | | |
| | | Franklin | | | Franklin | |
| | | DynaTech Fund | | | Growth Fund | |
| | | Shares | | | Amount | | | Shares | | | Amount | |
Advisor Class Shares: | | | | | | | | | | | | | | | | |
Year ended September 30, 2019 | | | | | | | | | | | | | | | | |
Shares sold | | | 8,540,729 | | | $ | 696,364,989 | | | | 8,275,911 | | | $ | 843,459,997 | |
Shares issued in reinvestment of distributions | | | 208,740 | | | | 15,569,915 | | | | 463,663 | | | | 46,542,484 | |
Shares redeemedin-kind (Note 12) | | | — | | | | — | | | | (956,267 | ) | | | (87,335,163 | ) |
Shares redeemed | | | (3,396,410 | ) | | | (267,725,750 | ) | | | (8,294,264 | ) | | | (856,648,088 | ) |
Net increase (decrease) | | | 5,353,059 | | | $ | 444,209,154 | | | | (510,957 | ) | | $ | (53,980,770 | ) |
Year ended September 30, 2018 | | | | | | | | | | | | | | | | |
Shares sold | | | 5,333,633 | | | $ | 398,259,942 | | | | 7,218,349 | | | $ | 715,181,948 | |
Shares issued in reinvestment of distributions | | | 79,332 | | | | 5,323,142 | | | | 772,474 | | | | 72,226,322 | |
Shares redeemed | | | (8,277,537 | ) | | | (560,428,615 | ) | | | (9,391,141 | ) | | | (913,663,262 | ) |
Net increase (decrease) | | | (2,864,572 | ) | | $ | (156,845,531 | ) | | | (1,400,318 | ) | | $ | (126,254,992 | ) |
aMay include a portion of Class C shares that were automatically converted to Class A.
| | | | | | | | | | | | | | | | |
| | | | | | | | | Franklin | |
| | | Franklin | | | U.S. Government | |
| | | Income Fund | | | Securities Fund | |
| | | Shares | | | Amount | | | Shares | | | Amount | |
Class A Shares: | | | | | | | | | | | | | | | | |
Year ended September 30, 2019 | | | | | | | | | | | | | | | | |
Shares solda | | | 3,539,972,556 | | | $ | 8,051,972,021 | | | | 63,345,656 | | | $ | 375,877,932 | |
Shares issued in reinvestment of distributions | | | 101,099,391 | | | | 229,215,481 | | | | 921,344 | | | | 5,509,871 | |
Shares redeemed | | | (455,241,055 | ) | | | (1,031,150,814 | ) | | | (9,596,929 | ) | | | (57,176,939 | ) |
Net increase (decrease) | | | 3,185,830,892 | | | $ | 7,250,036,688 | | | | 54,670,071 | | | $ | 324,210,864 | |
Year ended September 30, 2018b | | | | | | | | | | | | | | | | |
Shares sold | | | 47,757,868 | | | $ | 110,955,834 | | | | 854,097 | | | $ | 5,012,817 | |
Shares issued in reinvestment of distributions | | | — | | | | — | | | | 1,534 | | | | 8,990 | |
Shares redeemed | | | (1,647,742 | ) | | | (3,831,661 | ) | | | (91,919 | ) | | | (538,723 | ) |
Net increase (decrease) | | | 46,110,126 | | | $ | 107,124,173 | | | | 763,712 | | | $ | 4,483,084 | |
Class A1 Shares: | | | | | | | | | | | | | | | | |
Year ended September 30, 2019 | | | | | | | | | | | | | | | | |
Shares sold | | | 734,292,978 | | | $ | 1,667,920,670 | | | | 31,667,964 | | | $ | 188,180,745 | |
Shares issued in reinvestment of distributions | | | 861,324,178 | | | | 1,956,731,362 | | | | 12,257,776 | | | | 72,888,073 | |
Shares redeemed | | | (2,886,028,051 | ) | | | (6,545,500,654 | ) | | | (98,666,952 | ) | | | (584,924,153 | ) |
Net increase (decrease) | | | (1,290,410,895 | ) | | $ | (2,920,848,622 | ) | | | (54,741,212 | ) | | $ | (323,855,335 | ) |
Year ended September 30, 2018 | | | | | | | | | | | | | | | | |
Shares sold | | | 1,654,073,714 | | | $ | 3,876,349,005 | | | | 91,619,493 | | | $ | 551,601,916 | |
Shares issued in reinvestment of distributions | | | 897,284,705 | | | | 2,093,922,360 | | | | 14,259,224 | | | | 84,951,032 | |
Shares redeemed | | | (3,507,769,889 | ) | | | (8,201,911,014 | ) | | | (160,829,797 | ) | | | (962,646,389 | ) |
Net increase (decrease) | | | (956,411,470 | ) | | $ | (2,231,639,649 | ) | | | (54,951,080 | ) | | $ | (326,093,441 | ) |
| | | | |
| | | |
| franklintempleton.com | | Annual Report | | 117 |
FRANKLIN CUSTODIAN FUNDS
NOTES TO FINANCIAL STATEMENTS
2. Shares of Beneficial Interest(continued)
| | | | | | | | | | | | | | | | |
| | | | | | | | | Franklin | |
| | | Franklin | | | U.S. Government | |
| | | Income Fund | | | Securities Fund | |
| | | Shares | | | Amount | | | Shares | | | Amount | |
Class M Shares:c | | | | | | | | | | | | | | | | |
Year ended September 30, 2018d | | | | | | | | | | | | | | | | |
Shares sold | | | 2,058 | | | $ | 5,000 | | | | 829 | | | $ | 5,000 | |
Shares redeemed | | | (2,058 | ) | | | (4,771 | ) | | | (829 | ) | | | (4,892 | ) |
| | | | |
Net increase (decrease) | | | — | | | $ | 229 | | | | — | | | $ | 108 | |
Class C Shares: | | | | | | | | | | | | | | | | |
Year ended September 30, 2019 | | | | | | | | | | | | | | | | |
Shares sold | | | 604,815,133 | | | $ | 1,395,555,258 | | | | 9,900,368 | | | $ | 58,656,797 | |
Shares issued in reinvestment of distributions | | | 282,624,044 | | | | 650,966,785 | | | | 1,677,007 | | | | 9,894,309 | |
Shares redeemeda | | | (3,568,750,502 | ) | | | (8,244,148,551 | ) | | | (45,441,898 | ) | | | (266,169,376 | ) |
| | | | |
Net increase (decrease) | | | (2,681,311,325 | ) | | $ | (6,197,626,508 | ) | | | (33,864,523 | ) | | $ | (197,618,270 | ) |
| | | | |
Year ended September 30, 2018 | | | | | | | | | | | | | | | | |
Shares sold | | | 582,283,439 | | | $ | 1,382,849,638 | | | | 7,433,473 | | | $ | 44,268,648 | |
Shares issued in reinvestment of distributions | | | 377,996,060 | | | | 893,922,732 | | | | 2,628,467 | | | | 15,553,873 | |
Shares redeemed | | | (2,018,663,790 | ) | | | (4,782,175,252 | ) | | | (42,755,854 | ) | | | (254,172,773 | ) |
| | | | |
Net increase (decrease) | | | (1,058,384,291 | ) | | $ | (2,505,402,882 | ) | | | (32,693,914 | ) | | $ | (194,350,252 | ) |
Class R Shares: | �� | | | | | | | | | | | | | | | |
Year ended September 30, 2019 | | | | | | | | | | | | | | | | |
Shares sold | | | 22,136,825 | | | $ | 49,568,022 | | | | 1,880,919 | | | $ | 11,250,749 | |
Shares issued in reinvestment of distributions | | | 5,857,339 | | | | 13,054,171 | | | | 133,133 | | | | 792,020 | |
Shares redeemed | | | (40,417,255 | ) | | | (90,037,504 | ) | | | (1,919,391 | ) | | | (11,427,767 | ) |
| | | | |
Net increase (decrease) | | | (12,423,091 | ) | | $ | (27,415,311 | ) | | | 94,661 | | | $ | 615,002 | |
| | | | |
Year ended September 30, 2018 | | | | | | | | | | | | | | | | |
Shares sold | | | 22,303,807 | | | $ | 51,304,961 | | | | 1,311,996 | | | $ | 7,841,271 | |
Shares issued in reinvestment of distributions | | | 6,461,113 | | | | 14,805,328 | | | | 144,887 | | | | 862,596 | |
Shares redeemed | | | (52,753,780 | ) | | | (121,698,325 | ) | | | (2,397,338 | ) | | | (14,338,539 | ) |
| | | | |
Net increase (decrease) | | | (23,988,860 | ) | | $ | (55,588,036 | ) | | | (940,455 | ) | | $ | (5,634,672 | ) |
Class R6 Shares: | | | | | | | | | | | | | | | | |
Year ended September 30, 2019 | | | | | | | | | | | | | | | | |
Shares sold | | | 83,989,939 | | | $ | 189,707,762 | | | | 59,439,310 | | | $ | 354,899,398 | |
Shares issued in reinvestment of distributions | | | 44,158,383 | | | | 99,481,277 | | | | 4,115,777 | | | | 24,590,060 | |
Shares redeemed | | | (191,415,233 | ) | | | (429,563,313 | ) | | | (87,769,171 | ) | | | (529,847,901 | ) |
| | | | |
Net increase (decrease) | | | (63,266,911 | ) | | $ | (140,374,274 | ) | | | (24,214,084 | ) | | $ | (150,358,443 | ) |
| | | | |
Year ended September 30, 2018 | | | | | | | | | | | | | | | | |
Shares sold | | | 241,446,374 | | | $ | 566,628,288 | | | | 61,412,244 | | | $ | 370,212,496 | |
Shares issued in reinvestment of distributions | | | 46,333,019 | | | | 107,151,115 | | | | 3,488,682 | | | | 20,828,159 | |
Shares redeemed | | | (157,691,667 | ) | | | (364,327,918 | ) | | | (19,140,378 | ) | | | (114,420,880 | ) |
| | | | |
Net increase (decrease) | | | 130,087,726 | | | $ | 309,451,485 | | | | 45,760,548 | | | $ | 276,619,775 | |
| | | | |
| | | |
118 | | Annual Report | | franklintempleton.com |
FRANKLIN CUSTODIAN FUNDS
NOTES TO FINANCIAL STATEMENTS
| | | | | | | | | | | | | | | | |
| | | | | | | | | Franklin | |
| | | Franklin | | | U.S. Government | |
| | | Income Fund | | | Securities Fund | |
| | | Shares | | | Amount | | | Shares | | | Amount | |
Advisor Class Shares: | | | | | | | | | | | | | | | | |
Year ended September 30, 2019 | | | | | | | | | | | | | | | | |
Shares sold | | | 1,215,772,185 | | | $ | 2,742,135,489 | | | | 86,539,808 | | | $ | 515,721,436 | |
Shares issued in reinvestment of distributions | | | 241,618,818 | | | | 544,234,079 | | | | 4,124,300 | | | | 24,667,003 | |
Shares redeemed | | | (1,205,298,748 | ) | | | (2,705,062,441 | ) | | | (58,081,812 | ) | | | (346,144,755 | ) |
| | | | |
Net increase (decrease) | | | 252,092,255 | | | $ | 581,307,127 | | | | 32,582,296 | | | $ | 194,243,684 | |
| | | | |
Year ended September 30, 2018 | | | | | | | | | | | | | | | | |
Shares sold | | | 1,216,256,316 | | | $ | 2,822,041,342 | | | | 40,864,155 | | | $ | 245,204,402 | |
Shares issued in reinvestment of distributions | | | 227,374,647 | | | | 525,980,680 | | | | 3,544,600 | | | | 21,175,930 | |
Shares redeemed | | | (1,442,679,003 | ) | | | (3,349,547,760 | ) | | | (60,767,806 | ) | | | (366,985,904 | ) |
| | | | |
Net increase (decrease) | | | 951,960 | | | $ | (1,525,738 | ) | | | (16,359,051 | ) | | $ | (100,605,572 | ) |
aMay include a portion of Class C shares that were automatically converted to Class A.
bFor the period September 10, 2018 (effective date) to September 30, 2018.
cClass M was closed to investors on June 8, 2018.
dFor the period January 25, 2018 (effective date) to June 8, 2018.
| | | | | | | | |
| | | Franklin | |
| | | Utilities Fund | |
| | | | |
| | | Shares | | | Amount | |
| | |
Class A Shares: | | | | | | | | |
Year ended September 30, 2019 | | | | | | | | |
Shares solda | | | 27,331,039 | | | $ | 549,681,782 | |
Shares issued in reinvestment of distributions | | | 567,087 | | | | 11,254,351 | |
Shares redeemed | | | (4,931,903 | ) | | | (100,183,516) | |
| | | | |
| | |
Net increase (decrease) | | | 22,966,223 | | | $ | 460,752,617 | |
| | | | |
| | |
Year ended September 30, 2018b | | | | | | | | |
Shares sold | | | 192,333 | | | $ | 3,622,735 | |
Shares redeemed | | | (2,829 | ) | | | (52,133) | |
| | | | |
| | |
Net increase (decrease) | | | 189,504 | | | $ | 3,570,602 | |
| | | | |
| | |
Class A1 Shares: | | | | | | | | |
Year ended September 30, 2019 | | | | | | | | |
Shares sold | | | 12,428,032 | | | $ | 244,772,010 | |
Shares issued in reinvestment of distributions | | | 9,723,812 | | | | 190,596,017 | |
Shares redeemed | | | (32,697,882 | ) | | | (652,169,607) | |
| | | | |
| | |
Net increase (decrease) | | | (10,546,038 | ) | | $ | (216,801,580) | |
| | | | |
| | |
Year ended September 30, 2018 | | | | | | | | |
Shares sold | | | 24,701,743 | | | $ | 456,163,799 | |
Shares issued in reinvestment of distributions | | | 8,528,408 | | | | 161,849,791 | |
Shares redeemed | | | (55,450,300 | ) | | | (1,018,710,628) | |
| | | | |
| | |
Net increase (decrease) | | | (22,220,149 | ) | | $ | (400,697,038) | |
| | | | |
| | | | |
| | | |
| franklintempleton.com | | Annual Report | | 119 |
FRANKLIN CUSTODIAN FUNDS
NOTES TO FINANCIAL STATEMENTS
2. Shares of Beneficial Interest(continued)
| | | | | | | | |
| | | Franklin | |
| | | Utilities Fund | |
| | | Shares | | | Amount | |
| | |
Class M Shares:c | | | | | | | | |
Year ended September 30, 2018d | | | | | | | | |
Shares sold | | | 276 | | | $ | 5,000 | |
Shares redeemed | �� | | (276 | ) | | | (4,738) | |
| | | | |
| | |
Net increase (decrease) | | | — | | | $ | 262 | |
| | | | |
| | |
Class C Shares: | | | | | | | | |
Year ended September 30, 2019 | | | | | | | | |
Shares sold | | | 4,737,482 | | | $ | 94,764,608 | |
Shares issued in reinvestment of distributions | | | 1,745,793 | | | | 33,948,245 | |
Shares redeemeda | | | (17,173,602 | ) | | | (340,143,886) | |
| | | | |
| | |
Net increase (decrease) | | | (10,690,327 | ) | | $ | (211,431,033) | |
| | | | |
| | |
Year ended September 30, 2018 | | | | | | | | |
Shares sold | | | 3,577,672 | | | $ | 66,427,917 | |
Shares issued in reinvestment of distributions | | | 1,833,349 | | | | 34,761,364 | |
Shares redeemed | | | (11,911,335 | ) | | | (216,978,128) | |
| | | | |
| | |
Net increase (decrease) | | | (6,500,314 | ) | | $ | (115,788,847) | |
| | | | |
| | |
Class R Shares: | | | | | | | | |
Year ended September 30, 2019 | | | | | | | | |
Shares sold | | | 2,089,705 | | | $ | 41,924,174 | |
Shares issued in reinvestment of distributions | | | 204,895 | | | | 4,003,694 | |
Shares redeemed | | | (1,612,008 | ) | | | (32,019,228) | |
| | | | |
| | |
Net increase (decrease) | | | 682,592 | | | $ | 13,908,640 | |
| | | | |
| | |
Year ended September 30, 2018 | | | | | | | | |
Shares sold | | | 977,147 | | | $ | 17,937,233 | |
Shares issued in reinvestment of distributions | | | 181,427 | | | | 3,446,022 | |
Shares redeemed | | | (2,178,750 | ) | | | (39,843,759) | |
| | | | |
| | |
Net increase (decrease) | | | (1,020,176 | ) | | $ | (18,460,504) | |
| | | | |
| | |
Class R6 Shares: | | | | | | | | |
| | |
Year ended September 30, 2019 | | | | | | | | |
Shares sold | | | 3,594,861 | | | $ | 72,892,164 | |
Shares issued in reinvestment of distributions | | | 643,860 | | | | 12,661,539 | |
Shares redeemed | | | (9,878,250 | ) | | | (203,902,091) | |
| | | | |
| | |
Net increase (decrease) | | | (5,639,529 | ) | | $ | (118,348,388) | |
| | | | |
| | |
Year ended September 30, 2018 | | | | | | | | |
Shares sold | | | 2,535,167 | | | $ | 47,060,404 | |
Shares issued in reinvestment of distributions | | | 576,101 | | | | 10,987,844 | |
Shares redeemed | | | (3,356,319 | ) | | | (62,348,594) | |
| | | | |
| | |
Net increase (decrease) | | | (245,051 | ) | | $ | (4,300,346) | |
| | | | |
| | | | |
| | | |
120 | | Annual Report | | franklintempleton.com |
FRANKLIN CUSTODIAN FUNDS
NOTES TO FINANCIAL STATEMENTS
| | | | | | | | |
| | | Franklin | |
| | | Utilities Fund | |
| | | | |
| | | Shares | | | Amount | |
| | |
Advisor Class Shares: | | | | | | | | |
Year ended September 30, 2019 | | | | | | | | |
Shares sold | | | 21,320,610 | | | $ | 434,204,062 | |
Shares issued in reinvestment of distributions | | | 2,659,178 | | | | 52,686,480 | |
Shares redeemed | | | (17,744,082 | ) | | | (354,492,714) | |
| | | | |
| | |
Net increase (decrease) | | | 6,235,706 | | | $ | 132,397,828 | |
| | | | |
| | |
Year ended September 30, 2018 | | | | | | | | |
Shares sold | | | 14,395,975 | | | $ | 268,529,702 | |
Shares issued in reinvestment of distributions | | | 2,102,341 | | | | 40,138,480 | |
Shares redeemed | | | (17,010,198 | ) | | | (312,598,481) | |
| | | | |
| | |
Net increase (decrease) | | | (511,882 | ) | | $ | (3,930,299) | |
| | | | |
aMay include a portion of Class C shares that were automatically converted to Class A.
bFor the period September 10, 2018 (effective date) to September 30, 2018.
cClass M was closed to investors on June 8, 2018.
dFor the period January 25, 2018 (effective date) to June 8, 2018.
3. Transactions with Affiliates
Franklin Resources, Inc. is the holding company for various subsidiaries that together are referred to as Franklin Templeton. Certain officers and trustees of the Trust are also officers and/or directors of the following subsidiaries:
| | | | |
| Subsidiary | | Affiliation | | |
| | |
Franklin Advisers, Inc. (Advisers) | | Investment manager | | |
| | |
Franklin Templeton Institutional, LLC (FT Institutional) | | Investment manager | | |
| | |
Franklin Templeton Services, LLC (FT Services) | | Administrative manager | | |
| | |
Franklin Templeton Distributors, Inc. (Distributors) | | Principal underwriter | | |
| | |
Franklin Templeton Investor Services, LLC (Investor Services) | | Transfer agent | | |
| | | | |
| | | |
| franklintempleton.com | | Annual Report | | 121 |
FRANKLIN CUSTODIAN FUNDS
NOTES TO FINANCIAL STATEMENTS
3. Transactions with Affiliates(continued)
a. Management Fees
Franklin Income Fund and Franklin Utilities Fund pay an investment management fee to Advisers based on themonth-end net assets of each of the Funds as follows:
| | |
| Annualized Fee Rate | | Net Assets |
0.625% | | Up to and including $100 million |
0.500% | | Over $100 million, up to and including $250 million |
0.450% | | Over $250 million, up to and including $7.5 billion |
0.440% | | Over $7.5 billion, up to and including $10 billion |
0.430% | | Over $10 billion, up to and including $12.5 billion |
0.420% | | Over $12.5 billion, up to and including $15 billion |
0.400% | | Over $15 billion, up to and including $17.5 billion |
0.380% | | Over $17.5 billion, up to and including $20 billion |
0.360% | | Over $20 billion, up to and including $35 billion |
0.355% | | Over $35 billion, up to and including $50 billion |
0.350% | | Over $50 billion, up to and including $65 billion |
0.345% | | Over $65 billion, up to and including $80 billion |
0.340% | | In excess of $80 billion |
Franklin DynaTech Fund, Franklin Growth Fund and Franklin U.S. Government Securities Fund pay an investment management fee to Advisers based on themonth-end net assets of each of the Funds as follows:
| | |
| Annualized Fee Rate | | Net Assets |
0.625% | | Up to and including $100 million |
0.500% | | Over $100 million, up to and including $250 million |
0.450% | | Over $250 million, up to and including $7.5 billion |
0.440% | | Over $7.5 billion, up to and including $10 billion |
0.430% | | Over $10 billion, up to and including $12.5 billion |
0.420% | | Over $12.5 billion, up to and including $15 billion |
0.400% | | Over $15 billion, up to and including $17.5 billion |
0.380% | | Over $17.5 billion, up to and including $20 billion |
0.360% | | Over $20 billion, up to and including $35 billion |
0.355% | | Over $35 billion, up to and including $50 billion |
0.350% | | In excess of $50 billion |
For the year ended September 30, 2019, each Fund’s gross effective investment management fee rate based on average daily net assets was as follows:
| | | | | | | | | | | | | | | | | | |
Franklin DynaTech Fund | | | Franklin Growth Fund | | | Franklin Income Fund | | | Franklin U.S. Government Securities Fund | | | Franklin Utilities Fund | |
| 0.459% | | | | 0.441% | | | | 0.374% | | | | 0.453% | | | | 0.457% | |
| | | | |
| | | |
122 | | Annual Report | | franklintempleton.com |
FRANKLIN CUSTODIAN FUNDS
NOTES TO FINANCIAL STATEMENTS
Effective October 24, 2019, under a subadvisory agreement, FT Institutional, an affiliate of Advisers, will provide subadvisory services to Franklin U.S. Government Securities Fund. The subadvisory fee will be paid by Advisers based on the Fund’s average daily net assets, and will not be an additional expense of the Fund.
b. Administrative Fees
Under an agreement with Advisers, FT Services provides administrative services to the Funds. The fee is paid by Advisers based on each of the Funds’ average daily net assets, and is not an additional expense of the Funds.
c. Distribution Fees
The Board has adopted distribution plans for each share class, with the exception of Class R6 and Advisor Class shares, pursuant to Rule12b-1 under the 1940 Act. Under the Funds’ Class A and A1 reimbursement distribution plans, the Funds reimburse Distributors for costs incurred in connection with the servicing, sale and distribution of each Fund’s shares up to the maximum annual plan rate for each class. Under the Class A and A1 reimbursement distribution plans, costs exceeding the maximum for the current plan year cannot be reimbursed in subsequent periods. In addition, under the Funds’ Class C and R compensation distribution plans, the Funds pay Distributors for costs incurred in connection with the servicing, sale and distribution of each Fund’s shares up to the maximum annual plan rate for each class. The plan year, for purposes of monitoring compliance with the maximum annual plan rates, is February 1 through January 31 for each Fund.
The maximum annual plan rates, based on the average daily net assets, for each class, are as follows:
| | | | | | | | | | | | | | | | | | |
| | | Franklin
DynaTech Fund | | | Franklin Growth Fund | | | Franklin Income Fund | | | Franklin U.S. Government Securities Fund | | | Franklin Utilities Fund |
| | | | | |
Reimbursement Plans: | | | | | | | | | | | | | | | | | | |
Class A | | | 0.25% | | | | 0.25% | | | | 0.25% | | | | 0.25% | | | 0.25% |
Class A1 | | | —% | | | | —% | | | | 0.15% | | | | 0.15% | | | 0.15% |
Compensation Plans: | | | | | | | | | | | | | | | | | | |
Class C | | | 1.00% | | | | 1.00% | | | | 0.65% | | | | 0.65% | | | 0.65% |
Class R | | | 0.50% | | | | 0.50% | | | | 0.50% | | | | 0.50% | | | 0.50% |
d. Sales Charges/Underwriting Agreements
Front-end sales charges and contingent deferred sales charges (CDSC) do not represent expenses of the Funds. These charges are deducted from the proceeds of sales of fund shares prior to investment or from redemption proceeds prior to remittance, as applicable. Distributors has advised the Funds of the following commission transactions related to the sales and redemptions of the Funds’ shares for the year:
| | | | | | | | | | | | | | | | | | |
| | | | | |
| | | Franklin DynaTech Fund | | | Franklin Growth Fund | | | Franklin Income Fund | | | Franklin U.S. Government Securities Fund | | | Franklin Utilities Fund |
| | | | | |
Sales charges retained net of commissions paid to unaffiliated brokers/dealers | | | $1,948,791 | | | | $1,347,568 | | | | $3,272,500 | | | | $84,688 | | | $189,110 |
| | | | | |
CDSC retained | | | $ 103,500 | | | | $ 69,748 | | | | $ 817,809 | | | | $33,351 | | | $ 22,459 |
Effective March 1, 2019, certainfront-end sales charges on Class A and A1 shares, if any, were lowered. Further details are disclosed in the Funds’ Prospectus.
| | | | |
| | | |
| franklintempleton.com | | Annual Report | | 123 |
FRANKLIN CUSTODIAN FUNDS
NOTES TO FINANCIAL STATEMENTS
3. Transactions with Affiliates(continued)
e. Transfer Agent Fees
Each class of shares pays transfer agent fees to Investor Services for its performance of shareholder servicing obligations. The fees are based on an annualized asset based fee of 0.02% plus a transaction based fee. In addition, each class reimburses Investor Services for out of pocket expenses incurred and, except for Class R6, reimburses shareholder servicing fees paid to third parties. These fees are allocated daily based upon their relative proportion of such classes’ aggregate net assets. Class R6 pays Investor Services transfer agent fees specific to that class.
For the year ended September 30, 2019, the Funds paid transfer agent fees as noted in the Statements of Operations of which the following amounts were retained by Investor Services:
| | | | | | | | | | | | | | | | | | | | |
| | | Franklin
DynaTech Fund | | | Franklin
Growth Fund | | | Franklin
Income Fund | | | Franklin U.S. Government
Securities Fund | | | Franklin Utilities Fund | |
| | | | | |
Transfer agent fees | | | $3,263,368 | | | | $7,054,587 | | | | $27,027,775 | | | | $3,723,605 | | | | $3,020,909 | |
f. Investments in Affiliated Management Investment Companies
Certain or all Funds invest in one or more affiliated management investment companies for purposes other than exercising a controlling influence over the management or policies. Management fees paid by the Funds are waived on assets invested in the affiliated management investment companies, as noted in the Statements of Operations, in an amount not to exceed the management and administrative fees paid directly or indirectly by each affiliate. During the year ended September 30, 2019, investments in affiliated management investment companies were as follows:
| | | | | | | | | | | | | | | | | | | | | | | | | | | | | | | | | | | | | | | | |
| | | Value at
Beginning of Year | | | Purchases | | | Sales | | | | | | Realized
Gain (Loss) | | | Net Change in
Unrealized
Appreciation
(Depreciation) | | | Value at End of Year | | | | | | Number of
Shares Held at End
of Year | | | Investment
Income | |
Franklin DynaTech Fund | | | | | | | | | | | | | | | | | | | | | | | | | | | | | | | | | | | | | |
| | | | | | | | | |
Non-Controlled Affiliates | | | | | | | | | | | | | | | | | | | | | | | | | | | | | | | | | | | | | |
| | | | | | | | | | | | | | | | | | | | | | | | | | | | | | Dividends | |
| | | | | | | | | | | | | | | | | | | | | | | | | | | | | | | | | | | | | | | | |
Institutional Fiduciary Trust Money Market Portfolio, 1.71% | | $ | 125,141,525 | | | $ | 1,901,802,709 | | | $ | (1,587,592,513 | ) | | | | | | | $ — | | | | $ — | | | $ | 439,351,721 | | | | | | | | 439,351,721 | | | $ | 5,244,134 | |
| | | | | | | | | | | | | | | | |
| | | | | | | | | |
Franklin Growth Fund | | | | | | | | | | | | | | | | | | | | | | | | | | | | | | | | | | | | | |
| | | | | | | | | |
Non-Controlled Affiliates | | | | | | | | | | | | | | | | | | | | | | | | | | | | | | | | | | | | | |
| | | | | | | | | | | | | | | | | | | | | | | | | | | | | | Dividends | |
| | | | | | | | | | | | | | | | | | | | | | | | | | | | | | | | | | | | | | | | |
Institutional Fiduciary Trust Money Market Portfolio, 1.71% | | $ | 224,477,141 | | | $ | 1,246,406,265 | | | $ | (1,275,156,424 | ) | | | | | | | $ — | | | | $ — | | | $ | 195,726,982 | | | | | | | | 195,726,982 | | | $ | 4,811,993 | |
| | | | | | | | | | | | | | | | |
| | | | | | | | | |
Franklin Income Fund | | | | | | | | | | | | | | | | | | | | | | | | | | | | | | | | | | | | | |
| | | | | | | | | |
Non-Controlled Affiliates | | | | | | | | | | | | | | | | | | | | | | | | | | | | | | | | | | | | | |
| | | | | | | | | | | | | | | | | | | | | | | | | | | | | | Dividends | |
| | | | | | | | | | | | | | | | | | | | | | | | | | | | | | | | | | | | | | | | |
Institutional Fiduciary Trust Money Market Portfolio, 1.71% | | $ | 351,285,912 | | | $ | 18,895,140,807 | | | $ | (17,860,381,666 | ) | | | | | | | $ — | | | | $ — | | | $ | 1,386,045,053 | | | | | | | | 1,386,045,053 | | | $ | 21,027,211 | |
| | | | |
| | | |
124 | | Annual Report | | franklintempleton.com |
FRANKLIN CUSTODIAN FUNDS
NOTES TO FINANCIAL STATEMENTS
| | | | | | | | | | | | | | | | | | | | | | | | | | | | | | | | | | | | | | | | |
| | | Value at
Beginning of Year | | | Purchases | | | Sales | | | | | | Realized
Gain (Loss) | | | Net Change in
Unrealized
Appreciation
(Depreciation) | | | Value at End of Year | | | | | | Number of
Shares Held at End
of Year | | | Investment
Income | |
Franklin Income Fund(continued) | | | | | | | | | | | | | | | | | | | | | | | | | | | | | | | | | | | | | |
| | | | | | | | | |
Non-Controlled Affiliates(continued) | | | | | | | | | | | | | | | | | | | | | | | | | | | | | | | | | | | | | |
| | | | | | | | | | | | | | | | | | | | | | | | | | | | | | | | | | | | | |
| Income from
securities
loaned |
|
| | | | | | | | | | | | | | | | | | | | | | | | | | | | | | | | | | | | | | | | |
Institutional Fiduciary Trust Money Market Portfolio, 1.71% | | $ | 12,623,000 | | | $ | 67,294,000 | | | $ | (56,015,000 | ) | | | | | | | $ — | | | | $ — | | | $ | 23,902,000 | | | | | | | | 23,902,000 | | | $ | 115,507 | |
| | | | | | | | | | | | | | | | |
| | | | | | | | | | |
Total Affiliated Securities | | $ | 363,908,912 | | | $ | 18,962,434,807 | | | $ | (17,916,396,666 | ) | | | | | | | $ — | | | | $ — | | | $ | 1,409,947,053 | | | | | | | | | | | $ | 21,142,718 | |
| | | | | | | | | | | | | | | | |
| | | | | | | | |
Franklin U.S. Government Securities Fund | | | | | | | | | | | | | | | | | | | | | | | | | | | | | | | | | |
| | | | | | | | | |
Non-Controlled Affiliates | | | | | | | | | | | | | | | | | | | | | | | | | | | | | | | | | | | | | |
| | | | | | | | | | | | | | | | | | | | | | | | | | | | | | | | | | | | | | | Dividends | |
| | | | | | | | | | | | | | | | | | | | | | | | | | | | | | | | | | | | | | | | |
Institutional Fiduciary Trust Money Market Portfolio, 1.71% | | $ | 93,109,667 | | | $ | 1,163,313,178 | | | $ | (1,169,614,376 | ) | | | | | | | $ — | | | | $ — | | | $ | 86,808,469 | | | | | | | | 86,808,469 | | | $ | 2,940,395 | |
| | | | | | | | | | | | | | | | |
| | | | | | | | | |
Franklin Utilities Fund | | | | | | | | | | | | | | | | | | | | | | | | | | | | | | | | | | | | | |
| | | | | | | | | |
Non-Controlled Affiliates | | | | | | | | | | | | | | | | | | | | | | | | | | | | | | | | | | | | | |
| | | | | | | | | | |
| | | | | | | | | | | | | | | | | | | | | | | | | | | | | | | | | | | | | | | Dividends | |
| | | | | | | | | | | | | | | | | | | | | | | | | | | | | | | | | | | | | | | | |
Institutional Fiduciary Trust Money Market Portfolio, 1.71% | | $ | 17,808,342 | | | $ | 809,185,993 | | | $ | (791,623,278 | ) | | | | | | | $ — | | | | $ — | | | $ | 35,371,057 | | | | | | | | 35,371,057 | | | $ | 860,141 | |
| | | | | | | | | | | | | | | | | | | | | | | | | | | | | | | | | | | | | |
| Income from
securities
loaned |
|
| | | | | | | | | | | | | | | | | | | | | | | | | | | | | | | | | | | | | | | | |
Institutional Fiduciary Trust Money Market Portfolio, 1.71% | | | — | | | | 73,907,858 | | | | (73,907,858 | ) | | | | | | | — | | | | — | | | | — | | | | | | | | — | | | | 10,604 | |
| | | | | | | | | | | | | | | | |
| | | | | | | | | | |
Total Affiliated Securities | | $ | 17,808,342 | | | $ | 883,093,851 | | | $ | (865,531,136 | ) | | | | | | | $ — | | | | $ — | | | $ | 35,371,057 | | | | | | | | | | | $ | 870,745 | |
| | | | | | | | | | | | | | | | |
g. Waiver and Expense Reimbursements
For Franklin Income Fund, Investor Services has contractually agreed in advance to waive or limit its fees so that the Class R6 transfer agent fees do not exceed 0.02% based on the average net assets of the class until January 31, 2020. For Franklin DynaTech Fund, Franklin Growth Fund, Franklin U.S. Government Securities Fund and Franklin Utilities Fund, Investor Services has contractually agreed in advance to waive or limit its fees so that the Class R6 transfer agent fees do not exceed 0.03% based on the average net assets of the class until January 31, 2020.
Prior to February 1, 2019, expenses of Franklin Income Fund for Class R6 were limited to 0.01% based on the average net assets of the class.
Prior to February 1, 2019, expenses of Franklin DynaTech Fund, Franklin Growth Fund, Franklin U.S. Government Securities Fund and Franklin Utilities Fund for Class R6 were limited to 0.02% based on the average net assets of the class.
| | | | |
| | | |
| franklintempleton.com | | Annual Report | | 125 |
FRANKLIN CUSTODIAN FUNDS
NOTES TO FINANCIAL STATEMENTS
3. Transactions with Affiliates (continued)
h. Other Affiliated Transactions
At September 30, 2019, one or more of the funds in Franklin Fund Allocator Series owned a percentage of the following Funds’ outstanding shares:
| | | | | | |
Franklin DynaTech Fund | | Franklin Growth Fund | | Franklin Income Fund | | Franklin U.S. Government
Securities Fund |
1.8% | | 5.1% | | 1.7% | | 5.6% |
i. Interfund Transactions
Franklin Income Fund engaged in purchases and sales of investments with funds or other accounts that have common investment managers (or affiliated investment managers), directors, trustees or officers. During the year ended September 30, 2019, these purchase and sale transactions aggregated $31,420,250 and $0, respectively.
4. Expense Offset Arrangement
The Funds have entered into an arrangement with their custodian whereby credits realized as a result of uninvested cash balances are used to reduce a portion of the Funds’ custodian expenses. During the year ended September 30, 2019, the custodian fees were reduced as noted in the Statements of Operations.
5. Income Taxes
For tax purposes, capital losses may be carried over to offset future capital gains.
At September 30, 2019, the capital loss carryforwards were as follows:
| | | | | | | | |
| | | Franklin Income Fund | | | Franklin U.S. Government
Securities Fund | |
| | |
Capital loss carryforwards not subject to expiration: | | | | | | | | |
Short term | | $ | 1,721,032,147 | | | | $221,741,390 | |
Long term | | | 738,314,568 | | | | 340,183,847 | |
| | | | |
Total capital loss carryforwards | | $ | 2,459,346,715 | | | | $561,925,237 | |
| | | | |
On September 30, 2019, Franklin U.S. Government Securities Fund had expired capital loss carryforwards of $4,445,156, which were reclassified topaid-in capital.
For tax purposes, the Funds may elect to defer any portion of a post-October capital loss or late-year ordinary loss to the first day of the following fiscal year. At September 30, 2019, Franklin DynaTech Fund deferred late-year ordinary losses of $14,297,131.
| | | | |
| | | |
126 | | Annual Report | | franklintempleton.com |
FRANKLIN CUSTODIAN FUNDS
NOTES TO FINANCIAL STATEMENTS
The tax character of distributions paid during the years ended September 30, 2019 and 2018, was as follows:
| | | | | | | | | | | | | | | | |
| | | Franklin DynaTech Fund | | | Franklin Growth Fund | |
| | | | |
| | | 2019 | | | 2018 | | | 2019 | | | 2018 | |
| | |
| | | | |
Distributions paid from: | | | | | | | | | | | | | | | | |
Ordinary income | | $ | — | | | $ | — | | | $ | 77,950,588 | | | $ | 64,350,332 | |
Long term capital gain | | | 168,290,858 | | | | 77,650,256 | | | | 159,117,116 | | | | 343,841,429 | |
| | | | |
| | | | |
| | $ | 168,290,858 | | | $ | 77,650,256 | | | $ | 237,067,704 | | | $ | 408,191,761 | |
| | | | |
| | |
| | | Franklin Income Fund | | | Franklin U.S. Government Securities Fund | |
| | | | |
| | | 2019 | | | 2018 | | | 2019 | | | 2018 | |
| | |
| | | | |
Distributions paid from: | | | | | | | | | | | | | | | | |
Ordinary income | | $ | 3,821,492,884 | | | $ | 3,987,779,469 | | | $ | 157,276,563 | | | $ | 164,642,414 | |
| | | | |
| | | | | | | | |
| | | Franklin Utilities Fund | |
| | | | | | | | |
| | | 2019 | | | 2018 | |
| | |
| | |
Distributions paid from: | | | | | | | | |
Ordinary income | | $ | 159,770,655 | | | $ | 169,581,554 | |
Long term capital gain | | | 173,300,087 | | | | 102,781,203 | |
| | | | |
| | |
| | $ | 333,070,742 | | | $ | 272,362,757 | |
| | | | |
At September 30, 2019, the cost of investments, net unrealized appreciation (depreciation), undistributed ordinary income and undistributed long term capital gains for income tax purposes were as follows:
| | | | | | | | | | | | |
| | | Franklin | | | Franklin | | | Franklin | |
| | | DynaTech Fund | | | Growth Fund | | | Income Fund | |
| |
| | | |
Cost of investments | | $ | 5,256,885,741 | | | $ | 5,527,334,041 | | | $ | 72,092,210,863 | |
| | | | |
| | | |
Unrealized appreciation | | $ | 3,612,648,236 | | | $ | 10,696,391,727 | | | $ | 7,006,677,634 | |
Unrealized depreciation | | | (27,122,397 | ) | | | (197,084,963 | ) | | | (4,931,398,119 | ) |
| | | | |
| | | |
Net unrealized appreciation (depreciation) | | $ | 3,585,525,839 | | | $ | 10,499,306,764 | | | $ | 2,075,279,515 | |
| | | | |
| | | |
Distributable earnings: | | | | | | | | | | | | |
Undistributed ordinary income | | $ | — | | | $ | 55,199,560 | | | $ | 22,461,916 | |
Undistributed long term capital gains | | | 71,650,551 | | | | 724,326,295 | | | | — | |
| | | | |
| | | |
Total distributable earnings | | $ | 71,650,551 | | | $ | 779,525,855 | | | $ | 22,461,916 | |
| | | | |
| | | | |
| | | |
| franklintempleton.com | | Annual Report | | 127 |
FRANKLIN CUSTODIAN FUNDS
NOTES TO FINANCIAL STATEMENTS
5. Income Taxes(continued)
| | | | | | | | |
| | | Franklin U.S. Government
Securities Fund | | Franklin Utilities Fund | |
| | |
Cost of investments | | | $5,048,581,494 | | | $ | 3,167,655,376 | |
| | | | |
| | |
Unrealized appreciation | | | $ 119,403,900 | | | $ | 3,823,127,484 | |
Unrealized depreciation | | | (12,052,199 | ) | | | (8,907,948 | ) |
| | | | |
| | |
Net unrealized appreciation (depreciation) | | | $ 107,351,701 | | | $ | 3,814,219,536 | |
| | | | |
Distributable earnings: | | | | | | | | |
Undistributed ordinary income | | | $ 2,785,756 | | | $ | 21,310,394 | |
Undistributed long term capital gains | | | — | | | | 89,565,814 | |
| | | | |
| | |
Total distributable earnings | | | $ 2,785,756 | | | $ | 110,876,208 | |
| | | | |
Differences between income and/or capital gains as determined on a book basis and a tax basis are primarily due to differing treatments of paydown losses, bond discounts and premiums, corporate actions, equity-linked securities, wash sales and gains realized onin-kind shareholder redemptions.
Franklin Growth Fund and Franklin Utilities Fund utilized a tax accounting practice to treat a portion of the proceeds from capital shares redeemed as a distribution from realized capital gains.
6. Investment Transactions
Purchases and sales of investments (excluding short term securities andin-kind transactions) for the year ended September 30, 2019, were as follows:
| | | | | | | | | | | | | | | | | | | | |
| | | Franklin
DynaTech Fund | | | Franklin Growth Fund | | | Franklin Income
Fund | | | Franklin U.S. Government
Securities Fund | | | Franklin
Utilities Fund | |
| | | | | |
Purchases | | | $2,695,184,796 | | | | $ 751,866,127 | | | | $31,487,818,452 | | | | $2,087,593,482 | | | | $487,386,909 | |
Sales | | | $1,450,116,687 | | | | $1,383,278,076 | | | | $32,949,123,459 | | | | $2,235,963,692 | | | | $615,817,011 | |
At September 30, 2019, in connection with securities lending transactions, Franklin Income Fund loaned corporate bonds and received $29,878,422 of cash collateral. The gross amount of recognized liability for such transactions is included in payable upon return of securities loaned in the Statement of Assets and Liabilities. The agreements can be terminated at any time.
7. Credit Risk and Defaulted Securities
At September 30, 2019, Franklin Income Fund had 31.8% of its portfolio invested in high yield securities, senior secured floating rate loans, or other securities rated below investment grade and unrated securities, if any. These securities may be more sensitive to economic conditions causing greater price volatility and are potentially subject to a greater risk of loss due to default than higher rated securities.
Franklin Income Fund held defaulted securities and/or other securities for which the income has been deemed uncollectible. At September 30, 2019, the aggregate value of these securities was $627,680,937, representing 0.8% of the Fund’s net assets. The Fund discontinues accruing income on securities for which income has been deemed uncollectible and provides an estimate for losses on interest receivable. The securities have been identified in the accompanying Statement of Investments.
| | | | |
| | | |
128 | | Annual Report | | franklintempleton.com |
FRANKLIN CUSTODIAN FUNDS
NOTES TO FINANCIAL STATEMENTS
8. Other Derivative Information
At September 30, 2019, investments in derivative contracts are reflected in the Statements of Assets and Liabilities as follows:
| | | | | | | | | | | | | | |
| | | Asset Derivatives | | | | | Liability Derivatives | |
Derivative Contracts Not Accounted for as Hedging Instruments | | Statements of Assets and Liabilities Location | | Fair Value | | | | | Statements of Assets and Liabilities Location | | Fair Value | |
| |
| | | | | |
Franklin Income Fund | | | | | | | | | | | | | | |
Interest rate contracts | | Variation margin on futures
contracts | | $ | 15,254,808 | a | | | | Variation margin on futures
contracts | | $ | — | |
Equity contracts | | Investments in securities, at value | | | 369,200,000 | b | | | | Options written, at value | | | 119,615,000 | |
| | | | | | | | | | | | | | |
| | | | | |
Totals | | | | $ | 384,454,808 | | | | | | | $ | 119,615,000 | |
| | | | | | | | | | | | | | |
aThis amount reflects the cumulative appreciation (depreciation) of futures contracts as reported in the Statement of Investments. Only the variation margin receivable/payable at year end is separately reported within the Statements of Assets and Liabilities. Prior variation margin movements were recorded to cash upon receipt or payment.
bPurchased option contracts are included in investments in securities, at value in the Statements of Assets and Liabilities.
For the year ended September 30, 2019, the effect of derivative contracts in the Statements of Operations was as follows:
| | | | | | | | | | |
Derivative Contracts Not Accounted for as Hedging Instruments | | Statements of Operations Location | | Net Realized
Gain (Loss) for
the Year | | | Statements of Operations Location | | Net Change in Unrealized
Appreciation
(Depreciation)
for the Year |
| | | | |
| | Net realized gain (loss) from: | | | | | | Net change in unrealized appreciation (depreciation) on: | | |
Franklin Income Fund | | | | | | | | | | |
| | | | |
Interest rate contracts | | Futures contracts | | | $(78,797,490) | | | Futures contracts | | $15,254,808 |
| | | | |
Credit contracts | | Swap contracts | | | 1,944,731 | | | Swap contracts | | — |
Equity contracts | | Investments | | | (45,179,361) | a | | Investments | | (63,190,762)a |
| | Written options | | | 157,184,184 | | | Written options | | 33,247,542 |
| | | | | | | | | | |
| | | | |
Totals | | | | | $ 35,152,064 | | | | | $(14,688,412) |
| | | | | | | | | | |
aPurchased option contracts are included in net realized gain (loss) from investments and net change in unrealized appreciation (depreciation) on investments in the Statements of Operations.
For the year ended September 30, 2019, the average month end notional amount of futures contracts, options and swap contracts represented $447,433,894, 46,488,615 shares and $46,153,846, respectively.
See Note 1(e) regarding derivative financial instruments.
| | | | |
| | | |
| franklintempleton.com | | Annual Report | | 129 |
FRANKLIN CUSTODIAN FUNDS
NOTES TO FINANCIAL STATEMENTS
9. Holdings of 5% Voting Securities of Portfolio Companies
The 1940 Act defines “affiliated companies” to include investments in portfolio companies in which a fund owns 5% or more of the outstanding voting securities. During the year ended September 30, 2019, investments in “affiliated companies” were as follows:
| | | | | | | | | | | | | | | | | | | | | | | | | | | | | | | | |
| Name of Issuer | | Value at
Beginning of Year | | | Purchases | | | Sales | | | Realized Gain (Loss) | | | Net Change in
Unrealized
Appreciation
(Depreciation) | | | Value at End of Year | | | Number of Shares/Principal
Amount Held at End of Year | | | Investment
Income | |
| | | | | | |
Franklin Income Fund | | | | | | | | | | | | | | | | | | | | | | | | | |
Non-Controlled Affiliates | | | | | | | | | | | | | | | | | | | | | | | | | |
| | | | | | | | | | | | | | | | | | | | | | | | | | | | | | | Dividends | |
| | | | | | | | | | | | | | | | | | | | | | | | | | | | | | | | |
Talos Energy Inc. | | $ | 181,082,282 | | | $ | — | | | $ | (132,423,891 | ) | | $ | (66,146,896 | ) | | $ | 17,488,505 | | | $ | — | a | | | — | | | $ | — | |
Chesapeake Energy Corp. | | | — | | | | 442,992,135 | b | | | (22,711,571 | ) | | | (6,185,255 | ) | | | (88,385,309 | ) | | | 325,710,000 | | | | 231,000,000 | | | | — | |
Chesapeake Energy Corp., cvt. pfd., 5.75% | | | 60,676,870 | | | | 10,698,000 | | | | — | | | | — | | | | (26,653,432 | ) | | | 44,721,438 | | | | 112,980 | | | | 6,496,350 | |
| | | | | | | | | | | | |
| | | | | | | | |
| | $ | 241,759,152 | | | $ | 453,690,135 | | | $ | (155,135,462 | ) | | $ | (72,332,151 | ) | | $ | (97,550,236 | ) | | $ | 370,431,438 | | | | | | | $ | 6,496,350 | |
| | | | | | | | | | | | |
| | | | | | | | |
| | | | | | | | | | | | | | | | | | | | | | | | | | | | | | | Interest | |
| | | | | | | | | | | | | | | | | | | | | | | | | | | | | | | | |
| | | | | | | | |
Chesapeake Energy Corp., cvt., senior note, 5.50%, 9/15/26 | | | 133,756,650 | | | | 23,376,653 | b | | | (112,087,784 | )b | | | (1,595 | ) | | $ | (38,968,924 | ) | | | 6,075,000 | | | | 10,000,000 | | | | 6,958,478 | |
Chesapeake Energy Corp., senior bond, 8.00%, 6/15/27 | | | 255,500,000 | | | | 83,519,806 | b | | | (117,000,000 | )b | | | — | | | | (86,519,806 | ) | | | 135,500,000 | | | | 200,000,000 | | | | 19,557,778 | |
Chesapeake Energy Corp., senior note, 7.00%, 10/01/24 | | | — | | | | 277,576,228 | b | | | — | | | | — | | | | (64,704,339 | ) | | | 212,871,889 | | | | 295,143,000 | | | | 19,973,510 | |
Chesapeake Energy Corp., senior note, 8.00%, 1/15/25 | | | 424,145,000 | | | | 158,409,081 | b | | | (30,781,250 | ) | | | 840,944 | | | | (156,126,275 | ) | | | 396,487,500 | | | | 545,000,000 | | | | 44,638,889 | |
Chesapeake Energy Corp., senior note, 7.50%, 10/01/26 | | | 50,062,500 | | | | 74,204,022 | b | | | — | | | | — | | | | (35,764,522 | ) | | | 88,502,000 | | | | 129,200,000 | | | | 9,729,083 | |
Chesapeake Energy Corp., senior note, 144A, 8.00%, 3/15/26 | | | — | | | | 644,290,580 | b | | | — | | | | — | | | | (195,790,580 | ) | | | 448,500,000 | | | | 650,000,000 | | | | 25,566,667 | |
| | | | | | | | | | | | |
| | $ | 863,464,150 | | | $ | 1,261,376,370 | | | $ | (259,869,034 | ) | | $ | 839,349 | | | $ | (577,874,446 | ) | | $ | 1,287,936,389 | | | | | | | $ | 126,424,405 | |
| | | | | | | | | | | | |
Total Affiliated Securities(Value is 2.2% of Net Assets) | | $ | 1,105,223,302 | | | $ | 1,715,066,505 | | | $ | (415,004,496 | ) | | $ | (71,492,802 | ) | | $ | (675,424,682 | ) | | $ | 1,658,367,827 | | | | | | | $ | 132,920,755 | |
| | | | | | | | | | | | |
aAs of September 30, 2019, no longer held by the fund.
bMay include accretion, amortization, partnership adjustments, and/or corporate actions.
10. Upcoming Reorganization
On July 17, 2019, the Board for Franklin Strategic Series approved a proposal to reorganize Franklin Select U.S. Equity Fund with and into Franklin Growth Fund, subject to approval by the shareholders of Franklin Select U.S. Equity Fund.
| | | | |
| | | |
130 | | Annual Report | | franklintempleton.com |
FRANKLIN CUSTODIAN FUNDS
NOTES TO FINANCIAL STATEMENTS
11. Credit Facility
The Funds, together with other U.S. registered and foreign investment funds (collectively, Borrowers), managed by Franklin Templeton, are borrowers in a joint syndicated senior unsecured credit facility totaling $2 billion (Global Credit Facility) which matures on February 7, 2020. This Global Credit Facility provides a source of funds to the Borrowers for temporary and emergency purposes, including the ability to meet future unanticipated or unusually large redemption requests.
Under the terms of the Global Credit Facility, the Funds shall, in addition to interest charged on any borrowings made by the Funds and other costs incurred by the Funds, pay their share of fees and expenses incurred in connection with the implementation and maintenance of the Global Credit Facility, based upon their relative share of the aggregate net assets of all of the Borrowers, including an annual commitment fee of 0.15% based upon the unused portion of the Global Credit Facility. These fees are reflected in other expenses in the Statements of Operations. During the year ended September 30, 2019, the Funds did not use the Global Credit Facility.
12. RedemptionsIn-Kind
During the year ended September 30, 2019 and year ended September 30, 2018, the Franklin Growth Fund realized $52,349,028 and $42,189,159, respectively, of net gains resulting from redemptionsin-kind in which a shareholder redeemed fund shares for cash and securities held by the Fund. Because such gains are not taxable to the Fund and are not distributed to remaining shareholders, they are reclassified from accumulated net realized gains topaid-in capital.
13. Fair Value Measurements
The Funds follow a fair value hierarchy that distinguishes between market data obtained from independent sources (observable inputs) and the Funds’ own market assumptions (unobservable inputs). These inputs are used in determining the value of the Funds’ financial instruments and are summarized in the following fair value hierarchy:
| | • | | Level 1 – quoted prices in active markets for identical financial instruments |
| | • | | Level 2 – other significant observable inputs (including quoted prices for similar financial instruments, interest rates, prepayment speed, credit risk, etc.) |
| | • | | Level 3 – significant unobservable inputs (including the Funds’ own assumptions in determining the fair value of financial instruments) |
The input levels are not necessarily an indication of the risk or liquidity associated with financial instruments at that level.
A summary of inputs used as of September 30, 2019, in valuing the Funds’ assets and liabilities carried at fair value, is as follows:
| | | | | | | | | | | | | | | | |
| | | Level 1 | | | Level 2 | | | Level 3 | | | Total | |
| | | | |
Franklin DynaTech Fund | | | | | | | | | | | | | | | | |
Assets: | | | | | | | | | | | | | | | | |
Investments in Securities:a | | | | | | | | | | | | | | | | |
Equity Investments | | $ | 8,325,204,724 | | | $ | — | | | $ | — | | | $ | 8,325,204,724 | |
Short Term Investments | | | 439,351,721 | | | | 77,855,135 | | | | — | | | | 517,206,856 | |
| | | | |
| | | | |
Total Investments in Securities | | $ | 8,764,556,445 | | | $ | 77,855,135 | | | $ | — | | | $ | 8,842,411,580 | |
| | | | |
| | | | |
| | | |
| franklintempleton.com | | Annual Report | | 131 |
FRANKLIN CUSTODIAN FUNDS
NOTES TO FINANCIAL STATEMENTS
13. Fair Value Measurements(continued)
| | | | | | | | | | | | | | | | |
| | | Level 1 | | | Level 2 | | | Level 3 | | | Total | |
| | | | |
Franklin Growth Fund | | | | | | | | | | | | | | | | |
Assets: | | | | | | | | | | | | | | | | |
Investments in Securities:a | | | | | | | | | | | | | | | | |
Equity Investments | | $ | 15,830,913,823 | | | $ | — | | | $ | — | | | $ | 15,830,913,823 | |
Short Term Investments | | | 195,726,982 | | | | — | | | | — | | | | 195,726,982 | |
| | | | |
| | | | |
Total Investments in Securities | | $ | 16,026,640,805 | | | $ | — | | | $ | — | | | $ | 16,026,640,805 | |
| | | | |
Franklin Income Fund | | | | | | | | | | | | | | | | |
Assets: | | | | | | | | | | | | | | | | |
Investments in Securities:a | | | | | | | | | | | | | | | | |
Equity Investments:b | | | | | | | | | | | | | | | | |
Energy | | $ | 4,358,916,515 | | | $ | 44,721,438 | | | $ | — | | | $ | 4,403,637,953 | |
Financials | | | 4,420,575,425 | | | | 188,912,500 | | | | — | | | | 4,609,487,925 | |
All Other Equity Investments | | | 14,809,598,711 | | | | — | | | | — | | | | 14,809,598,711 | |
Equity-Linked Securities | | | — | | | | 11,176,907,038 | | | | — | | | | 11,176,907,038 | |
Index-Linked Notes | | | — | | | | 197,316,623 | | | | — | | | | 197,316,623 | |
Convertible Bonds | | | — | | | | 316,680,860 | | | | — | | | | 316,680,860 | |
Corporate Bonds | | | — | | | | 26,949,605,434 | | | | — | | | | 26,949,605,434 | |
Senior Floating Rate Interests | | | — | | | | 1,568,987,538 | | | | — | | | | 1,568,987,538 | |
U.S. Government and Agency Securities | | | — | | | | 8,099,682,617 | | | | — | | | | 8,099,682,617 | |
Mortgage-Backed Securities | | | — | | | | 334,972,379 | | | | — | | | | 334,972,379 | |
Escrows and Litigation Trusts | | | — | | | | — | | | | — | c | | | — | |
Options Purchased | | | 369,200,000 | | | | — | | | | — | | | | 369,200,000 | |
Short Term Investments | | | 1,409,947,053 | | | | 25,807,809 | | | | — | | | | 1,435,754,862 | |
| | | | |
| | | | |
Total Investments in Securities | | $ | 25,368,237,704 | | | $ | 48,903,594,236 | | | $ | — | | | $ | 74,271,831,940 | |
| | | | |
Other Financial Instruments: | | | | | | | | | | | | | | | | |
Futures Contracts | | $ | 15,254,808 | | | $ | — | | | $ | — | | | $ | 15,254,808 | |
| | | | |
Liabilities: | | | | | | | | | | | | | | | | |
Other Financial Instruments: | | | | | | | | | | | | | | | | |
Options Written | | $ | 119,615,000 | | | $ | — | | | $ | — | | | $ | 119,615,000 | |
| | | | |
Franklin U.S. Government Securities Fund | | | | | | | | | | | | | | | | |
Assets: | | | | | | | | | | | | | | | | |
Investments in Securities:a | | | | | | | | | | | | | | | | |
Mortgage-Backed Securities | | $ | — | | | $ | 5,048,328,271 | | | $ | — | | | $ | 5,048,328,271 | |
U.S. Government and Agency Securities | | | — | | | | 20,796,455 | | | | — | | | | 20,796,455 | |
Short Term Investments | | | 86,808,469 | | | | — | | | | — | | | | 86,808,469 | |
| | | | |
| | | | |
Total Investments in Securities | | $ | 86,808,469 | | | $ | 5,069,124,726 | | | $ | — | | | $ | 5,155,933,195 | |
| | | | |
| | | | |
| | | |
132 | | Annual Report | | franklintempleton.com |
FRANKLIN CUSTODIAN FUNDS
NOTES TO FINANCIAL STATEMENTS
| | | | | | | | | | | | | | | | |
| | | Level 1 | | | Level 2 | | | Level 3 | | | Total | |
| | | | |
Franklin Utilities Fund | | | | | | | | | | | | | | | | |
Assets: | | | | | | | | | | | | | | | | |
Investments in Securities:a | | | | | | | | | | | | | | | | |
Equity Investments | | $ | 6,939,666,776 | | | $ | — | | | $ | — | | | $ | 6,939,666,776 | |
Corporate Bonds | | | — | | | | 6,837,079 | | | | — | | | | 6,837,079 | |
Short Term Investments | | | 35,371,057 | | | | — | | | | — | | | | 35,371,057 | |
| | | | |
| | | | |
Total Investments in Securities | | $ | 6,975,037,833 | | | $ | 6,837,079 | | | $ | — | | | $ | 6,981,874,912 | |
| | | | |
aFor detailed categories, see the accompanying Statement of Investments.
bIncludes common, preferred and convertible preferred stocks.
cIncludes securities determined to have no value at September 30, 2019.
A reconciliation of assets in which Level 3 inputs are used in determining fair value is presented when there are significant Level 3 financial instruments at the beginning and/or end of the year.
14. Subsequent Events
The Funds have evaluated subsequent events through the issuance of the financial statements and determined that no events have occurred that require disclosure other than those already disclosed in the financial statements.
Abbreviations
| | | | | | | | |
| Currency | | Selected Portfolio | | |
| EUR | | Euro | | ADR | | American Depositary Receipt | | |
USD | | United States Dollar | | DIP | | Debtor-In-Possession | | |
| | | | FHLMC | | Federal Home Loan Mortgage Corp. | | |
| | | | FRN | | Floating Rate Note | | |
| | | | LIBOR | | London InterBank Offered Rate | | |
| | | | SF | | Single Family | | |
| | | | SPX B | | S&P 500 IndexBuy-Write | | |
| | | | SPX B DT | | S&P 500 IndexBuy-Write Distribution | | |
| | | | SPXDIV | | S&P 500 Dividend Points | | |
| | | | |
| | | |
| franklintempleton.com | | Annual Report | | 133 |
FRANKLIN CUSTODIAN FUNDS
Report of Independent Registered Public Accounting Firm
To the Board of Trustees of Franklin Custodian Funds and Shareholders of Franklin DynaTech Fund, Franklin Growth Fund, Franklin Income Fund, Franklin U.S. Government Securities Fund, and Franklin Utilities Fund
Opinions on the Financial Statements
We have audited the accompanying statements of assets and liabilities, including the statements of investments, of Franklin DynaTech Fund, Franklin Growth Fund, Franklin Income Fund, Franklin U.S. Government Securities Fund, and Franklin Utilities Fund (the “Funds”) as of September 30, 2019, the related statements of operations for the year ended September 30, 2019, the statements of changes in net assets for each of the two years in the period ended September 30, 2019, including the related notes, and the financial highlights for each of the periods indicated therein (collectively referred to as the “financial statements”). In our opinion, the financial statements present fairly, in all material respects, the financial position of each of the Funds as of September 30, 2019, the results of each of their operations for the year then ended, the changes in each of their net assets for each of the two years in the period ended September 30, 2019 and each of the financial highlights for each of the periods indicated therein in conformity with accounting principles generally accepted in the United States of America.
Basis for Opinions
These financial statements are the responsibility of the Funds’ management. Our responsibility is to express an opinion on the Funds’ financial statements based on our audits. We are a public accounting firm registered with the Public Company Accounting Oversight Board (United States) (PCAOB) and are required to be independent with respect to the Funds in accordance with the U.S. federal securities laws and the applicable rules and regulations of the Securities and Exchange Commission and the PCAOB.
We conducted our audits of these financial statements in accordance with the standards of the PCAOB. Those standards require that we plan and perform the audit to obtain reasonable assurance about whether the financial statements are free of material misstatement, whether due to error or fraud.
Our audits included performing procedures to assess the risks of material misstatement of the financial statements, whether due to error or fraud, and performing procedures that respond to those risks. Such procedures included examining, on a test basis, evidence regarding the amounts and disclosures in the financial statements. Our audits also included evaluating the accounting principles used and significant estimates made by management, as well as evaluating the overall presentation of the financial statements. Our procedures included confirmation of securities owned as of September 30, 2019 by correspondence with the custodian, transfer agent and brokers; when replies were not received from brokers, we performed other auditing procedures. We believe that our audits provide a reasonable basis for our opinions.
PricewaterhouseCoopers LLP
San Francisco, California
November 14, 2019
We have served as the auditor of one or more investment companies in the Franklin Templeton Group of Funds since 1948.
| | | | |
| | | |
134 | | Annual Report | | franklintempleton.com |
FRANKLIN CUSTODIAN FUNDS
Tax Information (unaudited)
Under Section 852(b)(3)(C) of the Internal Revenue Code, the Funds hereby report the maximum amount allowable but no less than the following amounts as long term capital gain dividends for the fiscal year ended September 30, 2019:
| | | | | | | | |
Franklin DynaTech Fund | | Franklin
Growth Fund | | | Franklin
Utilities Fund | |
| | |
$168,290,858 | | | $222,080,082 | | | | $183,865,898 | |
Under Section 871(k)(2)(C) of the Internal Revenue Code, the Funds hereby report the maximum amount allowable but no less than the following amounts as short term capital gain dividends for purposes of the tax imposed under Section 871(a)(1)(A) of the Internal Revenue Code for the fiscal year ended September 30, 2019:
|
Franklin Utilities Fund |
|
$3,431,078 |
Under Section 854(b)(1)(A) of the Internal Revenue Code, the Funds hereby report the following percentage amounts of the ordinary income dividends as income qualifying for the dividends received deduction for the fiscal year ended September 30, 2019:
| | | | |
Franklin Growth Fund | | Franklin
Income Fund | | Franklin
Utilities Fund |
| | |
100.00% | | 18.24% | | 100.00% |
Under Section 854(b)(1)(B) of the Internal Revenue Code, the Funds hereby report the maximum amount allowable but no less than the following amounts as qualified dividends for purposes of the maximum rate under Section 1(h)(11) of the Internal Revenue Code for the fiscal year ended September 30, 2019:
| | | | | | |
| | | |
Franklin DynaTech Fund | | Franklin Growth Fund | | Franklin Income Fund | | Franklin Utilities Fund |
| | | |
$34,541,136 | | $188,680,509 | | $984,769,240 | | $207,895,510 |
Distributions, including qualified dividend income, paid during calendar year 2019 will be reported to shareholders on Form1099-DIV bymid-February 2020. Shareholders are advised to check with their tax advisors for information on the treatment of these amounts on their individual income tax returns.
Under Section 871(k)(1)(C) of the Internal Revenue Code, the Funds hereby report the maximum amount allowable but no less than the following amounts as interest related dividends for purposes of the tax imposed under Section 871(a)(1)(A) of the Internal Revenue Code for the fiscal year ended September 30, 2019:
| | | | | | |
Franklin
Income Fund | | Franklin U.S. Government Securities Fund | | | |
| | |
$1,976,162,882 | | $155,007,707 | | | | |
| | | | |
| | | |
| franklintempleton.com | | Annual Report | | 135 |
FRANKLIN CUSTODIAN FUNDS
Board Members and Officers
The name, year of birth and address of the officers and board members, as well as their affiliations, positions held with the Trust, principal occupations during at least the past five years and number of U.S. registered portfolios overseen in the Franklin Templeton fund complex, are shown below. Generally, each board member serves until that person’s successor is elected and qualified.
Independent Board Members
| | | | | | | | |
Name, Year of Birth and Address | | Position | | Length of Time Served | | Number of Portfolios in
Fund Complex Overseen by Board Member* | | Other Directorships Held During at Least the Past 5 Years |
| | | | |
Harris J. Ashton (1932) One Franklin Parkway San Mateo, CA 94403-1906 | | Trustee | | Since 1976 | | 135 | | Bar-S Foods (meat packing company) (1981-2010). |
| | |
| Principal Occupation During at Least the Past 5 Years: | | | | |
Director of various companies; andformerly, Director, RBC Holdings, Inc. (bank holding company) (until 2002); and President, Chief Executive Officer and Chairman of the Board, General Host Corporation (nursery and craft centers) (until 1998). |
| | | | |
Terrence J. Checki (1945) One Franklin Parkway San Mateo, CA 94403-1906 | | Trustee | | Since 2017 | | 114 | | Hess Corporation (exploration of oil and gas) (2014-present). |
| | |
| Principal Occupation During at Least the Past 5 Years: | | | | |
Member of the Council on Foreign Relations (1996-present); Member of the National Committee on U.S.-China Relations (1999-present); member of the Board of Trustees of the Economic Club of New York (2013-present); member of the Board of Trustees of the Foreign Policy Association (2005-present) and member of various other boards of trustees and advisory boards; andformerly, Executive Vice President of the Federal Reserve Bank of New York and Head of its Emerging Markets and Internal Affairs Group and Member of Management Committee (1995-2014); and Visiting Fellow at the Council on Foreign Relations (2014). |
| | | | |
Mary C. Choksi (1950) One Franklin Parkway San Mateo, CA 94403-1906 | | Trustee | | Since 2014 | | 135 | | Avis Budget Group Inc. (car rental)(2007-present), Omnicom Group Inc. (advertising and marketing communications services) (2011-present) and White Mountains Insurance Group, Ltd. (holding company) (2017-present). |
| | |
| Principal Occupation During at Least the Past 5 Years: | | | | |
Director of various companies; andformerly, Founder and Senior Advisor, Strategic Investment Group (investment management group) (2015-2017); Founding Partner and Senior Managing Director, Strategic Investment Group (1987-2015); Founding Partner and Managing Director, Emerging Markets Management LLC (investment management firm) (1987-2011); and Loan Officer/Senior Loan Officer/Senior Pension Investment Officer, World Bank Group (international financial institution) (1977-1987). |
| | | | |
Edith E. Holiday (1952) One Franklin Parkway San Mateo, CA 94403-1906 | | Lead Independent Trustee | | Trustee since 1998 and Lead Independent Trustee since March 2019 | | 135 | | Hess Corporation (exploration of oil and gas) (1993-present), Canadian National Railway (railroad) (2001-present), White Mountains Insurance Group, Ltd. (holding company) (2004-present), Santander Consumer USA Holdings, Inc. (consumer finance) (2016-present), RTI International Metals, Inc. (manufacture and distribution of titanium) (1999-2015) and H.J. Heinz Company (processed foods and allied products)(1994-2013). |
| | |
| Principal Occupation During at Least the Past 5 Years: | | | | |
Director or Trustee of various companies and trusts; andformerly, Assistant to the President of the United States and Secretary of the Cabinet (1990-1993); General Counsel to the United States Treasury Department (1989-1990); and Counselor to the Secretary and Assistant Secretary for Public Affairs and Public Liaison-United States Treasury Department (1988-1989). |
| | | | |
| | | |
136 | | Annual Report | | franklintempleton.com |
FRANKLIN CUSTODIAN FUNDS
Independent Board Members(continued)
| | | | | | | | |
Name, Year of Birth and Address | | Position | | Length of Time Served | | Number of Portfolios in
Fund Complex Overseen by Board Member* | | Other Directorships Held During at Least the Past 5 Years |
| | | | |
J. Michael Luttig (1954) One Franklin Parkway San Mateo, CA 94403-1906 | | Trustee | | Since 2009 | | 135 | | Boeing Capital Corporation (aircraft financing) (2006-2013). |
| | |
| Principal Occupation During at Least the Past 5 Years: | | | | |
Executive Vice President, Counselor and Senior Advisor to Boeing Chairman and Board of Directors, The Boeing Company (aerospace company) (May 2019); andformerly, General Counsel and member of the Executive Council, The Boeing Company (2006-2019) and Federal Appeals Court Judge, U.S. Court of Appeals for the Fourth Circuit (1991-2006). |
| | | | |
Larry D. Thompson (1945) One Franklin Parkway San Mateo, CA 94403-1906 | | Trustee | | Since 2007 | | 135 | | The Southern Company (energy company) (2014-present; previously 2010-2012), Graham Holdings Company (education and media organization) (2011-present) and Cbeyond, Inc. (business communications provider) (2010-2012). |
| | |
| Principal Occupation During at Least the Past 5 Years: | | | | |
Director of various companies; Counsel, Finch McCranie, LLP (law firm) (2015-present); Independent Compliance Monitor and Auditor, Volkswagen AG (manufacturer of automobiles and commercial vehicles) (2017-present); John A. Sibley Professor of Corporate and Business Law, University of Georgia School of Law (2015-present; previously 2011-2012); andformerly, Executive Vice President - Government Affairs, General Counsel and Corporate Secretary, PepsiCo, Inc. (consumer products) (2012-2014); Senior Vice President - Government Affairs, General Counsel and Secretary, PepsiCo, Inc. (2004-2011); Senior Fellow of The Brookings Institution (2003-2004); Visiting Professor, University of Georgia School of Law (2004); and Deputy Attorney General, U.S. Department of Justice (2001-2003). |
| |
Interested Board Members and Officers | | |
| | | | |
Name, Year of Birth and Address | | Position | | Length of Time Served | | Number of Portfolios in Fund Complex Overseen by Board Member* | | Other Directorships Held During at Least the Past 5 Years |
| | | | |
**Gregory E. Johnson (1961) One Franklin Parkway San Mateo, CA 94403-1906 | | Trustee | | Since 2013 | | 147 | | None |
| | |
| Principal Occupation During at Least the Past 5 Years: | | | | |
Chairman of the Board, Member - Office of the Chairman, Director and Chief Executive Officer, Franklin Resources, Inc.; officer and/or director or trustee, as the case may be, of some of the other subsidiaries of Franklin Resources, Inc. and of 42 of the investment companies in Franklin Templeton; Vice Chairman, Investment Company Institute; andformerly, President, Franklin Resources, Inc. (1994-2015). |
| | | | |
**Rupert H. Johnson, Jr. (1940) One Franklin Parkway San Mateo, CA 94403-1906 | | Chairman of the Board, Trustee and Vice President | | Chairman of the Board since 2013, Trustee since 1983 and Vice President since 1982 | | 135 | | None |
| | |
| Principal Occupation During at Least the Past 5 Years: | | | | |
Vice Chairman, Member - Office of the Chairman and Director, Franklin Resources, Inc.; Director, Franklin Advisers, Inc.; and officer and/or director or trustee, as the case may be, of some of the other subsidiaries of Franklin Resources, Inc. and of 40 of the investment companies in Franklin Templeton. |
| | | | |
Alison E. Baur (1964) One Franklin Parkway San Mateo, CA 94403-1906 | | Vice President | | Since 2012 | | Not Applicable | | Not Applicable |
| | |
| Principal Occupation During at Least the Past 5 Years: | | | | |
Deputy General Counsel, Franklin Templeton; and officer of some of the other subsidiaries of Franklin Resources, Inc. and of 44 of the investment companies in Franklin Templeton. |
| | | | |
| | | |
| franklintempleton.com | | Annual Report | | 137 |
FRANKLIN CUSTODIAN FUNDS
Interested Board Members and Officers(continued)
| | | | | | | | |
Name, Year of Birth and Address | | Position | | Length of Time Served | | Number of Portfolios in
Fund Complex Overseen by Board Member* | | Other Directorships Held During at Least the Past 5 Years |
| | | | |
Gaston Gardey (1967) One Franklin Parkway San Mateo, CA 94403-1906 | | Treasurer, Chief Financial Officer and Chief Accounting Officer | | Since 2009 | | Not Applicable | | Not Applicable |
| | |
| Principal Occupation During at Least the Past 5 Years: | | | | |
Treasurer, U.S. Fund Administration & Reporting and officer of 26 of the investment companies in Franklin Templeton. |
| | | | |
Aliya S. Gordon (1973) One Franklin Parkway San Mateo, CA 94403-1906 | | Vice President | | Since 2009 | | Not Applicable | | Not Applicable |
| | |
| Principal Occupation During at Least the Past 5 Years: | | | | |
Senior Associate General Counsel, Franklin Templeton; Vice President and Secretary, Franklin Resources, Inc.; and officer of 44 of the investment companies in Franklin Templeton. |
| | | | |
Steven J. Gray (1955) One Franklin Parkway San Mateo, CA 94403-1906 | | Vice President since 2009 andCo-Secretary since January 2019 | | Vice President since 2009 andCo-Secretary since January 2019 | | Not Applicable | | Not Applicable |
| | |
| Principal Occupation During at Least the Past 5 Years: | | | | |
Senior Associate General Counsel, Franklin Templeton; Vice President, Franklin Templeton Distributors, Inc. and FASA, LLC; and officer of 44 of the investment companies in Franklin Templeton. |
| | | | |
Matthew T. Hinkle (1971) One Franklin Parkway San Mateo, CA 94403-1906 | | Chief Executive Officer – Finance and Administration | | Since 2017 | | Not Applicable | | Not Applicable |
| | |
| Principal Occupation During at Least the Past 5 Years: | | | | |
Senior Vice President, Franklin Templeton Services, LLC; officer of 44 of the investment companies in Franklin Templeton; andformerly,Vice President, Global Tax (2012-April 2017) and Treasurer/Assistant Treasurer, Franklin Templeton (2009-2017). |
| | | | |
Robert Lim (1948) One Franklin Parkway San Mateo, CA 94403-1906 | | Vice President – AML Compliance | | Since 2016 | | Not Applicable | | Not Applicable |
| | |
| Principal Occupation During at Least the Past 5 Years: | | | | |
Vice President, Franklin Templeton Companies, LLC; Chief Compliance Officer, Franklin Templeton Distributors, Inc. and Franklin Templeton Investor Services, LLC; and officer of 44 of the investment companies in Franklin Templeton. |
| | | | |
Kimberly H. Novotny (1972) 300 S.E. 2nd Street Fort Lauderdale, FL 33301-1923 | | Vice President | | Since 2013 | | Not Applicable | | Not Applicable |
| | |
| Principal Occupation During at Least the Past 5 Years: | | | | |
Senior Associate General Counsel, Franklin Templeton; Vice President and Corporate Secretary, Fiduciary Trust International of the South; Vice President, Templeton Investment Counsel, LLC; Assistant Secretary, Franklin Resources, Inc.; and officer of 44 of the investment companies in Franklin Templeton. |
| | | | |
| | | |
138 | | Annual Report | | franklintempleton.com |
FRANKLIN CUSTODIAN FUNDS
Interested Board Members and Officers(continued)
| | | | | | | | |
Name, Year of Birth and Address | | Position | | Length of Time Served | | Number of Portfolios in
Fund Complex Overseen by Board Member* | | Other Directorships Held During at Least the Past 5 Years |
| | | | |
Edward D. Perks (1970) One Franklin Parkway San Mateo, CA 94403-1906 | | President and Chief Executive Officer – Investment Management | | Since December 2018 | | Not Applicable | | Not Applicable |
| | |
| Principal Occupation During at Least the Past 5 Years: | | | | |
President and Director, Franklin Advisers, Inc.; and officer of nine of the investment companies in Franklin Templeton (since December 2018). |
| | | | |
Robert C. Rosselot (1960) 300 S.E. 2nd Street Fort Lauderdale, FL 33301-1923 | | Chief Compliance Officer and Secretary | | Since 2013 | | Not Applicable | | Not Applicable |
| | |
| Principal Occupation During at Least the Past 5 Years: | | | | |
Director, Global Compliance, Franklin Templeton; Vice President, Franklin Templeton Companies, LLC; officer of 44 of the investment companies in Franklin Templeton; andformerly, Senior Associate General Counsel, Franklin Templeton (2007-2013); and Secretary and Vice President, Templeton Group of Funds (2004-2013). |
| | | | |
Navid J. Tofigh (1972) One Franklin Parkway San Mateo, CA 94403-1906 | | Vice President | | Since 2015 | | Not Applicable | | Not Applicable |
| | |
| Principal Occupation During at Least the Past 5 Years: | | | | |
Associate General Counsel and officer of 44 of the investment companies in Franklin Templeton. |
| | | | |
Craig S. Tyle (1960) One Franklin Parkway San Mateo, CA 94403-1906 | | Vice President | | Since 2005 | | Not Applicable | | Not Applicable |
| | |
| Principal Occupation During at Least the Past 5 Years: | | | | |
General Counsel and Executive Vice President, Franklin Resources, Inc.; and officer of some of the other subsidiaries of Franklin Resources, Inc. and of 44 of the investment companies in Franklin Templeton. |
| | | | |
Lori A. Weber (1964) 300 S.E. 2nd Street Fort Lauderdale, FL 33301-1923 | | Vice President and Co- Secretary | | Vice President since 2011 andCo-Secretary since January 2019 | | Not Applicable | | Not Applicable |
| | |
| Principal Occupation During at Least the Past 5 Years: | | | | |
Senior Associate General Counsel, Franklin Templeton; Assistant Secretary, Franklin Resources, Inc.; Vice President and Secretary, Templeton Investment Counsel, LLC; and officer of 44 of the investment companies in Franklin Templeton. |
*We base the number of portfolios on each separate series of the U.S. registered investment companies within the Franklin Templeton fund complex. These portfolios have a common investment manager or affiliated investment managers.
**Gregory E. Johnson is considered to be an interested person of the Fund under the federal securities laws due to his position as an officer and director of Franklin Resources, Inc. (Resources), which is the parent company of the Fund’s investment manager and distributor. Rupert H. Johnson, Jr. is considered to be an interested person of the Fund under the federal securities laws due to his position as an officer and director and major shareholder of Resources.
Note 1: Rupert H. Johnson, Jr. is the uncle of Gregory E. Johnson.
Note 2: Effective March 12, 2019, John B. Wilson ceased to be a trustee of the Trust.
Note 3: Officer information is current as of the date of this report. It is possible that after this date, information about officers may change.
The Sarbanes-Oxley Act of 2002 and Rules adopted by the Securities and Exchange Commission require the Fund to disclose whether the Fund’s Audit Committee includes at least one member who is an audit committee financial expert within the meaning of such Act and Rules. The Fund’s Board has determined that there is at least one such financial expert on the Audit Committee and has designated Mary C. Choksi as its audit committee financial expert. The Board believes that Ms. Choksi qualifies as such an expert in view of her extensive business background and experience. She currently serves as a director of Avis Budget Group, Inc. (2007-present) and formerly, Founder and Senior Advisor, Strategic Investment Group (1987 to 2017). Ms. Choksi has been a Member of the
| | | | |
| | | |
| franklintempleton.com | | Annual Report | | 139 |
FRANKLIN CUSTODIAN FUNDS
Fund’s Audit Committee since 2014. As a result of such background and experience, the Board believes that Ms. Choksi has acquired an understanding of generally accepted accounting principles and financial statements, the general application of such principles in connection with the accounting estimates, accruals and reserves, and analyzing and evaluating financial statements that present a breadth and level of complexity of accounting issues generally comparable to those of the Fund, as well as an understanding of internal controls and procedures for financial reporting and an understanding of audit committee functions. Ms. Choksi is an independent Board member as that term is defined under the relevant Securities and Exchange Commission Rules and Releases.
The Statement of Additional Information (SAI) includes additional information about the board members and is available, without charge, upon request. Shareholders may call (800) DIALBEN/342-5236 to request the SAI.
| | | | |
| | | |
140 | | Annual Report | | franklintempleton.com |
FRANKLIN CUSTODIAN FUNDS
Shareholder Information
Proxy Voting Policies and Procedures
The Trust’s investment manager has established Proxy Voting Policies and Procedures (Policies) that the Trust uses to determine how to vote proxies relating to portfolio securities. Shareholders may view the Trust’s complete Policies online at franklintempleton.com. Alternatively, shareholders may request copies of the Policies free of charge by calling the Proxy Group collect at (954)527-7678 or by sending a written request to: Franklin Templeton Companies, LLC, 300 S.E. 2nd Street, Fort Lauderdale, FL 33301, Attention: Proxy Group. Copies of the Trust’s proxy voting records are also made available online at franklintempleton.com and posted on the U.S. Securities and Exchange Commission’s website at sec.gov and reflect the most recent12-month period ended June 30.
Quarterly Statement of Investments
The Trust files a complete statement of investments with the U.S. Securities and Exchange Commission for the first and third quarters for each fiscal year as an exhibit to its report on FormN-PORT. Shareholders may view the filed FormN-PORT by visiting the Commission’s website at sec.gov. The filed form may also be viewed and copied at the Commission’s Public Reference Room in Washington, DC. Information regarding the operations of the Public Reference Room may be obtained by calling(800) SEC-0330.
Householding of Reports and Prospectuses
You will receive each Fund’s financial reports every six months as well as an annual updated summary prospectus (prospectus available upon request). To reduce Fund expenses, we try to identify related shareholders in a household and send only one copy of the financial reports and summary prospectus. This process, called “householding,” will continue indefinitely unless you instruct us otherwise. If you prefer not to have these documents householded, please call us at (800)632-2301. At any time you may view current prospectuses/summary prospectuses and financial reports on our website. If you choose, you may receive these documents through electronic delivery.
| | | | |
| | | |
| franklintempleton.com | | Annual Report | | 141 |
This page intentionally left blank.
This page intentionally left blank.
This page intentionally left blank.
Authorized for distribution only when accompanied or preceded by a summary prospectus and/or prospectus. Investors should carefully consider a fund’s investment goals, risks, charges and expenses before investing. A prospectus contains this and other information; please read it carefully before investing.
To help ensure we provide you with quality service, all calls to and from our service areas are monitored and/or recorded.
| | | | | | | | |
 | | Annual Report and Shareholder Letter | | | | |
| | Franklin Custodian Funds | | | | |
| | | | | | | | |
| | Investment Manager | | Distributor | | | | Shareholder Services |
| | Franklin Advisers, Inc. | | Franklin Templeton Distributors, Inc. | | | | (800)632-2301 |
| | | | (800) DIAL BEN®/342-5236 | | | | |
| | | | franklintempleton.com | | | | |
| © 2019 Franklin Templeton Investments. All rights reserved. | | | | | | FCF A 11/19 |
ANNUAL REPORT
Franklin Focused Growth Fund
This annual report for Franklin Focused Growth Fund covers the fiscal year ended September 30, 2019.
Your Fund’s Goal and Main Investments
The Fund seeks capital appreciation by investing in an equity securities portfolio of approximately 20–50 companies that the investment manager believes offer a compellingtrade-off between growth opportunity, business and financial risk and valuation.
Performance Overview
For the period under review, the Fund’s Advisor Class shares posted a +2.80% cumulative total return. In comparison, the Russell 1000® Growth Index, which measures performance of those Russell 1000® Index companies with higherprice-to-book ratios and higher forecasted growth values, posted a +3.71% total return.1 You can find more of the Fund’s performance data in the Performance Summary beginning on page 5.
Performance data represent past performance, which does not guarantee future results. Investment return and principal value will fluctuate, and you may have a gain or loss when you sell your shares. Current performance may differ from figures shown.
Economic and Market Overview
The U.S. economy expanded during the 12 months ended September 30, 2019. After moderating for two consecutive quarters, the economy grew significantly faster in 2019’s first quarter. However, the economy moderated in the second and third quarters, due partly to weakness in inventory and business investment. The manufacturing sector expanded during most of the period, but contracted in August and September 2019. The services sector continued to expand throughout the period, although the rate of expansion slowed in September. The unemployment rate decreased from 3.7% in September 2018 to 3.5% atperiod-end.2 The annual inflation rate, as measured by the Consumer Price Index,
Portfolio Composition
Based on Total Net Assets as of 9/30/19
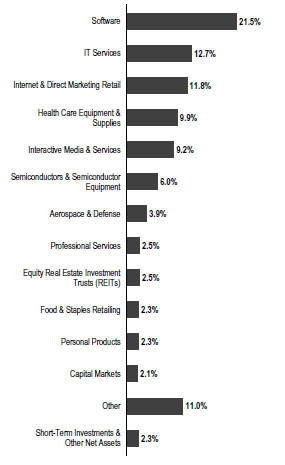
decreased from 2.3% in September 2018 to 1.7% atperiod-end.2
The U.S. Federal Reserve (Fed) raised its target range for the federal funds rate by 0.25% at its December 2018
1. Source: Morningstar. Frank Russell Company is the source and owner of the trademarks, service marks and copyrights related to the Russell Indexes. Russell® is a trademark of Frank Russell Company.
The index is unmanaged and includes reinvestment of any income or distributions. It does not reflect any fees, expenses or sales charges. One cannot invest directly in an index, and an index is not representative of the Fund’s portfolio.
2. Source: Bureau of Labor Statistics.
The dollar value, number of shares or principal amount, and names of all portfolio holdings are listed in the Fund’s Statement of Investments (SOI). The SOI begins on page 10.
FRANKLIN FOCUSED GROWTH FUND
meeting, to 2.25%–2.50%. However, at its July 2019 meeting, the Fed lowered the federal funds target rate range for the first time since December 2008, to 2.00%–2.25%, citing muted inflation pressures and the potential effects of global trade tensions on economic growth. Furthermore, the Fed ended its balance sheet normalization program earlier than previously indicated. In September, the Fed further lowered the federal funds target rate range to 1.75%–2.00%, reiterating the rationale cited at the July meeting.
U.S. equity markets overall rose during the period, benefiting from upbeat economic data and U.S. corporate earnings, the Fed’s rate cuts and investor optimism about further monetary easing. However, markets reflected concerns about tighter regulation of technology companies, the Fed’s 2018 interest-rate path, political uncertainties in the U.S. (including the impeachment inquiry into President Donald Trump), geopolitical tensions in certain regions, and the impact of U.S. trade disputes with China and other trading partners on global growth and corporate earnings. These concerns were partly alleviated at certain points during the period by easing trade tensions and optimism about a potential U.S.-China trade deal. The broad U.S. stock market, as measured by the Standard & Poor’s® 500 Index (S&P 500®), sold off sharply in 2018’s fourth quarter, but generally trended higher in 2019’s first seven months, reaching a newall-time high in July. Stocks retreated in August, due to escalating trade tensions and heightened concerns about U.S. and global economic growth, but recovered in September amid easing trade tensions and investor optimism about the upcoming U.S.-China trade negotiations in October 2019. Overall, the S&P 500 posted a +4.25% total return for the12-month period.3
Investment Strategy
We are research-driven,bottom-up fundamental investors. Under normal market conditions, we invest predominantly in equity securities of companies that we believe offer compelling growth opportunities. The equity securities in which we invest are predominantly common stock. We may invest in companies of any size, including small and medium capitalization companies. In addition to our main investments, we may invest a portion (up to 25%) of net assets in foreign equity securities, including those located in emerging markets. We generally seek to maintain a portfolio consisting of securities of approximately 20–50 companies. Although we seek investments across a number of sectors,
Top 10 Holdings
9/30/19
| | | | |
| |
Company Sector/Industry | | % of Total
Net Assets | |
| |
Microsoft Corp. Software | | | 8.7% | |
| |
Amazon.com Inc. Internet & Direct Marketing Retail | | | 8.7% | |
| |
Adobe Inc. Software | | | 4.7% | |
| |
Alphabet Inc. Interactive Media & Services | | | 4.2% | |
| |
salesforce.com Inc. Software | | | 4.0% | |
| |
ServiceNow Inc. Software | | | 4.0% | |
| |
Mastercard Inc. IT Services | | | 4.0% | |
| |
Visa Inc. IT Services | | | 3.9% | |
| |
Facebook Inc. Interactive Media & Services | | | 2.6% | |
| |
Xilinx Inc. Semiconductors & Semiconductor Equipment | | | 2.6% | |
from time to time, based on economic conditions, we may have significant positions in particular sectors.
Manager’s Discussion
During the 12 months under review, the information technology (IT), real estate and consumer staples sectors contributed to the Fund’s performance.4 In the IT sector, information software and services firm Microsoft, payment technology company Mastercard and cloud solutions provider ServiceNow benefited results. Microsoft is a beneficiary of strong sales execution, a positive enterprise IT spending environment, its status as a critical partner to IT departments in this time of digital transformation, and a large installed base that is successfully moving to higher-value cloud andService-as-a-Software deployments. The company saw sustained strength in its enterprise cloud computing platform Azure, solid growth in its traditional server products and particularly strong growth in commercial bookings. Furthermore, the company continued to expand gross profit margins and control operational expenses. Mastercard continues to perform very well, meeting revenue
3. Source: Morningstar.
4. The IT sector comprises IT services, semiconductors and semiconductor equipment, and software in the SOI. The real estate sector comprises equity real estate investment trusts in the SOI. The consumer staples sector comprises food and staples retailing and personal products in the SOI.
FRANKLIN FOCUSED GROWTH FUND
and earnings expectations amid continued strong volume, transaction and cross border growth rates. The company announced several growth initiatives, partnerships, acquisition of capabilities that expand its global network, investment in emerging regions and expansion into new payment flows. Mastercard has shown an ability to both invest for the long term and deliver solidquarter-to-quarter execution, which we believe is supported by a strong organic growth profile. ServiceNow, a leader in enabling digital transformation, provides cloud-based IT service management for enterprise customers and has been steadily growing into a multi-product company providing an integrated platform to clients. We believe its strong productline-up and a relatively benign competitive environment could potentially lead to strong growth as the company increases its market share and seeks to become the workflow platform for larger enterprises.
In the real estate and consumer staples sectors, wireless communications and broadcast towers operator American Tower; and skin care, makeup, fragrance and hair products manufacturer Estee Lauder benefited performance. In other sectors, professional, medical, industrial and commercial products and services designer Danaher and data analytics provider Verisk Analytics also aided performance.
In contrast, the communication services, consumer discretionary and energy sectors detracted from performance.5 In communication services, interactive entertainment developer Activision Blizzard (not held atperiod-end), social networking website operator Facebook and internet subscription service company Netflix hurt results. After reaching anall-time high in October 2018, Activision Blizzard’s share price declined after disappointment that the company did not announce Diablo 4’s launch at its annual gaming convention and due to the negative response to its Diablo mobile expansion.
In the consumer discretionary sector, online marketplace Amazon.com delivered a mixed third quarter with growing revenue that exceeded company guidance, but was lower than investors expected, due to slower international retail revenue growth and weak results from acquired businesses. Amazon’s fourth quarter revenue and earnings exceeded all expectations, but guidance indicating slower first-quarter revenue growth hindered the stock.
In the energy sector, oil and natural gas exploration and development company Concho Resources hindered
performance. In other sectors, computer graphics processor and software provider Nvidia and alcoholic beverages producer Constellation Brands (not held atperiod-end) also detracted from results. Shares of Nvidia fell in late 2018 due to disappointing earnings results, but the company’s share price partially recovered in 2019 as earnings began to improve and the company announced breakthroughs in conversational artificial intelligence, gaming, professional visualization and automotive technologies.
| | |
 | | 
Matthew J. Moberg, CPA Portfolio Manager |
The foregoing information reflects our analysis, opinions and portfolio holdings as of September 30, 2019, the end of the reporting period. The way we implement our main investment strategies and the resulting portfolio holdings may change depending on factors such as market and economic conditions. These opinions may not be relied upon as investment advice or an offer for a particular security. The information is not a complete analysis of every aspect of any market, country, industry, security or the Fund. Statements of fact are from sources considered reliable, but the investment manager makes no representation or warranty as to their completeness or accuracy. Although historical performance is no guarantee of future results, these insights may help you understand our investment management philosophy.
5. The communication services sector comprises entertainment, interactive media and services, and media in the SOI. The consumer discretionary sector comprises internet and direct marketing retail; and textiles, apparel and luxury goods in the SOI. The Fund held no positions in the energy sector atperiod-end.
See www.franklintempletondatasources.com for additional data provider information.
FRANKLIN FOCUSED GROWTH FUND
Performance Summary as of September 30, 2019
The performance table and graph do not reflect any taxes that a shareholder would pay on Fund dividends, capital gain distributions, if any, or any realized gains on the sale of Fund shares. Total return reflects reinvestment of the Fund’s dividends and capital gain distributions, if any, and any unrealized gains or losses. Your dividend income will vary depending on dividends or interest paid by securities in the Fund’s portfolio, adjusted for operating expenses. Capital gain distributions are net profits realized from the sale of portfolio securities.
Performance as of 9/30/191
Cumulative total return excludes sales charges. Average annual total return includes maximum sales charges. Sales charges will vary depending on the size of the investment and the class of share purchased. Advisor Class shares are offered without sales charges.
| | | | | | |
| Share Class | | Cumulative
Total Return2
| | | | Average Annual
Total Return3 |
| | | |
Advisor | | | | | | |
1-Year | | +2.80% | | | | +2.80% |
3-Year | | +62.88% | | | | +17.66% |
Since Inception (4/12/16) | | +77.86% | | | | +18.06% |
Performance data represent past performance, which does not guarantee future results. Investment return and principal value will fluctuate, and you may have a gain or loss when you sell your shares. Current performance may differ from figures shown.
See page 7 for Performance Summary footnotes.
FRANKLIN FOCUSED GROWTH FUND
PERFORMANCE SUMMARY
Total Return Index Comparison for a Hypothetical $10,000 Investment1
Total return represents the change in value of an investment over the periods shown. It includes any applicable maximum sales charge, Fund expenses, account fees and reinvested distributions. The unmanaged index includes reinvestment of any income or distributions. It differs from the Fund in composition and does not pay management fees or expenses. One cannot invest directly in an index.
Advisor Class(4/12/16–9/30/19)
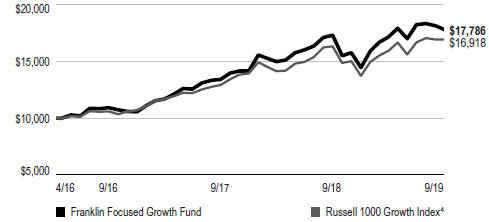
See page 7 for Performance Summary footnotes.
FRANKLIN FOCUSED GROWTH FUND
PERFORMANCE SUMMARY
Distributions (10/1/18–9/30/19)
| | | | | | | | | | | | |
| Share Class | | Net Investment
Income | | | Long-Term
Capital Gain | | | Total | |
| | | |
| Advisor | | | $0.0109 | | | | $0.0731 | | | | $0.0840 | |
Total Annual Operating Expenses5
| | | | | | | | |
| Share Class | | With Fee Waiver | | | Without Fee
Waiver | |
| | |
| Advisor | | | 1.01% | | | | 2.24% | |
All investments involve risks, including possible loss of principal. The market values of securities or other investments owned by the Fund will go up or down, sometimes rapidly or unpredictably. Growth stock prices reflect projections of future earnings or revenues, and can, therefore, fall dramatically if the company fails to meet those projections. To the extent the Fund focuses on particular countries, regions, industries, sectors or types of investment from time to time, it may be subject to greater risks of adverse developments in such areas of focus than a fund that invests in a wider variety of countries, regions, industries, sectors or investments. Foreign securities involve more risks than investing in U.S. securities, including currency fluctuations and economic and political uncertainties. From time to time, the trading market for a particular security or type of security or other investments in which the Fund invests may become less liquid or even illiquid. Reduced liquidity will have an adverse impact on the Fund’s ability to sell such securities or other investments when necessary to meet the Fund’s liquidity needs or in response to a specific economic event and will also generally lower the value of a security or other investments. The Fund may also invest in small- andmid-capitalization companies, which can be particularly sensitive to changing economic conditions, and their prospects for growth are less certain than those of larger, more established companies. The Fund is actively managed but there is no guarantee that the manager’s investment decisions will produce the desired results. The Fund’s prospectus also includes a description of the main investment risks.
1. The Fund has an expense reduction contractually guaranteed through 1/31/20. Fund investment results reflect the expense reduction; without this reduction the results would have been lower.
2. Cumulative total return represents the change in value of an investment over the periods indicated.
3. Average annual total return represents the average annual change in value of an investment over the periods indicated. Return for less than one year, if any, has not been annualized.
4. Source: Morningstar. The Russell 1000 Growth Index is market capitalization weighted and measures performance of those Russell 1000 Index companies with higherprice-to-book ratios and higher forecasted growth values.
5. Figures are as stated in the Fund’s current prospectus and may differ from the expense ratios disclosed in the Your Fund’s Expenses and Financial Highlights sections in this report. In periods of market volatility, assets may decline significantly, causing total annual Fund operating expenses to become higher than the figures shown.
See www.franklintempletondatasources.com for additional data provider information.
FRANKLIN FOCUSED GROWTH FUND
Your Fund’s Expenses
As a Fund shareholder, you can incur two types of costs: (1) transaction costs, including sales charges (loads) on Fund purchases and redemptions; and (2) ongoing Fund costs, including management fees, distribution and service(12b-1) fees, and other Fund expenses. All mutual funds have ongoing costs, sometimes referred to as operating expenses. The table below shows ongoing costs of investing in the Fund and can help you understand these costs and compare them with those of other mutual funds. The table assumes a $1,000 investment held for the six months indicated.
Actual Fund Expenses
The table below provides information about actual account values and actual expenses in the columns under the heading “Actual.” In these columns the Fund’s actual return, which includes the effect of Fund expenses, is used to calculate the “Ending Account Value.” You can estimate the expenses you paid during the period by following these steps (of course, your account value and expenses will differ from those in this illustration): Divide your account value by $1,000 (if your account had an $8,600 value, then $8,600÷ $1,000 = 8.6). Then multiply the result by the number in the row for your class of shares under the headings “Actual” and “Expenses Paid During Period” (if Actual Expenses Paid During Period were $7.50, then 8.6 x $7.50= $64.50). In this illustration, the actual expenses paid this period are $64.50.
Hypothetical Example for Comparison with Other Funds
Under the heading “Hypothetical” in the table, information is provided about hypothetical account values and hypothetical expenses based on the Fund’s actual expense ratio and an assumed rate of return of 5% per year before expenses, which is not the Fund’s actual return. This information may not be used to estimate the actual ending account balance or expenses you paid for the period, but it can help you compare ongoing costs of investing in the Fund with those of other funds. To do so, compare this 5% hypothetical example for the class of shares you hold with the 5% hypothetical examples that appear in the shareholder reports of other funds.
Please note that expenses shown in the table are meant to highlight ongoing costs and do not reflect any transactional costs. Therefore, information under the heading “Hypothetical” is useful in comparing ongoing costs only, and will not help you compare total costs of owning different funds. In addition, if transactional costs were included, your total costs would have been higher.
| | | | | | | | | | | | |
| | | | | Actual (actual return after expenses) | | Hypothetical (5% annual return before expenses) | | |
| | | | | | | | |
Share Class | | Beginning
Account
Value 4/1/19 | | Ending Account
Value 9/30/19 | | Expenses Paid During Period 4/1/19–9/30/191, 2 | | Ending Account Value 9/30/19 | | Expenses Paid During Period 4/1/19–9/30/191,2 | | Net Annualized
Expense Ratio2 |
| | | | | | |
| | | | | | |
Advisor | | $1,000 | | $1,037.10 | | $5.11 | | $1,020.05 | | $5.06 | | 1.00% |
1. Expenses are equal to the annualized expense ratio for thesix-month period as indicated above—in the far right column—multiplied by the simple average account value over the period indicated, and then multiplied by 183/365 to reflect theone-half year period.
2. Reflects expenses after fee waivers and expense reimbursements. Does not include acquired fund fees and expenses.
FRANKLIN CUSTODIAN FUNDS
Financial Highlights
Franklin Focused Growth Fund
| | | | | | | | | | | | | | | | |
| | | Year Ended September 30, | |
| | | | |
| | | 2019 | | | 2018 | | | 2017 | | | 2016a | |
| | | | |
Advisor Class | | | | | | | | | | | | | | | | |
| | | | |
Per share operating performance | | | | | | | | | | | | | | | | |
(for a share outstanding throughout the year) | | | | | | | | | | | | | | | | |
| | | | |
Net asset value, beginning of year | | | $17.24 | | | | $13.36 | | | | $10.93 | | | | $10.00 | |
| | | | |
| | | | |
Income from investment operationsb: | | | | | | | | | | | | | | | | |
| | | | |
Net investment income (loss)c | | | (0.06 | ) | | | (0.05 | ) | | | (0.02 | ) | | | (0.01 | ) |
| | | | |
Net realized and unrealized gains (losses) | | | 0.52 | | | | 3.93 | | | | 2.49 | | | | 0.94 | |
| | | | |
| | | | |
Total from investment operations | | | 0.46 | | | | 3.88 | | | | 2.47 | | | | 0.93 | |
| | | | |
| | | | |
Less distributions from: | | | | | | | | | | | | | | | | |
| | | | |
Net investment income | | | (0.01 | ) | | | — | | | | (0.01 | ) | | | — | |
| | | | |
Net realized gains | | | (0.07 | ) | | | — | | | | (0.03 | ) | | | — | |
| | | | |
| | | | |
Total distributions | | | (0.08 | ) | | | — | | | | (0.04 | ) | | | — | |
| | | | |
| | | | |
Net asset value, end of year | | | $17.62 | | | | $17.24 | | | | $13.36 | | | | $10.93 | |
| | | | |
| | | | |
Total returnd | | | 2.80% | | | | 29.04% | | | | 22.78% | | | | 9.30% | |
| | | | |
Ratios to average net assetse | | | | | | | | | | | | | | | | |
| | | | |
Expenses before waiver and payments by affiliates | | | 2.41% | | | | 2.23% | | | | 2.31% | | | | 4.76% | |
| | | | |
Expenses net of waiver and payments by affiliates | | | 1.00% | | | | 1.00% | f | | | 1.00% | f | | | 1.00% | |
| | | | |
Net investment income (loss) | | | (0.36)% | | | | (0.34)% | | | | (0.20)% | | | | (0.18)% | |
| | | | |
Supplemental data | | | | | | | | | | | | | | | | |
| | | | |
Net assets, end of year (000’s) | | | $4,404 | | | | $4,310 | | | | $3,341 | | | | $2,732 | |
| | | | |
Portfolio turnover rate | | | 28.65% | | | | 14.47% | | | | 28.48% | | | | 7.46% | |
aFor the period April 12, 2016 (commencement of operations) to September 30, 2016.
bThe amount shown for a share outstanding throughout the period may not correlate with the Statement of Operations for the period due to the timing of sales and repurchases of the Fund’s shares in relation to income earned and/or fluctuating fair value of the investments of the Fund.
cBased on average daily shares outstanding.
dTotal return is not annualized for periods less than one year.
eRatios are annualized for periods less than one year, except fornon-recurring expenses, if any.
fBenefit of expense reduction rounds to less than 0.01%.
| | | | |
| | | |
| | The accompanying notes are an integral part of these financial statements. | Annual Report | | 9 |
FRANKLIN CUSTODIAN FUNDS
Statement of Investments, September 30, 2019
Franklin Focused Growth Fund
| | | | | | | | | | | | |
| | | Country | | | Shares | | | Value | |
| | | |
Common Stocks 97.7% | | | | | | | | | | | | |
Aerospace & Defense 3.9% | | | | | | | | | | | | |
The Boeing Co. | | | United States | | | | 300 | | | $ | 114,141 | |
Raytheon Co. | | | United States | | | | 300 | | | | 58,857 | |
| | | | | | | | | | | | |
| | | |
| | | | | | | | | | | 172,998 | |
| | | | | | | | | | | | |
Capital Markets 2.1% | | | | | | | | | | | | |
CME Group Inc. | | | United States | | | | 400 | | | | 84,536 | |
Tradeweb Markets Inc. | | | United States | | | | 200 | | | | 7,396 | |
| | | | | | | | | | | | |
| | | |
| | | | | | | | | | | 91,932 | |
| | | | | | | | | | | | |
Entertainment 1.8% | | | | | | | | | | | | |
aNetflix Inc. | | | United States | | | | 300 | | | | 80,286 | |
| | | | | | | | | | | | |
Equity Real Estate Investment Trusts (REITs) 2.5% | | | | | | | | | | | | |
American Tower Corp. | | | United States | | | | 500 | | | | 110,565 | |
| | | | | | | | | | | | |
Food & Staples Retailing 2.3% | | | | | | | | | | | | |
Costco Wholesale Corp. | | | United States | | | | 350 | | | | 100,839 | |
| | | | | | | | | | | | |
Health Care Equipment & Supplies 9.9% | | | | | | | | | | | | |
Abbott Laboratories | | | United States | | | | 1,000 | | | | 83,670 | |
aAlcon Inc. | | | Switzerland | | | | 800 | | | | 46,632 | |
Danaher Corp. | | | United States | | | | 700 | | | | 101,101 | |
aIDEXX Laboratories Inc. | | | United States | | | | 350 | | | | 95,175 | |
aIntuitive Surgical Inc. | | | United States | | | | 200 | | | | 107,986 | |
| | | | | | | | | | | | |
| | | |
| | | | | | | | | | | 434,564 | |
| | | | | | | | | | | | |
Industrial Conglomerates 1.2% | | | | | | | | | | | | |
Roper Technologies Inc. | | | United States | | | | 150 | | | | 53,490 | |
| | | | | | | | | | | | |
Interactive Media & Services 9.2% | | | | | | | | | | | | |
aAlphabet Inc., A | | | United States | | | | 150 | | | | 183,171 | |
aFacebook Inc., A | | | United States | | | | 650 | | | | 115,752 | |
Tencent Holdings Ltd. | | | China | | | | 2,500 | | | | 105,322 | |
| | | | | | | | | | | | |
| | | |
| | | | | | | | | | | 404,245 | |
| | | | | | | | | | | | |
Internet & Direct Marketing Retail 11.8% | | | | | | | | | | | | |
aAlibaba Group Holding Ltd., ADR | | | China | | | | 500 | | | | 83,615 | |
aAmazon.com Inc. | | | United States | | | | 220 | | | | 381,900 | |
aMercadoLibre Inc. | | | Argentina | | | | 100 | | | | 55,123 | |
| | | | | | | | | | | | |
| | | |
| | | | | | | | | | | 520,638 | |
| | | | | | | | | | | | |
IT Services 12.7% | | | | | | | | | | | | |
aAdyen NV | | | Netherlands | | | | 100 | | | | 65,874 | |
Mastercard Inc., A | | | United States | | | | 650 | | | | 176,520 | |
aPayPal Holdings Inc. | | | United States | | | | 800 | | | | 82,872 | |
aShopify Inc., A | | | Canada | | | | 200 | | | | 62,267 | |
Visa Inc., A | | | United States | | | | 1,000 | | | | 172,010 | |
| | | | | | | | | | | | |
| | | |
| | | | | | | | | | | 559,543 | |
| | | | | | | | | | | | |
Life Sciences Tools & Services 1.5% | | | | | | | | | | | | |
a10X Genomics Inc., A | | | United States | | | | 100 | | | | 5,040 | |
aIllumina Inc. | | | United States | | | | 200 | | | | 60,844 | |
| | | | | | | | | | | | |
| | | |
| | | | | | | | | | | 65,884 | |
| | | | | | | | | | | | |
FRANKLIN CUSTODIAN FUNDS
STATEMENT OF INVESTMENTS
Franklin Focused Growth Fund(continued)
| | | | | | | | | | | | |
| | | Country | | | Shares | | | Value | |
Common Stocks(continued) | | | | | | | | | | | | |
Machinery 1.5% | | | | | | | | | | | | |
Fortive Corp. | | | United States | | | | 1,000 | | | $ | 68,560 | |
| | | | | | | | | | | | |
Media 1.9% | | | | | | | | | | | | |
aCharter Communications Inc., A | | | United States | | | | 200 | | | | 82,424 | |
| | | | | | | | | | | | |
Personal Products 2.3% | | | | | | | | | | | | |
Estee Lauder Cos. Inc., A | | | United States | | | | 500 | | | | 99,475 | |
| | | | | | | | | | | | |
Pharmaceuticals 1.5% | | | | | | | | | | | | |
aElanco Animal Health Inc. | | | United States | | | | 2,500 | | | | 66,475 | |
| | | | | | | | | | | | |
Professional Services 2.5% | | | | | | | | | | | | |
Verisk Analytics Inc. | | | United States | | | | 700 | | | | 110,698 | |
| | | | | | | | | | | | |
Semiconductors & Semiconductor Equipment 6.0% | | | | | | | | | | | | |
Analog Devices Inc. | | | United States | | | | 800 | | | | 89,384 | |
NVIDIA Corp. | | | United States | | | | 350 | | | | 60,924 | |
Xilinx Inc. | | | United States | | | | 1,200 | | | | 115,080 | |
| | | | | | | | | | | | |
| | | |
| | | | | | | | | | | 265,388 | |
| | | | | | | | | | | | |
Software 21.5% | | | | | | | | | | | | |
aAdobe Inc. | | | United States | | | | 750 | | | | 207,188 | |
Microsoft Corp. | | | United States | | | | 2,750 | | | | 382,332 | |
asalesforce.com Inc. | | | United States | | | | 1,200 | | | | 178,128 | |
aServiceNow Inc. | | | United States | | | | 700 | | | | 177,695 | |
| | | | | | | | | | | | |
| | | |
| | | | | | | | | | | 945,343 | |
| | | | | | | | | | | | |
Textiles, Apparel & Luxury Goods 1.6% | | | | | | | | | | | | |
NIKE Inc., B | | | United States | | | | 750 | | | | 70,440 | |
| | | | | | | | | | | | |
Total Common Stocks (Cost $2,600,223) | | | | | | | | | | | 4,303,787 | |
| | | | | | | | | | | | |
| | | |
Short Term Investments (Cost $116,522) 2.7% | | | | | | | | | | | | |
| | | |
Money Market Funds 2.7% | | | | | | | | | | | | |
b,cInstitutional Fiduciary Trust Money Market Portfolio, 1.71% | | | United States | | | | 116,522 | | | | 116,522 | |
| | | | | | | | | | | | |
Total Investments (Cost $2,716,745) 100.4% | | | | | | | | | | | 4,420,309 | |
Other Assets, less Liabilities (0.4)% | | | | | | | | | | | (16,133 | ) |
| | | | | | | | | | | | |
Net Assets 100.0% | | | | | | | | | | $ | 4,404,176 | |
| | | | | | | | | | | | |
See Abbreviations on page 21.
aNon-income producing.
bSee Note 3(e) regarding investments in affiliated management investment companies.
cThe rate shown is the annualizedseven-day effective yield at period end.
| | | | |
| | | |
| | The accompanying notes are an integral part of these financial statements. | Annual Report | | 11 |
FRANKLIN CUSTODIAN FUNDS
FINANCIAL STATEMENTS
Statement of Assets and Liabilities
September 30, 2019
Franklin Focused Growth Fund
| | | | |
| |
Assets: | | | | |
Investments in securities: | | | | |
Cost - Unaffiliated issuers | | | $ 2,600,223 | |
Cost -Non-controlled affiliates (Note 3e) | | | 116,522 | |
| | | | |
| |
Value - Unaffiliated issuers | | | $ 4,303,787 | |
Value -Non-controlled affiliates (Note 3e) | | | 116,522 | |
Receivables: | | | | |
Dividends | | | 594 | |
Affiliates | | | 23,241 | |
Other assets | | | 2 | |
| | | | |
| |
Total assets | | | 4,444,146 | |
| | | | |
| |
Liabilities: | | | | |
Payables: | | | | |
Transfer agent fees | | | 74 | |
Professional fees | | | 38,316 | |
Accrued expenses and other liabilities | | | 1,580 | |
| | | | |
| |
Total liabilities | | | 39,970 | |
| | | | |
| |
Net assets, at value | | | $4,404,176 | |
| | | | |
| |
Net assets consist of: | | | | |
Paid-in capital | | | $2,486,477 | |
| |
Total distributable earnings (loss) | | | 1,917,699 | |
| | | | |
Net assets, at value | | | $4,404,176 | |
| | | | |
| |
Shares outstanding | | | 250,000 | |
| | | | |
Net asset value and maximum offering price per share | | | $17.62 | |
| | | | |
| | | | |
| | | |
12 | | Annual Report | The accompanying notes are an integral part of these financial statements. | | |
FRANKLIN CUSTODIAN FUNDS
FINANCIAL STATEMENTS
Statement of Operations
for the year ended September 30, 2019
Franklin Focused Growth Fund
| | | | |
Investment income: | | | | |
Dividends: | | | | |
Unaffiliated issuers | | | $ 25,136 | |
Non-controlled affiliates (Note 3e) | | | 1,580 | |
| | | | |
| |
Total investment income | | | 26,716 | |
| | | | |
Expenses: | | | | |
Management fees (Note 3a) | | | 35,481 | |
Transfer agent fees (Note 3d) | | | 821 | |
Custodian fees (Note 4) | | | 126 | |
Reports to shareholders | | | 6,396 | |
Professional fees | | | 50,194 | |
Other | | | 7,434 | |
| | | | |
| |
Total expenses | | | 100,452 | |
Expenses waived/paid by affiliates (Note 3f) | | | (58,723 | ) |
| | | | |
| |
Net expenses | | | 41,729 | |
| | | | |
| |
Net investment income (loss) | | | (15,013 | ) |
| | | | |
Realized and unrealized gains (losses): | | | | |
Net realized gain (loss) from: | | | | |
Investments: | | | | |
Unaffiliated issuers | | | 242,341 | |
Foreign currency transactions | | | 280 | |
| | | | |
| |
Net realized gain (loss) | | | 242,621 | |
| | | | |
Net change in unrealized appreciation (depreciation) on: | | | | |
Investments: | | | | |
Unaffiliated issuers | | | (112,364 | ) |
| | | | |
| |
Net realized and unrealized gain (loss) | | | 130,257 | |
| | | | |
Net increase (decrease) in net assets resulting from operations | | | $ 115,244 | |
| | | | |
| | | | |
| | | |
| | The accompanying notes are an integral part of these financial statements. | Annual Report | | 13 |
FRANKLIN CUSTODIAN FUNDS
FINANCIAL STATEMENTS
Statements of Changes in Net Assets
Franklin Focused Growth Fund
| | | | | | | | |
| | | Year Ended September 30, | |
| | | | |
| | | 2019 | | | 2018 | |
| |
Increase (decrease) in net assets: | | | | | | | | |
Operations: | | | | | | | | |
Net investment income (loss) | | $ | (15,013 | ) | | $ | (13,077 | ) |
Net realized gain (loss) | | | 242,621 | | | | 33,371 | |
Net change in unrealized appreciation (depreciation) | | | (112,364 | ) | | | 949,113 | |
| | | | |
| | |
Net increase (decrease) in net assets resulting from operations | | | 115,244 | | | | 969,407 | |
| | | | |
| | |
Distributions to shareholders | | | (21,000 | ) | | | — | |
| | | | |
| | |
Net increase (decrease) in net assets | | | 94,244 | | | | 969,407 | |
Net assets: | | | | | | | | |
Beginning of year | | | 4,309,932 | | | | 3,340,525 | |
| | | | |
| | |
End of year | | $ | 4,404,176 | | | $ | 4,309,932 | |
| | | | |
| | | | |
| | | |
14 | | Annual Report | The accompanying notes are an integral part of these financial statements. | | |
FRANKLIN CUSTODIAN FUNDS
Notes to Financial Statements
Franklin Focused Growth Fund
1. Organization and Significant Accounting Policies
Franklin Custodian Funds (Trust) is registered under the Investment Company Act of 1940 (1940 Act) as anopen-end management investment company, consisting of six separate funds and applies the specialized accounting and reporting guidance in U.S. Generally Accepted Accounting Principles (U.S. GAAP). Franklin Focused Growth Fund (Fund) is included in this report. The Fund has five classes of shares: Class A, Class C, Class R, Class R6 and Advisor Class. Beginning on October 19, 2018, Class C shares automatically convert to Class A shares after they have been held for 10 years. Each class of shares may differ by its initial sales load, contingent deferred sales charges, voting rights on matters affecting a single class, its exchange privilege and fees due to differing arrangements for distribution and transfer agent fees.
The Fund currently operates with one class of shares, Advisor Class.
The following summarizes the Fund’s significant accounting policies.
a. Financial Instrument Valuation
The Fund’s investments in financial instruments are carried at fair value daily. Fair value is the price that would be received to sell an asset or paid to transfer a liability in an orderly transaction between market participants on the measurement date. The Fund calculates the net asset value (NAV) per share each business day as of 4 p.m. Eastern time or the regularly scheduled close of the New York Stock Exchange (NYSE), whichever is earlier. Under compliance policies and procedures approved by the Trust’s Board of Trustees (the Board), the Fund’s administrator has responsibility for oversight of valuation, including leading the cross-functional Valuation Committee (VC). The Fund may utilize independent pricing services, quotations from securities and financial instrument dealers, and other market sources to determine fair value.
Equity securities listed on an exchange or on the NASDAQ National Market System are valued at the last quoted sale price or the official closing price of the day, respectively. Foreign equity securities are valued as of the close of trading on the foreign stock exchange on which the security is primarily traded, or as of 4 p.m. Eastern time. The value is then converted into its U.S. dollar equivalent at the foreign exchange rate in effect at 4 p.m. Eastern time on the day that
the value of the security is determined.Over-the-counter (OTC) securities are valued within the range of the most recent quoted bid and ask prices. Securities that trade in multiple markets or on multiple exchanges are valued according to the broadest and most representative market. Certain equity securities are valued based upon fundamental characteristics or relationships to similar securities.
Investments inopen-end mutual funds are valued at the closing NAV.
The Fund has procedures to determine the fair value of financial instruments for which market prices are not reliable or readily available. Under these procedures, the Fund primarily employs a market-based approach which may use related or comparable assets or liabilities, recent transactions, market multiples, book values, and other relevant information for the investment to determine the fair value of the investment. An income-based valuation approach may also be used in which the anticipated future cash flows of the investment are discounted to calculate fair value. Discounts may also be applied due to the nature or duration of any restrictions on the disposition of the investments. Due to the inherent uncertainty of valuations of such investments, the fair values may differ significantly from the values that would have been used had an active market existed.
Trading in securities on foreign securities stock exchanges and OTC markets may be completed before 4 p.m. Eastern time. In addition, trading in certain foreign markets may not take place on every Fund’s business day. Occasionally, events occur between the time at which trading in a foreign security is completed and 4 p.m. Eastern time that might call into question the reliability of the value of a portfolio security held by the Fund. As a result, differences may arise between the value of the Fund’s portfolio securities as determined at the foreign market close and the latest indications of value at 4 p.m. Eastern time. In order to minimize the potential for these differences, the VC monitors price movements following the close of trading in foreign stock markets through a series of country specific market proxies (such as baskets of American Depositary Receipts, futures contracts and exchange traded funds). These price movements are measured against established trigger thresholds for each specific market proxy to assist in determining if an event has occurred that may call into question the reliability of the values of the foreign securities held by the Fund. If such an
FRANKLIN CUSTODIAN FUNDS
NOTES TO FINANCIAL STATEMENTS
Franklin Focused Growth Fund(continued)
1. Organization and Significant Accounting
Policies(continued)
a. Financial Instrument Valuation(continued)
event occurs, the securities may be valued using fair value procedures, which may include the use of independent pricing services.
When the last day of the reporting period is anon-business day, certain foreign markets may be open on those days that the Fund’s NAV is not calculated, which could result in differences between the value of the Fund’s portfolio securities on the last business day and the last calendar day of the reporting period. Any significant security valuation changes due to an open foreign market are adjusted and reflected by the Fund for financial reporting purposes.
b. Foreign Currency Translation
Portfolio securities and other assets and liabilities denominated in foreign currencies are translated into U.S. dollars based on the exchange rate of such currencies against U.S. dollars on the date of valuation. The Fund may enter into foreign currency exchange contracts to facilitate transactions denominated in a foreign currency. Purchases and sales of securities, income and expense items denominated in foreign currencies are translated into U.S. dollars at the exchange rate in effect on the transaction date. Portfolio securities and assets and liabilities denominated in foreign currencies contain risks that those currencies will decline in value relative to the U.S. dollar. Occasionally, events may impact the availability or reliability of foreign exchange rates used to convert the U.S. dollar equivalent value. If such an event occurs, the foreign exchange rate will be valued at fair value using procedures established and approved by the Board.
The Fund does not separately report the effect of changes in foreign exchange rates from changes in market prices on securities held. Such changes are included in net realized and unrealized gain or loss from investments in the Statement of Operations.
Realized foreign exchange gains or losses arise from sales of foreign currencies, currency gains or losses realized between the trade and settlement dates on securities transactions and the difference between the recorded amounts of dividends, interest, and foreign withholding taxes and the U.S. dollar equivalent of the amounts actually received or paid. Net unrealized foreign exchange gains and losses arise from
changes in foreign exchange rates on foreign denominated assets and liabilities other than investments in securities held at the end of the reporting period.
c. Income and Deferred Taxes
It is the Fund’s policy to qualify as a regulated investment company under the Internal Revenue Code. The Fund intends to distribute to shareholders substantially all of its taxable income and net realized gains to relieve it from federal income and excise taxes. As a result, no provision for U.S. federal income taxes is required.
The Fund may be subject to foreign taxation related to income received, capital gains on the sale of securities and certain foreign currency transactions in the foreign jurisdictions in which it invests. Foreign taxes, if any, are recorded based on the tax regulations and rates that exist in the foreign markets in which the Fund invests. When a capital gain tax is determined to apply, the Fund records an estimated deferred tax liability in an amount that would be payable if the securities were disposed of on the valuation date.
The Fund may recognize an income tax liability related to its uncertain tax positions under U.S. GAAP when the uncertain tax position has a less than 50% probability that it will be sustained upon examination by the tax authorities based on its technical merits. As of September 30, 2019, the Fund has determined that no tax liability is required in its financial statements related to uncertain tax positions for any open tax years (or expected to be taken in future tax years). Open tax years are those that remain subject to examination and are based on the statute of limitations in each jurisdiction in which the Fund invests.
d. Security Transactions, Investment Income, Expenses and Distributions
Security transactions are accounted for on trade date. Realized gains and losses on security transactions are determined on a specific identification basis. Estimated expenses are accrued daily. Dividend income is recorded on theex-dividend date except for certain dividends from securities where the dividend rate is not available. In such cases, the dividend is recorded as soon as the information is received by the Fund. Distributions to shareholders are recorded on theex-dividend date. Distributable earnings are determined according to income tax regulations (tax basis) and may differ from earnings recorded in accordance with
FRANKLIN CUSTODIAN FUNDS
NOTES TO FINANCIAL STATEMENTS
Franklin Focused Growth Fund(continued)
U.S. GAAP. These differences may be permanent or temporary. Permanent differences are reclassified among capital accounts to reflect their tax character. These reclassifications have no impact on net assets or the results of operations. Temporary differences are not reclassified, as they may reverse in subsequent periods.
Common expenses incurred by the Trust are allocated among the Funds based on the ratio of net assets of each Fund to the combined net assets of the Trust or based on the ratio of number of shareholders of each Fund to the combined number of shareholders of the Trust. Fund specific expenses are charged directly to the Fund that incurred the expense.
Realized and unrealized gains and losses and net investment income, excluding class specific expenses, are allocated daily to each class of shares based upon the relative proportion of net assets of each class. Differences in per share distributions by class are generally due to differences in class specific expenses.
e. Accounting Estimates
The preparation of financial statements in accordance with U.S. GAAP requires management to make estimates and assumptions that affect the reported amounts of assets and
liabilities at the date of the financial statements and the amounts of income and expenses during the reporting period. Actual results could differ from those estimates.
f. Guarantees and Indemnifications
Under the Trust’s organizational documents, its officers and trustees are indemnified by the Trust against certain liabilities arising out of the performance of their duties to the Trust. Additionally, in the normal course of business, the Trust, on behalf of the Fund, enters into contracts with service providers that contain general indemnification clauses. The Trust’s maximum exposure under these arrangements is unknown as this would involve future claims that may be made against the Trust that have not yet occurred. Currently, the Trust expects the risk of loss to be remote.
2. Shares of Beneficial Interest
At September 30, 2019, there were an unlimited number of shares authorized (without par value). During the years ended September 30, 2019 and 2018, there were no transactions of the Fund’s shares.
3. Transactions with Affiliates
Franklin Resources, Inc. is the holding company for various subsidiaries that together are referred to as Franklin Templeton. Certain officers and trustees of the Trust are also officers and/or directors of the following subsidiaries:
| | | | |
| Subsidiary | | Affiliation | | |
| | |
Franklin Advisers, Inc. (Advisers) | | Investment manager | | |
| | |
Franklin Templeton Services, LLC (FT Services) | | Administrative manager | | |
| | |
Franklin Templeton Distributors, Inc. (Distributors) | | Principal underwriter | | |
| | |
Franklin Templeton Investor Services, LLC (Investor Services) | | Transfer agent | | |
FRANKLIN CUSTODIAN FUNDS
NOTES TO FINANCIAL STATEMENTS
Franklin Focused Growth Fund(continued)
3. Transactions with Affiliates(continued)
a. Management Fees
The Fund pays an investment management fee to Advisers based on the average daily net assets of the Fund as follows:
| | |
| Annualized Fee Rate | | Net Assets |
0.850% | | Up to and including $500 million |
0.800% | | Over $500 million, up to and including $1 billion |
0.750% | | Over $1 billion, up to and including $3 billion |
0.730% | | Over $3 billion, up to and including $5 billion |
0.700% | | In excess of $5 billion |
b. Administrative Fees
Under an agreement with Advisers, FT Services provides administrative services to the Fund. The fee is paid by Advisers based on the Fund’s average daily net assets, and is not an additional expense of the Fund.
c. Distribution Fees
The Board has adopted distribution plans for each share class, with the exception of Class R6 and Advisor Class shares, pursuant to Rule12b-1 under the 1940 Act. Under the Fund’s Class A reimbursement distribution plan, the Fund reimburses Distributors for costs incurred in connection with the servicing, sale and distribution of the Fund’s shares up to the maximum annual plan rate. Under the Class A reimbursement distribution plan, costs exceeding the maximum for the current plan year cannot be reimbursed in subsequent periods. In addition, under the Fund’s Class C and R compensation distribution plans, the Fund pays Distributors for costs incurred in connection with the servicing, sale and distribution of the Fund’s shares up to the maximum annual plan rate for each class. The plan year, for purposes of monitoring compliance with the maximum annual plan rates, is February 1 through January 31.
The maximum annual plan rates, based on the average daily net assets, for each class, are as follows:
| | | | |
Class A | | | 0.25 | % |
| |
Class C | | | 1.00 | % |
| |
Class R | | | 0.50 | % |
d. Transfer Agent Fees
Each class of shares pays transfer agent fees to Investor Services for its performance of shareholder servicing obligations. The fees are based on an annualized asset based fee of 0.02% plus a transaction based fee. In addition, each class reimburses Investor Services for out of pocket expenses incurred and, except for Class R6, reimburses shareholder servicing fees paid to third parties. These fees are allocated daily based upon their relative proportion of such classes’ aggregate net assets. Class R6 pays Investor Services transfer agent fees specific to that class.
For the year ended September 30, 2019, the Fund paid transfer agent fees of $821, which were retained by Investor Services.
FRANKLIN CUSTODIAN FUNDS
NOTES TO FINANCIAL STATEMENTS
Franklin Focused Growth Fund(continued)
e. Investments in Affiliated Management Investment Companies
The Fund invests in one or more affiliated management investment companies for purposes other than exercising a controlling influence over the management or policies. Management fees paid by the Fund are waived on assets invested in the affiliated management investment companies, as noted in the Statement of Operations, in an amount not to exceed the management and administrative fees paid directly or indirectly by each affiliate. During the year ended September 30, 2019, the Fund held investments in affiliated management investment companies as follows:
| | | | | | | | | | | | | | | | | | | | | | | | | | | | | | | | |
| | | Value at
Beginning
of Year | | | Purchases | | | Sales | | | Realized
Gain (Loss) | | | Net Change in
Unrealized
Appreciation
(Depreciation) | | | Value at
End of
Year | | | Number of
Shares
Held at End
of Year | | | Dividend
Income | |
| | | | | | | | |
Non-Controlled Affiliates | | | | | | | | | | | | | | | | | | | | | | | | | | | | | | | | |
Institutional Fiduciary Trust Money Market Portfolio, 1.71% | | | $89,859 | | | | $493,785 | | | | $(467,122) | | | | $ — | | | | $ — | | | | $116,522 | | | | 116,522 | | | | $1,580 | |
| | | | | | | | | | | | |
f. Waiver and Expense Reimbursements
Advisers has contractually agreed in advance to waive or limit its fees and to assume as its own expense certain expenses otherwise payable by the Fund so that the expenses (excluding distribution fees, acquired fund fees and expenses and certainnon-routine expenses or costs, including those relating to litigation, indemnification, reorganizations, and liquidations) of the Fund does not exceed 1.00%, based on the average net assets of each class until January 31, 2020. Total expenses waived or paid are not subject to recapture subsequent to the Fund’s fiscal year end.
g. Other Affiliated Transactions
At September 30, 2019, Franklin Resources, Inc. owned 100% of the Fund’s outstanding shares. Investment activities of this shareholder could have a material impact on the Fund.
4. Expense Offset Arrangement
The Fund has entered into an arrangement with its custodian whereby credits realized as a result of uninvested cash balances are used to reduce a portion of the Fund’s custodian expenses. During the year ended September 30, 2019, there were no credits earned.
5. Income Taxes
The tax character of distributions paid during the years ended September 30, 2019 and 2018, was as follows:
| | | | | | | | |
| | | 2019 | | | 2018 | |
| | | | |
| | |
Distributions paid from: | | | | | | | | |
Ordinary income | | $ | 2,725 | | | $ | — | |
Long term capital gain | | | 18,275 | | | | — | |
| | | | |
| | |
| | $ | 21,000 | | | $ | — | |
| | | | |
FRANKLIN CUSTODIAN FUNDS
NOTES TO FINANCIAL STATEMENTS
Franklin Focused Growth Fund(continued)
5. Income Taxes(continued)
At September 30, 2019, the cost of investments, net unrealized appreciation (depreciation), undistributed ordinary income and undistributed long term capital gains for income tax purposes were as follows:
| | | | |
Cost of investments | | $ | 2,716,745 | |
| | | | |
| |
Unrealized appreciation | | $ | 1,736,738 | |
Unrealized depreciation | | | (33,174 | ) |
| | | | |
| |
Net unrealized appreciation (depreciation) | | $ | 1,703,564 | |
| | | | |
| |
Distributable earnings: | | | | |
Undistributed ordinary income | | $ | 5,444 | |
Undistributed long term capital gains | | | 208,691 | |
| | | | |
| |
Total distributable earnings | | $ | 214,135 | |
| | | | |
6. Investment Transactions
Purchases and sales of investments (excluding short term securities) for the year ended September 30, 2019, aggregated $1,183,102 and $1,248,776, respectively.
7. Credit Facility
The Fund, together with other U.S. registered and foreign investment funds (collectively, Borrowers), managed by Franklin Templeton, are borrowers in a joint syndicated senior unsecured credit facility totaling $2 billion (Global Credit Facility) which matures on February 7, 2020. This Global Credit Facility provides a source of funds to the Borrowers for temporary and emergency purposes, including the ability to meet future unanticipated or unusually large redemption requests.
Under the terms of the Global Credit Facility, the Fund shall, in addition to interest charged on any borrowings made by the Fund and other costs incurred by the Fund, pay its share of fees and expenses incurred in connection with the implementation and maintenance of the Global Credit Facility, based upon its relative share of the aggregate net assets of all of the Borrowers, including an annual commitment fee of 0.15% based upon the unused portion of the Global Credit Facility. These fees are reflected in other expenses in the Statement of Operations. During the year ended September 30, 2019, the Fund did not use the Global Credit Facility.
8. Fair Value Measurements
The Fund follows a fair value hierarchy that distinguishes between market data obtained from independent sources (observable inputs) and the Fund’s own market assumptions (unobservable inputs). These inputs are used in determining the value of the Fund’s financial instruments and are summarized in the following fair value hierarchy:
| | • | | Level 1 – quoted prices in active markets for identical financial instruments |
| | • | | Level 2 – other significant observable inputs (including quoted prices for similar financial instruments, interest rates, prepayment speed, credit risk, etc.) |
| | • | | Level 3 – significant unobservable inputs (including the Fund’s own assumptions in determining the fair value of financial instruments) |
The input levels are not necessarily an indication of the risk or liquidity associated with financial instruments at that level.
FRANKLIN CUSTODIAN FUNDS
NOTES TO FINANCIAL STATEMENTS
Franklin Focused Growth Fund(continued)
At September 30, 2019, all of the Fund’s investments in financial instruments carried at fair value were valued using Level 1 inputs. For detailed categories, see the accompanying Statement of Investments.
9. Subsequent Events
The Fund has evaluated subsequent events through the issuance of the financial statements and determined that no events have occurred that require disclosure.
| | |
Abbreviations |
| Selected Portfolio |
| ADR | | American Depositary Receipt |
FRANKLIN CUSTODIAN FUNDS
Report of Independent Registered Public Accounting Firm
To the Board of Trustees of Franklin Custodian Funds and Shareholders of Franklin Focused Growth Fund
Opinion on the Financial Statements
We have audited the accompanying statement of assets and liabilities, including the statement of investments, of Franklin Focused Growth Fund (the “Fund”) as of September 30, 2019, the related statement of operations for the year ended September 30, 2019, the statement of changes in net assets for each of the two years in the period ended September 30, 2019, including the related notes, and the financial highlights for each of the periods indicated therein (collectively referred to as the “financial statements”). In our opinion, the financial statements present fairly, in all material respects, the financial position of the Fund as of September 30, 2019, the results of its operations for the year then ended, the changes in its net assets for each of the two years in the period ended September 30, 2019 and the financial highlights for each of the periods indicated therein in conformity with accounting principles generally accepted in the United States of America.
Basis for Opinion
These financial statements are the responsibility of the Fund’s management. Our responsibility is to express an opinion on the Fund’s financial statements based on our audits. We are a public accounting firm registered with the Public Company Accounting Oversight Board (United States) (PCAOB) and are required to be independent with respect to the Fund in accordance with the U.S. federal securities laws and the applicable rules and regulations of the Securities and Exchange Commission and the PCAOB.
We conducted our audits of these financial statements in accordance with the standards of the PCAOB. Those standards require that we plan and perform the audit to obtain reasonable assurance about whether the financial statements are free of material misstatement, whether due to error or fraud.
Our audits included performing procedures to assess the risks of material misstatement of the financial statements, whether due to error or fraud, and performing procedures that respond to those risks. Such procedures included examining, on a test basis, evidence regarding the amounts and disclosures in the financial statements. Our audits also included evaluating the accounting principles used and significant estimates made by management, as well as evaluating the overall presentation of the financial statements. Our procedures included confirmation of securities owned as of September 30, 2019 by correspondence with the custodian and transfer agent. We believe that our audits provide a reasonable basis for our opinion.
PricewaterhouseCoopers LLP
San Francisco, California
November 14, 2019
We have served as the auditor of one or more investment companies in the Franklin Templeton Group of Funds since 1948.
FRANKLIN CUSTODIAN FUNDS
Tax Information (unaudited)
Franklin Focused Growth Fund
Under Section 852(b)(3)(C) of the Internal Revenue Code, the Fund hereby reports the maximum amount allowable but no less than $18,275 as a long term capital gain dividend for the fiscal year ended September 30, 2019.
Under Section 871(k)(2)(C) of the Internal Revenue Code, the Fund hereby reports the maximum amount allowable but no less than $2,725 as a short term capital gain dividend for purposes of the tax imposed under Section 871(a)(1)(A) of the Internal Revenue Code for the fiscal year ended September 30, 2019.
Under Section 854(b)(1)(A) of the Internal Revenue Code, the Fund hereby reports 100.00% of the ordinary income dividends as income qualifying for the dividends received deduction for the fiscal year ended September 30, 2019.
Under Section 854(b)(1)(B) of the Internal Revenue Code, the Fund hereby reports the maximum amount allowable but no less than $23,005 as qualified dividends for purposes of the maximum rate under Section 1(h)(11) of the Internal Revenue Code for the fiscal year ended September 30, 2019. Distributions, including qualified dividend income, paid during calendar year 2019 will be reported to shareholders on Form1099-DIV bymid-February 2020. Shareholders are advised to check with their tax advisors for information on the treatment of these amounts on their individual income tax returns.
FRANKLIN CUSTODIAN FUNDS
Board Members and Officers
The name, year of birth and address of the officers and board members, as well as their affiliations, positions held with the Trust, principal occupations during at least the past five years and number of U.S. registered portfolios overseen in the Franklin Templeton fund complex, are shown below. Generally, each board member serves until that person’s successor is elected and qualified.
Independent Board Members
| | | | | | | | |
Name, Year of Birth and Address | | Position | | Length of
Time Served | | Number of Portfolios in
Fund Complex Overseen
by Board Member* | | Other Directorships Held
During at Least the Past 5 Years |
| | | | |
Harris J. Ashton (1932) One Franklin Parkway San Mateo, CA 94403-1906 | | Trustee | | Since 1976 | | 135 | | Bar-S Foods (meat packing company) (1981-2010). |
| | |
| Principal Occupation During at Least the Past 5 Years: | | | | |
Director of various companies; andformerly, Director, RBC Holdings, Inc. (bank holding company) (until 2002); and President, Chief Executive Officer and Chairman of the Board, General Host Corporation (nursery and craft centers) (until 1998). |
| | | | |
Terrence J. Checki (1945) One Franklin Parkway San Mateo, CA 94403-1906 | | Trustee | | Since 2017 | | 114 | | Hess Corporation (exploration of oil and gas) (2014-present). |
| | |
| Principal Occupation During at Least the Past 5 Years: | | | | |
Member of the Council on Foreign Relations (1996-present); Member of the National Committee on U.S.-China Relations (1999-present); member of the Board of Trustees of the Economic Club of New York (2013-present); member of the Board of Trustees of the Foreign Policy Association (2005-present) and member of various other boards of trustees and advisory boards; andformerly, Executive Vice President of the Federal Reserve Bank of New York and Head of its Emerging Markets and Internal Affairs Group and Member of Management Committee (1995-2014); and Visiting Fellow at the Council on Foreign Relations (2014). |
| | | | |
Mary C. Choksi (1950) One Franklin Parkway San Mateo, CA 94403-1906 | | Trustee | | Since 2014 | | 135 | | Avis Budget Group Inc. (car rental)(2007-present), Omnicom Group Inc. (advertising and marketing communications services) (2011-present) and White Mountains Insurance Group, Ltd. (holding company) (2017-present). |
| | |
| Principal Occupation During at Least the Past 5 Years: | | | | |
Director of various companies; andformerly, Founder and Senior Advisor, Strategic Investment Group (investment management group) (2015-2017); Founding Partner and Senior Managing Director, Strategic Investment Group (1987-2015); Founding Partner and Managing Director, Emerging Markets Management LLC (investment management firm) (1987-2011); and Loan Officer/Senior Loan Officer/Senior Pension Investment Officer, World Bank Group (international financial institution) (1977-1987). |
| | | | |
Edith E. Holiday (1952) One Franklin Parkway San Mateo, CA 94403-1906 | | Lead Independent Trustee | | Trustee since 1998 and Lead Independent Trustee since March 2019 | | 135 | | Hess Corporation (exploration of oil and gas) (1993-present), Canadian National Railway (railroad) (2001-present), White Mountains Insurance Group, Ltd. (holding company) (2004-present), Santander Consumer USA Holdings, Inc. (consumer finance) (2016-present), RTI International Metals, Inc. (manufacture and distribution of titanium) (1999-2015) and H.J. Heinz Company (processed foods and allied products) (1994-2013). |
| | |
| Principal Occupation During at Least the Past 5 Years: | | | | |
Director or Trustee of various companies and trusts; andformerly, Assistant to the President of the United States and Secretary of the Cabinet (1990-1993); General Counsel to the United States Treasury Department (1989-1990); and Counselor to the Secretary and Assistant Secretary for Public Affairs and Public Liaison-United States Treasury Department (1988-1989). |
FRANKLIN CUSTODIAN FUNDS
Independent Board Members(continued)
| | | | | | | | |
Name, Year of Birth and Address | | Position | | Length of
Time Served | | Number of Portfolios in
Fund Complex Overseen
by Board Member* | | Other Directorships Held
During at Least the Past 5 Years |
| | | | |
J. Michael Luttig (1954) One Franklin Parkway San Mateo, CA 94403-1906 | | Trustee | | Since 2009 | | 135 | | Boeing Capital Corporation (aircraft financing) (2006-2013). |
| | |
| Principal Occupation During at Least the Past 5 Years: | | | | |
Executive Vice President, Counselor and Senior Advisor to Boeing Chairman and Board of Directors, The Boeing Company (aerospace company) (May 2019); andformerly, General Counsel and member of the Executive Council, The Boeing Company (2006-2019) and Federal Appeals Court Judge, U.S. Court of Appeals for the Fourth Circuit (1991-2006). |
| | | | |
Larry D. Thompson (1945) One Franklin Parkway San Mateo, CA 94403-1906 | | Trustee | | Since 2007 | | 135 | | The Southern Company (energy company) (2014-present; previously 2010-2012), Graham Holdings Company (education and media organization) (2011-present) and Cbeyond, Inc. (business communications provider) (2010-2012). |
| | |
| Principal Occupation During at Least the Past 5 Years: | | | | |
Director of various companies; Counsel, Finch McCranie, LLP (law firm) (2015-present); Independent Compliance Monitor and Auditor, Volkswagen AG (manufacturer of automobiles and commercial vehicles) (2017-present); John A. Sibley Professor of Corporate and Business Law, University of Georgia School of Law (2015-present; previously 2011-2012); andformerly, Executive Vice President - Government Affairs, General Counsel and Corporate Secretary, PepsiCo, Inc. (consumer products) (2012-2014); Senior Vice President - Government Affairs, General Counsel and Secretary, PepsiCo, Inc. (2004-2011); Senior Fellow of The Brookings Institution (2003-2004); Visiting Professor, University of Georgia School of Law (2004); and Deputy Attorney General, U.S. Department of Justice (2001-2003). |
| |
| Interested Board Members and Officers | | |
| | | | |
Name, Year of Birth and Address | | Position | | Length of Time
Served | | Number of Portfolios in Fund Complex Overseen by Board Member* | | Other Directorships Held During at Least the Past 5 Years |
| | | | |
**Gregory E. Johnson (1961) One Franklin Parkway San Mateo, CA 94403-1906 | | Trustee | | Since 2013 | | 147 | | None |
| | |
| Principal Occupation During at Least the Past 5 Years: | | | | |
Chairman of the Board, Member - Office of the Chairman, Director and Chief Executive Officer, Franklin Resources, Inc.; officer and/or director or trustee, as the case may be, of some of the other subsidiaries of Franklin Resources, Inc. and of 42 of the investment companies in Franklin Templeton; Vice Chairman, Investment Company Institute; andformerly, President, Franklin Resources, Inc. (1994-2015). |
| | | | |
**Rupert H. Johnson, Jr. (1940) One Franklin Parkway San Mateo, CA 94403-1906 | | Chairman of the Board, Trustee and Vice President | | Chairman of the Board since 2013, Trustee since 1983 and Vice President since 1982 | | 135 | | None |
| | |
| Principal Occupation During at Least the Past 5 Years: | | | | |
Vice Chairman, Member - Office of the Chairman and Director, Franklin Resources, Inc.; Director, Franklin Advisers, Inc.; and officer and/or director or trustee, as the case may be, of some of the other subsidiaries of Franklin Resources, Inc. and of 40 of the investment companies in Franklin Templeton. |
| | | | |
Alison E. Baur (1964) One Franklin Parkway San Mateo, CA 94403-1906 | | Vice President | | Since 2012 | | Not Applicable | | Not Applicable |
| | |
| Principal Occupation During at Least the Past 5 Years: | | | | |
Deputy General Counsel, Franklin Templeton; and officer of some of the other subsidiaries of Franklin Resources, Inc. and of 44 of the investment companies in Franklin Templeton. |
FRANKLIN CUSTODIAN FUNDS
Interested Board Members and Officers(continued)
| | | | | | | | |
Name, Year of Birth and Address | | Position | | Length of
Time Served | | Number of Portfolios in
Fund Complex Overseen
by Board Member* | | Other Directorships Held
During at Least the Past 5 Years |
| | | | |
Gaston Gardey (1967) One Franklin Parkway San Mateo, CA 94403-1906 | | Treasurer, Chief Financial Officer and Chief Accounting Officer | | Since 2009 | | Not Applicable | | Not Applicable |
| | |
| Principal Occupation During at Least the Past 5 Years: | | | | |
Treasurer, U.S. Fund Administration & Reporting and officer of 26 of the investment companies in Franklin Templeton. |
| | | | |
Aliya S. Gordon (1973) One Franklin Parkway San Mateo, CA 94403-1906 | | Vice President | | Since 2009 | | Not Applicable | | Not Applicable |
| | |
| Principal Occupation During at Least the Past 5 Years: | | | | |
Senior Associate General Counsel, Franklin Templeton; Vice President and Secretary, Franklin Resources, Inc.; and officer of 44 of the investment companies in Franklin Templeton. |
| | | | |
Steven J. Gray (1955) One Franklin Parkway San Mateo, CA 94403-1906 | | Vice President since 2009 andCo-Secretary since January 2019 | | Vice President since 2009 andCo-Secretary since January 2019 | | Not Applicable | | Not Applicable |
| | |
| Principal Occupation During at Least the Past 5 Years: | | | | |
Senior Associate General Counsel, Franklin Templeton; Vice President, Franklin Templeton Distributors, Inc. and FASA, LLC; and officer of 44 of the investment companies in Franklin Templeton. |
| | | | |
Matthew T. Hinkle (1971) One Franklin Parkway San Mateo, CA 94403-1906 | | Chief Executive Officer – Finance and Administration | | Since 2017 | | Not Applicable | | Not Applicable |
| | |
| Principal Occupation During at Least the Past 5 Years: | | | | |
Senior Vice President, Franklin Templeton Services, LLC; officer of 44 of the investment companies in Franklin Templeton; andformerly, Vice President, Global Tax (2012-April 2017) and Treasurer/Assistant Treasurer, Franklin Templeton (2009-2017). |
| | | | |
Robert Lim (1948) One Franklin Parkway San Mateo, CA 94403-1906 | | Vice President – AML Compliance | | Since 2016 | | Not Applicable | | Not Applicable |
| | |
| Principal Occupation During at Least the Past 5 Years: | | | | |
Vice President, Franklin Templeton Companies, LLC; Chief Compliance Officer, Franklin Templeton Distributors, Inc. and Franklin Templeton Investor Services, LLC; and officer of 44 of the investment companies in Franklin Templeton. |
| | | | |
Kimberly H. Novotny (1972) 300 S.E. 2nd Street Fort Lauderdale, FL 33301-1923 | | Vice President | | Since 2013 | | Not Applicable | | Not Applicable |
| | |
| Principal Occupation During at Least the Past 5 Years: | | | | |
Senior Associate General Counsel, Franklin Templeton; Vice President and Corporate Secretary, Fiduciary Trust International of the South; Vice President, Templeton Investment Counsel, LLC; Assistant Secretary, Franklin Resources, Inc.; and officer of 44 of the investment companies in Franklin Templeton. |
FRANKLIN CUSTODIAN FUNDS
Interested Board Members and Officers(continued)
| | | | | | | | |
Name, Year of Birth and Address | | Position | | Length of
Time Served | | Number of Portfolios in
Fund Complex Overseen
by Board Member* | | Other Directorships Held
During at Least the Past 5 Years |
| | | | |
Edward D. Perks (1970) One Franklin Parkway San Mateo, CA 94403-1906 | | President and Chief Executive Officer – Investment Management | | Since December 2018 | | Not Applicable | | Not Applicable |
| | |
| Principal Occupation During at Least the Past 5 Years: | | | | |
President and Director, Franklin Advisers, Inc.; and officer of nine of the investment companies in Franklin Templeton (since December 2018). |
| | | | |
Robert C. Rosselot (1960) 300 S.E. 2nd Street Fort Lauderdale, FL 33301-1923 | | Chief Compliance Officer and Secretary | | Since 2013 | | Not Applicable | | Not Applicable |
| | |
| Principal Occupation During at Least the Past 5 Years: | | | | |
Director, Global Compliance, Franklin Templeton; Vice President, Franklin Templeton Companies, LLC; officer of 44 of the investment companies in Franklin Templeton; andformerly, Senior Associate General Counsel, Franklin Templeton (2007-2013); and Secretary and Vice President, Templeton Group of Funds (2004-2013). |
| | | | |
Navid J. Tofigh (1972) One Franklin Parkway San Mateo, CA 94403-1906 | �� | Vice President | | Since 2015 | | Not Applicable | | Not Applicable |
| | |
| Principal Occupation During at Least the Past 5 Years: | | | | |
Associate General Counsel and officer of 44 of the investment companies in Franklin Templeton. |
| | | | |
Craig S. Tyle (1960) One Franklin Parkway San Mateo, CA 94403-1906 | | Vice President | | Since 2005 | | Not Applicable | | Not Applicable |
| | |
| Principal Occupation During at Least the Past 5 Years: | | | | |
General Counsel and Executive Vice President, Franklin Resources, Inc.; and officer of some of the other subsidiaries of Franklin Resources, Inc. and of 44 of the investment companies in Franklin Templeton. |
| | | | |
Lori A. Weber (1964) 300 S.E. 2nd Street Fort Lauderdale, FL 33301-1923 | | Vice President and Co- Secretary | | Vice President since 2011 andCo-Secretary since January 2019 | | Not Applicable | | Not Applicable |
Principal Occupation During at Least the Past 5 Years:
Senior Associate General Counsel, Franklin Templeton; Assistant Secretary, Franklin Resources, Inc.; Vice President and Secretary, Templeton Investment Counsel, LLC; and officer of 44 of the investment companies in Franklin Templeton.
*We base the number of portfolios on each separate series of the U.S. registered investment companies within the Franklin Templeton fund complex. These portfolios have a common investment manager or affiliated investment managers.
**Gregory E. Johnson is considered to be an interested person of the Fund under the federal securities laws due to his position as an officer and director of Franklin Resources, Inc. (Resources), which is the parent company of the Fund’s investment manager and distributor. Rupert H. Johnson, Jr. is considered to be an interested person of the Fund under the federal securities laws due to his position as an officer and director and major shareholder of Resources.
Note 1: Rupert H. Johnson, Jr. is the uncle of Gregory E. Johnson.
Note 2: Effective March 12, 2019, John B. Wilson ceased to be a trustee of the Trust.
Note 3: Officer information is current as of the date of this report. It is possible that after this date, information about officers may change.
The Sarbanes-Oxley Act of 2002 and Rules adopted by the Securities and Exchange Commission require the Fund to disclose whether the Fund’s Audit Committee includes at least one member who is an audit committee financial expert within the meaning of such Act and Rules. The Fund’s Board has determined that there is at least one such financial expert on the Audit Committee and has designated Mary C. Choksi as its audit committee financial expert. The Board believes that Ms. Choksi qualifies as such an expert in view of her extensive business background and experience. She currently serves as a director of Avis Budget Group, Inc. (2007-present) and formerly, Founder and Senior Advisor, Strategic Investment Group (1987 to 2017). Ms. Choksi has been a Member of the
FRANKLIN CUSTODIAN FUNDS
Fund’s Audit Committee since 2014. As a result of such background and experience, the Board believes that Ms. Choksi has acquired an understanding of generally accepted accounting principles and financial statements, the general application of such principles in connection with the accounting estimates, accruals and reserves, and analyzing and evaluating financial statements that present a breadth and level of complexity of accounting issues generally comparable to those of the Fund, as well as an understanding of internal controls and procedures for financial reporting and an understanding of audit committee functions. Ms. Choksi is an independent Board member as that term is defined under the relevant Securities and Exchange Commission Rules and Releases.
The Statement of Additional Information (SAI) includes additional information about the board members and is available, without charge, upon request. Shareholders may call (800) DIALBEN/342-5236 to request the SAI.
FRANKLIN CUSTODIAN FUNDS
FRANKLIN FOCUSED GROWTH FUND
Shareholder Information
Proxy Voting Policies and Procedures
The Fund’s investment manager has established Proxy Voting Policies and Procedures (Policies) that the Fund uses to determine how to vote proxies relating to portfolio securities. Shareholders may view the Fund’s complete Policies online at franklintempleton.com. Alternatively, shareholders may request copies of the Policies free of charge by calling the Proxy Group collect at (954)527-7678 or by sending a written request to: Franklin Templeton Companies, LLC, 300 S.E. 2nd Street, Fort Lauderdale, FL 33301, Attention: Proxy Group. Copies of the Fund’s proxy voting records are also made available online at franklintempleton.com and posted on the U.S. Securities and Exchange Commission’s website at sec.gov and reflect the most recent12-month period ended June 30.
Quarterly Statement of Investments
The Trust, on behalf of the Fund, files a complete statement of investments with the U.S. Securities and Exchange Commission for the first and third quarters for each fiscal year as an exhibit to its report on FormN-PORT. Shareholders may view the filed FormN-PORT by visiting the Commission’s website at sec.gov. The filed form may also be viewed and copied at the Commission’s Public Reference Room in Washington, DC. Information regarding the operations of the Public Reference Room may be obtained by calling(800) SEC-0330.
(a) The Registrant has adopted a code of ethics that applies to its principal executive officers and principal financial and accounting officer.
(c) N/A
(d) N/A
(f) Pursuant to Item 13(a)(1), the Registrant is attaching as an exhibit a copy of its code of ethics that applies to its principal executive officers and principal financial and accounting officer.
| Item 3. | Audit Committee Financial Expert. |
(a)(1) The Registrant has an audit committee financial expert serving on its audit committee.
(2) The audit committee financial expert is Mary C. Choksi and she is “independent” as defined under the relevant Securities and Exchange Commission Rules and Releases.
| Item 4. | Principal Accountant Fees and Services. |
(a) Audit Fees
The aggregate fees paid to the principal accountant for professional services rendered by the principal accountant for the audit of the registrant’s annual financial statements or for services that are normally provided by the principal accountant in connection with statutory and regulatory filings or engagements were $475,596 for the fiscal year ended September 30, 2019 and $571,475 for the fiscal year ended September 30, 2018.
(b) Audit-Related Fees
The aggregate fees paid to the principal accountant for assurance and related services rendered by the principal accountant to the registrant that are reasonably related to the performance of the audit of the registrant’s financial statements and are not reported under paragraph (a) of Item 4 were $9,399 for the fiscal year ended September 30, 2019 and $9,306 for the fiscal year ended September 30, 2018. The services for which these fees were paid included attestation services.
There were no fees paid to the principal accountant for assurance and related services rendered by the principal accountant to the registrant’s investment adviser and any entity controlling, controlled by or under common control with the investment adviser that provides ongoing services to the registrant that are reasonably related to the performance of the audit of their financial statements.
(c) Tax Fees
There were no fees paid to the principal accountant for professional services rendered by the principal accountant to the registrant for tax compliance, tax advice and tax planning.
The aggregate fees paid to the principal accountant for professional services rendered by the principal accountant to the registrant’s investment adviser and any entity controlling, controlled by or under common control with the investment adviser that provides ongoing services to the registrant for tax compliance, tax advice and tax planning were $20,000 for the fiscal year ended September 30, 2019 and $5,000 for the fiscal year ended September 30, 2018. The services for which these fees were paid included professional fees in connection with tax treatment of equipment lease transactions, professional fees in connection with an Indonesia withholding tax refund claim and tax consulting services related to the operating agreement and term sheet for the launch of a new fund.
(d) All Other Fees
The aggregate fees paid to the principal accountant for products and services rendered by the principal accountant to the registrant not reported in paragraphs (a)-(c) of Item 4 were $0 for the fiscal year ended September 30, 2019 and $39,976 for the fiscal year ended September 30, 2018. The services for which these fees were paid included review of materials provided to the fund Board in connection with the investment management contract renewal process.
The aggregate fees paid to the principal accountant for products and services rendered by the principal accountant to the registrant’s investment adviser and any entity controlling, controlled by or under common control with the investment adviser that provides ongoing services to the registrant not reported in paragraphs (a)-(c) of Item 4 were $114,908 for the fiscal year ended September 30, 2019 and $16,500 for the fiscal year ended September 30, 2018. The services for which these fees were paid included valuation services related to fair value engagement, the issuance of an Auditor’s Certificate for South Korean regulatory shareholders disclosures, benchmarking services in connection with the ICI TA Survey and assets under management certification.
(e) (1) The registrant’s audit committee is directly responsible for approving the services to be provided by the auditors, including:
(i)pre-approval of all audit and audit related services;
(ii)pre-approval of allnon-audit related services to be provided to the Fund by the auditors;
(iii)pre-approval of allnon-audit related services to be provided to the registrant by the auditors to the registrant’s investment adviser or to any entity that controls, is controlled by or is under common control with the registrant’s investment adviser and that provides ongoing services to the registrant where thenon-audit services relate directly to the operations or financial reporting of the registrant; and
(iv) establishment by the audit committee, if deemed necessary or appropriate, as an alternative to committeepre-approval of services to be provided by the auditors, as required by paragraphs (ii) and (iii) above, of policies and procedures to permit such services to bepre-approved by other means, such as through
establishment of guidelines or by action of a designated member or members of the committee; provided the policies and procedures are detailed as to the particular service and the committee is informed of each service and such policies and procedures do not include delegation of audit committee responsibilities, as contemplated under the Securities Exchange Act of 1934, to management; subject, in the case of (ii) through (iv), to any waivers, exceptions or exemptions that may be available under applicable law or rules.
(e) (2) None of the services provided to the registrant described in paragraphs (b)-(d) of Item 4 were approved by the audit committee pursuant to paragraph (c)(7)(i)(C) of Rule2-01 of regulationS-X.
(f) No disclosures are required by this Item 4(f).
(g) The aggregatenon-audit fees paid to the principal accountant for services rendered by the principal accountant to the registrant and the registrant’s investment adviser and any entity controlling, controlled by or under common control with the investment adviser that provides ongoing services to the registrant were $144,307 for the fiscal year ended September 30, 2019 and $70,782 for the fiscal year ended September 30, 2018.
(h) The registrant’s audit committee of the board has considered whether the provision ofnon-audit services that were rendered to the registrant’s investment adviser (not including anysub-adviser whose role is primarily portfolio management and is subcontracted with or overseen by another investment adviser), and any entity controlling, controlled by, or under common control with the investment adviser that provides ongoing services to the registrant that were notpre-approved pursuant to paragraph (c)(7)(ii) of Rule2-01 of RegulationS-X is compatible with maintaining the principal accountant’s independence.
| Item 5. | Audit Committee of Listed Registrants. N/A |
| Item 6. | Schedule of Investments. N/A |
| Item 7. | Disclosure of Proxy Voting Policies and Procedures forClosed-End Management Investment Companies. N/A |
| Item 8. | Portfolio Managers ofClosed-End Management Investment Companies. N/A |
| Item 9. | Purchases of Equity Securities byClosed-End Management Investment Company and Affiliated Purchasers. N/A |
| Item 10. | Submission of Matters to a Vote of Security Holders. |
There have been no changes to the procedures by which shareholders may recommend nominees to the Registrant’s Board of Trustees that would require disclosure herein.
| Item 11. | Controls and Procedures. |
(a)Evaluation of Disclosure Controls and Procedures. The Registrant maintains disclosure controls and procedures that are designed to provide reasonable assurance that information required to be disclosed in the Registrant’s filings under the Securities Exchange Act of 1934, as amended, and the Investment Company Act of 1940 is recorded, processed, summarized and reported within the periods specified in the rules and forms of the Securities and Exchange Commission. Such information is accumulated and communicated to the Registrant’s management, including its principal executive officer and principal financial officer, as appropriate, to allow timely decisions regarding required disclosure. The Registrant’s management, including the principal executive officer and the principal financial officer, recognizes that any set of controls and procedures, no matter how well designed and operated, can provide only reasonable assurance of achieving the desired control objectives.
Within 90 days prior to the filing date of this Shareholder Report onForm N-CSR, the Registrant had carried out an evaluation, under the supervision and with the participation of the Registrant’s management, including the Registrant’s principal executive officer and the Registrant’s principal financial officer, of the effectiveness of the design and operation of the Registrant’s disclosure controls and procedures. Based on such evaluation, the Registrant’s principal executive officer and principal financial officer concluded that the Registrant’s disclosure controls and procedures are effective.
(b)Changes in Internal Controls. There have been no changes in the Registrant’s internal control over financial reporting that occurred during the period covered by this report that has materially affected, or is reasonably likely to materially affect the internal control over financial reporting.
| Item 12. | Disclosure of Securities Lending Activities forClosed-End Management Investment Company. N/A |
(a)(1) Code of Ethics
(a)(2) Certifications pursuant to Section 302 of the Sarbanes-Oxley Act of 2002 of Matthew T. Hinkle, Chief Executive Officer - Finance and Administration, and Gaston Gardey, Chief Financial Officer and Chief Accounting Officer
(b) Certifications pursuant to Section 906 of the Sarbanes-Oxley Act of 2002 of Matthew T. Hinkle, Chief Executive Officer - Finance and Administration, and Gaston Gardey, Chief Financial Officer and Chief Accounting Officer
SIGNATURES
Pursuant to the requirements of the Securities Exchange Act of 1934 and the Investment Company Act of 1940, the registrant has duly caused this report to be signed on its behalf by the undersigned, thereunto duly authorized.
| | |
| FRANKLIN CUSTODIAN FUNDS |
| |
| By | | /S/ MATTHEW T. HINKLE |
| | Matthew T. Hinkle |
| | Chief Executive Officer - Finance and Administration |
| Date November 29, 2019 |
Pursuant to the requirements of the Securities Exchange Act of 1934 and the Investment Company Act of 1940, this report has been signed below by the following persons on behalf of the registrant and in the capacities and on the dates indicated.
| | |
| By | | /S/ MATTHEW T. HINKLE |
| | Matthew T. Hinkle |
| | Chief Executive Officer - Finance and Administration |
| Date November 29, 2019 |
| |
| By | | /S/ GASTON GARDEY |
| | Gaston Gardey |
| | Chief Financial Officer and Chief Accounting Officer |
| Date November 29, 2019 |