UNITED STATES
SECURITIES AND EXCHANGE COMMISSION
Washington, DC 20549
FORMN-CSR/A
CERTIFIED SHAREHOLDER REPORT OF REGISTERED
MANAGEMENT INVESTMENT COMPANIES
Investment Company Act file number811-00537
Franklin Custodian Funds
(Exact name of registrant as specified in charter)
One Franklin Parkway, San Mateo, CA 94403-1906
(Address of principal executive offices) (Zip code)
Craig S. Tyle, One Franklin Parkway, San Mateo, CA 94403-1906
(Name and address of agent for service)
Registrant’s telephone number, including area code: 650 312-2000
Date of fiscal year end: 9/30
Date of reporting period: 9/30/18
| Item 1. | Reports to Stockholders. |
| | |

| | Annual Report
and Shareholder Letter September 30, 2018 |
Sign up for electronic delivery at franklintempleton.com/edelivery
Franklin Templeton Investments
Why choose Franklin Templeton Investments?
Successful investing begins with ambition. And achievement only comes when you reach for it. That’s why we continually strive to deliver better outcomes for investors. No matter what your goals are, our deep, global investment expertise allows us to offer solutions that can help.
During our more than 70 years of experience, we’ve managed through all kinds of markets—up, down and those in between. We’re always preparing for what may come next. It’s because of this, combined with our strength as one of the world’s largest asset managers that we’ve earned the trust of millions of investors around the world.
Dear Fellow Shareholder:
The 12 months ended September 30, 2018, benefited from mostly upbeat economic data as corporate earnings increased, the U.S. job market continued to improve and the unemployment rate declined. Under new chairman Jerome Powell, the U.S. Federal Reserve (Fed) increased its federal funds rate by 0.25% in March, June and September 2018, after a 0.25% increase in December 2017, bringing the rate from 1.25% at the start of the period to 2.25% by period-end. In September, the Fed cited growing business investment and household spending as further evidence of strong economic growth. The Fed also stated that inflation remained near 2.00% and that longer-term inflation expectations had changed little. The 10-year U.S. Treasury yield began the period at 2.33% and ended the period at 3.05%.
Within this environment, U.S. stocks, as measured by the Standard & Poor’s 500® Index (S&P 500®), increased 17.91%,1 representing a change in this total return index level from 4,887.97 to 5,763.42.2 Investment-grade bonds, as measured by the Bloomberg Barclays U.S. Aggregate Bond Index, decreased 1.22%,1 representing a change in this total return index level from 2,038.46 to 2,013.67.3
We are committed to our long-term perspective and disciplined investment approach as we conduct a rigorous, fundamental analysis of securities with a regular emphasis on investment risk management.
We believe active, professional investment management serves investors well. We also recognize the important role of financial advisors in today’s markets and encourage investors to continue to seek their advice. Amid changing markets and economic conditions, we are confident investors with a well-diversified portfolio and a patient, long-term outlook should be well positioned for the years ahead.
Franklin Custodian Funds’ annual report, covering Franklin DynaTech Fund, Franklin Growth Fund, Franklin Income Fund, Franklin U.S. Government Securities Fund and Franklin Utilities Fund, includes more detail about prevailing conditions and a discussion about investment decisions during the period. Please remember all securities markets fluctuate, as do mutual fund share prices.
1. Source: Morningstar.
2. Source: Copyright© 2018, S&P Dow Jones Indices LLC. All rights reserved. The index levels for the S&P 500 shown above are based on total returns, which include reinvestment of any income or distributions.
3. Source: Bloomberg Barclays Indices. The index levels for the Bloomberg Barclays U.S. Aggregate Bond Index shown above are based on total returns, which include reinvestment of any income or distributions.
The indexes are unmanaged and include reinvestment of any income or distributions.
See www.franklintempletondatasources.com for additional data provider information.
|
Not FDIC Insured | May Lose Value | No Bank Guarantee |
| | | | |
| | | |
| franklintempleton.com | | Not part of the annual report | | 1 |
We thank you for investing with Franklin Templeton, welcome your questions and comments, and look forward to serving your future investment needs.
Sincerely,

Rupert H. Johnson, Jr.
Chairman
Franklin Custodian Funds
This letter reflects our analysis and opinions as of September 30, 2018, unless otherwise indicated. The information is not a complete analysis of every aspect of any market, country, industry, security or fund. Statements of fact are from sources considered reliable.
Contents
Visitfranklintempleton.com for fund updates, to access your account, or to find helpful financial planning tools.
| | | | |
| | | |
2 | | Not part of the annual report | | franklintempleton.com |
Annual Report
Economic and Market Overview
The U.S. economy grew during the 12 months under review. The economy grew faster in 2018’s second quarter, driven by consumer spending, business investment, exports and government spending, but moderated in the third quarter due to declines in exports and housing investment. The manufacturing and services sectors expanded during the period. The unemployment rate declined from 4.2% in September 2017, as reported at the beginning of the 12-month period, to a nearly 49-year low of 3.7% at period-end.1 Annual inflation, as measured by the Consumer Price Index, increased from 2.2% in September 2017, as reported at the beginning of the period, to 2.3% at period-end.1
The U.S. Federal Reserve (Fed) began reducing its balance sheet in October 2017 as part of an ongoing effort to normalize its monetary policy. At its December 2017 meeting, the Fed raised its target range for the federal funds rate 0.25%. In his congressional testimonies in February and July 2018, as well as at the Fed symposium in August, Fed Chair Jerome Powell reiterated the Fed’s intention to gradually raise interest rates. As widely expected, the Fed further raised its target range for the federal funds rate 0.25% each at its March, June and September 2018 meetings, to 2.00%–2.25%. At its September meeting, the Fed raised its forecast for U.S. economic growth in 2018 and 2019 and projected one more rate increase in 2018.
U.S. equity markets rose overall during the period, benefiting from mostly upbeat economic data and better U.S. corporate earnings. Markets were also supported by the expectations of gradual rate increases and the passage of the U.S. tax reform bill. After reaching record highs in January 2018, U.S. stocks declined amid concerns that strong economic growth and rising inflation would lead the Fed to increase its target rate faster than expected, as well as fears of tighter regulation of information technology and technology-related companies. Other factors that curbed investor sentiment included tensions between the U.S. and North Korea at certain times during the period, political uncertainties in the U.S., the Trump administration’s protectionist policies and escalating trade tensions between the U.S. and China. Partially offsetting these concerns were an overall easing of tensions in the Korean peninsula in the latter part of the period, intermittent U.S.-China trade negotiations, an agreement between the U.S. and the European Union to try to reduce trade barriers and a
trade deal between the U.S. and Mexico that Canada joined at period-end. In this environment, the broad U.S. stock market, as measured by the Standard & Poor’s® 500 Index, reached a new all-time high in September and generated a +17.91% total return for the 12-month period.2
The foregoing information reflects our analysis and opinions as of September 30, 2018. The information is not a complete analysis of every aspect of any market, country, industry, security or fund. Statements of fact are from sources considered reliable.
1. Source: Bureau of Labor Statistics.
2. Source: Morningstar.
See www.franklintempletondatasources.com for additional data provider information.
| | | | |
| | | |
| franklintempleton.com | | Annual Report | | 3 |
Franklin DynaTech Fund
We are pleased to bring you Franklin DynaTech Fund’s annual report for the fiscal year ended September 30, 2018.
Your Fund’s Goal and Main Investments
The Fund seeks capital appreciation by investing primarily in equity securities of companies that emphasize innovation and new technologies, have superior management and that benefit from new industry conditions in the dynamically changing global economy.
Performance Overview
The Fund’s Class A shares delivered a +30.88% cumulative total return for the 12 months under review. In comparison, the Russell 1000® Growth Index, which measures performance of the largest companies in the Russell 3000® Index with higher price-to-book ratios and higher forecasted growth values, generated a total return of +26.30%.1 Also for comparison, the broad U.S. stock market as measured by the Standard & Poor’s 500 Index (S&P 500®), produced a +17.91% return.1 You can find the Fund’s long-term performance data in the Performance Summary beginning on page 7.
Performance data represent past performance, which does not guarantee future results. Investment return and principal value will fluctuate, and you may have a gain or loss when you sell your shares. Current performance may differ from figures shown. For most recent month-end performance, go tofranklintempleton.comor call (800) 342-5236.
Investment Strategy
We use fundamental, bottom-up research to seek companies meeting our criteria of growth potential, quality and valuation. In seeking sustainable growth characteristics, we look for companies we believe can produce sustainable earnings and cash flow growth, evaluating the long-term market opportunity and competitive structure of an industry to target leaders and emerging leaders. We define quality companies as those with strong and improving competitive positions in attractive markets. We also believe important attributes of quality are
experienced and talented management teams as well as financial strength reflected in the capital structure, gross and operating margins, free cash flow generation and returns on capital employed. Our valuation analysis includes a range of potential outcomes based on an assessment of multiple scenarios. In assessing value, we consider whether security prices fully reflect the balance of the sustainable growth opportunities relative to business and financial risks.
We may invest in companies in any economic sector or of any market capitalization and may invest in companies both inside and outside of the U.S. Although we search for investments across a large number of sectors, we expect to have significant positions in particular sectors including, for example, technology and health care.
Manager’s Discussion
During the reporting period, most investment sectors contributed to absolute performance, notably information technology (IT), consumer discretionary and health care.2 In the IT sector, payment technology company Mastercard benefited results. The company reported strong quarterly revenues that exceeded consensus expectations. In addition, it increased its 2018 revenue guidance and announced several growth initiatives. Digital marketing and media company Adobe Systems also benefited results. Salesforce.com, which provides cloud-based enterprise software for customer relationship management, also contributed to Fund performance.
In the consumer discretionary sector, online retail shopping and cloud services provider Amazon.com benefited results as it reported better-than-expected revenue and operating profits in the first quarter of 2018. Highlights included accelerating growth at its market-leading cloud business Amazon Web Services (AWS), as well as retail strength driven by advertising and its Prime service. Improved utilization in its fulfillment and data centers drove margins higher for the period, while the mix shift toward higher margin businesses continued to drive higher profitability over time. With e-commerce in its early days, we
1. Source: Morningstar.
The indexes are unmanaged and include reinvestment of any income or distributions. They do not reflect any fees, expenses or sales charges. One cannot invest directly in an index, and an index is not representative of the Fund’s portfolio.
Frank Russell Company is the source and owner of the trademarks, service marks and copyrights related to the Russell Indexes. Russell® is a trademark of Frank Russell Company.
2. The information technology sector comprises communications equipment; electronic equipment, instruments and components; IT services; semiconductors and semiconductor equipment; software; and technology hardware, storage and peripherals in the SOI. The consumer discretionary sector comprises diversified consumer services; internet and direct marketing retail; and textiles, apparel and luxury goods in the SOI. The health care sector comprises biotechnology, health care equipment and supplies, health care providers and services, health care technology, life sciences tools and services, and pharmaceuticals in the SOI.
The dollar value, number of shares or principal amount, and names of all portfolio holdings are listed in the Fund’s Statement of Investments (SOI).
The SOI begins on page 45.
| | | | |
| | | |
4 | | Annual Report | | franklintempleton.com |
FRANKLIN DYNATECH FUND
do not underestimate the growth and sustainability of Amazon.com, which continues to add new categories and countries to its footprint. The company also continues to see accelerated growth in AWS, which we consider a leader in Infrastructure-as-a-Service cloud computing.
In the health care sector, veterinary products and services provider IDEXX Laboratories was the sector’s largest contributor to Fund results. Other contributors included Veeva Systems, a software provider for the life sciences industry, and UnitedHealth Group, a diversified managed care company.
In contrast, the energy sector detracted from the Fund’s absolute performance during the period.3 Schlumberger, a company that provides project management solutions to the international oil and gas exploration and production industries, detracted from performance.4
Individual holdings that detracted from the Fund’s performance included Celgene,4 Regeneron Pharmaceuticals and Liberty Broadband. Biopharmaceutical company Celgene’s application to the U.S. Food and Drug Administration for Ozanimod, a new drug to treat multiple sclerosis and inflammatory bowel disease, was rejected during the period. In addition, concerns over patent expirations in coming years dampened investor sentiment. Shares of Regeneron, a protein-engineering biopharmaceutical company, declined after it discontinued phase 3 trials for its combination eye disease therapy due to unfavorable results. Further pressuring sales were investor concerns about encouraging developmental data from two direct competitors to its primary product Eylea, an engineered protein used in treating retinal disorders. Liberty is a holding company whose subsidiaries include Charter Communications, a broadband communications services provider. Despite solid first-quarter revenues, Charter’s shares fell, largely due to deteriorating subscriber trends following better results in the prior quarter, a lack of free cash flow generation, and a delay in material improvements amid ongoing competition and industry challenges.
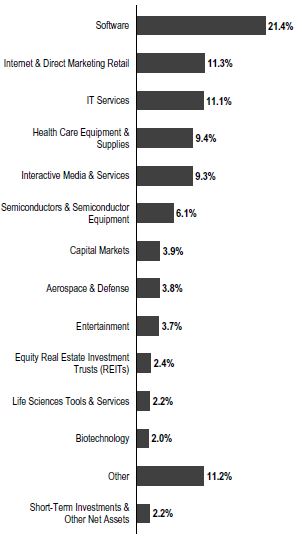
Portfolio Composition
Based on Total Net Assets as of 9/30/18
3. No energy sector companies held at period-end.
4. Not held at period-end.
See www.franklintempletondatasources.com for additional data provider information.
| | | | |
| | | |
| franklintempleton.com | | Annual Report | | 5 |
FRANKLIN DYNATECH FUND
Top 10 Holdings
9/30/18
| | |
Company Sector/Industry | | % of Total Net Assets |
| |
Amazon.com Inc. Internet & Direct Marketing Retail | | 7.3% |
| |
Alphabet Inc. Interactive Media & Services | | 4.6% |
| |
Microsoft Corp. Software | | 3.4% |
| |
Mastercard Inc. IT Services | | 3.3% |
| |
Facebook Inc. Interactive Media & Services | | 2.4% |
| |
Salesforce.com Inc. Software | | 2.3% |
| |
Visa Inc. IT Services | | 2.2% |
| |
Adobe Systems Inc. Software | | 2.0% |
| |
NVIDIA Corp. Semiconductors & Semiconductor Equipment | | 1.8% |
| |
ServiceNow Inc. Software | | 1.7% |
Thank you for your continued participation in Franklin DynaTech Fund. We look forward to serving your future investment needs.
| | |

| | 
Matthew J. Moberg, CPA |
 | | 
Rupert H. Johnson, Jr. Portfolio Management Team |
|
The foregoing information reflects our analysis, opinions and portfolio holdings as of September 30, 2018, the end of the reporting period. The way we implement our main investment strategies and the resulting portfolio holdings may change depending on factors such as market and economic conditions. These opinions may not be relied upon as investment advice or an offer for a particular security. The information is not a complete analysis of every aspect of any market, country, industry, security or the Fund. Statements of fact are from sources considered reliable, but the investment manager makes no representation or warranty as to their completeness or accuracy. Although historical performance is no guarantee of future results, these insights may help you understand our investment management philosophy.
| | | | |
| | | |
6 | | Annual Report | | franklintempleton.com |
FRANKLIN DYNATECH FUND
Performance Summary as of September 30, 2018
The performance table and graphs do not reflect any taxes that a shareholder would pay on Fund dividends, capital gain distributions, if any, or any realized gains on the sale of Fund shares. Total return reflects reinvestment of the Fund’s dividends and capital gain distributions, if any, and any unrealized gains or losses. Your dividend income will vary depending on dividends or interest paid by securities in the Fund’s portfolio, adjusted for operating expenses of each class. Capital gain distributions are net profits realized from the sale of portfolio securities.
Performance as of 9/30/181
Cumulative total return excludes sales charges. Average annual total return includes maximum sales charges. Sales charges will vary depending on the size of the investment and the class of share purchased. The maximum is 5.50% and the minimum is 0%.Class A: 5.50% maximum initial sales charge;Advisor Class: no sales charges. For other share classes, visitfranklintempleton.com.
| | | | | | |
| Share Class | | Cumulative Total Return2 | | | | Average Annual Total Return3 |
| | | |
A4 | | | | | | |
1-Year | | +30.88% | | | | +23.68% |
5-Year | | +124.31% | | | | +16.21% |
10-Year | | +327.46% | | | | +14.98% |
| | | |
Advisor | | | | | | |
1-Year | | +31.21% | | | | +31.21% |
5-Year | | +127.13% | | | | +17.83% |
10-Year | | +338.12% | | | | +15.92% |
Performance data represent past performance, which does not guarantee future results. Investment return and principal value will fluctuate, and you may have a gain or loss when you sell your shares. Current performance may differ from figures shown. For most recent month-end performance, go tofranklintempleton.com or call(800) 342-5236.
See page 9 for Performance Summary footnotes.
| | | | |
| | | |
| franklintempleton.com | | Annual Report | | 7 |
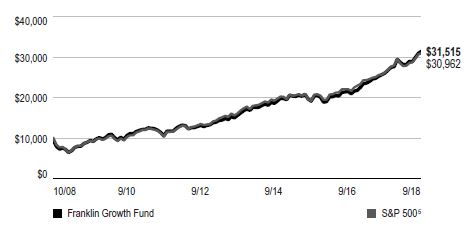
FRANKLIN DYNATECH FUND
PERFORMANCE SUMMARY
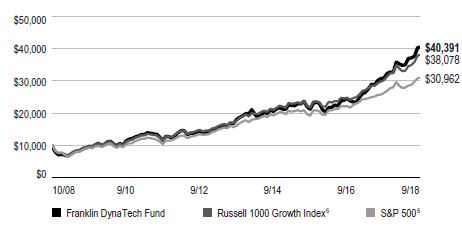
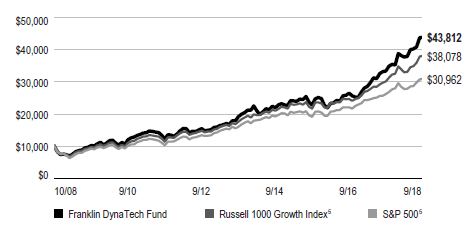
Total Return Index Comparison for a Hypothetical $10,000 Investment1
Total return represents the change in value of an investment over the periods shown. It includes any applicable maximum sales charge, Fund expenses, account fees and reinvested distributions. The unmanaged indexes include reinvestment of any income or distributions. They differ from the Fund in composition and do not pay management fees or expenses. One cannot invest directly in an index.
Class A(10/1/08–9/30/18)
Advisor Class(10/1/08–9/30/18)
See page 9 for Performance Summary footnotes.
| | | | |
| | | |
8 | | Annual Report | | franklintempleton.com |
FRANKLIN DYNATECH FUND
PERFORMANCE SUMMARY
Distributions(10/1/17–9/30/18)
| | | | |
| Share Class | | Long-Term Capital Gain | |
| |
| A | | | $1.1554 | |
| C | | | $1.1554 | |
| R | | | $1.1554 | |
| R6 | | | $1.1554 | |
| Advisor | | | $1.1554 | |
Total Annual Operating Expenses6
| | | | | | |
| Share Class | | With Waiver | | | | Without Waiver |
| | | |
| A | | 0.89% | | | | 0.90% |
| Advisor | | 0.64% | | | | 0.65% |
Each class of shares is available to certain eligible investors and has different annual fees and expenses, as described in the prospectus.
All investments involve risks, including possible loss of principal. Stocks historically have outperformed other asset classes over the long term, but tend to fluctuate more dramatically over the short term. Investments in fast-growing industries, like the technology and health care sectors (which have historically been volatile) could result in increased price fluctuation, especially over the short term, due to the rapid pace of product change and development and changes in government regulation of companies emphasizing scientific or technological advancement or regulatory approval for new drugs and medical instruments. The Fund may also invest in small- and mid-capitalization companies, which can be particularly sensitive to changing economic conditions, and their prospects for growth are less certain than those of larger, more established companies. The Fund is actively managed but there is no guarantee that the manager’s investment decisions will produce the desired results. The Fund’s prospectus also includes a description of the main investment risks.
1. The Fund has a fee waiver associated with any investment it makes in a Franklin Templeton money fund and/or other Franklin Templeton fund, contractually guaranteed through 1/31/19. Fund investment results reflect the fee waiver; without this waiver, the results would have been lower.
2. Cumulative total return represents the change in value of an investment over the periods indicated.
3. Average annual total return represents the average annual change in value of an investment over the periods indicated. Return for less than one year, if any, has not been annualized.
4. Prior to 9/10/18, these shares were offered at a higher initial sales charge of 5.75%, thus actual returns would have differed. Total returns with sales charges have been restated to reflect the current maximum initial sales charge of 5.50%.
5. Source: Morningstar. The Russell 1000 Growth Index is market capitalization-weighted and measures performance of those Russell 1000 Index companies with higher price-to-book ratios and higher forecasted growth values. The S&P 500 is a market capitalization-weighted index of 500 stocks designed to measure total U.S. equity market performance.
6. Figures are as stated in the Fund’s current prospectus and may differ from the expense ratios disclosed in the Your Fund’s Expenses and Financial Highlights sections in this report. In periods of market volatility, assets may decline significantly, causing total annual Fund operating expenses to become higher than the figures shown.
See www.franklintempletondatasources.com for additional data provider information.
| | | | |
| | | |
| franklintempleton.com | | Annual Report | | 9 |
FRANKLIN DYNATECH FUND
Your Fund’s Expenses
As a Fund shareholder, you can incur two types of costs: (1) transaction costs, including sales charges (loads) on Fund purchases and redemptions; and (2) ongoing Fund costs, including management fees, distribution and service (12b-1) fees, and other Fund expenses. All mutual funds have ongoing costs, sometimes referred to as operating expenses. The table below shows ongoing costs of investing in the Fund and can help you understand these costs and compare them with those of other mutual funds. The table assumes a $1,000 investment held for the six months indicated.
Actual Fund Expenses
The table below provides information about actual account values and actual expenses in the columns under the heading “Actual.” In these columns the Fund’s actual return, which includes the effect of Fund expenses, is used to calculate the “Ending Account Value” for each class of shares. You can estimate the expenses you paid during the period by following these steps (of course, your account value and expenses will differ from those in this illustration): Divide your account value by $1,000 (if your account had an $8,600 value, then $8,600 ÷ $1,000 = 8.6). Then multiply the result by the number in the row for your class of shares under the headings “Actual” and “Expenses Paid During Period” (if Actual Expenses Paid During Period were $7.50, then 8.6 x $7.50 = $64.50). In this illustration, the actual expenses paid this period are $64.50.
Hypothetical Example for Comparison with Other Funds
Under the heading “Hypothetical” in the table, information is provided about hypothetical account values and hypothetical expenses based on the Fund’s actual expense ratio and an assumed rate of return of 5% per year before expenses, which is not the Fund’s actual return. This information may not be used to estimate the actual ending account balance or expenses you paid for the period, but it can help you compare ongoing costs of investing in the Fund with those of other funds. To do so, compare this 5% hypothetical example for the class of shares you hold with the 5% hypothetical examples that appear in the shareholder reports of other funds.
Please note that expenses shown in the table are meant to highlight ongoing costs and do not reflect any transactional costs. Therefore, information under the heading “Hypothetical” is useful in comparing ongoing costs only, and will not help you compare total costs of owning different funds. In addition, if transactional costs were included, your total costs would have been higher.
| | | | | | | | | | | | |
| | | | | Actual (actual return after expenses) | | Hypothetical (5% annual return before expenses) | | |
| | | | | | | | |
Share
Class | | Beginning Account Value 4/1/18 | | Ending Account Value 9/30/18 | | Expenses Paid During Period 4/1/18–9/30/181,2 | | Ending Account Value 9/30/18 | | Expenses Paid During Period 4/1/18–9/30/181,2 | | Net
Annualized
Expense
Ratio2 |
| | | | | | |
A | | $1,000 | | $1,160.90 | | $4.60 | | $1,020.81 | | $4.31 | | 0.85% |
C | | $1,000 | | $1,156.50 | | $8.65 | | $1,017.05 | | $8.09 | | 1.60% |
R | | $1,000 | | $1,159.50 | | $5.95 | | $1,019.55 | | $5.57 | | 1.10% |
R6 | | $1,000 | | $1,162.70 | | $2.71 | | $1,022.56 | | $2.54 | | 0.50% |
Advisor | | $1,000 | | $1,162.30 | | $3.25 | | $1,022.06 | | $3.04 | | 0.60% |
1. Expenses are equal to the annualized expense ratio for the six-month period as indicated above—in the far right column—multiplied by the simple average account value over the period indicated, and then multiplied by 183/365 to reflect the one-half year period.
2. Reflects expenses after fee waivers and expense reimbursements. Does not include acquired fund fees and expenses.
| | | | |
| | | |
10 | | Annual Report | | franklintempleton.com |
Franklin Growth Fund
We are pleased to bring you Franklin Growth Fund’s annual report for the fiscal year ended September 30, 2018.
Your Fund’s Goal and Main Investments
The Fund seeks capital appreciation by investing substantially in equity securities of companies that are leaders in their industries.
Performance Overview
The Fund’s Class A shares delivered a +20.72% cumulative total return for the 12 months under review. In comparison, the Standard & Poor’s 500 Index (S&P 500), which is a broad measure of U.S. stock performance, had a +17.91% total return.1 You can find the Fund’s long-term performance data in the Performance Summary beginning on page 14.
Performance data represent past performance, which does not guarantee future results. Investment return will fluctuate. Current performance may differ from figures shown. For most recent month-end performance, go tofranklintempleton.com or call(800) 342-5236.
Investment Strategy
We use fundamental, bottom-up research to seek companies meeting our criteria of growth potential, quality and valuation. In seeking sustainable growth characteristics, we look for companies we believe can produce sustainable earnings and cash flow growth, evaluating the long-term market opportunity and competitive structure of an industry to target leaders and emerging leaders. We define quality companies as those with strong and improving competitive positions in attractive markets. We also believe important attributes of quality are experienced and talented management teams as well as financial strength reflected in the capital structure, gross and operating margins, free cash flow generation and returns on capital employed. Our valuation analysis includes a range of potential outcomes based on an assessment of multiple scenarios. In assessing value, we consider whether security prices fully reflect the balance of the sustainable growth opportunities relative to business and financial risks.
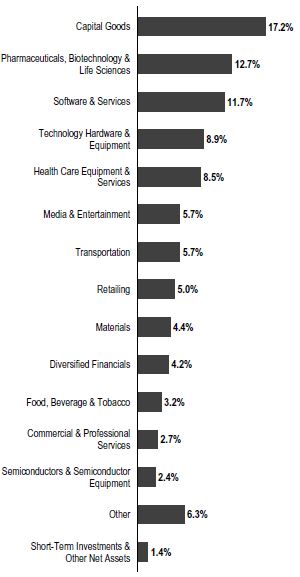
Portfolio Composition
Based on Total Net Assets as of 9/30/18
Manager’s Discussion
Franklin Growth Fund owned shares of 136 companies at period-end. We continue to invest in a broad array of companies of all sizes and in varied industries.
During the period under review, all sectors contributed to absolute performance, notably information technology (IT),
1. Source: Morningstar.
The index is unmanaged and includes reinvestment of any income or distributions. It does not reflect any fees, expenses or sales charges. One cannot invest directly in an index, and an index is not representative of the Fund’s portfolio.
The dollar value, number of shares or principal amount, and names of all portfolio holdings are listed in the Fund’s Statement of Investments (SOI).
The SOI begins on page 55.
| | | | |
| | | |
| franklintempleton.com | | Annual Report | | 11 |
FRANKLIN GROWTH FUND
Top 10 Holdings
9/30/18
| | |
Company Sector/Industry | | % of Total Net Assets |
| |
Apple Inc. Technology Hardware & Equipment | | 5.6% |
| |
Amazon.com Inc. Retailing | | 4.2% |
| |
The Boeing Co. Capital Goods | | 2.5% |
| |
Microsoft Corp. Software & Services | | 2.4% |
| |
Alphabet Inc. Media & Entertainment | | 2.4% |
| |
Northrop Grumman Corp. Capital Goods | | 2.1% |
| |
Union Pacific Corp. Transportation | | 2.0% |
| |
Mastercard Inc. Software & Services | | 1.9% |
| |
Mettler-Toledo International Inc. Pharmaceuticals, Biotechnology & Life Sciences | | 1.6% |
| |
Intuitive Surgical Inc. Health Care Equipment & Services | | 1.6% |
health care and industrials.2 In the IT sector, software and equipment company Apple reported a solid fiscal second quarter, supported by strong growth in services, and it issued guidance for its fiscal third quarter that was above consensus expectations. Near period-end, the company revealed its latest lineup of products, which included new Apple Watch and iPhone models. Analysts believe that consumers waiting for a larger iPhone would buy the new iPhone XS Max despite its record-high price. Software and services firm Microsoft benefited absolute performance due to demand for its suite of office and cloud-based products, as well as its cloud services. The company is a beneficiary of healthy levels of corporate spending for the IT services industry. At period-end, Microsoft issued a positive quarterly outlook that disclosed the company’s revenue growth was slightly ahead of consensus forecasts. The company expected its cloud products to continue to deliver strong growth. Other contributors in the sector included payment technology company Mastercard.
In health care, medical device developers Intuitive Surgical and Illumina boosted Fund results. In the industrials sector,
aerospace manufacturer Boeing and railroad company Union Pacific were strong contributors to Fund performance.
Online retail shopping and cloud services provider Amazon.com was a strong individual contributor. The company benefited results as it reported better-than-expected revenue and operating profits in the first quarter of 2018. Highlights included accelerating growth at its market-leading cloud business Amazon Web Services (AWS), as well as retail strength driven by advertising and its Prime service. Improved utilization in its fulfillment and data centers drove margins higher for the period, while the mix shift toward higher margin businesses continued to drive higher profitability over time. With e-commerce in its early days, we do not underestimate the growth and sustainability of Amazon.com, which continues to add new categories and countries to its footprint. The company also continues to see accelerated growth in AWS, which we consider a leader in Infrastructure-as-a-Service cloud computing.
Although the Fund had no sector detractors, some holdings detracted from absolute performance, including Celgene, General Electric (GE), Alaska Air Group, Allergan and Albemarle. Biopharmaceuticals company Celgene’s application to the U.S. Food and Drug Administration for Ozanimod, a new drug to treat multiple sclerosis and inflammatory bowel disease, was rejected during the period. In addition, concerns over patent expirations in coming years dampened investor sentiment. Shares of Regeneron, a protein-engineering biopharmaceutical company, declined after it discontinued phase 3 trials for its combination eye disease therapy due to unfavorable results. Further pressuring sales were investor concerns about encouraging developmental data from two direct competitors to its primary product Eylea, an engineered protein used in treating retinal disorders.
In January 2018, GE announced a greater-than-expected $6.2 billion after-tax charge related to its insurance subsidiary at GE Capital. Management also moved ahead with what amounts to a breakup of GE. In May 2018, the company announced the merger of its transportation operations into Wabtec3, and in June 2018 it announced a plan to spin off its health care division and divest its stake in oil-services firm Baker Hughes.3 Once completed, we believe the moves will streamline GE and enable the company to reduce debt and build
2. The IT sector comprises semiconductors and semiconductor equipment, software and services, and technology hardware and equipment in the SOI. The health care sector comprises health care equipment and services and pharmaceuticals, biotechnology and life sciences in the SOI. The industrials sector comprises capital goods, commercial and professional services, and transportation in the SOI.
3. Not a Fund holding.
See www.franklintempletondatasources.com for additional data provider information.
| | | | |
| | | |
12 | | Annual Report | | franklintempleton.com |
FRANKLIN GROWTH FUND
up a cash buffer, as well as help management better focus on its key aviation, power and renewable energy divisions.
Air transportation services company Alaska Air Group, the holding company for Alaska Airlines and Horizon Air Industries, reported that although its first quarter earnings were slightly ahead of consensus estimates, they were down from the previous year. Also, the company stated that it expected its capacity growth level to moderate in its second quarter, underperforming its previous guidance.
Thank you for your participation in Franklin Growth Fund. We look forward to serving your future investment needs.
| | |
 | | 
Serena Perin Vinton, CFA |
| |
| | John Anderson |
| | Robert Rendler, CFA |
| |
| | Portfolio Management Team |
The foregoing information reflects our analysis, opinions and portfolio holdings as of September 30, 2018, the end of the reporting period. The way we implement our main investment strategies and the resulting portfolio holdings may change depending on factors such as market and economic conditions. These opinions may not be relied upon as investment advice or an offer for a particular security. The information is not a complete analysis of every aspect of any market, country, industry, security or the Fund. Statements of fact are from sources considered reliable, but the investment manager makes no representation or warranty as to their completeness or accuracy. Although historical performance is no guarantee of future results, these insights may help you understand our investment management philosophy.
CFA® is a trademark owned by CFA Institute.
| | | | |
| | | |
| franklintempleton.com | | Annual Report | | 13 |
FRANKLIN GROWTH FUND
Performance Summary as of September 30, 2018
The performance table and graphs do not reflect any taxes that a shareholder would pay on Fund dividends, capital gain distributions, if any, or any realized gains on the sale of Fund shares. Total return reflects reinvestment of the Fund’s dividends and capital gain distributions, if any, and any unrealized gains or losses. Your dividend income will vary depending on dividends or interest paid by securities in the Fund’s portfolio, adjusted for operating expenses of each class. Capital gain distributions are net profits realized from the sale of portfolio securities.
Performance as of 9/30/181
Cumulative total return excludes sales charges. Average annual total return includes maximum sales charges. Sales charges will vary depending on the size of the investment and the class of share purchased. The maximum is 5.50% and the minimum is 0%.Class A: 5.50% maximum initial sales charge;Advisor Class: no sales charges. For other share classes, visitfranklintempleton.com.
| | | | |
| Share Class | | Cumulative
Total Return2 | | Average Annual
Total Return3 |
| | |
A4 | | | | |
1-Year | | +20.72% | | +14.08% |
5-Year | | +101.75% | | +13.78% |
10-Year | | +233.46% | | +12.16% |
| | |
Advisor | | | | |
1-Year | | +21.02% | | +21.02% |
5-Year | | +104.29% | | +15.36% |
10-Year | | +241.95% | | +13.08% |
Performance data represent past performance, which does not guarantee future results. Investment return and principal value will fluctuate, and you may have a gain or loss when you sell your shares. Current performance may differ from figures shown. For most recent month-end performance, go tofranklintempleton.com or call(800) 342-5236.
See page 16 for Performance Summary footnotes.
| | | | |
| | | |
14 | | Annual Report | | franklintempleton.com |
FRANKLIN GROWTH FUND
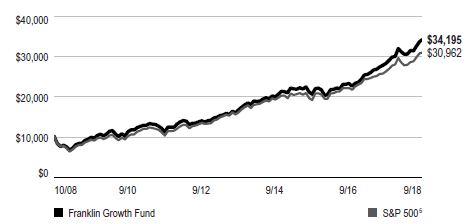
PERFORMANCE SUMMARY
Total Return Index Comparison for a Hypothetical $10,000 Investment1
Total return represents the change in value of an investment over the periods shown. It includes any applicable maximum sales charge, Fund expenses, account fees and reinvested distributions. The unmanaged index includes reinvestment of any income or distributions. It differs from the Fund in composition and does not pay management fees or expenses. One cannot invest directly in an index.
Class A(10/1/08–9/30/18)
Advisor Class(10/1/08–9/30/18)
See page 16 for Performance Summary footnotes.
| | | | |
| | | |
| franklintempleton.com | | Annual Report | | 15 |
FRANKLIN GROWTH FUND
PERFORMANCE SUMMARY
Distributions(10/1/17–9/30/18)
| | | | | | | | |
| Share Class | | Net Investment
Income | | | Long-Term
Capital Gain | | Total |
A | | $ | 0.3618 | | | $2.2538 | | $2.6156 |
| C | | $ | — | | | $2.2538 | | $2.2538 |
| R | | $ | 0.1304 | | | $2.2538 | | $2.3842 |
| R6 | | $ | 0.7359 | | | $2.2538 | | $2.9897 |
| Advisor | | $ | 0.5853 | | | $2.2538 | | $2.8391 |
Total Annual Operating Expenses6 | | | | | |
| Share Class | | With Waiver | | | Without Waiver | | |
A | | | 0.87% | | | 0.88% | | |
| Advisor | | | 0.62% | | | 0.63% | | |
Each class of shares is available to certain eligible investors and has different annual fees and expenses, as described in the prospectus.
All investments involve risks, including possible loss of principal. Historically, the Fund has focused on larger companies. The Fund may also invest in small, relatively new and/or unseasoned companies, which involves additional risks, as the price of these securities can be volatile, particularly over the short term. The Fund may focus on particular sectors of the market from time to time, which can carry greater risks of adverse developments in such sectors. In addition, the Fund may invest up to 40% of its net assets in stocks of foreign companies, which involve special risks, including currency fluctuations and economic as well as political uncertainty. The Fund is actively managed but there is no guarantee that the manager’s investment decisions will produce the desired results. The Fund’s prospectus also includes a description of the main investment risks.
1. The Fund has a fee waiver associated with any investment it makes in a Franklin Templeton money fund and/or other Franklin Templeton fund, contractually guaranteed through 1/31/19. Fund investment results reflect the fee waiver; without this waiver, the results would have been lower.
2. Cumulative total return represents the change in value of an investment over the periods indicated.
3. Average annual total return represents the average annual change in value of an investment over the periods indicated. Return for less than one year, if any, has not been annualized.
4. Prior to 9/10/18, these shares were offered at a higher initial sales charge of 5.75%, thus actual returns would have differed. Total returns with sales charges have been restated to reflect the current maximum initial sales charge of 5.50%.
5. Source: Morningstar. The S&P 500 is a market capitalization-weighted index of 500 stocks designed to measure total U.S. equity market performance.
6. Figures are as stated in the Fund’s current prospectus and may differ from the expense ratios disclosed in the Your Fund’s Expenses and Financial Highlights sections in this report. In periods of market volatility, assets may decline significantly, causing total annual Fund operating expenses to become higher than the figures shown.
See www.franklintempletondatasources.com for additional data provider information.
| | | | |
| | | |
16 | | Annual Report | | franklintempleton.com |
FRANKLIN GROWTH FUND
Your Fund’s Expenses
As a Fund shareholder, you can incur two types of costs: (1) transaction costs, including sales charges (loads) on Fund purchases and redemptions; and (2) ongoing Fund costs, including management fees, distribution and service (12b-1) fees, and other Fund expenses. All mutual funds have ongoing costs, sometimes referred to as operating expenses. The table below shows ongoing costs of investing in the Fund and can help you understand these costs and compare them with those of other mutual funds. The table assumes a $1,000 investment held for the six months indicated.
Actual Fund Expenses
The table below provides information about actual account values and actual expenses in the columns under the heading “Actual.” In these columns the Fund’s actual return, which includes the effect of Fund expenses, is used to calculate the “Ending Account Value” for each class of shares. You can estimate the expenses you paid during the period by following these steps (of course, your account value and expenses will differ from those in this illustration): Divide your account value by $1,000 (if your account had an $8,600 value, then $8,600 ÷ $1,000 = 8.6). Then multiply the result by the number in the row for your class of shares under the headings “Actual” and “Expenses Paid During Period” (if Actual Expenses Paid During Period were $7.50, then 8.6 x $7.50 = $64.50). In this illustration, the actual expenses paid this period are $64.50.
Hypothetical Example for Comparison with Other Funds
Under the heading “Hypothetical” in the table, information is provided about hypothetical account values and hypothetical expenses based on the Fund’s actual expense ratio and an assumed rate of return of 5% per year before expenses, which is not the Fund’s actual return. This information may not be used to estimate the actual ending account balance or expenses you paid for the period, but it can help you compare ongoing costs of investing in the Fund with those of other funds. To do so, compare this 5% hypothetical example for the class of shares you hold with the 5% hypothetical examples that appear in the shareholder reports of other funds.
Please note that expenses shown in the table are meant to highlight ongoing costs and do not reflect any transactional costs. Therefore, information under the heading “Hypothetical” is useful in comparing ongoing costs only, and will not help you compare total costs of owning different funds. In addition, if transactional costs were included, your total costs would have been higher.
| | | | | | | | | | | | | | | | | | | | | | | | |
| | | | | | | Actual (actual return after expenses) | | | | Hypothetical (5% annual return before expenses) | | | | | | |
| | | | | | | | | | | | | | | | |
| | | | | | | | | | | | |
Share Class | | Beginning Account Value 4/1/18 | | | | Ending Account Value 9/30/18 | | | | Expenses Paid During Period 4/1/18–9/30/181,2 | | | | Ending Account Value 9/30/18 | | | | Expenses Paid During Period 4/1/18–9/30/181,2 | | | | | | Net Annualized Expense Ratio2 |
| | | | | | | | | | | | | | |
A | | $1,000 | | | | $1,117.40 | | | | $4.25 | | | | $1,021.06 | | | | $4.05 | | | | | | 0.80% |
C | | $1,000 | | | | $1,113.20 | | | | $8.21 | | | | $1,017.30 | | | | $7.84 | | | | | | 1.55% |
R | | $1,000 | | | | $1,116.00 | | | | $5.57 | | | | $1,019.80 | | | | $5.32 | | | | | | 1.05% |
R6 | | $1,000 | | | | $1,119.30 | | | | $2.44 | | | | $1,022.76 | | | | $2.33 | | | | | | 0.46% |
Advisor | | $1,000 | | | | $1,118.80 | | | | $2.92 | | | | $1,022.31 | | | | $2.79 | | | | | | 0.55% |
1. Expenses are equal to the annualized expense ratio for the six-month period as indicated above—in the far right column—multiplied by the simple average account value over the period indicated, and then multiplied by 183/365 to reflect the one-half year period.
2. Reflects expenses after fee waivers and expense reimbursements. Does not include acquired fund fees and expenses.
| | | | |
| | | |
| franklintempleton.com | | Annual Report | | 17 |
Franklin Income Fund
This annual report for Franklin Income Fund covers the fiscal year ended September 30, 2018.
Your Fund’s Goal and Main Investments
The Fund seeks to maximize income, while maintaining prospects for capital appreciation by investing, under normal market conditions, in a diversified portfolio of debt and equity securities.
Performance Overview
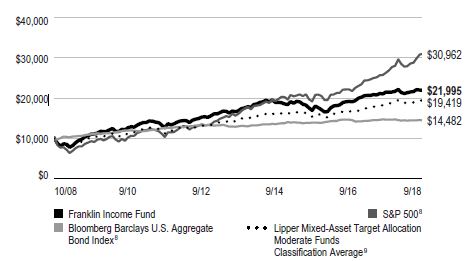
The Fund’s Class A shares delivered a cumulative total return of +2.17% for the 12 months under review. In comparison, the Fund’s equity benchmark, the Standard & Poor’s 500 Index (S&P 500), which is a broad measure of U.S. stock performance, returned +17.91%.1 The Fund’s fixed income benchmark, the Bloomberg Barclays U.S. Aggregate Bond Index, which tracks the U.S. investment-grade, taxable bond market, had a -1.22% total return.1 The Fund’s peers, as measured by the Lipper Mixed-Asset Target Allocation Moderate Funds Classification Average, which consists of funds chosen by Lipper that, by practice, maintain a mix of 40% to 60% equity securities, with the remainder in bonds and cash, posted a +5.12% total return.2 You can find the Fund’s long-term performance data in the Performance Summary beginning on page 22.
Performance data represent past performance, which does not guarantee future results. Investment return will fluctuate. Current performance may differ from figures shown. For most recent month-end performance, go tofranklintempleton.com or call(800) 342-5236.
Investment Strategy
Through our independent analysis of debt, convertible and equity securities, we search for undervalued or out-of-favor securities we believe offer opportunities for income today and significant growth tomorrow. We consider such factors as a company’s experience and managerial strength; cash flow potential and profitability; competitive positioning and advantages; responsiveness to changes in interest rates and business conditions; debt maturity schedules and borrowing requirements; changing financial condition and market
Dividend Distributions*
10/1/17–9/30/18
| | | | | | | | | | | | | | | | | | | | | | | | |
| | | Dividend per Share (cents) | |
Month | | Class
A** | | | Class
A1 | | | Class
C | | | Class
R | | | Class
R6 | | | Advisor
Class | |
| | | | | | |
October | | | — | | | | 1.00 | | | | 0.90 | | | | 0.93 | | | | 1.04 | | | | 1.03 | |
| | | | | | |
November | | | — | | | | 1.00 | | | | 0.90 | | | | 0.93 | | | | 1.04 | | | | 1.03 | |
| | | | | | |
December | | | — | | | | 1.00 | | | | 0.89 | | | | 0.93 | | | | 1.04 | | | | 1.03 | |
| | | | | | |
January | | | — | | | | 1.00 | | | | 0.89 | | | | 0.93 | | | | 1.04 | | | | 1.03 | |
| | | | | | |
February | | | — | | | | 1.00 | | | | 0.89 | | | | 0.93 | | | | 1.04 | | | | 1.03 | |
| | | | | | |
March | | | — | | | | 1.00 | | | | 0.89 | | | | 0.93 | | | | 1.04 | | | | 1.03 | |
| | | | | | |
April | | | — | | | | 1.00 | | | | 0.89 | | | | 0.93 | | | | 1.04 | | | | 1.03 | |
| | | | | | |
May | | | — | | | | 1.00 | | | | 0.89 | | | | 0.93 | | | | 1.04 | | | | 1.03 | |
| | | | | | |
June | | | — | | | | 1.00 | | | | 0.90 | | | | 0.93 | | | | 1.03 | | | | 1.02 | |
| | | | | | |
July | | | — | | | | 1.00 | | | | 0.90 | | | | 0.93 | | | | 1.03 | | | | 1.02 | |
| | | | | | |
August | | | — | | | | 1.00 | | | | 0.90 | | | | 0.93 | | | | 1.03 | | | | 1.02 | |
| | | | | | |
September | | | — | | | | 1.00 | | | | 0.90 | | | | 0.93 | | | | 1.03 | | | | 1.02 | |
| | | | | | |
Total | | | — | | | | 12.00 | | | | 10.74 | | | | 11.16 | | | | 12.44 | | | | 12.32 | |
*The distribution amount is the sum of all net investment income distributions for the period shown. All Fund distributions will vary depending upon current market conditions, and past distributions are not indicative of future trends.
**Effective 9/10/18, the Fund began offering Class A shares. See the prospectus for details.
recognition of the change; and a security’s relative value based on such factors as anticipated cash flow, interest or dividend coverage, asset coverage and earnings.
Manager’s Discussion
During the period under review, our equity weighting decreased from 54.9% to 50.0%, and our fixed income weighting increased from 39.0% to 47.9%. The Fund’s cash position decreased from 6.1% to 2.1% of total net assets.
Positive economic news contributed to very high consumer and business optimism even as the length of the current business cycle looked stretched by historical standards. Corporate fundamentals in the U.S. remained positive drivers for U.S. equity markets. Lower corporate tax rates and the repatriation of foreign earnings appeared to have boosted corporate earnings. Corporate profits continued to accelerate and consumer spending, a major driver of activity in the U.S., remained at very healthy levels.
1. Source: Morningstar.
2. Source: Lipper, a Thomson Reuters Company. For the 12-month period ended 9/30/18, this category consisted of 561 funds. Lipper calculations do not include sales charges or expense subsidization by a fund’s manager. The Fund’s performance relative to the average may have differed if these and other factors had been considered.
The indexes are unmanaged and include reinvestment of any income or distributions. They do not reflect any fees, expenses or sales charges. One cannot invest directly in an index, and an index is not representative of the Fund’s portfolio.
The dollar value, number of shares or principal amount, and names of all portfolio holdings are listed in the Fund’s Statement of Investments (SOI).
The SOI begins on page 65.
| | | | |
| | | |
18 | | Annual Report | | franklintempleton.com |
FRANKLIN INCOME FUND
Trends in high yield credit continued to look good and noninvestment-grade credit, similar to what comprised most of the Fund’s fixed income holdings, outperformed most other sectors within fixed income credit. We have remained focused primarily on the short end of the curve as we believed interest rates would continue to normalize over time. With near- and medium-term fundamentals likely remaining strong, in our view, we continued to see opportunities in short-dated credit. Overall credit quality on the fixed income side of the Fund’s portfolio drifted higher as positive re-ratings pushed some previously speculative credits up into higher ratings segments.
With the rise in U.S. Treasury yields, our weighting in U.S. government debt increased. At period-end, our weighting in investment-grade credit was as high as it has been over the past five years. We believe this should provide some excellent flexibility to take advantage of any volatility in markets, if economic conditions erode.
In equities, our focus remains on dividend-paying stocks across the various segments of the economy. The absolute level of yield is important, in our opinion, but a company’s ability to grow its dividend and cash flow and improve its business over time are also important considerations. The outlook for corporate earnings remains attractive, in our analysis, aiding in our efforts to find compelling total return possibilities. U.S. tax reform has certainly helped corporate cash flow and the ability of companies to return cash to shareholders in the form of dividends and buybacks.
The portfolio’s equity holdings in the information technology, health care and energy sectors led returns. The most significant individual contributors to performance in these sectors were technology giants Intel, Microsoft and Apple; pharmaceutical manufacturers Merck, Pfizer and AstraZenca; and oil and natural gas producer Royal Dutch Shell. Intel experienced solid demand for its semiconductors, and Microsoft continued to show excellent results in its cloud computing and enterprise segments. Strong corporate spending for various types of technologies has driven strong results in recent years. Apple benefited due to a strong response from consumers for their latest iPhones and related products. Successful new products in large markets helped results for Merck and Pfizer. After years of investing in product development, pharmaceutical manufacturer AstraZeneca showed promising results with a number of new drugs this year, with one of the more favorable product pipelines within the industry, in our view. Energy names such as Royal Dutch Shell benefited from rising commodity prices as solid global demand and companies focused on reduced capital spending and lower operating costs combined for improved cash flow. Other major contributors to
Portfolio Composition
9/30/18
| | |
| | | % of Total Net Assets |
| |
Equity* | | 50.0% |
| |
Financials | | 7.9% |
| |
Utilities | | 6.5% |
| |
Energy | | 6.4% |
| |
Information Technology | | 6.3% |
| |
Health Care | | 5.5% |
| |
Materials | | 3.9% |
| |
Consumer Discretionary | | 3.8% |
| |
Consumer Staples | | 3.6% |
| |
Industrials | | 3.0% |
| |
Communication Services | | 2.5% |
| |
Real Estate | | 0.6% |
| |
Fixed Income** | | 47.9% |
| |
Health Care | | 12.3% |
| |
Financials | | 11.9% |
| |
Energy | | 8.1% |
| |
Communication Services | | 7.0% |
| |
Consumer Discretionary | | 3.0% |
| |
Utilities | | 1.7% |
| |
Materials | | 1.2% |
| |
Consumer Staples | | 0.8% |
| |
Industrials | | 0.8% |
| |
Real Estate | | 0.6% |
| |
Information Technology | | 0.5% |
| |
Short-Term Investments & Other Net Assets | | 2.1% |
*Includes convertible bonds.
**Includes senior floating rate interests and index-linked notes.
performance included mass retailer Target and railroad operator Union Pacific. Target recently experienced the best quarterly results it had achieved in many years due to a strong consumer spending environment and specific merchandise initiatives that attracted new customers. Union Pacific benefited from carload growth and pricing gains during the period and continued to make solid progress on reducing operating costs.
In equities, the industrials, consumer staples and consumer discretionary sectors detracted from performance. Notable detractors in these sectors included General Electric (GE), Philip Morris International, Newell Brands, and Ford Motor. GE was a major detractor during the period as cash flow eroded from weak fundamentals, causing the company to cut its dividend in half early in the period. Philip Morris experienced weaker-than-expected demand trends and slower activity in key emerging markets. For consumer product manufacturer Newell
| | | | |
| | | |
| franklintempleton.com | | Annual Report | | 19 |
FRANKLIN INCOME FUND
Top Five Equity Holdings*
9/30/18
| | |
Company Sector/Industry | | % of Total Net Assets |
| |
Wells Fargo & Co. Financials | | 2.0% |
| |
The Southern Co. Utilities | | 1.7% |
| |
Sempra Energy Utilities | | 1.7% |
| |
Dominion Energy Inc. Utilities | | 1.7% |
| |
Bank of America Corp. Financials | | 1.3% |
*Includes convertible bonds.
Brands, revenue fell and promotional levels rose as key customers delayed orders. The company also struggled with business integration following a large acquisition. After several years of strong new car demand, our holdings in global auto manufacturers, such as Ford Motor, declined as softer demand has ensued. In other sectors, Germany-based chemical manufacturer BASF struggled to offset higher input costs, and PG&E3 eliminated its dividend after tragic fires hit Northern California and fears of a large liability appeared to be facing the company.
On the fixed income side of the portfolio, we established a much stronger presence in U.S. Treasury securities. The portfolio’s weighting rose substantially, which has provided attractive current income and some defensive protection from interest rate risk. The vast majority of our much larger exposure to corporate bonds also experienced price increases against a favorable backdrop of stable credit fundamentals and ongoing investor demand for higher-yielding corporate debt securities. All fixed income sectors contributed positively to performance. The strongest results were seen among consumer non-cyclical and energy, and to a lesser extent, communications. Balance sheet improvements and strong energy sector dynamics over the period lifted results. A notable contributor was our large position in Chesapeake Energy, for which debt reduction, continued asset sales and improved fundamentals drove returns. Hospital operator Tenet Healthcare was also a strong contributor as results were positive in its surgery center segment and lower costs have boosted free cash flow and reduced leverage. Bausch Health’s stronger growth and patent durability exceeded expectations and its debt reduction was a key positive for performance.
Top Five Fixed Income Holdings*
9/30/18
| | |
Company Sector/Industry | | % of Total Net Assets |
| |
U.S. Treasury Note Financials | | 6.7% |
| |
CHS/Community Health Systems Inc. Health Care | | 4.0% |
| |
Chesapeake Energy Corp. Energy | | 2.8% |
| |
Tenet Healthcare Corp. Health Care | | 2.6% |
| |
JPMorgan Chase & Co. Financials | | 1.6% |
*Includes senior floating rate interests and index-linked notes.
In fixed income, some individual companies in the consumer non-cyclical sector, and to a lesser extent, some individual companies in the communications sector also hindered performance. A notable detractor was Community Health Systems, for which leverage remained high and near-term maturity concerns pressured bond prices. The company also experienced softer operating cash flow as hurricane activity was disruptive. We remain positive on the prospects of improved results for Community Health going forward. Satellite TV and internet services provider DISH Network, another key detractor, suffered from weaker subscription. The company also disclosed in May 2018 that it was unlikely to find the partnership it needed to build its 5G network in the near term, but we believe DISH is well positioned at period-end as industry demand grows and moves to 5G standards.
3. Not held at period-end.
see www.franklintempletondatasources.com for additional data provider information.
| | | | |
| | | |
20 | | Annual Report | | franklintempleton.com |
FRANKLIN INCOME FUND
Thank you for your continued participation in Franklin Income Fund. We look forward to serving your future investment needs.
| | |
 | | 
Edward Perks, CFA |
| |
| | Matthew Quinlan |
| | Richard S. Hsu, CFA |
| | Todd Brighton, CFA |
| |
| | Portfolio Management Team |
The foregoing information reflects our analysis, opinions and portfolio holdings as of September 30, 2018, the end of the reporting period. The way we implement our main investment strategies and the resulting portfolio holdings may change depending on factors such as market and economic conditions. These opinions may not be relied upon as investment advice or an offer for a particular security. The information is not a complete analysis of every aspect of any market, country, industry, security or the Fund. Statements of fact are from sources considered reliable, but the investment manager makes no representation or warranty as to their completeness or accuracy. Although historical performance is no guarantee of future results, these insights may help you understand our investment management philosophy.
| | | | |
| | | |
| franklintempleton.com | | Annual Report | | 21 |
FRANKLIN INCOME FUND
Performance Summary as of September 30, 2018
The performance tables and graphs do not reflect any taxes that a shareholder would pay on Fund dividends, capital gain distributions, if any, or any realized gains on the sale of Fund shares. Total return reflects reinvestment of the Fund’s dividends and capital gain distributions, if any, and any unrealized gains or losses. Your dividend income will vary depending on dividends or interest paid by securities in the Fund’s portfolio, adjusted for operating expenses of each class. Capital gain distributions are net profits realized from the sale of portfolio securities.
Performance as of 9/30/181
Cumulative total return excludes sales charges. Average annual total return includes maximum sales charges. Sales charges will vary depending on the size of the investment and the class of share purchased. The maximum is 4.25% and the minimum is 0%.Class A: 4.25% maximum initial sales charge;Advisor Class: no sales charges. For other share classes, visitfranklintempleton.com.
| | | | |
| Share Class | | Cumulative Total Return2 | | Average Annual Total Return3 |
| | |
A4 | | | | |
| | |
1-Year | | +2.17% | | -2.17% |
| | |
5-Year | | +29.01% | | +4.32% |
| | |
10-Year | | +116.46% | | +7.56% |
| | |
Advisor | | | | |
| | |
1-Year | | +2.34% | | +2.34% |
| | |
5-Year | | +30.21% | | +5.42% |
| | |
10-Year | | +119.95% | | +8.20% |
| | | | | | | | |
| | | Distribution | | | | 30-Day Standardized Yield6 |
| Share Class | | Rate5 | | | | (with waiver) | | (without waiver) |
| | | | |
A7 | | —% | | | | —% | | —% |
| | | | |
Advisor | | 5.32% | | | | 4.02% | | 4.02% |
Performance data represent past performance, which does not guarantee future results. Investment return and principal value will fluctuate, and you may have a gain or loss when you sell your shares. Current performance may differ from figures shown. For most recent month-end performance, go tofranklintempleton.com or call(800) 342-5236.
See page 25 for Performance Summary footnotes.
| | | | |
| | | |
22 | | Annual Report | | franklintempleton.com |
FRANKLIN INCOME FUND
PERFORMANCE SUMMARY
Total Return Index Comparison for a Hypothetical $10,000 Investment1
Total return represents the change in value of an investment over the periods shown. It includes any applicable maximum sales charge, Fund expenses, account fees and reinvested distributions. The unmanaged indexes include reinvestment of any income or distributions. They differ from the Fund in composition and do not pay management fees or expenses. One cannot invest directly in an index.
Class A(10/1/08–9/30/18)
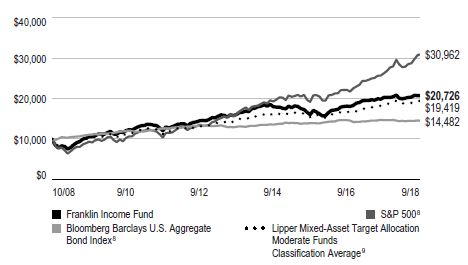
Advisor Class(10/1/08–9/30/18)
See page 25 for Performance Summary footnotes.
| | | | |
| | | |
| franklintempleton.com | | Annual Report | | 23 |
FRANKLIN INCOME FUND
PERFORMANCE SUMMARY
Net Asset Value
| | | | | | | | |
| Share Class(Symbol) | | 9/30/18 | | 9/10/18 | | 9/30/17 | | Change |
| | | | |
| A(FKIQX) | | $2.32 | | $2.31 | | N/A | | +$0.01 |
| | | | |
| A1(FKINX) | | $2.32 | | N/A | | $2.39 | | -$0.07 |
| | | | |
| C(FCISX) | | $2.35 | | N/A | | $2.42 | | -$0.07 |
| | | | |
| R(FISRX) | | $2.28 | | N/A | | $2.35 | | -$0.07 |
| | | | |
| R6(FNCFX) | | $2.30 | | N/A | | $2.37 | | -$0.07 |
| | | | |
| Advisor(FRIAX) | | $2.30 | | N/A | | $2.37 | | -$0.07 |
| | | | |
| Distributions(10/1/17–9/30/18) | | | | | | | | |
| Share Class | | Net Investment Income | | | | | | |
| | | | |
| A (9/10/18–9/30/18) | | $ — | | | | | | |
| | | | |
| A1 | | $0.1200 | | | | | | |
| | | | |
| C | | $0.1074 | | | | | | |
| | | | |
| R | | $0.1116 | | | | | | |
| | | | |
| R6 | | $0.1244 | | | | | | |
| | | | |
| Advisor | | $0.1232 | | | | | | |
| | | | |
| Total Annual Operating Expenses10 | | | | | | | | |
| | | | |
| Share Class | | With Waiver | | Without Waiver | | | | |
| | | | |
| A | | 0.72% | | 0.73% | | | | |
| | | | |
| Advisor | | 0.47% | | 0.48% | | | | |
See page 25 for Performance Summary footnotes.
| | | | |
| | | |
24 | | Annual Report | | franklintempleton.com |
FRANKLIN INCOME FUND
PERFORMANCE SUMMARY
Each class of shares is available to certain investors and has different annual fees and expenses, as described in the prospectus.
All investments involve risks, including possible loss of principal. The Fund’s share price and yield will be affected by interest rate movements. Bond prices generally move in the opposite direction of interest rates. Thus, as prices of bonds in the Fund adjust to a rise in interest rates, the Fund’s share price may decline. Changes in the financial strength of a bond issuer or in a bond’s credit rating may affect its value. The Fund’s portfolio includes a substantial portion of higher yielding, lower rated corporate bonds because of the relatively higher yields they offer. Floating-rate loans are lower rated, higher yielding instruments, which are subject to increased risk of default and can potentially result in loss of principal. These securities carry a greater degree of credit risk relative to investment-grade securities. Stock prices fluctuate, sometimes rapidly and dramatically, due to factors affecting individual companies, particular industries or sectors, or general market conditions. The Fund is actively managed but there is no guarantee that the manager’s investment decisions will produce the desired results. The Fund’s prospectus also includes a description of the main investment risks.
1. The Fund has a fee waiver associated with any investment it makes in a Franklin Templeton money fund and/or other Franklin Templeton fund, contractually guaranteed through 1/31/19. Fund investment results reflect the fee waiver; without this waiver, the results would have been lower.
2. Cumulative total return represents the change in value of an investment over the periods indicated.
3. Average annual total return represents the average annual change in value of an investment over the periods indicated. Return for less than one year, if any, has not been annualized.
4. Effective 9/10/18, Class A shares closed to new investors, were renamed Class A1 shares, and a new Class A share with a different expense structure became available. Class A performance shown has been calculated as follows: (a) for periods prior to 9/10/18, a restated figure is used based on the Fund’s Class A1 performance that includes any Rule 12b-1 rate differential that exists between Class A1 and Class A; and (b) for periods after 9/10/18, actual Class A performance is used, reflecting all charges and fees applicable to that class.
5. Distribution rate is based on an annualization of the respective class’s September dividend and the maximum offering price (NAV for Advisor Class) per share on 9/30/18.
6. The Fund’s 30-day standardized yield is calculated over a trailing 30-day period using the yield to maturity on bonds and/or the dividends accrued on stocks. It may not equal the Fund’s actual income distribution rate, which reflects the Fund’s past dividends paid to shareholders.
7. Share Class A launched on 9/10/18 and yield cannot be produced until this share class has been in existence for 30 days. This value will not be calculated until 10/31/18.
8. Source: Morningstar. The S&P 500 is a market capitalization-weighted index of 500 stocks designed to measure total U.S. equity market performance. The Bloomberg Barclays U.S. Aggregate Bond Index is a market capitalization-weighted index representing the U.S. investment-grade, fixed-rate, taxable bond market with index components for government and corporate, mortgage pass-through and asset-backed securities. All issues included are SEC registered, taxable, dollar denominated and nonconvertible, must have at least one year to final maturity and must be rated investment grade (Baa3/BBB-/BBB- or higher) using the middle rating of Moody’s, S&P and Fitch, respectively.
9. Source: Lipper, a Thomas Reuters Company. The Lipper Mixed-Asset Target Allocation Moderate Funds Classification Average is calculated by averaging the total returns of all funds within the Lipper Mixed-Asset Target Allocation Moderate Funds classification in the Lipper Open-End underlying funds universe. Lipper Mixed-Asset Target Allocation Moderate Funds are defined as funds that, by portfolio practice, maintain a mix of between 40%–60% equity securities, with the remainder invested in bonds, cash and cash equivalents. For the one-year period ended 9/30/18, there were 561 funds in this category. Lipper calculations do not include sales charges or expense subsidization by a fund’s manager. The Fund’s performance relative to the average may have differed if these and other factors had been considered.
10. Figures are as stated in the Fund’s current prospectus and may differ from the expense ratios disclosed in the Your Fund’s Expenses and Financial Highlights sections in this report. In periods of market volatility, assets may decline significantly, causing total annual Fund operating expenses to become higher than the figures shown.
See www.franklintempletondatasources.com for additional data provider information.
| | | | |
| | | |
| franklintempleton.com | | Annual Report | | 25 |
FRANKLIN INCOME FUND
Your Fund’s Expenses
As a Fund shareholder, you can incur two types of costs: (1) transaction costs, including sales charges (loads) on Fund purchases and redemptions; and (2) ongoing Fund costs, including management fees, distribution and service (12b-1) fees, and other Fund expenses. All mutual funds have ongoing costs, sometimes referred to as operating expenses. The table below shows ongoing costs of investing in the Fund and can help you understand these costs and compare them with those of other mutual funds. The table assumes a $1,000 investment held for the six months indicated.
Actual Fund Expenses
The table below provides information about actual account values and actual expenses in the columns under the heading “Actual.” In these columns the Fund’s actual return, which includes the effect of Fund expenses, is used to calculate the “Ending Account Value” for each class of shares. You can estimate the expenses you paid during the period by following these steps (of course, your account value and expenses will differ from those in this illustration): Divide your account value by $1,000 (if your account had an $8,600 value, then $8,600 ÷ $1,000 = 8.6). Then multiply the result by the number in the row for your class of shares under the headings “Actual” and “Expenses Paid During Period” (if Actual Expenses Paid During Period were $7.50, then 8.6 x $7.50 = $64.50). In this illustration, the actual expenses paid this period are $64.50.
Hypothetical Example for Comparison with Other Funds
Under the heading “Hypothetical” in the table, information is provided about hypothetical account values and hypothetical expenses based on the Fund’s actual expense ratio and an assumed rate of return of 5% per year before expenses, which is not the Fund’s actual return. This information may not be used to estimate the actual ending account balance or expenses you paid for the period, but it can help you compare ongoing costs of investing in the Fund with those of other funds. To do so, compare this 5% hypothetical example for the class of shares you hold with the 5% hypothetical examples that appear in the shareholder reports of other funds.
Please note that expenses shown in the table are meant to highlight ongoing costs and do not reflect any transactional costs. Therefore, information under the heading “Hypothetical” is useful in comparing ongoing costs only, and will not help you compare total costs of owning different funds. In addition, if transactional costs were included, your total costs would have been higher.
| | | | | | | | | | | | |
| | | | | Actual (actual return after expenses) | | Hypothetical
(5% annual return before expenses) | | |
| | | | | | |
Share
Class | | Beginning Account Value 4/1/181 | | Ending Account Value 9/30/18 | | Expenses Paid During Period 4/1/18–9/30/182,3,4 | | Ending Account Value 9/30/18 | | Expenses Paid During Period 4/1/18–9/30/183,4 | | Net Annualized Expense Ratio4 |
| | | | | | |
A | | $1,000 | | $1,004.30 | | $0.39 | | $1,021.51 | | $3.60 | | 0.71% |
A1 | | $1,000 | | $1,039.80 | | $3.17 | | $1,021.96 | | $3.14 | | 0.62% |
C | | $1,000 | | $1,041.10 | | $5.73 | | $1,019.45 | | $5.67 | | 1.12% |
R | | $1,000 | | $1,043.30 | | $4.97 | | $1,020.21 | | $4.91 | | 0.97% |
R6 | | $1,000 | | $1,041.10 | | $1.89 | | $1,023.21 | | $1.88 | | 0.37% |
Advisor | | $1,000 | | $1,040.80 | | $2.40 | | $1,022.71 | | $2.38 | | 0.47% |
1. For A1, C, R, R6 and Advisor, 4/1/18 for Actual and Hypothetical. For Class A, 9/10/18 for Actual and 4/1/18 for Hypothetical.
2. For Classes A1, C, R, R6 and Advisor, 4/1/18–9/30/18. For Class A, 9/10/18–9/30/18.
3. Expenses are equal to the annualized expense ratio for the six-month period as indicated above—in the far right column—multiplied by the simple average account value over the period indicated, and then multiplied by 183/365 to reflect the one-half year period. The multiplier is 20/365 for Actual Class A expenses to reflect the number of days since inception.
4. Reflects expenses after fee waivers and expense reimbursements. Does not include acquired fund fees and expenses.
| | | | |
| | | |
26 | | Annual Report | | franklintempleton.com |
Franklin U.S. Government Securities Fund
This annual report for Franklin U.S. Government Securities Fund covers the fiscal year ended September 30, 2018.
Your Fund’s Goal and Main Investments
The Fund seeks income by investing at least 80% of its net assets in U.S. government securities. The Fund presently invests substantially all of its assets in Government National Mortgage Association obligations (Ginnie Maes).
Since 1983, the Fund has invested substantially in Ginnie Mae securities, which carry a guarantee backed by the full faith and credit of the U.S. government as to the timely payment of interest and principal.1 Issued by the Government National Mortgage Association (GNMA), Ginnie Maes have been among the highest yielding U.S. government obligations available.
Portfolio Composition
Based on Total Net Assets as of 9/30/18
| | |
GNMA | | 96.5% |
U.S. Government and Agency Securities | | 1.6% |
Short-Term Investments & Other Net Assets | | 1.9% |
Performance Overview
The Fund’s Class A shares had a -1.42% cumulative total return for the 12 months under review. In comparison, the Bloomberg Barclays U.S. Government Intermediate Index, the intermediate component of the Bloomberg Barclays U.S. Government Index, had -1.18% total return.2 The Fund’s peers, as measured by the Lipper GNMA Funds Classification Average, which consists of funds chosen by Lipper that invest primarily in GNMAs, had a -1.38% total return for the same period.3 You can find the Fund’s long-term performance data in the Performance Summary beginning on page 29.
Performance data represent past performance, which does not guarantee future results. Investment return and principal value will fluctuate, and you may have a gain or loss when you sell your shares. Current performance may differ from figures shown. For most recent month-end performance, go tofranklintempleton.comor call (800) 342-5236.
Investment Strategy
We currently invest the Fund’s assets substantially in GNMA obligations. We analyze securities using proprietary models to help us identify attractive investment opportunities.
Dividend Distributions*
10/1/17–9/30/18
| | | | | | | | | | | | | | | | | | | | | | | | |
| | | Dividend per Share (cents) | |
| Month | | Class A** | | | Class A1 | | | Class C | | | Class R | | | Class R6 | | | Advisor Class | |
| |
October | | | — | | | | 1.40 | | | | 1.13 | | | | 1.21 | | | | 1.55 | | | | 1.46 | |
November | | | — | | | | 1.52 | | | | 1.27 | | | | 1.34 | | | | 1.66 | | | | 1.60 | |
December | | | — | | | | 1.51 | | | | 1.25 | | | | 1.33 | | | | 1.65 | | | | 1.59 | |
January | | | — | | | | 1.52 | | | | 1.26 | | | | 1.34 | | | | 1.66 | | | | 1.60 | |
February | | | — | | | | 1.54 | | | | 1.31 | | | | 1.38 | | | | 1.67 | | | | 1.61 | |
March | | | — | | | | 1.51 | | | | 1.25 | | | | 1.34 | | | | 1.65 | | | | 1.58 | |
April | | | — | | | | 1.54 | | | | 1.29 | | | | 1.37 | | | | 1.66 | | | | 1.61 | |
May | | | — | | | | 1.55 | | | | 1.30 | | | | 1.37 | | | | 1.68 | | | | 1.62 | |
June | | | — | | | | 1.52 | | | | 1.28 | | | | 1.35 | | | | 1.65 | | | | 1.59 | |
July | | | — | | | | 1.55 | | | | 1.30 | | | | 1.37 | | | | 1.68 | | | | 1.62 | |
August | | | — | | | | 1.55 | | | | 1.30 | | | | 1.37 | | | | 1.68 | | | | 1.63 | |
September | | | 1.64 | | | | 1.57 | | | | 1.33 | | | | 1.40 | | | | 1.69 | | | | 1.64 | |
Total | | | 1.64 | | | | 18.28 | | | | 15.27 | | | | 16.17 | | | | 19.88 | | | | 19.15 | |
*The distribution amount is the sum of all net investment income distributions for the period shown. All Fund distributions will vary depending upon current market conditions, and past distributions are not indicative of future trends.
**Effective 9/10/18, the Fund began offering Class A shares. See the prospectus for details.
Manager’s Discussion
Overall, the U.S. equity markets rose during the period, boosted by mostly upbeat economic data and improved U.S. corporate earnings. Manufacturing and services sectors had steady growth and employment levels increased. Retail sales generally grew and inflation, while slowed by period-end, also increased. In this environment, home sales declined due to low supply levels and rising prices.
During the period, Ginnie Mae (GNMA) mortgage backed securities (MBS) produced positive excess returns and outperformed Treasuries.
1. Securities owned by the Fund, but not shares of the Fund, are guaranteed by the U.S. government, its agencies or instrumentalities as to timely payment of principal and interest. The Fund’s yield and share price are not guaranteed and will vary with market conditions.
2. Source: Morningstar.
3. Source: Lipper, a Thomson Reuters Company. For the 12-month period ended 9/30/18, there were 53 funds in this category. Lipper calculations do not include sales charges or expense subsidization by a fund’s manager. The Fund’s performance relative to the average may have differed if these or other factors had been considered.
The indexes are unmanaged and include reinvestment of any income or distributions. They do not reflect any fees, expenses or sales charges. One cannot invest directly in an index, and an index is not representative of the Fund’s portfolio.
See www.franklintempletondatasources.com for additional data provider information.
The dollar value, number of shares or principal amount, and names of all portfolio holdings are listed in the Fund’s Statement of Investments (SOI).
The SOI begins on page 87.
| | | | |
| | | |
| franklintempleton.com | | Annual Report | | 27 |
FRANKLIN U.S. GOVERNMENT SECURITIES FUND
MBS fundamentals remain supportive and the prepayment outlook continues to look fairly benign. In the current environment, many qualified homeowners have already refinanced and with rising mortgage rates there is less economic incentive to refinance, leaving only approximately 8% of the existing universe refinanceable. We expect prepayments to remain contained, given the low incentive to refinance loans, increasing mortgage rates and slowing seasonal home purchases.
As part of the balance sheet normalization plan, the Federal Reserve (Fed) is expected to incorporate a $16 billion cap on runoff during the third quarter of 2018. Considering the current composition of the Fed’s portfolio and the current pace of reinvestments, the Fed is expected to conclude their large-scale purchases in October, increasing the supply of securities in the market. Some of the demand slack may be offset with a decrease in supply due to higher mortgage rates and housing seasonality, though any additional supply will need to be absorbed by the market without the Fed’s demand component.
Within the agency mortgage pass-through sector, GNMAs underperformed their Freddie Mac and Fannie Mae counterparts. On an excess return basis, GNMA II 5.0% coupons were the best performers, while GNMA I and II 3.5% coupons generally lagged.
The Fund maintains a conservative, disciplined investment strategy and invests primarily in GNMA mortgage pass-throughs, which remain the only MBS that are backed by the full faith and credit of the U.S. government—the same guarantee applicable to U.S. Treasuries.1 We believe our collateral-intensive research approach can allow us to uncover dislocations across the GNMA markets and associated misvaluation of prepayment risk. We continue to focus on specified pools where we believe our experience and continual investment in new technologies help us uncover these discrepancies.
During the period, we were more weighted toward GNMA IIs (pools of mortgages from multiple issuers) than GNMA Is (pools of mortgages from single issuers). Over the period, we added to GNMA II 3.0% and 4.0% coupons, while reducing exposure to 4.5% and 5.0% coupons. Our heaviest allocation was in 3.5%, 4.0% and 4.5% coupons at period-end. The Fund’s position in 3.0% and 4.0% coupon GNMA securities benefited performance, while our allocation to 3.5% coupon GNMAs detracted from performance.
Thank you for your continued participation in Franklin U.S. Government Securities Fund. We welcome your comments and questions and look forward to serving your investment needs in the years ahead.
| | |

| | 
Roger A. Bayston, CFA |

| | 
Paul Varunok |
| |
| | Portfolio Management Team |
The foregoing information reflects our analysis, opinions and portfolio holdings as of September 30, 2018, the end of the reporting period. The way we implement our main investment strategies and the resulting portfolio holdings may change depending on factors such as market and economic conditions. These opinions may not be relied upon as investment advice or an offer for a particular security. The information is not a complete analysis of every aspect of any market, country, industry, security or the Fund. Statements of fact are from sources considered reliable, but the investment manager makes no representation or warranty as to their completeness or accuracy. Although historical performance is no guarantee of future results, these insights may help you understand our investment management philosophy.
| | | | |
| | | |
28 | | Annual Report | | franklintempleton.com |
FRANKLIN U.S. GOVERNMENT SECURITIES FUND
Performance Summary as of September 30, 2018
The performance tables and graphs do not reflect any taxes that a shareholder would pay on Fund dividends, capital gain distributions, if any, or any realized gains on the sale of Fund shares. Total return reflects reinvestment of the Fund’s dividends and capital gain distributions, if any, and any unrealized gains or losses. Your dividend income will vary depending on dividends or interest paid by securities in the Fund’s portfolio, adjusted for operating expenses of each class. Capital gain distributions are net profits realized from the sale of portfolio securities.
Performance as of 9/30/181
Cumulative total return excludes sales charges. Average annual total return includes maximum sales charges. Sales charges will vary depending on the size of the investment and the class of share purchased. The maximum is 4.25% and the minimum is 0%.Class A: 4.25% maximum initial sales charge;Advisor Class: no sales charges. For other share classes, visitfranklintempleton.com.
| | | | |
| Share Class | | Cumulative Total Return2 | | Average Annual Total Return3 |
| | |
A4 | | | | |
| | |
1-Year | | -1.42% | | -5.61% |
| | |
5-Year | | +5.36% | | +0.18% |
| | |
10-Year | | +30.02% | | +2.22% |
| | |
Advisor | | | | |
| | |
1-Year | | -1.45% | | -1.45% |
| | |
5-Year | | +5.96% | | +1.17% |
| | |
10-Year | | +31.70% | | +2.79% |
| | | | | | | | |
| | | Distribution | | | | 30-Day Standardized Yield6 |
| Share Class | | Rate5 | | | | (with waiver) | | (without waiver) |
| | | | |
A7 | | 3.22% | | | | —% | | —% |
| | | | |
Advisor | | 3.35% | | | | 2.73% | | 2.72% |
Performance data represent past performance, which does not guarantee future results. Investment return and principal value will fluctuate, and you may have a gain or loss when you sell your shares. Current performance may differ from figures shown. For most recent month-end performance, go tofranklintempleton.com or call(800) 342-5236.
See page 31 for Performance Summary footnotes.
| | | | |
| | | |
| franklintempleton.com | | Annual Report | | 29 |
FRANKLIN U.S. GOVERNMENT SECURITIES FUND
PERFORMANCE SUMMARY
Total Return Index Comparison for a Hypothetical $10,000 Investment1
Total return represents the change in value of an investment over the periods shown. It includes any applicable maximum sales charge, Fund expenses, account fees and reinvested distributions. The unmanaged indexes include reinvestment of any income or distributions. They differ from the Fund in composition and do not pay management fees or expenses. One cannot invest directly in an index.
Class A(10/1/08–9/30/18)
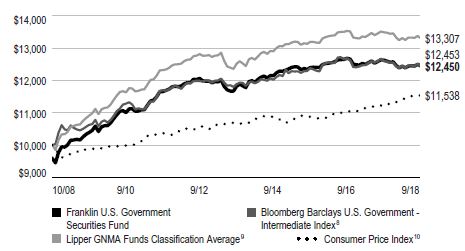
Advisor Class(10/1/08–9/30/18)
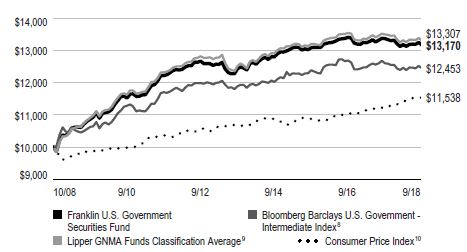
See page 31 for Performance Summary footnotes.
| | | | |
| | | |
30 | | Annual Report | | franklintempleton.com |
FRANKLIN U.S. GOVERNMENT SECURITIES FUND
PERFORMANCE SUMMARY
Distributions(10/1/17–9/30/18)
| | |
| Share Class | | Net Investment Income |
A (9/10/18–9/30/18) | | $0.0164 |
| A1 | | $0.1828 |
| C | | $0.1527 |
| R | | $0.1617 |
| R6 | | $0.1988 |
| Advisor | | $0.1915 |
Total Annual Operating Expenses11
| | |
| Share Class | | |
A | | 0.87% |
| Advisor | | 0.62% |
Each class of shares is available to certain eligible investors and has different annual fees and expenses, as described in the prospectus.
All investments involve risks, including possible loss of principal. The Fund’s share price and yield will be affected by interest rate movements and mortgage prepayments. Bond prices generally move in the opposite direction of interest rates. Thus, as prices of bonds in the Fund adjust to a rise in interest rates, the Fund’s share price may decline. Changes in the financial strength of a bond issuer or in a bond’s credit rating may affect its value. The Fund is actively managed but there is no guarantee that the manager’s investment decisions will produce the desired results. The Fund’s prospectus also includes a description of the main investment risks.
1. The Fund has a fee waiver associated with any investment it makes in a Franklin Templeton money fund and/or other Franklin Templeton fund, contractually guaranteed through 1/31/19. Fund investment results reflect the fee waiver; without this waiver, the results would have been lower.
2. Cumulative total return represents the change in value of an investment over the periods indicated.
3. Average annual total return represents the average annual change in value of an investment over the periods indicated. Return for less than one year, if any, has not been annualized.
4. Effective 9/10/18, Class A shares closed to new investors, were renamed Class A1 shares, and a new Class A share with a different expense structure became available. Class A performance shown has been calculated as follows: (a) for periods prior to 9/10/18, a restated figure is used based on the Fund’s Class A1 performance that includes any Rule 12b-1 rate differential that exists between Class A1 and Class A; and (b) for periods after 9/10/18, actual Class A performance is used, reflecting all charges and fees applicable to that class.
5. Distribution rate is based on an annualization of the respective class’s September dividend and the maximum offering price (NAV for Advisor Class) per share on 9/30/18.
6. The Fund’s 30-day standardized yield is calculated over a trailing 30-day period using the yield to maturity on bonds and/or the dividends accrued on stocks. It may not equal the Fund’s actual income distribution rate, which reflects the Fund’s past dividends paid to shareholders.
7. Share Class A launched on 9/10/18 and yield cannot be produced until this share class has been in existence for 30 days. This value will not be calculated until 10/31/18.
8. Source: Morningstar. Bloomberg Barclays U.S. Government Intermediate Index, the intermediate component of the Bloomberg Barclays U.S. Government Index, which includes public obligations of the U.S. Treasury with at least one year to final maturity and publicly issued debt of U.S. government agencies, quasi-federal corporations, and corporate or foreign debt guaranteed by the U.S. government.
9. Source: Lipper, a Thomson Reuters Company. The Lipper GNMA Funds Classification Average is calculated by averaging the total sum for all funds within the Lipper GNMA Funds classification in the Lipper Open-End underlying funds universe for the period indicated. Lipper GNMA Funds are defined as funds that invest primarily in Government National Mortgage Association securities. For the one-year period ended 9/30/18, there were 53 funds in this category. Lipper calculations do not include sales charges or expense subsidization by a fund’s manager. The Fund’s performance relative to the average may have differed if these or other factors had been considered.
10. Source: Bureau of Labor Statistics, bls.gov/cpi. The Consumer Price Index (CPI) is a commonly used measure of the inflation rate.
11. Figures are as stated in the Fund’s current prospectus and may differ from the expense ratios disclosed in the Your Fund’s Expenses and Financial Highlights sections in this report. In periods of market volatility, assets may decline significantly, causing total annual Fund operating expenses to become higher than the figures shown.
See www.franklintempletondatasources.com for additional data provider information.
| | | | |
| | | |
| franklintempleton.com | | Annual Report | | 31 |
FRANKLIN U.S. GOVERNMENT SECURITIES FUND
Your Fund’s Expenses
As a Fund shareholder, you can incur two types of costs: (1) transaction costs, including sales charges (loads) on Fund purchases and redemptions; and (2) ongoing Fund costs, including management fees, distribution and service (12b-1) fees, and other Fund expenses. All mutual funds have ongoing costs, sometimes referred to as operating expenses. The table below shows ongoing costs of investing in the Fund and can help you understand these costs and compare them with those of other mutual funds. The table assumes a $1,000 investment held for the six months indicated.
Actual Fund Expenses
The table below provides information about actual account values and actual expenses in the columns under the heading “Actual.” In these columns the Fund’s actual return, which includes the effect of Fund expenses, is used to calculate the “Ending Account Value” for each class of shares. You can estimate the expenses you paid during the period by following these steps (of course, your account value and expenses will differ from those in this illustration): Divide your account value by $1,000 (if your account had an $8,600 value, then $8,600 ÷ $1,000 = 8.6). Then multiply the result by the number in the row for your class of shares under the headings “Actual” and “Expenses Paid During Period” (if Actual Expenses Paid During Period were $7.50, then 8.6 x $7.50 = $64.50). In this illustration, the actual expenses paid this period are $64.50.
Hypothetical Example for Comparison with Other Funds
Under the heading “Hypothetical” in the table, information is provided about hypothetical account values and hypothetical expenses based on the Fund’s actual expense ratio and an assumed rate of return of 5% per year before expenses, which is not the Fund’s actual return. This information may not be used to estimate the actual ending account balance or expenses you paid for the period, but it can help you compare ongoing costs of investing in the Fund with those of other funds. To do so, compare this 5% hypothetical example for the class of shares you hold with the 5% hypothetical examples that appear in the shareholder reports of other funds.
Please note that expenses shown in the table are meant to highlight ongoing costs and do not reflect any transactional costs. Therefore, information under the heading “Hypothetical” is useful in comparing ongoing costs only, and will not help you compare total costs of owning different funds. In addition, if transactional costs were included, your total costs would have been higher.
| | | | | | | | | | | | |
| | | | | Actual (actual return after expenses) | | Hypothetical (5% annual return before expenses) | | |
| | | | | | | | |
Share Class | | Beginning Account Value 4/1/181 | | Ending Account Value 9/30/18 | | Expenses Paid During Period 4/1/18–9/30/182,3,4 | | Ending Account Value 9/30/18 | | Expenses Paid During Period 4/1/18–9/30/183,4 | | Net Annualized Expense Ratio4 |
| | | | | | |
A | | $1,000 | | $ 997.70 | | $0.47 | | $1,020.76 | | $4.36 | | 0.86% |
A1 | | $1,000 | | $ 998.80 | | $3.71 | | $1,021.36 | | $3.75 | | 0.74% |
C | | $1,000 | | $ 996.30 | | $6.21 | | $1,018.85 | | $6.28 | | 1.24% |
R | | $1,000 | | $ 997.00 | | $5.46 | | $1,019.60 | | $5.52 | | 1.09% |
R6 | | $1,000 | | $ 1,000.10 | | $2.41 | | $1,022.66 | | $2.43 | | 0.48% |
Advisor | | $1,000 | | $ 999.50 | | $2.96 | | $1,022.11 | | $2.99 | | 0.59% |
1. For Classes A1, C, R, R6 and Advisor, 4/1/18 for Actual and Hypothetical. For Class A, 9/10/18 for Actual and 4/1/18 for Hypothetical.
2. For Classes A1, C, R, R6 and Advisor, 4/1/18–9/30/18. For Class A, 9/10/18-9/30/18.
3. Expenses are equal to the annualized expense ratio for the six-month period as indicated above—in the far right column—multiplied by the simple average account value over the period indicated, and then multiplied by 183/365 to reflect the one-half year period. The multiplier is 20/365 for Actual Class A expenses to reflect the number of days since inception.
4. Reflects expenses after fee waivers and expense reimbursements. Does not include acquired fund fees and expenses.
| | | | |
| | | |
32 | | Annual Report | | franklintempleton.com |
Franklin Utilities Fund
This annual report for Franklin Utilities Fund covers the fiscal year ended September 30, 2018.
Your Fund’s Goal and Main Investments
The Fund seeks both capital appreciation and current income by investing at least 80% of its net assets in the securities of public utility companies. These are companies that provide electricity, natural gas, water, and communications services to the public and companies that provide services to public utilities companies. The Fund concentrates (invests more than 25% of its total assets) in companies operating in the utilities industry. The Fund invests primarily in equity securities, which consist mainly of common stocks.
Performance Overview
The Fund’s Class A shares delivered a +1.68% cumulative total return for the 12 months under review. In comparison, the Standard & Poor’s 500 Index (S&P 500), which is a broad measure of U.S. stock performance, generated a +17.91% total return, and the S&P 500 Utilities Index, which measures the performance of all utilities stocks in the S&P 500, posted a +2.93% total return.1 You can find the Fund’s long-term performance data in the Performance Summary beginning on page 35.
Performance data represent past performance, which does not guarantee future results. Investment return will fluctuate. Current performance may differ from figures shown. For most recent month-end performance, go tofranklintempleton.com or call(800) 342-5236.
Investment Strategy
We search for the best return opportunities available in the global utilities arena with a specific focus on the U.S. electricity and gas sector. Generally, we seek to invest in companies producing a high percentage of earnings from their regulated operations.
Manager’s Discussion
During the 12 months under review, the utilities sector contributed to the Fund’s absolute performance.2 Individual contributors included our investments in NextEra Energy, Exelon and FirstEnergy. A clean energy company with interests
Portfolio Composition
Based on Total Net Assets as of 9/30/18
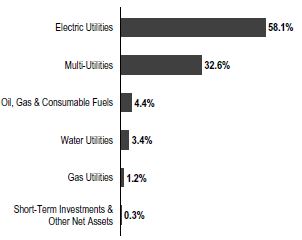
in generating and distributing electricity, NextEra Energy delivered strong quarterly earnings, driven by solid contribution from both Florida Power Light Company and NextEra Energy Resources segments. NextEra Energy also raised its earnings guidance due to U.S. tax reform. Shares of Exelon, a utility services holding company, enjoyed substantial rallies that outpaced most of its industry peers. Exelon’s share price was also helped by strong cash flow support from merchant operations, higher-than-expected 2018 earnings guidance, healthy earnings growth and increased annual dividend growth that reflected better cash flow due to U.S. tax reform. Diversified energy company FirstEnergy made progress in transitioning to a fully regulated utility during the period. It reported strong quarterly results, reaffirmed its earnings growth for the regulated business and provided an overall earnings growth guidance that was slightly better than consensus view. The company sold shares to raise capital, which it planned to use to reduce debt and supplement the pension fund.
In contrast, key individual detractors included utility companies PG&E, Edison International and PPL. Shares of PG&E were heavily impacted by the devastating fires that occurred in Northern California in 2017, which was feared to be a large potential liability, and the company eliminated its dividend. Renewable energy company Edison International’s shares declined due to lawsuits and increased costs resulting from the
1. Source: Morningstar.
The indexes are unmanaged and include reinvested dividends. They do not reflect any fees, expenses or sales charges. One cannot invest directly in an index, and an index is not representative of the Fund’s portfolio.
2. The utilities sector comprises electric utilities, gas utilities, multi-utilities and water utilities in the SOI.
The dollar value, number of shares or principal amount, and names of all portfolio holdings are listed in the Fund’s Statement of Investments (SOI).
The SOI begins on page 96.
| | | | |
| | | |
| franklintempleton.com | | Annual Report | | 33 |
FRANKLIN UTILITIES FUND
Top 10 Holdings
9/30/18
| | |
Company Sector/Industry | | % of Total Net Assets |
| |
NextEra Energy Inc. Electric Utilities | | 8.3% |
| |
Dominion Energy Inc. Multi-Utilities | | 5.2% |
| |
Exelon Corp. Electric Utilities | | 5.1% |
| |
American Electric Power Co. Inc. Electric Utilities | | 4.8% |
| |
Sempra Energy Multi-Utilities | | 4.8% |
| |
Duke Energy Corp. Electric Utilities | | 4.5% |
| |
Evergy Inc. Electric Utilities | | 4.4% |
| |
CMS Energy Corp. Multi-Utilities | | 4.4% |
| |
Edison International Electric Utilities | | 3.9% |
| |
Xcel Energy Inc. Electric Utilities | | 3.8% |
southern California wildfires and subsequent mudslides. Revenue for its subsidiary Southern California Edison was also limited pending a decision from the California Public Utilities Commission on a proposed rate increase. Electric utilities holding company PPL issued lower-than-expected 2018 earnings guidance due to plans to issue new equity to bolster assets after the implementation of U.S. tax reform. Concerns about regulation of their U.K. business and excessive leverage also depressed the stock. The energy sector also detracted from the Fund’s absolute performance, including energy company Enbridge.3
Thank you for your continued participation in Franklin Utilities Fund. We look forward to serving your future investment needs.
| | |

| | 
John C. Kohli, CFA |

| | 
J. Blair Schmicker, CFA |
| |
| | Portfolio Management Team |
The foregoing information reflects our analysis, opinions and portfolio holdings as of September 30, 2018, the end of the reporting period. The way we implement our main investment strategies and the resulting portfolio holdings may change depending on factors such as market and economic conditions. These opinions may not be relied upon as investment advice or an offer for a particular security. The information is not a complete analysis of every aspect of any market, country, industry, security or the Fund. Statements of fact are from sources considered reliable, but the investment manager makes no representation or warranty as to their completeness or accuracy. Although historical performance is no guarantee of future results, these insights may help you understand our investment management philosophy.
3. The energy sector comprises oil, gas and consumable fuels in the SOI.
See www.franklintempletondatasources.com for additional data provider information.
| | | | |
| | | |
34 | | Annual Report | | franklintempleton.com |
FRANKLIN UTILITIES FUND
Performance Summary as of September 30, 2018
The performance tables and graphs do not reflect any taxes that a shareholder would pay on Fund dividends, capital gain distributions, if any, or any realized gains on the sale of Fund shares. Total return reflects reinvestment of the Fund’s dividends and capital gain distributions, if any, and any unrealized gains or losses. Your dividend income will vary depending on dividends or interest paid by securities in the Fund’s portfolio, adjusted for operating expenses of each class. Capital gain distributions are net profits realized from the sale of portfolio securities.
Performance as of 9/30/181
Cumulative total return excludes sales charges. Average annual total return includes maximum sales charges. Sales charges will vary depending on the size of the investment and the class of share purchased. The maximum is 4.25% and the minimum is 0%.Class A: 4.25% maximum initial sales charge;Advisor Class: no sales charges. For other share classes, visitfranklintempleton.com.
| | | | |
| Share Class | | Cumulative
Total Return2 | | Average Annual
Total Return3 |
| | |
A4 | | | | |
| | |
1-Year | | +1.68% | | -2.64% |
| | |
5-Year | | +58.94% | | +8.76% |
| | |
10-Year | | +141.08% | | +8.73% |
| | |
Advisor | | | | |
| | |
1-Year | | +1.82% | | +1.82% |
| | |
5-Year | | +60.23% | | +9.89% |
| | |
10-Year | | +144.91% | | +9.37% |
| | | | | | | | |
| | | Distribution | | | | 30-Day Standardized Yield6 |
| Share Class | | Rate5 | | | | (with waiver) | | (without waiver) |
| | | | |
A7 | | —% | | | | —% | | —% |
| | | | |
Advisor | | 2.70% | | | | 3.00% | | 3.00% |
Performance data represent past performance, which does not guarantee future results. Investment return and principal value will fluctuate, and you may have a gain or loss when you sell your shares. Current performance may differ from figures shown. For most recent month-end performance, go tofranklintempleton.com or call(800) 342-5236.
See page 38 for Performance Summary footnotes.
| | | | |
| | | |
| franklintempleton.com | | Annual Report | | 35 |
FRANKLIN UTILITIES FUND
PERFORMANCE SUMMARY
Total Return Index Comparison for a Hypothetical $10,000 Investment1
Total return represents the change in value of an investment over the periods shown. It includes any applicable maximum sales charge, Fund expenses, account fees and reinvested distributions. The unmanaged indexes include reinvestment of any income or distributions. They differ from the Fund in composition and do not pay management fees or expenses. One cannot invest directly in an index.
Class A(10/1/08–9/30/18)
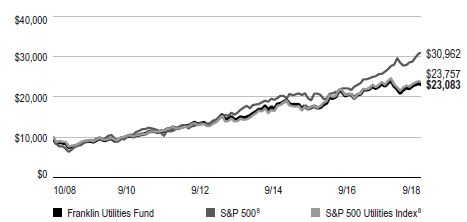
Advisor Class(10/1/08–9/30/18)
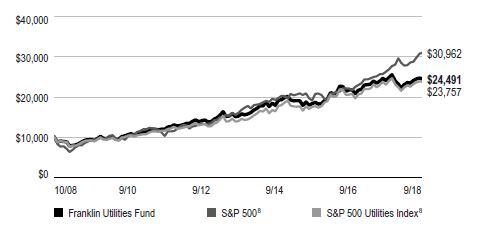
See page 38 for Performance Summary footnotes.
| | | | |
| | | |
36 | | Annual Report | | franklintempleton.com |
FRANKLIN UTILITIES FUND
PERFORMANCE SUMMARY
Net Asset Value
| | | | | | | | |
| Share Class(Symbol) | | 9/30/18 | | 9/10/18 | | 9/30/17 | | Change |
| | | | |
| A (FKUQX) | | $18.66 | | $19.16 | | N/A | | -$ 0.50 |
| | | | |
| A1(FKUTX) | | $18.66 | | N/A | | $19.18 | | -$ 0.52 |
| | | | |
| C (FRUSX) | | $18.57 | | N/A | | $19.09 | | -$ 0.52 |
| | | | |
| R (FRURX) | | $18.59 | | N/A | | $19.11 | | -$ 0.52 |
| | | | |
| R6(FUFRX) | | $18.81 | | N/A | | $19.32 | | -$ 0.51 |
| | | | |
| Advisor(FRUAX) | | $18.81 | | N/A | | $19.32 | | -$ 0.51 |
| | | | |
| Distributions(10/1/17–9/30/18) | | | | | | | | |
| Share Class | | Net Investment
Income | | Long-Term
Capital Gain | | Total | | |
| | | | |
| A (9/10/18–9/30/18) | | $ — | | $ — | | $ — | | |
| | | | |
| A1 | | $0.5355 | | $0.3087 | | $0.8442 | | |
| | | | |
| C | | $0.4422 | | $0.3087 | | $0.7509 | | |
| | | | |
| R | | $0.4701 | | $0.3087 | | $0.7788 | | |
| | | | |
| R6 | | $0.5813 | | $0.3087 | | $0.8900 | | |
| | | | |
| Advisor | | $0.5634 | | $0.3087 | | $0.8721 | | |
| | | |
| Total Annual Operating Expenses9 | | | | | | |
| | | | |
| Share Class | | | | | | | | |
| | | | |
| A | | 0.83% | | | | | | |
| | | | |
| Advisor | | 0.58% | | | | | | |
See page 38 for Performance Summary footnotes.
| | | | |
| | | |
| franklintempleton.com | | Annual Report | | 37 |
FRANKLIN UTILITIES FUND
PERFORMANCE SUMMARY
Each class of shares is available to certain eligible investors and has different annual fees and expenses, as described in the prospectus.
All investments involve risks, including possible loss of principal. Investing in a fund concentrating in the utilities sector involves special risks, including increased susceptibility to adverse economic and regulatory developments affecting the sector. Stocks historically have outperformed other asset classes over the long term, but tend to fluctuate more dramatically over the short term. Securities issued by utility companies have been historically sensitive to interest rate changes. When interest rates fall, utility securities prices, and thus a utilities fund’s share price, tend to rise; when interest rates rise, their prices generally fall. The Fund is actively managed but there is no guarantee that the manager’s investment decisions will produce the desired results. The Fund’s prospectus also includes a description of the main investment risks.
1. The Fund has a fee waiver associated with any investment it makes in a Franklin Templeton money fund and/or other Franklin Templeton fund, contractually guaranteed through 1/31/19. Fund investment results reflect the fee waiver; without this waiver, the results would have been lower.
2. Cumulative total return represents the change in value of an investment over the periods indicated.
3. Average annual total return represents the average annual change in value of an investment over the periods indicated. Return for less than one year, if any, has not been annualized.
4. Effective 9/10/18, Class A shares closed to new investors, were renamed Class A1 shares, and a new Class A share with a different expense structure became available. Class A performance shown has been calculated as follows: (a) for periods prior to 9/10/18, a restated figure is used based on the Fund’s Class A1 performance that includes any Rule12b-1 rate differential that exists between Class A1 and Class A; and (b) for periods after 9/10/18, actual Class A performance is used, reflecting all charges and fees applicable to that class.
5. Distribution rate is based on an annualization of the respective class’s current quarterly dividend and the maximum offering price (NAV for Advisor Class) per share on 9/30/18.
6. The Fund’s30-day standardized yield is calculated over a trailing30-day period using the yield to maturity on bonds and/or the dividends accrued on stocks. It may not equal the Fund’s actual income distribution rate, which reflects the Fund’s past dividends paid to shareholders.
7. Share Class A launched on 9/10/18 and yield cannot be produced until this share class has been in existence for 30 days. This value will not be calculated until 10/31/18.
8. Source: Morningstar. The S&P 500 is a market capitalization-weighted index of 500 stocks designed to measure total U.S. equity market performance. The S&P 500 Utilities Index is market capitalization weighted and consists of all utility stocks in the S&P 500.
9. Figures are as stated in the Fund’s current prospectus and may differ from the expense ratios disclosed in the Your Fund’s Expenses and Financial Highlights sections in this report. In periods of market volatility, assets may decline significantly, causing total annual Fund operating expenses to become higher than the figures shown.
See www.franklintempletondatasources.com for additional data provider information.
| | | | |
| | | |
38 | | Annual Report | | franklintempleton.com |
FRANKLIN UTILITIES FUND
Your Fund’s Expenses
As a Fund shareholder, you can incur two types of costs: (1) transaction costs, including sales charges (loads) on Fund purchases and redemptions; and (2) ongoing Fund costs, including management fees, distribution and service(12b-1) fees, and other Fund expenses. All mutual funds have ongoing costs, sometimes referred to as operating expenses. The table below shows ongoing costs of investing in the Fund and can help you understand these costs and compare them with those of other mutual funds. The table assumes a $1,000 investment held for the six months indicated.
Actual Fund Expenses
The table below provides information about actual account values and actual expenses in the columns under the heading “Actual.” In these columns the Fund’s actual return, which includes the effect of Fund expenses, is used to calculate the “Ending Account Value” for each class of shares. You can estimate the expenses you paid during the period by following these steps (of course, your account value and expenses will differ from those in this illustration): Divide your account value by $1,000 (if your account had an $8,600 value, then $8,600 ÷ $1,000 = 8.6). Then multiply the result by the number in the row for your class of shares under the headings “Actual” and “Expenses Paid During Period” (if Actual Expenses Paid During Period were $7.50, then 8.6 x $7.50 = $64.50). In this illustration, the actual expenses paid this period are $64.50.
Hypothetical Example for Comparison with Other Funds
Under the heading “Hypothetical” in the table, information is provided about hypothetical account values and hypothetical expenses based on the Fund’s actual expense ratio and an assumed rate of return of 5% per year before expenses, which is not the Fund’s actual return. This information may not be used to estimate the actual ending account balance or expenses you paid for the period, but it can help you compare ongoing costs of investing in the Fund with those of other funds. To do so, compare this 5% hypothetical example for the class of shares you hold with the 5% hypothetical examples that appear in the shareholder reports of other funds.
Please note that expenses shown in the table are meant to highlight ongoing costs and do not reflect any transactional costs. Therefore, information under the heading “Hypothetical” is useful in comparing ongoing costs only, and will not help you compare total costs of owning different funds. In addition, if transactional costs were included, your total costs would have been higher.
| | | | | | | | | | | | |
| | | | | Actual (actual return after expenses) | | Hypothetical (5% annual return before expenses) | | |
| | | | | | | | |
Share
Class | | Beginning
Account
Value 4/1/181 | | Ending
Account
Value 9/30/18 | | Expenses Paid During
Period 4/1/18–9/30/182,3,4 | | Ending
Account
Value 9/30/18 | | Expenses Paid During Period 4/1/18–9/30/183,4 | | Net
Annualized
Expense
Ratio4 |
| | | | | | |
A | | $1,000 | | $ 973.90 | | $0.45 | | $1,020.86 | | $4.26 | | 0.84% |
A1 | | $1,000 | | $1,059.10 | | $3.87 | | $1,021.31 | | $3.80 | | 0.75% |
C | | $1,000 | | $1,057.40 | | $6.45 | | $1,018.80 | | $6.33 | | 1.25% |
R | | $1,000 | | $1,057.50 | | $5.67 | | $1,019.55 | | $5.57 | | 1.10% |
R6 | | $1,000 | | $1,061.10 | | $2.53 | | $1,022.61 | | $2.48 | | 0.49% |
Advisor | | $1,000 | | $1,060.60 | | $3.10 | | $1,022.06 | | $3.04 | | 0.60% |
1. For Classes A1, C, R, R6 and Advisor, 4/1/18 for Actual and Hypothetical. For Class A, 9/10/18 for Actual and 4/1/18 for Hypothetical.
2. For Classes A1, C, R, R6 and Advisor, 4/1/18–9/30/18. For Class A, 9/10/18–9/30/18.
3. Expenses are equal to the annualized expense ratio for thesix-month period as indicated above—in the far right column—multiplied by the simple average account value over the period indicated, and then multiplied by 183/365 to reflect theone-half year period. The multiplier is 20/365 for Actual Class A expenses to reflect the number of days since inception.
4. Reflects expenses after fee waivers and expense reimbursements. Does not include acquired fund fees and expenses.
| | | | |
| | | |
| franklintempleton.com | | Annual Report | | 39 |
FRANKLIN CUSTODIAN FUNDS
Financial Highlights
Franklin DynaTech Fund
| | | | | | | | | | | | | | | | | | | | |
| | | Year Ended September 30, | |
| | | 2018 | | | 2017 | | | 2016 | | | 2015 | | | 2014 | |
| |
| | | | | |
Class A | | | | | | | | | | | | | | | | | | | | |
| | | | | |
Per share operating performance | | | | | | | | | | | | | | | | | | | | |
(for a share outstanding throughout the year) | | | | | | | | | | | | | | | | | | | | |
Net asset value, beginning of year | | | $63.10 | | | | $52.05 | | | | $46.04 | | | | $46.08 | | | | $42.13 | |
| | | | |
| | | | | |
Income from investment operationsa: | | | | | | | | | | | | | | | | | | | | |
Net investment income (loss)b | | | (0.23 | ) | | | (0.18 | ) | | | (0.14 | ) | | | (0.21 | ) | | | (0.18 | ) |
Net realized and unrealized gains (losses) | | | 19.45 | | | | 12.92 | | | | 7.35 | | | | 1.78 | | | | 5.94 | |
| | | | |
| | | | | |
Total from investment operations | | | 19.22 | | | | 12.74 | | | | 7.21 | | | | 1.57 | | | | 5.76 | |
| | | | |
| | | | | |
Less distributions from net realized gains | | | (1.16 | ) | | | (1.69 | ) | | | (1.20 | ) | | | (1.61 | ) | | | (1.81 | ) |
| | | | |
| | | | | |
Net asset value, end of year | | | $81.16 | | | | $63.10 | | | | $52.05 | | | | $46.04 | | | | $46.08 | |
| | | | |
| | | | | |
Total returnc | | | 30.88% | | | | 25.67% | | | | 15.73% | | | | 3.40% | | | | 13.98% | |
| | | | | |
Ratios to average net assets | | | | | | | | | | | | | | | | | | | | |
Expenses before waiver and payments by affiliates | | | 0.86% | | | | 0.92% | | | | 0.91% | | | | 0.89% | | | | 0.89% | |
Expenses net of waiver and payments by affiliates | | | 0.86% | d,e | | | 0.91% | d | | | 0.90% | | | | 0.89% | e | | | 0.89% | d,e |
Net investment income (loss) | | | (0.32)% | | | | (0.33)% | | | | (0.30)% | | | | (0.44)% | | | | (0.41)% | |
| | | | | |
Supplemental data | | | | | | | | | | | | | | | | | | | | |
Net assets, end of year (000’s) | | | $3,741,562 | | | | $2,498,393 | | | | $2,123,082 | | | | $1,857,570 | | | | $1,504,338 | |
Portfolio turnover rate | | | 17.22% | | | | 19.85% | | | | 22.42% | | | | 31.02% | | | | 26.43% | |
aThe amount shown for a share outstanding throughout the period may not correlate with the Statement of Operations for the period due to the timing of sales and repurchases of the Fund’s shares in relation to income earned and/or fluctuating fair value of the investments of the Fund.
bBased on average daily shares outstanding.
cTotal return does not reflect sales commissions or contingent deferred sales charges, if applicable.
dBenefit of expense reduction rounds to less than 0.01%.
eBenefit of waiver and payments by affiliates rounds to less than 0.01%.
| | | | |
| | | |
40 | | Annual Report | The accompanying notes are an integral part of these financial statements. | | franklintempleton.com |
FRANKLIN CUSTODIAN FUNDS
FINANCIAL HIGHLIGHTS
Franklin DynaTech Fund(continued)
| | | | | | | | | | | | | | | | | | | | |
| | | Year Ended September 30, | |
| | | 2018 | | | 2017 | | | 2016 | | | 2015 | | | 2014 | |
| |
| | | | | |
Class C | | | | | | | | | | | | | | | | | | | | |
| | | | | |
Per share operating performance | | | | | | | | | | | | | | | | | | | | |
(for a share outstanding throughout the year) | | | | | | | | | | | | | | | | | | | | |
Net asset value, beginning of year | | | $53.49 | | | | $44.71 | | | | $40.00 | | | | $40.53 | | | | $37.53 | |
| | | | |
| | | | | |
Income from investment operationsa: | | | | | | | | | | | | | | | | | | | | |
Net investment income (loss)b | | | (0.65 | ) | | | (0.50 | ) | | | (0.43 | ) | | | (0.50 | ) | | | (0.46 | ) |
Net realized and unrealized gains (losses) | | | 16.39 | | | | 10.97 | | | | 6.34 | | | | 1.58 | | | | 5.27 | |
| | | | |
| | | | | |
Total from investment operations | | | 15.74 | | | | 10.47 | | | | 5.91 | | | | 1.08 | | | | 4.81 | |
| | | | |
| | | | | |
Less distributions from net realized gains | | | (1.16 | ) | | | (1.69 | ) | | | (1.20 | ) | | | (1.61 | ) | | | (1.81 | ) |
| | | | |
| | | | | |
Net asset value, end of year. | | | $68.07 | | | | $53.49 | | | | $44.71 | | | | $40.00 | | | | $40.53 | |
| | | | |
| | | | | |
Total returnc | | | 29.93% | | | | 24.72% | | | | 14.86% | | | | 2.63% | | | | 13.13% | |
| | | | | |
Ratios to average net assets | | | | | | | | | | | | | | | | | | | | |
Expenses before waiver and payments by affiliates | | | 1.61% | | | | 1.67% | | | | 1.66% | | | | 1.64% | | | | 1.64% | |
Expenses net of waiver and payments by affiliates | | | 1.61% | d,e | | | 1.66% | d | | | 1.65% | | | | 1.64% | e | | | 1.64% | d,e |
Net investment income (loss) | | | (1.07)% | | | | (1.08)% | | | | (1.05)% | | | | (1.19)% | | | | (1.16)% | |
| | | | | |
Supplemental data | | | | | | | | | | | | | | | | | | | | |
Net assets, end of year (000’s) | | | $611,221 | | | | $374,502 | | | | $318,896 | | | | $270,961 | | | | $212,961 | |
Portfolio turnover rate | | | 17.22% | | | | 19.85% | | | | 22.42% | | | | 31.02% | | | | 26.43% | |
aThe amount shown for a share outstanding throughout the period may not correlate with the Statement of Operations for the period due to the timing of sales and repurchases of the Fund’s shares in relation to income earned and/or fluctuating fair value of the investments of the Fund.
bBased on average daily shares outstanding.
cTotal return does not reflect sales commissions or contingent deferred sales charges, if applicable.
dBenefit of expense reduction rounds to less than 0.01%.
eBenefit of waiver and payments by affiliates rounds to less than 0.01%.
| | | | |
| | | |
| franklintempleton.com | | The accompanying notes are an integral part of these financial statements. | Annual Report | | 41 |
FRANKLIN CUSTODIAN FUNDS
FINANCIAL HIGHLIGHTS
Franklin DynaTech Fund(continued)
| | | | | | | | | | | | | | | | | | | | |
| | | Year Ended September 30, | |
| | | 2018 | | | 2017 | | | 2016 | | | 2015 | | | 2014 | |
| |
| | | | | |
Class R | | | | | | | | | | | | | | | | | | | | |
| | | | | |
Per share operating performance | | | | | | | | | | | | | | | | | | | | |
(for a share outstanding throughout the year) | | | | | | | | | | | | | | | | | | | | |
Net asset value, beginning of year | | | $61.51 | | | | $50.90 | | | | $45.16 | | | | $45.35 | | | | $41.58 | |
| | | | |
| | | | | |
Income from investment operationsa: | | | | | | | | | | | | | | | | | | | | |
Net investment income (loss)b | | | (0.40 | ) | | | (0.31 | ) | | | (0.26 | ) | | | (0.32 | ) | | | (0.29 | ) |
Net realized and unrealized gains (losses) | | | 18.93 | | | | 12.61 | | | | 7.20 | | | | 1.74 | | | | 5.87 | |
| | | | |
| | | | | |
Total from investment operations | | | 18.53 | | | | 12.30 | | | | 6.94 | | | | 1.42 | | | | 5.58 | |
| | | | |
| | | | | |
Less distributions from net realized gains | | | (1.16 | ) | | | (1.69 | ) | | | (1.20 | ) | | | (1.61 | ) | | | (1.81 | ) |
| | | | |
| | | | | |
Net asset value, end of year. | | | $78.88 | | | | $61.51 | | | | $50.90 | | | | $45.16 | | | | $45.35 | |
| | | | |
| | | | | |
Total return | | | 30.57% | | | | 25.36% | | | | 15.43% | | | | 3.11% | | | | 13.72% | |
| | | | | |
Ratios to average net assets | | | | | | | | | | | | | | | | | | | | |
Expenses before waiver and payments by affiliates | | | 1.11% | | | | 1.17% | | | | 1.16% | | | | 1.14% | | | | 1.14% | |
Expenses net of waiver and payments by affiliates | | | 1.11% | c,d | | | 1.16% | c | | | 1.15% | | | | 1.14% | d | | | 1.14% | c,d |
Net investment income (loss) | | | (0.57)% | | | | (0.58)% | | | | (0.55)% | | | | (0.69)% | | | | (0.66)% | |
| | | | | |
Supplemental data | | | | | | | | | | | | | | | | | | | | |
Net assets, end of year (000’s) | | | $95,925 | | | | $47,860 | | | | $38,862 | | | | $43,001 | | | | $45,230 | |
Portfolio turnover rate | | | 17.22% | | | | 19.85% | | | | 22.42% | | | | 31.02% | | | | 26.43% | |
aThe amount shown for a share outstanding throughout the period may not correlate with the Statement of Operations for the period due to the timing of sales and repurchases of the Fund’s shares in relation to income earned and/or fluctuating fair value of the investments of the Fund.
bBased on average daily shares outstanding.
cBenefit of expense reduction rounds to less than 0.01%.
dBenefit of waiver and payments by affiliates rounds to less than 0.01%.
| | | | |
| | | |
42 | | Annual Report | The accompanying notes are an integral part of these financial statements. | | franklintempleton.com |
FRANKLIN CUSTODIAN FUNDS
FINANCIAL HIGHLIGHTS
Franklin DynaTech Fund(continued)
| | | | | | | | | | | | | | | | | | | | |
| | | Year Ended September 30, | |
| | | 2018 | | | 2017 | | | 2016 | | | 2015 | | | 2014 | |
| |
| | | | | |
Class R6 | | | | | | | | | | | | | | | | | | | | |
| | | | | |
Per share operating performance | | | | | | | | | | | | | | | | | | | | |
(for a share outstanding throughout the year) | | | | | | | | | | | | | | | | | | | | |
Net asset value, beginning of year | | | $65.28 | | | | $53.56 | | | | $47.15 | | | | $46.97 | | | | $42.74 | |
| | | | |
| | | | | |
Income from investment operationsa: | | | | | | | | | | | | | | | | | | | | |
Net investment income (loss)b | | | 0.04 | | | | 0.06 | | | | 0.06 | | | | (0.01 | ) | | | (0.01 | ) |
Net realized and unrealized gains (losses) | | | 20.15 | | | | 13.35 | | | | 7.55 | | | | 1.80 | | | | 6.05 | |
| | | | |
| | | | | |
Total from investment operations | | | 20.19 | | | | 13.41 | | | | 7.61 | | | | 1.79 | | | | 6.04 | |
| | | | |
| | | | | |
Less distributions from net realized gains | | | (1.16 | ) | | | (1.69 | ) | | | (1.20 | ) | | | (1.61 | ) | | | (1.81 | ) |
| | | | |
| | | | | |
Net asset value, end of year | | | $84.31 | | | | $65.28 | | | | $53.56 | | | | $47.15 | | | | $46.97 | |
| | | | |
| | | | | |
Total return | | | 31.38% | | | | 26.17% | | | | 16.21% | | | | 3.81% | | | | 14.45% | |
| | | | | |
Ratios to average net assets | | | | | | | | | | | | | | | | | | | | |
Expenses before waiver and payments by affiliates | | | 0.50% | | | | 0.49% | | | | 0.49% | | | | 0.48% | | | | 0.49% | |
Expenses net of waiver and payments by affiliates | | | 0.50% | c,d | | | 0.48% | c | | | 0.48% | | | | 0.48% | d | | | 0.49% | c,d |
Net investment income (loss) | | | 0.04% | | | | 0.10% | | | | 0.12% | | | | (0.03)% | | | | (0.01)% | |
| | | | | |
Supplemental data | | | | | | | | | | | | | | | | | | | | |
Net assets, end of year (000’s) | | | $1,688,595 | | | | $457,846 | | | | $359,505 | | | | $362,627 | | | | $342,466 | |
Portfolio turnover rate | | | 17.22% | | | | 19.85% | | | | 22.42% | | | | 31.02% | | | | 26.43% | |
aThe amount shown for a share outstanding throughout the period may not correlate with the Statement of Operations for the period due to the timing of sales and repurchases of the Fund’s shares in relation to income earned and/or fluctuating fair value of the investments of the Fund.
bBased on average daily shares outstanding.
cBenefit of expense reduction rounds to less than 0.01%.
dBenefit of waiver and payments by affiliates rounds to less than 0.01%.
| | | | |
| | | |
| franklintempleton.com | | The accompanying notes are an integral part of these financial statements. | Annual Report | | 43 |
FRANKLIN CUSTODIAN FUNDS
FINANCIAL HIGHLIGHTS
Franklin DynaTech Fund(continued)
| | | | | | | | | | | | | | | | | | | | |
| | | Year Ended September 30, | |
| | | 2018 | | | 2017 | | | 2016 | | | 2015 | | | 2014 | |
| |
| | | | | |
Advisor Class | | | | | | | | | | | | | | | | | | | | |
| | | | | |
Per share operating performance | | | | | | | | | | | | | | | | | | | | |
(for a share outstanding throughout the year) | | | | | | | | | | | | | | | | | | | | |
Net asset value, beginning of year | | | $64.78 | | | | $53.25 | | | | $46.96 | | | | $46.87 | | | | $42.71 | |
| | | | |
| | | | | |
Income from investment operationsa: | | | | | | | | | | | | | | | | | | | | |
Net investment income (loss)b | | | (0.06 | ) | | | (0.04 | ) | | | (0.03 | ) | | | (0.09 | ) | | | (0.07 | ) |
Net realized and unrealized gains (losses) | | | 20.00 | | | | 13.26 | | | | 7.52 | | | | 1.79 | | | | 6.04 | |
| | | | |
| | | | | |
Total from investment operations | | | 19.94 | | | | 13.22 | | | | 7.49 | | | | 1.70 | | | | 5.97 | |
| | | | |
| | | | | |
Less distributions from net realized gains | | | (1.16 | ) | | | (1.69 | ) | | | (1.20 | ) | | | (1.61 | ) | | | (1.81 | ) |
| | | | |
| | | | | |
Net asset value, end of year | | | $83.56 | | | | $64.78 | | | | $53.25 | | | | $46.96 | | | | $46.87 | |
| | | | |
| | | | | |
Total return | | | 31.21% | | | | 25.98% | | | | 16.02% | | | | 3.62% | | | | 14.29% | |
| | | | | |
Ratios to average net assets | | | | | | | | | | | | | | | | | | | | |
Expenses before waiver and payments by affiliates | | | 0.61% | | | | 0.67% | | | | 0.66% | | | | 0.64% | | | | 0.64% | |
Expenses net of waiver and payments by affiliates | | | 0.61% | c,d | | | 0.66% | c | | | 0.65% | | | | 0.64% | d | | | 0.64% | c,d |
Net investment income (loss) | | | (0.07)% | | | | (0.08)% | | | | (0.05)% | | | | (0.19)% | | | | (0.16)% | |
| | | | | |
Supplemental data | | | | | | | | | | | | | | | | | | | | |
Net assets, end of year (000’s) | | | $680,066 | | | | $712,762 | | | | $203,443 | | | | $176,090 | | | | $159,180 | |
Portfolio turnover rate | | | 17.22% | | | | 19.85% | | | | 22.42% | | | | 31.02% | | | | 26.43% | |
aThe amount shown for a share outstanding throughout the period may not correlate with the Statement of Operations for the period due to the timing of sales and repurchases of the Fund’s shares in relation to income earned and/or fluctuating fair value of the investments of the Fund.
bBased on average daily shares outstanding.
cBenefit of expense reduction rounds to less than 0.01%.
dBenefit of waiver and payments by affiliates rounds to less than 0.01%.
| | | | |
| | | |
44 | | Annual Report | The accompanying notes are an integral part of these financial statements. | | franklintempleton.com |
FRANKLIN CUSTODIAN FUNDS
Statement of Investments, September 30, 2018
Franklin DynaTech Fund
| | | | | | | | | | |
| | | Country | | Shares | | | Value | |
Common Stocks 97.8% | | | | | | | | | | |
Aerospace & Defense 3.8% | | | | | | | | | | |
The Boeing Co. | | United States | | | 250,000 | | | $ | 92,975,000 | |
Heico Corp. | | United States | | | 650,000 | | | | 60,196,500 | |
Raytheon Co. | | United States | | | 500,000 | | | | 103,330,000 | |
| | | | | | | | | | |
| | | |
| | | | | | | | | 256,501,500 | |
| | | | | | | | | | |
Air Freight & Logistics 0.7% | | | | | | | | | | |
FedEx Corp. | | United States | | | 200,000 | | | | 48,158,000 | |
| | | | | | | | | | |
Biotechnology 2.0% | | | | | | | | | | |
Amgen Inc. | | United States | | | 80,000 | | | | 16,583,200 | |
aAudentes Therapeutics Inc. | | United States | | | 20,000 | | | | 791,800 | |
aBluebird Bio Inc. | | United States | | | 100,000 | | | | 14,600,000 | |
aGenomic Health Inc. | | United States | | | 100,000 | | | | 7,022,000 | |
aHomology Medicines Inc. | | United States | | | 30,000 | | | | 685,800 | |
aNeurocrine Biosciences Inc. | | United States | | | 300,000 | | | | 36,885,000 | |
aPTC Therapeutics Inc. | | United States | | | 150,000 | | | | 7,050,000 | |
aRegeneron Pharmaceuticals Inc. | | United States | | | 50,000 | | | | 20,202,000 | |
aSarepta Therapeutics Inc. | | United States | | | 175,000 | | | | 28,264,250 | |
auniQure NV | | Netherlands | | | 100,000 | | | | 3,639,000 | |
| | | | | | | | | | |
| | | |
| | | | | | | | | 135,723,050 | |
| | | | | | | | | | |
Capital Markets 3.9% | | | | | | | | | | |
The Charles Schwab Corp. | | United States | | | 1,400,000 | | | | 68,810,000 | |
Intercontinental Exchange Inc. | | United States | | | 750,000 | | | | 56,167,500 | |
Moody’s Corp. | | United States | | | 350,000 | | | | 58,520,000 | |
MSCI Inc. | | United States | | | 450,000 | | | | 79,834,500 | |
Nasdaq Inc. | | United States | | | 25,000 | | | | 2,145,000 | |
| | | | | | | | | | |
| | | |
| | | | | | | | | 265,477,000 | |
| | | | | | | | | | |
Communications Equipment 0.4% | | | | | | | | | | |
aArista Networks Inc. | | United States | | | 50,000 | | | | 13,293,000 | |
aPalo Alto Networks Inc. | | United States | | | 60,000 | | | | 13,515,600 | |
| | | | | | | | | | |
| | | |
| | | | | | | | | 26,808,600 | |
| | | | | | | | | | |
Diversified Consumer Services 0.4% | | | | | | | | | | |
aBright Horizons Family Solutions Inc. | | United States | | | 250,000 | | | | 29,460,000 | |
| | | | | | | | | | |
Electrical Equipment 0.2% | | | | | | | | | | |
Nidec Corp. | | Japan | | | 100,000 | | | | 14,382,507 | |
| | | | | | | | | | |
Electronic Equipment, Instruments & Components 1.9% | | | | | | | | | | |
Amphenol Corp., A | | United States | | | 700,000 | | | | 65,814,000 | |
Cognex Corp. | | United States | | | 400,000 | | | | 22,328,000 | |
Keyence Corp. | | Japan | | | 75,000 | | | | 43,543,491 | |
| | | | | | | | | | |
| | | |
| | | | | | | | | 131,685,491 | |
| | | | | | | | | | |
Entertainment 3.7% | | | | | | | | | | |
Activision Blizzard Inc. | | United States | | | 750,000 | | | | 62,392,500 | |
aElectronic Arts Inc. | | United States | | | 500,000 | | | | 60,245,000 | |
aNetflix Inc. | | United States | | | 250,000 | | | | 93,532,500 | |
aSea Ltd., ADR | | Thailand | | | 50,000 | | | | 691,500 | |
aSpotify Technology SA | | United States | | | 120,000 | | | | 21,699,600 | |
aTake-Two Interactive Software Inc. | | United States | | | 100,000 | | | | 13,799,000 | |
| | | | | | | | | | |
| | | |
| | | | | | | | | 252,360,100 | |
| | | | | | | | | | |
| | | | |
| | | |
| franklintempleton.com | | Annual Report | | 45 |
FRANKLIN CUSTODIAN FUNDS
STATEMENT OF INVESTMENTS
Franklin DynaTech Fund(continued)
| | | | | | | | | | |
| | | Country | | Shares | | | Value | |
Common Stocks(continued) | | | | | | | | | | |
Equity Real Estate Investment Trusts (REITs) 2.4% | | | | | | | | | | |
American Tower Corp. | | United States | | | 400,000 | | | $ | 58,120,000 | |
Equinix Inc. | | United States | | | 100,000 | | | | 43,289,000 | |
aSBA Communications Corp., A | | United States | | | 400,000 | | | | 64,252,000 | |
| | | | | | | | | | |
| | | |
| | | | | | | | | 165,661,000 | |
| | | | | | | | | | |
Health Care Equipment & Supplies 9.4% | | | | | | | | | | |
Abbott Laboratories | | United States | | | 1,000,000 | | | | 73,360,000 | |
aABIOMED Inc. | | United States | | | 140,000 | | | | 62,965,000 | |
aAlign Technology Inc. | | United States | | | 70,000 | | | | 27,385,400 | |
Becton, Dickinson and Co. | | United States | | | 250,000 | | | | 65,250,000 | |
Danaher Corp. | | United States | | | 500,000 | | | | 54,330,000 | |
aEdwards Lifesciences Corp. | | United States | | | 300,000 | | | | 52,230,000 | |
aIDEXX Laboratories Inc. | | United States | | | 450,000 | | | | 112,347,000 | |
aIntuitive Surgical Inc. | | United States | | | 150,000 | | | | 86,100,000 | |
aiRhythm Technologies Inc. | | United States | | | 315,000 | | | | 29,817,900 | |
aNeuronetics Inc. | | United States | | | 160,800 | | | | 5,155,248 | |
ResMed Inc. | | United States | | | 75,000 | | | | 8,650,500 | |
aSiemens Healthineers AG | | Germany | | | 250,000 | | | | 10,992,746 | |
Stryker Corp. | | United States | | | 300,000 | | | | 53,304,000 | |
| | | | | | | | | | |
| | | |
| | | | | | | | | 641,887,794 | |
| | | | | | | | | | |
Health Care Providers & Services 1.4% | | | | | | | | | | |
UnitedHealth Group Inc. | | United States | | | 350,000 | | | | 93,114,000 | |
| | | | | | | | | | |
Health Care Technology 1.3% | | | | | | | | | | |
aInspire Medical Systems Inc. | | United States | | | 350,000 | | | | 14,728,000 | |
aVeeva Systems Inc. | | United States | | | 700,000 | | | | 76,209,000 | |
| | | | | | | | | | |
| | | |
| | | | | | | | | 90,937,000 | |
| | | | | | | | | | |
Industrial Conglomerates 0.3% | | | | | | | | | | |
Roper Technologies Inc. | | United States | | | 75,000 | | | | 22,215,750 | |
| | | | | | | | | | |
Interactive Media & Services 9.3% | | | | | | | | | | |
aAlphabet Inc., A | | United States | | | 200,000 | | | | 241,416,000 | |
aAlphabet Inc., C | | United States | | | 62,170 | | | | 74,198,030 | |
aCarGurus Inc. | | United States | | | 375,000 | | | | 20,883,750 | |
aEventbrite Inc., A | | United States | | | 113,500 | | | | 4,309,595 | |
aFacebook Inc., A. | | United States | | | 1,000,000 | | | | 164,460,000 | |
aMatch Group Inc. | | United States | | | 350,000 | | | | 20,268,500 | |
a,bMeituan Dianping, Reg S, B | | China | | | 680,400 | | | | 5,970,899 | |
Tencent Holdings Ltd. | | China | | | 2,500,000 | | | | 103,211,961 | |
| | | | | | | | | | |
| | | |
| | | | | | | | | 634,718,735 | |
| | | | | | | | | | |
Internet & Direct Marketing Retail 11.3% | | | | | | | | | | |
aAlibaba Group Holding Ltd., ADR | | China | | | 500,000 | | | | 82,380,000 | |
aAmazon.com Inc. | | United States | | | 250,000 | | | | 500,750,000 | |
aBooking Holdings Inc. | | United States | | | 20,000 | | | | 39,680,000 | |
aDelivery Hero SE | | Germany | | | 350,000 | | | | 16,830,293 | |
aEtsy Inc. | | United States | | | 500,000 | | | | 25,690,000 | |
aGrubHub Inc. | | United States | | | 300,000 | | | | 41,586,000 | |
aJust Eat PLC | | United Kingdom | | | 100,000 | | | | 873,639 | |
MercadoLibre Inc. | | Argentina | | | 100,000 | | | | 34,047,000 | |
aMercari Inc. | | Japan | | | 200,000 | | | | 6,608,298 | |
Zozo Inc. | | Japan | | | 750,000 | | | | 22,702,275 | |
| | | | | | | | | | |
| | | |
| | | | | | | | | 771,147,505 | |
| | | | | | | | | | |
| | | | |
| | | |
46 | | Annual Report | | franklintempleton.com |
FRANKLIN CUSTODIAN FUNDS
STATEMENT OF INVESTMENTS
Franklin DynaTech Fund (continued)
| | | | | | | | | | |
| | | Country | | Shares | | | Value | |
Common Stocks(continued) | | | | | | | | | | |
IT Services 11.1% | | | | | | | | | | |
aAdyen NV | | Netherlands | | | 65,000 | | | $ | 53,049,612 | |
aFiserv Inc. | | United States | | | 500,000 | | | | 41,190,000 | |
aGoDaddy Inc., A | | United States | | | 500,000 | | | | 41,695,000 | |
aI3 Verticals Inc., A | | United States | | | 277,300 | | | | 6,372,354 | |
aInterXion Holding NV | | Netherlands | | | 500,000 | | | | 33,650,000 | |
Mastercard Inc., A | | United States | | | 1,000,000 | | | | 222,610,000 | |
aMongoDB Inc. | | United States | | | 325,000 | | | | 26,503,750 | |
aPagSeguro Digital Ltd. | | Brazil | | | 350,000 | | | | 9,684,500 | |
aPayPal Holdings Inc. | | United States | | | 600,000 | | | | 52,704,000 | |
aShopify Inc., A | | Canada | | | 350,000 | | | | 57,487,138 | |
aSquare Inc., A | | United States | | | 650,000 | | | | 64,356,500 | |
Visa Inc., A | | United States | | | 1,000,000 | | | | 150,090,000 | |
| | | | | | | | | | |
| | | |
| | | | | | | | | 759,392,854 | |
| | | | | | | | | | |
Life Sciences Tools & Services 2.2% | | | | | | | | | | |
aIllumina Inc. | | United States | | | 225,000 | | | | 82,588,500 | |
Thermo Fisher Scientific Inc. | | United States | | | 200,000 | | | | 48,816,000 | |
aWaters Corp. | | United States | | | 100,000 | | | | 19,468,000 | |
| | | | | | | | | | |
| | | |
| | | | | | | | | 150,872,500 | |
| | | | | | | | | | |
Machinery 1.2% | | | | | | | | | | |
Fortive Corp. | | United States | | | 1,000,000 | | | | 84,200,000 | |
| | | | | | | | | | |
Media 0.3% | | | | | | | | | | |
aLiberty Broadband Corp., A | | United States | | | 200,000 | | | | 16,866,000 | |
| | | | | | | | | | |
Pharmaceuticals 0.3% | | | | | | | | | | |
aElanco Animal Health Inc. | | United States | | | 247,800 | | | | 8,645,742 | |
Merck KGaA | | Germany | | | 100,000 | | | | 10,332,455 | |
| | | | | | | | | | |
| | | |
| | | | | | | | | 18,978,197 | |
| | | | | | | | | | |
Professional Services 1.2% | | | | | | | | | | |
aCoStar Group Inc. | | United States | | | 150,000 | | | | 63,126,000 | |
TransUnion | | United States | | | 200,000 | | | | 14,716,000 | |
| | | | | | | | | | |
| | | |
| | | | | | | | | 77,842,000 | |
| | | | | | | | | | |
Real Estate Management & Development 0.0%† | | | | | | | | | | |
aRedfin Corp. | | United States | | | 50,000 | | | | 935,000 | |
| | | | | | | | | | |
Semiconductors & Semiconductor Equipment 6.1% | | | | | | | | | | |
Analog Devices Inc. | | United States | | | 500,000 | | | | 46,230,000 | |
ASML Holding NV, N.Y. shs | | Netherlands | | | 200,000 | | | | 37,604,000 | |
Intel Corp. | | United States | | | 1,000,000 | | | | 47,290,000 | |
KLA-Tencor Corp. | | United States | | | 150,000 | | | | 15,256,500 | |
Lam Research Corp. | | United States | | | 350,000 | | | | 53,095,000 | |
Monolithic Power Systems | | United States | | | 350,000 | | | | 43,935,500 | |
NVIDIA Corp. | | United States | | | 425,000 | | | | 119,433,500 | |
Xilinx Inc. | | United States | | | 625,000 | | | | 50,106,250 | |
| | | | | | | | | | |
| | | |
| | | | | | | | | 412,950,750 | |
| | | | | | | | | | |
Software 21.4% | | | | | | | | | | |
a2U Inc. | | United States | | | 500,000 | | | | 37,595,000 | |
aAdobe Systems Inc. | | United States | | | 500,000 | | | | 134,975,000 | |
aAltair Engineering Inc. | | United States | | | 500,000 | | | | 21,725,000 | |
aAlteryx Inc. | | United States | | | 225,000 | | | | 12,872,250 | |
aANSYS Inc. | | United States | | | 200,000 | | | | 37,336,000 | |
aAspen Technology Inc. | | United States | | | 500,000 | | | | 56,955,000 | |
| | | | |
| | | |
| franklintempleton.com | | Annual Report | | 47 |
FRANKLIN CUSTODIAN FUNDS
STATEMENT OF INVESTMENTS
Franklin DynaTech Fund(continued)
| | | | | | | | | | |
| | | Country | | Shares | | | Value | |
Common Stocks(continued) | | | | | | | | | | |
Software(continued) | | | | | | | | | | |
aAtlassian Corp. PLC | | United States | | | 500,000 | | | $ | 48,070,000 | |
aAutodesk Inc. | | United States | | | 400,000 | | | | 62,444,000 | |
aAvalara Inc. | | United States | | | 110,000 | | | | 3,842,300 | |
aBlackline Inc. | | United States | | | 350,000 | | | | 19,764,500 | |
aCadence Design Systems Inc. | | United States | | | 500,000 | | | | 22,660,000 | |
Constellation Software Inc. | | Canada | | | 5,000 | | | | 3,674,403 | |
aDocuSign Inc. | | United States | | | 500,000 | | | | 26,285,000 | |
aDropbox Inc., A | | United States | | | 150,000 | | | | 4,024,500 | |
aGuidewire Software Inc. | | United States | | | 500,000 | | | | 50,505,000 | |
aHubspot Inc. | | United States | | | 250,000 | | | | 37,737,500 | |
Intuit Inc. | | United States | | | 300,000 | | | | 68,220,000 | |
Microsoft Corp. | | United States | | | 2,000,000 | | | | 228,740,000 | |
aPluralsight Inc., A | | United States | | | 500,000 | | | | 16,000,000 | |
aPTC Inc. | | United States | | | 25,000 | | | | 2,654,750 | |
aQ2 Holdings Inc. | | United States | | | 500,000 | | | | 30,275,000 | |
aRealPage Inc. | | United States | | | 25,000 | | | | 1,647,500 | |
aSalesforce.com Inc. | | United States | | | 1,000,000 | | | | 159,030,000 | |
aSendGrid Inc. | | United States | | | 100,000 | | | | 3,679,000 | |
aServiceNow Inc. | | United States | | | 600,000 | | | | 117,378,000 | |
aSmartsheet Inc. A | | United States | | | 200,000 | | | | 6,252,000 | |
aSplunk Inc. | | United States | | | 500,000 | | | | 60,455,000 | |
aSVMK Inc. | | United States | | | 125,100 | | | | 2,005,353 | |
aTyler Technologies Inc. | | United States | | | 100,000 | | | | 24,506,000 | |
aUltimate Software Group Inc. | | United States | | | 100,000 | | | | 32,219,000 | |
aWorkday Inc., A | | United States | | | 500,000 | | | | 72,990,000 | |
aZendesk Inc. | | United States | | | 500,000 | | | | 35,500,000 | |
aZscaler Inc. | | United States | | | 200,000 | | | | 8,156,000 | |
aZuora Inc. | | United States | | | 200,000 | | | | 4,622,000 | |
| | | | | | | | | | |
| | | |
| | | | | | | | | 1,454,795,056 | |
| | | | | | | | | | |
Technology Hardware, Storage & Peripherals 1.3% | | | | | | | | | | |
Apple Inc. | | United States | | | 400,000 | | | | 90,296,000 | |
| | | | | | | | | | |
Textiles, Apparel & Luxury Goods 0.3% | | | | | | | | | | |
NIKE Inc., B | | United States | | | 200,000 | | | | 16,944,000 | |
| | | | | | | | | | |
Total Common Stocks (Cost $3,421,116,937) | | | | | | | | | 6,664,310,389 | |
| | | | | | | | | | |
| | | |
| | | | | | | | | | |
Short Term Investments (Cost $125,141,525) 1.8% | | | | | | | | | | |
| | | |
Money Market Funds 1.8% | | | | | | | | | | |
c,dInstitutional Fiduciary Trust Money Market Portfolio, 1.69% | | United States | | | 125,141,525 | | | | 125,141,525 | |
| | | | | | | | | | |
Total Investments (Cost $3,546,258,462) 99.6% | | | | | | | | | 6,789,451,914 | |
Other Assets, less Liabilities 0.4% | | | | | | | | | 27,917,474 | |
| | | | | | | | | | |
Net Assets 100.0% | | | | | | | | $ | 6,817,369,388 | |
| | | | | | | | | | |
| | | | |
| | | |
48 | | Annual Report | | franklintempleton.com |
FRANKLIN CUSTODIAN FUNDS
STATEMENT OF INVESTMENTS
Franklin DynaTech Fund(continued)
See Abbreviations on page 130.
†Rounds to less than 0.1% of net assets.
aNon-income producing.
bSecurity was purchased pursuant to Regulation S under the Securities Act of 1933, which exempts from registration securities offered and sold outside of the United States. Such a security cannot be sold in the United States without either an effective registration statement filed pursuant to the Securities Act of 1933, or pursuant to an exemption from registration. This security has been deemed liquid under guidelines approved by the Fund’s Board of Trustees. At September 30, 2018, the value of this security was $5,970,899, representing less than 0.1% of net assets.
cSee Note 3(f) regarding investments in affiliated management investment companies.
dThe rate shown is the annualizedseven-day effective yield at period end.
| | | | |
| | | |
| franklintempleton.com | | The accompanying notes are an integral part of these financial statements. | Annual Report | | 49 |
FRANKLIN CUSTODIAN FUNDS
Financial Highlights
Franklin Growth Fund
| | | | | | | | | | | | | | | | | | | | |
| | | Year Ended September 30, | |
| | | 2018 | | | 2017 | | | 2016 | | | 2015 | | | 2014 | |
| |
| | | | | |
Class A | | | | | | | | | | | | | | | | | | | | |
| | | | | |
Per share operating performance | | | | | | | | | | | | | | | | | | | | |
(for a share outstanding throughout the year) | | | | | | | | | | | | | | | | | | | | |
Net asset value, beginning of year | | | $ 91.61 | | | | $78.54 | | | | $72.40 | | | | $70.51 | | | | $59.49 | |
| | | | |
| | | | | |
Income from investment operationsa: | | | | | | | | | | | | | | | | | | | | |
Net investment incomeb | | | 0.41 | | | | 0.40 | | | | 0.47 | c | | | 0.29 | | | | 0.26 | |
Net realized and unrealized gains (losses) | | | 18.18 | | | | 15.56 | | | | 8.51 | | | | 1.79 | | | | 11.06 | |
| | | | |
| | | | | |
Total from investment operations | | | 18.59 | | | | 15.96 | | | | 8.98 | | | | 2.08 | | | | 11.32 | |
| | | | |
| | | | | |
Less distributions from: | | | | | | | | | | | | | | | | | | | | |
Net investment income | | | (0.36 | ) | | | (0.39 | ) | | | (0.47 | ) | | | (0.19 | ) | | | (0.30 | ) |
Net realized gains | | | (2.25 | ) | | | (2.50 | ) | | | (2.37 | ) | | | — | | | | — | |
| | | | |
| | | | | |
Total distributions | | | (2.61 | ) | | | (2.89 | ) | | | (2.84 | ) | | | (0.19 | ) | | | (0.30 | ) |
| | | | |
| | | | | |
Net asset value, end of year | | | $107.59 | | | | $91.61 | | | | $78.54 | | | | $72.40 | | | | $70.51 | |
| | | | |
| | | | | |
Total returnd | | | 20.72% | | | | 21.12% | | | | 12.57% | | | | 2.94% | | | | 19.08% | |
| | | | | |
Ratios to average net assets | | | | | | | | | | | | | | | | | | | | |
Expenses before waiver and payments by affiliates | | | 0.83% | | | | 0.88% | | | | 0.88% | | | | 0.88% | | | | 0.90% | |
Expenses net of waiver and payments by affiliatese | | | 0.83% | f | | | 0.87% | | | | 0.86% | | | | 0.88% | f | | | 0.90% | f |
Net investment income | | | 0.41% | | | | 0.47% | | | | 0.63% | c | | | 0.38% | | | | 0.40% | |
| | | | | |
Supplemental data | | | | | | | | | | | | | | | | | | | | |
Net assets, end of year (000’s) | | | $9,044,834 | | | | $8,051,641 | | | | $7,628,523 | | | | $7,185,665 | | | | $6,611,073 | |
Portfolio turnover rate | | | 6.05% | g | | | 5.60% | | | | 7.53% | | | | 5.05% | | | | 1.50% | |
aThe amount shown for a share outstanding throughout the period may not correlate with the Statement of Operations for the period due to the timing of sales and repurchases of the Fund’s shares in relation to income earned and/or fluctuating fair value of the investments of the Fund.
bBased on average daily shares outstanding.
cNet investment income per share includes approximately $0.10 per share related to income received in the form of special dividends in connection with certain Fund holdings. Excluding this amount, the ratio of net investment income to average net assets would have been 0.50%.
dTotal return does not reflect sales commissions or contingent deferred sales charges, if applicable.
eBenefit of expense reduction rounds to less than 0.01%.
fBenefit of waiver and payments by affiliates rounds to less than 0.01%.
gExcludes the value of portfolio securities delivered as a result of a redemptionin-kind. See Note 11.
| | | | |
| | | |
50 | | Annual Report | The accompanying notes are an integral part of these financial statements. | | franklintempleton.com |
FRANKLIN CUSTODIAN FUNDS
FINANCIAL HIGHLIGHTS
Franklin Growth Fund(continued)
| | | | | | | | | | | | | | | | | | | | |
| | | Year Ended September 30, | |
| | | 2018 | | | 2017 | | | 2016 | | | 2015 | | | 2014 | |
| |
| | | | | |
Class C | | | | | | | | | | | | | | | | | | | | |
| | | | | |
Per share operating performance | | | | | | | | | | | | | | | | | | | | |
(for a share outstanding throughout the year) | | | | | | | | | | | | | | | | | | | | |
Net asset value, beginning of year | | | $84.25 | | | | $72.60 | | | | $67.17 | | | | $65.75 | | | | $55.64 | |
| | | | |
| | | | | |
Income from investment operationsa: | | | | | | | | | | | | | | | | | | | | |
Net investment income (loss)b | | | (0.30 | ) | | | (0.21 | ) | | | (0.08 | )c | | | (0.26 | ) | | | (0.22 | ) |
Net realized and unrealized gains (losses) | | | 16.68 | | | | 14.36 | | | | 7.88 | | | | 1.68 | | | | 10.33 | |
| | | | |
| | | | | |
Total from investment operations | | | 16.38 | | | | 14.15 | | | | 7.80 | | | | 1.42 | | | | 10.11 | |
| | | | |
| | | | | |
Less distributions from net realized gains | | | (2.25 | ) | | | (2.50 | ) | | | (2.37 | ) | | | — | | | | — | |
| | | | |
| | | | | |
Net asset value, end of year | | | $98.38 | | | | $84.25 | | | | $72.60 | | | | $67.17 | | | | $65.75 | |
| | | | |
| | | | | |
Total returnd | | | 19.82% | | | | 20.21% | | | | 11.74% | | | | 2.16% | | | | 18.17% | |
| | | | | |
Ratios to average net assets | | | | | | | | | | | | | | | | | | | | |
Expenses before waiver and payments by affiliates | | | 1.58% | | | | 1.63% | | | | 1.63% | | | | 1.63% | | | | 1.65% | |
Expenses net of waiver and payments by affiliatese | | | 1.58% | f | | | 1.62% | | | | 1.61% | | | | 1.63% | f | | | 1.65% | f |
Net investment income (loss) | | | (0.34)% | | | | (0.28)% | | | | (0.12)%c | | | | (0.37)% | | | | (0.35)% | |
| | | | | |
Supplemental data | | | | | | | | | | | | | | | | | | | | |
Net assets, end of year (000’s) | | | $1,060,258 | | | | $930,751 | | | | $846,965 | | | | $777,570 | | | | $662,548 | |
Portfolio turnover rate | | | 6.05% | g | | | 5.60% | | | | 7.53% | | | | 5.05% | | | | 1.50% | |
aThe amount shown for a share outstanding throughout the period may not correlate with the Statement of Operations for the period due to the timing of sales and repurchases of the Fund’s shares in relation to income earned and/or fluctuating fair value of the investments of the Fund.
bBased on average daily shares outstanding.
cNet investment income per share includes approximately $0.10 per share related to income received in the form of special dividends in connection with certain Fund holdings. Excluding this amount, the ratio of net investment income to average net assets would have been (0.25)%.
dTotal return does not reflect sales commissions or contingent deferred sales charges, if applicable.
eBenefit of expense reduction rounds to less than 0.01%.
fBenefit of waiver and payments by affiliates rounds to less than 0.01%.
gExcludes the value of portfolio securities delivered as a result of a redemptionin-kind. See Note 11.
| | | | |
| | | |
| franklintempleton.com | | The accompanying notes are an integral part of these financial statements. | Annual Report | | 51 |
FRANKLIN CUSTODIAN FUNDS
FINANCIAL HIGHLIGHTS
Franklin Growth Fund(continued)
| | | | | | | | | | | | | | | | | | | | |
| | | Year Ended September 30, | |
| | | 2018 | | | 2017 | | | 2016 | | | 2015 | | | 2014 | |
| |
| | | | | |
Class R | | | | | | | | | | | | | | | | | | | | |
| | | | | |
Per share operating performance | | | | | | | | | | | | | | | | | | | | |
(for a share outstanding throughout the year) | | | | | | | | | | | | | | | | | | | | |
Net asset value, beginning of year | | | $ 91.13 | | | | $78.14 | | | | $71.93 | | | | $70.05 | | | | $59.07 | |
| | | | |
| | | | | |
Income from investment operationsa: | | | | | | | | | | | | | | | | | | | | |
Net investment incomeb | | | 0.16 | | | | 0.19 | | | | 0.29 | c | | | 0.10 | | | | 0.10 | |
Net realized and unrealized gains (losses) | | | 18.09 | | | | 15.51 | | | | 8.45 | | | | 1.78 | | | | 10.98 | |
| | | | |
| | | | | |
Total from investment operations | | | 18.25 | | | | 15.70 | | | | 8.74 | | | | 1.88 | | | | 11.08 | |
| | | | |
| | | | | |
Less distributions from: | | | | | | | | | | | | | | | | | | | | |
Net investment income | | | (0.13 | ) | | | (0.21 | ) | | | (0.16 | ) | | | — | | | | (0.10 | ) |
Net realized gains | | | (2.25 | ) | | | (2.50 | ) | | | (2.37 | ) | | | — | | | | — | |
| | | | |
| | | | | |
Total distributions | | | (2.38 | ) | | | (2.71 | ) | | | (2.53 | ) | | | — | | | | (0.10 | ) |
| | | | |
| | | | | |
Net asset value, end of year | | | $107.00 | | | | $91.13 | | | | $78.14 | | | | $71.93 | | | | $70.05 | |
| | | | |
| | | | | |
Total return | | | 20.42% | | | | 20.81% | | | | 12.29% | | | | 2.68% | | | | 18.77% | |
| | | | | |
Ratios to average net assets | | | | | | | | | | | | | | | | | | | | |
Expenses before waiver and payments by affiliates | | | 1.08% | | | | 1.13% | | | | 1.13% | | | | 1.13% | | | | 1.15% | |
Expenses net of waiver and payments by affiliatesd | | | 1.08% | e | | | 1.12% | | | | 1.11% | | | | 1.13% | e | | | 1.15% | e |
Net investment income | | | 0.16% | | | | 0.22% | | | | 0.38% | c | | | 0.13% | | | | 0.15% | |
| | | | | |
Supplemental data | | | | | | | | | | | | | | | | | | | | |
Net assets, end of year (000’s) | | | $524,960 | | | | $510,317 | | | | $477,221 | | | | $501,813 | | | | $565,634 | |
Portfolio turnover rate | | | 6.05% | f | | | 5.60% | | | | 7.53% | | | | 5.05% | | | | 1.50% | |
aThe amount shown for a share outstanding throughout the period may not correlate with the Statement of Operations for the period due to the timing of sales and repurchases of the Fund’s shares in relation to income earned and/or fluctuating fair value of the investments of the Fund.
bBased on average daily shares outstanding.
cNet investment income per share includes approximately $0.10 per share related to income received in the form of special dividends in connection with certain Fund holdings. Excluding this amount, the ratio of net investment income to average net assets would have been 0.25%.
dBenefit of expense reduction rounds to less than 0.01%.
eBenefit of waiver and payments by affiliates rounds to less than 0.01%.
fExcludes the value of portfolio securities delivered as a result of a redemptionin-kind. See Note 11.
| | | | |
| | | |
52 | | Annual Report | The accompanying notes are an integral part of these financial statements. | | franklintempleton.com |
FRANKLIN CUSTODIAN FUNDS
FINANCIAL HIGHLIGHTS
Franklin Growth Fund(continued)
| | | | | | | | | | | | | | | | | | | | |
| | | Year Ended September 30, | |
| | | 2018 | | | 2017 | | | 2016 | | | 2015 | | | 2014 | |
| |
| | | | | |
Class R6 | | | | | | | | | | | | | | | | | | | | |
| | | | | |
Per share operating performance | | | | | | | | | | | | | | | | | | | | |
(for a share outstanding throughout the year) | | | | | | | | | | | | | | | | | | | | |
Net asset value, beginning of year | | | $ 91.90 | | | | $78.79 | | | | $72.69 | | | | $70.76 | | | | $59.71 | |
| | | | |
| | | | | |
Income from investment operationsa: | | | | | | | | | | | | | | | | | | | | |
Net investment incomeb | | | 0.77 | | | | 0.74 | | | | 0.78 | c | | | 0.61 | | | | 0.55 | |
Net realized and unrealized gains (losses) | | | 18.22 | | | | 15.59 | | | | 8.56 | | | | 1.79 | | | | 11.08 | |
| | | | |
| | | | | |
Total from investment operations | | | 18.99 | | | | 16.33 | | | | 9.34 | | | | 2.40 | | | | 11.63 | |
| | | | |
| | | | | |
Less distributions from: | | | | | | | | | | | | | | | | | | | | |
Net investment income | | | (0.74 | ) | | | (0.72 | ) | | | (0.87 | ) | | | (0.47 | ) | | | (0.58 | ) |
Net realized gains | | | (2.25 | ) | | | (2.50 | ) | | | (2.37 | ) | | | — | | | | — | |
| | | | |
| | | | | |
Total distributions | | | (2.99 | ) | | | (3.22 | ) | | | (3.24 | ) | | | (0.47 | ) | | | (0.58 | ) |
| | | | |
| | | | | |
Net asset value, end of year | | | $107.90 | | | | $91.90 | | | | $78.79 | | | | $72.69 | | | | $70.76 | |
| | | | |
| | | | | |
Total return | | | 21.17% | | | | 21.61% | | | | 13.05% | | | | 3.37% | | | | 19.59% | |
| | | | | |
Ratios to average net assets | | | | | | | | | | | | | | | | | | | | |
Expenses before waiver and payments by affiliates | | | 0.47% | | | | 0.46% | | | | 0.46% | | | | 0.46% | | | | 0.47% | |
Expenses net of waiver and payments by affiliatesd | | | 0.46% | | | | 0.45% | | | | 0.44% | | | | 0.46% | e | | | 0.47% | e |
Net investment income | | | 0.78% | | | | 0.89% | | | | 1.05% | c | | | 0.80% | | | | 0.83% | |
| | | | | |
Supplemental data | | | | | | | | | | | | | | | | | | | | |
Net assets, end of year (000’s) | | | $2,634,455 | | | | $1,700,993 | | | | $1,247,825 | | | | $1,163,362 | | | | $1,107,887 | |
Portfolio turnover rate | | | 6.05% | f | | | 5.60% | | | | 7.53% | | | | 5.05% | | | | 1.50% | |
aThe amount shown for a share outstanding throughout the period may not correlate with the Statement of Operations for the period due to the timing of sales and repurchases of the Fund’s shares in relation to income earned and/or fluctuating fair value of the investments of the Fund.
bBased on average daily shares outstanding.
cNet investment income per share includes approximately $0.10 per share related to income received in the form of special dividends in connection with certain Fund holdings. Excluding this amount, the ratio of net investment income to average net assets would have been 0.92%.
dBenefit of expense reduction rounds to less than 0.01%.
eBenefit of waiver and payments by affiliates rounds to less than 0.01%.
fExcludes the value of portfolio securities delivered as a result of a redemptionin-kind. See Note 11.
| | | | |
| | | |
| franklintempleton.com | | The accompanying notes are an integral part of these financial statements. | Annual Report | | 53 |
FRANKLIN CUSTODIAN FUNDS
FINANCIAL HIGHLIGHTS
Franklin Growth Fund(continued)
| | | | | | | | | | | | | | | | | | | | |
| | | Year Ended September 30, | |
| | | 2018 | | | 2017 | | | 2016 | | | 2015 | | | 2014 | |
| |
| | | | | |
Advisor Class | | | | | | | | | | | | | | | | | | | | |
| | | | | |
Per share operating performance | | | | | | | | | | | | | | | | | | | | |
(for a share outstanding throughout the year) | | | | | | | | | | | | | | | | | | | | |
Net asset value, beginning of year | | | $ 91.90 | | | | $78.80 | | | | $72.67 | | | | $70.75 | | | | $59.66 | |
| | | | |
| | | | | |
Income from investment operationsa: | | | | | | | | | | | | | | | | | | | | |
Net investment incomeb | | | 0.66 | | | | 0.60 | | | | 0.65 | c | | | 0.48 | | | | 0.43 | |
Net realized and unrealized gains (losses) | | | 18.23 | | | | 15.61 | | | | 8.56 | | | | 1.79 | | | | 11.08 | |
| | | | |
| | | | | |
Total from investment operations | | | 18.89 | | | | 16.21 | | | | 9.21 | | | | 2.27 | | | | 11.51 | |
| | | | |
| | | | | |
Less distributions from: | | | | | | | | | | | | | | | | | | | | |
Net investment income | | | (0.59 | ) | | | (0.61 | ) | | | (0.71 | ) | | | (0.35 | ) | | | (0.42 | ) |
Net realized gains | | | (2.25 | ) | | | (2.50 | ) | | | (2.37 | ) | | | — | | | | — | |
| | | | |
| | | | | |
Total distributions | | | (2.84 | ) | | | (3.11 | ) | | | (3.08 | ) | | | (0.35 | ) | | | (0.42 | ) |
| | | | |
| | | | | |
Net asset value, end of year | | | $107.95 | | | | $91.90 | | | | $78.80 | | | | $72.67 | | | | $70.75 | |
| | | | |
| | | | | |
Total return | | | 21.02% | | | | 21.43% | | | | 12.85% | | | | 3.20% | | | | 19.37% | |
| | | | | |
Ratios to average net assets | | | | | | | | | | | | | | | | | | | | |
Expenses before waiver and payments by affiliates | | | 0.58% | | | | 0.63% | | | | 0.63% | | | | 0.63% | | | | 0.65% | |
Expenses net of waiver and payments by affiliatesd | | | 0.58% | e | | | 0.62% | | | | 0.61% | | | | 0.63% | e | | | 0.65% | e |
Net investment income | | | 0.66% | | | | 0.72% | | | | 0.88% | c | | | 0.63% | | | | 0.65% | |
| | | | | |
Supplemental data | | | | | | | | | | | | | | | | | | | | |
Net assets, end of year (000’s) | | | $3,139,208 | | | | $2,801,153 | | | | $1,998,483 | | | | $1,514,492 | | | | $1,414,980 | |
Portfolio turnover rate | | | 6.05% | f | | | 5.60% | | | | 7.53% | | | | 5.05% | | | | 1.50% | |
aThe amount shown for a share outstanding throughout the period may not correlate with the Statement of Operations for the period due to the timing of sales and repurchases of the Fund’s shares in relation to income earned and/or fluctuating fair value of the investments of the Fund.
bBased on average daily shares outstanding.
cNet investment income per share includes approximately $0.10 per share related to income received in the form of special dividends in connection with certain Fund holdings. Excluding this amount, the ratio of net investment income to average net assets would have been 0.75%.
dBenefit of expense reduction rounds to less than 0.01%.
eBenefit of waiver and payments by affiliates rounds to less than 0.01%.
fExcludes the value of portfolio securities delivered as a result of a redemptionin-kind. See Note 11.
| | | | |
| | | |
54 | | Annual Report | The accompanying notes are an integral part of these financial statements. | | franklintempleton.com |
FRANKLIN CUSTODIAN FUNDS
Statement of Investments, September 30, 2018
Franklin Growth Fund
| | | | | | | | | | |
| | | Country | | Shares | | | Value | |
Common Stocks 97.9% | | | | | | | | | | |
Automobiles & Components 0.4% | | | | | | | | | | |
BorgWarner Inc. | | United States | | | 1,643,554 | | | $ | 70,311,240 | |
| | | | | | | | | | |
Banks 0.2% | | | | | | | | | | |
Wells Fargo & Co. | | United States | | | 747,070 | | | | 39,265,999 | |
| | | | | | | | | | |
Capital Goods 17.2% | | | | | | | | | | |
3M Co. | | United States | | | 851,660 | | | | 179,453,279 | |
Allegion PLC | | United States | | | 697,265 | | | | 63,151,291 | |
AMETEK Inc. | | United States | | | 697,265 | | | | 55,167,607 | |
The Boeing Co. | | United States | | | 1,095,703 | | | | 407,491,946 | |
BWX Technologies Inc. | | United States | | | 1,195,312 | | | | 74,754,812 | |
Caterpillar Inc. | | United States | | | 547,852 | | | | 83,541,951 | |
Deere & Co. | | United States | | | 498,047 | | | | 74,871,405 | |
Emerson Electric Co. | | United States | | | 1,095,703 | | | | 83,908,936 | |
Fortive Corp. | | United States | | | 522,949 | | | | 44,032,306 | |
General Dynamics Corp. | | United States | | | 996,093 | | | | 203,920,159 | |
General Electric Co. | | United States | | | 2,490,233 | | | | 28,114,731 | |
Huntington Ingalls Industries Inc. | | United States | | | 298,828 | | | | 76,523,874 | |
Illinois Tool Works Inc. | | United States | | | 996,093 | | | | 140,568,644 | |
Ingersoll-Rand PLC | | United States | | | 1,095,703 | | | | 112,090,417 | |
Lockheed Martin Corp. | | United States | | | 498,047 | | | | 172,304,340 | |
Northrop Grumman Corp. | | United States | | | 1,095,703 | | | | 347,743,261 | |
Raytheon Co. | | United States | | | 597,656 | | | | 123,511,589 | |
Rockwell Collins Inc. | | United States | | | 348,633 | | | | 48,972,478 | |
aSensata Technologies Holding PLC | | United States | | | 3,187,498 | | | | 157,940,526 | |
Stanley Black & Decker Inc. | | United States | | | 647,461 | | | | 94,814,189 | |
Textron Inc. | | United States | | | 1,593,749 | | | | 113,905,241 | |
United Technologies Corp. | | United States | | | 926,367 | | | | 129,515,370 | |
| | | | | | | | | | |
| | | |
| | | | | | | | | 2,816,298,352 | |
| | | | | | | | | | |
| | | |
Commercial & Professional Services 2.7% | | | | | | | | | | |
Equifax Inc. | | United States | | | 547,852 | | | | 71,533,036 | |
aIHS Markit Ltd. | | United States | | | 3,542,704 | | | | 191,164,308 | |
aVerisk Analytics Inc. | | United States | | | 1,494,140 | | | | 180,118,577 | |
| | | | | | | | | | |
| | | |
| | | | | | | | | 442,815,921 | |
| | | | | | | | | | |
| | | |
Consumer Durables & Apparel 1.0% | | | | | | | | | | |
NIKE Inc., B | | United States | | | 1,872,655 | | | | 158,651,332 | |
| | | | | | | | | | |
Consumer Services 0.9% | | | | | | | | | | |
Carnival Corp. | | United States | | | 1,195,312 | | | | 76,225,046 | |
Graham Holdings Co., B | | United States | | | 79,688 | | | | 46,163,258 | |
Marriott International Inc., A | | United States | | | 199,219 | | | | 26,302,885 | |
| | | | | | | | | | |
| | | |
| | | | | | | | | 148,691,189 | |
| | | | | | | | | | |
| | | |
Diversified Financials 3.5% | | | | | | | | | | |
American Express Co. | | United States | | | 597,656 | | | | 63,644,387 | |
aBerkshire Hathaway Inc., A | | United States | | | 184 | | | | 58,880,009 | |
BlackRock Inc. | | United States | | | 224,121 | | | | 105,634,951 | |
The Charles Schwab Corp. | | United States | | | 2,988,279 | | | | 146,873,913 | |
Intercontinental Exchange Inc. | | United States | | | 1,394,530 | | | | 104,436,352 | |
T. Rowe Price Group Inc. | | United States | | | 896,484 | | | | 97,878,123 | |
| | | | | | | | | | |
| | | |
| | | | | | | | | 577,347,735 | |
| | | | | | | | | | |
| | | | |
| | | |
| franklintempleton.com | | Annual Report | | 55 |
FRANKLIN CUSTODIAN FUNDS
STATEMENT OF INVESTMENTS
Franklin Growth Fund(continued)
| | | | | | | | | | |
| | | Country | | Shares | | | Value | |
Common Stocks(continued) | | | | | | | | | | |
Energy 1.0% | | | | | | | | | | |
Cabot Oil & Gas Corp., A | | United States | | | 3,386,716 | | | $ | 76,268,844 | |
aConcho Resources Inc. | | United States | | | 597,656 | | | | 91,291,954 | |
| | | | | | | | | | |
| | | |
| | | | | | | | | 167,560,798 | |
| | | | | | | | | | |
| | | |
Food, Beverage & Tobacco 3.2% | | | | | | | | | | |
Anheuser-Busch InBev SA/NV, ADR | | Belgium | | | 348,633 | | | | 30,529,792 | |
Brown-Forman Corp., B | | United States | | | 1,618,651 | | | | 81,822,808 | |
Constellation Brands Inc., A | | United States | | | 547,852 | | | | 118,127,848 | |
Mondelez International Inc., A | | United States | | | 1,494,140 | | | | 64,188,255 | |
aMonster Beverage Corp. | | United States | | | 2,689,451 | | | | 156,741,204 | |
PepsiCo Inc. | | United States | | | 647,461 | | | | 72,386,140 | |
| | | | | | | | | | |
| | | |
| | | | | | | | | 523,796,047 | |
| | | | | | | | | | |
| | | |
Health Care Equipment & Services 8.5% | | | | | | | | | | |
Abbott Laboratories | | United States | | | 1,344,726 | | | | 98,649,099 | |
aABIOMED Inc. | | United States | | | 199,219 | | | | 89,598,745 | |
Aetna Inc. | | United States | | | 647,461 | | | | 131,337,464 | |
Baxter International Inc. | | United States | | | 398,438 | | | | 30,715,585 | |
Becton, Dickinson and Co. | | United States | | | 77,397 | | | | 20,200,617 | |
CVS Health Corp. | | United States | | | 653,437 | | | | 51,438,561 | |
Danaher Corp. | | United States | | | 1,045,898 | | | | 113,647,277 | |
aEdwards Lifesciences Corp. | | United States | | | 398,438 | | | | 69,368,056 | |
aHaemonetics Corp. | | United States | | | 996,093 | | | | 114,132,336 | |
aIntuitive Surgical Inc. | | United States | | | 448,242 | | | | 257,290,908 | |
aLaboratory Corp. of America Holdings | | United States | | | 498,047 | | | | 86,500,803 | |
Quest Diagnostics Inc. | | United States | | | 896,484 | | | | 96,739,588 | |
Stryker Corp. | | United States | | | 398,438 | | | | 70,794,464 | |
Teleflex Inc. | | United States | | | 498,047 | | | | 132,525,326 | |
aVarian Medical Systems Inc. | | United States | | | 298,828 | | | | 33,447,818 | |
| | | | | | | | | | |
| | | |
| | | | | | | | | 1,396,386,647 | |
| | | | | | | | | | |
Insurance 0.3% | | | | | | | | | | |
Aflac Inc. | | United States | | | 1,195,312 | | | | 56,263,336 | |
| | | | | | | | | | |
Materials 4.4% | | | | | | | | | | |
Air Products and Chemicals Inc. | | United States | | | 498,047 | | | | 83,198,751 | |
Albemarle Corp. | | United States | | | 547,852 | | | | 54,664,673 | |
aAxalta Coating Systems Ltd. | | United States | | | 3,386,716 | | | | 98,756,639 | |
Celanese Corp. | | United States | | | 1,245,117 | | | | 141,943,338 | |
Ecolab Inc. | | United States | | | 916,406 | | | | 143,674,133 | |
International Flavors & Fragrances Inc. | | United States | | | 198,721 | | | | 27,646,065 | |
Martin Marietta Materials Inc. | | United States | | | 398,438 | | | | 72,495,794 | |
Praxair Inc. | | United States | | | 572,754 | | | | 92,058,750 | |
| | | | | | | | | | |
| | | |
| | | | | | | | | 714,438,143 | |
| | | | | | | | | | |
| | | |
Media & Entertainment 5.7% | | | | | | | | | | |
aAlphabet Inc., A | | United States | | | 164,356 | | | | 198,390,841 | |
aAlphabet Inc., C | | United States | | | 157,813 | | | | 188,345,081 | |
Cable One Inc. | | United States | | | 79,688 | | | | 70,413,114 | |
Comcast Corp., A | | United States | | | 109,571 | | | | 3,879,909 | |
aElectronic Arts Inc. | | United States | | | 597,656 | | | | 72,011,571 | |
aFacebook Inc., A | | United States | | | 871,582 | | | | 143,340,376 | |
aIAC/InterActiveCorp. | | United States | | | 298,828 | | | | 64,762,004 | |
The Walt Disney Co. | | United States | | | 1,717,553 | | | | 200,850,648 | |
| | | | | | | | | | |
| | | |
| | | | | | | | | 941,993,544 | |
| | | | | | | | | | |
| | | | |
| | | |
56 | | Annual Report | | franklintempleton.com |
FRANKLIN CUSTODIAN FUNDS
STATEMENT OF INVESTMENTS
Franklin Growth Fund(continued)
| | | | | | | | | | |
| | | Country | | Shares | | | Value | |
Common Stocks(continued) | | | | | | | | | | |
Pharmaceuticals, Biotechnology & Life Sciences 12.7% | | | | | | | | | | |
AbbVie Inc. | | United States | | | 458,203 | | | $ | 43,336,840 | |
Agilent Technologies Inc. | | United States | | | 1,294,921 | | | | 91,343,727 | |
Amgen Inc. | | United States | | | 996,093 | | | | 206,480,118 | |
AstraZeneca PLC, ADR | | United Kingdom | | | 1,992,186 | | | | 78,830,800 | |
aBiogen Inc. | | United States | | | 498,047 | | | | 175,964,986 | |
aCatalent Inc. | | United States | | | 3,386,716 | | | | 154,264,914 | |
aCelgene Corp. | | United States | | | 1,294,921 | | | | 115,882,480 | |
aElanco Animal Health Inc. | | United States | | | 610,307 | | | | 21,293,611 | |
Eli Lilly & Co. | | United States | | | 1,444,335 | | | | 154,991,589 | |
Gilead Sciences Inc. | | United States | | | 647,461 | | | | 49,990,464 | |
aIllumina Inc. | | United States | | | 522,949 | | | | 191,953,660 | |
Johnson & Johnson | | United States | | | 1,195,412 | | | | 165,170,076 | |
Merck & Co. Inc. | | United States | | | 996,093 | | | | 70,662,837 | |
aMettler-Toledo International Inc. | | United States | | | 423,340 | | | | 257,805,593 | |
aNeurocrine Biosciences Inc. | | United States | | | 498,047 | | | | 61,234,879 | |
Pfizer Inc. | | United States | | | 2,750,213 | | | | 121,201,887 | |
aWaters Corp. | | United States | | | 622,559 | | | | 121,199,786 | |
| | | | | | | | | | |
| | | |
| | | | | | | | | 2,081,608,247 | |
| | | | | | | | | | |
| | | |
Real Estate 1.6% | | | | | | | | | | |
American Tower Corp. | | United States | | | 896,484 | | | | 130,259,125 | |
Equinix Inc. | | United States | | | 298,828 | | | | 129,359,653 | |
| | | | | | | | | | |
| | | |
| | | | | | | | | 259,618,778 | |
| | | | | | | | | | |
| | | |
Retailing 5.0% | | | | | | | | | | |
aAlibaba Group Holding Ltd., ADR | | China | | | 478,524 | | | | 78,841,614 | |
aAmazon.com Inc. | | United States | | | 348,633 | | | | 698,311,899 | |
Expedia Group Inc. | | United States | | | 348,633 | | | | 45,489,634 | |
| | | | | | | | | | |
| | | |
| | | | | | | | | 822,643,147 | |
| | | | | | | | | | |
| | | |
Semiconductors & Semiconductor Equipment 2.4% | | | | | | | | | | |
ASML Holding NV, N.Y. shs | | Netherlands | | | 647,461 | | | | 121,735,617 | |
Intel Corp. | | United States | | | 1,095,703 | | | | 51,815,795 | |
Lam Research Corp. | | United States | | | 29,883 | | | | 4,533,251 | |
Monolithic Power Systems | | United States | | | 448,242 | | | | 56,267,818 | |
Texas Instruments Inc. | | United States | | | 1,394,530 | | | | 149,619,124 | |
Versum Materials Inc. | | United States | | | 249,024 | | | | 8,967,354 | |
| | | | | | | | | | |
| | | |
| | | | | | | | | 392,938,959 | |
| | | | | | | | | | |
| | | |
Software & Services 11.7% | | | | | | | | | | |
aAdyen NV | | Netherlands | | | 59,965 | | | | 48,940,308 | |
aAutodesk Inc. | | United States | | | 796,875 | | | | 124,400,156 | |
Automatic Data Processing Inc. | | United States | | | 697,265 | | | | 105,049,945 | |
CDK Global LLC | | United States | | | 232,422 | | | | 14,540,320 | |
DXC Technology Co. | | United States | | | 1,394,530 | | | | 130,416,446 | |
Intuit Inc. | | United States | | | 996,093 | | | | 226,511,548 | |
Mastercard Inc., A | | United States | | | 1,394,530 | | | | 310,436,323 | |
Microsoft Corp. | | United States | | | 3,386,716 | | | | 387,338,709 | |
Perspecta Inc. | | United States | | | 697,265 | | | | 17,933,656 | |
aSalesforce.com Inc. | | United States | | | 547,852 | | | | 87,124,904 | |
aServiceNow Inc. | | United States | | | 996,093 | | | | 194,865,674 | |
aTwilio Inc., A | | United States | | | 209,180 | | | | 18,048,050 | |
aTyler Technologies Inc. | | United States | | | 174,317 | | | | 42,718,124 | |
| | | | |
| | | |
| franklintempleton.com | | Annual Report | | 57 |
FRANKLIN CUSTODIAN FUNDS
STATEMENT OF INVESTMENTS
Franklin Growth Fund(continued)
| | | | | | | | | | |
| | | Country | | Shares | | | Value | |
Common Stocks(continued) | | | | | | | | | | |
Software & Services(continued) | | | | | | | | | | |
Visa Inc., A | | United States | | | 1,394,530 | | | $ | 209,305,008 | |
| | | | | | | | | | |
| | | |
| | | | | | | | | 1,917,629,171 | |
| | | | | | | | | | |
| | | |
Technology Hardware & Equipment 8.9% | | | | | | | | | | |
Apple Inc. | | United States | | | 4,070,036 | | | | 918,769,927 | |
Cisco Systems Inc. | | United States | | | 2,933,494 | | | | 142,714,483 | |
Cognex Corp. | | United States | | | 846,679 | | | | 47,261,622 | |
aKeysight Technologies Inc. | | United States | | | 647,461 | | | | 42,913,715 | |
TE Connectivity Ltd. | | United States | | | 1,643,554 | | | | 144,517,703 | |
aTrimble Inc. | | United States | | | 2,689,451 | | | | 116,883,540 | |
aViaSat Inc. | | United States | | | 697,265 | | | | 44,590,097 | |
| | | | | | | | | | |
| | | |
| | | | | | | | | 1,457,651,087 | |
| | | | | | | | | | |
| | | |
Transportation 5.7% | | | | | | | | | | |
Alaska Air Group Inc. | | United States | | | 3,187,498 | | | | 219,491,112 | |
Allegiant Travel Co. | | United States | | | 199,219 | | | | 25,260,969 | |
Canadian National Railway Co. | | Canada | | | 996,093 | | | | 89,449,152 | |
Canadian Pacific Railway Ltd. | | Canada | | | 498,047 | | | | 105,556,081 | |
J.B. Hunt Transport Services Inc. | | United States | | | 498,047 | | | | 59,237,710 | |
Kansas City Southern | | United States | | | 747,070 | | | | 84,628,090 | |
aRyanair Holdings PLC, ADR | | Ireland | | | 232,309 | | | | 22,310,956 | |
Union Pacific Corp. | | United States | | | 2,022,069 | | | | 329,253,495 | |
| | | | | | | | | | |
| | | |
| | | | | | | | | 935,187,565 | |
| | | | | | | | | | |
| | | |
Utilities 0.9% | | | | | | | | | | |
American Water Works Co. Inc. | | United States | | | 697,265 | | | | 61,338,402 | |
NextEra Energy Inc. | | United States | | | 498,047 | | | | 83,472,677 | |
| | | | | | | | | | |
| | | |
| | | | | | | | | 144,811,079 | |
| | | | | | | | | | |
| | | |
Total Common Stocks (Cost $5,320,743,047) | | | | | | | | | 16,065,908,316 | |
| | | | | | | | | | |
Management Investment Companies (Cost $10,108,515) 0.7% | | | | | | | | | | |
Diversified Financials 0.7% | | | | | | | | | | |
aAltaba Inc. | | United States | | | 1,693,358 | | | | 115,351,547 | |
| | | | | | | | | | |
Total Investments before Short Term Investments
(Cost $5,330,851,562) | | | | | | | | | 16,181,259,863 | |
| | | | | | | | | | |
| | | |
Short Term Investments (Cost $224,477,141) 1.4% | | | | | | | | | | |
| | | |
Money Market Funds 1.4% | | | | | | | | | | |
b,cInstitutional Fiduciary Trust Money Market Portfolio, 1.69% | | United States | | | 224,477,141 | | | | 224,477,141 | |
| | | | | | | | | | |
Total Investments (Cost $5,555,328,703) 100.0% | | | | | | | | | 16,405,737,004 | |
Other Assets, less Liabilities (0.0)%† | | | | | | | | | (2,021,685 | ) |
| | | | | | | | | | |
| | | |
Net Assets 100.0% | | | | | | | | $ | 16,403,715,319 | |
| | | | | | | | | | |
See Abbreviations on page 130.
†Rounds to less than 0.1% of net assets.
aNon-income producing.
bSee Note 3(f) regarding investments in affiliated management investment companies.
cThe rate shown is the annualizedseven-day effective yield at period end.
| | | | |
| | | |
58 | | Annual Report | The accompanying notes are an integral part of these financial statements. | | franklintempleton.com |
FRANKLIN CUSTODIAN FUNDS
Financial Highlights
Franklin Income Fund
| | | | |
| | | Year Ended September 30, 2018a | |
Class A | | | | |
| |
Per share operating performance | | | | |
(for a share outstanding throughout the year) | | | | |
| |
Net asset value, beginning of year | | | $ 2.31 | |
Income from investment operationsb: | | | | |
Net investment income (loss)c | | | (0.04 | ) |
Net realized and unrealized gains (losses) | | | 0.05 | |
| |
Total from investment operations | | | 0.01 | |
| |
Net asset value, end of year. | | | $ 2.32 | |
| |
Total returnd | | | 0.43% | |
| |
Ratios to average net assetse | | | | |
Expensesf | | | 0.71% | |
Net investment income | | | 3.89% | |
| |
Supplemental data | | | | |
Net assets, end of year (000’s) | | | $107,057 | |
Portfolio turnover rate | | | 49.95% | |
aFor the period September 10, 2018 (effective date) to September 30, 2018.
bThe amount shown for a share outstanding throughout the period may not correlate with the Statement of Operations for the period due to the timing of sales and repurchases of the Fund’s shares in relation to income earned and/or fluctuating fair value of the investments of the Fund.
cBased on average daily shares outstanding.
dTotal return does not reflect sales commissions or contingent deferred sales charges, if applicable, and is not annualized for periods less than one year.
eRatios are annualized for periods less than one year.
fBenefit of waiver and payments by affiliates and expense reduction rounds to less than 0.01%.
| | | | |
| | | |
| franklintempleton.com | | The accompanying notes are an integral part of these financial statements. | Annual Report | | 59 |
FRANKLIN CUSTODIAN FUNDS
FINANCIAL HIGHLIGHTS
Franklin Income Fund(continued)
| | | | | | | | | | | | | | | | | | | | |
| | | Year Ended September 30, | |
| | | 2018 | | | 2017 | | | 2016 | | | 2015 | | | 2014 | |
| | | | | |
Class A1 | | | | | | | | | | | | | | | | | | | | |
| | | | | |
Per share operating performance | | | | | | | | | | | | | | | | | | | | |
(for a share outstanding throughout the year) | | | | | | | | | | | | | | | | | | | | |
Net asset value, beginning of year | | | $ 2.39 | | | | $ 2.25 | | | | $ 2.10 | | | | $ 2.48 | | | | $ 2.33 | |
Income from investment operationsa: | | | | | | | | | | | | | | | | | | | | |
Net investment incomeb | | | 0.09 | | | | 0.10 | | | | 0.10 | | | | 0.10 | | | | 0.11 | |
Net realized and unrealized gains (losses) | | | (0.04 | ) | | | 0.16 | | | | 0.17 | | | | (0.36 | ) | | | 0.16 | |
Total from investment operations | | | 0.05 | | | | 0.26 | | | | 0.27 | | | | (0.26 | ) | | | 0.27 | |
Less distributions from net investment income | | | (0.12 | ) | | | (0.12 | ) | | | (0.12 | ) | | | (0.12 | ) | | | (0.12 | ) |
Net asset value, end of year | | | $ 2.32 | | | | $ 2.39 | | | | $ 2.25 | | | | $ 2.10 | | | | $ 2.48 | |
| | | | | |
Total returnc | | | 2.18% | | | | 11.86% | | | | 13.31% | | | | (10.93)% | | | | 11.86% | |
| | | | | |
Ratios to average net assets | | | | | | | | | | | | | | | | | | | | |
Expenses before waiver and payments by affiliates | | | 0.61% | | | | 0.62% | | | | 0.61% | | | | 0.61% | | | | 0.61% | |
Expenses net of waiver and payments by affiliatesd | | | 0.61% | e | | | 0.61% | | | | 0.61% | e | | | 0.61% | e | | | 0.61% | e |
Net investment income | | | 3.99% | | | | 4.22% | | | | 4.57% | | | | 4.43% | | | | 4.28% | |
| | | | | |
Supplemental data | | | | | | | | | | | | | | | | | | | | |
Net assets, end of year (000’s) | | | $42,929,573 | | | | $46,505,632 | | | | $45,515,127 | | | | $44,886,127 | | | | $53,823,921 | |
Portfolio turnover rate | | | 49.95% | | | | 34.12% | | | | 61.26% | | | | 44.81% | | | | 36.03% | |
aThe amount shown for a share outstanding throughout the period may not correlate with the Statement of Operations for the period due to the timing of sales and repurchases of the Fund’s shares in relation to income earned and/or fluctuating fair value of the investments of the Fund.
bBased on average daily shares outstanding.
cTotal return does not reflect sales commissions or contingent deferred sales charges, if applicable.
dBenefit of expense reduction rounds to less than 0.01%.
eBenefit of waiver and payments by affiliates rounds to less than 0.01%.
| | | | |
| | | |
60 | | Annual Report | The accompanying notes are an integral part of these financial statements. | | franklintempleton.com |
FRANKLIN CUSTODIAN FUNDS
FINANCIAL HIGHLIGHTS
Franklin Income Fund(continued)
| | | | | | | | | | | | | | | | | | | | |
| | | Year Ended September 30, | |
| | | 2018 | | | 2017 | | | 2016 | | | 2015 | | | 2014 | |
| | | | | |
Class C | | | | | | | | | | | | | | | | | | | | |
| | | | | |
Per share operating performance | | | | | | | | | | | | | | | | | | | | |
(for a share outstanding throughout the year) | | | | | | | | | | | | | | | | | | | | |
Net asset value, beginning of year | | | $ 2.42 | | | | $ 2.27 | | | | $ 2.13 | | | | $ 2.50 | | | | $ 2.35 | |
| | | | | |
Income from investment operationsa: | | | | | | | | | | | | | | | | | | | | |
Net investment incomeb | | | 0.08 | | | | 0.09 | | | | 0.09 | | | | 0.09 | | | | 0.09 | |
Net realized and unrealized gains (losses) | | | (0.04 | ) | | | 0.17 | | | | 0.16 | | | | (0.35 | ) | | | 0.17 | |
| | | | | |
Total from investment operations | | | 0.04 | | | | 0.26 | | | | 0.25 | | | | (0.26 | ) | | | 0.26 | |
Less distributions from net investment income | | | (0.11 | ) | | | (0.11 | ) | | | (0.11 | ) | | | (0.11 | ) | | | (0.11 | ) |
Net asset value, end of year | | | $ 2.35 | | | | $ 2.42 | | | | $ 2.27 | | | | $ 2.13 | | | | $ 2.50 | |
| | | | | |
Total returnc | | | 1.61% | | | | 11.63% | | | | 12.07% | | | | (10.89)% | | | | 11.19% | |
| | | | | |
Ratios to average net assets | | | | | | | | | | | | | | | | | | | | |
Expenses before waiver and payments by affiliates | | | 1.11% | | | | 1.12% | | | | 1.11% | | | | 1.11% | | | | 1.11% | |
Expenses net of waiver and payments by affiliatesd | | | 1.11% | e | | | 1.11% | | | | 1.11% | e | | | 1.11% | e | | | 1.11% | e |
Net investment income | | | 3.49% | | | | 3.72% | | | | 4.07% | | | | 3.93% | | | | 3.78% | |
| | | | | |
Supplemental data | | | | | | | | | | | | | | | | | | | | |
Net assets, end of year (000’s) | | | $19,895,441 | | | | $23,036,875 | | | | $23,841,466 | | | | $24,091,638 | | | | $28,802,209 | |
Portfolio turnover rate | | | 49.95% | | | | 34.12% | | | | 61.26% | | | | 44.81% | | | | 36.03% | |
aThe amount shown for a share outstanding throughout the period may not correlate with the Statement of Operations for the period due to the timing of sales and repurchases of the Fund’s shares in relation to income earned and/or fluctuating fair value of the investments of the Fund.
bBased on average daily shares outstanding.
cTotal return does not reflect sales commissions or contingent deferred sales charges, if applicable.
dBenefit of expense reduction rounds to less than 0.01%.
eBenefit of waiver and payments by affiliates rounds to less than 0.01%.
| | | | |
| | | |
| franklintempleton.com | | The accompanying notes are an integral part of these financial statements. | Annual Report | | 61 |
FRANKLIN CUSTODIAN FUNDS
FINANCIAL HIGHLIGHTS
Franklin Income Fund(continued)
| | | | | | | | | | | | | | | | | | | | |
| | | Year Ended September 30, | |
| | | 2018 | | | 2017 | | | 2016 | | | 2015 | | | 2014 | |
| | | | | |
Class R | | | | | | | | | | | | | | | | | | | | |
| | | | | |
Per share operating performance | | | | | | | | | | | | | | | | | | | | |
(for a share outstanding throughout the year) | | | | | | | | | | | | | | | | | | | | |
Net asset value, beginning of year | | | $ 2.35 | | | | $ 2.21 | | | | $ 2.07 | | | | $ 2.44 | | | | $ 2.29 | |
| | | | | |
Income from investment operationsa: | | | | | | | | | | | | | | | | | | | | |
Net investment incomeb | | | 0.08 | | | | 0.09 | | | | 0.09 | | | | 0.10 | | | | 0.10 | |
Net realized and unrealized gains (losses) | | | (0.04 | ) | | | 0.16 | | | | 0.16 | | | | (0.36 | ) | | | 0.16 | |
| | | | | |
Total from investment operations | | | 0.04 | | | | 0.25 | | | | 0.25 | | | | (0.26 | ) | | | 0.26 | |
Less distributions from net investment income | | | (0.11 | ) | | | (0.11 | ) | | | (0.11 | ) | | | (0.11 | ) | | | (0.11 | ) |
Net asset value, end of year | | | $ 2.28 | | | | $ 2.35 | | | | $ 2.21 | | | | $ 2.07 | | | | $ 2.44 | |
| | | | | |
Total return | | | 1.86% | | | | 11.67% | | | | 12.62% | | | | (10.99)% | | | | 11.66% | |
| | | | | |
Ratios to average net assets | | | | | | | | | | | | | | | | | | | | |
Expenses before waiver and payments by affiliates | | | 0.96% | | | | 0.97% | | | | 0.96% | | | | 0.96% | | | | 0.96% | |
Expenses net of waiver and payments by affiliatesc | | | 0.96% | d | | | 0.96% | | | | 0.96% | d | | | 0.96% | d | | | 0.96% | d |
Net investment income | | | 3.64% | | | | 3.87% | | | | 4.22% | | | | 4.08% | | | | 3.93% | |
| | | | | |
Supplemental data | | | | | | | | | | | | | | | | | | | | |
Net assets, end of year (000’s) | | | $296,098 | | | | $361,603 | | | | $396,107 | | | | $416,653 | | | | $514,892 | |
Portfolio turnover rate | | | 49.95% | | | | 34.12% | | | | 61.26% | | | | 44.81% | | | | 36.03% | |
aThe amount shown for a share outstanding throughout the period may not correlate with the Statement of Operations for the period due to the timing of sales and repurchases of the Fund’s shares in relation to income earned and/or fluctuating fair value of the investments of the Fund.
bBased on average daily shares outstanding.
cBenefit of expense reduction rounds to less than 0.01%.
dBenefit of waiver and payments by affiliates rounds to less than 0.01%.
| | | | |
| | | |
62 | | Annual Report | The accompanying notes are an integral part of these financial statements. | | franklintempleton.com |
FRANKLIN CUSTODIAN FUNDS
FINANCIAL HIGHLIGHTS
Franklin Income Fund(continued)
| | | | | | | | | | | | | | | | | | | | |
| | | Year Ended September 30, | |
| | | 2018 | | | 2017 | | | 2016 | | | 2015 | | | 2014 | |
| | | | | |
Class R6 | | | | | | | | | | | | | | | | | | | | |
| | | | | |
Per share operating performance | | | | | | | | | | | | | | | | | | | | |
(for a share outstanding throughout the year) | | | | | | | | | | | | | | | | | | | | |
Net asset value, beginning of year | | | $ 2.37 | | | | $ 2.23 | | | | $ 2.09 | | | | $ 2.46 | | | | $ 2.31 | |
| | | | | |
Income from investment operationsa: | | | | | | | | | | | | | | | | | | | | |
Net investment incomeb | | | 0.10 | | | | 0.11 | | | | 0.10 | | | | 0.11 | | | | 0.11 | |
Net realized and unrealized gains (losses) | | | (0.05 | ) | | | 0.15 | | | | 0.16 | | | | (0.35 | ) | | | 0.17 | |
Total from investment operations | | | 0.05 | | | | 0.26 | | | | 0.26 | | | | (0.24 | ) | | | 0.28 | |
Less distributions from net investment income | | | (0.12 | ) | | | (0.12 | ) | | | (0.12 | ) | | | (0.13 | ) | | | (0.13 | ) |
Net asset value, end of year | | | $ 2.30 | | | | $ 2.37 | | | | $ 2.23 | | | | $ 2.09 | | | | $ 2.46 | |
| | | | | |
Total return | | | 2.40% | | | | 12.15% | | | | 13.15% | | | | (10.39)% | | | | 12.19% | |
| | | | | |
Ratios to average net assets | | | | | | | | | | | | | | | | | | | | |
Expenses before waiver and payments by affiliates | | | 0.39% | | | | 0.39% | | | | 0.38% | | | | 0.38% | | | | 0.38% | |
Expenses net of waiver and payments by affiliatesc | | | 0.39% | d | | | 0.38% | | | | 0.38% | d | | | 0.38% | d | | | 0.38% | d |
Net investment income | | | 4.21% | | | | 4.45% | | | | 4.80% | | | | 4.66% | | | | 4.50% | |
| | | | | |
Supplemental data | | | | | | | | | | | | | | | | | | | | |
Net assets, end of year (000’s) | | | $2,062,334 | | | | $1,815,977 | | | | $1,737,577 | | | | $1,744,718 | | | | $2,108,076 | |
Portfolio turnover rate | | | 49.95% | | | | 34.12% | | | | 61.26% | | | | 44.81% | | | | 36.03% | |
aThe amount shown for a share outstanding throughout the period may not correlate with the Statement of Operations for the period due to the timing of sales and repurchases of the Fund’s shares in relation to income earned and/or fluctuating fair value of the investments of the Fund.
bBased on average daily shares outstanding.
cBenefit of expense reduction rounds to less than 0.01%.
dBenefit of waiver and payments by affiliates rounds to less than 0.01%.
| | | | |
| | | |
| franklintempleton.com | | The accompanying notes are an integral part of these financial statements. | Annual Report | | 63 |
FRANKLIN CUSTODIAN FUNDS
FINANCIAL HIGHLIGHTS
Franklin Income Fund(continued)
| | | | | | | | | | | | | | | | | | | | |
| | | Year Ended September 30, | |
| | | 2018 | | | 2017 | | | 2016 | | | 2015 | | | 2014 | |
| | | | | |
Advisor Class | | | | | | | | | | | | | | | | | | | | |
| | | | | |
Per share operating performance | | | | | | | | | | | | | | | | | | | | |
(for a share outstanding throughout the year) | | | | | | | | | | | | | | | | | | | | |
Net asset value, beginning of year | | | $ 2.37 | | | | $ 2.23 | | | | $ 2.09 | | | | $ 2.46 | | | | $ 2.31 | |
| | | | | |
Income from investment operationsa: | | | | | | | | | | | | | | | | | | | | |
Net investment incomeb | | | 0.10 | | | | 0.10 | | | | 0.10 | | | | 0.11 | | | | 0.11 | |
Net realized and unrealized gains (losses) | | | (0.05 | ) | | | 0.16 | | | | 0.16 | | | | (0.36 | ) | | | 0.17 | |
Total from investment operations | | | 0.05 | | | | 0.26 | | | | 0.26 | | | | (0.25 | ) | | | 0.28 | |
Less distributions from net investment income | | | (0.12 | ) | | | (0.12 | ) | | | (0.12 | ) | | | (0.12 | ) | | | (0.13 | ) |
Net asset value, end of year | | | $ 2.30 | | | | $ 2.37 | | | | $ 2.23 | | | | $ 2.09 | | | | $ 2.46 | |
| | | | | |
Total return | | | 2.34% | | | | 12.09% | | | | 13.06% | | | | (10.46)% | | | | 12.12% | |
| | | | | |
Ratios to average net assets | | | | | | | | | | | | | | | | | | | | |
Expenses before waiver and payments by affiliates | | | 0.46% | | | | 0.47% | | | | 0.46% | | | | 0.46% | | | | 0.46% | |
Expenses net of waiver and payments by affiliatesc | | | 0.46% | d | | | 0.46% | | | | 0.46% | d | | | 0.46% | d | | | 0.46% | d |
Net investment income | | | 4.14% | | | | 4.37% | | | | 4.72% | | | | 4.58% | | | | 4.43% | |
| | | | | |
Supplemental data | | | | | | | | | | | | | | | | | | | | |
Net assets, end of year (000’s) | | | $11,328,761 | | | | $11,671,173 | | | | $8,143,479 | | | | $7,754,475 | | | | $9,096,269 | |
Portfolio turnover rate | | | 49.95% | | | | 34.12% | | | | 61.26% | | | | 44.81% | | | | 36.03% | |
aThe amount shown for a share outstanding throughout the period may not correlate with the Statement of Operations for the period due to the timing of sales and repurchases of the Fund’s shares in relation to income earned and/or fluctuating fair value of the investments of the Fund.
bBased on average daily shares outstanding.
cBenefit of expense reduction rounds to less than 0.01%.
dBenefit of waiver and payments by affiliates rounds to less than 0.01%.
| | | | |
| | | |
64 | | Annual Report | The accompanying notes are an integral part of these financial statements. | | franklintempleton.com |
FRANKLIN CUSTODIAN FUNDS
Statement of Investments, September 30, 2018
Franklin Income Fund
| | | | | | | | | | |
| | | Country | | Shares | | | Value | |
Common Stocks 35.2% | | | | | | | | | | |
Communication Services 1.6% | | | | | | | | | | |
BCE Inc. | | Canada | | | 6,000,000 | | | $ | 242,915,168 | |
Verizon Communications Inc. | | United States | | | 18,000,000 | | | | 961,020,000 | |
| | | | | | | | | | |
| | | |
| | | | | | | | | 1,203,935,168 | |
| | | | | | | | | | |
Consumer Discretionary 1.7% | | | | | | | | | | |
Daimler AG | | Germany | | | 5,000,000 | | | | 315,488,177 | |
aFord Motor Co. | | United States | | | 53,300,341 | | | | 493,028,154 | |
General Motors Co. | | United States | | | 11,793,000 | | | | 397,070,310 | |
bTarget Corp. | | United States | | | 1,000,000 | | | | 88,210,000 | |
| | | | | | | | | | |
| | | |
| | | | | | | | | 1,293,796,641 | |
| | | | | | | | | | |
Consumer Staples 3.6% | | | | | | | | | | |
cAnheuser-Busch InBev SA/NV, ADR | | Belgium | | | 5,999,930 | | | | 525,413,870 | |
bThe Coca-Cola Co. | | United States | | | 7,000,000 | | | | 323,330,000 | |
Nestle SA | | Switzerland | | | 5,000,000 | | | | 416,768,541 | |
PepsiCo Inc. | | United States | | | 5,500,000 | | | | 614,900,000 | |
bPhilip Morris International Inc. | | United States | | | 4,519,400 | | | | 368,511,876 | |
The Procter & Gamble Co. | | United States | | | 6,500,000 | | | | 540,995,000 | |
| | | | | | | | | | |
| | | |
| | | | | | | | | 2,789,919,287 | |
| | | | | | | | | | |
Energy 4.7% | | | | | | | | | | |
Baker Hughes a GE Co., A | | United States | | | 9,500,000 | | | | 321,385,000 | |
bBP PLC, ADR | | United Kingdom | | | 4,000,000 | | | | 184,400,000 | |
Chevron Corp. | | United States | | | 3,000,000 | | | | 366,840,000 | |
Exxon Mobil Corp. | | United States | | | 6,500,000 | | | | 552,630,000 | |
Halliburton Co. | | United States | | | 12,948,409 | | | | 524,799,017 | |
bOccidental Petroleum Corp. | | United States | | | 2,500,000 | | | | 205,425,000 | |
Royal Dutch Shell PLC, A, ADR | | United Kingdom | | | 13,500,000 | | | | 919,890,000 | |
Schlumberger Ltd. | | United States | | | 237,000 | | | | 14,438,040 | |
d,eTalos Energy Inc. | | United States | | | 5,517,437 | | | | 181,082,282 | |
TransCanada Corp. | | Canada | | | 4,500,000 | | | | 182,070,000 | |
The Williams Cos. Inc. | | United States | | | 6,500,000 | | | | 176,735,000 | |
| | | | | | | | | | |
| | | |
| | | | | | | | | 3,629,694,339 | |
| | | | | | | | | | |
Financials 5.8% | | | | | | | | | | |
AXA SA | | France | | | 18,000,000 | | | | 483,767,887 | |
bBank of America Corp. | | United States | | | 15,000,000 | | | | 441,900,000 | |
Barclays PLC | | United Kingdom | | | 59,230,758 | | | | 132,631,775 | |
HSBC Holdings PLC | | United Kingdom | | | 30,000,000 | | | | 261,935,336 | |
bJPMorgan Chase & Co. | | United States | | | 7,500,000 | | | | 846,300,000 | |
bMetLife Inc. | | United States | | | 8,880,000 | | | | 414,873,600 | |
U.S. Bancorp | | United States | | | 6,000,000 | | | | 316,860,000 | |
Wells Fargo & Co. | | United States | | | 29,690,000 | | | | 1,560,506,400 | |
| | | | | | | | | | |
| | | |
| | | | | | | | | 4,458,774,998 | |
| | | | | | | | | | |
Health Care 4.3% | | | | | | | | | | |
AstraZeneca PLC | | United Kingdom | | | 10,000,000 | | | | 777,306,863 | |
bEli Lilly & Co. | | United States | | | 2,000,000 | | | | 214,620,000 | |
Johnson & Johnson | | United States | | | 3,000,000 | | | | 414,510,000 | |
bMerck & Co. Inc. | | United States | | | 14,000,000 | | | | 993,160,000 | |
Pfizer Inc. | | United States | | | 20,000,000 | | | | 881,400,000 | |
| | | | | | | | | | |
| | | |
| | | | | | | | | 3,280,996,863 | |
| | | | | | | | | | |
| | | | |
| | | |
| franklintempleton.com | | Annual Report | | 65 |
FRANKLIN CUSTODIAN FUNDS
STATEMENT OF INVESTMENTS
Franklin Income Fund(continued)
| | | | | | | | | | |
| | | Country | | Shares | | | Value | |
Common Stocks(continued) | | | | | | | | | | |
Industrials 1.6% | | | | | | | | | | |
b3M Co. | | United States | | | 1,000,000 | | | $ | 210,710,000 | |
d,fCEVA Logistics AG | | Switzerland | | | 1,963,608 | | | | 36,663,024 | |
Cummins Inc. | | United States | | | 1,760,706 | | | | 257,186,325 | |
General Electric Co. | | United States | | | 66,000,000 | | | | 745,140,000 | |
| | | | | | | | | | |
| | | |
| | | | | | | | | 1,249,699,349 | |
| | | | | | | | | | |
Information Technology 2.2% | | | | | | | | | | |
Analog Devices Inc. | | United States | | | 3,000,000 | | | | 277,380,000 | |
Applied Materials Inc. | | United States | | | 1,000,000 | | | | 38,650,000 | |
Intel Corp. | | United States | | | 3,000,000 | | | | 141,870,000 | |
Lam Research Corp. | | United States | | | 1,500,000 | | | | 227,550,000 | |
Microchip Technology Inc. | | United States | | | 400,000 | | | | 31,564,000 | |
Microsoft Corp. | | United States | | | 2,908,000 | | | | 332,587,960 | |
Oracle Corp. | | United States | | | 3,920,015 | | | | 202,115,974 | |
Texas Instruments Inc. | | United States | | | 4,000,000 | | | | 429,160,000 | |
| | | | | | | | | | |
| | | |
| | | | | | | | | 1,680,877,934 | |
| | | | | | | | | | |
Materials 2.7% | | | | | | | | | | |
BASF SE | | Germany | | | 10,000,000 | | | | 888,707,264 | |
BHP Billiton PLC | | United Kingdom | | | 5,000,000 | | | | 108,924,638 | |
DowDuPont Inc. | | United States | | | 7,757,000 | | | | 498,852,670 | |
Rio Tinto PLC, ADR. | | Australia | | | 11,251,535 | | | | 574,053,316 | |
| | | | | | | | | | |
| | | |
| | | | | | | | | 2,070,537,888 | |
| | | | | | | | | | |
Real Estate 0.6% | | | | | | | | | | |
Host Hotels & Resorts Inc. | | United States | | | 20,000,000 | | | | 422,000,000 | |
| | | | | | | | | | |
Utilities 6.4% | | | | | | | | | | |
bDominion Energy Inc. | | United States | | | 18,000,000 | | | | 1,265,040,000 | |
Duke Energy Corp. | | United States | | | 9,000,000 | | | | 720,180,000 | |
Entergy Corp. | | United States | | | 1,428,600 | | | | 115,902,318 | |
bSempra Energy. | | United States | | | 10,330,000 | | | | 1,175,037,500 | |
The Southern Co. | | United States | | | 30,000,000 | | | | 1,308,000,000 | |
Xcel Energy Inc. | | United States | | | 6,500,000 | | | | 306,865,000 | |
| | | | | | | | | | |
| | | |
| | | | | | | | | 4,891,024,818 | |
| | | | | | | | | | |
| | | |
Total Common Stocks (Cost $23,998,851,144) | | | | | | | | | 26,971,257,285 | |
| | | | | | | | | | |
| | | |
gEquity-Linked Securities 12.8% | | | | | | | | | | |
Communication Services 0.9% | | | | | | | | | | |
hBarclays Bank PLC into Alphabet Inc., 7.00%, A, 144A | | United States | | | 182,000 | | | | 211,912,165 | |
hCredit Suisse AG London into Comcast Corp., 7.00%, A, 144A | | United States | | | 6,204,000 | | | | 225,201,869 | |
hGoldman Sachs International into Comcast Corp., 7.00%, A, 144A | | United States | | | 5,970,000 | | | | 212,915,447 | |
hRoyal Bank of Canada into Alphabet Inc., 6.00%, A, 144A | | Belgium | | | 24,100 | | | | 29,218,258 | |
| | | | | | | | | | |
| | | |
| | | | | | | | | 679,247,739 | |
| | | | | | | | | | |
Consumer Discretionary 2.1% | | | | | | | | | | |
hCitigroup Global Markets Holdings Inc. into Ford Motor Co., 9.00%, 144A | | United States | | | 17,100,000 | | | | 162,957,989 | |
hCitigroup Global Markets Holdings Inc. into General Motors Co., 9.00%, 144A | | United States | | | 8,350,000 | | | | 288,837,664 | |
hCredit Suisse AG London into General Motors Co., 8.00%, 144A | | United States | | | 5,680,000 | | | | 199,376,912 | |
hCredit Suisse AG London into Newell Brands Inc., 7.00%, 144A | | United States | | | 3,940,000 | | | | 82,837,921 | |
hJP Morgan Chase Financial Co. LLC into Ford Motor Co., 10.00%, 144A | | United States | | | 28,170,000 | | | | 269,104,038 | |
hMorgan Stanley BV into Target Corp., 8.00%, 144A | | United States | | | 3,379,000 | | | | 283,786,660 | |
hWells Fargo Bank National Assn. into Ford Motor Co., 8.50%, 144A | | United States | | | 12,500,000 | | | | 120,573,925 | |
| | | | |
| | | |
66 | | Annual Report | | franklintempleton.com |
FRANKLIN CUSTODIAN FUNDS
STATEMENT OF INVESTMENTS
Franklin Income Fund(continued)
| | | | | | | | | | |
| | | Country | | Shares | | | Value | |
| | | |
gEquity-Linked Securities(continued) | | | | | | | | | | |
Consumer Discretionary(continued) | | | | | | | | | | |
hWells Fargo Bank National Assn. into Target Corp., 8.00%, 144A | | United States | | | 2,536,000 | | | $ | 218,228,138 | |
| | | | | | | | | | |
| | | |
| | | | | | | | | 1,625,703,247 | |
| | | | | | | | | | |
Energy 1.1% | | | | | | | | | | |
hBNP Paribas Arbitrage Issuance BV into Anadarko Petroleum Corp., 8.50%, 144A | | United States | | | 4,464,000 | | | | 247,265,451 | |
hJP Morgan Chase Financial Co. LLC into Schlumberger Ltd., 144A | | United States | | | 4,170,000 | | | | 250,955,262 | |
hRoyal Bank of Canada into Anadarko Petroleum Corp., 8.50%, 144A | | United States | | | 4,450,000 | | | | 252,854,229 | |
hUBS AG London into Halliburton Co., 7.00%, 144A | | United States | | | 1,400,000 | | | | 58,883,818 | |
| | | | | | | | | | |
| | | |
| | | | | | | | | 809,958,760 | |
| | | | | | | | | | |
Financials 1.1% | | | | | | | | | | |
hBarclays Bank PLC into Wells Fargo & Co., 6.50%, 144A | | United States | | | 4,355,000 | | | | 232,728,870 | |
hBarclays Bank PLC into MetLife Inc., 7.00%, 144A | | United States | | | 5,339,000 | | | | 248,557,871 | |
hDeutsche Bank AG London into Wells Fargo & Co., 7.00%, 144A | | United States | | | 3,785,000 | | | | 204,960,475 | |
hRoyal Bank of Canada into U.S. Bancorp, 6.00%, 144A | | United States | | | 3,680,000 | | | | 196,768,353 | |
| | | | | | | | | | |
| | | |
| | | | | | | | | 883,015,569 | |
| | | | | | | | | | |
Health Care 1.0% | | | | | | | | | | |
hBarclays Bank PLC into Mylan NV, 7.50%, 144A | | United States | | | 2,421,000 | | | | 89,266,819 | |
hCitigroup Global Markets Holdings Inc. into Medtronic PLC, 6.00%, 144A | | United States | | | 1,882,000 | | | | 165,439,675 | |
hMerrill Lynch International & Co. CV into Merck & Co. Inc., 6.50%, 144A | | United States | | | 4,125,000 | | | | 274,243,988 | |
hUBS AG London into Medtronic PLC, 6.00%, 144A | | United States | | | 2,442,000 | | | | 219,664,198 | |
| | | | | | | | | | |
| | | |
| | | | | | | | | 748,614,680 | |
| | | | | | | | | | |
Industrials 1.3% | | | | | | | | | | |
hMerrill Lynch International & Co. CV into Deere & Co., 7.00%, 144A | | United States | | | 1,848,000 | | | | 268,845,874 | |
hMorgan Stanley BV into Cummins Inc., 7.50%, 144A | | United States | | | 1,265,000 | | | | 191,947,429 | |
hUBS AG London into Union Pacific Corp., 7.50%, 144A | | United States | | | 2,130,000 | | | | 328,443,048 | |
hWells Fargo Bank National Assn. into General Electric Co., 8.00%, 144A | | United States | | | 17,300,000 | | | | 202,062,944 | |
| | | | | | | | | | |
| | | |
| | | | | | | | | 991,299,295 | |
| | | | | | | | | | |
Information Technology 4.1% | | | | | | | | | | |
hCitigroup Global Markets Holdings Inc. into Texas Instruments Inc., 7.00%, 144A | | United States | | | 1,600,000 | | | | 175,403,744 | |
hDeutsche Bank AG London into Applied Materials Inc., 8.00%, 144A | | United States | | | 3,252,000 | | | | 132,509,042 | |
hDeutsche Bank AG London into Intel Corp., 7.00%, 144A | | United States | | | 10,750,000 | | | | 510,084,576 | |
hGoldman Sachs International into Apple Inc., 6.50%, 144A | | United States | | | 2,883,000 | | | | 561,866,988 | |
hGoldman Sachs International into Texas Instruments Inc., 7.00%, 144A | | United States | | | 2,312,000 | | | | 248,084,319 | |
hMorgan Stanley BV into Microsoft Corp., 7.00%, 144A | | United States | | | 3,521,000 | | | | 376,879,421 | |
hSociete Generale SA into Intel Corp., 8.00%, 144A | | United States | | | 4,322,000 | | | | 207,764,509 | |
hUBS AG London into Broadcom Ltd., 8.00%, 144A | | United States | | | 757,000 | | | | 190,959,381 | |
hUBS AG London into Microsoft Corp., 6.50%, 144A | | United States | | | 550,000 | | | | 61,551,426 | |
hUBS AG London into Oracle Corp., 5.50%, 144A | | United States | | | 3,799,000 | | | | 197,186,821 | |
hWells Fargo Bank National Assn. into Intel Corp., 8.00%, 144A | | United States | | | 2,880,000 | | | | 141,336,608 | |
hWells Fargo Bank National Assn. into Microsoft Corp., 7.00%, 144A | | United States | | | 3,118,000 | | | | 326,172,346 | |
| | | | | | | | | | |
| | | |
| | | | | | | | | 3,129,799,181 | |
| | | | | | | | | | |
Materials 1.2% | | | | | | | | | | |
hBarclays Bank PLC into International Paper Co., 8.00%, 144A | | United States | | | 3,125,000 | | | | 158,166,231 | |
hBarclays Bank PLC into Rio Tinto PLC, 10.00%, 144A | | United Kingdom | | | 4,752,000 | | | | 249,758,586 | |
hMerrill Lynch International & Co. CV into DowDuPont Inc., 7.00%, 144A | | United States | | | 3,560,000 | | | | 234,578,760 | |
hUBS AG London into DowDuPont Inc., 6.00%, 144A | | United States | | | 4,360,000 | | | | 286,920,870 | |
| | | | | | | | | | |
| | | |
| | | | | | | | | 929,424,447 | |
| | | | | | | | | | |
Total Equity-Linked Securities (Cost $9,975,623,924) | | | | | | | | | 9,797,062,918 | |
| | | | | | | | | | |
| | | | |
| | | |
| franklintempleton.com | | Annual Report | | 67 |
FRANKLIN CUSTODIAN FUNDS
STATEMENT OF INVESTMENTS
Franklin Income Fund(continued)
| | | | | | | | | | | | | | |
| | | Country | | Shares | | | | | | Value | |
| | | | |
Convertible Preferred Stocks 1.2% | | | | | | | | | | | | | | |
Energy 0.1% | | | | | | | | | | | | | | |
Chesapeake Energy Corp., 5.75%, cvt. pfd. | | United States | | | 95,150 | | | | | | | $ | 60,676,870 | |
| | | | | | | | | | | | | | |
Financials 0.9% | | | | | | | | | | | | | | |
Bank of America Corp., 7.25%, cvt. pfd., L | | United States | | | 445,218 | | | | | | | | 576,223,395 | |
dFNMA, 5.375%, cvt. pfd. | | United States | | | 4,250 | | | | | | | | 76,500,000 | |
| | | | | | | | | | | | | | |
| | | | |
| | | | | | | | | | | | | 652,723,395 | |
| | | | | | | | | | | | | | |
Industrials 0.1% | | | | | | | | | | | | | | |
Fortive Corp., 5.00%, cvt. pfd., A | | United States | | | 47,000 | | | | | | | | 50,704,070 | |
| | | | | | | | | | | | | | |
Utilities 0.1% | | | | | | | | | | | | | | |
Sempra Energy, 6.00%, cvt. pfd., A | | United States | | | 400,000 | | | | | | | | 40,336,000 | |
Sempra Energy, 6.75%, cvt. pfd., B | | United States | | | 739,000 | | | | | | | | 74,487,505 | |
| | | | | | | | | | | | | | |
| | | | |
| | | | | | | | | | | | | 114,823,505 | |
| | | | | | | | | | | | | | |
| | | | |
Total Convertible Preferred Stocks (Cost $922,626,057) | | | | | | | | | | | | | 878,927,840 | |
| | | | | | | | | | | | | | |
| | | | |
Preferred Stocks 0.1% | | | | | | | | | | | | | | |
Financials 0.1% | | | | | | | | | | | | | | |
dFHLMC, 8.375%, pfd., Z | | United States | | | 7,632,009 | | | | | | | | 40,678,608 | |
dFNMA, 8.25%, pfd., S | | United States | | | 5,500,000 | | | | | | | | 30,305,000 | |
| | | | | | | | | | | | | | |
| | | | |
Total Preferred Stocks (Cost $316,153,851) | | | | | | | | | | | | | 70,983,608 | |
| | | | | | | | | | | | | | |
| | | | |
| | | | | Units | | | | | | | |
iIndex-Linked Notes (Cost $100,105,450) 0.1% | | | | | | | | | | | | | | |
Financials 0.1% | | | | | | | | | | | | | | |
h,jMorgan Stanley Finance LLC, senior note, 144A, 5.08%, 10/03/19 | | United States | | | 755,000 | | | | | | | | 107,904,600 | |
| | | | | | | | | | | | | | |
| | | | |
| | | | | Principal
Amount* | | | | | | | |
Convertible Bonds 0.7% | | | | | | | | | | | | | | |
Energy 0.5% | | | | | | | | | | | | | | |
Chesapeake Energy Corp., cvt., senior note, 5.50%, 9/15/26 | | United States | | | 135,000,000 | | | | | | | | 133,756,650 | |
Weatherford International Ltd., cvt., senior note, 5.875%, 7/01/21 | | United States | | | 238,500,000 | | | | | | | | 225,197,424 | |
| | | | | | | | | | | | | | |
| | | | |
| | | | | | | | | | | | | 358,954,074 | |
| | | | | | | | | | | | | | |
Health Care 0.2% | | | | | | | | | | | | | | |
hBayer Capital Corp BV, cvt., junior sub. note, 144A, 5.625%, 11/22/19 | | Germany | | | 150,000,000 | | | | EUR | | | | 160,735,276 | |
| | | | | | | | | | | | | | |
| | | | |
Total Convertible Bonds (Cost $528,459,708) | | | | | | | | | | | | | 519,689,350 | |
| | | | | | | | | | | | | | |
| | | | |
Corporate Bonds 37.2% | | | | | | | | | | | | | | |
Communication Services 5.4% | | | | | | | | | | | | | | |
hAltice Financing SA, secured bond, 144A, 7.50%, 5/15/26 | | Luxembourg | | | 50,000,000 | | | | | | | | 48,375,000 | |
hAltice Luxembourg SA, senior secured note, 144A, 7.75%, 5/15/22 | | Luxembourg | | | 50,000,000 | | | | | | | | 48,850,000 | |
AMC Entertainment Holdings Inc., | | | | | | | | | | | | | | |
senior sub. bond, 5.75%, 6/15/25 | | United States | | | 37,325,000 | | | | | | | | 35,859,994 | |
senior sub. note, 5.875%, 11/15/26 | | United States | | | 41,300,000 | | | | | | | | 39,648,000 | |
AT&T Inc., | | | | | | | | | | | | | | |
senior bond, 4.125%, 2/17/26 | | United States | | | 100,000,000 | | | | | | | | 98,917,957 | |
senior note, 3.00%, 6/30/22 | | United States | | | 100,000,000 | | | | | | | | 97,591,543 | |
| | | | |
| | | |
68 | | Annual Report | | franklintempleton.com |
FRANKLIN CUSTODIAN FUNDS
STATEMENT OF INVESTMENTS
Franklin Income Fund(continued)
| | | | | | | | |
| | | Country | | Principal Amount* | | Value | |
| | | |
Corporate Bonds(continued) | | | | | | | | |
Communication Services(continued) | | | | | | | | |
CCO Holdings LLC/CCO Holdings Capital Corp., | | | | | | | | |
senior bond, 5.125%, 2/15/23 | | United States | | 105,000,000 | | $ | 105,656,250 | |
senior bond, 5.75%, 9/01/23 | | United States | | 67,000,000 | | | 68,255,580 | |
senior bond, 5.75%, 1/15/24 | | United States | | 105,000,000 | | | 106,968,750 | |
hsenior bond, 144A, 5.50%, 5/01/26 | | United States | | 60,000,000 | | | 59,475,000 | |
hsenior bond, 144A, 5.125%, 5/01/27 | | United States | | 70,000,000 | | | 66,542,700 | |
hsenior bond, 144A, 5.00%, 2/01/28 | | United States | | 45,500,000 | | | 42,879,200 | |
hsenior note, 144A, 5.875%, 4/01/24 | | United States | | 5,000,000 | | | 5,118,750 | |
Consolidated Communications Inc., senior note, 6.50%, 10/01/22 | | United States | | 34,300,000 | | | 32,585,000 | |
DISH DBS Corp., | | | | | | | | |
senior bond, 5.875%, 7/15/22 | | United States | | 391,500,000 | | | 383,425,312 | |
senior bond, 5.00%, 3/15/23 | | United States | | 300,000,000 | | | 273,354,000 | |
senior note, 5.875%, 11/15/24 | | United States | | 128,200,000 | | | 115,700,500 | |
Netflix Inc., | | | | | | | | |
senior bond, 4.375%, 11/15/26 | | United States | | 52,000,000 | | | 49,112,960 | |
hsenior bond, 144A, 4.875%, 4/15/28 | | United States | | 55,000,000 | | | 51,768,750 | |
hsenior bond, 144A, 5.875%, 11/15/28 | | United States | | 60,000,000 | | | 60,259,200 | |
hSFR Group SA, secured bond, 144A, 7.375%, 5/01/26 | | France | | 50,000,000 | | | 50,187,500 | |
hSirius XM Radio Inc., | | | | | | | | |
senior bond, 144A, 6.00%, 7/15/24 | | United States | | 50,000,000 | | | 52,010,000 | |
senior note, 144A, 4.625%, 5/15/23 | | United States | | 88,400,000 | | | 87,745,840 | |
Sprint Capital Corp., senior note, 6.90%, 5/01/19 | | United States | | 200,000,000 | | | 203,750,000 | |
Sprint Communications Inc., | | | | | | | | |
senior bond, 11.50%, 11/15/21 | | United States | | 200,000,000 | | | 235,500,000 | |
senior note, 7.00%, 8/15/20 | | United States | | 102,500,000 | | | 107,581,950 | |
senior note, 6.00%, 11/15/22 | | United States | | 362,700,000 | | | 370,860,750 | |
Sprint Corp., | | | | | | | | |
senior bond, 7.875%, 9/15/23 | | United States | | 187,350,000 | | | 202,311,771 | |
senior bond, 7.125%, 6/15/24 | | United States | | 190,650,000 | | | 198,514,313 | |
senior note, 7.625%, 3/01/26 | | United States | | 100,000,000 | | | 106,075,000 | |
hSprint Spectrum Co. LLC, senior secured bond, first lien, 144A, 5.152%, 9/20/29 | | United States | | 220,000,000 | | | 221,628,000 | |
hUnivision Communications Inc., | | | | | | | | |
senior secured note, first lien, 144A, 5.125%, 5/15/23 | | United States | | 160,000,000 | | | 153,600,000 | |
senior secured note, first lien, 144A, 5.125%, 2/15/25 | | United States | | 120,020,000 | | | 112,518,750 | |
Verizon Communications Inc., | | | | | | | | |
senior bond, 3.50%, 11/01/24 | | United States | | 50,000,000 | | | 49,389,312 | |
senior bond, 2.625%, 8/15/26. | | United States | | 7,000,000 | | | 6,354,597 | |
hVirgin Media Secured Finance PLC, senior secured bond, first lien, 144A, 5.50%, 1/15/25 | | United Kingdom | | 80,000,000 | | | 80,200,000 | |
Zayo Group LLC/Zayo Capital Inc., senior note, 6.00%, 4/01/23 | | United States | | 77,000,000 | | | 79,695,000 | |
| | | | | | | | |
| | | |
| | | | | | | 4,108,267,229 | |
| | | | | | | | |
Consumer Discretionary 2.0% | | | | | | | | |
h24 Hour Holdings III LLC, senior note, 144A, 8.00%, 6/01/22 | | United States | | 110,000,000 | | | 110,853,600 | |
Alibaba Group Holding Ltd., senior note, 3.40%, 12/06/27 | | China | | 55,000,000 | | | 51,322,975 | |
Fiat Chrysler Automobiles NV, senior note, 5.25%, 4/15/23 | | United Kingdom | | 55,400,000 | | | 56,529,052 | |
Ford Motor Co., | | | | | | | | |
senior bond, 4.75%, 1/15/43 | | United States | | 50,000,000 | | | 41,803,268 | |
senior note, 4.346%, 12/08/26 | | United States | | 100,000,000 | | | 94,316,369 | |
| | | | |
| | | |
| franklintempleton.com | | Annual Report | | 69 |
FRANKLIN CUSTODIAN FUNDS
STATEMENT OF INVESTMENTS
Franklin Income Fund(continued)
| | | | | | | | |
| | | Country | | Principal Amount* | | Value | |
| | | |
Corporate Bonds(continued) | | | | | | | | |
Consumer Discretionary(continued) | | | | | | | | |
Ford Motor Credit Co. LLC, | | | | | | | | |
senior note, 3.336%, 3/18/21 | | United States | | 25,000,000 | | $ | 24,659,334 | |
senior note, 4.134%, 8/04/25 | | United States | | 75,000,000 | | | 70,934,066 | |
ksenior note, FRN, 3.221%,(3-month USD LIBOR + 0.88%), 10/12/21 | | United States | | 50,000,000 | | | 49,558,428 | |
General Motors Co., senior bond, 5.15%, 4/01/38 | | United States | | 165,000,000 | | | 153,759,684 | |
General Motors Financial Co. Inc., | | | | | | | | |
senior note, 3.15%, 6/30/22 | | United States | | 14,400,000 | | | 14,020,523 | |
senior note, 4.15%, 6/19/23 | | United States | | 75,000,000 | | | 74,847,022 | |
hGolden Nugget Inc., senior note, 144A, 6.75%, 10/15/24 | | United States | | 50,000,000 | | | 50,844,000 | |
hHanesbrands Inc., | | | | | | | | |
senior bond, 144A, 4.875%, 5/15/26 | | United States | | 41,000,000 | | | 39,411,250 | |
senior note, 144A, 4.625%, 5/15/24 | | United States | | 30,000,000 | | | 29,306,250 | |
KB Home, | | | | | | | | |
senior bond, 7.50%, 9/15/22 | | United States | | 25,800,000 | | | 27,960,750 | |
senior note, 7.00%, 12/15/21 | | United States | | 20,200,000 | | | 21,361,500 | |
hShea Homes LP/Shea Homes Funding Corp., | | | | | | | | |
senior bond, 144A, 6.125%, 4/01/25 | | United States | | 85,000,000 | | | 83,406,250 | |
senior note, 144A, 5.875%, 4/01/23 | | United States | | 70,000,000 | | | 69,387,500 | |
hTesla Inc., senior note, 144A, 5.30%, 8/15/25 | | United States | | 100,000,000 | | | 84,625,000 | |
hWynn Las Vegas LLC/Wynn Las Vegas Capital Corp., | | | | | | | | |
senior bond, 144A, 4.25%, 5/30/23 | | United States | | 84,000,000 | | | 80,640,000 | |
senior bond, 144A, 5.50%, 3/01/25 | | United States | | 135,000,000 | | | 130,781,250 | |
senior bond, 144A, 5.25%, 5/15/27 | | United States | | 99,827,000 | | | 92,839,110 | |
hWynn Macau Ltd., senior bond, 144A, 5.50%, 10/01/27 | | Macau | | 60,100,000 | | | 56,494,000 | |
| | | | | | | | |
| | | |
| | | | | | | 1,509,661,181 | |
| | | | | | | | |
Consumer Staples 0.7% | | | | | | | | |
Anheuser-Busch InBev Worldwide Inc., senior bond, 4.00%, 4/13/28 | | Belgium | | 25,000,000 | | | 24,676,684 | |
hBAT Capital Corp., | | | | | | | | |
senior note, 144A, 3.222%, 8/15/24 | | United Kingdom | | 75,000,000 | | | 71,560,059 | |
senior note, 144A, 3.557%, 8/15/27 | | United Kingdom | | 140,000,000 | | | 130,485,600 | |
Kraft Heinz Foods Co., | | | | | | | | |
senior bond, 3.50%, 6/06/22 | | United States | | 14,200,000 | | | 14,121,255 | |
senior bond, 3.95%, 7/15/25 | | United States | | 60,000,000 | | | 59,190,059 | |
senior bond, 4.625%, 1/30/29 | | United States | | 50,000,000 | | | 49,988,148 | |
hPost Holdings Inc., | | | | | | | | |
senior bond, 144A, 5.00%, 8/15/26 | | United States | | 62,500,000 | | | 59,331,250 | |
senior bond, 144A, 5.625%, 1/15/28 | | United States | | 65,000,000 | | | 62,725,000 | |
Walmart Inc., | | | | | | | | |
senior note, 3.40%, 6/26/23 | | United States | | 50,000,000 | | | 50,199,414 | |
senior note, 3.55%, 6/26/25 | | United States | | 40,000,000 | | | 40,216,352 | |
| | | | | | | | |
| | | |
| | | | | | | 562,493,821 | |
| | | | | | | | |
Energy 7.7% | | | | | | | | |
hAscent Resources Utica Holdings LLC/ARU Finance Corp., senior note, 144A, 10.00%, 4/01/22 | | United States | | 150,000,000 | | | 169,875,000 | |
Bill Barrett Corp., | | | | | | | | |
senior bond, 7.00%, 10/15/22 | | United States | | 200,890,000 | | | 200,890,000 | |
senior note, 8.75%, 6/15/25 | | United States | | 142,000,000 | | | 149,810,000 | |
Callon Petroleum Co., senior note, 6.375%, 7/01/26 | | United States | | 40,000,000 | | | 40,900,000 | |
| | | | |
| | | |
70 | | Annual Report | | franklintempleton.com |
FRANKLIN CUSTODIAN FUNDS
STATEMENT OF INVESTMENTS
Franklin Income Fund(continued)
| | | | | | | | |
| | | Country | | Principal Amount* | | Value | |
| | | |
Corporate Bonds(continued) | | | | | | | | |
Energy (continued) | | | | | | | | |
Calumet Specialty Products Partners LP/Calumet Finance Corp., | | | | | | | | |
senior note, 6.50%, 4/15/21 | | United States | | 309,348,000 | | $ | 309,348,000 | |
senior note, 7.625%, 1/15/22 | | United States | | 97,552,000 | | | 98,283,640 | |
senior note, 7.75%, 4/15/23 | | United States | | 62,000,000 | | | 62,310,000 | |
Canadian Natural Resources Ltd., senior bond, 3.85%, 6/01/27 | | Canada | | 25,000,000 | | | 24,379,490 | |
Chesapeake Energy Corp., | | | | | | | | |
hsecured note, second lien, 144A, 8.00%, 12/15/22 | | United States | | 506,386,000 | | | 531,705,300 | |
senior bond, 6.875%, 11/15/20 | | United States | | 95,000,000 | | | 99,987,500 | |
senior bond, 6.125%, 2/15/21 | | United States | | 226,000,000 | | | 232,384,500 | |
senior bond, 8.00%, 6/15/27 | | United States | | 250,000,000 | | | 255,500,000 | |
senior note, 6.625%, 8/15/20 | | United States | | 157,800,000 | | | 165,690,000 | |
senior note, 5.375%, 6/15/21 | | United States | | 97,000,000 | | | 97,000,000 | |
senior note, 4.875%, 4/15/22 | | United States | | 107,710,000 | | | 105,151,887 | |
senior note, 5.75%, 3/15/23 | | United States | | 96,700,000 | | | 94,645,125 | |
csenior note, 8.00%, 1/15/25 | | United States | | 410,000,000 | | | 424,145,000 | |
senior note, 7.50%, 10/01/26 | | United States | | 50,000,000 | | | 50,062,500 | |
ksenior note, FRN, 5.589%,(3-month USD LIBOR + 3.25%), 4/15/19 | | United States | | 72,800,000 | | | 73,073,000 | |
Chevron Corp., senior note, 2.895%, 3/03/24 | | United States | | 17,300,000 | | | 16,847,713 | |
Energy Transfer Equity LP, senior secured bond, first lien, 5.50%, 6/01/27 | | United States | | 95,300,000 | | | 99,140,590 | |
Ensco PLC, | | | | | | | | |
senior bond, 5.75%, 10/01/44 | | United States | | 50,000,000 | | | 37,562,500 | |
senior note, 7.75%, 2/01/26 | | United States | | 35,000,000 | | | 34,868,750 | |
Ferrellgas LP/Ferrellgas Finance Corp., | | | | | | | | |
senior note, 6.50%, 5/01/21 | | United States | | 79,295,000 | | | 71,365,500 | |
senior note, 6.75%, 1/15/22 | | United States | | 112,500,000 | | | 98,718,750 | |
senior note, 6.75%, 6/15/23 | | United States | | 88,500,000 | | | 74,340,000 | |
Gulfport Energy Corp., | | | | | | | | |
senior note, 6.375%, 5/15/25 | | United States | | 50,000,000 | | | 49,375,000 | |
senior note, 6.375%, 1/15/26 | | United States | | 50,000,000 | | | 48,750,000 | |
Halcon Resources Corp., senior note, 6.75%, 2/15/25 | | United States | | 80,000,000 | | | 77,200,000 | |
Kinder Morgan Inc., | | | | | | | | |
senior bond, 7.75%, 1/15/32 | | United States | | 118,000,000 | | | 149,239,438 | |
hsenior secured bond, first lien, 144A, 5.625%, 11/15/23 | | United States | | 91,200,000 | | | 97,411,816 | |
hMatador Resources Co., senior note, 144A, 5.875%, 9/15/26 | | United States | | 50,000,000 | | | 50,750,000 | |
Sanchez Energy Corp., senior note, 7.75%, 6/15/21 | | United States | | 81,692,000 | | | 57,592,860 | |
hSunoco LP/Sunoco Finance Corp., senior note, 144A, 5.50%, 2/15/26 | | United States | | 74,775,000 | | | 72,419,587 | |
hTalos Production LLC/Talos Production Finance Inc., senior note, second lien, 144A, 11.00%, 4/03/22 | | United States | | 72,845,556 | | | 78,308,973 | |
W&T Offshore Inc., | | | | | | | | |
h,lsecured note, second lien, 144A, PIK, 9.00%, 5/15/20 | | United States | | 82,377,299 | | | 83,201,072 | |
senior note, 8.50%, 6/15/19 | | United States | | 96,921,000 | | | 97,405,605 | |
h,lsenior secured note, third lien, 144A, PIK, 10.00%, 6/15/21 | | United States | | 74,635,970 | | | 75,059,008 | |
hWeatherford International LLC, senior note, 144A, 9.875%, 3/01/25 | | United States | | 88,000,000 | | | 85,360,000 | |
Weatherford International Ltd., | | | | | | | | |
senior note, 5.125%, 9/15/20 | | United States | | 81,000,000 | | | 80,898,750 | |
senior note, 7.75%, 6/15/21 | | United States | | 384,500,000 | | | 383,058,125 | |
senior note, 4.50%, 4/15/22 | | United States | | 317,600,000 | | | 279,488,000 | |
senior note, 8.25%, 6/15/23 | | United States | | 283,100,000 | | | 268,945,000 | |
senior note, 9.875%, 2/15/24 | | United States | | 230,000,000 | | | 225,975,000 | |
The Williams Cos. Inc., senior note, 4.55%, 6/24/24 | | United States | | 46,858,000 | | | 47,650,515 | |
| | | | | | | | |
| | | |
| | | | | | | 5,926,073,494 | |
| | | | | | | | |
| | | | |
| | | |
| franklintempleton.com | | Annual Report | | 71 |
FRANKLIN CUSTODIAN FUNDS
STATEMENT OF INVESTMENTS
Franklin Income Fund(continued)
| | | | | | | | |
| | | Country | | Principal Amount* | | Value | |
| | | |
Corporate Bonds(continued) | | | | | | | | |
Financials 5.0% | | | | | | | | |
hAshtead Capital Inc., secured bond, second lien, 144A, 4.375%, 8/15/27 | | United Kingdom | | 20,000,000 | | $ | 19,026,400 | |
Bank of America Corp., | | | | | | | | |
mjunior sub. bond, AA, 6.10% to 3/17/25, FRN thereafter, Perpetual | | United States | | 80,000,000 | | | 84,000,000 | |
mjunior sub. bond, U, 5.20% to 6/01/23, FRN thereafter, Perpetual | | United States | | 68,000,000 | | | 67,405,000 | |
mjunior sub. bond, X, 6.25% to 9/05/24, FRN thereafter, Perpetual | | United States | | 85,000,000 | | | 90,100,000 | |
senior bond, 3.419% to 12/20/27, FRN thereafter, 12/20/28 | | United States | | 135,000,000 | | | 126,774,902 | |
senior note, 3.004% to 12/20/22, FRN thereafter, 12/20/23 | | United States | | 100,000,000 | | | 97,077,538 | |
Barclays PLC, senior note, 4.375%, 1/12/26 | | United Kingdom | | 67,300,000 | | | 65,296,816 | |
Capital One Financial Corp., | | | | | | | | |
senior sub. note, 4.20%, 10/29/25 | | United States | | 100,000,000 | | | 97,814,856 | |
sub. note, 3.75%, 7/28/26 | | United States | | 75,000,000 | | | 70,065,289 | |
Citigroup Inc., | | | | | | | | |
mjunior sub. bond, 5.35% to 5/15/23, FRN thereafter, Perpetual | | United States | | 179,195,000 | | | 176,283,081 | |
mjunior sub. bond, 5.90% to 2/15/23, FRN thereafter, Perpetual | | United States | | 33,000,000 | | | 33,825,000 | |
mjunior sub. bond, 5.95% to 1/30/23, FRN thereafter, Perpetual | | United States | | 230,000,000 | | | 235,398,100 | |
mjunior sub. bond, M, 6.30% to 5/15/24, FRN thereafter, Perpetual | | United States | | 247,500,000 | | | 253,068,750 | |
mjunior sub. bond, O, 5.875% to 3/27/20, FRN thereafter, Perpetual | | United States | | 160,000,000 | | | 164,400,000 | |
mjunior sub. bond, Q, 5.95% to 8/15/20, FRN thereafter, Perpetual | | United States | | 120,000,000 | | | 123,771,000 | |
sub. bond, 4.125%, 7/25/28 | | United States | | 165,000,000 | | | 159,501,743 | |
sub. note, 3.50%, 5/15/23 | | United States | | 45,000,000 | | | 44,300,305 | |
mFifth Third Bancorp, junior sub. bond, 5.10% to 6/30/23, FRN thereafter, Perpetual | | United States | | 54,000,000 | | | 53,055,000 | |
The Goldman Sachs Group Inc., | | | | | | | | |
senior note, 3.50%, 11/16/26 | | United States | | 55,000,000 | | | 52,222,018 | |
senior note, 2.876% to 10/31/21, FRN thereafter, 10/31/22 | | United States | | 125,000,000 | | | 122,010,541 | |
senior note, 3.272% to 9/29/24, FRN thereafter, 9/29/25 | | United States | | 100,000,000 | | | 95,591,156 | |
HSBC Holdings PLC, | | | | | | | | |
senior bond, 4.292% to 9/12/25, FRN thereafter, 9/12/26 | | United Kingdom | | 125,000,000 | | | 123,380,000 | |
senior note, 3.40%, 3/08/21 | | United Kingdom | | 15,500,000 | | | 15,464,583 | |
mJPMorgan Chase & Co., | | | | | | | | |
junior sub. bond, 6.125% to 4/30/24, FRN thereafter, Perpetual | | United States | | 60,000,000 | | | 62,557,800 | |
junior sub. bond, 6.75% to 2/01/24, FRN thereafter, Perpetual | | United States | | 100,000,000 | | | 109,250,000 | |
kjunior sub. bond, FRN, 5.809%,(3-month USD LIBOR + 3.47%), Perpetual | | United States | | 585,000,000 | | | 588,217,500 | |
junior sub. bond, Q, 5.15% to 5/01/23, FRN thereafter, Perpetual | | United States | | 100,000,000 | | | 100,125,000 | |
junior sub. bond, R, 6.00% to 8/01/23, FRN thereafter, Perpetual | | United States | | 105,000,000 | | | 109,331,250 | |
junior sub. bond, V, 5.00% to 7/30/19, FRN thereafter, Perpetual | | United States | | 200,000,000 | | | 201,750,000 | |
junior sub. bond, X, 6.10% to 10/01/24, FRN thereafter, Perpetual | | United States | | 80,000,000 | | | 82,900,000 | |
mMorgan Stanley, junior sub. bond, 5.55% to 7/15/20, FRN thereafter, Perpetual | | United States | | 58,000,000 | | | 59,609,500 | |
Prudential Financial Inc., junior sub. bond, 5.70% to 9/15/28, FRN thereafter, 9/15/48 | | United States | | 75,000,000 | | | 74,743,500 | |
mWells Fargo & Co., junior sub. bond, S, 5.90% to 6/15/24, FRN thereafter, Perpetual | | United States | | 98,700,000 | | | 100,303,875 | |
| | | | | | | | |
| | | |
| | | | | | | 3,858,620,503 | |
| | | | | | | | |
Health Care 12.0% | | | | | | | | |
AbbVie Inc., | | | | | | | | |
senior bond, 3.20%, 5/14/26 | | United States | | 10,000,000 | | | 9,323,635 | |
senior note, 2.90%, 11/06/22 | | United States | | 25,000,000 | | | 24,305,683 | |
Allergan Funding SCS, senior bond, 3.80%, 3/15/25 | | United States | | 100,000,000 | | | 98,024,236 | |
| | | | |
| | | |
72 | | Annual Report | | franklintempleton.com |
FRANKLIN CUSTODIAN FUNDS
STATEMENT OF INVESTMENTS
Franklin Income Fund(continued)
| | | | | | | | |
| | | Country | | Principal Amount* | | Value | |
| | | |
Corporate Bonds(continued) | | | | | | | | |
Health Care(continued) | | | | | | | | |
AstraZeneca PLC, | | | | | | | | |
senior note, 2.375%, 11/16/20 | | United Kingdom | | 10,000,000 | | $ | 9,851,250 | |
senior note, 2.375%, 6/12/22 | | United Kingdom | | 31,500,000 | | | 30,315,758 | |
hAvantor Inc., senior note, 144A, 9.00%, 10/01/25 | | United States | | 30,000,000 | | | 31,012,500 | |
hBausch Health Cos. Inc., | | | | | | | | |
senior bond, 144A, 6.125%, 4/15/25 | | United States | | 122,400,000 | | | 116,714,520 | |
senior note, 144A, 7.50%, 7/15/21 | | United States | | 205,000,000 | | | 209,356,250 | |
senior note, 144A, 5.50%, 3/01/23 | | United States | | 50,526,000 | | | 48,795,485 | |
senior note, 144A, 5.875%, 5/15/23 | | United States | | 315,000,000 | | | 306,967,500 | |
senior note, 144A, 9.00%, 12/15/25 | | United States | | 85,000,000 | | | 91,803,400 | |
senior note, 144A, 9.25%, 4/01/26 | | United States | | 200,000,000 | | | 216,250,000 | |
senior note, 144A, 8.50%, 1/31/27 | | United States | | 50,000,000 | | | 52,625,000 | |
senior note, first lien, 144A, 7.00%, 3/15/24 | | United States | | 77,300,000 | | | 81,860,700 | |
senior secured note, first lien, 144A, 6.50%, 3/15/22 | | United States | | 50,500,000 | | | 52,646,250 | |
senior secured note, first lien, 144A, 5.50%, 11/01/25 | | United States | | 30,000,000 | | | 30,060,000 | |
hBayer US Finance II LLC, senior note, 144A, 4.25%, 12/15/25 | | Germany | | 75,000,000 | | | 74,614,125 | |
CHS/Community Health Systems Inc., | | | | | | | | |
senior note, 6.875%, 2/01/22 | | United States | | 1,260,024,000 | | | 714,094,410 | |
hsenior note, 144A, 11.00%, 6/30/23 | | United States | | 1,475,000,000 | | | 1,334,255,500 | |
hsenior note, 144A, 8.125%, 6/30/24 | | United States | | 731,006,000 | | | 614,045,040 | |
hsenior secured note, 144A, 8.625%, 1/15/24 | | United States | | 50,000,000 | | | 51,937,500 | |
senior secured note, first lien, 6.25%, 3/31/23 | | United States | | 355,000,000 | | | 338,581,250 | |
CVS Health Corp., | | | | | | | | |
senior bond, 4.30%, 3/25/28 | | United States | | 125,000,000 | | | 124,005,071 | |
senior bond, 5.05%, 3/25/48 | | United States | | 50,200,000 | | | 51,483,165 | |
senior note, 4.10%, 3/25/25 | | United States | | 75,000,000 | | | 74,872,486 | |
DaVita Inc., | | | | | | | | |
senior bond, 5.125%, 7/15/24 | | United States | | 132,000,000 | | | 128,040,000 | |
senior bond, 5.00%, 5/01/25 | | United States | | 129,500,000 | | | 124,927,355 | |
hEndo DAC/Endo Finance LLC/Endo Finco Inc., | | | | | | | | |
senior bond, 144A, 6.00%, 2/01/25 | | United States | | 108,700,000 | | | 94,242,900 | |
senior note, 144A, 6.00%, 7/15/23 | | United States | | 185,525,000 | | | 165,581,062 | |
hEndo Finance LLC, senior note, 144A, 5.75%, 1/15/22 | | United States | | 126,000,000 | | | 118,282,500 | |
hEndo Finance LLC/Endo Finco Inc., senior note, 144A, 5.375%, 1/15/23 | | United States | | 35,000,000 | | | 30,975,000 | |
hHalfmoon Parent Inc., | | | | | | | | |
senior secured note, 144A, 3.75%, 7/15/23 | | United States | | 60,000,000 | | | 59,836,628 | |
senior secured note, 144A, 4.125%, 11/15/25 | | United States | | 60,000,000 | | | 59,899,594 | |
HCA Inc., | | | | | | | | |
senior bond, 5.875%, 5/01/23 | | United States | | 120,000,000 | | | 126,750,000 | |
senior note, 7.50%, 2/15/22 | | United States | | 100,000,000 | | | 109,750,000 | |
senior secured note, first lien, 5.00%, 3/15/24 | | United States | | 134,800,000 | | | 138,507,000 | |
Horizon Pharma Inc., senior note, 6.625%, 5/01/23 | | United States | | 95,012,000 | | | 97,387,300 | |
cMallinckrodt International Finance SA, senior bond, 4.75%, 4/15/23 | | United States | | 66,000,000 | | | 56,618,544 | |
hMallinckrodt International Finance SA/Mallinckrodt CB LLC, | | | | | | | | |
senior note, 144A, 4.875%, 4/15/20 | | United States | | 277,252,000 | | | 275,865,740 | |
senior note, 144A, 5.75%, 8/01/22 | | United States | | 340,000,000 | | | 315,350,000 | |
senior note, 144A, 5.625%, 10/15/23 | | United States | | 285,350,000 | | | 253,961,500 | |
senior note, 144A, 5.50%, 4/15/25 | | United States | | 137,500,000 | | | 116,806,250 | |
Mylan NV, senior note, 3.95%, 6/15/26 | | United States | | 100,000,000 | | | 94,812,000 | |
| | | | |
| | | |
| franklintempleton.com | | Annual Report | | 73 |
FRANKLIN CUSTODIAN FUNDS
STATEMENT OF INVESTMENTS
Franklin Income Fund(continued)
| | | | | | | | |
| | | Country | | Principal Amount* | | Value | |
| | | |
Corporate Bonds(continued) | | | | | | | | |
Health Care(continued) | | | | | | | | |
Tenet Healthcare Corp., | | | | | | | | |
secured note, second lien, 5.125%, 5/01/25 | | United States | | 128,300,000 | | $ | 126,696,250 | |
senior note, 8.125%, 4/01/22 | | United States | | 872,900,000 | | | 923,135,395 | |
senior note, 6.75%, 6/15/23 | | United States | | 550,000,000 | | | 550,000,000 | |
senior note, 7.00%, 8/01/25 | | United States | | 140,000,000 | | | 138,837,300 | |
senior note, 6.875%, 11/15/31 | | United States | | 37,400,000 | | | 33,667,480 | |
senior secured note, first lien, 4.375%, 10/01/21 | | United States | | 130,000,000 | | | 130,087,100 | |
senior secured note, first lien, 4.625%, 7/15/24 | | United States | | 25,200,000 | | | 24,557,400 | |
hsenior secured note, second lien, 144A, 7.50%, 1/01/22 | | United States | | 66,700,000 | | | 69,868,250 | |
| | | | | | | | |
| | | |
| | | | | | | 9,152,243,262 | |
| | | | | | | | |
Industrials 0.5% | | | | | | | | |
hCloud Crane LLC, secured note, second lien, 144A, 10.125%, 8/01/24 | | United States | | 20,000,000 | | | 21,950,000 | |
United Rentals North America Inc., | | | | | | | | |
senior bond, 5.75%, 11/15/24 | | United States | | 47,400,000 | | | 48,857,550 | |
senior bond, 4.875%, 1/15/28 | | United States | | 48,000,000 | | | 45,120,000 | |
United Technologies Corp., | | | | | | | | |
senior bond, 4.50%, 6/01/42 | | United States | | 50,000,000 | | | 49,602,856 | |
senior note, 3.10%, 6/01/22 | | United States | | 15,900,000 | | | 15,667,006 | |
senior note, 3.95%, 8/16/25 | | United States | | 25,000,000 | | | 24,878,399 | |
senior note, 3.125%, 5/04/27 | | United States | | 40,000,000 | | | 37,416,060 | |
hWest Corp., senior note, 144A, 8.50%, 10/15/25 | | United States | | 40,000,000 | | | 36,900,000 | |
hXPO Logistics Inc., senior note, 144A, 6.50%, 6/15/22 | | United States | | 128,598,000 | | | 133,259,677 | |
| | | | | | | | |
| | | |
| | | | | | | 413,651,548 | |
| | | | | | | | |
Information Technology 0.5% | | | | | | | | |
hCommScope Inc., senior bond, 144A, 5.50%, 6/15/24 | | United States | | 100,000,000 | | | 101,125,000 | |
hCommScope Technologies LLC, senior bond, 144A, 6.00%, 6/15/25 | | United States | | 74,200,000 | | | 76,945,400 | |
hDell International LLC/EMC Corp., senior secured note, first lien, 144A, 5.45%, 6/15/23 | | United States | | 69,750,000 | | | 73,337,167 | |
hMicrochip Technology Inc., senior secured note, first lien, 144A, 4.333%, 6/01/23 | | United States | | 25,000,000 | | | 24,865,294 | |
NCR Corp., | | | | | | | | |
senior note, 5.00%, 7/15/22 | | United States | | 40,000,000 | | | 39,850,000 | |
senior note, 6.375%, 12/15/23 | | United States | | 35,000,000 | | | 35,743,750 | |
| | | | | | | | |
| | | |
| | | | | | | 351,866,611 | |
| | | | | | | | |
Materials 1.2% | | | | | | | | |
Ball Corp., senior bond, 4.00%, 11/15/23 | | United States | | 90,000,000 | | | 88,312,500 | |
hBWAY Holding Co., | | | | | | | | |
secured note, 144A, 5.50%, 4/15/24 | | United States | | 75,000,000 | | | 73,919,250 | |
senior note, 144A, 7.25%, 4/15/25 | | United States | | 170,000,000 | | | 166,158,000 | |
hCemex Finance LLC, senior secured note, first lien, 144A, 6.00%, 4/01/24 | | Mexico | | 88,400,000 | | | 91,355,654 | |
hCemex SAB de CV, | | | | | | | | |
senior secured bond, 144A, 7.75%, 4/16/26 | | Mexico | | 55,100,000 | | | 60,410,262 | |
senior secured bond, first lien, 144A, 5.70%, 1/11/25 | | Mexico | | 70,000,000 | | | 71,166,550 | |
Crown Americas LLC/Crown Americas Capital Corp. IV, senior bond, 4.50%, 1/15/23 | | United States | | 85,000,000 | | | 85,552,500 | |
hFMG Resources (August 2006) Pty. Ltd., | | | | | | | | |
senior note, 144A, 4.75%, 5/15/22 | | Australia | | 20,000,000 | | | 19,773,400 | |
senior note, 144A, 5.125%, 3/15/23 | | Australia | | 4,000,000 | | | 3,925,000 | |
senior note, 144A, 5.125%, 5/15/24 | | Australia | | 44,400,000 | | | 43,164,126 | |
| | | | |
| | | |
74 | | Annual Report | | franklintempleton.com |
FRANKLIN CUSTODIAN FUNDS
STATEMENT OF INVESTMENTS
Franklin Income Fund(continued)
| | | | | | | | | | |
| | | Country | | Principal Amount* | | | Value | |
| | | |
Corporate Bonds(continued) | | | | | | | | | | |
Materials(continued) | | | | | | | | | | |
International Paper Co., | | | | | | | | | | |
senior bond, 3.00%, 2/15/27 | | United States | | | 50,000,000 | | | $ | 45,967,645 | |
senior bond, 4.40%, 8/15/47 | | United States | | | 50,000,000 | | | | 46,199,842 | |
LYB International Finance II BV, senior note, 3.50%, 3/02/27 | | United States | | | 50,000,000 | | | | 46,849,295 | |
hSyngenta Finance NV, | | | | | | | | | | |
senior note, 144A, 4.441%, 4/24/23 | | Switzerland | | | 35,000,000 | | | | 34,794,200 | |
senior note, 144A, 5.182%, 4/24/28 | | Switzerland | | | 50,000,000 | | | | 47,940,250 | |
| | | | | | | | | | |
| | | |
| | | | | | | | | 925,488,474 | |
| | | | | | | | | | |
Real Estate 0.6% | | | | | | | | | | |
American Tower Corp., senior bond, 3.375%, 10/15/26 | | United States | | | 50,000,000 | | | | 46,621,515 | |
Equinix Inc., senior bond, 5.375%, 5/15/27 | | United States | | | 140,000,000 | | | | 140,582,400 | |
Iron Mountain Inc., | | | | | | | | | | |
hsenior note, 144A, 4.875%, 9/15/27 | | United States | | | 135,610,000 | | | | 124,930,712 | |
senior sub. bond, 5.75%, 8/15/24 | | United States | | | 129,254,000 | | | | 128,219,968 | |
| | | | | | | | | | |
| | | |
| | | | | | | | | 440,354,595 | |
| | | | | | | | | | |
Utilities 1.6% | | | | | | | | | | |
The AES Corp., senior bond, 4.875%, 5/15/23 | | United States | | | 60,000,000 | | | | 60,825,000 | |
Calpine Corp., | | | | | | | | | | |
senior bond, 5.75%, 1/15/25 | | United States | | | 170,000,000 | | | | 151,087,500 | |
senior note, 5.375%, 1/15/23 | | United States | | | 300,000,000 | | | | 283,125,000 | |
senior note, 5.50%, 2/01/24 | | United States | | | 186,500,000 | | | | 167,150,625 | |
Ferrellgas Partners LP/Ferrellgas Partners Finance Corp., senior note, 8.625%, 6/15/20 | | United States | | | 49,900,000 | | | | 47,654,500 | |
hInterGen NV, secured bond, 144A, 7.00%, 6/30/23 | | Netherlands | | | 26,900,000 | | | | 26,765,500 | |
Sempra Energy, senior bond, 3.40%, 2/01/28 | | United States | | | 50,000,000 | | | | 46,865,999 | |
Vistra Energy Corp., | | | | | | | | | | |
senior note, 7.375%, 11/01/22 | | United States | | | 286,500,000 | | | | 298,369,695 | |
senior note, 5.875%, 6/01/23 | | United States | | | 130,000,000 | | | | 133,997,500 | |
| | | | | | | | | | |
| | | |
| | | | | | | | | 1,215,841,319 | |
| | | | | | | | | | |
| | | |
Total Corporate Bonds (Cost $28,334,394,799) | | | | | | | | | 28,464,562,037 | |
| | | | | | | | | | |
| | | |
k,nSenior Floating Rate Interests 3.8% | | | | | | | | | | |
Communication Services 1.5% | | | | | | | | | | |
Digicel International Finance Ltd., Initial Term B Loans, 5.57%,(3-month USD LIBOR + 3.25%), 5/25/24 | | United States | | | 69,324,937 | | | | 66,234,223 | |
Digicert Holdings Inc., | | | | | | | | | | |
First Lien Term Loan, 6.242%,(1-month USD LIBOR + 4.00%), 10/01/24 | | United States | | | 44,887,500 | | | | 45,128,770 | |
Second Lien Initial Loan, 10.242%,(1-month USD LIBOR + 8.00%), 9/18/25 | | United States | | | 20,396,762 | | | | 20,371,266 | |
Global Eagle Entertainment Inc., Initial Term Loans, 10.02%,(6-month USD LIBOR + 7.50%), 1/06/23 | | United States | | | 103,901,875 | | | | 107,278,686 | |
oiHeartCommunications Inc., | | | | | | | | | | |
Tranche D Term Loan, 8.443%,(3-month USD LIBOR + 6.75%), 1/30/19 | | United States | | | 731,589,932 | | | | 551,494,438 | |
Tranche E Term Loan, 9.193%,(3-month USD LIBOR + 7.50%), 7/30/19 | | United States | | | 241,744,256 | | | | 181,761,463 | |
| | | | |
| | | |
| franklintempleton.com | | Annual Report | | 75 |
FRANKLIN CUSTODIAN FUNDS
STATEMENT OF INVESTMENTS
Franklin Income Fund(continued)
| | | | | | | | |
| | | Country | | Principal Amount* | | Value | |
| | | |
k,nSenior Floating Rate Interests(continued) | | | | | | | | |
Communication Services(continued) | | | | | | | | |
MH Sub I LLC & Micro Holding Corp., | | | | | | | | |
Amendment No. 2 Initial Term Loan, 5.915%,(1-month USD LIBOR + 3.75%), 9/15/24 | | United States | | 39,600,000 | | $ | 39,918,582 | |
Second Lien Initial Term Loan, 9.665%,(1-month USD LIBOR + 7.50%), 9/15/25 | | United States | | 30,000,000 | | | 30,393,750 | |
Securus Technologies Holdings Inc., | | | | | | | | |
Initial Term Loan B, 6.742%,(1-month USD LIBOR + 4.50%), 11/01/24 | | United States | | 44,662,500 | | | 44,876,523 | |
Second Lien Initial Loan, 10.492%,(1-month USD LIBOR + 8.25%), 11/01/25 | | United States | | 30,000,000 | | | 30,150,000 | |
Univision Communications Inc., Term Loan, 4.992%,(1-month USD LIBOR + 2.75%), 3/15/24 | | United States | | 29,756,023 | | | 29,007,481 | |
| | | | | | | | |
| | | |
| | | | | | | 1,146,615,182 | |
| | | | | | | | |
Consumer Discretionary 1.0% | | | | | | | | |
24 Hour Fitness Worldwide Inc., Term Loan, 5.742%,(1-month USD LIBOR + 3.50%), 5/30/25 | | United States | | 99,750,000 | | | 100,581,217 | |
Academy Ltd., Initial Term Loan, 6.104%,(1-month USD LIBOR + 4.00%), 7/02/22 | | United States | | 110,854,786 | | | 86,512,960 | |
Belk Inc., Closing Date Term Loan, 6.883%,(1-month USD LIBOR + 4.75%), 12/12/22 | | United States | | 233,257,868 | | | 204,757,256 | |
LTI Holdings Inc., Initial Term Loans, 5.742%,(1-month USD LIBOR + 3.50%), 9/06/25 | | United States | | 30,000,000 | | | 30,168,750 | |
PetSmart Inc., TrancheB-2 Loans, 5.12%,(1-month USD LIBOR + 3.00%), 3/11/22 | | United States | | 231,594,530 | | | 202,723,955 | |
Stars Group Holdings BV, Stars Group (US), USD Term Loan, 5.886%,(3-month USD LIBOR + 3.50%), 7/10/25 | | United States | | 64,837,500 | | | 65,522,508 | |
a,pTenneco Inc., Tranche B Term Loan, TBD, 10/01/25 | | United States | | 50,000,000 | | | 50,023,150 | |
| | | | | | | | |
| | | |
| | | | | | | 740,289,796 | |
| | | | | | | | |
Consumer Staples 0.1% | | | | | | | | |
Almonde Inc., | | | | | | | | |
Tahoe Canada Bidco Inc. and Misys Europe SA, Dollar Term Loan, 5.886%,(3-month USD LIBOR + 3.50%), 6/13/24 | | United States | | 56,462,782 | | | 56,564,245 | |
Tahoe Canada Bidco Inc. and Misys Europe SA, Second Lien, Dollar Term Loan, 9.636%,(3-month USD LIBOR + 7.25%), 6/13/25 | | United States | | 15,000,000 | | | 14,868,750 | |
| | | | | | | | |
| | | |
| | | | | | | 71,432,995 | |
| | | | | | | | |
Energy 0.4% | | | | | | | | |
pNorthRiver Midstream Finance LP, Senior Secured Term Loan, TBD, 9/28/25 | | United States | | 40,000,000 | | | 39,900,000 | |
W&T Offshore Inc., | | | | | | | | |
Second Lien Term Loan, 9.00%, 5/15/20 | | United States | | 161,850,000 | | | 164,682,375 | |
Senior Secured 1.5 Lien Term Loan, 11.00%, 11/15/19 | | United States | | 75,000,000 | | | 79,125,000 | |
| | | | | | | | |
| | | |
| | | | | | | 283,707,375 | |
| | | | | | | | |
Financials 0.1% | | | | | | | | |
Russell Investments US Institutional Holdco Inc., Initial Term Loan, 5.492%,(1-month USD LIBOR + 3.25%), 6/01/23 | | United States | | 85,499,222 | | | 86,087,029 | |
| | | | | | | | |
| | | | |
| | | |
76 | | Annual Report | | franklintempleton.com |
FRANKLIN CUSTODIAN FUNDS
STATEMENT OF INVESTMENTS
Franklin Income Fund(continued)
| | | | | | | | |
| | | Country | | Principal Amount* | | Value | |
| | | |
k,nSenior Floating Rate Interests(continued) | | | | | | | | |
Health Care 0.3% | | | | | | | | |
Amneal Pharmaceuticals LLC, Initial Term Loans, 5.75%,(1-month USD LIBOR + 3.50%), 5/04/25 | | United States | | 59,836,133 | | $ | 60,471,892 | |
Endo Luxembourg Finance Co. I S.A.R.L. and Endo LLC, Initial Term Loans, 6.50%,(1-month USD LIBOR + 4.25%), 4/29/24 | | United States | | 79,000,000 | | | 79,691,250 | |
Horizon Pharma Inc., Third Amendment Refinancing Term Loan, 5.50%,(1-month USD LIBOR + 3.25%), 3/29/24 | | United States | | 31,652,262 | | | 31,949,003 | |
Lannett Co. Inc., Initial Tranche B Term Loans, 7.617%,(1-month USD LIBOR + 5.375%), 11/25/22 | | United States | | 34,825,837 | | | 30,646,736 | |
Mallinckrodt International Finance SA and Mallinckrodt CB LLC, 2018 Incremental Term Loans, 5.517%,(6-month USD LIBOR + 3.00%), 2/24/25 | | Luxembourg | | 49,750,000 | | | 49,854,923 | |
| | | | | | | | |
| | | |
| | | | | | | 252,613,804 | |
| | | | | | | | |
Industrials 0.3% | | | | | | | | |
Commercial Barge Line Co., Initial Term Loan, 10.992%,(1-month USD LIBOR + 8.75%), 11/12/20 | | United States | | 54,033,646 | | | 42,011,160 | |
Vertiv Group Corp., Term B Loans, 6.313%,(3-month USD LIBOR + 4.00%), 11/30/23 | | United States | | 104,327,586 | | | 104,947,083 | |
West Corp., Term B Loans, 6.242%,(1-month USD LIBOR + 4.00%), 10/10/24 | | United States | | 61,268,853 | | | 61,162,490 | |
| | | | | | | | |
| | | |
| | | | | | | 208,120,733 | |
| | | | | | | | |
Information Technology 0.0%† | | | | | | | | |
Microchip Technology Inc., Initial Term Loan, 4.25%,(1-month USD LIBOR + 2.00%), 5/29/25 | | United States | | 47,827,500 | | | 47,916,985 | |
| | | | | | | | |
Utilities 0.1% | | | | | | | | |
Talen Energy Supply LLC, | | | | | | | | |
Initial Term Loan, 6.242%,(1-month USD LIBOR + 4.00%), 4/13/24 | | United States | | 43,913,327 | | | 44,204,252 | |
TermB-1 Loans, 6.242%,(1-month USD LIBOR + 4.00%), 7/15/23 | | United States | | 63,889,562 | | | 64,400,679 | |
| | | | | | | | |
| | | |
| | | | | | | 108,604,931 | |
| | | | | | | | |
| | | |
Total Senior Floating Rate Interests
(Cost $3,139,060,470) | | | | | | | 2,945,388,830 | |
| | | | | | | | |
| | | |
U.S. Government and Agency Securities 6.7% | | | | | | | | |
U.S. Treasury Note, | | | | | | | | |
1.00%, 6/30/19 | | United States | | 500,000,000 | | | 494,472,655 | |
1.875%, 12/31/19 | | United States | | 500,000,000 | | | 494,941,405 | |
2.25%, 3/31/20 | | United States | | 750,000,000 | | | 744,477,540 | |
2.50%, 5/31/20 | | United States | | 500,000,000 | | | 497,675,780 | |
2.50%, 6/30/20 | | United States | | 500,000,000 | | | 497,509,765 | |
2.375%, 3/15/21 | | United States | | 500,000,000 | | | 494,414,060 | |
2.625%, 6/15/21 | | United States | | 500,000,000 | | | 496,816,405 | |
2.75%, 8/15/21 | | United States | | 200,000,000 | | | 199,285,156 | |
2.75%, 4/30/23 | | United States | | 500,000,000 | | | 495,986,330 | |
2.75%, 5/31/23 | | United States | | 500,000,000 | | | 495,996,095 | |
2.875%, 5/31/25 | | United States | | 250,000,000 | | | 248,012,695 | |
| | | | | | | | |
| | | |
Total U.S. Government and Agency Securities
(Cost $5,180,095,059) | | | | | | | 5,159,587,886 | |
| | | | | | | | |
| | | | |
| | | |
| franklintempleton.com | | Annual Report | | 77 |
FRANKLIN CUSTODIAN FUNDS
STATEMENT OF INVESTMENTS
Franklin Income Fund(continued)
| | | | | | | | |
| | | Country | | Shares | | Value | |
| | | |
Escrows and Litigation Trusts 0.0% | | | | | | | | |
d,fMotors Liquidation Co., Escrow Account | | United States | | 400,000,000 | | $ | — | |
d,fMotors Liquidation Co., Escrow Account, cvt. pfd., C | | United States | | 11,000,000 | | | — | |
| | | | | | | | |
| | | |
Total Escrows and Litigation Trusts
(Cost $2,416,248) | | | | | | | — | |
| | | | | | | | |
| | | |
| | | Number of Contracts | | Notional Amount* | | | |
Options Purchased (Cost $121,510,189) 0.1% | | | | | | | | |
Puts - Exchange-Traded | | | | | | | | |
S&P 500 Index, December Strike Price $2,700, Expires 12/18/20 | | 5,000 | | 500,000 | | | 81,950,000 | |
| | | | | | | | |
Total Investments before Short Term Investments
(Cost $72,619,296,899) | | | | | | | 74,997,314,354 | |
| | | | | | | | |
| | | |
| | | Country | | Principal
Amount* | | | |
| | | |
Short Term Investments 1.8% | | | | | | | | |
| | | |
U.S. Government and Agency Securities (Cost $994,257,994) 1.3% | | | | | | | | |
qU.S. Treasury Bill, 10/04/18 - 3/21/19 | | United States | | 1,000,000,000 | | | 994,256,995 | |
| | | | | | | | |
| | | |
Total Investments before Money Market Funds and Repurchase Agreement
(Cost $73,613,554,893) | | | | | | | 75,991,571,349 | |
| | | | | | | | |
| | | |
| | | | | Shares | | | |
Money Market Funds (Cost $351,285,912) 0.5% | | | | | | | | |
r,sInstitutional Fiduciary Trust Money Market Portfolio, 1.69% | | United States | | 351,285,912 | | | 351,285,912 | |
| | | | | | | | |
tInvestments from Cash Collateral Received for Loaned Securities 0.0%† | | | | | | | | |
Money Market Funds (Cost $12,623,000) 0.0%† | | | | | | | | |
r,sInstitutional Fiduciary Trust Money Market Portfolio, 1.69% | | United States | | 12,623,000 | | | 12,623,000 | |
| | | | | | | | |
| | | |
| | | | | Principal
Amount* | | | |
| | | | |
| | | |
78 | | Annual Report | | franklintempleton.com |
FRANKLIN CUSTODIAN FUNDS
STATEMENT OF INVESTMENTS
Franklin Income Fund(continued)
| | | | | | | | | | | | |
| | | Country | | | Principal
Amount* | | | Value | |
| | | |
Investments from Cash Collateral Received for Loaned Securities(continued) | | | | | | | | | | | | |
Repurchase Agreement (Cost $3,155,971) 0.0%† | | | | | | | | | | | | |
uJoint Repurchase Agreement, 2.24%, 10/01/18 (Maturity Value $3,156,560) | | | | | | | | | | | | |
BNP Paribas Securities Corp. | | | | | | | | | | | | |
Collateralized byqU.S. Treasury Bill, 10/11/18 - 1/17/19; U.S. Treasury Bond, 8.00%, 11/15/21; U.S. Treasury Note, 0.875% - 2.25%, 11/30/18 - 2/28/23; and U.S. Treasury Strip, 2/15/19 - 8/15/21 (valued at $3,218,970) | | | United States | | | | 3,155,971 | | | $ | 3,155,971 | |
| | | | | | | | | | | | |
| | | |
Total Investments from Cash Collateral Received for Loaned Securities (Cost $15,778,971) | | | | | | | | | | | 15,778,971 | |
| | | | | | | | | | | | |
Total Investments (Cost $73,980,619,776) 99.7% | | | | | | | | | | | 76,358,636,232 | |
Options Written (0.0)%† | | | | | | | | | | | (24,673,000 | ) |
Other Assets, less Liabilities 0.3% | | | | | | | | | | | 285,301,255 | |
| | | | | | | | | | | | |
| | | |
Net Assets 100.0% | | | | | | | | | | $ | 76,619,264,487 | |
| | | | | | | | | | | | |
| | | |
| | | Number of
Contracts | | | Notional
Amount* | | | | |
vOptions Written (0.0)%† | | | | | | | | | | | | |
Calls - Exchange-Traded | | | | | | | | | | | | |
3M Co., October Strike Price $230, Expires 10/19/18 | | | 10,000 | | | | 1,000,000 | | | | (40,000 | ) |
Bank of America Corp., December Strike Price $33, Expires 12/21/18 | | | 50,000 | | | | 5,000,000 | | | | (1,000,000 | ) |
BP PLC, October Strike Price $44, Expires 10/19/18 | | | 20,000 | | | | 2,000,000 | | | | (5,000,000 | ) |
The Coca-Cola Co., November Strike Price $48, Expires 11/16/18 | | | 20,000 | | | | 2,000,000 | | | | (460,000 | ) |
Dominion Energy Inc., October Strike Price $75, Expires 10/19/18 | | | 15,000 | | | | 1,500,000 | | | | (30,000 | ) |
Eli Lilly & Co., October Strike Price $105, Expires 10/19/18 | | | 10,000 | | | | 1,000,000 | | | | (3,430,000 | ) |
Eli Lilly & Co., October Strike Price $110, Expires 10/19/18 | | | 10,000 | | | | 1,000,000 | | | | (680,000 | ) |
JPMorgan Chase & Co., October Strike Price $125, Expires 10/19/18 | | | 10,000 | | | | 1,000,000 | | | | (50,000 | ) |
Merck & Co Inc., October Strike Price $72.50, Expires 10/19/18 | | | 15,000 | | | | 1,500,000 | | | | (615,000 | ) |
Merck & Co. Inc., November Strike Price $72.50, Expires 11/16/18 | | | 10,000 | | | | 1,000,000 | | | | (1,240,000 | ) |
MetLife Inc., October Strike Price $47.50, Expires 10/19/18 | | | 10,000 | | | | 1,000,000 | | | | (560,000 | ) |
Occidental Petroleum Corp., November Strike Price $85, Expires 11/16/18 | | | 10,000 | | | | 1,000,000 | | | | (1,450,000 | ) |
Occidental Petroleum Corp., November Strike Price $87.50, Expires 11/16/18 | | | 5,000 | | | | 500,000 | | | | (395,000 | ) |
Philip Morris International Inc., October Strike Price $87.50, Expires 10/19/18 | | | 10,000 | | | | 1,000,000 | | | | (200,000 | ) |
Sempra Energy, October Strike Price $120, Expires 10/19/18 | | | 10,000 | | | | 1,000,000 | | | | (100,000 | ) |
Target Corp., October Strike Price $85, Expires 10/19/18 | | | 10,000 | | | | 1,000,000 | | | | (3,770,000 | ) |
| | | | | | | | | | | | |
| | | |
| | | | | | | | | | | (19,020,000 | ) |
| | | | | | | | | | | | |
Puts - Exchange-Traded | | | | | | | | | | | | |
Amazon.com Inc., October Strike Price $1,850, Expires 10/19/18 | | | 1,100 | | | | 110,000 | | | | (968,000 | ) |
Analog Devices Inc., October Strike Price $87.50, Expires 10/19/18 | | | 10,000 | | | | 1,000,000 | | | | (525,000 | ) |
Exxon Mobil Corp., October Strike Price $75, Expires 10/19/18 | | | 20,000 | | | | 2,000,000 | | | | (60,000 | ) |
Lam Research Corp., October Strike Price $150, Expires 10/19/18 | | | 10,000 | | | | 1,000,000 | | | | (4,100,000 | ) |
| | | | | | | | | | | | |
| | | |
| | | | | | | | | | | (5,653,000 | ) |
| | | | | | | | | | | | |
| | | |
Total Options Written (Premiums received $28,483,429) | | | | | | | | | | $ | (24,673,000 | ) |
| | | | | | | | | | | | |
| | | | |
| | | |
| franklintempleton.com | | Annual Report | �� | 79 |
FRANKLIN CUSTODIAN FUNDS
STATEMENT OF INVESTMENTS
Franklin Income Fund(continued)
See Abbreviations on page 130.
†Rounds to less than 0.1% of net assets.
*The principal/notional amount is stated in U.S. dollars unless otherwise indicated.
aA portion or all of the security purchased on a delayed delivery basis. See Note 1(d).
bA portion or all of the security is held in connection with written option contracts open at year end.
cA portion or all of the security is on loan at September 30, 2018. See Note 1(h).
dNon-income producing.
eSee Note 9 regarding holdings of 5% voting securities.
fFair valued using significant unobservable inputs. See Note 12 regarding fair value measurements.
gSee Note 1(g) regarding equity-linked securities.
hSecurity was purchased pursuant to Rule 144A under the Securities Act of 1933 and may be sold in transactions exempt from registration only to qualified institutional buyers or in a public offering registered under the Securities Act of 1933. These securities have been deemed liquid under guidelines approved by the Trust’s Board of Trustees. At September 30, 2018, the aggregate value of these securities was $19,728,967,395, representing 25.7% of net assets.
iSee Note 1(f) regarding index-linked notes.
jSecurity pays a fixed 2.00% coupon rate and a variable coupon based on the distribution of the Morgan Stanley Custom Enhanced SPX B DT Index 20 Delta. The coupon rate shown represents the combined rate at period end. Cash payment at maturity or upon early redemption is based on the performance of the Morgan Stanley Custom Enhanced SPX B Index 20 Delta.
kThe coupon rate shown represents the rate at period end.
lIncome may be received in additional securities and/or cash.
mPerpetual security with no stated maturity date.
nSee Note 1(j) regarding senior floating rate interests.
oSee Note 7 regarding defaulted securities.
pA portion or all of the security represents an unsettled loan commitment. The coupon rate isto-be determined (TBD) at the time of settlement and will be based upon a reference index/floor plus a spread.
qThe security was issued on a discount basis with no stated coupon rate.
rSee Note 3(f) regarding investments in affiliated management investment companies.
sThe rate shown is the annualizedseven-day effective yield at period end.
tSee Note 1(h) regarding securities on loan.
uSee Note 1(c) regarding joint repurchase agreement.
vSee Note 1(e) regarding written options.
| | | | |
| | | |
80 | | Annual Report | The accompanying notes are an integral part of these financial statements. | | franklintempleton.com |
FRANKLIN CUSTODIAN FUNDS
Financial Highlights
Franklin U.S. Government Securities Fund
| | | | |
| | | Year Ended September 30, 2018a | |
| |
Class A | | | | |
| |
Per share operating performance | | | | |
(for a share outstanding throughout the year) | | | | |
Net asset value, beginning of year | | | $ 5.89 | |
| | | | |
| |
Income from investment operationsb: | | | | |
Net investment incomec | | | 0.01 | |
Net realized and unrealized gains (losses) | | | (0.02 | ) |
| | | | |
| |
Total from investment operations | | | (0.01 | ) |
| | | | |
| |
Less distributions from net investment income | | | (0.02 | ) |
| | | | |
| |
Net asset value, end of year | | | $ 5.86 | |
| | | | |
| |
Total returnd | | | (0.23)% | |
| |
Ratios to average net assetse | | | | |
Expensesf,g | | | 0.86% | |
Net investment income | | | 2.40% | |
| |
Supplemental data | | | | |
Net assets, end of year (000’s) | | | $4,472 | |
Portfolio turnover rate | | | 44.67% | |
Portfolio turnover rate excluding mortgage dollar rollsh | | | 44.67% | |
aFor the period September 10, 2018 (effective date) to September 30, 2018.
bThe amount shown for a share outstanding throughout the period may not correlate with the Statement of Operations for the period due to the timing of sales and repurchases of the Fund’s shares in relation to income earned and/or fluctuating fair value of the investments of the Fund.
cBased on average daily shares outstanding.
dTotal return does not reflect sales commissions or contingent deferred sales charges, if applicable, and is not annualized for periods less than one year.
eRatios are annualized for periods less than one year.
fBenefit of expense reduction rounds to less than 0.01%.
gBenefit of waiver and payments by affiliates rounds to less than 0.01%.
hSee Note 1(i) regarding mortgage dollar rolls.
| | | | |
| | | |
| franklintempleton.com | | The accompanying notes are an integral part of these financial statements. | Annual Report | | 81 |
FRANKLIN CUSTODIAN FUNDS
FINANCIAL HIGHLIGHTS
Franklin U.S. Government Securities Fund(continued)
| | | | | | | | | | | | | | | | | | | | |
| | | Year Ended September 30, | |
| | | 2018 | | | 2017 | | | 2016 | | | 2015 | | | 2014 | |
Class A1 | | | | | | | | | | | | | | | | | | | | |
| | | | | |
Per share operating performance | | | | | | | | | | | | | | | | | | | | |
(for a share outstanding throughout the year) | | | | | | | | | | | | | | | | | | | | |
Net asset value, beginning of year | | | $ 6.13 | | | | $ 6.35 | | | | $ 6.40 | | | | $ 6.48 | | | | $ 6.53 | |
| | | | | |
Income from investment operationsa: | | | | | | | | | | | | | | | | | | | | |
Net investment incomeb | | | 0.15 | | | | 0.13 | | | | 0.14 | | | | 0.15 | | | | 0.17 | |
Net realized and unrealized gains (losses) | | | (0.25 | ) | | | (0.16 | ) | | | 0.01 | | | | (0.02 | ) | | | 0.01 | |
| | | | | |
Total from investment operations | | | (0.10 | ) | | | (0.03 | ) | | | 0.15 | | | | 0.13 | | | | 0.18 | |
| | | | | |
Less distributions from net investment income | | | (0.18 | ) | | | (0.19 | ) | | | (0.20 | ) | | | (0.21 | ) | | | (0.23 | ) |
| | | | | |
Net asset value, end of year | | | $ 5.85 | | | | $ 6.13 | | | | $ 6.35 | | | | $ 6.40 | | | | $ 6.48 | |
| | | | | |
Total returnc | | | (1.60)% | | | | (0.45)% | | | | 2.35% | | | | 2.07% | | | | 2.80% | |
| | | | | |
Ratios to average net assets | | | | | | | | | | | | | | | | | | | | |
Expensesd,e | | | 0.76% | | | | 0.79% | | | | 0.76% | | | | 0.76% | | | | 0.75% | |
Net investment income | | | 2.50% | | | | 2.17% | | | | 2.21% | | | | 2.28% | | | | 2.62% | |
| | | | | |
Supplemental data | | | | | | | | | | | | | | | | | | | | |
Net assets, end of year (000’s) | | | $3,099,373 | | | | $3,581,769 | | | | $4,235,819 | | | | $4,167,639 | | | | $4,323,990 | |
Portfolio turnover rate | | | 44.67% | | | | 86.72% | | | | 92.18% | | | | 69.10% | | | | 69.73% | |
Portfolio turnover rate excluding mortgage dollar rollsf | | | 44.67% | | | | 86.72% | | | | 92.18% | | | | 58.70% | | | | 38.79% | |
aThe amount shown for a share outstanding throughout the period may not correlate with the Statement of Operations for the period due to the timing of sales and repurchases of the Fund’s shares in relation to income earned and/or fluctuating fair value of the investments of the Fund.
bBased on average daily shares outstanding.
cTotal return does not reflect sales commissions or contingent deferred sales charges, if applicable.
dBenefit of expense reduction rounds to less than 0.01%.
eBenefit of waiver and payments by affiliates rounds to less than 0.01%.
fSee Note 1(i) regarding mortgage dollar rolls.
| | | | |
| | | |
82 | | Annual Report | The accompanying notes are an integral part of these financial statements. | | franklintempleton.com |
FRANKLIN CUSTODIAN FUNDS
FINANCIAL HIGHLIGHTS
Franklin U.S. Government Securities Fund(continued)
| | | | | | | | | | | | | | | | | | | | |
| | | Year Ended September 30, | |
| | | 2018 | | | 2017 | | | 2016 | | | 2015 | | | 2014 | |
Class C | | | | | | | | | | | | | | | | | | | | |
| | | | | |
Per share operating performance | | | | | | | | | | | | | | | | | | | | |
(for a share outstanding throughout the year) | | | | | | | | | | | | | | | | | | | | |
Net asset value, beginning of year | | | $ 6.08 | | | | $ 6.30 | | | | $ 6.36 | | | | $ 6.44 | | | | $ 6.49 | |
| | | | | |
Income from investment operationsa: | | | | | | | | | | | | | | | | | | | | |
Net investment incomeb | | | 0.12 | | | | 0.10 | | | | 0.11 | | | | 0.11 | | | | 0.14 | |
Net realized and unrealized gains (losses) | | | (0.24 | )�� | | | (0.16 | ) | | | — | c | | | (0.01 | ) | | | 0.01 | |
| | | | | |
Total from investment operations | | | (0.12 | ) | | | (0.06 | ) | | | 0.11 | | | | 0.10 | | | | 0.15 | |
| | | | | |
Less distributions from net investment income | | | (0.15 | ) | | | (0.16 | ) | | | (0.17 | ) | | | (0.18 | ) | | | (0.20 | ) |
| | | | | |
Net asset value, end of year. | | | $ 5.81 | | | | $ 6.08 | | | | $ 6.30 | | | | $ 6.36 | | | | $ 6.44 | |
| | | | | |
Total returnd | | | (1.94)% | | | | (0.96)% | | | | 1.70% | | | | 1.57% | | | | 2.30% | |
| | | | | |
Ratios to average net assets | | | | | | | | | | | | | | | | | | | | |
Expensese,f | | | 1.26% | | | | 1.29% | | | | 1.26% | | | | 1.26% | | | | 1.25% | |
Net investment income | | | 2.00% | | | | 1.67% | | | | 1.71% | | | | 1.78% | | | | 2.12% | |
| | | | | |
Supplemental data | | | | | | | | | | | | | | | | | | | | |
Net assets, end of year (000’s) | | | $571,525 | | | | $797,394 | | | | $1,034,410 | | | | $1,040,294 | | | | $1,190,720 | |
Portfolio turnover rate | | | 44.67% | | | | 86.72% | | | | 92.18% | | | | 69.10% | | | | 69.73% | |
Portfolio turnover rate excluding mortgage dollar rollsg | | | 44.67% | | | | 86.72% | | | | 92.18% | | | | 58.70% | | | | 38.79% | |
aThe amount shown for a share outstanding throughout the period may not correlate with the Statement of Operations for the period due to the timing of sales and repurchases of the Fund’s shares in relation to income earned and/or fluctuating fair value of the investments of the Fund.
bBased on average daily shares outstanding.
cAmount rounds to less than $0.01 per share.
dTotal return does not reflect sales commissions or contingent deferred sales charges, if applicable.
eBenefit of expense reduction rounds to less than 0.01%.
fBenefit of waiver and payments by affiliates rounds to less than 0.01%.
gSee Note 1(i) regarding mortgage dollar rolls.
| | | | |
| | | |
| franklintempleton.com | | The accompanying notes are an integral part of these financial statements. | Annual Report | | 83 |
FRANKLIN CUSTODIAN FUNDS
FINANCIAL HIGHLIGHTS
Franklin U.S. Government Securities Fund(continued)
| | | | | | | | | | | | | | | | | | | | |
| | | Year Ended September 30, | |
| | | 2018 | | | 2017 | | | 2016 | | | 2015 | | | 2014 | |
Class R | | | | | | | | | | | | | | | | | | | | |
| | | | | |
Per share operating performance | | | | | | | | | | | | | | | | | | | | |
(for a share outstanding throughout the year) | | | | | | | | | | | | | | | | | | | | |
Net asset value, beginning of year | | | $ 6.12 | | | | $ 6.34 | | | | $ 6.40 | | | | $ 6.48 | | | | $ 6.53 | |
| | | | | |
Income from investment operationsa: | | | | | | | | | | | | | | | | | | | | |
Net investment incomeb | | | 0.13 | | | | 0.11 | | | | 0.12 | | | | 0.13 | | | | 0.15 | |
Net realized and unrealized gains (losses) | | | (0.24 | ) | | | (0.16 | ) | | | — | c | | | (0.02 | ) | | | 0.01 | |
| | | | | |
Total from investment operations | | | (0.11 | ) | | | (0.05 | ) | | | 0.12 | | | | 0.11 | | | | 0.16 | |
| | | | | |
Less distributions from net investment income | | | (0.16 | ) | | | (0.17 | ) | | | (0.18 | ) | | | (0.19 | ) | | | (0.21 | ) |
| | | | | |
Net asset value, end of year | | | $ 5.85 | | | | $ 6.12 | | | | $ 6.34 | | | | $ 6.40 | | | | $ 6.48 | |
| | | | | |
Total return | | | (1.78)% | | | | (0.81)% | | | | 1.84% | | | | 1.71% | | | | 2.44% | |
| | | | | |
Ratios to average net assets | | | | | | | | | | | | | | | | | | | | |
Expensesd,e | | | 1.11% | | | | 1.13% | | | | 1.11% | | | | 1.11% | | | | 1.10% | |
Net investment income | | | 2.15% | | | | 1.83% | | | | 1.86% | | | | 1.93% | | | | 2.27% | |
| | | | | |
Supplemental data | | | | | | | | | | | | | | | | | | | | |
Net assets, end of year (000’s) | | | $31,144 | | | | $38,363 | | | | $59,785 | | | | $64,689 | | | | $74,442 | |
Portfolio turnover rate | | | 44.67% | | | | 86.72% | | | | 92.18% | | | | 69.10% | | | | 69.73% | |
Portfolio turnover rate excluding mortgage dollar rollsf | | | 44.67% | | | | 86.72% | | | | 92.18% | | | | 58.70% | | | | 38.79% | |
aThe amount shown for a share outstanding throughout the period may not correlate with the Statement of Operations for the period due to the timing of sales and repurchases of the Fund’s shares in relation to income earned and/or fluctuating fair value of the investments of the Fund.
bBased on average daily shares outstanding.
cAmount rounds to less than $0.01 per share.
dBenefit of expense reduction rounds to less than 0.01%.
eBenefit of waiver and payments by affiliates rounds to less than 0.01%.
fSee Note 1(i) regarding mortgage dollar rolls.
| | | | |
| | | |
84 | | Annual Report | The accompanying notes are an integral part of these financial statements. | | franklintempleton.com |
FRANKLIN CUSTODIAN FUNDS
FINANCIAL HIGHLIGHTS
Franklin U.S. Government Securities Fund(continued)
| | | | | | | | | | | | | | | | | | | | |
| | | Year Ended September 30, | |
| | | 2018 | | | 2017 | | | 2016 | | | 2015 | | | 2014 | |
Class R6 | | | | | | | | | | | | | | | | | | | | |
| | | | | |
Per share operating performance | | | | | | | | | | | | | | | | | | | | |
(for a share outstanding throughout the year) | | | | | | | | | | | | | | | | | | | | |
Net asset value, beginning of year | | | $ 6.15 | | | | $ 6.37 | | | | $ 6.42 | | | | $ 6.50 | | | | $ 6.55 | |
| | | | | |
Income from investment operationsa: | | | | | | | | | | | | | | | | | | | | |
Net investment incomeb | | | 0.17 | | | | 0.15 | | | | 0.16 | | | | 0.17 | | | | 0.19 | |
Net realized and unrealized gains (losses) | | | (0.25 | ) | | | (0.16 | ) | | | 0.01 | | | | (0.02 | ) | | | 0.01 | |
| | | | | |
Total from investment operations | | | (0.08 | ) | | | (0.01 | ) | | | 0.17 | | | | 0.15 | | | | 0.20 | |
| | | | | |
Less distributions from net investment income | | | (0.20 | ) | | | (0.21 | ) | | | (0.22 | ) | | | (0.23 | ) | | | (0.25 | ) |
| | | | | |
Net asset value, end of year | | | $ 5.87 | | | | $ 6.15 | | | | $ 6.37 | | | | $ 6.42 | | | | $ 6.50 | |
| | | | | |
Total return | | | (1.33)% | | | | (0.16)% | | | | 2.63% | | | | 2.35% | | | | 3.08% | |
| | | | | |
Ratios to average net assets | | | | | | | | | | | | | | | | | | | | |
Expenses before waiver and payments by affiliates | | | 0.49% | | | | 0.48% | | | | 0.48% | | | | 0.47% | | | | 0.47% | |
Expenses net of waiver and payments by affiliatesc | | | 0.48% | | | | 0.48% | d | | | 0.48% | d | | | 0.47% | d | | | 0.47% | d |
Net investment income | | | 2.78% | | | | 2.48% | | | | 2.49% | | | | 2.57% | | | | 2.90% | |
| | | | | |
Supplemental data | | | | | | | | | | | | | | | | | | | | |
Net assets, end of year (000’s) | | | $694,813 | | | | $446,174 | | | | $624,619 | | | | $375,644 | | | | $497,246 | |
Portfolio turnover rate | | | 44.67% | | | | 86.72% | | | | 92.18% | | | | 69.10% | | | | 69.73% | |
Portfolio turnover rate excluding mortgage dollar rollse | | | 44.67% | | | | 86.72% | | | | 92.18% | | | | 58.70% | | | | 38.79% | |
aThe amount shown for a share outstanding throughout the period may not correlate with the Statement of Operations for the period due to the timing of sales and repurchases of the Fund’s shares in relation to income earned and/or fluctuating fair value of the investments of the Fund.
bBased on average daily shares outstanding.
cBenefit of expense reduction rounds to less than 0.01%.
dBenefit of waiver and payments by affiliates rounds to less than 0.01%.
eSee Note 1(i) regarding mortgage dollar rolls.
| | | | |
| | | |
| franklintempleton.com | | The accompanying notes are an integral part of these financial statements. | Annual Report | | 85 |
FRANKLIN CUSTODIAN FUNDS
FINANCIAL HIGHLIGHTS
Franklin U.S. Government Securities Fund(continued)
| | | | | | | | | | | | | | | | | | | | |
| | | Year Ended September 30, | |
| | | 2018 | | | 2017 | | | 2016 | | | 2015 | | | 2014 | |
Advisor Class | | | | | | | | | | | | | | | | | | | | |
| | | | | |
Per share operating performance | | | | | | | | | | | | | | | | | | | | |
(for a share outstanding throughout the year) | | | | | | | | | | | | | | | | | | | | |
Net asset value, beginning of year | | | $ 6.15 | | | | $ 6.37 | | | | $ 6.42 | | | | $ 6.50 | | | | $ 6.55 | |
| | | | | |
Income from investment operationsa: | | | | | | | | | | | | | | | | | | | | |
Net investment incomeb | | | 0.16 | | | | 0.15 | | | | 0.15 | | | | 0.16 | | | | 0.18 | |
Net realized and unrealized gains (losses) | | | (0.25 | ) | | | (0.17 | ) | | | 0.01 | | | | (0.02 | ) | | | 0.01 | |
| | | | | |
Total from investment operations | | | (0.09 | ) | | | (0.02 | ) | | | 0.16 | | | | 0.14 | | | | 0.19 | |
| | | | | |
Less distributions from net investment income | | | (0.19 | ) | | | (0.20 | ) | | | (0.21 | ) | | | (0.22 | ) | | | (0.24 | ) |
| | | | | |
Net asset value, end of year | | | $ 5.87 | | | | $ 6.15 | | | | $ 6.37 | | | | $ 6.42 | | | | $ 6.50 | |
| | | | | |
Total return | | | (1.45)% | | | | (0.30)% | | | | 2.49% | | | | 2.21% | | | | 2.94% | |
| | | | | |
Ratios to average net assets | | | | | | | | | | | | | | | | | | | | |
Expensesc,d | | | 0.61% | | | | 0.64% | | | | 0.61% | | | | 0.61% | | | | 0.60% | |
Net investment income | | | 2.65% | | | | 2.32% | | | | 2.36% | | | | 2.43% | | | | 2.77% | |
| | | | | |
Supplemental data | | | | | | | | | | | | | | | | | | | | |
Net assets, end of year (000’s) | | | $720,281 | | | | $854,640 | | | | $718,975 | | | | $622,339 | | | | $652,737 | |
Portfolio turnover rate | | | 44.67% | | | | 86.72% | | | | 92.18% | | | | 69.10% | | | | 69.73% | |
Portfolio turnover rate excluding mortgage dollar rollse | | | 44.67% | | | | 86.72% | | | | 92.18% | | | | 58.70% | | | | 38.79% | |
aThe amount shown for a share outstanding throughout the period may not correlate with the Statement of Operations for the period due to the timing of sales and repurchases of the Fund’s shares in relation to income earned and/or fluctuating fair value of the investments of the Fund.
bBased on average daily shares outstanding.
cBenefit of expense reduction rounds to less than 0.01%.
dBenefit of waiver and payments by affiliates rounds to less than 0.01%.
eSee Note 1(i) regarding mortgage dollar rolls.
| | | | |
| | | |
86 | | Annual Report | The accompanying notes are an integral part of these financial statements. | | franklintempleton.com |
FRANKLIN CUSTODIAN FUNDS
Statement of Investments, September 30, 2018
Franklin U.S. Government Securities Fund
| | | | | | | | |
| | | Principal
Amount | | | Value | |
Mortgage-Backed Securities 96.5% | | | | | | | | |
Government National Mortgage Association (GNMA) Fixed Rate 96.5% | | | | | | | | |
GNMA I SF 30 Year, 3.50%, 4/15/43 - 5/15/43 | | $ | 27,392,517 | | | $ | 27,362,813 | |
GNMA I SF 30 Year, 4.00%, 10/15/40 - 1/15/45 | | | 44,635,641 | | | | 45,687,121 | |
GNMA I SF 30 Year, 4.00%, 8/15/44 | | | 17,237,555 | | | | 17,643,555 | |
GNMA I SF 30 Year, 4.00%, 1/15/45 - 8/15/46 | | | 47,578,145 | | | | 48,694,748 | |
GNMA I SF 30 Year, 4.50%, 2/15/39 - 1/15/40 | | | 47,964,954 | | | | 50,233,289 | |
GNMA I SF 30 Year, 4.50%, 3/15/39 | | | 16,251,877 | | | | 16,963,702 | |
GNMA I SF 30 Year, 4.50%, 1/15/40 - 6/15/40 | | | 48,163,265 | | | | 50,335,347 | |
GNMA I SF 30 Year, 4.50%, 6/15/40 | | | 13,254,132 | | | | 13,919,495 | |
GNMA I SF 30 Year, 4.50%, 6/15/40 - 8/15/40 | | | 45,144,410 | | | | 47,152,020 | |
GNMA I SF 30 Year, 4.50%, 7/15/40 | | | 13,255,121 | | | | 13,832,705 | |
GNMA I SF 30 Year, 4.50%, 8/15/40 - 6/15/41 | | | 28,586,272 | | | | 29,972,495 | |
GNMA I SF 30 Year, 5.00%, 2/15/33 - 11/15/33 | | | 48,235,775 | | | | 51,141,338 | |
GNMA I SF 30 Year, 5.00%, 11/15/33 - 6/15/39 | | | 46,461,863 | | | | 49,257,134 | |
GNMA I SF 30 Year, 5.00%, 6/15/39 - 11/15/39 | | | 47,737,292 | | | | 50,689,043 | |
GNMA I SF 30 Year, 5.00%, 8/15/39 | | | 19,673,882 | | | | 20,906,221 | |
GNMA I SF 30 Year, 5.00%, 10/15/39 | | | 13,856,243 | | | | 14,729,892 | |
GNMA I SF 30 Year, 5.00%, 10/15/39 | | | 18,089,337 | | | | 19,222,518 | |
GNMA I SF 30 Year, 5.00%, 11/15/39 | | | 23,903,508 | | | | 25,401,488 | |
GNMA I SF 30 Year, 5.00%, 11/15/39 - 4/15/40 | | | 47,546,658 | | | | 50,452,638 | |
GNMA I SF 30 Year, 5.00%, 2/15/40 | | | 12,898,635 | | | | 13,709,124 | |
GNMA I SF 30 Year, 5.00%, 3/15/40 | | | 15,746,852 | | | | 16,734,907 | |
GNMA I SF 30 Year, 5.00%, 4/15/40 - 6/15/40 | | | 45,892,400 | | | | 48,675,782 | |
GNMA I SF 30 Year, 5.00%, 9/15/40 | | | 20,407,482 | | | | 21,685,852 | |
GNMA I SF 30 Year, 5.50%, 5/15/28 - 6/15/33 | | | 47,234,989 | | | | 51,193,465 | |
GNMA I SF 30 Year, 5.50%, 6/15/33 - 11/15/36 | | | 44,366,955 | | | | 48,083,540 | |
GNMA I SF 30 Year, 5.50%, 12/15/36 - 7/15/39 | | | 43,489,700 | | | | 47,088,049 | |
GNMA I SF 30 Year, 5.50%, 8/15/39 - 2/15/40 | | | 14,190,765 | | | | 15,382,144 | |
GNMA I SF 30 Year, 6.00%, 10/15/23 - 2/15/34 | | | 46,983,761 | | | | 51,098,573 | |
GNMA I SF 30 Year, 6.00%, 2/15/34 - 8/15/37 | | | 46,644,438 | | | | 50,973,363 | |
GNMA I SF 30 Year, 6.00%, 9/15/37 - 12/15/39 | | | 37,463,875 | | | | 40,641,798 | |
GNMA I SF 30 Year, 6.50%, 5/15/23 - 8/15/37 | | | 41,087,879 | | | | 45,265,539 | |
GNMA I SF 30 Year, 7.00%, 3/15/22 - 9/15/32 | | | 28,454,373 | | | | 30,644,894 | |
GNMA I SF 30 Year, 7.25%, 12/15/25 - 1/15/26 | | | 80,885 | | | | 82,066 | |
GNMA I SF 30 Year, 7.50%, 6/15/21 - 8/15/33 | | | 7,918,345 | | | | 8,418,257 | |
GNMA I SF 30 Year, 7.70%, 1/15/21 - 10/15/21 | | | 24,551 | | | | 24,600 | |
GNMA I SF 30 Year, 8.00%, 2/15/20 - 9/15/30 | | | 2,823,689 | | | | 2,888,971 | |
GNMA I SF 30 Year, 8.50%, 9/15/19 - 5/15/25 | | | 479,182 | | | | 489,767 | |
GNMA I SF 30 Year, 9.00%, 12/15/18 - 7/15/23 | | | 389,324 | | | | 396,050 | |
GNMA I SF 30 Year, 9.50%, 11/15/18 - 8/15/22 | | | 361,631 | | | | 364,090 | |
GNMA I SF 30 Year, 10.00%, 12/15/18 - 3/15/25 | | | 132,936 | | | | 133,797 | |
GNMA I SF 30 Year, 10.50%, 1/15/19 - 10/15/21 | | | 42,558 | | | | 42,709 | |
GNMA I SF 30 Year, 11.00%, 7/15/19 - 5/15/21 | | | 2,986 | | | | 2,995 | |
GNMA II SF 30 Year, 3.00%, 2/20/45 | | | 8,589,705 | | | | 8,391,205 | |
GNMA II SF 30 Year, 3.00%, 7/20/47 | | | 243,106,116 | | | | 235,769,385 | |
GNMA II SF 30 Year, 3.00%, 9/20/47 | | | 56,348,497 | | | | 54,640,804 | |
GNMA II SF 30 Year, 3.00%, 10/20/47 | | | 24,313,674 | | | | 23,575,789 | |
GNMA II SF 30 Year, 3.00%, 11/20/47 | | | 90,465,482 | | | | 87,714,548 | |
GNMA II SF 30 Year, 3.50%, 10/20/40 - 5/20/43 | | | 33,084,235 | | | | 33,048,989 | |
GNMA II SF 30 Year, 3.50%, 7/20/42 | | | 50,252,743 | | | | 50,271,721 | |
GNMA II SF 30 Year, 3.50%, 8/20/42 | | | 17,432,853 | | | | 17,439,437 | |
GNMA II SF 30 Year, 3.50%, 9/20/42 | | | 115,899,961 | | | | 115,943,735 | |
| | | | |
| | | |
| franklintempleton.com | | Annual Report | | 87 |
FRANKLIN CUSTODIAN FUNDS
STATEMENT OF INVESTMENTS
Franklin U.S. Government Securities Fund(continued)
| | | | | | | | |
| | | Principal
Amount | | | Value | |
Mortgage-Backed Securities(continued) | | | | | | | | |
Government National Mortgage Association (GNMA) Fixed Rate(continued) | | | | | | | | |
GNMA II SF 30 Year, 3.50%, 10/20/42 | | $ | 23,888,360 | | | $ | 23,897,382 | |
GNMA II SF 30 Year, 3.50%, 11/20/42 | | | 19,996,383 | | | | 20,003,936 | |
GNMA II SF 30 Year, 3.50%, 4/20/43 | | | 24,447,428 | | | | 24,456,664 | |
GNMA II SF 30 Year, 3.50%, 5/20/43 | | | 33,078,718 | | | | 33,091,214 | |
GNMA II SF 30 Year, 3.50%, 6/20/43 | | | 38,113,659 | | | | 38,128,058 | |
GNMA II SF 30 Year, 3.50%, 8/20/43 | | | 27,166,917 | | | | 27,177,182 | |
GNMA II SF 30 Year, 3.50%, 9/20/47 | | | 718,249,057 | | | | 714,967,176 | |
GNMA II SF 30 Year, 3.50%, 11/20/47 | | | 706,843,484 | | | | 703,612,149 | |
GNMA II SF 30 Year, 3.50%, 2/20/48 | | | 296,220,783 | | | | 294,864,371 | |
GNMA II SF 30 Year, 4.00%, 5/20/40 - 2/20/44 | | | 21,567,225 | | | | 22,085,424 | |
GNMA II SF 30 Year, 4.00%, 11/20/40 | | | 33,080,738 | | | | 33,961,357 | |
GNMA II SF 30 Year, 4.00%, 12/20/40 | | | 19,536,762 | | | | 20,057,492 | |
GNMA II SF 30 Year, 4.00%, 1/20/41 | | | 21,495,339 | | | | 22,068,465 | |
GNMA II SF 30 Year, 4.00%, 7/20/41 | | | 26,369,189 | | | | 27,069,531 | |
GNMA II SF 30 Year, 4.00%, 9/20/41 | | | 31,302,034 | | | | 32,135,416 | |
GNMA II SF 30 Year, 4.00%, 10/20/41 | | | 38,454,925 | | | | 39,477,534 | |
GNMA II SF 30 Year, 4.00%, 11/20/41 | | | 35,455,193 | | | | 36,400,224 | |
GNMA II SF 30 Year, 4.00%, 2/20/44 | | | 22,077,452 | | | | 22,539,150 | |
GNMA II SF 30 Year, 4.00%, 4/20/48 | | | 292,609,043 | | | | 297,945,173 | |
GNMA II SF 30 Year, 4.00%, 6/20/48 | | | 84,237,651 | | | | 85,773,870 | |
GNMA II SF 30 Year, 4.00%, 9/20/48 | | | 56,600,000 | | | | 57,629,397 | |
GNMA II SF 30 Year, 4.50%, 5/20/33 - 7/20/40 | | | 40,835,283 | | | | 42,812,834 | |
GNMA II SF 30 Year, 4.50%, 12/20/39 | | | 22,272,266 | | | | 23,361,229 | |
GNMA II SF 30 Year, 4.50%, 5/20/41 | | | 29,003,333 | | | | 30,418,040 | |
GNMA II SF 30 Year, 4.50%, 6/20/41 - 8/20/42 | | | 15,250,728 | | | | 15,993,325 | |
GNMA II SF 30 Year, 4.50%, 6/20/41 | | | 35,112,221 | | | | 36,822,083 | |
GNMA II SF 30 Year, 4.50%, 7/20/41 | | | 38,268,764 | | | | 40,130,795 | |
GNMA II SF 30 Year, 4.50%, 9/20/41 | | | 51,268,838 | | | | 53,762,832 | |
GNMA II SF 30 Year, 4.50%, 10/20/41 | | | 38,212,037 | | | | 40,069,859 | |
GNMA II SF 30 Year, 4.50%, 2/20/44 | | | 20,778,890 | | | | 21,782,437 | |
GNMA II SF 30 Year, 5.00%, 7/20/33 - 12/20/39 | | | 45,320,765 | | | | 48,439,623 | |
GNMA II SF 30 Year, 5.00%, 9/20/33 | | | 21,572,836 | | | | 23,279,783 | |
GNMA II SF 30 Year, 5.00%, 4/20/40 - 9/20/41 | | | 15,276,828 | | | | 16,291,354 | |
GNMA II SF 30 Year, 5.00%, 6/20/40 | | | 14,960,319 | | | | 16,147,837 | |
GNMA II SF 30 Year, 5.50%, 6/20/34 - 8/20/35 | | | 46,915,057 | | | | 50,571,151 | |
GNMA II SF 30 Year, 5.50%, 12/20/34 | | | 13,921,847 | | | | 15,005,025 | |
GNMA II SF 30 Year, 5.50%, 10/20/35 - 4/20/40 | | | 21,587,544 | | | | 23,188,387 | |
GNMA II SF 30 Year, 6.00%, 10/20/23 - 10/20/37 | | | 46,314,052 | | | | 50,707,911 | |
GNMA II SF 30 Year, 6.00%, 12/20/37 - 7/20/39 | | | 15,443,678 | | | | 16,905,285 | |
GNMA II SF 30 Year, 6.50%, 6/20/24 - 1/20/39 | | | 20,920,724 | | | | 23,380,468 | |
GNMA II SF 30 Year, 7.00%, 2/20/28 - 7/20/33 | | | 5,220,225 | | | | 5,966,448 | |
GNMA II SF 30 Year, 7.50%, 10/20/22 - 4/20/32 | | | 1,074,999 | | | | 1,178,807 | |
GNMA II SF 30 Year, 8.00%, 5/20/24 - 6/20/30 | | | 517,662 | | | | 582,316 | |
GNMA II SF 30 Year, 8.50%, 5/20/19 - 6/20/25 | | | 93,331 | | | | 96,115 | |
GNMA II SF 30 Year, 9.00%, 9/20/21 - 11/20/21 | | | 22,526 | | | | 23,394 | |
GNMA II SF 30 Year, 9.50%, 1/20/20 - 4/20/25 | | | 29,696 | | | | 29,989 | |
GNMA II SF 30 Year, 10.00%, 6/20/19 - 3/20/21 | | | 30,497 | | | | 31,141 | |
GNMA II SF 30 Year, 10.50%, 11/20/18 - 1/20/21 | | | 18,263 | | | | 18,329 | |
GNMA II SF 30 Year, 11.00%, 1/20/21 | | | 2,896 | | | | 2,906 | |
| | | | | | | | |
Total Mortgage-Backed Securities (Cost $5,029,038,819) | | | | | | | 4,938,754,375 | |
| | | | | | | | |
| | | | |
| | | |
88 | | Annual Report | | franklintempleton.com |
FRANKLIN CUSTODIAN FUNDS
STATEMENT OF INVESTMENTS
Franklin U.S. Government Securities Fund(continued)
| | | | | | | | |
| | | Principal
Amount | | | Value | |
U.S. Government and Agency Securities (Cost $89,975,770) 1.6% | | | | | | | | |
U.S. Treasury Bond, 4.75%, 2/15/37 | | $ | 67,500,000 | | | $ | 82,922,168 | |
| | | | | | | | |
Total Investments before Short Term Investments
(Cost $5,119,014,589) | | | | | | | 5,021,676,543 | |
| | | | | | | | |
| | |
| | | Shares | | | | |
| | | | | | | | |
| | |
Short Term Investments (Cost $93,109,667) 1.8% | | | | | | | | |
| | |
Money Market Funds 1.8% | | | | | | | | |
a,bInstitutional Fiduciary Trust Money Market Portfolio, 1.69% | | | 93,109,667 | | | | 93,109,667 | |
| | | | | | | | |
Total Investments (Cost $5,212,124,256) 99.9% | | | | | | | 5,114,786,210 | |
Other Assets, less Liabilities 0.1% | | | | | | | 6,821,815 | |
| | | | | | | | |
Net Assets 100.0% | | | | | | $ | 5,121,608,025 | |
| | | | | | | | |
See Abbreviations on page 130.
aSee Note 3(f) regarding investments in affiliated management investment companies.
bThe rate shown is the annualized seven-day effective yield at period end.
| | | | |
| | | |
| franklintempleton.com | | The accompanying notes are an integral part of these financial statements. | Annual Report | | 89 |
FRANKLIN CUSTODIAN FUNDS
Financial Highlights
Franklin Utilities Fund
| | |
| | | Year Ended
September 30,
2018a |
Class A | | |
| |
Per share operating performance | | |
(for a share outstanding throughout the year) | | |
Net asset value, beginning of year | | $19.16 |
| | |
| |
Income from investment operationsb: | | |
Net investment incomec | | 0.02 |
Net realized and unrealized gains (losses) | | (0.52) |
| | |
| |
Total from investment operations | | (0.50) |
| | |
| |
Net asset value, end of year | | $18.66 |
| | |
| |
Total returnd | | (2.61)% |
| |
Ratios to average net assetse | | |
Expensesf,g | | 0.84% |
Net investment income | | 2.62% |
| |
Supplemental data | | |
Net assets, end of year (000’s) | | $3,536 |
Portfolio turnover rate | | 4.58% |
aFor the period September 10, 2018 (effective date) to September 30, 2018.
bThe amount shown for a share outstanding throughout the period may not correlate with the Statement of Operations for the period due to the timing of sales and repurchases of the Fund’s shares in relation to income earned and/or fluctuating fair value of the investments of the Fund.
cBased on average daily shares outstanding.
dTotal return does not reflect sales commissions or contingent deferred sales charges, if applicable, and is not annualized for periods less than one year.
eRatios are annualized for periods less than one year.
fBenefit of expense reduction rounds to less than 0.01%.
gBenefit of waiver and payments by affiliates rounds to less than 0.01%.
| | | | |
| | | |
90 | | Annual Report | The accompanying notes are an integral part of these financial statements. | | franklintempleton.com |
FRANKLIN CUSTODIAN FUNDS
FINANCIAL HIGHLIGHTS
Franklin Utilities Fund(continued)
| | | | | | | | | | | | | | | | | | | | |
| | | Year Ended September 30, | |
| | | 2018 | | | 2017 | | | 2016 | | | 2015 | | | 2014 | |
| | | | | |
Class A1 | | | | | | | | | | | | | | | | | | | | |
| | | | | |
Per share operating performance | | | | | | | | | | | | | | | | | | | | |
(for a share outstanding throughout the year) | | | | | | | | | | | | | | | | | | | | |
Net asset value, beginning of year | | | $19.18 | | | | $17.85 | | | | $16.08 | | | | $16.58 | | | | $14.62 | |
| | | | | |
Income from investment operationsa: | | | | | | | | | | | | | | | | | | | | |
Net investment incomeb | | | 0.50 | | | | 0.53 | | | | 0.48 | | | | 0.49 | | | | 0.49 | |
Net realized and unrealized gains (losses) | | | (0.17 | ) | | | 1.30 | | | | 2.31 | | | | (0.09 | ) | | | 2.00 | |
| | | | | |
Total from investment operations | | | 0.33 | | | | 1.83 | | | | 2.79 | | | | 0.40 | | | | 2.49 | |
| | | | | |
Less distributions from: | | | | | | | | | | | | | | | | | | | | |
Net investment income | | | (0.54 | ) | | | (0.49 | ) | | | (0.50 | ) | | | (0.48 | ) | | | (0.49 | ) |
Net realized gains | | | (0.31 | ) | | | (0.01 | ) | | | (0.52 | ) | | | (0.42 | ) | | | (0.04 | ) |
| | | | | |
Total distributions | | | (0.85 | ) | | | (0.50 | ) | | | (1.02 | ) | | | (0.90 | ) | | | (0.53 | ) |
| | | | | |
Net asset value, end of year | | | $18.66 | | | | $19.18 | | | | $17.85 | | | | $16.08 | | | | $16.58 | |
| | | | | |
Total returnc | | | 1.68% | | | | 10.38% | | | | 18.23% | | | | 2.19% | | | | 17.24% | |
| | | | | |
Ratios to average net assets | | | | | | | | | | | | | | | | | | | | |
Expensesd | | | 0.74% | e | | | 0.75% | e | | | 0.73% | e | | | 0.73% | | | | 0.75% | e |
Net investment income | | | 2.72% | | | | 2.86% | | | | 2.81% | | | | 2.88% | | | | 3.05% | |
| | | | | |
Supplemental data | | | | | | | | | | | | | | | | | | | | |
Net assets, end of year (000’s) | | | $3,654,795 | | | | $4,182,780 | | | | $4,180,124 | | | | $3,524,835 | | | | $3,717,397 | |
Portfolio turnover rate | | | 4.58% | | | | 0.89% | | | | 7.17% | | | | 9.55% | | | | 8.10% | |
aThe amount shown for a share outstanding throughout the period may not correlate with the Statement of Operations for the period due to the timing of sales and repurchases of the Fund’s shares in relation to income earned and/or fluctuating fair value of the investments of the Fund.
bBased on average daily shares outstanding.
cTotal return does not reflect sales commissions or contingent deferred sales charges, if applicable.
dBenefit of waiver and payments by affiliates rounds to less than 0.01%.
eBenefit of expense reduction rounds to less than 0.01%.
| | | | |
| | | |
| franklintempleton.com | | The accompanying notes are an integral part of these financial statements. | Annual Report | | 91 |
FRANKLIN CUSTODIAN FUNDS
FINANCIAL HIGHLIGHTS
Franklin Utilities Fund(continued)
| | | | | | | | | | | | | | | | | | | | |
| | | Year Ended September 30, | |
| | | 2018 | | | 2017 | | | 2016 | | | 2015 | | | 2014 | |
| | | | | |
Class C | | | | | | | | | | | | | | | | | | | | |
| | | | | |
Per share operating performance | | | | | | | | | | | | | | | | | | | | |
(for a share outstanding throughout the year) | | | | | | | | | | | | | | | | | | | | |
Net asset value, beginning of year | | | $19.09 | | | | $17.76 | | | | $16.01 | | | | $16.50 | | | | $14.56 | |
| | | | | |
Income from investment operationsa: | | | | | | | | | | | | | | | | | | | | |
Net investment incomeb | | | 0.41 | | | | 0.43 | | | | 0.39 | | | | 0.40 | | | | 0.41 | |
Net realized and unrealized gains (losses) | | | (0.18 | ) | | | 1.30 | | | | 2.30 | | | | (0.08 | ) | | | 1.98 | |
| | | | | |
Total from investment operations | | | 0.23 | | | | 1.73 | | | | 2.69 | | | | 0.32 | | | | 2.39 | |
| | | | | |
Less distributions from: | | | | | | | | | | | | | | | | | | | | |
Net investment income | | | (0.44 | ) | | | (0.39 | ) | | | (0.42 | ) | | | (0.39 | ) | | | (0.41 | ) |
Net realized gains | | | (0.31 | ) | | | (0.01 | ) | | | (0.52 | ) | | | (0.42 | ) | | | (0.04 | ) |
| | | | | |
Total distributions | | | (0.75 | ) | | | (0.40 | ) | | | (0.94 | ) | | | (0.81 | ) | | | (0.45 | ) |
| | | | | |
Net asset value, end of year | | | $18.57 | | | | $19.09 | | | | $17.76 | | | | $16.01 | | | | $16.50 | |
| | | | | |
Total returnc | | | 1.18% | | | | 9.88% | | | | 17.59% | | | | 1.74% | | | | 16.61% | |
| | | | | |
Ratios to average net assets | | | | | | | | | | | | | | | | | | | | |
Expensesd | | | 1.24% | e | | | 1.25% | e | | | 1.23% | e | | | 1.23% | | | | 1.25% | e |
Net investment income | | | 2.22% | | | | 2.36% | | | | 2.31% | | | | 2.38% | | | | 2.55% | |
| | | | | |
Supplemental data | | | | | | | | | | | | | | | | | | | | |
Net assets, end of year (000’s) | | | $834,070 | | | | $981,515 | | | | $1,064,065 | | | | $931,800 | | | | $986,318 | |
Portfolio turnover rate | | | 4.58% | | | | 0.89% | | | | 7.17% | | | | 9.55% | | | | 8.10% | |
aThe amount shown for a share outstanding throughout the period may not correlate with the Statement of Operations for the period due to the timing of sales and repurchases of the Fund’s shares in relation to income earned and/or fluctuating fair value of the investments of the Fund.
bBased on average daily shares outstanding.
cTotal return does not reflect sales commissions or contingent deferred sales charges, if applicable.
dBenefit of waiver and payments by affiliates rounds to less than 0.01%.
eBenefit of expense reduction rounds to less than 0.01%.
| | | | |
| | | |
92 | | Annual Report | The accompanying notes are an integral part of these financial statements. | | franklintempleton.com |
FRANKLIN CUSTODIAN FUNDS
FINANCIAL HIGHLIGHTS
Franklin Utilities Fund(continued)
| | | | | | | | | | | | | | | | | | | | |
| | | Year Ended September 30, | |
| | | 2018 | | | 2017 | | | 2016 | | | 2015 | | | 2014 | |
| | | | | |
Class R | | | | | | | | | | | | | | | | | | | | |
| | | | | |
Per share operating performance | | | | | | | | | | | | | | | | | | | | |
(for a share outstanding throughout the year) | | | | | | | | | | | | | | | | | | | | |
Net asset value, beginning of year | | | $19.11 | | | | $17.78 | | | | $16.02 | | | | $16.52 | | | | $14.58 | |
| | | | | |
Income from investment operationsa: | | | | | | | | | | | | | | | | | | | | |
Net investment incomeb | | | 0.44 | | | | 0.46 | | | | 0.42 | | | | 0.42 | | | | 0.43 | |
Net realized and unrealized gains (losses) | | | (0.18 | ) | | | 1.30 | | | | 2.30 | | | | (0.09 | ) | | | 1.99 | |
| | | | | |
Total from investment operations | | | 0.26 | | | | 1.76 | | | | 2.72 | | | | 0.33 | | | | 2.42 | |
| | | | | |
Less distributions from: | | | | | | | | | | | | | | | | | | | | |
Net investment income | | | (0.47 | ) | | | (0.42 | ) | | | (0.44 | ) | | | (0.41 | ) | | | (0.44 | ) |
Net realized gains | | | (0.31 | ) | | | (0.01 | ) | | | (0.52 | ) | | | (0.42 | ) | | | (0.04 | ) |
Total distributions | | | (0.78 | ) | | | (0.43 | ) | | | (0.96 | ) | | | (0.83 | ) | | | (0.48 | ) |
| | | | | |
Net asset value, end of year | | | $18.59 | | | | $19.11 | | | | $17.78 | | | | $16.02 | | | | $16.52 | |
| | | | | |
Total return | | | 1.33% | | | | 10.04% | | | | 17.81% | | | | 1.83% | | | | 16.75% | |
| | | | | |
Ratios to average net assets | | | | | | | | | | | | | | | | | | | | |
Expensesc | | | 1.09% | d | | | 1.10% | d | | | 1.08% | d | | | 1.08% | | | | 1.10% | d |
Net investment income | | | 2.37% | | | | 2.51% | | | | 2.46% | | | | 2.53% | | | | 2.70% | |
| | | | | |
Supplemental data | | | | | | | | | | | | | | | | | | | | |
Net assets, end of year (000’s) | | | $72,927 | | | | $94,465 | | | | $103,247 | | | | $83,271 | | | | $95,498 | |
Portfolio turnover rate | | | 4.58% | | | | 0.89% | | | | 7.17% | | | | 9.55% | | | | 8.10% | |
aThe amount shown for a share outstanding throughout the period may not correlate with the Statement of Operations for the period due to the timing of sales and repurchases of the Fund’s shares in relation to income earned and/or fluctuating fair value of the investments of the Fund.
bBased on average daily shares outstanding.
cBenefit of waiver and payments by affiliates rounds to less than 0.01%.
dBenefit of expense reduction rounds to less than 0.01%.
| | | | |
| | | |
| franklintempleton.com | | The accompanying notes are an integral part of these financial statements. | Annual Report | | 93 |
FRANKLIN CUSTODIAN FUNDS
FINANCIAL HIGHLIGHTS
Franklin Utilities Fund(continued)
| | | | | | | | | | | | | | | | | | | | |
| | | Year Ended September 30, | |
| | | 2018 | | | 2017 | | | 2016 | | | 2015 | | | 2014 | |
| | | | | |
Class R6 | | | | | | | | | | | | | | | | | | | | |
| | | | | |
Per share operating performance | | | | | | | | | | | | | | | | | | | | |
(for a share outstanding throughout the year) | | | | | | | | | | | | | | | | | | | | |
Net asset value, beginning of year | | | $19.32 | | | | $17.97 | | | | $16.18 | | | | $16.68 | | | | $14.71 | |
| | | | | |
Income from investment operationsa: | | | | | | | | | | | | | | | | | | | | |
Net investment incomeb | | | 0.55 | | | | 0.58 | | | | 0.53 | | | | 0.53 | | | | 0.53 | |
Net realized and unrealized gains (losses) | | | (0.17 | ) | | | 1.31 | | | | 2.32 | | | | (0.09 | ) | | | 2.01 | |
| | | | | |
Total from investment operations | | | 0.38 | | | | 1.89 | | | | 2.85 | | | | 0.44 | | | | 2.54 | |
| | | | | |
Less distributions from: | | | | | | | | | | | | | | | | | | | | |
Net investment income | | | (0.58 | ) | | | (0.53 | ) | | | (0.54 | ) | | | (0.52 | ) | | | (0.53 | ) |
Net realized gains | | | (0.31 | ) | | | (0.01 | ) | | | (0.52 | ) | | | (0.42 | ) | | | (0.04 | ) |
| | | | | |
Total distributions | | | (0.89 | ) | | | (0.54 | ) | | | (1.06 | ) | | | (0.94 | ) | | | (0.57 | ) |
| | | | | |
Net asset value, end of year | | | $18.81 | | | | $19.32 | | | | $17.97 | | | | $16.18 | | | | $16.68 | |
| | | | | |
Total return | | | 1.97% | | | | 10.70% | | | | 18.55% | | | | 2.45% | | | | 17.51% | |
| | | | | |
Ratios to average net assets | | | | | | | | | | | | | | | | | | | | |
Expenses before waiver and payments by affiliates | | | 0.52% | | | | 0.48% | | | | 0.47% | | | | 0.47% | | | | 0.48% | |
Expenses net of waiver and payments by affiliates | | | 0.48% | c | | | 0.48% | c,d | | | 0.47% | c,d | | | 0.47% | d | | | 0.48% | c,d |
Net investment income | | | 2.98% | | | | 3.13% | | | | 3.07% | | | | 3.14% | | | | 3.32% | |
| | | | | |
Supplemental data | | | | | | | | | | | | | | | | | | | | |
Net assets, end of year (000’s) | | | $230,393 | | | | $241,455 | | | | $219,587 | | | | $201,225 | | | | $236,437 | |
Portfolio turnover rate | | | 4.58% | | | | 0.89% | | | | 7.17% | | | | 9.55% | | | | 8.10% | |
aThe amount shown for a share outstanding throughout the period may not correlate with the Statement of Operations for the period due to the timing of sales and repurchases of the Fund’s shares in relation to income earned and/or fluctuating fair value of the investments of the Fund.
bBased on average daily shares outstanding.
cBenefit of expense reduction rounds to less than 0.01%.
dBenefit of waiver and payments by affiliates rounds to less than 0.01%.
| | | | |
| | | |
94 | | Annual Report | The accompanying notes are an integral part of these financial statements. | | franklintempleton.com |
FRANKLIN CUSTODIAN FUNDS
FINANCIAL HIGHLIGHTS
Franklin Utilities Fund(continued)
| | | | | | | | | | | | | | | | | | | | |
| | | Year Ended September 30, | |
| | | 2018 | | | 2017 | | | 2016 | | | 2015 | | | 2014 | |
| | | | | |
Advisor Class | | | | | | | | | | | | | | | | | | | | |
| | | | | |
Per share operating performance | | | | | | | | | | | | | | | | | | | | |
(for a share outstanding throughout the year) | | | | | | | | | | | | | | | | | | | | |
Net asset value, beginning of year | | | $19.32 | | | | $17.97 | | | | $16.19 | | | | $16.68 | | | | $14.71 | |
| | | | | |
Income from investment operationsa: | | | | | | | | | | | | | | | | | | | | |
Net investment incomeb | | | 0.54 | | | | 0.57 | | | | 0.51 | | | | 0.52 | | | | 0.52 | |
Net realized and unrealized gains (losses) | | | (0.18 | ) | | | 1.30 | | | | 2.32 | | | | (0.09 | ) | | | 2.00 | |
| | | | | |
Total from investment operations | | | 0.36 | | | | 1.87 | | | | 2.83 | | | | 0.43 | | | | 2.52 | |
| | | | | |
Less distributions from: | | | | | | | | | | | | | | | | | | | | |
Net investment income | | | (0.56 | ) | | | (0.51 | ) | | | (0.53 | ) | | | (0.50 | ) | | | (0.51 | ) |
Net realized gains | | | (0.31 | ) | | | (0.01 | ) | | | (0.52 | ) | | | (0.42 | ) | | | (0.04 | ) |
| | | | | |
Total distributions | | | (0.87 | ) | | | (0.52 | ) | | | (1.05 | ) | | | (0.92 | ) | | | (0.55 | ) |
| | | | | |
Net asset value, end of year | | | $18.81 | | | | $19.32 | | | | $17.97 | | | | $16.19 | | | | $16.68 | |
| | | | | |
Total return | | | 1.82% | | | | 10.64% | | | | 18.34% | | | | 2.40% | | | | 17.37% | |
| | | | | |
Ratios to average net assets | | | | | | | | | | | | | | | | | | | | |
Expensesc | | | 0.59% | d | | | 0.60% | d | | | 0.58% | d | | | 0.58% | | | | 0.60% | d |
Net investment income | | | 2.87% | | | | 3.01% | | | | 2.96% | | | | 3.03% | | | | 3.20% | |
| | | | | |
Supplemental data | | | | | | | | | | | | | | | | | | | | |
Net assets, end of year (000’s) | | | $927,845 | | | | $963,228 | | | | $755,484 | | | | $549,371 | | | | $562,202 | |
Portfolio turnover rate | | | 4.58% | | | | 0.89% | | | | 7.17% | | | | 9.55% | | | | 8.10% | |
aThe amount shown for a share outstanding throughout the period may not correlate with the Statement of Operations for the period due to the timing of sales and repurchases of the Fund’s shares in relation to income earned and/or fluctuating fair value of the investments of the Fund.
bBased on average daily shares outstanding.
cBenefit of waiver and payments by affiliates rounds to less than 0.01%.
dBenefit of expense reduction rounds to less than 0.01%.
| | | | |
| | | |
| franklintempleton.com | | The accompanying notes are an integral part of these financial statements. | Annual Report | | 95 |
FRANKLIN CUSTODIAN FUNDS
Statement of Investments, September 30, 2018
Franklin Utilities Fund
| | | | | | | | | | |
| | | Country | | Shares | | | Value | |
| | | |
Common Stocks 99.6% | | | | | | | | | | |
Electric Utilities 58.1% | | | | | | | | | | |
Alliant Energy Corp. | | United States | | | 3,800,000 | | | $ | 161,766,000 | |
American Electric Power Co. Inc. | | United States | | | 3,900,000 | | | | 276,432,000 | |
Duke Energy Corp. | | United States | | | 3,200,000 | | | | 256,064,000 | |
Edison International | | United States | | | 3,300,000 | | | | 223,344,000 | |
Emera Inc. | | Canada | | | 2,000,000 | | | | 62,140,730 | |
Entergy Corp. | | United States | | | 2,100,000 | | | | 170,373,000 | |
Evergy Inc. | | United States | | | 4,600,000 | | | | 252,632,000 | |
Eversource Energy | | United States | | | 2,300,000 | | | | 141,312,000 | |
Exelon Corp. | | United States | | | 6,700,000 | | | | 292,522,000 | |
FirstEnergy Corp. | | United States | | | 4,700,000 | | | | 174,699,000 | |
NextEra Energy Inc. | | United States | | | 2,850,000 | | | | 477,660,000 | |
OGE Energy Corp. | | United States | | | 1,700,000 | | | | 61,744,000 | |
aPG&E Corp. | | United States | | | 2,000,000 | | | | 92,020,000 | |
Pinnacle West Capital Corp. | | United States | | | 1,500,000 | | | | 118,770,000 | |
PNM Resources Inc. | | United States | | | 2,199,970 | | | | 86,788,816 | |
PPL Corp. | | United States | | | 2,700,000 | | | | 79,002,000 | |
The Southern Co. | | United States | | | 4,200,000 | | | | 183,120,000 | |
Xcel Energy Inc. | | United States | | | 4,600,000 | | | | 217,166,000 | |
| | | | | | | | | | |
| | | |
| | | | | | | | | 3,327,555,546 | |
| | | | | | | | | | |
Gas Utilities 1.2% | | | | | | | | | | |
Atmos Energy Corp. | | United States | | | 200,000 | | | | 18,782,000 | |
Spire Inc. | | United States | | | 700,000 | | | | 51,485,000 | |
| | | | | | | | | | |
| | | |
| | | | | | | | | 70,267,000 | |
| | | | | | | | | | |
Multi-Utilities 32.5% | | | | | | | | | | |
Ameren Corp. | | United States | | | 1,100,000 | | | | 69,542,000 | |
Black Hills Corp. | | United States | | | 700,000 | | | | 40,663,000 | |
CenterPoint Energy Inc. | | United States | | | 5,000,000 | | | | 138,250,000 | |
CMS Energy Corp. | | United States | | | 5,100,000 | | | | 249,900,000 | |
Consolidated Edison Inc. | | United States | | | 1,250,000 | | | | 95,237,500 | |
Dominion Energy Inc. | | United States | | | 4,200,000 | | | | 295,176,000 | |
DTE Energy Co. | | United States | | | 1,600,000 | | | | 174,608,000 | |
National Grid PLC | | United Kingdom | | | 5,999,933 | | | | 61,897,077 | |
NiSource Inc. | | United States | | | 3,400,000 | | | | 84,728,000 | |
NorthWestern Corp. | | United States | | | 596,800 | | | | 35,008,288 | |
Public Service Enterprise Group Inc. | | United States | | | 2,800,000 | | | | 147,812,000 | |
SCANA Corp. | | United States | | | 300,000 | | | | 11,667,000 | |
Sempra Energy | | United States | | | 2,400,000 | | | | 273,000,000 | |
Vectren Corp. | | United States | | | 500,000 | | | | 35,745,000 | |
WEC Energy Group Inc. | | United States | | | 2,150,792 | | | | 143,586,874 | |
| | | | | | | | | | |
| | | |
| | | | | | | | | 1,856,820,739 | |
| | | | | | | | | | |
Oil, Gas & Consumable Fuels 4.4% | | | | | | | | | | |
Enbridge Inc. | | Canada | | | 800,000 | | | | 25,832,000 | |
Kinder Morgan Inc. | | United States | | | 4,800,000 | | | | 85,104,000 | |
ONEOK Inc. | | United States | | | 568,200 | | | | 38,518,278 | |
TransCanada Corp. | | Canada | | | 1,000,000 | | | | 40,431,705 | |
The Williams Cos. Inc. | | United States | | | 2,200,000 | | | | 59,818,000 | |
| | | | | | | | | | |
| | | |
| | | | | | | | | 249,703,983 | |
| | | | | | | | | | |
| | | | |
| | | |
96 | | Annual Report | | franklintempleton.com |
FRANKLIN CUSTODIAN FUNDS
STATEMENT OF INVESTMENTS
Franklin Utilities Fund(continued)
| | | | | | | | | | |
| | | Country | | Shares | | | Value | |
| | | |
Common Stocks(continued) | | | | | | | | | | |
Water Utilities 3.4% | | | | | | | | | | |
American Water Works Co. Inc. | | United States | | | 1,500,000 | | | $ | 131,955,000 | |
United Utilities Group PLC | | United Kingdom | | | 6,700,000 | | | | 61,485,846 | |
| | | | | | | | | | |
| | | | | | | | | 193,440,846 | |
| | | | | | | | | | |
Total Common Stocks (Cost $3,130,618,940) | | | | | | | | | 5,697,788,114 | |
| | | | | | | | | | |
| | | |
| | | | | Principal
Amount | | | | |
Corporate Bonds (Cost $6,087,828) 0.1% | | | | | | | | | | |
Multi-Utilities 0.1% | | | | | | | | | | |
Aquila Inc., senior note, 8.27%, 11/15/21 | | United States | | $ | 6,100,000 | | | | 6,818,488 | |
| | | | | | | | | | |
| | | |
Total Investments before Short Term Investments
(Cost $3,136,706,768) | | | | | | | | | 5,704,606,602 | |
| | | | | | | | | | |
| | | |
| | | | | Shares | | | | |
Short Term Investments (Cost $17,808,342) 0.3% | | | | | | | | | | |
| | | |
Money Market Funds 0.3% | | | | | | | | | | |
b,cInstitutional Fiduciary Trust Money Market Portfolio, 1.69% | | United States | | | 17,808,342 | | | | 17,808,342 | |
| | | | | | | | | | |
Total Investments (Cost $3,154,515,110) 100.0% | | | | | | | | | 5,722,414,944 | |
Other Assets, less Liabilities 0.0%† | | | | | | | | | 1,151,601 | |
| | | | | | | | | | |
Net Assets 100.0% | | | | | | | | $ | 5,723,566,545 | |
| | | | | | | | | | |
See Abbreviations on page 130.
†Rounds to less than 0.1% of net assets.
aNon-income producing.
bSee Note 3(f) regarding investments in affiliated management investment companies.
cThe rate shown is the annualized seven-day effective yield at period end.
| | | | |
| | | |
| franklintempleton.com | | The accompanying notes are an integral part of these financial statements. | Annual Report | | 97 |
FRANKLIN CUSTODIAN FUNDS
Financial Statements
Statements of Assets and Liabilities
September 30, 2018
| | | | | | | | | | | | |
| | | Franklin DynaTech Fund | | | Franklin Growth Fund | | | Franklin Income Fund | |
| | | |
Assets: | | | | | | | | | | | | |
+Investments in securities: | | | | | | | | | | | | |
Cost - Unaffiliated issuers | | | $3,421,116,937 | | | | $ 5,330,851,562 | | | | $73,414,984,106 | |
Cost - Non-controlled affiliates (Note 3f and 9) | | | 125,141,525 | | | | 224,477,141 | | | | 562,479,699 | |
Cost - Unaffiliated repurchase agreements | | | — | | | | — | | | | 3,155,971 | |
| | | | |
| | | |
Value - Unaffiliated issuers | | | $6,664,310,389 | | | | $16,181,259,863 | | | | $75,810,489,067 | |
Value - Non-controlled affiliates (Note 3f and 9) | | | 125,141,525 | | | | 224,477,141 | | | | 544,991,194 | |
Value - Unaffiliated repurchase agreements | | | — | | | | — | | | | 3,155,971 | |
Cash | | | — | | | | 298,762 | | | | 7,079,695 | |
Receivables: | | | | | | | | | | | | |
Investment securities sold | | | 18,383,491 | | | | — | | | | 163,817,810 | |
Capital shares sold | | | 31,793,292 | | | | 33,715,266 | | | | 48,041,336 | |
Dividends and interest | | | 1,397,883 | | | | 8,902,516 | | | | 675,300,542 | |
Other assets | | | 1,894 | | | | 5,858 | | | | 31,367 | |
| | | | |
| | | |
Total assets | | | 6,841,028,474 | | | | 16,448,659,406 | | | | 77,252,906,982 | |
| | | | |
| | | |
Liabilities: | | | | | | | | | | | | |
Payables: | | | | | | | | | | | | |
Investment securities purchased | | | 7,372,010 | | | | — | | | | 440,489,736 | |
Capital shares redeemed | | | 9,979,269 | | | | 29,557,054 | | | | 82,502,934 | |
Management fees | | | 2,539,677 | | | | 5,903,346 | | | | 23,567,847 | |
Distribution fees | | | 2,543,406 | | | | 5,884,279 | | | | 33,055,070 | |
Transfer agent fees | | | 837,869 | | | | 2,906,625 | | | | 10,105,514 | |
Options written, at value (premiums received $—, $— and $28,483,429, respectively) | | | — | | | | — | | | | 24,673,000 | |
Payable upon return of securities loaned | | | — | | | | — | | | | 15,778,971 | |
Accrued expenses and other liabilities | | | 386,855 | | | | 692,783 | | | | 3,469,423 | |
| | | | |
| | | |
Total liabilities | | | 23,659,086 | | | | 44,944,087 | | | | 633,642,495 | |
| | | | |
| | | |
Net assets, at value | | | $6,817,369,388 | | | | $16,403,715,319 | | | | $76,619,264,487 | |
| | | | |
| | | |
Net assets consist of: | | | | | | | | | | | | |
Paid-in capital | | | $3,419,048,146 | | | | $ 5,345,609,332 | | | | $76,426,657,156 | |
Total distributable earnings (loss) | | | 3,398,321,242 | | | | 11,058,105,987 | | | | 192,607,331 | |
| | | | |
| | | |
Net assets, at value | | | $6,817,369,388 | | | | $16,403,715,319 | | | | $76,619,264,487 | |
| | | | |
| | | |
+Includes securities loaned | | | $ — | | | | $ — | | | | $ 15,276,890 | |
| | | | |
| | | |
98 | | Annual Report | The accompanying notes are an integral part of these financial statements. | | franklintempleton.com |
FRANKLIN CUSTODIAN FUNDS
FINANCIAL STATEMENTS
Statements of Assets and Liabilities(continued)
September 30, 2018
| | | | | | | | | | |
| | | Franklin DynaTech Fund | | Franklin Growth Fund | | | Franklin Income Fund | |
| | | |
| Class A: | | | | | | | | | | |
Net assets, at value | | $3,741,561,876 | | | $9,044,834,174 | | | | $ 107,057,233 | |
| | | |
Shares outstanding | | 46,102,241 | | | 84,070,372 | | | | 46,110,126 | |
| | | |
Net asset value per sharea | | $81.16 | | | $107.59 | | | | $2.32 | |
| | | |
Maximum offering price per share (net asset value per share ÷ 94.50%, 94.50% and 95.75%, respectively) | | $85.88 | | | $113.85 | | | | $2.42 | |
| | | |
Class A1: | | | | | | | | | | |
Net assets, at value | | | | | | | | | $42,929,573,280 | |
| | | | | | | | | | |
Shares outstanding | | | | | | | | | 18,489,593,506 | |
| | | | | | | | | | |
Net asset value and maximum offering price per sharea | | | | | | | | | $2.32 | |
| | | | | | | | | | |
Maximum offering price per share (net asset value per share ÷ 95.75%) | | | | | | | | | $2.42 | |
| | | | | | | | | | |
Class C: | | | | | | | | | | |
Net assets, at value | | $ 611,220,971 | | | $1,060,257,868 | | | | $19,895,441,018 | |
| | | |
Shares outstanding | | 8,979,652 | | | 10,777,365 | | | | 8,453,597,826 | |
| | | |
Net asset value and maximum offering price per sharea | | $68.07 | | | $98.38 | | | | $2.35 | |
| | | |
Class R: | | | | | | | | | | |
Net assets, at value | | $ 95,924,932 | | | $ 524,960,276 | | | | $ 296,097,953 | |
| | | |
Shares outstanding | | 1,216,121 | | | 4,906,019 | | | | 129,959,623 | |
| | | |
Net asset value and maximum offering price per share | | $78.88 | | | $107.00 | | | | $2.28 | |
| | | |
Class R6: | | | | | | | | | | |
Net assets, at value | | $1,688,595,135 | | | $2,634,454,734 | | | | $ 2,062,333,739 | |
| | | |
Shares outstanding | | 20,027,224 | | | 24,415,837 | | | | 895,173,936 | |
| | | |
Net asset value and maximum offering price per share | | $84.31 | | | $107.90 | | | | $2.30 | |
| | | |
Advisor Class: | | | | | | | | | | |
Net assets, at value | | $ 680,066,474 | | | $3,139,208,267 | | | | $11,328,761,264 | |
| | | |
Shares outstanding | | 8,138,719 | | | 29,079,905 | | | | 4,920,721,863 | |
| | | |
Net asset value and maximum offering price per share | | $83.56 | | | $107.95 | | | | $2.30 | |
| | | |
aRedemption price is equal to net asset value less contingent deferred sales charges, if applicable.
| | | | |
| | | |
| franklintempleton.com | | The accompanying notes are an integral part of these financial statements. | Annual Report | | 99 |
FRANKLIN CUSTODIAN FUNDS
FINANCIAL STATEMENTS
Statements of Assets and Liabilities(continued)
September 30, 2018
| | | | | | | | |
| | | Franklin U.S. Government Securities Fund | | | Franklin
Utilities Fund | |
| | |
Assets: | | | | | | | | |
Investments in securities: | | | | | | | | |
Cost - Unaffiliated issuers | | | $5,119,014,589 | | | | $3,136,706,768 | |
Cost - Non-controlled affiliates (Note 3f and 9) | | | 93,109,667 | | | | 17,808,342 | |
| | | | |
| | |
Value - Unaffiliated issuers | | | $5,021,676,543 | | | | $5,704,606,602 | |
Value - Non-controlled affiliates (Note 3f and 9) | | | 93,109,667 | | | | 17,808,342 | |
Receivables: | | | | | | | | |
Capital shares sold | | | 2,115,061 | | | | 3,344,770 | |
Dividends and interest | | | 16,218,287 | | | | 9,485,290 | |
Other assets | | | 2,078 | | | | 2,274 | |
| | | | |
| | |
Total assets | | | 5,133,121,636 | | | | 5,735,247,278 | |
| | | | |
| | |
Liabilities: | | | | | | | | |
Payables: | | | | | | | | |
Capital shares redeemed | | | 4,887,625 | | | | 6,353,511 | |
Management fees | | | 1,908,586 | | | | 2,164,274 | |
Distribution fees | | | 1,447,085 | | | | 1,929,251 | |
Transfer agent fees | | | 940,462 | | | | 897,247 | |
Distributions to shareholders | | | 1,728,665 | | | | — | |
Accrued expenses and other liabilities | | | 601,188 | | | | 336,450 | |
| | | | |
| | |
Total liabilities | | | 11,513,611 | | | | 11,680,733 | |
| | | | |
| | |
Net assets, at value | | | $5,121,608,025 | | | | $5,723,566,545 | |
| | | | |
| | |
Net assets consist of: | | | | | | | | |
Paid-in capital | | | $5,774,571,841 | | | | $2,985,993,771 | |
Total distributable earnings (loss) | | | (652,963,816 | ) | | | 2,737,572,774 | |
| | | | |
Net assets, at value | | | $5,121,608,025 | | | | $5,723,566,545 | |
| | | | |
| | | | |
| | | |
100 | | Annual Report | The accompanying notes are an integral part of these financial statements. | | franklintempleton.com |
FRANKLIN CUSTODIAN FUNDS
FINANCIAL STATEMENTS
Statements of Assets and Liabilities(continued)
September 30, 2018
| | | | | | | | |
| | | Franklin U.S. Government Securities Fund | | | Franklin Utilities Fund | |
| | |
Class A: | | | | | | | | |
Net assets, at value | | $ | 4,471,761 | | | $ | 3,536,416 | |
| | | | |
Shares outstanding | | | 763,712 | | | | 189,504 | |
| | | | |
Net asset value per sharea | | | $5.86 | | | | $18.66 | |
| | | | |
Maximum offering price per share (net asset value per share ÷ 95.75%) | | | $6.12 | | | | $19.49 | |
| | | | |
Class A1: | | | | | | | | |
Net assets, at value | | | $3,099,373,279 | | | | $3,654,795,449 | |
| | | | |
Shares outstanding | | | 529,734,092 | | | | 195,813,880 | |
| | | | |
Net asset value and maximum offering price per sharea | | | $5.85 | | | | $18.66 | |
| | | | |
Maximum offering price per share (net asset value per share ÷ 95.75%) | | | $6.11 | | | | $19.49 | |
| | | | |
Class C: | | | | | | | | |
Net assets, at value | | $ | 571,525,228 | | | $ | 834,069,544 | |
| | | | |
Shares outstanding | | | 98,391,789 | | | | 44,920,626 | |
| | | | |
Net asset value and maximum offering price per sharea | | | $5.81 | | | | $18.57 | |
| | | | |
Class R: | | | | | | | | |
Net assets, at value | | $ | 31,143,613 | | | $ | 72,926,787 | |
| | | | |
Shares outstanding | | | 5,325,841 | | | | 3,922,276 | |
| | | | |
Net asset value and maximum offering price per share | | | $5.85 | | | | $18.59 | |
| | | | |
Class R6: | | | | | | | | |
Net assets, at value | | $ | 694,812,652 | | | $ | 230,392,966 | |
| | | | |
Shares outstanding | | | 118,357,953 | | | | 12,250,590 | |
| | | | |
Net asset value and maximum offering price per share | | | $5.87 | | | | $18.81 | |
| | | | |
Advisor Class: | | | | | | | | |
Net assets, at value | | $ | 720,281,492 | | | $ | 927,845,383 | |
| | | | |
Shares outstanding | | | 122,678,764 | | | | 49,332,482 | |
| | | | |
Net asset value and maximum offering price per share | | | $5.87 | | | | $18.81 | |
| | | | |
aRedemption price is equal to net asset value less contingent deferred sales charges, if applicable.
| | | | |
| | | |
| franklintempleton.com | | The accompanying notes are an integral part of these financial statements. | Annual Report | | 101 |
FRANKLIN CUSTODIAN FUNDS
FINANCIAL STATEMENTS
Statements of Operations
for the year ended September 30, 2018
| | | | | | | | | | | | |
| | | Franklin
DynaTech Fund | | | Franklin Growth Fund | | | Franklin Income Fund | |
Investment income: | | | | | | | | | | | | |
Dividends: (net of foreign taxes)* | | | | | | | | | | | | |
Unaffiliated issuers | | $ | 26,915,256 | | | $ | 184,282,044 | | | $ | 1,191,885,750 | |
Non-controlled affiliates (Note 3f and 9) | | | 1,641,929 | | | | 3,722,826 | | | | 14,519,270 | |
Interest: | | | | | | | | | | | | |
Unaffiliated issuers | | | — | | | | — | | | | 2,407,788,207 | |
Controlled affiliates (Note 9) | | | — | | | | — | | | | 3,353,931 | |
Non-controlled affiliates (Note 9) | | | — | | | | — | | | | 54,098,020 | |
Income from securities loaned (net of fees and rebates) | | | — | | | | — | | | | 1,784,265 | |
| | | | |
Total investment income | | | 28,557,185 | | | | 188,004,870 | | | | 3,673,429,443 | |
| | | | |
Expenses: | | | | | | | | | | | | |
Management fees (Note 3a) | | | 24,562,529 | | | | 67,188,693 | | | | 295,407,924 | |
Distribution fees: (Note 3c) | | | | | | | | | | | | |
Class A | | | 7,607,712 | | | | 21,320,776 | | | | 7,774 | |
Class A1 | | | — | | | | — | | | | 66,878,563 | |
Class C | | | 4,825,287 | | | | 10,022,333 | | | | 139,081,351 | |
Class R | | | 332,065 | | | | 2,596,195 | | | | 1,606,084 | |
Transfer agent fees: (Note 3e) | | | | | | | | | | | | |
Class A | | | 3,942,975 | | | | 10,762,503 | | | | 2,555 | |
Class A1 | | | — | | | | — | | | | 39,476,500 | |
Class C | | | 625,212 | | | | 1,264,977 | | | | 18,944,896 | |
Class R | | | 86,202 | | | | 656,832 | | | | 286,257 | |
Class R6 | | | 294,901 | | | | 565,131 | | | | 332,845 | |
Advisor Class | | | 629,903 | | | | 3,542,778 | | | | 9,980,022 | |
Custodian fees (Note 4) | | | 102,240 | | | | 192,780 | | | | 1,134,368 | |
Reports to shareholders | | | 589,165 | | | | 919,198 | | | | 4,137,630 | |
Registration and filing fees | | | 362,023 | | | | 215,466 | | | | 741,861 | |
Professional fees | | | 88,153 | | | | 188,019 | | | | 1,862,824 | |
Trustees’ fees and expenses | | | 21,513 | | | | 66,212 | | | | 363,971 | |
Other | | | 70,274 | | | | 224,385 | | | | 687,973 | |
| | | | |
Total expenses | | | 44,140,154 | | | | 119,726,278 | | | | 580,933,398 | |
Expense reductions (Note 4) | | | (155 | ) | | | (743 | ) | | | (418,073 | ) |
Expenses waived/paid by affiliates (Note 3f and 3g) | | | (541,797 | ) | | | (1,190,435 | ) | | | (5,123,635 | ) |
| | | | |
Net expenses | | | 43,598,202 | | | | 118,535,100 | | | | 575,391,690 | |
| | | | |
Net investment income (loss) | | | (15,041,017 | ) | | | 69,469,770 | | | | 3,098,037,753 | |
| | | | |
Realized and unrealized gains (losses): | | | | | | | | | | | | |
Net realized gain (loss) from: | | | | | | | | | | | | |
Investments:+ | | | | | | | | | | | | |
Unaffiliated issuers | | | 176,745,336 | | | | 308,138,392 | | | | 2,407,938,687 | |
Controlled affiliates (Note 3f and 9) | | | — | | | | — | | | | 4,149,459 | |
Non-controlled affiliates (Note 3f and 9) | | | — | | | | — | | | | (389,718,988 | ) |
Written options | | | — | | | | — | | | | 121,101,389 | |
Foreign currency transactions | | | 41,609 | | | | (204,064 | ) | | | (3,955,235 | ) |
| | | | |
Net realized gain (loss) | | | 176,786,945 | | | | 307,934,328 | | | | 2,139,515,312 | |
| | | | |
Net change in unrealized appreciation (depreciation) on: | | | | | | | | | | | | |
Investments: | | | | | | | | | | | | |
Unaffiliated issuers | | | 1,253,022,528 | | | | 2,488,154,018 | | | | (4,256,651,399 | ) |
Controlled affiliates (Note 3f and 9) | | | — | | | | — | | | | 50,030,607 | |
Non-controlled affiliates (Note 3f and 9) | | | — | | | | — | | | | 556,805,106 | |
Translation of other assets and liabilities denominated in foreign currencies | | | (5,535 | ) | | | — | | | | (1,303,586 | ) |
Written options | | | — | | | | — | | | | 6,930,114 | |
| | | | |
Net change in unrealized appreciation (depreciation) | | | 1,253,016,993 | | | | 2,488,154,018 | | | | (3,644,189,158 | ) |
| | | | |
| | | | |
| | | |
102 | | Annual Report | The accompanying notes are an integral part of these financial statements. | | franklintempleton.com |
FRANKLIN CUSTODIAN FUNDS
FINANCIAL STATEMENTS
Statements of Operations(continued)
for the year ended September 30, 2018
| | | | | | | | | | | | |
| | | Franklin DynaTech Fund | | | Franklin Growth Fund | | | Franklin Income Fund | |
Net realized and unrealized gain (loss) | | $ | 1,429,803,938 | | | $ | 2,796,088,346 | | | $ | (1,504,673,846 | ) |
| | | | |
Net increase (decrease) in net assets resulting from operations | | $ | 1,414,762,921 | | | $ | 2,865,558,116 | | | $ | 1,593,363,907 | |
| | | | |
| | | |
| | | | | | | | | | |
*Foreign taxes withheld on dividends | | $ | 116,462 | | | $ | 1,251,966 | | | $ | 55,476,204 | |
+Includes gains from a redemption in-kind (Note 11) | | $ | — | | | $ | 42,189,159 | | | $ | — | |
| | | | |
| | | |
| franklintempleton.com | | The accompanying notes are an integral part of these financial statements. | Annual Report | | 103 |
FRANKLIN CUSTODIAN FUNDS
FINANCIAL STATEMENTS
Statements of Operations(continued)
for the year ended September 30, 2018
| | | | | | | | |
| | | Franklin U.S. Government
Securities Fund | | | Franklin Utilities Fund | |
Investment income: | | | | | | | | |
Dividends: (net of foreign taxes)* | | | | | | | | |
Unaffiliated issuers | | $ | — | | | $ | 205,451,330 | |
Non-controlled affiliates (Note 3f and 9) | | | 1,279,356 | | | | 278,893 | |
Interest: | | | | | | | | |
Unaffiliated issuers: | | | | | | | | |
Paydown gain (loss) | | | (29,839,912 | ) | | | — | |
Paid in cash | | | 205,400,869 | | | | 1,328,823 | |
Income from securities loaned (net of fees and rebates) | | | — | | | | 2,492 | |
| | | | |
Total investment income | | | 176,840,313 | | | | 207,061,538 | |
| | | | |
Expenses: | | | | | | | | |
Management fees (Note 3a) | | | 24,532,386 | | | | 27,230,235 | |
Distribution fees: (Note 3c) | | | | | | | | |
Class A | | | 277 | | | | 260 | |
Class A1 | | | 4,980,924 | | | | 5,772,753 | |
Class C | | | 4,376,640 | | | | 5,826,246 | |
Class R | | | 168,573 | | | | 403,339 | |
Transfer agent fees: (Note 3e) | | | | | | | | |
Class A | | | 142 | | | | 112 | |
Class A1 | | | 4,651,394 | | | | 4,467,136 | |
Class C | | | 929,587 | | | | 1,040,390 | |
Class R | | | 47,000 | | | | 93,918 | |
Class R6 | | | 151,927 | | | | 127,199 | |
Advisor Class | | | 1,012,477 | | | | 1,073,316 | |
Custodian fees (Note 4) | | | 45,842 | | | | 72,945 | |
Reports to shareholders | | | 400,518 | | | | 423,124 | |
Registration and filing fees | | | 162,551 | | | | 153,389 | |
Professional fees | | | 95,120 | | | | 102,060 | |
Trustees’ fees and expenses | | | 25,001 | | | | 28,007 | |
Other | | | 578,710 | | | | 108,443 | |
| | | | |
Total expenses | | | 42,159,069 | | | | 46,922,872 | |
Expense reductions (Note 4) | | | (1,315 | ) | | | (6,897 | ) |
Expenses waived/paid by affiliates (Note 3f and 3g) | | | (424,436 | ) | | | (184,341 | ) |
| | | | |
Net expenses | | | 41,733,318 | | | | 46,731,634 | |
| | | | |
Net investment income | | | 135,106,995 | | | | 160,329,904 | |
| | | | |
Realized and unrealized gains (losses): | | | | | | | | |
Net realized gain (loss) from: | | | | | | | | |
Investments: | | | | | | | | |
Unaffiliated issuers | | | (17,091,870 | ) | | | 202,345,920 | |
Foreign currency transactions | | | — | | | | (204,082 | ) |
| | | | |
Net realized gain (loss) | | | (17,091,870 | ) | | | 202,141,838 | |
| | | | |
| | |
Net change in unrealized appreciation (depreciation) on: | | | | | | | | |
Investments: | | | | | | | | |
Unaffiliated issuers | | | (204,522,890 | ) | | | (290,381,785 | ) |
Translation of other assets and liabilities denominated in foreign currencies | | | — | | | | 3,394 | |
| | | | |
Net change in unrealized appreciation (depreciation) | | | (204,522,890 | ) | | | (290,378,391 | ) |
| | | | |
Net realized and unrealized gain (loss) | | | (221,614,760 | ) | | | (88,236,553 | ) |
| | | | |
Net increase (decrease) in net assets resulting from operations | | $ | (86,507,765 | ) | | $ | 72,093,351 | |
| | | | |
| | | | |
| | |
*Foreign taxes withheld on dividends | | $ | — | | | $ | 1,429,263 | |
| | | | |
| | | |
104 | | Annual Report | The accompanying notes are an integral part of these financial statements. | | franklintempleton.com |
FRANKLIN CUSTODIAN FUNDS
FINANCIAL STATEMENTS
Statements of Changes in Net Assets
| | | | | | | | | | | | | | | | |
| | | Franklin DynaTech Fund | | | Franklin Growth Fund | |
| | | | |
| | | Year Ended September 30, | | | Year Ended September 30, | |
| | | | |
| | | 2018 | | | 2017 | | | 2018 | | | 2017 | |
Increase (decrease) in net assets: | | | | | | | | | | | | | | | | |
Operations: | | | | | | | | | | | | | | | | |
Net investment income (loss) | | $ | (15,041,017 | ) | | $ | (10,773,451 | ) | | $ | 69,469,770 | | | $ | 65,365,826 | |
Net realized gain (loss) | | | 176,786,945 | | | | 110,351,134 | | | | 307,934,328 | | | | 281,282,680 | |
Net change in unrealized appreciation (depreciation) | | | 1,253,016,993 | | | | 687,873,992 | | | | 2,488,154,018 | | | | 2,130,737,126 | |
| | | | |
| | | | |
Net increase (decrease) in net assets resulting from operations | | | 1,414,762,921 | | | | 787,451,675 | | | | 2,865,558,116 | | | | 2,477,385,632 | |
| | | | |
| | | | |
Distributions to shareholders: (Note 1l) | | | | | | | | | | | | | | | | |
Class A | | | (46,020,971 | ) | | | (67,256,053 | ) | | | (226,847,781 | ) | | | (271,375,277 | ) |
Class C | | | (8,263,863 | ) | | | (11,758,906 | ) | | | (24,694,013 | ) | | | (28,670,653 | ) |
Class R | | | (916,852 | ) | | | (1,284,067 | ) | | | (13,125,428 | ) | | | (16,218,229 | ) |
Class R6 | | | (16,654,639 | ) | | | (11,046,724 | ) | | | (66,654,737 | ) | | | (50,057,658 | ) |
Advisor Class | | | (5,793,931 | ) | | | (7,824,210 | ) | | | (76,869,802 | ) | | | (80,246,268 | ) |
| | | | |
Total distributions to shareholders | | | (77,650,256 | ) | | | (99,169,960 | ) | | | (408,191,761 | ) | | | (446,568,085 | ) |
| | | | |
| | | | |
Capital share transactions: (Note 2) | | | | | | | | | | | | | | | | |
Class A | | | 479,666,303 | | | | (58,619,051 | ) | | | (384,147,638 | ) | | | (775,062,897 | ) |
Class C | | | 121,107,638 | | | | (5,464,905 | ) | | | (26,004,014 | ) | | | (50,580,939 | ) |
Class R | | | 32,046,631 | | | | 1,319,443 | | | | (68,853,353 | ) | | | (43,562,140 | ) |
Class R6 | | | 912,918,385 | | | | 11,234,886 | | | | 556,753,865 | | | | 215,211,021 | |
Advisor Class | | | (156,845,531 | ) | | | 410,822,596 | | | | (126,254,992 | ) | | | 419,014,663 | |
| | | | |
Total capital share transactions | | | 1,388,893,426 | | | | 359,292,969 | | | | (48,506,132 | ) | | | (234,980,292 | ) |
| | | | |
Net increase (decrease) in net assets | | | 2,726,006,091 | | | | 1,047,574,684 | | | | 2,408,860,223 | | | | 1,795,837,255 | |
Net assets: | | | | | | | | | | | | | | | | |
Beginning of year | | | 4,091,363,297 | | | | 3,043,788,613 | | | | 13,994,855,096 | | | | 12,199,017,841 | |
| | | | |
| | | | |
End of year (Note 1l) | | $ | 6,817,369,388 | | | $ | 4,091,363,297 | | | $ | 16,403,715,319 | | | $ | 13,994,855,096 | |
| | | | |
| | | | |
| | | |
| franklintempleton.com | | The accompanying notes are an integral part of these financial statements. | Annual Report | | 105 |
FRANKLIN CUSTODIAN FUNDS
FINANCIAL STATEMENTS
Statements of Changes in Net Assets(continued)
| | | | | | | | | | | | | | | | |
| | | Franklin Income Fund | | | Franklin U.S. Government Securities Fund | |
| | | Year Ended September 30, | | | Year Ended September 30, | |
| | | 2018 | | | 2017 | | | 2018 | | | 2017 | |
Increase (decrease) in net assets: | | | | | | | | | | | | | | | | |
Operations: | | | | | | | | | | | | | | | | |
Net investment income | | $ | 3,098,037,753 | | | $ | 3,350,660,766 | | | $ | 135,106,995 | | | $ | 130,407,046 | |
Net realized gain (loss) | | | 2,139,515,312 | | | | 1,860,395,900 | | | | (17,091,870 | ) | | | (63,379,288 | ) |
Net change in unrealized appreciation (depreciation) | | | (3,644,189,158 | ) | | | 3,978,607,766 | | | | (204,522,890 | ) | | | (107,534,558 | ) |
| | | | |
Net increase (decrease) in net assets resulting from operations | | | 1,593,363,907 | | | | 9,189,664,432 | | | | (86,507,765 | ) | | | (40,506,800 | ) |
| | | | |
Distributions to shareholders: (Note 1l) | | | | | | | | | | | | | | | | |
Class A | | | — | | | | — | | | | (12,054 | ) | | | — | |
Class A1 | | | (2,288,960,635 | ) | | | (2,378,392,172 | ) | | | (102,662,505 | ) | | | (117,543,709 | ) |
Class M | | | (106 | ) | | | — | | | | (67 | ) | | | — | |
Class C | | | (972,575,550 | ) | | | (1,087,030,360 | ) | | | (17,064,880 | ) | | | (23,194,188 | ) |
Class R | | | (15,730,910 | ) | | | (18,864,554 | ) | | | (917,007 | ) | | | (1,294,613 | ) |
Class R6 | | | (112,761,533 | ) | | | (95,303,179 | ) | | | (20,832,132 | ) | | | (16,694,015 | ) |
Advisor Class | | | (597,750,735 | ) | | | (524,726,253 | ) | | | (23,153,769 | ) | | | (25,402,172 | ) |
| | | | |
Total distributions to shareholders | | | (3,987,779,469 | ) | | | (4,104,316,518 | ) | | | (164,642,414 | ) | | | (184,128,697 | ) |
| | | | |
Capital share transactions: (Note 2) | | | | | | | | | | | | | | | | |
Class A | | | 107,124,173 | | | | — | | | | 4,483,084 | | | | — | |
Class A1 | | | (2,231,639,649 | ) | | | (1,869,610,539 | ) | | | (326,093,441 | ) | | | (511,968,136 | ) |
Class M | | | 229 | | | | — | | | | 108 | | | | — | |
Class C | | | (2,505,402,882 | ) | | | (2,293,654,717 | ) | | | (194,350,252 | ) | | | (202,855,335 | ) |
Class R | | | (55,588,036 | ) | | | (58,209,535 | ) | | | (5,634,672 | ) | | | (19,433,072 | ) |
Class R6 | | | 309,451,485 | | | | (32,346,017 | ) | | | 276,619,775 | | | | (159,062,673 | ) |
Advisor Class | | | (1,525,738 | ) | | | 2,925,976,903 | | | | (100,605,572 | ) | | | 162,685,038 | |
| | | | |
Total capital share transactions | | | (4,377,580,418 | ) | | | (1,327,843,905 | ) | | | (345,580,970 | ) | | | (730,634,178 | ) |
| | | | |
Net increase (decrease) in net assets | | | (6,771,995,980 | ) | | | 3,757,504,009 | | | | (596,731,149 | ) | | | (955,269,675 | ) |
Net assets: | | | | | | | | | | | | | | | | |
Beginning of year | | | 83,391,260,467 | | | | 79,633,756,458 | | | | 5,718,339,174 | | | | 6,673,608,849 | |
| | | | |
End of year (Note 1l) | | $ | 76,619,264,487 | | | | $83,391,260,467 | | | | $5,121,608,025 | | | | $5,718,339,174 | |
| | | | |
| | | | |
| | | |
106 | | Annual Report | The accompanying notes are an integral part of these financial statements. | | franklintempleton.com |
FRANKLIN CUSTODIAN FUNDS
FINANCIAL STATEMENTS
Statements of Changes in Net Assets(continued)
| | | | | | | | |
| | | Franklin Utilities Fund | |
| | | Year Ended September 30, | |
| | | 2018 | | | 2017 | |
Increase (decrease) in net assets: | | | | | | | | |
Operations: | | | | | | | | |
Net investment income | | $ | 160,329,904 | | | $ | 177,423,281 | |
Net realized gain (loss) | | | 202,141,838 | | | | 88,486,105 | |
Net change in unrealized appreciation (depreciation) | | | (290,378,391 | ) | | | 349,739,100 | |
| | | | |
Net increase (decrease) in net assets resulting from operations | | | 72,093,351 | | | | 615,648,486 | |
| | | | |
Distributions to shareholders: (Note 1l) | | | | | | | | |
Class A1 | | | (177,065,549 | ) | | | (110,776,128 | ) |
Class M | | | (70 | ) | | | — | |
Class C | | | (37,179,447 | ) | | | (22,295,630 | ) |
Class R | | | (3,557,682 | ) | | | (2,300,362 | ) |
Class R6 | | | (10,987,844 | ) | | | (6,819,072 | ) |
Advisor Class | | | (43,572,165 | ) | | | (23,791,428 | ) |
| | | | |
Total distributions to shareholders | | | (272,362,757 | ) | | | (165,982,620 | ) |
| | | | |
| | |
Capital share transactions: (Note 2) | | | | | | | | |
Class A | | | 3,570,602 | | | | — | |
Class A1 | | | (400,697,038 | ) | | | (289,671,581 | ) |
Class M | | | 262 | | | | — | |
Class C | | | (115,788,847 | ) | | | (156,252,743 | ) |
Class R | | | (18,460,504 | ) | | | (15,638,722 | ) |
Class R6 | | | (4,300,346 | ) | | | 4,295,848 | |
Advisor Class | | | (3,930,299 | ) | | | 148,535,428 | |
| | | | |
Total capital share transactions | | | (539,606,170 | ) | | | (308,731,770 | ) |
| | | | |
Net increase (decrease) in net assets | | | (739,875,576 | ) | | | 140,934,096 | |
Net assets: | | | | | | | | |
Beginning of year | | | 6,463,442,121 | | | | 6,322,508,025 | |
| | | | |
End of year (Note 1l) | | $ | 5,723,566,545 | | | $ | 6,463,442,121 | |
| | | | |
| | | | |
| | | |
| franklintempleton.com | | The accompanying notes are an integral part of these financial statements. | Annual Report | | 107 |
FRANKLIN CUSTODIAN FUNDS
Notes to Financial Statements
1. Organization and Significant Accounting Policies
Franklin Custodian Funds (Trust) is registered under the Investment Company Act of 1940 (1940 Act) as an open-end management investment company, consisting of six separate funds, five of which are included in this report (Funds) and applies the specialized accounting and reporting guidance in U.S. Generally Accepted Accounting Principles (U.S. GAAP). The classes of shares offered within each of the Funds are indicated below. Each class of shares may differ by its initial sales load, contingent deferred sales charges, voting rights on matters affecting a single class, its exchange privilege and fees due to differing arrangements for distribution and transfer agent fees.
Effective January 25, 2018, Franklin Income Fund, Franklin U.S. Government Securities Fund and Franklin Utilities Fund began offering a new class of shares, Class M. Class M was closed to investors effective at the close of market June 8, 2018.
Effective September 10, 2018, Franklin Income, Franklin U.S. Government Securities and Franklin Utilities Funds’ Class A shares were renamed Class A1 and these Funds began offering a new class of shares, Class A. Class A1 shares are only offered to existing Class A1 shareholders.
Class A, Class C, Class R, Class R6 & Advisor Class
Franklin DynaTech Fund
Franklin Growth Fund
Class A, Class A1, Class C, Class R, Class R6 & Advisor Class
Franklin Income Fund
Franklin U.S. Government Securities Fund
Franklin Utilities Fund
The following summarizes the Funds’ significant accounting policies.
a. Financial Instrument Valuation
The Funds’ investments in financial instruments are carried at fair value daily. Fair value is the price that would be received to sell an asset or paid to transfer a liability in an orderly transaction between market participants on the measurement date. The Funds calculate the net asset value (NAV) per share each business day as of 4 p.m. Eastern time or the regularly scheduled close of the New York Stock Exchange (NYSE), whichever is earlier. Under compliance policies and procedures
approved by the Trust’s Board of Trustees (the Board), the Funds’ administrator has responsibility for oversight of valuation, including leading the cross-functional Valuation Committee (VC). The VC provides administration and oversight of the Funds’ valuation policies and procedures, which are approved annually by the Board. Among other things, these procedures allow the Funds to utilize independent pricing services, quotations from securities and financial instrument dealers, and other market sources to determine fair value.
Equity securities and derivative financial instruments listed on an exchange or on the NASDAQ National Market System are valued at the last quoted sale price or the official closing price of the day, respectively. Foreign equity securities are valued as of the close of trading on the foreign stock exchange on which the security is primarily traded, or as of 4 p.m. Eastern time. The value is then converted into its U.S. dollar equivalent at the foreign exchange rate in effect at 4 p.m. Eastern time on the day that the value of the security is determined. Over-the-counter (OTC) securities are valued within the range of the most recent quoted bid and ask prices. Securities that trade in multiple markets or on multiple exchanges are valued according to the broadest and most representative market. Certain equity securities are valued based upon fundamental characteristics or relationships to similar securities.
Debt securities generally trade in the OTC market rather than on a securities exchange. The Funds’ pricing services use multiple valuation techniques to determine fair value. In instances where sufficient market activity exists, the pricing services may utilize a market-based approach through which quotes from market makers are used to determine fair value. In instances where sufficient market activity may not exist or is limited, the pricing services also utilize proprietary valuation models which may consider market characteristics such as benchmark yield curves, credit spreads, estimated default rates, anticipated market interest rate volatility, coupon rates, anticipated timing of principal repayments, underlying collateral, and other unique security features in order to estimate the relevant cash flows, which are then discounted to calculate the fair value. Securities denominated in a foreign currency are converted into their U.S. dollar equivalent at the foreign exchange rate in effect at 4 p.m. Eastern time on the date that the values of the foreign debt securities are determined.
Investments in open-end mutual funds are valued at the closing NAV. Investments in repurchase agreements are valued at cost, which approximates fair value.
| | | | |
| | | |
108 | | Annual Report | | franklintempleton.com |
FRANKLIN CUSTODIAN FUNDS
NOTES TO FINANCIAL STATEMENTS
The Funds have procedures to determine the fair value of financial instruments for which market prices are not reliable or readily available. Under these procedures, the VC convenes on a regular basis to review such financial instruments and considers a number of factors, including significant unobservable valuation inputs, when arriving at fair value. The VC primarily employs a market-based approach which may use related or comparable assets or liabilities, recent transactions, market multiples, book values, and other relevant information for the investment to determine the fair value of the investment. An income-based valuation approach may also be used in which the anticipated future cash flows of the investment are discounted to calculate fair value. Discounts may also be applied due to the nature or duration of any restrictions on the disposition of the investments. Due to the inherent uncertainty of valuations of such investments, the fair values may differ significantly from the values that would have been used had an active market existed. The VC employs various methods for calibrating these valuation approaches including a regular review of key inputs and assumptions, transactional back-testing or disposition analysis, and reviews of any related market activity.
Trading in securities on foreign securities stock exchanges and OTC markets may be completed before 4 p.m. Eastern time. In addition, trading in certain foreign markets may not take place on every Funds’ business day. Occasionally, events occur between the time at which trading in a foreign security is completed and 4 p.m. Eastern time that might call into question the reliability of the value of a portfolio security held by the Fund. As a result, differences may arise between the value of the Funds’ portfolio securities as determined at the foreign market close and the latest indications of value at 4 p.m. Eastern time. In order to minimize the potential for these differences, the VC monitors price movements following the close of trading in foreign stock markets through a series of country specific market proxies (such as baskets of American Depositary Receipts, futures contracts and exchange traded funds). These price movements are measured against established trigger thresholds for each specific market proxy to assist in determining if an event has occurred that may call into question the reliability of the values of the foreign securities held by the Funds. If such an event occurs, the securities may be valued using fair value procedures, which may include the use of independent pricing services.
When the last day of the reporting period is a non-business day, certain foreign markets may be open on those days that the Funds’ NAV is not calculated, which could result in differences between the value of the Funds’ portfolio securities on the last business day and the last calendar day of the reporting period. Any significant security valuation changes due to an open foreign market are adjusted and reflected by the Funds for financial reporting purposes.
b. Foreign Currency Translation
Portfolio securities and other assets and liabilities denominated in foreign currencies are translated into U.S. dollars based on the exchange rate of such currencies against U.S. dollars on the date of valuation. The Funds may enter into foreign currency exchange contracts to facilitate transactions denominated in a foreign currency. Purchases and sales of securities, income and expense items denominated in foreign currencies are translated into U.S. dollars at the exchange rate in effect on the transaction date. Portfolio securities and assets and liabilities denominated in foreign currencies contain risks that those currencies will decline in value relative to the U.S. dollar. Occasionally, events may impact the availability or reliability of foreign exchange rates used to convert the U.S. dollar equivalent value. If such an event occurs, the foreign exchange rate will be valued at fair value using procedures established and approved by the Board.
The Funds do not separately report the effect of changes in foreign exchange rates from changes in market prices on securities held. Such changes are included in net realized and unrealized gain or loss from investments in the Statements of Operations.
Realized foreign exchange gains or losses arise from sales of foreign currencies, currency gains or losses realized between the trade and settlement dates on securities transactions and the difference between the recorded amounts of dividends, interest, and foreign withholding taxes and the U.S. dollar equivalent of the amounts actually received or paid. Net unrealized foreign exchange gains and losses arise from changes in foreign exchange rates on foreign denominated assets and liabilities other than investments in securities held at the end of the reporting period.
c. Joint Repurchase Agreement
Certain or all Funds enter into a joint repurchase agreement whereby their uninvested cash balance is deposited into a joint cash account with other funds managed by the investment
| | | | |
| | | |
| franklintempleton.com | | Annual Report | | 109 |
FRANKLIN CUSTODIAN FUNDS
NOTES TO FINANCIAL STATEMENTS
1. Organization and Significant Accounting
Policies(continued)
c. Joint Repurchase Agreement(continued)
manager or an affiliate of the investment manager and is used to invest in one or more repurchase agreements. The value and face amount of the joint repurchase agreement are allocated to the funds based on their pro-rata interest. A repurchase agreement is accounted for as a loan by the Fund to the seller, collateralized by securities which are delivered to the Funds’ custodian. The fair value, including accrued interest, of the initial collateralization is required to be at least 102% of the dollar amount invested by the funds, with the value of the underlying securities marked to market daily to maintain coverage of at least 100%. Repurchase agreements are subject to the terms of Master Repurchase Agreements (MRAs) with approved counterparties (sellers). The MRAs contain various provisions, including but not limited to events of default and maintenance of collateral for repurchase agreements. In the event of default by either the seller or the Funds, certain MRAs may permit the non-defaulting party to net and close-out all transactions, if any, traded under such agreements. The Funds may sell securities it holds as collateral and apply the proceeds towards the repurchase price and any other amounts owed by the seller to the Funds in the event of default by the seller. This could involve costs or delays in addition to a loss on the securities if their value falls below the repurchase price owed by the seller. The joint repurchase agreement held by the Funds at year end, as indicated in the Statements of Investments, had been entered into on September 28, 2018.
d. Securities Purchased on a Delayed Delivery Basis
Certain or all Funds purchase securities on a delayed delivery basis, with payment and delivery scheduled for a future date. These transactions are subject to market fluctuations and are subject to the risk that the value at delivery may be more or less than the trade date purchase price. Although the Funds will generally purchase these securities with the intention of holding the securities, they may sell the securities before the settlement date. Sufficient assets have been segregated for these securities.
e. Derivative Financial Instruments
Certain or all Funds invested in derivative financial instruments in order to manage risk or gain exposure to various other investments or markets. Derivatives are financial contracts based on an underlying or notional amount, require no initial
investment or an initial net investment that is smaller than would normally be required to have a similar response to changes in market factors, and require or permit net settlement. Derivatives contain various risks including the potential inability of the counterparty to fulfill their obligations under the terms of the contract, the potential for an illiquid secondary market, and/or the potential for market movements which expose the Fund to gains or losses in excess of the amounts shown in the Statements of Assets and Liabilities. Realized gain and loss and unrealized appreciation and depreciation on these contracts for the period are included in the Statements of Operations.
Certain or all Funds purchased or wrote exchange traded option contracts primarily to manage exposure to equity price risk. An option is a contract entitling the holder to purchase or sell a specific amount of shares or units of an asset or notional amount of a swap (swaption), at a specified price. When an option is purchased or written, an amount equal to the premium paid or received is recorded as an asset or liability, respectively. Upon exercise of an option, the acquisition cost or sales proceeds of the underlying investment is adjusted by any premium received or paid. Upon expiration of an option, any premium received or paid is recorded as a realized gain or loss. Upon closing an option other than through expiration or exercise, the difference between the premium received or paid and the cost to close the position is recorded as a realized gain or loss.
See Note 8 regarding other derivative information.
f. Index-Linked Notes
Certain or all Funds invest in index-linked notes. Index-linked notes are senior, unsecured, subordinated debt securities issued by a financial institution, and the value is based on the price movements of the underlying index. Index-linked notes are designed to provide investors access to the returns of various market benchmarks and intended to replicate the economic effects that would apply had the Fund directly purchased the underlying referenced asset or basket of assets. The risks of investing in index-linked notes include unfavorable price movements in the underlying index and the credit risk of the issuing financial institution. There may be no guarantee of a return of principal with index-linked notes and the appreciation potential may be limited. Index-linked notes may be more volatile and less liquid than other investments held by the Funds.
| | | | |
| | | |
110 | | Annual Report | | franklintempleton.com |
FRANKLIN CUSTODIAN FUNDS
NOTES TO FINANCIAL STATEMENTS
g. Equity-Linked Securities
Certain or all Funds invest in equity-linked securities. Equity-linked securities are hybrid financial instruments that generally combine both debt and equity characteristics into a single note form. Income received from equity-linked securities is recorded as realized gains in the Statements of Operations and may be based on the performance of an underlying equity security, an equity index, or an option position. The risks of investing in equity-linked securities include unfavorable price movements in the underlying security and the credit risk of the issuing financial institution. There may be no guarantee of a return of principal with equity-linked securities and the appreciation potential may be limited. Equity-linked securities may be more volatile and less liquid than other investments held by the Funds.
h. Securities Lending
Certain or all Funds participate in an agency based securities lending program to earn additional income. The Fund receives cash collateral against the loaned securities in an amount equal to at least 102% of the fair value of the loaned securities. Collateral is maintained over the life of the loan in an amount not less than 100% of the fair value of loaned securities, as determined at the close of Fund business each day; any additional collateral required due to changes in security values is delivered to the Fund on the next business day. The collateral is deposited into a joint cash account with other funds and is used to invest in a money market fund managed by Franklin Advisers, Inc., an affiliate of the Funds, and/or a joint repurchase agreement. The Fund may receive income from the investment of cash collateral, in addition to lending fees and rebates paid by the borrower. Income from securities loaned, net of fees paid to the securities lending agent and/or third-party vendor, is reported separately in the Statements of Operations. The Fund bears the market risk with respect to the collateral investment, securities loaned, and the risk that the agent may default on its obligations to the Fund. If the borrower defaults on its obligation to return the securities loaned, the Fund has the right to repurchase the securities in the open market using the collateral received. The securities lending agent has agreed to indemnify the Fund in the event of default by a third party borrower. At September 30, 2018, the Franklin Utilities Fund had no securities on loan.
i. Mortgage Dollar Rolls
Certain or all Funds enter into mortgage dollar rolls, typically on a TBA basis. Mortgage dollar rolls are agreements between the Fund and a financial institution where the Fund sells (or buys) mortgage-backed securities for delivery on a specified date and simultaneously contracts to repurchase (or sell) substantially similar (same type, coupon, and maturity) securities at a future date and at a predetermined price. Gains or losses are realized on the initial sale, and the difference between the repurchase price and the sale price is recorded as an unrealized gain or loss to the Fund upon entering into the mortgage dollar roll. In addition, the Fund may invest the cash proceeds that are received from the initial sale. During the period between the sale and repurchase, the Fund is not entitled to principal and interest paid on the mortgage backed securities. Transactions in mortgage dollar rolls are accounted for as purchases and sales and may result in an increase to the Fund’s portfolio turnover rate. The risks of mortgage dollar roll transactions include the potential inability of the counterparty to fulfill its obligations.
j. Senior Floating Rate Interests
Certain or all Funds invest in senior secured corporate loans that pay interest at rates which are periodically reset by reference to a base lending rate plus a spread. These base lending rates are generally the prime rate offered by a designated U.S. bank or the London InterBank Offered Rate (LIBOR). Senior secured corporate loans often require prepayment of principal from excess cash flows or at the discretion of the borrower. As a result, actual maturity may be substantially less than the stated maturity. Senior secured corporate loans in which the Funds invest are generally readily marketable, but may be subject to certain restrictions on resale.
k. Income and Deferred Taxes
It is each Fund’s policy to qualify as a regulated investment company under the Internal Revenue Code. Each Fund intends to distribute to shareholders substantially all of its taxable income and net realized gains to relieve it from federal income and excise taxes. As a result, no provision for U.S. federal income taxes is required.
The Funds may be subject to foreign taxation related to income received, capital gains on the sale of securities and certain foreign currency transactions in the foreign jurisdictions in which the Funds invest. Foreign taxes, if any, are recorded
| | | | |
| | | |
| franklintempleton.com | | Annual Report | | 111 |
FRANKLIN CUSTODIAN FUNDS
NOTES TO FINANCIAL STATEMENTS
1. Organization and Significant Accounting
Policies(continued)
k. Income and Deferred Taxes(continued)
based on the tax regulations and rates that exist in the foreign markets in which the Funds invest. When a capital gain tax is determined to apply, certain or all Funds record an estimated deferred tax liability in an amount that would be payable if the securities were disposed of on the valuation date.
As a result of several court cases, in certain countries across the European Union, certain or all Funds filed additional tax reclaims for previously withheld taxes on dividends earned in those countries (EU reclaims). These additional filings are subject to various administrative proceedings by the local jurisdictions’ tax authorities within the European Union, as well as a number of related judicial proceedings. Income recognized, if any, for EU reclaims is reflected as other income in the Statements of Operations and any related receivable, if any, is reflected as European Union tax reclaims in the Statements of Assets and Liabilities. When uncertainty exists as to the ultimate resolution of these proceedings, the likelihood of receipt of these EU reclaims, and the potential timing of payment, no amounts are reflected in the financial statements. For U.S. income tax purposes, EU reclaims received by the Funds, if any, reduce the amounts of foreign taxes Fund shareholders can use as tax credits in their individual income tax returns.
Each Fund may recognize an income tax liability related to its uncertain tax positions under U.S. GAAP when the uncertain tax position has a less than 50% probability that it will be sustained upon examination by the tax authorities based on its technical merits. As of September 30, 2018, each Fund has determined that no tax liability is required in its financial statements related to uncertain tax positions for any open tax years (or expected to be taken in future tax years). Open tax years are those that remain subject to examination and are based on the statute of limitations in each jurisdiction in which the Fund invests.
l. Security Transactions, Investment Income, Expenses and Distributions
Security transactions are accounted for on trade date. Realized gains and losses on security transactions are determined on a specific identification basis. Interest income and estimated expenses are accrued daily. Amortization of premium and
accretion of discount on debt securities are included in interest income. Paydown gains and losses are recorded separately on the Statements of Operations. Facility fees are recognized as income over the expected term of the loan. Dividend income is recorded on the ex-dividend date except for certain dividends from securities where the dividend rate is not available. In such cases, the dividend is recorded as soon as the information is received by the Funds. Distributions to shareholders are recorded on the ex-dividend date. Distributable earnings are determined according to income tax regulations (tax basis) and may differ from earnings recorded in accordance with U.S. GAAP. These differences may be permanent or temporary. Permanent differences are reclassified among capital accounts to reflect their tax character. These reclassifications have no impact on net assets or the results of operations. Temporary differences are not reclassified, as they may reverse in subsequent periods.*
Common expenses incurred by the Trust are allocated among the Funds based on the ratio of net assets of each Fund to the combined net assets of the Trust or based on the ratio of number of shareholders of each Fund to the combined number of shareholders of the Trust. Fund specific expenses are charged directly to the Fund that incurred the expense.
Realized and unrealized gains and losses and net investment income, excluding class specific expenses, are allocated daily to each class of shares based upon the relative proportion of net assets of each class. Differences in per share distributions by class are generally due to differences in class specific expenses.
m. Accounting Estimates
The preparation of financial statements in accordance with U.S. GAAP requires management to make estimates and assumptions that affect the reported amounts of assets and liabilities at the date of the financial statements and the amounts of income and expenses during the reporting period. Actual results could differ from those estimates.
n. Guarantees and Indemnifications
Under the Trust’s organizational documents, its officers and trustees are indemnified by the Trust against certain liabilities arising out of the performance of their duties to the Trust. Additionally, in the normal course of business, the Trust, on behalf of the Funds, enters into contracts with service providers that contain general indemnification clauses. The Trust’s maximum exposure under these arrangements is unknown as
| | | | |
| | | |
112 | | Annual Report | | franklintempleton.com |
FRANKLIN CUSTODIAN FUNDS
NOTES TO FINANCIAL STATEMENTS
this would involve future claims that may be made against the Trust that have not yet occurred. Currently, the Trust expects the risk of loss to be remote.
*Effective with the current reporting period, it is no longer required to present certain line items on the Statements of Changes in Net Assets. Such disclosure changes are included in the Statements of Changes in Net Assets, therefore prior period amounts are presented below.
For the year ended September 30, 2017, distributions to shareholders were as follows:
| | | | | | | | | | | | |
| | | Franklin DynaTech Fund | | | Franklin Growth Fund | | | Franklin Income Fund | |
Distributions from net investment income: | | | | | | | | | | | | |
Class A | | $ | — | | | $ | (36,895,906 | ) | | $ | — | |
Class A1 | | | — | | | | — | | | | (2,378,392,172 | ) |
Class C | | | — | | | | — | | | | (1,087,030,360 | ) |
Class R | | | — | | | | (1,230,882 | ) | | | (18,864,554 | ) |
Class R6 | | | — | | | | (11,177,576 | ) | | | (95,303,179 | ) |
Advisor Class | | | — | | | | (15,699,120 | ) | | | (524,726,253 | ) |
Distributions from net realized gains: | | | | | | | | | | | | |
Class A | | | (67,256,053 | ) | | | (234,479,371 | ) | | | — | |
Class C | | | (11,758,906 | ) | | | (28,670,653 | ) | | | — | |
Class R | | | (1,284,067 | ) | | | (14,987,347 | ) | | | — | |
Class R6 | | | (11,046,724 | ) | | | (38,880,082 | ) | | | — | |
Advisor Class | | | (7,824,210 | ) | | | (64,547,148 | ) | | | — | |
| | | |
| | | Franklin U.S. Government
Securities Fund | | | Franklin Utilities Fund | | | | |
Distributions from net investment income: | | | | | | | | | | | | |
Class A1 | | $ | (117,543,709 | ) | | $ | (108,430,003 | ) | | | | |
Class C | | | (23,194,188 | ) | | | (21,699,670 | ) | | | | |
Class R | | | (1,294,613 | ) | | | (2,242,163 | ) | | | | |
Class R6 | | | (16,694,015 | ) | | | (6,694,467 | ) | | | | |
Advisor Class | | | (25,402,172 | ) | | | (23,372,926 | ) | | | | |
Distributions from net realized gains: | | | | | | | | | | | | |
Class A1 | | | — | | | | (2,346,125 | ) | | | | |
Class C | | | — | | | | (595,960 | ) | | | | |
Class R | | | — | | | | (58,199 | ) | | | | |
Class R6 | | | — | | | | (124,605 | ) | | | | |
Advisor Class | | | — | | | | (418,502 | ) | | | | |
For the year ended September 30, 2017, undistributed net investment income/accumulated net investment loss/distribution in excess of net investment income included in net assets were as follows:
| | | | | | | | | | | | | | | | | | | | | | |
| Fund | | Undistributed net investment income | | | Distribution in excess of net investment income | | | Accumulated net investment loss | |
Franklin DynaTech Fund | | | | $ | — | | | | | | | $ | — | | | | | | | $ | (8,477,093 | ) |
Franklin Growth Fund | | | | $ | 37,243,783 | | | | | | | $ | — | | | | | | | $ | — | |
Franklin Income Fund | | | | $ | — | | | | | | | $ | (74,871,430 | ) | | | | | | $ | — | |
Franklin U.S. Government Securities Fund | | | | $ | — | | | | | | | $ | (1,086,491 | ) | | | | | | $ | — | |
Franklin Utilities Fund | | | | $ | 19,836,444 | | | | | | | $ | — | | | | | | | $ | — | |
| | | | |
| | | |
| franklintempleton.com | | Annual Report | | 113 |
FRANKLIN CUSTODIAN FUNDS
NOTES TO FINANCIAL STATEMENTS
2. Shares of Beneficial Interest
At September 30, 2018, there were an unlimited number of shares authorized (without par value). Transactions in the Funds’ shares were as follows:
| | | | | | | | | | | | | | | | |
| | | Franklin DynaTech Fund | | | Franklin Growth Fund | |
| | | Shares | | | Amount | | | Shares | | | Amount | |
Class A Shares: | | | | | | | | | | | | | | | | |
Year ended September 30, 2018 | | | | | | | | | | | | | | | | |
Shares sold | | | 14,831,366 | | | $ | 1,079,518,288 | | | | 11,280,920 | | | $ | 1,109,298,387 | |
Shares issued in reinvestment of distributions | | | 649,398 | | | | 42,412,146 | | | | 2,241,557 | | | | 209,293,239 | |
Shares redeemed | | | (8,972,810 | ) | | | (642,264,131 | ) | | | (17,341,818 | ) | | | (1,702,739,264 | ) |
Net increase (decrease) | | | 6,507,954 | | | $ | 479,666,303 | | | | (3,819,341 | ) | | $ | (384,147,638 | ) |
Year ended September 30, 2017 | | | | | | | | | | | | | | | | |
Shares sold | | | 9,362,267 | | | $ | 523,007,968 | | | | 14,162,348 | | | $ | 1,174,286,495 | |
Shares issued in reinvestment of distributions | | | 1,325,934 | | | | 62,305,651 | | | | 3,311,489 | | | | 249,918,049 | |
Shares redeemed | | | (11,882,951 | ) | | | (643,932,670 | ) | | | (26,713,031 | ) | | | (2,199,267,441 | ) |
Net increase (decrease) | | | (1,194,750 | ) | | $ | (58,619,051 | ) | | | (9,239,194 | ) | | $ | (775,062,897 | ) |
Class C Shares: | | | | | | | | | | | | | | | | |
Year ended September 30, 2018 | | | | | | | | | | | | | | | | |
Shares sold | | | 3,541,513 | | | $ | 216,395,204 | | | | 2,015,126 | | | $ | 182,547,090 | |
Shares issued in reinvestment of distributions | | | 145,521 | | | | 8,019,671 | | | | 273,473 | | | | 23,494,117 | |
Shares redeemed | | | (1,708,778 | ) | | | (103,307,237 | ) | | | (2,558,228 | ) | | | (232,045,221 | ) |
Net increase (decrease) | | | 1,978,256 | | | $ | 121,107,638 | | | | (269,629 | ) | | $ | (26,004,014 | ) |
Year ended September 30, 2017 | | | | | | | | | | | | | | | | |
Shares sold | | | 1,608,949 | | | $ | 76,923,384 | | | | 2,061,309 | | | $ | 157,211,473 | |
Shares issued in reinvestment of distributions | | | 278,097 | | | | 11,146,149 | | | | 378,292 | | | | 26,423,730 | |
Shares redeemed | | | (2,017,425 | ) | | | (93,534,438 | ) | | | (3,058,986 | ) | | | (234,216,142 | ) |
| | | | |
Net increase (decrease) | | | (130,379 | ) | | $ | (5,464,905 | ) | | | (619,385 | ) | | $ | (50,580,939 | ) |
Class R Shares: | | | | | | | | | | | | | | | | |
Year ended September 30, 2018 | | | | | | | | | | | | | | | | |
Shares sold | | | 728,247 | | | $ | 52,135,875 | | | | 646,523 | | | $ | 63,137,515 | |
Shares issued in reinvestment of distributions | | | 14,081 | | | | 895,541 | | | | 137,299 | | | | 12,777,077 | |
Shares redeemed | | | (304,303 | ) | | | (20,984,785 | ) | | | (1,477,753 | ) | | | (144,767,945 | ) |
Net increase (decrease) | | | 438,025 | | | $ | 32,046,631 | | | | (693,931 | ) | | $ | (68,853,353 | ) |
Year ended September 30, 2017 | | | | | | | | | | | | | | | | |
Shares sold | | | 267,584 | | | $ | 14,852,690 | | | | 912,197 | | | $ | 76,231,533 | |
Shares issued in reinvestment of distributions | | | 27,272 | | | | 1,251,781 | | | | 210,204 | | | | 15,813,630 | |
Shares redeemed | | | (280,176 | ) | | | (14,785,028 | ) | | | (1,629,437 | ) | | | (135,607,303 | ) |
Net increase (decrease) | | | 14,680 | | | $ | 1,319,443 | | | | (507,036 | ) | | $ | (43,562,140 | ) |
| | | | |
| | | |
114 | | Annual Report | | franklintempleton.com |
FRANKLIN CUSTODIAN FUNDS
NOTES TO FINANCIAL STATEMENTS
| | | | | | | | | | | | | | |
| | | Franklin DynaTech Fund | | | Franklin Growth Fund |
| | | Shares | | | Amount | | | Shares | | | Amount |
Class R6 Shares: | | | | | | | | | | | | | | |
Year ended September 30, 2018 | | | | | | | | | | | | | | |
Shares sold | | | 17,913,232 | | | | $1,294,331,619 | | | | 11,217,056 | | | $ 1,090,829,917 |
Shares issued in reinvestment of distributions | | | 246,188 | | | | 16,654,639 | | | | 664,503 | | | 62,044,590 |
Shares redeemed in-kind (Note 11) | | | — | | | | — | | | | (596,870 | ) | | (64,204,995) |
Shares redeemed | | | (5,146,068 | ) | | | (398,067,873 | ) | | | (5,377,348 | ) | | (531,915,647) |
| | | |
| | | | |
Net increase (decrease) | | | 13,013,352 | | | | $ 912,918,385 | | | | 5,907,341 | | | $ 556,753,865 |
| | | |
| | | | |
Year ended September 30, 2017 | | | | | | | | | | | | | | |
Shares sold | | | 1,671,232 | | | | $ 92,675,376 | | | | 6,556,890 | | | $ 547,502,376 |
Shares issued in reinvestment of distributions | | | 228,050 | | | | 11,046,724 | | | | 613,371 | | | 46,278,808 |
Shares redeemed | | | (1,597,410 | ) | | | (92,487,214 | ) | | | (4,499,648 | ) | | (378,570,163) |
| | | |
| | | | |
Net increase (decrease) | | | 301,872 | | | | $ 11,234,886 | | | | 2,670,613 | | | $ 215,211,021 |
| | | |
| | | | |
Advisor Class Shares: | | | | | | | | | | | | | | |
Year ended September 30, 2018 | | | | | | | | | | | | | | |
Shares sold | | | 5,333,633 | | | | $ 398,259,942 | | | | 7,218,349 | | | $ 715,181,948 |
Shares issued in reinvestment of distributions | | | 79,332 | | | | 5,323,142 | | | | 772,474 | | | 72,226,322 |
Shares redeemed | | | (8,277,537 | ) | | | (560,428,615 | ) | | | (9,391,141 | ) | | (913,663,262) |
| | | |
| | | | |
Net increase (decrease) | | | (2,864,572 | ) | | | $ (156,845,531 | ) | | | (1,400,318 | ) | | $ (126,254,992) |
| | | |
| | | | |
Year ended September 30, 2017 | | | | | | | | | | | | | | |
Shares sold | | | 9,006,379 | | | | $ 514,535,401 | | | | 11,853,956 | | | $ 980,377,887 |
Shares issued in reinvestment of distributions | | | 155,933 | | | | 7,506,593 | | | | 998,990 | | | 75,473,718 |
Shares redeemed | | | (1,979,331 | ) | | | (111,219,398 | ) | | | (7,733,627 | ) | | (636,836,942) |
| | | |
| | | | |
Net increase (decrease) | | | 7,182,981 | | | | $ 410,822,596 | | | | 5,119,319 | | | $ 419,014,663 |
| | | |
| | | | | | | | | | | | |
| | | Franklin Income Fund | | | Franklin U.S. Government Securities Fund |
| | | Shares | | Amount | | | Shares | | | Amount |
| | | | |
Class A Shares: | | | | | | | | | | | | |
Year ended September 30, 2018a | | | | | | | | | | | | |
Shares sold | | 47,757,868 | | $ | 110,955,834 | | | | 854,097 | | | $ 5,012,817 |
Shares issued in reinvestment of distributions | | — | | | — | | | | 1,534 | | | 8,990 |
Shares redeemed | | (1,647,742) | | | (3,831,661 | ) | | | (91,919 | ) | | (538,723) |
| | |
| | | | |
Net increase (decrease) | | 46,110,126 | | $ | 107,124,173 | | | | 763,712 | | | $ 4,483,084 |
| | |
| | | | |
Class A1 Shares: | | | | | | | | | | | | |
Year ended September 30, 2018 | | | | | | | | | | | | |
Shares sold | | 1,654,073,714 | | $ | 3,876,349,005 | | | | 91,619,493 | | | $ 551,601,916 |
Shares issued in reinvestment of distributions | | 897,284,705 | | | 2,093,922,360 | | | | 14,259,224 | | | 84,951,032 |
Shares redeemed | | (3,507,769,889) | | | (8,201,911,014 | ) | | | (160,829,797 | ) | | (962,646,389) |
| | |
| | | | |
Net increase (decrease) | | (956,411,470) | | $ | (2,231,639,649 | ) | | | (54,951,080 | ) | | $ (326,093,441) |
| | |
| | | | |
Year ended September 30, 2017 | | | | | | | | | | | | |
Shares sold | | 2,326,579,530 | | $ | 5,409,263,110 | | | | 88,315,020 | | | $ 547,846,708 |
Shares issued in reinvestment of distributions | | 942,817,065 | | | 2,180,859,371 | | | | 16,155,083 | | | 99,906,202 |
Shares redeemed | | (4,077,035,296) | | | (9,459,733,020 | ) | | | (187,133,417 | ) | | (1,159,721,046) |
| | |
| | | | |
Net increase (decrease) | | (807,638,701) | | $ | (1,869,610,539 | ) | | | (82,663,314 | ) | | $ (511,968,136) |
| | |
| | | | |
| | | |
| franklintempleton.com | | Annual Report | | 115 |
FRANKLIN CUSTODIAN FUNDS
NOTES TO FINANCIAL STATEMENTS
2. Shares of Beneficial Interest (continued)
| | | | | | | | | | | | | | | | |
| | | Franklin Income Fund | | | Franklin U.S. Government Securities Fund | |
| | | Shares | | | Amount | | | Shares | | | Amount | |
| | | | |
Class M Shares:b | | | | | | | | | | | | | | | | |
Year ended September 30, 2018c | | | | | | | | | | | | | | | | |
Shares sold | | | 2,058 | | | $ | 5,000 | | | | 829 | | | $ | 5,000 | |
Shares redeemed | | | (2,058 | ) | | | (4,771 | ) | | | (829 | ) | | | (4,892 | ) |
| | | | |
| | | | |
Net increase (decrease) | | | — | | | $ | 229 | | | | — | | | $ | 108 | |
| | | | |
| | | | |
Class C Shares: | | | | | | | | | | | | | | | | |
Year ended September 30, 2018 | | | | | | | | | | | | | | | | |
Shares sold | | | 582,283,439 | | | $ | 1,382,849,638 | | | | 7,433,473 | | | $ | 44,268,648 | |
Shares issued in reinvestment of distributions | | | 377,996,060 | | | | 893,922,732 | | | | 2,628,467 | | | | 15,553,873 | |
Shares redeemed | | | (2,018,663,790 | ) | | | (4,782,175,252 | ) | | | (42,755,854 | ) | | | (254,172,773 | ) |
| | | | |
| | | | |
Net increase (decrease) | | | (1,058,384,291 | ) | | $ | (2,505,402,882 | ) | | | (32,693,914 | ) | | $ | (194,350,252 | ) |
| | | | |
| | | | |
Year ended September 30, 2017 | | | | | | | | | | | | | | | | |
Shares sold | | | 911,767,616 | | | $ | 2,142,426,105 | | | | 14,550,091 | | | $ | 89,797,342 | |
Shares issued in reinvestment of distributions | | | 413,154,940 | | | | 967,759,461 | | | | 3,401,372 | | | | 20,890,746 | |
Shares redeemed | | | (2,297,260,192 | ) | | | (5,403,840,283 | ) | | | (50,952,421 | ) | | | (313,543,423 | ) |
| | | | |
| | | | |
Net increase (decrease) | | | (972,337,636 | ) | | $ | (2,293,654,717 | ) | | | (33,000,958 | ) | | $ | (202,855,335 | ) |
| | | | |
| | | | |
Class R Shares: | | | | | | | | | | | | | | | | |
Year ended September 30, 2018 | | | | | | | | | | | | | | | | |
Shares sold | | | 22,303,807 | | | $ | 51,304,961 | | | | 1,311,996 | | | $ | 7,841,271 | |
Shares issued in reinvestment of distributions | | | 6,461,113 | | | | 14,805,328 | | | | 144,887 | | | | 862,596 | |
Shares redeemed | | | (52,753,780 | ) | | | (121,698,325 | ) | | | (2,397,338 | ) | | | (14,338,539 | ) |
| | | | |
| | | | |
Net increase (decrease) | | | (23,988,860 | ) | | $ | (55,588,036 | ) | | | (940,455 | ) | | $ | (5,634,672 | ) |
| | | | |
| | | | |
Year ended September 30, 2017 | | | | | | | | | | | | | | | | |
Shares sold | | | 29,390,834 | | | $ | 67,078,836 | | | | 2,216,203 | | | $ | 13,791,777 | |
Shares issued in reinvestment of distributions | | | 7,822,410 | | | | 17,773,811 | | | | 199,172 | | | | 1,231,596 | |
Shares redeemed | | | (62,623,063 | ) | | | (143,062,182 | ) | | | (5,574,593 | ) | | | (34,456,445 | ) |
| | | | |
| | | | |
Net increase (decrease) | | | (25,409,819 | ) | | $ | (58,209,535 | ) | | | (3,159,218 | ) | | $ | (19,433,072 | ) |
| | | | |
| | | | |
Class R6 Shares: | | | | | | | | | | | | | | | | |
Year ended September 30, 2018 | | | | | | | | | | | | | | | | |
Shares sold | | | 241,446,374 | | | $ | 566,628,288 | | | | 61,412,244 | | | $ | 370,212,496 | |
Shares issued in reinvestment of distributions | | | 46,333,019 | | | | 107,151,115 | | | | 3,488,682 | | | | 20,828,159 | |
Shares redeemed | | | (157,691,667 | ) | | | (364,327,918 | ) | | | (19,140,378 | ) | | | (114,420,880 | ) |
| | | | |
| | | | |
Net increase (decrease) | | | 130,087,726 | | | $ | 309,451,485 | | | | 45,760,548 | | | $ | 276,619,775 | |
| | | | |
| | | | |
Year ended September 30, 2017 | | | | | | | | | | | | | | | | |
Shares sold | | | 45,238,070 | | | $ | 104,748,463 | | | | 7,989,421 | | | $ | 49,592,166 | |
Shares issued in reinvestment of distributions | | | 39,448,905 | | | | 90,547,964 | | | | 2,685,559 | | | | 16,667,699 | |
Shares redeemed | | | (98,936,238 | ) | | | (227,642,444 | ) | | | (36,176,783 | ) | | | (225,322,538 | ) |
| | | | |
| | | | |
Net increase (decrease) | | | (14,249,263 | ) | | $ | (32,346,017 | ) | | | (25,501,803 | ) | | $ | (159,062,673 | ) |
| | | | |
| | | | |
| | | |
116 | | Annual Report | | franklintempleton.com |
FRANKLIN CUSTODIAN FUNDS
NOTES TO FINANCIAL STATEMENTS
| | | | | | | | | | | | | | | | |
| | | Franklin Income Fund | | Franklin U.S. Government Securities Fund | |
| | | | |
| | | Shares | | Amount | | | Shares | | | Amount |
| | | | |
Advisor Class Shares: | | | | | | | | | | | | | | | | |
Year ended September 30, 2018 | | | | | | | | | | | | | | | | |
Shares sold | | | 1,216,256,316 | | | $ | 2,822,041,342 | | | | 40,864,155 | | | $ | 245,204,402 | |
Shares issued in reinvestment of distributions | | | 227,374,647 | | | | 525,980,680 | | | | 3,544,600 | | | | 21,175,930 | |
Shares redeemed | | | (1,442,679,003 | ) | | | (3,349,547,760 | ) | | | (60,767,806 | ) | | | (366,985,904 | ) |
| | | | |
| | | | |
Net increase (decrease) | | | 951,960 | | | $ | (1,525,738 | ) | | | (16,359,051 | ) | | $ | (100,605,572 | ) |
| | | | |
| | | | |
Year ended September 30, 2017 | | | | | | | | | | | | | | | | |
Shares sold | | | 2,163,722,071 | | | $ | 4,992,265,330 | | | | 63,438,736 | | | $ | 394,713,677 | |
Shares issued in reinvestment of distributions | | | 201,275,423 | | | | 462,952,027 | | | | 3,720,638 | | | | 23,067,829 | |
Shares redeemed | | | (1,099,054,643 | ) | | | (2,529,240,454 | ) | | | (41,027,662 | ) | | | (255,096,468 | ) |
| | | | |
| | | | |
Net increase (decrease) | | | 1,265,942,851 | | | $ | 2,925,976,903 | | | | 26,131,712 | | | $ | 162,685,038 | |
| | | | |
aFor the period September 10, 2018 (effective date) to September 30, 2018.
bClass M was closed to investors on June 8, 2018.
cFor the period January 25, 2018 (effective date) to June 8, 2018.
| | | | | | | | |
| | | Franklin Utilities Fund |
| | | | |
| | | Shares | | Amount |
| | |
Class A Shares: | | | | | | | | |
Year ended September 30, 2018a | | | | | | | | |
Shares sold | | | 192,333 | | | $ | 3,622,735 | |
Shares redeemed | | | (2,829 | ) | | | (52,133 | ) |
| | | | |
| | |
Net increase (decrease) | | | 189,504 | | | $ | 3,570,602 | |
| | | | |
| | |
Class A1 Shares: | | | | | | | | |
Year ended September 30, 2018 | | | | | | | | |
Shares sold | | | 24,701,743 | | | $ | 456,163,799 | |
Shares issued in reinvestment of distributions | | | 8,528,408 | | | | 161,849,791 | |
Shares redeemed | | | (55,450,300 | ) | | | (1,018,710,628 | ) |
| | | | |
| | |
Net increase (decrease) | | | (22,220,149 | ) | | $ | (400,697,038 | ) |
| | | | |
| | |
Year ended September 30, 2017 | | | | | | | | |
Shares sold | | | 33,746,244 | | | $ | 620,365,753 | |
Shares issued in reinvestment of distributions | | | 5,477,068 | | | | 100,790,068 | |
Shares redeemed | | | (55,404,028 | ) | | | (1,010,827,402 | ) |
| | | | |
| | |
Net increase (decrease) | | | (16,180,716 | ) | | $ | (289,671,581 | ) |
| | | | |
| | |
Class M Shares:b | | | | | | | | |
Year ended September 30, 2018c | | | | | | | | |
Shares sold | | | 276 | | | $ | 5,000 | |
Shares redeemed | | | (276 | ) | | | (4,738 | ) |
| | | | |
| | |
Net increase (decrease) | | | — | | | $ | 262 | |
| | | | |
| | | | |
| | | |
| franklintempleton.com | | Annual Report | | 117 |
FRANKLIN CUSTODIAN FUNDS
NOTES TO FINANCIAL STATEMENTS
2. Shares of Beneficial Interest (continued)
| | | | | | | | |
| | | Franklin
Utilities Fund | |
| | | Shares | | | Amount | |
| |
| | |
Class C Shares: | | | | | | | | |
Year ended September 30, 2018 | | | | | | | | |
Shares sold | | | 3,577,672 | | | $ | 66,427,917 | |
Shares issued in reinvestment of distributions | | | 1,833,349 | | | | 34,761,364 | |
Shares redeemed | | | (11,911,335 | ) | | | (216,978,128) | |
| | | | |
Net increase (decrease) | | | (6,500,314 | ) | | $ | (115,788,847) | |
| | | | |
Year ended September 30, 2017 | | | | | | | | |
Shares sold | | | 5,503,753 | | | $ | 100,721,777 | |
Shares issued in reinvestment of distributions | | | 1,083,738 | | | | 19,834,562 | |
Shares redeemed | | | (15,075,669 | ) | | | (276,809,082) | |
| | | | |
Net increase (decrease) | | | (8,488,178 | ) | | $ | (156,252,743) | |
| | | | |
Class R Shares: | | | | | | | | |
Year ended September 30, 2018 | | | | | | | | |
Shares sold | | | 977,147 | | | $ | 17,937,233 | |
Shares issued in reinvestment of distributions | | | 181,427 | | | | 3,446,022 | |
Shares redeemed | | | (2,178,750 | ) | | | (39,843,759) | |
| | | | |
Net increase (decrease) | | | (1,020,176 | ) | | $ | (18,460,504) | |
| | | | |
Year ended September 30, 2017 | | | | | | | | |
Shares sold | | | 1,609,833 | | | $ | 29,215,041 | |
Shares issued in reinvestment of distributions | | | 121,708 | | | | 2,225,505 | |
Shares redeemed | | | (2,594,910 | ) | | | (47,079,268) | |
| | | | |
Net increase (decrease) | | | (863,369 | ) | | $ | (15,638,722) | |
| | | | |
Class R6 Shares: | | | | | | | | |
Year ended September 30, 2018 | | | | | | | | |
Shares sold | | | 2,535,167 | | | $ | 47,060,404 | |
Shares issued in reinvestment of distributions | | | 576,101 | | | | 10,987,844 | |
Shares redeemed | | | (3,356,319 | ) | | | (62,348,594) | |
| | | | |
Net increase (decrease) | | | (245,051 | ) | | $ | (4,300,346) | |
| | | | |
Year ended September 30, 2017 | | | | | | | | |
Shares sold | | | 3,378,291 | | | $ | 61,987,731 | |
Shares issued in reinvestment of distributions | | | 367,045 | | | | 6,819,073 | |
Shares redeemed | | | (3,469,190 | ) | | | (64,510,956) | |
| | | | |
Net increase (decrease) | | | 276,146 | | | $ | 4,295,848 | |
| | | | |
| | | | |
| | | |
118 | | Annual Report | | franklintempleton.com |
FRANKLIN CUSTODIAN FUNDS
NOTES TO FINANCIAL STATEMENTS
| | | | | | |
| | | Franklin Utilities Fund |
| | | Shares | | | Amount |
| | |
Advisor Class Shares: | | | | | | |
Year ended September 30, 2018 | | | | | | |
Shares sold | | | 14,395,975 | | | $ 268,529,702 |
Shares issued in reinvestment of distributions | | | 2,102,341 | | | 40,138,480 |
Shares redeemed | | | (17,010,198 | ) | | (312,598,481) |
| | |
Net increase (decrease) | | | (511,882 | ) | | $ (3,930,299) |
| | |
Year ended September 30, 2017 | | | | | | |
Shares sold | | | 21,268,414 | | | $ 394,510,240 |
Shares issued in reinvestment of distributions | | | 1,182,297 | | | 22,042,770 |
Shares redeemed | | | (14,639,265 | ) | | (268,017,582) |
| | |
Net increase (decrease) | | | 7,811,446 | | | $ 148,535,428 |
aFor the period September 10, 2018 (effective date) to September 30, 2018.
bClass M was closed to investors on June 8, 2018.
cFor the period January 25, 2018 (effective date) to June 8, 2018.
3. Transactions with Affiliates
Franklin Resources, Inc. is the holding company for various subsidiaries that together are referred to as Franklin Templeton Investments. Certain officers and trustees of the Trust are also officers and/or directors of the following subsidiaries:
| | | | |
| Subsidiary | | Affiliation | | |
| | |
Franklin Advisers, Inc. (Advisers) | | Investment manager | | |
| | |
Franklin Templeton Services, LLC (FT Services) | | Administrative manager | | |
| | |
Franklin Templeton Distributors, Inc. (Distributors) | | Principal underwriter | | |
| | |
Franklin Templeton Investor Services, LLC (Investor Services) | | Transfer agent | | |
| | | | |
| | | |
| franklintempleton.com | | Annual Report | | 119 |
FRANKLIN CUSTODIAN FUNDS
NOTES TO FINANCIAL STATEMENTS
3. Transactions with Affiliates(continued)
a. Management Fees
Franklin Income Fund and Franklin Utilities Fund pay an investment management fee to Advisers based on themonth-end net assets of each of the Funds as follows:
| | |
| Annualized Fee Rate | | Net Assets |
0.625% | | Up to and including $100 million |
0.500% | | Over $100 million, up to and including $250 million |
0.450% | | Over $250 million, up to and including $7.5 billion |
0.440% | | Over $7.5 billion, up to and including $10 billion |
0.430% | | Over $10 billion, up to and including $12.5 billion |
0.420% | | Over $12.5 billion, up to and including $15 billion |
0.400% | | Over $15 billion, up to and including $17.5 billion |
0.380% | | Over $17.5 billion, up to and including $20 billion |
0.360% | | Over $20 billion, up to and including $35 billion |
0.355% | | Over $35 billion, up to and including $50 billion |
0.350% | | Over $50 billion, up to and including $65 billion |
0.345% | | Over $65 billion, up to and including $80 billion |
0.340% | | In excess of $80 billion |
Franklin DynaTech Fund, Franklin Growth Fund and Franklin U.S. Government Securities Fund pay an investment management fee to Advisers based on themonth-end net assets of each of the Funds as follows:
| | |
| Annualized Fee Rate | | Net Assets |
|
0.625% | | Up to and including $100 million |
|
0.500% | | Over $100 million, up to and including $250 million |
|
0.450% | | Over $250 million, up to and including $7.5 billion |
|
0.440% | | Over $7.5 billion, up to and including $10 billion |
|
0.430% | | Over $10 billion, up to and including $12.5 billion |
|
0.420% | | Over $12.5 billion, up to and including $15 billion |
|
0.400% | | Over $15 billion, up to and including $17.5 billion |
|
0.380% | | Over $17.5 billion, up to and including $20 billion |
|
0.360% | | Over $20 billion, up to and including $35 billion |
|
0.355% | | Over $35 billion, up to and including $50 billion |
|
0.350% | | In excess of $50 billion |
|
For the year ended September 30, 2018, each Fund’s gross effective investment management fee rate based on average daily net assets was as follows:
| | | | | | | | | | | | | | | | | | |
Franklin
DynaTech Fund | | | Franklin Growth Fund | | | Franklin
Income Fund | | | Franklin
U.S. Government Securities Fund | | | Franklin
Utilities Fund | |
| 0.462% | | | | 0.442% | | | | 0.371% | | | | 0.453% | | | | 0.455% | |
| | | | |
| | | |
120 | | Annual Report | | franklintempleton.com |
FRANKLIN CUSTODIAN FUNDS
NOTES TO FINANCIAL STATEMENTS
b. Administrative Fees
Under an agreement with Advisers, FT Services provides administrative services to the Funds. The fee is paid by Advisers based on each of the Funds’ average daily net assets, and is not an additional expense of the Funds.
c. Distribution Fees
The Board has adopted distribution plans for each share class, with the exception of Class R6 and Advisor Class shares, pursuant to Rule12b-1 under the 1940 Act. Under the Funds’ Class A and A1 reimbursement distribution plans, the Funds reimburse Distributors for costs incurred in connection with the servicing, sale and distribution of each Fund’s shares up to the maximum annual plan rate for each class. Under the Class A and A1 reimbursement distribution plans, costs exceeding the maximum for the current plan year cannot be reimbursed in subsequent periods. In addition, under the Funds’ Class C and R compensation distribution plans, the Funds pay Distributors for costs incurred in connection with the servicing, sale and distribution of each Fund’s shares up to the maximum annual plan rate for each class. The plan year, for purposes of monitoring compliance with the maximum annual plan rates, is February 1 through January 31 for each Fund.
The maximum annual plan rates, based on the average daily net assets, for each class, are as follows:
| | | | | | | | | | | | | | | | | | |
| | | Franklin
DynaTech Fund | | | Franklin
Growth Fund | | | Franklin
Income Fund | | | Franklin
U.S. Government
Securities Fund | | | Franklin
Utilities Fund |
| | | | | |
Reimbursement Plans: | | | | | | | | | | | | | | | | | | |
Class A | | | 0.25% | | | | 0.25% | | | | 0.25% | | | | 0.25% | | | 0.25% |
Class A1 | | | —% | | | | —% | | | | 0.15% | | | | 0.15% | | | 0.15% |
| | | | | |
Compensation Plans: | | | | | | | | | | | | | | | | | | |
Class C | | | 1.00% | | | | 1.00% | | | | 0.65% | | | | 0.65% | | | 0.65% |
Class R | | | 0.50% | | | | 0.50% | | | | 0.50% | | | | 0.50% | | | 0.50% |
|
| d. Sales Charges/Underwriting Agreements |
|
| Front-end sales charges and contingent deferred sales charges (CDSC) do not represent expenses of the Funds. These charges are deducted from the proceeds of sales of fund shares prior to investment or from redemption proceeds prior to remittance, as applicable. Distributors has advised the Funds of the following commission transactions related to the sales and redemptions of the Funds’ shares for the year: |
| | | | | |
| | | Franklin
DynaTech Fund | | | Franklin
Growth Fund | | | Franklin Income Fund | | | Franklin
U.S. Government
Securities Fund | | | Franklin
Utilities Fund |
| | | | | |
Sales charges retained net of commissions paid to unaffiliated brokers/dealers | | $ | 1,967,161 | | | $ | 2,000,188 | | | $ | 9,031,023 | | | $ | 324,323 | | | $406,279 |
| | | | | |
CDSC retained | | $ | 70,764 | | | $ | 82,594 | | | $ | 983,947 | | | $ | 43,517 | | | $ 65,162 |
Effective September 10, 2018, the Board approved changes to certainfront-end sales charges and dealer commissions on Class A and A1 shares. Further details are disclosed in the Funds’ Prospectus.
e. Transfer Agent Fees
Each class of shares pays transfer agent fees to Investor Services for its performance of shareholder servicing obligations. Effective November 1, 2017, the fees are based on an annualized asset based fee of 0.02% plus a transaction based fee. Prior to November 1, 2017, the fees were account based fees that varied based on fund or account type. In addition, each class reimburses Investor
| | | | |
| | | |
| franklintempleton.com | | Annual Report | | 121 |
FRANKLIN CUSTODIAN FUNDS
NOTES TO FINANCIAL STATEMENTS
3. Transactions with Affiliates(continued)
e. Transfer Agent Fees(continued)
Services for out of pocket expenses incurred and, except for Class R6, reimburses shareholder servicing fees paid to third parties. These fees are allocated daily based upon their relative proportion of such classes’ aggregate net assets. Class R6 pays Investor Services transfer agent fees specific to that class.
For the year ended September 30, 2018, the Funds paid transfer agent fees as noted in the Statements of Operations of which the following amounts were retained by Investor Services:
| | | | | | | | | | | | | | | | | | | | |
| | | Franklin DynaTech Fund | | | Franklin Growth Fund | | | Franklin Income Fund | | | Franklin U.S. Government Securities Fund | | | Franklin Utilities Fund | |
| | | | | |
Transfer agent fees | | | $2,498,796 | | | | $6,502,207 | | | | $27,704,796 | | | | $3,393,589 | | | | $2,931,859 | |
f. Investments in Affiliated Management Investment Companies
Certain or all Funds invest in one or more affiliated management investment companies for purposes other than exercising a controlling influence over the management or policies. Management fees paid by the Funds are waived on assets invested in the affiliated management investment companies, as noted in the Statements of Operations, in an amount not to exceed the management and administrative fees paid directly or indirectly by each affiliate. During the year ended September 30, 2018, investments in affiliated management investment companies were as follows:
| | | | | | | | | | | | | | | | | | | | | | | | | | | | |
| | | Number of Shares Held at Beginning of Year | | | Gross Additions | | | Gross Reductions | | | Number of Shares
Held at End of Year | | | Value at End of Year | | | Dividend Income | | | Realized Gain (Loss) | | Net Change in Unrealized Appreciation (Depreciation) |
Franklin DynaTech Fund | | | | | | | | | | | | | | | | | | | | | | | | | |
Non-Controlled Affiliates | | | | | | | | | | | | | | | | | | | | | | | | | |
Institutional Fiduciary Trust Money Market Portfolio, 1.69% | | | 90,584,258 | | | | 1,497,776,816 | | | | (1,463,219,549 | ) | | | 125,141,525 | | | $ | 125,141,525 | | | $ | 1,641,929 | | | $ — | | $ — |
| | | | | | | |
Franklin Growth Fund | | | | | | | | | | | | | | | | | | | | | | | | | |
Non-Controlled Affiliates | | | | | | | | | | | | | | | | | | | | | | | | | |
Institutional Fiduciary Trust Money Market Portfolio, 1.69% | | | 331,780,723 | | | | 917,604,905 | | | | (1,024,908,487 | ) | | | 224,477,141 | | | $ | 224,477,141 | | | $ | 3,722,826 | | | $ — | | $ — |
| | | | | | | |
Franklin Income Fund | | | | | | | | | | | | | | | | | | | | | | | | | |
Non-Controlled Affiliates | | | | | | | | | | | | | | | | | | | | | | | | | |
Institutional Fiduciary Trust Money Market Portfolio, 1.69% | | | 4,208,455,331 | | | | 20,073,441,797 | | | | (23,917,988,216 | ) | | | 363,908,912 | | | $ | 363,908,912 | | | $ | 14,519,270 | | | $ — | | $ — |
| | | | | | |
Franklin U.S. Government Securities Fund | | | | | | | | | | | | | | | | | | | | | |
Non-Controlled Affiliates | | | | | | | | | | | | | | | | | | | | | | | | | |
Institutional Fiduciary Trust Money Market Portfolio, 1.69% | | | 90,681,295 | | | | 1,136,760,512 | | | | (1,134,332,140 | ) | | | 93,109,667 | | | $ | 93,109,667 | | | $ | 1,279,356 | | | $ — | | $ — |
| | | | | | | |
Franklin Utilities Fund | | | | | | | | | | | | | | | | | | | | | | | | | |
Non-Controlled Affiliates | | | | | | | | | | | | | | | | | | | | | | | | | |
Institutional Fiduciary Trust Money Market Portfolio, 1.69% | | | 21,127,106 | | | | 704,284,803 | | | | (707,603,567 | ) | | | 17,808,342 | | | $ | 17,808,342 | | | $ | 278,893 | | | $ — | | $ — |
| | | | |
| | | |
122 | | Annual Report | | franklintempleton.com |
FRANKLIN CUSTODIAN FUNDS
NOTES TO FINANCIAL STATEMENTS
g. Waiver and Expense Reimbursements
For Franklin Income Fund, Investor Services has contractually agreed in advance to waive or limit its fees so that the Class R6 transfer agent fees do not exceed 0.01% based on the average net assets of the class until January 31, 2019. For Franklin DynaTech Fund, Franklin Growth Fund, Franklin U.S. Government Securities Fund and Franklin Utilities Fund, Investor Services has voluntarily agreed in advance to waive or limit its fees so that the Class R6 transfer agent fees do not exceed 0.02%. Investor Services may discontinue this waiver in the future.
h. Other Affiliated Transactions
At September 30, 2018, one or more of the funds in Franklin Fund Allocator Series owned a percentage of the following Funds’ outstanding shares:
| | | | | | | | |
Franklin
DynaTech Fund | | Franklin
Growth Fund | | Franklin
Income Fund | | Franklin
U.S. Government
Securities Fund | | Franklin
Utilities Fund |
| | | | |
4.3% | | 6.2% | | 1.9% | | 8.4% | | 2.3% |
i. Interfund Transactions
Franklin Income Fund engaged in purchases and sales of investments with funds or other accounts that have common investment managers (or affiliated investment managers), directors, trustees or officers. During the year ended September 30, 2018, these purchase and sale transactions aggregated $11,130,000 and $0, respectively.
4. Expense Offset Arrangement
The Funds have entered into an arrangement with their custodian whereby credits realized as a result of uninvested cash balances are used to reduce a portion of the Funds’ custodian expenses. During the year ended September 30, 2018, the custodian fees were reduced as noted in the Statements of Operations.
5. Income Taxes
For tax purposes, capital losses may be carried over to offset future capital gains. Capital loss carryforwards with no expiration, if any, must be fully utilized before those losses with expiration dates.
At September 30, 2018, the capital loss carryforwards were as follows:
| | | | | | | | |
| | | Franklin Income Fund | | | Franklin U.S. Government
Securities Fund | |
Capital loss carryforwards subject to expiration: | | | | | | | | |
2019 | | $ | — | | | | $ 4,445,156 | |
Capital loss carryforwards not subject to expiration: | | | | | | | | |
Short Term | | | 1,410,836,852 | | | | 227,313,517 | |
Long Term | | | 577,904,717 | | | | 323,826,140 | |
| | | | |
Total capital loss carryforwards | | $ | 1,988,741,569 | | | | $555,584,813 | |
| | | | |
During the year ended September 30, 2018, Franklin Income Fund utilized $1,148,333,281 of capital loss carryforwards.
On September 30, 2018, Franklin Income Fund and Franklin U.S. Government Securities Fund had expired capital loss carryforwards of $2,298,838,256 and $16,923,310, respectively, which were reclassified topaid-in capital.
| | | | |
| | | |
| franklintempleton.com | | Annual Report | | 123 |
FRANKLIN CUSTODIAN FUNDS
NOTES TO FINANCIAL STATEMENTS
5. Income Taxes (continued)
For tax purposes, the Funds may elect to defer any portion of a late-year ordinary loss to the first day of the following fiscal year. At September 30, 2018, Franklin DynaTech Fund deferred late-year ordinary losses of $11,794,621.
The tax character of distributions paid during the years ended September 30, 2018 and 2017, was as follows:
| | | | | | | | | | | | | | | | |
| | | Franklin DynaTech Fund | | | Franklin Growth Fund | |
| | | | |
| | | 2018 | | | 2017 | | | 2018 | | | 2017 | |
| |
| | | | |
Distributions paid from: | | | | | | | | | | | | | | | | |
Ordinary income | | $ | — | | | $ | — | | | $ | 64,350,332 | | | $ | 65,003,484 | |
Long term capital gain | | | 77,650,256 | | | | 99,169,960 | | | | 343,841,429 | | | | 381,564,601 | |
| | | | |
| | | | |
| | $ | 77,650,256 | | | $ | 99,169,960 | | | $ | 408,191,761 | | | $ | 446,568,085 | |
| | | | |
| | |
| | | Franklin Income Fund | | | Franklin U.S. Government Securities Fund | |
| | | | |
| | | 2018 | | | 2017 | | | 2018 | | | 2017 | |
| |
| | | | |
Distributions paid from: | | | | | | | | | | | | | | | | |
Ordinary income | | $ | 3,987,779,469 | | | $ | 4,104,316,518 | | | $ | 164,642,414 | | | $ | 184,128,697 | |
| | | | |
| | | | | | | | |
| | | Franklin Utilities Fund | |
| | | | |
| | | 2018 | | | 2017 | |
| |
| | |
Distributions paid from: | | | | | | | | |
Ordinary income | | $ | 169,581,554 | | | $ | 165,982,620 | |
Long term capital gain | | | 102,781,203 | | | | — | |
| | | | |
| | |
| | $ | 272,362,757 | | | $ | 165,982,620 | |
| | | | |
At September 30, 2018, the cost of investments, net unrealized appreciation (depreciation), undistributed ordinary income and undistributed long term capital gains for income tax purposes were as follows:
| | | | | | | | | | |
| | | Franklin
DynaTech Fund | | | Franklin Growth Fund | | | Franklin Income Fund |
| | | |
Cost of investments | | $ | 3,547,127,933 | | | $ | 5,560,734,542 | | | $74,137,873,509 |
| | | |
| | | |
Unrealized appreciation | | $ | 3,248,049,056 | | | $ | 10,912,369,301 | | | $ 6,295,593,800 |
Unrealized depreciation | | | (5,725,075 | ) | | | (67,366,839 | ) | | (4,099,504,077) |
| | | |
| | | |
Net unrealized appreciation (depreciation) | | $ | 3,242,323,981 | | | $ | 10,845,002,462 | | | $ 2,196,089,723 |
| | | |
| | | |
Distributable earnings: | | | | | | | | | | |
Undistributed ordinary income | | $ | — | | | $ | 53,693,621 | | | $ 22,797,075 |
Undistributed long term capital gains | | | 167,082,709 | | | | 159,409,937 | | | — |
| | | |
| | | |
Total distributable earnings | | $ | 167,082,709 | | | $ | 213,103,558 | | | $ 22,797,075 |
| | | |
| | | | |
| | | |
124 | | Annual Report | | franklintempleton.com |
FRANKLIN CUSTODIAN FUNDS
NOTES TO FINANCIAL STATEMENTS
| | | | | | |
| | | Franklin U.S. Government
Securities Fund | | | Franklin Utilities Fund |
| | |
Cost of investments | | $ | 5,213,336,770 | | | $3,153,216,354 |
| | | |
| | |
Unrealized appreciation | | $ | 54,153,567 | | | $2,617,379,234 |
Unrealized depreciation | | | (152,704,127 | ) | | (48,180,644) |
| | | |
| | |
Net unrealized appreciation (depreciation) | | $ | (98,550,560 | ) | | $2,569,198,590 |
| | | |
| | |
Distributable earnings: | | | | | | |
Undistributed ordinary income | | $ | 2,900,221 | | | $ 12,532,253 |
Undistributed long term capital gains | | | — | | | 155,838,727 |
| | | |
| | |
Total distributable earnings | | $ | 2,900,221 | | | $ 168,370,980 |
| | | |
Differences between income and/or capital gains as determined on a book basis and a tax basis are primarily due to differing treatments of paydown losses, bond discounts and premiums, corporate actions, equity-linked securities, wash sales and gains realized onin-kind shareholder redemptions.
Franklin DynaTech Fund, Franklin Growth Fund and Franklin Utilities Fund utilized a tax accounting practice to treat a portion of the proceeds from capital shares redeemed as a distribution from realized capital gains.
6. Investment Transactions
Purchases and sales of investments (excluding short term securities andin-kind transactions) for the year ended September 30, 2018, were as follows:
| | | | | | | | | | | | | | | | | | |
| | | Franklin DynaTech Fund | | | Franklin Growth Fund | | | Franklin Income Fund | | | Franklin U.S. Government Securities Fund | | | Franklin Utilities Fund |
| | | | | |
Purchases | | | $2,128,367,915 | | | $ | 897,922,270 | | | $ | 38,354,125,751 | | | | $2,372,371,850 | | | $274,493,157 |
Sales | | | $ 889,294,014 | | | $ | 1,117,705,970 | | | $ | 39,655,069,205 | | | | $2,744,292,913 | | | $917,753,491 |
At September 30, 2018, in connection with securities lending transactions, Franklin Income Fund loaned corporate bonds and notes and received $15,778,971 of cash collateral. The gross amount of recognized liability for such transactions is included in payable upon return of securities loaned in the Statement of Assets and Liabilities. The agreements can be terminated at any time.
7. Credit Risk and Defaulted Securities
At September 30, 2018, Franklin Income Fund had 34.1% of its portfolio invested in high yield securities, senior secured floating rate notes, or other securities rated below investment grade and unrated securities, if any. These securities may be more sensitive to economic conditions causing greater price volatility and are potentially subject to a greater risk of loss due to default than higher rated securities.
Franklin Income Fund held defaulted securities and/or other securities for which the income has been deemed uncollectible. At September 30, 2018, the aggregate value of these securities was $733,255,901, representing 1.0% of the Fund’s net assets. The Fund discontinues accruing income on securities for which income has been deemed uncollectible and provides an estimate for losses on interest receivable. The securities have been identified in the accompanying Statement of Investments.
| | | | |
| | | |
| franklintempleton.com | | Annual Report | | 125 |
FRANKLIN CUSTODIAN FUNDS
NOTES TO FINANCIAL STATEMENTS
8. Other Derivative Information
At September 30, 2018, the Fund’s investments in derivative contracts are reflected in the Statements of Assets and Liabilities as follows:
| | | | | | | | | | | | |
| | | Asset Derivatives | | | | | Liability Derivatives |
Derivative Contracts Not Accounted for as Hedging Instruments | | Statements of
Assets and Liabilities Location | | Fair Value | | | | | Statements of
Assets and Liabilities Location | | Fair Value |
Franklin Income Fund | | | | | | | | | | | | |
Equity contracts | | Investments in securities, at value | | $ | 81,950,000 | a | | | | Options written, at value | | $24,673,000 |
| | | | | | | | | | | | |
aPurchased option contracts are included in investments in securities, at value in the Statements of Assets and Liabilities.
For the year ended September 30, 2018, the effect of derivative contracts in the Fund’s Statements of Operations was as follows:
| | | | | | | | | | |
Derivative Contracts Not Accounted for as Hedging Instruments | | Statements of Operations Location | | Net Realized Gain (Loss) for the Year | | | Statements of Operations Location | | Net Change in Unrealized Appreciation (Depreciation) for the Year |
| | | | |
| | Net realized gain (loss) from: | | | | | | Net change in unrealized appreciation (depreciation) on: | | |
| | | | |
Franklin Income Fund | | | | | | | | | | |
Equity contracts | | Investments | | $ | 4,614,303 | a | | Investments | | $(33,314,959)a |
| | | | |
| | Written options | | | 121,101,389 | | | Written options | | 6,930,114 |
| | | | | | | | | | |
Totals | | | | $ | 125,715,692 | | | | | $(26,384,845) |
| | | | | | | | | | |
aPurchased option contracts are included in net realized gain (loss) from investments and net change in unrealized appreciation (depreciation) on investments in the Statements of Operations.
For the year ended September 30, 2018, the average month end notional amount of options represented $40,827,538.
See Note 1(e) regarding derivative financial instruments.
9. Holdings of 5% Voting Securities of Portfolio Companies
The 1940 Act defines “affiliated companies” to include investments in portfolio companies in which a fund owns 5% or more of the outstanding voting securities. During the year ended September 30, 2018, investments in “affiliated companies” were as follows:
| | | | | | | | | | | | | | | | | | | | | | | | | | | | | | |
| Name of Issuer | | Number of Shares / Principal
Amount Held at Beginning of Year | | | Gross
Additions | | | Gross
Reductions | | | Number of Shares /
Principal Amount Held at End of Year | | | Value
at End
of Year | | | Investment
Income | | | Realized
Gain (Loss) | | | Net Change in Unrealized
Appreciation
(Depreciation) |
Franklin Income Fund | | | | | | | | | | | | | | | | | | | | | | | | | | | |
Controlled Affiliatesa | | | | | | | | | | | | | | | | | | | | | | | | | | | |
| | | | | | | | | | | | | | | | | | | | | | | Dividends | | | | | | | |
| | | | | | | | | | | | | | | | | | | | | | |
Stone Energy Corp. | | | 6,151,402 | | | | — | | | | (6,151,402)b | | | | — | | | | $ — | | | | $ — | | | | $ — | | | $46,273,623 |
| | | | | | | | | | | |
| | | | | | | | |
| | | | | | | | | | | | | | | | | | | | | | | Interest | | | | | | | |
| | | | | | | | | | | | | | | | | | | | | | |
Stone Energy Corp., senior note, 7.50%, 5/31/22 | | | 72,845,556 | | | | — | | | | (72,845,556)b | | | | — | | | | — | | | | 3,353,931 | | | | 4,149,459 | | | 3,756,984 |
| | | | | | | | | | | |
| | | | | | | |
Total Controlled Affiliates | | | | | | | | | | | | | | | | $ — | | | | $3,353,931 | | | | $4,149,459 | | | $50,030,607 |
| | | | | | | | | | | |
| | | | |
| | | |
126 | | Annual Report | | franklintempleton.com |
FRANKLIN CUSTODIAN FUNDS
NOTES TO FINANCIAL STATEMENTS
| | | | | | | | | | | | | | | | | | | | | | | | | | | | | | |
| Name of Issuer | | Number of Shares / Principal Amount Held at Beginning of Year | | | Gross Additions | | | Gross Reductions | | | Number of Shares / Principal Amount Held at End of Year | | | Value at End of Year | | | Investment
Income | | | Realized Gain (Loss) | | | Net Change in Unrealized Appreciation (Depreciation) |
| | | | | | |
Franklin Income Fund(continued) | | | | | | | | | | | | | | | | | | | | | | | |
Non-Controlled Affiliates | | | | | | | | | | | | | | | | | | | | | | | | | | | |
| | | | | | | | | | | | | | | | | | | | | | | Dividends | | | | | | | |
| | | | | | | | | | | | | | | | | | | | | | | | | | | | | | |
CEVA Holdings LLC | | | 81,371 | | | | 114,990 | b | | | (196,361 | )b | | | — | | | $ | — | | | $ | — | | | $ | — | | | $ 111,348,143 |
CEVA Holdings LLC, cvt. pfd.,A-1, 2/20/49 | | | 2,897 | | | | — | | | | (2,897 | )b | | | — | | | | — | | | | — | | | | — | | | 2,086,020 |
CEVA Holdings LLC, cvt. pfd.,A-2, 2/20/49 | | | 110,565 | | | | — | | | | (110,565 | )b | | | — | | | | — | | | | — | | | | — | | | 114,542,822 |
Energy XXI Gulf Coast Inc. | | | 7,000,000 | | | | — | | | | (7,000,000 | ) | | | — | | | | — | | | | — | | | | (276,683,474 | ) | | 244,184,332 |
Goodrich Petroleum Corp. | | | 2,260,859 | | | | — | | | | (2,260,859 | ) | | | — | | | | — | | | | — | | | | 4,645,755 | | | (1,960,199) |
Halcon Resources Corp. | | | 22,500,000 | | | | — | | | | (22,500,000 | ) | | | — | | | | — | | | | — | | | | (129,393,550 | ) | | 125,091,495 |
Talos Energy Inc. | | | — | | | | 6,151,402 | b | | | (633,965 | ) | | | 5,517,437 | | | | 181,082,282 | | | | — | | | | (5,559,547 | ) | | (17,488,505) |
W&T Offshore Inc. | | | 10,000,000 | | | | — | | | | (10,000,000 | ) | | | — | | | | — | | | | — | | | | 15,002,537 | | | (14,382,287) |
| | | | | | | | | | | | | | | | | | | |
| | | | | | | | |
| | | | | | | | | | | | | | | | | | $ | 181,082,282 | | | $ | — | | | $ | (391,988,279 | ) | | $563,421,821 |
| | | | | | | | | | | | | | | | | | | |
| | | | | | | | |
| | | | | | | | | | | | | | | | | | | | | | | Interest | | | | | | | |
| | | | | | | | | | | | | | | | | | | | | | | | | | | | | | |
Halcon Resources Corp., senior note, 144A, 6.75%, 2/15/25 | | | 108,000,000 | | | | — | | | | (108,000,000 | )b | | | — | | | | — | | | | 90,147 | | | | 2,269,291 | | | (6,616,715) |
W&T Offshore Inc., Second Lien Term Loan, 9.00%, 5/15/20 | | | 161,850,000 | | | | — | | | | — | | | | 161,850,000 | | | | — | c | | | 14,566,500 | | | | — | | | —c |
W&T Offshore Inc., secured note, second lien, 144A, PIK, 9.00%, 5/15/20 | | | 75,645,453 | | | | 6,731,846 | b | | | — | | | | 82,377,299 | | | | — | c | | | 10,390,355 | d | | | — | | | —c |
W&T Offshore Inc., senior note, 8.50%, 6/15/19 | | | 15,568,000 | | | | 81,353,000 | | | | — | | | | 96,921,000 | | | | — | c | | | 12,905,395 | | | | — | | | —c |
W&T Offshore Inc., Senior Secured 1.5 Lien Term Loan, 11.00%, 11/15/19 | | | 75,000,000 | | | | — | | | | — | | | | 75,000,000 | | | | — | c | | | 8,250,000 | | | | — | | | —c |
W&T Offshore Inc., senior secured note, third lien, 144A, PIK, 10.00%, 6/15/21 | | | 67,697,026 | | | | 6,938,944 | b | | | — | | | | 74,635,970 | | | | — | c | | | 7,895,623 | d | | | — | | | —c |
| | | | | | | | | | | | | | | | | | | |
| | | | | | | | |
| | | | | | | | | | | | | | | | | | $ | — | | | | $54,098,020 | | | $ | 2,269,291 | | | $ (6,616,715) |
| | | | | | | | | | | | | | | | | | | |
| | | | | | |
TotalNon-Controlled Affiliates | | | | | | | | | | | $ | 181,082,282 | | | | $54,098,020 | | | $ | (389,718,988 | ) | | $556,805,106 |
| | | | | | | | | | | | | | | | | | | |
| | | | | |
Total Affiliated Securities(Value is 0.2% of Net Assets) | | | | | | | $ | 181,082,282 | | | | $57,451,951 | | | $ | (385,569,529 | ) | | $606,835,713 |
| | | | | | | | | | | | | | | | | | | |
aIssuer in which the Fund owns 25% or more of the outstanding voting securities.
bGross addition/reduction was the result of various corporate actions.
cAs of September 30, 2018, no longer an affiliate.
dIncludesnon-cash dividend/interest received.
10. Credit Facility
The Funds, together with other U.S. registered and foreign investment funds (collectively, Borrowers), managed by Franklin Templeton Investments, are borrowers in a joint syndicated senior unsecured credit facility totaling $2 billion (Global Credit Facility) which matures on February 8, 2019. This Global Credit Facility provides a source of funds to the Borrowers for temporary and emergency purposes, including the ability to meet future unanticipated or unusually large redemption requests.
| | | | |
| | | |
| franklintempleton.com | | Annual Report | | 127 |
FRANKLIN CUSTODIAN FUNDS
NOTES TO FINANCIAL STATEMENTS
10. Credit Facility(continued)
Under the terms of the Global Credit Facility, the Funds shall, in addition to interest charged on any borrowings made by the Funds and other costs incurred by the Funds, pay their share of fees and expenses incurred in connection with the implementation and maintenance of the Global Credit Facility, based upon their relative share of the aggregate net assets of all of the Borrowers, including an annual commitment fee of 0.15% based upon the unused portion of the Global Credit Facility. These fees are reflected in other expenses in the Statements of Operations. During the year ended September 30, 2018, the Funds did not use the Global Credit Facility.
11. RedemptionIn-Kind
During the year ended September 30, 2018, the Franklin Growth Fund realized $42,189,159 of net gains resulting from a redemptionin-kind in which a shareholder redeemed fund shares for cash and securities held by the Fund. Because such gains are not taxable to the Fund and are not distributed to remaining shareholders, they have been reclassified from accumulated net realized gains topaid-in capital.
12. Fair Value Measurements
The Funds follow a fair value hierarchy that distinguishes between market data obtained from independent sources (observable inputs) and the Funds’ own market assumptions (unobservable inputs). These inputs are used in determining the value of the Funds’ financial instruments and are summarized in the following fair value hierarchy:
| | • | | Level 1 – quoted prices in active markets for identical financial instruments |
| | • | | Level 2 – other significant observable inputs (including quoted prices for similar financial instruments, interest rates, prepayment speed, credit risk, etc.) |
| | • | | Level 3 – significant unobservable inputs (including the Funds’ own assumptions in determining the fair value of financial instruments) |
The input levels are not necessarily an indication of the risk or liquidity associated with financial instruments at that level.
For movements between the levels within the fair value hierarchy, the Funds have adopted a policy of recognizing the transfers as of the date of the underlying event which caused the movement.
A summary of inputs used as of September 30, 2018, in valuing the Funds’ assets and liabilities carried at fair value, is as follows:
| | | | | | | | | | | | | | | | |
| | | Level 1 | | | Level 2 | | | Level 3 | | | Total | |
Franklin DynaTech Fund | | | | | | | | | | | | | | | | |
Assets: | | | | | | | | | | | | | | | | |
Investments in Securities:a | | | | | | | | | | | | | | | | |
Equity Investments | | $ | 6,664,310,389 | | | $ | — | | | $ | — | | | $ | 6,664,310,389 | |
Short Term Investments | | | 125,141,525 | | | | — | | | | — | | | | 125,141,525 | |
| | | | |
Total Investments in Securities | | $ | 6,789,451,914 | | | $ | — | | | $ | — | | | $ | 6,789,451,914 | |
| | | | |
| | | | |
Franklin Growth Fund | | | | | | | | | | | | | | | | |
Assets: | | | | | | | | | | | | | | | | |
Investments in Securities:a | | | | | | | | | | | | | | | | |
Equity Investmentsb | | $ | 16,181,259,863 | | | $ | — | | | $ | — | | | $ | 16,181,259,863 | |
Short Term Investments | | | 224,477,141 | | | | — | | | | — | | | | 224,477,141 | |
| | | | |
Total Investments in Securities | | $ | 16,405,737,004 | | | $ | — | | | $ | — | | | $ | 16,405,737,004 | |
| | | | |
| | | | |
| | | |
128 | | Annual Report | | franklintempleton.com |
FRANKLIN CUSTODIAN FUNDS
NOTES TO FINANCIAL STATEMENTS
| | | | | | | | | | | | | | | | |
| | | Level 1 | | | Level 2 | | | Level 3 | | | Total | |
Franklin Income Fund | | | | | | | | | | | | | | | | |
Assets: | | | | | | | | | | | | | | | | |
Investments in Securities:a | | | | | | | | | | | | | | | | |
Equity Investments:b | | | | | | | | | | | | | | | | |
Energy | | $ | 3,629,694,339 | | | $ | 60,676,870 | | | $ | — | | | $ | 3,690,371,209 | |
Financials | | | 5,105,982,001 | | | | 76,500,000 | | | | — | | | | 5,182,482,001 | |
Industrials | | | 1,263,740,395 | | | | — | | | | 36,663,024 | | | | 1,300,403,419 | |
All Other Equity Investments | | | 17,747,912,104 | | | | — | | | | — | | | | 17,747,912,104 | |
Equity-Linked Securities | | | — | | | | 9,797,062,918 | | | | — | | | | 9,797,062,918 | |
Index-Linked Notes | | | — | | | | 107,904,600 | | | | — | | | | 107,904,600 | |
Convertible Bonds | | | — | | | | 519,689,350 | | | | — | | | | 519,689,350 | |
Corporate Bonds | | | — | | | | 28,464,562,037 | | | | — | | | | 28,464,562,037 | |
Senior Floating Rate Interests | | | — | | | | 2,945,388,830 | | | | — | | | | 2,945,388,830 | |
U.S. Government and Agency Securities | | | — | | | | 5,159,587,886 | | | | — | | | | 5,159,587,886 | |
Escrows and Litigation Trusts | | | — | | | | — | | | | — | c | | | — | |
Options Purchased | | | 81,950,000 | | | | — | | | | — | | | | 81,950,000 | |
Short Term Investments | | | 1,358,165,907 | | | | 3,155,971 | | | | — | | | | 1,361,321,878 | |
| | | | |
Total Investments in Securities | | $ | 29,187,444,746 | | | $ | 47,134,528,462 | | | $ | 36,663,024 | | | $ | 76,358,636,232 | |
| | | | |
Liabilities: | | | | | | | | | | | | | | | | |
Other Financial Instruments: | | | | | | | | | | | | | | | | |
Options Written | | $ | 24,673,000 | | | $ | — | | | $ | — | | | $ | 24,673,000 | |
| | | | |
| | | | |
Franklin U.S. Government Securities Fund | | | | | | | | | | | | | | | | |
Assets: | | | | | | | | | | | | | | | | |
Investments in Securities:a | | | | | | | | | | | | | | | | |
Mortgage-Backed Securities | | $ | — | | | $ | 4,938,754,375 | | | $ | — | | | $ | 4,938,754,375 | |
U.S. Government and Agency Securities | | | — | | | | 82,922,168 | | | | — | | | | 82,922,168 | |
Short Term Investments | | | 93,109,667 | | | | — | | | | — | | | | 93,109,667 | |
| | | | |
Total Investments in Securities | | $ | 93,109,667 | | | $ | 5,021,676,543 | | | $ | — | | | $ | 5,114,786,210 | |
| | | | |
| | | | |
Franklin Utilities Fund | | | | | | | | | | | | | | | | |
Assets: | | | | | | | | | | | | | | | | |
Investments in Securities:a | | | | | | | | | | | | | | | | |
Equity Investments | | $ | 5,697,788,114 | | | $ | — | | | $ | — | | | $ | 5,697,788,114 | |
Corporate Bonds | | | — | | | | 6,818,488 | | | | — | | | | 6,818,488 | |
Short Term Investments | | | 17,808,342 | | | | — | | | | — | | | | 17,808,342 | |
| | | | |
Total Investments in Securities | | $ | 5,715,596,456 | | | $ | 6,818,488 | | | $ | — | | | $ | 5,722,414,944 | |
| | | | |
aFor detailed categories, see the accompanying Statement of Investments.
bIncludes common, preferred and convertible preferred stocks and management investment companies.
cIncludes securities determined to have no value at September 30, 2018.
A reconciliation of assets in which Level 3 inputs are used in determining fair value is presented when there are significant Level 3 financial instruments at the beginning and/or end of the year.
13. New Accounting Pronouncements
In March 2017, the Financial Accounting Standards Board (FASB) issued Accounting Standards Update (ASU)No. 2017-08, Receivables—Nonrefundable Fees and Other Costs (Subtopic310-20): Premium Amortization on Purchased Callable Debt Securities. The amendments in the ASU shorten the amortization period for certain callable debt securities acquired at a premium, to be amortized to the earliest call date. The ASU does not require an accounting change for securities acquired at a discount, which
| | | | |
| | | |
| franklintempleton.com | | Annual Report | | 129 |
FRANKLIN CUSTODIAN FUNDS
NOTES TO FINANCIAL STATEMENTS
13. New Accounting Pronouncements(continued)
continues to be amortized to maturity. The ASU is effective for fiscal years and interim periods within those fiscal years beginning after December 15, 2018. Management has reviewed the requirements and believes the adoption of this ASU will not have a material impact on the financial statements.
In August 2018, FASB issued ASUNo. 2018-13, Fair Value Measurement (Topic 820): Disclosure Framework—Changes to the Disclosure Requirements for Fair Value Measurements. The amendments in the ASU modify the disclosure requirements on fair value measurements in Topic 820. The ASU is effective for interim and annual reporting periods beginning after December 15, 2019. Management is currently evaluating the impact, if any, of applying this provision.
14. Subsequent Events
The Funds have evaluated subsequent events through the issuance of the financial statements and determined that no events have occurred that require disclosure, except for the following:
On February 27, 2018, the Board approved an automatic conversion feature for Class C that will convert shareholders’ Class C shares into Class A shares after they have been held for 10 years. The conversion feature will become effective October 5, 2018. Further details are disclosed in the Funds’ Prospectus.
Abbreviations
| | | | | | | | |
| Currency | | Selected Portfolio | | |
EUR | | Euro | | ADR | | American Depositary Receipt | | |
USD | | United States Dollar | | FHLMC | | Federal Home Loan Mortgage Corp. | | |
| | | | FNMA | | Federal National Mortgage Association | | |
| | | | FRN | | Floating Rate Note | | |
| | | | LIBOR | | London InterBank Offered Rate | | |
| | | | PIK | | Payment-In-Kind | | |
| | | | SF | | Single Family | | |
| | | | SPX B | | S&P 500 IndexBuy-Write | | |
| | | | SPX B DT | | S&P 500 IndexBuy-Write Distribution | | |
| | | | |
| | | |
130 | | Annual Report | | franklintempleton.com |
FRANKLIN CUSTODIAN FUNDS
Report of Independent Registered Public Accounting Firm
To the Board of Trustees of Franklin Custodian Funds and Shareholders of Franklin Dynatech Fund, Franklin Growth Fund, Franklin Income Fund, Franklin U.S. Government Securities Fund and Franklin Utilities Fund
Opinions on the Financial Statements
We have audited the accompanying statements of assets and liabilities, including the statements of investments, of Franklin Dynatech Fund, Franklin Growth Fund, Franklin Income Fund, Franklin U.S. Government Securities Fund, and Franklin Utilities Fund (the “Funds”) as of September 30, 2018, the related statements of operations for the year ended September 30, 2018, the statements of changes in net assets for each of the two years in the period ended September 30, 2018, including the related notes, and the financial highlights for each of the periods indicated therein (collectively referred to as the “financial statements”). In our opinion, the financial statements present fairly, in all material respects, the financial position of each of the Funds as of September 30, 2018, the results of each of their operations for the year then ended, the changes in each of their net assets for each of the two years in the period ended September 30, 2018 and each of the financial highlights for each of the periods indicated therein in conformity with accounting principles generally accepted in the United States of America.
Basis for Opinions
These financial statements are the responsibility of the Funds’ management. Our responsibility is to express an opinion on the Funds’ financial statements based on our audits. We are a public accounting firm registered with the Public Company Accounting Oversight Board (United States) (“PCAOB”) and are required to be independent with respect to the Funds in accordance with the U.S. federal securities laws and the applicable rules and regulations of the Securities and Exchange Commission and the PCAOB. We conducted our audits of these financial statements in accordance with the standards of the PCAOB. Those standards require that we plan and perform the audit to obtain reasonable assurance about whether the financial statements are free of material misstatement, whether due to error or fraud.
We conducted our audits of these financial statements in accordance with the standards of the PCAOB. Those standards require that we plan and perform the audit to obtain reasonable assurance about whether the financial statements are free of material misstatement, whether due to error or fraud.
Our audits included performing procedures to assess the risks of material misstatement of the financial statements, whether due to error or fraud, and performing procedures that respond to those risks. Such procedures included examining, on a test basis, evidence regarding the amounts and disclosures in the financial statements. Our audits also included evaluating the accounting principles used and significant estimates made by management, as well as evaluating the overall presentation of the financial statements. Our procedures included confirmation of securities owned as of September 30, 2018 by correspondence with the custodian, transfer agent and brokers; when replies were not received from brokers, we performed other auditing procedures. We believe that our audits provide a reasonable basis for our opinions.
PricewaterhouseCoopers LLP
San Francisco, California
November 29, 2018
We have served as the auditor of one or more investment companies in the Franklin Templeton Group of Funds since 1948.
| | | | |
| | | |
| franklintempleton.com | | Annual Report | | 131 |
FRANKLIN CUSTODIAN FUNDS
Tax Information (unaudited)
Under Section 852(b)(3)(C) of the Internal Revenue Code, the Funds hereby report the maximum amount allowable but no less than the following amounts as long term capital gain dividends for the fiscal year ended September 30, 2018:
| | | | | | |
Franklin
DynaTech Fund | | Franklin
Growth Fund | | Franklin
Utilities Fund | | |
$80,609,920 | | $352,856,934 | | $119,370,157 | | |
Under Section 854(b)(1)(A) of the Internal Revenue Code, the Funds hereby report the following percentage amounts of the ordinary income dividends as income qualifying for the dividends received deduction for the fiscal year ended September 30, 2018:
| | | | | | |
Franklin
Growth Fund | | Franklin
Income Fund | | Franklin
Utilities Fund | | |
100.00% | | 19.75% | | 100.00% | | |
Under Section 854(b)(1)(B) of the Internal Revenue Code, the Funds hereby report the maximum amount allowable but no less than the following amounts as qualified dividends for purposes of the maximum rate under Section 1(h)(11) of the Internal Revenue Code for the fiscal year ended September 30, 2018:
| | | | | | | | |
| | | | |
Franklin DynaTech Fund | | Franklin
Growth Fund | | Franklin
Income Fund | | Franklin
Utilities Fund | | |
$22,952,651 | | $177,693,494 | | $1,196,031,910 | | $206,685,415 | | |
Distributions, including qualified dividend income, paid during calendar year 2018 will be reported to shareholders on Form1099-DIV bymid-February 2019. Shareholders are advised to check with their tax advisors for information on the treatment of these amounts on their individual income tax returns.
Under Section 871(k)(1)(C) of the Internal Revenue Code, the Funds hereby report the maximum amount allowable but no less than the following amounts as interest related dividends for purposes of the tax imposed under Section 871(a)(1)(A) of the Internal Revenue Code for the fiscal year ended September 30, 2018:
| | | | | | |
Franklin
Income Fund | | Franklin U.S. Government
Securities Fund | | | |
$1,753,286,377 | | $165,617,839 | | | | |
| | | | |
| | | |
132 | | Annual Report | | franklintempleton.com |
FRANKLIN CUSTODIAN FUNDS
Special Meeting of Shareholders
MEETING OF SHAREHOLDERS: OCTOBER 30, 2017 AND RECONVENED ON DECEMBER 15, 2017 AND DECEMBER 29, 2017
(UNAUDITED)
A Special Meeting of Shareholders of Franklin Custodian Funds was held at the offices of Franklin Templeton Investments, One Franklin Parkway, San Mateo, California on October 30, 2017 and reconvened on December 15, 2017 and December 29, 2017. The purpose of the meeting was to elect Trustees of Franklin Custodian Funds and to vote on the following proposals: for each Fund, to approve the use of a “manager of managers” structure whereby the Fund’s investment manager would be able to hire and replace subadvisers without shareholder approval; for each Fund, to approve an amended fundamental investment restriction regarding investments in commodities; and for Franklin Income Fund, to consider a shareholder proposal. At the meeting, (i) the following persons were elected by the shareholders to serve as Trustees of Franklin Custodian Funds: Harris J. Ashton, Terrence J. Checki, Mary C. Choksi, Edith E. Holiday, Gregory E. Johnson, Rupert H. Johnson, Jr., J. Michael Luttig, Larry D. Thompson, and John B. Wilson; (ii) the proposals to use a “manager of managers” structure and to approve the amended fundamental investment restriction regarding investments in commodities were approved by shareholders of each Fund; and (iii) sufficient votes were not received to pass the shareholder proposal for Franklin Income Fund. No other business was transacted at the meeting.
In connection with the meeting, management is aware that some shareholders received from the proxy solicitor numerous calls and mailings that may have been distracting. Management is taking steps to ensure that, in the future, for any new shareholder meeting solicitations that occur, such activity is not repeated. Management apologizes for any inconvenience that may have been caused as a result of such calls and mailings.
The results of the voting at the meeting are as follows:
| Proposal 1. | To elect a Board of Trustees: |
| | | | | | | | |
| Name | | For | | | Withheld | |
| | |
Harris J. Ashton | | | 20,620,255,266 | | | | 682,475,910 | |
Terrence J. Checki | | | 20,622,617,162 | | | | 680,114,004 | |
Mary C. Choksi | | | 20,641,972,272 | | | | 660,758,903 | |
Edith E. Holiday | | | 20,643,191,970 | | | | 659,539,208 | |
Gregory E. Johnson | | | 20,640,028,777 | | | | 662,702,399 | |
Rupert H. Johnson, Jr. | | | 20,623,629,983 | | | | 679,101,196 | |
J. Michael Luttig | | | 20,638,743,410 | | | | 663,987,768 | |
Larry D. Thompson | | | 20,634,644,439 | | | | 668,086,738 | |
John B. Wilson | | | 20,638,176,920 | | | | 661,053,794 | |
Total Trust Shares Outstanding*: 36,447,693,102
*As of the record date.
| | | | |
| | | |
| franklintempleton.com | | Annual Report | | 133 |
FRANKLIN CUSTODIAN FUNDS
SPECIAL MEETING OF SHAREHOLDERS
| Proposal 2. | To approve the use of a “manager of managers” structure whereby the Fund’s investment manager would be able to hire and replace subadvisers without shareholder approval: |
Franklin DynaTech Fund
| | | | |
| | | Shares | |
| |
For | | | 26,120,033 | |
Against | | | 1,611,032 | |
Abstain | | | 1,036,224 | |
BrokerNon-Votes | | | 7,606,644 | |
Total Fund Shares Voted | | | 36,373,925 | |
Total Fund Shares Outstanding* | | | 64,259,298 | |
| |
| Franklin Growth Fund | | | |
| | | Shares | |
| |
For | | | 62,525,115 | |
Against | | | 3,841,242 | |
Abstain | | | 2,289,625 | |
BrokerNon-Votes | | | 17,966,153 | |
Total Fund Shares Voted | | | 86,622,134 | |
Total Fund Shares Outstanding* | | | 153,895,391 | |
| |
| Franklin Income Fund | | | |
| | | Shares | |
| |
For | | | 13,745,941,125 | |
Against | | | 1,083,743,995 | |
Abstain | | | 700,822,344 | |
BrokerNon-Votes | | | 4,857,894,126 | |
Total Fund Shares Voted | | | 20,388,081,146 | |
Total Fund Shares Outstanding* | | | 34,952,846,556 | |
| |
| Franklin U.S. Government Securities Fund | | | |
| | | Shares | |
| |
For | | | 428,222,393 | |
Against | | | 29,263,682 | |
Abstain | | | 20,078,313 | |
BrokerNon-Votes | | | 103,560,080 | |
Total Fund Shares Voted | | | 581,124,647 | |
Total Fund Shares Outstanding* | | | 940,312,857 | |
| |
| Franklin Utilities Fund | | | |
| | | Shares | |
| |
For | | | 143,130,068 | |
Against | | | 10,836,309 | |
Abstain | | | 7,518,358 | |
BrokerNon-Votes | | | 48,794,594 | |
Total Fund Shares Voted | | | 210,279,325 | |
Total Fund Shares Outstanding* | | | 336,129,000 | |
| | | | |
| | | |
134 | | Annual Report | | franklintempleton.com |
FRANKLIN CUSTODIAN FUNDS
SPECIAL MEETING OF SHAREHOLDERS
| Proposal 3. | To approve an amended fundamental investment restriction regarding investments in commodities: |
Franklin DynaTech Fund
| | | | |
| | | Shares | |
| |
For | | | 26,263,004 | |
Against | | | 1,160,563 | |
Abstain | | | 1,343,715 | |
BrokerNon-Votes | | | 7,606,644 | |
Total Fund Shares Voted | | | 36,373,925 | |
Total Fund Shares Outstanding* | | | 64,259,298 | |
| |
| Franklin Growth Fund | | | |
| | | Shares | |
| |
For | | | 62,908,596 | |
Against | | | 2,906,472 | |
Abstain | | | 2,840,914 | |
BrokerNon-Votes | | | 17,966,153 | |
Total Fund Shares Voted | | | 86,622,134 | |
Total Fund Shares Outstanding* | | | 153,895,391 | |
| |
| Franklin Income Fund | | | |
| | | Shares | |
| |
For | | | 13,861,058,200 | |
Against | | | 776,938,721 | |
Abstain | | | 892,190,099 | |
BrokerNon-Votes | | | 4,857,894,126 | |
Total Fund Shares Voted | | | 20,388,081,146 | |
Total Fund Shares Outstanding* | | | 34,952,846,556 | |
| |
| Franklin U.S. Government Securities Fund | | | |
| | | Shares | |
| |
For | | | 428,632,998 | |
Against | | | 23,699,554 | |
Abstain | | | 25,232,014 | |
BrokerNon-Votes | | | 103,560,080 | |
Total Fund Shares Voted | | | 581,124,647 | |
Total Fund Shares Outstanding* | | | 940,312,857 | |
| |
| Franklin Utilities Fund | | | |
| | | Shares | |
| |
For | | | 143,792,779 | |
Against | | | 8,193,703 | |
Abstain | | | 9,498,250 | |
BrokerNon-Votes | | | 48,794,594 | |
Total Fund Shares Voted | | | 210,279,325 | |
Total Fund Shares Outstanding* | | | 336,129,000 | |
| | | | |
| | | |
| franklintempleton.com | | Annual Report | | 135 |
FRANKLIN CUSTODIAN FUNDS
SPECIAL MEETING OF SHAREHOLDERS
| Proposal 4. | Shareholder proposal requesting that Franklin Income Fund’s Board institute procedures to prevent holding investments in companies that, in the judgment of the Board, substantially contribute to genocide or crimes against humanity: |
| | | | |
| | | Shares | |
| |
For | | | 3,258,164,390 | |
Against | | | 11,233,489,698 | |
Abstain | | | 1,038,532,927 | |
BrokerNon-Votes | | | 4,857,894,126 | |
Total Fund Shares Voted | | | 20,388,081,146 | |
Total Fund Shares Outstanding* | | | 34,952,846,556 | |
| | | | |
| | | |
136 | | Annual Report | | franklintempleton.com |
FRANKLIN CUSTODIAN FUNDS
Board Members and Officers
The name, year of birth and address of the officers and board members, as well as their affiliations, positions held with the Trust, principal occupations during at least the past five years and number of U.S. registered portfolios overseen in the Franklin Templeton Investments fund complex, are shown below. Generally, each board member serves until that person’s successor is elected and qualified.
Independent Board Members
| | | | | | | | |
Name, Year of Birth and Address | | Position | | Length of
Time Served | | Number of Portfolios in
Fund Complex Overseen
by Board Member* | | Other Directorships Held
During at Least the Past 5 Years |
| | | | |
Harris J. Ashton (1932) One Franklin Parkway San Mateo, CA 94403-1906 | | Trustee | | Since 1976 | | 136 | | Bar-S Foods (meat packing company)(1981-2010). |
| | |
| Principal Occupation During at Least the Past 5 Years: | | | | |
Director of various companies; andformerly, Director, RBC Holdings, Inc. (bank holding company) (until 2002); and President, Chief Executive Officer and Chairman of the Board, General Host Corporation (nursery and craft centers) (until 1998). |
| | | | |
Terrence J. Checki (1945) One Franklin Parkway San Mateo, CA 94403-1906 | | Trustee | | Since December 2017 | | 112 | | Hess Corporation (exploration of oil and gas) (2014-present). |
| | |
| Principal Occupation During at Least the Past 5 Years: | | | | |
Member of the Council on Foreign Relations (1996-present); Member of the National Committee on U.S.-China Relations (1999-present); member of the Board of Trustees of the Economic Club of New York (2013-present); member of the Board of Trustees of the Foreign Policy Association (2005-present) and member of various other boards of trustees and advisory boards; andformerly, Executive Vice President of the Federal Reserve Bank of New York and Head of its Emerging Markets and Internal Affairs Group and Member of Management Committee (1995-2014); and Visiting Fellow at the Council on Foreign Relations (2014). |
| | | | |
Mary C. Choksi (1950) One Franklin Parkway San Mateo, CA 94403-1906 | | Trustee | | Since 2014 | | 136 | | Avis Budget Group Inc. (car rental)(2007-present), Omnicom Group Inc. (advertising and marketing communications services) (2011-present) and White Mountains Insurance Group, Ltd. (holding company) (2017-present). |
| | |
| Principal Occupation During at Least the Past 5 Years: | | | | |
Director of various companies; andformerly, Founder and Senior Advisor, Strategic Investment Group (investment management group) (2015-2017); Founding Partner and Senior Managing Director, Strategic Investment Group (1987–2015); Founding Partner and Managing Director, Emerging Markets Management LLC (investment management firm) (1987-2011); and Loan Officer/Senior Loan Officer/Senior Pension Investment Officer, World Bank Group (international financial institution) (1977-1987). |
| | | | |
Edith E. Holiday (1952) One Franklin Parkway San Mateo, CA 94403-1906 | | Trustee | | Since 1998 | | 136 | | Hess Corporation (exploration of oil and gas) (1993-present), Canadian National Railway (railroad) (2001-present), White Mountains Insurance Group, Ltd. (holding company) (2004-present), Santander Consumer USA Holdings, Inc. (consumer finance) (2016-present), RTI International Metals, Inc. (manufacture and distribution of titanium) (1999-2015) and H.J. Heinz Company (processed foods and allied products) (1994-2013). |
| | |
| Principal Occupation During at Least the Past 5 Years: | | | | |
Director or Trustee of various companies and trusts; andformerly, Assistant to the President of the United States and Secretary of the Cabinet(1990-1993); General Counsel to the United States Treasury Department (1989-1990); and Counselor to the Secretary and Assistant Secretary for Public Affairs and Public Liaison-United States Treasury Department (1988-1989). |
| | | | |
J. Michael Luttig (1954) One Franklin Parkway San Mateo, CA 94403-1906 | | Trustee | | Since 2009 | | 136 | | Boeing Capital Corporation (aircraft financing) (2006-2013). |
| | |
| Principal Occupation During at Least the Past 5 Years: | | | | |
Executive Vice President, General Counsel and member of the Executive Council, The Boeing Company (aerospace company) (2006-present); andformerly, Federal Appeals Court Judge, U.S. Court of Appeals for the Fourth Circuit (1991-2006). |
| | | | |
| | | |
| franklintempleton.com | | Annual Report | | 137 |
FRANKLIN CUSTODIAN FUNDS
Independent Board Members(continued)
| | | | | | | | |
Name, Year of Birth and Address | | Position | | Length of
Time Served | | Number of Portfolios in
Fund Complex Overseen
by Board Member* | | Other Directorships Held
During at Least the Past 5 Years |
| | | | |
Larry D. Thompson (1945) One Franklin Parkway San Mateo, CA 94403-1906 | | Trustee | | Since 2007 | | 136 | | The Southern Company (energy company) (2014-present; previously 2010-2012), Graham Holdings Company (education and media organization) (2011-present) and Cbeyond, Inc. (business communications provider) (2010-2012). |
| | |
| Principal Occupation During at Least the Past 5 Years: | | | | |
Director of various companies; Counsel, Finch McCranie, LLP (law firm) (2015-present); Independent Compliance Monitor and Auditor, Volkswagen AG (manufacturer of automobiles and commercial vehicles) (2017-present); John A. Sibley Professor of Corporate and Business Law, University of Georgia School of Law (2015-present; previously 2011-2012); andformerly, Executive Vice President - Government Affairs, General Counsel and Corporate Secretary, PepsiCo, Inc. (consumer products) (2012-2014); Senior Vice President - Government Affairs, General Counsel and Secretary, PepsiCo, Inc. (2004-2011); Senior Fellow of The Brookings Institution (2003-2004); Visiting Professor, University of Georgia School of Law (2004); and Deputy Attorney General, U.S. Department of Justice (2001-2003). |
| | | | |
John B. Wilson (1959) One Franklin Parkway San Mateo, CA 94403-1906 | | Lead Independent Trustee | | Trustee since 2007 and Lead Independent Trustee since 2008 | | 112 | | None |
| | |
| Principal Occupation During at Least the Past 5 Years: | | | | |
President and Founder, Hyannis Port Capital, Inc. (real estate and private equity investing) (2002-present); Senior Advisor, McKinsey & Co. (consulting) (2017-present); serves on private andnon-profit boards; andformerly, President, Staples International and Head of Global Transformation (office supplies) (2012-2016); Chief Operating Officer and Executive Vice President, Gap, Inc. (retail) (1996-2000); Chief Financial Officer and Executive Vice President – Finance and Strategy, Staples, Inc. (1992-1996); Senior Vice President – Corporate Planning, Northwest Airlines, Inc. (airlines) (1990-1992); and Vice President and Partner, Bain & Company (consulting firm) (1986-1990). |
| |
| Interested Board Members and Officers | | |
| | | | |
Name, Year of Birth
and Address | | Position | | Length of
Time Served | | Number of Portfolios in
Fund Complex Overseen
by Board Member* | | Other Directorships Held
During at Least the Past 5 Years |
| | | | |
**Gregory E. Johnson (1961) One Franklin Parkway San Mateo, CA 94403-1906 | | Trustee | | Since 2013 | | 150 | | None |
| | |
| Principal Occupation During at Least the Past 5 Years: | | | | |
Chairman of the Board, Member - Office of the Chairman, Director and Chief Executive Officer, Franklin Resources, Inc.; officer and/or director or trustee, as the case may be, of some of the other subsidiaries of Franklin Resources, Inc. and of 42 of the investment companies in Franklin Templeton Investments; Vice Chairman, Investment Company Institute; andformerly, President, Franklin Resources, Inc. (1994-2015). |
| | | | |
**Rupert H. Johnson, Jr. (1940) One Franklin Parkway San Mateo, CA 94403-1906 | | Chairman of the Board, Trustee and Vice President | | Chairman of the Board since 2013, Trustee since 1983 and Vice President since 1982 | | 136 | | None |
| | |
| Principal Occupation During at Least the Past 5 Years: | | | | |
Vice Chairman, Member - Office of the Chairman and Director, Franklin Resources, Inc.; Director, Franklin Advisers, Inc.; Senior Vice President, Franklin Advisory Services, LLC; and officer and/or director or trustee, as the case may be, of some of the other subsidiaries of Franklin Resources, Inc. and of 40 of the investment companies in Franklin Templeton Investments. |
| | | | |
Alison E. Baur (1964) One Franklin Parkway San Mateo, CA 94403-1906 | | Vice President | | Since 2012 | | Not Applicable | | Not Applicable |
| | |
| Principal Occupation During at Least the Past 5 Years: | | | | |
Deputy General Counsel, Franklin Templeton Investments; and officer of some of the other subsidiaries of Franklin Resources, Inc. and of 44 of the investment companies in Franklin Templeton Investments. |
| | | | |
| | | |
138 | | Annual Report | | franklintempleton.com |
FRANKLIN CUSTODIAN FUNDS
Interested Board Members and Officers(continued)
| | | | | | | | |
Name, Year of Birth
and Address | | Position | | Length of
Time Served | | Number of Portfolios in
Fund Complex Overseen
by Board Member* | | Other Directorships Held
During at Least the Past 5 Years |
| | | | |
Gaston Gardey (1967) One Franklin Parkway San Mateo, CA 94403-1906 | | Chief Financial Officer, Chief Accounting Officer and Treasurer | | Since 2009 | | Not Applicable | | Not Applicable |
| | |
| Principal Occupation During at Least the Past 5 Years: | | | | |
Treasurer, U.S. Fund Administration & Reporting, Franklin Templeton Investments; and officer of 28 of the investment companies in Franklin Templeton Investments. |
| | | | |
Aliya S. Gordon (1973) One Franklin Parkway San Mateo, CA 94403-1906 | | Vice President | | Since 2009 | | Not Applicable | | Not Applicable |
| | |
| Principal Occupation During at Least the Past 5 Years: | | | | |
Senior Associate General Counsel, Franklin Templeton Investments; and officer of 44 of the investment companies in Franklin Templeton Investments. |
| | | | |
Steven J. Gray (1955) One Franklin Parkway San Mateo, CA 94403-1906 | | Vice President | | Since 2009 | | Not Applicable | | Not Applicable |
| | |
| Principal Occupation During at Least the Past 5 Years: | | | | |
Senior Associate General Counsel, Franklin Templeton Investments; Vice President, Franklin Templeton Distributors, Inc. and FASA, LLC; and officer of 44 of the investment companies in Franklin Templeton Investments. |
| | | | |
Matthew T. Hinkle (1971) One Franklin Parkway San Mateo, CA 94403-1906 | | Chief Executive Officer – Finance and Administration | | Since 2017 | | Not Applicable | | Not Applicable |
| | |
| Principal Occupation During at Least the Past 5 Years: | | | | |
Senior Vice President, Franklin Templeton Services, LLC; officer of 44 of the investment companies in Franklin Templeton Investments; andformerly, Vice President, Global Tax (2012-April 2017) and Treasurer/Assistant Treasurer, Franklin Templeton Investments (2009-2017). |
| | | | |
Edward B. Jamieson (1948) One Franklin Parkway San Mateo, CA 94403-1906 | | President and Chief Executive Officer – Investment Management | | Since 2010 | | Not Applicable | | Not Applicable |
| | |
| Principal Occupation During at Least the Past 5 Years: | | | | |
President and Director, Franklin Advisers, Inc.; Executive Vice President, Franklin Templeton Institutional, LLC; and officer and/or trustee, as the case may be, of some of the other subsidiaries of Franklin Resources, Inc. and of 10 of the investment companies in Franklin Templeton Investments. |
| | | | |
Robert Lim (1948) One Franklin Parkway San Mateo, CA 94403-1906 | | Vice President –AML Compliance | | Since 2016 | | Not Applicable | | Not Applicable |
| | |
| Principal Occupation During at Least the Past 5 Years: | | | | |
Vice President, Franklin Templeton Companies, LLC; Chief Compliance Officer, Franklin Templeton Distributors, Inc. and Franklin Templeton Investor Services, LLC; and officer of 44 of the investment companies in Franklin Templeton Investments. |
| | | | |
Kimberly H. Novotny (1972) 300 S.E. 2nd Street Fort Lauderdale, FL 33301-1923 | | Vice President | | Since 2013 | | Not Applicable | | Not Applicable |
| | |
| Principal Occupation During at Least the Past 5 Years: | | | | |
Associate General Counsel, Franklin Templeton Investments; Vice President and Corporate Secretary, Fiduciary Trust International of the South; Vice President, Templeton Investment Counsel, LLC; Assistant Secretary, Franklin Resources, Inc.; and officer of 44 of the investment companies in Franklin Templeton Investments. |
| | | | |
| | | |
| franklintempleton.com | | Annual Report | | 139 |
FRANKLIN CUSTODIAN FUNDS
Interested Board Members and Officers(continued)
| | | | | | | | |
Name, Year of Birth
and Address | | Position | | Length of
Time Served | | Number of Portfolios in
Fund Complex Overseen
by Board Member* | | Other Directorships Held
During at Least the Past 5 Years |
| | | | |
Robert C. Rosselot (1960) 300 S.E. 2nd Street Fort Lauderdale, FL 33301-1923 | | Chief Compliance Officer | | Since 2013 | | Not Applicable | | Not Applicable |
| | |
| Principal Occupation During at Least the Past 5 Years: | | | | |
Director, Global Compliance, Franklin Templeton Investments; Vice President, Franklin Templeton Companies, LLC; officer of 44 of the investment companies in Franklin Templeton Investments; andformerly, Senior Associate General Counsel, Franklin Templeton Investments (2007-2013); and Secretary and Vice President, Templeton Group of Funds (2004-2013). |
| | | | |
Karen L. Skidmore (1952) One Franklin Parkway San Mateo, CA 94403-1906 | | Vice President and Secretary | | Since 2006 | | Not Applicable | | Not Applicable |
| | |
| Principal Occupation During at Least the Past 5 Years: | | | | |
Senior Associate General Counsel, Franklin Templeton Investments; and officer of 44 of the investment companies in Franklin Templeton Investments. |
| | | | |
Navid J. Tofigh (1972) One Franklin Parkway San Mateo, CA 94403-1906 | | Vice President | | Since 2015 | | Not Applicable | | Not Applicable |
| | |
| Principal Occupation During at Least the Past 5 Years: | | | | |
Associate General Counsel, Franklin Templeton Investments; and officer of 44 of the investment companies in Franklin Templeton Investments. |
| | | | |
Craig S. Tyle (1960) One Franklin Parkway San Mateo, CA 94403-1906 | | Vice President | | Since 2005 | | Not Applicable | | Not Applicable |
| | |
| Principal Occupation During at Least the Past 5 Years: | | | | |
General Counsel and Executive Vice President, Franklin Resources, Inc.; and officer of some of the other subsidiaries of Franklin Resources, Inc. and of 44 of the investment companies in Franklin Templeton Investments. |
| | | | |
Lori A. Weber (1964) 300 S.E. 2nd Street Fort Lauderdale, FL 33301-1923 | | Vice President | | Since 2011 | | Not Applicable | | Not Applicable |
| | |
| Principal Occupation During at Least the Past 5 Years: | | | | |
Senior Associate General Counsel, Franklin Templeton Investments; Assistant Secretary, Franklin Resources, Inc.; Vice President and Secretary, Templeton Investment Counsel, LLC; and officer of 44 of the investment companies in Franklin Templeton Investments. |
*We base the number of portfolios on each separate series of the U.S. registered investment companies within the Franklin Templeton Investments fund complex. These portfolios have a common investment manager or affiliated investment managers.
**Gregory E. Johnson is considered to be an interested person of the Fund under the federal securities laws due to his position as an officer and director of Franklin Resources, Inc. (Resources), which is the parent company of the Fund’s investment manager and distributor. Rupert H. Johnson, Jr. is considered to be an interested person of the Fund under the federal securities laws due to his position as an officer and director and major shareholder of Resources.
Note 1: Rupert H. Johnson, Jr. is the uncle of Gregory E. Johnson.
Note 2: Officer information is current as of the date of this report. It is possible that after this date, information about officers may change.
The Sarbanes-Oxley Act of 2002 and Rules adopted by the Securities and Exchange Commission require the Fund to disclose whether the Fund’s Audit Committee includes at least one member who is an audit committee financial expert within the meaning of such Act and Rules. The Fund’s Board has determined that there is at least one such financial expert on the Audit Committee and has designated John B. Wilson as its audit committee financial expert. The Board believes that Mr. Wilson qualifies as such an expert in view of his extensive business background and experience, including service as chief financial officer of Staples, Inc. from 1992 to 1996. Mr. Wilson has been a Member and Chairman of the Fund’s Audit Committee since 2007. As a result of such background and experience, the Board believes that Mr. Wilson has acquired an understanding of generally accepted accounting principles and financial statements, the general application of such principles in connection with the accounting estimates, accruals and reserves, and analyzing and evaluating financial statements that present a breadth and level of complexity of accounting issues generally comparable to those of the Fund, as well as an understanding of internal controls and procedures for financial reporting and an understanding of audit committee functions. Mr. Wilson is an independent Board member as that term is defined under the relevant Securities and Exchange Commission Rules and Releases.
The Statement of Additional Information (SAI) includes additional information about the board members and is available, without charge, upon request. Shareholders may call (800) DIALBEN/342-5236 to request the SAI.
| | | | |
| | | |
140 | | Annual Report | | franklintempleton.com |
FRANKLIN CUSTODIAN FUNDS
Shareholder Information
Proxy Voting Policies and Procedures
The Trust’s investment manager has established Proxy Voting Policies and Procedures (Policies) that the Trust uses to determine how to vote proxies relating to portfolio securities. Shareholders may view the Trust’s complete Policies online at franklintempleton.com. Alternatively, shareholders may request copies of the Policies free of charge by calling the Proxy Group collect at (954)527-7678 or by sending a written request to: Franklin Templeton Companies, LLC, 300 S.E. 2nd Street, Fort Lauderdale, FL 33301, Attention: Proxy Group. Copies of the Trust’s proxy voting records are also made available online at franklintempleton.com and posted on the U.S. Securities and Exchange Commission’s website at sec.gov and reflect the most recent12-month period ended June 30.
Quarterly Statement of Investments
The Trust files a complete statement of investments with the U.S. Securities and Exchange Commission for the first and third quarters for each fiscal year on FormN-Q. Shareholders may view the filed FormN-Q by visiting the Commission’s website at sec.gov. The filed form may also be viewed and copied at the Commission’s Public Reference Room in Washington, DC. Information regarding the operations of the Public Reference Room may be obtained by calling(800) SEC-0330.
Householding of Reports and Prospectuses
You will receive each Fund’s financial reports every six months as well as an annual updated summary prospectus (prospectus available upon request). To reduce Fund expenses, we try to identify related shareholders in a household and send only one copy of the financial reports and summary prospectus. This process, called “householding,” will continue indefinitely unless you instruct us otherwise. If you prefer not to have these documents householded, please call us at (800)632-2301. At any time you may view current prospectuses/summary prospectuses and financial reports on our website. If you choose, you may receive these documents through electronic delivery.
| | | | |
| | | |
| franklintempleton.com | | Annual Report | | 141 |
This page intentionally left blank.
This page intentionally left blank.
This page intentionally left blank.
| | | | | | | | |

| | | | Annual Report and Shareholder Letter | | | | |
| | Franklin Custodian Funds | | | | |
| | Investment Manager | | | | |
| | Franklin Advisers, Inc. | | | | |
| | Distributor | | | | |
| | Franklin Templeton Distributors, Inc. | | | | |
| | (800) DIAL BEN®/342-5236 franklintempleton.com | | | | |
| | Shareholder Services | | | | |
| | (800)632-2301 | | | | |
| |
Authorized for distribution only when accompanied or preceded by a summary prospectus and/or prospectus. Investors should carefully consider a fund’s investment goals, risks, charges and expenses before investing. A prospectus contains this and other information; please read it carefully before investing. To help ensure we provide you with quality service, all calls to and from our service areas are monitored and/or recorded | | |
| | |
© 2018 Franklin Templeton Investments. All rights reserved. | | FCF A 11/18 | | |
Contents
Annual Report
Franklin Focused Growth Fund
We are pleased to bring you Franklin Focused Growth Fund’s annual report for the fiscal year ended September 30, 2018.
Your Fund’s Goal and Main Investments
The Fund seeks capital appreciation by investing in a focused portfolio of approximately 20–50 stocks that the investment manager believes offer a compellingtrade-off between growth opportunity, business and financial risk and valuation.
Performance Overview
For the period under review, the Fund’s Advisor Class shares delivered a +29.04% cumulative total return. In comparison, the Russell 1000® Growth Index, which measures performance of those Russell 1000® Index companies with higherprice-to-book ratios and higher forecasted growth values, generated a +26.30% total return.1 You can find more of the Fund’s performance data in the Performance Summary beginning on page 5.
Performance data represent past performance, which does not guarantee future results. Investment return and principal value will fluctuate, and you may have a gain or loss when you sell your shares. Current performance may differ from figures shown.
Economic and Market Overview
The U.S. economy grew during the 12 months under review. The economy grew faster in 2018’s second quarter, driven by consumer spending, business investment, exports and government spending, but moderated in the third quarter due to declines in exports and housing investment. The manufacturing and services sectors expanded during the period. The unemployment rate declined from 4.2% in September 2017, as reported at the beginning of the12-month period, to a nearly49-year low of 3.7% atperiod-end.2 Annual inflation, as measured by the Consumer Price Index, increased from 2.2% in September 2017, as reported at the beginning of the period, to 2.3% atperiod-end.2
Portfolio Composition
Based on Total Net Assets as of 9/30/18
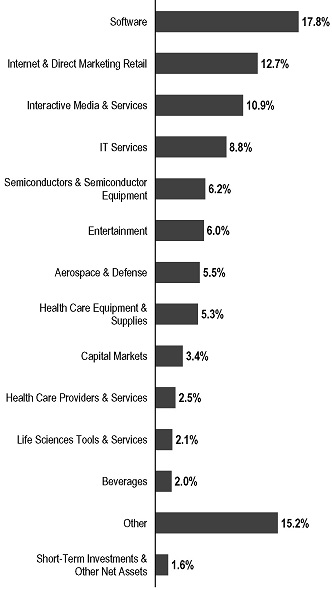
The U.S. Federal Reserve (Fed) began reducing its balance sheet in October 2017 as part of an ongoing effort to normalize its monetary policy. At its December 2017 meeting, the Fed raised its target range for the federal funds rate 0.25%. In his
1. Source: Morningstar. Frank Russell Company is the source and owner of the trademarks, service marks and copyrights related to the Russell Indexes. Russell® is a trademark of Frank Russell Company.
The index is unmanaged and includes reinvestment of any income or distributions. It does not reflect any fees, expenses or sales charges. One cannot invest directly in an index, and an index is not representative of the Fund’s portfolio.
2. Source: U.S. Bureau of Labor Statistics.
The dollar value, number of shares or principal amount, and names of all portfolio holdings are listed in the Fund’s Statement of Investments (SOI).
The SOI begins on page 10.
FRANKLIN FOCUSED GROWTH FUND
congressional testimonies in February and July 2018, as well as at the Fed symposium in August, Fed Chair Jerome Powell reiterated the Fed’s intention to gradually raise interest rates. As widely expected, the Fed further raised its target range for the federal funds rate 0.25% each at its March, June and September 2018 meetings, to 2.00%–2.25%. At its September meeting, the Fed raised its forecast for U.S. economic growth in 2018 and 2019 and projected one more rate increase in 2018.
U.S. equity markets rose overall during the period, benefiting from mostly upbeat economic data and better U.S. corporate earnings. Markets were also supported by the expectations of gradual rate increases and the passage of the U.S. tax reform bill. After reaching record highs in January 2018, U.S. stocks declined amid concerns that strong economic growth and rising inflation would lead the Fed to increase its target rate faster than expected, as well as fears of tighter regulation of information technology (IT) and technology-related companies. Other factors that curbed investor sentiment included tensions between the U.S. and North Korea at certain times during the period, political uncertainties in the U.S., the Trump administration’s protectionist policies and escalating trade tensions between the U.S. and China. Partially offsetting these concerns were an overall easing of tensions in the Korean peninsula in the latter part of the period, intermittent U.S.-China trade negotiations, an agreement between the U.S. and European Union to try to reduce trade barriers and a trade deal between the U.S. and Mexico that Canada joined atperiod-end. In this environment, the broad U.S. stock market, as measured by the Standard & Poor’s® 500 Index, reached a newall-time high in September and generated a +17.91% total return for the12-month period.3
Investment Strategy
We are research-driven,bottom-up fundamental investors. Under normal market conditions, we invest predominantly in equity securities of companies that we believe offer compelling growth opportunities. The equity securities in which we invest are predominantly common stock. We may invest in companies of any size, including small and medium capitalization companies. In addition to our main investments, we may invest a portion (up to 25%) of net assets in foreign securities, including those located in emerging markets. We generally seek to maintain a portfolio consisting of securities of approximately 20–50 companies. Although we seek
| | | | |
| Top 10 Holdings | |
9/30/18 | |
Company Sector/Industry | | % of Total Net Assets | |
| |
Amazon.com Inc. Internet & Direct Marketing Retail | | | 10.2% | |
| |
Visa Inc. IT Services | | | 7.0% | |
| |
Alphabet Inc. Interactive Media & Services | | | 5.6% | |
| |
Microsoft Corp. Software | | | 5.3% | |
| |
Adobe Systems Inc. Software | | | 5.0% | |
| |
Salesforce.com Inc. Software | | | 4.4% | |
| |
ServiceNow Inc. Software | | | 2.9% | |
| |
Raytheon Co. Aerospace & Defense | | | 2.9% | |
| |
Facebook Inc. Interactive Media & Services | | | 2.7% | |
| |
NVIDIA Corp. Semiconductors & Semiconductor Equipment | | | 2.6% | |
investments across a number of sectors, from time to time, based on economic conditions, we may have significant positions in particular sectors.
Manager’s Discussion
During the period under review, most sectors contributed to the Fund’s absolute performance, including IT, consumer discretionary and communication services.4 In the IT sector, digital marketing and media company Adobe Systems, payments technology company Visa, and software and IT services company Microsoft benefited results. Visa reported better-than-expected fiscal results in the first and second quarters of 2018 due to acceleration in debit, credit and cross border payment volume growth.
In the consumer discretionary sector, online retail shopping and cloud services provider Amazon.com contributed significantly to performance as it reported better-than-expected revenue and operating profits in the first quarter of 2018. Highlights included accelerating growth at its market-leading cloud business Amazon Web Services (AWS), as well as retail strength driven by advertising and its Prime service. Improved
3. Source: Morningstar.
4. The IT sector comprises IT services; semiconductors and semiconductor equipment; and software in the SOI. The consumer discretionary sector comprises hotels, restaurants and leisure; internet and direct marketing retail; and textiles, apparel and luxury goods in the SOI. The communication services sector comprises entertainment, interactive media and services, and media in the SOI.
FRANKLIN FOCUSED GROWTH FUND
utilization in its fulfillment and data centers drove margins higher for the period, while the mix shift toward higher margin businesses continued to drive higher profitability over time. Withe-commerce in its early days, we do not underestimate the growth and sustainability of Amazon.com, which continues to add new categories and countries to its footprint. The company also continues to see accelerated growth in AWS, which we consider a leader inInfrastructure-as-a-Service cloud computing. Athletic footwear designer and marketer NIKE also benefited results.
In the communication services sector, internet streaming service Netflix; Alphabet, the holding company of leading search-engine provider Google; and computer game developer Activision Blizzard contributed to performance.
In contrast, the materials, financials and real estate sectors detracted from the Fund’s absolute performance.5 In the materials sector, specialty chemical manufacturer Albemarle hurt results.6
In the financials sector, diversified financial services provider First Republic Bank6 and global investment management company BlackRock detracted from performance. CBOE Global Markets, an options exchange operator, also hurt results.6
In real estate, data center provider Equinix also detracted from performance, as uncertainty over the company’s future growth rate persisted and margins were impacted by increased investment in the business.6
Elsewhere, biopharmaceutical company Celgene hurt results, as its application to the U.S. Food and Drug Administration for Ozanimod, a new drug to treat multiple sclerosis and inflammatory bowel disease, was rejected during the period.6 In addition, concerns over patent expirations in coming years dampened investor sentiment. Broadband communications services provider Charter Communications hurt results as well. Despite solid first-quarter revenues, Charter’s shares fell, largely due to deteriorating subscriber trends following better results in the prior quarter, a lack of free cash flow generation,
and a delay in material improvements amid ongoing competition and industry challenges.
| | |
 | |  Matthew J. Moberg, CPA Portfolio Manager |
The foregoing information reflects our analysis, opinions and portfolio holdings as of September 30, 2018, the end of the reporting period. The way we implement our main investment strategies and the resulting portfolio holdings may change depending on factors such as market and economic conditions. These opinions may not be relied upon as investment advice or an offer for a particular security. The information is not a complete analysis of every aspect of any market, country, industry, security or the Fund. Statements of fact are from sources considered reliable, but the investment manager makes no representation or warranty as to their completeness or accuracy. Although historical performance is no guarantee of future results, these insights may help you understand our investment management philosophy.
5. There are no companies in the materials sector atperiod-end. The financials sector comprises capital markets in the SOI. The real estate sector comprises equity real estate investment trusts in the SOI.
6. Not held atperiod-end.
See www.franklintempletondatasources.com for additional data provider information.
FRANKLIN FOCUSED GROWTH FUND
Performance Summary as of September 30, 2018
The performance table and graph do not reflect any taxes that a shareholder would pay on Fund dividends, capital gain distributions, if any, or any realized gains on the sale of Fund shares. Total return reflects reinvestment of the Fund’s dividends and capital gain distributions, if any, and any unrealized gains or losses. Your dividend income will vary depending on dividends or interest paid by securities in the Fund’s portfolio, adjusted for operating expenses. Capital gain distributions are net profits realized from the sale of portfolio securities.
Performance as of 9/30/181
Cumulative total return excludes sales charges. Average annual total return includes maximum sales charges. Sales charges will vary depending on the size of the investment and the class of share purchased. Advisor Class shares are offered without sales charges.
| | | | | | | | |
| Share Class | | Cumulative Total Return2 | | Average Annual Total Return3 | |
| | |
Advisor | | | | | | | | |
1-Year | | | +29.04% | | | | +29.04% | |
Since Inception (4/12/16) | | | +73.01% | | | | +24.87% | |
Performance data represent past performance, which does not guarantee future results. Investment return and principal value will fluctuate, and you may have a gain or loss when you sell your shares. Current performance may differ from figures shown.
See page 7 for Performance Summary footnotes.
FRANKLIN FOCUSED GROWTH FUND
PERFORMANCE SUMMARY
Total Return Index Comparison for a Hypothetical $10,000 Investment1
Total return represents the change in value of an investment over the periods shown. It includes any applicable maximum sales charge, Fund expenses, account fees and reinvested distributions. The unmanaged index includes reinvestment of any income or distributions. It differs from the Fund in composition and does not pay management fees or expenses. One cannot invest directly in an index.
Advisor Class(4/12/16–9/30/18)
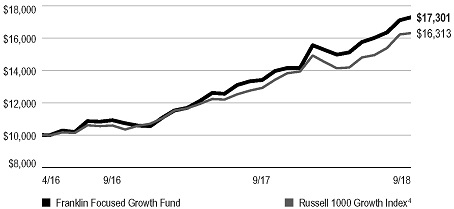
See page 7 for Performance Summary footnotes.
FRANKLIN FOCUSED GROWTH FUND
PERFORMANCE SUMMARY
Total Annual Operating Expenses5
| | | | | | | | |
| Share Class | | With Waiver | | | Without Waiver | |
Advisor | | | 1.00 | % | | | 2.56% | |
All investments involve risks, including possible loss of principal. The market values of securities or other investments owned by the Fund will go up or down, sometimes rapidly or unpredictably. Growth stock prices reflect projections of future earnings or revenues, and can, therefore, fall dramatically if the company fails to meet those projections. To the extent the Fund focuses on particular countries, regions, industries, sectors or types of investment from time to time, it may be subject to greater risks of adverse developments in such areas of focus than a fund that invests in a wider variety of countries, regions, industries, sectors or investments. Foreign securities involve special risks, including currency fluctuations and economic and political uncertainties. From time to time, the trading market for a particular security or type of security or other investments in which the Fund invests may become less liquid or even illiquid. Reduced liquidity will have an adverse impact on the Fund’s ability to sell such securities or other investments when necessary to meet the Fund’s liquidity needs or in response to a specific economic event and will also generally lower the value of a security or other investments. The Fund may also invest in small- andmid-capitalization companies, which can be particularly sensitive to changing economic conditions, and their prospects for growth are less certain than those of larger, more established companies. The Fund is actively managed but there is no guarantee that the manager’s investment decisions will produce the desired results. The Fund’s prospectus also includes a description of the main investment risks.
1. The Fund has an expense reduction contractually guaranteed through 1/31/19. Fund investment results reflect the expense reduction; without this reduction the results would have been lower.
2. Cumulative total return represents the change in value of an investment over the periods indicated.
3. Average annual total return represents the average annual change in value of an investment over the periods indicated. Return for less than one year, if any, has not been annualized.
4. Source: Morningstar. The Russell 1000 Growth Index is market capitalization weighted and measures performance of those Russell 1000® Index companies with higherprice-to-book ratios and higher forecasted growth values.
5. Figures are as stated in the Fund’s current prospectus and may differ from the expense ratios disclosed in the Your Fund’s Expenses and Financial Highlights sections in this report. In periods of market volatility, assets may decline significantly, causing total annual Fund operating expenses to become higher than the figures shown.
See www.franklintempletondatasources.com for additional data provider information.
FRANKLIN FOCUSED GROWTH FUND
Your Fund’s Expenses
As a Fund shareholder, you can incur two types of costs: (1) transaction costs, including sales charges (loads) on Fund purchases and redemptions; and (2) ongoing Fund costs, including management fees, distribution and service(12b-1) fees, and other Fund expenses. All mutual funds have ongoing costs, sometimes referred to as operating expenses. The table below shows ongoing costs of investing in the Fund and can help you understand these costs and compare them with those of other mutual funds. The table assumes a $1,000 investment held for the six months indicated.
Actual Fund Expenses
The table below provides information about actual account values and actual expenses in the columns under the heading “Actual.” In these columns the Fund’s actual return, which includes the effect of Fund expenses, is used to calculate the “Ending Account Value.” You can estimate the expenses you paid during the period by following these steps (ofcourse, your account value and expenses will differ from those in this illustration):Divide your account value by $1,000 (ifyour account had an $8,600 value, then $8,600 ÷ $1,000 = 8.6). Then multiply the result by the number in the row for your class of shares under the headings “Actual” and “Expenses Paid During Period” (ifActual Expenses Paid During Period were $7.50, then 8.6 x $7.50 = $64.50). In this illustration, the actual expenses paid this period are $64.50.
Hypothetical Example for Comparison with Other Funds
Under the heading “Hypothetical” in the table, information is provided about hypothetical account values and hypothetical expenses based on the Fund’s actual expense ratio and an assumed rate of return of 5% per year before expenses, which is not the Fund’s actual return. This information may not be used to estimate the actual ending account balance or expenses you paid for the period, but it can help you compare ongoing costs of investing in the Fund with those of other funds. To do so, compare this 5% hypothetical example for the class of shares you hold with the 5% hypothetical examples that appear in the shareholder reports of other funds.
Please note that expenses shown in the table are meant to highlight ongoing costs and do not reflect any transactional costs. Therefore, information under the heading “Hypothetical” is useful in comparing ongoing costs only, and will not help you compare total costs of owning different funds. In addition, if transactional costs were included, your total costs would have been higher.
| | | | | | | | | | | | | | | | | | |
| | | | | | | Actual (actual return after expenses) | | | | Hypothetical (5% annual return before expenses) | | | | |
Share Class | | Beginning Account Value | | | | Ending Account Value 9/30/18 | | Expenses Paid During Period1,2 | | | | Ending Account Value 9/30/18 | | Expenses Paid During Period 4/1/18–9/30/181,2 | | | | Net Annualized Expense Ratio2 |
Advisor | | $1,000 | | | | $1,155.50 | | $5.40 | | | | $1,020.05 | | $5.06 | | | | 1.00% |
1. Expenses are equal to the annualized expense ratio for thesix-month period as indicated above—in the far right column—multiplied by the simple average account value over the period indicated, and then multiplied by 183/365 to reflect theone-half year period.
2. Reflects expenses after fee waivers and expense reimbursements. Does not include acquired fund fees and expenses.
FRANKLIN CUSTODIAN FUNDS
Financial Highlights
Franklin Focused Growth Fund
| | | | | | | | | | | | |
| | | Year Ended September 30, | |
| | | 2018 | | | 2017 | | | 2016a | |
| | | |
Advisor Class | | | | | | | | | | | | |
| | | |
Per share operating performance | | | | | | | | | | | | |
(for a share outstanding throughout the year) | | | | | | | | | | | | |
| | | |
Net asset value, beginning of year | | | $13.36 | | | | $10.93 | | | | $10.00 | |
| | | |
Income from investment operationsb: | | | | | | | | | | | | |
Net investment income (loss)c | | | (0.05 | ) | | | (0.02 | ) | | | (0.01 | ) |
Net realized and unrealized gains (losses) | | | 3.93 | | | | 2.49 | | | | 0.94 | |
| | | |
Total from investment operations. | | | 3.88 | | | | 2.47 | | | | 0.93 | |
| | | |
Less distributions from: | | | | | | | | | | | | |
Net investment income | | | — | | | | (0.01 | ) | | | — | |
Net realized gains | | | — | | | | (0.03 | ) | | | — | |
| | | |
Total distributions | | | — | | | | (0.04 | ) | | | — | |
| | | |
Net asset value, end of year | | | $17.24 | | | | $13.36 | | | | $10.93 | |
| | | |
Total returnd | | | 29.04% | | | | 22.78% | | | | 9.30% | |
| | | |
Ratios to average net assetse | | | | | | | | | | | | |
Expenses before waiver and payments by affiliates | | | 2.23% | | | | 2.31% | | | | 4.76% | |
Expenses net of waiver and payments by affiliates | | | 1.00% | f | | | 1.00% | f | | | 1.00% | |
Net investment income (loss) | | | (0.34)% | | | | (0.20)% | | | | (0.18)% | |
| | | |
Supplemental data | | | | | | | | | | | | |
Net assets, end of year (000’s) | | | $4,310 | | | | $3,341 | | | | $2,732 | |
Portfolio turnover rate | | | 14.47% | | | | 28.48% | | | | 7.46% | |
aFor the period April 12, 2016 (commencement of operations) to September 30, 2016.
bThe amount shown for a share outstanding throughout the period may not correlate with the Statement of Operations for the period due to the timing of sales and repurchases of the Fund’s shares in relation to income earned and/or fluctuating fair value of the investments of the Fund.
cBased on average daily shares outstanding.
dTotal return is not annualized for periods less than one year.
eRatios are annualized for periods less than one year, except fornon-recurring expenses, if any.
fBenefit of expense reduction rounds to less than 0.01%.
| | | | |
| | | |
9 | | Annual Report | The accompanying notes are an integral part of these financial statements. | | |
FRANKLIN CUSTODIAN FUNDS
Statement of Investments, September 30, 2018
Franklin Focused Growth Fund
| | | | | | | | | | |
| | | Country | | Shares | | | Value | |
| | | |
Common Stocks 98.4% | | | | | | | | | | |
Aerospace & Defense 5.5% | | | | | | | | | | |
The Boeing Co. | | United States | | | 300 | | | $ | 111,570 | |
Raytheon Co. | | United States | | | 600 | | | | 123,996 | |
| | | | | | | | | 235,566 | |
Beverages 2.0% | | | | | | | | | | |
Constellation Brands Inc., A | | United States | | | 400 | | | | 86,248 | |
Capital Markets 3.4% | | | | | | | | | | |
BlackRock Inc. | | United States | | | 100 | | | | 47,133 | |
The Charles Schwab Corp. | | United States | | | 2,000 | | | | 98,300 | |
| | | | | | | | | 145,433 | |
Electrical Equipment 0.9% | | | | | | | | | | |
Rockwell Automation Inc. | | United States | | | 200 | | | | 37,504 | |
Entertainment 6.0% | | | | | | | | | | |
Activision Blizzard Inc. | | United States | | | 1,200 | | | | 99,828 | |
aNetflix Inc. | | United States | | | 300 | | | | 112,239 | |
aSpotify Technology SA | | United States | | | 250 | | | | 45,207 | |
| | | | | | | | | 257,274 | |
Equity Real Estate Investment Trusts (REITs) 1.7% | | | | | | | | | | |
American Tower Corp. | | United States | | | 500 | | | | 72,650 | |
Food & Staples Retailing 1.9% | | | | | | | | | | |
Costco Wholesale Corp. | | United States | | | 350 | | | | 82,208 | |
Health Care Equipment & Supplies 5.3% | | | | | | | | | | |
Danaher Corp. | | United States | | | 700 | | | | 76,062 | |
aIDEXX Laboratories Inc. | | United States | | | 350 | | | | 87,381 | |
aIntuitive Surgical Inc. | | United States | | | 100 | | | | 57,400 | |
aNeuronetics Inc. | | United States | | | 200 | | | | 6,412 | |
| | | | | | | | | 227,255 | |
Health Care Providers & Services 2.5% | | | | | | | | | | |
UnitedHealth Group Inc. | | United States | | | 400 | | | | 106,416 | |
Hotels, Restaurants & Leisure 0.9% | | | | | | | | | | |
Vail Resorts Inc. | | United States | | | 150 | | | | 41,163 | |
Industrial Conglomerates 1.5% | | | | | | | | | | |
3M Co. | | United States | | | 300 | | | | 63,213 | |
Interactive Media & Services 10.9% | | | | | | | | | | |
aAlphabet Inc., A | | United States | | | 200 | | | | 241,416 | |
aEventbrite Inc., A | | United States | | | 200 | | | | 7,594 | |
aFacebook Inc., A | | United States | | | 700 | | | | 115,122 | |
a,bMeituan Dianping, Reg S, B | | China | | | 500 | | | | 4,388 | |
Tencent Holdings Ltd. | | China | | | 2,500 | | | | 103,212 | |
| | | | | | | | | 471,732 | |
Internet & Direct Marketing Retail 12.7% | | | | | | | | | | |
aAlibaba Group Holding Ltd., ADR | | China | | | 400 | | | | 65,904 | |
aAmazon.com Inc. | | United States | | | 220 | | | | 440,660 | |
aBooking Holdings Inc. | | United States | | | 20 | | | | 39,680 | |
| | | | | | | | | 546,244 | |
FRANKLIN CUSTODIAN FUNDS
STATEMENT OF INVESTMENTS
Franklin Focused Growth Fund(continued)
| | | | | | | | | | |
| | | Country | | Shares | | | Value | |
| | | |
Common Stocks(continued) | | | | | | | | | | |
IT Services 8.8% | | | | | | | | | | |
aAdyen NV | | Netherlands | | | 100 | | | $ | 81,615 | |
Visa Inc., A | | United States | | | 2,000 | | | | 300,180 | |
| | | | | | | | | 381,795 | |
Life Sciences Tools & Services 2.1% | | | | | | | | | | |
aMettler-Toledo International Inc. | | United States | | | 150 | | | | 91,347 | |
Machinery 1.9% | | | | | | | | | | |
Fortive Corp. | | United States | | | 1,000 | | | | 84,200 | |
Media 1.5% | | | | | | | | | | |
aCharter Communications Inc., A | | United States | | | 200 | | | | 65,176 | |
Oil, Gas & Consumable Fuels 1.1% | | | | | | | | | | |
aConcho Resources Inc. | | United States | | | 300 | | | | 45,825 | |
Personal Products 1.7% | | | | | | | | | | |
Estee Lauder Cos. Inc., A | | United States | | | 500 | | | | 72,660 | |
Pharmaceuticals 0.1% | | | | | | | | | | |
aElanco Animal Health Inc. | | United States | | | 200 | | | | 6,978 | |
Professional Services 1.0% | | | | | | | | | | |
aVerisk Analytics Inc. | | United States | | | 350 | | | | 42,193 | |
Semiconductors & Semiconductor Equipment 6.2% | | | | | | | | | | |
Analog Devices Inc. | | United States | | | 800 | | | | 73,968 | |
NVIDIA Corp. | | United States | | | 400 | | | | 112,408 | |
Xilinx Inc. | | United States | | | 1,000 | | | | 80,170 | |
| | | | | | | | | 266,546 | |
Software 17.8% | | | | | | | | | | |
aAdobe Systems Inc. | | United States | | | 800 | | | | 215,960 | |
Microsoft Corp. | | United States | | | 2,000 | | | | 228,740 | |
aPluralsight Inc., A | | United States | | | 100 | | | | 3,200 | |
aSalesforce.com Inc. | | United States | | | 1,200 | | | | 190,836 | |
aServiceNow Inc. | | United States | | | 650 | | | | 127,159 | |
aSVMK Inc. | | United States | | | 100 | | | | 1,603 | |
| | | | | | | | | 767,498 | |
Textiles, Apparel & Luxury Goods 1.0% | | | | | | | | | | |
NIKE Inc., B | | United States | | | 500 | | | | 42,360 | |
Total Common Stocks (Cost $2,423,556) | | | | | | | | | 4,239,484 | |
FRANKLIN CUSTODIAN FUNDS
STATEMENT OF INVESTMENTS
Franklin Focused Growth Fund(continued)
| | | | | | | | | | |
| | | Country | | Shares | | | Value | |
| | | |
Short Term Investments (Cost $89,859) 2.1% | | | | | | | | | | |
| | | |
Money Market Funds 2.1% | | | | | | | | | | |
c,dInstitutional Fiduciary Trust Money Market Portfolio, 1.69% | | United States | | | 89,859 | | | $ | 89,859 | |
Total Investments (Cost $2,513,415) 100.5% | | | | | | | | | 4,329,343 | |
Other Assets, less Liabilities (0.5)% | | | | | | | | | (19,411 | ) |
Net Assets 100.0% | | | | | | | | $ | 4,309,932 | |
See Abbreviations on page 22.
aNon-income producing.
bSecurity was purchased pursuant to Regulation S under the Securities Act of 1933, which exempts from registration securities offered and sold outside of the United States. Such a security cannot be sold in the United States without either an effective registration statement filed pursuant to the Securities Act of 1933, or pursuant to an exemption from registration. This security has been deemed liquid under guidelines approved by the Trust’s Board of Trustees. At September 30, 2018, the value of this security was $4,388, representing 0.1% of net assets.
cSee Note 3(e) regarding investments in affiliated management investment companies.
dThe rate shown is the annualizedseven-day effective yield at period end.
| | | | |
| | | |
| | The accompanying notes are an integral part of these financial statements. | Annual Report | | 12 |
FRANKLIN CUSTODIAN FUNDS
Financial Statements
Statement of Assets and Liabilities
September 30, 2018
Franklin Focused Growth Fund
| | | | |
Assets: | | | | |
Investments in securities: | | | | |
Cost - Unaffiliated issuers | | | $2,423,556 | |
Cost -Non-controlled affiliates (Note 3e) | | | 89,859 | |
| | | | |
| |
Value - Unaffiliated issuers | | | $4,239,484 | |
Value -Non-controlled affiliates (Note 3e) | | | 89,859 | |
Receivables: | | | | |
Dividends | | | 607 | |
Affiliates. | | | 14,334 | |
Other assets | | | 2 | |
| | | | |
| |
Total assets | | | 4,344,286 | |
| | | | |
| |
Liabilities: | | | | |
Payables: | | | | |
Professional fees | | | 32,898 | |
Accrued expenses and other liabilities | | | 1,456 | |
| | | | |
| |
Total liabilities | | | 34,354 | |
| | | | |
| |
Net assets, at value | | | $4,309,932 | |
| | | | |
| |
Net assets consist of: | | | | |
Paid-in capital | | | $2,486,568 | |
Total distributable earnings (loss) | | | 1,823,364 | |
| | | | |
| |
Net assets, at value | | | $4,309,932 | |
| | | | |
| |
Shares outstanding | | | 250,000 | |
| | | | |
Net asset value and maximum offering price per share | | | $17.24 | |
| | | | |
| | | | |
| | | |
13 | | Annual Report | The accompanying notes are an integral part of these financial statements. | | |
FRANKLIN CUSTODIAN FUNDS
FINANCIAL STATEMENTS
Statement of Operations
for the year ended September 30, 2018
Franklin Focused Growth Fund
| | | | |
Investment income: | | | | |
Dividends: | | | | |
Unaffiliated issuers | | | $ 23,860 | |
Non-controlled affiliates (Note 3e) | | | 1,336 | |
| | | | |
Total investment income | | | 25,196 | |
| | | | |
Expenses: | | | | |
Management fees (Note 3a) | | | 32,528 | |
Transfer agent fees (Note 3d) | | | 708 | |
Custodian fees (Note 4) | | | 53 | |
Reports to shareholders | | | 5,564 | |
Registration and filing fees | | | 137 | |
Professional fees | | | 41,484 | |
Other | | | 4,780 | |
| | | | |
Total expenses | | | 85,254 | |
Expense reductions (Note 4) | | | (31 | ) |
Expenses waived/paid by affiliates (Note 3f) | | | (46,950 | ) |
| | | | |
Net expenses | | | 38,273 | |
| | | | |
Net investment income (loss) | | | (13,077 | ) |
| | | | |
Realized and unrealized gains (losses): | | | | |
Net realized gain (loss) from: | | | | |
Investments: | | | | |
Unaffiliated issuers | | | 33,321 | |
Foreign currency transactions | | | 50 | |
| | | | |
Net realized gain (loss) | | | 33,371 | |
| | | | |
Net change in unrealized appreciation (depreciation) on: | | | | |
Investments: | | | | |
Unaffiliated issuers | | | 949,113 | |
| | | | |
Net realized and unrealized gain (loss) | | | 982,484 | |
| | | | |
Net increase (decrease) in net assets resulting from operations | | | $969,407 | |
| | | | |
| | | | |
| | | |
| | The accompanying notes are an integral part of these financial statements. | Annual Report | | 14 |
FRANKLIN CUSTODIAN FUNDS
FINANCIAL STATEMENTS
Statements of Changes in Net Assets
Franklin Focused Growth Fund
| | | | | | | | |
| | | Year Ended September 30, | |
| | | | |
| | | 2018 | | | 2017 | |
| |
Increase (decrease) in net assets: | | | | | | | | |
Operations: | | | | | | | | |
Net investment income (loss) | | | $ (13,077 | ) | | | $ (6,004 | ) |
Net realized gain (loss) | | | 33,371 | | | | (15,522 | ) |
Net change in unrealized appreciation (depreciation) | | | 949,113 | | | | 639,454 | |
| | | | |
Net increase (decrease) in net assets resulting from operations | | | 969,407 | | | | 617,928 | |
| | | | |
Distributions to shareholders (Note 1d) | | | — | | | | (9,475 | ) |
| | | | |
Net increase (decrease) in net assets | | | 969,407 | | | | 608,453 | |
Net assets: | | | | | | | | |
Beginning of year | | | 3,340,525 | | | | 2,732,072 | |
| | | | |
End of year (Note 1d) | | | $4,309,932 | | | | $3,340,525 | |
| | | | |
| | | | |
| | | |
15 | | Annual Report | The accompanying notes are an integral part of these financial statements. | | |
FRANKLIN CUSTODIAN FUNDS
Notes to Financial Statements
Franklin Focused Growth Fund
1. Organization and Significant Accounting Policies
Franklin Custodian Funds (Trust) is registered under the Investment Company Act of 1940 (1940 Act) as anopen-end management investment company, consisting of six separate funds and applies the specialized accounting and reporting guidance in U.S. Generally Accepted Accounting Principles (U.S. GAAP). Franklin Focused Growth Fund (Fund) is included in this report. The Fund has five classes of shares: Class A, Class C, Class R, Class R6, and Advisor Class. Each class of shares may differ by its initial sales load, contingent deferred sales charges, voting rights on matters affecting a single class, its exchange privilege and fees due to differing arrangements for distribution and transfer agent fees.
The Fund currently operates with one class of shares, Advisor Class.
The following summarizes the Fund’s significant accounting policies.
a. Financial Instrument Valuation
The Fund’s investments in financial instruments are carried at fair value daily. Fair value is the price that would be received to sell an asset or paid to transfer a liability in an orderly transaction between market participants on the measurement date. The Fund calculates the net asset value (NAV) per share each business day as of 4 p.m. Eastern time or the regularly scheduled close of the New York Stock Exchange (NYSE), whichever is earlier. Under compliance policies and procedures approved by the Trust’s Board of Trustees (the Board), the Fund’s administrator has responsibility for oversight of valuation, including leading the cross-functional Valuation Committee (VC). The VC provides administration and oversight of the Fund’s valuation policies and procedures, which are approved annually by the Board. Among other things, these procedures allow the Fund to utilize independent pricing services, quotations from securities and financial instrument dealers, and other market sources to determine fair value.
Equity securities listed on an exchange or on the NASDAQ National Market System are valued at the last quoted sale price or the official closing price of the day, respectively. Foreign equity securities are valued as of the close of trading on the foreign stock exchange on which the security is primarily traded, or as of 4 p.m. Eastern time. The value is then converted into its U.S. dollar equivalent at the foreign exchange rate in
effect at 4 p.m. Eastern time on the day that the value of the security is determined.Over-the-counter (OTC) securities are valued within the range of the most recent quoted bid and ask prices. Securities that trade in multiple markets or on multiple exchanges are valued according to the broadest and most representative market. Certain equity securities are valued based upon fundamental characteristics or relationships to similar securities.
Investments inopen-end mutual funds are valued at the closing NAV.
The Fund has procedures to determine the fair value of financial instruments for which market prices are not reliable or readily available. Under these procedures, the VC convenes on a regular basis to review such financial instruments and considers a number of factors, including significant unobservable valuation inputs, when arriving at fair value. The VC primarily employs a market-based approach which may use related or comparable assets or liabilities, recent transactions, market multiples, book values, and other relevant information for the investment to determine the fair value of the investment. An income-based valuation approach may also be used in which the anticipated future cash flows of the investment are discounted to calculate fair value. Discounts may also be applied due to the nature or duration of any restrictions on the disposition of the investments. Due to the inherent uncertainty of valuations of such investments, the fair values may differ significantly from the values that would have been used had an active market existed. The VC employs various methods for calibrating these valuation approaches including a regular review of key inputs and assumptions, transactional back-testing or disposition analysis, and reviews of any related market activity.
Trading in securities on foreign securities stock exchanges and OTC markets may be completed before 4 p.m. Eastern time. In addition, trading in certain foreign markets may not take place on every Fund’s business day. Occasionally, events occur between the time at which trading in a foreign security is completed and 4 p.m. Eastern time that might call into question the reliability of the value of a portfolio security held by the Fund. As a result, differences may arise between the value of the Fund’s portfolio securities as determined at the foreign market close and the latest indications of value at 4 p.m. Eastern time. In order to minimize the potential for these differences, the VC monitors price movements following the close of trading in foreign stock markets through a series of country specific market proxies (such as baskets of American
FRANKLIN CUSTODIAN FUNDS
NOTES TO FINANCIAL STATEMENTS
Franklin Focused Growth Fund(continued)
1. Organization and Significant Accounting Policies(continued)
a. Financial Instrument Valuation(continued)
Depositary Receipts, futures contracts and exchange traded funds). These price movements are measured against established trigger thresholds for each specific market proxy to assist in determining if an event has occurred that may call into question the reliability of the values of the foreign securities held by the Fund. If such an event occurs, the securities may be valued using fair value procedures, which may include the use of independent pricing services.
When the last day of the reporting period is anon-business day, certain foreign markets may be open on those days that the Fund’s NAV is not calculated, which could result in differences between the value of the Fund’s portfolio securities on the last business day and the last calendar day of the reporting period. Any significant security valuation changes due to an open foreign market are adjusted and reflected by the Fund for financial reporting purposes.
b. Foreign Currency Translation
Portfolio securities and other assets and liabilities denominated in foreign currencies are translated into U.S. dollars based on the exchange rate of such currencies against U.S. dollars on the date of valuation. The Fund may enter into foreign currency exchange contracts to facilitate transactions denominated in a foreign currency. Purchases and sales of securities, income and expense items denominated in foreign currencies are translated into U.S. dollars at the exchange rate in effect on the transaction date. Portfolio securities and assets and liabilities denominated in foreign currencies contain risks that those currencies will decline in value relative to the U.S. dollar. Occasionally, events may impact the availability or reliability of foreign exchange rates used to convert the U.S. dollar equivalent value. If such an event occurs, the foreign exchange rate will be valued at fair value using procedures established and approved by the Board.
The Fund does not separately report the effect of changes in foreign exchange rates from changes in market prices on securities held. Such changes are included in net realized and unrealized gain or loss from investments in the Statement of Operations.
Realized foreign exchange gains or losses arise from sales of foreign currencies, currency gains or losses realized between the trade and settlement dates on securities transactions and the
difference between the recorded amounts of dividends, interest, and foreign withholding taxes and the U.S. dollar equivalent of the amounts actually received or paid. Net unrealized foreign exchange gains and losses arise from changes in foreign exchange rates on foreign denominated assets and liabilities other than investments in securities held at the end of the reporting period.
c. Income and Deferred Taxes
It is the Fund’s policy to qualify as a regulated investment company under the Internal Revenue Code. The Fund intends to distribute to shareholders substantially all of its taxable income and net realized gains to relieve it from federal income and excise taxes. As a result, no provision for U.S. federal income taxes is required.
The Fund may be subject to foreign taxation related to income received, capital gains on the sale of securities and certain foreign currency transactions in the foreign jurisdictions in which it invests. Foreign taxes, if any, are recorded based on the tax regulations and rates that exist in the foreign markets in which the Fund invests. When a capital gain tax is determined to apply, the Fund records an estimated deferred tax liability in an amount that would be payable if the securities were disposed of on the valuation date.
The Fund may recognize an income tax liability related to its uncertain tax positions under U.S. GAAP when the uncertain tax position has a less than 50% probability that it will be sustained upon examination by the tax authorities based on its technical merits. As of September 30, 2018, the Fund has determined that no tax liability is required in its financial statements related to uncertain tax positions for any open tax years (or expected to be taken in future tax years). Open tax years are those that remain subject to examination and are based on the statute of limitations in each jurisdiction in which the Fund invests.
d. Security Transactions, Investment Income, Expenses and Distributions
Security transactions are accounted for on trade date. Realized gains and losses on security transactions are determined on a specific identification basis. Estimated expenses are accrued daily. Dividend income is recorded on theex-dividend date except for certain dividends from securities where the dividend rate is not available. In such cases, the dividend is recorded as soon as the information is received by the Fund. Distributions to
FRANKLIN CUSTODIAN FUNDS
NOTES TO FINANCIAL STATEMENTS
Franklin Focused Growth Fund(continued)
shareholders are recorded on theex-dividend date. Distributable earnings are determined according to income tax regulations (tax basis) and may differ from earnings recorded in accordance with U.S. GAAP. These differences may be permanent or temporary. Permanent differences are reclassified among capital accounts to reflect their tax character. These reclassifications have no impact on net assets or the results of operations. Temporary differences are not reclassified, as they may reverse in subsequent periods.*
Common expenses incurred by the Trust are allocated among the Funds based on the ratio of net assets of each Fund to the combined net assets of the Trust or based on the ratio of number of shareholders of each Fund to the combined number of shareholders of the Trust. Fund specific expenses are charged directly to the Fund that incurred the expense.
Realized and unrealized gains and losses and net investment income, excluding class specific expenses, are allocated daily to each class of shares based upon the relative proportion of net assets of each class. Differences in per share distributions by class are generally due to differences in class specific expenses.
e. Accounting Estimates
The preparation of financial statements in accordance with U.S. GAAP requires management to make estimates and assumptions that affect the reported amounts of assets and liabilities at the date of the financial statements and the amounts of income and expenses during the reporting period. Actual results could differ from those estimates.
f. Guarantees and Indemnifications
Under the Trust’s organizational documents, its officers and trustees are indemnified by the Trust against certain liabilities arising out of the performance of their duties to the Trust. Additionally, in the normal course of business, the Trust, on behalf of the Fund, enters into contracts with service providers that contain general indemnification clauses. The Trust’s maximum exposure under these arrangements is unknown as this would involve future claims that may be made against the Trust that have not yet occurred. Currently, the Trust expects the risk of loss to be remote.
*Effective with the current reporting period, it is no longer required to present certain line items on the Statements of Changes in Net Assets. Such disclosure changes are included in the Statements of Changes in Net Assets, therefore prior period amounts are presented below.
For the year ended September 30, 2017, distributions to shareholders were as follows:
| | | | |
Net investment income | | $ | (2,575 | ) |
Net realized gains | | | (6,900 | ) |
For the year ended September 30, 2017, distributions in excess of net investment income included in net assets was $(6,008).
2. Shares of Beneficial Interest
At September 30, 2018, there were an unlimited number of shares authorized (without par value). During the years ended September 30, 2017 and 2018, there were no transactions of the Fund’s shares.
3. Transactions with Affiliates
Franklin Resources, Inc. is the holding company for various subsidiaries that together are referred to as Franklin Templeton Investments. Certain officers and trustees of the Trust are also officers and/or directors of the following subsidiaries:
| | |
| Subsidiary | | Affiliation |
Franklin Advisers, Inc. (Advisers) | | Investment manager |
Franklin Templeton Services, LLC (FT Services) | | Administrative manager |
Franklin Templeton Distributors, Inc. (Distributors) | | Principal underwriter |
Franklin Templeton Investor Services, LLC (Investor Services) | | Transfer agent |
FRANKLIN CUSTODIAN FUNDS
NOTES TO FINANCIAL STATEMENTS
Franklin Focused Growth Fund(continued)
3. Transactions with Affiliates(continued)
a. Management Fees
The Fund pays an investment management fee to Advisers based on the average daily net assets of the Fund as follows:
| | |
| Annualized Fee Rate | | Net Assets |
0.850% | | Up to and including $500 million |
0.800% | | Over $500 million, up to and including $1 billion |
0.750% | | Over $1 billion, up to and including $3 billion |
0.730% | | Over $3 billion, up to and including $5 billion |
0.700% | | In excess of $5 billion |
For the year ended September 30, 2018, the gross effective investment management fee rate was 0.850% of the Fund’s average daily net assets.
b. Administrative Fees
Under an agreement with Advisers, FT Services provides administrative services to the Fund. The fee is paid by Advisers based on the Fund’s average daily net assets, and is not an additional expense of the Fund.
c. Distribution Fees
The Board has adopted distribution plans for each share class, with the exception of Class R6 and Advisor Class shares, pursuant to Rule12b-1 under the 1940 Act. Under the Fund’s Class A reimbursement distribution plan, the Fund reimburses Distributors for costs incurred in connection with the servicing, sale and distribution of the Fund’s shares up to the maximum annual plan rate. Under the Class A reimbursement distribution plan, costs exceeding the maximum for the current plan year cannot be reimbursed in subsequent periods. In addition, under the Fund’s Class C and R compensation distribution plans, the Fund pays Distributors for costs incurred in connection with the servicing, sale and distribution of the Fund’s shares up to the maximum annual plan rate for each class. The plan year, for purposes of monitoring compliance with the maximum annual plan rates, is February 1 through January 31.
The maximum annual plan rates, based on the average daily net assets, for each class, are as follows:
| | | | |
Class A | | | 0.25 | % |
Class C | | | 1.00 | % |
Class R | | | 0.50 | % |
d. Transfer Agent Fees
Each class of shares pays transfer agent fees to Investor Services for its performance of shareholder servicing obligations. Effective November 1, 2017, the fees are based on an annualized asset based fee of 0.02% plus a transaction based fee. Prior to November 1, 2017, the fees were account based fees that varied based on fund or account type. In addition, each class reimburses Investor Services for out of pocket expenses incurred and, except for Class R6, reimburses shareholder servicing fees paid to third parties. These fees are allocated daily based upon their relative proportion of such classes’ aggregate net assets. Class R6 pays Investor Services transfer agent fees specific to that class.
For the year ended September 30, 2018, the Fund paid transfer agent fees of $708, which were retained by Investor Services.
FRANKLIN CUSTODIAN FUNDS
NOTES TO FINANCIAL STATEMENTS
Franklin Focused Growth Fund(continued)
e. Investments in Affiliated Management Investment Companies
The Fund invests in one or more affiliated management investment companies for purposes other than exercising a controlling influence over the management or policies. Management fees paid by the Fund are waived on assets invested in the affiliated management investment companies, as noted in the Statement of Operations, in an amount not to exceed the management and administrative fees paid directly or indirectly by each affiliate. During the year ended September 30, 2018, the Fund held investments in affiliated management investment companies as follows:
| | | | | | | | | | | | | | | | | | | | | | | | | | | | | | | | |
| | | Number of Shares Held at Beginning of Year | | | Gross Additions | | | Gross Reductions | | | Number of Shares Held at End of Year | | | Value at End of Year | | | Dividend Income | | | Realized Gain (Loss) | | | Net Change in Unrealized Appreciation (Depreciation) | |
Non-Controlled Affiliates | | | | | | | | | | | | | | | | | | | | | | | | | |
Institutional Fiduciary Trust Money Market Portfolio, 1.69% | | | 25,993 | | | | 417,969 | | | | (354,103 | ) | | | 89,859 | | | $ | 89,859 | | | | $1,336 | | | | $ — | | | | $ — | |
f. Waiver and Expense Reimbursements
Advisers has contractually agreed in advance to waive or limit its fees and to assume as its own expense certain expenses otherwise payable by the Fund so that the expenses (excluding distribution fees, acquired fund fees and expenses, and certainnon-routine expenses or costs, including those relating to litigation, indemnification, reorganizations, and liquidations) for each class of the Fund do not exceed 1.00% based on the average net assets of each class until January 31, 2019. Total expenses waived or paid are not subject to recapture subsequent to the Fund’s fiscal year end.
g. Other Affiliated Transactions
At September 30, 2018, Franklin Resources Inc. owned 100% of the Fund’s outstanding shares. Investment activities of this shareholder could have a material impact on the Fund.
4. Expense Offset Arrangement
The Fund has entered into an arrangement with its custodian whereby credits realized as a result of uninvested cash balances are used to reduce a portion of the Fund’s custodian expenses. During the year ended September 30, 2018, the custodian fees were reduced as noted in the Statement of Operations.
5. Income Taxes
For tax purposes, capital losses may be carried over to offset future capital gains.
During the year ended September 30, 2018, the Fund utilized $15,516 of capital loss carryforwards.
For tax purposes, the Fund may elect to defer any portion of a late-year ordinary loss to the first day of the following fiscal year. At September 30, 2018, the Fund deferred late-year ordinary losses of $9,695.
The tax character of distributions paid during the years ended September 30, 2018 and 2017, was as follows:
| | | | | | | | |
| | | 2018 | | | 2017 | |
Distributions paid from ordinary income | | $ | — | | | $ | 9,463 | |
FRANKLIN CUSTODIAN FUNDS
NOTES TO FINANCIAL STATEMENTS
Franklin Focused Growth Fund(continued)
5. Income Taxes(continued)
At September 30, 2018, the cost of investments, net unrealized appreciation (depreciation) and undistributed long term capital gains for income tax purposes were as follows:
| | | | |
Cost of investments | | $ | 2,513,415 | |
| | | | |
| |
Unrealized appreciation | | $ | 1,822,927 | |
Unrealized depreciation | | | (6,999 | ) |
| | | | |
| |
Net unrealized appreciation (depreciation) | | $ | 1,815,928 | |
| | | | |
| |
Distributable earnings: | | | | |
Undistributed long term capital gains | | $ | 17,129 | |
| | | | |
Differences between income and/or capital gains as determined on a book basis and a tax basis are primarily due to differing treatment of passive foreign investment company shares.
6. Investment Transactions
Purchases and sales of investments (excluding short term securities) for the year ended September 30, 2018, aggregated $537,851 and $615,325, respectively.
7. Credit Facility
The Fund, together with other U.S. registered and foreign investment funds (collectively, Borrowers), managed by Franklin Templeton Investments, are borrowers in a joint syndicated senior unsecured credit facility totaling $2 billion (Global Credit Facility) which matures on February 8, 2019. This Global Credit Facility provides a source of funds to the Borrowers for temporary and emergency purposes, including the ability to meet future unanticipated or unusually large redemption requests.
Under the terms of the Global Credit Facility, the Fund shall, in addition to interest charged on any borrowings made by the Fund and other costs incurred by the Fund, pay its share of fees and expenses incurred in connection with the implementation and maintenance of the Global Credit Facility, based upon its relative share of the aggregate net assets of all of the Borrowers, including an annual commitment fee of 0.15% based upon the unused portion of the Global Credit Facility. These fees are reflected in other expenses in the Statement of Operations. During the year ended September 30, 2018, the Fund did not use the Global Credit Facility.
8. Fair Value Measurements
The Fund follows a fair value hierarchy that distinguishes between market data obtained from independent sources (observable inputs) and the Fund’s own market assumptions (unobservable inputs). These inputs are used in determining the value of the Fund’s financial instruments and are summarized in the following fair value hierarchy:
| | • | | Level 1 – quoted prices in active markets for identical financial instruments |
| | • | | Level 2 – other significant observable inputs (including quoted prices for similar financial instruments, interest rates, prepayment speed, credit risk, etc.) |
| | • | | Level 3 – significant unobservable inputs (including the Fund’s own assumptions in determining the fair value of financial instruments) |
The input levels are not necessarily an indication of the risk or liquidity associated with financial instruments at that level.
FRANKLIN CUSTODIAN FUNDS
NOTES TO FINANCIAL STATEMENTS
Franklin Focused Growth Fund(continued)
For movements between the levels within the fair value hierarchy, the Fund has adopted a policy of recognizing the transfers as of the date of the underlying event which caused the movement.
At September 30, 2018, all of the Fund’s investments in financial instruments carried at fair value were valued using Level 1 inputs. For detailed categories, see the accompanying Statement of Investments.
9. New Accounting Pronouncements
In August 2018, the Financial Accounting Standards Board issued Accounting Standards Update (ASU)No. 2018-13, Fair Value Measurement (Topic 820): Disclosure Framework—Changes to the Disclosure Requirements for Fair Value Measurements. The amendments in the ASU modify the disclosure requirements on fair value measurements in Topic 820. The ASU is effective for interim and annual reporting periods beginning after December 15, 2019. Management is currently evaluating the impact, if any, of applying this provision.
10. Subsequent Events
The Fund has evaluated subsequent events through the issuance of the financial statements and determined that no events have occurred that require disclosure.
| | |
Abbreviations Selected Portfolio ADR American Depository Receipt | | |
FRANKLIN CUSTODIAN FUNDS
Report of Independent Registered Public Accounting Firm
To the Board of Trustees of Franklin Custodian Funds and Shareholders of Franklin Focused Growth Fund
Opinion on the Financial Statements
We have audited the accompanying statement of assets and liabilities, including the statement of investments, of Franklin Focused Growth Fund (the “Fund”) as of September 30, 2018, the related statement of operations for the year ended September 30, 2018, the statement of changes in net assets for each of the two years in the period ended September 30, 2018, including the related notes, and the financial highlights for each of the periods indicated therein (collectively referred to as the “financial statements”). In our opinion, the financial statements present fairly, in all material respects, the financial position of the Fund as of September 30, 2018, the results of its operations for the year then ended, the changes in its net assets for each of the two years in the period ended September 30, 2018 and the financial highlights for each of the periods indicated therein in conformity with accounting principles generally accepted in the United States of America.
Basis for Opinion
These financial statements are the responsibility of the Fund’s management. Our responsibility is to express an opinion on the Fund’s financial statements based on our audits. We are a public accounting firm registered with the Public Company Accounting Oversight Board (United States) (“PCAOB”) and are required to be independent with respect to the Fund in accordance with the U.S. federal securities laws and the applicable rules and regulations of the Securities and Exchange Commission and the PCAOB.
We conducted our audits of these financial statements in accordance with the standards of the PCAOB. Those standards require that we plan and perform the audit to obtain reasonable assurance about whether the financial statements are free of material misstatement, whether due to error or fraud.
Our audits included performing procedures to assess the risks of material misstatement of the financial statements, whether due to error or fraud, and performing procedures that respond to those risks. Such procedures included examining, on a test basis, evidence regarding the amounts and disclosures in the financial statements. Our audits also included evaluating the accounting principles used and significant estimates made by management, as well as evaluating the overall presentation of the financial statements. Our procedures included confirmation of securities owned as of September 30, 2018 by correspondence with the custodian and transfer agent. We believe that our audits provide a reasonable basis for our opinion.
PricewaterhouseCoopers LLP
San Francisco, California
November 29, 2018
We have served as the auditor of one or more investment companies in the Franklin Templeton Group of Funds since 1948.
FRANKLIN CUSTODIAN FUNDS
Tax Information (unaudited)
Under Section 854(b)(1)(B) of the Internal Revenue Code, the Fund hereby reports the maximum amount allowable but no less than $21,219 as qualified dividends for purposes of the maximum rate under Section 1(h)(11) of the Internal Revenue Code for the fiscal year ended September 30, 2018. Distributions, including qualified dividend income, paid during calendar year 2018 will be reported to shareholders on Form1099-DIV bymid-February 2019. Shareholders are advised to check with their tax advisors for information on the treatment of these amounts on their individual income tax returns.
FRANKLIN FOCUSED GROWTH FUND
Special Meeting of Shareholders
MEETING OF SHAREHOLDERS: OCTOBER 30, 2017 AND RECONVENED ON DECEMBER 15, 2017 AND DECEMBER 29, 2017
(UNAUDITED)
A Special Meeting of Shareholders of Franklin Custodian Funds was held at the offices of Franklin Templeton Investments, One Franklin Parkway, San Mateo, California on October 30, 2017 and reconvened on December 15, 2017 and December 29, 2017. The purpose of the meeting was to elect Trustees of Franklin Custodian Funds and to vote to approve an amended fundamental investment restriction regarding investments in commodities for the Fund. At the meeting, (i) the following persons were elected by the shareholders to serve as Trustees of Franklin Custodian Funds: Harris J. Ashton, Terrence J. Checki, Mary C. Choksi, Edith E. Holiday, Gregory E. Johnson, Rupert H. Johnson, Jr., J. Michael Luttig, Larry D. Thompson, and John B. Wilson; and (ii) the proposal to approve the amended fundamental investment restriction regarding investments in commodities was approved by shareholders of the Fund. No other business was transacted at the meeting.
In connection with the meeting, management is aware that some shareholders received from the proxy solicitor numerous calls and mailings that may have been distracting. Management is taking steps to ensure that, in the future, for any new shareholder meeting solicitations that occur, such activity is not repeated. Management apologizes for any inconvenience that may have been caused as a result of such calls and mailings.
The results of the voting at the meeting are as follows:
| Proposal 1. | To elect a Board of Trustees: |
| | | | | | | | |
| Name | | For | | | Withheld | |
| | |
Harris J. Ashton | | | 20,620,255,266 | | | | 682,475,910 | |
| | |
Terrence J. Checki | | | 20,622,617,162 | | | | 680,114,004 | |
| | |
Mary C. Choksi | | | 20,641,972,272 | | | | 660,758,903 | |
| | |
Edith E. Holiday | | | 20,643,191,970 | | | | 659,539,208 | |
| | |
Gregory E. Johnson | | | 20,640,028,777 | | | | 662,702,399 | |
| | |
Rupert H. Johnson, Jr. | | | 20,623,629,983 | | | | 679,101,196 | |
| | |
J. Michael Luttig | | | 20,638,743,410 | | | | 663,987,768 | |
| | |
Larry D. Thompson | | | 20,634,644,439 | | | | 668,086,738 | |
| | |
John B. Wilson | | | 20,638,176,920 | | | | 661,053,794 | |
Total Trust Shares Outstanding*: 36,447,693,102
*As of the record date.
FRANKLIN FOCUSED GROWTH FUND
SPECIAL MEETING OF SHAREHOLDERS
| Proposal 2. | To approve an amended fundamental investment restriction regarding investments in commodities: |
| | | | |
| | | Shares | |
| |
For | | | 250,000 | |
| |
Against | | | 0 | |
| |
Abstain | | | 0 | |
| |
BrokerNon-Votes | | | 0 | |
| |
Total Fund Shares Voted | | | 250,000 | |
| |
Total Fund Shares Outstanding* | | | 250,000 | |
FRANKLIN CUSTODIAN FUNDS
Board Members and Officers
The name, year of birth and address of the officers and board members, as well as their affiliations, positions held with the Trust, principal occupations during at least the past five years and number of U.S. registered portfolios overseen in the Franklin Templeton Investments fund complex, are shown below. Generally, each board member serves until that person’s successor is elected and qualified.
Independent Board Members
| | | | | | | | |
Name, Year of Birth �� and Address | | Position | | Length of Time Served | | Number of Portfolios in
Fund Complex Overseen
by Board Member* | | Other Directorships Held During at Least the Past 5 Years |
| | | | |
Harris J. Ashton (1932) One Franklin Parkway San Mateo, CA 94403-1906 | | Trustee | | Since 1976 | | 136 | | Bar-S Foods (meat packing company) (1981-2010). |
|
| Principal Occupation During at Least the Past 5 Years: |
Director of various companies; andformerly, Director, RBC Holdings, Inc. (bank holding company) (until 2002); and President, Chief Executive Officer and Chairman of the Board, General Host Corporation (nursery and craft centers) (until 1998). |
| | | | |
Terrence J. Checki (1945) One Franklin Parkway San Mateo, CA 94403-1906 | | Trustee | | Since December 2017 | | 112 | | Hess Corporation (exploration of oil and gas) (2014-present). |
|
| Principal Occupation During at Least the Past 5 Years: |
Member of the Council on Foreign Relations (1996-present); Member of the National Committee on U.S.-China Relations (1999-present); member of the Board of Trustees of the Economic Club of New York (2013-present); member of the Board of Trustees of the Foreign Policy Association (2005-present) and member of various other boards of trustees and advisory boards; andformerly, Executive Vice President of the Federal Reserve Bank of New York and Head of its Emerging Markets and Internal Affairs Group and Member of Management Committee (1995-2014); and Visiting Fellow at the Council on Foreign Relations (2014). |
| | | | |
Mary C. Choksi (1950) One Franklin Parkway San Mateo, CA 94403-1906 | | Trustee | | Since 2014 | | 136 | | Avis Budget Group Inc. (car rental) (2007-present), Omnicom Group Inc. (advertising and marketing communications services) (2011-present) and White Mountains Insurance Group, Ltd. (holding company) (2017-present). |
|
| Principal Occupation During at Least the Past 5 Years: |
Director of various companies; andformerly, Founder and Senior Advisor, Strategic Investment Group (investment management group) (2015-2017); Founding Partner and Senior Managing Director, Strategic Investment Group (1987–2015); Founding Partner and Managing Director, Emerging Markets Management LLC (investment management firm) (1987-2011); and Loan Officer/Senior Loan Officer/Senior Pension Investment Officer, World Bank Group (international financial institution) (1977-1987). |
| | | | |
Edith E. Holiday (1952) One Franklin Parkway San Mateo, CA 94403-1906 | | Trustee | | Since 1998 | | 136 | | Hess Corporation (exploration of oil and gas) (1993-present), Canadian National Railway (railroad) (2001-present), White Mountains Insurance Group, Ltd. (holding company) (2004-present), Santander Consumer USA Holdings, Inc. (consumer finance) (2016-present), RTI International Metals, Inc. (manufacture and distribution of titanium) (1999-2015) and H.J. Heinz Company (processed foods and allied products) (1994-2013). |
|
| Principal Occupation During at Least the Past 5 Years: |
Director or Trustee of various companies and trusts; andformerly, Assistant to the President of the United States and Secretary of the Cabinet (1990-1993); General Counsel to the United States Treasury Department (1989-1990); and Counselor to the Secretary and Assistant Secretary for Public Affairs and Public Liaison-United States Treasury Department (1988-1989). |
| | | | |
J. Michael Luttig (1954) One Franklin Parkway San Mateo, CA 94403-1906 | | Trustee | | Since 2009 | | 136 | | Boeing Capital Corporation (aircraft financing) (2006-2013). |
|
| Principal Occupation During at Least the Past 5 Years: |
Executive Vice President, General Counsel and member of the Executive Council, The Boeing Company (aerospace company) (2006-present); andformerly, Federal Appeals Court Judge, U.S. Court of Appeals for the Fourth Circuit (1991-2006). |
FRANKLIN CUSTODIAN FUNDS
Independent Board Members(continued)
| | | | | | | | |
Name, Year of Birth and Address | | Position | | Length of Time Served | | Number of Portfolios in Fund Complex Overseen
by Board Member* | | Other Directorships Held During at Least the Past 5 Years |
| | | | |
Larry D. Thompson (1945) One Franklin Parkway San Mateo, CA 94403-1906 | | Trustee | | Since 2007 | | 136 | | The Southern Company (energy company) (2014-present; previously 2010-2012), Graham Holdings Company (education and media organization) (2011-present) and Cbeyond, Inc. (business communications provider) (2010-2012). |
| | |
| Principal Occupation During at Least the Past 5 Years: | | | | |
Director of various companies; Counsel, Finch McCranie, LLP (law firm) (2015-present); Independent Compliance Monitor and Auditor, Volkswagen AG (manufacturer of automobiles and commercial vehicles) (2017-present); John A. Sibley Professor of Corporate and Business Law, University of Georgia School of Law (2015-present; previously 2011-2012); andformerly, Executive Vice President - Government Affairs, General Counsel and Corporate Secretary, PepsiCo, Inc. (consumer products) (2012-2014); Senior Vice President - Government Affairs, General Counsel and Secretary, PepsiCo, Inc. (2004-2011); Senior Fellow of The Brookings Institution (2003-2004); Visiting Professor, University of Georgia School of Law (2004); and Deputy Attorney General, U.S. Department of Justice (2001-2003). |
| | | | |
John B. Wilson (1959) One Franklin Parkway San Mateo, CA 94403-1906 | | Lead Independent Trustee | | Trustee since 2007 and Lead Independent Trustee since 2008 | | 112 | | None |
| | |
| Principal Occupation During at Least the Past 5 Years: | | | | |
President and Founder, Hyannis Port Capital, Inc. (real estate and private equity investing) (2002-present); Senior Advisor, McKinsey & Co. (consulting) (2017-present); serves on private andnon-profit boards; andformerly, President, Staples International and Head of Global Transformation (office supplies) (2012-2016); Chief Operating Officer and Executive Vice President, Gap, Inc. (retail) (1996-2000); Chief Financial Officer and Executive Vice President – Finance and Strategy, Staples, Inc. (1992-1996); Senior Vice President – Corporate Planning, Northwest Airlines, Inc. (airlines) (1990-1992); and Vice President and Partner, Bain & Company (consulting firm) (1986-1990). |
|
| Interested Board Members and Officers |
| | | | |
Name, Year of Birth and Address | | Position | | Length of Time Served | | Number of Portfolios in Fund Complex Overseen by Board Member* | | Other Directorships Held During at Least the Past 5 Years |
| | | | |
**Gregory E. Johnson (1961) One Franklin Parkway San Mateo, CA 94403-1906 | | Trustee | | Since 2013 | | 150 | | None |
| | |
| Principal Occupation During at Least the Past 5 Years: | | | | |
Chairman of the Board, Member - Office of the Chairman, Director and Chief Executive Officer, Franklin Resources, Inc.; officer and/or director or trustee, as the case may be, of some of the other subsidiaries of Franklin Resources, Inc. and of 42 of the investment companies in Franklin Templeton Investments; Vice Chairman, Investment Company Institute; andformerly, President, Franklin Resources, Inc. (1994-2015). |
| | | | |
**Rupert H. Johnson, Jr. (1940) One Franklin Parkway San Mateo, CA 94403-1906 | | Chairman of the Board, Trustee and Vice President | | Chairman of the Board since 2013, Trustee since 1983 and Vice President since 1982 | | 136 | | None |
| | |
| Principal Occupation During at Least the Past 5 Years: | | | | |
Vice Chairman, Member - Office of the Chairman and Director, Franklin Resources, Inc.; Director, Franklin Advisers, Inc.; Senior Vice President, Franklin Advisory Services, LLC; and officer and/or director or trustee, as the case may be, of some of the other subsidiaries of Franklin Resources, Inc. and of 40 of the investment companies in Franklin Templeton Investments. |
| | | | |
Alison E. Baur (1964) One Franklin Parkway San Mateo, CA 94403-1906 | | Vice President | | Since 2012 | | Not Applicable | | Not Applicable |
| | |
| Principal Occupation During at Least the Past 5 Years: | | | | |
Deputy General Counsel, Franklin Templeton Investments; and officer of some of the other subsidiaries of Franklin Resources, Inc. and of 44 of the investment companies in Franklin Templeton Investments. |
FRANKLIN CUSTODIAN FUNDS
Interested Board Members and Officers(continued)
| | | | | | | | |
Name, Year of Birth and Address | | Position | | Length of Time Served | | Number of Portfolios in Fund Complex Overseen by Board Member* | | Other Directorships Held During at Least the Past 5 Years |
| | | | |
Gaston Gardey (1967) One Franklin Parkway San Mateo, CA 94403-1906 | | Chief Financial Officer, Chief Accounting Officer and Treasurer | | Since 2009 | | Not Applicable | | Not Applicable |
| | |
| Principal Occupation During at Least the Past 5 Years: | | | | |
| Treasurer, U.S. Fund Administration & Reporting, Franklin Templeton Investments; and officer of 28 of the investment companies in Franklin Templeton Investments. |
| | | | |
Aliya S. Gordon (1973) One Franklin Parkway San Mateo, CA 94403-1906 | | Vice President | | Since 2009 | | Not Applicable | | Not Applicable |
| | |
| Principal Occupation During at Least the Past 5 Years: | | | | |
| Senior Associate General Counsel, Franklin Templeton Investments; and officer of 44 of the investment companies in Franklin Templeton Investments. |
| | | | |
Steven J. Gray (1955) One Franklin Parkway San Mateo, CA 94403-1906 | | Vice President | | Since 2009 | | Not Applicable | | Not Applicable |
| | |
| Principal Occupation During at Least the Past 5 Years: | | | | |
| Senior Associate General Counsel, Franklin Templeton Investments; Vice President, Franklin Templeton Distributors, Inc. and FASA, LLC; and officer of 44 of the investment companies in Franklin Templeton Investments. |
| | | | |
Matthew T. Hinkle (1971) One Franklin Parkway San Mateo, CA 94403-1906 | | Chief Executive Officer – Finance and Administration | | Since 2017 | | Not Applicable | | Not Applicable |
| | |
| Principal Occupation During at Least the Past 5 Years: | | | | |
| Senior Vice President, Franklin Templeton Services, LLC; officer of 44 of the investment companies in Franklin Templeton Investments; andformerly, Vice President, Global Tax (2012-April 2017) and Treasurer/Assistant Treasurer, Franklin Templeton Investments (2009-2017). |
| | | | |
Edward B. Jamieson (1948) One Franklin Parkway San Mateo, CA 94403-1906 | | President and Chief Executive Officer – Investment Management | | Since 2010 | | Not Applicable | | Not Applicable |
| | |
| Principal Occupation During at Least the Past 5 Years: | | | | |
| President and Director, Franklin Advisers, Inc.; Executive Vice President, Franklin Templeton Institutional, LLC; and officer and/or trustee, as the case may be, of some of the other subsidiaries of Franklin Resources, Inc. and of 10 of the investment companies in Franklin Templeton Investments. |
| | | | |
Robert Lim (1948) One Franklin Parkway San Mateo, CA 94403-1906 | | Vice President – AML Compliance | | Since 2016 | | Not Applicable | | Not Applicable |
| | |
| Principal Occupation During at Least the Past 5 Years: | | | | |
| Vice President, Franklin Templeton Companies, LLC; Chief Compliance Officer, Franklin Templeton Distributors, Inc. and Franklin Templeton Investor Services, LLC; and officer of 44 of the investment companies in Franklin Templeton Investments. |
| | | | |
Kimberly H. Novotny (1972) 300 S.E. 2nd Street Fort Lauderdale, FL 33301-1923 | | Vice President | | Since 2013 | | Not Applicable | | Not Applicable |
| | |
| Principal Occupation During at Least the Past 5 Years: | | | | |
| Associate General Counsel, Franklin Templeton Investments; Vice President and Corporate Secretary, Fiduciary Trust International of the South; Vice President, Templeton Investment Counsel, LLC; Assistant Secretary, Franklin Resources, Inc.; and officer of 44 of the investment companies in Franklin Templeton Investments. |
FRANKLIN CUSTODIAN FUNDS
Interested Board Members and Officers(continued)
| | | | | | | | |
| | | | |
Name, Year of Birth and Address | | Position | | Length of Time Served | | Number of Portfolios in Fund Complex Overseen by Board Member* | | Other Directorships Held During at Least the Past 5 Years |
| | | | |
Robert C. Rosselot (1960) 300 S.E. 2nd Street Fort Lauderdale, FL 33301-1923 | | Chief Compliance Officer | | Since 2013 | | Not Applicable | | Not Applicable |
| | |
| Principal Occupation During at Least the Past 5 Years: | | | | |
| Director, Global Compliance, Franklin Templeton Investments; Vice President, Franklin Templeton Companies, LLC; officer of 44 of the investment companies in Franklin Templeton Investments; andformerly, Senior Associate General Counsel, Franklin Templeton Investments (2007-2013); and Secretary and Vice President, Templeton Group of Funds (2004-2013). |
| | | | |
Karen L. Skidmore (1952) One Franklin Parkway San Mateo, CA 94403-1906 | | Vice President and Secretary | | Since 2006 | | Not Applicable | | Not Applicable |
| | |
| Principal Occupation During at Least the Past 5 Years: | | | | |
| Senior Associate General Counsel, Franklin Templeton Investments; and officer of 44 of the investment companies in Franklin Templeton Investments. |
| | | | |
Navid J. Tofigh (1972) One Franklin Parkway San Mateo, CA 94403-1906 | | Vice President | | Since 2015 | | Not Applicable | | Not Applicable |
| | |
| Principal Occupation During at Least the Past 5 Years: | | | | |
| Associate General Counsel, Franklin Templeton Investments; and officer of 44 of the investment companies in Franklin Templeton Investments. |
| | | | |
Craig S. Tyle (1960) One Franklin Parkway San Mateo, CA 94403-1906 | | Vice President | | Since 2005 | | Not Applicable | | Not Applicable |
| | |
| Principal Occupation During at Least the Past 5 Years: | | | | |
| General Counsel and Executive Vice President, Franklin Resources, Inc.; and officer of some of the other subsidiaries of Franklin Resources, Inc. and of 44 of the investment companies in Franklin Templeton Investments. |
| | | | |
Lori A. Weber (1964) 300 S.E. 2nd Street Fort Lauderdale, FL 33301-1923 | | Vice President | | Since 2011 | | Not Applicable | | Not Applicable |
| | |
| Principal Occupation During at Least the Past 5 Years: | | | | |
| Senior Associate General Counsel, Franklin Templeton Investments; Assistant Secretary, Franklin Resources, Inc.; Vice President and Secretary, Templeton Investment Counsel, LLC; and officer of 44 of the investment companies in Franklin Templeton Investments. |
|
| *We base the number of portfolios on each separate series of the U.S. registered investment companies within the Franklin Templeton Investments fund complex. These portfolios have a common investment manager or affiliated investment managers. |
|
| **Gregory E. Johnson is considered to be an interested person of the Fund under the federal securities laws due to his position as an officer and director of Franklin Resources, Inc. (Resources), which is the parent company of the Fund’s investment manager and distributor. Rupert H. Johnson, Jr. is considered to be an interested person of the Fund under the federal securities laws due to his position as an officer and director and major shareholder of Resources. |
|
| Note 1: Rupert H. Johnson, Jr. is the uncle of Gregory E. Johnson. |
|
| Note 2: Officer information is current as of the date of this report. It is possible that after this date, information about officers may change. |
|
| The Sarbanes-Oxley Act of 2002 and Rules adopted by the Securities and Exchange Commission require the Fund to disclose whether the Fund’s Audit Committee includes at least one member who is an audit committee financial expert within the meaning of such Act and Rules. The Fund’s Board has determined that there is at least one such financial expert on the Audit Committee and has designated John B. Wilson as its audit committee financial expert. The Board believes that Mr. Wilson qualifies as such an expert in view of his extensive business background and experience, including service as chief financial officer of Staples, Inc. from 1992 to 1996. Mr. Wilson has been a Member and Chairman of the Fund’s Audit Committee since 2007. As a result of such background and experience, the Board believes that Mr. Wilson has acquired an understanding of generally accepted accounting principles and financial statements, the general application of such principles in connection with the accounting estimates, accruals and reserves, and analyzing and evaluating financial statements that present a breadth and level of complexity of accounting issues generally comparable to those of the Fund, as well as an understanding of internal controls and procedures for financial reporting and an understanding of audit committee functions. Mr. Wilson is an independent Board member as that term is defined under the relevant Securities and Exchange Commission Rules and Releases. |
|
| The Statement of Additional Information (SAI) includes additional information about the board members and is available, without charge, upon request. Shareholders may call (800) DIALBEN/342-5236 to request the SAI. |
FRANKLIN CUSTODIAN FUNDS
FRANKLIN FOCUSED GROWTH FUND
Shareholder Information
Proxy Voting Policies and Procedures
The Fund’s investment manager has established Proxy Voting Policies and Procedures (Policies) that the Fund uses to determine how to vote proxies relating to portfolio securities. Shareholders may view the Fund’s complete Policies online at franklintempleton.com. Alternatively, shareholders may request copies of the Policies free of charge by calling the Proxy Group collect at (954)527-7678 or by sending a written request to: Franklin Templeton Companies, LLC, 300 S.E. 2nd Street, Fort Lauderdale, FL 33301, Attention: Proxy Group. Copies of the Fund’s proxy voting records are also made available online at franklintempleton.com and posted on the U.S. Securities and Exchange Commission’s website at sec.gov and reflect the most recent12-month period ended June 30.
Quarterly Statement of Investments
The Trust, on behalf of the Fund, files a complete statement of investments with the U.S. Securities and Exchange Commission for the first and third quarters for each fiscal year on FormN-Q. Shareholders may view the filed FormN-Q by visiting the Commission’s website at sec.gov. The filed form may also be viewed and copied at the Commission’s Public Reference Room in Washington, DC. Information regarding the operations of the Public Reference Room may be obtained by calling(800) SEC-0330.
Householding of Reports and Prospectuses
You will receive each Fund’s financial reports every six months as well as an annual updated summary prospectus (prospectus available upon request). To reduce Fund expenses, we try to identify related shareholders in a household and send only one copy of the financial reports and summary prospectus. This process, called “householding,” will continue indefinitely unless you instruct us otherwise. If you prefer not to have these documents householded, please call us at (800)632-2301. At any time you may view current prospectuses/summary prospectuses and financial reports on our website. If you choose, you may receive these documents through electronic delivery.
(a) The Registrant has adopted a code of ethics that applies to its principal executive officers and principal financial and accounting officer.
(c) N/A
(d) N/A
(f) Pursuant to Item 12(a)(1), the Registrant is attaching as an exhibit a copy of its code of ethics that applies to its principal executive officers and principal financial and accounting officer.
| Item 3. | Audit Committee Financial Expert. |
(a)(1) The Registrant has an audit committee financial expert serving on its audit committee.
(2) The audit committee financial expert is John B. Wilson and he is “independent” as defined under the relevant Securities and Exchange Commission Rules and Releases.
| Item 4. | Principal Accountant Fees and Services. |
(a) Audit Fees
The aggregate fees paid to the principal accountant for professional services rendered by the principal accountant for the audit of the registrant’s annual financial statements or for services that are normally provided by the principal accountant in connection with statutory and regulatory filings or engagements were $486,626 for the fiscal year ended September 30, 2018 and $554,374 for the fiscal year ended September 30, 2017.
(b) Audit-Related Fees
The aggregate fees paid to the principal accountant for assurance and related services rendered by the principal accountant to the registrant that are reasonably related to the performance of the audit of the registrant’s financial statements and are not reported under paragraph (a) of Item 4 were $9,306 for the fiscal year ended September 30, 2018 and $9,213 for the fiscal year ended September 30, 2017. The services for which these fees were paid included attestation services.
There were no fees paid to the principal accountant for assurance and related services rendered by the principal accountant to the registrant’s investment adviser and any entity controlling, controlled by or under common control with the investment adviser that provides ongoing services to the registrant that are reasonably related to the performance of the audit of their financial statements.
(c) Tax Fees
There were no fees paid to the principal accountant for professional services rendered by the principal accountant to the registrant for tax compliance, tax advice and tax planning.
The aggregate fees paid to the principal accountant for professional services rendered by the principal accountant to the registrant’s investment adviser and any entity controlling, controlled by or under common control with the investment adviser that provides ongoing services to the registrant for tax compliance, tax advice and tax planning were $5,000 for the fiscal year ended September 30, 2018 and $0 for the fiscal year ended September 30, 2017. The services for which these fees were paid included tax consulting services related to the operating agreement and term sheet for the launch of a new fund.
(d) All Other Fees
The aggregate fees paid to the principal accountant for products and services rendered by the principal accountant to the registrant not reported in paragraphs (a)-(c) of Item 4 were $39,976 for the fiscal year ended September 30, 2018 and $0 for the fiscal year ended September 30, 2017. The services for which these fees were paid included review of materials provided to the fund Board in connection with the investment management contract renewal process.
The aggregate fees paid to the principal accountant for products and services rendered by the principal accountant to the registrant’s investment adviser and any entity controlling, controlled by or under common control with the investment adviser that provides ongoing services to the registrant not reported in paragraphs (a)-(c) of Item 4 were $16,500 for the fiscal year ended September 30, 2018 and $14,000 for the fiscal year ended September 30, 2017. The services for which these fees were paid included the issuance of an Auditor’s Certificate for South Korean regulatory shareholders disclosures, assets under management certification, and benchmarking services in connection with the ICI TA Survey.
(e) (1) The registrant’s audit committee is directly responsible for approving the services to be provided by the auditors, including:
(i) pre-approval of all audit and audit related services;
(ii) pre-approval of allnon-audit related services to be provided to the Fund by the auditors;
(iii) pre-approval of allnon-audit related services to be provided to the registrant by the auditors to the registrant’s investment adviser or to any entity that controls, is controlled by or is under common control with the registrant’s investment adviser and that provides ongoing services to the registrant where thenon-audit services relate directly to the operations or financial reporting of the registrant; and
(iv) establishment by the audit committee, if deemed necessary or appropriate, as an alternative to committeepre-approval of services to be provided by the auditors, as required by paragraphs (ii) and (iii) above, of policies and procedures to permit such services to bepre-approved by other means, such as through establishment of guidelines or by action of a designated member or members of the committee; provided the policies and procedures are detailed as to the particular service and the committee is informed of each service and such policies and procedures do not include delegation
of audit committee responsibilities, as contemplated under the Securities Exchange Act of 1934, to management; subject, in the case of (ii) through (iv), to any waivers, exceptions or exemptions that may be available under applicable law or rules.
(e) (2) None of the services provided to the registrant described in paragraphs (b)-(d) of Item 4 were approved by the audit committee pursuant to paragraph (c)(7)(i)(C) of Rule2-01 of regulationS-X.
(f) No disclosures are required by this Item 4(f).
(g) The aggregatenon-audit fees paid to the principal accountant for services rendered by the principal accountant to the registrant and the registrant’s investment adviser and any entity controlling, controlled by or under common control with the investment adviser that provides ongoing services to the registrant were $70,782 for the fiscal year ended September 30, 2018 and $23,213 for the fiscal year ended September 30, 2017.
(h) The registrant’s audit committee of the board has considered whether the provision ofnon-audit services that were rendered to the registrant’s investment adviser (not including anysub-adviser whose role is primarily portfolio management and is subcontracted with or overseen by another investment adviser), and any entity controlling, controlled by, or under common control with the investment adviser that provides ongoing services to the registrant that were notpre-approved pursuant to paragraph (c)(7)(ii) of Rule2-01 of RegulationS-X is compatible with maintaining the principal accountant’s independence.
| Item 5. | Audit Committee of Listed Registrants. N/A |
| Item 6. | Schedule of Investments. N/A |
| Item 7. | Disclosure of Proxy Voting Policies and Procedures forClosed-End Management Investment Companies. N/A |
| Item 8. | Portfolio Managers ofClosed-End Management Investment Companies. N/A |
| Item 9. | Purchases of Equity Securities byClosed-End Management Investment Company and Affiliated Purchasers. N/A |
| Item 10. | Submission of Matters to a Vote of Security Holders. |
There have been no changes to the procedures by which shareholders may recommend nominees to the Registrant’s Board of Trustees that would require disclosure herein.
| Item 11. | Controls and Procedures. |
(a)Evaluation of Disclosure Controls and Procedures. The Registrant maintains disclosure controls and procedures that are designed to provide reasonable assurance that information required to be disclosed in the Registrant’s filings under the Securities Exchange Act of 1934, as amended, and the Investment Company Act of 1940 is recorded, processed, summarized and reported within the periods specified in the rules and forms of the Securities and Exchange Commission. Such information is accumulated and communicated to the Registrant’s management, including its principal executive officer and principal financial officer, as appropriate, to allow timely decisions regarding required disclosure. The Registrant’s management, including the principal executive officer and the principal financial officer, recognizes that any set of controls and procedures, no matter how well designed and operated, can provide only reasonable assurance of achieving the desired control objectives.
Within 90 days prior to the filing date of this Shareholder Report onForm N-CSR, the Registrant had carried out an evaluation, under the supervision and with the participation of the Registrant’s management, including the Registrant’s principal executive officer and the Registrant’s principal financial officer, of the effectiveness of the design and operation of the Registrant’s disclosure controls and procedures. Based on such evaluation, the Registrant’s principal executive officer and principal financial officer concluded that the Registrant’s disclosure controls and procedures are effective.
(b)Changes in Internal Controls. There have been no changes in the Registrant’s internal control over financial reporting that occurred during the period covered by this report that has materially affected, or is reasonably likely to materially affect the internal control over financial reporting.
| Item 12. | Disclosure of Securities Lending Activities forClosed-End Management Investment Company. N/A |
(a)(1) Code of Ethics
(a)(2) Certifications pursuant to Section 302 of the Sarbanes-Oxley Act of 2002 of Matthew T. Hinkle, Chief Executive Officer - Finance and Administration, and Gaston Gardey, Chief Financial Officer and Chief Accounting Officer
(b) Certifications pursuant to Section 906 of the Sarbanes-Oxley Act of 2002 of Matthew T. Hinkle, Chief Executive Officer - Finance and Administration, and Gaston Gardey, Chief Financial Officer and Chief Accounting Officer
SIGNATURES
Pursuant to the requirements of the Securities Exchange Act of 1934 and the Investment Company Act of 1940, the registrant has duly caused this report to be signed on its behalf by the undersigned, thereunto duly authorized.
FRANKLIN CUSTODIAN FUNDS
| | |
| By | | /s/ MATTHEW T. HINKLE |
| | Matthew T. Hinkle |
| | Chief Executive Officer - Finance and Administration |
| Date | | January 15, 2019 |
Pursuant to the requirements of the Securities Exchange Act of 1934 and the Investment Company Act of 1940, this report has been signed below by the following persons on behalf of the registrant and in the capacities and on the dates indicated.
| | |
| By | | /s/ MATTHEW T. HINKLE |
| | Matthew T. Hinkle |
| | Chief Executive Officer - Finance and Administration |
| Date | | January 15, 2019 |
| |
| By | | /s/ GASTON GARDEY |
| | Gaston Gardey |
| | Chief Financial Officer and Chief Accounting Officer |
| Date | | January 15, 2019 |