UNITED STATES
SECURITIES AND EXCHANGE COMMISSION
Washington, DC 20549
FORM N-CSR
CERTIFIED SHAREHOLDER REPORT OF REGISTERED MANAGEMENT INVESTMENT COMPANIES
Investment Company Act file number 811-00537
Franklin Custodian Funds
(Exact name of registrant as specified in charter)
One Franklin Parkway, San Mateo, CA 94403-1906
(Address of principal executive offices) (Zip code)
Craig S. Tyle, One Franklin Parkway, San Mateo, CA 94403-1906
(Name and address of agent for service)
Registrant's telephone number, including area code: 650 312-2000
Date of fiscal year end: 9/30
Date of reporting period: 9/30/15
Item 1. Reports to Stockholders.

| |
| Contents | |
| Annual Report | |
| Economic and Market Overview | 3 |
| Franklin DynaTech Fund | 4 |
| Franklin Growth Fund | 14 |
| Franklin Income Fund | 24 |
| Franklin U.S. Government Securities Fund | 35 |
| Franklin Utilities Fund | 44 |
| Financial Highlights and Statements of Investments | 53 |
| Financial Statements | 109 |
| Notes to Financial Statements | 118 |
| Report of Independent Registered | |
| Public Accounting Firm | 137 |
| Tax Information | 138 |
| Board Members and Officers | 139 |
| Shareholder Information | 144 |
Visit franklintempleton.com for fund updates, to access your account, or to find helpful financial planning tools.
|
2 Annual Report
franklintempleton.com
Annual Report
Economic and Market Overview
U.S. economic growth was mixed during the 12 months under review. Growth expanded in 2014’s fourth quarter, slowed in 2015’s first quarter and rebounded in 2015’s second quarter. Additionally, estimates indicated tepid third-quarter growth despite healthy consumer spending as businesses cut back on inventories, exports declined and governments reduced their spending. Manufacturing and service activities expanded during the 12-month period, contributing to new jobs, and the unemployment rate declined from 5.9% in September 2014 to 5.1% at period-end.1 Housing market data were generally encouraging as home sales and prices rose amid declining mortgage rates. Retail sales generally rose for the 12-month period as strong employment gains led to broad-based improvement, especially for auto and auto components sales. Inflation, as measured by the Consumer Price Index, remained subdued for the period and declined toward period-end mainly due to a sharp drop in energy prices.
The Federal Reserve (Fed) ended its bond buying program in October 2014 and kept its target interest rate at 0%–0.25% while considering when an increase might be appropriate. Although global financial markets anticipated an increase, in September the Fed kept interest rates unchanged and said it would continue to monitor developments domestically and abroad. The Fed also raised its forecast for 2015 U.S. economic growth and lowered its unemployment projections.
Investor confidence grew during the period as corporate profits remained healthy, the Fed kept its target interest rate low, economic data in Europe improved, China introduced more stimulus measures and Greece reached an agreement with its international creditors. However, the U.S. stock market endured some sell-offs when many investors reacted to geopolitical tensions in certain regions, Greece’s debt negotiations and ongoing uncertainty over the Fed’s timing for raising interest rates. Less robust growth in China as well as devaluation of the renminbi also affected equity markets. U.S. stocks retreated overall for the 12 months under review as the Standard & Poor’s 500 Index and the Dow Jones Industrial Average declined from all-time highs reached in May.
The foregoing information reflects our analysis and opinions as of September 30, 2015. The information is not a complete analysis of every aspect of any market, country, industry, security or fund. Statements of fact are from sources considered reliable.
1. Source: Bureau of Labor Statistics.
franklintempleton.com
Annual Report
3
Franklin DynaTech Fund
This annual report for Franklin DynaTech Fund covers the fiscal year ended September 30, 2015.
Your Fund’s Goal and Main Investments
The Fund seeks capital appreciation by investing primarily in equity securities of companies that emphasize innovation and new technologies, and that benefit from new industry conditions in the dynamically changing global economy.
Performance Overview
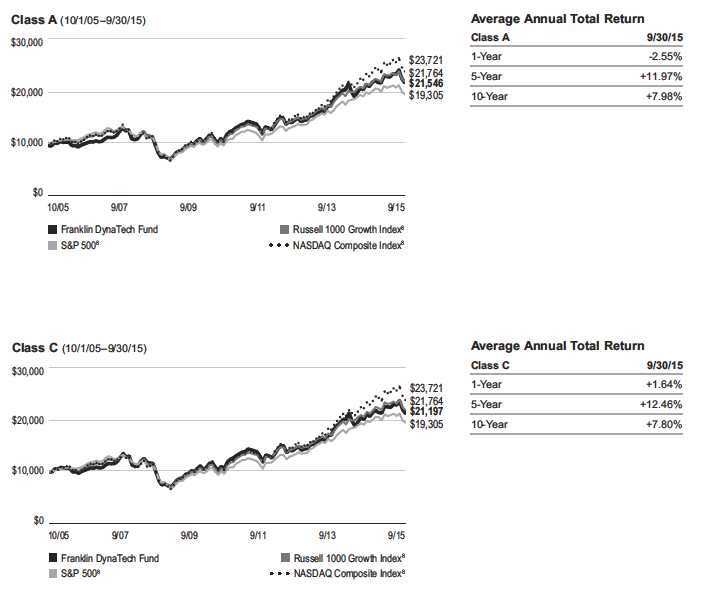
The Fund’s Class A shares delivered a +3.40% cumulative total return for the 12 months under review. In comparison, the Russell 1000® Growth Index, which measures performance of the largest companies in the Russell 3000® Index with higher price-to-book ratios and higher forecasted growth values, generated a total return of +3.17%.1 Also for comparison, the broad U.S. stock market as measured by the Standard & Poor’s 500 Index (S&P 500®), had a -0.61% total return, and domestic and international-based stocks as measured by the NASDAQ Composite Index® posted a +4.00% total return.1 You can find the Fund’s long-term performance data in the Performance Summary beginning on page 7.
Performance data represent past performance, which does not guarantee future results. Investment return and principal value will fluctuate, and you may have a gain or loss when you sell your shares. Current performance may differ from figures shown. Please visit franklintempleton.com or call (800) 342-5236 for most recent month-end performance.
Investment Strategy
We use fundamental, bottom-up research to seek companies meeting our criteria of growth potential, quality and valuation. In seeking sustainable growth characteristics, we look for companies we believe can produce sustainable earnings and cash flow growth, evaluating the long-term market opportunity and competitive structure of an industry to target leaders and emerging leaders. We define quality companies as those with strong and improving competitive positions in attractive markets. We also believe important attributes of quality are experienced and talented management teams as well as financial strength reflected in the capital structure, gross and operating margins, free cash flow generation and returns on capital employed. Our valuation analysis includes a range of potential outcomes based on an assessment of multiple scenarios. In assessing value, we consider whether security prices fully reflect the balance of the sustainable growth opportunities relative to business and financial risks.
Manager’s Discussion
The Fund’s health care holdings contributed notably to absolute performance during the reporting period.2 Shares of medical device maker DexCom rose given growing use of its continuous glucose monitors and market interest about approval by the U.S. Food and Drug Administration (FDA) of related product enhancements expected to help the company capture a greater share of this expanding market. Biopharmaceutical firm Incyte Therapeutic’s stock performed well amid enthusiasm for its immuno-oncology agent epacadostat that has shown encouraging test results as a treatment for melanoma. Positive test data for the company’s arthritis drug baricitinib and FDA approval of Jakafi for treatment of polycythemia vera also fueled investor optimism. Shares of UnitedHealth Group, a health care provider, rose resulting from stable medical cost trends and solid underwriting for its managed care business, increased customer use of its health services platform products in an expanding market, and its acquisition of pharmacy benefit manager Catamaran.
The Fund’s information technology (IT) positions also substantially supported results.3 Palo Alto Networks, a provider of next generation network and PC security solutions, benefited in fiscal year 2015 from growing sales of its strong product portfolio and from a variety of high profile cyberattacks that helped to expand the market. Shares of Visa, a global payments technology firm, rose in response to news the company might purchase Visa Europe, as well as from solid cross-border traffic and increased currency translation that supported stronger-than-expected revenue. MasterCard, another global payments firm, experienced success in the domestic commercial credit business, taking market share from American
1. Source: Morningstar.
The indexes are unmanaged and include reinvested dividends. One cannot invest directly in an index, and an index is not representative of the Fund’s portfolio.
Russell Investment Group is the source and owner of the trademarks, service marks and copyrights related to the Russell Indexes. Russell® is a trademark of Russell
Investment Group.
2. The health care sector comprises biotechnology, health care equipment and supplies, health care providers and services, health care technology, life sciences tools and
services, and pharmaceuticals in the SOI.
3. The IT sector comprises communications equipment; electronic equipment, instruments and components; Internet software and services; IT services; semiconductors and
semiconductor equipment; software; and technology hardware, storage and peripherals in the SOI.
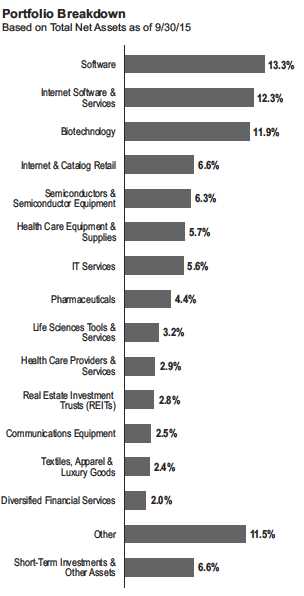
The dollar value, number of shares or principal amount, and names of all portfolio holdings are listed in the Fund’s Statement of Investments (SOI).
The SOI begins on page 58.
4 Annual Report franklintempleton.com
FRANKLIN DYNATECH FUND
Express and Visa. The company reported strong long-term revenue guidance based on solid underlying fundamentals.
The Fund’s consumer discretionary and materials sector holdings also aided performance.4 In consumer discretionary, online retail shopping service provider Amazon.com reported strong, sustained revenue growth in core domestic retail, including Amazon Prime customers, and better-than-expected profits for its new Amazon Web Services cloud computing business. Additionally, the company improved its fixed and variable costs through lower shipping expenses, better utilization of fulfillment centers and growing use of third-party sellers. NIKE is exposed to the best secular growth area in the apparel industry and is a leader in the growing athletic category. It has a proven category strategy driven by innovation and marketing that has worked tremendously in the U.S. and is now being replicated across the globe. In other sectors, shares of Cytec Industries,5 a specialty materials and chemicals company, performed well due to an announced acquisition by Belgium-based Solvay at a premium to Cytec’s share price.
In contrast, the Fund’s energy sector holdings weighed on absolute performance.6 The decline in crude oil and natural gas prices was driven by supply growth exceeding slowing demand growth, which resulted in reduced capital spending and lower forecasted volume growth for energy and production companies. In this environment, Anadarko Petroleum increased production to consistently exceed guidance and sold assets to generate cash reserves for the company’s long-term health. The sell-off in oilfield services stocks was broad-based as investors became more fearful of protracted lower oil prices and spending levels. Diversified oilfield service companies FMC Technologies5 and Schlumberger outperformed smaller companies in their industry, although companies with greater offshore exposure like FMC Technologies lost value as investors believed that offshore spending would remain depressed for several years. However, we believe offshore spending is likely to be more resilient than most expect. FMC Technologies and Schlumberger are leaders in their primary markets and should be well positioned if spending recovers, in our view.
Some of the Fund’s positions in the industrials sector also hindered performance.7 Flowserve’s stock declined based on concerns about oil and gas markets, as energy market activity
affected a significant portion of the company’s total sales and the stock itself was correlated with oil prices.5 The company’s second-quarter earnings met analyst expectations, but sales and orders declined more than anticipated.
In other sectors, shares of Gilead Sciences were flat following a doubling of stock value in the prior year. The company lowered the price of Harvoni, one of its hepatitis C medicines, to
4. The consumer discretionary sector comprises Internet and catalog retail; media; and textiles, apparel and luxury goods in the SOI. The materials sector holdings were
sold by period-end.
5. Sold by period-end.
6. The energy sector comprises energy equipment and services; and oil, gas and consumable fuels in the SOI.
7. The industrials sector comprises aerospace and defense, air freight and logistics, commercial services and supplies, and electrical equipment in the SOI.
See www.franklintempletondatasources.com for additional data provider information.
|
franklintempleton.com Annual Report 5
| | |
| FRANKLIN DYNATECH FUND | | |
| |
| |
| |
| |
| Top 10 Holdings | | |
| 9/30/15 | | |
| Company | % of Total | |
| Sector/Industry | Net Assets | |
| |
| Google Inc., A & C | 4.3 | % |
| Internet Software & Services | | |
| Amazon.com Inc. | 3.8 | % |
| Internet & Catalog Retail | | |
| Facebook Inc., A | 3.3 | % |
| Internet Software & Services | | |
| MasterCard Inc., A | 2.8 | % |
| IT Services | | |
| Celgene Corp. | 2.6 | % |
| Biotechnology | | |
| Visa Inc., A | 2.6 | % |
| IT Services | | |
| Allergan PLC | 2.5 | % |
| Pharmaceuticals | | |
| Gilead Sciences Inc. | 2.2 | % |
| Biotechnology | | |
| Palo Alto Networks Inc. | 2.2 | % |
| Communications Equipment | | |
| Salesforce.com Inc. | 1.8 | % |
| Software | | |
protect its market share after Abbvie launched a competing drug in December, and sales of Harvoni declined after peaking in March. After earning profits in fiscal year 2014, online user-generated review database provider Yelp reported operating losses based largely on slowing user growth, U.S. market saturation and competition from rivals.5 Chinese Internet search provider Baidu also earned growing profits in 2014, but earnings decreased in 2015 as it sought to expand new markets such as food delivery and group purchases for dining and movie tickets. Social media provider Twitter experienced net losses despite growing revenue as it recognized the need to increase its audience.5
As managers of Franklin DynaTech Fund, at period-end we remained encouraged by the relative abundance of companies that we believe have strong long-term growth prospects trading at what we perceive to be attractive valuations. We believe it is these innovative, thought-leading companies that may promote economic advancement over the longer term.
Thank you for your continued participation in Franklin DynaTech Fund. We look forward to serving your future investment needs.

The foregoing information reflects our analysis, opinions and portfolio holdings as of September 30, 2015, the end of the reporting period. The way we implement our main investment strategies and the resulting portfolio holdings may change depending on factors such as market and economic conditions. These opinions may not be relied upon as investment advice or an offer for a particular security. The information is not a complete analysis of every aspect of any market, country, industry, security or the Fund. Statements of fact are from sources considered reliable, but the investment manager makes no representation or warranty as to their completeness or accuracy. Although historical performance is no guarantee of future results, these insights may help you understand our investment management philosophy.
|
6 Annual Report
franklintempleton.com
FRANKLIN DYNATECH FUND
Performance Summary as of September 30, 2015
Your dividend income will vary depending on dividends or interest paid by securities in the Fund’s portfolio, adjusted for operating expenses of each class. Capital gain distributions are net profits realized from the sale of portfolio securities. The performance table and graphs do not reflect any taxes that a shareholder would pay on Fund dividends, capital gain distributions, if any, or any realized gains on the sale of Fund shares. Total return reflects reinvestment of the Fund’s dividends and capital gain distributions, if any, and any unrealized gains or losses.
| | | | | | |
| Net Asset Value | | | | | | |
| Share Class (Symbol) | | 9/30/15 | | 9/30/14 | | Change |
| A (FKDNX) | $ | 46.04 | $ | 46.08 | -$ | 0.04 |
| C (FDYNX) | $ | 40.00 | $ | 40.53 | -$ | 0.53 |
| R (FDNRX) | $ | 45.16 | $ | 45.35 | -$ | 0.19 |
| R6 (FDTRX) | $ | 47.15 | $ | 46.97 | +$ | 0.18 |
| Advisor (FDYZX) | $ | 46.96 | $ | 46.87 | +$ | 0.09 |
| |
| |
| Distributions1 (10/1/14–9/30/15) | | | | | | |
| | | Long-Term | | | | |
| Share Class | | Capital Gain | | | | |
| A | $ | 1.6140 | | | | |
| C | $ | 1.6140 | | | | |
| R | $ | 1.6140 | | | | |
| R6 | $ | 1.6140 | | | | |
| Advisor | $ | 1.6140 | | | | |
franklintempleton.com
Annual Report
|
7
FRANKLIN DYNATECH FUND
PERFORMANCE SUMMARY
Performance as of 9/30/152
Cumulative total return excludes sales charges. Average annual total return and value of $10,000 investment include maximum sales charges. Class A: 5.75% maximum initial sales charge; Class C: 1% contingent deferred sales charge in first year only;
Class R/R6/Advisor Class: no sales charges.
| | | | | | | | |
| | Cumulative | | Average Annual | | | Value of | Total Annual | |
| Share Class | Total Return3 | | Total Return4 | | $ | 10,000 Investment5 | Operating Expenses6 | |
| A | | | | | | | 0.89 | % |
| 1-Year | +3.40 | % | -2.55 | % | $ | 9,745 | | |
| 5-Year | +86.78 | % | +11.97 | % | $ | 17,602 | | |
| 10-Year | +128.57 | % | +7.98 | % | $ | 21,546 | | |
| C | | | | | | | 1.64 | % |
| 1-Year | +2.63 | % | +1.64 | % | $ | 10,164 | | |
| 5-Year | +79.85 | % | +12.46 | % | $ | 17,985 | | |
| 10-Year | +111.97 | % | +7.80 | % | $ | 21,197 | | |
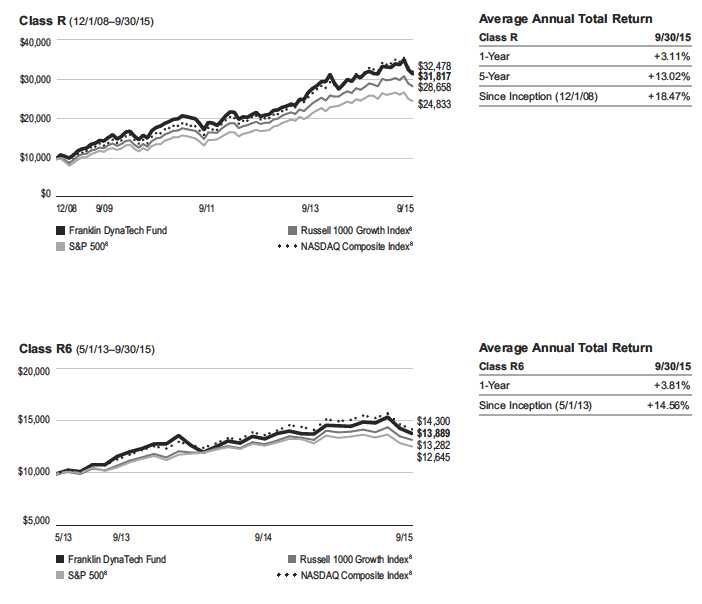
| R | | | | | | | 1.14 | % |
| 1-Year | +3.11 | % | +3.11 | % | $ | 10,311 | | |
| 5-Year | +84.40 | % | +13.02 | % | $ | 18,440 | | |
| Since Inception (12/1/08) | +218.17 | % | +18.47 | % | $ | 31,817 | | |
| R6 | | | | | | | 0.49 | % |
| 1-Year | +3.81 | % | +3.81 | % | $ | 10,381 | | |
| Since Inception (5/1/13) | +38.89 | % | +14.56 | % | $ | 13,889 | | |
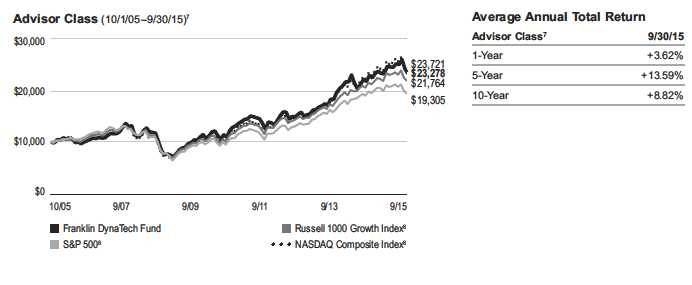
| Advisor7 | | | | | | | 0.64 | % |
| 1-Year | +3.62 | % | +3.62 | % | $ | 10,362 | | |
| 5-Year | +89.06 | % | +13.59 | % | $ | 18,906 | | |
| 10-Year | +132.78 | % | +8.82 | % | $ | 23,278 | | |
Performance data represent past performance, which does not guarantee future results. Investment return and principal value will fluctuate, and you may have a gain or loss when you sell your shares. Current performance may differ from figures shown. For most recent month-end performance, go to franklintempleton.com or call (800) 342-5236.
|
8 Annual Report
franklintempleton.com
FRANKLIN DYNATECH FUND
PERFORMANCE SUMMARY
Total Return Index Comparison for a Hypothetical $10,000 Investment2
Total return represents the change in value of an investment over the periods shown. It includes any applicable maximum sales charge, Fund expenses, account fees and reinvested distributions. The unmanaged indexes include reinvestment of any income or distributions. They differ from the Fund in composition and do not pay management fees or expenses. One cannot invest directly in an index.
franklintempleton.com
Annual Report
|
9
FRANKLIN DYNATECH FUND
PERFORMANCE SUMMARY
Total Return Index Comparison for a Hypothetical $10,000 Investment2 (continued)
|
10 Annual Report
franklintempleton.com
FRANKLIN DYNATECH FUND
PERFORMANCE SUMMARY
Total Return Index Comparison for a Hypothetical $10,000 Investment2 (continued)
All investments involve risks, including possible loss of principal. The Fund’s investments in fast-growing industries, including the technology and health care sectors (which have historically been volatile) could result in increased price fluctuation, especially over the short term, due to the rapid pace of product change and development and changes in government regulation of companies emphasizing scientific or technological advancement or regulatory approval for new drugs and medical instruments. The Fund may also invest in small capitalization companies, which can be particularly sensitive to changing economic conditions, and their prospects for growth are less certain than those of larger, more established companies. The Fund is actively managed but there is no guarantee that the manager’s investment decisions will produce the desired results. The Fund’s prospectus also includes a description of the main investment risks.
| |
| Class C: | These shares have higher annual fees and expenses than Class A shares. |
| Class R: | Shares are available to certain eligible investors as described in the prospectus. These shares have higher annual fees and expenses than Class A shares. |
| Class R6: | Shares are available to certain eligible investors as described in the prospectus. |
| Advisor Class: | Shares are available to certain eligible investors as described in the prospectus. |
1. The distribution amount is the sum of the dividend payments to shareholders for the period shown and includes only estimated tax-basis capital gain.
2. The Fund has a fee waiver associated with any investment in a Franklin Templeton money fund, contractually guaranteed through at least its current fiscal year-end.
Fund investment results reflect the fee waiver, to the extent applicable; without this reduction, the results would have been lower.
3. Cumulative total return represents the change in value of an investment over the periods indicated.
4. Average annual total return represents the average annual change in value of an investment over the periods indicated.
5. These figures represent the value of a hypothetical $10,000 investment in the Fund over the periods indicated.
6. Figures are as stated in the Fund’s current prospectus. In periods of market volatility, assets may decline significantly, causing total annual Fund operating expenses
to become higher than the figures shown.
7. Effective 5/15/08, the Fund began offering Advisor Class shares, which do not have sales charges or a Rule 12b-1 plan. Performance quotations for this class reflect the
following methods of calculation: (a) For periods prior to 5/15/08, a restated figure is used based upon the Fund’s Class A performance, excluding the effect of Class A’s
maximum initial sales charge, but reflecting the effect of the Class A Rule 12b-1 fees; and (b) for periods after 5/15/08, actual Advisor Class performance is used reflecting
all charges and fees applicable to that class. Since 5/15/08 (commencement of sales), the cumulative and average annual total returns of Advisor Class shares were
+81.15% and +8.39%.
8. Source: Morningstar. The Russell 1000 Growth Index is market capitalization weighted and measures performance of those Russell 1000 Index companies with higher
price-to-book ratios and higher forecasted growth values. The S&P 500 is a market capitalization-weighted index of 500 stocks designed to measure total U.S. equity market
performance. The NASDAQ Composite Index is a broad-based, market capitalization-weighted index designed to measure all NASDAQ domestic and international-based
common type stocks listed on The NASDAQ Stock Market.
See www.franklintempletondatasources.com for additional data provider information.
franklintempleton.com
Annual Report
|
11
FRANKLIN DYNATECH FUND
Your Fund’s Expenses
As a Fund shareholder, you can incur two types of costs:
- Transaction costs, including sales charges (loads) on Fund purchases; and
- Ongoing Fund costs, including management fees, distribution and service (12b-1) fees, and other Fund expenses. All mutual funds have ongoing costs, sometimes referred to as operating expenses.
The following table shows ongoing costs of investing in the Fund and can help you understand these costs and compare them with those of other mutual funds. The table assumes a $1,000 investment held for the six months indicated.
Actual Fund Expenses
The first line (Actual) for each share class listed in the table provides actual account values and expenses. The “Ending Account Value” is derived from the Fund’s actual return, which includes the effect of Fund expenses.
You can estimate the expenses you paid during the period by following these steps. Of course, your account value and expenses will differ from those in this illustration:
1. Divide your account value by $1,000.
If an account had an $8,600 value, then $8,600 ÷ $1,000 = 8.6.
2. Multiply the result by the number under the heading “Expenses Paid During Period.”
If Expenses Paid During Period were $7.50, then 8.6 x $7.50 = $64.50.
In this illustration, the estimated expenses paid this period are $64.50.
Hypothetical Example for Comparison with Other Funds
Information in the second line (Hypothetical) for each class in the table can help you compare ongoing costs of investing in the Fund with those of other mutual funds. This information may not be used to estimate the actual ending account balance or expenses you paid during the period. The hypothetical “Ending Account Value” is based on the actual expense ratio for each class and an assumed 5% annual rate of return before expenses, which does not represent the Fund’s actual return. The figure under the heading “Expenses Paid During Period” shows the hypothetical expenses your account would have incurred under this scenario. You can compare this figure with the 5% hypothetical examples that appear in shareholder reports of other funds.
Please note that expenses shown in the table are meant to highlight ongoing costs and do not reflect any transaction costs, such as sales charges. Therefore, the second line for each class is useful in comparing ongoing costs only, and will not help you compare total costs of owning different funds. In addition, if transaction costs were included, your total costs would have been higher. Please refer to the Fund prospectus for additional information on operating expenses.
|
12 Annual Report
franklintempleton.com
FRANKLIN DYNATECH FUND
YOUR FUND’S EXPENSES
| | | | | | |
| | | Beginning Account | | Ending Account | | Expenses Paid During |
| Share Class | | Value 4/1/15 | | Value 9/30/15 | | Period* 4/1/15–9/30/15 |
| A | | | | | | |
| Actual | $ | 1,000 | $ | 946.50 | $ | 4.39 |
| Hypothetical (5% return before expenses) | $ | 1,000 | $ | 1,020.56 | $ | 4.56 |
| C | | | | | | |
| Actual | $ | 1,000 | $ | 943.00 | $ | 8.04 |
| Hypothetical (5% return before expenses) | $ | 1,000 | $ | 1,016.80 | $ | 8.34 |
| R | | | | | | |
| Actual | $ | 1,000 | $ | 945.40 | $ | 5.61 |
| Hypothetical (5% return before expenses) | $ | 1,000 | $ | 1,019.30 | $ | 5.82 |
| R6 | | | | | | |
| Actual | $ | 1,000 | $ | 948.50 | $ | 2.34 |
| Hypothetical (5% return before expenses) | $ | 1,000 | $ | 1,022.66 | $ | 2.43 |
| Advisor | | | | | | |
| Actual | $ | 1,000 | $ | 947.50 | $ | 3.17 |
| Hypothetical (5% return before expenses) | $ | 1,000 | $ | 1,021.81 | $ | 3.29 |
*Expenses are calculated using the most recent six-month expense ratio, net of expense waivers, annualized for each class (A: 0.90%;
C: 1.65%; R: 1.15%; R6: 0.48%; and Advisor: 0.65%), multiplied by the average account value over the period, multiplied by 183/365 to
reflect the one-half year period.
franklintempleton.com
Annual Report
|
13
Franklin Growth Fund
We are pleased to bring you Franklin Growth Fund’s annual report for the fiscal year ended September 30, 2015.
Your Fund’s Goal and Main Investments
The Fund seeks capital appreciation by investing substantially in equity securities of companies that are leaders in their industries.
Performance Overview
The Fund’s Class A shares delivered a +2.94% cumulative total return for the 12 months under review. In comparison, the Standard & Poor’s 500 Index (S&P 500), which is a broad measure of U.S. stock performance, had a -0.61% total return.1 You can find the Fund’s long-term performance data in the Performance Summary beginning on page 17.
Performance data represent past performance, which does not guarantee future results. Investment return and principal value will fluctuate, and you may have a gain or loss when you sell your shares. Current performance may differ from figures shown. Please visit franklintempleton.com or call (800) 342-5236 for most recent month-end performance.
Investment Strategy
We use fundamental, bottom-up research to seek companies meeting our criteria of growth potential, quality and valuation. In seeking sustainable growth characteristics, we look for companies we believe can produce sustainable earnings and cash flow growth, evaluating the long-term market opportunity and competitive structure of an industry to target leaders and emerging leaders. We define quality companies as those with strong and improving competitive positions in attractive markets. We also believe important attributes of quality are experienced and talented management teams as well as financial strength reflected in the capital structure, gross and operating margins, free cash flow generation and returns on capital employed. Our valuation analysis includes a range of potential outcomes based on an assessment of multiple scenarios. In assessing value, we consider whether security prices fully reflect the balance of the sustainable growth opportunities relative to business and financial risks.
Manager’s Discussion
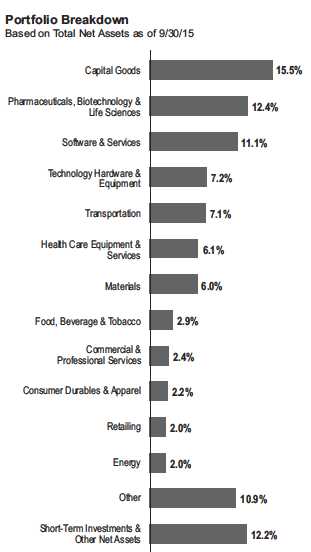
Franklin Growth Fund owned shares of 155 companies at period-end. We continue to invest in a broad array of companies of all sizes and in varied industries.
1. Source: Morningstar.
The index is unmanaged and includes reinvested dividends. One cannot invest directly in an index, and an index is not representative of the Fund’s portfolio.
The dollar value, number of shares or principal amount, and names of all portfolio holdings are listed in the Fund’s Statement of Investments (SOI).
The SOI begins on page 67.
|
14 Annual Report
franklintempleton.com
FRANKLIN GROWTH FUND
During the period under review, most investment sectors contributed to absolute performance, particularly industrials, health care and consumer discretionary.2 In industrials, air service provider Alaska Air Group reported record margin and profits largely due to competitor Delta Air Line’s slowing capacity growth in Seattle and falling fuel prices. Shares of fluid filtration products supplier Pall Corporation rose as Danaher announced a definitive agreement to acquire the company. Defense contractor Northrup Grumman has consistently met or exceeded consensus estimates for revenues and profitability, returned large amounts of capital to shareholders through dividends and share repurchases, and raised its guidance in its first quarter and second quarter earnings calls. In health care, beauty drug maker Allergan gained from its acquisition by Actavis, and injection drug and infusion technology provider Hospira benefited from being acquired by Pfizer. In consumer discretionary, online retail shopping service provider Amazon.com reported strong, sustained revenue growth in core domestic retail, including Amazon Prime customers, and better-than-expected profits for its new Amazon web services cloud computing business. Additionally, the company improved its fixed and variable costs through lower shipping expenses, better utilization of fulfillment centers and growing use of third-party sellers.
Energy companies, including many with solid fundamentals, were generally hurt by declining energy prices and geopolitical unrest. Thus, the Fund’s modest energy sector allocation hindered absolute performance. Anadarko Petroleum reduced capital spending and lowered its 2015 volume growth forecast as crude oil and natural gas prices fell. The sell-off in oilfield services stocks also negatively affected energy technology provider FMC Technologies and oil and gas industry products and services firm Halliburton.
| | |
| Top 10 Holdings | | |
| 9/30/15 | | |
| Company | % of Total | |
| Sector/Industry | Net Assets | |
| |
| Apple Inc. | 4.0 | % |
| Technology Hardware & Equipment | | |
| Alaska Air Group Inc. | 2.3 | % |
| Transportation | | |
| Google Inc., A & C | 1.8 | % |
| Software & Services | | |
| Northrop Grumman Corp. | 1.6 | % |
| Capital Goods | | |
| Amazon.com Inc. | 1.6 | % |
| Retailing | | |
| The Walt Disney Co. | 1.5 | % |
| Media | | |
| Cytec Industries Inc. | 1.3 | % |
| Materials | | |
| Biogen Inc. | 1.3 | % |
| Pharmaceuticals, Biotechnology & Life Sciences | | |
| The Boeing Co. | 1.3 | % |
| Capital Goods | | |
| Amgen Inc. | 1.2 | % |
| Pharmaceuticals, Biotechnology & Life Sciences | | |
In other sectors, Trimble Navigation, a positioning, wireless and software technology provider, suffered as its end markets — oil exploration, agriculture, China and South America —deteriorated simultaneously. U.S. dollar strength also weakened sales and had a negative exchange rate effect. A large drop in copper prices hurt copper and gold mining firm Freeport-McMoRan (sold by period-end), which had to sell its Candelaria copper mine and raise funds through equity sales to maintain its financial strength. IT software and services provider International Business Machines’ legacy services, software and hardware businesses struggled as enterprises accelerated their investment in emerging cloud computing and Software as a Service solutions.
2. The industrials sector comprises capital goods, commercial and professional services, and transportation in the SOI. The health care sector comprises health care
equipment and services; and pharmaceuticals, biotechnology and life sciences in the SOI. The consumer discretionary sector comprises automobiles and components,
consumer durables and apparel, consumer services, media and retailing in the SOI.
See www.franklintempletondatasources.com for additional data provider information.
|
franklintempleton.com Annual Report 15
FRANKLIN GROWTH FUND
Thank you for your continued participation in Franklin Growth Fund. We look forward to serving your future investment needs.

The foregoing information reflects our analysis, opinions and portfolio holdings as of September 30, 2015, the end of the reporting period. The way we implement our main investment strategies and the resulting portfolio holdings may change depending on factors such as market and economic conditions. These opinions may not be relied upon as investment advice or an offer for a particular security. The information is not a complete analysis of every aspect of any market, country, industry, security or the Fund. Statements of fact are from sources considered reliable, but the investment manager makes no representation or warranty as to their completeness or accuracy. Although historical performance is no guarantee of future results, these insights may help you understand our investment management philosophy.
CFA® is a trademark owned by CFA Institute.
|
16 Annual Report
franklintempleton.com
FRANKLIN GROWTH FUND
Performance Summary as of September 30, 2015
Your dividend income will vary depending on dividends or interest paid by securities in the Fund’s portfolio, adjusted for operating expenses of each class. Capital gain distributions are net profits realized from the sale of portfolio securities. The performance table and graphs do not reflect any taxes that a shareholder would pay on Fund dividends, capital gain distributions, if any, or any realized gains on the sale of Fund shares. Total return reflects reinvestment of the Fund’s dividends and capital gain distributions, if any, and any unrealized gains or losses.
| | | | | |
| Net Asset Value | | | | | |
| Share Class (Symbol) | | 9/30/15 | | 9/30/14 | Change |
| A (FKGRX) | $ | 72.40 | $ | 70.51 | +$1.89 |
| C (FRGSX) | $ | 67.17 | $ | 65.75 | +$1.42 |
| R (FGSRX) | $ | 71.93 | $ | 70.05 | +$1.88 |
| R6 (FIFRX) | $ | 72.69 | $ | 70.76 | +$1.93 |
| Advisor (FCGAX) | $ | 72.67 | $ | 70.75 | +$1.92 |
| | |
| Distributions1 (10/1/14–9/30/15) | | |
| | | Dividend |
| Share Class | | Income |
| A | $ | 0.1859 |
| R6 | $ | 0.4667 |
| Advisor | $ | 0.3521 |
franklintempleton.com
Annual Report
|
17
FRANKLIN GROWTH FUND
PERFORMANCE SUMMARY
Performance as of 9/30/152
Cumulative total return excludes sales charges. Average annual total return and value of $10,000 investment include maximum sales charges. Class A: 5.75% maximum initial sales charge; Class C: 1% contingent deferred sales charge in first year only;
Class R/R6/Advisor Class: no sales charges.
| | | | | | | | |
| | Cumulative | | Average Annual | | | Value of | Total Annual | |
| Share Class | Total Return3 | | Total Return4 | | $ | 10,000 Investment5 | Operating Expenses6 | |
| A | | | | | | | 0.90 | % |
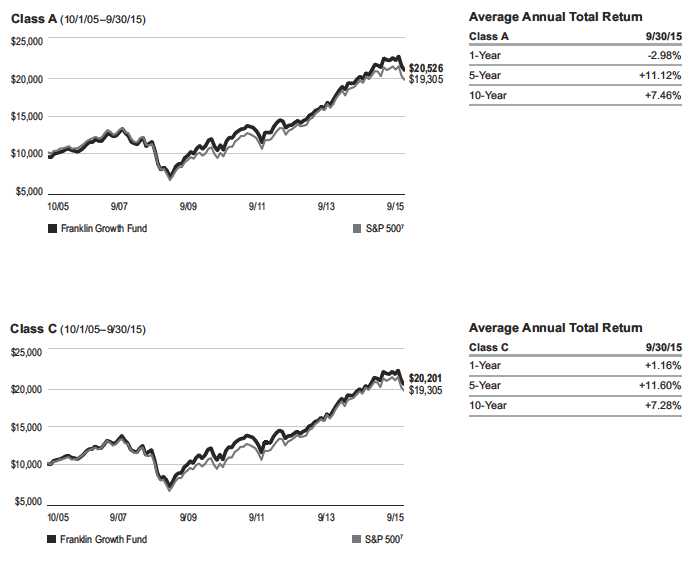
| 1-Year | +2.94 | % | -2.98 | % | $ | 9,702 | | |
| 5-Year | +79.72 | % | +11.12 | % | $ | 16,938 | | |
| 10-Year | +117.76 | % | +7.46 | % | $ | 20,526 | | |
| C | | | | | | | 1.65 | % |
| 1-Year | +2.16 | % | +1.16 | % | $ | 10,116 | | |
| 5-Year | +73.09 | % | +11.60 | % | $ | 17,309 | | |
| 10-Year | +102.01 | % | +7.28 | % | $ | 20,201 | | |
| R | | | | | | | 1.15 | % |
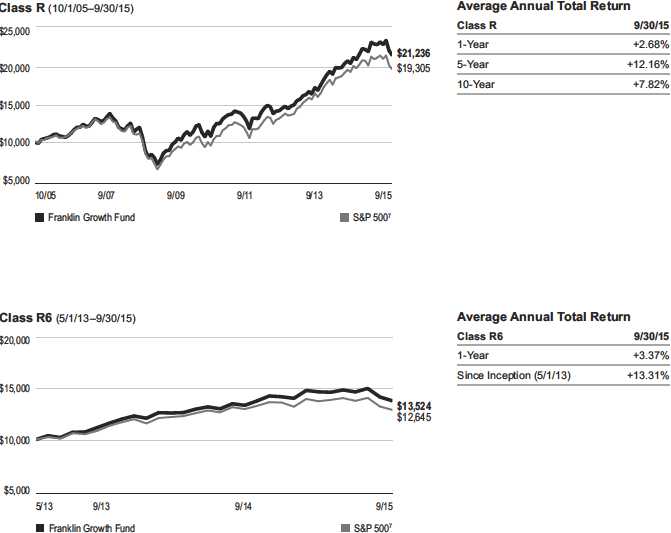
| 1-Year | +2.68 | % | +2.68 | % | $ | 10,268 | | |
| 5-Year | +77.48 | % | +12.16 | % | $ | 17,748 | | |
| 10-Year | +112.36 | % | +7.82 | % | $ | 21,236 | | |
| R6 | | | | | | | 0.47 | % |
| 1-Year | +3.37 | % | +3.37 | % | $ | 10,337 | | |
| Since Inception (5/1/13) | +35.24 | % | +13.31 | % | $ | 13,524 | | |
| Advisor | | | | | | | 0.65 | % |
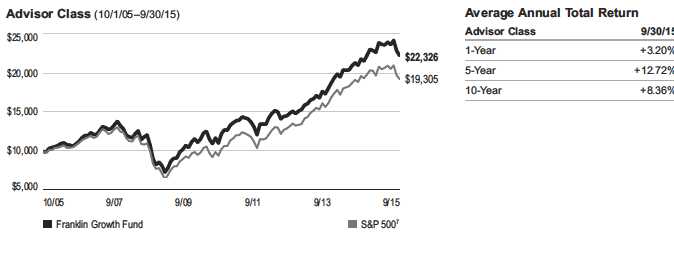
| 1-Year | +3.20 | % | +3.20 | % | $ | 10,320 | | |
| 5-Year | +81.99 | % | +12.72 | % | $ | 18,199 | | |
| 10-Year | +123.26 | % | +8.36 | % | $ | 22,326 | | |
Performance data represent past performance, which does not guarantee future results. Investment return and principal value will fluctuate, and you may have a gain or loss when you sell your shares. Current performance may differ from figures shown. For most recent month-end performance, go to franklintempleton.com or call (800) 342-5236.
|
18 Annual Report
franklintempleton.com
FRANKLIN GROWTH FUND
PERFORMANCE SUMMARY
Total Return Index Comparison for a Hypothetical $10,000 Investment2
Total return represents the change in value of an investment over the periods shown. It includes any applicable maximum sales charge, Fund expenses, account fees and reinvested distributions. The unmanaged index includes reinvestment of any income or distributions. It differs from the Fund in composition and does not pay management fees or expenses. One cannot invest directly in an index.
franklintempleton.com
Annual Report
|
19
FRANKLIN GROWTH FUND
PERFORMANCE SUMMARY
Total Return Index Comparison for a Hypothetical $10,000 Investment2 (continued)
|
20 Annual Report
franklintempleton.com
FRANKLIN GROWTH FUND
PERFORMANCE SUMMARY
Total Return Index Comparison for a Hypothetical $10,000 Investment2 (continued)
All investments involve risks, including possible loss of principal. Historically, the Fund has focused on larger companies. The Fund may also invest in small, relatively new and/or unseasoned companies, which involves additional risks, as the prices of these securities can be volatile, particularly over the short term. The Fund may focus on particular sectors of the market from time to time, which can carry greater risks of adverse developments in such sectors. In addition, the Fund may invest up to 40% of its net assets in stocks of foreign companies, which involve special risks, including currency fluctuations and economic as well as political uncertainty. The Fund is actively managed but there is no guarantee that the manager’s investment decisions will produce the desired results. The Fund’s prospectus also includes a description of the main investment risks.
| |
| Class C: | These shares have higher annual fees and expenses than Class A shares. |
| Class R: | Shares are available to certain eligible investors as described in the prospectus. These shares have higher annual fees and expenses than Class A shares. |
| Class R6: | Shares are available to certain eligible investors as described in the prospectus. |
| Advisor Class: | Shares are available to certain eligible investors as described in the prospectus. |
1. The distribution amount is the sum of the dividend payments to shareholders for the period shown and includes only estimated tax-basis net investment income.
2. The Fund has a fee waiver associated with any investment in a Franklin Templeton money fund, contractually guaranteed through at least its current fiscal year-end.
Fund investment results reflect the fee waiver, to the extent applicable; without this reduction, the results would have been lower.
3. Cumulative total return represents the change in value of an investment over the periods indicated.
4. Average annual total return represents the average annual change in value of an investment over the periods indicated.
5. These figures represent the value of a hypothetical $10,000 investment in the Fund over the periods indicated.
6. Figures are as stated in the Fund’s current prospectus. In periods of market volatility, assets may decline significantly, causing total annual Fund operating expenses to
become higher than the figures shown.
7. Source: Morningstar. The S&P 500 is a market capitalization-weighted index of 500 stocks designed to measure total U.S. equity market performance.
See www.franklintempletondatasources.com for additional data provider information.
franklintempleton.com
Annual Report
|
21
FRANKLIN GROWTH FUND
Your Fund’s Expenses
As a Fund shareholder, you can incur two types of costs:
- Transaction costs, including sales charges (loads) on Fund purchases; and
- Ongoing Fund costs, including management fees, distribution and service (12b-1) fees, and other Fund expenses. All mutual funds have ongoing costs, sometimes referred to as operating expenses.
The following table shows ongoing costs of investing in the Fund and can help you understand these costs and compare them with those of other mutual funds. The table assumes a $1,000 investment held for the six months indicated.
Actual Fund Expenses
The first line (Actual) for each share class listed in the table provides actual account values and expenses. The “Ending Account Value” is derived from the Fund’s actual return, which includes the effect of Fund expenses.
You can estimate the expenses you paid during the period by following these steps. Of course, your account value and expenses will differ from those in this illustration:
1. Divide your account value by $1,000.
If an account had an $8,600 value, then $8,600 ÷ $1,000 = 8.6.
2. Multiply the result by the number under the heading “Expenses Paid During Period.”
If Expenses Paid During Period were $7.50, then 8.6 x $7.50 = $64.50.
In this illustration, the estimated expenses paid this period are $64.50.
Hypothetical Example for Comparison with Other Funds
Information in the second line (Hypothetical) for each class in the table can help you compare ongoing costs of investing in the Fund with those of other mutual funds. This information may not be used to estimate the actual ending account balance or expenses you paid during the period. The hypothetical “Ending Account Value” is based on the actual expense ratio for each class and an assumed 5% annual rate of return before expenses, which does not represent the Fund’s actual return. The figure under the heading “Expenses Paid During Period” shows the hypothetical expenses your account would have incurred under this scenario. You can compare this figure with the 5% hypothetical examples that appear in shareholder reports of other funds.
Please note that expenses shown in the table are meant to highlight ongoing costs and do not reflect any transaction costs, such as sales charges. Therefore, the second line for each class is useful in comparing ongoing costs only, and will not help you compare total costs of owning different funds. In addition, if transaction costs were included, your total costs would have been higher. Please refer to the Fund prospectus for additional information on operating expenses.
|
22 Annual Report
franklintempleton.com
FRANKLIN GROWTH FUND
YOUR FUND’S EXPENSES
| | | | | | |
| | | Beginning Account | | Ending Account | | Expenses Paid During |
| Share Class | | Value 4/1/15 | | Value 9/30/15 | | Period* 4/1/15–9/30/15 |
| A | | | | | | |
| Actual | $ | 1,000 | $ | 938.30 | $ | 4.23 |
| Hypothetical (5% return before expenses) | $ | 1,000 | $ | 1,020.71 | $ | 4.41 |
| C | | | | | | |
| Actual | $ | 1,000 | $ | 934.70 | $ | 7.86 |
| Hypothetical (5% return before expenses) | $ | 1,000 | $ | 1,016.95 | $ | 8.19 |
| R | | | | | | |
| Actual | $ | 1,000 | $ | 937.10 | $ | 5.44 |
| Hypothetical (5% return before expenses) | $ | 1,000 | $ | 1,019.45 | $ | 5.67 |
| R6 | | | | | | |
| Actual | $ | 1,000 | $ | 940.20 | $ | 2.19 |
| Hypothetical (5% return before expenses) | $ | 1,000 | $ | 1,022.81 | $ | 2.28 |
| Advisor | | | | | | |
| Actual | $ | 1,000 | $ | 939.50 | $ | 3.01 |
| Hypothetical (5% return before expenses) | $ | 1,000 | $ | 1,021.96 | $ | 3.14 |
*Expenses are calculated using the most recent six-month expense ratio, net of expense waivers, annualized for each class (A: 0.87%;
C: 1.62%; R: 1.12%; R6: 0.45% and Advisor: 0.62%), multiplied by the average account value over the period, multiplied by 183/365
to reflect the one-half year period.
franklintempleton.com
Annual Report
|
23
Franklin Income Fund
This annual report for Franklin Income Fund covers the fiscal year ended September 30, 2015.
Your Fund’s Goal and Main Investments
The Fund seeks to maximize income while maintaining prospects for capital appreciation by investing, under normal market conditions, in a diversified portfolio of debt and equity securities.
Performance Overview
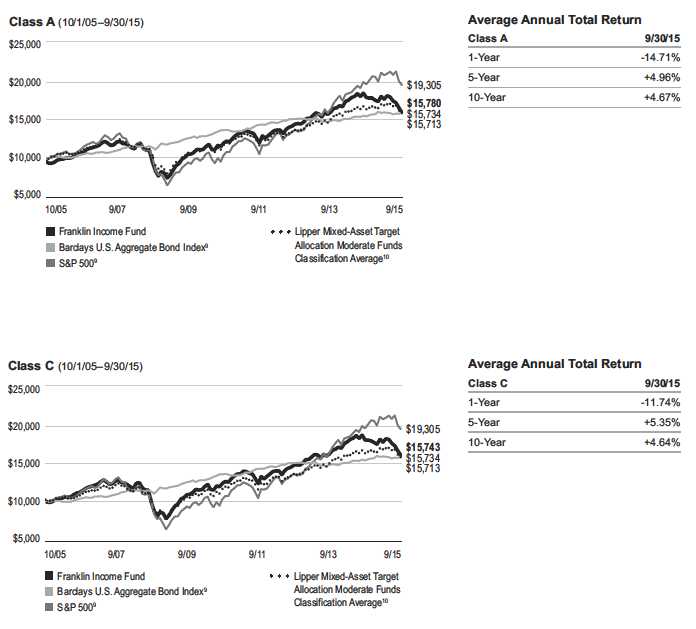
The Fund’s Class A shares had a -10.93% cumulative total return for the 12 months under review. In comparison, the Fund’s equity benchmark, the Standard & Poor’s 500 Index (S&P 500), which is a broad measure of U.S. stock performance, had a -0.61% total return.1 The Fund’s fixed income benchmark, the Barclays U.S. Aggregate Bond Index, which tracks the U.S. investment-grade, taxable bond market, posted a +2.94% total return.1 The Fund’s peers, as measured by the Lipper Mixed-Asset Target Allocation Moderate Funds Classification Average, which consists of funds chosen by Lipper that, by practice, maintain a mix of 40% to 60% equity securities, with the remainder in bonds and cash, returned -3.06%.2 You can find the Fund’s long-term performance data in the Performance Summary beginning on page 28.
Performance data represent past performance, which does not guarantee future results. Investment return and principal value will fluctuate, and you may have a gain or loss when you sell your shares. Current performance may differ from figures shown. Please visit franklintempleton.com or call (800) 342-5236 for most recent month-end performance.
Investment Strategy
By generally performing independent analysis of debt, convertible and equity securities, we search for undervalued or out-of-favor securities we believe offer opportunities for income today and significant growth tomorrow. We consider such factors as a company’s experience and managerial strength; its cash flow potential and profitability; its competitive positioning and
| | | | | |
| Dividend Distributions* | | | |
| 10/1/14–9/30/15 | | | | |
| | | Dividend per Share (cents) | |
| | | | | | Advisor |
| Month | Class A | Class C | Class R | Class R6 | Class |
| October | 1.00 | 0.89 | 0.93 | 1.05 | 1.03 |
| November | 1.00 | 0.89 | 0.93 | 1.05 | 1.03 |
| December | 1.00 | 0.89 | 0.93 | 1.04 | 1.03 |
| January | 1.00 | 0.89 | 0.93 | 1.04 | 1.03 |
| February | 1.00 | 0.89 | 0.93 | 1.04 | 1.03 |
| March | 1.00 | 0.91 | 0.94 | 1.04 | 1.03 |
| April | 1.00 | 0.91 | 0.94 | 1.04 | 1.03 |
| May | 1.00 | 0.91 | 0.94 | 1.04 | 1.03 |
| June | 1.00 | 0.89 | 0.93 | 1.05 | 1.03 |
| July | 1.00 | 0.89 | 0.93 | 1.05 | 1.03 |
| August | 1.00 | 0.89 | 0.93 | 1.05 | 1.03 |
| September | 1.00 | 0.90 | 0.93 | 1.04 | 1.02 |
| Total | 12.00 | 10.75 | 11.19 | 12.53 | 12.35 |
*The distribution amount is the sum of the dividend payments to shareholders for
the period shown and includes only estimated tax-basis net investment income.
All Fund distributions will vary depending upon current market conditions, and
past distributions are not indicative of future trends.
advantages; its responsiveness to changes in interest rates and business conditions; debt maturity schedules and borrowing requirements; a company’s changing financial condition and market recognition of the change; and a security’s relative value based on such factors as anticipated cash flow, interest or dividend coverage, asset coverage and earnings.
Manager’s Discussion
During the 12 months under review, we continued to strategically shift the Fund’s asset mix in seeking to manage risks, and our equity holdings increased while our fixed income holdings declined. The Fund’s equity weighting rose from 60.6% to 65.5% of total net assets and its fixed income weighting fell from 38.2% to 32.5%. Our cash position rose from 1.2% to 2.0% of total net assets.
1. Source: Morningstar.
2. Source: Lipper, a Thomson Reuters Company. For the 12-month period ended 9/30/15, this category consisted of 574 funds. Lipper calculations do not include sales
charges or expense subsidization by a fund’s manager. The Fund’s performance relative to the average may have differed if these and other factors had been considered.
The indexes are unmanaged and include reinvestment of any income or distributions. One cannot invest directly in an index, and an index is not representative of the
Fund’s portfolio.
The dollar value, number of shares or principal amount, and names of all portfolio holdings are listed in the Fund’s Statement of Investments (SOI).
The SOI begins on page 77.
|
24 Annual Report franklintempleton.com
FRANKLIN INCOME FUND
| | |
| Portfolio Breakdown | | |
| 9/30/15 | | |
| | % of Total | |
| | Net Assets | |
| Equity* | 65.5 | % |
| Utilities | 11.0 | % |
| Energy | 10.2 | % |
| Materials | 8.4 | % |
| Industrials | 8.4 | % |
| Health Care | 7.5 | % |
| Financials | 5.5 | % |
| Information Technology | 5.3 | % |
| Consumer Discretionary | 4.5 | % |
| Telecommunication Services | 2.5 | % |
| Consumer Staples | 2.2 | % |
| Fixed Income** | 32.5 | % |
| Energy | 6.5 | % |
| Consumer Discretionary | 5.9 | % |
| Financials | 4.8 | % |
| Telecommunication Services | 3.1 | % |
| Information Technology | 3.0 | % |
| Materials | 2.8 | % |
| Other | 6.4 | % |
| Short-Term Investments & Other Net Assets | 2.0 | % |
*Includes convertible bonds.
**Includes senior floating rate interests.
The Fund’s equity holdings underperformed the S&P 500 during the period, largely because of weak performance in the Fund’s energy and materials sector positions. During the period, crude oil prices declined precipitously by about one half, influenced by OPEC’s drive for greater market share along with uncertain demand in late 2014 and early 2015 as global economies slowed. This environment took a severe toll on the share prices of large, international, integrated oil companies including Royal Dutch Shell, Chevron, BP, Total and Exxon Mobil, which were among the Fund’s leading energy sector decliners. Our positions in upstream-focused oil and gas producers including Canadian Oil Sands, Anadarko Petroleum and Chesapeake Energy also lost value as crude oil and natural gas prices fell. Additionally, with reduced revenues and cash flows expected in a lower commodity price environment, capital expenditure budgets for upstream activities declined, dimming the outlook for oilfield services and equipment companies including Schlumberger and Halliburton. On a more positive note, the industry’s supply and demand balance began to improve somewhat as low prices stimulated consumption and as reduced investment weighed on the forward supply outlook.
A majority of holdings in the materials sector detracted from Fund performance, with Freeport-McMoRan, BHP Billiton and Rio Tinto among the largest decliners. These well-positioned operators with relatively stronger balance sheets than those of their peers have lowered their cost structures, but their recent results reflected dramatically lower commodity prices and lighter volumes. Results of two of our larger global chemical companies, E.I. du Pont de Nemours and Co. and The Dow Chemical Co., also negatively affected performance. Du Pont’s results have been disappointing and the company recently lowered annual guidance following declining demand, unfavorable currency exchange rates and a lack of progress reducing costs. Dow Chemical was hurt by currency exchange rates and lower energy prices that suppressed ethylene profitability.
In the financials sector, our positions overall hurt performance as small gains in banks, namely Citigroup3 and Wells Fargo & Co., were more than offset by losses in Royal Bank of Canada and insurance company MetLife. Hindering MetLife was uncertainty about interest rate rises as well as its exposure to slowing Asian economies. Although we continue to be optimistic about Royal Bank of Canada, the Canadian dollar’s declining value and fears of slower Canadian economic growth amid energy market volatility pressured the bank’s results over the past year.
The utilities sector produced a major positive contribution with strong results from PG&E, Xcel Energy and The Southern Co., although Exelon, one of our larger utility holdings, notably detracted. The market generally viewed utilities less favorably earlier in the year as the prospect for interest rate increases was high, but utility stocks rebounded somewhat as the Fed elected not to raise rates in September. Although the potential for future rate hikes may likely continue to dampen investor sentiment toward utility sector stocks, we feel our focus on individual utility companies with meaningful earnings-per-share growth potential somewhat mitigated this interest rate sensitivity. Within the Fund’s utilities sector, we sought investments we viewed as having growth potential with
3. Sold by period-end.
|
franklintempleton.com Annual Report 25
FRANKLIN INCOME FUND
liquefied natural gas export projects, capital investment and rate-base growth aimed at enhancing our nation’s electricity transmission and natural gas pipeline infrastructure, certain states where the regulatory environment has been welcoming to needed capital investments, and renewable energy projects. At period-end, the Fund’s overall weighting in utilities remained toward the low end of its historical range.
The Fund’s industrials sector holdings also contributed positively to performance, particularly investments in aerospace and defense. Lockheed Martin and Raytheon are examples of companies that fit well with our overall investment framework as we believe they operate strong businesses with underappre-ciated growth and improving margins and cash flows. Given new product development and healthy government defense spending levels, we believe the opportunity for defense contractors should be attractive for the next several years. Although the Fund’s industrials sector exposure benefited overall results, logistics facilitator CEVA Holdings and a new position in multi-industry conglomerate United Technologies hindered sector performance. Our weighting in industrials grew as the year progressed due to strong performance and the addition of several new investments made later in the Fund’s fiscal year as fears of slower global economic activity created opportunities we considered compelling.
In the consumer discretionary sector, strong results for one of the Fund’s larger holdings, retailer Target, aided Fund performance. Investors reacted favorably to Target’s new management team, which had increased in-store traffic, refocused merchandise and exited its troubled Canadian segment.
In health care, pharmaceutical giants Eli Lilly and Pfizer continued to benefit from new drug development prospects, and their results aided Fund performance, while Merck and Sanofi had disappointing results and detracted from performance.
Within fixed income, despite a slight reduction in U.S. Treasury yields, high yield corporate bonds had negative returns as yield spreads over Treasuries widened during the period. This widening was most pronounced in the energy and materials sectors, but growing investor concerns about corporate credit quality in general was evident across most sectors. Despite the negative impact on returns during the reporting period, in our view, the spread widening created opportunities for us to selectively increase our exposure to certain high yield bond issuers at attractive valuations.
| | |
| Top Five Equity Holdings | | |
| 9/30/15 | | |
| Company | % of Total | |
| Sector/Industry | Net Assets | |
| |
| Royal Dutch Shell PLC | 2.4 | % |
| Energy | | |
| General Electric Co. | 2.2 | % |
| Industrials | | |
| PG&E Corp. | 1.7 | % |
| Utilities | | |
| The Dow Chemical Co. | 1.5 | % |
| Materials | | |
| Chevron Corp. | 1.4 | % |
| Energy | | |
Energy was a primary detractor among fixed income sectors driven largely by declines in the securities of independent exploration and production companies. Notable laggards included Linn Energy, Energy XXI Gulf Coast, Halcon Resources, SandRidge Energy and Chesapeake Energy, all of which are North American producers of oil and gas. Commodity price declines raised investor concerns over these companies’ ability to manage cash flows and ultimately meet debt obligations as they become due. During the period we consolidated positions, eliminating several holdings that we believed remained challenged in favor of others that, in our view, appeared to have a clearer path to navigating the industry downturn and restructuring balance sheets through effective capital structure management. The debt securities of oilfield services and equipment companies, particularly offshore drilling contractors including Ocean Rig UDW,3 Hercules Offshore and Vantage Drilling (Offshore Group Investment),3 also lost value as upstream spending expectations fell and industry supply expanded.
Another major fixed income detractor during the period was the basic industry sector.4 Despite being a relatively small allocation within the Fund, our holdings in coal mining companies substantially weighed on performance due to a confluence of factors including falling prices, lower volumes and concerns regarding the continuing decline of coal as a fuel source. The coal industry’s cash flow generation was far below expectations and led to financial distress for many of the top producers. Our holdings in Peabody Energy, Walter Energy, Arch Coal and Alpha Natural Resources3 were notable detractors from this sector during the period. We significantly reduced our overall exposure to the coal industry, and at period-end the portfolio held small positions in Peabody Energy, Walter Energy and Arch Coal secured bonds.
4. Basic industry holdings are in materials in the fixed income section of the SOI.
|
26 Annual Report
franklintempleton.com
FRANKLIN INCOME FUND
| | |
| Top Five Fixed Income Holdings | | |
| and Senior Floating Rate Interests* | | |
| 9/30/15 | | |
| Company | % of Total | |
| Sector/Industry | Net Assets | |
| iHeartCommunications Inc. | 1.9 | % |
| Consumer Discretionary | | |
| First Data Corp. | 1.9 | % |
| Information Technology | | |
| JPMorgan Chase & Co. | 1.9 | % |
| Financials | | |
| Citigroup Inc. | 1.2 | % |
| Financials | | |
| Dynegy Inc. | 0.8 | % |
| Utilities | | |
| |
| *Does not include convertible bonds. | | |
The communications sector also suppressed our fixed income returns during the period.5 Hurting our Sprint position were investor concerns regarding the company’s ability to maintain its share of new subscribers and manage its balance sheet during a period of slowing industry growth. We continue to monitor the progress of Sprint’s new management team as they work closely with Softbank to improve operations and position the company for future growth. iHeartCommunications also weighed on returns due to concerns over its currently high level of debt and the company’s ability to deleverage over time. iHeartCommunications continued to deliver solid operational results and took advantage of its large platform to gain market share from the competition.
Our fixed income holdings in the consumer non-cyclical sector delivered positive returns during the period.6 The hospital industry continued to benefit from broadening access to health care and the resulting growth in demand for its services. Our holdings in HCA, Tenet Healthcare and CHS/Community Health Systems produced solid returns, and the companies were well positioned to benefit from increased future demand, in our view.
The information technology sector also helped the Fund during the period with solid performance from some of our largest
holdings. First Data shares rose as the company continued to strengthen its balance sheet by raising new equity to retire debt and exploring an initial public offering to further reduce its debt load. Freescale Semiconductor also made gains as it continued to improve its cash flow and strengthen its balance sheet. Both companies greatly benefited from refinancing higher cost debt with new debt at much lower interest rates, which had a significant positive impact on cash flow.
Thank you for your continued participation in Franklin Income Fund. We look forward to serving your future investment needs.

The foregoing information reflects our analysis, opinions and portfolio holdings as of September 30, 2015, the end of the reporting period. The way we implement our main investment strategies and the resulting portfolio holdings may change depending on factors such as market and economic conditions. These opinions may not be relied upon as investment advice or an offer for a particular security. The information is not a complete analysis of every aspect of any market, country, industry, security or the Fund. Statements of fact are from sources considered reliable, but the investment manager makes no representation or warranty as to their completeness or accuracy. Although historical performance is no guarantee of future results, these insights may help you understand our investment management philosophy.
5. Communications holdings are in consumer discretionary and telecommunication services in the fixed income section of the SOI.
6. Consumer non-cyclical holdings are in consumer discretionary, consumer staples, health care and information technology in the fixed income section of the SOI.
See www.franklintempletondatasources.com for additional data provider information.
|
franklintempleton.com Annual Report 27
FRANKLIN INCOME FUND
Performance Summary as of September 30, 2015
Your dividend income will vary depending on dividends or interest paid by securities in the Fund’s portfolio, adjusted for operating expenses of each class. Capital gain distributions are net profits realized from the sale of portfolio securities. The performance tables and graphs do not reflect any taxes that a shareholder would pay on Fund dividends, capital gain distributions, if any, or any realized gains on the sale of Fund shares. Total return reflects reinvestment of the Fund’s dividends and capital gain distributions, if any, and any unrealized gains or losses.
| | | | | | |
| Net Asset Value | | | | | | |
| Share Class (Symbol) | | 9/30/15 | | 9/30/14 | | Change |
| A (FKINX) | $ | 2.10 | $ | 2.48 | -$ | 0.38 |
| C (FCISX) | $ | 2.13 | $ | 2.50 | -$ | 0.37 |
| R (FISRX) | $ | 2.07 | $ | 2.44 | -$ | 0.37 |
| R6 (FNCFX) | $ | 2.09 | $ | 2.46 | -$ | 0.37 |
| Advisor (FRIAX) | $ | 2.09 | $ | 2.46 | -$ | 0.37 |
| |
| |
| Distributions1 (10/1/14–9/30/15) | | | | | | |
| Dividend |
| Share Class | | Income | | | | |
| A | $ | 0.1200 | | | | |
| C | $ | 0.1075 | | | | |
| R | $ | 0.1119 | | | | |
| R6 | $ | 0.1253 | | | | |
| Advisor | $ | 0.1235 | | | | |
|
28 Annual Report
franklintempleton.com
FRANKLIN INCOME FUND
PERFORMANCE SUMMARY
Performance as of 9/30/152
Cumulative total return excludes sales charges. Average annual total return and value of $10,000 investment include maximum sales charges. Class A: 4.25% maximum initial sales charge; Class C: 1% contingent deferred sales charge in first year only;
Class R/R6/Advisor Class: no sales charges.
| | | | | | | | |
| | Cumulative | | Average Annual | | | Value of | Total Annual | |
| Share Class | Total Return3 | | Total Return4 | | $ | 10,000 Investment5 | Operating Expenses6 | |
| A | | | | | | | 0.61 | % |
| 1-Year | -10.93 | % | -14.71 | % | $ | 8,529 | | |
| 5-Year | +32.83 | % | +4.96 | % | $ | 12,739 | | |
| 10-Year | +64.74 | % | +4.67 | % | $ | 15,780 | | |
| C | | | | | | | 1.11 | % |
| 1-Year | -10.89 | % | -11.74 | % | $ | 8,826 | | |
| 5-Year | +29.78 | % | +5.35 | % | $ | 12,978 | | |
| 10-Year | +57.43 | % | +4.64 | % | $ | 15,743 | | |
| R | | | | | | | 0.96 | % |
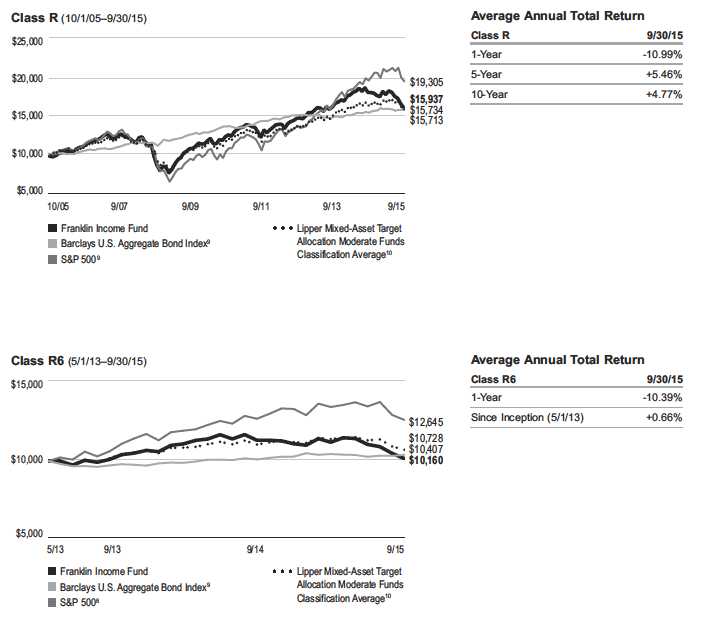
| 1-Year | -10.99 | % | -10.99 | % | $ | 8,901 | | |
| 5-Year | +30.44 | % | +5.46 | % | $ | 13,044 | | |
| 10-Year | +59.37 | % | +4.77 | % | $ | 15,937 | | |
| R6 | | | | | | | 0.38 | % |
| 1-Year | -10.39 | % | -10.39 | % | $ | 8,961 | | |
| Since Inception (5/1/13) | +1.60 | % | +0.66 | % | $ | 10,160 | | |
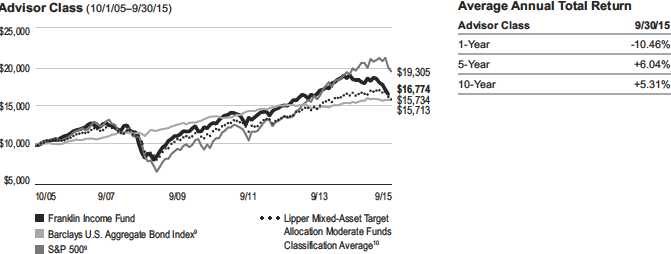
| Advisor | | | | | | | 0.46 | % |
| 1-Year | -10.46 | % | -10.46 | % | $ | 8,954 | | |
| 5-Year | +34.09 | % | +6.04 | % | $ | 13,409 | | |
| 10-Year | +67.74 | % | +5.31 | % | $ | 16,774 | | |
| | | | | | |
| | | | 30-Day Standardized Yield8 | |
| | Distribution | | | | | |
| Share Class | Rate7 | | (with waiver) | | (without waiver) | |
| A | 5.48 | % | 4.65 | % | 4.65 | % |
| C | 5.07 | % | 4.34 | % | 4.34 | % |
| R | 5.39 | % | 4.48 | % | 4.48 | % |
| R6 | 5.97 | % | 5.09 | % | 5.09 | % |
| Advisor | 5.86 | % | 4.99 | % | 4.99 | % |
Performance data represent past performance, which does not guarantee future results. Investment return and principal value will fluctuate, and you may have a gain or loss when you sell your shares. Current performance may differ from figures shown. For most recent month-end performance, go to franklintempleton.com or call (800) 342-5236.
franklintempleton.com
Annual Report
|
29
FRANKLIN INCOME FUND
PERFORMANCE SUMMARY
Total Return Index Comparison for a Hypothetical $10,000 Investment2
Total return represents the change in value of an investment over the periods shown. It includes any applicable maximum sales charge, Fund expenses, account fees and reinvested distributions. The unmanaged indexes include reinvestment of any income or distributions. They differ from the Fund in composition and do not pay management fees or expenses. One cannot invest directly in an index.
|
30 Annual Report
franklintempleton.com
FRANKLIN INCOME FUND
PERFORMANCE SUMMARY
Total Return Index Comparison for a Hypothetical $10,000 Investment2 (continued)
franklintempleton.com
Annual Report
|
31
FRANKLIN INCOME FUND
PERFORMANCE SUMMARY
Total Return Index Comparison for a Hypothetical $10,000 Investment2 (continued)
All investments involve risks, including possible loss of principal. Stock prices fluctuate, sometimes rapidly and dramatically, due to factors affecting individual companies, particular industries or sectors, or general market conditions. The Fund’s share price and yield will be affected by interest rate movements. Bond prices generally move in the opposite direction of interest rates. Thus, as prices of bonds in the Fund adjust to a rise in interest rates, the Fund’s share price may decline. Changes in the financial strength of a bond issuer or in a bond’s credit rating may affect its value. The Fund’s portfolio includes a substantial portion of higher yielding, lower rated corporate bonds because of the relatively higher yields they offer. Floating-rate loans are lower rated, higher yielding instruments, which are subject to increased risk of default and can potentially result in loss of principal. These securities carry a greater degree of credit risk relative to investment-grade securities. The Fund is actively managed but there is no guarantee that the manager’s investment decisions will produce the desired results. The Fund’s prospectus also includes a description of the main investment risks.
| |
| Class C: | These shares have higher annual fees and expenses than Class A shares. |
| Class R: | Shares are available to certain eligible investors as described in the prospectus. These shares have higher annual fees and expenses than Class A shares. |
| Class R6: | Shares are available to certain eligible investors as described in the prospectus. |
| Advisor Class: | Shares are available to certain eligible investors as described in the prospectus. |
1. The distribution amount is the sum of the dividend payments to shareholders for the period shown and includes only estimated tax-basis net investment income.
2. The Fund has a fee waiver associated with any investment in a Franklin Templeton money fund, contractually guaranteed through at least its current fiscal year-end.
Fund investment results reflect the fee waiver, to the extent applicable; without this reduction, the results would have been lower.
3. Cumulative total return represents the change in value of an investment over the periods indicated.
4. Average annual total return represents the average annual change in value of an investment over the periods indicated.
5. These figures represent the value of a hypothetical $10,000 investment in the Fund over the periods indicated.
6. Figures are as stated in the Fund’s current prospectus. In periods of market volatility, assets may decline significantly, causing total annual Fund operating expenses to
become higher than the figures shown.
7. Distribution rate is based on an annualization of the respective class’s September dividend and the maximum offering price (NAV for Classes C, R, R6 and Advisor) per
share on 9/30/15.
8. The 30-day standardized yield for the 30 days ended 9/30/15 reflects an estimated yield to maturity (assuming all portfolio securities are held to maturity). It should be
regarded as an estimate of the Fund’s rate of investment income, and it may not equal the Fund’s actual income distribution rate (which reflects the Fund’s past dividends
paid to shareholders) or the income reported in the Fund’s financial statements.
9. Source: Morningstar. The S&P 500 is a market capitalization-weighted index of 500 stocks designed to measure total U.S. equity market performance. The Barclays U.S.
Aggregate Bond Index is a market capitalization-weighted index representing the U.S. investment-grade, fixed-rate, taxable bond market with index components for government
and corporate, mortgage pass-through and asset-backed securities. All issues included are SEC registered, taxable, dollar denominated and nonconvertible, must have at least
one year to final maturity and must be rated investment grade (Baa3/BBB-/BBB- or higher) using the middle rating of Moody’s, S&P and Fitch, respectively.
10. Source: Lipper, a Thomas Reuters Company. The Lipper Mixed-Asset Target Allocation Moderate Funds Classification Average is calculated by averaging the total
returns of all funds within the Lipper Mixed-Asset Target Allocation Moderate Funds classification in the Lipper Open-End underlying funds universe. Lipper Mixed-Asset
Target Allocation Moderate Funds are defined as funds that, by portfolio practice, maintain a mix of between 40%–60% equity securities, with the remainder invested in
bonds, cash and cash equivalents. For the 12-month period ended 9/30/15, there were 574 funds in this category. Lipper calculations do not include sales charges or
expense subsidization by a fund’s manager. The Fund’s performance relative to the average may have differed if these and other factors had been considered.
See www.franklintempletondatasources.com for additional data provider information.
|
32 Annual Report franklintempleton.com
FRANKLIN INCOME FUND
Your Fund’s Expenses
As a Fund shareholder, you can incur two types of costs:
- Transaction costs, including sales charges (loads) on Fund purchases; and
- Ongoing Fund costs, including management fees, distribution and service (12b-1) fees, and other Fund expenses. All mutual funds have ongoing costs, sometimes referred to as operating expenses.
The following table shows ongoing costs of investing in the Fund and can help you understand these costs and compare them with those of other mutual funds. The table assumes a $1,000 investment held for the six months indicated.
Actual Fund Expenses
The first line (Actual) for each share class listed in the table provides actual account values and expenses. The “Ending Account Value” is derived from the Fund’s actual return, which includes the effect of Fund expenses.
You can estimate the expenses you paid during the period by following these steps. Of course, your account value and expenses will differ from those in this illustration:
1. Divide your account value by $1,000.
If an account had an $8,600 value, then $8,600 ÷ $1,000 = 8.6.
2. Multiply the result by the number under the heading “Expenses Paid During Period.”
If Expenses Paid During Period were $7.50, then 8.6 x $7.50 = $64.50.
In this illustration, the estimated expenses paid this period are $64.50.
Hypothetical Example for Comparison with Other Funds
Information in the second line (Hypothetical) for each class in the table can help you compare ongoing costs of investing in the Fund with those of other mutual funds. This information may not be used to estimate the actual ending account balance or expenses you paid during the period. The hypothetical “Ending Account Value” is based on the actual expense ratio for each class and an assumed 5% annual rate of return before expenses, which does not represent the Fund’s actual return. The figure under the heading “Expenses Paid During Period” shows the hypothetical expenses your account would have incurred under this scenario. You can compare this figure with the 5% hypothetical examples that appear in shareholder reports of other funds.
Please note that expenses shown in the table are meant to highlight ongoing costs and do not reflect any transaction costs, such as sales charges. Therefore, the second line for each class is useful in comparing ongoing costs only, and will not help you compare total costs of owning different funds. In addition, if transaction costs were included, your total costs would have been higher. Please refer to the Fund prospectus for additional information on operating expenses.
franklintempleton.com
Annual Report
|
33
| | | | | | |
| FRANKLIN INCOME FUND | | | | | | |
| YOUR FUND’S EXPENSES | | | | | | |
| |
| |
| |
| | | Beginning Account | | Ending Account | | Expenses Paid During |
| Share Class | | Value 4/1/15 | | Value 9/30/15 | | Period* 4/1/15–9/30/15 |
| A | | | | | | |
| Actual | $ | 1,000 | $ | 901.60 | $ | 2.86 |
| Hypothetical (5% return before expenses) | $ | 1,000 | $ | 1,022.06 | $ | 3.04 |
| C | | | | | | |
| Actual | $ | 1,000 | $ | 904.30 | $ | 5.25 |
| Hypothetical (5% return before expenses) | $ | 1,000 | $ | 1,019.55 | $ | 5.57 |
| R | | | | | | |
| Actual | $ | 1,000 | $ | 902.70 | $ | 4.53 |
| Hypothetical (5% return before expenses) | $ | 1,000 | $ | 1,020.31 | $ | 4.81 |
| R6 | | | | | | |
| Actual | $ | 1,000 | $ | 906.10 | $ | 1.77 |
| Hypothetical (5% return before expenses) | $ | 1,000 | $ | 1,023.21 | $ | 1.88 |
| Advisor | | | | | | |
| Actual | $ | 1,000 | $ | 905.80 | $ | 2.15 |
| Hypothetical (5% return before expenses) | $ | 1,000 | $ | 1,022.81 | $ | 2.28 |
*Expenses are calculated using the most recent six-month expense ratio, net of expense waivers, annualized for each class (A: 0.60%;
C: 1.10%; R: 0.95%; R6: 0.37%; and Advisor: 0.45%), multiplied by the average account value over the period, multiplied by 183/365 to
reflect the one-half year period.
|
34 Annual Report
franklintempleton.com
Franklin U.S. Government Securities Fund
This annual report for Franklin U.S. Government Securities Fund covers the fiscal year ended September 30, 2015.
Your Fund’s Goal and Main Investments
The Fund seeks income by investing at least 80% of its net assets in U.S. government securities. The Fund presently invests substantially all of its assets in Government National Mortgage Association obligations (Ginnie Maes).
Since 1983, the Fund has invested substantially in Ginnie Mae securities, which carry a guarantee backed by the full faith and credit of the U.S. government as to the timely payment of interest and principal.1 Issued by the Government National Mortgage Association (GNMA), Ginnie Maes have been among the highest yielding U.S. government obligations available.
| | |
| Portfolio Breakdown | | |
| Based on Total Net Assets as of 9/30/15 | | |
| GNMA | 98.1 | % |
| Short-Term Investments & Other Net Assets | 1.9 | % |
Performance Overview
The Fund’s Class A shares generated a +2.07% cumulative total return for the 12 months under review. In comparison, the Fund’s peers, as measured by the Lipper GNMA Funds Classification Average, which consists of funds chosen by Lipper that invest primarily in GNMAs, posted a +1.92% total return.2 The Barclays U.S. Government Index: Intermediate Component, the intermediate component of the Barclays U.S. Government Index, returned +3.00% for the same period.3 The Fund’s return reflects the effect of management fees and expenses, while the Barclays U.S. Government Index: Intermediate Component does not have such costs. You can find the Fund’s long-term performance data in the Performance Summary beginning on page 37.
Performance data represent past performance, which does not guarantee future results. Investment return and principal value will fluctuate, and you may have a gain or loss when you sell your shares. Current performance may differ from figures shown. Please visit franklintempleton.com or call (800) 342-5236 for most recent month-end performance.
Investment Strategy
We currently invest the Fund’s assets predominantly in GNMA obligations. We analyze securities using proprietary models to help us identify attractive investment opportunities. The Fund’s short-term investments may include short-term government securities and cash or cash equivalents.
Dividend Distributions*
10/1/14–9/30/15
| | | | | |
| | | Dividend per Share (cents) | |
| | | | | | Advisor |
| Month | Class A | Class C | Class R | Class R6 | Class |
| October | 1.84 | 1.56 | 1.64 | 1.99 | 1.92 |
| November | 1.79 | 1.52 | 1.60 | 1.94 | 1.87 |
| December | 1.83 | 1.55 | 1.63 | 1.98 | 1.91 |
| January | 1.82 | 1.54 | 1.62 | 1.98 | 1.90 |
| February | 1.81 | 1.56 | 1.63 | 1.95 | 1.88 |
| March | 1.77 | 1.49 | 1.58 | 1.93 | 1.85 |
| April | 1.87 | 1.60 | 1.68 | 2.02 | 1.95 |
| May | 1.67 | 1.39 | 1.48 | 1.83 | 1.75 |
| June | 1.77 | 1.50 | 1.58 | 1.92 | 1.85 |
| July | 1.72 | 1.44 | 1.53 | 1.88 | 1.80 |
| August | 1.72 | 1.45 | 1.52 | 1.88 | 1.80 |
| September | 1.72 | 1.46 | 1.53 | 1.87 | 1.80 |
| Total | 21.33 | 18.06 | 19.02 | 23.17 | 22.28 |
*The distribution amount is the sum of the dividend payments to shareholders for
the period shown and includes only estimated tax-basis net investment income.
All Fund distributions will vary depending upon current market conditions, and
past distributions are not indicative of future trends.
1. Securities owned by the Fund, but not shares of the Fund, are guaranteed by the U.S. government, its agencies or instrumentalities as to timely payment of principal
and interest. The Fund’s yield and share price are not guaranteed and will vary with market conditions.
2. Source: Lipper, a Thomson Reuters Company. For the 12-month period ended 9/30/15, this category consisted of 59 funds. Lipper calculations do not include sales
charges or expense subsidization by a fund’s manager. The Fund’s performance relative to the average may have differed if these or other factors had been considered.
3. Source: Morningstar.
The indexes are unmanaged and include reinvestment of any income or distributions. One cannot invest directly in an index, and an index is not representative of the
Fund’s portfolio.
See www.franklintempletondatasources.com for additional data provider information.
The dollar value, number of shares or principal amount, and names of all portfolio holdings are listed in the Fund’s Statement of Investments (SOI).
The SOI begins on page 99.
|
franklintempleton.com Annual Report 35
FRANKLIN U.S. GOVERNMENT SECURITIES FUND
Manager’s Discussion
U.S. economic indicators were generally encouraging during the Fund’s fiscal year, with increases in consumer and investment spending and a declining unemployment rate. Ongoing domestic growth contrasted with a decline in the rate of foreign growth, and the U.S. dollar strengthened against other major currencies, creating a headwind for U.S. exports. We felt the domestic expansionary environment led to an increase in home sales and a rise in property values, while supply in that sector continued to shrink. Consumer credit remained tight even as mortgage interest rates continued to decline. The Federal Reserve (Fed) decided against raising the federal funds rate in September 2015, leaving the target rate at historically low levels, in part due to a decline in foreign growth prospects throughout the period.
Ginnie Mae (GNMA) mortgage-backed securities (MBS) performed well during the period and produced positive total returns but were outpaced by strong performance from Treasuries.
In our view, agency MBS remained fully valued. The Fed’s participation in agency MBS has, in our view, kept mortgage valuations high. Questions persist about the demand source for agency MBS once the Fed moves closer to ceasing reinvestment in MBS. We felt demand from banks, mortgage real estate investment trusts, overseas investors and domestic money managers would need to rise to compensate for the Fed’s reduced presence in the MBS sector. We believed prepayment levels could moderate with mortgage rates staying in the same range and underwriting standards remaining tight.
Within the agency mortgage pass-through sector, GNMA MBS lagged their Fannie Mae MBS and Freddie Mac MBS counterparts. On a total return basis, GNMA 3.0% coupons were the best performers, while 4.5% coupons generally lagged.
The Fund maintains a conservative, disciplined investment strategy and invests entirely in GNMA mortgage pass-throughs, which remain the only MBS that are backed by the full faith and credit of the U.S. government — the same guarantee applicable to U.S. Treasuries.1 Our collateral-intensive research approach can allow us to uncover dislocations across the GNMA markets and associated misvaluation of prepayment risk. We continue to focus on specified pools where we believe our experience and continual investment in new technologies help us uncover these discrepancies.
During the period, we were more weighted toward GNMA IIs (pools of mortgages from multiple issuers) than GNMA Is (pools of mortgages from single issuers). Over the period, we added to GNMA II 3.5% coupons while reducing exposure to 4.5% coupons. Our heaviest allocation was in 3.5%, 4.0% and 4.5% coupons at period-end. The Fund’s positions in higher coupon 4.5% and 5.0% GNMA securities generally benefited performance, while our allocation to 3.5% coupon GNMAs detracted from performance.
Thank you for your continued participation in Franklin U.S. Government Securities Fund. We welcome your comments and questions and look forward to serving your investment needs in the years ahead.

The foregoing information reflects our analysis, opinions and portfolio holdings as of September 30, 2015, the end of the reporting period. The way we implement our main investment strategies and the resulting portfolio holdings may change depending on factors such as market and economic conditions. These opinions may not be relied upon as investment advice or an offer for a particular security. The information is not a complete analysis of every aspect of any market, country, industry, security or the Fund. Statements of fact are from sources considered reliable, but the investment manager makes no representation or warranty as to their completeness or accuracy. Although historical performance is no guarantee of future results, these insights may help you understand our investment management philosophy.
|
36 Annual Report
franklintempleton.com
FRANKLIN U.S. GOVERNMENT SECURITIES FUND
Performance Summary as of September 30, 2015
Your dividend income will vary depending on dividends or interest paid by securities in the Fund’s portfolio, adjusted for operating expenses of each class. Capital gain distributions are net profits realized from the sale of portfolio securities. The performance tables and graphs do not reflect any taxes that a shareholder would pay on Fund dividends, capital gain distributions, if any, or any realized gains on the sale of Fund shares. Total return reflects reinvestment of the Fund’s dividends and capital gain distributions, if any, and any unrealized gains or losses.
| | | | | | |
| Net Asset Value | | | | | | |
| Share Class (Symbol) | | 9/30/15 | | 9/30/14 | | Change |
| A (FKUSX) | $ | 6.40 | $ | 6.48 | -$ | 0.08 |
| C (FRUGX) | $ | 6.36 | $ | 6.44 | -$ | 0.08 |
| R (FUSRX) | $ | 6.40 | $ | 6.48 | -$ | 0.08 |
| R6 (FGORX) | $ | 6.42 | $ | 6.50 | -$ | 0.08 |
| Advisor (FUSAX) | $ | 6.42 | $ | 6.50 | -$ | 0.08 |
| |
| |
| Distributions1 (10/1/14–9/30/15) | | | | | | |
| Dividend |
| Share Class | | Income | | | | |
| A | $ | 0.2133 | | | | |
| C | $ | 0.1806 | | | | |
| R | $ | 0.1902 | | | | |
| R6 | $ | 0.2317 | | | | |
| Advisor | $ | 0.2228 | | | | |
franklintempleton.com
Annual Report
|
37
FRANKLIN U.S. GOVERNMENT SECURITIES FUND
PERFORMANCE SUMMARY
Performance as of 9/30/152
Cumulative total return excludes sales charges. Average annual total return includes maximum sales charges. Class A: 4.25% maximum initial sales charge; Class C: 1% contingent deferred sales charge in first year only; Class R/R6/Advisor Class: no sales charges.
| | | | | | |
| | Cumulative | | Average Annual | | Total Annual | |
| Share Class | Total Return3 | | Total Return4 | | Operating Expenses5 | |
| A | | | | | 0.75 | % |
| 1-Year | +2.07 | % | -2.30 | % | | |
| 5-Year | +12.70 | % | +1.54 | % | | |
| 10-Year | +48.57 | % | +3.59 | % | | |
| C | | | | | 1.25 | % |
| 1-Year | +1.57 | % | +0.58 | % | | |
| 5-Year | +9.92 | % | +1.91 | % | | |
| 10-Year | +41.23 | % | +3.51 | % | | |
| R | | | | | 1.10 | % |
| 1-Year | +1.71 | % | +1.71 | % | | |
| 5-Year | +10.70 | % | +2.05 | % | | |
| 10-Year | +43.28 | % | +3.66 | % | | |
| R6 | | | | | 0.47 | % |
| 1-Year | +2.35 | % | +2.35 | % | | |
| Since Inception (5/1/13) | +3.89 | % | +1.59 | % | | |
| Advisor | | | | | 0.60 | % |
| 1-Year | +2.21 | % | +2.21 | % | | |
| 5-Year | +13.51 | % | +2.57 | % | | |
| 10-Year | +50.50 | % | +4.17 | % | | |
| |
| |
| | | | 30-Day Standardized Yield7 | |
| | Distribution | | | | | |
| Share Class | Rate6 | | (with waiver) | | (without waiver) | |
| A | 3.09 | % | 2.21 | % | 2.20 | % |
| C | 2.75 | % | 1.81 | % | 1.80 | % |
| R | 2.87 | % | 1.96 | % | 1.95 | % |
| R6 | 3.50 | % | 2.60 | % | 2.59 | % |
| Advisor | 3.36 | % | 2.45 | % | 2.44 | % |
Performance data represent past performance, which does not guarantee future results. Investment return and principal value will fluctuate, and you may have a gain or loss when you sell your shares. Current performance may differ from figures shown. For most recent month-end performance, go to franklintempleton.com or call (800) 342-5236.
|
38 Annual Report
franklintempleton.com
FRANKLIN U.S. GOVERNMENT SECURITIES FUND
PERFORMANCE SUMMARY
Total Return Index Comparison for a Hypothetical $10,000 Investment2
Total return represents the change in value of an investment over the periods shown. It includes any applicable maximum sales charge, Fund expenses, account fees and reinvested distributions. The unmanaged indexes include reinvestment of any income or distributions. They differ from the Fund in composition and do not pay management fees or expenses. One cannot invest directly in an index.
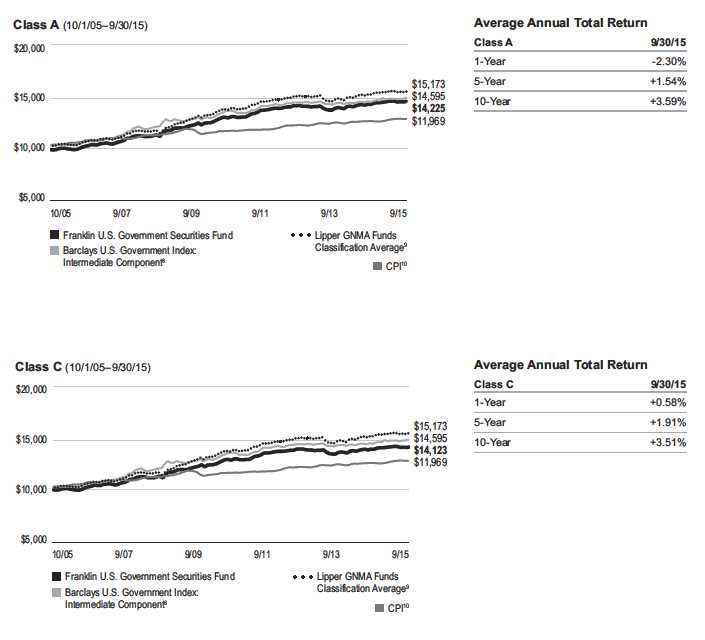
franklintempleton.com
Annual Report
|
39
FRANKLIN U.S. GOVERNMENT SECURITIES FUND
PERFORMANCE SUMMARY
Total Return Index Comparison for a Hypothetical $10,000 Investment2 (continued)
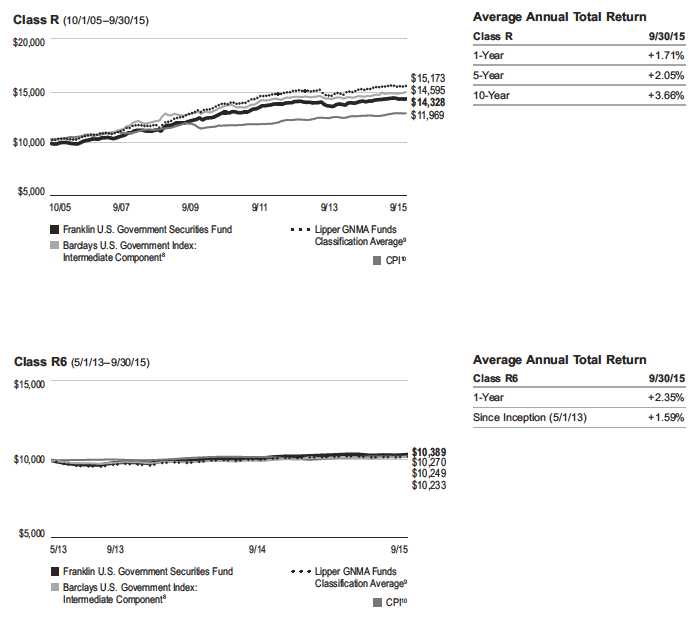
|
40 Annual Report
franklintempleton.com
FRANKLIN U.S. GOVERNMENT SECURITIES FUND
PERFORMANCE SUMMARY
Total Return Index Comparison for a Hypothetical $10,000 Investment2 (continued)
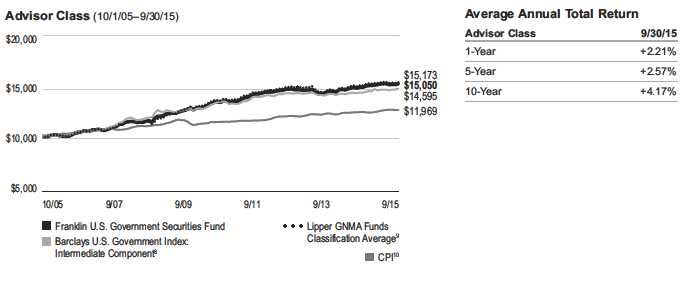
All investments involve risks, including possible loss of principal. The Fund’s share price and yield will be affected by interest rate movements and mortgage prepayments. Bond prices generally move in the opposite direction of interest rates. Thus, as prices of bonds in the Fund adjust to a rise in interest rates, the Fund’s share price may decline. Changes in the financial strength of a bond issuer or in a bond’s credit rating may affect its value. The Fund is actively managed but there is no guarantee that the manager’s investment decisions will produce the desired results. The Fund’s prospectus also includes a description of the main investment risks.
| |
| Class C: | These shares have higher annual fees and expenses than Class A shares. |
| Class R: | Shares are available to certain eligible investors as described in the prospectus. These shares have higher annual fees and expenses than Class A shares. |
| Class R6: | Shares are available to certain eligible investors as described in the prospectus. |
| Advisor Class: | Shares are available to certain eligible investors as described in the prospectus. |
1. The distribution amount is the sum of the dividend payments to shareholders for the period shown and includes only estimated tax-basis net investment income.
2. The Fund has a fee waiver associated with any investment in a Franklin Templeton money fund, contractually guaranteed through at least its current fiscal year-end.
Fund investment results reflect the fee waiver, to the extent applicable; without this reduction, the results would have been lower.
3. Cumulative total return represents the change in value of an investment over the periods indicated.
4. Average annual total return represents the average annual change in value of an investment over the periods indicated.
5. Figures are as stated in the Fund’s current prospectus. In periods of market volatility, assets may decline significantly, causing total annual Fund operating expenses
to become higher than the figures shown.
6. Distribution rate is based on an annualization of the respective class’s September dividend and the maximum offering price (NAV for Classes C, R, R6 and Advisor)
per share on 9/30/15.
7. The 30-day standardized yield for the 30 days ended 9/30/15 reflects an estimated yield to maturity (assuming all portfolio securities are held to maturity). It should be
regarded as an estimate of the Fund’s rate of investment income, and it may not equal the Fund’s actual income distribution rate (which reflects the Fund’s past dividends
paid to shareholders) or the income reported in the Fund’s financial statements.
8. Source: Morningstar. The Barclays U.S. Government Index: Intermediate Component is the intermediate component of the Barclays U.S. Government Index, which
includes public obligations of the U.S. Treasury with at least one year to final maturity and publicly issued debt of U.S. government agencies, quasi-federal corporations,
and corporate or foreign debt guaranteed by the U.S. government.
9. Source: Lipper, a Thomson Reuters Company. The Lipper GNMA Funds Classification Average is calculated by averaging the total return for all funds within the Lipper
GNMA Funds classification in the Lipper Open-End underlying funds universe for the period indicated. Lipper GNMA Funds are defined as funds that invest primarily in
Government National Mortgage Association securities. For the 12-month period ended 9/30/15, there were 59 funds in this category. Lipper calculations do not include sales
charges or expense subsidization by a fund’s manager. The Fund’s performance relative to the average may have differed if these or other factors had been considered.
10. Source: Bureau of Labor Statistics, bls.gov/cpi. The Consumer Price Index (CPI) is a commonly used measure of the inflation rate.
See www.franklintempletondatasources.com for additional data provider information.
franklintempleton.com
Annual Report
|
41
FRANKLIN U.S. GOVERNMENT SECURITIES FUND
Your Fund’s Expenses
As a Fund shareholder, you can incur two types of costs:
- Transaction costs, including sales charges (loads) on Fund purchases; and
- Ongoing Fund costs, including management fees, distribution and service (12b-1) fees, and other Fund expenses. All mutual funds have ongoing costs, sometimes referred to as operating expenses.
The following table shows ongoing costs of investing in the Fund and can help you understand these costs and compare them with those of other mutual funds. The table assumes a $1,000 investment held for the six months indicated.
Actual Fund Expenses
The first line (Actual) for each share class listed in the table provides actual account values and expenses. The “Ending Account Value” is derived from the Fund’s actual return, which includes the effect of Fund expenses.
You can estimate the expenses you paid during the period by following these steps. Of course, your account value and expenses will differ from those in this illustration:
1. Divide your account value by $1,000.
If an account had an $8,600 value, then $8,600 ÷ $1,000 = 8.6.
2. Multiply the result by the number under the heading “Expenses Paid During Period.”
If Expenses Paid During Period were $7.50, then 8.6 x $7.50 = $64.50.
In this illustration, the estimated expenses paid this period are $64.50.
Hypothetical Example for Comparison with Other Funds
Information in the second line (Hypothetical) for each class in the table can help you compare ongoing costs of investing in the Fund with those of other mutual funds. This information may not be used to estimate the actual ending account balance or expenses you paid during the period. The hypothetical “Ending Account Value” is based on the actual expense ratio for each class and an assumed 5% annual rate of return before expenses, which does not represent the Fund’s actual return. The figure under the heading “Expenses Paid During Period” shows the hypothetical expenses your account would have incurred under this scenario. You can compare this figure with the 5% hypothetical examples that appear in shareholder reports of other funds.
Please note that expenses shown in the table are meant to highlight ongoing costs and do not reflect any transaction costs, such as sales charges. Therefore, the second line for each class is useful in comparing ongoing costs only, and will not help you compare total costs of owning different funds. In addition, if transaction costs were included, your total costs would have been higher. Please refer to the Fund prospectus for additional information on operating expenses.
|
42 Annual Report
franklintempleton.com
FRANKLIN U.S. GOVERNMENT SECURITIES FUND
YOUR FUND’S EXPENSES
| | | | | | |
| | | Beginning Account | | Ending Account | | Expenses Paid During |
| Share Class | | Value 4/1/15 | | Value 9/30/15 | | Period* 4/1/15–9/30/15 |
| A | | | | | | |
| Actual | $ | 1,000 | $ | 999.20 | $ | 3.76 |
| Hypothetical (5% return before expenses) | $ | 1,000 | $ | 1,021.31 | $ | 3.80 |
| C | | | | | | |
| Actual | $ | 1,000 | $ | 998.20 | $ | 6.26 |
| Hypothetical (5% return before expenses) | $ | 1,000 | $ | 1,018.80 | $ | 6.33 |
| R | | | | | | |
| Actual | $ | 1,000 | $ | 999.00 | $ | 5.51 |
| Hypothetical (5% return before expenses) | $ | 1,000 | $ | 1,019.55 | $ | 5.57 |
| R6 | | | | | | |
| Actual | $ | 1,000 | $ | 1,002.20 | $ | 2.36 |
| Hypothetical (5% return before expenses) | $ | 1,000 | $ | 1,022.71 | $ | 2.38 |
| Advisor | | | | | | |
| Actual | $ | 1,000 | $ | 999.90 | $ | 3.01 |
| Hypothetical (5% return before expenses) | $ | 1,000 | $ | 1,022.06 | $ | 3.04 |
*Expenses are calculated using the most recent six-month expense ratio, net of expense waivers, annualized for each class (A: 0.75%;
C: 1.25%; R: 1.10%; R6: 0.47%; and Advisor: 0.60%), multiplied by the average account value over the period, multiplied by 183/365 to
reflect the one-half year period.
franklintempleton.com
Annual Report
|
43
Franklin Utilities Fund
This annual report for Franklin Utilities Fund covers the fiscal year ended September 30, 2015.
Your Fund’s Goals and Main Investments
The Fund seeks both capital appreciation and current income by investing at least 80% of its net assets in public utility company securities.
Performance Overview
The Fund’s Class A shares delivered a +2.19% cumulative total return for the 12 months under review. In comparison, the Standard & Poor’s 500 (S&P 500) Index, which is a broad measure of U.S. stock performance, had a -0.61% total return, and the S&P 500 Utilities Index, which measures the performance of all utilities stocks in the S&P 500 Index, produced a +6.57% total return.1 You can find the Fund’s long-term performance data in the Performance Summary beginning on page 46.
Performance data represent past performance, which does not guarantee future results. Investment return and principal value will fluctuate, and you may have a gain or loss when you sell your shares. Current performance may differ from figures shown. Please visit franklintempleton.com or call (800) 342-5236 for most recent month-end performance.
Investment Strategy
We search for the best return opportunities available in the global utilities arena with a specific focus on the U.S. electricity and gas sector. Generally, we look for companies producing a high percentage of earnings from regulated utility franchise operations.
Manager’s Discussion
For the 12 months under review, the utilities sector outperformed the S&P 500 Index and performed in line with the S&P 500 Utilities Index, while the energy sector underper-formed both indexes.2
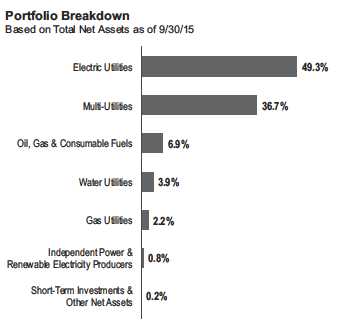
Edison International, Xcel Energy and Pinnacle West Capital in electric utilities, and PG&E and CMS Energy in multi-utilities, contributed to absolute performance. All five are mostly regulated companies operating in what we believe to be sound regulatory environments. With weak and volatile commodity markets over the past year, investors migrated away from companies exposed to gas and electricity commodity markets into more stable, regulated companies. PG&E and Edison operate in California, where there were solid growth opportunities in regulated networks as these companies followed Governor Brown’s push toward less carbon production and greater renewable energy use. CMS similarly operates in a state, Michigan, where the governor has been promoting a cleaner and more efficient energy network, and state policy-makers have partnered with the state’s utilities to help foster this transition. Thus, CMS forecast earnings and dividends growth that exceeded the industry average. Xcel Energy and Pinnacle West worked through regulatory challenges over the prior year, allowing for greater certainty of dividend and earnings growth.
1. Source: Morningstar.
The indexes are unmanaged and include reinvested dividends. One cannot invest directly in an index, and an index is not representative of the Fund’s portfolio.
2. The utilities sector comprises electric utilities, gas utilities, multi-utilities and water utilities in the SOI. The energy sector comprises oil, gas and consumable fuels
in the SOI.
See www.franklintempletondatasources.com for additional data provider information.
The dollar value, number of shares or principal amount, and names of all portfolio holdings are listed in the Fund’s Statement of Investments (SOI).
The SOI begins on page 107.
|
44 Annual Report franklintempleton.com
FRANKLIN UTILITIES FUND
| | |
| Top 10 Equity Holdings | | |
| 9/30/15 | | |
| Company | % of Total | |
| Sector/Industry | Net Assets | |
| |
| Dominion Resources Inc. | 5.6 | % |
| Multi-Utilities | | |
| NextEra Energy Inc. | 5.3 | % |
| Electric Utilities | | |
| Edison International | 5.2 | % |
| Electric Utilities | | |
| Duke Energy Corp. | 4.8 | % |
| Electric Utilities | | |
| Sempra Energy | 4.4 | % |
| Multi-Utilities | | |
| American Electric Power Co. Inc. | 4.3 | % |
| Electric Utilities | | |
| PG&E Corp. | 4.0 | % |
| Multi-Utilities | | |
| Exelon Corp. | 3.7 | % |
| Electric Utilities | | |
| CMS Energy Corp. | 3.1 | % |
| Multi-Utilities | | |
| PPL Corp. | 3.1 | % |
| Electric Utilities | | |
The energy sector in general was hurt by lower commodity prices during the period and weighed on the Fund’s absolute performance. Key energy detractors included The Williams Cos., TransCanada and Plains GP Holdings. Although these three companies maintained very limited direct exposure to commodities, the commodity price decline pressured capital availability to fund investment growth and also dampened longer term growth outlooks given moderating forecasts for production growth.
In addition, two other Fund holdings hindered absolute Fund performance due to direct or indirect exposure to lower commodity prices. Shares of British electricity producer Drax Group fell as a sharp decline in European natural gas prices materially affected the company’s earnings. Hurt by an oil price decline over the past year, U.S. diversified energy firm MDU Resources Group announced its intention to sell its exploration and production operations to reduce its exposure to commodity price movements.
Thank you for your continued participation in Franklin Utilities Fund. We look forward to serving your future investment needs.

The foregoing information reflects our analysis, opinions and portfolio holdings as of September 30, 2015, the end of the reporting period. The way we implement our main investment strategies and the resulting portfolio holdings may change depending on factors such as market and economic conditions. These opinions may not be relied upon as investment advice or an offer for a particular security. The information is not a complete analysis of every aspect of any market, country, industry, security or the Fund. Statements of fact are from sources considered reliable, but the investment manager makes no representation or warranty as to their completeness or accuracy. Although historical performance is no guarantee of future results, these insights may help you understand our investment management philosophy.
franklintempleton.com
Annual Report
|
45
FRANKLIN UTILITIES FUND
Performance Summary as of September 30, 2015
Your dividend income will vary depending on dividends or interest paid by securities in the Fund’s portfolio, adjusted for operating expenses of each class. Capital gain distributions are net profits realized from the sale of portfolio securities. The performance tables and graphs do not reflect any taxes that a shareholder would pay on Fund dividends, capital gain distributions, if any, or any realized gains on the sale of Fund shares. Total return reflects reinvestment of the Fund’s dividends and capital gain distributions, if any, and any unrealized gains or losses.
| | | | | | | | |
| Net Asset Value | | | | | | | | |
| Share Class (Symbol) | | 9/30/15 | | 9/30/14 | | Change | | |
| A (FKUTX) | $ | 16.08 | $ | 16.58 | -$ | 0.50 | | |
| C (FRUSX) | $ | 16.01 | $ | 16.50 | -$ | 0.49 | | |
| R (FRURX) | $ | 16.02 | $ | 16.52 | -$ | 0.50 | | |
| R6 (FUFRX) | $ | 16.18 | $ | 16.68 | -$ | 0.50 | | |
| Advisor (FRUAX) | $ | 16.19 | $ | 16.68 | -$ | 0.49 | | |
| |
| |
| Distributions1 (10/1/14–9/30/15) | | | | | | | | |
| | | Dividend | | Short-Term | | Long-Term | | |
| Share Class | | Income | | Capital Gain | | Capital Gain | | Total |
| A | $ | 0.4750 | $ | 0.0648 | $ | 0.3530 | $ | 0.8928 |
| C | $ | 0.3899 | $ | 0.0648 | $ | 0.3530 | $ | 0.8077 |
| R | $ | 0.4147 | $ | 0.0648 | $ | 0.3530 | $ | 0.8325 |
| R6 | $ | 0.5193 | $ | 0.0648 | $ | 0.3530 | $ | 0.9371 |
| Advisor | $ | 0.5008 | $ | 0.0648 | $ | 0.3530 | $ | 0.9186 |
|
46 Annual Report
franklintempleton.com
FRANKLIN UTILITIES FUND
PERFORMANCE SUMMARY
Performance as of 9/30/152
Cumulative total return excludes sales charges. Average annual total return and value of $10,000 investment include maximum sales charges. Class A: 4.25% maximum initial sales charge; Class C: 1% contingent deferred sales charge in first year only;
Class R/R6/Advisor Class: no sales charges.
| | | | | | | | | |
| | Cumulative | | Average Annual | | | Value of | | Total Annual | |
| Share Class | Total Return3 | | Total Return4 | | $ | 10,000 Investment5 | | Operating Expenses6 | |
| A | | | | | | | | 0.75 | % |
| 1-Year | +2.19 | % | -2.17 | % | $ | 9,783 | | | |
| 5-Year | +70.17 | % | +10.25 | % | $ | 16,291 | | | |
| 10-Year | +106.22 | % | +7.04 | % | $ | 19,743 | | | |
| C | | | | | | | | 1.25 | % |
| 1-Year | +1.74 | % | +0.77 | % | $ | 10,077 | | | |
| 5-Year | +66.00 | % | +10.67 | % | $ | 16,600 | | | |
| 10-Year | +96.27 | % | +6.98 | % | $ | 19,627 | | | |
| R | | | | | | | | 1.10 | % |
| 1-Year | +1.83 | % | +1.83 | % | $ | 10,183 | | | |
| 5-Year | +67.15 | % | +10.82 | % | $ | 16,715 | | | |
| 10-Year | +99.05 | % | +7.13 | % | $ | 19,905 | | | |
| R6 | | | | | | | | 0.48 | % |
| 1-Year | +2.45 | % | +2.45 | % | $ | 10,245 | | | |
| Since Inception (5/1/13) | +13.41 | % | +5.35 | % | $ | 11,341 | | | |
| Advisor | | | | | | | | 0.60 | % |
| 1-Year | +2.40 | % | +2.40 | % | $ | 10,240 | | | |
| 5-Year | +71.51 | % | +11.39 | % | $ | 17,151 | | | |
| 10-Year | +109.38 | % | +7.67 | % | $ | 20,938 | | | |
| |
| |
| | | | 30-Day Standardized Yield8 | | | |
| | Distribution | | | | | | | | |
| Share Class | Rate7 | | (with waiver) | | | (without waiver) | | | |
| A | 2.74 | % | 2.95 | % | | 2.95 | % | | |
| C | 2.35 | % | 2.60 | % | | 2.60 | % | | |
| R | 2.50 | % | 2.75 | % | | 2.75 | % | | |
| R6 | 3.11 | % | 3.35 | % | | 3.35 | % | | |
| Advisor | 3.00 | % | 3.23 | % | | 3.23 | % | | |
Performance data represent past performance, which does not guarantee future results. Investment return and principal value will fluctuate, and you may have a gain or loss when you sell your shares. Current performance may differ from figures shown. For most recent month-end performance, go to franklintempleton.com or call (800) 342-5236.
franklintempleton.com
Annual Report
|
47
FRANKLIN UTILITIES FUND
PERFORMANCE SUMMARY
Total Return Index Comparison for a Hypothetical $10,000 Investment2
Total return represents the change in value of an investment over the periods shown. It includes any applicable maximum sales charge, Fund expenses, account fees and reinvested distributions. The unmanaged indexes include reinvestment of any income or distributions. They differ from the Fund in composition and do not pay management fees or expenses. One cannot invest directly in an index.
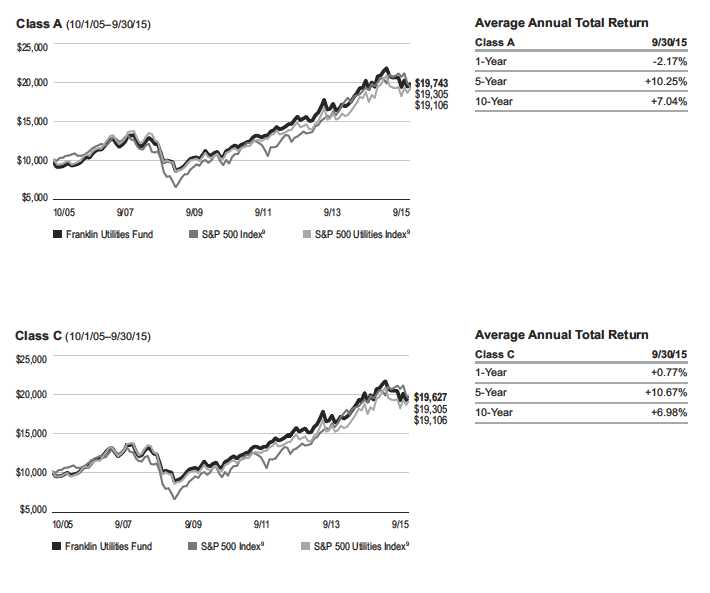
|
48 Annual Report
franklintempleton.com
FRANKLIN UTILITIES FUND
PERFORMANCE SUMMARY
Total Return Index Comparison for a Hypothetical $10,000 Investment2 (continued)
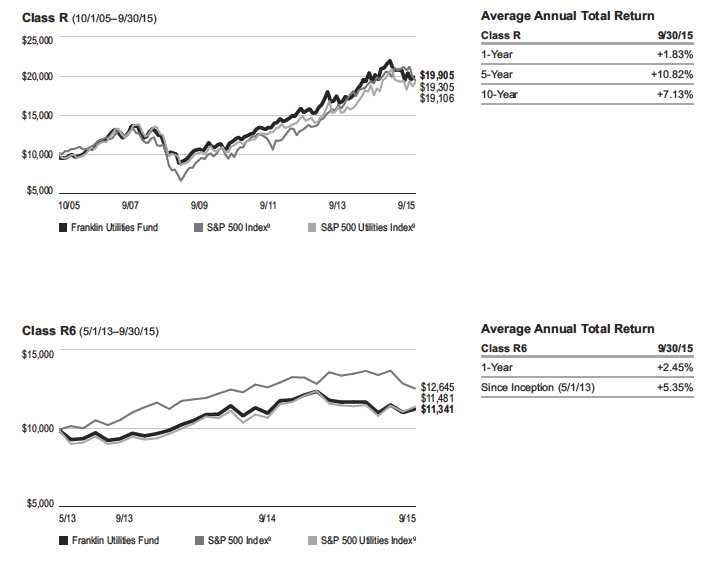
franklintempleton.com
Annual Report
|
49
FRANKLIN UTILITIES FUND
PERFORMANCE SUMMARY
Total Return Index Comparison for a Hypothetical $10,000 Investment2 (continued)
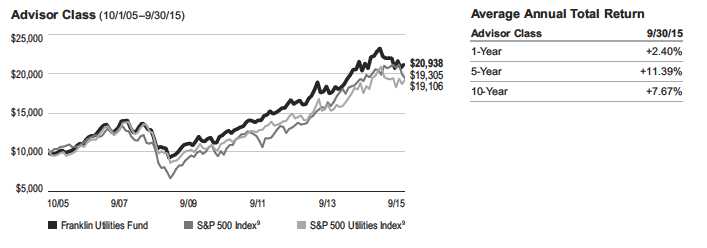
All investments involve risks, including possible loss of principal. In addition to being sensitive to other factors, securities issued by utility companies have been historically sensitive to interest rate changes. When interest rates fall, utility securities prices, and thus a utilities fund’s share price, tend to rise; when interest rates rise, their prices generally fall. The Fund is actively managed but there is no guarantee that the manager’s investment decisions will produce the desired results. The Fund’s prospectus also includes a description of the main investment risks.
| |
| Class C: | These shares have higher annual fees and expenses than Class A shares. |
| Class R: | Shares are available to certain eligible investors as described in the prospectus. These shares have higher annual fees and expenses than Class A shares. |
| Class R6: | Shares are available to certain eligible investors as described in the prospectus. |
| Advisor Class: | Shares are available to certain eligible investors as described in the prospectus. |
1. The distribution amount is the sum of the dividend payments to shareholders for the period shown and includes only estimated tax-basis net investment income and
capital gain.
2. The Fund has a fee waiver associated with any investment in a Franklin Templeton money fund, contractually guaranteed through at least its current fiscal year-end.
Fund investment results reflect the fee waiver, to the extent applicable; without this reduction, the results would have been lower.
3. Cumulative total return represents the change in value of an investment over the periods indicated.
4. Average annual total return represents the average annual change in value of an investment over the periods indicated.
5. These figures represent the value of a hypothetical $10,000 investment in the Fund over the periods indicated.
6. Figures are as stated in the Fund’s current prospectus. In periods of market volatility, assets may decline significantly, causing total annual Fund operating expenses
to become higher than the figures shown.
7. Distribution rate is based on an annualization of the respective class’s current quarterly dividend and the maximum offering price (NAV for Classes C, R, R6 and Advisor)
per share on 9/30/15.
8. The 30-day standardized yield for the 30 days ended 9/30/15 reflects an estimated yield to maturity (assuming all portfolio securities are held to maturity). It should
be regarded as an estimate of the Fund’s rate of investment income, and it may not equal the Fund’s actual income distribution rate (which reflects the Fund’s past
dividends paid to shareholders) or the income reported in the Fund’s financial statements.
9. Source: Morningstar. The S&P 500 Index is a market capitalization-weighted index of 500 stocks designed to measure total U.S. equity market performance.
The S&P 500 Utilities Index is market capitalization weighted and consists of all utility stocks in the S&P 500 Index.
See www.franklintempletondatasources.com for additional data provider information.
|
50 Annual Report
franklintempleton.com
FRANKLIN UTILITIES FUND
Your Fund’s Expenses
As a Fund shareholder, you can incur two types of costs:
- Transaction costs, including sales charges (loads) on Fund purchases; and
- Ongoing Fund costs, including management fees, distribution and service (12b-1) fees, and other Fund expenses. All mutual funds have ongoing costs, sometimes referred to as operating expenses.
The following table shows ongoing costs of investing in the Fund and can help you understand these costs and compare them with those of other mutual funds. The table assumes a $1,000 investment held for the six months indicated.
Actual Fund Expenses
The first line (Actual) for each share class listed in the table provides actual account values and expenses. The “Ending Account Value” is derived from the Fund’s actual return, which includes the effect of Fund expenses.
You can estimate the expenses you paid during the period by following these steps. Of course, your account value and expenses will differ from those in this illustration:
1. Divide your account value by $1,000.
If an account had an $8,600 value, then $8,600 ÷ $1,000 = 8.6.
2. Multiply the result by the number under the heading “Expenses Paid During Period.”
If Expenses Paid During Period were $7.50, then 8.6 x $7.50 = $64.50.
In this illustration, the estimated expenses paid this period are $64.50.
Hypothetical Example for Comparison with Other Funds
Information in the second line (Hypothetical) for each class in the table can help you compare ongoing costs of investing in the Fund with those of other mutual funds. This information may not be used to estimate the actual ending account balance or expenses you paid during the period. The hypothetical “Ending Account Value” is based on the actual expense ratio for each class and an assumed 5% annual rate of return before expenses, which does not represent the Fund’s actual return. The figure under the heading “Expenses Paid During Period” shows the hypothetical expenses your account would have incurred under this scenario. You can compare this figure with the 5% hypothetical examples that appear in shareholder reports of other funds.
Please note that expenses shown in the table are meant to highlight ongoing costs and do not reflect any transaction costs, such as sales charges. Therefore, the second line for each class is useful in comparing ongoing costs only, and will not help you compare total costs of owning different funds. In addition, if transaction costs were included, your total costs would have been higher. Please refer to the Fund prospectus for additional information on operating expenses.
franklintempleton.com
Annual Report
|
51
| | | | | | |
| FRANKLIN UTILITIES FUND | | | | | | |
| YOUR FUND’S EXPENSES | | | | | | |
| |
| |
| |
| | | Beginning Account | | Ending Account | | Expenses Paid During |
| Share Class | | Value 4/1/15 | | Value 9/30/15 | | Period* 4/1/15–9/30/15 |
| A | | | | | | |
| Actual | $ | 1,000 | $ | 962.30 | $ | 3.64 |
| Hypothetical (5% return before expenses) | $ | 1,000 | $ | 1,021.36 | $ | 3.75 |
| C | | | | | | |
| Actual | $ | 1,000 | $ | 960.10 | $ | 6.09 |
| Hypothetical (5% return before expenses) | $ | 1,000 | $ | 1,018.85 | $ | 6.28 |
| R | | | | | | |
| Actual | $ | 1,000 | $ | 960.20 | $ | 5.36 |
| Hypothetical (5% return before expenses) | $ | 1,000 | $ | 1,019.60 | $ | 5.52 |
| R6 | | | | | | |
| Actual | $ | 1,000 | $ | 963.00 | $ | 2.31 |
| Hypothetical (5% return before expenses) | $ | 1,000 | $ | 1,022.71 | $ | 2.38 |
| Advisor | | | | | | |
| Actual | $ | 1,000 | $ | 963.20 | $ | 2.90 |
| Hypothetical (5% return before expenses) | $ | 1,000 | $ | 1,022.11 | $ | 2.99 |
*Expenses are calculated using the most recent six-month expense ratio, net of expense waivers, annualized for each class (A: 0.74%;
C: 1.24%; R: 1.09%; R6: 0.47%; and Advisor: 0.59%), multiplied by the average account value over the period, multiplied by 183/365
to reflect the one-half year period.
|
52 Annual Report
franklintempleton.com
| | | | | | | | | | | | | | | |
| | | | | | | | | FRANKLIN CUSTODIAN FUNDS | |
| |
| |
| Financial Highlights | | | | | | | | | | | | | | | |
| Franklin DynaTech Fund | | | | | | | | | | | | | | | |
| | | | | | Year Ended September 30, | | | | |
| | | 2015 | | | 2014 | | | 2013 | | | 2012 | | | 2011 | |
| Class A | | | | | | | | | | | | | | | |
| Per share operating performance | | | | | | | | | | | | | | | |
| (for a share outstanding throughout the year) | | | | | | | | | | | | | | | |
| Net asset value, beginning of year | $ | 46.08 | | $ | 42.13 | | $ | 34.00 | | $ | 27.66 | | $ | 27.16 | |
| Income from investment operationsa: | | | | | | | | | | | | | | | |
| Net investment income (loss)b | | (0.21 | ) | | (0.18 | ) | | (0.12 | ) | | (0.11 | ) | | (0.14 | ) |
| Net realized and unrealized gains (losses) | | 1.78 | | | 5.94 | | | 8.25 | | | 7.10 | | | 0.64 | |
| Total from investment operations | | 1.57 | | | 5.76 | | | 8.13 | | | 6.99 | | | 0.50 | |
| Less distributions from net realized gains | | (1.61 | ) | | (1.81 | ) | | — | | | (0.65 | ) | | — | |
| Net asset value, end of year | $ | 46.04 | | $ | 46.08 | | $ | 42.13 | | $ | 34.00 | | $ | 27.66 | |
| |
| Total returnc | | 3.40 | % | | 13.98 | % | | 23.91 | % | | 25.59 | % | | 1.84 | % |
| |
| Ratios to average net assets | | | | | | | | | | | | | | | |
| Expenses | | 0.89 | %d | | 0.89 | %d,e | | 0.94 | % | | 0.96 | % | | 0.97 | % |
| Net investment income (loss) | | (0.44 | )% | | (0.41 | )% | | (0.34 | )% | | (0.35 | )% | | (0.46 | )% |
| |
| Supplemental data | | | | | | | | | | | | | | | |
| Net assets, end of year (000’s) | $ | 1,857,570 | | $ | 1,504,338 | | $ | 1,072,814 | | $ | 898,665 | | $ | 642,552 | |
| Portfolio turnover rate | | 31.02 | % | | 26.43 | % | | 35.40 | % | | 16.65 | % | | 30.11 | % |
aThe amount shown for a share outstanding throughout the period may not correlate with the Statement of Operations for the period due to the timing of sales and
repurchases of the Fund’s shares in relation to income earned and/or fluctuating fair value of the investments of the Fund.
bBased on average daily shares outstanding.
cTotal return does not reflect sales commissions or contingent deferred sales charges, if applicable.
dBenefit of waiver and payments by affiliates rounds to less than 0.01%.
eBenefit of expense reduction rounds to less than 0.01%.
|
franklintempleton.com The accompanying notes are an integral part of these financial statements. | Annual Report 53
FRANKLIN CUSTODIAN FUNDS
FINANCIAL HIGHLIGHTS
| | | | | | | | | | | | | | | |
| Franklin DynaTech Fund (continued) | | | | | | | | | | | | | | | |
| | | | | | Year Ended September 30, | | | | |
| | | 2015 | | | 2014 | | | 2013 | | | 2012 | | | 2011 | |
| Class C | | | | | | | | | | | | | | | |
| Per share operating performance | | | | | | | | | | | | | | | |
| (for a share outstanding throughout the year) | | | | | | | | | | | | | | | |
| Net asset value, beginning of year | $ | 40.53 | | $ | 37.53 | | $ | 30.52 | | $ | 25.07 | | $ | 24.81 | |
| Income from investment operationsa: | | | | | | | | | | | | | | | |
| Net investment income (loss)b | | (0.50 | ) | | (0.46 | ) | | (0.35 | ) | | (0.32 | ) | | (0.34 | ) |
| Net realized and unrealized gains (losses) | | 1.58 | | | 5.27 | | | 7.36 | | | 6.42 | | | 0.60 | |
| Total from investment operations | | 1.08 | | | 4.81 | | | 7.01 | | | 6.10 | | | 0.26 | |
| Less distributions from net realized gains | | (1.61 | ) | | (1.81 | ) | | — | | | (0.65 | ) | | — | |
| Net asset value, end of year | $ | 40.00 | | $ | 40.53 | | $ | 37.53 | | $ | 30.52 | | $ | 25.07 | |
| |
| Total returnc | | 2.63 | % | | 13.13 | % | | 22.97 | % | | 24.67 | % | | 1.05 | % |
| |
| Ratios to average net assets | | | | | | | | | | | | | | | |
| Expenses | | 1.64 | %d | | 1.64 | %d,e | | 1.69 | % | | 1.71 | % | | 1.72 | % |
| Net investment income (loss) | | (1.19 | )% | | (1.16 | )% | | (1.09 | )% | | (1.10 | )% | | (1.21 | )% |
| |
| Supplemental data | | | | | | | | | | | | | | | |
| Net assets, end of year (000’s) | $ | 270,961 | | $ | 212,961 | | $ | 176,556 | | $ | 142,903 | | $ | 105,707 | |
| Portfolio turnover rate | | 31.02 | % | | 26.43 | % | | 35.40 | % | | 16.65 | % | | 30.11 | % |
aThe amount shown for a share outstanding throughout the period may not correlate with the Statement of Operations for the period due to the timing of sales and
repurchases of the Fund’s shares in relation to income earned and/or fluctuating fair value of the investments of the Fund.
bBased on average daily shares outstanding.
cTotal return does not reflect sales commissions or contingent deferred sales charges, if applicable.
dBenefit of waiver and payments by affiliates rounds to less than 0.01%.
eBenefit of expense reduction rounds to less than 0.01%.
|
54 Annual Report | The accompanying notes are an integral part of these financial statements. franklintempleton.com
| | | | | | | | | | | | | | | |
| | | | | | | | | FRANKLIN CUSTODIAN FUNDS | |
| | | | | | | | | FINANCIAL HIGHLIGHTS | |
| |
| |
| |
| Franklin DynaTech Fund (continued) | | | | | | | | | | | | | | | |
| | | | | | Year Ended September 30, | | | | |
| | | 2015 | | | 2014 | | | 2013 | | | 2012 | | | 2011 | |
| Class R | | | | | | | | | | | | | | | |
| Per share operating performance | | | | | | | | | | | | | | | |
| (for a share outstanding throughout the year) | | | | | | | | | | | | | | | |
| Net asset value, beginning of year | $ | 45.35 | | $ | 41.58 | | $ | 33.65 | | $ | 27.44 | | $ | 27.02 | |
| Income from investment operationsa: | | | | | | | | | | | | | | | |
| Net investment income (loss)b | | (0.32 | ) | | (0.29 | ) | | (0.21 | ) | | (0.19 | ) | | (0.22 | ) |
| Net realized and unrealized gains (losses) | | 1.74 | | | 5.87 | | | 8.14 | | | 7.05 | | | 0.64 | |
| Total from investment operations | | 1.42 | | | 5.58 | | | 7.93 | | | 6.86 | | | 0.42 | |
| Less distributions from net realized gains | | (1.61 | ) | | (1.81 | ) | | — | | | (0.65 | ) | | — | |
| Net asset value, end of year | $ | 45.16 | | $ | 45.35 | | $ | 41.58 | | $ | 33.65 | | $ | 27.44 | |
| |
| Total return | | 3.11 | % | | 13.72 | % | | 23.57 | % | | 25.32 | % | | 1.55 | % |
| |
| Ratios to average net assets | | | | | | | | | | | | | | | |
| Expenses | | 1.14 | %c | | 1.14 | %c,d | | 1.19 | % | | 1.21 | % | | 1.22 | % |
| Net investment income (loss) | | (0.69 | )% | | (0.66 | )% | | (0.59 | )% | | (0.60 | )% | | (0.71 | )% |
| |
| Supplemental data | | | | | | | | | | | | | | | |
| Net assets, end of year (000’s) | $ | 43,001 | | $ | 45,230 | | $ | 41,825 | | $ | 33,338 | | $ | 11,100 | |
| Portfolio turnover rate | | 31.02 | % | | 26.43 | % | | 35.40 | % | | 16.65 | % | | 30.11 | % |
aThe amount shown for a share outstanding throughout the period may not correlate with the Statement of Operations for the period due to the timing of sales and
repurchases of the Fund’s shares in relation to income earned and/or fluctuating fair value of the investments of the Fund.
bBased on average daily shares outstanding.
cBenefit of waiver and payments by affiliates rounds to less than 0.01%.
dBenefit of expense reduction rounds to less than 0.01%.
|
franklintempleton.com The accompanying notes are an integral part of these financial statements. | Annual Report 55
FRANKLIN CUSTODIAN FUNDS
FINANCIAL HIGHLIGHTS
| | | | | | | | | |
| Franklin DynaTech Fund (continued) | | | | | | | | | |
| | | Year Ended September 30, | |
| | | 2015 | | | 2014 | | | 2013 | a |
| Class R6 | | | | | | | | | |
| Per share operating performance | | | | | | | | | |
| (for a share outstanding throughout the year) | | | | | | | | | |
| Net asset value, beginning of year | $ | 46.97 | | $ | 42.74 | | $ | 36.56 | |
| Income from investment operationsb: | | | | | | | | | |
| Net investment income (loss)c | | (0.01 | ) | | (0.01 | ) | | 0.01 | |
| Net realized and unrealized gains (losses) | | 1.80 | | | 6.05 | | | 6.17 | |
| Total from investment operations | | 1.79 | | | 6.04 | | | 6.18 | |
| Less distributions from net realized gains | | (1.61 | ) | | (1.81 | ) | | — | |
| Net asset value, end of year | $ | 47.15 | | $ | 46.97 | | $ | 42.74 | |
| |
| Total returnd | | 3.81 | % | | 14.45 | % | | 16.90 | % |
| |
| Ratios to average net assetse | | | | | | | | | |
| Expenses | | 0.48 | %f | | 0.49 | %f,g | | 0.52 | % |
| Net investment income (loss) | | (0.03 | )% | | (0.01 | )% | | 0.08 | % |
| |
| Supplemental data | | | | | | | | | |
| Net assets, end of year (000’s) | $ | 362,627 | | $ | 342,466 | | $ | 317,315 | |
| Portfolio turnover rate | | 31.02 | % | | 26.43 | % | | 35.40 | % |
aFor the period May 1, 2013 (effective date) to September 30, 2013.
bThe amount shown for a share outstanding throughout the period may not correlate with the Statement of Operations for the period due to the timing of sales and
repurchases of the Fund’s shares in relation to income earned and/or fluctuating fair value of the investments of the Fund.
cBased on average daily shares outstanding.
dTotal return is not annualized for periods less than one year.
eRatios are annualized for periods less than one year.
fBenefit of waiver and payments by affiliates rounds to less than 0.01%.
gBenefit of expense reduction rounds to less than 0.01%.
|
56 Annual Report | The accompanying notes are an integral part of these financial statements. franklintempleton.com
| | | | | | | | | | | | | | | |
| | | | | | | | | FRANKLIN CUSTODIAN FUNDS | |
| | | | | | | | | FINANCIAL HIGHLIGHTS | |
| |
| |
| |
| Franklin DynaTech Fund (continued) | | | | | | | | | | | | | | | |
| | | | | | Year Ended September 30, | | | | |
| | | 2015 | | | 2014 | | | 2013 | | | 2012 | | | 2011 | |
| Advisor Class | | | | | | | | | | | | | | | |
| Per share operating performance | | | | | | | | | | | | | | | |
| (for a share outstanding throughout the year) | | | | | | | | | | | | | | | |
| Net asset value, beginning of year | $ | 46.87 | | $ | 42.71 | | $ | 34.39 | | $ | 27.89 | | $ | 27.33 | |
| Income from investment operationsa: | | | | | | | | | | | | | | | |
| Net investment income (loss)b | | (0.09 | ) | | (0.07 | ) | | (0.03 | ) | | (0.03 | ) | | (0.06 | ) |
| Net realized and unrealized gains (losses) | | 1.79 | | | 6.04 | | | 8.35 | | | 7.18 | | | 0.62 | |
| Total from investment operations | | 1.70 | | | 5.97 | | | 8.32 | | | 7.15 | | | 0.56 | |
| Less distributions from net realized gains | | (1.61 | ) | | (1.81 | ) | | — | | | (0.65 | ) | | — | |
| Net asset value, end of year | $ | 46.96 | | $ | 46.87 | | $ | 42.71 | | $ | 34.39 | | $ | 27.89 | |
| |
| Total return | | 3.62 | % | | 14.29 | % | | 24.19 | % | | 25.96 | % | | 2.05 | % |
| |
| Ratios to average net assets | | | | | | | | | | | | | | | |
| Expenses | | 0.64 | %c | | 0.64 | %c,d | | 0.69 | % | | 0.71 | % | | 0.72 | % |
| Net investment income (loss) | | (0.19 | )% | | (0.16 | )% | | (0.09 | )% | | (0.10 | )% | | (0.21 | )% |
| |
| Supplemental data | | | | | | | | | | | | | | | |
| Net assets, end of year (000’s) | $ | 176,090 | | $ | 159,180 | | $ | 122,287 | | $ | 260,012 | | $ | 102,221 | |
| Portfolio turnover rate | | 31.02 | % | | 26.43 | % | | 35.40 | % | | 16.65 | % | | 30.11 | % |
aThe amount shown for a share outstanding throughout the period may not correlate with the Statement of Operations for the period due to the timing of sales and
repurchases of the Fund’s shares in relation to income earned and/or fluctuating fair value of the investments of the Fund.
bBased on average daily shares outstanding.
cBenefit of waiver and payments by affiliates rounds to less than 0.01%.
dBenefit of expense reduction rounds to less than 0.01%.
|
franklintempleton.com The accompanying notes are an integral part of these financial statements. | Annual Report 57
| | | | |
| FRANKLIN CUSTODIAN FUNDS | | | | |
| |
| |
| |
| |
| Statement of Investments, September 30, 2015 | | | | |
| |
| Franklin DynaTech Fund | | | | |
| | Country | Shares | | Value |
| Common Stocks 93.4% | | | | |
| Aerospace & Defense 0.5% | | | | |
| The Boeing Co. | United States | 100,000 | $ | 13,095,000 |
| Air Freight & Logistics 0.6% | | | | |
| FedEx Corp. | United States | 120,000 | | 17,277,600 |
| Biotechnology 11.9% | | | | |
| aAlnylam Pharmaceuticals Inc. | United States | 140,000 | | 11,250,400 |
| Amgen Inc. | United States | 150,000 | | 20,748,000 |
| aBiogen Inc. | United States | 165,000 | | 48,148,650 |
| aBioMarin Pharmaceutical Inc. | United States | 165,000 | | 17,377,800 |
| aBluebird Bio Inc. | United States | 55,000 | | 4,705,250 |
| aCelgene Corp. | United States | 650,000 | | 70,310,500 |
| aCelldex Therapeutics Inc. | United States | 250,000 | | 2,635,000 |
| Gilead Sciences Inc. | United States | 620,000 | | 60,877,800 |
| aHeron Therapeutics Inc. | United States | 325,000 | | 7,930,000 |
| aIncyte Corp. | United States | 300,000 | | 33,099,000 |
| aKite Pharma Inc. | United States | 100,000 | | 5,568,000 |
| aRegeneron Pharmaceuticals Inc. | United States | 85,000 | | 39,536,900 |
| aREGENXBIO Inc. | United States | 36,600 | | 806,298 |
| | | | | 322,993,598 |
| Commercial Services & Supplies 1.0% | | | | |
| aStericycle Inc. | United States | 200,000 | | 27,862,000 |
| Communications Equipment 2.5% | | | | |
| aInfinera Corp. | United States | 350,000 | | 6,846,000 |
| aPalo Alto Networks Inc. | United States | 350,000 | | 60,200,000 |
| | | | | 67,046,000 |
| Diversified Financial Services 2.0% | | | | |
| Intercontinental Exchange Inc. | United States | 100,000 | | 23,499,000 |
| Moody’s Corp. | United States | 300,000 | | 29,460,000 |
| | | | | 52,959,000 |
| Electrical Equipment 1.0% | | | | |
| Acuity Brands Inc. | United States | 150,000 | | 26,337,000 |
| Electronic Equipment, Instruments & Components 1.1% | | | | |
| Amphenol Corp., A | United States | 400,000 | | 20,384,000 |
| Cognex Corp. | United States | 200,000 | | 6,874,000 |
| aFitBit Inc., A | United States | 90,200 | | 3,399,638 |
| | | | | 30,657,638 |
| Energy Equipment & Services 0.8% | | | | |
| Schlumberger Ltd. | United States | 300,000 | | 20,691,000 |
| Health Care Equipment & Supplies 5.7% | | | | |
| Abbott Laboratories | United States | 550,000 | | 22,121,000 |
| C. R. Bard Inc. | United States | 10,000 | | 1,863,100 |
| aDexCom Inc. | United States | 450,000 | | 38,637,000 |
| aEdwards Lifesciences Corp. | United States | 300,000 | | 42,651,000 |
| aGlaukos Corp. | United States | 71,700 | | 1,734,423 |
| aIDEXX Laboratories Inc. | United States | 300,000 | | 22,275,000 |
| aNevro Corp. | United States | 100,000 | | 4,639,000 |
| aPenumbra Inc. | United States | 24,900 | | 998,490 |
| Stryker Corp. | United States | 200,000 | | 18,820,000 |
| | | | | 153,739,013 |
| |
| |
| 58 | Annual Report | | franklintempleton.com |
FRANKLIN CUSTODIAN FUNDS
STATEMENT OF INVESTMENTS
| | | | |
| Franklin DynaTech Fund (continued) | | | | |
| | Country | Shares | | Value |
| Common Stocks (continued) | | | | |
| Health Care Providers & Services 2.9% | | | | |
| McKesson Corp. | United States | 205,000 | $ | 37,931,150 |
| UnitedHealth Group Inc. | United States | 350,000 | | 40,603,500 |
| | | | | 78,534,650 |
| Health Care Technology 1.9% | | | | |
| aathenahealth Inc. | United States | 100,000 | | 13,335,000 |
| aCerner Corp. | United States | 450,000 | | 26,982,000 |
| aVeeva Systems Inc. | United States | 500,000 | | 11,705,000 |
| | | | | 52,022,000 |
| Internet & Catalog Retail 6.6% | | | | |
| aAmazon.com Inc. | United States | 200,000 | | 102,378,000 |
| aLiberty Ventures, A | United States | 250,000 | | 10,087,500 |
| aNetflix Inc. | United States | 245,000 | | 25,298,700 |
| aThe Priceline Group Inc. | United States | 34,000 | | 42,053,240 |
| | | | | 179,817,440 |
| Internet Software & Services 12.3% | | | | |
| aBaidu Inc., ADR | China | 100,000 | | 13,741,000 |
| aCoStar Group Inc. | United States | 20,000 | | 3,461,200 |
| aDemandware Inc. | United States | 300,000 | | 15,504,000 |
| aFacebook Inc., A | United States | 1,000,000 | | 89,900,000 |
| aGoogle Inc., A | United States | 125,000 | | 79,796,250 |
| aGoogle Inc., C | United States | 62,170 | | 37,825,472 |
| aLinkedIn Corp., A | United States | 200,000 | | 38,026,000 |
| MercadoLibre Inc. | Argentina | 100,000 | | 9,106,000 |
| NetEase Inc., ADR | China | 30,000 | | 3,603,600 |
| aShopify Inc., A | Canada | 14,300 | | 503,360 |
| Tencent Holdings Ltd. | China | 2,500,000 | | 41,773,385 |
| | | | | 333,240,267 |
| IT Services 5.6% | | | | |
| MasterCard Inc., A | United States | 850,000 | | 76,602,000 |
| aPayPal Holdings Inc. | United States | 150,000 | | 4,656,000 |
| Visa Inc., A | United States | 1,000,000 | | 69,660,000 |
| | | | | 150,918,000 |
| Life Sciences Tools & Services 3.2% | | | | |
| aIllumina Inc. | United States | 220,000 | | 38,680,400 |
| Thermo Fisher Scientific Inc. | United States | 200,000 | | 24,456,000 |
| aVWR Corp. | United States | 500,000 | | 12,845,000 |
| aWaters Corp. | United States | 100,000 | | 11,821,000 |
| | | | | 87,802,400 |
| Media 1.2% | | | | |
| aLiberty Broadband Corp., A | United States | 300,000 | | 15,432,000 |
| aLiberty Broadband Corp., C | United States | 130,907 | | 6,698,511 |
| aLiberty Media Corp., A | United States | 200,000 | | 7,144,000 |
| Naspers Ltd., N | South Africa | 15,000 | | 1,873,049 |
| | | | | 31,147,560 |
| Oil, Gas & Consumable Fuels 0.4% | | | | |
| Anadarko Petroleum Corp. | United States | 200,000 | | 12,078,000 |
franklintempleton.com
Annual Report
|
59
FRANKLIN CUSTODIAN FUNDS
STATEMENT OF INVESTMENTS
| | | | |
| Franklin DynaTech Fund (continued) | | | | |
| | Country | Shares | | Value |
| Common Stocks (continued) | | | | |
| Pharmaceuticals 4.4% | | | | |
| aAllergan PLC | United States | 250,000 | $ | 67,952,500 |
| Bristol-Myers Squibb Co. | United States | 220,000 | | 13,024,000 |
| Merck KGaA | Germany | 250,000 | | 22,099,722 |
| Novo Nordisk AS, ADR | Denmark | 10,000 | | 542,400 |
| Perrigo Co. PLC | United States | 100,000 | | 15,727,000 |
| | | | | 119,345,622 |
| Real Estate Investment Trusts (REITs) 2.8% | | | | |
| American Tower Corp. | United States | 400,000 | | 35,192,000 |
| Equinix Inc. | United States | 150,000 | | 41,010,000 |
| | | | | 76,202,000 |
| Semiconductors & Semiconductor Equipment 6.3% | | | | |
| ARM Holdings PLC, ADR | United Kingdom | 750,000 | | 32,437,500 |
| ASML Holding NV, N.Y. shs | Netherlands | 200,000 | | 17,596,000 |
| Avago Technologies Ltd. | Singapore | 220,000 | | 27,502,200 |
| aCavium Inc. | United States | 300,000 | | 18,411,000 |
| Intel Corp. | United States | 800,000 | | 24,112,000 |
| Lam Research Corp. | United States | 300,000 | | 19,599,000 |
| aNXP Semiconductors NV | Netherlands | 360,000 | | 31,345,200 |
| | | | | 171,002,900 |
| Software 13.3% | | | | |
| aAdobe Systems Inc. | United States | 400,000 | | 32,888,000 |
| aANSYS Inc. | United States | 200,000 | | 17,628,000 |
| aAspen Technology Inc. | United States | 400,000 | | 15,164,000 |
| aCyber-Ark Software Ltd./Israel | Israel | 175,000 | | 8,774,500 |
| aElectronic Arts Inc. | United States | 400,000 | | 27,100,000 |
| aEllie Mae Inc. | United States | 300,000 | | 19,971,000 |
| aHubspot Inc. | United States | 125,000 | | 5,796,250 |
| Intuit Inc. | United States | 300,000 | | 26,625,000 |
| Microsoft Corp. | United States | 50,000 | | 2,213,000 |
| aMobileye NV | United States | 150,000 | | 6,822,000 |
| aNetSuite Inc. | United States | 400,000 | | 33,560,000 |
| aRapid7 Inc. | United States | 25,000 | | 568,750 |
| aSalesforce.com Inc. | United States | 720,000 | | 49,989,600 |
| aServiceNow Inc. | United States | 640,000 | | 44,448,000 |
| aSplunk Inc. | United States | 175,000 | | 9,686,250 |
| aTyler Technologies Inc. | United States | 10,000 | | 1,493,100 |
| aUltimate Software Group Inc. | United States | 200,000 | | 35,802,000 |
| aWorkday Inc. | United States | 300,000 | | 20,658,000 |
| | | | | 359,187,450 |
| Technology Hardware, Storage & Peripherals 1.6% | | | | |
| Apple Inc. | United States | 400,000 | | 44,120,000 |
| Textiles, Apparel & Luxury Goods 2.4% | | | | |
| NIKE Inc., B | United States | 300,000 | | 36,891,000 |
| aUnder Armour Inc., A | United States | 300,000 | | 29,034,000 |
| | | | | 65,925,000 |
|
60 Annual Report
franklintempleton.com
FRANKLIN CUSTODIAN FUNDS
STATEMENT OF INVESTMENTS
| | | | | |
| Franklin DynaTech Fund (continued) | | | | | |
| | Country | Shares | | Value | |
| Common Stocks (continued) | | | | | |
| Wireless Telecommunication Services 1.4% | | | | | |
| aSBA Communications Corp. | United States | 350,000 | $ | 36,659,000 | |
| aT-Mobile U.S. Inc. | United States | 25,000 | | 995,250 | |
| | | | | 37,654,250 | |
| Total Common Stocks (Cost $1,595,101,747) | | | | 2,531,655,388 | |
| Short Term Investments 7.1% | | | | | |
| Money Market Funds (Cost $132,223,790) 4.9% | | | | | |
| a,bInstitutional Fiduciary Trust Money Market Portfolio | United States | 132,223,790 | | 132,223,790 | |
| |
| | | Principal | | | |
| | | Amount | | | |
| Repurchase Agreements (Cost $58,645,517) 2.2% | | | | | |
| c Joint Repurchase Agreement, 0.071%, 10/01/15 (Maturity Value $58,645,633) | | 58,645,517 | | 58,645,517 | |
| BNP Paribas Securities Corp. (Maturity Value $16,876,454) | | | | | |
| HSBC Securities (USA) Inc. (Maturity Value $33,752,908) | | | | | |
| Merrill Lynch, Pierce, Fenner & Smith Inc. (Maturity Value $8,016,271) | | | | | |
| Collateralized by U.S. Government Agency Securities, 0.000% - 5.125%, | | | | | |
| 12/01/15 - 2/01/20; U.S. Government Agency Securities, Strips, 6/01/17; and | | | | | |
| U.S. Treasury Notes, 2.125%-3.125%, 5/15/19 -8/31/20 (valued at $59,848,067) | | | | | |
| |
| Total Investments (Cost $1,785,971,054) 100.5% | | | | 2,722,524,695 | |
| Other Assets, less Liabilities (0.5)% | | | | (12,276,543 | ) |
| Net Assets 100.0% | | | $ | 2,710,248,152 | |
See Abbreviations on page 136.
aNon-income producing.
bSee Note 3(f) regarding investments in Institutional Fiduciary Trust Money Market Portfolio.
cSee Note 1(c) regarding joint repurchase agreement.
|
franklintempleton.com The accompanying notes are an integral part of these financial statements. | Annual Report 61
| | | | | | | | | | | | | | | |
| FRANKLIN CUSTODIAN FUNDS | | | | | | | | | | | | | | | |
| |
| |
| Financial Highlights | | | | | | | | | | | | | | | |
| Franklin Growth Fund | | | | | | | | | | | | | | | |
| | | | | | Year Ended September 30, | | | | |
| | | 2015 | | | 2014 | | | 2013 | | | 2012 | | | 2011 | |
| Class A | | | | | | | | | | | | | | | |
| Per share operating performance | | | | | | | | | | | | | | | |
| (for a share outstanding throughout the year) | | | | | | | | | | | | | | | |
| Net asset value, beginning of year | $ | 70.51 | | $ | 59.49 | | $ | 50.13 | | $ | 40.45 | | $ | 41.11 | |
| Income from investment operationsa: | | | | | | | | | | | | | | | |
| Net investment incomeb | | 0.29 | | | 0.26 | | | 0.26 | | | 0.20 | | | 0.19 | |
| Net realized and unrealized gains (losses) | | 1.79 | | | 11.06 | | | 9.24 | | | 9.76 | | | (0.67 | ) |
| Total from investment operations | | 2.08 | | | 11.32 | | | 9.50 | | | 9.96 | | | (0.48 | ) |
| Less distributions from: | | | | | | | | | | | | | | | |
| Net investment income | | (0.19 | ) | | (0.30 | ) | | (0.14 | ) | | (0.16 | ) | | (0.18 | ) |
| Net realized gains | | — | | | — | | | — | | | (0.12 | ) | | — | |
| Total distributions | | (0.19 | ) | | (0.30 | ) | | (0.14 | ) | | (0.28 | ) | | (0.18 | ) |
| Net asset value, end of year | $ | 72.40 | | $ | 70.51 | | $ | 59.49 | | $ | 50.13 | | $ | 40.45 | |
| |
| Total returnc | | 2.94 | % | | 19.08 | % | | 19.01 | % | | 24.74 | % | | (1.23 | )% |
| |
| Ratios to average net assets | | | | | | | | | | | | | | | |
| Expenses | | 0.88 | %d,e | | 0.90 | %d,e | | 0.91 | %e | | 0.94 | % | | 0.92 | % |
| Net investment income | | 0.38 | % | | 0.40 | % | | 0.49 | % | | 0.43 | % | | 0.42 | % |
| |
| Supplemental data | | | | | | | | | | | | | | | |
| Net assets, end of year (000’s) | $ | 7,185,665 | | $ | 6,611,073 | | $ | 5,305,031 | | $ | 4,135,962 | | $ | 3,046,277 | |
| Portfolio turnover rate | | 5.05 | % | | 1.50 | % | | 0.83 | % | | 3.50 | % | | 2.72 | % |
aThe amount shown for a share outstanding throughout the period may not correlate with the Statement of Operations for the period due to the timing of sales and
repurchases of the Fund’s shares in relation to income earned and/or fluctuating fair value of the investments of the Fund.
bBased on average daily shares outstanding.
cTotal return does not reflect sales commissions or contingent deferred sales charges, if applicable.
dBenefit of waiver and payments by affiliates rounds to less than 0.01%.
eBenefit of expense reduction rounds to less than 0.01%.
|
62 Annual Report | The accompanying notes are an integral part of these financial statements. franklintempleton.com
FRANKLIN CUSTODIAN FUNDS
FINANCIAL HIGHLIGHTS
| | | | | | | | | | | | | | | |
| Franklin Growth Fund (continued) | | | | | | | | | | | | | | | |
| | | | | | Year Ended September 30, | | | | |
| | | 2015 | | | 2014 | | | 2013 | | | 2012 | | | 2011 | |
| Class C | | | | | | | | | | | | | | | |
| Per share operating performance | | | | | | | | | | | | | | | |
| (for a share outstanding throughout the year) | | | | | | | | | | | | | | | |
| Net asset value, beginning of year | $ | 65.75 | | $ | 55.64 | | $ | 47.10 | | $ | 38.16 | | $ | 38.92 | |
| Income from investment operationsa: | | | | | | | | | | | | | | | |
| Net investment income (loss)b | | (0.26 | ) | | (0.22 | ) | | (0.13 | ) | | (0.14 | ) | | (0.14 | ) |
| Net realized and unrealized gains (losses) | | 1.68 | | | 10.33 | | | 8.67 | | | 9.20 | | | (0.62 | ) |
| Total from investment operations | | 1.42 | | | 10.11 | | | 8.54 | | | 9.06 | | | (0.76 | ) |
| Less distributions from net realized gains | | — | | | — | | | — | | | (0.12 | ) | | — | |
| Net asset value, end of year | $ | 67.17 | | $ | 65.75 | | $ | 55.64 | | $ | 47.10 | | $ | 38.16 | |
| |
| Total returnc | | 2.16 | % | | 18.17 | % | | 18.13 | % | | 23.79 | % | | (1.95 | )% |
| |
| Ratios to average net assets | | | | | | | | | | | | | | | |
| Expenses | | 1.63 | %d,e | | 1.65 | %d,e | | 1.66 | %e | | 1.69 | % | | 1.67 | % |
| Net investment income (loss) | | (0.37 | )% | | (0.35 | )% | | (0.26 | )% | | (0.32 | )% | | (0.33 | )% |
| |
| Supplemental data | | | | | | | | | | | | | | | |
| Net assets, end of year (000’s) | $ | 777,570 | | $ | 662,548 | | $ | 546,505 | | $ | 466,205 | | $ | 390,171 | |
| Portfolio turnover rate | | 5.05 | % | | 1.50 | % | | 0.83 | % | | 3.50 | % | | 2.72 | % |
aThe amount shown for a share outstanding throughout the period may not correlate with the Statement of Operations for the period due to the timing of sales and
repurchases of the Fund’s shares in relation to income earned and/or fluctuating fair value of the investments of the Fund.
bBased on average daily shares outstanding.
cTotal return does not reflect sales commissions or contingent deferred sales charges, if applicable.
dBenefit of waiver and payments by affiliates rounds to less than 0.01%.
eBenefit of expense reduction rounds to less than 0.01%.
|
franklintempleton.com The accompanying notes are an integral part of these financial statements. | Annual Report 63
FRANKLIN CUSTODIAN FUNDS
FINANCIAL HIGHLIGHTS
| | | | | | | | | | | | | | | |
| Franklin Growth Fund (continued) | | | | | | | | | | | | | | | |
| | | | | | Year Ended September 30, | | | | |
| | | 2015 | | | 2014 | | | 2013 | | | 2012 | | | 2011 | |
| Class R | | | | | | | | | | | | | | | |
| Per share operating performance | | | | | | | | | | | | | | | |
| (for a share outstanding throughout the year) | | | | | | | | | | | | | | | |
| Net asset value, beginning of year | $ | 70.05 | | $ | 59.07 | | $ | 49.82 | | $ | 40.23 | | $ | 40.94 | |
| Income from investment operationsa: | | | | | | | | | | | | | | | |
| Net investment incomeb | | 0.10 | | | 0.10 | | | 0.13 | | | 0.08 | | | 0.06 | |
| Net realized and unrealized gains (losses) | | 1.78 | | | 10.98 | | | 9.18 | | | 9.71 | | | (0.65 | ) |
| Total from investment operations | | 1.88 | | | 11.08 | | | 9.31 | | | 9.79 | | | (0.59 | ) |
| Less distributions from: | | | | | | | | | | | | | | | |
| Net investment income | | — | | | (0.10 | ) | | (0.06 | ) | | (0.08 | ) | | (0.12 | ) |
| Net realized gains | | — | | | — | | | — | | | (0.12 | ) | | — | |
| Total distributions | | — | | | (0.10 | ) | | (0.06 | ) | | (0.20 | ) | | (0.12 | ) |
| Net asset value, end of year | $ | 71.93 | | $ | 70.05 | | $ | 59.07 | | $ | 49.82 | | $ | 40.23 | |
| |
| Total return | | 2.68 | % | | 18.77 | % | | 18.71 | % | | 24.42 | % | | (1.47 | )% |
| |
| Ratios to average net assets | | | | | | | | | | | | | | | |
| Expenses | | 1.13 | %c,d | | 1.15 | %c,d | | 1.16 | %d | | 1.19 | % | | 1.17 | % |
| Net investment income | | 0.13 | % | | 0.15 | % | | 0.24 | % | | 0.18 | % | | 0.17 | % |
| |
| Supplemental data | | | | | | | | | | | | | | | |
| Net assets, end of year (000’s) | $ | 501,813 | | $ | 565,634 | | $ | 552,391 | | $ | 466,954 | | $ | 283,464 | |
| Portfolio turnover rate | | 5.05 | % | | 1.50 | % | | 0.83 | % | | 3.50 | % | | 2.72 | % |
aThe amount shown for a share outstanding throughout the period may not correlate with the Statement of Operations for the period due to the timing of sales and
repurchases of the Fund’s shares in relation to income earned and/or fluctuating fair value of the investments of the Fund.
bBased on average daily shares outstanding.
cBenefit of waiver and payments by affiliates rounds to less than 0.01%.
dBenefit of expense reduction rounds to less than 0.01%.
|
64 Annual Report | The accompanying notes are an integral part of these financial statements. franklintempleton.com
FRANKLIN CUSTODIAN FUNDS
FINANCIAL HIGHLIGHTS
| | | | | | | | | |
| Franklin Growth Fund (continued) | | | | | | | | | |
| | | Year Ended September 30, | |
| | | 2015 | | | 2014 | | | 2013 | a |
| Class R6 | | | | | | | | | |
| Per share operating performance | | | | | | | | | |
| (for a share outstanding throughout the year) | | | | | | | | | |
| Net asset value, beginning of year | $ | 70.76 | | $ | 59.71 | | $ | 54.58 | |
| Income from investment operationsb: | | | | | | | | | |
| Net investment incomec | | 0.61 | | | 0.55 | | | 0.24 | |
| Net realized and unrealized gains (losses) | | 1.79 | | | 11.08 | | | 4.89 | |
| Total from investment operations | | 2.40 | | | 11.63 | | | 5.13 | |
| Less distributions from net investment income | | (0.47 | ) | | (0.58 | ) | | — | |
| Net asset value, end of year | $ | 72.69 | | $ | 70.76 | | $ | 59.71 | |
| |
| Total returnd | | 3.37 | % | | 19.59 | % | | 9.40 | % |
| |
| Ratios to average net assetse | | | | | | | | | |
| Expensesf | | 0.46 | %g | | 0.47 | %g | | 0.48 | % |
| Net investment income | | 0.80 | % | | 0.83 | % | | 0.92 | % |
| |
| Supplemental data | | | | | | | | | |
| Net assets, end of year (000’s) | $ | 1,163,362 | | $ | 1,107,887 | | $ | 871,260 | |
| Portfolio turnover rate | | 5.05 | % | | 1.50 | % | | 0.83 | % |
aFor the period May 1, 2013 (effective date) to September 30, 2013.
bThe amount shown for a share outstanding throughout the period may not correlate with the Statement of Operations for the period due to the timing of sales and
repurchases of the Fund’s shares in relation to income earned and/or fluctuating fair value of the investments of the Fund.
cBased on average daily shares outstanding.
dTotal return is not annualized for periods less than one year.
eRatios are annualized for periods less than one year.
fBenefit of expense reduction rounds to less than 0.01%.
gBenefit of waiver and payments by affiliates rounds to less than 0.01%.
|
franklintempleton.com The accompanying notes are an integral part of these financial statements. | Annual Report 65
|
| FRANKLIN CUSTODIAN FUNDS |
| FINANCIAL HIGHLIGHTS |
| | | | | | | | | | | | | | | |
| Franklin Growth Fund (continued) | | | | | | | | | | | | | | | |
| | | | | | Year Ended September 30, | | | | |
| | | 2015 | | | 2014 | | | 2013 | | | 2012 | | | 2011 | |
| Advisor Class | | | | | | | | | | | | | | | |
| Per share operating performance | | | | | | | | | | | | | | | |
| (for a share outstanding throughout the year) | | | | | | | | | | | | | | | |
| Net asset value, beginning of year | $ | 70.75 | | $ | 59.66 | | $ | 50.24 | | $ | 40.53 | | $ | 41.18 | |
| Income from investment operationsa: | | | | | | | | | | | | | | | |
| Net investment incomeb | | 0.48 | | | 0.43 | | | 0.39 | | | 0.32 | | | 0.30 | |
| Net realized and unrealized gains (losses) | | 1.79 | | | 11.08 | | | 9.26 | | | 9.78 | | | (0.68 | ) |
| Total from investment operations | | 2.27 | | | 11.51 | | | 9.65 | | | 10.10 | | | (0.38 | ) |
| Less distributions from: | | | | | | | | | | | | | | | |
| Net investment income | | (0.35 | ) | | (0.42 | ) | | (0.23 | ) | | (0.27 | ) | | (0.27 | ) |
| Net realized gains | | — | | | — | | | — | | | (0.12 | ) | | — | |
| Total distributions | | (0.35 | ) | | (0.42 | ) | | (0.23 | ) | | (0.39 | ) | | (0.27 | ) |
| Net asset value, end of year | $ | 72.67 | | $ | 70.75 | | $ | 59.66 | | $ | 50.24 | | $ | 40.53 | |
| |
| Total return | | 3.20 | % | | 19.37 | % | | 19.29 | % | | 25.04 | % | | (0.96 | )% |
| |
| Ratios to average net assets | | | | | | | | | | | | | | | |
| Expenses | | 0.63 | %c,d | | 0.65 | %c,d | | 0.66 | %d | | 0.69 | % | | 0.67 | % |
| Net investment income | | 0.63 | % | | 0.65 | % | | 0.74 | % | | 0.68 | % | | 0.67 | % |
| |
| Supplemental data | | | | | | | | | | | | | | | |
| Net assets, end of year (000’s) | $ | 1,514,492 | | $ | 1,414,980 | | $ | 1,080,811 | | $ | 1,399,191 | | $ | 917,394 | |
| Portfolio turnover rate | | 5.05 | % | | 1.50 | % | | 0.83 | % | | 3.50 | % | | 2.72 | % |
aThe amount shown for a share outstanding throughout the period may not correlate with the Statement of Operations for the period due to the timing of sales and
repurchases of the Fund’s shares in relation to income earned and/or fluctuating fair value of the investments of the Fund.
bBased on average daily shares outstanding.
cBenefit of waiver and payments by affiliates rounds to less than 0.01%.
dBenefit of expense reduction rounds to less than 0.01%.
|
66 Annual Report | The accompanying notes are an integral part of these financial statements. franklintempleton.com
FRANKLIN CUSTODIAN FUNDS
| | | | |
| Statement of Investments, September 30, 2015 | | | | |
| |
| Franklin Growth Fund | | | | |
| | Country | Shares | | Value |
| Common Stocks 87.8% | | | | |
| Automobiles & Components 1.9% | | | | |
| BorgWarner Inc. | United States | 1,450,000 | $ | 60,305,500 |
| Ford Motor Co. | United States | 1,200,000 | | 16,284,000 |
| General Motors Co. | United States | 800,000 | | 24,016,000 |
| Harley-Davidson Inc. | United States | 913,096 | | 50,128,970 |
| Johnson Controls Inc. | United States | 1,600,000 | | 66,176,000 |
| | | | | 216,910,470 |
| Banks 0.7% | | | | |
| JPMorgan Chase & Co. | United States | 600,000 | | 36,582,000 |
| Wells Fargo & Co. | United States | 750,000 | | 38,512,500 |
| | | | | 75,094,500 |
| Capital Goods 15.5% | | | | |
| 3M Co. | United States | 855,000 | | 121,213,350 |
| Allegion PLC | United States | 366,666 | | 21,141,962 |
| The Boeing Co. | United States | 1,100,000 | | 144,045,000 |
| Caterpillar Inc. | United States | 550,000 | | 35,948,000 |
| Danaher Corp. | United States | 1,000,000 | | 85,210,000 |
| Deere & Co. | United States | 500,000 | | 37,000,000 |
| Emerson Electric Co. | United States | 1,100,000 | | 48,587,000 |
| General Dynamics Corp. | United States | 1,000,000 | | 137,950,000 |
| General Electric Co. | United States | 1,800,000 | | 45,396,000 |
| Huntington Ingalls Industries Inc. | United States | 166,666 | | 17,858,262 |
| Illinois Tool Works Inc. | United States | 1,000,000 | | 82,310,000 |
| Ingersoll-Rand PLC | United States | 1,100,000 | | 55,847,000 |
| Lockheed Martin Corp. | United States | 500,000 | | 103,655,000 |
| Northrop Grumman Corp. | United States | 1,100,000 | | 182,545,000 |
| Precision Castparts Corp. | United States | 450,000 | | 103,369,500 |
| Raytheon Co. | United States | 600,000 | | 65,556,000 |
| Rockwell Collins Inc. | United States | 350,000 | | 28,644,000 |
| aSensata Technologies Holding NV | United States | 2,050,000 | | 90,897,000 |
| Stanley Black & Decker Inc. | United States | 600,000 | | 58,188,000 |
| Textron Inc. | United States | 1,600,000 | | 60,224,000 |
| United Technologies Corp. | United States | 900,000 | | 80,091,000 |
| W.W. Grainger Inc. | United States | 550,000 | | 118,255,500 |
| | | | | 1,723,931,574 |
| Commercial & Professional Services 2.4% | | | | |
| Dun & Bradstreet Corp. | United States | 587,736 | | 61,712,280 |
| Equifax Inc. | United States | 500,000 | | 48,590,000 |
| aIHS Inc., A | United States | 700,000 | | 81,200,000 |
| Robert Half International Inc. | United States | 150,000 | | 7,674,000 |
| aStericycle Inc. | United States | 200,000 | | 27,862,000 |
| aVerisk Analytics Inc. | United States | 550,000 | | 40,650,500 |
| | | | | 267,688,780 |
| Consumer Durables & Apparel 2.2% | | | | |
| NIKE Inc., B | United States | 900,000 | | 110,673,000 |
| VF Corp. | United States | 2,000,000 | | 136,420,000 |
| | | | | 247,093,000 |
franklintempleton.com
Annual Report
|
67
FRANKLIN CUSTODIAN FUNDS
STATEMENT OF INVESTMENTS
| | | | |
| Franklin Growth Fund (continued) | | | | |
| | Country | Shares | | Value |
| Common Stocks (continued) | | | | |
| Consumer Services 1.1% | | | | |
| Carnival Corp. | United States | 1,200,000 | $ | 59,640,000 |
| Graham Holdings Co., B | United States | 80,000 | | 46,160,000 |
| Starwood Hotels & Resorts Worldwide Inc. | United States | 250,000 | | 16,620,000 |
| | | | | 122,420,000 |
| Diversified Financials 1.8% | | | | |
| American Express Co. | United States | 600,000 | | 44,478,000 |
| aBerkshire Hathaway Inc., A | United States | 184 | | 35,924,160 |
| BlackRock Inc. | United States | 208,000 | | 61,873,760 |
| T. Rowe Price Group Inc. | United States | 900,000 | | 62,550,000 |
| | | | | 204,825,920 |
| Energy 2.0% | | | | |
| Anadarko Petroleum Corp. | United States | 850,000 | | 51,331,500 |
| Cabot Oil & Gas Corp., A | United States | 1,000,000 | | 21,860,000 |
| aFMC Technologies Inc. | United States | 1,500,000 | | 46,500,000 |
| Halliburton Co. | United States | 850,000 | | 30,047,500 |
| Occidental Petroleum Corp. | United States | 300,000 | | 19,845,000 |
| Royal Dutch Shell PLC, A, ADR | United Kingdom | 280,000 | | 13,269,200 |
| Schlumberger Ltd. | United States | 550,000 | | 37,933,500 |
| | | | | 220,786,700 |
| Food & Staples Retailing 0.5% | | | | |
| CVS Health Corp. | United States | 600,000 | | 57,888,000 |
| Food, Beverage & Tobacco 2.9% | | | | |
| Brown-Forman Corp., B | United States | 600,000 | | 58,140,000 |
| Bunge Ltd. | United States | 250,000 | | 18,325,000 |
| Mead Johnson Nutrition Co., A | United States | 1,225,000 | | 86,240,000 |
| aMonster Beverage Corp. | United States | 900,000 | | 121,626,000 |
| PepsiCo Inc. | United States | 450,000 | | 42,435,000 |
| | | | | 326,766,000 |
| Health Care Equipment & Services 6.1% | | | | |
| Abbott Laboratories | United States | 900,000 | | 36,198,000 |
| Aetna Inc. | United States | 400,000 | | 43,764,000 |
| Baxter International Inc. | United States | 400,000 | | 13,140,000 |
| Becton, Dickinson and Co. | United States | 77,700 | | 10,307,682 |
| Cardinal Health Inc. | United States | 300,000 | | 23,046,000 |
| aEdwards Lifesciences Corp. | United States | 200,000 | | 28,434,000 |
| aEnvision Healthcare Holdings Inc. | United States | 1,600,000 | | 58,864,000 |
| aExpress Scripts Holding Co. | United States | 361,648 | | 29,279,022 |
| aHaemonetics Corp. | United States | 1,000,000 | | 32,320,000 |
| aHenry Schein Inc. | United States | 350,000 | | 46,452,000 |
| Hill-Rom Holdings Inc. | United States | 300,000 | | 15,597,000 |
| aIntuitive Surgical Inc. | United States | 150,000 | | 68,937,000 |
| aLaboratory Corp. of America Holdings | United States | 500,000 | | 54,235,000 |
| Medtronic PLC | United States | 406,300 | | 27,197,722 |
| Quest Diagnostics Inc. | United States | 900,000 | | 55,323,000 |
| Stryker Corp. | United States | 400,000 | | 37,640,000 |
| Teleflex Inc. | United States | 500,000 | | 62,105,000 |
| aVarian Medical Systems Inc. | United States | 300,000 | | 22,134,000 |
| Zimmer Biomet Holdings Inc. | United States | 100,000 | | 9,393,000 |
| | | | | 674,366,426 |
| |
| |
| 68 | Annual Report | | franklintempleton.com |
FRANKLIN CUSTODIAN FUNDS
STATEMENT OF INVESTMENTS
| | | | |
| Franklin Growth Fund (continued) | | | | |
| | Country | Shares | | Value |
| Common Stocks (continued) | | | | |
| Household & Personal Products 0.2% | | | | |
| The Procter & Gamble Co. | United States | 335,000 | $ | 24,099,900 |
| Insurance 0.3% | | | | |
| Aflac Inc. | United States | 600,000 | | 34,878,000 |
| Materials 6.0% | | | | |
| Air Products and Chemicals Inc. | United States | 500,000 | | 63,790,000 |
| aAxalta Coating Systems Ltd. | United States | 3,150,000 | | 79,821,000 |
| Celanese Corp., A | United States | 1,200,000 | | 71,004,000 |
| Cytec Industries Inc. | United States | 2,000,000 | | 147,700,000 |
| Ecolab Inc. | United States | 775,000 | | 85,033,000 |
| Martin Marietta Materials Inc. | United States | 350,000 | | 53,182,500 |
| Praxair Inc. | United States | 575,000 | | 58,569,500 |
| Sigma-Aldrich Corp. | United States | 800,000 | | 111,136,000 |
| | | | | 670,236,000 |
| Media 1.9% | | | | |
| aCable One Inc. | United States | 80,000 | | 33,553,600 |
| The Walt Disney Co. | United States | 1,687,290 | | 172,441,038 |
| | | | | 205,994,638 |
| Pharmaceuticals, Biotechnology & Life Sciences 12.4% | | | | |
| AbbVie Inc. | United States | 400,000 | | 21,764,000 |
| Agilent Technologies Inc. | United States | 1,300,000 | | 44,629,000 |
| aAllergan PLC | United States | 400,000 | | 108,724,000 |
| Amgen Inc. | United States | 1,000,000 | | 138,320,000 |
| Baxalta Inc. | United States | 400,000 | | 12,604,000 |
| aBiogen Inc. | United States | 500,000 | | 145,905,000 |
| aBluebird Bio Inc. | United States | 160,000 | | 13,688,000 |
| aCatalent Inc. | United States | 2,900,000 | | 70,470,000 |
| aCelgene Corp. | United States | 780,000 | | 84,372,600 |
| Eli Lilly & Co. | United States | 1,350,000 | | 112,981,500 |
| Gilead Sciences Inc. | United States | 600,000 | | 58,914,000 |
| aIllumina Inc. | United States | 400,000 | | 70,328,000 |
| Johnson & Johnson | United States | 1,200,100 | | 112,029,335 |
| Merck & Co. Inc. | United States | 1,000,000 | | 49,390,000 |
| aMettler-Toledo International Inc. | United States | 425,000 | | 121,014,500 |
| aNantKwest Inc. | United States | 248,600 | | 2,848,956 |
| a,bNantKwest Inc. | United States | 326,400 | | 3,366,490 |
| Pfizer Inc. | United States | 2,761,000 | | 86,723,010 |
| Roche Holding AG, ADR | Switzerland | 1,700,000 | | 56,015,000 |
| aWaters Corp. | United States | 575,000 | | 67,970,750 |
| | | | | 1,382,058,141 |
| Real Estate 0.6% | | | | |
| American Tower Corp. | United States | 715,000 | | 62,905,700 |
| Retailing 2.0% | | | | |
| aAmazon.com Inc. | United States | 350,000 | | 179,161,500 |
| Expedia Inc. | United States | 200,000 | | 23,536,000 |
| HSN Inc. | United States | 100,000 | | 5,724,000 |
| aTripAdvisor Inc. | United States | 200,000 | | 12,604,000 |
| | | | | 221,025,500 |
franklintempleton.com
Annual Report
|
69
| | | | |
| FRANKLIN CUSTODIAN FUNDS | | | | |
| STATEMENT OF INVESTMENTS | | | | |
| |
| |
| |
| |
| Franklin Growth Fund (continued) | | | | |
| | Country | Shares | | Value |
| Common Stocks (continued) | | | | |
| Semiconductors & Semiconductor Equipment 1.3% | | | | |
| ASML Holding NV, N.Y. shs | Netherlands | 550,000 | $ | 48,389,000 |
| Intel Corp. | United States | 1,100,000 | | 33,154,000 |
| Texas Instruments Inc. | United States | 1,250,000 | | 61,900,000 |
| | | | | 143,443,000 |
| Software & Services 11.1% | | | | |
| aAlibaba Group Holding Ltd., ADR | China | 480,400 | | 28,329,188 |
| aAutodesk Inc. | United States | 800,000 | | 35,312,000 |
| Automatic Data Processing Inc. | United States | 700,000 | | 56,252,000 |
| CDK Global LLC | United States | 233,333 | | 11,148,651 |
| aCheck Point Software Technologies Ltd. | Israel | 525,000 | | 41,648,250 |
| Computer Sciences Corp. | United States | 1,400,000 | | 85,932,000 |
| aFacebook Inc., A | United States | 400,000 | | 35,960,000 |
| aFortinet Inc. | United States | 1,500,000 | | 63,720,000 |
| aGoogle Inc., A | United States | 165,000 | | 105,331,050 |
| aGoogle Inc., C | United States | 150,411 | | 91,513,060 |
| IAC/InterActiveCorp | United States | 300,000 | | 19,581,000 |
| International Business Machines Corp. | United States | 600,000 | | 86,982,000 |
| Intuit Inc. | United States | 1,000,000 | | 88,750,000 |
| MasterCard Inc., A | United States | 1,000,000 | | 90,120,000 |
| Microsoft Corp. | United States | 2,700,000 | | 119,502,000 |
| Oracle Corp. | United States | 2,600,000 | | 93,912,000 |
| aServiceNow Inc. | United States | 675,000 | | 46,878,750 |
| Visa Inc., A | United States | 1,200,000 | | 83,592,000 |
| aYahoo! Inc. | United States | 1,700,000 | | 49,147,000 |
| | | | | 1,233,610,949 |
| Technology Hardware & Equipment 7.2% | | | | |
| Apple Inc. | United States | 4,025,000 | | 443,957,500 |
| Cisco Systems Inc. | United States | 2,945,000 | | 77,306,250 |
| EMC Corp. | United States | 2,700,000 | | 65,232,000 |
| Hewlett-Packard Co. | United States | 1,156,250 | | 29,611,563 |
| aKeysight Technologies Inc. | United States | 650,000 | | 20,046,000 |
| QUALCOMM Inc. | United States | 660,000 | | 35,461,800 |
| TE Connectivity Ltd. | United States | 1,600,000 | | 95,824,000 |
| aTrimble Navigation Ltd. | United States | 2,400,000 | | 39,408,000 |
| | | | | 806,847,113 |
| Transportation 7.1% | | | | |
| Alaska Air Group Inc. | United States | 3,200,000 | | 254,240,000 |
| Allegiant Travel Co. | United States | 200,000 | | 43,250,000 |
| C.H. Robinson Worldwide Inc. | United States | 267,300 | | 18,117,594 |
| Canadian National Railway Co. | Canada | 1,000,000 | | 56,760,000 |
| Canadian Pacific Railway Ltd. | Canada | 500,000 | | 71,785,000 |
| Expeditors International of Washington Inc. | United States | 600,000 | | 28,230,000 |
| Forward Air Corp. | United States | 500,000 | | 20,745,000 |
| aInternational Consolidated Airlines Group SA, ADR | United Kingdom | 1,400,000 | | 62,272,000 |
| Kansas City Southern | United States | 450,000 | | 40,896,000 |
| Ryanair Holdings PLC, ADR | Ireland | 239,200 | | 18,729,360 |
| Union Pacific Corp. | United States | 1,400,000 | | 123,774,000 |
| aUnited Continental Holdings Inc. | United States | 1,050,000 | | 55,702,500 |
| | | | | 794,501,454 |
| |
| |
| 70 | Annual Report | | franklintempleton.com |
FRANKLIN CUSTODIAN FUNDS
STATEMENT OF INVESTMENTS
| | | | | |
| Franklin Growth Fund (continued) | | | | | |
| | Country | Shares | | Value | |
| Common Stocks (continued) | | | | | |
| Utilities 0.6% | | | | | |
| American Water Works Co. Inc. | United States | 700,000 | $ | 38,556,000 | |
| NextEra Energy Inc. | United States | 250,000 | | 24,387,500 | |
| | | | | 62,943,500 | |
| Total Common Stocks (Cost $4,494,166,965) | | | | 9,780,315,264 | |
| Short Term Investments (Cost $1,399,136,183) 12.5% | | | | | |
| Money Market Funds 12.5% | | | | | |
| a,cInstitutional Fiduciary Trust Money Market Portfolio | United States | 1,399,136,183 | | 1,399,136,183 | |
| Total Investments (Cost $5,893,303,148) 100.3% | | | | 11,179,451,447 | |
| Other Assets, less Liabilities (0.3)% | | | | (36,549,528 | ) |
| Net Assets 100.0% | | | $ | 11,142,901,919 | |
See Abbreviations on page 136.
aNon-income producing.
bSecurity has been deemed illiquid because it may not be able to be sold within seven days. At September 30, 2015, the value of this security was $3,366,490,
representing 0.03% of net assets.
cSee Note 3(f) regarding investments in Institutional Fiduciary Trust Money Market Portfolio.
|
franklintempleton.com The accompanying notes are an integral part of these financial statements. | Annual Report 71
| | | | | | | | | | | | | | | |
| FRANKLIN CUSTODIAN FUNDS | | | | | | | | | | | | | | | |
| |
| |
| Financial Highlights | | | | | | | | | | | | | | | |
| Franklin Income Fund | | | | | | | | | | | | | | | |
| | | | | | Year Ended September 30, | | | | |
| | | 2015 | | | 2014 | | | 2013 | | | 2012 | | | 2011 | |
| Class A | | | | | | | | | | | | | | | |
| Per share operating performance | | | | | | | | | | | | | | | |
| (for a share outstanding throughout the year) | | | | | | | | | | | | | | | |
| Net asset value, beginning of year | $ | 2.48 | | $ | 2.33 | | $ | 2.23 | | $ | 1.98 | | $ | 2.11 | |
| Income from investment operationsa: | | | | | | | | | | | | | | | |
| Net investment incomeb | | 0.10 | | | 0.11 | | | 0.11 | | | 0.13 | | | 0.13 | |
| Net realized and unrealized gains (losses) | | (0.36 | ) | | 0.16 | | | 0.12 | | | 0.26 | | | (0.12 | ) |
| Total from investment operations | | (0.26 | ) | | 0.27 | | | 0.23 | | | 0.39 | | | 0.01 | |
| Less distributions from net investment income | | (0.12 | ) | | (0.12 | ) | | (0.13 | ) | | (0.14 | ) | | (0.14 | ) |
| Net asset value, end of year | $ | 2.10 | | $ | 2.48 | | $ | 2.33 | | $ | 2.23 | | $ | 1.98 | |
| |
| Total returnc | | (10.93 | )% | | 11.86 | % | | 10.72 | % | | 20.38 | % | | 0.01 | % |
| |
| Ratios to average net assets | | | | | | | | | | | | | | | |
| Expensesd | | 0.61 | %e | | 0.61 | %e | | 0.62 | % | | 0.64 | % | | 0.63 | % |
| Net investment income | | 4.43 | % | | 4.28 | % | | 4.98 | % | | 5.90 | % | | 6.03 | % |
| |
| Supplemental data | | | | | | | | | | | | | | | |
| Net assets, end of year (000’s) | $ | 44,886,127 | | $ | 53,823,921 | | $ | 48,320,611 | | $ | 41,280,437 | | $ | 32,847,934 | |
| Portfolio turnover rate | | 44.81 | % | | 36.03 | % | | 37.60 | % | | 33.44 | % | | 35.83 | % |
aThe amount shown for a share outstanding throughout the period may not correlate with the Statement of Operations for the period due to the timing of sales and
repurchases of the Fund’s shares in relation to income earned and/or fluctuating fair value of the investments of the Fund.
bBased on average daily shares outstanding.
cTotal return does not reflect sales commissions or contingent deferred sales charges, if applicable.
dBenefit of expense reduction rounds to less than 0.01%.
eBenefit of waiver and payments by affiliates rounds to less than 0.01%.
|
72 Annual Report | The accompanying notes are an integral part of these financial statements. franklintempleton.com
FRANKLIN CUSTODIAN FUNDS
FINANCIAL HIGHLIGHTS
| | | | | | | | | | | | | | | |
| Franklin Income Fund (continued) | | | | | | | | | | | | | | | |
| | | | | | Year Ended September 30, | | | | |
| | | 2015 | | | 2014 | | | 2013 | | | 2012 | | | 2011 | |
| Class C | | | | | | | | | | | | | | | |
| Per share operating performance | | | | | | | | | | | | | | | |
| (for a share outstanding throughout the year) | | | | | | | | | | | | | | | |
| Net asset value, beginning of year | $ | 2.50 | | $ | 2.35 | | $ | 2.25 | | $ | 2.00 | | $ | 2.13 | |
| Income from investment operationsa: | | | | | | | | | | | | | | | |
| Net investment incomeb | | 0.09 | | | 0.09 | | | 0.10 | | | 0.12 | | | 0.12 | |
| Net realized and unrealized gains (losses) | | (0.35 | ) | | 0.17 | | | 0.12 | | | 0.26 | | | (0.12 | ) |
| Total from investment operations | | (0.26 | ) | | 0.26 | | | 0.22 | | | 0.38 | | | — | |
| Less distributions from net investment income | | (0.11 | ) | | (0.11 | ) | | (0.12 | ) | | (0.13 | ) | | (0.13 | ) |
| Net asset value, end of year | $ | 2.13 | | $ | 2.50 | | $ | 2.35 | | $ | 2.25 | | $ | 2.00 | |
| |
| Total returnc | | (10.89 | )% | | 11.19 | % | | 10.07 | % | | 19.58 | % | | (0.48 | )% |
| |
| Ratios to average net assets | | | | | | | | | | | | | | | |
| Expensesd | | 1.11 | %e | | 1.11 | %e | | 1.12 | % | | 1.14 | % | | 1.13 | % |
| Net investment income | | 3.93 | % | | 3.78 | % | | 4.48 | % | | 5.40 | % | | 5.53 | % |
| |
| Supplemental data | | | | | | | | | | | | | | | |
| Net assets, end of year (000’s) | $ | 24,091,638 | | $ | 28,802,209 | | $ | 24,016,797 | | $ | 20,220,114 | | $ | 16,217,805 | |
| Portfolio turnover rate | | 44.81 | % | | 36.03 | % | | 37.60 | % | | 33.44 | % | | 35.83 | % |
aThe amount shown for a share outstanding throughout the period may not correlate with the Statement of Operations for the period due to the timing of sales and
repurchases of the Fund’s shares in relation to income earned and/or fluctuating fair value of the investments of the Fund.
bBased on average daily shares outstanding.
cTotal return does not reflect sales commissions or contingent deferred sales charges, if applicable.
dBenefit of expense reduction rounds to less than 0.01%.
eBenefit of waiver and payments by affiliates rounds to less than 0.01%.
|
franklintempleton.com The accompanying notes are an integral part of these financial statements. | Annual Report 73
| | | | | | | | | | | | | | | |
| FRANKLIN CUSTODIAN FUNDS | | | | | | | | | | | | | | | |
| FINANCIAL HIGHLIGHTS | | | | | | | | | | | | | | | |
| |
| |
| |
| Franklin Income Fund (continued) | | | | | | | | | | | | | | | |
| | | | | | Year Ended September 30, | | | | |
| | | 2015 | | | 2014 | | | 2013 | | | 2012 | | | 2011 | |
| Class R | | | | | | | | | | | | | | | |
| Per share operating performance | | | | | | | | | | | | | | | |
| (for a share outstanding throughout the year) | | | | | | | | | | | | | | | |
| Net asset value, beginning of year | $ | 2.44 | | $ | 2.29 | | $ | 2.20 | | $ | 1.96 | | $ | 2.09 | |
| Income from investment operationsa: | | | | | | | | | | | | | | | |
| Net investment incomeb | | 0.10 | | | 0.10 | | | 0.11 | | | 0.12 | | | 0.12 | |
| Net realized and unrealized gains (losses) | | (0.36 | ) | | 0.16 | | | 0.10 | | | 0.25 | | | (0.12 | ) |
| Total from investment operations | | (0.26 | ) | | 0.26 | | | 0.21 | | | 0.37 | | | — | |
| Less distributions from net investment income | | (0.11 | ) | | (0.11 | ) | | (0.12 | ) | | (0.13 | ) | | (0.13 | ) |
| Net asset value, end of year | $ | 2.07 | | $ | 2.44 | | $ | 2.29 | | $ | 2.20 | | $ | 1.96 | |
| |
| Total return | | (10.99 | )% | | 11.66 | % | | 10.03 | % | | 19.66 | % | | (0.32 | )% |
| |
| Ratios to average net assets | | | | | | | | | | | | | | | |
| Expensesc | | 0.96 | %d | | 0.96 | %d | | 0.97 | % | | 0.99 | % | | 0.98 | % |
| Net investment income | | 4.08 | % | | 3.93 | % | | 4.63 | % | | 5.55 | % | | 5.68 | % |
| |
| Supplemental data | | | | | | | | | | | | | | | |
| Net assets, end of year (000’s) | $ | 416,653 | | $ | 514,892 | | $ | 446,463 | �� | $ | 426,525 | | $ | 360,907 | |
| Portfolio turnover rate | | 44.81 | % | | 36.03 | % | | 37.60 | % | | 33.44 | % | | 35.83 | % |
aThe amount shown for a share outstanding throughout the period may not correlate with the Statement of Operations for the period due to the timing of sales and
repurchases of the Fund’s shares in relation to income earned and/or fluctuating fair value of the investments of the Fund.
bBased on average daily shares outstanding.
cBenefit of expense reduction rounds to less than 0.01%.
dBenefit of waiver and payments by affiliates rounds to less than 0.01%.
|
74 Annual Report | The accompanying notes are an integral part of these financial statements. franklintempleton.com
FRANKLIN CUSTODIAN FUNDS
FINANCIAL HIGHLIGHTS
| | | | | | | | | |
| Franklin Income Fund (continued) | | | | | | | | | |
| | | Year Ended September 30, | |
| | | 2015 | | | 2014 | | | 2013 | a |
| Class R6 | | | | | | | | | |
| Per share operating performance | | | | | | | | | |
| (for a share outstanding throughout the year) | | | | | | | | | |
| Net asset value, beginning of year | $ | 2.46 | | $ | 2.31 | | $ | 2.33 | |
| Income from investment operationsb: | | | | | | | | | |
| Net investment incomec | | 0.11 | | | 0.11 | | | 0.04 | |
| Net realized and unrealized gains (losses) | | (0.35 | ) | | 0.17 | | | (0.02 | ) |
| Total from investment operations | | (0.24 | ) | | 0.28 | | | 0.02 | |
| Less distributions from net investment income | | (0.13 | ) | | (0.13 | ) | | (0.04 | ) |
| Net asset value, end of year | $ | 2.09 | | $ | 2.46 | | $ | 2.31 | |
| |
| Total returnd | | (10.39 | )% | | 12.19 | % | | 1.06 | % |
| |
| Ratios to average net assetse | | | | | | | | | |
| Expensesf | | 0.38 | %g | | 0.38 | %g | | 0.39 | % |
| Net investment income | | 4.66 | % | | 4.50 | % | | 5.21 | % |
| |
| Supplemental data | | | | | | | | | |
| Net assets, end of year (000’s) | $ | 1,744,718 | | $ | 2,108,076 | | $ | 1,921,084 | |
| Portfolio turnover rate | | 44.81 | % | | 36.03 | % | | 37.60 | % |
aFor the period May 1, 2013 (effective date) to September 30, 2013.
bThe amount shown for a share outstanding throughout the period may not correlate with the Statement of Operations for the period due to the timing of sales and
repurchases of the Fund’s shares in relation to income earned and/or fluctuating fair value of the investments of the Fund.
cBased on average daily shares outstanding.
dTotal return is not annualized for periods less than one year.
eRatios are annualized for periods less than one year.
fBenefit of expense reduction rounds to less than 0.01%.
gBenefit of waiver and payments by affiliates rounds to less than 0.01%.
|
franklintempleton.com The accompanying notes are an integral part of these financial statements. | Annual Report 75
| | | | | | | | | | | | | | | |
| FRANKLIN CUSTODIAN FUNDS | | | | | | | | | | | | | | | |
| FINANCIAL HIGHLIGHTS | | | | | | | | | | | | | | | |
| |
| |
| |
| Franklin Income Fund (continued) | | | | | | | | | | | | | | | |
| | | | | | Year Ended September 30, | | | | |
| | | 2015 | | | 2014 | | | 2013 | | | 2012 | | | 2011 | |
| Advisor Class | | | | | | | | | | | | | | | |
| Per share operating performance | | | | | | | | | | | | | | | |
| (for a share outstanding throughout the year) | | | | | | | | | | | | | | | |
| Net asset value, beginning of year | $ | 2.46 | | $ | 2.31 | | $ | 2.22 | | $ | 1.97 | | $ | 2.10 | |
| Income from investment operationsa: | | | | | | | | | | | | | | | |
| Net investment incomeb | | 0.11 | | | 0.11 | | | 0.12 | | | 0.13 | | | 0.13 | |
| Net realized and unrealized gains (losses) | | (0.36 | ) | | 0.17 | | | 0.11 | | | 0.26 | | | (0.12 | ) |
| Total from investment operations | | (0.25 | ) | | 0.28 | | | 0.23 | | | 0.39 | | | 0.01 | |
| Less distributions from net investment income | | (0.12 | ) | | (0.13 | ) | | (0.14 | ) | | (0.14 | ) | | (0.14 | ) |
| Net asset value, end of year | $ | 2.09 | | $ | 2.46 | | $ | 2.31 | | $ | 2.22 | | $ | 1.97 | |
| |
| Total return | | (10.46 | )% | | 12.12 | % | | 10.49 | % | | 20.69 | % | | 0.16 | % |
| |
| Ratios to average net assets | | | | | | | | | | | | | | | |
| Expensesc | | 0.46 | %d | | 0.46 | %d | | 0.47 | % | | 0.49 | % | | 0.48 | % |
| Net investment income | | 4.58 | % | | 4.43 | % | | 5.13 | % | | 6.05 | % | | 6.18 | % |
| |
| Supplemental data | | | | | | | | | | | | | | | |
| Net assets, end of year (000’s) | $ | 7,754,475 | | $ | 9,096,269 | | $ | 5,903,701 | | $ | 6,444,763 | | $ | 5,032,128 | |
| Portfolio turnover rate | | 44.81 | % | | 36.03 | % | | 37.60 | % | | 33.44 | % | | 35.83 | % |
aThe amount shown for a share outstanding throughout the period may not correlate with the Statement of Operations for the period due to the timing of sales and
repurchases of the Fund’s shares in relation to income earned and/or fluctuating fair value of the investments of the Fund.
bBased on average daily shares outstanding.
cBenefit of expense reduction rounds to less than 0.01%.
dBenefit of waiver and payments by affiliates rounds to less than 0.01%.
|
76 Annual Report | The accompanying notes are an integral part of these financial statements. franklintempleton.com
| | | | |
| | | FRANKLIN CUSTODIAN FUNDS |
| |
| |
| |
| |
| Statement of Investments, September 30, 2015 | | | | |
| |
| Franklin Income Fund | | | | |
| | | Shares/ | | |
| | Country | Warrants | | Value |
| Common Stocks and Other Equity Interests 51.3% | | | | |
| Consumer Discretionary 2.4% | | | | |
| Ford Motor Co. | United States | 55,000,000 | $ | 746,350,000 |
| General Motors Co. | United States | 10,000,000 | | 300,200,000 |
| Las Vegas Sands Corp. | United States | 897,400 | | 34,074,278 |
| Target Corp. | United States | 10,000,000 | | 786,600,000 |
| | | | | 1,867,224,278 |
| Consumer Staples 2.1% | | | | |
| The Coca-Cola Co. | United States | 14,000,000 | | 561,680,000 |
| PepsiCo Inc. | United States | 8,000,000 | | 754,400,000 |
| Sysco Corp. | United States | 9,000,000 | | 350,730,000 |
| | | | | 1,666,810,000 |
| Energy 8.3% | | | | |
| BP PLC, ADR | United Kingdom | 22,000,000 | | 672,320,000 |
| Canadian Oil Sands Ltd. | Canada | 15,000,000 | | 70,944,047 |
| Chevron Corp. | United States | 14,000,000 | | 1,104,320,000 |
| Exxon Mobil Corp. | United States | 11,000,000 | | 817,850,000 |
| a,bHalcon Resources Corp. | United States | 47,500,000 | | 25,175,000 |
| Occidental Petroleum Corp. | United States | 5,500,000 | | 363,825,000 |
| Royal Dutch Shell PLC, A, ADR | United Kingdom | 40,000,000 | | 1,895,600,000 |
| Schlumberger Ltd. | United States | 2,000,000 | | 137,940,000 |
| Spectra Energy Corp. | United States | 9,500,000 | | 249,565,000 |
| Total SA, B, ADR | France | 17,500,000 | | 782,425,000 |
| The Williams Cos. Inc. | United States | 7,500,000 | | 276,375,000 |
| Woodside Petroleum Ltd. | Australia | 6,000,000 | | 121,809,765 |
| | | | | 6,518,148,812 |
| Financials 2.7% | | | | |
| Bank of America Corp. | United States | 6,135,000 | | 95,583,300 |
| CBL & Associates Properties Inc. | United States | 5,000,000 | | 68,750,000 |
| Commonwealth Bank of Australia | Australia | 2,086,957 | | 106,500,046 |
| HCP Inc. | United States | 1,500,000 | | 55,875,000 |
| JPMorgan Chase & Co. | United States | 4,000,000 | | 243,880,000 |
| MetLife Inc. | United States | 9,331,207 | | 439,966,410 |
| Outfront Media Inc. | United States | 5,608,191 | | 116,650,373 |
| Royal Bank of Canada | Canada | 5,000,000 | | 276,543,117 |
| The Toronto-Dominion Bank | Canada | 3,000,000 | | 118,277,555 |
| U.S. Bancorp | United States | 12,000,000 | | 492,120,000 |
| Wells Fargo & Co. | United States | 3,000,000 | | 154,050,000 |
| | | | | 2,168,195,801 |
| Health Care 6.7% | | | | |
| AstraZeneca PLC | United Kingdom | 5,500,000 | | 347,791,049 |
| Bristol-Myers Squibb Co. | United States | 5,405,100 | | 319,981,920 |
| Eli Lilly & Co. | United States | 8,000,000 | | 669,520,000 |
| Johnson & Johnson | United States | 9,000,000 | | 840,150,000 |
| Medtronic PLC | United States | 4,000,000 | | 267,760,000 |
| Merck & Co. Inc. | United States | 17,000,000 | | 839,630,000 |
| Pfizer Inc. | United States | 30,000,000 | | 942,300,000 |
| Roche Holding AG | Switzerland | 1,500,000 | | 395,628,079 |
| Sanofi, ADR | France | 14,500,000 | | 688,315,000 |
| | | | | 5,311,076,048 |
| |
| |
| franklintempleton.com | | | | Annual Report | 77 |
| | | | |
| FRANKLIN CUSTODIAN FUNDS | | | | |
| STATEMENT OF INVESTMENTS | | | | |
| |
| |
| |
| |
| Franklin Income Fund (continued) | | | | |
| | | Shares/ | | |
| | Country | Warrants | | Value |
| Common Stocks and Other Equity Interests (continued) | | | | |
| Industrials 7.7% | | | | |
| The Boeing Co. | United States | 1,560,000 | $ | 204,282,000 |
| a,bCEVA Holdings LLC | United Kingdom | 91,371 | | 54,822,636 |
| Deere & Co. | United States | 6,500,000 | | 481,000,000 |
| General Electric Co. | United States | 68,000,000 | | 1,714,960,000 |
| Illinois Tool Works Inc. | United States | 3,000,000 | | 246,930,000 |
| Lockheed Martin Corp. | United States | 2,750,000 | | 570,102,500 |
| Raytheon Co. | United States | 6,500,000 | | 710,190,000 |
| Republic Services Inc. | United States | 10,000,000 | | 412,000,000 |
| Union Pacific Corp. | United States | 5,000,000 | | 442,050,000 |
| United Technologies Corp. | United States | 9,000,000 | | 800,910,000 |
| Waste Management Inc. | United States | 8,000,000 | | 398,480,000 |
| | | | | 6,035,727,136 |
| Information Technology 2.2% | | | | |
| Cisco Systems Inc. | United States | 6,133,000 | | 160,991,250 |
| a,cFirst Data Holdings Inc., B | United States | 21,666,666 | | 112,433,725 |
| Intel Corp. | United States | 13,244,000 | | 399,174,160 |
| Microsoft Corp. | United States | 12,180,000 | | 539,086,800 |
| QUALCOMM Inc. | United States | 2,500,000 | | 134,325,000 |
| Texas Instruments Inc. | United States | 8,000,000 | | 396,160,000 |
| | | | | 1,742,170,935 |
| Materials 6.7% | | | | |
| bAgrium Inc. | Canada | 7,500,000 | | 671,250,000 |
| BASF SE | Germany | 5,250,000 | | 400,896,619 |
| BHP Billiton PLC | Australia | 37,500,000 | | 569,929,240 |
| The Dow Chemical Co. | United States | 27,080,000 | | 1,148,192,000 |
| E. I. du Pont de Nemours and Co. | United States | 16,000,000 | | 771,200,000 |
| Goldcorp Inc. | Canada | 12,332,770 | | 154,406,281 |
| The Mosaic Co. | United States | 12,000,000 | | 373,320,000 |
| Newmont Mining Corp. | United States | 3,350,000 | | 53,834,500 |
| Praxair Inc. | United States | 3,000,000 | | 305,580,000 |
| Rio Tinto PLC, ADR | United Kingdom | 24,347,600 | | 823,435,832 |
| | | | | 5,272,044,472 |
| Telecommunication Services 2.4% | | | | |
| AT&T Inc. | United States | 15,000,000 | | 488,700,000 |
| BCE Inc. | Canada | 5,500,000 | | 225,169,584 |
| CenturyLink Inc. | United States | 3,500,000 | | 87,920,000 |
| Telstra Corp. Ltd. | Australia | 30,000,000 | | 118,104,525 |
| Telus Corp. | Canada | 2,500,000 | | 78,795,488 |
| Verizon Communications Inc. | United States | 20,000,000 | | 870,200,000 |
| Vodafone Group PLC | United Kingdom | 15,727,271 | | 49,576,844 |
| | | | | 1,918,466,441 |
| Utilities 10.1% | | | | |
| Ameren Corp. | United States | 4,750,000 | | 200,782,500 |
| American Electric Power Co. Inc. | United States | 6,750,000 | | 383,805,000 |
| Dominion Resources Inc. | United States | 10,000,000 | | 703,800,000 |
| Duke Energy Corp. | United States | 10,000,000 | | 719,400,000 |
| aDynegy Inc. | United States | 6,225,800 | | 128,687,286 |
| aDynegy Inc., wts., 10/02/17 | United States | 1,143,273 | | 1,314,764 |
| |
| |
| 78 | Annual Report | | | | franklintempleton.com |
| | | | |
| | | FRANKLIN CUSTODIAN FUNDS |
| | | STATEMENT OF INVESTMENTS |
| |
| |
| |
| |
| Franklin Income Fund (continued) | | | | |
| | | Shares/ | | |
| | Country | Warrants | | Value |
| Common Stocks and Other Equity Interests (continued) | | | | |
| Utilities (continued) | | | | |
| Edison International | United States | 2,350,000 | $ | 148,214,500 |
| Exelon Corp. | United States | 25,000,000 | | 742,500,000 |
| FirstEnergy Corp. | United States | 4,000,000 | | 125,240,000 |
| NextEra Energy Inc. | United States | 5,500,000 | | 536,525,000 |
| bPG&E Corp. | United States | 24,910,000 | | 1,315,248,000 |
| Pinnacle West Capital Corp. | United States | 2,750,000 | | 176,385,000 |
| PPL Corp. | United States | 9,000,000 | | 296,010,000 |
| Public Service Enterprise Group Inc. | United States | 8,500,000 | | 358,360,000 |
| Sempra Energy | United States | 5,200,000 | | 502,944,000 |
| The Southern Co. | United States | 22,500,000 | | 1,005,750,000 |
| SSE PLC | United Kingdom | 6,000,000 | | 135,739,565 |
| Xcel Energy Inc. | United States | 14,000,000 | | 495,740,000 |
| | | | | 7,976,445,615 |
| Total Common Stocks and Other Equity Interests | | | | |
| (Cost $39,646,791,654) | | | | 40,476,309,538 |
| dEquity-Linked Securities 10.2% | | | | |
| Consumer Discretionary 1.9% | | | | |
| eBank of America Corp. into General Motors Co., 8.00%, 144A | United States | 2,820,000 | | 85,393,548 |
| eCredit Suisse New York into Target Corp., 6.00%, 144A | United States | 1,870,000 | | 145,002,605 |
| eCredit Suisse New York into Target Corp., 6.50%, 144A | United States | 1,382,000 | | 105,815,456 |
| eDeutsche Bank AG/London into Ford Motor Co., 7.00%, 144A | United States | 12,500,000 | | 170,898,750 |
| eDeutsche Bank AG/London into General Motors Co., 8.00%, 144A | United States | 2,800,000 | | 84,587,160 |
| eThe Goldman Sachs Group Inc. into Ford Motor Co., 7.50%, 144A | United States | 15,360,000 | | 211,015,680 |
| eThe Goldman Sachs Group Inc. into General Motors Co., 6.50%, | | | | |
| 144A | United States | 6,000,000 | | 181,344,000 |
| eJPMorgan Chase & Co. into Las Vegas Sands Corp., 9.00%, senior | | | | |
| note, 144A | United States | 1,817,000 | | 71,664,660 |
| eMerrill Lynch International & Co. CV into General Motors Co., 8.00%, | | | | |
| 144A | United States | 6,590,000 | | 191,595,024 |
| eMerrill Lynch International & Co. CV into Target Corp., 6.00%, 144A | United States | 2,455,000 | | 192,892,787 |
| eUBS AG into Las Vegas Sands Corp., 9.00%, 144A | United States | 2,494,000 | | 98,231,428 |
| | | | | 1,538,441,098 |
| Consumer Staples 0.1% | | | | |
| eBarclays Bank PLC into Whole Foods Market Inc., 7.00%, 144A | United States | 3,645,000 | | 119,817,711 |
| Energy 1.5% | | | | |
| eCitigroup Inc. into Anadarko Petroleum Corp., 6.50%, 144A | United States | 2,130,000 | | 135,008,772 |
| eCitigroup Inc. into Anadarko Petroleum Corp., 8.00%, 144A | United States | 1,628,000 | | 100,517,930 |
| eCredit Suisse New York into Baker Hughes Inc., 6.00%, 144A | United States | 2,025,000 | | 104,250,442 |
| eCredit Suisse New York into Halliburton Co., 8.00%, 144A | United States | 1,900,000 | | 68,437,430 |
| eCredit Suisse New York into Schlumberger Ltd., 6.00%, 144A | United States | 1,970,000 | | 137,790,665 |
| eDeutsche Bank AG/London into Anadarko Petroleum Corp., 9.50%, | | | | |
| 144A | United States | 1,900,000 | | 119,695,060 |
| eJPMorgan Chase & Co. into Devon Energy Corp., 7.50%, 144A | United States | 2,516,000 | | 96,524,579 |
| eJPMorgan Chase & Co. into Schlumberger Ltd., 6.00%, 144A | United States | 1,045,000 | | 72,870,045 |
| eRoyal Bank of Canada into Cabot Oil & Gas Corp., 6.50%, 144A | United States | 4,790,000 | | 105,888,698 |
| eRoyal Bank of Canada into Halliburton Co., 6.00%, 144A | United States | 3,125,000 | | 113,589,062 |
| eUBS AG into Halliburton Co., 7.00%, 144A | United States | 4,750,000 | | 170,368,250 |
| | | | | 1,224,940,933 |
| |
| |
| franklintempleton.com | | | | Annual Report | 79 |
FRANKLIN CUSTODIAN FUNDS
STATEMENT OF INVESTMENTS
| | | | | |
| Franklin Income Fund (continued) | | | | | |
| | | | Shares/ | | |
| | | Country | Warrants | | Value |
| dEquity-Linked Securities (continued) | | | | | |
| Financials 0.7% | | | | | |
| eBarclays Bank PLC into Bank of America Corp., 6.00%, 144A | | United States | 10,700,000 | $ | 167,706,450 |
| eDeutsche Bank AG/London into Bank of America Corp., 7.00%, | | | | | |
| 144A | | United States | 6,370,000 | | 98,455,357 |
| eDeutsche Bank AG/London into MetLife Inc., 6.50%, 144A | | United States | 3,000,000 | | 140,403,000 |
| eRoyal Bank of Canada into Metlife Inc., 6.00%, 144A | | United States | 2,950,000 | | 138,385,680 |
| | | | | | 544,950,487 |
| Health Care 0.6% | | | | | |
| eBarclays Bank PLC into Pfizer Inc., 6.00%, 144A | | United States | 6,057,000 | | 190,392,709 |
| eJPMorgan Chase & Co. into Merck & Co. Inc., 6.00%, senior note, | | | | | |
| 144A | | United States | 3,203,000 | | 161,774,562 |
| eRoyal Bank of Canada into Eli Lilly & Co., 6.50%, 144A | | United States | 1,197,000 | | 97,036,122 |
| | | | | | 449,203,393 |
| Industrials 0.6% | | | | | |
| eBarclays Bank PLC into The Boeing Co., 5.50%, 144A | | United States | 650,000 | | 85,568,600 |
| eThe Goldman Sachs Group Inc. into General Electric Co., 5.50%, | | | | | |
| 144A | | United States | 14,423,000 | | 362,725,469 |
| | | | | | 448,294,069 |
| Information Technology 3.1% | | | | | |
| eBank of America Corp. into QUALCOMM Inc., 6.00%, 144A | | United States | 1,400,000 | | 76,178,760 |
| eBarclays Bank PLC into Xilinx Inc., 6.00%, 144A | | United States | 2,535,000 | | 107,469,551 |
| eCitigroup Inc. into Apple Inc., 7.00%, 144A | | United States | 802,000 | | 88,667,516 |
| eCitigroup Inc. into Intel Corp., 7.50%, 144A | | United States | 6,864,000 | | 203,127,725 |
| eCitigroup Inc. into Microsoft Corp., 6.00%, 144A | | United States | 4,254,000 | | 187,633,730 |
| eCredit Suisse New York into Cisco Systems Inc., 6.00%, 144A | | United States | 5,400,000 | | 142,016,220 |
| eCredit Suisse New York into Cisco Systems Inc., 6.00%, 144A | | United States | 6,600,000 | | 175,287,420 |
| eCredit Suisse New York into QUALCOMM Inc., 6.00%, 144A | | United States | 2,910,000 | | 158,519,340 |
| eDeutsche Bank AG/London into Cisco Systems Inc., 6.50%, 144A | | United States | 7,900,000 | | 205,851,090 |
| eThe Goldman Sachs Group Inc. into Apple Inc., 7.50%, 144A | | United States | 1,561,000 | | 167,958,917 |
| eThe Goldman Sachs Group Inc. into Intel Corp., 6.50%, 144A | | United States | 5,350,000 | | 163,475,670 |
| eJPMorgan Chase & Co. into Google Inc., 4.50%, C, 144A | | United States | 524,000 | | 288,803,124 |
| eJPMorgan Chase & Co. into Microsoft Corp., 6.00%, senior note, | | | | | |
| 144A | | United States | 4,330,000 | | 192,091,790 |
| eRoyal Bank of Canada into Microsoft Corp., 5.50%, 144A | | United States | 3,100,000 | | 137,027,750 |
| eUBS AG into Intel Corp., 7.50%, 144A | | United States | 5,100,000 | | 151,108,920 |
| | | | | | 2,445,217,523 |
| Materials 1.6% | | | | | |
| eBarclays Bank PLC into Alcoa Inc., 8.50%, 144A | | United States | 8,495,000 | | 86,343,690 |
| eCitigroup Inc. into Freeport-McMoRan Inc., 10.00%, 144A | | United States | 9,920,000 | | 96,430,832 |
| eCitigroup Inc. into Freeport-McMoRan Inc., 10.00%, 144A | | United States | 7,857,000 | | 82,080,508 |
| eCitigroup Inc. into Rio Tinto PLC, 9.00%, 144A | | United Kingdom | 4,275,000 | | 146,087,010 |
| eDeutsche Bank AG/London into AngloGold Ashanti Ltd., 10.00%, | | | | | |
| 144A | | South Africa | 10,300,000 | | 84,311,886 |
| eDeutsche Bank AG/London into LyondellBasell IndustriesNV, 9.00%, A, | | | | | |
| 144A | | United States | 1,846,000 | | 148,262,782 |
| eDeutsche Bank AG/London into The Dow Chemical Co., 7.50%, | | | | | |
| 144A | | United States | 5,700,000 | | 237,714,510 |
| eJPMorgan Chase & Co. into LyondellBasell Industries NV, 7.00%, A, | | | | | |
| 144A | | United States | 1,429,000 | | 119,021,124 |
| |
| |
| 80 | Annual Report | | | | | franklintempleton.com |
FRANKLIN CUSTODIAN FUNDS
STATEMENT OF INVESTMENTS
| | | | | |
| Franklin Income Fund (continued) | | | | | |
| | | | Shares/ | | |
| | | Country | Warrants | | Value |
| dEquity-Linked Securities (continued) | | | | | |
| Materials (continued) | | | | | |
| eRoyal Bank of Canada into Alcoa Inc., 7.00%, 144A | | United States | 4,150,000 | $ | 40,464,243 |
| eRoyal Bank of Canada into LyondellBasell Industries NV, 8.00%, A, | | | | | |
| 144A | | United States | 2,308,000 | | 190,066,569 |
| | | | | | 1,230,783,154 |
| Utilities 0.1% | | | | | |
| eThe Goldman Sachs Group Inc. into Calpine Corp., 6.00%, 144A | | United States | 4,895,000 | | 74,331,064 |
| Total Equity-Linked Securities | | | | | |
| (Cost $9,412,955,311) | | | | | 8,075,979,432 |
| Convertible Preferred Stocks 3.3% | | | | | |
| Consumer Discretionary 0.2% | | | | | |
| Fiat Chrysler Automobiles NV, 7.875%, cvt. pfd. | | United Kingdom | 1,100,000 | | 130,361,000 |
| Energy 0.1% | | | | | |
| Chesapeake Energy Corp., 5.75%, cvt. pfd. | | United States | 123,292 | | 49,008,570 |
| bHalcon Resources Corp., 5.75%, cvt. pfd., A | | United States | 37,000 | | 4,194,875 |
| ePenn Virginia Corp., 6.00%, cvt. pfd., 144A | | United States | 700,000 | | 5,658,170 |
| Rex Energy Corp., 6.00%, cvt. pfd., A | | United States | 350,000 | | 11,725,000 |
| Sanchez Energy Corp., 6.50%, cvt. pfd., B | | United States | 1,200,000 | | 24,468,000 |
| | | | | | 95,054,615 |
| Financials 1.8% | | | | | |
| Bank of America Corp., 7.25%, cvt. pfd., L | | United States | 697,218 | | 750,903,786 |
| FelCor Lodging Trust Inc., 7.80%, cvt. pfd., A | | United States | 2,800,000 | | 69,524,000 |
| aFNMA, 5.375%, cvt. pfd. | | United States | 4,250 | | 70,214,250 |
| Wells Fargo & Co., 7.50%, cvt. pfd., A | | United States | 477,500 | | 557,720,000 |
| | | | | | 1,448,362,036 |
| Health Care 0.1% | | | | | |
| Allergan PLC, 5.50%, cvt. pfd. | | United States | 75,000 | | 70,759,500 |
| Industrials 0.1% | | | | | |
| a,bCEVA Holdings LLC, cvt. pfd., A-1 | | United Kingdom | 2,897 | | 2,390,231 |
| a,bCEVA Holdings LLC, cvt. pfd., A-2 | | United Kingdom | 110,565 | | 66,339,048 |
| | | | | | 68,729,279 |
| Materials 0.1% | | | | | |
| Alcoa Inc., 5.375%, cvt. pfd. | | United States | 3,056,375 | | 102,082,925 |
| Telecommunication Services 0.1% | | | | | |
| T-Mobile US Inc., 5.50%, cvt. pfd. | | United States | 777,800 | | 53,714,868 |
| Utilities 0.8% | | | | | |
| Dominion Resources Inc., 6.125%, cvt. pfd., A | | United States | 1,490,000 | | 82,411,900 |
| Dominion Resources Inc., 6.375%, cvt. pfd., A | | United States | 2,500,000 | | 124,025,000 |
| Dominion Resources Inc., 6.00%, cvt. pfd., B | | United States | 1,490,000 | | 83,410,200 |
| Exelon Corp., 6.50%, cvt. pfd. | | United States | 2,000,000 | | 87,300,000 |
| NextEra Energy Inc., 5.799%, cvt. pfd. | | United States | 1,000,000 | | 53,210,000 |
| NextEra Energy Inc., 6.371%, cvt. pfd. | | United States | 3,650,000 | | 187,792,500 |
| | | | | | 618,149,600 |
| Total Convertible Preferred Stocks | | | | | |
| (Cost $2,845,537,590) | | | | | 2,587,213,823 |
| |
| |
| |
| franklintempleton.com | | | | | Annual Report | 81 |
FRANKLIN CUSTODIAN FUNDS
STATEMENT OF INVESTMENTS
| | | | |
| Franklin Income Fund (continued) | | | | |
| | | Shares/ | | |
| | Country | Warrants | | Value |
| Preferred Stocks 0.3% | | | | |
| Financials 0.3% | | | | |
| aFHLMC, 8.375%, pfd., Z | United States | 12,390,000 | $ | 60,711,000 |
| aFNMA, 8.25%, pfd. | United States | 10,000,000 | | 48,500,000 |
| Morgan Stanley, 6.375%, pfd., I | United States | 3,900,000 | | 99,216,000 |
| Total Preferred Stocks (Cost $646,150,000) | | | | 208,427,000 |
| |
| | | Principal | | |
| | | Amount* | | |
| Convertible Bonds 0.4% | | | | |
| Energy 0.3% | | | | |
| e,fAmerican Energy-Permian Basin LLC, cvt., 144A, PIK, 8.00%, | | | | |
| 5/01/22 | United States | 40,000,000 | | 12,000,000 |
| Cobalt International Energy Inc., cvt., | | | | |
| senior bond, 3.125%, 5/15/24 | United States | 246,789,000 | | 156,402,529 |
| senior note, 2.625%, 12/01/19 | United States | 70,000,000 | | 49,875,000 |
| SandRidge Energy Inc., cvt., senior note, | | | | |
| 8.125%, 10/16/22 | United States | 60,000,000 | | 13,312,500 |
| 7.50%, 2/16/23 | United States | 50,000,000 | | 10,593,750 |
| Stone Energy Corp., cvt., senior note, 1.75%, 3/01/17 | United States | 71,500,000 | | 60,551,562 |
| | | | | 302,735,341 |
| Health Care 0.1% | | | | |
| eImpax Laboratories Inc., cvt., senior note, 144A, 2.00%, 6/15/22 | United States | 55,000,000 | | 49,912,500 |
| Total Convertible Bonds (Cost $577,711,891) | | | | 352,647,841 |
| Corporate Bonds 29.8% | | | | |
| Consumer Discretionary 4.7% | | | | |
| e,g24 Hour Holdings III LLC, senior note, 144A, 8.00%, 6/01/22 | United States | 79,000,000 | | 61,225,000 |
| eAltice Financing SA, secured note, 144A, 6.625%, 2/15/23 | Luxembourg | 35,000,000 | | 33,775,000 |
| eAltice Luxembourg SA, | | | | |
| senior bond, 144A, 7.625%, 2/15/25 | Luxembourg | 20,000,000 | | 17,637,500 |
| senior secured note, 144A, 7.75%, 5/15/22 | Luxembourg | 25,000,000 | | 22,875,000 |
| AMC Networks Inc., 4.75%, 12/15/22 | United States | 40,000,000 | | 37,850,000 |
| eArgos Merger Sub Inc., senior note, 144A, 7.125%, 3/15/23 | United States | 49,600,000 | | 50,282,000 |
| CCO Holdings LLC/CCO Holdings Capital Corp., | | | | |
| senior bond, 5.25%, 9/30/22 | United States | 57,800,000 | | 54,332,000 |
| senior bond, 5.125%, 2/15/23 | United States | 170,000,000 | | 157,250,000 |
| senior bond, 5.75%, 9/01/23 | United States | 67,000,000 | | 63,901,250 |
| senior bond, 5.75%, 1/15/24 | United States | 168,000,000 | | 160,860,000 |
| esenior note, 144A, 5.125%, 5/01/23 | United States | 50,000,000 | | 46,156,000 |
| esenior note, 144A, 5.875%, 5/01/27 | United States | 40,000,000 | | 37,200,000 |
| eCCO Safari II LLC, senior secured note, 144A, 4.908%, 7/23/25 | United States | 90,000,000 | | 89,742,870 |
| Chrysler Group LLC/CG Co-Issuer Inc., senior secured note, 8.25%, | | | | |
| 6/15/21 | United States | 30,000,000 | | 31,911,000 |
| Cinemark USA Inc., | | | | |
| senior bond, 4.875%, 6/01/23 | United States | 23,000,000 | | 22,108,750 |
| senior note, 5.125%, 12/15/22 | United States | 50,000,000 | | 49,187,500 |
| gCumulus Media Holdings Inc., senior note, 7.75%, 5/01/19 | United States | 50,000,000 | | 36,062,500 |
| DISH DBS Corp., | | | | |
| senior bond, 5.00%, 3/15/23 | United States | 240,000,000 | | 201,600,000 |
| senior note, 5.125%, 5/01/20 | United States | 30,000,000 | | 27,900,000 |
| senior note, 5.875%, 7/15/22 | United States | 158,000,000 | | 139,830,000 |
| senior note, 5.875%, 11/15/24 | United States | 82,100,000 | | 69,990,250 |
| |
| 82 | Annual Report | | | | franklintempleton.com |
| | | | | |
| | | | FRANKLIN CUSTODIAN FUNDS |
| | | | STATEMENT OF INVESTMENTS |
| |
| |
| |
| |
| Franklin Income Fund (continued) | | | | | |
| | | | Principal | | |
| | | Country | Amount* | | Value |
| Corporate Bonds (continued) | | | | | |
| Consumer Discretionary (continued) | | | | | |
| Dollar General Corp., senior bond, 3.25%, 4/15/23 | | United States | 170,000,000 | $ | 162,324,160 |
| Fiat Chrysler Automobiles NV, senior note, 5.25%, 4/15/23 | | United Kingdom | 67,600,000 | | 63,079,250 |
| eHD Supply Inc., first lien, 144A, 5.25%, 12/15/21 | | United States | 39,900,000 | | 40,249,125 |
| iHeartCommunications Inc., | | | | | |
| senior note, 10.00%, 1/15/18 | | United States | 65,000,000 | | 34,693,750 |
| senior note, 10.625%, 3/15/23 | | United States | 100,000,000 | | 84,750,000 |
| fsenior note, PIK, 14.00%, 2/01/21 | | United States | 27,282,147 | | 11,404,070 |
| senior secured bond, first lien, 9.00%, 3/01/21 | | United States | 329,775,000 | | 276,186,563 |
| senior secured note, first lien, 9.00%, 12/15/19 | | United States | 260,800,000 | | 223,962,000 |
| senior secured note, first lien, 11.25%, 3/01/21 | | United States | 50,000,000 | | 43,187,500 |
| senior secured note, first lien, 9.00%, 9/15/22 | | United States | 109,400,000 | | 90,118,250 |
| eInternational Game Technology PLC, | | | | | |
| senior note, 144A, 5.625%, 2/15/20 | | United States | 50,000,000 | | 49,312,500 |
| senior secured bond, 144A, 6.50%, 2/15/25 | | United States | 84,000,000 | | 76,230,000 |
| senior secured note, 144A, 6.25%, 2/15/22 | | United States | 46,600,000 | | 43,512,750 |
| KB Home, | | | | | |
| senior bond, 7.50%, 9/15/22 | | United States | 35,000,000 | | 35,787,500 |
| senior note, 7.00%, 12/15/21 | | United States | 40,000,000 | | 40,300,000 |
| MGM Resorts International, senior note, | | | | | |
| 5.25%, 3/31/20 | | United States | 18,200,000 | | 17,858,750 |
| 6.75%, 10/01/20 | | United States | 27,450,000 | | 28,479,375 |
| 7.75%, 3/15/22 | | United States | 80,000,000 | | 85,500,000 |
| 6.00%, 3/15/23 | | United States | 35,000,000 | | 34,037,500 |
| eNielsen Finance LLC/Co., senior note, 144A, 5.00%, 4/15/22 | | United States | 58,000,000 | | 56,296,250 |
| eNumericable Group SA, senior note, first lien, 144A, 6.00%, 5/15/22 | | France | 30,900,000 | | 29,818,500 |
| Outfront Media Capital LLC/Corp., senior bond, | | | | | |
| 5.625%, 2/15/24 | | United States | 22,700,000 | | 23,097,250 |
| 5.875%, 3/15/25 | | United States | 30,000,000 | | 30,637,500 |
| Quebecor Media Inc., senior bond, 5.75%, 1/15/23 | | Canada | 70,300,000 | | 69,509,125 |
| Regal Entertainment Group, senior note, 5.75%, 3/15/22 | | United States | 50,000,000 | | 49,312,500 |
| eShea Homes LP/Shea Homes Funding Corp., | | | | | |
| senior bond, 144A, 6.125%, 4/01/25 | | United States | 45,000,000 | | 46,237,500 |
| senior note, 144A, 5.875%, 4/01/23 | | United States | 45,000,000 | | 46,237,500 |
| eSirius XM Radio Inc., | | | | | |
| senior bond, 144A, 6.00%, 7/15/24 | | United States | 120,000,000 | | 120,900,000 |
| senior note, 144A, 4.625%, 5/15/23 | | United States | 94,400,000 | | 88,618,000 |
| eUnivision Communications Inc., senior secured note, first lien, 144A, | | | | | |
| 5.125%, | | | | | |
| 5/15/23 | | United States | 124,500,000 | | 118,897,500 |
| 2/15/25 | | United States | 35,500,000 | | 33,370,000 |
| eVirgin Media Secured Finance PLC, senior secured bond, first lien, | | | | | |
| 144A, 5.50%, 1/15/25 | | United Kingdom | 80,000,000 | | 78,050,000 |
| eWynn Las Vegas LLC/Capital Corp., senior bond, 144A, 4.25%, | | | | | |
| 5/30/23 | | United States | 43,300,000 | | 35,939,000 |
| eWynn Macau Ltd., senior note, 144A, 5.25%, 10/15/21 | | Macau | 25,000,000 | | 21,812,500 |
| | | | | | 3,701,382,788 |
| Consumer Staples 0.7% | | | | | |
| Cott Beverages Inc., senior note, | | | | | |
| 6.75%, 1/01/20 | | United States | 40,100,000 | | 41,303,000 |
| 5.375%, 7/01/22 | | United States | 49,377,000 | | 47,956,917 |
| |
| |
| franklintempleton.com | | | | | Annual Report | 83 |
FRANKLIN CUSTODIAN FUNDS
STATEMENT OF INVESTMENTS
| | | | |
| Franklin Income Fund (continued) | | | | |
| | | Principal | | |
| | Country | Amount* | | Value |
| Corporate Bonds (continued) | | | | |
| Consumer Staples (continued) | | | | |
| eESAL GmbH, senior note, 144A, 6.25%, 2/05/23 | Brazil | 50,000,000 | $ | 46,337,750 |
| eJBS USA LLC/Finance Inc., | | | | |
| senior bond, 144A, 5.875%, 7/15/24 | United States | 75,000,000 | | 70,687,500 |
| senior note, 144A, 7.25%, 6/01/21 | United States | 88,500,000 | | 92,261,250 |
| senior note, 144A, 5.75%, 6/15/25 | United States | 50,000,000 | | 46,000,000 |
| ePost Holdings Inc., senior note, 144A, | | | | |
| 6.75%, 12/01/21 | United States | 33,000,000 | | 33,082,500 |
| 7.75%, 3/15/24 | United States | 50,000,000 | | 51,375,000 |
| 8.00%, 7/15/25 | United States | 22,500,000 | | 23,217,188 |
| U.S. Foods Inc., 8.50%, 6/30/19 | United States | 70,000,000 | | 72,625,000 |
| | | | | 524,846,105 |
| Energy 5.8% | | | | |
| Access Midstream Partner LP/ACMP Finance Corp., senior note, | | | | |
| 4.875%, 5/15/23 | United States | 27,000,000 | | 25,013,772 |
| e,fAmerican Energy-Woodford LLC/AEW Finance Corp., senior secured | | | | |
| note, second lien, 144A, PIK, 12/30/20 | United States | 35,000,000 | | 14,922,481 |
| Antero Resources Corp., senior note, | | | | |
| 6.00%, 12/01/20 | United States | 42,000,000 | | 39,060,000 |
| 5.375%, 11/01/21 | United States | 75,000,000 | | 66,375,000 |
| 5.125%, 12/01/22 | United States | 112,500,000 | | 97,312,500 |
| Arch Coal Inc., senior note, 7.00%, 6/15/19 | United States | 111,000,000 | | 8,880,000 |
| Atlas Energy Holdings Operating Co. LLC/Atlas Resource Finance | | | | |
| Corp., senior note, 9.25%, 8/15/21 | United States | 35,000,000 | | 14,875,000 |
| Berry Petroleum Co., senior bond, 6.375%, 9/15/22 | United States | 28,000,000 | | 8,522,640 |
| Bill Barrett Corp., senior note, | | | | |
| 7.625%, 10/01/19 | United States | 195,000,000 | | 141,375,000 |
| 7.00%, 10/15/22 | United States | 135,000,000 | | 88,425,000 |
| California Resources Corp., | | | | |
| senior bond, 6.00%, 11/15/24 | United States | 127,000,000 | | 76,676,250 |
| senior note, 5.00%, 1/15/20 | United States | 125,000,000 | | 81,015,000 |
| senior note, 5.50%, 9/15/21 | United States | 120,000,000 | | 73,800,000 |
| Calumet Specialty Products Partners LP/Calumet Finance Corp., | | | | |
| senior note, 6.50%, 4/15/21 | United States | 39,800,000 | | 36,019,000 |
| CGG SA, senior note, | | | | |
| 6.50%, 6/01/21 | France | 98,096,000 | | 56,601,392 |
| 6.875%, 1/15/22 | France | 58,600,000 | | 32,889,250 |
| CHC Helicopter SA, senior secured note, first lien, 9.25%, 10/15/20 | Canada | 128,078,100 | | 72,364,127 |
| Chesapeake Energy Corp., senior note, | | | | |
| 7.25%, 12/15/18 | United States | 92,065,000 | | 76,644,112 |
| 5.375%, 6/15/21 | United States | 100,000,000 | | 67,250,000 |
| 4.875%, 4/15/22 | United States | 135,000,000 | | 88,762,500 |
| 5.75%, 3/15/23 | United States | 183,150,000 | | 120,363,799 |
| Denbury Resources Inc., | | | | |
| senior bond, 6.375%, 8/15/21 | United States | 64,112,000 | | 40,711,120 |
| senior note, 5.50%, 5/01/22 | United States | 195,000,000 | | 116,512,500 |
| senior sub. note, 4.625%, 7/15/23 | United States | 142,975,000 | | 77,921,375 |
| Energy Transfer Equity LP, | | | | |
| senior bond, 5.875%, 1/15/24 | United States | 57,300,000 | | 51,856,500 |
| senior secured bond, first lien, 5.50%, 6/01/27 | United States | 150,000,000 | | 125,250,000 |
|
84 Annual Report
franklintempleton.com
FRANKLIN CUSTODIAN FUNDS
STATEMENT OF INVESTMENTS
| | | | | |
| Franklin Income Fund (continued) | | | | | |
| | | Principal | | | |
| | Country | Amount* | | | Value |
| Corporate Bonds (continued) | | | | | |
| Energy (continued) | | | | | |
| Energy XXI Gulf Coast Inc., | | | | | |
| senior note, 9.25%, 12/15/17 | United States | 374,500,000 | | $ | 80,517,500 |
| senior note, 6.875%, 3/15/24 | United States | 200,000,000 | | | 34,500,000 |
| esenior secured note, second lien, 144A, 11.00%, 3/15/20 | United States | 158,700,000 | | | 75,382,500 |
| eEnQuest PLC, senior note, 144A, 7.00%, 4/15/22 | United Kingdom | 85,000,000 | | | 53,125,000 |
| EPL Oil & Gas Inc., senior note, 8.25%, 2/15/18 | United States | 166,278,000 | | | 41,569,500 |
| EXCO Resources Inc., senior note, 7.50%, 9/15/18 | United States | 40,000,000 | | | 10,700,000 |
| eFerrellgas LP/Ferrellgas Finance Corp., senior note, 144A, 6.75%, | | | | | |
| 6/15/23 | United States | 56,400,000 | | | 51,606,000 |
| eGoodrich Petroleum Corp., second lien, 144A, 8.00%, 3/15/18 | United States | 70,000 | h | | 52,500,000 |
| bHalcon Resources Corp., | | | | | |
| senior note, 9.75%, 7/15/20 | United States | 6,500,000 | | | 2,242,500 |
| senior note, 8.875%, 5/15/21 | United States | 13,375,000 | | | 4,079,375 |
| esenior note, 144A, 8.625%, 2/01/20 | United States | 130,000,000 | | | 108,550,000 |
| esenior secured note, third lien, 144A, 13.00%, 2/15/22 | United States | 341,510,000 | | | 220,700,837 |
| e,iHercules Offshore Inc., senior note, 144A, | | | | | |
| 10.25%, 4/01/19 | United States | 60,000,000 | | | 12,900,000 |
| 8.75%, 7/15/21 | United States | 22,000,000 | | | 4,730,000 |
| 7.50%, 10/01/21 | United States | 35,000,000 | | | 7,175,000 |
| Kinder Morgan Inc., | | | | | |
| senior note, MTN, 7.75%, 1/15/32 | United States | 123,000,000 | | | 129,654,915 |
| esenior secured bond, first lien, 144A, 5.625%, 11/15/23 | United States | 125,300,000 | | | 123,092,715 |
| Linn Energy LLC/Finance Corp., senior note, | | | | | |
| 6.50%, 5/15/19 | United States | 300,000,000 | | | 84,000,000 |
| 6.25%, 11/01/19 | United States | 275,000,000 | | | 74,250,000 |
| 8.625%, 4/15/20 | United States | 165,000,000 | | | 44,962,500 |
| 7.75%, 2/01/21 | United States | 90,000,000 | | | 21,150,000 |
| 6.50%, 9/15/21 | United States | 55,000,000 | | | 11,687,500 |
| Magnum Hunter Resources Corp., senior note, 9.75%, 5/15/20 | United States | 59,000,000 | | | 26,845,000 |
| eMcDermott International Inc., second lien, 144A, 8.00%, 5/01/21 | United States | 55,000,000 | | | 46,200,000 |
| eNGPL PipeCo LLC, secured note, 144A, 7.119%, 12/15/17 | United States | 68,000,000 | | | 64,940,000 |
| Niska Gas Storage Canada ULC/Niska Gas Storage Canada Finance | | | | | |
| Corp., senior note, 6.50%, 4/01/19 | United States | 72,700,000 | | | 64,339,500 |
| Oasis Petroleum Inc., senior note, | | | | | |
| 6.50%, 11/01/21 | United States | 25,500,000 | | | 20,208,750 |
| 6.875%, 3/15/22 | United States | 71,500,000 | | | 56,485,000 |
| e,jPeabody Energy Corp., second lien, 144A, 10.00%, 3/15/22 | United States | 100,000,000 | | | 38,125,000 |
| Penn Virginia Corp., senior note, 8.50%, 5/01/20 | United States | 107,700,000 | | | 27,732,750 |
| PetroQuest Energy Inc., senior note, 10.00%, 9/01/17 | United States | 60,000,000 | | | 53,400,000 |
| Rex Energy Corp., senior note, | | | | | |
| 8.875%, 12/01/20 | United States | 98,000,000 | | | 51,450,000 |
| 6.25%, 8/01/22 | United States | 70,000,000 | | | 28,350,000 |
| Rice Energy Inc., senior note, 6.25%, 5/01/22 | United States | 68,000,000 | | | 60,987,840 |
| Sabine Pass Liquefaction LLC, | | | | | |
| first lien, 6.25%, 3/15/22 | United States | 55,000,000 | | | 51,425,000 |
| first lien, 5.625%, 4/15/23 | United States | 149,450,000 | | | 134,878,625 |
| senior secured note, first lien, 5.75%, 5/15/24 | United States | 100,000,000 | | | 89,500,000 |
| esenior secured note, first lien, 144A, 5.625%, 3/01/25 | United States | 59,300,000 | | | 52,406,375 |
| Sanchez Energy Corp., senior note, | | | | | |
| 7.75%, 6/15/21 | United States | 141,100,000 | | | 105,119,500 |
| 6.125%, 1/15/23 | United States | 150,000,000 | | | 101,250,000 |
| |
| |
| franklintempleton.com | | | | | Annual Report | 85 |
FRANKLIN CUSTODIAN FUNDS
STATEMENT OF INVESTMENTS
| | | | |
| Franklin Income Fund (continued) | | | | |
| | | Principal | | |
| | Country | Amount* | | Value |
| Corporate Bonds (continued) | | | | |
| Energy (continued) | | | | |
| SandRidge Energy Inc., | | | | |
| esecond lien, 144A, 8.75%, 6/01/20 | United States | 137,615,000 | $ | 83,687,122 |
| senior note, 8.75%, 1/15/20 | United States | 120,000,000 | | 28,800,000 |
| senior note, 7.50%, 3/15/21 | United States | 338,000,000 | | 76,050,000 |
| senior note, 8.125%, 10/15/22 | United States | 10,100,000 | | 2,222,000 |
| senior note, 7.50%, 2/15/23 | United States | 33,716,000 | | 7,438,593 |
| Stone Energy Corp., senior bond, 7.50%, 11/15/22 | United States | 230,000,000 | | 143,750,000 |
| eUltra Petroleum Corp., senior bond, 144A, 6.125%, 10/01/24 | United States | 45,000,000 | | 25,875,000 |
| W&T Offshore Inc., senior note, 8.50%, 6/15/19 | United States | 218,500,000 | | 98,871,250 |
| Whiting Petroleum Corp., senior note, 6.25%, 4/01/23 | United States | 23,000,000 | | 20,010,000 |
| The Williams Cos. Inc., senior bond, 3.70%, 1/15/23 | United States | 60,700,000 | | 47,157,648 |
| | | | | 4,555,979,113 |
| Financials 4.8% | | | | |
| kBank of America Corp., junior sub. bond, | | | | |
| AA, 6.10% to 3/17/25, FRN thereafter, Perpetual | United States | 80,000,000 | | 78,200,000 |
| M, 8.125% to 5/15/18, FRN thereafter, Perpetual | United States | 100,000,000 | | 104,625,000 |
| U, 5.20% to 6/01/23, FRN thereafter, Perpetual | United States | 80,000,000 | | 74,750,000 |
| X, 6.25% to 9/05/24, FRN thereafter, Perpetual | United States | 85,000,000 | | 83,193,750 |
| kBarclays PLC, sub. bond, 8.25% to 12/15/18, FRN thereafter, | | | | |
| Perpetual | United Kingdom | 75,000,000 | | 78,345,000 |
| CIT Group Inc., senior bond, 5.00%, 8/01/23 | United States | 60,000,000 | | 59,775,000 |
| kCitigroup Inc., | | | | |
| junior sub. bond, 5.35% to 5/15/23, FRN thereafter, Perpetual | United States | 179,195,000 | | 167,323,331 |
| junior sub. bond, 5.95% to 1/30/23, FRN thereafter, Perpetual | United States | 165,000,000 | | 160,256,250 |
| junior sub. bond, M, 6.30% to 5/15/24, FRN thereafter, Perpetual | United States | 270,000,000 | | 260,118,000 |
| junior sub. bond, O, 5.875% to 3/27/20, FRN thereafter, | | | | |
| Perpetual | United States | 160,000,000 | | 157,400,000 |
| junior sub. bond, P, 5.95% to 5/15/25, FRN thereafter, Perpetual | United States | 25,000,000 | | 23,593,750 |
| junior sub. bond, Q, 5.95% to 8/15/20, FRN thereafter, Perpetual | United States | 120,000,000 | | 118,467,600 |
| junior sub. note, 5.90% to 2/15/23, FRN thereafter, Perpetual | United States | 33,000,000 | | 32,257,500 |
| kFifth Third Bancorp, junior sub. bond, 5.10% to 6/30/23, FRN | | | | |
| thereafter, Perpetual | United States | 54,000,000 | | 49,545,000 |
| kGeneral Electric Capital Corp., junior sub. bond, C, 5.25% to 6/15/23, | | | | |
| FRN thereafter, Perpetual | United States | 82,400,000 | | 84,892,600 |
| kThe Goldman Sachs Group Inc., junior sub. note, 5.70% to 5/10/19, | | | | |
| FRN thereafter, Perpetual | United States | 30,000,000 | | 29,925,000 |
| kHSBC Holdings PLC, junior sub. bond, 6.375% to 9/17/24, FRN | | | | |
| thereafter, Perpetual | United Kingdom | 40,000,000 | | 38,215,000 |
| International Lease Finance Corp., senior note, 8.75%, 3/15/17 | United States | 45,000,000 | | 48,487,500 |
| Iron Mountain Inc., senior sub. bond, 5.75%, 8/15/24 | United States | 78,000,000 | | 75,562,500 |
| Istar Inc., senior note, 5.00%, 7/01/19 | United States | 98,500,000 | | 94,005,445 |
| kJPMorgan Chase & Co., | | | | |
| junior sub. bond, 6.125% to 4/30/24, FRN thereafter, Perpetual | United States | 60,000,000 | | 60,000,000 |
| junior sub. bond, 6.75% to 2/01/24, FRN thereafter, Perpetual | United States | 100,000,000 | | 104,250,000 |
| junior sub. bond, Q, 5.15% to 5/01/23, FRN thereafter, | | | | |
| Perpetual | United States | 100,000,000 | | 94,532,000 |
| junior sub. bond, R, 6.00% to 8/01/23, FRN thereafter, Perpetual | United States | 105,000,000 | | 103,621,875 |
| junior sub. bond, V, 5.00% to 7/30/19, FRN thereafter, Perpetual | United States | 200,000,000 | | 194,750,000 |
| junior sub. bond, X, 6.10% to 10/01/24, FRN thereafter, | | | | |
| Perpetual | United States | 80,000,000 | | 79,580,000 |
| junior sub. note, I, 7.90% to 4/30/19, FRN thereafter, Perpetual | United States | 800,000,000 | | 831,500,000 |
| |
| 86 | Annual Report | | | | franklintempleton.com |
FRANKLIN CUSTODIAN FUNDS
STATEMENT OF INVESTMENTS
| | | | |
| Franklin Income Fund (continued) | | | | |
| | | Principal | | |
| | Country | Amount* | | Value |
| Corporate Bonds (continued) | | | | |
| Financials (continued) | | | | |
| kMetLife Inc., junior sub. note, 5.25% to 6/15/20, FRN thereafter, | | | | |
| Perpetual | United States | 57,900,000 | $ | 57,610,500 |
| kMorgan Stanley, junior sub. bond, 5.55% to 7/15/20, FRN thereafter, | | | | |
| Perpetual | United States | 58,000,000 | | 57,202,500 |
| Navient Corp., senior note, 6.125%, 3/25/24 | United States | 50,000,000 | | 40,125,000 |
| eOneMain Financial Holdings Inc., senior note, 144A, | | | | |
| 6.75%, 12/15/19 | United States | 75,000,000 | | 77,812,500 |
| 7.25%, 12/15/21 | United States | 75,000,000 | | 76,312,500 |
| kPNC Financial Services Group Inc., junior sub. note, 4.85% to 6/01/23, | | | | |
| FRN thereafter, Perpetual | United States | 54,000,000 | | 50,692,500 |
| kWells Fargo & Co., junior sub. bond, S, 5.90% to 6/15/24, FRN | | | | |
| thereafter, Perpetual | United States | 129,500,000 | | 129,823,750 |
| | | | | 3,776,751,351 |
| Health Care 1.9% | | | | |
| CHS/Community Health Systems Inc., senior note, 6.875%, 2/01/22 | United States | 59,000,000 | | 60,398,890 |
| DaVita HealthCare Partners Inc., senior bond, 5.125%, 7/15/24 | United States | 71,000,000 | | 69,855,125 |
| HCA Inc., | | | | |
| senior bond, 5.875%, 5/01/23 | United States | 110,000,000 | | 114,400,000 |
| senior note, 7.50%, 2/15/22 | United States | 150,000,000 | | 169,875,000 |
| senior secured bond, first lien, 4.75%, 5/01/23 | United States | 43,000,000 | | 43,258,000 |
| senior secured bond, first lien, 5.25%, 4/15/25 | United States | 20,000,000 | | 20,450,000 |
| senior secured note, first lien, 5.00%, 3/15/24 | United States | 148,900,000 | | 149,644,500 |
| eKindred Healthcare Inc., senior note, 144A, 8.75%, 1/15/23 | United States | 50,000,000 | | 54,375,000 |
| eMallinckrodt International Finance SA/Mallinckrodt CB LLC, senior note, | | | | |
| 144A, 5.50%, 4/15/25 | United States | 25,000,000 | | 22,375,000 |
| Tenet Healthcare Corp., | | | | |
| 4.375%, 10/01/21 | United States | 160,000,000 | | 156,800,000 |
| senior note, 8.125%, 4/01/22 | United States | 280,000,000 | | 298,312,000 |
| senior note, 6.75%, 6/15/23 | United States | 82,200,000 | | 81,789,000 |
| senior secured note, first lien, 4.50%, 4/01/21 | United States | 50,000,000 | | 49,437,500 |
| eValeant Pharmaceuticals International Inc., | | | | |
| senior bond, 144A, 6.125%, 4/15/25 | United States | 62,400,000 | | 59,928,960 |
| senior note, 144A, 5.875%, 5/15/23 | United States | 83,500,000 | | 80,264,375 |
| eVPI Escrow Corp., senior note, 144A, 6.375%, 10/15/20 | United States | 32,900,000 | | 32,797,187 |
| | | | | 1,463,960,537 |
| Industrials 1.6% | | | | |
| eAbengoa Finance SAU, senior note, 144A, 8.875%, 11/01/17 | Spain | 50,900,000 | | 28,376,750 |
| eAbengoa Greenfield SA, senior note, 144A, 6.50%, 10/01/19 | Spain | 40,000,000 | | 16,325,000 |
| The ADT Corp., | | | | |
| gsenior bond, 4.125%, 6/15/23 | United States | 110,000,000 | | 99,550,000 |
| senior note, 3.50%, 7/15/22 | United States | 58,500,000 | | 52,065,000 |
| eAhern Rentals Inc., secured note, second lien, 144A, 7.375%, | | | | |
| 5/15/23 | United States | 50,000,000 | | 43,750,000 |
| eAlgeco Scotsman Global Finance PLC, | | | | |
| senior note, 144A, 10.75%, 10/15/19 | United Kingdom | 25,000,000 | | 13,984,375 |
| senior secured note, first lien, 144A, 8.50%, 10/15/18 | United Kingdom | 88,900,000 | | 78,620,937 |
| eBombardier Inc., | | | | |
| 144A, 5.50%, 9/15/18 | Canada | 25,000,000 | | 21,750,000 |
| senior bond, 144A, 6.125%, 1/15/23 | Canada | 81,300,000 | | 60,162,000 |
| |
| |
| franklintempleton.com | | | | Annual Report | 87 |
FRANKLIN CUSTODIAN FUNDS
STATEMENT OF INVESTMENTS
| | | | |
| Franklin Income Fund (continued) | | | | |
| | | Principal | | |
| | Country | Amount* | | Value |
| Corporate Bonds (continued) | | | | |
| Industrials (continued) | | | | |
| eBombardier Inc., (continued) | | | | |
| senior bond, 144A, 7.50%, 3/15/25 | Canada | 50,100,000 | $ | 37,825,500 |
| senior note, 144A, 6.00%, 10/15/22 | Canada | 35,000,000 | | 26,075,000 |
| b,eCEVA Group PLC, senior note, first lien, 144A, 4.00%, 5/01/18 | United Kingdom | 174,778,982 | | 154,679,399 |
| Hertz Corp., senior note, | | | | |
| 6.75%, 4/15/19 | United States | 165,000,000 | | 168,300,000 |
| 5.875%, 10/15/20 | United States | 8,500,000 | | 8,500,000 |
| 7.375%, 1/15/21 | United States | 20,000,000 | | 20,750,000 |
| Navistar International Corp., senior bond, 8.25%, 11/01/21 | United States | 115,000,000 | | 92,718,750 |
| eStena AB, senior bond, 144A, 7.00%, 2/01/24 | Sweden | 47,500,000 | | 42,275,000 |
| eStena International SA, secured bond, 144A, 5.75%, 3/01/24 | Sweden | 60,650,000 | | 56,525,800 |
| TransDigm Inc., | | | | |
| senior sub. bond, 6.50%, 7/15/24 | United States | 26,500,000 | | 25,038,525 |
| senior sub. note, 5.50%, 10/15/20 | United States | 49,500,000 | | 47,427,188 |
| senior sub. note, 6.00%, 7/15/22 | United States | 26,800,000 | | 25,125,000 |
| United Rentals North America Inc., senior bond, 5.75%, 11/15/24 | United States | 69,700,000 | | 67,086,250 |
| eXPO Logistics Inc., senior note, 144A, 6.50%, 6/15/22 | United States | 75,000,000 | | 63,703,125 |
| | | | | 1,250,613,599 |
| Information Technology 2.7% | | | | |
| eBelden Inc., senior sub. note, 144A, 5.50%, 9/01/22 | United States | 40,000,000 | | 38,900,000 |
| eBMC Software Finance Inc., senior note, 144A, 8.125%, 7/15/21 | United States | 125,805,000 | | 102,137,934 |
| e,fBoxer Parent Co. Inc., senior note, 144A, PIK, 9.00%, 10/15/19 | United States | 55,000,000 | | 39,256,250 |
| eCommScope Inc., | | | | |
| senior bond, 144A, 5.50%, 6/15/24 | United States | 85,000,000 | | 81,493,750 |
| senior note, 144A, 5.00%, 6/15/21 | United States | 50,000,000 | | 49,062,500 |
| eCommScope Technologies Finance LLC, senior bond, 144A, 6.00%, | | | | |
| 6/15/25 | United States | 54,200,000 | | 52,133,896 |
| First Data Corp., | | | | |
| senior bond, 12.625%, 1/15/21 | United States | 540,000,000 | | 614,925,000 |
| esenior secured bond, second lien, 144A, 8.25%, 1/15/21 | United States | 425,000,000 | | 442,531,250 |
| e,fsenior secured note, 144A, PIK, 8.75%, 1/15/22 | United States | 208,158,000 | | 218,045,505 |
| esenior secured note, first lien, 144A, 5.375%, 8/15/23 | United States | 100,000,000 | | 99,250,000 |
| eFreescale Semiconductor Inc., | | | | |
| secured note, 144A, 5.00%, 5/15/21 | United States | 59,450,000 | | 60,639,000 |
| senior secured note, 144A, 6.00%, 1/15/22 | United States | 118,850,000 | | 124,495,375 |
| IAC/InterActiveCorp, senior note, 4.75%, 12/15/22 | United States | 45,000,000 | | 41,456,250 |
| eInfor (U.S.) Inc., senior note, 144A, 6.50%, 5/15/22 | United States | 50,000,000 | | 46,000,000 |
| e,fInfor Software Parent LLC/Inc., senior note, 144A, PIK, 7.125%, | | | | |
| 5/01/21 | United States | 24,650,000 | | 21,784,438 |
| eInmarsat Finance PLC, senior note, 144A, 4.875%, 5/15/22 | United Kingdom | 45,000,000 | | 43,706,250 |
| NCR Corp., senior note, | | | | |
| 5.00%, 7/15/22 | United States | 36,000,000 | | 34,245,000 |
| 6.375%, 12/15/23 | United States | 40,000,000 | | 39,350,000 |
| | | | | 2,149,412,398 |
| Materials 2.7% | | | | |
| eArdagh Packaging Finance PLC/Ardagh MP Holdings USA Inc., | | | | |
| senior note, 144A, | | | | |
| 6.25%, 1/31/19 | Luxembourg | 34,300,000 | | 34,300,000 |
| 6.75%, 1/31/21 | Luxembourg | 22,600,000 | | 23,037,875 |
| 6.00%, 6/30/21 | Luxembourg | 45,000,000 | | 43,200,000 |
| |
| |
| 88 | Annual Report | | | | franklintempleton.com |
FRANKLIN CUSTODIAN FUNDS
STATEMENT OF INVESTMENTS
| | | | |
| Franklin Income Fund (continued) | | | | |
| | | Principal | | |
| | Country | Amount* | | Value |
| Corporate Bonds (continued) | | | | |
| Materials (continued) | | | | |
| Ball Corp., senior bond, 4.00%, 11/15/23 | United States | 100,000,000 | $ | 94,500,000 |
| eBWAY Holding Co., senior note, 144A, 9.125%, 8/15/21 | United States | 55,000,000 | | 53,350,000 |
| eCemex Finance LLC, senior secured note, | | | | |
| 144A, 9.375%, 10/12/22 | Mexico | 42,500,000 | | 45,419,750 |
| first lien, 144A, 6.00%, 4/01/24 | Mexico | 88,400,000 | | 82,046,250 |
| eCemex SAB de CV, | | | | |
| first lien, 144A, 5.70%, 1/11/25 | Mexico | 80,000,000 | | 72,500,000 |
| secured note, 144A, 7.25%, 1/15/21 | Mexico | 111,000,000 | | 111,138,750 |
| eThe Chemours Co., senior note, 144A, 6.625%, 5/15/23 | United States | 99,900,000 | | 67,432,500 |
| eConsolidated Minerals Ltd., senior secured note, 144A, 8.00%, | | | | |
| 5/15/20 | Jersey Islands | 25,000,000 | | 17,750,000 |
| Crown Americas LLC/Crown Americas Capital Corp. IV, senior bond, | | | | |
| 4.50%, 1/15/23 | United States | 140,000,000 | | 138,250,000 |
| eFirst Quantum Minerals Ltd., senior note, 144A, | | | | |
| 6.75%, 2/15/20 | Canada | 61,630,000 | | 41,600,250 |
| 7.00%, 2/15/21 | Canada | 63,630,000 | | 41,518,575 |
| eFMG Resources (August 2006) Pty. Ltd., | | | | |
| senior note, 144A, 8.25%, 11/01/19 | Australia | 82,000,000 | | 66,112,500 |
| senior secured note, 144A, 9.75%, 3/01/22 | Australia | 500,000,000 | | 464,375,000 |
| HudBay Minerals Inc., senior note, 9.50%, 10/01/20 | Canada | 72,100,000 | | 57,950,375 |
| eKerling PLC, senior secured note, 144A, 10.625%, 2/01/17 | United Kingdom | 53,700,000 | EUR | 60,819,660 |
| eLundin Mining Corp., senior secured note, 144A, 7.875%, 11/01/22 | Canada | 12,000,000 | | 11,550,000 |
| eOwens-Brockway Glass Container Inc., senior note, 144A, 5.875%, | | | | |
| 8/15/23 | United States | 47,500,000 | | 47,975,000 |
| ePlatform Specialty Products Corp., senior note, 144A, 6.50%, | | | | |
| 2/01/22 | United States | 30,500,000 | | 26,382,500 |
| Reynolds Group Issuer Inc./LLC/SA, | | | | |
| first lien, 5.75%, 10/15/20 | United States | 45,800,000 | | 46,372,500 |
| senior note, 8.50%, 5/15/18 | United States | 99,900,000 | | 100,836,562 |
| senior note, 9.00%, 4/15/19 | United States | 100,100,000 | | 101,351,250 |
| senior note, 9.875%, 8/15/19 | United States | 127,000,000 | | 131,683,125 |
| senior note, 8.25%, 2/15/21 | United States | 45,000,000 | | 45,112,500 |
| senior secured note, 7.875%, 8/15/19 | United States | 30,000,000 | | 31,222,500 |
| senior secured note, 6.875%, 2/15/21 | United States | 25,600,000 | | 26,464,000 |
| eSealed Air Corp., senior bond, 144A, 5.25%, 4/01/23 | United States | 48,000,000 | | 48,360,000 |
| gUnited States Steel Corp., senior note, 7.375%, 4/01/20 | United States | 13,200,000 | | 10,527,000 |
| e,f,iWalter Energy Inc., second lien, 144A, PIK, 11.50%, 4/01/20 | United States | 78,860 | | 1,149 |
| | | | | 2,143,139,571 |
| Telecommunication Services 3.1% | | | | |
| CenturyLink Inc., senior note, 5.80%, 3/15/22 | United States | 63,000,000 | | 54,495,000 |
| eConsolidated Communications Inc., senior note, 144A, 6.50%, | | | | |
| 10/01/22 | United States | 100,000,000 | | 90,000,000 |
| eDigicel Ltd., senior note, 144A, 6.75%, 3/01/23 | Bermuda | 73,300,000 | | 66,064,191 |
| Frontier Communications Corp., | | | | |
| senior bond, 8.75%, 4/15/22 | United States | 43,900,000 | | 39,313,767 |
| senior bond, 7.625%, 4/15/24 | United States | 24,900,000 | | 20,916,000 |
| senior note, 9.25%, 7/01/21 | United States | 63,600,000 | | 61,485,936 |
| senior note, 7.125%, 1/15/23 | United States | 115,850,000 | | 95,796,365 |
| esenior note, 144A, 8.875%, 9/15/20 | United States | 20,000,000 | | 19,650,000 |
| esenior note, 144A, 10.50%, 9/15/22 | United States | 20,000,000 | | 19,500,000 |
| esenior note, 144A, 11.00%, 9/15/25 | United States | 50,000,000 | | 48,500,000 |
| |
| franklintempleton.com | | | Annual Report | 89 |
FRANKLIN CUSTODIAN FUNDS
STATEMENT OF INVESTMENTS
| | | | | |
| Franklin Income Fund (continued) | | | | | |
| | | Principal | | | |
| | Country | Amount* | | | Value |
| Corporate Bonds (continued) | | | | | |
| Telecommunication Services (continued) | | | | | |
| Intelsat Jackson Holdings SA, senior bond, 5.50%, 8/01/23 | Luxembourg | 170,000,000 | | $ | 140,250,000 |
| Intelsat Luxembourg SA, senior note, 7.75%, 6/01/21 | Luxembourg | 43,000,000 | | | 28,299,375 |
| e,lNeptune Finco Corp., | | | | | |
| senior bond, 144A, 10.875%, 10/15/25 | Netherlands | 26,000,000 | | | 26,308,750 |
| senior note, 144A, 10.125%, 1/15/23 | Netherlands | 75,000,000 | | | 75,984,375 |
| Sprint Capital Corp., senior bond, 6.875%, 11/15/28 | United States | 126,000,000 | | | 91,665,000 |
| Sprint Communications Inc., | | | | | |
| 11.50%, 11/15/21 | United States | 200,000,000 | | | 198,500,000 |
| senior note, 8.375%, 8/15/17 | United States | 100,000,000 | | | 99,949,000 |
| senior note, 7.00%, 8/15/20 | United States | 57,500,000 | | | 48,156,250 |
| senior note, 6.00%, 11/15/22 | United States | 185,000,000 | | | 139,675,000 |
| esenior note, 144A, 9.00%, 11/15/18 | United States | 100,000,000 | | | 105,250,000 |
| Sprint Corp., | | | | | |
| senior bond, 7.875%, 9/15/23 | United States | 187,350,000 | | | 152,104,781 |
| senior bond, 7.125%, 6/15/24 | United States | 235,650,000 | | | 181,945,365 |
| senior note, 7.625%, 2/15/25 | United States | 100,000,000 | | | 77,687,500 |
| T-Mobile USA Inc., | | | | | |
| senior bond, 6.625%, 4/01/23 | United States | 50,000,000 | | | 49,625,000 |
| senior note, 6.25%, 4/01/21 | United States | 80,000,000 | | | 79,920,000 |
| senior note, 6.633%, 4/28/21 | United States | 50,000,000 | | | 50,250,000 |
| senior note, 6.731%, 4/28/22 | United States | 50,000,000 | | | 50,000,000 |
| senior note, 6.00%, 3/01/23 | United States | 30,000,000 | | | 29,025,000 |
| senior note, 6.836%, 4/28/23 | United States | 17,000,000 | | | 16,872,500 |
| eTelecom Italia SpA, senior note, 144A, 5.303%, 5/30/24 | Italy | 55,000,000 | | | 54,071,875 |
| eWind Acquisition Finance SA, senior note, 144A, 7.375%, 4/23/21 | Italy | 274,000,000 | | | 269,033,750 |
| | | | | | 2,480,294,780 |
| Utilities 1.8% | | | | | |
| The AES Corp., senior bond, | | | | | |
| 4.875%, 5/15/23 | United States | 110,000,000 | | | 97,075,000 |
| 5.50%, 3/15/24 | United States | 50,000,000 | | | 44,575,000 |
| Calpine Corp., | | | | | |
| senior bond, 5.75%, 1/15/25 | United States | 250,000,000 | | | 234,687,500 |
| senior note, 5.375%, 1/15/23 | United States | 200,000,000 | | | 187,500,000 |
| esenior secured bond, first lien, 144A, 5.875%, 1/15/24 | United States | 8,700,000 | | | 9,004,500 |
| Dynegy Inc., senior note, | | | | | |
| 6.75%, 11/01/19 | United States | 270,000,000 | | | 272,025,000 |
| 7.375%, 11/01/22 | United States | 256,700,000 | | | 259,908,750 |
| 5.875%, 6/01/23 | United States | 100,000,000 | | | 93,312,500 |
| eInterGen NV, | | | | | |
| secured bond, 144A, 7.00%, 6/30/23 | Netherlands | 143,700,000 | | | 122,863,500 |
| secured note, 144A, 7.50%, 6/30/21 | Netherlands | 35,800,000 | GBP | | 51,160,932 |
| NGL Energy Partners LP/NGL Energy Finance Corp., senior note, | | | | | |
| 6.875%, 10/15/21 | United States | 63,000,000 | | | 59,535,000 |
| NRG Yield Operating LLC, senior bond, 5.375%, 8/15/24 | United States | 7,000,000 | | | 6,177,500 |
| | | | | | 1,437,825,182 |
| Total Corporate Bonds (Cost $26,850,522,227) | | | | | 23,484,205,424 |
|
90 Annual Report
franklintempleton.com
| | | | |
| | | FRANKLIN CUSTODIAN FUNDS |
| | | STATEMENT OF INVESTMENTS |
| |
| |
| |
| |
| Franklin Income Fund (continued) | | | | |
| | | Principal | | |
| | Country | Amount* | | Value |
| m,nSenior Floating Rate Interests 2.7% | | | | |
| Consumer Discretionary 1.2% | | | | |
| 24 Hour Fitness Worldwide Inc., Term Loan, 4.75%, 5/28/21 | United States | 29,625,000 | $ | 27,995,625 |
| Academy Ltd., Initial Term Loan, 5.00%, 7/02/22 | United States | 94,270,548 | | 93,949,745 |
| Altice Financing SA, Loans, 5.50%, 7/02/19 | Luxembourg | 49,125,000 | | 49,462,734 |
| iHeartCommunications Inc., | | | | |
| Tranche D Term Loan, 6.944%, 1/30/19 | United States | 707,373,595 | | 588,888,518 |
| Tranche E Term Loan, 7.694%, 7/30/19 | United States | 200,744,256 | | 168,374,245 |
| TOMS Shoes LLC, Term Loan B, 6.50%, 10/30/20 | United States | 24,875,000 | | 22,138,750 |
| Visant Corp. (Jostens), Initial Term Loan, 7.00%, 9/23/21 | United States | 38,796,518 | | 35,983,771 |
| | | | | 986,793,388 |
| Consumer Staples 0.1% | | | | |
| U.S. Foods Inc., Term Loan, 4.50%, 3/31/19 | United States | 97,750,000 | | 97,810,703 |
| Energy 0.7% | | | | |
| Callon Petroleum Co., Second Lien Term Loan, 8.50%, 10/08/21 | United States | 79,500,000 | | 76,916,250 |
| CJ Holding Co., | | | | |
| B-2 Term Loan, 7.25%, 3/24/22 | United States | 49,750,000 | | 35,322,500 |
| Term Loan B-1, 6.50%, 3/24/20 | United States | 49,750,000 | | 35,571,250 |
| Drillships Financing Holding Inc., Tranche B-1 Term Loan, 6.00%, | | | | |
| 3/31/21 | Marshall Islands | 170,738,693 | | 101,162,676 |
| Fieldwood Energy LLC, Loans (Second Lien), 8.375%, 9/30/20 | United States | 219,261,084 | | 63,403,070 |
| McDermott Finance LLC, Term Loan, 5.25%, 4/16/19 | United States | 12,781,456 | | 12,685,595 |
| NGPL PipeCo LLC, Term Loan, 6.75%, 9/15/17 | United States | 131,913,285 | | 119,381,522 |
| W&T Offshore Inc., Second Lien Term Loan, 9.00%, 5/15/20 | United States | 100,000,000 | | 86,017,000 |
| | | | | 530,459,863 |
| Health Care 0.0%† | | | | |
| Pharmaceutical Product Development LLC/Jaguar, Initial Term Loan, | | | | |
| 4.25%, 8/18/22 | United States | 29,925,000 | | 29,734,857 |
| Industrials 0.2% | | | | |
| bCEVA Group PLC, Pre-Funded L/C, 6.50%, 3/19/21 | United States | 20,320,197 | | 18,245,850 |
| CEVA Intercompany BV, Dutch BV Term Loan, 6.50%, 3/19/21 | Netherlands | 21,107,143 | | 18,952,462 |
| CEVA Logistics Canada ULC, Canadian Term Loan, 6.50%, 3/19/21 | Canada | 3,639,163 | | 3,267,666 |
| CEVA Logistics U.S. Holdings Inc., U.S. Term Loan, 6.50%, 3/19/21 | United States | 29,113,300 | | 26,141,328 |
| Navistar Inc., Tranche B Term Loans, 6.50%, 8/07/20 | United States | 36,590,777 | | 35,767,485 |
| Stena International SA, Loans, 4.00%, 3/03/21 | Sweden | 98,500,000 | | 85,571,875 |
| | | | | 187,946,666 |
| Information Technology 0.3% | | | | |
| BMC Software Finance Inc., Initial U.S. Term Loans, 5.00%, 9/10/20 | United States | 59,685,131 | | 54,369,454 |
| First Data Corp., 2018 New Dollar Term Loan, 3.696%, 3/23/18 | United States | 112,993,460 | | 112,190,189 |
| Freescale Semiconductor Inc., Tranche B-4 Term Loan, 4.25%, | | | | |
| 2/28/20 | United States | 9,899,244 | | 9,898,443 |
| SRA International Inc., Term Loan, 6.50%, 7/20/18 | United States | 41,082,360 | | 41,236,419 |
| | | | | 217,694,505 |
| Materials 0.1% | | | | |
| FMG America Finance Inc. (Fortescue Metals Group), Loans, 3.75%, | | | | |
| 6/30/19 | Australia | 81,644,289 | | 67,152,427 |
| Utilities 0.1% | | | | |
| Intergen NV, Term Advance, 5.50%, 6/13/20 | Netherlands | 43,975,251 | | 41,061,890 |
| Total Senior Floating Rate Interests | | | | |
| (Cost $2,535,596,486) | | | | 2,158,654,299 |
| |
| |
| franklintempleton.com | | | | Annual Report | 91 |
| | | | | | |
| | FRANKLIN CUSTODIAN FUNDS | | | | | |
| | STATEMENT OF INVESTMENTS | | | | | |
| |
| |
| |
| |
| | Franklin Income Fund (continued) | | | | | |
| | | | Country | Shares | | Value |
| �� | Escrows and Litigation Trusts 0.0% | | | | | |
| | a,oMotors Liquidation Co., Escrow Account | | United States | 400,000,000 | $ | — |
| | a,oMotors Liquidation Co., Escrow Account, cvt. pfd., C | | United States | 11,000,000 | | — |
| | Total Escrows and Litigation Trusts | | | | | |
| | (Cost $2,416,248) | | | | | — |
| | Total Investments before Short Term Investments | | | | | |
| | (Cost $82,517,681,407) | | | | | 77,343,437,357 |
| |
| | | | | Principal | | |
| | | | | Amount* | | |
| | Short Term Investments 0.7% | | | | | |
| | U.S. Government and Agency Securities 0.5% | | | | | |
| | pFHLB, 10/07/15 - 10/14/15 | | United States | 150,000,000 | | 149,999,150 |
| | pU.S. Treasury Bill, 1/14/16 - 2/18/16 | | United States | 199,750,000 | | 199,739,104 |
| | Total U.S. Government and Agency Securities | | | | | |
| | (Cost $349,607,906) | | | | | 349,738,254 |
| | Total Investments before Money Market Funds and | | | | | |
| | Repurchase Agreements (Cost $82,867,289,313) | | | | | 77,693,175,611 |
| |
| | | | | Shares | | |
| | Money Market Funds (Cost $116,272,415) 0.2% | | | | | |
| | a,qInstitutional Fiduciary Trust Money Market Portfolio | | United States | 116,272,415 | | 116,272,415 |
| | rInvestments from Cash Collateral Received for | | | | | |
| | Loaned Securities 0.0%† | | | | | |
| | Money Market Funds 0.0%† | | | | | |
| | a,qInstitutional Fiduciary Trust Money Market Portfolio | | United States | 26,750,000 | | 26,750,000 |
| |
| | | | | Principal | | |
| | | | | Amount* | | |
| | Repurchase Agreements 0.0%† | | | | | |
| | sJoint Repurchase Agreement, 0.09%, 10/01/15 (Maturity Value | | | | | |
| $5,428,559) | | | | | |
| | RBS Securities Inc. | | | | | |
| | Collateralized by U.S. Treasury Bonds, 3.625%, 2/15/44; and | | | | | |
| | U.S. Treasury Notes, 0.094% - 3.625%, 1/31/16 - 6/30/21 | | | | | |
| | (valued at $5,537,134) | | United States | 5,428,545 | | 5,428,545 |
| | Total Investments from Cash Collateral Received for | | | | | |
| | Loaned Securities (Cost $32,178,545) | | | | | 32,178,545 |
| | Total Investments (Cost $83,015,740,273) 98.7% | | | | | 77,841,626,571 |
| | Other Assets, less Liabilities 1.3% | | | | | 1,051,984,128 |
| | Net Assets 100.0% | | | | $ | 78,893,610,699 |
|
92 Annual Report
franklintempleton.com
FRANKLIN CUSTODIAN FUNDS
STATEMENT OF INVESTMENTS
Franklin Income Fund (continued)
See Abbreviations on page 136.
†Rounds to less than 0.1% of net assets.
*The principal amount is stated in U.S. dollars unless otherwise indicated.
aNon-income producing.
bSee Note 11 regarding holdings of 5% voting securities.
cSee Note 8 regarding restricted securities.
dSee Note 1(f) regarding equity-linked securities.
eSecurity was purchased pursuant to Rule 144A under the Securities Act of 1933 and may be sold in transactions exempt from registration only to qualified institutional
buyers or in a public offering registered under the Securities Act of 1933. These securities have been deemed liquid under guidelines approved by the Trust’s Board of
Trustees. At September 30, 2015, the aggregate value of these securities was $15,570,420,003, representing 19.74% of net assets.
fIncome may be received in additional securities and/or cash.
gA portion or all of the security is on loan at September 30, 2015. See Note 1(g).
hPrincipal amount is stated in 1,000 Units.
iSee Note 7 regarding defaulted securities.
jAt September 30, 2015, pursuant to the Fund’s policies and the requirements of applicable securities law, the Fund is restricted from trading this security at year end.
kPerpetual security with no stated maturity date.
lA portion or all of the security purchased on a when-issued basis. See Note 1(d).
mThe coupon rate shown represents the rate at period end.
nSee Note 1(i) regarding senior floating rate interests.
oSecurity has been deemed illiquid because it may not be able to be sold within seven days. At September 30, 2015, the aggregate value of these securities was $-.
pThe security is traded on a discount basis with no stated coupon rate.
qSee Note 3(f) regarding investments in Institutional Fiduciary Trust Money Market Portfolio.
rSee Note 1(g) regarding securities on loan.
sSee Note 1(c) regarding joint repurchase agreement.
franklintempleton.com
|
The accompanying notes are an integral part of these financial statements. | Annual Report 93
| | | | | | | | | | | | | | | |
| FRANKLIN CUSTODIAN FUNDS | | | | | | | | | | | | | | | |
| |
| |
| Financial Highlights | | | | | | | | | | | | | | | |
| Franklin U.S. Government Securities Fund | | | | | | | | | | | | | | | |
| | | | | | Year Ended September 30, | | | | |
| | | 2015 | | | 2014 | | | 2013 | | | 2012 | | | 2011 | |
| Class A | | | | | | | | | | | | | | | |
| Per share operating performance | | | | | | | | | | | | | | | |
| (for a share outstanding throughout the year) | | | | | | | | | | | | | | | |
| Net asset value, beginning of year | $ | 6.48 | | $ | 6.53 | | $ | 6.91 | | $ | 6.92 | | $ | 6.81 | |
| Income from investment operationsa: | | | | | | | | | | | | | | | |
| Net investment incomeb | | 0.15 | | | 0.17 | | | 0.15 | | | 0.20 | | | 0.24 | |
| Net realized and unrealized gains (losses) | | (0.02 | ) | | 0.01 | | | (0.29 | ) | | 0.04 | | | 0.15 | |
| Total from investment operations | | 0.13 | | | 0.18 | | | (0.14 | ) | | 0.24 | | | 0.39 | |
| Less distributions from net investment income | | (0.21 | ) | | (0.23 | ) | | (0.24 | ) | | (0.25 | ) | | (0.28 | ) |
| Net asset value, end of year | $ | 6.40 | | $ | 6.48 | | $ | 6.53 | | $ | 6.91 | | $ | 6.92 | |
| |
| Total returnc | | 2.07 | % | | 2.80 | % | | (2.03 | )% | | 3.49 | % | | 5.93 | % |
| |
| Ratios to average net assets | | | | | | | | | | | | | | | |
| Expenses | | 0.76 | %d | | 0.75 | %d | | 0.73 | % | | 0.73 | % | | 0.72 | % |
| Net investment income | | 2.28 | % | | 2.62 | % | | 2.17 | % | | 2.86 | % | | 3.55 | % |
| |
| Supplemental data | | | | | | | | | | | | | | | |
| Net assets, end of year (000’s) | $ | 4,167,639 | | $ | 4,323,990 | | $ | 5,138,613 | | $ | 6,861,193 | | $ | 6,423,821 | |
| Portfolio turnover rate | | 69.10 | % | | 69.73 | % | | 46.16 | % | | 40.15 | % | | 20.23 | % |
| Portfolio turnover rate excluding mortgage dollar rollse | | 58.70 | % | | 38.79 | % | | 40.83 | % | | 40.15 | % | | 20.23 | % |
aThe amount shown for a share outstanding throughout the period may not correlate with the Statement of Operations for the period due to the timing of sales and
repurchases of the Fund’s shares in relation to income earned and/or fluctuating fair value of the investments of the Fund.
bBased on average daily shares outstanding.
cTotal return does not reflect sales commissions or contingent deferred sales charges, if applicable.
dBenefit of waiver and payments by affiliates and expense reduction rounds to less than 0.01%.
eSee Note 1(h) regarding mortgage dollar rolls.
|
94 Annual Report | The accompanying notes are an integral part of these financial statements. franklintempleton.com
| | | | | | | | | | | | | | | |
| | | | | | | | | FRANKLIN CUSTODIAN FUNDS | |
| | | | | | | | | FINANCIAL HIGHLIGHTS | |
| |
| |
| |
| Franklin U.S. Government Securities Fund (continued) | | | | | | | | | | | | | | | |
| | | | | | Year Ended September 30, | | | | |
| | | 2015 | | | 2014 | | | 2013 | | | 2012 | | | 2011 | |
| Class C | | | | | | | | | | | | | | | |
| Per share operating performance | | | | | | | | | | | | | | | |
| (for a share outstanding throughout the year) | | | | | | | | | | | | | | | |
| Net asset value, beginning of year | $ | 6.44 | | $ | 6.49 | | $ | 6.86 | | $ | 6.88 | | $ | 6.77 | |
| Income from investment operationsa: | | | | | | | | | | | | | | | |
| Net investment incomeb | | 0.11 | | | 0.14 | | | 0.11 | | | 0.16 | | | 0.21 | |
| Net realized and unrealized gains (losses) | | (0.01 | ) | | 0.01 | | | (0.28 | ) | | 0.03 | | | 0.15 | |
| Total from investment operations | | 0.10 | | | 0.15 | | | (0.17 | ) | | 0.19 | | | 0.36 | |
| Less distributions from net investment income | | (0.18 | ) | | (0.20 | ) | | (0.20 | ) | | (0.21 | ) | | (0.25 | ) |
| Net asset value, end of year | $ | 6.36 | | $ | 6.44 | | $ | 6.49 | | $ | 6.86 | | $ | 6.88 | |
| |
| Total returnc | | 1.57 | % | | 2.30 | % | | (2.45 | )% | | 2.85 | % | | 5.44 | % |
| |
| Ratios to average net assets | | | | | | | | | | | | | | | |
| Expenses | | 1.26 | %d | | 1.25 | %d | | 1.23 | % | | 1.23 | % | | 1.23 | % |
| Net investment income | | 1.78 | % | | 2.12 | % | | 1.67 | % | | 2.36 | % | | 3.04 | % |
| |
| Supplemental data | | | | | | | | | | | | | | | |
| Net assets, end of year (000’s) | $ | 1,040,294 | | $ | 1,190,720 | | $ | 1,640,787 | | $ | 2,981,724 | | $ | 2,294,707 | |
| Portfolio turnover rate | | 69.10 | % | | 69.73 | % | | 46.16 | % | | 40.15 | % | | 20.23 | % |
| Portfolio turnover rate excluding mortgage dollar rollse | | 58.70 | % | | 38.79 | % | | 40.83 | % | | 40.15 | % | | 20.23 | % |
aThe amount shown for a share outstanding throughout the period may not correlate with the Statement of Operations for the period due to the timing of sales and
repurchases of the Fund’s shares in relation to income earned and/or fluctuating fair value of the investments of the Fund.
bBased on average daily shares outstanding.
cTotal return does not reflect sales commissions or contingent deferred sales charges, if applicable.
dBenefit of waiver and payments by affiliates and expense reduction rounds to less than 0.01%.
eSee Note 1(h) regarding mortgage dollar rolls.
|
franklintempleton.com The accompanying notes are an integral part of these financial statements. | Annual Report 95
| | | | | | | | | | | | | | | |
| FRANKLIN CUSTODIAN FUNDS | | | | | | | | | | | | | | | |
| FINANCIAL HIGHLIGHTS | | | | | | | | | | | | | | | |
| |
| |
| |
| Franklin U.S. Government Securities Fund (continued) | | | | | | | | | | | | | | | |
| | | | | | Year Ended September 30, | | | | |
| | | 2015 | | | 2014 | | | 2013 | | | 2012 | | | 2011 | |
| Class R | | | | | | | | | | | | | | | |
| Per share operating performance | | | | | | | | | | | | | | | |
| (for a share outstanding throughout the year) | | | | | | | | | | | | | | | |
| Net asset value, beginning of year | $ | 6.48 | | $ | 6.53 | | $ | 6.90 | | $ | 6.91 | | $ | 6.81 | |
| Income from investment operationsa: | | | | | | | | | | | | | | | |
| Net investment incomeb | | 0.13 | | | 0.15 | | | 0.12 | | | 0.17 | | | 0.22 | |
| Net realized and unrealized gains (losses) | | (0.02 | ) | | 0.01 | | | (0.27 | ) | | 0.04 | | | 0.14 | |
| Total from investment operations | | 0.11 | | | 0.16 | | | (0.15 | ) | | 0.21 | | | 0.36 | |
| Less distributions from net investment income | | (0.19 | ) | | (0.21 | ) | | (0.22 | ) | | (0.22 | ) | | (0.26 | ) |
| Net asset value, end of year | $ | 6.40 | | $ | 6.48 | | $ | 6.53 | | $ | 6.90 | | $ | 6.91 | |
| |
| Total return | | 1.71 | % | | 2.44 | % | | (2.27 | )% | | 3.13 | % | | 5.41 | % |
| |
| Ratios to average net assets | | | | | | | | | | | | | | | |
| Expenses | | 1.11 | %c | | 1.10 | %c | | 1.08 | % | | 1.08 | % | | 1.08 | % |
| Net investment income | | 1.93 | % | | 2.27 | % | | 1.82 | % | | 2.51 | % | | 3.19 | % |
| |
| Supplemental data | | | | | | | | | | | | | | | |
| Net assets, end of year (000’s) | $ | 64,689 | | $ | 74,442 | | $ | 94,110 | | $ | 141,140 | | $ | 131,692 | |
| Portfolio turnover rate | | 69.10 | % | | 69.73 | % | | 46.16 | % | | 40.15 | % | | 20.23 | % |
| Portfolio turnover rate excluding mortgage dollar rollsd | | 58.70 | % | | 38.79 | % | | 40.83 | % | | 40.15 | % | | 20.23 | % |
aThe amount shown for a share outstanding throughout the period may not correlate with the Statement of Operations for the period due to the timing of sales and
repurchases of the Fund’s shares in relation to income earned and/or fluctuating fair value of the investments of the Fund.
bBased on average daily shares outstanding.
cBenefit of waiver and payments by affiliates and expense reduction rounds to less than 0.01%.
dSee Note 1(h) regarding mortgage dollar rolls.
|
96 Annual Report | The accompanying notes are an integral part of these financial statements. franklintempleton.com
| | | | | | | | | |
| | | FRANKLIN CUSTODIAN FUNDS | |
| | | FINANCIAL HIGHLIGHTS | |
| |
| |
| |
| Franklin U.S. Government Securities Fund (continued) | | | | | | | | | |
| | | Year Ended September 30, | |
| | | 2015 | | | 2014 | | | 2013 | a |
| Class R6 | | | | | | | | | |
| Per share operating performance | | | | | | | | | |
| (for a share outstanding throughout the year) | | | | | | | | | |
| Net asset value, beginning of year | $ | 6.50 | | $ | 6.55 | | $ | 6.76 | |
| Income from investment operationsb: | | | | | | | | | |
| Net investment incomec | | 0.17 | | | 0.19 | | | 0.07 | |
| Net realized and unrealized gains (losses) | | (0.02 | ) | | 0.01 | | | (0.17 | ) |
| Total from investment operations | | 0.15 | | | 0.20 | | | (0.10 | ) |
| Less distributions from net investment income | | (0.23 | ) | | (0.25 | ) | | (0.11 | ) |
| Net asset value, end of year | $ | 6.42 | | $ | 6.50 | | $ | 6.55 | |
| |
| Total returnd | | 2.35 | % | | 3.08 | % | | (1.53 | )% |
| |
| Ratios to average net assetse | | | | | | | | | |
| Expenses | | 0.47 | %f | | 0.47 | %f | | 0.46 | % |
| Net investment income | | 2.57 | % | | 2.90 | % | | 2.44 | % |
| |
| Supplemental data | | | | | | | | | |
| Net assets, end of year (000’s) | $ | 375,644 | | $ | 497,246 | | $ | 480,590 | |
| Portfolio turnover rate | | 69.10 | % | | 69.73 | % | | 46.16 | % |
| Portfolio turnover rate excluding mortgage dollar rollsg | | 58.70 | % | | 38.79 | % | | 40.83 | % |
aFor the period May 1, 2013 (effective date) to September 30, 2013.
bThe amount shown for a share outstanding throughout the period may not correlate with the Statement of Operations for the period due to the timing of sales and
repurchases of the Fund’s shares in relation to income earned and/or fluctuating fair value of the investments of the Fund.
cBased on average daily shares outstanding.
dTotal return is not annualized for periods less than one year.
eRatios are annualized for periods less than one year.
fBenefit of waiver and payments by affiliates and expense reduction rounds to less than 0.01%.
gSee Note 1(h) regarding mortgage dollar rolls.
|
franklintempleton.com The accompanying notes are an integral part of these financial statements. | Annual Report 97
| | | | | | | | | | | | | | | |
| FRANKLIN CUSTODIAN FUNDS | | | | | | | | | | | | | | | |
| FINANCIAL HIGHLIGHTS | | | | | | | | | | | | | | | |
| |
| |
| |
| Franklin U.S. Government Securities Fund (continued) | | | | | | | | | | | | | | | |
| | | | | | Year Ended September 30, | | | | |
| | | 2015 | | | 2014 | | | 2013 | | | 2012 | | | 2011 | |
| Advisor Class | | | | | | | | | | | | | | | |
| Per share operating performance | | | | | | | | | | | | | | | |
| (for a share outstanding throughout the year) | | | | | | | | | | | | | | | |
| Net asset value, beginning of year | $ | 6.50 | | $ | 6.55 | | $ | 6.93 | | $ | 6.94 | | $ | 6.83 | |
| Income from investment operationsa: | | | | | | | | | | | | | | | |
| Net investment incomeb | | 0.16 | | | 0.18 | | | 0.16 | | | 0.21 | | | 0.25 | |
| Net realized and unrealized gains (losses) | | (0.02 | ) | | 0.01 | | | (0.29 | ) | | 0.04 | | | 0.15 | |
| Total from investment operations | | 0.14 | | | 0.19 | | | (0.13 | ) | | 0.25 | | | 0.40 | |
| Less distributions from net investment income | | (0.22 | ) | | (0.24 | ) | | (0.25 | ) | | (0.26 | ) | | (0.29 | ) |
| Net asset value, end of year | $ | 6.42 | | $ | 6.50 | | $ | 6.55 | | $ | 6.93 | | $ | 6.94 | |
| |
| Total return | | 2.21 | % | | 2.94 | % | | (1.86 | )% | | 3.63 | % | | 6.08 | % |
| |
| Ratios to average net assets | | | | | | | | | | | | | | | |
| Expenses | | 0.61 | %c | | 0.60 | %c | | 0.58 | % | | 0.58 | % | | 0.58 | % |
| Net investment income | | 2.43 | % | | 2.77 | % | | 2.32 | % | | 3.01 | % | | 3.69 | % |
| |
| Supplemental data | | | | | | | | | | | | | | | |
| Net assets, end of year (000’s) | $ | 622,339 | | $ | 652,737 | | $ | 949,085 | | $ | 1,586,928 | | $ | 1,478,504 | |
| Portfolio turnover rate | | 69.10 | % | | 69.73 | % | | 46.16 | % | | 40.15 | % | | 20.23 | % |
| Portfolio turnover rate excluding mortgage dollar rollsd | | 58.70 | % | | 38.79 | % | | 40.83 | % | | 40.15 | % | | 20.23 | % |
aThe amount shown for a share outstanding throughout the period may not correlate with the Statement of Operations for the period due to the timing of sales and
repurchases of the Fund’s shares in relation to income earned and/or fluctuating fair value of the investments of the Fund.
bBased on average daily shares outstanding.
cBenefit of waiver and payments by affiliates and expense reduction rounds to less than 0.01%.
dSee Note 1(h) regarding mortgage dollar rolls.
|
98 Annual Report | The accompanying notes are an integral part of these financial statements. franklintempleton.com
| | | | |
| | | FRANKLIN CUSTODIAN FUNDS |
| |
| |
| |
| |
| Statement of Investments, September 30, 2015 | | | | |
| |
| Franklin U.S. Government Securities Fund | | | | |
| | | Principal | | |
| | | Amount | | Value |
| Mortgage-Backed Securities 98.1% | | | | |
| Government National Mortgage Association (GNMA) Fixed Rate 98.1% | | | | |
| GNMA GP 30 Year, 8.25%, 3/15/17 - 5/15/17 | $ | 8,943 | $ | 8,981 |
| GNMA GP 30 Year, 9.25%, 5/15/16 - 12/15/16 | | 27,139 | | 27,417 |
| GNMA I SF 15 Year, 6.50%, 5/15/18 | | 41,614 | | 42,692 |
| GNMA I SF 30 Year, 3.50%, 4/15/43 - 5/15/43 | | 42,363,865 | | 44,597,784 |
| GNMA I SF 30 Year, 4.00%, 12/15/40 - 9/15/41 | | 15,533,321 | | 16,756,144 |
| GNMA I SF 30 Year, 4.50%, 2/15/39 - 6/15/39 | | 54,375,693 | | 59,706,389 |
| GNMA I SF 30 Year, 4.50%, 6/15/39 - 11/15/39 | | 55,993,076 | | 61,110,213 |
| GNMA I SF 30 Year, 4.50%, 12/15/39 - 3/15/40 | | 54,854,598 | | 59,897,048 |
| GNMA I SF 30 Year, 4.50%, 4/15/40 - 6/15/40 | | 53,383,542 | | 58,099,741 |
| GNMA I SF 30 Year, 4.50%, 6/15/40 | | 55,733,555 | | 61,067,262 |
| GNMA I SF 30 Year, 4.50%, 7/15/40 | | 37,846,717 | | 41,303,516 |
| GNMA I SF 30 Year, 4.50%, 7/15/40 - 8/15/40 | | 57,471,855 | | 62,475,946 |
| GNMA I SF 30 Year, 4.50%, 8/15/40 - 4/15/41 | | 51,004,071 | | 55,481,674 |
| GNMA I SF 30 Year, 4.50%, 4/15/41 - 6/15/41 | | 22,679,227 | | 25,018,037 |
| GNMA I SF 30 Year, 5.00%, 2/15/33 - 9/15/33 | | 54,084,203 | | 60,317,474 |
| GNMA I SF 30 Year, 5.00%, 9/15/33 - 3/15/34 | | 55,860,071 | | 62,318,152 |
| GNMA I SF 30 Year, 5.00%, 3/15/34 - 5/15/39 | | 51,461,515 | | 57,442,490 |
| GNMA I SF 30 Year, 5.00%, 6/15/39 - 7/15/39 | | 34,956,109 | | 38,789,039 |
| GNMA I SF 30 Year, 5.00%, 8/15/39 - 9/15/39 | | 55,159,013 | | 61,155,898 |
| GNMA I SF 30 Year, 5.00%, 9/15/39 - 10/15/39 | | 37,833,035 | | 42,036,492 |
| GNMA I SF 30 Year, 5.00%, 10/15/39 | | 52,721,190 | | 58,999,492 |
| GNMA I SF 30 Year, 5.00%, 10/15/39 | | 26,384,713 | | 29,511,330 |
| GNMA I SF 30 Year, 5.00%, 11/15/39 | | 55,820,679 | | 62,520,739 |
| GNMA I SF 30 Year, 5.00%, 11/15/39 - 2/15/40 | | 52,244,243 | | 58,325,558 |
| GNMA I SF 30 Year, 5.00%, 2/15/40 | | 39,153,360 | | 43,676,723 |
| GNMA I SF 30 Year, 5.00%, 3/15/40 - 4/15/40 | | 55,852,213 | | 62,367,341 |
| GNMA I SF 30 Year, 5.00%, 4/15/40 - 6/15/40 | | 55,238,770 | | 61,793,769 |
| GNMA I SF 30 Year, 5.00%, 6/15/40 | | 32,489,240 | | 36,316,717 |
| GNMA I SF 30 Year, 5.00%, 9/15/40 | | 40,427,620 | | 44,822,263 |
| GNMA I SF 30 Year, 5.50%, 5/15/28 - 4/15/33 | | 54,589,138 | | 62,238,022 |
| GNMA I SF 30 Year, 5.50%, 4/15/33 - 7/15/33 | | 54,749,167 | | 62,203,422 |
| GNMA I SF 30 Year, 5.50%, 7/15/33 - 11/15/36 | | 54,782,909 | | 62,188,364 |
| GNMA I SF 30 Year, 5.50%, 12/15/36 - 9/15/38 | | 46,581,751 | | 52,618,135 |
| GNMA I SF 30 Year, 5.50%, 12/15/38 - 10/15/39 | | 53,631,077 | | 60,270,924 |
| GNMA I SF 30 Year, 5.50%, 10/15/39 - 2/15/40 | | 14,928,956 | | 16,932,854 |
| GNMA I SF 30 Year, 6.00%, 10/15/23 - 9/15/32 | | 54,702,732 | | 62,641,260 |
| GNMA I SF 30 Year, 6.00%, 9/15/32 - 1/15/36 | | 49,766,327 | | 57,400,928 |
| GNMA I SF 30 Year, 6.00%, 1/15/36 - 6/15/37 | | 53,700,996 | | 61,715,807 |
| GNMA I SF 30 Year, 6.00%, 6/15/37 - 9/15/38 | | 42,817,555 | | 48,850,754 |
| GNMA I SF 30 Year, 6.00%, 11/15/38 - 12/15/39 | | 50,300,942 | | 57,049,487 |
| GNMA I SF 30 Year, 6.50%, 5/15/23 - 3/15/32 | | 54,481,564 | | 62,697,695 |
| GNMA I SF 30 Year, 6.50%, 3/15/32 - 8/15/37 | | 21,502,252 | | 25,126,071 |
| GNMA I SF 30 Year, 6.75%, 3/15/26 | | 7,586 | | 8,701 |
| GNMA I SF 30 Year, 7.00%, 4/15/16 - 9/15/32 | | 51,864,757 | | 58,560,624 |
| GNMA I SF 30 Year, 7.25%, 12/15/25 - 1/15/26 | | 177,153 | | 187,739 |
| GNMA I SF 30 Year, 7.50%, 7/15/16 - 8/15/33 | | 16,087,628 | | 17,892,254 |
| GNMA I SF 30 Year, 7.70%, 1/15/21 - 1/15/22 | | 107,910 | | 108,505 |
| GNMA I SF 30 Year, 8.00%, 11/15/15 - 9/15/30 | | 7,566,010 | | 8,007,740 |
| GNMA I SF 30 Year, 8.50%, 6/15/16 - 5/15/25 | | 1,561,205 | | 1,660,702 |
| GNMA I SF 30 Year, 9.00%, 4/15/16 - 7/15/23 | | 1,612,105 | | 1,686,991 |
| GNMA I SF 30 Year, 9.50%, 5/15/16 - 8/15/22 | | 1,449,924 | | 1,486,671 |
| |
| |
| franklintempleton.com | | Annual Report | 99 |
| | | | |
| FRANKLIN CUSTODIAN FUNDS | | | | |
| STATEMENT OF INVESTMENTS | | | | |
| |
| |
| |
| |
| Franklin U.S. Government Securities Fund (continued) | | | | |
| | | Principal | | |
| | | Amount | | Value |
| Mortgage-Backed Securities (continued) | | | | |
| Government National Mortgage Association (GNMA) Fixed Rate (continued) | | | | |
| GNMA I SF 30 Year, 10.00%, 2/15/16 - 3/15/25 | $ | 1,303,046 | $ | 1,342,269 |
| GNMA I SF 30 Year, 10.50%, 11/15/15 - 10/15/21 | | 699,301 | | 719,811 |
| GNMA I SF 30 Year, 11.00%, 10/15/15 - 5/15/21 | | 101,058 | | 102,351 |
| GNMA I SF 30 Year, 11.50%, 2/15/16 | | 6,386 | | 6,457 |
| GNMA II GP 30 Year, 8.75%, 3/20/17 - 7/20/17 | | 7,554 | | 7,612 |
| GNMA II SF 30 Year, 3.00%, 2/20/45 | | 15,572,303 | | 15,927,225 |
| GNMA II SF 30 Year, 3.50%, 10/20/40 - 6/20/42 | | 22,944,076 | | 24,128,012 |
| GNMA II SF 30 Year, 3.50%, 7/20/42 | | 95,527,658 | | 100,456,407 |
| GNMA II SF 30 Year, 3.50%, 8/20/42 | | 36,076,542 | | 37,948,015 |
| GNMA II SF 30 Year, 3.50%, 9/20/42 | | 210,404,252 | | 221,260,236 |
| GNMA II SF 30 Year, 3.50%, 10/20/42 | | 43,405,069 | | 45,644,594 |
| GNMA II SF 30 Year, 3.50%, 11/20/42 - 2/20/43 | | 55,202,766 | | 58,063,904 |
| GNMA II SF 30 Year, 3.50%, 3/20/43 - 4/20/43 | | 57,307,011 | | 60,261,679 |
| GNMA II SF 30 Year, 3.50%, 5/20/43 | | 60,447,805 | | 63,548,207 |
| GNMA II SF 30 Year, 3.50%, 5/20/43 | | 1,131,717 | | 1,196,915 |
| GNMA II SF 30 Year, 3.50%, 6/20/43 | | 69,721,792 | | 73,292,512 |
| GNMA II SF 30 Year, 3.50%, 8/20/43 | | 51,154,201 | | 53,762,256 |
| GNMA II SF 30 Year, 3.50%, 4/20/45 | | 132,312,228 | | 138,924,565 |
| GNMA II SF 30 Year, 3.50%, 5/20/45 | | 201,747,590 | | 211,770,519 |
| GNMA II SF 30 Year, 3.50%, 6/20/45 | | 236,808,467 | | 248,659,987 |
| GNMA II SF 30 Year, 3.50%, 7/20/45 | | 59,714,390 | | 62,704,590 |
| GNMA II SF 30 Year, 3.50%, 8/20/45 | | 55,725,779 | | 58,517,340 |
| GNMA II SF 30 Year, 3.50%, 9/20/45 | | 169,700,000 | | 178,201,147 |
| GNMA II SF 30 Year, 4.00%, 5/20/40 - 10/20/40 | | 22,013,959 | | 23,650,789 |
| GNMA II SF 30 Year, 4.00%, 11/20/40 | | 66,750,872 | | 71,758,732 |
| GNMA II SF 30 Year, 4.00%, 12/20/40 | | 38,810,473 | | 41,722,164 |
| GNMA II SF 30 Year, 4.00%, 1/20/41 - 6/20/41 | | 42,489,873 | | 45,677,281 |
| GNMA II SF 30 Year, 4.00%, 7/20/41 | | 56,224,397 | | 60,219,206 |
| GNMA II SF 30 Year, 4.00%, 9/20/41 | | 65,247,981 | | 70,053,781 |
| GNMA II SF 30 Year, 4.00%, 10/20/41 | | 77,835,635 | | 83,568,478 |
| GNMA II SF 30 Year, 4.00%, 11/20/41 | | 70,379,772 | | 75,552,695 |
| GNMA II SF 30 Year, 4.00%, 2/20/44 | | 52,690,116 | | 57,224,174 |
| GNMA II SF 30 Year, 4.00%, 12/20/44 | | 5,835,727 | | 6,220,196 |
| GNMA II SF 30 Year, 4.00%, 2/20/45 | | 132,910,520 | | 141,666,917 |
| GNMA II SF 30 Year, 4.00%, 7/20/45 | | 360,546,305 | | 385,362,929 |
| GNMA II SF 30 Year, 4.00%, 9/20/45 | | 68,050,000 | | 72,740,000 |
| GNMA II SF 30 Year, 4.50%, 5/20/33 - 11/20/39 | | 34,283,011 | | 37,244,156 |
| GNMA II SF 30 Year, 4.50%, 12/20/39 - 1/20/40 | | 57,448,011 | | 62,484,336 |
| GNMA II SF 30 Year, 4.50%, 2/20/40 - 7/20/40 | | 42,935,121 | | 46,699,509 |
| GNMA II SF 30 Year, 4.50%, 5/20/41 | | 61,802,477 | | 67,221,712 |
| GNMA II SF 30 Year, 4.50%, 6/20/41 | | 75,500,535 | | 82,120,964 |
| GNMA II SF 30 Year, 4.50%, 6/20/41 | | 18,440,965 | | 20,058,001 |
| GNMA II SF 30 Year, 4.50%, 7/20/41 | | 80,641,203 | | 87,712,444 |
| GNMA II SF 30 Year, 4.50%, 8/20/41 | | 10,071,061 | | 10,954,174 |
| GNMA II SF 30 Year, 4.50%, 9/20/41 | | 105,913,273 | | 115,200,689 |
| GNMA II SF 30 Year, 4.50%, 10/20/41 | | 79,490,795 | | 86,632,845 |
| GNMA II SF 30 Year, 4.50%, 8/20/42 - 2/20/44 | | 50,086,206 | | 53,980,843 |
| GNMA II SF 30 Year, 5.00%, 7/20/33 - 10/20/33 | | 54,791,293 | | 60,864,538 |
| GNMA II SF 30 Year, 5.00%, 11/20/33 - 3/20/36 | | 39,152,187 | | 43,453,455 |
| GNMA II SF 30 Year, 5.00%, 7/20/39 - 4/20/40 | | 52,353,221 | | 58,230,798 |
| GNMA II SF 30 Year, 5.00%, 5/20/40 - 9/20/41 | | 50,180,728 | | 55,802,448 |
| |
| |
| 100 | Annual Report | | franklintempleton.com |
FRANKLIN CUSTODIAN FUNDS
STATEMENT OF INVESTMENTS
| | | | |
| Franklin U.S. Government Securities Fund (continued) | | | | |
| | | Principal | | |
| | | Amount | | Value |
| Mortgage-Backed Securities (continued) | | | | |
| Government National Mortgage Association (GNMA) Fixed Rate (continued) | | | | |
| GNMA II SF 30 Year, 5.50%, 6/20/34 - 11/20/34 | $ | 40,206,247 | $ | 45,394,677 |
| GNMA II SF 30 Year, 5.50%, 12/20/34 - 3/20/35 | | 50,663,605 | | 57,194,162 |
| GNMA II SF 30 Year, 5.50%, 5/20/35 - 6/20/38 | | 55,371,634 | | 62,311,052 |
| GNMA II SF 30 Year, 5.50%, 7/20/38 - 4/20/40 | | 10,673,490 | | 11,999,391 |
| GNMA II SF 30 Year, 6.00%, 10/20/23 - 8/20/35 | | 53,281,055 | | 60,775,695 |
| GNMA II SF 30 Year, 6.00%, 9/20/35 - 9/20/38 | | 51,861,931 | | 58,684,370 |
| GNMA II SF 30 Year, 6.00%, 12/20/38 - 7/20/39 | | 8,676,848 | | 9,765,753 |
| GNMA II SF 30 Year, 6.50%, 6/20/24 - 1/20/39 | | 39,231,079 | | 46,022,135 |
| GNMA II SF 30 Year, 7.00%, 2/20/28 - 7/20/33 | | 8,216,132 | | 10,108,305 |
| GNMA II SF 30 Year, 7.50%, 10/20/22 - 4/20/32 | | 1,932,709 | | 2,255,812 |
| GNMA II SF 30 Year, 8.00%, 8/20/16 - 6/20/30 | | 925,815 | | 1,111,436 |
| GNMA II SF 30 Year, 8.50%, 5/20/16 - 6/20/25 | | 326,366 | | 349,045 |
| GNMA II SF 30 Year, 9.00%, 10/20/16 - 11/20/21 | | 68,286 | | 75,459 |
| GNMA II SF 30 Year, 9.50%, 3/20/18 - 4/20/25 | | 86,884 | | 92,914 |
| GNMA II SF 30 Year, 10.00%, 4/20/16 - 3/20/21 | | 112,980 | | 123,322 |
| GNMA II SF 30 Year, 10.50%, 1/20/16 - 1/20/21 | | 185,254 | | 192,119 |
| GNMA II SF 30 Year, 11.00%, 12/20/15 - 1/20/21 | | 39,331 | | 39,829 |
| GNMA II SF 30 Year, 11.50%, 1/20/18 | | 2,068 | | 2,102 |
| Total Mortgage-Backed Securities (Cost $5,933,209,896) | | | | 6,154,542,413 |
| |
| | | Shares | | |
| |
| Short Term Investments (Cost $106,304,328) 1.7% | | | | |
| Money Market Funds 1.7% | | | | |
| a,bInstitutional Fiduciary Trust Money Market Portfolio | | 106,304,328 | | 106,304,328 |
| Total Investments (Cost $6,039,514,224) 99.8% | | | | 6,260,846,741 |
| Other Assets, less Liabilities 0.2% | | | | 9,758,327 |
| Net Assets 100.0% | | | $ | 6,270,605,068 |
See Abbreviations on page 136.
aNon-income producing.
bSee Note 3(f) regarding investments in Institutional Fiduciary Trust Money Market Portfolio.
| 101
franklintempleton.com The accompanying notes are an integral part of these financial statements. | Annual Report
| | | | | | | | | | | | | | | |
| FRANKLIN CUSTODIAN FUNDS | | | | | | | | | | | | | | | |
| |
| |
| Financial Highlights | | | | | | | | | | | | | | | |
| Franklin Utilities Fund | | | | | | | | | | | | | | | |
| | | | | | Year Ended September 30, | | | | |
| | | 2015 | | | 2014 | | | 2013 | | | 2012 | | | 2011 | |
| Class A | | | | | | | | | | | | | | | |
| Per share operating performance | | | | | | | | | | | | | | | |
| (for a share outstanding throughout the year) | | | | | | | | | | | | | | | |
| Net asset value, beginning of year | $ | 16.58 | | $ | 14.62 | | $ | 14.04 | | $ | 12.42 | | $ | 11.44 | |
| Income from investment operationsa: | | | | | | | | | | | | | | | |
| Net investment incomeb | | 0.49 | | | 0.49 | | | 0.49 | | | 0.48 | | | 0.44 | |
| Net realized and unrealized gains (losses) | | (0.09 | ) | | 2.00 | | | 0.60 | | | 1.60 | | | 0.97 | |
| Total from investment operations | | 0.40 | | | 2.49 | | | 1.09 | | | 2.08 | | | 1.41 | |
| Less distributions from: | | | | | | | | | | | | | | | |
| Net investment income | | (0.48 | ) | | (0.49 | ) | | (0.51 | ) | | (0.46 | ) | | (0.43 | ) |
| Net realized gains | | (0.42 | ) | | (0.04 | ) | | — | | | — | | | — | |
| Total distributions | | (0.90 | ) | | (0.53 | ) | | (0.51 | ) | | (0.46 | ) | | (0.43 | ) |
| Net asset value, end of year | $ | 16.08 | | $ | 16.58 | | $ | 14.62 | | $ | 14.04 | | $ | 12.42 | |
| |
| Total returnc | | 2.19 | % | | 17.24 | % | | 7.92 | % | | 16.99 | % | | 12.50 | % |
| |
| Ratios to average net assets | | | | | | | | | | | | | | | |
| Expenses | | 0.73 | %d | | 0.75 | %d,e | | 0.75 | %e | | 0.76 | % | | 0.76 | % |
| Net investment income | | 2.88 | % | | 3.05 | % | | 3.34 | % | | 3.61 | % | | 3.67 | % |
| |
| Supplemental data | | | | | | | | | | | | | | | |
| Net assets, end of year (000’s) | $ | 3,524,835 | | $ | 3,717,397 | | $ | 3,275,129 | | $ | 3,076,131 | | $ | 2,220,083 | |
| Portfolio turnover rate | | 9.55 | % | | 8.10 | % | | 4.57 | % | | 1.27 | % | | 5.21 | % |
aThe amount shown for a share outstanding throughout the period may not correlate with the Statement of Operations for the period due to the timing of sales and
repurchases of the Fund’s shares in relation to income earned and/or fluctuating fair value of the investments of the Fund.
bBased on average daily shares outstanding.
cTotal return does not reflect sales commissions or contingent deferred sales charges, if applicable.
dBenefit of waiver and payments by affiliates rounds to less than 0.01%.
eBenefit of expense reduction rounds to less than 0.01%.
102 |
Annual Report | The accompanying notes are an integral part of these financial statements. franklintempleton.com
FRANKLIN CUSTODIAN FUNDS
FINANCIAL HIGHLIGHTS
| | | | | | | | | | | | | | | |
| Franklin Utilities Fund (continued) | | | | | | | | | | | | | | | |
| | | | | | Year Ended September 30, | | | | |
| | | 2015 | | | 2014 | | | 2013 | | | 2012 | | | 2011 | |
| Class C | | | | | | | | | | | | | | | |
| Per share operating performance | | | | | | | | | | | | | | | |
| (for a share outstanding throughout the year) | | | | | | | | | | | | | | | |
| Net asset value, beginning of year | $ | 16.50 | | $ | 14.56 | | $ | 13.98 | | $ | 12.37 | | $ | 11.40 | |
| Income from investment operationsa: | | | | | | | | | | | | | | | |
| Net investment incomeb | | 0.40 | | | 0.41 | | | 0.41 | | | 0.42 | | | 0.38 | |
| Net realized and unrealized gains (losses) | | (0.08 | ) | | 1.98 | | | 0.61 | | | 1.58 | | | 0.96 | |
| Total from investment operations | | 0.32 | | | 2.39 | | | 1.02 | | | 2.00 | | | 1.34 | |
| Less distributions from: | | | | | | | | | | | | | | | |
| Net investment income | | (0.39 | ) | | (0.41 | ) | | (0.44 | ) | | (0.39 | ) | | (0.37 | ) |
| Net realized gains | | (0.42 | ) | | (0.04 | ) | | — | | | — | | | — | |
| Total distributions | | (0.81 | ) | | (0.45 | ) | | (0.44 | ) | | (0.39 | ) | | (0.37 | ) |
| Net asset value, end of year | $ | 16.01 | | $ | 16.50 | | $ | 14.56 | | $ | 13.98 | | $ | 12.37 | |
| |
| Total returnc | | 1.74 | % | | 16.61 | % | | 7.40 | % | | 16.32 | % | | 12.00 | % |
| |
| Ratios to average net assets | | | | | | | | | | | | | | | |
| Expenses | | 1.23 | %d | | 1.25 | %d,e | | 1.25 | %e | | 1.26 | % | | 1.26 | % |
| Net investment income | | 2.38 | % | | 2.55 | % | | 2.84 | % | | 3.11 | % | | 3.17 | % |
| |
| Supplemental data | | | | | | | | | | | | | | | |
| Net assets, end of year (000’s) | $ | 931,800 | | $ | 986,318 | | $ | 845,173 | | $ | 774,711 | | $ | 528,391 | |
| Portfolio turnover rate | | 9.55 | % | | 8.10 | % | | 4.57 | % | | 1.27 | % | | 5.21 | % |
aThe amount shown for a share outstanding throughout the period may not correlate with the Statement of Operations for the period due to the timing of sales and
repurchases of the Fund’s shares in relation to income earned and/or fluctuating fair value of the investments of the Fund.
bBased on average daily shares outstanding.
cTotal return does not reflect sales commissions or contingent deferred sales charges, if applicable.
dBenefit of waiver and payments by affiliates rounds to less than 0.01%.
eBenefit of expense reduction rounds to less than 0.01%.
| 103
franklintempleton.com The accompanying notes are an integral part of these financial statements. | Annual Report
| | | | | | | | | | | | | | | |
| FRANKLIN CUSTODIAN FUNDS | | | | | | | | | | | | | | | |
| FINANCIAL HIGHLIGHTS | | | | | | | | | | | | | | | |
| |
| |
| |
| Franklin Utilities Fund (continued) | | | | | | | | | | | | | | | |
| | | | | | Year Ended September 30, | | | | |
| | | 2015 | | | 2014 | | | 2013 | | | 2012 | | | 2011 | |
| Class R | | | | | | | | | | | | | | | |
| Per share operating performance | | | | | | | | | | | | | | | |
| (for a share outstanding throughout the year) | | | | | | | | | | | | | | | |
| Net asset value, beginning of year | $ | 16.52 | | $ | 14.58 | | $ | 14.00 | | $ | 12.39 | | $ | 11.41 | |
| Income from investment operationsa: | | | | | | | | | | | | | | | |
| Net investment incomeb | | 0.42 | | | 0.43 | | | 0.44 | | | 0.44 | | | 0.40 | |
| Net realized and unrealized gains (losses) | | (0.09 | ) | | 1.99 | | | 0.60 | | | 1.58 | | | 0.97 | |
| Total from investment operations | | 0.33 | | | 2.42 | | | 1.04 | | | 2.02 | | | 1.37 | |
| Less distributions from: | | | | | | | | | | | | | | | |
| Net investment income | | (0.41 | ) | | (0.44 | ) | | (0.46 | ) | | (0.41 | ) | | (0.39 | ) |
| Net realized gains | | (0.42 | ) | | (0.04 | ) | | — | | | — | | | — | |
| Total distributions | | (0.83 | ) | | (0.48 | ) | | (0.46 | ) | | (0.41 | ) | | (0.39 | ) |
| Net asset value, end of year | $ | 16.02 | | $ | 16.52 | | $ | 14.58 | | $ | 14.00 | | $ | 12.39 | |
| |
| Total return | | 1.83 | % | | 16.75 | % | | 7.56 | % | | 16.55 | % | | 12.14 | % |
| |
| Ratios to average net assets | | | | | | | | | | | | | | | |
| Expenses | | 1.08 | %c | | 1.10 | %c,d | | 1.10 | %d | | 1.11 | % | | 1.11 | % |
| Net investment income | | 2.53 | % | | 2.70 | % | | 2.99 | % | | 3.26 | % | | 3.32 | % |
| |
| Supplemental data | | | | | | | | | | | | | | | |
| Net assets, end of year (000’s) | $ | 83,271 | | $ | 95,498 | | $ | 86,216 | | $ | 80,478 | | $ | 51,732 | |
| Portfolio turnover rate | | 9.55 | % | | 8.10 | % | | 4.57 | % | | 1.27 | % | | 5.21 | % |
aThe amount shown for a share outstanding throughout the period may not correlate with the Statement of Operations for the period due to the timing of sales and
repurchases of the Fund’s shares in relation to income earned and/or fluctuating fair value of the investments of the Fund.
bBased on average daily shares outstanding.
cBenefit of waiver and payments by affiliates rounds to less than 0.01%.
dBenefit of expense reduction rounds to less than 0.01%.
104 |
Annual Report | The accompanying notes are an integral part of these financial statements. franklintempleton.com
FRANKLIN CUSTODIAN FUNDS
FINANCIAL HIGHLIGHTS
| | | | | | | | | |
| Franklin Utilities Fund (continued) | | | | | | | | | |
| | | Year Ended September 30, | |
| | | 2015 | | | 2014 | | | 2013 | a |
| Class R6 | | | | | | | | | |
| Per share operating performance | | | | | | | | | |
| (for a share outstanding throughout the year) | | | | | | | | | |
| Net asset value, beginning of year | $ | 16.68 | | $ | 14.71 | | $ | 15.88 | |
| Income from investment operationsb: | | | | | | | | | |
| Net investment incomec | | 0.53 | | | 0.53 | | | 0.25 | |
| Net realized and unrealized gains (losses) | | (0.09 | ) | | 2.01 | | | (1.17 | ) |
| Total from investment operations | | 0.44 | | | 2.54 | | | (0.92 | ) |
| Less distributions from: | | | | | | | | | |
| Net investment income | | (0.52 | ) | | (0.53 | ) | | (0.25 | ) |
| Net realized gains | | (0.42 | ) | | (0.04 | ) | | — | |
| Total distributions | | (0.94 | ) | | (0.57 | ) | | (0.25 | ) |
| Net asset value, end of year | $ | 16.18 | | $ | 16.68 | | $ | 14.71 | |
| |
| Total returnd | | 2.45 | % | | 17.51 | % | | (5.79 | )% |
| |
| Ratios to average net assetse | | | | | | | | | |
| Expenses | | 0.47 | %f | | 0.48 | %f,g | | 0.48 | %g |
| Net investment income | | 3.14 | % | | 3.32 | % | | 3.61 | % |
| |
| Supplemental data | | | | | | | | | |
| Net assets, end of year (000’s) | $ | 201,225 | | $ | 236,437 | | $ | 218,746 | |
| Portfolio turnover rate | | 9.55 | % | | 8.10 | % | | 4.57 | % |
aFor the period May 1, 2013 (effective date) to September 30, 2013.
bThe amount shown for a share outstanding throughout the period may not correlate with the Statement of Operations for the period due to the timing of sales and
repurchases of the Fund’s shares in relation to income earned and/or fluctuating fair value of the investments of the Fund.
cBased on average daily shares outstanding.
dTotal return is not annualized for periods less than one year.
eRatios are annualized for periods less than one year.
fBenefit of waiver and payments by affiliates rounds to less than 0.01%.
gBenefit of expense reduction rounds to less than 0.01%.
| 105
franklintempleton.com The accompanying notes are an integral part of these financial statements. | Annual Report
|
| FRANKLIN CUSTODIAN FUNDS |
| FINANCIAL HIGHLIGHTS |
| | | | | | | | | | | | | | | |
| Franklin Utilities Fund (continued) | | | | | | | | | | | | | | | |
| | | | | | Year Ended September 30, | | | | |
| | | 2015 | | | 2014 | | | 2013 | | | 2012 | | | 2011 | |
| Advisor Class | | | | | | | | | | | | | | | |
| Per share operating performance | | | | | | | | | | | | | | | |
| (for a share outstanding throughout the year) | | | | | | | | | | | | | | | |
| Net asset value, beginning of year | $ | 16.68 | | $ | 14.71 | | $ | 14.12 | | $ | 12.49 | | $ | 11.50 | |
| Income from investment operationsa: | | | | | | | | | | | | | | | |
| Net investment incomeb | | 0.52 | | | 0.52 | | | 0.50 | | | 0.51 | | | 0.46 | |
| Net realized and unrealized gains (losses) | | (0.09 | ) | | 2.00 | | | 0.62 | | | 1.60 | | | 0.97 | |
| Total from investment operations | | 0.43 | | | 2.52 | | | 1.12 | | | 2.11 | | | 1.43 | |
| Less distributions from: | | | | | | | | | | | | | | | |
| Net investment income | | (0.50 | ) | | (0.51 | ) | | (0.53 | ) | | (0.48 | ) | | (0.44 | ) |
| Net realized gains | | (0.42 | ) | | (0.04 | ) | | — | | | — | | | — | |
| Total distributions | | (0.92 | ) | | (0.55 | ) | | (0.53 | ) | | (0.48 | ) | | (0.44 | ) |
| Net asset value, end of year | $ | 16.19 | | $ | 16.68 | | $ | 14.71 | | $ | 14.12 | | $ | 12.49 | |
| |
| Total return | | 2.40 | % | | 17.37 | % | | 8.11 | % | | 17.15 | % | | 12.68 | % |
| |
| Ratios to average net assets | | | | | | | | | | | | | | | |
| Expenses | | 0.58 | %c | | 0.60 | %c,d | | 0.60 | %d | | 0.61 | % | | 0.61 | % |
| Net investment income | | 3.03 | % | | 3.20 | % | | 3.49 | % | | 3.76 | % | | 3.82 | % |
| |
| Supplemental data | | | | | | | | | | | | | | | |
| Net assets, end of year (000’s) | $ | 549,371 | | $ | 562,202 | | $ | 343,082 | | $ | 574,803 | | $ | 347,983 | |
| Portfolio turnover rate | | 9.55 | % | | 8.10 | % | | 4.57 | % | | 1.27 | % | | 5.21 | % |
aThe amount shown for a share outstanding throughout the period may not correlate with the Statement of Operations for the period due to the timing of sales and
repurchases of the Fund’s shares in relation to income earned and/or fluctuating fair value of the investments of the Fund.
bBased on average daily shares outstanding.
cBenefit of waiver and payments by affiliates rounds to less than 0.01%.
dBenefit of expense reduction rounds to less than 0.01%.
106 |
Annual Report | The accompanying notes are an integral part of these financial statements. franklintempleton.com
FRANKLIN CUSTODIAN FUNDS
| | | | |
| Statement of Investments, September 30, 2015 | | | | |
| |
| Franklin Utilities Fund | | | | |
| | Country | Shares | | Value |
| Common Stocks 98.8% | | | | |
| Electric Utilities 49.2% | | | | |
| ALLETE Inc. | United States | 1,000,000 | $ | 50,490,000 |
| American Electric Power Co. Inc. | United States | 4,000,000 | | 227,440,000 |
| Duke Energy Corp. | United States | 3,550,000 | | 255,387,000 |
| Edison International | United States | 4,400,000 | | 277,508,000 |
| Entergy Corp. | United States | 1,300,000 | | 84,630,000 |
| Eversource Energy | United States | 1,700,000 | | 86,054,000 |
| Exelon Corp. | United States | 6,600,000 | | 196,020,000 |
| FirstEnergy Corp. | United States | 2,200,000 | | 68,882,000 |
| Great Plains Energy Inc. | United States | 4,300,000 | | 116,186,000 |
| IDACORP Inc. | United States | 400,000 | | 25,884,000 |
| ITC Holdings Corp. | United States | 300,000 | | 10,002,000 |
| NextEra Energy Inc. | United States | 2,900,000 | | 282,895,000 |
| OGE Energy Corp. | United States | 2,000,000 | | 54,720,000 |
| Pinnacle West Capital Corp. | United States | 1,900,000 | | 121,866,000 |
| PNM Resources Inc. | United States | 3,000,000 | | 84,150,000 |
| Portland General Electric Co. | United States | 1,800,000 | | 66,546,000 |
| PPL Corp. | United States | 5,000,000 | | 164,450,000 |
| The Southern Co. | United States | 3,600,000 | | 160,920,000 |
| SSE PLC | United Kingdom | 138,837 | | 3,140,946 |
| Westar Energy Inc. | United States | 2,700,000 | | 103,788,000 |
| Xcel Energy Inc. | United States | 4,600,000 | | 162,886,000 |
| | | | | 2,603,844,946 |
| Gas Utilities 2.2% | | | | |
| The Laclede Group Inc. | United States | 1,200,000 | | 65,436,000 |
| ONE Gas Inc. | United States | 438,181 | | 19,862,745 |
| Questar Corp. | United States | 1,700,000 | | 32,997,000 |
| | | | | 118,295,745 |
| Independent Power & Renewable Electricity Producers 0.8% | | | | |
| a,b8point3 Energy Partners LP | United States | 1,298,500 | | 13,777,085 |
| Drax Group PLC | United Kingdom | 8,000,000 | | 29,519,121 |
| | | | | 43,296,206 |
| Multi-Utilities 35.8% | | | | |
| Alliant Energy Corp. | United States | 1,600,000 | | 93,584,000 |
| Ameren Corp. | United States | 600,000 | | 25,362,000 |
| CenterPoint Energy Inc. | United States | 6,200,000 | | 111,848,000 |
| CMS Energy Corp. | United States | 4,700,000 | | 166,004,000 |
| Consolidated Edison Inc. | United States | 700,000 | | 46,795,000 |
| Dominion Resources Inc. | United States | 4,200,000 | | 295,596,000 |
| DTE Energy Co. | United States | 1,800,000 | | 144,666,000 |
| MDU Resources Group Inc. | United States | 4,000,000 | | 68,800,000 |
| National Grid PLC | United Kingdom | 11,000,000 | | 152,856,723 |
| NiSource Inc. | United States | 2,000,000 | | 37,100,000 |
| NorthWestern Corp. | United States | 596,800 | | 32,125,744 |
| PG&E Corp. | United States | 4,000,000 | | 211,200,000 |
| Public Service Enterprise Group Inc. | United States | 3,000,000 | | 126,480,000 |
| Sempra Energy | United States | 2,400,000 | | 232,128,000 |
| Vectren Corp. | United States | 925,100 | | 38,863,451 |
| WEC Energy Group Inc. | United States | 2,100,000 | | 109,662,000 |
| | | | | 1,893,070,918 |
| |
| |
| franklintempleton.com | | Annual Report | 107 |
FRANKLIN CUSTODIAN FUNDS
STATEMENT OF INVESTMENTS
| | | | | |
| Franklin Utilities Fund (continued) | | | | | |
| | Country | | Shares | | Value |
| Common Stocks (continued) | | | | | |
| Oil, Gas & Consumable Fuels 6.9% | | | | | |
| Columbia Pipeline Group Inc. | United States | | 1,500,000 | $ | 27,435,000 |
| Enbridge Inc. | Canada | | 800,000 | | 29,711,802 |
| Kinder Morgan Inc. | United States | | 3,000,000 | | 83,040,000 |
| aPlains GP Holdings LP, A | United States | | 2,600,000 | | 45,500,000 |
| Spectra Energy Corp. | United States | | 1,800,000 | | 47,286,000 |
| TransCanada Corp. | Canada | | 1,800,000 | | 56,935,127 |
| The Williams Cos. Inc. | United States | | 2,000,000 | | 73,700,000 |
| | | | | | 363,607,929 |
| Water Utilities 3.9% | | | | | |
| American Water Works Co. Inc. | United States | | 2,000,000 | | 110,160,000 |
| United Utilities Group PLC | United Kingdom | | 6,700,000 | | 93,721,697 |
| | | | | | 203,881,697 |
| Total Common Stocks (Cost $3,507,555,240) | | | | | 5,225,997,441 |
| |
| | | | Principal | | |
| | | | Amount | | |
| Corporate Bonds 1.0% | | | | | |
| Electric Utilities 0.1% | | | | | |
| Northeast Generation Co., senior secured note, B-1, 8.812%, 10/15/26 | United States | $ | 6,158,203 | | 6,882,999 |
| Multi-Utilities 0.9% | | | | | |
| Aquila Inc., senior note, 8.27%, 11/15/21 | United States | | 6,100,000 | | 7,764,105 |
| MidAmerican Energy Holdings Co., senior note, 8.48%, 9/15/28 | United States | | 25,000,000 | | 37,219,525 |
| | | | | | 44,983,630 |
| Total Corporate Bonds (Cost $37,393,050) | | | | | 51,866,629 |
| Total Investments before Short Term Investments | | | | | |
| (Cost $3,544,948,290) | | | | | 5,277,864,070 |
| |
| | | | Shares | | |
| Short Term Investments (Cost $2,850,614) 0.0%† | | | | | |
| Money Market Funds 0.0%† | | | | | |
| a,cInstitutional Fiduciary Trust Money Market Portfolio | United States | | 2,850,614 | | 2,850,614 |
| Total Investments (Cost $3,547,798,904) 99.8% | | | | | 5,280,714,684 |
| Other Assets, less Liabilities 0.2% | | | | | 9,786,232 |
| Net Assets 100.0% | | | | $ | 5,290,500,916 |
See Abbreviations on page 136.
†Rounds to less than 0.1% of net assets.
aNon-income producing.
bSee Note 11 regarding holdings of 5% voting securities.
cSee Note 3(f) regarding investments in Institutional Fiduciary Trust Money Market Portfolio.
108 |
Annual Report | The accompanying notes are an integral part of these financial statements. franklintempleton.com
| | | | | | | | | |
| | | | | | | FRANKLIN CUSTODIAN FUNDS | |
| |
| |
| |
| |
| Financial Statements | | | | | | | | | |
| |
| Statements of Assets and Liabilities | | | | | | | | | |
| September 30, 2015 | | | | | | | | | |
| |
| | | Franklin | | | | Franklin | | Franklin | |
| | | DynaTech Fund | | | | Growth Fund | | Income Fund | |
| Assets: | | | | | | | | | |
| Investments in securities: | | | | | | | | | |
| Cost - Unaffiliated issuers | $ | 1,595,101,747 | | | $ | 4,494,166,965 | $ | 79,958,305,808 | |
| Cost - Non-controlled affiliated issuers (Note 11) | | — | | | | — | | 2,908,983,505 | |
| Cost - Sweep Money Fund (Note 3f) | | 132,223,790 | | | | 1,399,136,183 | | 143,022,415 | |
| Cost - Repurchase agreements | | 58,645,517 | | | | — | | 5,428,545 | |
| Total cost of investments | $ | 1,785,971,054 | | | $ | 5,893,303,148 | $ | 83,015,740,273 | |
| Value - Unaffiliated issuers | $ | 2,531,655,388 | | | $ | 9,780,315,264 | $ | 75,045,257,860 | |
| Value - Non-controlled affiliated issuers (Note 11) | | — | | | | — | | 2,647,917,751 | |
| Value - Sweep Money Fund (Note 3f) | | 132,223,790 | | | | 1,399,136,183 | | 143,022,415 | |
| Value - Repurchase agreements | | 58,645,517 | | | | — | | 5,428,545 | |
| Total value of investmentsa | | 2,722,524,695 | | | | 11,179,451,447 | | 77,841,626,571 | |
| Cash | | — | | | | 553,835 | | 18,058,448 | |
| Receivables: | | | | | | | | | |
| Investment securities sold | | 5,679,018 | | | | — | | 704,603,363 | |
| Capital shares sold | | 6,415,957 | | | | 11,643,461 | | 76,819,943 | |
| Dividends and interest | | 884,152 | | | | 7,118,118 | | 682,418,091 | |
| Other assets | | 611 | | | | 2,809 | | 33,995,169 | |
| Total assets | | 2,735,504,433 | | | | 11,198,769,670 | | 79,357,521,585 | |
| Liabilities: | | | | | | | | | |
| Payables: | | | | | | | | | |
| Investment securities purchased | | 18,749,450 | | | | 26,650,957 | | 160,025,475 | |
| Capital shares redeemed | | 3,421,359 | | | | 15,961,606 | | 188,045,020 | |
| Management fees | | 1,020,967 | | | | 4,000,721 | | 24,293,930 | |
| Distribution fees | | 1,305,625 | | | | 4,909,024 | | 39,743,005 | |
| Transfer agent fees | | 633,354 | | | | 3,864,506 | | 12,343,171 | |
| Payable upon return of securities loaned | | — | | | | — | | 32,178,545 | |
| Unrealized depreciation on unfunded loan commitments (Note 9) | | — | | | | — | | 4,028,670 | |
| Accrued expenses and other liabilities | | 125,526 | | | | 480,937 | | 3,253,070 | |
| Total liabilities | | 25,256,281 | | | | 55,867,751 | | 463,910,886 | |
| Net assets, at value | $ | 2,710,248,152 | | $ | | 11,142,901,919 | $ | 78,893,610,699 | |
| Net assets consist of: | | | | | | | | | |
| Paid-in capital | $ | 1,709,859,151 | | | $ | 5,449,891,071 | $ | 88,849,158,723 | |
| Undistributed net investment income (loss) | | (8,521,276 | ) | | | 38,123,825 | | 2,068,832 | |
| Net unrealized appreciation (depreciation) | | 936,554,471 | | | | 5,286,148,299 | | (5,178,552,046 | ) |
| Accumulated net realized gain (loss) | | 72,355,806 | | | | 368,738,724 | | (4,779,064,810 | ) |
| Net assets, at value | $ | 2,710,248,152 | | $ | | 11,142,901,919 | $ | 78,893,610,699 | |
| |
| |
| |
| aIncludes securities loaned | $ | — | | $ | | — | $ | 29,652,711 | |
franklintempleton.com
| 109
The accompanying notes are an integral part of these financial statements. | Annual Report
FRANKLIN CUSTODIAN FUNDS
FINANCIAL STATEMENTS
| | | | | | | |
| Statements of Assets and Liabilities (continued) | | | | | | | |
| September 30, 2015 | | | | | | | |
| |
| | | | Franklin | | Franklin | | Franklin |
| | | | DynaTech Fund | | Growth Fund | | Income Fund |
| Class A: | | | | | | | |
| Net assets, at value | $ | | 1,857,569,668 | $ | 7,185,664,729 | $ | 44,886,127,337 |
| Shares outstanding | | | 40,350,361 | | 99,254,227 | | 21,344,879,538 |
| Net asset value per sharea | | $ | 46.04 | $ | 72.40 | $ | 2.10 |
| Maximum offering price per share (net asset value per share ÷ 94.25%, | | | | | | | |
| 94.25%, 95.75% respectively) | | $ | 48.85 | $ | 76.82 | $ | 2.19 |
| Class C: | | | | | | | |
| Net assets, at value | $ | | 270,960,621 | $ | 777,570,288 | $ | 24,091,637,707 |
| Shares outstanding | | | 6,774,197 | | 11,576,502 | | 11,329,862,170 |
| Net asset value and maximum offering price per sharea | | $ | 40.00 | $ | 67.17 | $ | 2.13 |
| Class R: | | | | | | | |
| Net assets, at value | $ | | 43,000,744 | $ | 501,812,821 | $ | 416,653,142 |
| Shares outstanding | | | 952,210 | | 6,976,835 | | 201,440,677 |
| Net asset value and maximum offering price per share | | $ | 45.16 | $ | 71.93 | $ | 2.07 |
| Class R6: | | | | | | | |
| Net assets, at value | $ | | 362,626,668 | $ | 1,163,362,397 | $ | 1,744,717,950 |
| Shares outstanding | | | 7,691,453 | | 16,004,512 | | 835,947,792 |
| Net asset value and maximum offering price per share | | $ | 47.15 | $ | 72.69 | $ | 2.09 |
| Advisor Class: | | | | | | | |
| Net assets, at value | $ | | 176,090,451 | $ | 1,514,491,684 | $ | 7,754,474,563 |
| Shares outstanding | | | 3,749,697 | | 20,841,292 | | 3,716,586,118 |
| Net asset value and maximum offering price per share | | $ | 46.96 | $ | 72.67 | $ | 2.09 |
| |
| aRedemption price is equal to net asset value less contingent deferred sales charges, if applicable. | |
| 110 | Annual Report | The accompanying notes are an integral part of these financial statements. | franklintempleton.com |
| | | | | |
| | | FRANKLIN CUSTODIAN FUNDS |
| | | FINANCIAL STATEMENTS |
| |
| |
| Statements of Assets and Liabilities (continued) | | | | | |
| September 30, 2015 | | | | | |
| |
| | | Franklin | | | |
| | | U.S. Government | | | Franklin |
| | | Securities Fund | | | Utilities Fund |
| Assets: | | | | | |
| Investments in securities: | | | | | |
| Cost - Unaffiliated issuers | $ | 5,933,209,896 | | $ | 3,517,812,590 |
| Cost - Non-controlled affiliated issuers (Note 11) | | — | | | 27,135,700 |
| Cost - Sweep Money Fund (Note 3f) | | 106,304,328 | | | 2,850,614 |
| Total cost of investments | $ | 6,039,514,224 | | $ | 3,547,798,904 |
| Value - Unaffiliated issuers | $ | 6,154,542,413 | | $ | 5,264,086,985 |
| Value - Non-controlled affiliated issuers (Note 11) | | — | | | 13,777,085 |
| Value - Sweep Money Fund (Note 3f) | | 106,304,328 | | | 2,850,614 |
| Total value of investments | | 6,260,846,741 | | | 5,280,714,684 |
| Receivables: | | | | | |
| Investment securities sold | | 937 | | | 4,086,301 |
| Capital shares sold | | 9,739,884 | | | 3,277,061 |
| Dividends and interest | | 20,334,017 | | | 14,798,338 |
| Other assets | | 1,634 | | | 1,639 |
| Total assets | | 6,290,923,213 | | | 5,302,878,023 |
| Liabilities: | | | | | |
| Payables: | | | | | |
| Capital shares redeemed | | 11,855,671 | | | 7,042,341 |
| Management fees | | 2,343,968 | | | 2,004,808 |
| Distribution fees | | 2,201,629 | | | 1,978,013 |
| Transfer agent fees | | 1,277,840 | | | 1,094,795 |
| Distributions to shareholders | | 2,369,320 | | | — |
| Accrued expenses and other liabilities | | 269,717 | | | 257,150 |
| Total liabilities | | 20,318,145 | | | 12,377,107 |
| Net assets, at value | $ | 6,270,605,068 | | $ | 5,290,500,916 |
| Net assets consist of: | | | | | |
| Paid-in capital | $ | 6,449,230,545 | | $ | 3,383,903,992 |
| Undistributed net investment income (distributions in excess of net investment income) | | 294,091 | | | 12,353,529 |
| Net unrealized appreciation (depreciation) | | 221,332,517 | | | 1,732,867,283 |
| Accumulated net realized gain (loss) | | (400,252,085 | ) | | 161,376,112 |
| Net assets, at value | $ | 6,270,605,068 | | $ | 5,290,500,916 |
franklintempleton.com
| 111
The accompanying notes are an integral part of these financial statements. | Annual Report
| | | | | |
| FRANKLIN CUSTODIAN FUNDS | | | | | |
| FINANCIAL STATEMENTS | | | | | |
| |
| |
| Statements of Assets and Liabilities (continued) | | | | | |
| September 30, 2015 | | | | | |
| |
| | | | Franklin | | |
| | | | U.S. Government | | Franklin |
| | | | Securities Fund | | Utilities Fund |
| Class A: | | | | | |
| Net assets, at value | $ | | 4,167,639,107 | $ | 3,524,835,010 |
| Shares outstanding | | | 651,103,839 | | 219,216,217 |
| Net asset value per sharea | | $ | 6.40 | $ | 16.08 |
| Maximum offering price per share (net asset value per share ÷ 95.75%) | | $ | 6.68 | $ | 16.79 |
| Class C: | | | | | |
| Net assets, at value | $ | | 1,040,294,088 | $ | 931,799,761 |
| Shares outstanding | | | 163,594,395 | | 58,216,698 |
| Net asset value and maximum offering price per sharea | | $ | 6.36 | $ | 16.01 |
| Class R: | | | | | |
| Net assets, at value | $ | | 64,688,675 | $ | 83,270,776 |
| Shares outstanding | | | 10,112,860 | | 5,196,486 |
| Net asset value and maximum offering price per share | | $ | 6.40 | $ | 16.02 |
| Class R6: | | | | | |
| Net assets, at value | $ | | 375,643,835 | $ | 201,224,662 |
| Shares outstanding | | | 58,509,868 | | 12,433,146 |
| Net asset value and maximum offering price per share | | $ | 6.42 | $ | 16.18 |
| Advisor Class: | | | | | |
| Net assets, at value | $ | | 622,339,363 | $ | 549,370,707 |
| Shares outstanding | | | 96,925,372 | | 33,941,584 |
| Net asset value and maximum offering price per share | | $ | 6.42 | $ | 16.19 |
| |
| aRedemption price is equal to net asset value less contingent deferred sales charges, if applicable. | |
| 112 | Annual Report | The accompanying notes are an integral part of these financial statements. | franklintempleton.com |
| | | | | | | | | |
| | | | | | FRANKLIN CUSTODIAN FUNDS | |
| | | | | | FINANCIAL STATEMENTS | |
| |
| |
| Statements of Operations | | | | | | | | | |
| for the year ended September 30, 2015 | | | | | | | | | |
| |
| | | Franklin | | | Franklin | | | Franklin | |
| | | DynaTech Fund | | | Growth Fund | | | Income Fund | |
| Investment income: | | | | | | | | | |
| Dividends: | | | | | | | | | |
| Unaffiliated issuers | $ | 11,779,895 | | $ | 143,972,797 | | $ | 1,717,366,170 | |
| Non-controlled affiliated issuers (Note 11) | | — | | | — | | | 61,736,363 | |
| Interest: | | | | | | | | | |
| Unaffiliated issuers | | 1,265 | | | 282,041 | | | 2,724,418,807 | |
| Non-controlled affiliated issuers (Note 11) | | — | | | — | | | 81,847,980 | |
| Income from securities loaned | | — | | | — | | | 2,709,937 | |
| Total investment income | | 11,781,160 | | | 144,254,838 | | | 4,588,079,257 | |
| Expenses: | | | | | | | | | |
| Management fees (Note 3a) | | 11,949,129 | | | 51,441,072 | | | 333,192,369 | |
| Distribution fees: (Note 3c) | | | | | | | | | |
| Class A | | 4,364,908 | | | 18,441,142 | | | 77,469,522 | |
| Class C | | 2,473,092 | | | 7,738,470 | | | 180,948,934 | |
| Class R | | 231,665 | | | 2,882,398 | | | 2,447,042 | |
| Transfer agent fees: (Note 3e) | | | | | | | | | |
| Class A | | 2,716,707 | | | 12,648,153 | | | 39,515,082 | |
| Class C | | 384,469 | | | 1,326,889 | | | 21,302,224 | |
| Class R | | 72,351 | | | 988,530 | | | 374,596 | |
| Class R6 | | 870 | | | 3,267 | | | 4,833 | |
| Advisor Class | | 272,138 | | | 2,686,538 | | | 6,923,612 | |
| Custodian fees (Note 4) | | 55,520 | | | 170,225 | | | 1,159,693 | |
| Reports to shareholders | | 256,609 | | | 913,206 | | | 5,435,621 | |
| Registration and filing fees | | 221,289 | | | 360,605 | | | 2,151,511 | |
| Professional fees | | 52,436 | | | 117,173 | | | 409,836 | |
| Trustees’ fees and expenses | | 9,914 | | | 45,181 | | | 379,885 | |
| Other | | 37,379 | | | 152,854 | | | 1,403,170 | |
| Total expenses | | 23,098,476 | | | 99,915,703 | | | 673,117,930 | |
| Expense reductions (Note 4) | | — | | | (1,894 | ) | | (1,820 | ) |
| Expenses waived/paid by affiliates (Note 3f) | | (71,354 | ) | | (732,769 | ) | | (1,018,921 | ) |
| Net expenses | | 23,027,122 | | | 99,181,040 | | | 672,097,189 | |
| Net investment income (loss) | | (11,245,962 | ) | | 45,073,798 | | | 3,915,982,068 | |
| Realized and unrealized gains (losses): | | | | | | | | | |
| Net realized gain (loss) from: | | | | | | | | | |
| Investments: | | | | | | | | | |
| Unaffiliated issuers | | 76,641,298 | | | 443,656,595 | | | 194,509,833 | |
| Non-controlled affiliated issuers (Note 11) | | — | | | — | | | (1,580,344,999 | ) |
| Written options | | — | | | — | | | 25,016,239 | |
| Foreign currency transactions | | 72,490 | | | (131,637 | ) | | (7,693,414 | ) |
| Net realized gain (loss) | | 76,713,788 | | | 443,524,958 | | | (1,368,512,341 | ) |
| Net change in unrealized appreciation (depreciation) on: | | | | | | | | | |
| Investments | | (8,213,031 | ) | | (201,921,374 | ) | | (12,459,089,752 | ) |
| Translation of other assets and liabilities denominated in foreign | | | | | | | | | |
| currencies | | 970 | | | — | | | 1,861,661 | |
| Net change in unrealized appreciation (depreciation) | | (8,212,061 | ) | | (201,921,374 | ) | | (12,457,228,091 | ) |
| Net realized and unrealized gain (loss) | | 68,501,727 | | | 241,603,584 | | | (13,825,740,432 | ) |
| Net increase (decrease) in net assets resulting from operations | $ | 57,255,765 | | $ | 286,677,382 | | $ | (9,909,758,364 | ) |
franklintempleton.com
| 113
The accompanying notes are an integral part of these financial statements. | Annual Report
| | | | | | |
| FRANKLIN CUSTODIAN FUNDS | | | | | | |
| FINANCIAL STATEMENTS | | | | | | |
| |
| |
| Statements of Operations (continued) | | | | | | |
| for the year ended September 30, 2015 | | | | | | |
| |
| | | Franklin | | | | |
| | | U.S. Government | | | Franklin | |
| | | Securities Fund | | | Utilities Fund | |
| Investment income: | | | | | | |
| Dividends | $ | — | | $ | 206,813,505 | |
| Interest | | 258,006,931 | | | 3,974,605 | |
| Paydown loss | | (62,287,203 | ) | | — | |
| Income from securities loaned | | — | | | 465,697 | |
| Total investment income | | 195,719,728 | | | 211,253,807 | |
| Expenses: | | | | | | |
| Management fees (Note 3a) | | 29,105,483 | | | 26,647,562 | |
| Distribution fees: (Note 3c) | | | | | | |
| Class A | | 6,213,212 | | | 5,833,876 | |
| Class C | | 7,220,086 | | | 6,675,820 | |
| Class R | | 351,831 | | | 484,973 | |
| Transfer agent fees: (Note 3e) | | | | | | |
| Class A | | 5,740,740 | | | 4,437,206 | |
| Class C | | 1,506,910 | | | 1,171,767 | |
| Class R | | 95,519 | | | 110,779 | |
| Class R6 | | 1,469 | | | 2,143 | |
| Advisor Class | | 870,628 | | | 693,388 | |
| Custodian fees (Note 4) | | 56,921 | | | 82,962 | |
| Reports to shareholders | | 425,731 | | | 460,722 | |
| Registration and filing fees | | 179,644 | | | 230,036 | |
| Professional fees | | 73,547 | | | 84,878 | |
| Trustees’ fees and expenses | | 26,435 | | | 23,979 | |
| Other | | 532,133 | | | 86,042 | |
| Total expenses | | 52,400,289 | | | 47,026,133 | |
| Expense reductions (Note 4) | | (143 | ) | | — | |
| Expenses waived/paid by affiliates (Note 3f) | | (162,622 | ) | | (46,253 | ) |
| Net expenses | | 52,237,524 | | | 46,979,880 | |
| Net investment income | | 143,482,204 | | | 164,273,927 | |
| Realized and unrealized gains (losses): | | | | | | |
| Net realized gain (loss) from: | | | | | | |
| Investments | | 6,672,945 | | | 167,312,698 | |
| Foreign currency transactions | | — | | | (195,568 | ) |
| Net realized gain (loss) | | 6,672,945 | | | 167,117,130 | |
| Net change in unrealized appreciation (depreciation) on: | | | | | | |
| Investments | | (22,546,828 | ) | | (215,533,484 | ) |
| Translation of other assets and liabilities denominated in foreign currencies | | — | | | 63,619 | |
| Net change in unrealized appreciation (depreciation) | | (22,546,828 | ) | | (215,469,865 | ) |
| Net realized and unrealized gain (loss) | | (15,873,883 | ) | | (48,352,735 | ) |
| Net increase (decrease) in net assets resulting from operations | $ | 127,608,321 | | $ | 115,921,192 | |
114 |
Annual Report | The accompanying notes are an integral part of these financial statements.
franklintempleton.com
| | | | | | | | | | | | |
| | | | | | | | | FRANKLIN CUSTODIAN FUNDS | |
| | | | | | | | | FINANCIAL STATEMENTS | |
| |
| |
| Statements of Changes in Net Assets | | | | | | | | | | | | |
| |
| | | Franklin DynaTech Fund | | | Franklin Growth Fund | |
| | | Year Ended September 30, | | | Year Ended September 30, | |
| | | 2015 | | | 2014 | | | 2015 | | | 2014 | |
| Increase (decrease) in net assets: | | | | | | | | | | | | |
| Operations: | | | | | | | | | | | | |
| Net investment income (loss) | $ | (11,245,962 | ) | $ | (8,509,059 | ) | $ | 45,073,798 | | $ | 40,261,849 | |
| Net realized gain (loss) | | 76,713,788 | | | 105,306,700 | | | 443,524,958 | | | (18,140,011 | ) |
| Net change in unrealized appreciation (depreciation) | | (8,212,061 | ) | | 154,336,779 | | | (201,921,374 | ) | | 1,629,272,278 | |
| Net increase (decrease) in net assets resulting | | | | | | | | | | | | |
| from operations | | 57,255,765 | | | 251,134,420 | | | 286,677,382 | | | 1,651,394,116 | |
| Distributions to shareholders from: | | | | | | | | | | | | |
| Net investment income: | | | | | | | | | | | | |
| Class A | | — | | | — | | | (17,701,413 | ) | | (27,683,049 | ) |
| Class R | | — | | | — | | | — | | | (887,842 | ) |
| Class R6 | | — | | | — | | | (7,173,435 | ) | | (8,353,795 | ) |
| Advisor Class | | — | | | — | | | (7,135,723 | ) | | (8,082,884 | ) |
| Net realized gains: | | | | | | | | | | | | |
| Class A | | (52,815,773 | ) | | (47,796,268 | ) | | — | | | — | |
| Class C | | (8,572,795 | ) | | (8,696,764 | ) | | — | | | — | |
| Class R | | (1,588,330 | ) | | (1,742,295 | ) | | — | | | — | |
| Class R6 | | (11,564,117 | ) | | (13,471,107 | ) | | — | | | — | |
| Advisor Class | | (5,461,764 | ) | | (5,233,437 | ) | | — | | | — | |
| Total distributions to shareholders | | (80,002,779 | ) | | (76,939,871 | ) | | (32,010,571 | ) | | (45,007,570 | ) |
| Capital share transactions: (Note 2) | | | | | | | | | | | | |
| Class A | | 370,383,990 | | | 320,357,428 | | | 411,335,990 | | | 275,723,858 | |
| Class C | | 64,529,697 | | | 21,692,026 | | | 105,104,211 | | | 16,016,618 | |
| Class R | | (2,196,266 | ) | | (395,246 | ) | | (82,225,233 | ) | | (84,447,235 | ) |
| Class R6 | | 18,888,470 | | | (7,436,944 | ) | | 26,817,282 | | | 70,430,935 | |
| Advisor Class | | 17,214,652 | | | 24,965,632 | | | 65,080,465 | | | 122,013,386 | |
| Total capital share transactions | | 468,820,543 | | | 359,182,896 | | | 526,112,715 | | | 399,737,562 | |
| Net increase (decrease) in net assets | | 446,073,529 | | | 533,377,445 | | | 780,779,526 | | | 2,006,124,108 | |
| Net assets: | | | | | | | | | | | | |
| Beginning of year | | 2,264,174,623 | | | 1,730,797,178 | | | 10,362,122,393 | | | 8,355,998,285 | |
| End of year | $ | 2,710,248,152 | | $ | 2,264,174,623 | | $ | 11,142,901,919 | | $ | 10,362,122,393 | |
| Undistributed net investment income (loss) included in | | | | | | | | | | | | |
| net assets: | | | | | | | | | | | | |
| End of year | $ | (8,521,276 | ) | $ | (6,251,480 | ) | $ | 38,123,825 | | $ | 25,192,235 | |
franklintempleton.com
| 115
The accompanying notes are an integral part of these financial statements. | Annual Report
| | | | | | | | | | | | |
| FRANKLIN CUSTODIAN FUNDS | | | | | | | | | | | | |
| FINANCIAL STATEMENTS | | | | | | | | | | | | |
| |
| |
| Statements of Changes in Net Assets (continued) | | | | | | | | | | | | |
| |
| | | | | | | | | Franklin U.S. Government | |
| | | Franklin Income Fund | | | Securities Fund | |
| | | Year Ended September 30, | | | Year Ended September 30, | |
| | | 2015 | | | 2014 | | | 2015 | | | 2014 | |
| Increase (decrease) in net assets: | | | | | | | | | | | | |
| Operations: | | | | | | | | | | | | |
| Net investment income | $ | 3,915,982,068 | | $ | 3,721,931,310 | | $ | 143,482,204 | | $ | 185,414,463 | |
| Net realized gain (loss) | | (1,368,512,341 | ) | | 3,791,361,373 | | | 6,672,945 | | | (2,377,827 | ) |
| Net change in unrealized appreciation | | | | | | | | | | | | |
| (depreciation) | | (12,457,228,091 | ) | | 2,070,072,850 | | | (22,546,828 | ) | | 13,162,088 | |
| Net increase (decrease) in net assets resulting | | | | | | | | | | | | |
| from operations | | (9,909,758,364 | ) | | 9,583,365,533 | | | 127,608,321 | | | 196,198,724 | |
| Distributions to shareholders from: | | | | | | | | | | | | |
| Net investment income: | | | | | | | | | | | | |
| Class A | | (2,619,399,527 | ) | | (2,604,340,271 | ) | | (139,163,796 | ) | | (160,609,100 | ) |
| Class C | | (1,251,131,091 | ) | | (1,185,274,983 | ) | | (31,007,890 | ) | | (40,859,974 | ) |
| Class R | | (23,492,505 | ) | | (22,900,570 | ) | | (2,057,369 | ) | | (2,541,019 | ) |
| Class R6 | | (106,712,525 | ) | | (108,240,006 | ) | | (13,473,393 | ) | | (18,975,768 | ) |
| Advisor Class | | (475,823,657 | ) | | (366,385,613 | ) | | (21,952,307 | ) | | (27,139,385 | ) |
| Total distributions to shareholders | | (4,476,559,305 | ) | | (4,287,141,443 | ) | | (207,654,755 | ) | | (250,125,246 | ) |
| Capital share transactions: (Note 2) | | | | | | | | | | | | |
| Class A | | (765,848,401 | ) | | 2,315,349,376 | | | (102,856,884 | ) | | (780,787,234 | ) |
| Class C | | (331,371,839 | ) | | 3,192,666,235 | | | (136,825,329 | ) | | (439,991,270 | ) |
| Class R | | (21,217,142 | ) | | 39,402,467 | | | (8,900,898 | ) | | (19,028,290 | ) |
| Class R6 | | (43,676,141 | ) | | 59,293,823 | | | (117,420,534 | ) | | 20,086,199 | |
| Advisor Class | | 96,674,297 | | | 2,833,775,583 | | | (22,480,703 | ) | | (290,403,556 | ) |
| Total capital share transactions | | (1,065,439,226 | ) | | 8,440,487,484 | | | (388,484,348 | ) | | (1,510,124,151 | ) |
| Net increase (decrease) in net assets | | (15,451,756,895 | ) | | 13,736,711,574 | | | (468,530,782 | ) | | (1,564,050,673 | ) |
| Net assets: | | | | | | | | | | | | |
| Beginning of year | | 94,345,367,594 | | | 80,608,656,020 | | | 6,739,135,850 | | | 8,303,186,523 | |
| End of year | $ | 78,893,610,699 | | $ | 94,345,367,594 | | $ | 6,270,605,068 | | $ | 6,739,135,850 | |
| Undistributed net investment income (distributions in | | | | | | | | | | | | |
| excess of net investment income) included in | | | | | | | | | | | | |
| net assets: | | | | | | | | | | | | |
| End of year | $ | 2,068,832 | | $ | (9,047,026 | ) | $ | 294,091 | | $ | 199,705 | |
116 |
Annual Report | The accompanying notes are an integral part of these financial statements.
franklintempleton.com
| | | | | | |
| | | FRANKLIN CUSTODIAN FUNDS | |
| | | FINANCIAL STATEMENTS | |
| |
| |
| Statements of Changes in Net Assets (continued) | | | | | | |
| |
| | | Franklin Utilities Fund | |
| | | Year Ended September 30, | |
| | | 2015 | | | 2014 | |
| Increase (decrease) in net assets: | | | | | | |
| Operations: | | | | | | |
| Net investment income | $ | 164,273,927 | | $ | 157,359,225 | |
| Net realized gain (loss) | | 167,117,130 | | | 144,072,177 | |
| Net change in unrealized appreciation (depreciation) | | (215,469,865 | ) | | 507,401,760 | |
| Net increase (decrease) in net assets resulting from operations | | 115,921,192 | | | 808,833,162 | |
| Distributions to shareholders from: | | | | | | |
| Net investment income: | | | | | | |
| Class A | | (108,522,416 | ) | | (108,592,280 | ) |
| Class C | | (23,635,072 | ) | | (24,014,791 | ) |
| Class R | | (2,354,864 | ) | | (2,519,737 | ) |
| Class R6 | | (7,004,985 | ) | | (7,920,985 | ) |
| Advisor Class | | (17,855,048 | ) | | (15,163,367 | ) |
| Net realized gains: | | | | | | |
| Class A | | (94,563,421 | ) | | (8,070,905 | ) |
| Class C | | (25,193,710 | ) | | (2,099,362 | ) |
| Class R | | (2,392,646 | ) | | (208,818 | ) |
| Class R6 | | (5,738,511 | ) | | (542,905 | ) |
| Advisor Class | | (14,963,811 | ) | | (948,180 | ) |
| Total distributions to shareholders | | (302,224,484 | ) | | (170,081,330 | ) |
| Capital share transactions: (Note 2) | | | | | | |
| Class A | | (68,305,043 | ) | | 10,997,734 | |
| Class C | | (22,237,201 | ) | | 29,377,765 | |
| Class R | | (9,199,737 | ) | | (1,938,388 | ) |
| Class R6 | | (29,285,137 | ) | | (12,216,873 | ) |
| Advisor Class | | 7,979,532 | | | 164,532,653 | |
| Total capital share transactions | | (121,047,586 | ) | | 190,752,891 | |
| Net increase (decrease) in net assets | | (307,350,878 | ) | | 829,504,723 | |
| Net assets: | | | | | | |
| Beginning of year | | 5,597,851,794 | | | 4,768,347,071 | |
| End of year | $ | 5,290,500,916 | | $ | 5,597,851,794 | |
| Undistributed net investment income included in net assets: | | | | | | |
| End of year | $ | 12,353,529 | | $ | 7,533,397 | |
franklintempleton.com
| 117
The accompanying notes are an integral part of these financial statements. | Annual Report
FRANKLIN CUSTODIAN FUNDS
Notes to Financial Statements
1. Organization and Significant Accounting Policies
Franklin Custodian Funds (Trust) is registered under the Investment Company Act of 1940 (1940 Act) as an open-end management investment company, consisting of five separate funds (Funds) and applies the specialized accounting and reporting guidance in U.S. Generally Accepted Accounting Principles (U.S. GAAP). The Funds offer five classes of shares: Class A, Class C, Class R, Class R6, and Advisor Class. Each class of shares differs by its initial sales load, contingent deferred sales charges, voting rights on matters affecting a single class, its exchange privilege and fees primarily due to differing arrangements for distribution and transfer agent fees.
The following summarizes the Funds’ significant accounting policies.
a. Financial Instrument Valuation
The Funds’ investments in financial instruments are carried at fair value daily. Fair value is the price that would be received to sell an asset or paid to transfer a liability in an orderly transaction between market participants on the measurement date. The Funds calculate the net asset value (NAV) per share as of 4 p.m. Eastern time each day the New York Stock Exchange (NYSE) is open for trading. Under compliance policies and procedures approved by the Trust’s Board of Trustees (the Board), the Funds’ administrator has responsibility for oversight of valuation, including leading the cross-functional Valuation and Liquidity Oversight Committee (VLOC). The VLOC provides administration and oversight of the Funds’ valuation policies and procedures, which are approved annually by the Board. Among other things, these procedures allow the Funds to utilize independent pricing services, quotations from securities and financial instrument dealers, and other market sources to determine fair value.
Equity securities and derivative financial instruments (derivatives) listed on an exchange or on the NASDAQ National Market System are valued at the last quoted sale price or the official closing price of the day, respectively. Foreign equity securities are valued as of the close of trading on the foreign stock exchange on which the security is primarily traded or as of the NYSE close, whichever is earlier. The value is then converted into its U.S. dollar equivalent at the foreign exchange rate in effect at the NYSE close on the day that the value of the security is determined. Over-the-counter (OTC) securities are valued within the range of the most recent quoted bid and ask prices. Securities that trade in multiple markets or on multiple exchanges are valued according to the broadest and most representative market. Certain equity securities are valued based upon fundamental characteristics or relationships to similar securities.
Debt securities generally trade in the OTC market rather than on a securities exchange. The Funds’ pricing services use multiple valuation techniques to determine fair value. In instances where sufficient market activity exists, the pricing services may utilize a market-based approach through which quotes from market makers are used to determine fair value. In instances where sufficient market activity may not exist or is limited, the pricing services also utilize proprietary valuation models which may consider market characteristics such as benchmark yield curves, credit spreads, estimated default rates, anticipated market interest rate volatility, coupon rates, anticipated timing of principal repayments, underlying collateral, and other unique security features in order to estimate the relevant cash flows, which are then discounted to calculate the fair value. Securities denominated in a foreign currency are converted into their U.S. dollar equivalent at the foreign exchange rate in effect at the NYSE close on the date that the values of the foreign debt securities are determined.
Investments in open-end mutual funds are valued at the closing NAV. Repurchase agreements are valued at cost, which approximates fair value.
The Funds have procedures to determine the fair value of financial instruments for which market prices are not reliable or readily available. Under these procedures, the VLOC convenes on a regular basis to review such financial instruments and considers a number of factors, including significant unobservable valuation inputs, when arriving at fair value. The VLOC primarily employs a market-based approach which may use related or comparable assets or liabilities, recent transactions, market multiples, book values, and other relevant information for the investment to determine the fair value of the investment. An income-based valuation approach may also be used in which the anticipated future cash flows of the investment are discounted to calculate fair value. Discounts may also be applied due to the nature or duration of any restrictions on the disposition of the investments. Due to the inherent uncertainty of valuations of such investments, the fair values may differ significantly from the values that would have been used had an active market existed. The VLOC employs various methods for calibrating these valuation approaches including a
118 |
Annual Report
franklintempleton.com
FRANKLIN CUSTODIAN FUNDS
NOTES TO FINANCIAL STATEMENTS
regular review of key inputs and assumptions, transactional back-testing or disposition analysis, and reviews of any related market activity.
Trading in securities on foreign securities stock exchanges and OTC markets may be completed before the daily NYSE close. In addition, trading in certain foreign markets may not take place on every NYSE business day. Occasionally, events occur between the time at which trading in a foreign security is completed and the close of the NYSE that might call into question the reliability of the value of a portfolio security held by the Fund. As a result, differences may arise between the value of the Funds’ portfolio securities as determined at the foreign market close and the latest indications of value at the close of the NYSE. In order to minimize the potential for these differences, the VLOC monitors price movements following the close of trading in foreign stock markets through a series of country specific market proxies (such as baskets of American Depositary Receipts, futures contracts and exchange traded funds). These price movements are measured against established trigger thresholds for each specific market proxy to assist in determining if an event has occurred that may call into question the reliability of the values of the foreign securities held by the Funds. If such an event occurs, the securities may be valued using fair value procedures, which may include the use of independent pricing services.
When the last day of the reporting period is a non-business day, certain foreign markets may be open on those days that the NYSE is closed, which could result in differences between the value of the Funds’ portfolio securities on the last business day and the last calendar day of the reporting period. Any significant security valuation changes due to an open foreign market are adjusted and reflected by the Funds for financial reporting purposes.
b. Foreign Currency Translation
Portfolio securities and other assets and liabilities denominated in foreign currencies are translated into U.S. dollars based on the exchange rate of such currencies against U.S. dollars on the date of valuation. The Funds may enter into foreign currency exchange contracts to facilitate transactions denominated in a foreign currency. Purchases and sales of securities, income and expense items denominated in foreign currencies are translated into U.S. dollars at the exchange rate in effect on the transaction date. Portfolio securities and assets and liabilities denominated in foreign currencies contain risks that those currencies will decline in value relative to the U.S. dollar. Occasionally, events may impact the availability or reliability of foreign exchange rates used to convert the U.S. dollar equivalent value. If such an event occurs, the foreign exchange rate will be valued at fair value using procedures established and approved by the Board.
The Funds do not separately report the effect of changes in foreign exchange rates from changes in market prices on securities held. Such changes are included in net realized and unrealized gain or loss from investments in the Statements of Operations.
Realized foreign exchange gains or losses arise from sales of foreign currencies, currency gains or losses realized between the trade and settlement dates on securities transactions and the difference between the recorded amounts of dividends, interest, and foreign withholding taxes and the U.S. dollar equivalent of the amounts actually received or paid. Net unrealized foreign exchange gains and losses arise from changes in foreign exchange rates on foreign denominated assets and liabilities other than investments in securities held at the end of the reporting period.
c. Joint Repurchase Agreement
Certain or all Funds enter into a joint repurchase agreement whereby their uninvested cash balance is deposited into a joint cash account with other funds managed by the investment manager or an affiliate of the investment manager and is used to invest in one or more repurchase agreements. The value and face amount of the joint repurchase agreement are allocated to the funds based on their pro-rata interest. A repurchase agreement is accounted for as a loan by the Fund to the seller, collateralized by securities which are delivered to the Fund’s custodian. The fair value, including accrued interest, of the initial collateralization is required to be at least 102% of the dollar amount invested by the funds, with the value of the underlying securities marked to market daily to maintain coverage of at least 100%. Repurchase agreements are subject to the terms of Master Repurchase Agreements (MRAs) with approved counterparties (sellers). The MRAs contain various provisions, including but not limited to events of default and maintenance of collateral for repurchase agreements. In the event of default by either the seller or the Fund, certain MRAs may permit the non-defaulting party to net and close-out all transactions, if any, traded under such agreements. The Funds may sell securities it holds as collateral and apply the proceeds
franklintempleton.com
Annual Report
| 119
FRANKLIN CUSTODIAN FUNDS
NOTES TO FINANCIAL STATEMENTS
1. Organization and Significant Accounting
Policies (continued)
c. Joint Repurchase Agreement (continued)
towards the repurchase price and any other amounts owed by the seller to the Funds in the event of default by the seller. This could involve costs or delays in addition to a loss on the securities if their value falls below the repurchase price owed by the seller. The joint repurchase agreement held by the Funds at year end, as indicated in the Statement of Investments, had been entered into on September 30, 2015.
d. Securities Purchased on a When-Issued Basis
Certain or all Funds purchase securities on a when-issued basis, with payment and delivery scheduled for a future date. These transactions are subject to market fluctuations and are subject to the risk that the value at delivery may be more or less than the trade date purchase price. Although the Funds will generally purchase these securities with the intention of holding the securities, they may sell the securities before the settlement date. Sufficient assets have been segregated for these securities.
e. Derivative Financial Instruments
Certain or all Funds invested in derivatives in order to manage risk or gain exposure to various other investments or markets. Derivatives are financial contracts based on an underlying or notional amount, require no initial investment or an initial net investment that is smaller than would normally be required to have a similar response to changes in market factors, and require or permit net settlement. Derivatives contain various risks including the potential inability of the counterparty to fulfill their obligations under the terms of the contract, the potential for an illiquid secondary market, and/or the potential for market movements which expose the Fund to gains or losses in excess of the amounts shown in the Statements of Assets and Liabilities. Realized gain and loss and unrealized appreciation and depreciation on these contracts for the period are included in the Statements of Operations.
Collateral requirements differ by type of derivative. Collateral or initial margin requirements are set by the broker or exchange clearing house for exchange traded and centrally cleared derivatives. Initial margin deposited is held at the exchange and can be in the form of cash and/or securities.
Certain or all Funds purchased or wrote exchange traded option contracts primarily to manage exposure to equity price risk. An option is a contract entitling the holder to purchase or
sell a specific amount of shares or units of an asset or notional amount of a swap (swaption), at a specified price. When an option is purchased or written, an amount equal to the premium paid or received is recorded as an asset or liability, respectively. Upon exercise of an option, the acquisition cost or sales proceeds of the underlying investment is adjusted by any premium received or paid. Upon expiration of an option, any premium received or paid is recorded as a realized gain or loss. Upon closing an option other than through expiration or exercise, the difference between the premium received or paid and the cost to close the position is recorded as a realized gain or loss.
See Notes 6 and 10 regarding investment transactions and other derivative information, respectively.
f. Equity-Linked Securities
Certain or all Funds invest in equity-linked securities. Equity-linked securities are hybrid financial instruments that generally combine both debt and equity characteristics into a single note form. Income received from equity-linked securities is recorded as realized gains in the Statements of Operations and may be based on the performance of an underlying equity security, an equity index, or an option position. The risks of investing in equity-linked securities include unfavorable price movements in the underlying security and the credit risk of the issuing financial institution. There may be no guarantee of a return of principal with equity-linked securities and the appreciation potential may be limited. Equity-linked securities may be more volatile and less liquid than other investments held by the Funds.
g. Securities Lending
Certain or all Funds participate in an agency based securities lending program to earn additional income. The Fund receives cash collateral against the loaned securities in an amount equal to at least 102% of the fair value of the loaned securities. Collateral is maintained over the life of the loan in an amount not less than 100% of the fair value of loaned securities, as determined at the close of Fund business each day; any additional collateral required due to changes in security values is delivered to the Fund on the next business day. The collateral is deposited into a joint cash account with other funds and is used to invest in a money market fund managed by Franklin Advisers, Inc., an affiliate of the Funds, and/or a joint repurchase agreement. The Fund may receive income from the investment of cash collateral, in addition to lending fees and rebates paid by the borrower. Income from securities loaned is reported separately in the Statements of Operations. The Fund bears the market risk with respect to the collateral investment,
120 |
Annual Report
franklintempleton.com
FRANKLIN CUSTODIAN FUNDS
NOTES TO FINANCIAL STATEMENTS
securities loaned, and the risk that the agent may default on its obligations to the Fund. If the borrower defaults on its obligation to return the securities loaned, the Fund has the right to repurchase the securities in the open market using the collateral received. The securities lending agent has agreed to indemnify the Fund in the event of default by a third party borrower.
h. Mortgage Dollar Rolls
Certain or all Funds enter into mortgage dollar rolls, typically on a to-be-announced basis. Mortgage dollar rolls are agreements between the Fund and a financial institution to simultaneously sell and repurchase mortgage-backed securities at a future date. Gains or losses are realized on the initial sale, and the difference between the repurchase price and the sale price is recorded as an unrealized gain or loss to the Fund upon entering into the mortgage dollar roll. In addition, the Fund may invest the cash proceeds that are received from the initial sale. During the period between the sale and repurchase, the Fund is not entitled to principal and interest paid on the mortgage backed securities. The risks of mortgage dollar roll transactions include the potential inability of the counterparty to fulfill its obligations.
i. Senior Floating Rate Interests
Certain or all Funds invest in senior secured corporate loans that pay interest at rates which are periodically reset by reference to a base lending rate plus a spread. These base lending rates are generally the prime rate offered by a designated U.S. bank or the London InterBank Offered Rate (LIBOR). Senior secured corporate loans often require prepayment of principal from excess cash flows or at the discretion of the borrower. As a result, actual maturity may be substantially less than the stated maturity. Senior secured corporate loans in which the Funds invest are generally readily marketable, but may be subject to certain restrictions on resale.
j. Income and Deferred Taxes
It is each Fund’s policy to qualify as a regulated investment company under the Internal Revenue Code. Each Fund intends to distribute to shareholders substantially all of its taxable income and net realized gains to relieve it from federal income and excise taxes. As a result, no provision for U.S. federal income taxes is required.
The Funds may be subject to foreign taxation related to income received, capital gains on the sale of securities and certain foreign currency transactions in the foreign jurisdictions in which
the Funds invest. Foreign taxes, if any, are recorded based on the tax regulations and rates that exist in the foreign markets in which the Funds invest. When a capital gain tax is determined to apply, certain or all Funds record an estimated deferred tax liability in an amount that would be payable if the securities were disposed of on the valuation date. As a result of several court cases, in certain countries across the European Union, the Funds have filed additional tax reclaims for previously withheld taxes on dividends earned in those countries. These additional filings are subject to various administrative proceedings by the local jurisdictions’ tax authorities within the European Union, as well as a number of related judicial proceedings. At this time, uncertainty exists as to the ultimate resolution of these proceedings, the likelihood of receipt of these reclaims, and the potential timing of payment, and accordingly, no amounts are reflected in the financial statements.
Each Fund recognizes the tax benefits of uncertain tax positions only when the position is “more likely than not” to be sustained upon examination by the tax authorities based on the technical merits of the tax position. As of September 30, 2015, and for all open tax years, each Fund has determined that no liability for unrecognized tax benefits is required in each Fund’s financial statements related to uncertain tax positions taken on a tax return (or expected to be taken on future tax returns). Open tax years are those that remain subject to examination and are based on each tax jurisdiction’s statute of limitation.
k. Security Transactions, Investment Income, Expenses and Distributions
Security transactions are accounted for on trade date. Realized gains and losses on security transactions are determined on a specific identification basis. Interest income and estimated expenses are accrued daily. Amortization of premium and accretion of discount on debt securities are included in interest income. Paydown gains and losses are recorded separately in the Statements of Operations. Facility fees are recognized as income over the expected term of the loan. Dividend income is recorded on the ex-dividend date except for certain dividends from foreign securities where the dividend rate is not available. In such cases, the dividend is recorded as soon as the information is received by the Funds. Distributions to shareholders are recorded on the ex-dividend date and are determined according to income tax regulations (tax basis). Distributable earnings determined on a tax basis may differ from earnings recorded in accordance with U.S. GAAP. These differences may be permanent or temporary. Permanent differences are reclassified among capital accounts to reflect their tax character. These reclassifications have no impact on net assets or the results of
franklintempleton.com
Annual Report
| 121
FRANKLIN CUSTODIAN FUNDS
NOTES TO FINANCIAL STATEMENTS
1. Organization and Significant Accounting
Policies (continued)
k. Security Transactions, Investment Income, Expenses and Distributions (continued)
operations. Temporary differences are not reclassified, as they may reverse in subsequent periods.
Common expenses incurred by the Trust are allocated among the Funds based on the ratio of net assets of each Fund to the combined net assets of the Trust. Fund specific expenses are charged directly to the fund that incurred the expense.
Realized and unrealized gains and losses and net investment income, not including class specific expenses, are allocated daily to each class of shares based upon the relative proportion of net assets of each class. Differences in per share distributions, by class, are generally due to differences in class specific expenses.
l. Accounting Estimates
The preparation of financial statements in accordance with U.S. GAAP requires management to make estimates and assumptions that affect the reported amounts of assets and liabilities at the date of the financial statements and the amounts of income and expenses during the reporting period. Actual results could differ from those estimates.
m. Guarantees and Indemnifications
Under the Trust’s organizational documents, its officers and trustees are indemnified by the Trust against certain liabilities arising out of the performance of their duties to the Trust. Additionally, in the normal course of business, the Trust, on behalf of the Funds, enters into contracts with service providers that contain general indemnification clauses. The Trust’s maximum exposure under these arrangements is unknown as this would involve future claims that may be made against the Trust that have not yet occurred. Currently, the Trust expects the risk of loss to be remote.
2. Shares of Beneficial Interest
At September 30, 2015, there were an unlimited number of shares authorized (without par value). Transactions in the Funds’ shares were as follows:
| | | | | | | | | | |
| | Franklin DynaTech Fund | | Franklin Growth Fund | |
| | Shares | | | Amount | | Shares | | | Amount | |
| Class A Shares: | | | | | | | | | | |
| Year ended September 30, 2015 | | | | | | | | | | |
| Shares sold | 18,501,749 | | $ | 892,063,000 | | 21,692,171 | | $ | 1,636,207,846 | |
| Shares issued in reinvestment of distributions | 1,036,739 | | | 48,011,508 | | 215,218 | | | 16,016,600 | |
| Shares redeemed | (11,831,219 | ) | | (569,690,518 | ) | (16,414,655 | ) | | (1,240,888,456 | ) |
| Net increase (decrease) | 7,707,269 | | $ | 370,383,990 | | 5,492,734 | | $ | 411,335,990 | |
| Year ended September 30, 2014 | | | | | | | | | | |
| Shares sold | 19,957,583 | | $ | 893,692,093 | | 22,635,844 | | $ | 1,476,657,042 | |
| Shares issued in reinvestment of distributions | 1,036,302 | | | 44,498,813 | | 384,777 | | | 24,402,538 | |
| Shares redeemed | (13,817,735 | ) | | (617,833,478 | ) | (18,426,891 | ) | | (1,225,335,722 | ) |
| Net increase (decrease) | 7,176,150 | | $ | 320,357,428 | | 4,593,730 | | $ | 275,723,858 | |
| Class C Shares: | | | | | | | | | | |
| Year ended September 30, 2015 | | | | | | | | | | |
| Shares sold | 2,327,658 | | $ | 98,622,323 | | 3,260,956 | | $ | 229,365,295 | |
| Shares issued in reinvestment of distributions | 197,997 | | | 8,016,890 | | — | | | — | |
| Shares redeemed | (1,005,267 | ) | | (42,109,516 | ) | (1,761,541 | ) | | (124,261,084 | ) |
| Net increase (decrease) | 1,520,388 | | $ | 64,529,697 | | 1,499,415 | | $ | 105,104,211 | |
| Year ended September 30, 2014 | | | | | | | | | | |
| Shares sold | 1,329,394 | | $ | 52,341,287 | | 1,755,572 | | $ | 109,225,881 | |
| Shares issued in reinvestment of distributions | 212,392 | | | 8,070,893 | | — | | | — | |
| Shares redeemed | (992,766 | ) | | (38,720,154 | ) | (1,501,516 | ) | | (93,209,263 | ) |
| Net increase (decrease) | 549,020 | | $ | 21,692,026 | | 254,056 | | $ | 16,016,618 | |
122 |
Annual Report
franklintempleton.com
| | | | | | | | | | |
| | | | | | | FRANKLIN CUSTODIAN FUNDS | |
| | | | | NOTES TO FINANCIAL STATEMENTS | |
| |
| |
| |
| |
| | Franklin DynaTech Fund | | Franklin Growth Fund | |
| | Shares | | | Amount | | Shares | | | Amount | |
| |
| Class R Shares: | | | | | | | | | | |
| Year ended September 30, 2015 | | | | | | | | | | |
| Shares sold | 176,420 | | $ | 8,339,480 | | 1,222,443 | | $ | 91,843,479 | |
| Shares issued in reinvestment of distributions | 34,518 | | | 1,571,239 | | — | | | — | |
| Shares redeemed | (256,145 | ) | | (12,106,985 | ) | (2,319,903 | ) | | (174,068,712 | ) |
| Net increase (decrease) | (45,207 | ) | $ | (2,196,266 | ) | (1,097,460 | ) | $ | (82,225,233 | ) |
| Year ended September 30, 2014 | | | | | | | | | | |
| Shares sold | 223,778 | | $ | 9,798,197 | | 1,259,033 | | $ | 82,452,020 | |
| Shares issued in reinvestment of distributions | 40,870 | | | 1,730,443 | | 13,715 | | | 865,946 | |
| Shares redeemed | (273,168 | ) | | (11,923,886 | ) | (2,549,245 | ) | | (167,765,201 | ) |
| Net increase (decrease) | (8,520 | ) | $ | (395,246 | ) | (1,276,497 | ) | $ | (84,447,235 | ) |
| Class R6 Shares: | | | | | | | | | | |
| Year ended September 30, 2015 | | | | | | | | | | |
| Shares sold | 498,228 | | $ | 24,243,849 | | 1,852,609 | | $ | 140,977,540 | |
| Shares issued in reinvestment of distributions | 244,640 | | | 11,564,117 | | 88,714 | | | 6,605,680 | |
| Shares redeemed | (341,976 | ) | | (16,919,496 | ) | (1,593,869 | ) | | (120,765,938 | ) |
| Net increase (decrease) | 400,892 | | $ | 18,888,470 | | 347,454 | | $ | 26,817,282 | |
| Year ended September 30, 2014 | | | | | | | | | | |
| Shares sold | 392,771 | | $ | 17,760,072 | | 1,963,079 | | $ | 130,998,376 | |
| Shares issued in reinvestment of distributions | 308,823 | | | 13,470,860 | | 131,722 | | | 8,353,795 | |
| Shares redeemed | (835,479 | ) | | (38,667,876 | ) | (1,028,486 | ) | | (68,921,236 | ) |
| Net increase (decrease) | (133,885 | ) | $ | (7,436,944 | ) | 1,066,315 | | $ | 70,430,935 | |
| Advisor Class Shares: | | | | | | | | | | |
| Year ended September 30, 2015 | | | | | | | | | | |
| Shares sold | 1,507,866 | | $ | 73,683,045 | | 5,277,961 | | $ | 400,540,494 | |
| Shares issued in reinvestment of distributions | 109,767 | | | 5,174,431 | | 89,253 | | | 6,652,935 | |
| Shares redeemed | (1,264,457 | ) | | (61,642,824 | ) | (4,525,051 | ) | | (342,112,964 | ) |
| Net increase (decrease) | 353,176 | | $ | 17,214,652 | | 842,163 | | $ | 65,080,465 | |
| Year ended September 30, 2014 | | | | | | | | | | |
| Shares sold | 1,513,116 | | $ | 68,768,455 | | 6,902,426 | | $ | 453,057,572 | |
| Shares issued in reinvestment of distributions | 113,735 | | | 4,955,439 | | 117,373 | | | 7,454,331 | |
| Shares redeemed | (1,093,743 | ) | | (48,758,262 | ) | (5,135,737 | ) | | (338,498,517 | ) |
| Net increase (decrease) | 533,108 | | $ | 24,965,632 | | 1,884,062 | | $ | 122,013,386 | |
franklintempleton.com
Annual Report
| 123
FRANKLIN CUSTODIAN FUNDS
NOTES TO FINANCIAL STATEMENTS
| | | | | | | | | | | |
| 2. Shares of Beneficial Interest (continued) | | | | | | | | | | | |
| | | | | | | | Franklin U.S. Government | |
| | Franklin Income Fund | | Securities Fund | |
| | Shares | | | Amount | | Shares | | | Amount | |
| |
| Class A Shares: | | | | | | | | | | | |
| Year ended September 30, 2015 | | | | | | | | | | | |
| Shares sold | 2,723,862,225 | | $ | 6,464,708,282 | | 99,038,940 | | $ | 641,302,319 | |
| Shares issued in reinvestment of distributions | 990,884,317 | | | 2,344,531,358 | | 17,899,302 | | | 115,836,536 | |
| Shares redeemed | (4,082,116,553 | ) | | (9,575,088,041 | ) | (132,675,658 | ) | | (859,995,739 | ) |
| Net increase (decrease) | (367,370,011 | ) | $ | (765,848,401 | ) | (15,737,416 | ) | $ | (102,856,884 | ) |
| Year ended September 30, 2014 | | | | | | | | | | | |
| Shares sold | 3,713,448,419 | | $ | 9,155,988,584 | | 71,829,810 | | $ | 468,017,184 | |
| Shares issued in reinvestment of distributions | 947,331,186 | | | 2,322,103,838 | | 20,519,832 | | | 133,500,755 | |
| Shares redeemed | (3,708,820,886 | ) | | (9,162,743,046 | ) | (212,106,767 | ) | (1,382,305,173 | ) |
| Net increase (decrease) | 951,958,719 | | $ | 2,315,349,376 | | (119,757,125 | ) | $ | (780,787,234 | ) |
| Class C Shares: | | | | | | | | | | | |
| Year ended September 30, 2015 | | | | | | | | | | | |
| Shares sold | 1,515,518,749 | | $ | 3,644,318,312 | | 21,009,366 | | $ | 135,074,176 | |
| Shares issued in reinvestment of distributions | 444,186,624 | | | 1,062,744,412 | | 4,258,005 | | | 27,388,271 | |
| Shares redeemed | (2,129,021,084 | ) | | (5,038,434,563 | ) | (46,483,636 | ) | | (299,287,776 | ) |
| Net increase (decrease) | (169,315,711 | ) | $ | (331,371,839 | ) | (21,216,265 | ) | $ | (136,825,329 | ) |
| Year ended September 30, 2014 | | | | | | | | | | | |
| Shares sold | 2,337,404,601 | | $ | 5,828,986,276 | | 12,474,550 | | $ | 80,745,279 | |
| Shares issued in reinvestment of distributions | 403,069,357 | | | 999,703,501 | | 5,546,252 | | | 35,857,816 | |
| Shares redeemed | (1,458,897,007 | ) | | (3,636,023,542 | ) | (85,939,596 | ) | | (556,594,365 | ) |
| Net increase (decrease) | 1,281,576,951 | | $ | 3,192,666,235 | | (67,918,794 | ) | $ | (439,991,270 | ) |
| Class R Shares: | | | | | | | | | | | |
| Year ended September 30, 2015 | | | | | | | | | | | |
| Shares sold | 45,090,049 | | $ | 105,356,612 | | 2,921,544 | | $ | 18,930,156 | |
| Shares issued in reinvestment of distributions | 9,620,381 | | | | 22,391,889 | | 304,019 | | | 1,967,188 | |
| Shares redeemed | (64,261,612 | ) | | (148,965,643 | ) | (4,600,896 | ) | | (29,798,242 | ) |
| Net increase (decrease) | (9,551,182 | ) | | $ | (21,217,142 | ) | (1,375,333 | ) | $ | (8,900,898 | ) |
| Year ended September 30, 2014 | | | | | | | | | | | |
| Shares sold | 54,226,242 | | $ | 131,788,544 | | 2,650,032 | | $ | 17,247,466 | |
| Shares issued in reinvestment of distributions | 8,980,499 | | | | 21,708,289 | | 373,462 | | | 2,428,996 | |
| Shares redeemed | (46,938,172 | ) | | (114,094,366 | ) | (5,950,807 | ) | | (38,704,752 | ) |
| Net increase (decrease) | 16,268,569 | | | $ | 39,402,467 | | (2,927,313 | ) | $ | (19,028,290 | ) |
| Class R6 Shares: | | | | | | | | | | | |
| Year ended September 30, 2015 | | | | | | | | | | | |
| Shares sold | 17,167,618 | | | $ | 40,192,542 | | 14,239,234 | | $ | 92,767,162 | |
| Shares issued in reinvestment of distributions | 43,733,583 | | | 102,667,315 | | 1,973,225 | | | 12,808,747 | |
| Shares redeemed | (81,471,526 | ) | | (186,535,998 | ) | (34,161,637 | ) | | (222,996,443 | ) |
| Net increase (decrease) | (20,570,325 | ) | | $ | (43,676,141 | ) | (17,949,178 | ) | $ | (117,420,534 | ) |
| Year ended September 30, 2014 | | | | | | | | | | | |
| Shares sold | 40,517,766 | | | $ | 97,896,117 | | 8,007,305 | | $ | 52,198,801 | |
| Shares issued in reinvestment of distributions | 44,205,466 | | | 107,593,287 | | 2,880,560 | | | 18,796,291 | |
| Shares redeemed | (59,362,751 | ) | | (146,195,581 | ) | (7,784,399 | ) | | (50,908,893 | ) |
| Net increase (decrease) | 25,360,481 | | | $ | 59,293,823 | | 3,103,466 | | $ | 20,086,199 | |
124 |
Annual Report
franklintempleton.com
| | | | | | | | | | |
| | | | | | | FRANKLIN CUSTODIAN FUNDS | |
| | | | | NOTES TO FINANCIAL STATEMENTS | |
| |
| |
| |
| |
| | | | | | | Franklin U.S. Government | |
| | Franklin Income Fund | | Securities Fund | |
| | Shares | | | Amount | | Shares | | | Amount | |
| |
| Advisor Class Shares: | | | | | | | | | | |
| Year ended September 30, 2015 | | | | | | | | | | |
| Shares sold | 1,046,052,890 | | $ | 2,467,625,168 | | 27,570,106 | | $ | 179,399,346 | |
| Shares issued in reinvestment of distributions | 173,756,747 | | | 407,768,104 | | 2,960,236 | | | 19,220,147 | |
| Shares redeemed | (1,200,237,331 | ) | | (2,778,718,975 | ) | (33,965,158 | ) | | (221,100,196 | ) |
| Net increase (decrease) | 19,572,306 | | $ | 96,674,297 | | (3,434,816 | ) | $ | (22,480,703 | ) |
| Year ended September 30, 2014 | | | | | | | | | | |
| Shares sold | 1,562,121,375 | | $ | 3,859,740,670 | | 27,080,227 | | $ | 176,904,592 | |
| Shares issued in reinvestment of distributions | 125,980,982 | | | 307,395,314 | | 3,666,095 | | | 23,923,798 | |
| Shares redeemed | (545,540,026 | ) | | (1,333,360,401 | ) | (75,256,361 | ) | | (491,231,946 | ) |
| Net increase (decrease) | 1,142,562,331 | | $ | 2,833,775,583 | | (44,510,039 | ) | $ | (290,403,556 | ) |
| |
| | Franklin Utilities Fund | | | | | | |
| | Shares | | | Amount | | | | | | |
| |
| Class A Shares: | | | | | | | | | | |
| Year ended September 30, 2015 | | | | | | | | | | |
| Shares sold | 42,258,371 | | $ | 726,023,381 | | | | | | |
| Shares issued in reinvestment of distributions | 10,958,781 | | | 185,109,264 | | | | | | |
| Shares redeemed | (58,276,559 | ) | | (979,437,688 | ) | | | | | |
| Net increase (decrease) | (5,059,407 | ) | $ | (68,305,043 | ) | | | | | |
| Year ended September 30, 2014 | | | | | | | | | | |
| Shares sold | 39,649,168 | | $ | 636,235,264 | | | | | | |
| Shares issued in reinvestment of distributions | 6,698,177 | | | 105,396,539 | | | | | | |
| Shares redeemed | (46,046,709 | ) | | (730,634,069 | ) | | | | | |
| Net increase (decrease) | 300,636 | | $ | 10,997,734 | | | | | | |
| Class C Shares: | | | | | | | | | | |
| Year ended September 30, 2015 | | | | | | | | | | |
| Shares sold | 9,428,768 | | $ | 161,040,132 | | | | | | |
| Shares issued in reinvestment of distributions | 2,420,296 | | | 40,798,650 | | | | | | |
| Shares redeemed | (13,401,139 | ) | | (224,075,983 | ) | | | | | |
| Net increase (decrease) | (1,552,075 | ) | $ | (22,237,201 | ) | | | | | |
| Year ended September 30, 2014 | | | | | | | | | | |
| Shares sold | 9,642,854 | | $ | 153,687,794 | | | | | | |
| Shares issued in reinvestment of distributions | 1,349,832 | | | 21,125,954 | | | | | | |
| Shares redeemed | (9,258,751 | ) | | (145,435,983 | ) | | | | | |
| Net increase (decrease) | 1,733,935 | | $ | 29,377,765 | | | | | | |
| Class R Shares: | | | | | | | | | | |
| Year ended September 30, 2015 | | | | | | | | | | |
| Shares sold | 2,047,309 | | $ | 34,931,594 | | | | | | |
| Shares issued in reinvestment of distributions | 272,659 | | | 4,601,120 | | | | | | |
| Shares redeemed | (2,904,134 | ) | | (48,732,451 | ) | | | | | |
| Net increase (decrease) | (584,166 | ) | $ | (9,199,737 | ) | | | | | |
| Year ended September 30, 2014 | | | | | | | | | | |
| Shares sold | 2,212,911 | | $ | 35,338,931 | | | | | | |
| Shares issued in reinvestment of distributions | 168,631 | | | 2,642,310 | | | | | | |
| Shares redeemed | (2,515,315 | ) | | (39,919,629 | ) | | | | | |
| Net increase (decrease) | (133,773 | ) | $ | (1,938,388 | ) | | | | | |
franklintempleton.com
Annual Report
| 125
FRANKLIN CUSTODIAN FUNDS
NOTES TO FINANCIAL STATEMENTS
| | | | | |
| 2. Shares of Beneficial Interest (continued) | | | | | |
| | Franklin Utilities Fund | |
| | Shares | | | Amount | |
| |
| Class R6 Shares: | | | | | |
| Year ended September 30, 2015 | | | | | |
| Shares sold | 1,511,769 | | $ | 26,223,112 | |
| Shares issued in reinvestment of distributions | 749,780 | | | 12,743,496 | |
| Shares redeemed | (4,004,853 | ) | | (68,251,745 | ) |
| Net increase (decrease) | (1,743,304 | ) | $ | (29,285,137 | ) |
| Year ended September 30, 2014 | | | | | |
| Shares sold | 1,158,712 | | $ | 18,704,736 | |
| Shares issued in reinvestment of distributions | 534,709 | | | 8,463,891 | |
| Shares redeemed | (2,387,364 | ) | | (39,385,500 | ) |
| Net increase (decrease) | (693,943 | ) | $ | (12,216,873 | ) |
| Advisor Class Shares: | | | | | |
| Year ended September 30, 2015 | | | | | |
| Shares sold | 11,264,405 | | $ | 194,715,849 | |
| Shares issued in reinvestment of distributions | 1,799,910 | | | 30,585,241 | |
| Shares redeemed | (12,829,193 | ) | | (217,321,558 | ) |
| Net increase (decrease) | 235,122 | | $ | 7,979,532 | |
| Year ended September 30, 2014 | | | | | |
| Shares sold | 17,575,665 | | $ | 278,956,564 | |
| Shares issued in reinvestment of distributions | 912,471 | | | 14,538,476 | |
| Shares redeemed | (8,103,315 | ) | | (128,962,387 | ) |
| Net increase (decrease) | 10,384,821 | | $ | 164,532,653 | |
3. Transactions with Affiliates
Franklin Resources, Inc. is the holding company for various subsidiaries that together are referred to as Franklin Templeton Investments. Certain officers and trustees of the Trust are also officers and/or directors of the following subsidiaries:
| |
| Subsidiary | Affiliation |
| Franklin Advisers, Inc. (Advisers) | Investment manager |
| Franklin Templeton Services, LLC (FT Services) | Administrative manager |
| Franklin Templeton Distributors, Inc. (Distributors) | Principal underwriter |
| Franklin Templeton Investor Services, LLC (Investor Services) | Transfer agent |
126 |
Annual Report
franklintempleton.com
FRANKLIN CUSTODIAN FUNDS
NOTES TO FINANCIAL STATEMENTS
a. Management Fees
Franklin Income Fund and Franklin Utilities Fund pay an investment management fee to Advisers based on the month-end net assets of each of the Funds as follows:
| | |
| Annualized Fee Rate | | Net Assets |
| 0.625 | % | Up to and including $100 million |
| 0.500 | % | Over $100 million, up to and including $250 million |
| 0.450 | % | Over $250 million, up to and including $7.5 billion |
| 0.440 | % | Over $7.5 billion, up to and including $10 billion |
| 0.430 | % | Over $10 billion, up to and including $12.5 billion |
| 0.420 | % | Over $12.5 billion, up to and including $15 billion |
| 0.400 | % | Over $15 billion, up to and including $17.5 billion |
| 0.380 | % | Over $17.5 billion, up to and including $20 billion |
| 0.360 | % | Over $20 billion, up to and including $35 billion |
| 0.355 | % | Over $35 billion, up to and including $50 billion |
| 0.350 | % | Over $50 billion, up to and including $65 billion |
| 0.345 | % | Over $65 billion, up to and including $80 billion |
| 0.340 | % | In excess of $80 billion |
Franklin DynaTech Fund, Franklin Growth Fund and Franklin U.S. Government Securities Fund pay an investment management fee to Advisers based on the month-end net assets of each of the Funds as follows:
| | |
| Annualized Fee Rate | | Net Assets |
| 0.625 | % | Up to and including $100 million |
| 0.500 | % | Over $100 million, up to and including $250 million |
| 0.450 | % | Over $250 million, up to and including $7.5 billion |
| 0.440 | % | Over $7.5 billion, up to and including $10 billion |
| 0.430 | % | Over $10 billion, up to and including $12.5 billion |
| 0.420 | % | Over $12.5 billion, up to and including $15 billion |
| 0.400 | % | Over $15 billion, up to and including $17.5 billion |
| 0.380 | % | Over $17.5 billion, up to and including $20 billion |
| 0.360 | % | Over $20 billion, up to and including $35 billion |
| 0.355 | % | Over $35 billion, up to and including $50 billion |
| 0.350 | % | In excess of $50 billion |
b. Administrative Fees
Under an agreement with Advisers, FT Services provides administrative services to the Funds. The fee is paid by Advisers based on each of the Funds’ average daily net assets, and is not an additional expense of the Funds.
franklintempleton.com
Annual Report
| 127
FRANKLIN CUSTODIAN FUNDS
NOTES TO FINANCIAL STATEMENTS
3. Transactions with Affiliates (continued)
c. Distribution Fees
The Board has adopted distribution plans for each share class, with the exception of Class R6 and Advisor Class shares, pursuant to Rule 12b-1 under the 1940 Act. Under the Funds’ Class A reimbursement distribution plans, the Funds reimburse Distributors for costs incurred in connection with the servicing, sale and distribution of each Fund’s shares up to the maximum annual plan rate for each class. Under the Class A reimbursement distribution plans, costs exceeding the maximum for the current plan year cannot be reimbursed in subsequent periods. In addition, under the Funds’ Class C and R compensation distribution plans, the Funds pay Distributors for costs incurred in connection with the servicing, sale and distribution of each Fund’s shares up to the maximum annual plan rate for each class. The plan year, for purposes of monitoring compliance with the maximum annual plan rates, is February 1 through January 31 for each Fund.
The maximum annual plan rates, based on the average daily net assets, for each class, are as follows:
| | | | | | | | | | |
| | | | | | | | Franklin U.S. | | | |
| | Franklin | | Franklin | | Franklin | | Government | | Franklin | |
| | DynaTech Fund | | Growth Fund | | Income Fund | | Securities Fund | | Utilities Fund | |
| Reimbursement Plans: | | | | | | | | | | |
| Class A | 0.25 | % | 0.25 | % | 0.15 | % | 0.15 | % | 0.15 | % |
| Compensation Plans: | | | | | | | | | | |
| Class C | 1.00 | % | 1.00 | % | 0.65 | % | 0.65 | % | 0.65 | % |
| Class R | 0.50 | % | 0.50 | % | 0.50 | % | 0.50 | % | 0.50 | % |
d. Sales Charges/Underwriting Agreements
Front-end sales charges and contingent deferred sales charges (CDSC) do not represent expenses of the Funds. These charges are deducted from the proceeds of sales of fund shares prior to investment or from redemption proceeds prior to remittance, as applicable. Distributors has advised the Funds of the following commission transactions related to the sales and redemptions of the Funds’ shares for the year:
| | | | | | | | | | |
| | | | | | | | | Franklin U.S. | | |
| | | Franklin | | Franklin | | Franklin | | Government | | Franklin |
| | | DynaTech Fund | | Growth Fund | | Income Fund | | Securities Fund | | Utilities Fund |
| Sales charges retained net of commissions | | | | | | | | | | |
| paid to unaffiliated broker/dealers | $ | 1,826,707 | $ | 4,014,593 | $ | 18,846,000 | $ | 871,599 | $ | 1,064,785 |
| |
| CDSC retained | $ | 39,472 | $ | 93,975 | $ | 3,474,943 | $ | 68,187 | $ | 152,928 |
e. Transfer Agent Fees
Each class of shares, except for Class R6, pays transfer agent fees to Investor Services for its performance of shareholder servicing obligations and reimburses Investor Services for out of pocket expenses incurred, including shareholding servicing fees paid to third parties. These fees are allocated daily based upon their relative proportion of such classes’ aggregate net assets. Class R6 pays Investor Services transfer agent fees specific to that class.
For the year ended September 30, 2015, the Funds paid transfer agent fees as noted in the Statements of Operations of which the following amounts were retained by Investor Services:
| | | | | | | | | | |
| | | | | | | | | Franklin U.S. | | |
| | | Franklin | | Franklin | | Franklin | | Government | | Franklin |
| | | DynaTech Fund | | Growth Fund | | Income Fund | | Securities Fund | | Utilities Fund |
| |
| Transfer agent fees | $ | 1,596,433 | $ | 7,075,718 | $ | 24,189,528 | $ | 4,133,157 | $ | 2,756,445 |
128 |
Annual Report
franklintempleton.com
FRANKLIN CUSTODIAN FUNDS
NOTES TO FINANCIAL STATEMENTS
f. Investments in Institutional Fiduciary Trust Money Market Portfolio
Certain or all Funds invest in Institutional Fiduciary Trust Money Market Portfolio (Sweep Money Fund), an affiliated open-end management investment company. Management fees paid by the Funds are waived on assets invested in the Sweep Money Fund, as noted in the Statements of Operations, in an amount not to exceed the management and administrative fees paid directly or indirectly by the Sweep Money Fund. Prior to October 1, 2013, the waiver was accounted for as a reduction to management fees.
g. Waiver and Expense Reimbursements
Investor Services has contractually agreed in advance to waive or limit its fees so that the Class R6 transfer agent fees do not exceed 0.01% until January 31, 2016. There were no Class R6 transfer agent fees waived during the year ended September 30, 2015.
h. Other Affiliated Transactions
At September 30, 2015, one or more of the funds in Franklin Fund Allocator Series owned a percentage of the following Funds’ outstanding shares:
| | | | | | | | | |
| | | | | | | Franklin U.S. | | | |
| Franklin | | Franklin | | Franklin | | Government | | Franklin | |
| DynaTech Fund | | Growth Fund | | Income Fund | | Securities Fund | | Utilities Fund | |
| |
| 12.71 | % | 8.81 | % | 2.11 | % | 4.32 | % | 3.49 | % |
4. Expense Offset Arrangement
The Funds have entered into an arrangement with their custodian whereby credits realized as a result of uninvested cash balances are used to reduce a portion of the Funds’ custodian expenses. During the year ended September 30, 2015, the custodian fees were reduced as noted in the Statements of Operations.
5. Income Taxes
For tax purposes, capital losses may be carried over to offset future capital gains. Capital loss carryforwards with no expiration, if any, must be fully utilized before those losses with expiration dates.
| | | | | |
| At September 30, 2015, the capital loss carryforwards were as follows: | | |
| |
| | | | | | Franklin U.S. |
| | | | Franklin | | Government |
| | | | Income Fund Securities Fund |
| Capital loss carryforwards subject to expiration: | | | | | |
| 2016 | | $ | — | $ | 20,514,778 |
| 2017 | | | — | | 18,668,917 |
| 2018 | | | 2,298,838,256 | | 16,923,310 |
| 2019 | | | — | | 4,445,156 |
| Capital loss carryforwards not subject to expiration: | | | | | |
| Short term | | | — | | 118,712,269 |
| Long term | | | — | | 220,987,655 |
| Total capital loss carryforwards | $ | 2,298,838,256 | $ | 400,252,085 |
During the year ended September 30, 2015, the Funds utilized capital loss carryforwards as follows:
| | | | | |
| | Franklin | | Franklin | | Franklin |
| | DynaTech Fund | | Growth Fund | | Income Fund |
| |
| $ | 3,499,727 | $ | 75,830,913 | $ | 374,467,716 |
franklintempleton.com
Annual Report
| 129
FRANKLIN CUSTODIAN FUNDS
NOTES TO FINANCIAL STATEMENTS
5. Income Taxes (continued)
The Franklin DynaTech Fund has foregone capital loss carryovers of $6,735,272 as a result of a timing difference between excise tax and income tax requirements relating to the expiration of capital loss carryovers, which were reclassified to paid-in capital.
On September 30, 2015, Franklin U.S. Government Securities Fund had expired capital loss carryforwards of $28,034,940, which were reclassified to paid-in capital.
For tax purposes, the Funds may elect to defer any portion of a post-October capital loss or late-year ordinary loss to the first day of the following fiscal year. At September 30, 2015, Franklin Income Fund deferred post-October capital losses of $2,304,654,220, and Franklin DynaTech Fund and Franklin Income Fund deferred late-year ordinary losses of $8,521,276 and $27,174,262, respectively.
The tax character of distributions paid during the years ended September 30, 2015 and 2014, was as follows:
| | | | | | | | | |
| | | Franklin | | | Franklin |
| | | DynaTech Fund | | Growth Fund |
| | | 2015 | | | 2014 | | 2015 | | 2014 |
| Distributions paid from: | | | | | | | | | |
| Ordinary income | $ | — | | $ | — | $ | 32,010,571 | $ | 45,007,570 |
| Long term capital gain | | 80,002,779 | | | 76,939,871 | | — | | — |
| | $ | 80,002,779 | $ | 76,939,871 | $ | 32,010,571 | $ | 45,007,570 |
| |
| | | | | | | | Franklin |
| | | Franklin | | | U.S. Government |
| | | Income Fund | | Securities Fund |
| | | 2015 | | | 2014 | | 2015 | | 2014 |
| Distributions paid from: | | | | | | | | | |
| Ordinary income | $ | 4,476,559,305 | $ | 4,287,141,443 | $ | 207,654,755 | $ | 250,125,246 |
| |
| | | Franklin Utilities Fund | | | | |
| | | 2015 | | | 2014 | | | | |
| Distributions paid from: | | | | | | | | | |
| Ordinary income | $ | 181,502,767 | $ | 158,635,095 | | | | |
| Long term capital gain | | 120,721,717 | | | 11,446,235 | | | | |
| | $ | 302,224,484 | $ | 170,081,330 | | | | |
At September 30, 2015, the cost of investments, net unrealized appreciation (depreciation), undistributed ordinary income and undistributed long term capital gains for income tax purposes were as follows:
| | | | | | | | | |
| | | Franklin | | | Franklin | | | Franklin | |
| | | DynaTech Fund | | | Growth Fund | | | Income Fund | |
| Cost of investments | $ | 1,787,023,768 | | $ | 5,898,333,105 | | $ | 83,142,634,592 | |
| |
| Unrealized appreciation | $ | 969,213,133 | | $ | 5,435,969,065 | | $ | 6,140,070,766 | |
| Unrealized depreciation | | (33,712,206 | ) | | (154,850,723 | ) | | (11,441,078,787 | ) |
| Net unrealized appreciation (depreciation) | $ | 935,500,927 | | $ | 5,281,118,342 | | $ | (5,301,008,021 | ) |
| |
| Undistributed ordinary income | $ | — | | $ | 44,066,821 | | $ | — | |
| Undistributed long term capital gains | | 73,408,519 | | | 367,825,682 | | | — | |
| Distributable earnings | $ | 73,408,519 | | $ | 411,892,503 | | $ | — | |
130 |
Annual Report
franklintempleton.com
FRANKLIN CUSTODIAN FUNDS
NOTES TO FINANCIAL STATEMENTS
| | | | | | |
| | | Franklin U.S. | | | | |
| | | Government | | | Franklin | |
| | | Securities Fund | | | Utilities Fund | |
| Cost of investments | $ | 6,039,533,536 | | $ | 3,547,511,738 | |
| |
| Unrealized appreciation | $ | 243,327,648 | | $ | 1,878,461,985 | |
| Unrealized depreciation | | (22,014,443 | ) | | (145,259,039 | ) |
| Net unrealized appreciation (depreciation) | $ | 221,313,205 | | $ | 1,733,202,946 | |
| |
| Undistributed ordinary income | $ | 2,682,724 | | $ | 22,068,178 | |
| Undistributed long term capital gains | | — | | | 151,374,303 | |
| Distributable earnings | $ | 2,682,724 | | $ | 173,442,481 | |
Differences between income and/or capital gains as determined on a book basis and a tax basis are primarily due to differing treatments of paydown losses, bond discounts and premiums, corporate actions, equity-linked securities and wash sales.
6. Investment Transactions
Purchases and sales of investments (excluding short term securities) for the year ended September 30, 2015, were as follows:
| | | | | | | | | | |
| | | | | | | | | Franklin U.S. | | |
| | | Franklin | | Franklin | | Franklin | | Government | | Franklin |
| | | DynaTech Fund | | Growth Fund | | Income Fund | | Securities Fund | | Utilities Fund |
| |
| Purchases | $ | 1,032,388,410 | $ | 888,251,327 | $ | 39,689,473,598 | $ | 4,388,193,776 | $ | 551,222,703 |
| Sales | $ | 774,889,991 | $ | 514,464,577 | $ | 41,062,773,342 | $ | 4,970,632,336 | $ | 715,619,492 |
| | | | | |
| Transactions in options written during the year ended September 30, 2015, were as follows: | |
| |
| | Number of | | | Premiums | |
| | Contracts | | | Received | |
| Franklin Income Fund | | | | | |
| Options outstanding at September 30, 2014 | — | | $ | — | |
| Options written | 327,500 | | | 36,367,261 | |
| Options expired | (219,596 | ) | | (22,446,291 | ) |
| Options exercised | (97,904 | ) | | (11,137,422 | ) |
| Options closed | (10,000 | ) | | (2,783,548 | ) |
| Options outstanding at September 30, 2015 | — | | $ | — | |
See Notes 1(e) and 10 regarding derivative financial instruments and other derivative information, respectively.
7. Credit Risk and Defaulted Securities
At September 30, 2015, Franklin Income Fund had 18.61% of its portfolio invested in high yield, senior secured floating rate notes, or other securities rated below investment grade. These securities may be more sensitive to economic conditions causing greater price volatility and are potentially subject to a greater risk of loss due to default than higher rated securities.
Certain or all Funds held defaulted securities and/or other securities for which the income has been deemed uncollectible. At September 30, 2015, the aggregate value of these securities for Franklin Income Fund represents less than 0.05% of the Fund’s net assets. The Funds discontinue accruing income on securities for which income has been deemed uncollectible and provide an estimate for losses on interest receivable. The securities have been identified in the accompanying Statement of Investments.
franklintempleton.com
Annual Report
| 131
FRANKLIN CUSTODIAN FUNDS
NOTES TO FINANCIAL STATEMENTS
8. Restricted Securities
Certain or all Funds invest in securities that are restricted under the Securities Act of 1933 (1933 Act) or which are subject to legal, contractual, or other agreed upon restrictions on resale. Restricted securities are often purchased in private placement transactions, and cannot be sold without prior registration unless the sale is pursuant to an exemption under the 1933 Act. Disposal of these securities may require greater effort and expense, and prompt sale at an acceptable price may be difficult. The Funds may have registration rights for restricted securities. The issuer generally incurs all registration costs.
At September 30, 2015, Franklin Income Fund held investments in restricted securities, excluding certain securities exempt from registration under the 1933 Act deemed to be liquid, as follows:
| | | | | | |
| | | Acquisition | | | | |
| Shares | Issuer | Date | | Cost | | Value |
| |
| 21,666,666 | First Data Holdings Inc., B (Value is 0.14% of Net Assets) | 6/26/14 | $ | 86,666,664 | $ | 112,433,725 |
9. Unfunded Loan Commitments
Certain or all Funds enter into certain credit agreements, all or a portion of which may be unfunded. The Funds are obligated to fund these loan commitments at the borrowers’ discretion. Unfunded loan commitments and funded portions of credit agreements are marked to market daily and any unrealized appreciation or depreciation is included in the Statements of Assets and Liabilities and the Statements of Operations. Funded portions of credit agreements are presented in the Statement of Investments.
| | |
| | | Unfunded |
| Borrower | | Commitment |
| Franklin Income Fund | | |
| Frontier Communications Corp., Senior Unsecured Bridge Loan, FRN, | | |
| 6.50%, 6/10/16 | $ | 125,000,000 |
| Hercules Offshore Inc., First Lien Exit Facility, FRN, 6.50%, 11/07/15 | | 94,000,000 |
| | $ | 219,000,000 |
10. Other Derivative Information
For the year ended September 30, 2015, the effect of derivative contracts in Franklin Income Fund’s Statements of Operations was as follows:
| | | | |
| | | | | Change in |
| | | | | Unrealized |
| Derivative Contracts | | | Realized | Appreciation |
| Not Accounted for as | | | Gain (Loss) | (Depreciation) |
| Hedging Instruments | Statement of Operations Locations | | for the Year | for the Year |
| Equity contracts | Net realized gain (loss) from written options | $ | 25,016,239 | $ — |
For the year ended September 30, 2015, the average month end fair value of derivatives represented less than 0.01% of average month end net assets. The average month end number of open derivative contracts for the year was 3.
See Notes 1(e) and 6 regarding derivative financial instruments and investment transactions, respectively.
132 |
Annual Report
franklintempleton.com
FRANKLIN CUSTODIAN FUNDS
NOTES TO FINANCIAL STATEMENTS
11. Holdings of 5% Voting Securities of Portfolio Companies
The 1940 Act defines “affiliated companies” to include investments in portfolio companies in which a fund owns 5% or more of the outstanding voting securities. Investments in “affiliated companies” for certain or all Funds for the year ended September 30, 2015, were as shown below.
| | | | | | | | | | | | | |
| | Number of | | | | | Number of | | | | | | | |
| | Shares/ | | | | | Shares/ | | | | | | | |
| | Warrants/ | | | | | Warrants/ | | | | | | | |
| | Principal | | | | | Principal | | | | | | | |
| | Amount* | | | | | Amount* | | | | | | | |
| | Held at | | | | | Held at | | | | | | | |
| | Beginning | Gross | | Gross | | End | | Value at | | Investment | | Realized | |
| Name of Issuer | of Year | Additions | | Reductions | | of Year | | End of Year | | Income | | Gain (Loss) | |
| Franklin Income Fund | | | | | | | | | | | | | |
| Non-Controlled Affiliates | | | | | | | | | | | | | |
| Agrium Inc. | 7,500,000 | 1,000,000 | | (1,000,000 | ) | 7,500,000 | $ | 671,250,000 | $ | 19,880,438 | $ | 1,622,112 | |
| CEVA Group PLC, first lien, 144A, 7.00%, | | | | | | | | | | | | | |
| 3/01/21 | 15,000,000 | — | | (15,000,000 | ) | — | | — | | 122,500 | | (600,000 | ) |
| CEVA Group PLC, Pre-Funded L/C, 6.50%, | | | | | | | | | | | | | |
| 3/19/21 | 20,320,197 | — | | — | | 20,320,197 | | 18,245,850 | | 1,298,799 | | — | |
| CEVA Group PLC, secured note, 144A, | | | | | | | | | | | | | |
| 9.00%, 9/01/21 | 20,000,000 | — | | (20,000,000 | ) | — | | — | | 240,000 | | (1,050,000 | ) |
| CEVA Group PLC, senior note, first lien, | | | | | | | | | | | | | |
| 144A, 4.00%, 5/01/18 | 186,778,982 | — | | (12,000,000 | ) | 174,778,982 | | 154,679,399 | | 7,285,739 | | (880,000 | ) |
| CEVA Holdings LLC | 91,371 | — | | — | | 91,371 | | 54,822,636 | | — | | — | |
| CEVA Holdings LLC, cvt. pfd., A-1 | 2,897 | — | | — | | 2,897 | | 2,390,231 | | — | | — | |
| CEVA Holdings LLC, cvt. pfd., A-2 | 110,565 | — | | — | | 110,565 | | 66,339,048 | | — | | — | |
| Dex Media Inc. | 2,048,551 | — | | (2,048,551 | ) | — | | — | | — | | (1,058,967,774 | ) |
| Dex Media Inc., senior sub. note, PIK, | | | | | | | | | | | | | |
| 14.00%, 1/29/17 | 41,400,812 | 1,448,756 | | (42,849,568 | ) | — | | — | | 2,190,157 | | (35,569,463 | ) |
| Dex Media West LLC, Term Loan B, 8.00%, | | | | | | | | | | | | | |
| 12/30/16 | 1,482,107 | — | | (1,482,107 | ) | — | | — | | 7,705 | | 39,792 | |
| Dynegy Finance I Inc./Dynegy Finance II | | | | | | | | | | | | | |
| Inc., senior note, 144A, 6.75%, 11/01/19 | — | 270,000,000 | | 270,000,000 | b | — | | — | | 16,558,125 | | — | |
| Dynegy Finance I Inc./Dynegy Finance II | | | | | | | | | | | | | |
| Inc., senior note, 144A, 7.375%, 11/01/22 | — | 256,700,000 | | 256,700,000 | b | — | | — | | 17,230,027 | | — | |
| Dynegy Holdings Inc., Escrow Account | 1,024,235,000 | — | | (1,024,235,000 | )b | — | | — | | — | | — | |
| Dynegy Inc. | 16,000,000 | — | | (9,774,200 | ) | 6,225,800 | | —a | | — | | (41,218,399 | ) |
| Dynegy Inc., senior note, 5.875%, 6/01/23 | 105,000,000 | — | | (5,000,000 | ) | 100,000,000 | | —a | | 4,421,753 | | 56,616 | |
| Dynegy Inc., wts., 10/02/17 | 1,143,273 | — | | — | | 1,143,273 | | —a | | — | | — | |
| Dynegy Roseton Danskammer Pass Through | | | | | | | | | | | | | |
| Trust, Escrow Account, B | 40,000,000 | — | | (40,000,000 | ) | — | | — | | — | | 229,912 | |
| Halcon Resources Corp. | 301,159 | 54,469,606 | b | (7,270,765 | ) | 47,500,000 | | 25,175,000 | | — | | (1,390,721 | ) |
| Halcon Resources Corp., 13.00%, 2/15/22 | — | 341,510,000 | | — | | 341,510,000 | | 220,700,837 | | 2,466,461 | | — | |
| Halcon Resources Corp., 5.75%, cvt. | | | | | | | | | | | | | |
| pfd., A | 108,000 | — | | (71,000 | ) | 37,000 | | 4,194,875 | | 2,084,375 | | (51,553,527 | ) |
| Halcon Resources Corp., senior note, 144A, | | | | | | | | | | | | | |
| 8.625%, 2/01/20 | — | 130,000,000 | | — | | 130,000,000 | | 108,550,000 | | 3,153,156 | | — | |
| Halcon Resources Corp., senior note, | | | | | | | | | | | | | |
| 8.875%, 5/15/21 | 28,000,000 | 162,675,000 | | (177,300,000 | ) | 13,375,000 | | 4,079,375 | | 10,768,857 | | (136,176,938 | ) |
| Halcon Resources Corp., senior note, 9.75%, | | | | | | | | | | | | | |
| 7/15/20 | 100,000,000 | 254,700,000 | | (348,200,000 | ) | 6,500,000 | | 2,242,500 | | 14,924,975 | | (271,152,011 | ) |
| PG&E Corp. | 23,000,000 | 4,910,000 | | (3,000,000 | ) | 24,910,000 | | 1,315,248,000 | | 39,771,550 | | 24,298,976 | |
| cR.H. Donnelley Inc., Term Loan B, 9.75%, | | | | | | | | | | | | | |
| 12/30/16 | 22,277,846 | — | | (22,277,846 | ) | — | | — | | 1,179,726 | | (8,033,574 | ) |
| Total Affiliated Securities (Value is 3.36% of Net Assets) | | | | | | $ | 2,647,917,751 | $ | 143,584,343 | $ | (1,580,344,999 | ) |
franklintempleton.com
Annual Report
| 133
FRANKLIN CUSTODIAN FUNDS
NOTES TO FINANCIAL STATEMENTS
11. Holdings of 5% Voting Securities of Portfolio Companies (continued)
| | | | | | | | | |
| | Number of | | | Number of | | | | | |
| | Shares | | | Shares | | | | | |
| | Held at | | | Held at | | | | | |
| | Beginning | Gross | Gross | End | | Value at | Investment | | Realized |
| Name of Issuer | of Year | Additions | Reductions | of Year | | End of Year | Income | | Gain (Loss) |
| |
| Franklin Utilities Fund | | | | | | | | | |
| Non-Controlled Affiliates | | | | | | | | | |
| 8point3 Energy Partners LP (Value is | | | | | | | | | |
| 0.26% of Net Assets) | — | 1,298,500 | — | 1,298,500 | $ | 13,777,085 | $ — | $ | — |
*In U.S. dollars unless otherwise indicated.
aAs of September 30, 2015, no longer an affiliate.
bGross addition/reduction was the result of various corporate actions.
cCompany is a wholly owned subsidiary of Dex Media Inc.
12. Credit Facility
The Funds, together with other U.S. registered and foreign investment funds (collectively, Borrowers), managed by Franklin Templeton Investments, are borrowers in a joint syndicated senior unsecured credit facility totaling $2 billion (Global Credit Facility) which matures on February 12, 2016. This Global Credit Facility provides a source of funds to the Borrowers for temporary and emergency purposes, including the ability to meet future unanticipated or unusually large redemption requests.
Under the terms of the Global Credit Facility, the Funds shall, in addition to interest charged on any borrowings made by the Funds and other costs incurred by the Funds, pay their share of fees and expenses incurred in connection with the implementation and maintenance of the Global Credit Facility, based upon their relative share of the aggregate net assets of all of the Borrowers, including an annual commitment fee of 0.07% based upon the unused portion of the Global Credit Facility. These fees are reflected in other expenses in the Statements of Operations. During the year ended September 30, 2015, the Funds did not use the Global Credit Facility.
13. Fair Value Measurements
The Funds follow a fair value hierarchy that distinguishes between market data obtained from independent sources (observable inputs) and the Funds’ own market assumptions (unobservable inputs). These inputs are used in determining the value of the Funds’ financial instruments and are summarized in the following fair value hierarchy:
- Level 1 – quoted prices in active markets for identical financial instruments
- Level 2 – other significant observable inputs (including quoted prices for similar financial instruments, interest rates, prepayment speed, credit risk, etc.)
- Level 3 – significant unobservable inputs (including the Funds’ own assumptions in determining the fair value of financial instruments)
The input levels are not necessarily an indication of the risk or liquidity associated with financial instruments at that level.
For movements between the levels within the fair value hierarchy, the Funds have adopted a policy of recognizing the transfers as of the date of the underlying event which caused the movement.
134 |
Annual Report
franklintempleton.com
FRANKLIN CUSTODIAN FUNDS
NOTES TO FINANCIAL STATEMENTS
A summary of inputs used as of September 30, 2015, in valuing the Funds’ assets and liabilities carried at fair value, is as follows:
| | | | | | | | |
| | | Level 1 | | Level 2 | | Level 3 | | Total |
| Franklin DynaTech Fund | | | | | | | | |
| Assets: | | | | | | | | |
| Investments in Securities: | | | | | | | | |
| Equity Investmentsa | $ | 2,531,655,388 | $ | — | $ | — | $ | 2,531,655,388 |
| Short Term Investments | | 132,223,790 | | 58,645,517 | | — | | 190,869,307 |
| Total Investments in Securities | $ | 2,663,879,178 | $ | 58,645,517 | $ | — | $ | 2,722,524,695 |
| Franklin Growth Fund | | | | | | | | |
| Assets: | | | | | | | | |
| Investments in Securities: | | | | | | | | |
| Equity Investments:b | | | | | | | | |
| Pharmaceuticals, Biotechnology & Life Sciences | $ | 1,378,691,651 | $ | — | $ | 3,366,490 | $ | 1,382,058,141 |
| All Other Equity Investmentsa | | 8,398,257,123 | | — | | — | | 8,398,257,123 |
| Short Term Investments | | 1,399,136,183 | | — | | — | | 1,399,136,183 |
| Total Investments in Securities | $ | 11,176,084,957 | $ | — | $ | 3,366,490 | $ | 11,179,451,447 |
| Franklin Income Fund | | | | | | | | |
| Assets: | | | | | | | | |
| Investments in Securities: | | | | | | | | |
| Equity Investments:b | | | | | | | | |
| Energy | $ | 6,518,148,812 | $ | 89,396,445 | $ | 5,658,170 | $ | 6,613,203,427 |
| Financials | | 3,754,770,587 | | 70,214,250 | | — | | 3,824,984,837 |
| Industrials | | 5,980,904,500 | | — | | 123,551,915 | | 6,104,456,415 |
| Information Technology | | 1,629,737,210 | — | - | | 112,433,725 | | 1,742,170,935 |
| All Other Equity Investmentsa | | 24,987,134,747 | | — | | — | | 24,987,134,747 |
| Equity-Linked Securities | | — | | 8,075,979,432 | | — | | 8,075,979,432 |
| Convertible Bonds | | — | | 328,741,591 | | 23,906,250 | | 352,647,841 |
| Corporate Bonds | | — | | 23,431,704,275 | | 52,501,149 | | 23,484,205,424 |
| Senior Floating Rate Interests | | — | | 2,158,654,299 | | — | | 2,158,654,299 |
| Escrows and Litigation Trusts | | — | | — | | —c | | — |
| Short Term Investments | | 342,761,519 | | 155,427,695 | | — | | 498,189,214 |
| Total Investments in Securities | $ | 43,213,457,375 | $ | 34,310,117,987 | $ | 318,051,209 | $ | 77,841,626,571 |
| Liabilities: | | | | | | | | |
| Other Financial Instruments | | | | | | | | |
| Unfunded Loan Commitments | $ | — | $ | 4,028,670 | $ | — | $ | 4,028,670 |
| |
| Franklin U.S. Government Securities Fund | | | | | | | | |
| Assets: | | | | | | | | |
| Investments in Securities: | | | | | | | | |
| Mortgage-Backed Securities | $ | — | $ | 6,154,542,413 | $ | — | $ | 6,154,542,413 |
| Short Term Investments | | 106,304,328 | | — | | — | | 106,304,328 |
| Total Investments in Securities | $ | 106,304,328 | $ | 6,154,542,413 | $ | — | $ | 6,260,846,741 |
| Franklin Utilities Fund | | | | | | | | |
| Assets: | | | | | | | | |
| Investments in Securities: | | | | | | | | |
| Equity Investmentsa | $ | 5,225,997,441 | $ | — | $ | — | $ | 5,225,997,441 |
| Corporate Bonds | | — | | 51,866,629 | | — | | 51,866,629 |
| Short Term Investments | | 2,850,614 | | — | | — | | 2,850,614 |
| Total Investments in Securities | $ | 5,228,848,055 | $ | 51,866,629 | $ | — | $ | 5,280,714,684 |
aFor detailed categories, see the accompanying Statement of Investments.
bIncludes common, preferred and convertible preferred stocks as well as other equity investments.
cIncludes securities determined to have no value at September 30, 2015.
| 135
franklintempleton.com Annual Report
FRANKLIN CUSTODIAN FUNDS
NOTES TO FINANCIAL STATEMENTS
A reconciliation of assets in which Level 3 inputs are used in determining fair value is presented when there are significant Level 3 financial instruments at the end of the year.
14. New Accounting Pronouncements
In June 2014, the Financial Accounting Standards Board issued Accounting Standards Update (ASU) No. 2014-11, Transfers and Servicing (Topic 860), Repurchase-to-Maturity Transactions, Repurchase Financings, and Disclosures. The ASU changes the accounting for certain repurchase agreements and expands disclosure requirements related to repurchase agreements, securities lending, repurchase-to-maturity and similar transactions. The ASU is effective for certain transactions accounted for as a sale for interim and annual reporting periods beginning after December 15, 2014 and transactions accounted for as secured borrowings for annual periods beginning after December 15, 2014, and for interim periods beginning after March 15, 2015. Management has reviewed the requirements and believes the adoption of this ASU will not have a material impact on the financial statements.
15. Subsequent Events
The Funds have evaluated subsequent events through the issuance of the financial statements and determined that no events have occurred that require disclosure.
| | |
| Abbreviations | | |
| Currency | Selected Portfolio |
| EUR Euro | ADR | American Depositary Receipt |
| GBP British Pound | FHLB | Federal Home Loan Bank |
| | FHLMC | Federal Home Loan Mortgage Corp. |
| | FNMA | Federal National Mortgage Association |
| | FRN | Floating Rate Note |
| | GP | Graduated Payment |
| | L/C | Letter of Credit |
| | MTN | Medium Term Note |
| | PIK | Payment-In-Kind |
| | RBS | Royal Bank of Scotland PLC |
| | SF | Single Family |
136 |
Annual Report
franklintempleton.com
FRANKLIN CUSTODIAN FUNDS
Report of Independent Registered Public Accounting Firm
To the Board of Trustees and Shareholders of Franklin Custodian Funds
In our opinion, the accompanying statement of assets and liabilities, including the statement of investments, and the related statements of operations and of changes in net assets and the financial highlights present fairly, in all material respects, the financial position of Franklin DynaTech Fund, Franklin Growth Fund, Franklin Income Fund, Franklin U.S. Government Securities Fund and Franklin Utilities Fund (constituting The Franklin Custodian Funds, hereafter referred to as the (“Funds”) at September 30, 2015, the results of its operations for the year then ended, the changes in its net assets for each of the two years in the period then ended and the financial highlights for each of the periods presented, in conformity with accounting principles generally accepted in the United States of America. These financial statements and financial highlights (hereafter referred to as “financial statements”) are the responsibility of the Fund’s management. Our responsibility is to express an opinion on these financial statements based on our audits. We conducted our audits of these financial statements in accordance with the standards of the Public Company Accounting Oversight Board (United States). Those standards require that we plan and perform the audit to obtain reasonable assurance about whether the financial statements are free of material misstatement. An audit includes examining, on a test basis, evidence supporting the amounts and disclosures in the financial statements, assessing the accounting principles used and significant estimates made by management, and evaluating the overall financial statement presentation. We believe that our audits, which included confirmation of securities at September 30, 2015 by correspondence with the custodian, brokers and transfer agent, provide a reasonable basis for our opinion.
PricewaterhouseCoopers LLP
San Francisco, California
November 16, 2015
franklintempleton.com
Annual Report
| 137
FRANKLIN CUSTODIAN FUNDS
Tax Information (unaudited)
Under Section 852(b)(3)(C) of the Internal Revenue Code (Code), the Funds hereby report the maximum amount allowable but no less than the following amounts as long term capital gain dividends for the fiscal year ended September 30, 2015:
| | | |
| | Franklin | | Franklin |
| | DynaTech Fund | | Utilities Fund |
| $ | 80,002,779 | $ | 120,721,717 |
Under Section 871(k)(2)(C) of the Code, Franklin Utilities Fund hereby reports the maximum amount allowable but no less than $22,130,382 as short term capital gain dividends for purposes of the tax imposed under Section 871(a)(1)(A) of the Code for the fiscal year ended September 30, 2015.
Under Section 854(b)(1)(A) of the Code, the Funds hereby report the following percentage amounts of the ordinary income dividends as income qualifying for the dividends received deduction for the fiscal year ended September 30, 2015:
| | | | | |
| Franklin | | Franklin | | Franklin | |
| Growth Fund | | Income Fund | | Utilities Fund | |
| 100.00 | % | 25.78 | % | 100.00 | % |
Under Section 854(b)(1)(B) of the Code, the Funds hereby report the maximum amount allowable but no less than the following amounts as qualified dividends for purposes of the maximum rate under Section 1(h)(11) of the Code for the fiscal year ended September 30, 2015:
| | | | | | | |
| | Franklin | | Franklin | | Franklin | | Franklin |
| | DynaTech Fund | | Growth Fund | | Income Fund | | Utilities Fund |
| $ | 10,761,218 | $ | 141,593,755 | $ | 1,721,745,463 | $ | 206,046,220 |
Distributions, including qualified dividend income, paid during calendar year 2015 will be reported to shareholders on Form 1099-DIV by mid-February 2016. Shareholders are advised to check with their tax advisors for information on the treatment of these amounts on their individual income tax returns.
Under Section 871(k)(1)(C) of the Code, the Funds hereby report the maximum amount allowable but no less than the following amounts as interest related dividends for purposes of the tax imposed under Section 871(a)(1)(A) of the Code for the fiscal year ended September 30, 2015:
| | | |
| | | | Franklin |
| | Franklin | | U.S. Government |
| | Income Fund | | Securities Fund |
| $ | 1,958,434,686 | $ | 207,455,005 |
138 |
Annual Report
franklintempleton.com
FRANKLIN CUSTODIAN FUNDS
Board Members and Officers
The name, year of birth and address of the officers and board members, as well as their affiliations, positions held with the Trust, principal occupations during at least the past five years and number of portfolios overseen in the Franklin Templeton Investments fund complex, are shown below. Generally, each board member serves until that person’s successor is elected and qualified.
| | | | |
| Independent Board Members | | | |
| |
| | | | Number of Portfolios in | |
| Name, Year of Birth | | Length of | Fund Complex Overseen | Other Directorships Held |
| and Address | Position | Time Served | by Board Member* | During at Least the Past 5 Years |
| |
| Harris J. Ashton (1932) | Trustee | Since 1976 | 144 | Bar-S Foods (meat packing company) |
| One Franklin Parkway | | | | (1981-2010). |
| San Mateo, CA 94403-1906 | | | | |
| Principal Occupation During at Least the Past 5 Years: | | |
| Director of various companies; and formerly, Director, RBC Holdings, Inc. (bank holding company) (until 2002); and President, Chief Executive |
| Officer and Chairman of the Board, General Host Corporation (nursery and craft centers) (until 1998). | |
| |
| Mary C. Choksi (1950) | Trustee | Since | 119 | Avis Budget Group Inc. (car rental) |
| One Franklin Parkway | | October 2014 | | (2007-present), Omnicom Group Inc. |
| San Mateo, CA 94403-1906 | | | | (advertising and marketing communi- |
| | | | | cations services) (2011-present) and |
| | | | | H.J. Heinz Company (processed foods |
| | | | | and allied products) (1998-2006). |
| |
| Principal Occupation During at Least the Past 5 Years: | | |
| Senior Advisor, Strategic Investment Group (investment management group) (August 2015); director of various companies; and formerly, |
| Founding Partner and Senior Managing Director, Strategic Investment Group (investment management group) (1987-2015); Founding |
| Partner and Managing Director, Emerging Markets Management LLC (investment management firm) (1987-2011); and Loan Officer/Senior |
| Loan Officer/Senior Pension Investment Officer, World Bank Group (international financial institution) (1977-1987). |
| |
| Edith E. Holiday (1952) | Trustee | Since 1998 | 144 | Hess Corporation (exploration and |
| One Franklin Parkway | | | | refining of oil and gas) (1993-present), |
| San Mateo, CA 94403-1906 | | | | RTI International Metals, Inc. (manu- |
| | | | | facture and distribution of titanium) |
| | | | | (1999-present), Canadian National |
| | | | | Railway (railroad) (2001-present), |
| | | | | White Mountains Insurance Group, Ltd. |
| | | | | (holding company) (2004-present) and |
| | | | | H.J. Heinz Company (processed foods |
| | | | | and allied products) (1994-2013). |
| Principal Occupation During at Least the Past 5 Years: | | |
| Director or Trustee of various companies and trusts; and formerly, Assistant to the President of the United States and Secretary of the |
| Cabinet (1990-1993); General Counsel to the United States Treasury Department (1989-1990); and Counselor to the Secretary and |
| Assistant Secretary for Public Affairs and Public Liaison – United States Treasury Department (1988-1989). |
| |
| J. Michael Luttig (1954) | Trustee | Since 2009 | 144 | Boeing Capital Corporation |
| One Franklin Parkway | | | | (aircraft financing) (2006-2013). |
| San Mateo, CA 94403-1906 | | | | |
| |
| Principal Occupation During at Least the Past 5 Years: | | |
| Executive Vice President, General Counsel and member of the Executive Council, The Boeing Company (aerospace company); and |
| formerly, Federal Appeals Court Judge, U.S. Court of Appeals for the Fourth Circuit (1991-2006). | |
franklintempleton.com
Annual Report
| 139
| | | | |
| FRANKLIN CUSTODIAN FUNDS | | | |
| |
| |
| |
| |
| Independent Board Members (continued) | | |
| |
| | | | Number of Portfolios in | |
| Name, Year of Birth | | Length of | Fund Complex Overseen | Other Directorships Held |
| and Address | Position | Time Served | by Board Member* | During at Least the Past 5 Years |
| |
| Frank A. Olson (1932) | Trustee | Since 2005 | 144 | Hess Corporation (exploration and |
| One Franklin Parkway | | | | refining of oil and gas) (1998-2013). |
| San Mateo, CA 94403-1906 | | | | |
| |
| Principal Occupation During at Least the Past 5 Years: | | |
| Director of various companies; and formerly, Chairman of the Board, The Hertz Corporation (car rental) (1980-2000) and Chief Executive |
| Officer (1977-1999); and Chairman of the Board, President and Chief Executive Officer, UAL Corporation (airlines) (June-December 1987). |
| |
| Larry D. Thompson (1945) | Trustee | Since 2007 | 144 | Cbeyond, Inc. (business communi- |
| One Franklin Parkway | | | | cations provider) (2010-2012), The |
| San Mateo, CA 94403-1906 | | | | Southern Company (energy company) |
| | | | | (2014-present; previously 2010-2012) |
| | | | | and Graham Holdings Company |
| | | | | (education and media organization) |
| | | | | (2011-present). |
| Principal Occupation During at Least the Past 5 Years: | | |
| Director of various companies; John A. Sibley Professor of Corporate and Business Law, University of Georgia School of Law (January 2015; |
| previously 2011-2012); and formerly, Executive Vice President – Government Affairs, General Counsel and Corporate Secretary, PepsiCo, |
| Inc. (consumer products) (2012-2014); Senior Vice President – Government Affairs, General Counsel and Secretary, PepsiCo, Inc. |
| (2004-2011); Senior Fellow of The Brookings Institution (2003-2004); Visiting Professor, University of Georgia School of Law (2004); and |
| Deputy Attorney General, U.S. Department of Justice (2001-2003). | | |
| |
| John B. Wilson (1959) | Lead | Trustee since | 119 | None |
| One Franklin Parkway | Independent | 2007 and Lead | | |
| San Mateo, CA 94403-1906 | Trustee | Independent | | |
| | | Trustee since 2008 | | |
| |
| Principal Occupation During at Least the Past 5 Years: | | |
| President, Staples Europe (office supplies) (2012-present); President and Founder, Hyannis Port Capital, Inc. (real estate and private equity |
| investing); serves on private and non-profit boards; and formerly, Chief Operating Officer and Executive Vice President, Gap, Inc. (retail) |
| (1996-2000); Chief Financial Officer and Executive Vice President – Finance and Strategy, Staples, Inc. (1992-1996); Senior Vice President – |
| Corporate Planning, Northwest Airlines, Inc. (airlines) (1990-1992); and Vice President and Partner, Bain & Company (consulting firm) |
| (1986-1990). | | | | |
| |
| |
| |
| |
| Interested Board Members and Officers | | |
| |
| | | | Number of Portfolios in | |
| Name, Year of Birth | | Length of | Fund Complex Overseen | Other Directorships Held |
| and Address | Position | Time Served | by Board Member* | During at Least the Past 5 Years |
| |
| **Gregory E. Johnson (1961) | Trustee | Since 2013 | 161 | None |
| One Franklin Parkway | | | | |
| San Mateo, CA 94403-1906 | | | | |
| |
| Principal Occupation During at Least the Past 5 Years: | | |
| Chairman of the Board, Member – Office of the Chairman, Director and Chief Executive Officer, Franklin Resources, Inc.; officer and/or |
| director or trustee, as the case may be, of some of the other subsidiaries of Franklin Resources, Inc. and of 45 of the investment companies |
| in Franklin Templeton Investments; Vice Chairman, Investment Company Institute; and formerly, President, Franklin Resources, Inc. |
| (1994-2015). | | | | |
140 |
Annual Report
franklintempleton.com
FRANKLIN CUSTODIAN FUNDS
| | | | |
| Interested Board Members and Officers (continued) | |
| |
| | | | Number of Portfolios in | |
| Name, Year of Birth | | Length of | Fund Complex Overseen | Other Directorships Held |
| and Address | Position | Time Served | by Board Member* | During at Least the Past 5 Years |
| |
| **Rupert H. Johnson, Jr. (1940) Trustee and | Chairman of the | 144 | None |
| One Franklin Parkway | Vice President | Board since 2013, | | |
| San Mateo, CA 94403-1906 | | Trustee since 1983 | | |
| | | and Vice President | | |
| | | since 1982 | | |
| |
| Principal Occupation During at Least the Past 5 Years: | | |
| Vice Chairman, Member – Office of the Chairman and Director, Franklin Resources, Inc.; Director, Franklin Advisers, Inc.; Senior Vice |
| President, Franklin Advisory Services, LLC; and officer and/or director or trustee, as the case may be, of some of the other subsidiaries of |
| Franklin Resources, Inc. and of 43 of the investment companies in Franklin Templeton Investments. | |
| |
| Alison E. Baur (1964) | Vice President | Since 2012 | Not Applicable | Not Applicable |
| One Franklin Parkway | | | | |
| San Mateo, CA 94403-1906 | | | | |
| |
| Principal Occupation During at Least the Past 5 Years: | | |
| Deputy General Counsel, Franklin Templeton Investments; and officer of some of the other subsidiaries of Franklin Resources, Inc. and of 45 |
| of the investment companies in Franklin Templeton Investments. | | |
| |
| Laura F. Fergerson (1962) | Chief Executive Since 2009 | Not Applicable | Not Applicable |
| One Franklin Parkway | Officer – | | | |
| San Mateo, CA 94403-1906 | Finance and | | | |
| | Administration | | | |
| Principal Occupation During at Least the Past 5 Years: | | |
| Senior Vice President, Franklin Templeton Services, LLC; Vice President, Franklin Advisers, Inc. and Franklin Templeton Institutional, LLC; |
| and officer of 45 of the investment companies in Franklin Templeton Investments. | |
| |
| Gaston Gardey (1967) | Treasurer, | Since 2009 | Not Applicable | Not Applicable |
| One Franklin Parkway | Chief Financial | | | |
| San Mateo, CA 94403-1906 | Officer and | | | |
| | Chief | | | |
| | Accounting | | | |
| | Officer | | | |
| Principal Occupation During at Least the Past 5 Years: | | |
| Treasurer, U.S. Fund Administration & Reporting, Franklin Templeton Investments; and officer of 27 of the investment companies in Franklin |
| Templeton Investments. | | | | |
| |
| Aliya S. Gordon (1973) | Vice President | Since 2009 | Not Applicable | Not Applicable |
| One Franklin Parkway | | | | |
| San Mateo, CA 94403-1906 | | | | |
| |
| Principal Occupation During at Least the Past 5 Years: | | |
| Senior Associate General Counsel, Franklin Templeton Investments; and officer of 45 of the investment companies in Franklin Templeton |
| Investments. | | | | |
franklintempleton.com
Annual Report
| 141
| | | | |
| FRANKLIN CUSTODIAN FUNDS | | | |
| |
| |
| |
| |
| Interested Board Members and Officers (continued) | |
| |
| | | | Number of Portfolios in | |
| Name, Year of Birth | | Length of | Fund Complex Overseen | Other Directorships Held |
| and Address | Position | Time Served | by Board Member* | During at Least the Past 5 Years |
| |
| Steven J. Gray (1955) | Vice President | Since 2009 | Not Applicable | Not Applicable |
| One Franklin Parkway | | | | |
| San Mateo, CA 94403-1906 | | | | |
| |
| Principal Occupation During at Least the Past 5 Years: | | |
| Senior Associate General Counsel, Franklin Templeton Investments; Vice President, Franklin Templeton Distributors, Inc. and Franklin |
| Alternative Strategies Advisers, LLC; and officer of 45 of the investment companies in Franklin Templeton Investments. |
| |
| Selena L. Holmes (1965) | Vice President | Since 2012 | Not Applicable | Not Applicable |
| 100 Fountain Parkway | – AML | | | |
| St. Petersburg, FL 33716-1205 | Compliance | | | |
| |
| Principal Occupation During at Least the Past 5 Years: | | |
| Director, Global Compliance Monitoring; Chief Compliance Officer, Franklin Alternative Strategies Advisers, LLC; Vice President, Franklin |
| Templeton Companies, LLC; and officer of 45 of the investment companies in Franklin Templeton Investments. |
| |
| Edward B. Jamieson (1948) | President and | Since 2010 | Not Applicable | Not Applicable |
| One Franklin Parkway | Chief Executive | | | |
| San Mateo, CA 94403-1906 | Officer – | | | |
| | Investment | | | |
| | Management | | | |
| |
| Principal Occupation During at Least the Past 5 Years: | | |
| President, Chief Investment Officer and Director, Franklin Advisers, Inc.; Executive Vice President, Franklin Templeton Institutional, LLC; |
| and officer and/or trustee, as the case may be, of some of the other subsidiaries of Franklin Resources, Inc. and of 10 of the investment |
| companies in Franklin Templeton Investments. | | | |
| |
| Kimberly H. Novotny (1972) | Vice President | Since 2013 | Not Applicable | Not Applicable |
| 300 S.E. 2nd Street | | | | |
| Fort Lauderdale, FL 33301-1923 | | | | |
| |
| Principal Occupation During at Least the Past 5 Years: | | |
| Associate General Counsel, Franklin Templeton Investments; Vice President, Fiduciary Trust International of the South; Vice President, |
| Templeton Investment Counsel, LLC; Assistant Secretary, Franklin Resources, Inc.; and officer of 45 of the investment companies in Franklin |
| Templeton Investments. | | | | |
| |
| Robert C. Rosselot (1960) | Chief | Since 2013 | Not Applicable | Not Applicable |
| 300 S.E. 2nd Street | Compliance | | | |
| Fort Lauderdale, FL 33301-1923 | Officer | | | |
| |
| Principal Occupation During at Least the Past 5 Years: | | |
| Director, Global Compliance, Franklin Templeton Investments; Vice President, Franklin Templeton Companies, LLC; officer of 45 of the |
| investment companies in Franklin Templeton Investments; and formerly, Senior Associate General Counsel, Franklin Templeton Investments |
| (2007-2013); and Secretary and Vice President, Templeton Group of Funds (2004-2013). | |
| |
| Karen L. Skidmore (1952) | Vice President | Since 2006 | Not Applicable | Not Applicable |
| One Franklin Parkway | and Secretary | | | |
| San Mateo, CA 94403-1906 | | | | |
| |
| Principal Occupation During at Least the Past 5 Years: | | |
| Senior Associate General Counsel, Franklin Templeton Investments; and officer of 45 of the investment companies in Franklin Templeton |
| Investments. | | | | |
142 |
Annual Report
franklintempleton.com
FRANKLIN CUSTODIAN FUNDS
| | | | |
| Interested Board Members and Officers (continued) | |
| |
| | | | Number of Portfolios in | |
| Name, Year of Birth | | Length of | Fund Complex Overseen | Other Directorships Held |
| and Address | Position | Time Served | by Board Member* | During at Least the Past 5 Years |
| |
| Navid Tofigh (1972) | Vice President | Since | Not Applicable | Not Applicable |
| One Franklin Parkway | | November 2015 | | |
| San Mateo, CA 94403-1906 | | | | |
| |
| Principal Occupation During at Least the Past 5 Years: | | |
| Associate General Counsel, Franklin Templeton Investments; and officer of 45 of the investment companies in Franklin Templeton |
| Investments. | | | | |
| |
| Craig S. Tyle (1960) | Vice President | Since 2005 | Not Applicable | Not Applicable |
| One Franklin Parkway | | | | |
| San Mateo, CA 94403-1906 | | | | |
| |
| Principal Occupation During at Least the Past 5 Years: | | |
| General Counsel and Executive Vice President, Franklin Resources, Inc.; and officer of some of the other subsidiaries of Franklin Resources, |
| Inc. and of 45 of the investment companies in Franklin Templeton Investments. | |
| |
| Lori A. Weber (1964) | Vice President | Since 2011 | Not Applicable | Not Applicable |
| 300 S.E. 2nd Street | | | | |
| Fort Lauderdale, FL 33301-1923 | | | | |
| Principal Occupation During at Least the Past 5 Years: | | |
| Senior Associate General Counsel, Franklin Templeton Investments; Assistant Secretary, Franklin Resources, Inc.; Vice President and |
| Secretary, Templeton Investment Counsel, LLC; and officer of 45 of the investment companies in Franklin Templeton Investments. |
*We base the number of portfolios on each separate series of the U.S. registered investment companies within the Franklin Templeton Investments fund complex.
These portfolios have a common investment manager or affiliated investment managers.
**Gregory E. Johnson is considered to be an interested person of the Fund under the federal securities laws due to his position as an officer and director of Franklin
Resources, Inc. (Resources), which is the parent company of the Fund’s investment manager and distributor. Rupert H. Johnson, Jr. is considered to be an interested
person of the Fund under the federal securities laws due to his position as officer and director and major shareholder of Resources.
Note 1: Rupert H. Johnson, Jr. is the uncle of Gregory E. Johnson.
Note 2: Officer information is current as of the date of this report. It is possible that after this date, information about officers may change.
Note 3: Effective April 30, 2015, Sam Ginn ceased to be a trustee of the Fund.
The Sarbanes-Oxley Act of 2002 and Rules adopted by the Securities and Exchange Commission require the Fund to disclose whether the Fund’s Audit
Committee includes at least one member who is an audit committee financial expert within the meaning of such Act and Rules. The Fund’s Board has deter-
mined that there is at least one such financial expert on the Audit Committee and has designated John B. Wilson as its audit committee financial expert.
The Board believes that Mr. Wilson qualifies as such an expert in view of his extensive business background and experience, including service as chief
financial officer of Staples, Inc. from 1992 to 1996. Mr. Wilson has been a Member and Chairman of the Fund’s Audit Committee since 2007. As a result of
such background and experience, the Board believes that Mr. Wilson has acquired an understanding of generally accepted accounting principles and finan-
cial statements, the general application of such principles in connection with the accounting estimates, accruals and reserves, and analyzing and evaluating
financial statements that present a breadth and level of complexity of accounting issues generally comparable to those of the Fund, as well as an under-
standing of internal controls and procedures for financial reporting and an understanding of audit committee functions. Mr. Wilson is an independent
Board member as that term is defined under the relevant Securities and Exchange Commission Rules and Releases.
The Statement of Additional Information (SAI) includes additional information about the board members and is available, without charge, upon request.
Shareholders may call (800) DIAL BEN/342-5236 to request the SAI.
franklintempleton.com
Annual Report
| 143
FRANKLIN CUSTODIAN FUNDS
Shareholder Information
Proxy Voting Policies and Procedures
The Trust’s investment manager has established Proxy Voting Policies and Procedures (Policies) that the Trust uses to determine how to vote proxies relating to portfolio securities. Shareholders may view the Trust’s complete Policies online at franklintempleton.com. Alternatively, shareholders may request copies of the Policies free of charge by calling the Proxy Group collect at (954) 527-7678 or by sending a written request to: Franklin Templeton Companies, LLC, 300 S.E. 2nd Street, Fort Lauderdale, FL 33301, Attention: Proxy Group. Copies of the Trust’s proxy voting records are also made available online at franklintempleton.com and posted on the U.S. Securities and Exchange Commission’s website at sec.gov and reflect the most recent 12-month period ended June 30.
Quarterly Statement of Investments
The Trust files a complete statement of investments with the U.S. Securities and Exchange Commission for the first and third quarters for each fiscal year on Form N-Q. Shareholders may view the filed Form N-Q by visiting the Commission’s website at sec.gov. The filed form may also be viewed and copied at the Commission’s Public Reference Room in Washington, DC. Information regarding the operations of the Public Reference Room may be obtained by calling (800) SEC-0330.
Householding of Reports and Prospectuses
You will receive each Fund’s financial reports every six months as well as an annual updated summary prospectus (prospectus available upon request). To reduce Fund expenses, we try to identify related shareholders in a household and send only one copy of the financial reports and summary prospectus. This process, called “householding,” will continue indefinitely unless you instruct us otherwise. If you prefer not to have these documents householded, please call us at (800) 632-2301. At any time you may view current prospectuses/summary prospectuses and financial reports on our website. If you choose, you may receive these documents through electronic delivery.
144 |
Annual Report
franklintempleton.com
Item 2. Code of Ethics.
(a) The Registrant has adopted a code of ethics that applies to its principal executive officers and principal financial and accounting officer.
(c) N/A
(d) N/A
(f) Pursuant to Item 12(a)(1), the Registrant is attaching as an exhibit a copy of its code of ethics that applies to its principal executive officers and principal financial and accounting officer.
Item 3. Audit Committee Financial Expert.
(a)(1) The Registrant has an audit committee financial expert serving on its audit committee.
(2) The audit committee financial expert is John B. Wilson and he is "independent" as defined under the relevant Securities and Exchange Commission Rules and Releases.
Item 4. Principal Accountant Fees and Services.
(a) Audit Fees
The aggregate fees paid to the principal accountant for professional services rendered by the principal accountant for the audit of the registrant’s annual financial statements or for services that are normally provided by the principal accountant in connection with statutory and regulatory filings or engagements were $431,241 for the fiscal year ended September 30, 2015 and $466,850 for the fiscal year ended September 30, 2014.
(b) Audit-Related Fees
The aggregate fees paid to the principal accountant for assurance and related services rendered by the principal accountant to the registrant that are reasonably related to the performance of the audit of the registrant's financial statements and are not reported under paragraph (a) of Item 4 were $8,856 for the fiscal year ended September 30, 2015 and $8,682 for the fiscal year ended September 30, 2014. The services for which these fees were paid included attestation services.
There were no fees paid to the principal accountant for assurance and related services rendered by the principal accountant to the registrant's investment adviser and any entity controlling, controlled by or under common control with the investment adviser that provides ongoing services to the registrant that are reasonably related to the performance of the audit of their financial statements.
(c) Tax Fees
There were no fees paid to the principal accountant for professional services rendered by the principal accountant to the registrant for tax compliance, tax advice and tax planning.
There were no fees paid to the principal accountant for professional services rendered by the principal accountant to the registrant’s investment adviser and any entity controlling, controlled by or under common control with the investment adviser that provides ongoing services to the registrant for tax compliance, tax advice and tax planning.
(d) All Other Fees
The aggregate fees paid to the principal accountant for products and services rendered by the principal accountant to the registrant not reported in paragraphs (a)-(c) of Item 4 were $0 for the fiscal year ended September 30, 2015 and $33,912 for the fiscal year ended September 30, 2014. The services for which these fees were paid include review of materials provided to the fund Board in connection with the investment management contract renewal process.
The aggregate fees paid to the principal accountant for products and services rendered by the principal accountant to the registrant’s investment adviser and any entity controlling, controlled by or under common control with the investment adviser that provides ongoing services to the registrant not reported in paragraphs (a)-(c) of Item 4 were $398,036 for the fiscal year ended September 30, 2015 and $125,824 for the fiscal year ended September 30, 2014. The services for which these fees were paid included preparation and review of materials provided to the fund Board in connection with the investment management contract renewal process and derivatives assessment. Also, includes review of system processes related to fixed income securities and certifying assets under management.
(e) (1) The registrant’s audit committee is directly responsible for approving the services to be provided by the auditors, including:
(i) pre-approval of all audit and audit related services;
(ii) pre-approval of all non-audit related services to be provided to the Fund by the auditors;
(iii) pre-approval of all non-audit related services to be provided to the registrant by the auditors to the registrant’s investment adviser or to any entity that controls, is controlled by or is under common control with the registrant’s investment adviser and that provides ongoing services to the registrant where the non-audit services relate directly to the operations or financial reporting of the registrant; and
(iv) establishment by the audit committee, if deemed necessary or appropriate, as an alternative to committee pre-approval of services to be provided by the auditors, as required by paragraphs (ii) and (iii) above, of policies and procedures to permit such services to be pre-approved by other means, such as through establishment of guidelines or by action of a designated member or members of the committee; provided the policies and procedures are detailed as to the particular service and the committee is informed of each service and such policies and procedures do not include delegation of audit committee responsibilities, as contemplated under the Securities Exchange Act of 1934, to management; subject, in the case of (ii) through (iv), to any waivers, exceptions or exemptions that may be available under applicable law or rules.
(e) (2) None of the services provided to the registrant described in paragraphs (b)-(d) of Item 4 were approved by the audit committee pursuant to paragraph (c)(7)(i)(C) of Rule 2-01 of regulation S-X.
(f) No disclosures are required by this Item 4(f).
(g) The aggregate non-audit fees paid to the principal accountant for services rendered by the principal accountant to the registrant and the registrant’s investment adviser and any entity controlling, controlled by or under common control with the investment adviser that provides ongoing services to the registrant were $406,892 for the fiscal year ended September 30, 2015 and $168,418 for the fiscal year ended September 30, 2014.
(h) The registrant’s audit committee of the board has considered whether the provision of non-audit services that were rendered to the registrant’s investment adviser (not including any sub-adviser whose role is primarily portfolio management and is subcontracted with or overseen by another investment adviser), and any entity controlling, controlled by, or under common control with the investment adviser that provides ongoing services to the registrant that were not pre-approved pursuant to paragraph (c)(7)(ii) of Rule 2-01 of Regulation S-X is compatible with maintaining the principal accountant’s independence.
Item 5. Audit Committee of Listed Registrants. N/A
Item 6. Schedule of Investments. N/A
Item 7. Disclosure of Proxy Voting Policies and Procedures for Closed-End Management Investment Companies. N/A
Item 8. Portfolio Managers of Closed-End Management Investment Companies. N/A
Item 9. Purchases of Equity Securities by Closed-End Management Investment Company and Affiliated Purchasers. N/A
Item 10. Submission of Matters to a Vote of Security Holders.
There have been no changes to the procedures by which shareholders may recommend nominees to the Registrant's Board of Trustees that would require disclosure herein.
Item 11. Controls and Procedures.
(a) Evaluation of Disclosure Controls and Procedures. The Registrant maintains disclosure controls and procedures that are designed to ensure that information required to be disclosed in the Registrant’s filings under the Securities Exchange Act of 1934 and the Investment Company Act of 1940 is recorded, processed, summarized and reported within the periods specified in the rules and forms of the Securities and Exchange Commission. Such information is accumulated and communicated to the Registrant’s management, including its principal executive officer and principal financial officer, as appropriate, to allow timely decisions regarding required disclosure. The Registrant’s management, including the principal executive officer and the principal financial officer, recognizes that any set of controls and procedures, no matter how well designed and operated, can provide only reasonable assurance of achieving the desired control objectives.
Within 90 days prior to the filing date of this Shareholder Report on Form N-CSR, the Registrant had carried out an evaluation, under the supervision and with the participation of the Registrant’s management, including the Registrant’s principal executive officer and the Registrant’s principal financial officer, of the effectiveness of the design and operation of the Registrant’s disclosure controls and procedures. Based on such evaluation, the Registrant’s principal executive officer and principal financial officer concluded that the Registrant’s disclosure controls and procedures are effective.
(b) Changes in Internal Controls. There have been no changes in the Registrant’s internal controls or in other factors that could materially affect the internal controls over financial reporting subsequent to the date of their evaluation in connection with the preparation of this Shareholder Report on Form N-CSR.
Item 12. Exhibits.
(a)(1) Code of Ethics
(a)(2) Certifications pursuant to Section 302 of the Sarbanes-Oxley Act of 2002 of Laura F. Fergerson, Chief Executive Officer - Finance and Administration, and Gaston Gardey, Chief Financial Officer and Chief Accounting Officer
(b) Certifications pursuant to Section 906 of the Sarbanes-Oxley Act of 2002 of Laura F. Fergerson, Chief Executive Officer - Finance and Administration, and Gaston Gardey, Chief Financial Officer and Chief Accounting Officer
SIGNATURES
Pursuant to the requirements of the Securities Exchange Act of 1934 and the Investment Company Act of 1940, the registrant has duly caused this report to be signed on its behalf by the undersigned, thereunto duly authorized.
FRANKLIN CUSTODIAN FUNDS
By /s/Laura F. Fergerson
Laura F. Fergerson
Chief Executive Officer - Finance and Administration
Date November 25, 2015
Pursuant to the requirements of the Securities Exchange Act of 1934 and the Investment Company Act of 1940, this report has been signed below by the following persons on behalf of the registrant and in the capacities and on the dates indicated.
By /s/Laura F. Fergerson
Laura F. Fergerson
Chief Executive Officer - Finance and Administration
Date November 25, 2015
By /s/Gaston Gardey
Gaston Gardey
Chief Financial Officer and Chief Accounting Officer
Date November 25, 2015