UNITED STATES
SECURITIES AND EXCHANGE COMMISSION
Washington, D.C. 20549
FORM N-CSR
Certified Shareholder Report of
Registered Management Investment Companies
Investment Company Act File Number: 811-00032
American Funds Fundamental Investors
(Exact Name of Registrant as Specified in Charter)
One Market, Steuart Tower
Suite 2000
San Francisco, California 94105
(Address of Principal Executive Offices)
Registrant's telephone number, including area code: (415) 421-9360
Date of fiscal year end: December 31
Date of reporting period: December 31, 2013
Patrick F. Quan
American Funds Fundamental Investors
One Market, Steuart Tower
Suite 2000
San Francisco, California 94105
(Name and Address of Agent for Service)
Copies to:
Mark D. Perlow
K&L Gates LLP
Four Embarcadero Center, Suite 1200
San Francisco, California 94111
(Counsel for the Registrant)
ITEM 1 – Reports to Stockholders

Active management
has helped Fundamental
Investors build a superior
long-term track record.
Special feature page 6
| | | |
 | | Fundamental Investors®
Annual report
for the year ended
December 31, 2013 |
Fundamental Investors seeks long-term growth of capital and income.
This fund is one of more than 40 offered by one of the nation’s largest mutual fund families, American Funds, from Capital Group. For more than 80 years, Capital has invested with a long-term focus based on thorough research and attention to risk.
Fund results shown in this report, unless otherwise indicated, are for Class A shares at net asset value. If a sales charge (maximum 5.75%) had been deducted, the results would have been lower. Results are for past periods and are not predictive of results for future periods. Current and future results may be lower or higher than those shown. Share prices and returns will vary, so investors may lose money. Investing for short periods makes losses more likely. Investments are not FDIC-insured, nor are they deposits of or guaranteed by a bank or any other entity, so they may lose value. For current information and month-end results, visit americanfunds.com.
See page 4 for Class A share results with relevant sales charges deducted. For other share class results, visit americanfunds.com and americanfundsretirement.com.
Investment results assume all distributions are reinvested and reflect applicable fees and expenses. When applicable, investment results reflect fee waivers, without which results would have been lower. Visit americanfunds.com for more information.
The fund’s 30-day yield for Class A shares as of January 31, 2014, calculated in accordance with the U.S. Securities and Exchange Commission (SEC) formula, was 1.25%. The fund’s 12-month distribution rate for Class A shares as of that date was 1.20%. Both reflect the 5.75% maximum sales charge. The SEC yield reflects the rate at which the fund is earning income on its current portfolio of securities while the distribution rate reflects the fund’s past dividends paid to shareholders. Accordingly, the fund’s SEC yield and distribution rate may differ.
Investing outside the United States may be subject to risks, such as currency fluctuations, periods of illiquidity and price volatility. These risks may be heightened in connection with investments in developing countries. Refer to the fund prospectus and the Risk Factors section of this report for more information on these and other risks associated with investing in the fund.

Fellow investors:
For the 12 months ended December 31, 2013, shares of Fundamental Investors surged in value. The fund advanced 31.5% for those who reinvested distributions totaling over $1.56 a share — a figure that includes a 15-cent special dividend and 91.5-cent capital gain paid in December.
The fund narrowly trailed the 32.4% increase recorded by its primary benchmark, the unmanaged Standard & Poor’s 500 Composite Index, but outpaced its growth-and-income fund peers, as measured by the Lipper Growth and Income Funds Index, which climbed 26.3%.
Because Fundamental Investors is able to invest up to 35% of its assets in companies domiciled outside the United States, we like to provide fund investors with a broader scope of returns. The unmanaged MSCI World Index, a measure of stock markets in more than 20 developed countries, rose 26.7%.
As shown in the table below, the fund has outpaced its primary index as well as its peer group for the five-year, 10-year and lifetime periods.
Strength at home and abroad
Supported by continued GDP growth, a strong housing market, falling unemployment and the Federal Reserve’s bond buying programs,
Results at a glance
For periods ended December 31, 2013, with all distributions reinvested
| | | Total returns | | Average annual total returns |
| | | 1 year | | 5 years | | 10 years | | Lifetime1 |
| | | | | | | | | |
| Fundamental Investors (Class A shares) | | | 31.5 | % | | | 18.1 | % | | | 9.1 | % | | | 12.7 | % |
| Standard & Poor’s 500 Composite Index2 | | | 32.4 | | | | 17.9 | | | | 7.4 | | | | 11.7 | |
| Lipper Growth and Income Funds Index | | | 26.3 | | | | 16.2 | | | | 6.7 | | | | 10.9 | |
| MSCI World Index2,3 | | | 26.7 | | | | 15.0 | | | | 7.0 | | | | 9.9 | |
| 1 | Since Capital Research and Management Company began managing the fund on August 1, 1978. |
| 2 | The indexes are unmanaged and, therefore, have no expenses. |
| 3 | Results reflect dividends net of withholding taxes. |
U.S. stocks posted robust gains for 2013. Despite pauses, including one in late spring when the Fed indicated it might begin to pare its monthly purchases and another brought on by October’s government shutdown in the wake of ongoing political arguments over the debt ceiling, the overall trend for stocks was up. The S&P 500 advanced in all four quarters, bookending the year with double-digit quarterly gains.
Though more muted than returns for U.S. stocks, markets abroad also logged healthy returns. European stocks rallied as the euro zone began to emerge from the longest recession of the post-World War II era.
In Japan, massive monetary stimulus from the Bank of Japan helped send stocks higher; other Asia-Pacific markets followed suit.
The yen hurts
On balance, currency translation negatively affected returns for U.S.-based investors in non-U.S. companies. The biggest culprit was the Japanese yen, which depreciated significantly relative to the greenback. This meant that the sizable gains of stocks denominated in yen were cut nearly in half when converted to U.S. dollars.
Sizable holdings in sensitive sectors support results
Among the areas of the market realizing the most significant increases were economically sensitive sectors that tend to thrive in an improving economy. They included industrials companies as well as consumer discretionary firms — a broad category encompassing everything from media providers to automakers to clothing retailers. As a group, Fundamental Investors’ holdings in these areas posted excellent results.
Shares of Amazon (58.8%), the fund’s largest investment, surged in price as its user base continued to expand. The company also registered a substantial sales increase and saw revenue for its cloud computing business increase by 50% year-over-year. Media companies including Disney (53.4%), Time Warner (45.8%) and Comcast (39.0%) also soared on the rising value of their content, disciplined financial returns and, in the case of Comcast, robust broadband business.
Among industrials, Boeing (81.1%) benefited considerably from a growing backlog of orders from airlines seeking the fuel efficiency gains offered by the new generation of airplanes. Lockheed Martin also notched an impressive gain (61.1%) as results exceeded expectations and strong free-cash generation benefited shareholders in the form of dividends and share repurchases.
General Electric rose 33.5% as the market took note of the company’s dividend increase, margin improvement and decision to split off part of its financing division. An anticipated increase in demand for industrial equipment and capital goods, together with operational improvements and a rising dividend elevated Parker-Hannifin (51.2%).
Elsewhere among the fund’s largest holdings, shares of Google (58.0%) surged as the company boosted revenue for its website by nearly 20% and showed progress in the mobile search area.
Health care companies also turned in excellent results. The fund’s portfolio houses a range of investments that collectively support both the fund’s growth and income objectives. Biotechnology firms such as Gilead Sciences (104.6%) and Regeneron (60.9%) are more on the growth end of the spectrum, while pharmaceutical giant Merck (22.3%) offers a healthy dividend and the potential for long-term growth. For the 12 months, Bristol-Myers Squibb (63.1%), which features a sizable yield, helped on both fronts.
Fundamental Investors’ total return year by year (ending December 31)
| | | Capital return | | Income return | | Total return |
| | | | | | | |
| 2004 | | | 11.9 | % | | | 2.0 | % | | | 13.9 | % |
| 2005 | | | 9.9 | | | | 1.8 | | | | 11.7 | |
| 2006 | | | 17.6 | | | | 1.6 | | | | 19.2 | |
| 2007 | | | 11.2 | | | | 2.4 | | | | 13.6 | |
| 2008 | | | –41.1 | | | | 1.4 | | | | –39.7 | |
| 2009 | | | 31.5 | | | | 1.9 | | | | 33.4 | |
| 2010 | | | 12.2 | | | | 1.8 | | | | 14.0 | |
| 2011 | | | –3.6 | | | | 1.7 | | | | –1.9 | |
| 2012 | | | 15.3 | | | | 1.8 | | | | 17.1 | |
| 2013 | | | 29.9 | | | | 1.6 | | | | 31.5 | |
| | | | | | | | | | | | | |
| 10-year average annual total return | | | | | | | | | | | 9.1 | % |
| 10-year cumulative total return | | | | | | | | | | | 138.8 | |
| Lifetime cumulative total return (since 8/1/78) | | | | | | | | | | | 6,832.3 | |
Total return measures both capital results (changes in net asset value) and income return (from dividends).
All returns assume reinvestment of all dividends and capital gain distributions.
The energy sector trailed the broader market. Returns for fund holdings Suncor Energy (6.6%), Royal Dutch Shell (6.0%) and Enbridge (1.0%) were modest. Mining firm Potash Corp. of Saskatchewan (–19.0%) lost ground as shifting dynamics within the potash industry took their toll. Decelerating growth in its cloud computing business caused Web services provider Rackspace Hosting (–47.3%) to fall sharply.
Looking ahead
For the two years ended December 31, 2013, Fundamental Investors’ cumulative total return was over 50%. We are gratified by the fund’s results during this time frame and over the longer periods shown on page 1. However, we remind investors that such returns are well above historical fund and market averages.
In the year ahead the market will no doubt present challenges and opportunities. For a look at how our active management approach has historically helped us deal with both, we invite you to read the feature article beginning on page 6.
We thank you for your commitment to long-term investing.
Sincerely,

James F. Rothenberg
Vice Chairman

Dina N. Perry
President
February 10, 2014
For current information about the fund, visit americanfunds.com.
Results of a $10,000 investment in Fundamental Investors
Fund results shown are for Class A shares and reflect deduction of the maximum sales charge of 5.75% on the $10,000 investment.1 Thus, the net amount invested was $9,425.2 Results are for past periods and are not predictive of results for future periods. Current and future results may be lower or higher than those shown. Share prices and returns will vary, so investors may lose money. For current information and month-end results, visit americanfunds.com.
The results shown are before taxes on fund distributions and sale of fund shares.
| 1 | As outlined in the prospectus, the sales charge is reduced for accounts (and aggregated investments) of $25,000 or more and is eliminated for purchases of $1 million or more. There is no sales charge on dividends or capital gain distributions that are reinvested in additional shares. |
| 2 | The maximum initial sales charge was 8.50% prior to July 1, 1988. |
| 3 | Includes reinvested dividends of $114,907 and reinvested capital gain distributions of $182,115. |
| 4 | The S&P 500 is unmanaged and, therefore, has no expenses. |
| 5 | Results of the Lipper Growth and Income Funds Index do not reflect any sales charges. |
| 6 | Includes reinvested capital gain distributions of $96,198 but does not reflect income dividends of $57,738 taken in cash. |
| 7 | Computed from data supplied by the U.S. Department of Labor, Bureau of Labor Statistics. |
| 8 | For the period August 1, 1978 (when Capital Research and Management Company became investment adviser), through December 31, 1978. |
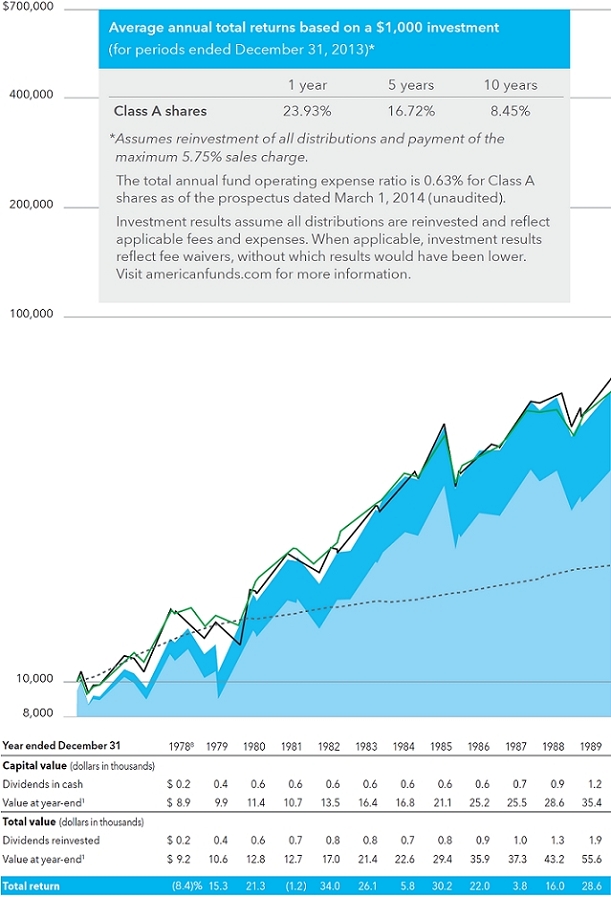
How a $10,000 investment has grown
The chart and the table below it illustrate how a $10,000 investment in the fund grew between August 1, 1978 — when Capital Research and Management Company became Fundamental Investors’ investment adviser — and December 31, 2013. The chart also shows how the unmanaged Standard & Poor’s 500 Composite Index and the Lipper Growth and Income Funds Index fared over this same period, and what happened to inflation (as measured by the Consumer Price Index).


Active management has helped
Fundamental Investors build a
superior long-term track record.
Within the mutual fund world, two investing approaches predominate. One is indexing, where a fund’s portfolio is a microcosm of its benchmark. For example, if a software company constitutes 2.3% of the market value of Standard & Poor’s 500 Composite Index, an index fund that tracks it seeks to have that company make up 2.3% of its portfolio. The other approach is active management, whereby managers select investments for a fund’s portfolio.

Fundamental Investors is managed according to the latter, and it’s thanks to active management — supported by intensive research, relatively low fees and a long-term perspective — that the fund has outpaced its primary benchmark, the unmanaged S&P 500, for the most recent five- and 10-year periods, as well as the fund’s nearly 35-year lifetime.
Here, we take a look at how active management has facilitated these results. We’ll also look at how it enables investment professionals to pursue their highest conviction investment ideas and examine the role it can play in helping them manage through the periodic bubbles and downturns that seem to be a fixture of markets. In addition, we’ll explore the crucial role that a bottom-up, research-driven approach to building a portfolio plays in helping investment professionals actively pursue the fund’s growth and income objectives.
A widely held perception
For some in the investing world, one widely held perception has nearly become an article of faith. It is this: Active managers cannot produce better results than their indexes over longer time frames. A variety of factors, it is said, preclude them from doing so. Expenses, which funds have but indexes do not, are often cited as the primary culprit. Over time, these expenses — coupled with the sheer difficulty of assembling an ever-changing group of stocks that will collectively outpace the broader market — will cause a fund to revert to the mean. Or worse.
“With respect to this perception, the data does say that the majority of active managers are not able to outpace their relevant indexes,” explains Fundamental Investors portfolio manager Martin Romo. “But people have taken that to mean that none of them are able to. This is akin to saying that because a particular person can’t dunk a basketball, no one can dunk a basketball. The fact is that some investment firms have demonstrated the ability to provide long-term returns that surpass those of their benchmarks. Fundamental Investors and a meaningful majority of its cohorts in the American Funds family have been among them.”
Low relative expenses play a role
The reasons for this are manifold, and not the least of them is expenses. Among active managers, American Funds has some of the lowest fees in the industry. In large part, low fees are the result of relatively low trading costs — commissions and fees incurred in connection with buying and selling stocks. In the fund’s case, there are fewer trading costs because there is less trading. Said another way, the fund buys and sells stocks less frequently than many of its peers. Indeed, its portfolio turnover —perhaps the most common measure of a fund’s buying and selling activity — is considerably lower than the industry average.
Results are for past periods and are not predictive of results for future periods. Current and future results may be lower or higher than those shown. Share prices and returns will vary, so investors may lose money. For current information and month-end results, visit americanfunds.com.

Low turnover is a manifestation of a key element of the fund’s investment approach: Rather than trade stocks, investment professionals develop a deep understanding of a company and, if they believe it’s attractively valued based on its business prospects and growth potential, they invest with the expectation of owning it for the long term.
“Our goal is to remain invested in companies for a multi-year period. This is important because it’s often the case that much of a stock’s excess return relative to its benchmark comes during a concentrated period of time,” says portfolio manager Brady Enright. “But the short-term uncertainties and fluctuations in the market mean it’s very difficult to know when that period will be. Maintaining one’s investment over a full market or economic cycle increases the likelihood that you will capture that price appreciation.”
And if you have invested in companies with solid fundamentals and attractive long-term business prospects, the belief is that over time the market will recognize that value and it will get priced into the stock, providing a solid return.
Managing through bubbles
Another potential benefit of active management is its potential to mitigate the impact of stock bubbles.
From the overheated markets that precipitated the Great Depression to the New York Stock Exhange’s “Nifty Fifty” of the 1960s and ’70s to the lofty valuations afforded Japanese stocks in the late ’80s, bubbles seem to be a fixture of capital markets.
“History has shown that investors, often acting on emotion, tend to get fixated on certain areas of the market,” notes Martin. “As investors grow more excited about a given company or industry and bid up stock prices, that exuberance gets reflected in the indexes and the funds that track them. Yet bubbles are often a product of perceived rather than real value. If and when such valuations prove unwarranted, stock prices contract.”
This was perhaps most vividly illustrated in the late 1990s and early 2000s when stocks of information technology, telecommunications and media companies grew to become nearly 50% of the S&P (today they make up about 25%). When the bubble burst, the index dropped over 47%, and investors in funds pegged to it realized the full measure of that loss. Although Fundamental Investors fell by less, by no means did it avoid the downturn, declining 36%. However, in the uncertain post-bubble environment, active management provided a significant benefit.
“Throughout this period, when much of the investing public was understandably rattled and standing on the sidelines, there were attractive investment opportunities for those with the will and resources to invest,” explains
Long-term results suggest an active advantage
Fundamental Investors’ active management approach aims to build a portfolio of well-researched holdings that will produce solid returns over full market and economic cycles. The table below shows that the fund has outpaced its primary index, the Standard & Poor’s 500 Composite Index, for 21 of the 26 rolling 10-year periods since joining the American Funds family. It has outpaced its growth-and-income category peers — as measured by Lipper — for all 26.
And as you can see, although differences in return may sometimes appear small, over time they can translate into meaningful differences in investment value.
| | | Results for 10-year period ending December 31st of each year shown |
| | | Fundamental
Investors | | S&P 500 | | Lipper Growth and
Income Funds Index |
| | | Growth of
$ 1,000 | | Average
annual
total return | | Growth of
$1,000 | | Average
annual
total return | | Growth of
$1,000 | | Average
annual
total return |
| 1988 | | $4,723 | | | 16.8 | % | | $4,535 | | | 16.3 | % | | $4,575 | | | 16.4 | % |
| 1989 | | 5,267 | | | 18.1 | | | 5,032 | | | 17.5 | | | 4,570 | | | 16.4 | |
| 1990 | | 4,071 | | | 15.1 | | | 3,681 | | | 13.9 | | | 3,349 | | | 12.8 | |
| 1991 | | 5,370 | | | 18.3 | | | 5,049 | | | 17.6 | | | 4,339 | | | 15.8 | |
| 1992 | | 4,415 | | | 16.0 | | | 4,470 | | | 16.2 | | | 3,831 | | | 14.4 | |
| 1993 | | 4,136 | | | 15.3 | | | 4,014 | | | 14.9 | | | 3,577 | | | 13.6 | |
| 1994 | | 3,963 | | | 14.8 | | | 3,827 | | | 14.4 | | | 3,416 | | | 13.1 | |
| 1995 | | 4,085 | | | 15.1 | | | 3,996 | | | 14.9 | | | 3,485 | | | 13.3 | |
| 1996 | | 4,016 | | | 14.9 | | | 4,140 | | | 15.3 | | | 3,575 | | | 13.6 | |
| 1997 | | 4,903 | | | 17.2 | | | 5,245 | | | 18.0 | | | 4,419 | | | 16.0 | |
| 1998 | | 4,935 | | | 17.3 | | | 5,785 | | | 19.2 | | | 4,241 | | | 15.5 | |
| 1999 | | 4,782 | | | 16.9 | | | 5,320 | | | 18.2 | | | 3,834 | | | 14.4 | |
| 2000 | | 5,318 | | | 18.2 | | | 4,991 | | | 17.4 | | | 4,094 | | | 15.1 | |
| 2001 | | 3,690 | | | 13.9 | | | 3,373 | | | 12.9 | | | 2,967 | | | 11.5 | |
| 2002 | | 2,768 | | | 10.7 | | | 2,442 | | | 9.3 | | | 2,222 | | | 8.3 | |
| 2003 | | 3,092 | | | 11.9 | | | 2,855 | | | 11.1 | | | 2,468 | | | 9.5 | |
| 2004 | | 3,476 | | | 13.3 | | | 3,124 | | | 12.1 | | | 2,769 | | | 10.7 | |
| 2005 | | 2,893 | | | 11.2 | | | 2,383 | | | 9.1 | | | 2,255 | | | 8.5 | |
| 2006 | | 2,874 | | | 11.1 | | | 2,244 | | | 8.4 | | | 2,160 | | | 8.0 | |
| 2007 | | 2,577 | | | 9.9 | | | 1,775 | | | 5.9 | | | 1,775 | | | 5.9 | |
| 2008 | | 1,331 | | | 2.9 | | | 870 | | | –1.4 | | | 976 | | | –0.2 | |
| 2009 | | 1,425 | | | 3.6 | | | 909 | | | –0.9 | | | 1,127 | | | 1.2 | |
| 2010 | | 1,559 | | | 4.5 | | | 1,151 | | | 1.4 | | | 1,282 | | | 2.5 | |
| 2011 | | 1,691 | | | 5.4 | | | 1,333 | | | 2.9 | | | 1,360 | | | 3.1 | |
| 2012 | | 2,396 | | | 9.1 | | | 1,985 | | | 7.1 | | | 1,920 | | | 6.7 | |
| 2013 | | 2,388 | | | 9.1 | | | 2,042 | | | 7.4 | | | 1,905 | | | 6.7 | |
Fund results shown are for Class A shares at net asset value. If a sales charge (maximum 5.75%) had been deducted, the results would have been lower. Results are for past periods and are not predictive of results for future periods. Current and future results may be lower or higher than those shown. Share prices and returns will vary, so investors may lose money. For current information and month-end results, visit americanfunds.com.
“Our perspective is that the benchmark is a tool for comparing results, not a portfolio construction aid.”
Brady Enright, portfolio manager
“Our view is that if you don’t have conviction in a company, you shouldn’t own any of it.”
Mark Casey, investment analyst
Fundamental Investors president Dina Perry, who is also a portfolio manager. “Because we were able to focus on the underlying companies rather than plunging stock prices during that period, we made or added to investments that helped fuel our results in the years that followed. The typical indexer did not have the same ability to invest in this opportunistic way.”
Opportunistic investing pays off
Thanks in part to that opportunistic investing in the period stretching from the dot-com collapse to the market high that preceded the financial crisis (3/24/00–10/9/07), the fund’s cumulative return exceeded 70%. Over that same stretch, the S&P 500 gained 16%, while the fund’s peers — as measured by the Lipper Growth and Income Funds Index — rose about 45%.
Of course active managers don’t always sidestep trouble. Because the stock market downturn spawned by the 2008 financial crisis was much broader based, virtually every industry declined and investors had fewer places to hide. During that time, fund returns were more in line with those of the index. And while there have been periods when the fund has lagged the S&P as well as its peer group, you can see from the chart on page 9 that it has bested both of the indexes in 21 of the 26 rolling 10-year intervals (measured as of December 31 in each of those years) since becoming a part of the American Funds. This includes, consecutively, the last 14 years.
Differences in active management
Although the great philosophical divide in the mutual fund world may be between active management and indexing, varying schools of thought exist among active managers.
“In my view, one of the best ways to beat the benchmark is to ignore it,” admits Brady. “When building my portfolio, I work within the investing guidelines that govern the fund. One thing I am not doing, however, is taking cues from the benchmark as to which companies I should invest in. I start with a blank slate. Our perspective is that the benchmark is a tool for comparing results, not a portfolio construction aid.”
Not all in the industry share this view. For some, the benchmark is the starting point, and active management involves determining ways in which to diverge from it. If, for example, managers like technology stocks, they may wish to own double the proportion found in the benchmark. Conversely, if they’re bearish on a particular sector, they can lighten its weighting.
In the view of Fundamental Investors’ portfolio managers, this tactic can land one in the strange position of maintaining investments in companies they simply do not believe in.
“I’ve heard industry colleagues say things like ‘I don’t like company XYZ, so I own less than half what the index does,’” states Mark Casey, a technology and media analyst for the fund. “Our view is that if you don’t have conviction in a company, you shouldn’t own any of it.”

Going outside the index universe
Active management also allows investment professionals to invest in companies that aren’t index components. Conversely, companies not counted among America’s 500 largest would be off limits to an S&P 500 index fund investor.
“Google didn’t become a constituent of the S&P 500 until two years after the company went public,” offers Mark. “Relative to most companies, that’s extremely quick — and it was by no means certain the company would become the force it has — but the fact is that before Google became part of many indexers’ portfolios, the stock price had to increase. An active approach could have enabled investment at an earlier stage.”
To those same S&P indexers, almost all companies domiciled outside the United States would likewise be out of bounds. Yet there are industries where only a handful of the most significant players are big U.S. firms. Examples include luxury goods manufacturers, brewers and mining companies.
Research: the engine behind the approach
Effectively pursuing a truly bottom-up active management approach requires a process that enables portfolio managers to consistently identify companies that have the potential to do well over time. For Fundamental Investors, that process is known as The Capital System,SM and it centers on research. The fund’s five portfolio managers are supported by 24 investment analysts who are located around the globe. And at American Funds, the analyst role, much like the active management approach it supports, differs from the industry norm.
Perhaps the most crucial distinction is in the experience level of fund analysts; often, they cover sectors for decades and their role is a career path unto itself, not just a stepping stone to portfolio management. Covering companies and industries for many years enables analysts to forge relationships with company managers, gain familiarity with suppliers and develop a more comprehensive understanding of the nuances of the business cycle.
Pursuing objectives is primary
As Brady noted, paying minimal attention to the S&P has, in the fund’s case, been instrumental in its ability to surpass the index over the long term. Indeed, “beating the index” cannot be found among the fund’s official objectives. Those objectives include capital appreciation — in layman’s terms, “growing the money shareholders entrust to the fund” — and providing income.
“The fund’s goals were chosen because they align with the objectives of many investors,” adds Dina. “Indexes are important measuring tools, but we believe that we can best pursue the goals of our investors through an actively chosen, thoroughly researched portfolio of companies we strongly believe in.” ¢
Summary investment portfolio December 31, 2013
| Industry sector diversification | Percent of net assets |

| Country diversification | Percent of net assets |
| United States | 82.8 | % |
| United Kingdom | 3.9 | |
| Euro zone* | 3.8 | |
| Canada | 2.4 | |
| Other countries | 3.3 | |
| Short-term securities & other assets less liabilities | 3.8 | |
| * | Countries using the euro as a common currency; those represented in the fund’s portfolio are France, Germany, Ireland, the Netherlands and Spain. |
| Common stocks 96.21% | | Shares | | | Value
(000) | | | Percent of
net assets | |
| Consumer discretionary 17.45% | | | | | | | | | | | | |
| Amazon.com, Inc.1 | | | 5,973,800 | | | $ | 2,382,292 | | | | 3.52 | % |
| Home Depot, Inc. | | | 18,689,500 | | | | 1,538,893 | | | | 2.27 | |
| Comcast Corp., Class A | | | 24,651,800 | | | | 1,281,031 | | | | 1.89 | |
| Time Warner Inc. | | | 16,267,000 | | | | 1,134,135 | | | | 1.68 | |
| Walt Disney Co. | | | 11,340,000 | | | | 866,376 | | | | 1.28 | |
| Twenty-First Century Fox, Inc., Class A | | | 18,000,000 | | | | 633,240 | | | | .94 | |
| Starbucks Corp. | | | 5,900,000 | | | | 462,501 | | | | .68 | |
| Other securities | | | | | | | 3,511,633 | | | | 5.19 | |
| | | | | | | | 11,810,101 | | | | 17.45 | |
| | | | | | | | | | | | | |
| Financials 15.59% | | | | | | | | | | | | |
| Wells Fargo & Co. | | | 20,150,916 | | | | 914,852 | | | | 1.35 | |
| American Express Co. | | | 9,770,000 | | | | 886,432 | | | | 1.31 | |
| JPMorgan Chase & Co. | | | 14,785,000 | | | | 864,627 | | | | 1.28 | |
| Citigroup Inc. | | | 14,685,000 | | | | 765,235 | | | | 1.13 | |
| CME Group Inc., Class A | | | 8,007,600 | | | | 628,276 | | | | .93 | |
| BlackRock, Inc. | | | 1,850,000 | | | | 585,470 | | | | .87 | |
| Capital One Financial Corp. | | | 7,500,000 | | | | 574,575 | | | | .85 | |
| ACE Ltd. | | | 4,900,000 | | | | 507,297 | | | | .75 | |
| Weyerhaeuser Co.1 | | | 14,726,107 | | | | 464,903 | | | | .69 | |
| Legal & General Group PLC | | | 119,784,921 | | | | 441,743 | | | | .65 | |
| Other securities | | | | | | | 3,914,214 | | | | 5.78 | |
| | | | | | | | 10,547,624 | | | | 15.59 | |
| | | | | | | | | | | | | |
| Industrials 14.37% | | | | | | | | | | | | |
| Boeing Co. | | | 12,340,000 | | | | 1,684,287 | | | | 2.49 | |
| General Electric Co. | | | 38,000,000 | | | | 1,065,140 | | | | 1.57 | |
| Parker-Hannifin Corp. | | | 7,350,000 | | | | 945,504 | | | | 1.40 | |
| Union Pacific Corp. | | | 5,185,000 | | | | 871,080 | | | | 1.29 | |
| Lockheed Martin Corp. | | | 5,323,200 | | | | 791,347 | | | | 1.17 | |
| European Aeronautic Defence and Space Co. EADS NV | | | 7,515,000 | | | | 576,985 | | | | .85 | |
| Caterpillar Inc. | | | 6,025,000 | | | | 547,130 | | | | .81 | |
| Other securities | | | | | | | 3,240,578 | | | | 4.79 | |
| | | | | | | | 9,722,051 | | | | 14.37 | |
| | | | | | | | | | | | | |
| Information technology 13.84% | | | | | | | | | | | | |
| Google Inc., Class A1 | | | 1,502,800 | | | | 1,684,203 | | | | 2.49 | |
| Microsoft Corp. | | | 42,750,000 | | | | 1,600,133 | | | | 2.36 | |
| Texas Instruments Inc. | | | 20,780,300 | | | | 912,463 | | | | 1.35 | |
| ASML Holding NV | | | 4,173,032 | | | | 390,607 | | | | | |
| ASML Holding NV (New York registered) | | | 2,396,000 | | | | 224,505 | | | | .91 | |
| Avago Technologies Ltd. | | | 10,049,993 | | | | 531,544 | | | | .78 | |
| Apple Inc. | | | 800,000 | | | | 448,888 | | | | .66 | |
| Other securities | | | | | | | 3,577,241 | | | | 5.29 | |
| | | | | | | | 9,369,584 | | | | 13.84 | |
| Common stocks (continued) | | | Shares | | | | Value
(000) | | | | Percent of
net assets | |
| Health care 10.27% | | | | | | | | | | | | |
| Merck & Co., Inc. | | | 19,500,800 | | | $ | 976,015 | | | | 1.44 | % |
| Gilead Sciences, Inc.1 | | | 10,893,790 | | | | 818,668 | | | | 1.21 | |
| Bristol-Myers Squibb Co. | | | 13,550,000 | | | | 720,183 | | | | 1.07 | |
| Express Scripts Holding Co.1 | | | 7,130,000 | | | | 500,811 | | | | .74 | |
| Vertex Pharmaceuticals Inc.1 | | | 6,215,000 | | | | 461,775 | | | | .68 | |
| Baxter International Inc. | | | 6,261,755 | | | | 435,505 | | | | .64 | |
| Other securities | | | | | | | 3,038,130 | | | | 4.49 | |
| | | | | | | | 6,951,087 | | | | 10.27 | |
| | | | | | | | | | | | | |
| Energy 9.69% | | | | | | | | | | | | |
| Suncor Energy Inc. | | | 18,092,932 | | | | 634,296 | | | | .94 | |
| Enbridge Inc. | | | 11,669,701 | | | | 509,853 | | | | .75 | |
| Chevron Corp. | | | 3,773,900 | | | | 471,398 | | | | .70 | |
| Occidental Petroleum Corp. | | | 4,600,000 | | | | 437,460 | | | | .64 | |
| Other securities | | | | | | | 4,507,132 | | | | 6.66 | |
| | | | | | | | 6,560,139 | | | | 9.69 | |
| | | | | | | | | | | | | |
| Consumer staples 5.13% | | | | | | | | | | | | |
| Philip Morris International Inc. | | | 11,690,000 | | | | 1,018,550 | | | | 1.51 | |
| PepsiCo, Inc. | | | 5,610,498 | | | | 465,335 | | | | .68 | |
| Costco Wholesale Corp. | | | 3,635,000 | | | | 432,601 | | | | .64 | |
| Other securities | | | | | | | 1,555,164 | | | | 2.30 | |
| | | | | | | | 3,471,650 | | | | 5.13 | |
| | | | | | | | | | | | | |
| Materials 4.93% | | | | | | | | | | | | |
| LyondellBasell Industries NV, Class A | | | 6,270,000 | | | | 503,356 | | | | .74 | |
| FMC Corp. | | | 6,408,000 | | | | 483,548 | | | | .72 | |
| Praxair, Inc. | | | 3,380,000 | | | | 439,501 | | | | .65 | |
| Dow Chemical Co. | | | 9,796,418 | | | | 434,961 | | | | .64 | |
| Other securities | | | | | | | 1,472,570 | | | | 2.18 | |
| | | | | | | | 3,333,936 | | | | 4.93 | |
| | | | | | | | | | | | | |
| Telecommunication services 2.68% | | | | | | | | | | | | |
| Vodafone Group PLC | | | 149,695,000 | | | | 587,493 | | | | | |
| Vodafone Group PLC (ADR) | | | 1,220,000 | | | | 47,958 | | | | .94 | |
| Other securities | | | | | | | 1,178,988 | | | | 1.74 | |
| | | | | | | | 1,814,439 | | | | 2.68 | |
| | | | | | | | | | | | | |
| Utilities 0.78% | | | | | | | | | | | | |
| Other securities | | | | | | | 529,101 | | | | .78 | |
| | | | | | | | | | | | | |
| Miscellaneous 1.48% | | | | | | | | | | | | |
| Other common stocks in initial period of acquisition | | | | | | | 1,000,924 | | | | 1.48 | |
| | | | | | | | | | | | | |
| Total common stocks (cost: $40,915,396,000) | | | | | | | 65,110,636 | | | | 96.21 | |
| | | | | | | | | | | | | |
| Warrants 0.00% | | | | | | | | | | | | |
| Energy 0.00% | | | | | | | | | | | | |
| Other securities | | | | | | | 2,468 | | | | .00 | |
| | | | | | | | | | | | | |
| Total warrants (cost: $1,158,000) | | | | | | | 2,468 | | | | .00 | |
| Short-term securities 3.82% | | | Principal amount
(000) | | | | Value
(000) | | | | Percent of
net assets | |
| Freddie Mac 0.07%–0.15% due 1/14–9/17/2014 | | $ | 1,075,518 | | | $ | 1,075,208 | | | | 1.59 | % |
| Federal Home Loan Bank 0.05%–0.14% due 1/3–6/11/2014 | | | 522,900 | | | | 522,777 | | | | .77 | |
| General Electric Capital Corp. 0.05%–0.18% due 1/2–4/1/2014 | | | 90,400 | | | | 90,386 | | | | .13 | |
| Chariot Funding, LLC 0.32% due 2/7/20142 | | | 50,000 | | | | 49,995 | | | | | |
| Jupiter Securitization Co., LLC 0.32% due 2/7/20142 | | | 16,800 | | | | 16,797 | | | | | |
| Walt Disney Co. 0.10% due 3/25/20142 | | | 25,000 | | | | 24,994 | | | | .04 | |
| Google Inc. 0.14% due 1/15/20142 | | | 15,000 | | | | 15,000 | | | | .02 | |
| Other securities | | | | | | | 791,239 | | | | 1.17 | |
| | | | | | | | | | | | | |
| Total short-term securities (cost: $2,586,199,000) | | | | | | | 2,586,396 | | | | 3.82 | |
| Total investment securities (cost: $43,502,753,000) | | | | | | | 67,699,500 | | | | 100.03 | |
| Other assets less liabilities | | | | | | | (22,488 | ) | | | (.03 | ) |
| Net assets | | | | | | $ | 67,677,012 | | | | 100.00 | % |
This summary investment portfolio is designed to streamline the report and help investors better focus on the fund’s principal holdings. See the inside back cover for details on how to obtain a complete schedule of portfolio holdings.
As permitted by U.S. Securities and Exchange Commission regulations, “Miscellaneous” securities include holdings in their first year of acquisition that have not previously been publicly disclosed.
“Other securities” includes all issues that are not disclosed separately in the summary investment portfolio.
Investment in affiliates
A company is considered to be an affiliate of the fund under the Investment Company Act of 1940 if the fund’s holdings in that company represent 5% or more of the outstanding voting shares. The value of the fund’s holdings in affiliated companies is included in “Other securities” under the respective industry sectors in the summary investment portfolio. Further details on these holdings and related transactions during the year ended December 31, 2013, appear below.
| | | Beginning
shares | | | Additions | | | Reductions | | | Ending
shares | | | Dividend income
(000) | | | Value
of affiliates
at 12/31/2013
(000) | |
| CNO Financial Group, Inc. | | | 11,900,000 | | | — | | | — | | | | 11,900,000 | | | $ | 1,309 | | | $ | 210,511 | |
| Grafton Group PLC, units | | | 15,037,000 | | | — | | | — | | | | 15,037,000 | | | | 1,771 | | | | 161,106 | |
| | | | | | | | | | | | | | | | | | | $ | 3,080 | | | $ | 371,617 | |
The following footnotes apply to either the individual securities noted or one or more of the securities aggregated and listed as a single line item.
| 1 | Security did not produce income during the last 12 months. |
| 2 | Acquired in a transaction exempt from registration under section 4(2) of the Securities Act of 1933. May be resold in the U.S. in transactions exempt from registration, normally to qualified institutional buyers. The total value of all such securities, including those in “Other securities,” was $352,253,000, which represented .52% of the net assets of the fund. |
Key to abbreviation
ADR = American Depositary Receipts
See Notes to Financial Statements
| Financial statements | | | | | | |
| | | | | | | |
Statement of assets and liabilities
at December 31, 2013 | | (dollars in thousands) |
| | |
| Assets: | | | | | | | | |
| Investment securities, at value: | | | | | | | | |
| Unaffiliated issuers (cost: $43,260,665) | | $ | 67,327,883 | | | | | |
| Affiliated issuers (cost: $242,088) | | | 371,617 | | | $ | 67,699,500 | |
| Cash | | | | | | | 59 | |
| Receivables for: | | | | | | | | |
| Sales of investments | | | 52,140 | | | | | |
| Sales of fund’s shares | | | 83,635 | | | | | |
| Dividends and interest | | | 139,614 | | | | 275,389 | |
| | | | | | | | 67,974,948 | |
| Liabilities: | | | | | | | | |
| Payables for: | | | | | | | | |
| Purchases of investments | | | 37,755 | | | | | |
| Repurchases of fund’s shares | | | 218,570 | | | | | |
| Investment advisory services | | | 13,890 | | | | | |
| Services provided by related parties | | | 23,010 | | | | | |
| Trustees’ deferred compensation | | | 4,133 | | | | | |
| Other | | | 578 | | | | 297,936 | |
| Net assets at December 31, 2013 | | | | | | $ | 67,677,012 | |
| | | | | | | | | |
| Net assets consist of: | | | | | | | | |
| Capital paid in on shares of beneficial interest | | | | | | $ | 42,669,967 | |
| Undistributed net investment income | | | | | | | 150,058 | |
| Undistributed net realized gain | | | | | | | 659,136 | |
| Net unrealized appreciation | | | | | | | 24,197,851 | |
| Net assets at December 31, 2013 | | | | | | $ | 67,677,012 | |
(dollars and shares in thousands, except per-share amounts)
Shares of beneficial interest issued and outstanding (no stated par value) —
unlimited shares authorized (1,302,710 total shares outstanding)
| | Net assets | | | Shares
outstanding | | | Net asset value
per share | |
| Class A | | $ | 41,819,733 | | | | 804,633 | | | $ | 51.97 | |
| Class B | | | 467,526 | | | | 9,016 | | | | 51.86 | |
| Class C | | | 2,352,475 | | | | 45,442 | | | | 51.77 | |
| Class F-1 | | | 5,306,091 | | | | 102,144 | | | | 51.95 | |
| Class F-2 | | | 2,485,377 | | | | 47,828 | | | | 51.96 | |
| Class 529-A | | | 1,590,011 | | | | 30,623 | | | | 51.92 | |
| Class 529-B | | | 40,638 | | | | 782 | | | | 51.95 | |
| Class 529-C | | | 416,196 | | | | 8,023 | | | | 51.88 | |
| Class 529-E | | | 67,041 | | | | 1,292 | | | | 51.89 | |
| Class 529-F-1 | | | 67,327 | | | | 1,297 | | | | 51.89 | |
| Class R-1 | | | 171,244 | | | | 3,308 | | | | 51.77 | |
| Class R-2 | | | 776,623 | | | | 15,005 | | | | 51.76 | |
| Class R-3 | | | 2,794,764 | | | | 53,885 | | | | 51.87 | |
| Class R-4 | | | 2,841,482 | | | | 54,766 | | | | 51.88 | |
| Class R-5 | | | 1,964,394 | | | | 37,781 | | | | 51.99 | |
| Class R-6 | | | 4,516,090 | | | | 86,885 | | | | 51.98 | |
See Notes to Financial Statements
Statement of operations
for the year ended December 31, 2013 | | (dollars in thousands) |
| |
| Investment income: | | | | | | | | |
| Income: | | | | | | | | |
| Dividends (net of non-U.S. taxes of $25,844; also includes $3,080 from affiliates) | | $ | 1,179,551 | | | | | |
| Interest | | | 4,267 | | | $ | 1,183,818 | |
| | | | | | | | | |
| Fees and expenses*: | | | | | | | | |
| Investment advisory services | | | 148,918 | | | | | |
| Distribution services | | | 159,330 | | | | | |
| Transfer agent services | | | 70,270 | | | | | |
| Administrative services | | | 14,842 | | | | | |
| Reports to shareholders | | | 2,549 | | | | | |
| Registration statement and prospectus | | | 766 | | | | | |
| Trustees’ compensation | | | 1,154 | | | | | |
| Auditing and legal | | | 154 | | | | | |
| Custodian | | | 989 | | | | | |
| Other | | | 2,190 | | | | 401,162 | |
| Net investment income | | | | | | | 782,656 | |
| | | | | | | | | |
| Net realized gain and unrealized appreciation on investments and currency: | | | | | | | | |
| Net realized gain (loss) on: | | | | | | | | |
| Investments | | | 3,716,896 | | | | | |
| Currency transactions | | | (4,283 | ) | | | 3,712,613 | |
| Net unrealized appreciation on: | | | | | | | | |
| Investments | | | 11,836,820 | | | | | |
| Currency translations | | | 882 | | | | 11,837,702 | |
| Net realized gain and unrealized appreciation on investments and currency | | | | | | | 15,550,315 | |
| | | | | | | | | |
| Net increase in net assets resulting from operations | | | | | | $ | 16,332,971 | |
| * | Additional information related to class-specific fees and expenses is included in the Notes to Financial Statements. |
See Notes to Financial Statements
| Statements of changes in net assets | | | | | | |
| (dollars in thousands) |
| |
| | | Year ended December 31 | |
| | | | 2013 | | | | 2012 | |
| Operations: | | | | | | | | |
| Net investment income | | $ | 782,656 | | | $ | 815,217 | |
| Net realized gain on investments and currency transactions | | | 3,712,613 | | | | 2,096,717 | |
| Net unrealized appreciation on investments and currency translations | | | 11,837,702 | | | | 4,937,151 | |
| Net increase in net assets resulting from operations | | | 16,332,971 | | | | 7,849,085 | |
| | | | | | | | | |
| Dividends and distributions paid to shareholders: | | | | | | | | |
| Dividends from net investment income | | | (807,959 | ) | | | (816,531 | ) |
| Distributions from net realized gain on investments | | | (1,168,741 | ) | | | — | |
| Total dividends and distributions paid to shareholders | | | (1,976,700 | ) | | | (816,531 | ) |
| | | | | | | | | |
| Net capital share transactions | | | 1,312,946 | | | | (1,945,234 | ) |
| | | | | | | | | |
| Total increase in net assets | | | 15,669,217 | | | | 5,087,320 | |
| | | | | | | | | |
| Net assets: | | | | | | | | |
| Beginning of year | | | 52,007,795 | | | | 46,920,475 | |
End of year (including undistributed net investment income:
$150,058 and $164,207, respectively) | | $ | 67,677,012 | | | $ | 52,007,795 | |
See Notes to Financial Statements
Notes to financial statements
1. Organization
American Funds Fundamental Investors (the “trust”) is registered under the Investment Company Act of 1940 as an open-end, diversified management investment company and has initially issued one series of shares, Fundamental Investors (the “fund”). The fund seeks long-term growth of capital and income.
The fund has 16 share classes consisting of five retail share classes (Classes A, B and C, as well as two F share classes, F-1 and F-2), five 529 college savings plan share classes (Classes 529-A, 529-B, 529-C, 529-E and 529-F-1) and six retirement plan share classes (Classes R-1, R-2, R-3, R-4, R-5 and R-6). The 529 college savings plan share classes can be used to save for college education. The retirement plan share classes are generally offered only through eligible employer-sponsored retirement plans. The fund’s share classes are further described:
| Share class | | Initial sales charge | | Contingent deferred sales
charge upon redemption | | Conversion feature |
| Classes A and 529-A | | Up to 5.75% | | None (except 1% for certain redemptions within one year of purchase without an initial sales charge) | | None |
| Classes B and 529-B* | | None | | Declines from 5% to 0% for redemptions within six years of purchase | | Classes B and 529-B convert to Classes A and 529-A, respectively, after eight years |
| Class C | | None | | 1% for redemptions within one year of purchase | | Class C converts to Class F-1 after 10 years |
| Class 529-C | | None | | 1% for redemptions within one year of purchase | | None |
| Class 529-E | | None | | None | | None |
| Classes F-1, F-2 and 529-F-1 | | None | | None | | None |
| Classes R-1, R-2, R-3, R-4, R-5 and R-6 | | None | | None | | None |
*Class B and 529-B shares of the fund are not available for purchase.
Holders of all share classes have equal pro rata rights to assets, dividends and liquidation proceeds. Each share class has identical voting rights, except for the exclusive right to vote on matters affecting only its class. Share classes have different fees and expenses (“class-specific fees and expenses”), primarily due to different arrangements for distribution, administrative and shareholder services. Differences in class-specific fees and expenses will result in differences in net investment income and, therefore, the payment of different per-share dividends by each share class.
2. Significant accounting policies
The financial statements have been prepared to comply with accounting principles generally accepted in the United States of America. These principles require management to make estimates and assumptions that affect reported amounts and disclosures. Actual results could differ from those estimates. The fund follows the significant accounting policies described in this section, as well as the valuation policies described in the next section on valuation.
Security transactions and related investment income — Security transactions are recorded by the fund as of the date the trades are executed with brokers. Realized gains and losses from security transactions are determined based on the specific identified cost of the securities. In the event a security is purchased with a delayed payment date, the fund will segregate liquid assets sufficient to meet its payment obligations. Dividend income is recognized on the ex-dividend date and interest income is recognized on an accrual basis. Market discounts, premiums and original issue discounts on fixed-income securities are amortized daily over the expected life of the security.
Class allocations — Income, fees and expenses (other than class-specific fees and expenses) and realized and unrealized gains and losses are allocated daily among the various share classes based on their relative net assets. Class-specific fees and expenses, such as distribution, administrative and shareholder services, are charged directly to the respective share class.
Dividends and distributions to shareholders — Dividends and distributions to shareholders are recorded on the ex-dividend date.
Currency translation — Assets and liabilities, including investment securities, denominated in currencies other than U.S. dollars are translated into U.S. dollars at the exchange rates supplied by one or more pricing vendors on the valuation date. Purchases and sales of investment securities and income and expenses are translated into U.S. dollars at the exchange rates on the dates of such transactions. The effects of changes in exchange rates on investment securities are included with the net realized gain or loss and net unrealized appreciation or depreciation on investments in the fund’s statement of operations. The realized gain or loss and unrealized appreciation or depreciation resulting from all other transactions denominated in currencies other than U.S. dollars are disclosed separately.
3. Valuation
Capital Research and Management Company (“CRMC”), the fund’s investment adviser, values the fund’s investments at fair value as defined by accounting principles generally accepted in the United States of America. The net asset value of each share class of the fund is generally determined as of approximately 4:00 p.m. New York time each day the New York Stock Exchange is open.
Methods and inputs — The fund’s investment adviser uses the following methods and inputs to establish the fair value of the fund’s assets and liabilities. Use of particular methods and inputs may vary over time based on availability and relevance as market and economic conditions evolve.
Equity securities are generally valued at the official closing price of, or the last reported sale price on, the exchange or market on which such securities are traded, as of the close of business on the day the securities are being valued or, lacking any sales, at the last available bid price. Prices for each security are taken from the principal exchange or market on which the security trades.
Fixed-income securities, including short-term securities purchased with more than 60 days left to maturity, are generally valued at prices obtained from one or more pricing vendors. Vendors value such securities based on one or more of the inputs described in the following table. The table provides examples of inputs that are commonly relevant for valuing particular classes of fixed-income securities in which the fund is authorized to invest. However, these classifications are not exclusive, and any of the inputs may be used to value any other class of fixed-income security.
| Fixed-income class | Example of standard inputs |
| All | Benchmark yields, transactions, bids, offers, quotations from dealers and trading systems, new issues, spreads and other relationships observed in the markets among comparable securities; and proprietary pricing models such as yield measures calculated using factors such as cash flows, financial or collateral performance and other reference data (collectively referred to as “standard inputs”) |
| Corporate bonds & notes; convertible securities | Standard inputs and underlying equity of the issuer |
| Bonds & notes of governments & government agencies | Standard inputs and interest rate volatilities |
| Mortgage-backed; asset-backed obligations | Standard inputs and cash flows, prepayment information, default rates, delinquency and loss assumptions, collateral characteristics, credit enhancements and specific deal information |
When the fund’s investment adviser deems it appropriate to do so (such as when vendor prices are unavailable or not deemed to be representative), fixed-income securities will be valued in good faith at the mean quoted bid and ask prices that are reasonably and timely available (or bid prices, if ask prices are not available) or at prices for securities of comparable maturity, quality and type.
Securities with both fixed-income and equity characteristics, or equity securities traded principally among fixed-income dealers, are generally valued in the manner described for either equity or fixed-income securities, depending on which method is deemed most appropriate by the fund’s investment adviser. Short-term securities purchased within 60 days to maturity are valued at amortized cost, which approximates fair value. The value of short-term securities originally purchased with maturities greater than 60 days is determined based on an amortized value to par when they reach 60 days.
Securities and other assets for which representative market quotations are not readily available or are considered unreliable by the fund’s investment adviser are fair valued as determined in good faith under fair valuation guidelines adopted by authority of the fund’s board of trustees as further described. The investment adviser follows fair valuation guidelines, consistent with U.S. Securities and Exchange Commission rules and guidance, to consider relevant principles and factors when making fair value determinations.
The investment adviser considers relevant indications of value that are reasonably and timely available to it in determining the fair value to be assigned to a particular security, such as the type and cost of the security; contractual or legal restrictions on resale of the security; relevant financial or business developments of the issuer; actively traded similar or related securities; conversion or exchange rights on the security; related corporate actions; significant events occurring after the close of trading in the security; and changes in overall market conditions. In addition, the closing prices of equity securities that trade in markets outside U.S. time zones may be adjusted to reflect significant events that occur after the close of local trading but before the net asset value of each share class of the fund is determined. Fair valuations and valuations of investments that are not actively trading involve judgment and may differ materially from valuations that would have been used had greater market activity occurred.
Processes and structure — The fund’s board of trustees has delegated authority to the fund’s investment adviser to make fair value determinations, subject to board oversight. The investment adviser has established a Joint Fair Valuation Committee (the “Fair Valuation Committee”) to administer, implement and oversee the fair valuation process, and to make fair value decisions. The Fair Valuation Committee regularly reviews its own fair value decisions, as well as decisions made under its standing instructions to the investment adviser’s valuation teams. The Fair Valuation Committee reviews changes in fair value measurements from period to period and may, as deemed appropriate, update the fair valuation guidelines to better reflect the results of back testing and address new or evolving issues. The Fair Valuation Committee reports any changes to the fair valuation guidelines to the board of trustees with supplemental information to support the changes. The fund’s board and audit committee also regularly review reports that describe fair value determinations and methods.
The fund’s investment adviser has also established a Fixed-Income Pricing Review Group to administer and oversee the fixed-income valuation process, including the use of fixed-income pricing vendors. This group regularly reviews pricing vendor information and market data. Pricing decisions, processes and controls over security valuation are also subject to additional internal reviews, including an annual control self-evaluation program facilitated by the investment adviser’s compliance group.
Classifications — The fund’s investment adviser classifies the fund’s assets and liabilities into three levels based on the inputs used to value the assets or liabilities. Level 1 values are based on quoted prices in active markets for identical securities. Level 2 values are based on significant observable market inputs, such as quoted prices for similar securities and quoted prices in inactive markets. Certain securities trading outside the U.S. may transfer between Level 1 and Level 2 due to valuation adjustments resulting from significant market movements following the close of local trading. Level 3 values are based on significant unobservable inputs that reflect the investment adviser’s determination of assumptions that market participants might reasonably use in valuing the securities. The valuation levels are not necessarily an indication of the risk or liquidity associated with the underlying investment. For example, U.S. government securities are reflected as Level 2 because the inputs used to determine fair value may not always be quoted prices in an active market. The following table presents the fund’s valuation levels as of December 31, 2013 (dollars in thousands):
| | | Investment securities |
| | | Level 1* | | | Level 2 | | | Level 3 | | | Total |
| Assets: | | | | | | | | | | | | | | | |
| Common stocks: | | | | | | | | | | | | | | | |
| Consumer discretionary | | $ | 11,810,101 | | | $ | — | | | $ | — | | | $ | 11,810,101 |
| Financials | | | 10,547,624 | | | | — | | | | — | | | | 10,547,624 |
| Industrials | | | 9,722,051 | | | | — | | | | — | | | | 9,722,051 |
| Information technology | | | 9,369,584 | | | | — | | | | — | | | | 9,369,584 |
| Health care | | | 6,951,087 | | | | — | | | | — | | | | 6,951,087 |
| Energy | | | 6,560,139 | | | | — | | | | — | | | | 6,560,139 |
| Consumer staples | | | 3,471,650 | | | | — | | | | — | | | | 3,471,650 |
| Materials | | | 3,333,936 | | | | — | | | | — | | | | 3,333,936 |
| Telecommunication services | | | 1,814,439 | | | | — | | | | — | | | | 1,814,439 |
| Utilities | | | 529,101 | | | | — | | | | — | | | | 529,101 |
| Miscellaneous | | | 1,000,924 | | | | — | | | | — | | | | 1,000,924 |
| Warrants | | | 2,468 | | | | — | | | | — | | | | 2,468 |
| Short-term securities | | | — | | | | 2,586,396 | | | | — | | | | 2,586,396 |
| Total | | $ | 65,113,104 | | | $ | 2,586,396 | | | $ | — | | | $ | 67,699,500 |
| * | Securities with a value of $3,853,045,000, which represented 5.69% of the net assets of the fund, transferred from Level 2 to Level 1 since the prior fiscal year-end, primarily due to a lack of significant market movements following the close of local trading. |
4. Risk factors
Investing in the fund may involve certain risks including, but not limited to, those described below.
Market conditions — The prices of, and the income generated by, the common stocks and other securities held by the fund may decline in response to certain events taking place around the world, including those directly involving the issuers of securities held by the fund; conditions affecting the general economy; overall market changes; local, regional or global political, social or economic instability; governmental or governmental agency responses to economic conditions; and currency, interest rate and commodity price fluctuations.
Investing in growth-oriented stocks — Growth-oriented common stocks and other equity-type securities (such as preferred stocks, convertible preferred stocks and convertible bonds) may involve larger price swings and greater potential for loss than other types of investments.
Investing in income-oriented stocks — Income provided by the fund may be reduced by changes in the dividend policies of, and the capital resources available for dividend payments at, the companies in which the fund invests.
Investing outside the U.S. — Securities of issuers domiciled outside the U.S., or with significant operations outside the U.S., may lose value because of adverse political, social, economic or market developments in the countries or regions in which the issuers operate. These securities may also lose value due to changes in foreign currency exchange rates against the U.S. dollar and/or currencies of other countries. Securities markets in certain countries may be more volatile and/or less liquid than those in the U.S. Investments outside the U.S. may also be subject to different accounting practices and different regulatory, legal and reporting standards, and may be more difficult to value, than those in the U.S. In addition, the value of investments outside the U.S. may be reduced by foreign taxes, including foreign withholding taxes on interest and dividends. Further, there may be increased risks of delayed settlement of securities purchased or sold by the fund. The risks of investing outside the U.S. may be heightened in connection with investments in emerging markets.
Management — The investment adviser to the fund actively manages the fund’s investments. Consequently, the fund is subject to the risk that the methods and analyses employed by the investment adviser in this process may not produce the desired results. This could cause the fund to lose value or its investment results to lag relevant benchmarks or other funds with similar objectives.
5. Taxation and distributions
Federal income taxation — The fund complies with the requirements under Subchapter M of the Internal Revenue Code applicable to mutual funds and intends to distribute substantially all of its net taxable income and net capital gains each year. The fund is not subject to income taxes to the extent such distributions are made. Therefore, no federal income tax provision is required.
As of and during the period ended December 31, 2013, the fund did not have a liability for any unrecognized tax benefits. The fund recognizes interest and penalties, if any, related to unrecognized tax benefits as income tax expense in the statement of operations. During the period, the fund did not incur any interest or penalties.
The fund is not subject to examination by U.S. federal tax authorities for tax years before 2010, by state tax authorities for tax years before 2009 and by tax authorities outside the U.S. for tax years before 2006.
Non-U.S. taxation — Dividend income is recorded net of non-U.S. taxes paid. Gains realized by the fund on the sale of securities in certain countries are subject to non-U.S. taxes. The fund records a liability based on unrealized gains to provide for potential non-U.S. taxes payable upon the sale of these securities.
Distributions — Distributions paid to shareholders are based on net investment income and net realized gains determined on a tax basis, which may differ from net investment income and net realized gains for financial reporting purposes. These differences are due primarily to different treatment for items such as currency gains and losses; short-term capital gains and losses; capital losses related to sales of certain securities within 30 days of purchase; and net capital losses. The fiscal year in which amounts are distributed may differ from the year in which the net investment income and net realized gains are recorded by the fund for financial reporting purposes. The fund may also designate a portion of the amount paid to redeeming shareholders as a distribution for tax purposes.
During the year ended December 31, 2013, the fund reclassified $126,000 from undistributed net investment income to capital paid in on shares of beneficial interest, $87,100,000 from undistributed net realized gain to capital paid in on shares of beneficial interest and $11,280,000 from undistributed net realized gain to undistributed net investment income to align financial reporting with tax reporting. The fund also utilized capital loss carryforward of $1,821,616,000.
As of December 31, 2013, the tax basis components of distributable earnings, unrealized appreciation (depreciation) and cost of investment securities were as follows (dollars in thousands):
| Undistributed ordinary income | | $ | 184,333 | |
| Undistributed long-term capital gains | | | 635,539 | |
| Gross unrealized appreciation on investment securities | | | 24,504,557 | |
| Gross unrealized depreciation on investment securities | | | (314,355 | ) |
| Net unrealized appreciation on investment securities | | | 24,190,202 | |
| Cost of investment securities | | | 43,509,298 | |
The tax character of distributions paid to shareholders was as follows (dollars in thousands):
| | | Year ended December 31, 2013 | | | Year ended December 31, 2012 |
| Share class | | Ordinary
income | | | Long-term
capital gains | | | Total
distributions
paid | | | Ordinary
income | | | Long-term
capital gains | | | Total
distributions
paid |
| Class A | | $ | 513,793 | | | $ | 720,627 | | | $ | 1,234,420 | | | $ | 530,525 | | | $ | — | | | $ | 530,525 |
| Class B | | | 2,649 | | | | 8,096 | | | | 10,745 | | | | 4,261 | | | | — | | | | 4,261 |
| Class C | | | 12,323 | | | | 40,660 | | | | 52,983 | | | | 15,856 | | | | — | | | | 15,856 |
| Class F-1 | | | 63,656 | | | | 91,663 | | | | 155,319 | | | | 73,364 | | | | — | | | | 73,364 |
| Class F-2 | | | 31,514 | | | | 42,802 | | | | 74,316 | | | | 23,514 | | | | — | | | | 23,514 |
| Class 529-A | | | 18,052 | | | | 27,333 | | | | 45,385 | | | | 17,739 | | | | — | | | | 17,739 |
| Class 529-B | | | 178 | | | | 703 | | | | 881 | | | | 312 | | | | — | | | | 312 |
| Class 529-C | | | 1,902 | | | | 7,181 | | | | 9,083 | | | | 2,429 | | | | — | | | | 2,429 |
| Class 529-E | | | 623 | | | | 1,153 | | | | 1,776 | | | | 638 | | | | — | | | | 638 |
| Class 529-F-1 | | | 877 | | | | 1,146 | | | | 2,023 | | | | 808 | | | | — | | | | 808 |
| Class R-1 | | | 939 | | | | 2,988 | | | | 3,927 | | | | 1,329 | | | | — | | | | 1,329 |
| Class R-2 | | | 4,611 | | | | 13,460 | | | | 18,071 | | | | 5,663 | | | | — | | | | 5,663 |
| Class R-3 | | | 27,448 | | | | 48,796 | | | | 76,244 | | | | 31,561 | | | | — | | | | 31,561 |
| Class R-4 | | | 35,636 | | | | 50,408 | | | | 86,044 | | | | 38,396 | | | | — | | | | 38,396 |
| Class R-5 | | | 28,959 | | | | 34,053 | | | | 63,012 | | | | 29,470 | | | | — | | | | 29,470 |
| Class R-6 | | | 64,799 | | | | 77,672 | | | | 142,471 | | | | 40,666 | | | | — | | | | 40,666 |
| Total | | $ | 807,959 | | | $ | 1,168,741 | | | $ | 1,976,700 | | | $ | 816,531 | | | $ | — | | | $ | 816,531 |
6. Fees and transactions with related parties
CRMC, the fund’s investment adviser, is the parent company of American Funds Distributors,® Inc. (“AFD”), the principal underwriter of the fund’s shares, and American Funds Service Company® (“AFS”), the fund’s transfer agent. CRMC, AFD and AFS are considered related parties to the fund.
Investment advisory services — The fund has an investment advisory and service agreement with CRMC that provides for monthly fees accrued daily. These fees are based on a series of decreasing annual rates beginning with 0.390% on the first $1 billion of daily net assets and decreasing to 0.232% on such assets in excess of $55 billion. For the year ended December 31, 2013, the investment advisory services fee was $148,918,000, which was equivalent to an annualized rate of 0.249% of average daily net assets.
Class-specific fees and expenses — Expenses that are specific to individual share classes are accrued directly to the respective share class. The principal class-specific fees and expenses are described below:
Distribution services — The fund has plans of distribution for all share classes, except Class F-2, R-5 and R-6 shares. Under the plans, the board of trustees approves certain categories of expenses that are used to finance activities primarily intended to sell fund shares and service existing accounts. The plans provide for payments, based on an annualized percentage of average daily net assets, ranging from 0.25% to 1.00% as noted in this section. In some cases, the board of trustees has limited the amounts that may be paid to less than the maximum allowed by the plans. All share classes with a plan may use up to 0.25% of average daily net assets to pay service fees, or to compensate AFD for paying service fees, to firms that have entered into agreements with AFD to provide certain shareholder services. The remaining amounts available to be paid under each plan are paid to dealers to compensate them for their sales activities.
For Class A and 529-A shares, distribution-related expenses include the reimbursement of dealer and wholesaler commissions paid by AFD for certain shares sold without a sales charge. These share classes reimburse AFD for amounts billed within the prior 15 months but only to the extent that the overall annual expense limit of 0.25% is not exceeded. As of December 31, 2013, there were no unreimbursed expenses subject to reimbursement for Class A or 529-A shares.
| Share class | | Currently approved limits | | Plan limits |
| Class A | | | 0.25 | % | | | 0.25 | % |
| Class 529-A | | | 0.25 | | | | 0.50 | |
| Classes B and 529-B | | | 1.00 | | | | 1.00 | |
| Classes C, 529-C and R-1 | | | 1.00 | | | | 1.00 | |
| Class R-2 | | | 0.75 | | | | 1.00 | |
| Classes 529-E and R-3 | | | 0.50 | | | | 0.75 | |
| Classes F-1, 529-F-1 and R-4 | | | 0.25 | | | | 0.50 | |
Transfer agent services — The fund has a shareholder services agreement with AFS under which the fund compensates AFS for providing transfer agent services to each of the fund’s share classes. These services include recordkeeping, shareholder communications and transaction processing. In addition, the fund reimburses AFS for amounts paid to third parties for performing transfer agent services on behalf of fund shareholders.
Administrative services — The fund has an administrative services agreement with CRMC under which the fund compensates CRMC for providing administrative services to Class A, C, F, 529 and R shares. These services include, but are not limited to, coordinating, monitoring, assisting and overseeing third parties that provide services to fund shareholders. Under the agreement, Class A shares pay an annual fee of 0.01% and Class C, F, 529 and R shares pay an annual fee of 0.05% of their respective average daily net assets.
529 plan services — Each 529 share class is subject to service fees to compensate the Commonwealth of Virginia for the maintenance of the 529 college savings plan. The quarterly fee is based on a series of decreasing annual rates beginning with 0.10% on the first $30 billion of the net assets invested in Class 529 shares of the American Funds and decreasing to 0.06% on such assets between $120 billion and $150 billion. The fee for any given calendar quarter is accrued and calculated on the basis of the average net assets of Class 529 shares of the American Funds for the last month of the prior calendar quarter. The fee is included in other expenses in the fund’s statement of operations. The Commonwealth of Virginia is not considered a related party.
For the year ended December 31, 2013, class-specific expenses under the agreements were as follows (dollars in thousands):
| Share class | | Distribution
services | | Transfer agent
services | | Administrative
services | | 529 plan
services |
| Class A | | | $87,759 | | | | $46,512 | | | | $3,706 | | | | Not applicable |
| Class B | | | 4,627 | | | | 620 | | | | Not applicable | | | | Not applicable |
| Class C | | | 20,889 | | | | 2,679 | | | | 1,047 | | | | Not applicable |
| Class F-1 | | | 12,282 | | | | 6,944 | | | | 2,464 | | | | Not applicable |
| Class F-2 | | | Not applicable | | | | 1,829 | | | | 922 | | | | Not applicable |
| Class 529-A | | | 2,955 | | | | 1,372 | | | | 689 | | | | $1,349 |
| Class 529-B | | | 404 | | | | 47 | | | | 20 | | | | 40 |
| Class 529-C | | | 3,631 | | | | 390 | | | | 182 | | | | 357 |
| Class 529-E | | | 290 | | | | 34 | | | | 29 | | | | 57 |
| Class 529-F-1 | | | — | | | | 57 | | | | 29 | | | | 56 |
| Class R-1 | | | 1,569 | | | | 168 | | | | 79 | | | | Not applicable |
| Class R-2 | | | 5,237 | | | | 2,178 | | | | 352 | | | | Not applicable |
| Class R-3 | | | 13,115 | | | | 3,919 | | | | 1,315 | | | | Not applicable |
| Class R-4 | | | 6,572 | | | | 2,653 | | | | 1,318 | | | | Not applicable |
| Class R-5 | | | Not applicable | | | | 850 | | | | 872 | | | | Not applicable |
| Class R-6 | | | Not applicable | | | | 18 | | | | 1,818 | | | | Not applicable |
| Total class-specific expenses | | | $159,330 | | | | $70,270 | | | | $14,842 | | | | $1,859 |
Trustees’ deferred compensation — Trustees who are unaffiliated with CRMC may elect to defer the cash payment of part or all of their compensation. These deferred amounts, which remain as liabilities of the fund, are treated as if invested in shares of the fund or other American Funds. These amounts represent general, unsecured liabilities of the fund and vary according to the total returns of the selected funds. Trustees’ compensation of $1,154,000, in the fund’s statement of operations, includes $392,000 in current fees (either paid in cash or deferred) and a net increase of $762,000 in the value of the deferred amounts.
Affiliated officers and trustees — Officers and certain trustees of the fund are or may be considered to be affiliated with CRMC, AFD and AFS. No affiliated officers or trustees received any compensation directly from the fund.
7. Capital share transactions
Capital share transactions in the fund were as follows (dollars and shares in thousands):
| | | Sales* | | | Reinvestments of
dividends
and distributions | | | Repurchases* | | | Net increase
(decrease) | |
| Share class | | Amount | | | Shares | | | Amount | | | Shares | | | Amount | | | Shares | | | Amount | | | Shares | |
| | | | | | | | | | | | | | | | | | | | | | | | | |
| Year ended December 31, 2013 | | | | | | | | | | | | | | | | | | | | | | | | | |
| | | | | | | | | | | | | | | | | | | | | | | | | | | | | | | | | |
| Class A | | $ | 3,448,489 | | | | 74,176 | | | $ | 1,210,350 | | | | 24,454 | | | $ | (4,317,349 | ) | | | (92,697 | ) | | $ | 341,490 | | | | 5,933 | |
| Class B | | | 11,393 | | | | 245 | | | | 10,666 | | | | 213 | | | | (132,485 | ) | | | (2,869 | ) | | | (110,426 | ) | | | (2,411 | ) |
| Class C | | | 313,424 | | | | 6,762 | | | | 52,176 | | | | 1,042 | | | | (368,787 | ) | | | (7,951 | ) | | | (3,187 | ) | | | (147 | ) |
| Class F-1 | | | 924,486 | | | | 19,827 | | | | 154,281 | | | | 3,119 | | | | (1,468,666 | ) | | | (31,298 | ) | | | (389,899 | ) | | | (8,352 | ) |
| Class F-2 | | | 839,064 | | | | 17,327 | | | | 69,565 | | | | 1,404 | | | | (382,030 | ) | | | (8,207 | ) | | | 526,599 | | | | 10,524 | |
| Class 529-A | | | 177,318 | | | | 3,813 | | | | 45,378 | | | | 916 | | | | (146,630 | ) | | | (3,152 | ) | | | 76,066 | | | | 1,577 | |
| Class 529-B | | | 1,100 | | | | 24 | | | | 880 | | | | 17 | | | | (12,335 | ) | | | (267 | ) | | | (10,355 | ) | | | (226 | ) |
| Class 529-C | | | 48,976 | | | | 1,051 | | | | 9,079 | | | | 181 | | | | (47,863 | ) | | | (1,030 | ) | | | 10,192 | | | | 202 | |
| Class 529-E | | | 8,384 | | | | 179 | | | | 1,776 | | | | 35 | | | | (7,139 | ) | | | (152 | ) | | | 3,021 | | | | 62 | |
| Class 529-F-1 | | | 13,441 | | | | 286 | | | | 2,019 | | | | 41 | | | | (10,249 | ) | | | (217 | ) | | | 5,211 | | | | 110 | |
| Class R-1 | | | 28,443 | | | | 616 | | | | 3,921 | | | | 78 | | | | (44,951 | ) | | | (978 | ) | | | (12,587 | ) | | | (284 | ) |
| Class R-2 | | | 161,540 | | | | 3,505 | | | | 18,065 | | | | 362 | | | | (201,324 | ) | | | (4,358 | ) | | | (21,719 | ) | | | (491 | ) |
| Class R-3 | | | 522,597 | | | | 11,370 | | | | 76,219 | | | | 1,537 | | | | (801,668 | ) | | | (17,177 | ) | | | (202,852 | ) | | | (4,270 | ) |
| Class R-4 | | | 499,256 | | | | 10,776 | | | | 86,040 | | | | 1,742 | | | | (768,659 | ) | | | (16,467 | ) | | | (183,363 | ) | | | (3,949 | ) |
| Class R-5 | | | 367,587 | | | | 7,932 | | | | 62,957 | | | | 1,277 | | | | (399,954 | ) | | | (8,586 | ) | | | 30,590 | | | | 623 | |
| Class R-6 | | | 1,559,432 | | | | 34,497 | | | | 142,471 | | | | 2,886 | | | | (447,738 | ) | | | (9,581 | ) | | | 1,254,165 | | | | 27,802 | |
| Total net increase (decrease) | | $ | 8,924,930 | | | | 192,386 | | | $ | 1,945,843 | | | | 39,304 | | | $ | (9,557,827 | ) | | | (204,987 | ) | | $ | 1,312,946 | | | | 26,703 | |
See page 26 for footnote.
| | | Sales* | | | Reinvestments of
dividends
and distributions | | | Repurchases* | | | Net (decrease)
increase | |
| Share class | | Amount | | | Shares | | | Amount | | | Shares | | | Amount | | | Shares | | | Amount | | | Shares | |
| | | | | | | | | | | | | | | | | | | | | | | | | | | | | | | | | |
| Year ended December 31, 2012 | | | | | | | | | | | | | | | | | | | | | | | | | |
| | | | | | | | | | | | | | | | | | | | | | | | | | | | | | | | | |
| Class A | | $ | 2,453,514 | | | | 63,447 | | | $ | 516,906 | | | | 13,080 | | | $ | (5,061,560 | ) | | | (130,497 | ) | | $ | (2,091,140 | ) | | | (53,970 | ) |
| Class B | | | 13,205 | | | | 345 | | | | 4,218 | | | | 106 | | | | (171,381 | ) | | | (4,468 | ) | | | (153,958 | ) | | | (4,017 | ) |
| Class C | | | 202,268 | | | | 5,257 | | | | 15,516 | | | | 391 | | | | (431,015 | ) | | | (11,215 | ) | | | (213,231 | ) | | | (5,567 | ) |
| Class F-1 | | | 1,029,045 | | | | 26,471 | | | | 72,692 | | | | 1,841 | | | | (1,510,388 | ) | | | (38,960 | ) | | | (408,651 | ) | | | (10,648 | ) |
| Class F-2 | | | 690,318 | | | | 17,594 | | | | 20,440 | | | | 515 | | | | (259,700 | ) | | | (6,662 | ) | | | 451,058 | | | | 11,447 | |
| Class 529-A | | | 166,520 | | | | 4,312 | | | | 17,735 | | | | 449 | | | | (130,069 | ) | | | (3,350 | ) | | | 54,186 | | | | 1,411 | |
| Class 529-B | | | 1,501 | | | | 39 | | | | 312 | | | | 8 | | | | (15,117 | ) | | | (394 | ) | | | (13,304 | ) | | | (347 | ) |
| Class 529-C | | | 49,273 | | | | 1,275 | | | | 2,429 | | | | 61 | | | | (47,839 | ) | | | (1,235 | ) | | | 3,863 | | | | 101 | |
| Class 529-E | | | 7,439 | | | | 194 | | | | 638 | | | | 16 | | | | (6,654 | ) | | | (172 | ) | | | 1,423 | | | | 38 | |
| Class 529-F-1 | | | 9,774 | | | | 252 | | | | 808 | | | | 21 | | | | (8,645 | ) | | | (224 | ) | | | 1,937 | | | | 49 | |
| Class R-1 | | | 33,132 | | | | 865 | | | | 1,327 | | | | 34 | | | | (51,688 | ) | | | (1,336 | ) | | | (17,229 | ) | | | (437 | ) |
| Class R-2 | | | 150,270 | | | | 3,906 | | | | 5,660 | | | | 143 | | | | (202,893 | ) | | | (5,266 | ) | | | (46,963 | ) | | | (1,217 | ) |
| Class R-3 | | | 515,702 | | | | 13,367 | | | | 31,548 | | | | 798 | | | | (650,464 | ) | | | (16,771 | ) | | | (103,214 | ) | | | (2,606 | ) |
| Class R-4 | | | 576,299 | | | | 14,962 | | | | 38,387 | | | | 972 | | | | (669,840 | ) | | | (17,315 | ) | | | (55,154 | ) | | | (1,381 | ) |
| Class R-5 | | | 368,240 | | | | 9,546 | | | | 29,415 | | | | 746 | | | | (486,978 | ) | | | (12,499 | ) | | | (89,323 | ) | | | (2,207 | ) |
| Class R-6 | | | 956,801 | | | | 24,680 | | | | 40,666 | | | | 1,027 | | | | (263,001 | ) | | | (6,778 | ) | | | 734,466 | | | | 18,929 | |
| Total net increase (decrease) | | $ | 7,223,301 | | | | 186,512 | | | $ | 798,697 | | | | 20,208 | | | $ | (9,967,232 | ) | | | (257,142 | ) | | $ | (1,945,234 | ) | | | (50,422 | ) |
| * | Includes exchanges between share classes of the fund. |
8. Investment transactions
The fund made purchases and sales of investment securities, excluding short-term securities and U.S. government obligations, if any, of $19,794,469,000 and $19,053,272,000, respectively, during the year ended December 31, 2013.
Financial highlights
| | | | | Income (loss) from
investment operations1 | | Dividends and distributions | | | | | | | | | | |
| | | Net asset
value,
beginning
of period | | | Net
investment
income2 | | | Net gains
(losses) on
securities
(both
realized and
unrealized) | | | Total from
investment
operations | | | Dividends
(from net
investment
income) | | | Distributions
(from capital
gains) | | | Total
dividends
and
distributions | | | Net asset
value, end
of period | | | Total
return3 | | | Net assets,
end of period
(in millions) | | | Ratio of
expenses
to average
net assets | | | Ratio of
net income
to average
net assets2 | |
| Class A: | | | | | | | | | | | | | | | | | | | | | | | | | | | | | | | | | | | | | | | | | | | | | | | | |
| Year ended 12/31/2013 | | $ | 40.78 | | | $ | .63 | | | $ | 12.13 | | | $ | 12.76 | | | $ | (.65 | ) | | $ | (.92 | ) | | $ | (1.57 | ) | | $ | 51.97 | | | | 31.49 | % | | $ | 41,820 | | | | .63 | % | | | 1.35 | % |
| Year ended 12/31/2012 | | | 35.39 | | | | .64 | | | | 5.40 | | | | 6.04 | | | | (.65 | ) | | | — | | | | (.65 | ) | | | 40.78 | | | | 17.14 | | | | 32,568 | | | | .65 | | | | 1.66 | |
| Year ended 12/31/2011 | | | 36.70 | | | | .60 | | | | (1.29 | ) | | | (.69 | ) | | | (.62 | ) | | | — | | | | (.62 | ) | | | 35.39 | | | | (1.89 | ) | | | 30,176 | | | | .63 | | | | 1.62 | |
| Year ended 12/31/2010 | | | 32.73 | | | | .59 | | | | 3.95 | | | | 4.54 | | | | (.57 | ) | | | — | | | | (.57 | ) | | | 36.70 | | | | 14.05 | | | | 33,089 | | | | .64 | | | | 1.78 | |
| Year ended 12/31/2009 | | | 24.98 | | | | .44 | | | | 7.79 | | | | 8.23 | | | | (.48 | ) | | | — | | | | (.48 | ) | | | 32.73 | | | | 33.36 | | | | 30,954 | | | | .69 | | | | 1.60 | |
| Class B: | | | | | | | | | | | | | | | | | | | | | | | | | | | | | | | | | | | | | | | | | | | | | | | | |
| Year ended 12/31/2013 | | | 40.68 | | | | .27 | | | | 12.11 | | | | 12.38 | | | | (.28 | ) | | | (.92 | ) | | | (1.20 | ) | | | 51.86 | | | | 30.53 | | | | 468 | | | | 1.39 | | | | .59 | |
| Year ended 12/31/2012 | | | 35.30 | | | | .34 | | | | 5.39 | | | | 5.73 | | | | (.35 | ) | | | — | | | | (.35 | ) | | | 40.68 | | | | 16.25 | | | | 465 | | | | 1.41 | | | | .89 | |
| Year ended 12/31/2011 | | | 36.60 | | | | .31 | | | | (1.28 | ) | | | (.97 | ) | | | (.33 | ) | | | — | | | | (.33 | ) | | | 35.30 | | | | (2.64 | ) | | | 545 | | | | 1.40 | | | | .85 | |
| Year ended 12/31/2010 | | | 32.64 | | | | .33 | | | | 3.94 | | | | 4.27 | | | | (.31 | ) | | | — | | | | (.31 | ) | | | 36.60 | | | | 13.18 | | | | 746 | | | | 1.41 | | | | 1.01 | |
| Year ended 12/31/2009 | | | 24.92 | | | | .23 | | | | 7.76 | | | | 7.99 | | | | (.27 | ) | | | — | | | | (.27 | ) | | | 32.64 | | | | 32.30 | | | | 897 | | | | 1.46 | | | | .85 | |
| Class C: | | | | | | | | | | | | | | | | | | | | | | | | | | | | | | | | | | | | | | | | | | | | | | | | |
| Year ended 12/31/2013 | | | 40.63 | | | | .25 | | | | 12.09 | | | | 12.34 | | | | (.28 | ) | | | (.92 | ) | | | (1.20 | ) | | | 51.77 | | | | 30.44 | | | | 2,352 | | | | 1.43 | | | | .54 | |
| Year ended 12/31/2012 | | | 35.26 | | | | .33 | | | | 5.38 | | | | 5.71 | | | | (.34 | ) | | | — | | | | (.34 | ) | | | 40.63 | | | | 16.21 | | | | 1,852 | | | | 1.45 | | | | .86 | |
| Year ended 12/31/2011 | | | 36.56 | | | | .30 | | | | (1.28 | ) | | | (.98 | ) | | | (.32 | ) | | | — | | | | (.32 | ) | | | 35.26 | | | | (2.67 | ) | | | 1,804 | | | | 1.44 | | | | .82 | |
| Year ended 12/31/2010 | | | 32.61 | | | | .32 | | | | 3.94 | | | | 4.26 | | | | (.31 | ) | | | — | | | | (.31 | ) | | | 36.56 | | | | 13.13 | | | | 2,081 | | | | 1.44 | | | | .98 | |
| Year ended 12/31/2009 | | | 24.90 | | | | .22 | | | | 7.75 | | | | 7.97 | | | | (.26 | ) | | | — | | | | (.26 | ) | | | 32.61 | | | | 32.26 | | | | 1,925 | | | | 1.48 | | | | .81 | |
| Class F-1: | | | | | | | | | | | | | | | | | | | | | | | | | | | | | | | | | | | | | | | | | | | | | | | | |
| Year ended 12/31/2013 | | | 40.76 | | | | .59 | | | | 12.14 | | | | 12.73 | | | | (.62 | ) | | | (.92 | ) | | | (1.54 | ) | | | 51.95 | | | | 31.42 | | | | 5,306 | | | | .70 | | | | 1.27 | |
| Year ended 12/31/2012 | | | 35.37 | | | | .64 | | | | 5.39 | | | | 6.03 | | | | (.64 | ) | | | — | | | | (.64 | ) | | | 40.76 | | | | 17.12 | | | | 4,503 | | | | .66 | | | | 1.65 | |
| Year ended 12/31/2011 | | | 36.68 | | | | .59 | | | | (1.29 | ) | | | (.70 | ) | | | (.61 | ) | | | — | | | | (.61 | ) | | | 35.37 | | | | (1.92 | ) | | | 4,285 | | | | .67 | | | | 1.60 | |
| Year ended 12/31/2010 | | | 32.72 | | | | .59 | | | | 3.93 | | | | 4.52 | | | | (.56 | ) | | | — | | | | (.56 | ) | | | 36.68 | | | | 14.01 | | | | 4,330 | | | | .66 | | | | 1.77 | |
| Year ended 12/31/2009 | | | 24.97 | | | | .45 | | | | 7.79 | | | | 8.24 | | | | (.49 | ) | | | — | | | | (.49 | ) | | | 32.72 | | | | 33.40 | | | | 3,868 | | | | .67 | | | | 1.61 | |
| Class F-2: | | | | | | | | | | | | | | | | | | | | | | | | | | | | | | | | | | | | | | | | | | | | | | | | |
| Year ended 12/31/2013 | | | 40.77 | | | | .74 | | | | 12.13 | | | | 12.87 | | | | (.76 | ) | | | (.92 | ) | | | (1.68 | ) | | | 51.96 | | | | 31.80 | | | | 2,485 | | | | .41 | | | | 1.58 | |
| Year ended 12/31/2012 | | | 35.39 | | | | .76 | | | | 5.37 | | | | 6.13 | | | | (.75 | ) | | | — | | | | (.75 | ) | | | 40.77 | | | | 17.39 | | | | 1,521 | | | | .41 | | | | 1.96 | |
| Year ended 12/31/2011 | | | 36.70 | | | | .68 | | | | (1.29 | ) | | | (.61 | ) | | | (.70 | ) | | | — | | | | (.70 | ) | | | 35.39 | | | | (1.67 | ) | | | 915 | | | | .42 | | | | 1.85 | |
| Year ended 12/31/2010 | | | 32.73 | | | | .67 | | | | 3.95 | | | | 4.62 | | | | (.65 | ) | | | — | | | | (.65 | ) | | | 36.70 | | | | 14.32 | | | | 888 | | | | .40 | | | | 2.03 | |
| Year ended 12/31/2009 | | | 24.98 | | | | .49 | | | | 7.81 | | | | 8.30 | | | | (.55 | ) | | | — | | | | (.55 | ) | | | 32.73 | | | | 33.72 | | | | 641 | | | | .43 | | | | 1.69 | |
| Class 529-A: | | | | | | | | | | | | | | | | | | | | | | | | | | | | | | | | | | | | | | | | | | | | | | | | |
| Year ended 12/31/2013 | | | 40.74 | | | | .59 | | | | 12.12 | | | | 12.71 | | | | (.61 | ) | | | (.92 | ) | | | (1.53 | ) | | | 51.92 | | | | 31.39 | | | | 1,590 | | | | .72 | | | | 1.26 | |
| Year ended 12/31/2012 | | | 35.36 | | | | .61 | | | | 5.39 | | | | 6.00 | | | | (.62 | ) | | | — | | | | (.62 | ) | | | 40.74 | | | | 17.03 | | | | 1,183 | | | | .73 | | | | 1.59 | |
| Year ended 12/31/2011 | | | 36.67 | | | | .57 | | | | (1.29 | ) | | | (.72 | ) | | | (.59 | ) | | | — | | | | (.59 | ) | | | 35.36 | | | | (1.97 | ) | | | 977 | | | | .71 | | | | 1.55 | |
| Year ended 12/31/2010 | | | 32.71 | | | | .58 | | | | 3.93 | | | | 4.51 | | | | (.55 | ) | | | — | | | | (.55 | ) | | | 36.67 | | | | 13.98 | | | | 916 | | | | .69 | | | | 1.74 | |
| Year ended 12/31/2009 | | | 24.97 | | | | .43 | | | | 7.78 | | | | 8.21 | | | | (.47 | ) | | | — | | | | (.47 | ) | | | 32.71 | | | | 33.30 | | | | 723 | | | | .73 | | | | 1.55 | |
| Class 529-B: | | | | | | | | | | | | | | | | | | | | | | | | | | | | | | | | | | | | | | | | | | | | | | | | |
| Year ended 12/31/2013 | | | 40.75 | | | | .21 | | | | 12.13 | | | | 12.34 | | | | (.22 | ) | | | (.92 | ) | | | (1.14 | ) | | | 51.95 | | | | 30.36 | | | | 41 | | | | 1.52 | | | | .46 | |
| Year ended 12/31/2012 | | | 35.36 | | | | .29 | | | | 5.39 | | | | 5.68 | | | | (.29 | ) | | | — | | | | (.29 | ) | | | 40.75 | | | | 16.09 | | | | 41 | | | | 1.54 | | | | .76 | |
| Year ended 12/31/2011 | | | 36.66 | | | | .27 | | | | (1.28 | ) | | | (1.01 | ) | | | (.29 | ) | | | — | | | | (.29 | ) | | | 35.36 | | | | (2.74 | ) | | | 48 | | | | 1.51 | | | | .74 | |
| Year ended 12/31/2010 | | | 32.69 | | | | .30 | | | | 3.95 | | | | 4.25 | | | | (.28 | ) | | | — | | | | (.28 | ) | | | 36.66 | | | | 13.09 | | | | 63 | | | | 1.50 | | | | .92 | |
| Year ended 12/31/2009 | | | 24.96 | | | | .20 | | | | 7.77 | | | | 7.97 | | | | (.24 | ) | | | — | | | | (.24 | ) | | | 32.69 | | | | 32.16 | | | | 71 | | | | 1.55 | | | | .74 | |
| Class 529-C: | | | | | | | | | | | | | | | | | | | | | | | | | | | | | | | | | | | | | | | | | | | | | | | | |
| Year ended 12/31/2013 | | | 40.71 | | | | .22 | | | | 12.11 | | | | 12.33 | | | | (.24 | ) | | | (.92 | ) | | | (1.16 | ) | | | 51.88 | | | | 30.37 | | | | 416 | | | | 1.51 | | | | .47 | |
| Year ended 12/31/2012 | | | 35.34 | | | | .30 | | | | 5.38 | | | | 5.68 | | | | (.31 | ) | | | — | | | | (.31 | ) | | | 40.71 | | | | 16.09 | | | | 319 | | | | 1.53 | | | | .79 | |
| Year ended 12/31/2011 | | | 36.64 | | | | .28 | | | | (1.28 | ) | | | (1.00 | ) | | | (.30 | ) | | | — | | | | (.30 | ) | | | 35.34 | | | | (2.72 | ) | | | 273 | | | | 1.51 | | | | .76 | |
| Year ended 12/31/2010 | | | 32.69 | | | | .31 | | | | 3.93 | | | | 4.24 | | | | (.29 | ) | | | — | | | | (.29 | ) | | | 36.64 | | | | 13.05 | | | | 265 | | | | 1.49 | | | | .94 | |
| Year ended 12/31/2009 | | | 24.95 | | | | .20 | | | | 7.78 | | | | 7.98 | | | | (.24 | ) | | | — | | | | (.24 | ) | | | 32.69 | | | | 32.22 | | | | 215 | | | | 1.55 | | | | .74 | |
| Class 529-E: | | | | | | | | | | | | | | | | | | | | | | | | | | | | | | | | | | | | | | | | | | | | | | | | |
| Year ended 12/31/2013 | | | 40.71 | | | | .47 | | | | 12.13 | | | | 12.60 | | | | (.50 | ) | | | (.92 | ) | | | (1.42 | ) | | | 51.89 | | | | 31.10 | | | | 67 | | | | .96 | | | | 1.02 | |
| Year ended 12/31/2012 | | | 35.34 | | | | .52 | | | | 5.37 | | | | 5.89 | | | | (.52 | ) | | | — | | | | (.52 | ) | | | 40.71 | | | | 16.73 | | | | 50 | | | | .98 | | | | 1.34 | |
| Year ended 12/31/2011 | | | 36.65 | | | | .47 | | | | (1.29 | ) | | | (.82 | ) | | | (.49 | ) | | | — | | | | (.49 | ) | | | 35.34 | | | | (2.23 | ) | | | 42 | | | | .98 | | | | 1.29 | |
| Year ended 12/31/2010 | | | 32.69 | | | | .48 | | | | 3.94 | | | | 4.42 | | | | (.46 | ) | | | — | | | | (.46 | ) | | | 36.65 | | | | 13.66 | | | | 41 | | | | .98 | | | | 1.45 | |
| Year ended 12/31/2009 | | | 24.95 | | | | .34 | | | | 7.78 | | | | 8.12 | | | | (.38 | ) | | | — | | | | (.38 | ) | | | 32.69 | | | | 32.89 | | | | 32 | | | | 1.04 | | | | 1.24 | |
See page 28 for footnotes.
Financial highlights (continued)
| | | | | Income (loss) from
investment operations1 | | Dividends and distributions | | | | | | | | | | |
| | | Net asset
value,
beginning
of period | | | Net
investment
income2 | | | Net gains
(losses) on
securities
(both
realized and
unrealized) | | | Total from
investment
operations | | | Dividends
(from net
investment
income) | | | Distributions
(from capital
gains) | | | Total
dividends
and
distributions | | | Net asset
value, end
of period | | | Total
return3 | | | Net assets,
end of period
(in millions) | | | Ratio of
expenses
to average
net assets | | | Ratio of
net income
to average
net assets2 | |
| Class 529-F-1: | | | | | | | | | | | | | | | | | | | | | | | | | | | | | | | | | | | | | | | | | | | | | | | | |
| Year ended 12/31/2013 | | $ | 40.71 | | | $ | .69 | | | $ | 12.12 | | | $ | 12.81 | | | $ | (.71 | ) | | $ | (.92 | ) | | $ | (1.63 | ) | | $ | 51.89 | | | | 31.70 | % | | $ | 67 | | | | .51 | % | | | 1.47 | % |
| Year ended 12/31/2012 | | | 35.33 | | | | .69 | | | | 5.39 | | | | 6.08 | | | | (.70 | ) | | | — | | | | (.70 | ) | | | 40.71 | | | | 17.25 | | | | 48 | | | | .52 | | | | 1.79 | |
| Year ended 12/31/2011 | | | 36.65 | | | | .65 | | | | (1.30 | ) | | | (.65 | ) | | | (.67 | ) | | | — | | | | (.67 | ) | | | 35.33 | | | | (1.75 | ) | | | 40 | | | | .50 | | | | 1.77 | |
| Year ended 12/31/2010 | | | 32.69 | | | | .65 | | | | 3.93 | | | | 4.58 | | | | (.62 | ) | | | — | | | | (.62 | ) | | | 36.65 | | | | 14.22 | | | | 37 | | | | .48 | | | | 1.95 | |
| Year ended 12/31/2009 | | | 24.95 | | | | .48 | | | | 7.78 | | | | 8.26 | | | | (.52 | ) | | | — | | | | (.52 | ) | | | 32.69 | | | | 33.56 | | | | 27 | | | | .54 | | | | 1.74 | |
| Class R-1: | | | | | | | | | | | | | | | | | | | | | | | | | | | | | | | | | | | | | | | | | | | | | | | | |
| Year ended 12/31/2013 | | | 40.62 | | | | .26 | | | | 12.09 | | | | 12.35 | | | | (.28 | ) | | | (.92 | ) | | | (1.20 | ) | | | 51.77 | | | | 30.50 | | | | 171 | | | | 1.41 | | | | .57 | |
| Year ended 12/31/2012 | | | 35.26 | | | | .34 | | | | 5.37 | | | | 5.71 | | | | (.35 | ) | | | — | | | | (.35 | ) | | | 40.62 | | | | 16.22 | | | | 146 | | | | 1.42 | | | | .88 | |
| Year ended 12/31/2011 | | | 36.56 | | | | .31 | | | | (1.28 | ) | | | (.97 | ) | | | (.33 | ) | | | — | | | | (.33 | ) | | | 35.26 | | | | (2.65 | ) | | | 142 | | | | 1.43 | | | | .84 | |
| Year ended 12/31/2010 | | | 32.62 | | | | .33 | | | | 3.93 | | | | 4.26 | | | | (.32 | ) | | | — | | | | (.32 | ) | | | 36.56 | | | | 13.13 | | | | 138 | | | | 1.43 | | | | 1.01 | |
| Year ended 12/31/2009 | | | 24.90 | | | | .22 | | | | 7.76 | | | | 7.98 | | | | (.26 | ) | | | — | | | | (.26 | ) | | | 32.62 | | | | 32.30 | | | | 98 | | | | 1.47 | | | | .80 | |
| Class R-2: | | | | | | | | | | | | | | | | | | | | | | | | | | | | | | | | | | | | | | | | | | | | | | | | |
| Year ended 12/31/2013 | | | 40.62 | | | | .29 | | | | 12.08 | | | | 12.37 | | | | (.31 | ) | | | (.92 | ) | | | (1.23 | ) | | | 51.76 | | | | 30.55 | | | | 777 | | | | 1.36 | | | | .62 | |
| Year ended 12/31/2012 | | | 35.26 | | | | .35 | | | | 5.37 | | | | 5.72 | | | | (.36 | ) | | | — | | | | (.36 | ) | | | 40.62 | | | | 16.24 | | | | 630 | | | | 1.40 | | | | .91 | |
| Year ended 12/31/2011 | | | 36.56 | | | | .31 | | | | (1.28 | ) | | | (.97 | ) | | | (.33 | ) | | | — | | | | (.33 | ) | | | 35.26 | | | | (2.64 | ) | | | 589 | | | | 1.41 | | | | .85 | |
| Year ended 12/31/2010 | | | 32.61 | | | | .33 | | | | 3.93 | | | | 4.26 | | | | (.31 | ) | | | — | | | | (.31 | ) | | | 36.56 | | | | 13.15 | | | | 631 | | | | 1.42 | | | | 1.00 | |
| Year ended 12/31/2009 | | | 24.89 | | | | .21 | | | | 7.76 | | | | 7.97 | | | | (.25 | ) | | | — | | | | (.25 | ) | | | 32.61 | | | | 32.22 | | | | 550 | | | | 1.52 | | | | .77 | |
| Class R-3: | | | | | | | | | | | | | | | | | | | | | | | | | | | | | | | | | | | | | | | | | | | | | | | | |
| Year ended 12/31/2013 | | | 40.70 | | | | .48 | | | | 12.11 | | | | 12.59 | | | | (.50 | ) | | | (.92 | ) | | | (1.42 | ) | | | 51.87 | | | | 31.09 | | | | 2,795 | | | | .96 | | | | 1.02 | |
| Year ended 12/31/2012 | | | 35.32 | | | | .52 | | | | 5.39 | | | | 5.91 | | | | (.53 | ) | | | — | | | | (.53 | ) | | | 40.70 | | | | 16.78 | | | | 2,367 | | | | .96 | | | | 1.35 | |
| Year ended 12/31/2011 | | | 36.63 | | | | .48 | | | | (1.29 | ) | | | (.81 | ) | | | (.50 | ) | | | — | | | | (.50 | ) | | | 35.32 | | | | (2.22 | ) | | | 2,146 | | | | .96 | | | | 1.30 | |
| Year ended 12/31/2010 | | | 32.67 | | | | .49 | | | | 3.94 | | | | 4.43 | | | | (.47 | ) | | | — | | | | (.47 | ) | | | 36.63 | | | | 13.69 | | | | 2,177 | | | | .96 | | | | 1.47 | |
| Year ended 12/31/2009 | | | 24.94 | | | | .36 | | | | 7.77 | | | | 8.13 | | | | (.40 | ) | | | — | | | | (.40 | ) | | | 32.67 | | | | 32.93 | | | | 1,707 | | | | .99 | | | | 1.29 | |
| Class R-4: | | | | | | | | | | | | | | | | | | | | | | | | | | | | | | | | | | | | | | | | | | | | | | | | |
| Year ended 12/31/2013 | | | 40.71 | | | | .61 | | | | 12.12 | | | | 12.73 | | | | (.64 | ) | | | (.92 | ) | | | (1.56 | ) | | | 51.88 | | | | 31.47 | | | | 2,842 | | | | .66 | | | | 1.32 | |
| Year ended 12/31/2012 | | | 35.33 | | | | .64 | | | | 5.39 | | | | 6.03 | | | | (.65 | ) | | | — | | | | (.65 | ) | | | 40.71 | | | | 17.13 | | | | 2,390 | | | | .66 | | | | 1.65 | |
| Year ended 12/31/2011 | | | 36.64 | | | | .59 | | | | (1.30 | ) | | | (.71 | ) | | | (.60 | ) | | | — | | | | (.60 | ) | | | 35.33 | | | | (1.92 | ) | | | 2,123 | | | | .66 | | | | 1.60 | |
| Year ended 12/31/2010 | | | 32.68 | | | | .59 | | | | 3.93 | | | | 4.52 | | | | (.56 | ) | | | — | | | | (.56 | ) | | | 36.64 | | | | 14.02 | | | | 2,050 | | | | .66 | | | | 1.77 | |
| Year ended 12/31/2009 | | | 24.95 | | | | .44 | | | | 7.77 | | | | 8.21 | | | | (.48 | ) | | | — | | | | (.48 | ) | | | 32.68 | | | | 33.31 | | | | 1,545 | | | | .69 | | | | 1.58 | |
| Class R-5: | | | | | | | | | | | | | | | | | | | | | | | | | | | | | | | | | | | | | | | | | | | | | | | | |
| Year ended 12/31/2013 | | | 40.79 | | | | .76 | | | | 12.14 | | | | 12.90 | | | | (.78 | ) | | | (.92 | ) | | | (1.70 | ) | | | 51.99 | | | | 31.87 | | | | 1,964 | | | | .36 | | | | 1.62 | |
| Year ended 12/31/2012 | | | 35.40 | | | | .75 | | | | 5.40 | | | | 6.15 | | | | (.76 | ) | | | — | | | | (.76 | ) | | | 40.79 | | | | 17.47 | | | | 1,516 | | | | .36 | | | | 1.95 | |
| Year ended 12/31/2011 | | | 36.71 | | | | .70 | | | | (1.30 | ) | | | (.60 | ) | | | (.71 | ) | | | — | | | | (.71 | ) | | | 35.40 | | | | (1.62 | ) | | | 1,394 | | | | .36 | | | | 1.89 | |
| Year ended 12/31/2010 | | | 32.74 | | | | .69 | | | | 3.94 | | | | 4.63 | | | | (.66 | ) | | | — | | | | (.66 | ) | | | 36.71 | | | | 14.37 | | | | 1,419 | | | | .36 | | | | 2.06 | |
| Year ended 12/31/2009 | | | 24.99 | | | | .52 | | | | 7.79 | | | | 8.31 | | | | (.56 | ) | | | — | | | | (.56 | ) | | | 32.74 | | | | 33.75 | | | | 1,269 | | | | .39 | | | | 1.92 | |
| Class R-6: | | | | | | | | | | | | | | | | | | | | | | | | | | | | | | | | | | | | | | | | | | | | | | | | |
| Year ended 12/31/2013 | | | 40.78 | | | | .79 | | | | 12.13 | | | | 12.92 | | | | (.80 | ) | | | (.92 | ) | | | (1.72 | ) | | | 51.98 | | | | 31.95 | | | | 4,516 | | | | .31 | | | | 1.68 | |
| Year ended 12/31/2012 | | | 35.39 | | | | .79 | | | | 5.38 | | | | 6.17 | | | | (.78 | ) | | | — | | | | (.78 | ) | | | 40.78 | | | | 17.53 | | | | 2,409 | | | | .31 | | | | 2.03 | |
| Year ended 12/31/2011 | | | 36.70 | | | | .72 | | | | (1.30 | ) | | | (.58 | ) | | | (.73 | ) | | | — | | | | (.73 | ) | | | 35.39 | | | | (1.57 | ) | | | 1,421 | | | | .31 | | | | 1.97 | |
| Year ended 12/31/2010 | | | 32.74 | | | | .71 | | | | 3.93 | | | | 4.64 | | | | (.68 | ) | | | — | | | | (.68 | ) | | | 36.70 | | | | 14.39 | | | | 950 | | | | .32 | | | | 2.13 | |
| Period from 5/1/2009 to 12/31/20094,5 | | | 25.63 | | | | .37 | | | | 7.17 | | | | 7.54 | | | | (.43 | ) | | | — | | | | (.43 | ) | | | 32.74 | | | | 29.60 | | | | 596 | | | | .35 | 6 | | | 1.87 | 6 |
| | | Year ended December 31 |
| | | 2013 | | 2012 | | 2011 | | 2010 | | 2009 |
| Portfolio turnover rate for all share classes | | | 34 | % | | | 28 | % | | | 28 | % | | | 32 | % | | | 30 | % |
| 1 | Based on average shares outstanding. |
| 2 | For the year ended December 31, 2010, this column reflects the impact of a corporate action event that resulted in a one-time increase to net investment income. If the corporate action event had not occurred, the Class A net investment income per share and ratio of net income to average net assets would have been lower by $.07 and .21 percentage points, respectively. The impact to the other share classes would have been similar. |
| 3 | Total returns exclude any applicable sales charges, including contingent deferred sales charges. |
| 4 | Based on operations for the period shown and, accordingly, is not representative of a full year. |
| 5 | Class R-6 shares were offered beginning May 1, 2009. |
| 6 | Annualized. |
See Notes to Financial Statements
Report of Independent Registered Public Accounting Firm
To the Shareholders and Board of Trustees of American Funds Fundamental Investors — Fundamental Investors:
We have audited the accompanying statement of assets and liabilities of American Funds Fundamental Investors – Fundamental Investors (the “Fund”), including the summary investment portfolio, as of December 31, 2013, and the related statement of operations for the year then ended, the statements of changes in net assets for each of the two years in the period then ended, and the financial highlights for each of the periods presented. These financial statements and financial highlights are the responsibility of the Fund’s management. Our responsibility is to express an opinion on these financial statements and financial highlights based on our audits.
We conducted our audits in accordance with the standards of the Public Company Accounting Oversight Board (United States). Those standards require that we plan and perform the audit to obtain reasonable assurance about whether the financial statements and financial highlights are free of material misstatement. The Fund is not required to have, nor were we engaged to perform, an audit of its internal control over financial reporting. Our audits included consideration of internal control over financial reporting as a basis for designing audit procedures that are appropriate in the circumstances, but not for the purpose of expressing an opinion on the effectiveness of the Fund’s internal control over financial reporting. Accordingly, we express no such opinion. An audit also includes examining, on a test basis, evidence supporting the amounts and disclosures in the financial statements, assessing the accounting principles used and significant estimates made by management, as well as evaluating the overall financial statement presentation. Our procedures included confirmation of securities owned as of December 31, 2013, by correspondence with the custodian and brokers; where replies were not received from brokers, we performed other auditing procedures. We believe that our audits provide a reasonable basis for our opinion.
In our opinion, such financial statements and financial highlights referred to above present fairly, in all material respects, the financial position of American Funds Fundamental Investors — Fundamental Investors as of December 31, 2013, the results of its operations for the year then ended, the changes in its net assets for each of the two years in the period then ended, and the financial highlights for each of the periods presented, in conformity with accounting principles generally accepted in the United States of America.
Deloitte & Touche LLP
Costa Mesa, California
February 10, 2014
As a fund shareholder, you incur two types of costs: (1) transaction costs, such as initial sales charges on purchase payments and contingent deferred sales charges on redemptions (loads), and (2) ongoing costs, including management fees, distribution and service (12b-1) fees, and other expenses. This example is intended to help you understand your ongoing costs (in dollars) of investing in the fund so you can compare these costs with the ongoing costs of investing in other mutual funds. The example is based on an investment of $1,000 invested at the beginning of the period and held for the entire six-month period (July 1, 2013, through December 31, 2013).
Actual expenses:
The first line of each share class in the table on the following page provides information about actual account values and actual expenses. You may use the information in this line, together with the amount you invested, to estimate the expenses that you paid over the period. Simply divide your account value by $1,000 (for example, an $8,600 account value divided by $1,000 = 8.6), then multiply the result by the number in the first line under the heading entitled “Expenses paid during period” to estimate the expenses you paid on your account during this period.
Hypothetical example for comparison purposes:
The second line of each share class in the table on the following page provides information about hypothetical account values and hypothetical expenses based on the actual expense ratio for the share class and an assumed rate of return of 5.00% per year before expenses, which is not the actual return of the share class. The hypothetical account values and expenses may not be used to estimate the actual ending account balance or expenses you paid for the period. You may use this information to compare the ongoing costs of investing in the fund and other funds. To do so, compare this 5.00% hypothetical example with the 5.00% hypothetical examples that appear in the shareholder reports of the other funds.
Notes:
There are some account fees that are charged to certain types of accounts, such as individual retirement accounts and 529 college savings plan accounts (generally, a $10 fee is charged to set up the account and an additional $10 fee is charged to the account annually), that would increase the amount of expenses paid on your account. In addition, retirement plan participants may be subject to certain fees charged by the plan sponsor, and Class F-1, F-2 and 529-F-1 shareholders may be subject to fees charged by financial intermediaries, typically ranging from 0.75% to 1.50% of assets annually depending on services offered. You can estimate the impact of these fees by adding the amount of the fees to the total estimated expenses you paid on your account during the period as calculated above. In addition, your ending account value would be lower by the amount of these fees.
Note that the expenses shown in the table on the following page are meant to highlight your ongoing costs only and do not reflect any transactional costs, such as sales charges (loads). Therefore, the second line of each share class in the table is useful in comparing ongoing costs only and will not help you determine the relative total costs of owning different funds. In addition, if these transactional costs were included, your costs would have been higher.
| | | Beginning
account value
7/1/2013 | | Ending
account value
12/31/2013 | | Expenses paid
during period* | | Annualized
expense ratio | |
| Class A — actual return | | $ | 1,000.00 | | $ | 1,168.44 | | $ | 3.39 | | | .62 | % |
| Class A — assumed 5% return | | | 1,000.00 | | | 1,022.08 | | | 3.16 | | | .62 | |
| Class B — actual return | | | 1,000.00 | | | 1,164.36 | | | 7.53 | | | 1.38 | |
| Class B — assumed 5% return | | | 1,000.00 | | | 1,018.25 | | | 7.02 | | | 1.38 | |
| Class C — actual return | | | 1,000.00 | | | 1,164.00 | | | 7.80 | | | 1.43 | |
| Class C — assumed 5% return | | | 1,000.00 | | | 1,018.00 | | | 7.27 | | | 1.43 | |
| Class F-1 — actual return | | | 1,000.00 | | | 1,168.20 | | | 3.93 | | | .72 | |
| Class F-1 — assumed 5% return | | | 1,000.00 | | | 1,021.58 | | | 3.67 | | | .72 | |
| Class F-2 — actual return | | | 1,000.00 | | | 1,169.78 | | | 2.24 | | | .41 | |
| Class F-2 — assumed 5% return | | | 1,000.00 | | | 1,023.14 | | | 2.09 | | | .41 | |
| Class 529-A — actual return | | | 1,000.00 | | | 1,168.15 | | | 3.88 | | | .71 | |
| Class 529-A — assumed 5% return | | | 1,000.00 | | | 1,021.63 | | | 3.62 | | | .71 | |
| Class 529-B — actual return | | | 1,000.00 | | | 1,163.52 | | | 8.23 | | | 1.51 | |
| Class 529-B — assumed 5% return | | | 1,000.00 | | | 1,017.59 | | | 7.68 | | | 1.51 | |
| Class 529-C — actual return | | | 1,000.00 | | | 1,163.51 | | | 8.18 | | | 1.50 | |
| Class 529-C — assumed 5% return | | | 1,000.00 | | | 1,017.64 | | | 7.63 | | | 1.50 | |
| Class 529-E — actual return | | | 1,000.00 | | | 1,166.85 | | | 5.24 | | | .96 | |
| Class 529-E — assumed 5% return | | | 1,000.00 | | | 1,020.37 | | | 4.89 | | | .96 | |
| Class 529-F-1 — actual return | | | 1,000.00 | | | 1,169.24 | | | 2.73 | | | .50 | |
| Class 529-F-1 — assumed 5% return | | | 1,000.00 | | | 1,022.68 | | | 2.55 | | | .50 | |
| Class R-1 — actual return | | | 1,000.00 | | | 1,164.10 | | | 7.69 | | | 1.41 | |
| Class R-1 — assumed 5% return | | | 1,000.00 | | | 1,018.10 | | | 7.17 | | | 1.41 | |
| Class R-2 — actual return | | | 1,000.00 | | | 1,164.50 | | | 7.37 | | | 1.35 | |
| Class R-2 — assumed 5% return | | | 1,000.00 | | | 1,018.40 | | | 6.87 | | | 1.35 | |
| Class R-3 — actual return | | | 1,000.00 | | | 1,166.87 | | | 5.19 | | | .95 | |
| Class R-3 — assumed 5% return | | | 1,000.00 | | | 1,020.42 | | | 4.84 | | | .95 | |
| Class R-4 — actual return | | | 1,000.00 | | | 1,168.29 | | | 3.61 | | | .66 | |
| Class R-4 — assumed 5% return | | | 1,000.00 | | | 1,021.88 | | | 3.36 | | | .66 | |
| Class R-5 — actual return | | | 1,000.00 | | | 1,170.14 | | | 1.97 | | | .36 | |
| Class R-5 — assumed 5% return | | | 1,000.00 | | | 1,023.39 | | | 1.84 | | | .36 | |
| Class R-6 — actual return | | | 1,000.00 | | | 1,170.49 | | | 1.70 | | | .31 | |
| Class R-6 — assumed 5% return | | | 1,000.00 | | | 1,023.64 | | | 1.58 | | | .31 | |
| * | The “expenses paid during period” are equal to the “annualized expense ratio,” multiplied by the average account value over the period, multiplied by the number of days in the period, and divided by 365 (to reflect the one-half year period). |
We are required to advise you of the federal tax status of certain distributions received by shareholders during the fiscal year. The fund hereby designates the following amounts for the fund’s fiscal year ended December 31, 2013:
| Long-term capital gains | | | $1,255,841,000 |
| Qualified dividend income | | | 100% |
| Corporate dividends received deduction | | | 100% |
| U.S. government income that may be exempt from state taxation | | | $808,000 |
Individual shareholders should refer to their Form 1099 or other tax information, which was mailed in January 2014, to determine the calendar year amounts to be included on their 2013 tax returns. Shareholders should consult their tax advisors.
Approval of Investment Advisory and Service Agreement
The fund’s board has approved the fund’s Investment Advisory and Service Agreement (the “agreement”) with Capital Research and Management Company (“CRMC”) for an additional one-year term through November 30, 2014. The board approved the agreement following the recommendation of the fund’s Contracts Committee (the “committee”), which is composed of all of the fund’s independent board members. The board and the committee determined that the fund’s advisory fee structure was fair and reasonable in relation to the services provided and that approving the agreement was in the best interests of the fund and its shareholders.
In reaching this decision, the board and the committee took into account information furnished to them throughout the year and otherwise provided to them, as well as information prepared specifically in connection with their review of the agreement, and were advised by their independent counsel. They considered the following factors, among others, but did not identify any single issue or particular piece of information that, in isolation, was the controlling factor, and each board and committee member did not necessarily attribute the same weight to each factor.
1. Nature, extent and quality of services
The board and the committee considered the depth and quality of CRMC’s investment management process, including its global research capabilities; the experience, capability and integrity of its senior management and other personnel; the low turnover rates of its key personnel; the overall financial strength and stability of its organization; and the ongoing evolution of CRMC’s organizational structure designed to maintain and strengthen these qualities. The board and the committee also considered the nature, extent and quality of administrative, compliance and shareholder services provided by CRMC to the fund under the agreement and other agreements, as well as the benefits to fund shareholders from investing in a fund that is part of a large family of funds. The board and the committee concluded that the nature, extent and quality of the services provided by CRMC have benefited and should continue to benefit the fund and its shareholders.
2. Investment results
The board and the committee considered the investment results of the fund in light of its objective of pursuing long-term growth of capital and income. They compared the fund’s investment results with those of other relevant funds (including funds that form the basis of the Lipper index for the category in which the fund is included) and data such as relevant market and fund indexes, over various periods through March 31, 2013. This report, including the letter to shareholders and related disclosures, contains certain information about the fund’s investment results. The board and the committee reviewed the fund’s investment results measured against various indexes, including the Lipper Growth and Income Funds Index and the S&P 500 Index. They noted that the investment results of the fund generally compared favorably to these two indexes for the lifetime period, the 20-year period, and the 10-year period and were mixed for shorter periods. The board and the committee concluded that the fund’s investment results have been satisfactory and that CRMC’s record in managing the fund indicated that its continued management should benefit the fund and its shareholders.
3. Advisory fees and total expenses
The board and the committee compared the advisory fees and total expense levels of the fund to those of other relevant funds. They observed that the fund’s advisory fees and expenses were lower than most other similar funds included in the Lipper Growth and Income Funds category. The board and the committee also considered the breakpoint discounts in the fund’s advisory fee structure that reduce the level of fees charged by CRMC to the fund as fund assets increase. In addition, they reviewed information regarding the effective advisory fees charged to non-mutual fund clients by CRMC and its affiliates. They noted that, to the extent there were differences between the advisory fees paid by the fund and the advisory fees paid by those clients, the differences appropriately reflected the investment, operational and regulatory differences between advising the fund and the other clients. The board and the committee concluded that the fund’s cost structure was fair and reasonable in relation to the services provided, and that the fund’s shareholders receive reasonable value in return for the advisory fees and other amounts paid to CRMC by the fund.
4. Ancillary benefits
The board and the committee considered a variety of other benefits that CRMC and its affiliates receive as a result of CRMC’s relationship with the fund and the other American Funds, including fees for administrative services provided to certain share classes; fees paid to CRMC’s affiliated transfer agent; sales charges and distribution fees received and retained by the fund’s principal underwriter, an affiliate of CRMC; and possible ancillary benefits to CRMC and its institutional management affiliates in managing other investment vehicles. The board and the committee reviewed CRMC’s portfolio trading practices, noting that while CRMC receives the benefit of research provided by broker-dealers executing portfolio transactions on behalf of the fund, it does not obtain third-party research or other services in return for allocating brokerage to such broker-dealers. The board and the committee took these ancillary benefits into account in evaluating the reasonableness of the advisory fees and other amounts paid to CRMC by the fund.
5. Adviser financial information
The board and the committee reviewed information regarding CRMC’s costs of providing services to the American Funds, including personnel, systems and resources of investment, compliance, trading, accounting and other administrative operations. They considered CRMC’s costs and willingness to invest in technology, infrastructure and staff to maintain and expand services and capabilities, respond to industry and regulatory developments, and attract and retain qualified personnel. They noted information regarding the compensation structure for CRMC’s investment professionals. The board and the committee also compared CRMC’s profitability and compensation data to the reported results and data of several large, publicly held investment management companies. The board and the committee noted the competitiveness and cyclicality of both the mutual fund industry and the capital markets, and the importance in that environment of CRMC’s long-term profitability for maintaining its independence, company culture and management continuity. They further considered the breakpoint discounts in the fund’s advisory fee structure. The board and the committee concluded that the fund’s advisory fee structure reflected a reasonable sharing of benefits between CRMC and the fund’s shareholders.
Board of trustees and other officers
“Independent” trustees1
| Name and age | | Year first
elected
a trustee
of the fund2 | | Principal occupation(s) during past five years | | Number of
portfolios in fund
complex overseen
by trustee | | Other directorships3
held by trustee |
| Ronald P. Badie, 71 | | 2008 | | Retired; former Vice Chairman, Deutsche Bank Alex. Brown (retired 2002) | | 3 | | Amphenol Corporation; Nautilus, Inc. |
Joseph C. Berenato, 67
Chairman of the Board
(Independent and
Non-Executive) | | 2003 | | Former Chairman and CEO, Ducommun Incorporated (aerospace components manufacturer) | | 6 | | Ducommun Incorporated |
| Louise H. Bryson, 69 | | 2008 | | Chair Emerita of the Board of Trustees, J. Paul Getty Trust; former President, Distribution, Lifetime Entertainment Network (retired 2008); former Executive Vice President and General Manager, Lifetime Movie Network (retired 2008) | | 7 | | None |
| Robert J. Denison, 72 | | 2005 | | Chair, First Security Management (private investment) | | 6 | | None |
| Mary Anne Dolan, 66 | | 2010 | | Founder and President, MAD Ink (communications company) | | 10 | | None |
| John G. Freund, 60 | | 2010 | | Founder and Managing Director, Skyline Ventures (venture capital investor in health care companies) | | 3 | | Tetraphase
Pharmaceuticals, Inc.;
XenoPort, Inc. |
| Leonade D. Jones, 66 | | 1998 | | Retired; former Treasurer, The Washington Post Company (retired 1996) | | 10 | | None |
| William H. Kling, 71 | | 2010 | | President Emeritus and former CEO, American Public Media | | 10 | | None |
| Christopher E. Stone, 57 | | 2010 | | President, Open Society Foundations; former Professor of the Practice of Criminal Justice, John F. Kennedy School of Government, Harvard University | | 6 | | None |
“Interested” trustees4,5
Name, age and
position with fund | | Year first
elected
a trustee
or officer
of the fund2 | | Principal occupation(s) during past five years
and positions held with affiliated entities or
the principal underwriter of the fund | | Number of
portfolios in fund
complex overseen
by trustee | | Other directorships3
held by trustee |
James F. Rothenberg, 67
Vice Chairman of the Board | | 1998 | | Director, Capital Research and Management Company; Director, American Funds Distributors, Inc.;6 Director and Chair, The Capital Group Companies, Inc.6 | | 2 | | None |
Dina N. Perry, 68
President | | 1994 | | Senior Vice President — Capital World Investors, Capital Research and Management Company; Director, The Capital Group Companies, Inc.6 | | 1 | | None |
The fund’s statement of additional information includes further details about fund trustees and is available without charge upon request by calling American Funds Service Company at (800) 421-4225 or by visiting the American Funds website at americanfunds.com. The address for all trustees and officers of the fund is 333 South Hope Street, Los Angeles, CA 90071, Attention: Secretary.
Other officers5
Name, age and
position with fund | | Year first
elected
an officer
of the fund2 | | Principal occupation(s) during past five years and positions held with affiliated entities
or the principal underwriter of the fund |
Paul F. Roye, 60
Executive Vice President | | 2012 | | Senior Vice President — Fund Business Management Group, Capital Research and Management Company; Chief Legal Officer, Capital Research and Management Company; Director, American Funds Service Company6 |
Michael T. Kerr, 54
Senior Vice President | | 1995 | | Senior Vice President — Capital World Investors, Capital Research and Management Company; Director, The Capital Group Companies, Inc.6 |
Martin Romo, 46
Senior Vice President | | 1999 | | Director, Capital Research and Management Company; Senior Vice President — Capital World Investors, Capital Research and Management Company; President and Director, Capital Research Company6 |
Walter R. Burkley, 47
Vice President | | 2010 | | Senior Vice President and Senior Counsel — Fund Business Management Group, Capital Research and Management Company; Director, Capital Research Company6 |
Mark L. Casey, 43
Vice President | | 2008 | | Senior Vice President — Capital World Investors, Capital Research Company6 |
Ronald B. Morrow, 68 Vice President | | 2004 | | Senior Vice President — Capital World Investors, Capital Research and Management Company |
Patrick F. Quan, 55
Secretary | | 1989–1998
2000 | | Vice President — Fund Business Management Group, Capital Research and Management Company |
Jeffrey P. Regal, 42
Treasurer | | 2006 | | Vice President — Fund Business Management Group, Capital Research and Management Company |
Julie E. Lawton, 40
Assistant Secretary | | 2010 | | Assistant Vice President — Fund Business Management Group, Capital Research and Management Company |
Dori Laskin, 62 Assistant Treasurer | | 2011 | | Vice President — Fund Business Management Group, Capital Research and Management Company |
Neal F. Wellons, 42
Assistant Treasurer | | 2010 | | Vice President — Fund Business Management Group, Capital Research and Management Company |
| 1 | The term “independent” trustee refers to a trustee who is not an “interested person” of the fund within the meaning of the Investment Company Act of 1940. |
| 2 | Trustees and officers of the fund serve until their resignation, removal or retirement. |
| 3 | This includes all directorships (other than those in the American Funds or other funds managed by Capital Research and Management Company or its affiliates) that are held by each trustee as a trustee or director of a public company or a registered investment company. |
| 4 | “Interested persons” within the meaning of the Investment Company Act of 1940, on the basis of their affiliation with the fund’s investment adviser, Capital Research and Management Company, or affiliated entities (including the fund’s principal underwriter). |
| 5 | All of the officers listed, except Mark L. Casey, are officers and/or directors/trustees of one or more of the other funds for which Capital Research and Management Company serves as investment adviser. |
| 6 | Company affiliated with Capital Research and Management Company. |
Offices
Office of the fund
One Market
Steuart Tower, Suite 2000
San Francisco, CA 94105-1409
Investment adviser
Capital Research and Management Company
333 South Hope Street
Los Angeles, CA 90071-1406
6455 Irvine Center Drive
Irvine, CA 92618-4518
Transfer agent for shareholder accounts
American Funds Service Company
(Write to the address near you.)
P.O. Box 6007
Indianapolis, IN 46206-6007
P.O. Box 2280
Norfolk, VA 23501-2280
Custodian of assets
State Street Bank and Trust Company
One Lincoln Street
Boston, MA 02111
Counsel
K&L Gates LLP
Four Embarcadero Center, Suite 1200
San Francisco, CA 94111-5994
Independent registered public accounting firm
Deloitte & Touche LLP
695 Town Center Drive
Suite 1200
Costa Mesa, CA 92626-7188
Principal underwriter
American Funds Distributors, Inc.
333 South Hope Street
Los Angeles, CA 90071-1406
Investors should carefully consider investment objectives, risks, charges and expenses. This and other important information is contained in the fund prospectus and summary prospectus, which can be obtained from your financial professional and should be read carefully before investing. You may also call American Funds Service Company (AFS) at (800) 421-4225 or visit the American Funds website at americanfunds.com.
“American Funds Proxy Voting Procedures and Principles” — which describes how we vote proxies relating to portfolio securities — is available on the American Funds website or upon request by calling AFS. The fund files its proxy voting record with the U.S. Securities and Exchange Commission (SEC) for the 12 months ended June 30 by August 31. The proxy voting record is available free of charge on the SEC website at sec.gov and on the American Funds website.
A complete December 31, 2013, portfolio of Fundamental Investors’ investments is available free of charge by calling AFS or visiting the SEC website (where it is part of Form N-CSR).
Fundamental Investors files a complete list of its portfolio holdings with the SEC for the first and third quarters of each fiscal year on Form N-Q. This filing is available free of charge on the SEC website. You may also review or, for a fee, copy this filing at the SEC’s Public Reference Room in Washington, D.C. Additional information regarding the operation of the Public Reference Room may be obtained by calling the SEC’s Office of Investor Education and Advocacy at (800) SEC-0330. Additionally, the list of portfolio holdings is available by calling AFS.
This report is for the information of shareholders of Fundamental Investors, but it also may be used as sales literature when preceded or accompanied by the current prospectus or summary prospectus, which gives details about charges, expenses, investment objectives and operating policies of the fund. If used as sales material after March 31, 2014, this report must be accompanied by an American Funds statistical update for the most recently completed calendar quarter.
The American Funds Advantage
Since 1931, American Funds, part of Capital Group, has helped investors pursue long-term investment success. Our consistent approach — in combination with The Capital SystemSM — has resulted in a superior long-term track record.
Aligned with investor success
We base our decisions on a long-term perspective, which we believe aligns our goals with the interests of our clients. Our portfolio managers average 25 years of investment experience, including 20 years at our company, reflecting a career commitment to our long-term approach.1
The Capital SystemSM
Our investment process, The Capital System, combines individual accountability with teamwork. Each fund is divided into portions that are managed independently by investment professionals with diverse backgrounds, ages and investment approaches. An extensive global research effort is the backbone of our system.
Superior long-term track record
Our equity funds have beaten their Lipper peer indexes in 90% of 10-year periods and 96% of 20-year periods. Our fixed-income funds have beaten their Lipper indexes in 58% of 10-year periods and 63% of 20-year periods.2 Our fund management fees have been among the lowest in the industry.3
| | 1 | Portfolio manager experience as of December 31, 2012. |
| | 2 | Based on Class A share results for rolling periods through December 31, 2012. Periods covered are the shorter of the fund’s lifetime or since the comparable Lipper index inception date. |
| | 3 | Based on management fees for the 20-year period ended December 31, 2012, versus comparable Lipper categories, excluding funds of funds. |

ITEM 2 – Code of Ethics
The Registrant has adopted a Code of Ethics that applies to its Principal Executive Officer and Principal Financial Officer. The Registrant undertakes to provide to any person without charge, upon request, a copy of the Code of Ethics. Such request can be made to American Funds Service Company at 800/421-9225 or to the Secretary of the Registrant, One Market, Steuart Tower, Suite 2000, San Francisco, California 94105.
ITEM 3 – Audit Committee Financial Expert
The Registrant’s board has determined that Christopher E. Stone, a member of the Registrant’s audit committee, is an “audit committee financial expert” and "independent," as such terms are defined in this Item. This designation will not increase the designee’s duties, obligations or liability as compared to his or her duties, obligations and liability as a member of the audit committee and of the board, nor will it reduce the responsibility of the other audit committee members. There may be other individuals who, through education or experience, would qualify as "audit committee financial experts" if the board had designated them as such. Most importantly, the board believes each member of the audit committee contributes significantly to the effective oversight of the Registrant’s financial statements and condition.
ITEM 4 – Principal Accountant Fees and Services
| | Registrant: |
| | | a) Audit Fees: |
| | | | 2012 | $83,000 |
| | | | 2013 | $87,000 |
| | | | |
| | | b) Audit-Related Fees: |
| | | | 2012 | $16,000 |
| | | | 2013 | $24,000 |
| | | | The audit-related fees consist of assurance and related services relating to the examination of the Registrant’s investment adviser conducted in accordance with Statement on Standards for Attestation Engagements Number 16 issued by the American Institute of Certified Public Accountants. |
| | | | |
| | | c) Tax Fees: |
| | | | 2012 | $5,000 |
| | | | 2013 | $4,000 |
| | | | The tax fees consist of professional services relating to the preparation of the Registrant’s tax returns including returns relating to the Registrant’s investments in non-U.S. jurisdictions. |
| | | | |
| | | d) All Other Fees: |
| | | | 2012 | None |
| | | | 2013 | None |
| | | | |
| | Adviser and affiliates (includes only fees for non-audit services billed to the adviser and affiliates for engagements that relate directly to the operations and financial reporting of the Registrant and were subject to the pre-approval policies described below): |
| | | a) Audit Fees: |
| | | | Not Applicable |
| | | | |
| | | b) Audit-Related Fees: |
| | | | 2012 | $1,055,000 |
| | | | 2013 | $1,020,000 |
| | | | The audit-related fees consist of assurance and related services relating to the examination of the Registrant’s transfer agent, principal underwriter and investment adviser conducted in accordance with Statement on Standards for Attestation Engagements Number 16 issued by the American Institute of Certified Public Accountants. |
| | | | |
| | | c) Tax Fees: |
| | | | 2012 | $34,000 |
| | | | 2013 | $10,000 |
| | | | The tax fees consist of consulting services relating to the Registrant’s investments. |
| | | | |
| | | d) All Other Fees: |
| | | | 2012 | $2,000 |
| | | | 2013 | $3,000 |
| | | | The other fees consist of subscription services related to an accounting research tool. |
All audit and permissible non-audit services that the Registrant’s audit committee considers compatible with maintaining the independent registered public accounting firm’s independence are required to be pre-approved by the committee. The pre-approval requirement will extend to all non-audit services provided to the Registrant, the investment adviser, and any entity controlling, controlled by, or under common control with the investment adviser that provides ongoing services to the Registrant, if the engagement relates directly to the operations and financial reporting of the Registrant. The committee will not delegate its responsibility to pre-approve these services to the investment adviser. The committee may delegate to one or more committee members the authority to review and pre-approve audit and permissible non-audit services. Actions taken under any such delegation will be reported to the full committee at its next meeting. The pre-approval requirement is waived with respect to non-audit services if certain conditions are met. The pre-approval requirement was not waived for any of the non-audit services listed above provided to the Registrant, adviser and affiliates.
Aggregate non-audit fees paid to the Registrant’s auditors, including fees for all services billed to the Registrant, adviser and affiliates that provide ongoing services to the Registrant, were $1,583,000 for fiscal year 2012 and $1,474,000 for fiscal year 2013. The non-audit services represented by these amounts were brought to the attention of the committee and considered to be compatible with maintaining the auditors’ independence.
ITEM 5 – Audit Committee of Listed Registrants
Not applicable to this Registrant, insofar as the Registrant is not a listed issuer as defined in Rule 10A-3 under the Securities Exchange Act of 1934.
ITEM 6 – Schedule of Investments
 | Fundamental Investors® Investment portfolio December 31, 2013 |
| Common stocks 96.21% | | |
| | | Value |
| Consumer discretionary 17.45% | Shares | (000) |
| | | |
| Amazon.com, Inc.1 | 5,973,800 | $ 2,382,292 |
| Home Depot, Inc. | 18,689,500 | 1,538,893 |
| Comcast Corp., Class A | 24,651,800 | 1,281,031 |
| Time Warner Inc. | 16,267,000 | 1,134,135 |
| Walt Disney Co. | 11,340,000 | 866,376 |
| Twenty-First Century Fox, Inc., Class A | 18,000,000 | 633,240 |
| Starbucks Corp. | 5,900,000 | 462,501 |
| Expedia, Inc. | 5,291,000 | 368,571 |
| NIKE, Inc., Class B | 3,400,000 | 267,376 |
| Liberty Global PLC, Class A1 | 1,702,829 | 151,535 |
| Liberty Global PLC, Class C1 | 1,371,516 | 115,646 |
| Macy’s, Inc. | 5,000,000 | 267,000 |
| CBS Corp., Class B | 4,125,000 | 262,928 |
| Marriott International, Inc., Class A | 4,693,545 | 231,673 |
| Johnson Controls, Inc. | 4,500,000 | 230,850 |
| Time Warner Cable Inc. | 1,638,000 | 221,949 |
| Viacom Inc., Class B | 2,500,000 | 218,350 |
| General Motors Co.1 | 5,000,000 | 204,350 |
| Naspers Ltd., Class N | 1,700,000 | 177,618 |
| Lowe’s Companies, Inc. | 3,430,000 | 169,957 |
| Las Vegas Sands Corp. | 1,958,240 | 154,446 |
| Ctrip.com International, Ltd. (ADR)1 | 2,500,000 | 124,050 |
| VF Corp. | 1,400,000 | 87,276 |
| Wynn Resorts, Ltd. | 400,000 | 77,684 |
| Ralph Lauren Corp., Class A | 408,541 | 72,136 |
| Toyota Motor Corp. | 930,000 | 56,696 |
| Murphy USA Inc.1 | 685,000 | 28,469 |
| Industria de Diseño Textil, SA | 140,000 | 23,073 |
| | | 11,810,101 |
| | | |
| Financials 15.59% | | |
| | | |
| Wells Fargo & Co. | 20,150,916 | 914,852 |
| American Express Co. | 9,770,000 | 886,432 |
| JPMorgan Chase & Co. | 14,785,000 | 864,627 |
| Citigroup Inc. | 14,685,000 | 765,235 |
| CME Group Inc., Class A | 8,007,600 | 628,276 |
| BlackRock, Inc. | 1,850,000 | 585,470 |
| Capital One Financial Corp. | 7,500,000 | 574,575 |
| ACE Ltd. | 4,900,000 | 507,297 |
| Weyerhaeuser Co.1 | 14,726,107 | 464,903 |
| Legal & General Group PLC | 119,784,921 | 441,743 |
| Charles Schwab Corp. | 16,465,000 | 428,090 |
| Moody’s Corp. | 5,420,000 | 425,307 |
| Goldman Sachs Group, Inc. | 2,120,000 | 375,791 |
| Common stocks | | |
| | | Value |
| Financials (continued) | Shares | (000) |
| | | |
| McGraw Hill Financial, Inc. | 4,405,000 | $ 344,471 |
| Berkshire Hathaway Inc., Class A1 | 1,555 | 276,635 |
| SunTrust Banks, Inc. | 7,000,000 | 257,670 |
| Aon PLC, Class A | 2,860,000 | 239,925 |
| American International Group, Inc. | 4,666,700 | 238,235 |
| CNO Financial Group, Inc.2 | 11,900,000 | 210,511 |
| XL Group PLC | 6,000,000 | 191,040 |
| American Tower Corp. | 2,000,000 | 159,640 |
| Svenska Handelsbanken AB, Class A | 2,790,000 | 137,074 |
| Leucadia National Corp. | 4,589,846 | 130,076 |
| KeyCorp | 9,625,000 | 129,168 |
| U.S. Bancorp | 2,672,000 | 107,949 |
| Hospitality Properties Trust | 3,693,018 | 99,822 |
| Digital Realty Trust, Inc. | 1,578,400 | 77,531 |
| Deutsche Bank AG | 1,010,000 | 48,180 |
| AXA SA | 800,000 | 22,242 |
| Industrial and Commercial Bank of China Ltd., Class H | 21,986,000 | 14,857 |
| | | 10,547,624 |
| | | |
| Industrials 14.37% | | |
| | | |
| Boeing Co. | 12,340,000 | 1,684,287 |
| General Electric Co. | 38,000,000 | 1,065,140 |
| Parker-Hannifin Corp. | 7,350,000 | 945,504 |
| Union Pacific Corp. | 5,185,000 | 871,080 |
| Lockheed Martin Corp. | 5,323,200 | 791,347 |
| European Aeronautic Defence and Space Co. EADS NV | 7,515,000 | 576,985 |
| Caterpillar Inc. | 6,025,000 | 547,130 |
| Rockwell Automation | 3,500,000 | 413,560 |
| Deere & Co. | 3,500,000 | 319,655 |
| Siemens AG | 2,000,000 | 273,187 |
| Honeywell International Inc. | 2,800,000 | 255,836 |
| Schneider Electric SA | 2,807,000 | 244,825 |
| United Technologies Corp. | 1,900,000 | 216,220 |
| Cummins Inc. | 1,410,000 | 198,768 |
| Iron Mountain Inc. | 6,319,011 | 191,782 |
| MTU Aero Engines AG | 1,835,346 | 180,252 |
| Masco Corp. | 7,750,000 | 176,468 |
| Grafton Group PLC, units2 | 15,037,000 | 161,106 |
| Waste Management, Inc. | 3,400,000 | 152,558 |
| Fastenal Co. | 3,100,000 | 147,281 |
| Meggitt PLC | 13,897,937 | 121,400 |
| Ryanair Holdings PLC (ADR)1 | 1,850,000 | 86,820 |
| Northrop Grumman Corp. | 740,000 | 84,811 |
| Experian PLC | 870,000 | 16,049 |
| | | 9,722,051 |
| | | |
| Information technology 13.84% | | |
| | | |
| Google Inc., Class A1 | 1,502,800 | 1,684,203 |
| Microsoft Corp. | 42,750,000 | 1,600,133 |
| Texas Instruments Inc. | 20,780,300 | 912,463 |
| ASML Holding NV | 4,173,032 | 390,607 |
| ASML Holding NV (New York registered) | 2,396,000 | 224,505 |
| Avago Technologies Ltd. | 10,049,993 | 531,544 |
| Common stocks | | |
| | | Value |
| Information technology (continued) | Shares | (000) |
| | | |
| Apple Inc. | 800,000 | $ 448,888 |
| Amphenol Corp., Class A | 4,100,000 | 365,638 |
| Taiwan Semiconductor Manufacturing Co. Ltd. | 58,225,000 | 206,108 |
| Taiwan Semiconductor Manufacturing Co. Ltd. (ADR) | 6,331,600 | 110,423 |
| Intel Corp. | 12,000,000 | 311,520 |
| Analog Devices, Inc. | 5,705,484 | 290,580 |
| Intuit Inc. | 3,755,000 | 286,582 |
| salesforce.com, inc.1 | 4,595,000 | 253,598 |
| MasterCard Inc., Class A | 300,000 | 250,638 |
| Cisco Systems, Inc. | 10,500,000 | 235,725 |
| Baidu, Inc., Class A (ADR)1 | 985,000 | 175,212 |
| Rackspace Hosting, Inc.1 | 3,975,000 | 155,542 |
| Murata Manufacturing Co., Ltd. | 1,655,000 | 146,783 |
| eBay Inc.1 | 2,500,000 | 137,225 |
| Visa Inc., Class A | 600,000 | 133,608 |
| Micron Technology, Inc.1 | 5,000,000 | 108,800 |
| TE Connectivity Ltd. | 1,955,000 | 107,740 |
| SanDisk Corp. | 1,500,000 | 105,810 |
| Linear Technology Corp. | 1,860,000 | 84,723 |
| ASM Pacific Technology Ltd. | 7,417,300 | 62,079 |
| Concur Technologies, Inc.1 | 474,000 | 48,907 |
| | | 9,369,584 |
| | | |
| Health care 10.27% | | |
| | | |
| Merck & Co., Inc. | 19,500,800 | 976,015 |
| Gilead Sciences, Inc.1 | 10,893,790 | 818,668 |
| Bristol-Myers Squibb Co. | 13,550,000 | 720,183 |
| Express Scripts Holding Co.1 | 7,130,000 | 500,811 |
| Vertex Pharmaceuticals Inc.1 | 6,215,000 | 461,775 |
| Baxter International Inc. | 6,261,755 | 435,505 |
| AbbVie Inc. | 8,015,000 | 423,272 |
| Pfizer Inc. | 13,250,000 | 405,847 |
| Regeneron Pharmaceuticals, Inc.1 | 1,349,248 | 371,367 |
| Johnson & Johnson | 3,500,000 | 320,565 |
| Roche Holding AG | 1,130,000 | 315,673 |
| AstraZeneca PLC | 3,300,000 | 195,333 |
| AstraZeneca PLC (ADR) | 700,000 | 41,559 |
| Intuitive Surgical, Inc.1 | 498,000 | 191,272 |
| Edwards Lifesciences Corp.1 | 2,700,000 | 177,552 |
| UnitedHealth Group Inc. | 1,852,000 | 139,456 |
| GlaxoSmithKline PLC | 5,070,000 | 135,296 |
| Quest Diagnostics Inc. | 2,000,000 | 107,080 |
| Thermo Fisher Scientific Inc. | 800,000 | 89,080 |
| PerkinElmer, Inc. | 2,035,000 | 83,903 |
| Humana Inc. | 396,000 | 40,875 |
| | | 6,951,087 |
| | | |
| Energy 9.69% | | |
| | | |
| Suncor Energy Inc. | 18,092,932 | 634,296 |
| Enbridge Inc. | 11,669,701 | 509,853 |
| Chevron Corp. | 3,773,900 | 471,398 |
| Occidental Petroleum Corp. | 4,600,000 | 437,460 |
| ConocoPhillips | 6,000,000 | 423,900 |
| Common stocks | | |
| | | Value |
| Energy (continued) | Shares | (000) |
| | | |
| FMC Technologies, Inc.1 | 7,750,000 | $ 404,627 |
| Noble Energy, Inc. | 5,400,000 | 367,794 |
| Royal Dutch Shell PLC, Class B (ADR) | 4,700,000 | 353,017 |
| Kinder Morgan, Inc. | 8,240,645 | 296,663 |
| Baker Hughes Inc. | 5,000,000 | 276,300 |
| Southwestern Energy Co.1 | 7,000,000 | 275,310 |
| Concho Resources Inc.1 | 2,420,000 | 261,360 |
| Chesapeake Energy Corp. | 9,060,000 | 245,888 |
| Denbury Resources Inc.1 | 13,800,000 | 226,734 |
| Oceaneering International, Inc. | 2,449,764 | 193,237 |
| EOG Resources, Inc. | 1,000,000 | 167,840 |
| Murphy Oil Corp. | 2,548,321 | 165,335 |
| Schlumberger Ltd. | 1,600,000 | 144,176 |
| CONSOL Energy Inc. | 3,700,000 | 140,748 |
| Oil States International, Inc.1 | 1,362,000 | 138,543 |
| Peyto Exploration & Development Corp. | 4,297,500 | 131,525 |
| TOTAL SA | 2,000,000 | 122,520 |
| Pioneer Natural Resources Co. | 500,000 | 92,035 |
| Spectra Energy Corp | 1,300,000 | 46,306 |
| Transocean Ltd. | 673,300 | 33,274 |
| | | 6,560,139 |
| | | |
| Consumer staples 5.13% | | |
| | | |
| Philip Morris International Inc. | 11,690,000 | 1,018,550 |
| PepsiCo, Inc. | 5,610,498 | 465,335 |
| Costco Wholesale Corp. | 3,635,000 | 432,601 |
| Procter & Gamble Co. | 5,100,000 | 415,191 |
| Kimberly-Clark Corp. | 3,700,000 | 386,502 |
| British American Tobacco PLC | 4,185,000 | 224,398 |
| Herbalife Ltd. | 2,625,000 | 206,587 |
| Japan Tobacco Inc. | 5,896,000 | 191,476 |
| Pernod Ricard SA | 1,150,000 | 131,010 |
| | | 3,471,650 |
| | | |
| Materials 4.93% | | |
| | | |
| LyondellBasell Industries NV, Class A | 6,270,000 | 503,356 |
| FMC Corp. | 6,408,000 | 483,548 |
| Praxair, Inc. | 3,380,000 | 439,501 |
| Dow Chemical Co. | 9,796,418 | 434,961 |
| E.I. du Pont de Nemours and Co. | 6,000,000 | 389,820 |
| Potash Corp. of Saskatchewan Inc. | 9,115,000 | 300,430 |
| Mosaic Co. | 5,000,000 | 236,350 |
| Monsanto Co. | 1,500,000 | 174,825 |
| MeadWestvaco Corp. | 3,660,000 | 135,164 |
| Nucor Corp. | 1,975,000 | 105,425 |
| HudBay Minerals Inc. | 6,744,900 | 55,496 |
| Steel Dynamics, Inc. | 2,500,000 | 48,850 |
| Cliffs Natural Resources Inc. | 1,000,000 | 26,210 |
| | | 3,333,936 |
| | | |
| Telecommunication services 2.68% | | |
| | | |
| Vodafone Group PLC | 149,695,000 | 587,493 |
| Vodafone Group PLC (ADR) | 1,220,000 | 47,958 |
| Common stocks | | |
| | | Value |
| Telecommunication services (continued) | Shares | (000) |
| | | |
| Verizon Communications Inc. | 8,100,000 | $ 398,034 |
| SoftBank Corp. | 4,295,000 | 375,216 |
| Deutsche Telekom AG | 16,000,000 | 273,599 |
| Crown Castle International Corp.1 | 1,251,522 | 91,900 |
| Orange | 3,250,000 | 40,239 |
| | | 1,814,439 |
| Utilities 0.78% | | |
| | | |
| National Grid PLC | 17,719,285 | 231,217 |
| FirstEnergy Corp. | 5,978,900 | 197,184 |
| PG&E Corp. | 2,500,000 | 100,700 |
| | | 529,101 |
| Miscellaneous 1.48% | | |
| | | |
| Other common stocks in initial period of acquisition | | 1,000,924 |
| Total common stocks (cost: $40,915,396,000) | | 65,110,636 |
| Warrants 0.00% | | |
| | | |
| Energy 0.00% | | |
| | | |
| Kinder Morgan, Inc., warrants, expire 20171 | 608,000 | 2,468 |
| Total warrants (cost: $1,158,000) | | 2,468 |
| | Principal amount | |
| Short-term securities 3.82% | (000) | |
| | | |
| Freddie Mac 0.07%–0.15% due 1/14–9/17/2014 | $1,075,518 | 1,075,208 |
| Federal Home Loan Bank 0.05%–0.14% due 1/3–6/11/2014 | 522,900 | 522,777 |
| Fannie Mae 0.08%–0.14% due 2/18–9/22/2014 | 405,400 | 405,218 |
| Coca-Cola Co. 0.11%–0.18% due 1/6–4/10/20143 | 150,900 | 150,882 |
| General Electric Capital Corp. 0.05%–0.18% due 1/2–4/1/2014 | 90,400 | 90,386 |
| Chariot Funding, LLC 0.32% due 2/7/20143 | 50,000 | 49,995 |
| Jupiter Securitization Co., LLC 0.32% due 2/7/20143 | 16,800 | 16,797 |
| Federal Farm Credit Banks 0.10%–0.15% due 5/7–8/25/2014 | 52,100 | 52,062 |
| Regents of the University of California 0.10% due 2/11/2014 | 48,500 | 48,493 |
| Private Export Funding Corp.0.10% due 2/20/20143 | 44,600 | 44,592 |
| National Rural Utilities Cooperative Finance Corp. 0.10% due 1/6–1/23/2014 | 40,000 | 39,999 |
| Emerson Electric Co. 0.08% due 2/3/20143 | 25,000 | 24,998 |
| Army and Air Force Exchange Service 0.11% due 2/20/20143 | 25,000 | 24,995 |
| Walt Disney Co. 0.10% due 3/25/20143 | 25,000 | 24,994 |
| Google Inc. 0.14% due 1/15/20143 | 15,000 | 15,000 |
| Total short-term securities (cost: $2,586,199,000) | | 2,586,396 |
| Total investment securities (cost: $43,502,753,000) | | 67,699,500 |
| Other assets less liabilities | | (22,488) |
| Net assets | | $67,677,012 |
As permitted by U.S. Securities and Exchange Commission regulations, “Miscellaneous” securities include holdings in their first year of acquisition that have not previously been publicly disclosed.
1Security did not produce income during the last 12 months.
2Represents an affiliated company as defined under the Investment Company Act of 1940.
3Acquired in a transaction exempt from registration under section 4(2) of the Securities Act of 1933. May be resold in the U.S. in transactions exempt from registration, normally to qualified institutional buyers. The total value of all such securities was $352,253,000, which represented ..52% of the net assets of the fund.
Key to abbreviation
ADR = American Depositary Receipts
Investments are not FDIC-insured, nor are they deposits of or guaranteed by a bank or any other entity, so they may lose value.
Investors should carefully consider investment objectives, risks, charges and expenses. This and other important information is contained in the fund prospectus and summary prospectus, which can be obtained from your financial professional and should be read carefully before investing. You may also call American Funds Service Company (AFS) at (800) 421-4225 or visit the American Funds website at americanfunds.com.
MFGEFPX-010-0214O-S37693
REPORT OF INDEPENDENT REGISTERED PUBLIC ACCOUNTING FIRM ON INVESTMENT PORTFOLIO
To the Shareholders and Board of Trustees of
American Funds Fundamental Investors – Fundamental Investors:
We have audited, in accordance with the standards of the Public Company Accounting Oversight Board (United States), the financial statements of American Funds Fundamental Investors – Fundamental Investors (the “Fund”) as of December 31, 2013, and for the year then ended and have issued our report thereon dated February 10, 2014, which report and financial statements are included in Item 1 of this Certified Shareholder Report on Form N-CSR. Our audit also included the Fund’s investment portfolio (the “Schedule”) as of December 31, 2013, appearing in Item 6 of this Form N-CSR. This Schedule is the responsibility of the Fund’s management. Our responsibility is to express an opinion based on our audit. In our opinion, the Schedule referred to above, when considered in relation to the basic financial statements taken as a whole of the Fund referred to above, presents fairly, in all material respects, the information set forth therein.
DELOITTE & TOUCHE LLP
Costa Mesa, California
February 10, 2014
ITEM 7 – Disclosure of Proxy Voting Policies and Procedures for Closed-End Management Investment Companies
Not applicable to this Registrant, insofar as the Registrant is not a closed-end management investment company.
ITEM 8 – Portfolio Managers of Closed-End Management Investment Companies
Not applicable to this Registrant, insofar as the Registrant is not a closed-end management investment company.
ITEM 9 – Purchases of Equity Securities by Closed-End Management Investment Company and Affiliated Purchasers
Not applicable to this Registrant, insofar as the Registrant is not a closed-end management investment company.
ITEM 10 – Submission of Matters to a Vote of Security Holders
There have been no material changes to the procedures by which shareholders may recommend nominees to the Registrant’s board of trustees since the Registrant last submitted a proxy statement to its shareholders. The procedures are as follows. The Registrant has a nominating and governance committee comprised solely of persons who are not considered ‘‘interested persons’’ of the Registrant within the meaning of the Investment Company Act of 1940, as amended. The committee periodically reviews such issues as the board’s composition, responsibilities, committees, compensation and other relevant issues, and recommends any appropriate changes to the full board of trustees. While the committee normally is able to identify from its own resources an ample number of qualified candidates, it will consider shareholder suggestions of persons to be considered as nominees to fill future vacancies on the board. Such suggestions must be sent in writing to the nominating and governance committee of the Registrant, c/o the Registrant’s Secretary, and must be accompanied by complete biographical and occupational data on the prospective nominee, along with a written consent of the prospective nominee for consideration of his or her name by the nominating and governance committee.
ITEM 11 – Controls and Procedures
| (a) | The Registrant’s Principal Executive Officer and Principal Financial Officer have concluded, based on their evaluation of the Registrant’s disclosure controls and procedures (as such term is defined in Rule 30a-3 under the Investment Company Act of 1940), that such controls and procedures are adequate and reasonably designed to achieve the purposes described in paragraph (c) of such rule. |
| | |
| (b) | There were no changes in the Registrant’s internal controls over financial reporting (as defined in Rule 30a-3(d) under the Investment Company Act of 1940) that occurred during the Registrant’s second fiscal quarter of the period covered by this report that has materially affected, or is reasonably likely to materially affect, the Registrant’s internal control over financial reporting. |
ITEM 12 – Exhibits
| (a)(1) | The Code of Ethics that is the subject of the disclosure required by Item 2 is attached as an exhibit hereto. |
| | |
| (a)(2) | The certifications required by Rule 30a-2 of the Investment Company Act of 1940 and Sections 302 and 906 of the Sarbanes-Oxley Act of 2002 are attached as exhibits hereto. |
SIGNATURES
Pursuant to the requirements of the Securities Exchange Act of 1934 and the Investment Company Act of 1940, the Registrant has duly caused this report to be signed on its behalf by the undersigned, thereunto duly authorized.
| | AMERICAN FUNDS FUNDAMENTAL INVESTORS |
| | |
| | By /s/ Paul F. Roye |
| | Paul F. Roye, Executive Vice President and Principal Executive Officer |
| | |
| | Date: February 28, 2014 |
Pursuant to the requirements of the Securities Exchange Act of 1934 and the Investment Company Act of 1940, this report has been signed below by the following persons on behalf of the Registrant and in the capacities and on the dates indicated.
| By /s/ Paul F. Roye |
Paul F. Roye, Executive Vice President and Principal Executive Officer |
| |
| Date: February 28, 2014 |
| By /s/ Jeffrey P. Regal |
Jeffrey P. Regal, Treasurer and Principal Financial Officer |
| |
| Date: February 28, 2014 |