UNITED STATES
SECURITIES AND EXCHANGE COMMISSION
Washington, D.C. 20549
FORM N-CSR
Certified Shareholder Report of
Registered Management Investment Companies
Investment Company Act File Number: 811-00032
American Funds Fundamental Investors
(Exact Name of Registrant as Specified in Charter)
6455 Irvine Center Drive
Irvine, California 92618
(Address of Principal Executive Offices)
Registrant's telephone number, including area code: (949) 975-5000
Date of fiscal year end: December 31
Date of reporting period: December 31, 2014
Michael W. Stockton
American Funds Fundamental Investors
6455 Irvine Center Drive
Irvine, California 92618
(Name and Address of Agent for Service)
Copies to:
Mark D. Perlow
K&L Gates LLP
Four Embarcadero Center, Suite 1200
San Francisco, California 94111
(Counsel for the Registrant)
ITEM 1 – Reports to Stockholders

Varied forces shape
the fund’s portfolio.
| | | |
 | | Fundamental Investors®
Annual report
for the year ended
December 31, 2014 |
Fundamental Investors seeks long-term growth of capital and income.
This fund is one of more than 40 offered by one of the nation’s largest mutual fund families, American Funds, from Capital Group. For more than 80 years, Capital has invested with a long-term focus based on thorough research and attention to risk.
Fund results shown in this report, unless otherwise indicated, are for Class A shares at net asset value. If a sales charge (maximum 5.75%) had been deducted, the results would have been lower. Results are for past periods and are not predictive of results for future periods. Current and future results may be lower or higher than those shown. Share prices and returns will vary, so investors may lose money. Investing for short periods makes losses more likely. Investments are not FDIC-insured, nor are they deposits of or guaranteed by a bank or any other entity, so they may lose value. For current information and month-end results, visit americanfunds.com.
See page 4 for Class A share results with relevant sales charges deducted. For other share class results, visit americanfunds.com and americanfundsretirement.com.
Investment results assume all distributions are reinvested and reflect applicable fees and expenses. When applicable, investment results reflect fee waivers, without which results would have been lower. Visit americanfunds.com for more information.
The fund’s 30-day yield for Class A shares as of January 31, 2015, calculated in accordance with the U.S. Securities and Exchange Commission (SEC) formula, was 1.24%. The fund’s 12-month distribution rate for Class A shares as of that date was 1.67%. Both reflect the 5.75% maximum sales charge. The SEC yield reflects the rate at which the fund is earning income on its current portfolio of securities while the distribution rate reflects the fund’s past dividends paid to shareholders. Accordingly, the fund’s SEC yield and distribution rate may differ.
Investing outside the United States may be subject to risks, such as currency fluctuations, periods of illiquidity and price volatility. These risks may be heightened in connection with investments in developing countries. Refer to the fund prospectus and the Risk Factors section of this report for more information on these and other risks associated with investing in the fund.

Fellow investors:
For the 12 months ended December 31, 2014, shares of Fundamental Investors gained 8.96% for those who reinvested distributions totaling approximately $4.52 a share – a figure that includes a 40-cent special dividend and an approximately $3.56 capital gain, both of which were paid in December.
Although it finished well into positive territory, the fund trailed the 13.66% gain recorded by the unmanaged Standard & Poor’s 500 Composite Index, a market capitalization-weighted index based on the results of 500 widely held common stocks. Relative to its peer group, however, Fundamental Investors fared better, narrowly eclipsing the 8.77% return of the Lipper Growth & Income Funds Index.
To expand the set of investment opportunities available to portfolio managers as they pursue the fund’s growth and income objectives, Fundamental Investors is able to invest up to 35% of its assets in companies domiciled outside the United States. Thus we believe it’s important to provide a broader context for fund returns. For the 12 months, the unmanaged MSCI World Index, a measure of stock markets in more than 20 developed countries including the U.S., gained 4.94%.
As of December 31, the portion of fund assets invested in companies based abroad was 11.0%, a 10-year low. As a group, these investments fared much better than the -3.87% return of the unmanaged MSCI All Country World Index ex USA, a measure of more than
Results at a glance
For periods ended December 31, 2014, with all distributions reinvested
| | | Cumulative | | |
| | | total returns | | Average annual total returns |
| | | | | | | | | | | | | | | Lifetime |
| | | 1 year | | 5 years | | 10 years | | (since 8/1/78) |
| | | | | | | | | |
| Fundamental Investors (Class A shares) | | | 8.96 | % | | | 13.43 | % | | | 8.61 | % | | | 12.61 | % |
| Standard & Poor’s 500 Composite Index* | | | 13.66 | | | | 15.44 | | | | 7.67 | | | | 11.78 | |
| Lipper Growth & Income Funds Index | | | 8.77 | | | | 12.30 | | | | 6.37 | | | | 10.83 | |
| MSCI World Index*,† | | | 4.94 | | | | 10.20 | | | | 6.03 | | | | 9.72 | |
| * | The market indexes are unmanaged and, therefore, have no expenses. Investors cannot invest directly in an index. |
| † | Results reflect dividends net of withholding taxes. |
40 developed and emerging markets, excluding the United States. Nonetheless, our non-U.S. holdings proved a drag on overall results, just as they have over the last few years when markets outside the U.S. have, in aggregate, trailed their U.S. counterpart by an average slightly above 10% per year.
Despite challenging conditions for funds with a non-U.S. component, Fundamental Investors has bested its peer group for all periods and outpaced the S&P 500 over the 10-year and lifetime periods, as shown in the table on page 1.
The U.S., then everybody else
U.S. markets were, by far, the best in the developed world save Israel, as the accelerating American economy, strong corporate earnings, continued low interest rates and high levels of mergers and acquisitions activity supported stock market returns. As noted previously, the story abroad was much less rosy. In Europe, persistent deflationary pressures, muted growth and chronically high unemployment held down stock prices. In Japan, weak economic data and uncertainty over whether the country could meet its inflation target were partially offset by the boost provided to exporters by a yen that weakened relative to the U.S. dollar.
The impact of currency
For U.S.-based investors, accounting for the impact of such currency fluctuations is crucial, particularly in a year when the greenback strengthened significantly against all its major counterparts. Currency fluctuation exerts a multi-faceted effect on the global economy, but its biggest impact on stock investors is what’s known as the translation effect. For example, if a stock is denominated in euros and, due to euro weakening, that currency buys fewer dollars, then the stock price in dollars will be lower. This can, and did, exert a significant drag on returns during the 12 months. For example, European markets actually posted a 6.84% gain in 2014, but because the euro weakened significantly against the dollar, that return became -6.18% when converted to U.S. currency.
As investors, the hazards of currency volatility are well known to us, and we judge the potential benefits of investing abroad worth the risk – but the reality is that in some years it can represent a very meaningful headwind.
Strength among large holdings can’t close the gap
Results for the fund’s 10 largest holdings were mixed over the period, with a majority recording solid results. Firms from six different industries posted strong gains, led by Union Pacific (41.82%) and longtime investments Home Depot (27.48%) and Microsoft (24.10%), followed by Wells Fargo (20.75%), Merck (13.47%) and Comcast (11.63%).
Finishing in negative territory was a similarly diverse group of companies including Boeing (-4.77%), Google (-5.30%), Philip Morris International (-6.52%) and Amazon (-22.18%).
The fund’s technology holdings were a source of strength, as were investments in health care. Both sectors feature a combination of smaller, higher growth companies that generally do not offer dividends and established ones that offer attractive yields.
Stock selection in a handful of economically sensitive areas including energy, industrials and materials lagged the fund’s overall results.
2015: More of the same?
Heading into 2015, the global economic picture is mixed. The U.S. recovery seems likely to continue, but prospects for Europe are uncertain. The ability of the continent’s central bankers and policy makers to stem deflation, stimulate growth and address the sometimes disparate needs and desires of its member nations is a major challenge. A similarly uncertain outlook faces Japan, where the reform programs of Prime Minister Shinzo Abe continue to meet with uneven results.
Fundamental Investors’ total return year by year (ending December 31)
| | | Capital return | | Income return | | Total return |
| 2005 | | | 9.84 | % | | | 1.84 | % | | | 11.68 | % |
| 2006 | | | 17.65 | | | | 1.59 | | | | 19.24 | |
| 2007 | | | 11.16 | | | | 2.39 | | | | 13.55 | |
| 2008 | | | –41.08 | | | | 1.38 | | | | –39.70 | |
| 2009 | | | 31.42 | | | | 1.94 | | | | 33.36 | |
| 2010 | | | 12.30 | | | | 1.75 | | | | 14.05 | |
| 2011 | | | –3.58 | | | | 1.69 | | | | –1.89 | |
| 2012 | | | 15.29 | | | | 1.85 | | | | 17.14 | |
| 2013 | | | 29.89 | | | | 1.60 | | | | 31.49 | |
| 2014 | | | 7.09 | | | | 1.87 | | | | 8.96 | |
| | | | | | | | | | | | | |
| 10-year average annual total return | | | | 8.61 | % |
| 10-year cumulative total return | | | | | 128.38 | |
| Lifetime cumulative total return (since 8/1/78) | | | 7,453.48 | |
Total return measures both capital results (changes in net asset value) and income return (from dividends).
All returns assume reinvestment of all dividends and capital gain distributions.
The energy sector also remains in flux as the recent steep drop in crude prices has affected regions, industries and companies in different ways. In the U.S., the decline in gas prices means more money in the pockets of consumers, which could translate into greater spending elsewhere in the economy. For U.S. firms involved in energy extraction, however, lower prices reduce revenues. This could, in turn, curtail spending on wells and slow or reverse hiring. For nations heavily dependent on oil exports, retreating prices create real pain — as evidenced in Russia where markets and the value of the ruble have both plunged.
Why continue to look abroad?
The drag that non-U.S. holdings have exerted on the portfolio in recent years may lead some to question the wisdom of investing abroad. While we believe the question is a reasonable one, we continue to see value in having the flexibility to cast our nets beyond our shores. What’s more, we strongly believe that over the long term, where a company does business is often much less important than where it’s headquartered.
This belief, together with the fact that one needn’t look too far into the past to find a time when U.S. markets lagged their overseas counterparts, is why we hold to our belief in the value of our flexible, research-driven, company-by-company philosophy.
We hope you will continue to view the fund’s long-term results as a testament to the value of this approach. Thank you for your commitment to Fundamental Investors.
Sincerely,
 |  |
James F. Rothenberg Vice Chairman | Dina N. Perry President |
February 11, 2015
For current information about the fund, visit americanfunds.com.
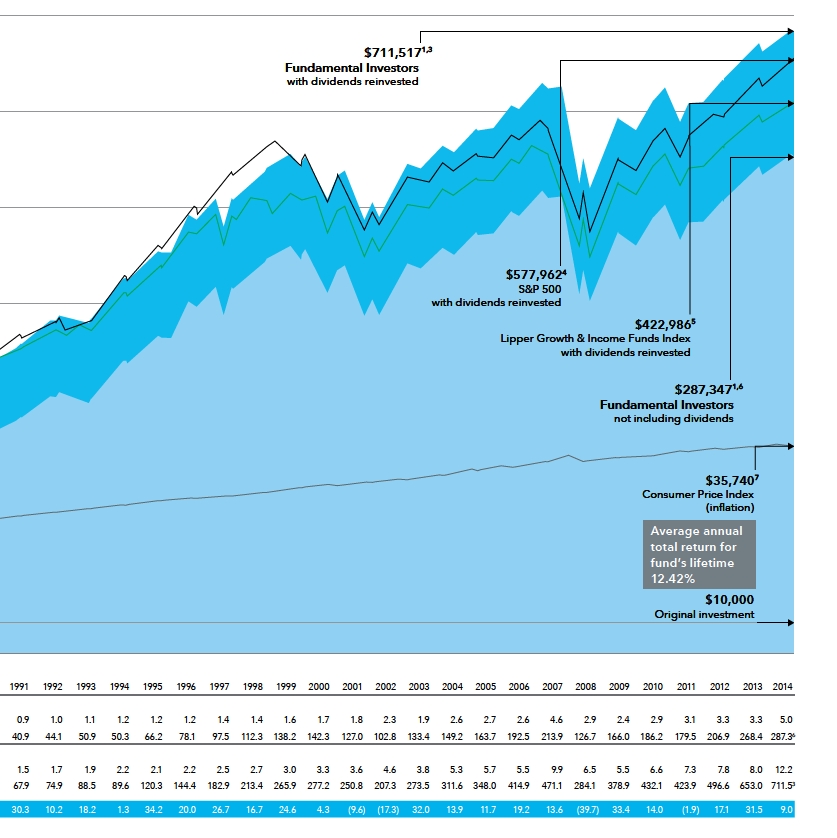
Results of a $10,000 investment in Fundamental Investors
Fund results shown are for Class A shares and reflect deduction of the maximum sales charge of 5.75% on the $10,000 investment.1 Thus, the net amount invested was $9,425.2 Results are for past periods and are not predictive of results for future periods. Current and future results may be lower or higher than those shown. Share prices and returns will vary, so investors may lose money. For current information and month-end results, visit americanfunds.com.
The results shown are before taxes on fund distributions and sale of fund shares.
| 1 | As outlined in the prospectus, the sales charge is reduced for accounts (and aggregated investments) of $25,000 or more and is eliminated for purchases of $1 million or more. There is no sales charge on dividends or capital gain distributions that are reinvested in additional shares. |
| 2 | The maximum initial sales charge was 8.50% prior to July 1, 1988. |
| 3 | Includes reinvested dividends of $127,139 and reinvested capital gain distributions of $227,574. |
| 4 | The S&P 500 is unmanaged and, therefore, has no expenses. Investors cannot invest directly in an index. |
| 5 | Results of the Lipper Growth & Income Funds Index do not reflect any sales charges. |
| 6 | Includes reinvested capital gain distributions of $114,758 but does not reflect income dividends of $62,738 taken in cash. |
| 7 | Computed from data supplied by the U.S. Department of Labor, Bureau of Labor Statistics. |
| 8 | For the period August 1, 1978 (when Capital Research and Management Company became investment adviser), through December 31, 1978. |
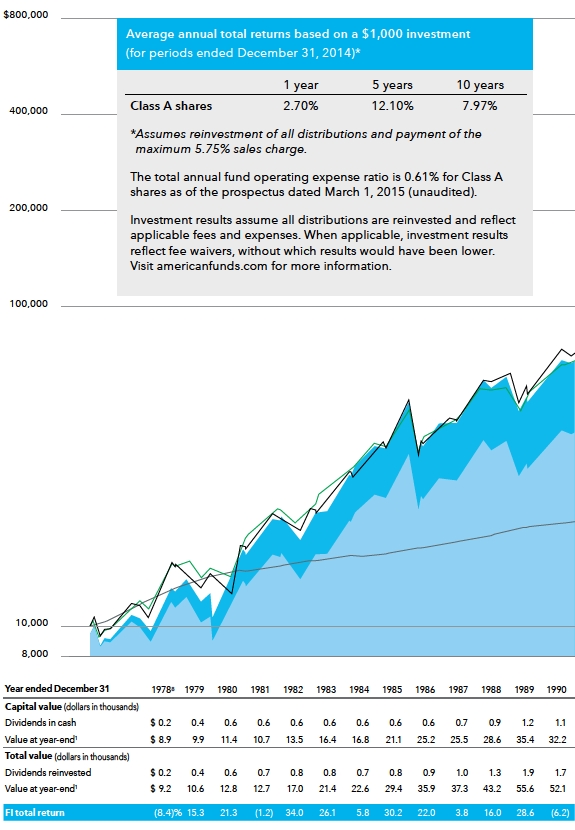
How a $10,000 investment has grown
The chart and the table below it illustrate how a $10,000 investment in the fund grew between August 1, 1978 — when Capital Research and Management Company became Fundamental Investors’ investment adviser — and December 31, 2014. The chart also shows how the unmanaged Standard & Poor’s 500 Composite Index and the Lipper Growth & Income Funds Index fared over this same period, and what happened to inflation (as measured by the Consumer Price Index).

Varied forces shape
the fund’s portfolio.
Company by company. It’s consistently been our approach to building the fund’s portfolio for nearly four decades – as true today as it’s always been.
Yet built into many people’s understanding of this methodology is the belief that it’s fundamentally incompatible with thematic investing. And although market or economic conditions and trends are rarely our starting point, many of the forces and trends shaping economies and industries do get reflected in the fund’s portfolio. In the following pages, we look at some of the factors that have helped drive our investment decisions in recent years and meaningfully changed the face of Fundamental Investors’ portfolio.
Staying closer to home
Significant shifts in the portfolio often result from multiple investment professionals arriving at similar conclusions through a combination of dialogue and research. Take, for example, the reduction in holdings of non-U.S. companies that the fund has experienced in recent years.
“The ability to invest up to 35% of assets in companies domiciled outside the U.S. has given us the flexibility to seek out investments worldwide that we think can contribute to our growth and income objectives,” says fund President Dina Perry, who is also one of the fund’s portfolio managers. “Yet over the last few years, that percentage has declined for a number of reasons.”
First among those reasons has been the resilience of the U.S. economy in the wake of the global financial crisis. Though the crisis originated in the American housing market, the interconnected nature of today’s global financial system meant other countries and regions quickly felt our pain. Unfortunately, not all have been equally successful in extricating themselves from the global economic slump.
The U.S. has recovered more quickly than most thanks to aggressive action from government officials, regulators and central bankers. Toxic assets were segregated, banks forced to improve their balance sheets, the mortgage market shored up and interest rates held down. From there, the dynamism, innovativeness and flexibility of the U.S. economy took over. Unemployment has trended down steadily, the dollar continues to strengthen and inflation remains in check. Moreover, the shale gas revolution has re-drawn the U.S. energy picture and fundamentally changed the cost structure for manufacturers looking to build things in America.
In contrast, Europe was slower to move, its actions less sweeping and aggressive. Consequently, the continent’s economy is still struggling to get back on its feet. Japan, meanwhile, remains in a multi-decade economic malaise. In this environment, it is understandable that the fund’s managers might have a bias toward firms that call America home, and that the concentration of non-U.S. firms has dropped to a 10-year low.
“These conditions provided significant tailwinds for U.S. firms, but it’s important to note that there was no dictate to increase our investments in American companies,” cautions Dina. “Rather, it’s an organic occurrence resulting from a diverse group of investment professionals who, by conferring and sharing research and opinions, arrived at a similar conclusion. In the end, however, each of us – individually – makes the decisions about the portion of the portfolio we manage.”
A careful return to a sector
The global financial crisis led to the emergence of another, seemingly counterintuitive, theme within the fund’s portfolio: a meaningful increase in our investments among financial companies. Post-crisis there was an opportunity to invest not only in attractively valued,
better capitalized U.S. banks, but also to consider adding several companies that might not readily come to mind when one thinks “financials.”
Thatcher Thompson, an investment analyst who covers the sector, explains. “As with most investors, the high loan default rates associated with the financial crisis took a hard toll on our investments in banks. Understandably, we’ve exercised extra caution when investing in firms that loaned money. However, there was a set of companies that we felt offered minimal lending exposure but were very inexpensively priced as a result of the overall sector downturn. I call them ‘financial plumbing’ companies.”
According to Thatcher, these firms provide some key global banking and finance infrastructure. They include firms like MasterCard and Visa whose networks – built over decades – are indispensable transaction pipelines for our increasingly cashless society. Others include companies such as Moody’s and Standard & Poor’s (owned by McGraw Hill). As the two most prominent raters of companies and other issuers of bonds such as governments, they are seen as critical to the successful functioning of capital markets. Yet their post-crisis valuations had plunged in part because of their failure to foresee – or worse, a perceived willingness to overlook – the risks in many of the securities they rated in the lead up to the U.S. housing meltdown. In fact, the companies still face costly legal challenges relating to their actions during this period. Adding to their troubles was the fact that, while in the public’s crosshairs, their core business came under scrutiny as people began to question whether, as a firm paid by the companies they rate, they suffered from a conflict of interest.
What the CEOs told us
“These companies have faced considerable perception problems, but despite their troubles we believed they would continue to serve an important function within the markets,” says Thatcher. “Perhaps the biggest reason for this belief was that in the course of our research on a variety of companies, countless CEOs indirectly emphasized how important the credit rating agencies were. When we would ask about capital allocation decisions (dividends, buybacks and acquisitions) or balance sheet structure, CEOs would often question how Moody’s and Standard & Poor’s might respond and what it might mean to their future borrowing costs. The fact that senior executives at a number of firms had elevated these agencies to the role of unofficial regulators convinced us that they’d continue to play an important role in the markets.”
In the meantime, a tailwind began to put some air in their sails as tighter post-crisis lending – particularly in Europe – made it necessary for more companies to turn to the bond markets in order to raise capital. And who stood ready to rate the companies and the debt? The agencies, of course, who in turn saw their share prices rise sharply on increased demand for their services.
Commodity values bounce back, derivative trading rises
Still another financial infrastructure company that has rebounded well is CME – parent company of the Chicago Mercantile Exchange, the world’s busiest exchange for raw commodities such as corn, copper and wheat, as well as financial products such as stock, interest rate and currency futures. For exchanges, there are a few key profit drivers. Top among them is the volume of trading in contracts like futures, which is directly related to the amount of volatility in the market. By these measures, the post-crisis period was full of headwinds. Global coordination of the world’s major central banks led to historically low levels of volatility among interest rates, currencies and even stocks.
Yet for those willing to look closely, there was opportunity.
“One perceived culprit of the U.S. mortgage crisis was the heavy employment of derivatives linked to many of the mortgage securities that were being issued as the bubble was forming,” says Thatcher. “These derivatives were primarily traded over the counter, making them and the risks they carried less visible to those outside the trades. The Dodd/ Frank legislation implemented after the crisis mandated that these instruments be cleared in a central clearinghouse. As one of the world’s largest clearinghouses, CME was uniquely positioned to provide a solution for those trying to comply efficiently with the new legislation.
As derivatives activity grew, commodity volumes began to improve as well, as trading levels rebounded much more quickly than expected. With volatility expected to pick up in the coming months and a surge in trading related to interest rates a likely possibility, CME appears to be facing favorable business conditions.
Tracing today’s innovation back to the source
Sometimes, like a duck that’s furiously paddling beneath a seemingly tranquil surface, the percentage of fund assets invested in a particular sector may not drastically change, but the forces reshaping the industry are profound. To a large extent, that’s the case with the
(continued on page 11)

The changing shape of Fundamental Investors’ portfolio
Significant changes in the composition of Fundamental Investors’ portfolio may be difficult to spot from one quarter to the next. But take a longer view – a multiyear market or economic cycle, for example – and shifts become visible. “Suddenly” financial companies are the biggest sector; investments in companies headquartered abroad are half of what they once were; utilities barely register. And behind most such shifts there is a story: recessionary conditions in a country or region; a wave of innovation within a particular industry; changes in the culture of a sector. The table below shows how the fund’s composition has changed over the past decade and reveals some of the forces that drove the change. (Holdings are as of 12/31 each year.)
| | | U.S.
stocks | | Non-U.S.
stocks | | Cash &
equivalents | | Financials | | Consumer
Staples | | Information
technology | | Materials | | Energy | | Industrials | | Health care | | Consumer
discretionary | | Telecom | | Utilities |
| 2005 | | 70.4% | | 26.0% | | 3.6% | | 12.4% | | 5.3% | | 10.4% | | 9.0% | | 17.8% | | 12.7% | | 8.6% | | 8.5% | | 4.1% | | 4.4% |
| 2006 | | 66.3 | | 28.1 | | 5.6 | | 12.8 | | 6.6 | | 11.2 | | 7.6 | | 14.2 | | 12.7 | | 10.1 | | 8.2 | | 5.0 | | 3.9 |
| 2007 | | 62.6 | | 28.8 | | 8.6 | | 8.4 | | 5.7 | | 12.9 | | 9.9 | | 14.8 | | 14.1 | | 7.9 | | 8.9 | | 4.0 | | 2.8 |
| 2008 | | 65.0 | | 23.0 | | 12.0 | | 7.6 | | 5.2 | | 17.6 | | 6.3 | | 10.5 | | 12.2 | | 11.9 | | 7.2 | | 3.3 | | 2.8 |
| 2009 | | 72.3 | | 23.0 | | 4.7 | | 9.6 | | 6.1 | | 17.0 | | 9.0 | | 12.7 | | 11.0 | | 12.1 | | 7.8 | | 2.9 | | 4.4 |
| 2010 | | 74.7 | | 19.2 | | 6.1 | | 11.9 | | 5.6 | | 13.7 | | 7.6 | | 12.2 | | 11.8 | | 11.4 | | 11.3 | | 2.6 | | 3.2 |
| 2011 | | 74.5 | | 20.0 | | 5.5 | | 9.1 | | 6.7 | | 15.2 | | 7.7 | | 12.7 | | 12.4 | | 10.6 | | 12.1 | | 3.6 | | 2.7 |
| 2012 | | 77.2 | | 16.7 | | 6.1 | | 13.0 | | 4.3 | | 14.2 | | 6.1 | | 11.5 | | 11.8 | | 12.4 | | 14.8 | | 1.4 | | 1.8 |
| 2013 | | 82.8 | | 13.4 | | 3.8 | | 15.6 | | 5.1 | | 13.8 | | 4.9 | | 9.7 | | 14.4 | | 10.3 | | 17.5 | | 2.7 | | 0.8 |
| 2014 | | 84.3 | | 11.1 | | 4.6 | | 16.6 | | 7.6 | | 16.2 | | 4.1 | | 7.3 | | 13.4 | | 10.5 | | 15.9 | | 1.3 | | 0.3 |
Financials:
Appealing valuations coming out of the financial crisis spurred investment in newly recapitalized banks as well as heavy investment in select nonlending financial companies that provide “plumbing” for capital markets and commerce.
Consumer discretionary:
Sector holdings have risen on the fund’s considerable investment in Amazon and a sharp increase in media companies where broadening demand is driving pricing power and managements are exercising greater discipline.
Non-U.S. stocks:
With much of Europe slow to emerge from the global financial crisis and Japan still struggling, portfolio managers have shown a bias toward companies based in an economically stronger U.S.
Materials and Energy:
Reductions in these economically sensitive sectors speak both to the slowdown in global economic growth, and the fact that managers have found more attractively valued opportunities among companies from other sectors.

Microsoft: The same thing, only different
Over the past decade, just one company has appeared among the fund’s 10 largest holdings at the close of each year: Microsoft. Even those familiar with our buy-and-hold philosophy might find this a bit unusual. Yet the history of our stake in Microsoft is not one of “set it and forget it.”
The truth is, the Microsoft we own today looks meaningfully different than it did over a decade ago. And the transition from new economy darling to blue chip stalwart has not been without its challenges.
“Microsoft has missed the boat in a number of high-growth areas. It’s failed to gain substantial market share in mobile computing, and its efforts to grow its internet search business have lagged,” says Paul Benjamin, a technology analyst who covers the firm today. “Moreover, its retail stores have failed to capture the public’s attention and its Surface tablet has met with lackluster demand. Together, this has contributed to the perception that the company is a tech also-ran. Despite all that, for those with patience and a long-term investment window, there’s always been a reasonably clear case for owning it.”
In Paul’s view and those of several managers, what’s kept the company compelling is the ongoing dominance of its Windows operating system and Office productivity suite, both of which enjoy virtual monopolies. Add to it the company’s strength in the enterprise server business and – more recently – its success in the cloud computing area, and the picture starts to change.
Interestingly, although Microsoft has remained a fund investment, the mix of managers holding it in their respective slices of the portfolio has changed. One who’s owned it throughout is fund President Dina Perry. “I’ve maintained an investment in Microsoft for over a decade, but throughout that time I’ve continued to test the assumptions that triggered my initial purchase. Obviously, the ongoing strength of its franchises and earnings has been key. But so has the fact that its valuation has remained very appealing, and its growing dividend has offered tangible incentive to hold onto it.”
Dina’s vision and her willingness to hold through the ups and downs that have marked the company’s last 10 years have been rewarded. Despite change and challenge, over that time Microsoft has recorded a total return of 74.0%. Much of that return has come on the strength of share price gains over the past few years. During that time, the fund added to its stake based on Paul’s belief in the firm’s competitive positioning and appealing valuation, as well as the potential benefits of a leadership change that came to pass. And although past results are not predictive of future returns, the last 12 months mark the latest chapter in a rewarding long-term story.
pharmaceuticals industry, which seems to have entered a kind of golden age of innovation. Indeed these days, treatments and remedies that once seemed the stuff of science fiction have become the norm.
Go in search of forces that launched the current renaissance and you’ll find yourself in 2003. In April of that year, the Human Genome Project was completed.
“In science, there’s a principle known as ‘punctuated equilibrium,’ which is most often applied to evolutionary biology. In essence it theorizes that evolution does not proceed at a single uniform rate of speed but rather is punctuated by big leaps forward that add to diversification,” explains pharmaceutical analyst Jay Markowitz, a former transplant surgeon. “The mapping of the genome was that kind of big leap forward. It catalyzed the current wave of innovation in the pharmaceuticals area and has greatly expanded the options for how we treat disease.”
From $100 million to $5,000 in under 15 years
According to Jay, pharmaceutical innovation cycles typically span 10 to 15 years. So it’s not surprising that a dozen years removed from the mapping of the human genome, such a tidal wave of innovation is cresting in the form of effective treatments and robust drug pipelines. Yet in reality, that wave may just be gathering strength.
“We’re entering a new era of medicine that will be characterized less by palliating symptoms and more by treating the molecular basis of disease. Understanding one’s genetic profile will be central to that effort,” adds Jay. “And thanks to advances in technology, the cost of sequencing one’s genes has dropped at a staggering rate – from nearly $100,000,000 in 2001 to less than $5,000 today.”
“We’re seeking companies with important new drugs to treat serious diseases with the potential to deliver a growing cash stream to investors. And it seems that more companies than ever fit that description,” says Jay.
From emperors to advocates
Sometimes, the winds of change buffeting the culture of a particular sector or industry can provide the impetus for investment. Media firms, which have become a much bigger part of the portfolio in recent years, are a case in point. In the past, media companies had a reputation for being run by larger-than-life figures more intent on building empires than creating value for shareholders. Assets changed hands frequently, often with the promise that synergy or added capital would unlock value. It rarely did. But over the past few years, higher quality, more disciplined managers have taken the reins at a number of firms and done what the empire builders could not: drive share price growth.
“In recent years many of the firms sold off assets unrelated to their core businesses and put their focus on getting essential assets to perform better,” says media analyst Andrei Muresianu. “Several firms have taken steps that we believe will ensure better capital discipline. Specifically, they have instituted dividends and/or share buyback programs. Publicly committing to such payouts can act as a check and balance when it comes to riskier, capital intensive projects.”
This newfound discipline occurred alongside another favorable trend: the growing appetite for the content these firms produce. Indeed, today’s environment fulfills a prediction Bill Gates made back in 1996 when he declared that “Content is King.”
“As consumers, we understand that there are hundreds of cable channels that demand content. But there are also less traditional outlets such as Netflix, Amazon and Hulu that need to keep their pipelines full,” explains Andrei. “And that’s just in the U.S. Overseas outlets also need programming, and conglomerates like Fox and Time Warner are huge suppliers of it. This global demand has fundamentally shifted the economics of production because it has created a broader revenue base and enabled firms to distribute the once-sizable risk involved in, say, developing a sitcom or drama.”
In addition, their pricing power in the U.S. has grown as there are more distributors bringing content into homes – including traditional cable companies, telecoms (Verizon and AT&T) and satellite firms. Added pricing power has meant greater profit for producers and, in many cases, driven share price growth.
“None of these developments took place overnight, and there wasn’t a specific point in time when we concluded it made sense to invest. Rather, we continued to conduct rigorous research on these firms and the industry, stay connected with their management teams and pay close attention to company valuations,” says Andrei. “Over time, several of the fund’s managers developed conviction and built positions. That’s typical of how many of the themes shaping economies and industries get captured in the fund’s portfolio.” ■
Summary investment portfolio December 31, 2014
| Industry sector diversification | Percent of net assets |

| Country diversification by domicile | | Percent of
net assets |
| United States | | 84.29 | % |
| Euro zone* | | 3.25 | |
| United Kingdom | | 2.62 | |
| Canada | | 2.44 | |
| Switzerland | | 0.68 | |
| Japan | | 0.61 | |
| Taiwan | | 0.45 | |
| South Africa | | 0.27 | |
| Sweden | | 0.25 | |
| Other countries | | 0.50 | |
| Short-term securities & other assets less liabilities | | 4.64 | |
| * | Countries using the euro as a common currency; those represented in the fund’s portfolio are France, Germany, Ireland and the Netherlands. |
| Common stocks 95.36% | | Shares | | | Value
(000) | |
| Financials 16.55% | | | | | | | | |
| Wells Fargo & Co. | | | 24,745,916 | | | $ | 1,356,571 | |
| JPMorgan Chase & Co. | | | 17,205,000 | | | | 1,076,689 | |
| American Express Co. | | | 10,270,000 | | | | 955,521 | |
| Berkshire Hathaway Inc., Class A1 | | | 3,835 | | | | 866,710 | |
| Capital One Financial Corp. | | | 10,162,000 | | | | 838,873 | |
| CME Group Inc., Class A | | | 8,007,600 | | | | 709,874 | |
| ACE Ltd. | | | 4,350,000 | | | | 499,728 | |
| Goldman Sachs Group, Inc. | | | 2,438,200 | | | | 472,596 | |
| Legal & General Group PLC2 | | | 119,784,921 | | | | 460,072 | |
| SunTrust Banks, Inc. | | | 10,603,987 | | | | 444,307 | |
| Citigroup Inc. | | | 8,000,000 | | | | 432,880 | |
| American International Group, Inc. | | | 7,641,700 | | | | 428,012 | |
| Other securities | | | | | | | 3,323,768 | |
| | | | | | | | 11,865,601 | |
| | | | | | | | | |
| Information technology 16.22% | | | | | | | | |
| Microsoft Corp. | | | 55,205,000 | | | | 2,564,272 | |
| Google Inc., Class C1 | | | 1,162,800 | | | | 612,098 | |
| Google Inc., Class A1 | | | 1,137,800 | | | | 603,785 | |
| Avago Technologies Ltd. | | | 10,261,993 | | | | 1,032,254 | |
| ASML Holding NV2 | | | 4,555,030 | | | | 488,011 | |
| ASML Holding NV (New York registered) | | | 2,481,000 | | | | 267,526 | |
| Apple Inc. | | | 6,630,000 | | | | 731,819 | |
| Texas Instruments Inc. | | | 12,570,300 | | | | 672,071 | |
| Visa Inc., Class A | | | 2,320,000 | | | | 608,304 | |
| Cisco Systems, Inc. | | | 21,730,000 | | | | 604,420 | |
| Intel Corp. | | | 12,000,000 | | | | 435,480 | |
| Other securities | | | | | | | 3,009,196 | |
| | | | | | | | 11,629,236 | |
| | | | | | | | | |
| Consumer discretionary 15.93% | | | | | | | | |
| Comcast Corp., Class A | | | 34,085,000 | | | | 1,977,271 | |
| Amazon.com, Inc.1 | | | 5,832,800 | | | | 1,810,209 | |
| Home Depot, Inc. | | | 14,110,000 | | | | 1,481,127 | |
| Twenty-First Century Fox, Inc., Class A | | | 26,125,000 | | | | 1,003,331 | |
| Walt Disney Co. | | | 9,390,000 | | | | 884,444 | |
| Time Warner Inc. | | | 9,230,000 | | | | 788,427 | |
| Other securities | | | | | | | 3,474,308 | |
| | | | | | | | 11,419,117 | |
| | Shares | | | Value
(000) | |
| Industrials 13.35% | | | | | | | | |
| Boeing Co. | | | 11,900,000 | | | $ | 1,546,762 | |
| Union Pacific Corp. | | | 11,740,000 | | | | 1,398,586 | |
| General Electric Co. | | | 43,750,000 | | | | 1,105,562 | |
| Parker-Hannifin Corp. | | | 4,664,300 | | | | 601,461 | |
| Lockheed Martin Corp. | | | 3,113,200 | | | | 599,509 | |
| Other securities | | | | | | | 4,317,984 | |
| | | | | | | | 9,569,864 | |
| | | | | | | | | |
| Health care 10.46% | | | | | | | | |
| Merck & Co., Inc. | | | 22,485,000 | | | | 1,276,923 | |
| Express Scripts Holding Co.1 | | | 10,039,474 | | | | 850,042 | |
| Vertex Pharmaceuticals Inc.1 | | | 5,800,000 | | | | 689,040 | |
| Pfizer Inc. | | | 18,600,000 | | | | 579,390 | |
| Bristol-Myers Squibb Co. | | | 9,500,000 | | | | 560,785 | |
| Other securities | | | | | | | 3,541,722 | |
| | | | | | | | 7,497,902 | |
| | | | | | | | | |
| Consumer staples 7.58% | | | | | | | | |
| Philip Morris International Inc. | | | 19,770,000 | | | | 1,610,266 | |
| Coca-Cola Co. | | | 18,695,000 | | | | 789,303 | |
| Procter & Gamble Co. | | | 6,860,000 | | | | 624,877 | |
| PepsiCo, Inc. | | | 5,000,000 | | | | 472,800 | |
| Other securities | | | | | | | 1,935,229 | |
| | | | | | | | 5,432,475 | |
| | | | | | | | | |
| Energy 7.31% | | | | | | | | |
| ConocoPhillips | | | 9,410,000 | | | | 649,855 | |
| Suncor Energy Inc. | | | 12,996,034 | | | | 412,768 | |
| Other securities | | | | | | | 4,181,557 | |
| | | | | | | | 5,244,180 | |
| | | | | | | | | |
| Materials 4.06% | | | | | | | | |
| Potash Corp. of Saskatchewan Inc. | | | 19,130,000 | | | | 675,672 | |
| E.I. du Pont de Nemours and Co. | | | 6,000,000 | | | | 443,640 | |
| Other securities | | | | | | | 1,791,864 | |
| | | | | | | | 2,911,176 | |
| | | | | | | | | |
| Other 1.61% | | | | | | | | |
| Other securities | | | | | | | 1,150,636 | |
| | | | | | | | | |
| Miscellaneous 2.29% | | | | | | | | |
| Other common stocks in initial period of acquisition | | | | | | | 1,640,563 | |
| | | | | | | | | |
| Total common stocks (cost: $44,651,678,000) | | | | | | | 68,360,750 | |
| | | | | | | | | |
| Short-term securities 4.54% | | Principal
amount
(000) | | | | | |
| Chariot Funding, LLC 0.26% due 1/26/20153 | | $ | 25,000 | | | | 24,998 | |
| Coca-Cola Co. 0.14%-0.17% due 1/23/2015-4/23/20153 | | | 107,700 | | | | 107,678 | |
| Fannie Mae 0.08%-0.12% due 1/5/2015-6/15/2015 | | | 742,731 | | | | 742,563 | |
| Federal Home Loan Bank 0.06%-0.16% due 1/21/2015-11/6/2015 | | | 926,800 | | | | 926,585 | |
| Freddie Mac 0.09%-0.17% due 1/6/2015-7/23/2015 | | | 416,785 | | | | 416,643 | |
| Jupiter Securitization Co., LLC 0.21%-0.27% due 5/27/2015-8/11/20153 | | | 75,100 | | | | 74,970 | |
| Short-term securities (continued) | | Principal
amount
(000) | | | Value (000) | |
| Microsoft Corp. 0.09% due 2/9/20153 | | $ | 50,000 | | | $ | 49,995 | |
| Walt Disney Co. 0.08% due 1/26/20153 | | | 10,600 | | | | 10,599 | |
| Other securities | | | | | | | 898,125 | |
| | | | | | | | | |
| Total short-term securities (cost: $3,251,921,000) | | | | | | | 3,252,156 | |
| Total investment securities 99.90% (cost: $47,903,599,000) | | | | | | | 71,612,906 | |
| Other assets less liabilities 0.10% | | | | | | | 70,713 | |
| | | | | | | | | |
| Net assets 100.00% | | | | | | $ | 71,683,619 | |
This summary investment portfolio is designed to streamline the report and help investors better focus on the fund’s principal holdings. See the inside back cover for details on how to obtain a complete schedule of portfolio holdings.
As permitted by U.S. Securities and Exchange Commission regulations, “Miscellaneous” securities include holdings in their first year of acquisition that have not previously been publicly disclosed.
“Other securities” includes all issues that are not disclosed separately in the summary investment portfolio.
Investments in affiliates
A company is an affiliate of the fund under the Investment Company Act of 1940 if the fund’s holdings in that company represent 5% or more of the outstanding voting shares. The value of the fund’s holdings in affiliated companies is included in “Other securities” under the respective industry sectors in the summary investment portfolio. Further details on these holdings and related transactions during the year ended December 31, 2014, appear below.
| | | Beginning
shares | | Additions | | Reductions | | Ending
shares | | Dividend
income
(000) | | Value of
affiliates at
12/31/2014
(000) |
| Peyto Exploration & Development Corp. | | | 3,870,000 | | | | 4,557,500 | | | | 320,000 | | | | 8,107,500 | | | $ | 4,890 | | | $ | 233,567 | |
| CNO Financial Group, Inc. | | | 11,900,000 | | | | — | | | | — | | | | 11,900,000 | | | | 2,856 | | | | 204,918 | |
| Denbury Resources Inc. | | | 13,800,000 | | | | 6,700,000 | | | | — | | | | 20,500,000 | | | | 4,198 | | | | 166,665 | |
| Grafton Group PLC, units2 | | | 15,037,000 | | | | — | | | | — | | | | 15,037,000 | | | | 2,303 | | | | 148,840 | |
| | | | | | | | | | | | | | | | | | | $ | 14,247 | | | $ | 753,990 | |
| 1 | Security did not produce income during the last 12 months. |
| 2 | Valued under fair value procedures adopted by authority of the board of trustees. The total value of all such securities, including those in “Miscellaneous” and “Other securities,” was $5,264,961,000, which represented 7.34% of the net assets of the fund. This entire amount relates to certain securities trading outside the U.S. whose values were adjusted as a result of significant market movements following the close of local trading. |
| 3 | Acquired in a transaction exempt from registration under Section 4(2) of the Securities Act of 1933. May be resold in the U.S. in transactions exempt from registration, normally to qualified institutional buyers. The total value of all such securities, including those in “Other securities,” was $803,993,000, which represented 1.12% of the net assets of the fund. |
See Notes to Financial Statements
Financial statements
| Statement of assets and liabilities | | | | | | | | |
| at December 31, 2014 | | (dollars in thousands) |
| | | | | | | | | |
| Assets: | | | | | | | | |
| Investment securities, at value: | | | | | | | | |
| Unaffiliated issuers (cost: $47,105,365) | | $ | 70,858,916 | | | | | |
| Affiliated issuers (cost: $798,234) | | | 753,990 | | | $ | 71,612,906 | |
| Cash | | | | | | | 240 | |
| Receivables for: | | | | | | | | |
| Sales of investments | | | 60,362 | | | | | |
| Sales of fund’s shares | | | 165,567 | | | | | |
| Dividends | | | 114,429 | | | | 340,358 | |
| | | | | | | | 71,953,504 | |
| Liabilities: | | | | | | | | |
| Payables for: | | | | | | | | |
| Purchases of investments | | | 85,380 | | | | | |
| Repurchases of fund’s shares | | | 140,102 | | | | | |
| Investment advisory services | | | 15,028 | | | | | |
| Services provided by related parties | | | 23,573 | | | | | |
| Trustees’ deferred compensation | | | 4,525 | | | | | |
| Other | | | 1,277 | | | | 269,885 | |
| Net assets at December 31, 2014 | | | | | | $ | 71,683,619 | |
| | | | | | | | | |
| Net assets consist of: | | | | | | | | |
| Capital paid in on shares of beneficial interest | | | | | | $ | 46,937,231 | |
| Undistributed net investment income | | | | | | | 174,637 | |
| Undistributed net realized gain | | | | | | | 862,986 | |
| Net unrealized appreciation | | | | | | | 23,708,765 | |
| Net assets at December 31, 2014 | | | | | | $ | 71,683,619 | |
(dollars and shares in thousands, except per-share amounts)
Shares of beneficial interest issued and outstanding (no stated par value) —
unlimited shares authorized (1,377,623 total shares outstanding)
| | | Net assets | | | Shares outstanding | | | Net asset
value per share | |
| Class A | | $ | 43,929,265 | | | | 843,871 | | | $ | 52.06 | |
| Class B | | | 332,639 | | | | 6,403 | | | | 51.95 | |
| Class C | | | 2,440,995 | | | | 47,097 | | | | 51.83 | |
| Class F-1 | | | 4,768,483 | | | | 91,643 | | | | 52.03 | |
| Class F-2 | | | 3,920,612 | | | | 75,332 | | | | 52.04 | |
| Class 529-A | | | 1,741,823 | | | | 33,497 | | | | 52.00 | |
| Class 529-B | | | 29,215 | | | | 561 | | | | 52.05 | |
| Class 529-C | | | 445,202 | | | | 8,571 | | | | 51.95 | |
| Class 529-E | | | 72,253 | | | | 1,391 | | | | 51.96 | |
| Class 529-F-1 | | | 76,237 | | | | 1,467 | | | | 51.97 | |
| Class R-1 | | | 167,247 | | | | 3,227 | | | | 51.83 | |
| Class R-2 | | | 789,381 | | | | 15,234 | | | | 51.82 | |
| Class R-2E | | | 10 | | | | — | * | | | 52.03 | |
| Class R-3 | | | 2,627,178 | | | | 50,581 | | | | 51.94 | |
| Class R-4 | | | 2,650,492 | | | | 51,009 | | | | 51.96 | |
| Class R-5 | | | 1,979,350 | | | | 38,004 | | | | 52.08 | |
| Class R-6 | | | 5,713,237 | | | | 109,735 | | | | 52.06 | |
* Amount less than one thousand.
See Notes to Financial Statements
| Statement of operations | | | |
| for the year ended December 31, 2014 | | (dollars in thousands) | |
| | | | | | | | | |
| Investment income: | | | | | | | | |
| Income: | | | | | | | | |
| Dividends (net of non-U.S. taxes of $19,549; also includes $14,247 from affiliates) | | $ | 1,696,642 | | | | | |
| Interest | | | 3,237 | | | $ | 1,699,879 | |
| Fees and expenses*: | | | | | | | | |
| Investment advisory services | | | 170,907 | | | | | |
| Distribution services | | | 177,208 | | | | | |
| Transfer agent services | | | 70,788 | | | | | |
| Administrative services | | | 17,410 | | | | | |
| Reports to shareholders | | | 2,548 | | | | | |
| Registration statement and prospectus | | | 940 | | | | | |
| Trustees’ compensation | | | 801 | | | | | |
| Auditing and legal | | | 171 | | | | | |
| Custodian | | | 966 | | | | | |
| Other | | | 2,291 | | | | | |
| Total fees and expenses before waiver | | | 444,030 | | | | | |
| Less investment advisory services waiver | | | 2 | | | | | |
| Total fees and expenses after waiver | | | | | | | 444,028 | |
| Net investment income | | | | | | | 1,255,851 | |
| | | | | | | | | |
| Net realized gain and unrealized depreciation on investments and currency: | | | | | | | | |
| Net realized gain (loss) on: | | | | | | | | |
| Investments (includes $1,113 net gain from affiliates) | | | 5,208,941 | | | | | |
| Currency transactions | | | (6,265 | ) | | | 5,202,676 | |
| Net unrealized depreciation on: | | | | | | | | |
| Investments | | | (487,440 | ) | | | | |
| Currency translations | | | (1,646 | ) | | | (489,086 | ) |
| Net realized gain and unrealized depreciation on investments and currency | | | | | | | 4,713,590 | |
| | | | | | | | | |
| Net increase in net assets resulting from operations | | | | | | $ | 5,969,441 | |
* Additional information related to class-specific fees and expenses is included in the Notes to Financial Statements.
| Statements of changes in net assets | | | |
| | | (dollars in thousands) | |
| | | | |
| | | Year ended December 31 | |
| | | 2014 | | | 2013 | |
| Operations: | | | | | | | | |
| Net investment income | | $ | 1,255,851 | | | $ | 782,656 | |
| Net realized gain on investments and currency transactions | | | 5,202,676 | | | | 3,712,613 | |
| Net unrealized (depreciation) appreciation on investments and currency translations | | | (489,086 | ) | | | 11,837,702 | |
| Net increase in net assets resulting from operations | | | 5,969,441 | | | | 16,332,971 | |
| | | | | | | | | |
| Dividends and distributions paid to shareholders: | | | | | | | | |
| Dividends from net investment income | | | (1,225,000 | ) | | | (807,959 | ) |
| Distributions from net realized gain on investments | | | (4,617,443 | ) | | | (1,168,741 | ) |
| Total dividends and distributions paid to shareholders | | | (5,842,443 | ) | | | (1,976,700 | ) |
| | | | | | | | | |
| Net capital share transactions | | | 3,879,609 | | | | 1,312,946 | |
| | | | | | | | | |
| Total increase in net assets | | | 4,006,607 | | | | 15,669,217 | |
| | | | | | | | | |
| Net assets: | | | | | | | | |
| Beginning of year | | | 67,677,012 | | | | 52,007,795 | |
| End of year (including undistributed net investment income: $174,637 and $150,058, respectively) | | $ | 71,683,619 | | | $ | 67,677,012 | |
See Notes to Financial Statements
Notes to financial statements
1. Organization
American Funds Fundamental Investors (the “trust”) is registered under the Investment Company Act of 1940 as an open-end, diversified investment company and has initially issued one series of shares, Fundamental Investors (the “fund”). The fund seeks long-term growth of capital and income.
The fund has 17 share classes consisting of five retail share classes (Classes A, B and C, as well as two F share classes, F-1 and F-2), five 529 college savings plan share classes (Classes 529-A, 529-B, 529-C, 529-E and 529-F-1) and seven retirement plan share classes (Classes R-1, R-2, R-2E, R-3, R-4, R-5 and R-6). The 529 college savings plan share classes can be used to save for college education. The retirement plan share classes are generally offered only through eligible employer-sponsored retirement plans. The fund’s share classes are described further in the following table:
| Share class | | Initial sales
charge | | Contingent deferred sales
charge upon redemption | | Conversion feature | |
| Classes A and 529-A | | Up to 5.75% | | None (except 1% for certain redemptions within one year of purchase without an initial sales charge) | | None | |
| Classes B and 529-B* | | None | | Declines from 5% to 0% for redemptions within six years of purchase | | Classes B and 529-B convert to Classes A and 529-A, respectively, after eight years | |
| Class C | | None | | 1% for redemptions within one year of purchase | | Class C converts to Class F-1 after 10 years | |
| Class 529-C | | None | | 1% for redemptions within one year of purchase | | None | |
| Class 529-E | | None | | None | | None | |
| Classes F-1, F-2 and 529-F-1 | | None | | None | | None | |
| Classes R-1, R-2, R-2E, R-3, R-4, R-5 and R-6 | | None | | None | | None | |
* Class B and 529-B shares of the fund are not available for purchase.
On August 29, 2014, the fund made an additional retirement plan share class (Class R-2E) available for sale pursuant to an amendment to its registration statement filed with the U.S. Securities and Exchange Commission. Refer to the fund’s prospectus for more details.
Holders of all share classes have equal pro rata rights to the assets, dividends and liquidation proceeds of the fund. Each share class has identical voting rights, except for the exclusive right to vote on matters affecting only its class. Share classes have different fees and expenses (“class-specific fees and expenses”), primarily due to different arrangements for distribution, transfer agent and administrative services. Differences in class-specific fees and expenses will result in differences in net investment income and, therefore, the payment of different per-share dividends by each share class.
2. Significant accounting policies
The fund is an investment company that applies the accounting and reporting guidance issued in Topic 946 by the U.S. Financial Accounting Standards Board. The fund’s financial statements have been prepared to comply with U.S. generally accepted accounting principles (“U.S. GAAP”). These principles require the fund’s investment adviser to make estimates and assumptions that affect reported amounts and disclosures. Actual results could differ from those estimates. The fund follows the significant accounting policies described in this section, as well as the valuation policies described in the next section on valuation.
Security transactions and related investment income — Security transactions are recorded by the fund as of the date the trades are executed with brokers. Realized gains and losses from security transactions are determined based on the specific identified cost of the securities. In the event a security is purchased with a delayed payment date, the fund will segregate liquid assets sufficient to meet its payment obligations. Dividend income is recognized on the ex-dividend date and interest income is recognized on an accrual basis. Market discounts, premiums and original issue discounts on fixed-income securities are amortized daily over the expected life of the security.
Class allocations — Income, fees and expenses (other than class-specific fees and expenses) and realized and unrealized gains and losses are allocated daily among the various share classes based on their relative net assets. Class-specific fees and expenses, such as distribution, transfer agent and administrative services, are charged directly to the respective share class.
Dividends and distributions to shareholders — Dividends and distributions to shareholders are recorded on the ex-dividend date.
Currency translation — Assets and liabilities, including investment securities, denominated in currencies other than U.S. dollars are translated into U.S. dollars at the exchange rates supplied by one or more pricing vendors on the valuation date. Purchases and sales of investment securities and income and expenses are translated into U.S. dollars at the exchange rates on the dates of such transactions. The effects of changes in exchange rates on investment securities are included with the net realized gain or loss and net unrealized appreciation or depreciation on investments in the fund’s statement of operations. The realized gain or loss and unrealized appreciation or depreciation resulting from all other transactions denominated in currencies other than U.S. dollars are disclosed separately.
3. Valuation
Capital Research and Management Company (“CRMC”), the fund’s investment adviser, values the fund’s investments at fair value as defined by U.S. GAAP. The net asset value of each share class of the fund is generally determined as of approximately 4:00 p.m. New York time each day the New York Stock Exchange is open.
Methods and inputs — The fund’s investment adviser uses the following methods and inputs to establish the fair value of the fund’s assets and liabilities. Use of particular methods and inputs may vary over time based on availability and relevance as market and economic conditions evolve.
Equity securities are generally valued at the official closing price of, or the last reported sale price on, the exchange or market on which such securities are traded, as of the close of business on the day the securities are being valued or, lacking any sales, at the last available bid price. Prices for each security are taken from the principal exchange or market on which the security trades.
Fixed-income securities, including short-term securities, are generally valued at prices obtained from one or more pricing vendors. Vendors value such securities based on one or more of the inputs described in the following table. The table provides examples of inputs that are commonly relevant for valuing particular classes of fixed-income securities in which the fund is authorized to invest. However, these classifications are not exclusive, and any of the inputs may be used to value any other class of fixed-income security.
| Fixed-income class | Examples of standard inputs |
| All | Benchmark yields, transactions, bids, offers, quotations from dealers and trading systems, new issues, spreads and other relationships observed in the markets among comparable securities; and proprietary pricing models such as yield measures calculated using factors such as cash flows, financial or collateral performance and other reference data (collectively referred to as “standard inputs”) |
| Corporate bonds & notes; convertible securities | Standard inputs and underlying equity of the issuer |
| Bonds & notes of governments & government agencies | Standard inputs and interest rate volatilities |
| Mortgage-backed; asset-backed obligations | Standard inputs and cash flows, prepayment information, default rates, delinquency and loss assumptions, collateral characteristics, credit enhancements and specific deal information |
When the fund’s investment adviser deems it appropriate to do so (such as when vendor prices are unavailable or deemed to be not representative), fixed-income securities will be valued in good faith at the mean quoted bid and ask prices that are reasonably and timely available (or bid prices, if ask prices are not available) or at prices for securities of comparable maturity, quality and type.
Securities with both fixed-income and equity characteristics, or equity securities traded principally among fixed-income dealers, are generally valued in the manner described above for either equity or fixed-income securities, depending on which method is deemed most appropriate by the fund’s investment adviser.
Securities and other assets for which representative market quotations are not readily available or are considered unreliable by the fund’s investment adviser are fair valued as determined in good faith under fair valuation guidelines adopted by authority of the fund’s board of trustees as further described. The investment adviser follows fair valuation guidelines, consistent with U.S. Securities and Exchange Commission rules and guidance, to consider relevant principles and factors when making fair value determinations. The investment
adviser considers relevant indications of value that are reasonably and timely available to it in determining the fair value to be assigned to a particular security, such as the type and cost of the security; contractual or legal restrictions on resale of the security; relevant financial or business developments of the issuer; actively traded similar or related securities; conversion or exchange rights on the security; related corporate actions; significant events occurring after the close of trading in the security; and changes in overall market conditions. In addition, the closing prices of equity securities that trade in markets outside U.S. time zones may be adjusted to reflect significant events that occur after the close of local trading but before the net asset value of each share class of the fund is determined. Fair valuations and valuations of investments that are not actively trading involve judgment and may differ materially from valuations that would have been used had greater market activity occurred.
Processes and structure — The fund’s board of trustees has delegated authority to the fund’s investment adviser to make fair value determinations, subject to board oversight. The investment adviser has established a Joint Fair Valuation Committee (the “Fair Valuation Committee”) to administer, implement and oversee the fair valuation process, and to make fair value decisions. The Fair Valuation Committee regularly reviews its own fair value decisions, as well as decisions made under its standing instructions to the investment adviser’s valuation teams. The Fair Valuation Committee reviews changes in fair value measurements from period to period and may, as deemed appropriate, update the fair valuation guidelines to better reflect the results of back testing and address new or evolving issues. The Fair Valuation Committee reports any changes to the fair valuation guidelines to the board of trustees with supplemental information to support the changes. The fund’s board and audit committee also regularly review reports that describe fair value determinations and methods.
The fund’s investment adviser has also established a Fixed-Income Pricing Review Group to administer and oversee the fixed-income valuation process, including the use of fixed-income pricing vendors. This group regularly reviews pricing vendor information and market data. Pricing decisions, processes and controls over security valuation are also subject to additional internal reviews, including an annual control self-evaluation program facilitated by the investment adviser’s compliance group.
Classifications — The fund’s investment adviser classifies the fund’s assets and liabilities into three levels based on the inputs used to value the assets or liabilities. Level 1 values are based on quoted prices in active markets for identical securities. Level 2 values are based on significant observable market inputs, such as quoted prices for similar securities and quoted prices in inactive markets. Certain securities trading outside the U.S. may transfer between Level 1 and Level 2 due to valuation adjustments resulting from significant market movements following the close of local trading. Level 3 values are based on significant unobservable inputs that reflect the investment adviser’s determination of assumptions that market participants might reasonably use in valuing the securities. The valuation levels are not necessarily an indication of the risk or liquidity associated with the underlying investment. For example, U.S. government securities are reflected as Level 2 because the inputs used to determine fair value may not always be quoted prices in an active market. The following table presents the fund’s valuation levels as of December 31, 2014 (dollars in thousands):
| | | Investment securities | |
| | | Level 1 | | | Level 2* | | | Level 3 | | | Total | |
| Assets: | | | | | | | | | | | | | | | | |
| Common stocks: | | | | | | | | | | | | | | | | |
| Financials | | $ | 10,955,161 | | | $ | 910,440 | | | $ | — | | | $ | 11,865,601 | |
| Information technology | | | 10,595,202 | | | | 1,034,034 | | | | — | | | | 11,629,236 | |
| Consumer discretionary | | | 10,962,263 | | | | 456,854 | | | | — | | | | 11,419,117 | |
| Industrials | | | 8,650,655 | | | | 919,209 | | | | — | | | | 9,569,864 | |
| Health care | | | 7,013,593 | | | | 484,309 | | | | — | | | | 7,497,902 | |
| Consumer staples | | | 4,941,293 | | | | 491,182 | | | | — | | | | 5,432,475 | |
| Energy | | | 5,138,360 | | | | 105,820 | | | | — | | | | 5,244,180 | |
| Materials | | | 2,736,272 | | | | 174,904 | | | | — | | | | 2,911,176 | |
| Other | | | 525,924 | | | | 624,712 | | | | — | | | | 1,150,636 | |
| Miscellaneous | | | 1,577,066 | | | | 63,497 | | | | — | | | | 1,640,563 | |
| Short-term securities | | | — | | | | 3,252,156 | | | | — | | | | 3,252,156 | |
| Total | | $ | 63,095,789 | | | $ | 8,517,117 | | | $ | — | | | $ | 71,612,906 | |
| * | Securities with a value of $4,018,553,000, which represented 5.61% of the net assets of the fund, transferred from Level 1 to Level 2 since the prior fiscal year-end, primarily due to significant market movements following the close of local trading. |
4. Risk factors
Investing in the fund may involve certain risks including, but not limited to, those described below.
Market conditions — The prices of, and the income generated by, the common stocks and other securities held by the fund may decline – sometimes rapidly or unpredictably – due to various factors, including events or conditions affecting the general economy or particular industries; overall market changes; local, regional or global political, social or economic instability; governmental or governmental agency responses to economic conditions; and currency exchange, interest rate and commodity price fluctuations.
Issuer risks — The prices of, and the income generated by, securities held by the fund may decline in response to various factors directly related to the issuers of such securities, including reduced demand for an issuer’s goods or services, poor management performance and strategic initiatives such as mergers, acquisitions or dispositions and the market response to any such initiatives.
Investing in growth-oriented stocks — Growth-oriented common stocks and other equity-type securities (such as preferred stocks, convertible preferred stocks and convertible bonds) may involve larger price swings and greater potential for loss than other types of investments.
Investing in income-oriented stocks — Income provided by the fund may be reduced by changes in the dividend policies of, and the capital resources available for dividend payments at, the companies in which the fund invests.
Investing outside the U.S. — Securities of issuers domiciled outside the U.S., or with significant operations or revenues outside the U.S., may lose value because of adverse political, social, economic or market developments (including social instability, regional conflicts, terrorism and war) in the countries or regions in which the issuers operate or generate revenue. These securities may also lose value due to changes in foreign currency exchange rates against the U.S. dollar and/or currencies of other countries. Issuers of these securities may be more susceptible to actions of foreign governments such as the imposition of price controls or punitive taxes that could adversely impact revenues. Securities markets in certain countries may be more volatile and/or less liquid than those in the U.S. Investments outside the U.S. may also be subject to different accounting practices and different regulatory, legal and reporting standards, and may be more difficult to value, than those in the U.S. In addition, the value of investments outside the U.S. may be reduced by foreign taxes, including foreign withholding taxes on interest and dividends. Further, there may be increased risks of delayed settlement of securities purchased or sold by the fund. The risks of investing outside the U.S. may be heightened in connection with investments in emerging markets.
Management — The investment adviser to the fund actively manages the fund’s investments. Consequently, the fund is subject to the risk that the methods and analyses employed by the investment adviser in this process may not produce the desired results. This could cause the fund to lose value or its investment results to lag relevant benchmarks or other funds with similar objectives.
5. Taxation and distributions
Federal income taxation — The fund complies with the requirements under Subchapter M of the Internal Revenue Code applicable to mutual funds and intends to distribute substantially all of its net taxable income and net capital gains each year. The fund is not subject to income taxes to the extent such distributions are made. Therefore, no federal income tax provision is required.
As of and during the period ended December 31, 2014, the fund did not have a liability for any unrecognized tax benefits. The fund recognizes interest and penalties, if any, related to unrecognized tax benefits as income tax expense in the statement of operations. During the period, the fund did not incur any interest or penalties.
The fund is not subject to examination by U.S. federal tax authorities for tax years before 2011, by state tax authorities for tax years before 2010 and by tax authorities outside the U.S. for tax years before 2007.
Non-U.S. taxation — Dividend income is recorded net of non-U.S. taxes paid. Gains realized by the fund on the sale of securities in certain countries are subject to non-U.S. taxes. The fund records a liability based on unrealized gains to provide for potential non-U.S. taxes payable upon the sale of these securities.
Distributions — Distributions paid to shareholders are based on net investment income and net realized gains determined on a tax basis, which may differ from net investment income and net realized gains for financial reporting purposes. These differences are due primarily to different treatment for items such as currency gains and losses; short-term capital gains and losses; capital losses related to sales of
certain securities within 30 days of purchase; and deferred expenses. The fiscal year in which amounts are distributed may differ from the year in which the net investment income and net realized gains are recorded by the fund for financial reporting purposes. The fund may also designate a portion of the amount paid to redeeming shareholders as a distribution for tax purposes.
During the year ended December 31, 2014, the fund reclassified $6,200,000 from undistributed net investment income to undistributed net realized gain, $72,000 from undistributed net investment income to capital paid in on shares of beneficial interest and $387,583,000 from undistributed net realized gain to capital paid in on shares of beneficial interest to align financial reporting with tax reporting.
As of December 31, 2014, the tax-basis components of distributable earnings, unrealized appreciation (depreciation) and cost of investment securities were as follows (dollars in thousands):
| Undistributed ordinary income | $ | 209,303 | |
| Undistributed long-term capital gains | | 837,866 | |
| Gross unrealized appreciation on investment securities | | 24,480,646 | |
| Gross unrealized depreciation on investment securities | | (776,360 | ) |
| Net unrealized appreciation on investment securities | | 23,704,286 | |
| Cost of investment securities | | 47,908,620 | |
The tax character of distributions paid to shareholders was as follows (dollars in thousands):
| | | Year ended December 31, 2014 | | | Year ended December 31, 2013 | |
| Share class | | Ordinary
income | | | Long-term
capital gains | | | Total
distributions
paid | | | Ordinary
income | | | Long-term
capital gains | | | Total
distributions paid | |
| Class A | | $ | 764,791 | | | $ | 2,831,568 | | | $ | 3,596,359 | | | $ | 513,793 | | | $ | 720,627 | | | $ | 1,234,420 | |
| Class B | | | 3,340 | | | | 22,585 | | | | 25,925 | | | | 2,649 | | | | 8,096 | | | | 10,745 | |
| Class C | | | 23,666 | | | | 157,991 | | | | 181,657 | | | | 12,323 | | | | 40,660 | | | | 52,983 | |
| Class F-1 | | | 84,501 | | | | 315,661 | | | | 400,162 | | | | 63,656 | | | | 91,663 | | | | 155,319 | |
| Class F-2 | | | 69,169 | | | | 243,008 | | | | 312,177 | | | | 31,514 | | | | 42,802 | | | | 74,316 | |
| Class 529-A | | | 28,473 | | | | 111,375 | | | | 139,848 | | | | 18,052 | | | | 27,333 | | | | 45,385 | |
| Class 529-B | | | 248 | | | | 1,972 | | | | 2,220 | | | | 178 | | | | 703 | | | | 881 | |
| Class 529-C | | | 3,983 | | | | 28,643 | | | | 32,626 | | | | 1,902 | | | | 7,181 | | | | 9,083 | |
| Class 529-E | | | 1,021 | | | | 4,643 | | | | 5,664 | | | | 623 | | | | 1,153 | | | | 1,776 | |
| Class 529-F-1 | | | 1,388 | | | | 4,820 | | | | 6,208 | | | | 877 | | | | 1,146 | | | | 2,023 | |
| Class R-1 | | | 1,646 | | | | 10,954 | | | | 12,600 | | | | 939 | | | | 2,988 | | | | 3,927 | |
| Class R-2 | | | 7,959 | | | | 51,351 | | | | 59,310 | | | | 4,611 | | | | 13,460 | | | | 18,071 | |
| Class R-2E* | | | — | † | | | 1 | | | | 1 | | | | | | | | | | | | | |
| Class R-3 | | | 37,696 | | | | 172,538 | | | | 210,234 | | | | 27,448 | | | | 48,796 | | | | 76,244 | |
| Class R-4 | | | 46,617 | | | | 175,597 | | | | 222,214 | | | | 35,636 | | | | 50,408 | | | | 86,044 | |
| Class R-5 | | | 39,475 | | | | 128,126 | | | | 167,601 | | | | 28,959 | | | | 34,053 | | | | 63,012 | |
| Class R-6 | | | 111,027 | | | | 356,610 | | | | 467,637 | | | | 64,799 | | | | 77,672 | | | | 142,471 | |
| Total | | $ | 1,225,000 | | | $ | 4,617,443 | | | $ | 5,842,443 | | | $ | 807,959 | | | $ | 1,168,741 | | | $ | 1,976,700 | |
| * | Class R-2E shares were offered beginning August 29, 2014. |
| † | Amount less than one thousand. |
6. Fees and transactions with related parties
CRMC, the fund’s investment adviser, is the parent company of American Funds Distributors,® Inc. (“AFD”), the principal underwriter of the fund’s shares, and American Funds Service Company® (“AFS”), the fund’s transfer agent. CRMC, AFD and AFS are considered related parties to the fund.
Investment advisory services — The fund has an investment advisory and service agreement with CRMC that provides for monthly fees accrued daily. At the beginning of the year, these fees were based on a series of decreasing annual rates beginning with 0.390% on the first $1 billion of daily net assets and decreasing to 0.232% on such assets in excess of $55 billion.
On September 16, 2014, the fund’s board of trustees approved an amended investment advisory and service agreement effective December 1, 2014, decreasing the annual rates on daily net assets in excess of $71 billion to 0.230%. Prior to December 1, 2014, CRMC voluntarily reduced investment advisory services fees based upon the approved rates and asset levels contained in the amended
agreement. For the year ended December 31, 2014, total investment advisory services fees waived by CRMC were $2,000. As a result, the fee of $170,907,000 shown on the statement of operations was reduced to $170,905,000, both of which were equivalent to an annualized rate of 0.247% of average daily net assets.
Class-specific fees and expenses — Expenses that are specific to individual share classes are accrued directly to the respective share class. The principal class-specific fees and expenses are further described below:
Distribution services — The fund has plans of distribution for all share classes, except Class F-2, R-5 and R-6 shares. Under the plans, the board of trustees approves certain categories of expenses that are used to finance activities primarily intended to sell fund shares and service existing accounts. The plans provide for payments, based on an annualized percentage of average daily net assets, ranging from 0.25% to 1.00% as noted below. In some cases, the board of trustees has limited the amounts that may be paid to less than the maximum allowed by the plans. All share classes with a plan may use up to 0.25% of average daily net assets to pay service fees, or to compensate AFD for paying service fees, to firms that have entered into agreements with AFD to provide certain shareholder services. The remaining amounts available to be paid under each plan are paid to dealers to compensate them for their sales activities.
For Class A and 529-A shares, distribution-related expenses include the reimbursement of dealer and wholesaler commissions paid by AFD for certain shares sold without a sales charge. These share classes reimburse AFD for amounts billed within the prior 15 months but only to the extent that the overall annual expense limit of 0.25% is not exceeded. As of December 31, 2014, there were no unreimbursed expenses subject to reimbursement for Class A or 529-A shares.
| | Share class | | Currently approved limits | | Plan limits | |
| | Class A | | | 0.25 | % | | | 0.25 | % | |
| | Class 529-A | | | 0.25 | | | | 0.50 | | |
| | Classes B and 529-B | | | 1.00 | | | | 1.00 | | |
| | Classes C, 529-C and R-1 | | | 1.00 | | | | 1.00 | | |
| | Class R-2 | | | 0.75 | | | | 1.00 | | |
| | Class R-2E | | | 0.60 | | | | 0.85 | | |
| | Classes 529-E and R-3 | | | 0.50 | | | | 0.75 | | |
| | Classes F-1, 529-F-1 and R-4 | | | 0.25 | | | | 0.50 | | |
Transfer agent services — The fund has a shareholder services agreement with AFS under which the fund compensates AFS for providing transfer agent services to each of the fund’s share classes. These services include recordkeeping, shareholder communications and transaction processing. In addition, the fund reimburses AFS for amounts paid to third parties for performing transfer agent services on behalf of fund shareholders.
Administrative services — The fund has an administrative services agreement with CRMC under which the fund compensates CRMC for providing administrative services to Class A, C, F, 529 and R shares. These services include, but are not limited to, coordinating, monitoring, assisting and overseeing third parties that provide services to fund shareholders. Under the agreement, Class A shares pay an annual fee of 0.01% and Class C, F, 529 and R shares pay an annual fee of 0.05% of their respective average daily net assets.
529 plan services — Each 529 share class is subject to service fees to compensate the Virginia College Savings Plan (“Virginia529”) for its oversight and administration of the 529 college savings plan. During the period January 1, 2014, to March 31, 2014, the quarterly fee was based on a series of decreasing annual rates beginning with 0.10% on the first $30 billion of the net assets invested in Class 529 shares of the American Funds and decreasing to 0.06% on such assets between $120 billion and $150 billion. Effective April 1, 2014, the quarterly fee was amended to provide for reduced annual rates of 0.07%, 0.06% and 0.05% over $30 billion, $50 billion and $70 billion, respectively, of the net assets invested in Class 529 shares of the American Funds. The fee for any given calendar quarter is accrued and calculated on the basis of the average net assets of Class 529 shares of the American Funds for the last month of the prior calendar quarter. The fee is included in other expenses in the fund’s statement of operations. Virginia529 is not considered a related party to the fund.
For the year ended December 31, 2014, class-specific expenses under the agreements were as follows (dollars in thousands):
| | Share class | | Distribution
services | | Transfer agent
services | | Administrative
services | | 529 plan
services |
| | Class A | | $100,324 | | $46,477 | | $4,257 | | Not applicable |
| | Class B | | 3,917 | | 443 | | Not applicable | | Not applicable |
| | Class C | | 23,732 | | 2,574 | | 1,189 | | Not applicable |
| | Class F-1 | | 12,936 | | 5,733 | | 2,596 | | Not applicable |
| | Class F-2 | | Not applicable | | 2,841 | | 1,509 | | Not applicable |
| | Class 529-A | | 3,585 | | 1,460 | | 827 | | $1,507 |
| | Class 529-B | | 342 | | 36 | | 17 | | 31 |
| | Class 529-C | | 4,252 | | 404 | | 214 | | 390 |
| | Class 529-E | | 345 | | 34 | | 35 | | 63 |
| | Class 529-F-1 | | — | | 63 | | 35 | | 65 |
| | Class R-1 | | 1,685 | | 180 | | 84 | | Not applicable |
| | Class R-2 | | 5,801 | | 2,533 | | 388 | | Not applicable |
| | Class R-2E* | | — | | — | † | — | † | Not applicable |
| | Class R-3 | | 13,395 | | 4,120 | | 1,342 | | Not applicable |
| | Class R-4 | | 6,894 | | 2,897 | | 1,382 | | Not applicable |
| | Class R-5 | | Not applicable | | 974 | | 972 | | Not applicable |
| | Class R-6 | | Not applicable | | 19 | | 2,563 | | Not applicable |
| | Total class-specific expenses | | $177,208 | | $70,788 | | $17,410 | | $2,056 |
| | * | Class R-2E shares were offered beginning August 29, 2014. |
| | † | Amount less than one thousand. |
Trustees’ deferred compensation — Trustees who are unaffiliated with CRMC may elect to defer the cash payment of part or all of their compensation. These deferred amounts, which remain as liabilities of the fund, are treated as if invested in shares of the fund or other American Funds. These amounts represent general, unsecured liabilities of the fund and vary according to the total returns of the selected funds. Trustees’ compensation of $801,000 in the fund’s statement of operations includes $368,000 in current fees (either paid in cash or deferred) and a net increase of $433,000 in the value of the deferred amounts.
Affiliated officers and trustees — Officers and certain trustees of the fund are or may be considered to be affiliated with CRMC, AFD and AFS. No affiliated officers or trustees received any compensation directly from the fund.
7. Capital share transactions
Capital share transactions in the fund were as follows (dollars and shares in thousands):
| | | Sales1 | | | Reinvestments of
dividends and
distributions | | | Repurchases1 | | | Net increase
(decrease) | |
| Share class | | Amount | | | Shares | | | | Amount | | | Shares | | | Amount | | | Shares | | | Amount | | | Shares | |
| | | | | | | | | | | | | | | | | | | | | | | | | | | | | | | | | | |
| Year ended December 31, 2014 | | |
| | | | | | | | | | | | | | | | | | | | | | | | | | | | | | | | | | |
| Class A | | $ | 3,350,182 | | | | 63,503 | | | | $ | 3,529,145 | | | | 67,435 | | | $ | (4,850,703 | ) | | | (91,700 | ) | | $ | 2,028,624 | | | | 39,238 | |
| Class B | | | 4,981 | | | | 95 | | | | | 25,761 | | | | 494 | | | | (168,496 | ) | | | (3,202 | ) | | | (137,754 | ) | | | (2,613 | ) |
| Class C | | | 313,800 | | | | 5,979 | | | | | 179,147 | | | | 3,441 | | | | (408,310 | ) | | | (7,765 | ) | | | 84,637 | | | | 1,655 | |
| Class F-1 | | | 791,791 | | | | 15,055 | | | | | 397,300 | | | | 7,599 | | | | (1,779,319 | ) | | | (33,155 | ) | | | (590,228 | ) | | | (10,501 | ) |
| Class F-2 | | | 1,773,938 | | | | 32,939 | | | | | 297,943 | | | | 5,689 | | | | (589,626 | ) | | | (11,124 | ) | | | 1,482,255 | | | | 27,504 | |
| Class 529-A | | | 179,223 | | | | 3,397 | | | | | 139,822 | | | | 2,675 | | | | (169,583 | ) | | | (3,198 | ) | | | 149,462 | | | | 2,874 | |
| Class 529-B | | | 826 | | | | 16 | | | | | 2,219 | | | | 42 | | | | (14,745 | ) | | | (279 | ) | | | (11,700 | ) | | | (221 | ) |
| Class 529-C | | | 51,160 | | | | 971 | | | | | 32,617 | | | | 625 | | | | (55,441 | ) | | | (1,048 | ) | | | 28,336 | | | | 548 | |
| Class 529-E | | | 7,578 | | | | 144 | | | | | 5,664 | | | | 109 | | | | (8,144 | ) | | | (154 | ) | | | 5,098 | | | | 99 | |
| Class 529-F-1 | | | 15,714 | | | | 296 | | | | | 6,198 | | | | 119 | | | | (12,887 | ) | | | (245 | ) | | | 9,025 | | | | 170 | |
| Class R-1 | | | 25,552 | | | | 485 | | | | | 12,581 | | | | 242 | | | | (42,697 | ) | | | (808 | ) | | | (4,564 | ) | | | (81 | ) |
| Class R-2 | | | 151,803 | | | | 2,890 | | | | | 59,273 | | | | 1,139 | | | | (199,925 | ) | | | (3,800 | ) | | | 11,151 | | | | 229 | |
| Class R-2E2 | | | 10 | | | | — | 3 | | | | — | | | | — | | | | — | | | | — | | | | 10 | | | | — | 3 |
| Class R-3 | | | 435,871 | | | | 8,287 | | | | | 210,119 | | | | 4,026 | | | | (823,455 | ) | | | (15,617 | ) | | | (177,465 | ) | | | (3,304 | ) |
| Class R-4 | | | 483,181 | | | | 9,170 | | | | | 222,203 | | | | 4,256 | | | | (907,827 | ) | | | (17,183 | ) | | | (202,443 | ) | | | (3,757 | ) |
| Class R-5 | | | 410,325 | | | | 7,784 | | | | | 167,445 | | | | 3,198 | | | | (565,911 | ) | | | (10,759 | ) | | | 11,859 | | | | 223 | |
| Class R-6 | | | 1,288,984 | | | | 24,539 | | | | | 467,630 | | | | 8,928 | | | | (563,308 | ) | | | (10,617 | ) | | | 1,193,306 | | | | 22,850 | |
| Total net increase (decrease) | | $ | 9,284,919 | | | | 175,550 | | | | $ | 5,755,067 | | | | 110,017 | | | $ | (11,160,377 | ) | | | (210,654 | ) | | $ | 3,879,609 | | | | 74,913 | |
| | | Sales1 | | | Reinvestments of
dividends and
distributions | | | Repurchases1 | | | Net increase (decrease) | |
| Share class | | Amount | | | Shares | | | | Amount | | | Shares | | | Amount | | | Shares | | | Amount | | | Shares | |
| | | | | | | | | | | | | | | | | | | | | | | | | | | | | | | | | | |
| Year ended December 31, 2013 | |
| | | | | | | | | | | | | | | | | | | | | | | | | | | | | | | | | | |
| Class A | | $ | 3,448,489 | | | | 74,176 | | | | $ | 1,210,350 | | | | 24,454 | | | $ | (4,317,349 | ) | | | (92,697 | ) | | $ | 341,490 | | | | 5,933 | |
| Class B | | | 11,393 | | | | 245 | | | | | 10,666 | | | | 213 | | | | (132,485 | ) | | | (2,869 | ) | | | (110,426 | ) | | | (2,411 | ) |
| Class C | | | 313,424 | | | | 6,762 | | | | | 52,176 | | | | 1,042 | | | | (368,787 | ) | | | (7,951 | ) | | | (3,187 | ) | | | (147 | ) |
| Class F-1 | | | 924,486 | | | | 19,827 | | | | | 154,281 | | | | 3,119 | | | | (1,468,666 | ) | | | (31,298 | ) | | | (389,899 | ) | | | (8,352 | ) |
| Class F-2 | | | 839,064 | | | | 17,327 | | | | | 69,565 | | | | 1,404 | | | | (382,030 | ) | | | (8,207 | ) | | | 526,599 | | | | 10,524 | |
| Class 529-A | | | 177,318 | | | | 3,813 | | | | | 45,378 | | | | 916 | | | | (146,630 | ) | | | (3,152 | ) | | | 76,066 | | | | 1,577 | |
| Class 529-B | | | 1,100 | | | | 24 | | | | | 880 | | | | 17 | | | | (12,335 | ) | | | (267 | ) | | | (10,355 | ) | | | (226 | ) |
| Class 529-C | | | 48,976 | | | | 1,051 | | | | | 9,079 | | | | 181 | | | | (47,863 | ) | | | (1,030 | ) | | | 10,192 | | | | 202 | |
| Class 529-E | | | 8,384 | | | | 179 | | | | | 1,776 | | | | 35 | | | | (7,139 | ) | | | (152 | ) | | | 3,021 | | | | 62 | |
| Class 529-F-1 | | | 13,441 | | | | 286 | | | | | 2,019 | | | | 41 | | | | (10,249 | ) | | | (217 | ) | | | 5,211 | | | | 110 | |
| Class R-1 | | | 28,443 | | | | 616 | | | | | 3,921 | | | | 78 | | | | (44,951 | ) | | | (978 | ) | | | (12,587 | ) | | | (284 | ) |
| Class R-2 | | | 161,540 | | | | 3,505 | | | | | 18,065 | | | | 362 | | | | (201,324 | ) | | | (4,358 | ) | | | (21,719 | ) | | | (491 | ) |
| Class R-3 | | | 522,597 | | | | 11,370 | | | | | 76,219 | | | | 1,537 | | | | (801,668 | ) | | | (17,177 | ) | | | (202,852 | ) | | | (4,270 | ) |
| Class R-4 | | | 499,256 | | | | 10,776 | | | | | 86,040 | | | | 1,742 | | | | (768,659 | ) | | | (16,467 | ) | | | (183,363 | ) | | | (3,949 | ) |
| Class R-5 | | | 367,587 | | | | 7,932 | | | | | 62,957 | | | | 1,277 | | | | (399,954 | ) | | | (8,586 | ) | | | 30,590 | | | | 623 | |
| Class R-6 | | | 1,559,432 | | | | 34,497 | | | | | 142,471 | | | | 2,886 | | | | (447,738 | ) | | | (9,581 | ) | | | 1,254,165 | | | | 27,802 | |
| Total net increase (decrease) | | $ | 8,924,930 | | | | 192,386 | | | | $ | 1,945,843 | | | | 39,304 | | | $ | (9,557,827 | ) | | | (204,987 | ) | | $ | 1,312,946 | | | | 26,703 | |
| 1 | Includes exchanges between share classes of the fund. |
| 2 | Class R-2E shares were offered beginning August 29, 2014. |
| 3 | Amount less than one thousand. |
8. Investment transactions
The fund made purchases and sales of investment securities, excluding short-term securities and U.S. government obligations, if any, of $19,060,026,000 and $20,738,363,000, respectively, during the year ended December 31, 2014.
Financial highlights
| | | | | | Income (loss) from | | | | | | | | | | | | | | | | | | | | | | | | | |
| | | | | | investment operations1 | | | Dividends and distributions | | | | | | | | | | | | | | | | |
| | | Net asset
value,
beginning
of period | | | Net
investment
income
(loss)2,3 | | | Net gains
(losses) on
securities
(both
realized and
unrealized) | | | Total from
investment
operations | | | Dividends
(from net
investment
income) | | | Distributions
(from capital
gains) | | | Total
dividends
and
distributions | | | Net asset
value,
end
of period | | | Total
return4,5 | | | Net assets,
end of period
(in millions) | | | Ratio of
expenses to
average
net assets | | | Ratio of
net income
(loss) to
average
net assets2,3 | |
| Class A: | | | | | | | | | | | | | | | | | | | | | | | | | | | | | | | | | | | | | | | | | | | | | | | | |
| Year ended 12/31/2014 | | $ | 51.97 | | | $ | .98 | | | $ | 3.63 | | | $ | 4.61 | | | $ | (.96 | ) | | $ | (3.56 | ) | | $ | (4.52 | ) | | $ | 52.06 | | | | 8.96 | % | | $ | 43,929 | | | | .61 | % | | | 1.85 | % |
| Year ended 12/31/2013 | | | 40.78 | | | | .63 | | | | 12.13 | | | | 12.76 | | | | (.65 | ) | | | (.92 | ) | | | (1.57 | ) | | | 51.97 | | | | 31.49 | | | | 41,820 | | | | .63 | | | | 1.35 | |
| Year ended 12/31/2012 | | | 35.39 | | | | .64 | | | | 5.40 | | | | 6.04 | | | | (.65 | ) | | | — | | | | (.65 | ) | | | 40.78 | | | | 17.14 | | | | 32,568 | | | | .65 | | | | 1.66 | |
| Year ended 12/31/2011 | | | 36.70 | | | | .60 | | | | (1.29 | ) | | | (.69 | ) | | | (.62 | ) | | | — | | | | (.62 | ) | | | 35.39 | | | | (1.89 | ) | | | 30,176 | | | | .63 | | | | 1.62 | |
| Year ended 12/31/2010 | | | 32.73 | | | | .59 | | | | 3.95 | | | | 4.54 | | | | (.57 | ) | | | — | | | | (.57 | ) | | | 36.70 | | | | 14.05 | | | | 33,089 | | | | .64 | | | | 1.78 | |
| Class B: | | | | | | | | | | | | | | | | | | | | | | | | | | | | | | | | | | | | | | | | | | | | | | | | |
| Year ended 12/31/2014 | | | 51.86 | | | | .61 | | | | 3.57 | | | | 4.18 | | | | (.53 | ) | | | (3.56 | ) | | | (4.09 | ) | | | 51.95 | | | | 8.13 | | | | 333 | | | | 1.37 | | | | 1.16 | |
| Year ended 12/31/2013 | | | 40.68 | | | | .27 | | | | 12.11 | | | | 12.38 | | | | (.28 | ) | | | (.92 | ) | | | (1.20 | ) | | | 51.86 | | | | 30.53 | | | | 468 | | | | 1.39 | | | | .59 | |
| Year ended 12/31/2012 | | | 35.30 | | | | .34 | | | | 5.39 | | | | 5.73 | | | | (.35 | ) | | | — | | | | (.35 | ) | | | 40.68 | | | | 16.25 | | | | 465 | | | | 1.41 | | | | .89 | |
| Year ended 12/31/2011 | | | 36.60 | | | | .31 | | | | (1.28 | ) | | | (.97 | ) | | | (.33 | ) | | | — | | | | (.33 | ) | | | 35.30 | | | | (2.64 | ) | | | 545 | | | | 1.40 | | | | .85 | |
| Year ended 12/31/2010 | | | 32.64 | | | | .33 | | | | 3.94 | | | | 4.27 | | | | (.31 | ) | | | — | | | | (.31 | ) | | | 36.60 | | | | 13.18 | | | | 746 | | | | 1.41 | | | | 1.01 | |
| Class C: | | | | | | | | | | | | | | | | | | | | | | | | | | | | | | | | | | | | | | | | | | | | | | | | |
| Year ended 12/31/2014 | | | 51.77 | | | | .55 | | | | 3.60 | | | | 4.15 | | | | (.53 | ) | | | (3.56 | ) | | | (4.09 | ) | | | 51.83 | | | | 8.08 | | | | 2,441 | | | | 1.41 | | | | 1.05 | |
| Year ended 12/31/2013 | | | 40.63 | | | | .25 | | | | 12.09 | | | | 12.34 | | | | (.28 | ) | | | (.92 | ) | | | (1.20 | ) | | | 51.77 | | | | 30.44 | | | | 2,352 | | | | 1.43 | | | | .54 | |
| Year ended 12/31/2012 | | | 35.26 | | | | .33 | | | | 5.38 | | | | 5.71 | | | | (.34 | ) | | | — | | | | (.34 | ) | | | 40.63 | | | | 16.21 | | | | 1,852 | | | | 1.45 | | | | .86 | |
| Year ended 12/31/2011 | | | 36.56 | | | | .30 | | | | (1.28 | ) | | | (.98 | ) | | | (.32 | ) | | | — | | | | (.32 | ) | | | 35.26 | | | | (2.67 | ) | | | 1,804 | | | | 1.44 | | | | .82 | |
| Year ended 12/31/2010 | | | 32.61 | | | | .32 | | | | 3.94 | | | | 4.26 | | | | (.31 | ) | | | — | | | | (.31 | ) | | | 36.56 | | | | 13.13 | | | | 2,081 | | | | 1.44 | | | | .98 | |
| Class F-1: | | | | | | | | | | | | | | | | | | | | | | | | | | | | | | | | | | | | | | | | | | | | | | | | |
| Year ended 12/31/2014 | | | 51.95 | | | | .96 | | | | 3.60 | | | | 4.56 | | | | (.92 | ) | | | (3.56 | ) | | | (4.48 | ) | | | 52.03 | | | | 8.87 | | | | 4,769 | | | | .66 | | | | 1.81 | |
| Year ended 12/31/2013 | | | 40.76 | | | | .59 | | | | 12.14 | | | | 12.73 | | | | (.62 | ) | | | (.92 | ) | | | (1.54 | ) | | | 51.95 | | | | 31.42 | | | | 5,306 | | | | .70 | | | | 1.27 | |
| Year ended 12/31/2012 | | | 35.37 | | | | .64 | | | | 5.39 | | | | 6.03 | | | | (.64 | ) | | | — | | | | (.64 | ) | | | 40.76 | | | | 17.12 | | | | 4,503 | | | | .66 | | | | 1.65 | |
| Year ended 12/31/2011 | | | 36.68 | | | | .59 | | | | (1.29 | ) | | | (.70 | ) | | | (.61 | ) | | | — | | | | (.61 | ) | | | 35.37 | | | | (1.92 | ) | | | 4,285 | | | | .67 | | | | 1.60 | |
| Year ended 12/31/2010 | | | 32.72 | | | | .59 | | | | 3.93 | | | | 4.52 | | | | (.56 | ) | | | — | | | | (.56 | ) | | | 36.68 | | | | 14.01 | | | | 4,330 | | | | .66 | | | | 1.77 | |
| Class F-2: | | | | | | | | | | | | | | | | | | | | | | | | | | | | | | | | | | | | | | | | | | | | | | | | |
| Year ended 12/31/2014 | | | 51.96 | | | | 1.06 | | | | 3.66 | | | | 4.72 | | | | (1.08 | ) | | | (3.56 | ) | | | (4.64 | ) | | | 52.04 | | | | 9.17 | | | | 3,921 | | | | .40 | | | | 1.99 | |
| Year ended 12/31/2013 | | | 40.77 | | | | .74 | | | | 12.13 | | | | 12.87 | | | | (.76 | ) | | | (.92 | ) | | | (1.68 | ) | | | 51.96 | | | | 31.80 | | | | 2,485 | | | | .41 | | | | 1.58 | |
| Year ended 12/31/2012 | | | 35.39 | | | | .76 | | | | 5.37 | | | | 6.13 | | | | (.75 | ) | | | — | | | | (.75 | ) | | | 40.77 | | | | 17.39 | | | | 1,521 | | | | .41 | | | | 1.96 | |
| Year ended 12/31/2011 | | | 36.70 | | | | .68 | | | | (1.29 | ) | | | (.61 | ) | | | (.70 | ) | | | — | | | | (.70 | ) | | | 35.39 | | | | (1.67 | ) | | | 915 | | | | .42 | | | | 1.85 | |
| Year ended 12/31/2010 | | | 32.73 | | | | .67 | | | | 3.95 | | | | 4.62 | | | | (.65 | ) | | | — | | | | (.65 | ) | | | 36.70 | | | | 14.32 | | | | 888 | | | | .40 | | | | 2.03 | |
| Class 529-A: | | | | | | | | | | | | | | | | | | | | | | | | | | | | | | | | | | | | | | | | | | | | | | | | |
| Year ended 12/31/2014 | | | 51.92 | | | | .93 | | | | 3.62 | | | | 4.55 | | | | (.91 | ) | | | (3.56 | ) | | | (4.47 | ) | | | 52.00 | | | | 8.85 | | | | 1,742 | | | | .70 | | | | 1.75 | |
| Year ended 12/31/2013 | | | 40.74 | | | | .59 | | | | 12.12 | | | | 12.71 | | | | (.61 | ) | | | (.92 | ) | | | (1.53 | ) | | | 51.92 | | | | 31.39 | | | | 1,590 | | | | .72 | | | | 1.26 | |
| Year ended 12/31/2012 | | | 35.36 | | | | .61 | | | | 5.39 | | | | 6.00 | | | | (.62 | ) | | | — | | | | (.62 | ) | | | 40.74 | | | | 17.03 | | | | 1,183 | | | | .73 | | | | 1.59 | |
| Year ended 12/31/2011 | | | 36.67 | | | | .57 | | | | (1.29 | ) | | | (.72 | ) | | | (.59 | ) | | | — | | | | (.59 | ) | | | 35.36 | | | | (1.97 | ) | | | 977 | | | | .71 | | | | 1.55 | |
| Year ended 12/31/2010 | | | 32.71 | | | | .58 | | | | 3.93 | | | | 4.51 | | | | (.55 | ) | | | — | | | | (.55 | ) | | | 36.67 | | | | 13.98 | | | | 916 | | | | .69 | | | | 1.74 | |
| Class 529-B: | | | | | | | | | | | | | | | | | | | | | | | | | | | | | | | | | | | | | | | | | | | | | | | | |
| Year ended 12/31/2014 | | | 51.95 | | | | .54 | | | | 3.58 | | | | 4.12 | | | | (.46 | ) | | | (3.56 | ) | | | (4.02 | ) | | | 52.05 | | | | 7.97 | | | | 29 | | | | 1.49 | | | | 1.02 | |
| Year ended 12/31/2013 | | | 40.75 | | | | .21 | | | | 12.13 | | | | 12.34 | | | | (.22 | ) | | | (.92 | ) | | | (1.14 | ) | | | 51.95 | | | | 30.36 | | | | 41 | | | | 1.52 | | | | .46 | |
| Year ended 12/31/2012 | | | 35.36 | | | | .29 | | | | 5.39 | | | | 5.68 | | | | (.29 | ) | | | — | | | | (.29 | ) | | | 40.75 | | | | 16.09 | | | | 41 | | | | 1.54 | | | | .76 | |
| Year ended 12/31/2011 | | | 36.66 | | | | .27 | | | | (1.28 | ) | | | (1.01 | ) | | | (.29 | ) | | | — | | | | (.29 | ) | | | 35.36 | | | | (2.74 | ) | | | 48 | | | | 1.51 | | | | .74 | |
| Year ended 12/31/2010 | | | 32.69 | | | | .30 | | | | 3.95 | | | | 4.25 | | | | (.28 | ) | | | — | | | | (.28 | ) | | | 36.66 | | | | 13.09 | | | | 63 | | | | 1.50 | | | | .92 | |
See page 27 for footnotes.
Financial highlights (continued)
| | | | | | Income (loss) from | | | | | | | | | | | | | | | | | | | | | | | | | |
| | | | | | investment operations1 | | | Dividends and distributions | | | | | | | | | | | | | | | | |
| | | Net asset
value,
beginning
of period | | | Net
investment
income
(loss)2,3 | | | Net gains
(losses) on
securities
(both
realized and
unrealized) | | | Total from
investment
operations | | | Dividends
(from net
investment
income) | | | Distributions
(from capital
gains) | | | Total
dividends
and
distributions | | | Net asset
value,
end
of period | | | Total
return4,5 | | | Net assets,
end of period
(in millions) | | | Ratio of
expenses to
average
net assets | | | Ratio of
net income
(loss) to
average
net assets2,3 | |
| Class 529-C: | | | | | | | | | | | | | | | | | | | | | | | | | | | | | | | | | | | | | | | | | | | | | | | | |
| Year ended 12/31/2014 | | $ | 51.88 | | | $ | .51 | | | $ | 3.62 | | | $ | 4.13 | | | $ | (.50 | ) | | $ | (3.56 | ) | | $ | (4.06 | ) | | $ | 51.95 | | | | 7.99 | % | | $ | 445 | | | | 1.49 | % | | | .97 | % |
| Year ended 12/31/2013 | | | 40.71 | | | | .22 | | | | 12.11 | | | | 12.33 | | | | (.24 | ) | | | (.92 | ) | | | (1.16 | ) | | | 51.88 | | | | 30.37 | | | | 416 | | | | 1.51 | | | | .47 | |
| Year ended 12/31/2012 | | | 35.34 | | | | .30 | | | | 5.38 | | | | 5.68 | | | | (.31 | ) | | | — | | | | (.31 | ) | | | 40.71 | | | | 16.09 | | | | 319 | | | | 1.53 | | | | .79 | |
| Year ended 12/31/2011 | | | 36.64 | | | | .28 | | | | (1.28 | ) | | | (1.00 | ) | | | (.30 | ) | | | — | | | | (.30 | ) | | | 35.34 | | | | (2.72 | ) | | | 273 | | | | 1.51 | | | | .76 | |
| Year ended 12/31/2010 | | | 32.69 | | | | .31 | | | | 3.93 | | | | 4.24 | | | | (.29 | ) | | | — | | | | (.29 | ) | | | 36.64 | | | | 13.05 | | | | 265 | | | | 1.49 | | | | .94 | |
| Class 529-E: | | | | | | | | | | | | | | | | | | | | | | | | | | | | | | | | | | | | | | | | | | | | | | | | |
| Year ended 12/31/2014 | | | 51.89 | | | | .80 | | | | 3.61 | | | | 4.41 | | | | (.78 | ) | | | (3.56 | ) | | | (4.34 | ) | | | 51.96 | | | | 8.58 | | | | 72 | | | | .94 | | | | 1.51 | |
| Year ended 12/31/2013 | | | 40.71 | | | | .47 | | | | 12.13 | | | | 12.60 | | | | (.50 | ) | | | (.92 | ) | | | (1.42 | ) | | | 51.89 | | | | 31.10 | | | | 67 | | | | .96 | | | | 1.02 | |
| Year ended 12/31/2012 | | | 35.34 | | | | .52 | | | | 5.37 | | | | 5.89 | | | | (.52 | ) | | | — | | | | (.52 | ) | | | 40.71 | | | | 16.73 | | | | 50 | | | | .98 | | | | 1.34 | |
| Year ended 12/31/2011 | | | 36.65 | | | | .47 | | | | (1.29 | ) | | | (.82 | ) | | | (.49 | ) | | | — | | | | (.49 | ) | | | 35.34 | | | | (2.23 | ) | | | 42 | | | | .98 | | | | 1.29 | |
| Year ended 12/31/2010 | | | 32.69 | | | | .48 | | | | 3.94 | | | | 4.42 | | | | (.46 | ) | | | — | | | | (.46 | ) | | | 36.65 | | | | 13.66 | | | | 41 | | | | .98 | | | | 1.45 | |
| Class 529-F-1: | | | | | | | | | | | | | | | | | | | | | | | | | | | | | | | | | | | | | | | | | | | | | | | | |
| Year ended 12/31/2014 | | | 51.89 | | | | 1.04 | | | | 3.63 | | | | 4.67 | | | | (1.03 | ) | | | (3.56 | ) | | | (4.59 | ) | | | 51.97 | | | | 9.10 | | | | 76 | | | | .48 | | | | 1.96 | |
| Year ended 12/31/2013 | | | 40.71 | | | | .69 | | | | 12.12 | | | | 12.81 | | | | (.71 | ) | | | (.92 | ) | | | (1.63 | ) | | | 51.89 | | | | 31.70 | | | | 67 | | | | .51 | | | | 1.47 | |
| Year ended 12/31/2012 | | | 35.33 | | | | .69 | | | | 5.39 | | | | 6.08 | | | | (.70 | ) | | | — | | | | (.70 | ) | | | 40.71 | | | | 17.25 | | | | 48 | | | | .52 | | | | 1.79 | |
| Year ended 12/31/2011 | | | 36.65 | | | | .65 | | | | (1.30 | ) | | | (.65 | ) | | | (.67 | ) | | | — | | | | (.67 | ) | | | 35.33 | | | | (1.75 | ) | | | 40 | | | | .50 | | | | 1.77 | |
| Year ended 12/31/2010 | | | 32.69 | | | | .65 | | | | 3.93 | | | | 4.58 | | | | (.62 | ) | | | — | | | | (.62 | ) | | | 36.65 | | | | 14.22 | | | | 37 | | | | .48 | | | | 1.95 | |
| Class R-1: | | | | | | | | | | | | | | | | | | | | | | | | | | | | | | | | | | | | | | | | | | | | | | | | |
| Year ended 12/31/2014 | | | 51.77 | | | | .56 | | | | 3.60 | | | | 4.16 | | | | (.54 | ) | | | (3.56 | ) | | | (4.10 | ) | | | 51.83 | | | | 8.08 | | | | 167 | | | | 1.41 | | | | 1.06 | |
| Year ended 12/31/2013 | | | 40.62 | | | | .26 | | | | 12.09 | | | | 12.35 | | | | (.28 | ) | | | (.92 | ) | | | (1.20 | ) | | | 51.77 | | | | 30.50 | | | | 171 | | | | 1.41 | | | | .57 | |
| Year ended 12/31/2012 | | | 35.26 | | | | .34 | | | | 5.37 | | | | 5.71 | | | | (.35 | ) | | | — | | | | (.35 | ) | | | 40.62 | | | | 16.22 | | | | 146 | | | | 1.42 | | | | .88 | |
| Year ended 12/31/2011 | | | 36.56 | | | | .31 | | | | (1.28 | ) | | | (.97 | ) | | | (.33 | ) | | | — | | | | (.33 | ) | | | 35.26 | | | | (2.65 | ) | | | 142 | | | | 1.43 | | | | .84 | |
| Year ended 12/31/2010 | | | 32.62 | | | | .33 | | | | 3.93 | | | | 4.26 | | | | (.32 | ) | | | — | | | | (.32 | ) | | | 36.56 | | | | 13.13 | | | | 138 | | | | 1.43 | | | | 1.01 | |
| Class R-2: | | | | | | | | | | | | | | | | | | | | | | | | | | | | | | | | | | | | | | | | | | | | | | | | |
| Year ended 12/31/2014 | | | 51.76 | | | | .57 | | | | 3.60 | | | | 4.17 | | | | (.55 | ) | | | (3.56 | ) | | | (4.11 | ) | | | 51.82 | | | | 8.11 | | | | 790 | | | | 1.38 | | | | 1.08 | |
| Year ended 12/31/2013 | | | 40.62 | | | | .29 | | | | 12.08 | | | | 12.37 | | | | (.31 | ) | | | (.92 | ) | | | (1.23 | ) | | | 51.76 | | | | 30.55 | | | | 777 | | | | 1.36 | | | | .62 | |
| Year ended 12/31/2012 | | | 35.26 | | | | .35 | | | | 5.37 | | | | 5.72 | | | | (.36 | ) | | | — | | | | (.36 | ) | | | 40.62 | | | | 16.24 | | | | 630 | | | | 1.40 | | | | .91 | |
| Year ended 12/31/2011 | | | 36.56 | | | | .31 | | | | (1.28 | ) | | | (.97 | ) | | | (.33 | ) | | | — | | | | (.33 | ) | | | 35.26 | | | | (2.64 | ) | | | 589 | | | | 1.41 | | | | .85 | |
| Year ended 12/31/2010 | | | 32.61 | | | | .33 | | | | 3.93 | | | | 4.26 | | | | (.31 | ) | | | — | | | | (.31 | ) | | | 36.56 | | | | 13.15 | | | | 631 | | | | 1.42 | | | | 1.00 | |
| Class R-2E: | | | | | | | | | | | | | | | | | | | | | | | | | | | | | | | | | | | | | | | | | | | | | | | | |
| Period from 8/29/2014 to 12/31/20146,7 | | | 55.04 | | | | .27 | | | | .52 | | | | .79 | | | | (.74 | ) | | | (3.06 | ) | | | (3.80 | ) | | | 52.03 | | | | 1.40 | | | | — | 8 | | | .17 | 5,9 | | | .50 | 5,9 |
| Class R-3: | | | | | | | | | | | | | | | | | | | | | | | | | | | | | | | | | | | | | | | | | | | | | | | | |
| Year ended 12/31/2014 | | | 51.87 | | | | .80 | | | | 3.60 | | | | 4.40 | | | | (.77 | ) | | | (3.56 | ) | | | (4.33 | ) | | | 51.94 | | | | 8.56 | | | | 2,627 | | | | .96 | | | | 1.51 | |
| Year ended 12/31/2013 | | | 40.70 | | | | .48 | | | | 12.11 | | | | 12.59 | | | | (.50 | ) | | | (.92 | ) | | | (1.42 | ) | | | 51.87 | | | | 31.09 | | | | 2,795 | | | | .96 | | | | 1.02 | |
| Year ended 12/31/2012 | | | 35.32 | | | | .52 | | | | 5.39 | | | | 5.91 | | | | (.53 | ) | | | — | | | | (.53 | ) | | | 40.70 | | | | 16.78 | | | | 2,367 | | | | .96 | | | | 1.35 | |
| Year ended 12/31/2011 | | | 36.63 | | | | .48 | | | | (1.29 | ) | | | (.81 | ) | | | (.50 | ) | | | — | | | | (.50 | ) | | | 35.32 | | | | (2.22 | ) | | | 2,146 | | | | .96 | | | | 1.30 | |
| Year ended 12/31/2010 | | | 32.67 | | | | .49 | | | | 3.94 | | | | 4.43 | | | | (.47 | ) | | | — | | | | (.47 | ) | | | 36.63 | | | | 13.69 | | | | 2,177 | | | | .96 | | | | 1.47 | |
| | | | | | Income (loss) from | | | | | | | | | | | | | | | | | | | | | | | | | |
| | | | | | investment operations1 | | | Dividends and distributions | | | | | | | | | | | | | | | | |
| | | Net asset
value,
beginning
of period | | | Net
investment
income
(loss)2,3 | | | Net gains
(losses) on
securities
(both
realized and
unrealized) | | | Total from
investment
operations | | | Dividends
(from net
investment
income) | | | Distributions
(from capital
gains) | | | Total
dividends
and
distributions | | | Net asset
value,
end
of period | | | Total
return4,5 | | | Net assets,
end of period
(in millions) | | | Ratio of
expenses to
average
net assets | | | Ratio of
net income
(loss) to
average
net assets2,3 | |
| Class R-4: | | | | | | | | | | | | | | | | | | | | | | | | | | | | | | | | | | | | | | | | | | | | | | | | |
| Year ended 12/31/2014 | | $ | 51.88 | | | $ | .96 | | | $ | 3.61 | | | $ | 4.57 | | | $ | (.93 | ) | | $ | (3.56 | ) | | $ | (4.49 | ) | | $ | 51.96 | | | | 8.90 | % | | $ | 2,651 | | | | .66 | % | | | 1.82 | % |
| Year ended 12/31/2013 | | | 40.71 | | | | .61 | | | | 12.12 | | | | 12.73 | | | | (.64 | ) | | | (.92 | ) | | | (1.56 | ) | | | 51.88 | | | | 31.47 | | | | 2,842 | | | | .66 | | | | 1.32 | |
| Year ended 12/31/2012 | | | 35.33 | | | | .64 | | | | 5.39 | | | | 6.03 | | | | (.65 | ) | | | — | | | | (.65 | ) | | | 40.71 | | | | 17.13 | | | | 2,390 | | | | .66 | | | | 1.65 | |
| Year ended 12/31/2011 | | | 36.64 | | | | .59 | | | | (1.30 | ) | | | (.71 | ) | | | (.60 | ) | | | — | | | | (.60 | ) | | | 35.33 | | | | (1.92 | ) | | | 2,123 | | | | .66 | | | | 1.60 | |
| Year ended 12/31/2010 | | | 32.68 | | | | .59 | | | | 3.93 | | | | 4.52 | | | | (.56 | ) | | | — | | | | (.56 | ) | | | 36.64 | | | | 14.02 | | | | 2,050 | | �� | | .66 | | | | 1.77 | |
| Class R-5: | | | | | | | | | | | | | | | | | | | | | | | | | | | | | | | | | | | | | | | | | | | | | | | | |
| Year ended 12/31/2014 | | | 51.99 | | | | 1.13 | | | | 3.62 | | | | 4.75 | | | | (1.10 | ) | | | (3.56 | ) | | | (4.66 | ) | | | 52.08 | | | | 9.23 | | | | 1,979 | | | | .35 | | | | 2.12 | |
| Year ended 12/31/2013 | | | 40.79 | | | | .76 | | | | 12.14 | | | | 12.90 | | | | (.78 | ) | | | (.92 | ) | | | (1.70 | ) | | | 51.99 | | | | 31.87 | | | | 1,964 | | | | .36 | | | | 1.62 | |
| Year ended 12/31/2012 | | | 35.40 | | | | .75 | | | | 5.40 | | | | 6.15 | | | | (.76 | ) | | | — | | | | (.76 | ) | | | 40.79 | | | | 17.47 | | | | 1,516 | | | | .36 | | | | 1.95 | |
| Year ended 12/31/2011 | | | 36.71 | | | | .70 | | | | (1.30 | ) | | | (.60 | ) | | | (.71 | ) | | | — | | | | (.71 | ) | | | 35.40 | | | | (1.62 | ) | | | 1,394 | | | | .36 | | | | 1.89 | |
| Year ended 12/31/2010 | | | 32.74 | | | | .69 | | | | 3.94 | | | | 4.63 | | | | (.66 | ) | | | — | | | | (.66 | ) | | | 36.71 | | | | 14.37 | | | | 1,419 | | | | .36 | | | | 2.06 | |
| Class R-6: | | | | | | | | | | | | | | | | | | | | | | | | | | | | | | | | | | | | | | | | | | | | | | | | |
| Year ended 12/31/2014 | | | 51.98 | | | | 1.12 | | | | 3.64 | | | | 4.76 | | | | (1.12 | ) | | | (3.56 | ) | | | (4.68 | ) | | | 52.06 | | | | 9.27 | | | | 5,713 | | | | .31 | | | | 2.12 | |
| Year ended 12/31/2013 | | | 40.78 | | | | .79 | | | | 12.13 | | | | 12.92 | | | | (.80 | ) | | | (.92 | ) | | | (1.72 | ) | | | 51.98 | | | | 31.95 | | | | 4,516 | | | | .31 | | | | 1.68 | |
| Year ended 12/31/2012 | | | 35.39 | | | | .79 | | | | 5.38 | | | | 6.17 | | | | (.78 | ) | | | — | | | | (.78 | ) | | | 40.78 | | | | 17.53 | | | | 2,409 | | | | .31 | | | | 2.03 | |
| Year ended 12/31/2011 | | | 36.70 | | | | .72 | | | | (1.30 | ) | | | (.58 | ) | | | (.73 | ) | | | — | | | | (.73 | ) | | | 35.39 | | | | (1.57 | ) | | | 1,421 | | | | .31 | | | | 1.97 | |
| Year ended 12/31/2010 | | | 32.74 | | | | .71 | | | | 3.93 | | | | 4.64 | | | | (.68 | ) | | | — | | | | (.68 | ) | | | 36.70 | | | | 14.39 | | | | 950 | | | | .32 | | | | 2.13 | |
| | | Year ended December 31 |
| | | 2014 | 2013 | 2012 | 2011 | 2010 |
| Portfolio turnover rate for all share classes | | 29% | 34% | 28% | 28% | 32% |
| 1 | Based on average shares outstanding. |
| 2 | For the year ended December 31, 2010, this column reflects the impact of a corporate action event that resulted in a one-time increase to net investment income. If the corporate action event had not occurred, the Class A net investment income per share and ratio of net income to average net assets would have been lower by $.07 and .21 percentage points, respectively. The impact to the other share classes would have been similar. |
| 3 | For the year ended December 31, 2014, this column reflects the impact of a corporate action event that resulted in a one-time increase to net investment income. If the corporate action event had not occurred, the Class A net investment income per share and ratio of net income to average net assets would have been lower by $.27 and .51 percentage points, respectively. The impact to the other share classes would have been similar. |
| 4 | Total returns exclude any applicable sales charges, including contingent deferred sales charges. |
| 5 | Not annualized. |
| 6 | Class R-2E shares were offered beginning August 29, 2014. |
| 7 | Based on operations for the period shown and, accordingly, is not representative of a full year. |
| 8 | Amount less than $1 million. |
| 9 | Class R-2E assets consisted solely of seed capital invested by CRMC; therefore, certain fees were not accrued. |
See Notes to Financial Statements
Report of Independent Registered Public Accounting Firm
To the Shareholders and Board of Trustees of American Funds Fundamental Investors — Fundamental Investors:
We have audited the accompanying statement of assets and liabilities of American Funds Fundamental Investors – Fundamental Investors (the “Fund”), including the summary investment portfolio, as of December 31, 2014, and the related statement of operations for the year then ended, the statements of changes in net assets for each of the two years in the period then ended, and the financial highlights for each of the periods presented. These financial statements and financial highlights are the responsibility of the Fund’s management. Our responsibility is to express an opinion on these financial statements and financial highlights based on our audits.
We conducted our audits in accordance with the standards of the Public Company Accounting Oversight Board (United States). Those standards require that we plan and perform the audit to obtain reasonable assurance about whether the financial statements and financial highlights are free of material misstatement. The Fund is not required to have, nor were we engaged to perform, an audit of its internal control over financial reporting. Our audits included consideration of internal control over financial reporting as a basis for designing audit procedures that are appropriate in the circumstances, but not for the purpose of expressing an opinion on the effectiveness of the Fund’s internal control over financial reporting. Accordingly, we express no such opinion. An audit also includes examining, on a test basis, evidence supporting the amounts and disclosures in the financial statements, assessing the accounting principles used and significant estimates made by management, as well as evaluating the overall financial statement presentation. Our procedures included confirmation of securities owned as of December 31, 2014, by correspondence with the custodian and brokers; where replies were not received from brokers, we performed other auditing procedures. We believe that our audits provide a reasonable basis for our opinion.
In our opinion, such financial statements and financial highlights referred to above present fairly, in all material respects, the financial position of American Funds Fundamental Investors — Fundamental Investors as of December 31, 2014, the results of its operations for the year then ended, the changes in its net assets for each of the two years in the period then ended, and the financial highlights for each of the periods presented, in conformity with accounting principles generally accepted in the United States of America.
Deloitte & Touche LLP
Costa Mesa, California
February 11, 2015
As a fund shareholder, you incur two types of costs: (1) transaction costs, such as initial sales charges on purchase payments and contingent deferred sales charges on redemptions (loads), and (2) ongoing costs, including management fees, distribution and service (12b-1) fees, and other expenses. This example is intended to help you understand your ongoing costs (in dollars) of investing in the fund so you can compare these costs with the ongoing costs of investing in other mutual funds. The example is based on an investment of $1,000 invested at the beginning of the period and held for the entire six-month period (July 1, 2014, through December 31, 2014).
Actual expenses:
The first line of each share class in the table on the following page provides information about actual account values and actual expenses. You may use the information in this line, together with the amount you invested, to estimate the expenses that you paid over the period. Simply divide your account value by $1,000 (for example, an $8,600 account value divided by $1,000 = 8.6), then multiply the result by the number in the first line under the heading entitled “Expenses paid during period” to estimate the expenses you paid on your account during this period.
Hypothetical example for comparison purposes:
The second line of each share class in the table on the following page provides information about hypothetical account values and hypothetical expenses based on the actual expense ratio for the share class and an assumed rate of return of 5.00% per year before expenses, which is not the actual return of the share class. The hypothetical account values and expenses may not be used to estimate the actual ending account balance or expenses you paid for the period. You may use this information to compare the ongoing costs of investing in the fund and other funds. To do so, compare this 5.00% hypothetical example with the 5.00% hypothetical examples that appear in the shareholder reports of the other funds.
Notes:
Retirement plan participants may be subject to certain fees charged by the plan sponsor, and Class F-1, F-2 and 529-F-1 shareholders may be subject to fees charged by financial intermediaries, typically ranging from 0.75% to 1.50% of assets annually depending on services offered. You can estimate the impact of these fees by adding the amount of the fees to the total estimated expenses you paid on your account during the period as calculated above. In addition, your ending account value would be lower by the amount of these fees.
Note that the expenses shown in the table on the following page are meant to highlight your ongoing costs only and do not reflect any transactional costs, such as sales charges (loads). Therefore, the second line of each share class in the table is useful in comparing ongoing costs only and will not help you determine the relative total costs of owning different funds. In addition, if these transactional costs were included, your costs would have been higher.
| | | Beginning
account value
7/1/2014 | | | Ending
account value
12/31/2014 | | | Expenses paid
during period* | | | Annualized
expense ratio | |
| Class A — actual return | | $ | 1,000.00 | | | $ | 1,034.38 | | | $ | 3.08 | | | | .60 | % |
| Class A — assumed 5% return | | | 1,000.00 | | | | 1,022.18 | | | | 3.06 | | | | .60 | |
| Class B — actual return | | | 1,000.00 | | | | 1,030.32 | | | | 6.96 | | | | 1.36 | |
| Class B — assumed 5% return | | | 1,000.00 | | | | 1,018.35 | | | | 6.92 | | | | 1.36 | |
| Class C — actual return | | | 1,000.00 | | | | 1,030.07 | | | | 7.21 | | | | 1.41 | |
| Class C — assumed 5% return | | | 1,000.00 | | | | 1,018.10 | | | | 7.17 | | | | 1.41 | |
| Class F-1 — actual return | | | 1,000.00 | | | | 1,033.84 | | | | 3.43 | | | | .67 | |
| Class F-1 — assumed 5% return | | | 1,000.00 | | | | 1,021.83 | | | | 3.41 | | | | .67 | |
| Class F-2 — actual return | | | 1,000.00 | | | | 1,035.34 | | | | 2.05 | | | | .40 | |
| Class F-2 — assumed 5% return | | | 1,000.00 | | | | 1,023.19 | | | | 2.04 | | | | .40 | |
| Class 529-A — actual return | | | 1,000.00 | | | | 1,033.76 | | | | 3.59 | | | | .70 | |
| Class 529-A — assumed 5% return | | | 1,000.00 | | | | 1,021.68 | | | | 3.57 | | | | .70 | |
| Class 529-B — actual return | | | 1,000.00 | | | | 1,029.76 | | | | 7.62 | | | | 1.49 | |
| Class 529-B — assumed 5% return | | | 1,000.00 | | | | 1,017.69 | | | | 7.58 | | | | 1.49 | |
| Class 529-C — actual return | | | 1,000.00 | | | | 1,029.86 | | | | 7.57 | | | | 1.48 | |
| Class 529-C — assumed 5% return | | | 1,000.00 | | | | 1,017.74 | | | | 7.53 | | | | 1.48 | |
| Class 529-E — actual return | | | 1,000.00 | | | | 1,032.55 | | | | 4.82 | | | | .94 | |
| Class 529-E — assumed 5% return | | | 1,000.00 | | | | 1,020.47 | | | | 4.79 | | | | .94 | |
| Class 529-F-1 — actual return | | | 1,000.00 | | | | 1,034.93 | | | | 2.46 | | | | .48 | |
| Class 529-F-1 — assumed 5% return | | | 1,000.00 | | | | 1,022.79 | | | | 2.45 | | | | .48 | |
| Class R-1 — actual return | | | 1,000.00 | | | | 1,030.22 | | | | 7.22 | | | | 1.41 | |
| Class R-1 — assumed 5% return | | | 1,000.00 | | | | 1,018.10 | | | | 7.17 | | | | 1.41 | |
| Class R-2 — actual return | | | 1,000.00 | | | | 1,030.44 | | | | 7.01 | | | | 1.37 | |
| Class R-2 — assumed 5% return | | | 1,000.00 | | | | 1,018.30 | | | | 6.97 | | | | 1.37 | |
| Class R-2E — actual return† | | | 1,000.00 | | | | 1,014.01 | | | | 1.74 | | | | .51 | |
| Class R-2E — assumed 5% return† | | | 1,000.00 | | | | 1,022.63 | | | | 2.60 | | | | .51 | |
| Class R-3 — actual return | | | 1,000.00 | | | | 1,032.41 | | | | 4.87 | | | | .95 | |
| Class R-3 — assumed 5% return | | | 1,000.00 | | | | 1,020.42 | | | | 4.84 | | | | .95 | |
| Class R-4 — actual return | | | 1,000.00 | | | | 1,033.95 | | | | 3.38 | | | | .66 | |
| Class R-4 — assumed 5% return | | | 1,000.00 | | | | 1,021.88 | | | | 3.36 | | | | .66 | |
| Class R-5 — actual return | | | 1,000.00 | | | | 1,035.51 | | | | 1.80 | | | | .35 | |
| Class R-5 — assumed 5% return | | | 1,000.00 | | | | 1,023.44 | | | | 1.79 | | | | .35 | |
| Class R-6 — actual return | | | 1,000.00 | | | | 1,035.68 | | | | 1.54 | | | | .30 | |
| Class R-6 — assumed 5% return | | | 1,000.00 | | | | 1,023.69 | | | | 1.53 | | | | .30 | |
| * | The “expenses paid during period” are equal to the “annualized expense ratio,” multiplied by the average account value over the period, multiplied by the number of days in the period, and divided by 365 (to reflect the one-half year period). |
| † | The period for the “annualized expense ratio” and “actual return” line is based on the number of days since the initial sale of the share class on August 29, 2014. The “assumed 5% return” line is based on 184 days. |
We are required to advise you of the federal tax status of certain distributions received by shareholders during the fiscal year. The fund hereby designates the following amounts for the fund’s fiscal year ended December 31, 2014:
| Long-term capital gains | $5,005,026,000 |
| Qualified dividend income | 100% |
| Corporate dividends received deduction | $1,201,903,000 |
| U.S. government income that may be exempt from state taxation | $613,000 |
Individual shareholders should refer to their Form 1099 or other tax information, which was mailed in January 2015, to determine the calendar year amounts to be included on their 2014 tax returns. Shareholders should consult their tax advisors.
Approval of Investment Advisory and Service Agreement
The Fundamental Investors board has approved the fund’s Investment Advisory and Service Agreement (the “agreement”) with Capital Research and Management Company (“CRMC”) for an additional one-year term through November 30, 2015. The agreement was amended to add an additional advisory fee breakpoint if and when the fund’s net assets exceed $71 billion. The board approved the agreement following the recommendation of the fund’s Contracts Committee (the “committee”), which is composed of all of the fund’s independent board members. The board and the committee determined that the fund’s advisory fee structure was fair and reasonable in relation to the services provided, and that approving the agreement was in the best interests of the fund and its shareholders.
In reaching this decision, the board and the committee took into account information furnished to them throughout the year and otherwise provided to them, as well as information prepared specifically in connection with their review of the agreement, and were advised by their independent counsel. They considered the following factors, among others, but did not identify any single issue or particular piece of information that, in isolation, was the controlling factor, and each board and committee member did not necessarily attribute the same weight to each factor.
1. Nature, extent and quality of services
The board and the committee considered the depth and quality of CRMC’s investment management process, including its global research capabilities; the experience, capability and integrity of its senior management and other personnel; the low turnover rates of its key personnel; the overall financial strength and stability of CRMC and the Capital Group organization; and the ongoing evolution of CRMC’s organizational structure designed to maintain and strengthen these qualities. The board and the committee also considered the nature, extent and quality of administrative, compliance and shareholder services provided by CRMC to the fund under the agreement and other agreements, as well as the benefits to fund shareholders from investing in a fund that is part of a large family of funds. The board and the committee concluded that the nature, extent and quality of the services provided by CRMC have benefited and should continue to benefit the fund and its shareholders.
2. Investment results
The board and the committee considered the investment results of the fund in light of its objective of pursuing long-term growth of capital and income. They compared the fund’s investment results with those of other relevant funds (including funds that form the basis of the Lipper index for the category in which the fund is included), and data such as relevant market and fund indexes, over various periods through March 31, 2014. This report, including the letter to shareholders and related disclosures, contains certain information about the fund’s investment results. The board and the committee reviewed the fund’s investment results measured against various indexes, including the Lipper Growth & Income Funds Index and Standard & Poor’s 500 Composite Index. They noted that the investment results of the fund generally compared favorably to these two indexes for the lifetime period, the 20-year period and the 10-year period, and were mixed for shorter periods. The board and the committee concluded that the fund’s investment results have been satisfactory for renewal of the agreement, and that CRMC’s record in managing the fund indicated that its continued management should benefit the fund and its shareholders.
3. Advisory fees and total expenses
The board and the committee compared the advisory fees and total expense levels of the fund to those of other relevant funds. They observed that the fund’s advisory fees and expenses generally compared favorably to those of other similar funds included in the Lipper Growth & Income Funds category. The board and the committee also considered the breakpoint discounts in the fund’s advisory fee structure that reduce the level of fees charged by CRMC to the fund as fund assets increase. In addition, they reviewed information regarding the effective advisory fees charged to non-mutual fund clients by CRMC and its affiliates. They noted that, to the extent there were differences between the advisory fees paid by the fund and the advisory fees paid by those clients, the differences appropriately reflected the investment, operational and regulatory differences between advising the fund and the other clients. The board and the committee concluded that the fund’s cost structure was fair and reasonable in relation to the services provided, and that the fund’s shareholders receive reasonable value in return for the advisory fees and other amounts paid to CRMC by the fund.
4. Ancillary benefits
The board and the committee considered a variety of other benefits that CRMC and its affiliates receive as a result of CRMC’s relationship with the fund and the other American Funds, including fees for administrative services provided to certain share classes; fees paid to CRMC’s affiliated transfer agent; sales charges and distribution fees received and retained by the fund’s principal underwriter, an affiliate of CRMC; and possible ancillary benefits to CRMC and its institutional management affiliates in managing other investment vehicles. The board and the committee reviewed CRMC’s portfolio trading practices, noting that while CRMC received the benefit of research provided by broker-dealers executing portfolio transactions on behalf of the fund, it did not obtain third-party research or other services in return for allocating brokerage to such broker-dealers. The board and the committee took these ancillary benefits into account in evaluating the reasonableness of the advisory fees and other amounts paid to CRMC by the fund.
5. Adviser financial information
The board and the committee reviewed information regarding CRMC’s costs of providing services to the American Funds, including personnel, systems and resources of investment, compliance, trading, accounting and other administrative operations. They considered CRMC’s costs and willingness to invest in technology, infrastructure and staff to maintain and expand services and capabilities, respond to industry and regulatory developments, and attract and retain qualified personnel. They noted information regarding the compensation structure for CRMC’s investment professionals. The board and the committee also compared CRMC’s profitability and compensation data to the reported results and data of several large, publicly held investment management companies. The board and the committee noted the competitiveness and cyclicality of both the mutual fund industry and the capital markets, and the importance in that environment of CRMC’s long-term profitability for maintaining its independence, company culture and management continuity. They further considered the breakpoint discounts in the fund’s advisory fee structure. The board and the committee concluded that the fund’s advisory fee structure reflected a reasonable sharing of benefits between CRMC and the fund’s shareholders.
Board of trustees and other officers
Independent trustees1
| Name and year of birth | | Year first
elected
a trustee
of the fund2 | | Principal occupation(s) during past five years | | Number of
portfolios in fund
complex overseen
by trustee | | Other directorships3
held by trustee |
| Ronald P. Badie, 1942 | | 2008 | | Retired; former Vice Chairman, Deutsche Bank Alex. Brown (retired 2002) | | 3 | | Amphenol Corporation; Nautilus, Inc. |
Joseph C. Berenato, 1946
Chairman of the Board
(Independent and Non-Executive) | | 2003 | | Former Chairman and CEO, Ducommun Incorporated (aerospace components manufacturer) | | 6 | | Ducommun Incorporated |
| Louise H. Bryson, 1944 | | 2008 | | Chair Emerita of the Board of Trustees, J. Paul Getty Trust; former President, Distribution, Lifetime Entertainment Network (retired 2008); former Executive Vice President and General Manager, Lifetime Movie Network (retired 2008) | | 7 | | None |
| Robert J. Denison, 1941 | | 2005 | | Chair, First Security Management (private investment) | | 6 | | None |
| Mary Anne Dolan, 1947 | | 2010 | | Founder and President, MAD Ink (communications company) | | 10 | | None |
| John G. Freund, 1953 | | 2010 | | Founder and Managing Director, Skyline Ventures (venture capital investor in health care companies) | | 3 | | Concert Pharmaceuticals, Inc.;
Proteon Therapeutics, Inc.;
Tetraphase Pharmaceuticals, Inc.;
XenoPort, Inc. |
| Leonade D. Jones, 1947 | | 1998 | | Retired; former Treasurer, The Washington Post Company (retired 1996) | | 10 | | None |
| William H. Kling, 1942 | | 2010 | | President Emeritus and former CEO, American Public Media | | 10 | | None |
| Christopher E. Stone, 1956 | | 2010 | | President, Open Society Foundations; former Professor of the Practice of Criminal Justice, John F. Kennedy School of Government, Harvard University | | 6 | | None |
Interested trustees4,5
Name, year of birth
and position with fund | | Year first
elected
a trustee
or officer
of the fund2 | | Principal occupation(s) during past five years
and positions held with affiliated entities or
the principal underwriter of the fund | | Number of
portfolios in fund
complex overseen
by trustee | | Other directorships3
held by trustee |
James F. Rothenberg, 1946
Vice Chairman of the Board | | 1998 | | Director, Capital Research and Management Company; Director, American Funds Distributors, Inc.;6 Director and Chair, The Capital Group Companies, Inc.6 | | 2 | | None |
Dina N. Perry, 1945
President | | 1994 | | Partner — Capital World Investors, Capital Research and Management Company; Director, The Capital Group Companies, Inc.6 | | 1 | | None |
The fund’s statement of additional information includes further details about fund trustees and is available without charge upon request by calling American Funds Service Company at (800) 421-4225 or by visiting the American Funds website at americanfunds.com. The address for all trustees and officers of the fund is 333 South Hope Street, Los Angeles, CA 90071, Attention: Secretary.
Other officers5
| | | | | |
| Name, year of birth and position with fund | | Year first
elected
an officer
of the fund2 | | Principal occupation(s) during past five years and positions held with affiliated entities or the principal underwriter of the fund |
Paul F. Roye, 1953
Executive Vice President | | 2012 | | Senior Vice President — Fund Business Management Group, Capital Research and Management Company;
Director, American Funds Service Company6 |
Michael T. Kerr, 1959
Senior Vice President | | 1995 | | Partner — Capital World Investors, Capital Research and Management Company;
Director, The Capital Group Companies, Inc.6 |
Martin Romo, 1967
Senior Vice President | | 1999 | | Director, Capital Research and Management Company;
Partner — Capital World Investors, Capital Research and Management Company;
President and Director, Capital Research Company;6
Director, The Capital Group Companies, Inc.6 |
Walter R. Burkley, 1966
Vice President | | 2010 | | Senior Vice President and Senior Counsel — Fund Business Management Group, Capital Research and Management Company;
Director, Capital Research Company6 |
Mark L. Casey, 1970
Vice President | | 2008 | | Partner — Capital World Investors, Capital Research and Management Company |
Ronald B. Morrow, 1945
Vice President | | 2004 | | Partner — Capital World Investors, Capital Research and Management Company |
Michael W. Stockton, 1967
Secretary | | 2014 | | Vice President — Fund Business Management Group, Capital Research and Management Company |
Jeffrey P. Regal, 1971
Treasurer | | 2006 | | Vice President — Investment Operations, Capital Research and Management Company |
Julie E. Lawton, 1973
Assistant Secretary | | 2010 | | Assistant Vice President — Fund Business Management Group, Capital Research and Management Company |
Dori Laskin, 1951
Assistant Treasurer | | 2011 | | Vice President — Investment Operations, Capital Research and Management Company |
Neal F. Wellons, 1971
Assistant Treasurer | | 2010 | | Vice President — Investment Operations, Capital Research and Management Company |
| 1 | The term independent trustee refers to a trustee who is not an “interested person” of the fund within the meaning of the Investment Company Act of 1940. |
| 2 | Trustees and officers of the fund serve until their resignation, removal or retirement. |
| 3 | This includes all directorships/trusteeships (other than those in the American Funds or other funds managed by Capital Research and Management Company or its affiliates) that are held by each trustee as a trustee or director of a public company or a registered investment company. |
| 4 | The term interested trustee refers to a trustee who is an “interested person” within the meaning of the Investment Company Act of 1940, on the basis of their affiliation with the fund’s investment adviser, Capital Research and Management Company, or affiliated entities (including the fund’s principal underwriter). |
| 5 | All of the directors/trustees and/or officers listed, except Mark L. Casey, are officers and/or directors/trustees of one or more of the other funds for which Capital Research and Management Company serves as investment adviser. |
| 6 | Company affiliated with Capital Research and Management Company. |
| Office of the fund |
| 6455 Irvine Center Drive |
| Irvine, CA 92618-4518 |
| |
| Investment adviser |
| Capital Research and Management Company |
| 333 South Hope Street |
| Los Angeles, CA 90071-1406 |
| |
| 6455 Irvine Center Drive |
| Irvine, CA 92618-4518 |
| |
| Transfer agent for shareholder accounts |
| American Funds Service Company |
| (Write to the address near you.) |
| |
| P.O. Box 6007 |
| Indianapolis, IN 46206-6007 |
| |
| P.O. Box 2280 |
| Norfolk, VA 23501-2280 |
| |
| Custodian of assets |
| State Street Bank and Trust Company |
| One Lincoln Street |
| Boston, MA 02111 |
| |
| Counsel |
| K&L Gates LLP |
| Four Embarcadero Center, Suite 1200 |
| San Francisco, CA 94111-5994 |
| |
| Independent registered public accounting firm |
| Deloitte & Touche LLP |
| 695 Town Center Drive |
| Suite 1200 |
| Costa Mesa, CA 92626-7188 |
| |
| Principal underwriter |
| American Funds Distributors, Inc. |
| 333 South Hope Street |
| Los Angeles, CA 90071-1406 |
Investors should carefully consider investment objectives, risks, charges and expenses. This and other important information is contained in the fund prospectus and summary prospectus, which can be obtained from your financial professional and should be read carefully before investing. You may also call American Funds Service Company (AFS) at (800) 421-4225 or visit the American Funds website at americanfunds.com.
“American Funds Proxy Voting Procedures and Principles” — which describes how we vote proxies relating to portfolio securities — is available on the American Funds website or upon request by calling AFS. The fund files its proxy voting record with the U.S. Securities and Exchange Commission (SEC) for the 12 months ended June 30 by August 31. The proxy voting record is available free of charge on the SEC website at sec.gov and on the American Funds website.
A complete December 31, 2014, portfolio of Fundamental Investors’ investments is available free of charge by calling AFS or visiting the SEC website (where it is part of Form N-CSR).
Fundamental Investors files a complete list of its portfolio holdings with the SEC for the first and third quarters of each fiscal year on Form N-Q. This filing is available free of charge on the SEC website. You may also review or, for a fee, copy this filing at the SEC’s Public Reference Room in Washington, D.C. Additional information regarding the operation of the Public Reference Room may be obtained by calling the SEC’s Office of Investor Education and Advocacy at (800) SEC-0330. Additionally, the list of portfolio holdings is available by calling AFS.
This report is for the information of shareholders of Fundamental Investors, but it also may be used as sales literature when preceded or accompanied by the current prospectus or summary prospectus, which gives details about charges, expenses, investment objectives and operating policies of the fund. If used as sales material after March 31, 2015, this report must be accompanied by an American Funds statistical update for the most recently completed calendar quarter.
The American Funds Advantage
Since 1931, American Funds, part of Capital Group, has helped investors pursue long-term investment success. Our consistent approach — in combination with The Capital SystemSM — has resulted in a superior long-term track record.
| | Aligned with investor success |
| | We base our decisions on a long-term perspective, which we believe aligns our goals with the interests of our clients. Our portfolio managers average 27 years of investment experience, including 22 years at our company, reflecting a career commitment to our long-term approach.1 |
| | |
| | The Capital SystemSM |
| | Our investment process, The Capital System, combines individual accountability with teamwork. Each fund is divided into portions that are managed independently by investment professionals with diverse backgrounds, ages and investment approaches. An extensive global research effort is the backbone of our system. |
| | |
| | Superior long-term track record |
| | Our equity funds have beaten their Lipper peer indexes in 91% of 10-year periods and 96% of 20-year periods. Our fixed-income funds have beaten their Lipper indexes in 54% of 10-year periods and 57% of 20-year periods.2 Our fund management fees have been among the lowest in the industry.3 |
| | 1 | Portfolio manager experience as of December 31, 2014. |
| | 2 | Based on Class A share results for rolling periods through December 31, 2014. Periods covered are the shorter of the fund’s lifetime or since the comparable Lipper index inception date (except SMALLCAP World Fund, for which the Lipper average was used). |
| | 3 | On average, our management fees were in the lowest quintile 70% of the time, based on the 20-year period ended December 31, 2014, versus comparable Lipper categories, excluding funds of funds. |

ITEM 2 – Code of Ethics
The Registrant has adopted a Code of Ethics that applies to its Principal Executive Officer and Principal Financial Officer. The Registrant undertakes to provide to any person without charge, upon request, a copy of the Code of Ethics. Such request can be made to American Funds Service Company at 800/421-9225 or to the Secretary of the Registrant, 6455 Irvine Center Drive, Irvine, California 92618.
ITEM 3 – Audit Committee Financial Expert
The Registrant’s board has determined that Ronald P. Badie, a member of the Registrant’s audit committee, is an “audit committee financial expert” and "independent," as such terms are defined in this Item. This designation will not increase the designee’s duties, obligations or liability as compared to his or her duties, obligations and liability as a member of the audit committee and of the board, nor will it reduce the responsibility of the other audit committee members. There may be other individuals who, through education or experience, would qualify as "audit committee financial experts" if the board had designated them as such. Most importantly, the board believes each member of the audit committee contributes significantly to the effective oversight of the Registrant’s financial statements and condition.
ITEM 4 – Principal Accountant Fees and Services
| | Registrant: |
| | | a) Audit Fees: |
| | | | 2013 | $87,000 |
| | | | 2014 | $93,000 |
| | | | |
| | | b) Audit-Related Fees: |
| | | | 2013 | $24,000 |
| | | | 2014 | $15,000 |
| | | | The audit-related fees consist of assurance and related services relating to the examination of the Registrant’s investment adviser conducted in accordance with Statement on Standards for Attestation Engagements Number 16 issued by the American Institute of Certified Public Accountants. |
| | | | |
| | | c) Tax Fees: |
| | | | 2013 | $4,000 |
| | | | 2014 | $9,000 |
| | | | The tax fees consist of professional services relating to the preparation of the Registrant’s tax returns including returns relating to the Registrant’s investments in non-U.S. jurisdictions. |
| | | | |
| | | d) All Other Fees: |
| | | | 2013 | None |
| | | | 2014 | None |
| | | | |
| | Adviser and affiliates (includes only fees for non-audit services billed to the adviser and affiliates for engagements that relate directly to the operations and financial reporting of the Registrant and were subject to the pre-approval policies described below): |
| | | a) Audit Fees: |
| | | | Not Applicable |
| | | | |
| | | b) Audit-Related Fees: |
| | | | 2013 | $1,020,000 |
| | | | 2014 | $927,000 |
| | | | The audit-related fees consist of assurance and related services relating to the examination of the Registrant’s transfer agent, principal underwriter and investment adviser conducted in accordance with Statement on Standards for Attestation Engagements Number 16 issued by the American Institute of Certified Public Accountants. |
| | | | |
| | | c) Tax Fees: |
| | | | 2013 | $10,000 |
| | | | 2014 | $33,000 |
| | | | The tax fees consist of consulting services relating to the Registrant’s investments. |
| | | | |
| | | d) All Other Fees: |
| | | | 2013 | $3,000 |
| | | | 2014 | $3,000 |
| | | | The other fees consist of subscription services related to an accounting research tool. |
| | | | |
All audit and permissible non-audit services that the Registrant’s audit committee considers compatible with maintaining the independent registered public accounting firm’s independence are required to be pre-approved by the committee. The pre-approval requirement will extend to all non-audit services provided to the Registrant, the investment adviser, and any entity controlling, controlled by, or under common control with the investment adviser that provides ongoing services to the Registrant, if the engagement relates directly to the operations and financial reporting of the Registrant. The committee will not delegate its responsibility to pre-approve these services to the investment adviser. The committee may delegate to one or more committee members the authority to review and pre-approve audit and permissible non-audit services. Actions taken under any such delegation will be reported to the full committee at its next meeting. The pre-approval requirement is waived with respect to non-audit services if certain conditions are met. The pre-approval requirement was not waived for any of the non-audit services listed above provided to the Registrant, adviser and affiliates.
Aggregate non-audit fees paid to the Registrant’s auditors, including fees for all services billed to the Registrant, adviser and affiliates that provide ongoing services to the Registrant, were $1,474,000 for fiscal year 2013 and $1,286,000 for fiscal year 2014. The non-audit services represented by these amounts were brought to the attention of the committee and considered to be compatible with maintaining the auditors’ independence.
ITEM 5 – Audit Committee of Listed Registrants
Not applicable to this Registrant, insofar as the Registrant is not a listed issuer as defined in Rule 10A-3 under the Securities Exchange Act of 1934.
ITEM 6 – Schedule of Investments
Fundamental Investors®
Investment portfolio
December 31, 2014
Common stocks 95.36%
Financials 16.55% | Shares | Value
(000) |
| Wells Fargo & Co. | 24,745,916 | $1,356,571 |
| JPMorgan Chase & Co. | 17,205,000 | 1,076,689 |
| American Express Co. | 10,270,000 | 955,521 |
| Berkshire Hathaway Inc., Class A1 | 3,835 | 866,710 |
| Capital One Financial Corp. | 10,162,000 | 838,873 |
| CME Group Inc., Class A | 8,007,600 | 709,874 |
| ACE Ltd. | 4,350,000 | 499,728 |
| Goldman Sachs Group, Inc. | 2,438,200 | 472,596 |
| Legal & General Group PLC2 | 119,784,921 | 460,072 |
| SunTrust Banks, Inc. | 10,603,987 | 444,307 |
| Citigroup Inc. | 8,000,000 | 432,880 |
| American International Group, Inc. | 7,641,700 | 428,012 |
| Equity Residential | 4,506,171 | 323,723 |
| Weyerhaeuser Co.1 | 9,000,107 | 323,014 |
| PNC Financial Services Group, Inc. | 3,491,000 | 318,484 |
| Iron Mountain Inc. | 6,961,529 | 269,133 |
| Moody’s Corp. | 2,575,000 | 246,711 |
| KeyCorp | 16,060,000 | 223,234 |
| BlackRock, Inc. | 600,000 | 214,536 |
| CNO Financial Group, Inc.3 | 11,900,000 | 204,918 |
| American Tower Corp. | 2,000,000 | 197,700 |
| Svenska Handelsbanken AB, Class A2 | 3,820,000 | 178,366 |
| McGraw Hill Financial, Inc. | 2,000,000 | 177,960 |
| Aegon NV2 | 22,277,585 | 167,149 |
| Crown Castle International Corp. | 1,997,039 | 157,167 |
| Aon PLC, Class A | 1,201,270 | 113,916 |
| Deutsche Bank AG2 | 3,469,000 | 104,853 |
| Leucadia National Corp. | 4,589,846 | 102,904 |
| | | 11,865,601 |
| Information technology 16.22% | | |
| Microsoft Corp. | 55,205,000 | 2,564,272 |
| Google Inc., Class C1 | 1,162,800 | 612,098 |
| Google Inc., Class A1 | 1,137,800 | 603,785 |
| Avago Technologies Ltd. | 10,261,993 | 1,032,254 |
| ASML Holding NV2 | 4,555,030 | 488,011 |
| ASML Holding NV (New York registered) | 2,481,000 | 267,526 |
| Apple Inc. | 6,630,000 | 731,819 |
| Texas Instruments Inc. | 12,570,300 | 672,071 |
| Visa Inc., Class A | 2,320,000 | 608,304 |
| Cisco Systems, Inc. | 21,730,000 | 604,420 |
| Intel Corp. | 12,000,000 | 435,480 |
| Analog Devices, Inc. | 7,099,000 | 394,136 |
| Amphenol Corp., Class A | 6,750,000 | 363,217 |
| Taiwan Semiconductor Manufacturing Co. Ltd.2 | 65,320,000 | 288,240 |
| Taiwan Semiconductor Manufacturing Co. Ltd. (ADR) | 1,435,000 | 32,115 |
| salesforce.com, inc.1 | 5,025,000 | 298,033 |
Fundamental Investors — Page 1 of 5
Common stocks
Information technology (continued) | Shares | Value
(000) |
| Intuit Inc. | 2,762,382 | $254,664 |
| LinkedIn Corp., Class A1 | 1,020,000 | 234,304 |
| MasterCard Inc., Class A | 2,500,000 | 215,400 |
| Maxim Integrated Products, Inc. | 6,000,000 | 191,220 |
| Baidu, Inc., Class A (ADR)1 | 725,000 | 165,278 |
| Murata Manufacturing Co., Ltd.2 | 1,455,000 | 158,935 |
| Rackspace Hosting, Inc.1 | 2,844,000 | 133,128 |
| TE Connectivity Ltd. | 1,955,000 | 123,654 |
| ASM Pacific Technology Ltd.2 | 10,397,300 | 98,848 |
| KLA-Tencor Corp. | 825,140 | 58,024 |
| | | 11,629,236 |
| Consumer discretionary 15.93% | | |
| Comcast Corp., Class A | 34,085,000 | 1,977,271 |
| Amazon.com, Inc.1 | 5,832,800 | 1,810,209 |
| Home Depot, Inc. | 14,110,000 | 1,481,127 |
| Twenty-First Century Fox, Inc., Class A | 26,125,000 | 1,003,331 |
| Walt Disney Co. | 9,390,000 | 884,444 |
| Time Warner Inc. | 9,230,000 | 788,427 |
| Expedia, Inc. | 4,591,000 | 391,888 |
| Carnival Corp., units | 8,506,090 | 385,581 |
| Macy’s, Inc. | 5,500,000 | 361,625 |
| CBS Corp., Class B | 4,460,000 | 246,816 |
| Johnson Controls, Inc. | 5,000,000 | 241,700 |
| Viacom Inc., Class B | 3,175,000 | 238,919 |
| NIKE, Inc., Class B | 2,480,000 | 238,452 |
| Lowe’s Companies, Inc. | 3,430,000 | 235,984 |
| Ralph Lauren Corp., Class A | 1,270,000 | 235,153 |
| Altice SA1,2 | 2,607,171 | 205,737 |
| Naspers Ltd., Class N2 | 1,500,000 | 193,122 |
| Liberty Global PLC, Class C1 | 2,353,511 | 113,698 |
| Liberty Global PLC, Class A1 | 863,679 | 43,361 |
| Wynn Resorts, Ltd. | 1,000,000 | 148,760 |
| Starbucks Corp. | 1,000,000 | 82,050 |
| Toyota Motor Corp.2 | 930,000 | 57,995 |
| Marriott International, Inc., Class A | 453,900 | 35,418 |
| Toll Brothers, Inc.1 | 526,682 | 18,049 |
| | | 11,419,117 |
| Industrials 13.35% | | |
| Boeing Co. | 11,900,000 | 1,546,762 |
| Union Pacific Corp. | 11,740,000 | 1,398,586 |
| General Electric Co. | 43,750,000 | 1,105,562 |
| Parker-Hannifin Corp. | 4,664,300 | 601,461 |
| Lockheed Martin Corp. | 3,113,200 | 599,509 |
| United Continental Holdings, Inc.1 | 6,100,000 | 408,029 |
| Rockwell Automation | 3,500,000 | 389,200 |
| Deere & Co. | 3,800,000 | 336,186 |
| Cummins Inc. | 2,210,000 | 318,616 |
| Masco Corp. | 12,350,000 | 311,220 |
| Caterpillar Inc. | 3,375,000 | 308,914 |
| Airbus Group NV2 | 5,915,508 | 293,807 |
| United Technologies Corp. | 2,300,000 | 264,500 |
| TransDigm Group Inc. | 1,260,000 | 247,401 |
| Honeywell International Inc. | 2,400,000 | 239,808 |
Fundamental Investors — Page 2 of 5
Common stocks
Industrials (continued) | Shares | Value
(000) |
| Schneider Electric SE2 | 2,807,000 | $203,962 |
| Waste Management, Inc. | 3,400,000 | 174,488 |
| MTU Aero Engines AG2 | 1,835,346 | 160,251 |
| Grafton Group PLC, units2,3 | 15,037,000 | 148,840 |
| Fastenal Co. | 3,100,000 | 147,436 |
| Ryanair Holdings PLC (ADR)1 | 1,850,000 | 131,849 |
| Meggitt PLC2 | 14,055,334 | 112,349 |
| Northrop Grumman Corp. | 740,000 | 109,069 |
| Civeo Corp. | 2,934,000 | 12,059 |
| | | 9,569,864 |
| Health care 10.46% | | |
| Merck & Co., Inc. | 22,485,000 | 1,276,923 |
| Express Scripts Holding Co.1 | 10,039,474 | 850,042 |
| Vertex Pharmaceuticals Inc.1 | 5,800,000 | 689,040 |
| Pfizer Inc. | 18,600,000 | 579,390 |
| Bristol-Myers Squibb Co. | 9,500,000 | 560,785 |
| Thermo Fisher Scientific Inc. | 2,800,000 | 350,812 |
| Gilead Sciences, Inc.1 | 3,418,790 | 322,255 |
| Regeneron Pharmaceuticals, Inc.1 | 778,000 | 319,175 |
| Johnson & Johnson | 3,000,000 | 313,710 |
| Baxter International Inc. | 3,751,755 | 274,966 |
| Hologic, Inc.1 | 10,005,000 | 267,534 |
| Boston Scientific Corp.1 | 20,000,000 | 265,000 |
| Roche Holding AG2 | 925,000 | 250,712 |
| Novartis AG2 | 2,540,000 | 233,597 |
| AbbVie Inc. | 3,400,000 | 222,496 |
| Edwards Lifesciences Corp.1 | 1,700,000 | 216,546 |
| UnitedHealth Group Inc. | 1,852,000 | 187,219 |
| Abbott Laboratories | 3,816,771 | 171,831 |
| PerkinElmer, Inc. | 2,035,000 | 88,991 |
| Humana Inc. | 396,000 | 56,878 |
| | | 7,497,902 |
| Consumer staples 7.58% | | |
| Philip Morris International Inc. | 19,770,000 | 1,610,266 |
| Coca-Cola Co. | 18,695,000 | 789,303 |
| Procter & Gamble Co. | 6,860,000 | 624,877 |
| PepsiCo, Inc. | 5,000,000 | 472,800 |
| Walgreens Boots Alliance, Inc. | 5,375,000 | 409,575 |
| British American Tobacco PLC2 | 5,345,000 | 290,414 |
| Campbell Soup Co. | 6,000,000 | 264,000 |
| Costco Wholesale Corp. | 1,700,000 | 240,975 |
| Diageo PLC2 | 7,000,000 | 200,768 |
| CVS/Caremark Corp. | 1,820,000 | 175,284 |
| Altria Group, Inc. | 2,595,000 | 127,856 |
| Reynolds American Inc. | 1,350,000 | 86,765 |
| Lorillard, Inc. | 1,300,000 | 81,822 |
| Kimberly-Clark Corp. | 500,000 | 57,770 |
| | | 5,432,475 |
| Energy 7.31% | | |
| ConocoPhillips | 9,410,000 | 649,855 |
| Suncor Energy Inc. | 12,996,034 | 412,768 |
| Noble Energy, Inc. | 7,678,400 | 364,187 |
Fundamental Investors — Page 3 of 5
Common stocks
Energy (continued) | Shares | Value
(000) |
| EOG Resources, Inc. | 3,935,000 | $362,295 |
| FMC Technologies, Inc.1 | 7,200,000 | 337,248 |
| Royal Dutch Shell PLC, Class B (ADR) | 4,663,834 | 324,416 |
| Enbridge Inc. | 5,284,485 | 271,729 |
| Baker Hughes Inc. | 4,500,000 | 252,315 |
| Chevron Corp. | 2,226,137 | 249,728 |
| Concho Resources Inc.1 | 2,420,000 | 241,395 |
| Chesapeake Energy Corp. | 12,020,000 | 235,231 |
| Peyto Exploration & Development Corp.3 | 8,107,500 | 233,567 |
| Southwestern Energy Co.1 | 7,000,000 | 191,030 |
| Kinder Morgan, Inc. | 3,990,000 | 168,817 |
| Denbury Resources Inc.3 | 20,500,000 | 166,665 |
| Occidental Petroleum Corp. | 2,000,000 | 161,220 |
| Phillips 66 | 1,670,000 | 119,739 |
| Murphy Oil Corp. | 2,140,000 | 108,113 |
| BG Group PLC2 | 7,950,000 | 105,820 |
| Schlumberger Ltd. | 850,000 | 72,599 |
| Oil States International, Inc.1 | 1,467,000 | 71,736 |
| Pioneer Natural Resources Co. | 449,469 | 66,903 |
| CONSOL Energy Inc. | 1,600,000 | 54,096 |
| Oceaneering International, Inc. | 341,364 | 20,076 |
| Seventy Seven Energy, Inc.1 | 486,429 | 2,632 |
| | | 5,244,180 |
| Materials 4.06% | | |
| Potash Corp. of Saskatchewan Inc. | 19,130,000 | 675,672 |
| E.I. du Pont de Nemours and Co. | 6,000,000 | 443,640 |
| FMC Corp. | 6,758,000 | 385,409 |
| LyondellBasell Industries NV | 4,770,000 | 378,690 |
| Mosaic Co. | 5,500,000 | 251,075 |
| Monsanto Co. | 1,500,000 | 179,205 |
| Glencore PLC2 | 38,000,000 | 174,904 |
| MeadWestvaco Corp. | 3,660,000 | 162,467 |
| Praxair, Inc. | 900,000 | 116,604 |
| Dow Chemical Co. | 1,858,318 | 84,758 |
| HudBay Minerals Inc. | 6,744,900 | 58,752 |
| | | 2,911,176 |
| Telecommunication services 1.33% | | |
| Verizon Communications Inc. | 6,980,362 | 326,541 |
| SoftBank Corp.2 | 3,740,000 | 222,576 |
| Deutsche Telekom AG2 | 12,800,000 | 205,162 |
| Orange2 | 6,000,000 | 102,038 |
| TDC A/S2 | 12,457,767 | 94,936 |
| | | 951,253 |
| Utilities 0.28% | | |
| PG&E Corp. | 2,500,000 | 133,100 |
| FirstEnergy Corp. | 1,700,000 | 66,283 |
| | | 199,383 |
| Miscellaneous 2.29% | | |
| Other common stocks in initial period of acquisition | | 1,640,563 |
| Total common stocks (cost: $44,651,678,000) | | 68,360,750 |
Fundamental Investors — Page 4 of 5
| Short-term securities 4.54% | Principal amount
(000) | Value
(000) |
| Abbott Laboratories 0.10%–0.14% due 2/2/2015–2/24/20154 | $58,000 | $57,994 |
| Caterpillar Financial Services Corp. 0.10% due 2/2/2015 | 22,900 | 22,897 |
| Chariot Funding, LLC 0.26% due 1/26/20154 | 25,000 | 24,998 |
| Chevron Corp. 0.12% due 1/21/2015–2/18/20154 | 105,600 | 105,584 |
| Citicorp 0.20% due 3/9/2015 | 14,000 | 13,995 |
| Coca-Cola Co. 0.14%–0.17% due 1/23/2015–4/23/20154 | 107,700 | 107,678 |
| Emerson Electric Co. 0.09%–0.13% due 1/9/2015–3/18/20154 | 67,600 | 67,589 |
| Fannie Mae 0.08%–0.12% due 1/5/2015–6/15/2015 | 742,731 | 742,563 |
| Federal Farm Credit Banks 0.11%–0.14% due 3/30/2015–8/10/2015 | 123,800 | 123,728 |
| Federal Home Loan Bank 0.06%–0.16% due 1/21/2015–11/6/2015 | 926,800 | 926,585 |
| Freddie Mac 0.09%–0.17% due 1/6/2015–7/23/2015 | 416,785 | 416,643 |
| John Deere Capital Corp. 0.10% due 1/14/2015–1/21/20154 | 29,500 | 29,498 |
| John Deere Financial Ltd. 0.11% due 1/7/2015–1/21/20154 | 58,500 | 58,497 |
| Jupiter Securitization Co., LLC 0.21%–0.27% due 5/27/2015–8/11/20154 | 75,100 | 74,970 |
| Microsoft Corp. 0.09% due 2/9/20154 | 50,000 | 49,995 |
| National Rural Utilities Cooperative Finance Corp. 0.11% due 1/13/2015 | 20,000 | 19,999 |
| Precision Castparts Corp. 0.00% due 1/27/20154 | 46,000 | 45,995 |
| Private Export Funding Corp. 0.26% due 1/22/20154 | 46,600 | 46,597 |
| Procter & Gamble Co. 0.11%–0.12% due 1/6/2015–1/12/20154 | 69,700 | 69,699 |
| Regents of the University of California 0.13%–0.15% due 2/4/2015–4/9/2015 | 52,700 | 52,689 |
| U.S. Treasury Bills 0.10%–0.15% due 6/25/2015–7/23/2015 | 129,100 | 129,064 |
| United Parcel Service Inc. 0.13% due 1/2/20154 | 54,300 | 54,300 |
| Walt Disney Co. 0.08% due 1/26/20154 | 10,600 | 10,599 |
| Total short-term securities (cost: $3,251,921,000) | | 3,252,156 |
| Total investment securities 99.90% (cost: $47,903,599,000) | | 71,612,906 |
| Other assets less liabilities 0.10% | | 70,713 |
| Net assets 100.00% | | $71,683,619 |
As permitted by U.S. Securities and Exchange Commission regulations, “Miscellaneous” securities include holdings in their first year of acquisition that have not previously been publicly disclosed.
| 1 | Security did not produce income during the last 12 months. |
| 2 | Valued under fair value procedures adopted by authority of the board of trustees. The total value of all such securities, including those in “Miscellaneous,“ was $5,264,961,000, which represented 7.34% of the net assets of the fund. This entire amount relates to certain securities trading outside the U.S. whose values were adjusted as a result of significant market movements following the close of local trading. |
| 3 | Represents an affiliated company as defined under the Investment Company Act of 1940. |
| 4 | Acquired in a transaction exempt from registration under Section 4(2) of the Securities Act of 1933. May be resold in the U.S. in transactions exempt from registration, normally to qualified institutional buyers. The total value of all such securities was $803,993,000, which represented 1.12% of the net assets of the fund. |
| Key to abbreviation | | | |
| ADR = American Depositary Receipts | | | |
Investments are not FDIC-insured, nor are they deposits of or guaranteed by a bank or any other entity, so they may lose value.
Investors should carefully consider investment objectives, risks, charges and expenses. This and other important information is contained in the fund prospectus and summary prospectus, which can be obtained from your financial professional and should be read carefully before investing. You may also call American Funds Service Company (AFS) at (800) 421-4225 or visit the American Funds website at americanfunds.com.
| MFGEFPX-010-0215O-S42202 | Fundamental Investors — Page 5 of 5 |
REPORT OF INDEPENDENT REGISTERED PUBLIC ACCOUNTING FIRM
To the Shareholders and Board of Trustees of
American Funds Fundamental Investors – Fundamental Investors:
We have audited the accompanying statement of assets and liabilities of American Funds Fundamental Investors – Fundamental Investors (the “Fund”), including the summary schedule of investments, as of December 31, 2014, and the related statements of operations for the year then ended, the statements of changes in net assets for each of the two years in the period then ended (collectively, the “financial statements”), the financial highlights for each of the five years in the period then ended (the financial statements and financial highlights are included in Item 1 of this Form N-CSR), and the schedule of investments in securities as of December 31, 2014 (included in Item 6 of this Form N-CSR). These financial statements, financial highlights, and schedule of investments in securities are the responsibility of the Fund’s management. Our responsibility is to express an opinion on these financial statements, financial highlights, and schedule of investments in securities based on our audits.
We conducted our audits in accordance with the standards of the Public Company Accounting Oversight Board (United States). Those standards require that we plan and perform the audit to obtain reasonable assurance about whether the financial statements, financial highlights, and schedule of investments in securities are free of material misstatement. An audit includes examining, on a test basis, evidence supporting the amounts and disclosures in the financial statements and schedule of investments in securities. Our procedures included confirmation of securities owned as of December 31, 2014, by correspondence with the custodian and brokers; where replies were not received from brokers, we performed other auditing procedures. An audit also includes assessing the accounting principles used and significant estimates made by management, as well as evaluating the overall financial statement presentation. We believe that our audits provide a reasonable basis for our opinion.
In our opinion, the financial statements, financial highlights, and schedule of investments in securities referred to above present fairly, in all material respects, the financial position of American Funds Fundamental Investors – Fundamental Investors as of December 31, 2014, and the results of its operations for the year then ended, the changes in its net assets for each of the two years in the period then ended, and the financial highlights for each of the five years in the period then ended, in conformity with accounting principles generally accepted in the United States of America.
DELOITTE & TOUCHE LLP
Costa Mesa, California
February 11, 2015
ITEM 7 – Disclosure of Proxy Voting Policies and Procedures for Closed-End Management Investment Companies
Not applicable to this Registrant, insofar as the Registrant is not a closed-end management investment company.
ITEM 8 – Portfolio Managers of Closed-End Management Investment Companies
Not applicable to this Registrant, insofar as the Registrant is not a closed-end management investment company.
ITEM 9 – Purchases of Equity Securities by Closed-End Management Investment Company and Affiliated Purchasers
Not applicable to this Registrant, insofar as the Registrant is not a closed-end management investment company.
ITEM 10 – Submission of Matters to a Vote of Security Holders
There have been no material changes to the procedures by which shareholders may recommend nominees to the Registrant’s board of trustees since the Registrant last submitted a proxy statement to its shareholders. The procedures are as follows. The Registrant has a nominating and governance committee comprised solely of persons who are not considered ‘‘interested persons’’ of the Registrant within the meaning of the Investment Company Act of 1940, as amended. The committee periodically reviews such issues as the board’s composition, responsibilities, committees, compensation and other relevant issues, and recommends any appropriate changes to the full board of trustees. While the committee normally is able to identify from its own resources an ample number of qualified candidates, it will consider shareholder suggestions of persons to be considered as nominees to fill future vacancies on the board. Such suggestions must be sent in writing to the nominating and governance committee of the Registrant, c/o the Registrant’s Secretary, and must be accompanied by complete biographical and occupational data on the prospective nominee, along with a written consent of the prospective nominee for consideration of his or her name by the nominating and governance committee.
ITEM 11 – Controls and Procedures
| (a) | The Registrant’s Principal Executive Officer and Principal Financial Officer have concluded, based on their evaluation of the Registrant’s disclosure controls and procedures (as such term is defined in Rule 30a-3 under the Investment Company Act of 1940), that such controls and procedures are adequate and reasonably designed to achieve the purposes described in paragraph (c) of such rule. |
| | |
| (b) | There were no changes in our internal control over financial reporting during the quarter ended December 31, 2014, which were identified in connection with management's evaluation required by paragraph (d) of Rule 13a-15 and 15d-15 under the Exchange Act, that have materially affected, or are reasonably likely to materially affect, our internal control over financial reporting, other than as provided below. Effective November 10, 2014, the American Funds Fundamental Investors’s investment adviser implemented a new accounting system. In connection with introducing this new system, additional automated and manual controls were implemented and some existing controls were modified. None of these changes were in response to any identified deficiency or weakness in the American Funds Fundamental Investors’s internal control over financial reporting. |
ITEM 12 – Exhibits
| (a)(1) | The Code of Ethics that is the subject of the disclosure required by Item 2 is attached as an exhibit hereto. |
| | |
| (a)(2) | The certifications required by Rule 30a-2 of the Investment Company Act of 1940 and Sections 302 and 906 of the Sarbanes-Oxley Act of 2002 are attached as exhibits hereto. |
SIGNATURES
Pursuant to the requirements of the Securities Exchange Act of 1934 and the Investment Company Act of 1940, the Registrant has duly caused this report to be signed on its behalf by the undersigned, thereunto duly authorized.
| | AMERICAN FUNDS FUNDAMENTAL INVESTORS |
| | |
| | By /s/ Paul F. Roye |
| | Paul F. Roye, Executive Vice President and Principal Executive Officer |
| | |
| | Date: February 27, 2015 |
Pursuant to the requirements of the Securities Exchange Act of 1934 and the Investment Company Act of 1940, this report has been signed below by the following persons on behalf of the Registrant and in the capacities and on the dates indicated.
| By /s/ Paul F. Roye |
Paul F. Roye, Executive Vice President and Principal Executive Officer |
| |
| Date: February 27, 2015 |
| By /s/ Jeffrey P. Regal |
Jeffrey P. Regal, Treasurer and Principal Financial Officer |
| |
| Date: February 27, 2015 |