UNITED STATES
SECURITIES AND EXCHANGE COMMISSION
Washington, D.C. 20549
FORM N-CSR
Certified Shareholder Report of
Registered Management Investment Companies
Investment Company Act File Number: 811-00032
American Funds Fundamental Investors
(Exact Name of Registrant as Specified in Charter)
6455 Irvine Center Drive
Irvine, California 92618
(Address of Principal Executive Offices)
Registrant's telephone number, including area code: (213) 486-9200
Date of fiscal year end: December 31
Date of reporting period: December 31, 2016
Michael W. Stockton
American Funds Fundamental Investors
333 South Hope Street
Los Angeles, California 90071
(Name and Address of Agent for Service)
ITEM 1 – Reports to Stockholders

Flexibility
enhances finding
durable investing
opportunities.
 | Fundamental Investors®
Annual report
for the year ended
December 31, 2016 |
|
|
Fundamental Investors seeks long-term growth of capital and income.
This fund is one of more than 40 offered by one of the nation’s largest mutual fund families, American Funds, from Capital Group. For more than 85 years, Capital has invested with a long-term focus based on thorough research and attention to risk.
Fund results shown in this report, unless otherwise indicated, are for Class A shares at net asset value. If a sales charge (maximum 5.75%) had been deducted, the results would have been lower. Results are for past periods and are not predictive of results for future periods. Current and future results may be lower or higher than those shown. Share prices and returns will vary, so investors may lose money. Investing for short periods makes losses more likely. Investments are not FDIC-insured, nor are they deposits of or guaranteed by a bank or any other entity, so they may lose value. For current information and month-end results, visit americanfunds.com.
See page 4 for Class A share results with relevant sales charges deducted. For other share class results, visit americanfunds.com and americanfundsretirement.com.
Investment results assume all distributions are reinvested and reflect applicable fees and expenses. When applicable, investment results reflect fee waivers, without which results would have been lower. Visit americanfunds.com for more information.
The fund’s 30-day yield for Class A shares as of January 31, 2017, calculated in accordance with the U.S. Securities and Exchange Commission (SEC) formula, was 1.50%. The fund’s 12-month distribution rate for Class A shares as of that date was 1.42%. Both reflect the 5.75% maximum sales charge. The SEC yield reflects the rate at which the fund is earning income on its current portfolio of securities while the distribution rate reflects the fund’s past dividends paid to shareholders. Accordingly, the fund’s SEC yield and distribution rate may differ.
Investing outside the United States may be subject to risks, such as currency fluctuations, periods of illiquidity and price volatility. These risks may be heightened in connection with investments in developing countries. Refer to the fund prospectus and the Risk Factors section of this report for more information on these and other risks associated with investing in the fund.

Fellow investors:
For the 12 months ended December 31, 2016, Fundamental Investors gained 12.54%. This return includes reinvested distributions totaling $2.57 a share. Distributions include regular quarterly dividends of 61 cents a share, a 26-cents-a-share special dividend and long-term capital gains payments of $1.70 a share.
The fund’s results were ahead of its primary benchmark, the unmanaged Standard & Poor’s 500 Composite Index, a market capitalization-weighted index based on the results of 500 widely held common stocks, which rose 11.96%. Fundamental Investors’ return relative to its growth-and-income fund peers was greater, as measured by the Lipper Growth and Income Funds Index, which climbed 10.47%.
The fund’s results have topped those of its Lipper peers in multiple periods since its inception. In addition, Fundamental Investors has outpaced the S&P 500 over its lifetime. Although the annual advantages might seem small, when compounded over longer time frames, they have translated into added wealth for long-term investors.
Results at a glance
For periods ended December 31, 2016, with all distributions reinvested
| | | Cumulative
total returns | | Average annual
total returns |
| | | 1 year | | 5 years | | 10 years | | Lifetime
(since 8/1/78)1 |
| | | | | | | | | |
| Fundamental Investors (Class A shares) | | | 12.54 | % | | | 14.32 | % | | | 7.15 | % | | | 12.36 | % |
| Standard & Poor’s 500 Composite Index2,3 | | | 11.96 | | | | 14.66 | | | | 6.95 | | | | 11.51 | |
| Lipper Growth and Income Funds Index4 | | | 10.47 | | | | 11.60 | | | | 5.02 | | | | 10.48 | |
| MSCI World Index3,5 | | | 7.51 | | | | 10.41 | | | | 3.83 | | | | 9.37 | |
| 1 | Date Capital Research and Management Company began managing the fund. |
| 2 | Source: S&P Dow Jones Indices LLC. |
| 3 | The market indexes are unmanaged and, therefore, have no expenses. Investors cannot invest directly in an index. |
| 4 | Source: Thomson Reuters Lipper. Lipper indexes track the largest mutual funds (no more than 30), represented by one share class per fund, in the corresponding Lipper category. |
| 5 | Source: MSCI. Results reflect dividends net of withholding taxes. |

U.S. stocks advanced against a volatile backdrop
In a year marked by volatility and political upheaval, U.S. stocks rallied with the help of solid economic data and low interest rates. A strong job market and low energy costs have supported consumer spending.
Stocks got off to a rocky start early in the year. Concerns over a decelerating Chinese economy, falling oil prices and a potential U.S. recession sent markets lower in January. The S&P 500 fell more than 10% into a correction by early February, but stocks then began to recover on reassuring domestic economic data heading into March.
U.S. stocks advanced late in the year following the November presidential election, buoyed by the prospects for tax cuts, regulatory reductions and fiscal stimulus. Several key market indexes hit a series of all-time highs, and the Federal Reserve’s decision to raise rates was interpreted as a vote of confidence in sustained economic growth.
U.S. stocks outpace international markets
European stocks advanced in local currency terms, supported by central bank stimulus measures and modestly improving economic growth. Markets moved higher despite rising political tensions, including Great Britain’s pivotal vote to leave the European Union. The Brexit decision raised fears of dire economic consequences, but the short-term impact was primarily felt in currencies while the European economies remained stable. Because of the currency weakness, European stocks ended the year essentially flat in U.S. dollar terms.
Japanese equities declined slightly in local currency terms as the benefits of an accommodative Bank of Japan were largely offset by lackluster economic data and currency headwinds. The central bank continued aggressive monetary stimulus, but inflation and economic growth remained low.
Emerging markets notched their strongest returns since 2012, helped by strengthening commodity prices, accommodative monetary policies and reform efforts in some countries. There was a range of returns, with China, for example, the world’s largest emerging market, finishing essentially flat after beginning the year with steep declines, while Brazil gained 66%.
Commodity crosscurrents
Adding to the volatile market backdrop were swings in commodity prices. After initially declining 30% to below $30 per barrel by early February, U.S. crude oil staged a turnaround. The price rose 45% for the year to just under $54 per barrel as OPEC nations finally agreed to curb production in late November. Copper also rebounded significantly, rising on signs of stabilization in the economic outlook for China and other emerging markets.
Companies over themes
We continue to note that the fund’s portfolio is carefully constructed based on the value and merits of individual companies rather than around a single overarching macroeconomic theme or investment thesis.
This company-by-company approach can be seen in the fund’s 10 largest holdings, which span a wide range of industries. Returns from six of these companies contributed to the fund outpacing both its benchmark and peers, including JPMorgan Chase (+30.68%), Berkshire Hathaway (+23.42%), Comcast (+22.36%), Broadcom (+21.78%), Schlumberger (+20.36%) and Microsoft (+12.00%).
Energy stocks buoy results; health care drags
Economically sensitive sectors outpaced defensive areas of the market, highlighted by strong returns in energy, materials and industrial stocks. Health care and consumer staples, which had done well over the last few years due to their steady earnings growth, lagged the overall market.
Following a precipitous drop that began in mid-2014, the rebound in oil prices supported gains in the energy sector. In addition to Schlumberger, Halliburton (+58.90%), Chevron (+30.84%), Royal Dutch Shell (+25.91%), and BP (+19.23%) were all key contributors. We took advantage of the weakness earlier in the year to buy solid companies at attractive prices and add to our exposure to the sector while commodities were under pressure.
Health care companies weighed on the fund’s results. Vertex Pharmaceuticals (-41.45%), Regeneron Pharmaceuticals (-32.38%), Gilead Sciences (-29.23%) and Express Scripts (-21.30%) were among the biggest detractors. Pharmaceutical companies were hurt by greater political focus on pricing and a lull in new products following several years of anticipation about their prospects. Uncertainty over the future of the Affordable Care Act also weighed on the sector.
A consistent approach with a long-term focus
The fund’s results reflect the fact that at the individual holding level, the path to solid long-term results seldom moves steadily upward. A superior track record tends to be built using an investment approach that centers on the merits of the underlying company rather than near-term moves in its stock price, short-term company operating results, instances of market turmoil or market-moving world events.
We expect that we will continue to see changes in the investment landscape that are difficult to anticipate. That is the nature of investing. However, our investment professionals continue to find opportunities across the available investment universe.
In some cases, we are finding opportunities in technology companies that are driving value creation through innovation, and in other cases we are finding opportunities in commodity businesses where earnings power may be temporarily depressed due to cyclical factors. Our goal is to continue to construct a diverse portfolio that can generate consistently superior returns for investors.
We are confident that our emphasis on companies will allow us to uncover opportunities in the U.S. and abroad for shareholders with the patience to remain invested through changing market environments.
We thank you for your continued investment in Fundamental Investors.
Sincerely,

Brady Enright
President
February 9, 2017
For current information about the fund, visit americanfunds.com.
The value of a long-term perspective
Fund results shown are for Class A shares and reflect deduction of the maximum sales charge of 5.75% on the $10,000 investment.1 Thus, the net amount invested was $9,425.2 Results are for past periods and are not predictive of results for future periods. Current and future results may be lower or higher than those shown. Share prices and returns will vary, so investors may lose money. For current information and month-end results, visit americanfunds.com.
The results shown are before taxes on fund distributions and sale of fund shares.
| 1 | As outlined in the prospectus, the sales charge is reduced for accounts (and aggregated investments) of $25,000 or more and is eliminated for purchases of $1 million or more. There is no sales charge on dividends or capital gain distributions that are reinvested in additional shares. |
| 2 | The maximum initial sales charge was 8.50% prior to July 1, 1988. |
| 3 | Includes reinvested dividends of $150,477 and reinvested capital gain distributions of $284,709. |
| 4 | Source: S&P Dow Jones Indices LLC. Standard & Poor’s 500 Composite Index is unmanaged and, therefore, has no expenses. Investors cannot invest directly in an index. |
| 5 | Source: Thomson Reuters Lipper. Results of the Lipper Growth and Income Funds Funds Index do not reflect any sales charges. Lipper indexes track the largest mutual funds (no more than 30), represented by one share class per fund, in the corresponding Lipper category. |
| 6 | Includes reinvested capital gain distributions of $137,530, but does not reflect income dividends of $72,037 taken in cash. |
| 7 | Computed from data supplied by the U.S. Department of Labor, Bureau of Labor Statistics. |
| 8 | For the period August 1, 1978 (when Capital Research and Management Company became investment adviser), through December 31, 1978. |

How a $10,000 investment has grown
The chart and the table below it illustrate how a $10,000 investment in the fund grew between August 1, 1978 — when Capital Research and Management Company became the investment adviser for Fundamental Investors — and December 31, 2016. The chart also shows how the unmanaged Standard & Poor’s 500 Composite Index and the Lipper Growth and Income Funds Index fared over this same period and what happened to inflation (as measured by the Consumer Price Index).


Flexibility enhances finding durable investing opportunities.
Fundamental Investors’ portfolio managers have the flexibility to pursue high conviction opportunities across a broad range of companies to achieve the fund’s objectives of capital appreciation and income.
“Fundamental Investors is a value-oriented fund, but we have the flexibility to define value in different ways,” says Brady Enright, a portfolio manager and the fund’s principal investment officer. This flexibility allows for investments in undervalued, overlooked companies or those that may have hidden assets. In the following pages, we take a closer look at some of the companies that illustrate how flexibility has enhanced our investment professionals’ pursuit of the fund’s goals.
A flexible approach to income with Amazon
Amazon’s prospects for continued capital appreciation are a good fit for Fundamental Investors’ growth objective. Having opened its virtual doors in July 1995, Amazon’s core e-commerce business dominates online retailing. In a 2016 survey, 53% of American households shopped on Amazon at least once a month. However, the stock could be a controversial holding for many growth-and-income funds since it generates little in terms of current earnings and doesn’t pay a dividend.
“Had the fund’s guidelines limited investments to companies that pay a dividend or have high profit margins, we wouldn’t have been able to invest in Amazon,” says Mark Casey, one of the fund’s portfolio managers. “But because of the flexibility to own non-dividend-paying stocks and low-margin companies, we have been able to grow our Amazon position into the fund’s second largest holding, which has been wonderful for our shareholders.”
Amazon’s high valuation may also appear at odds with the portfolio managers’ style of often seeking undervalued opportunities. “Sometimes we see a lot of value in fast-growing businesses with high valuations, and sometimes we see it in companies with lower valuations,” notes Brady.
When Amazon became a large position in the fund in 2010, it was already well ahead of the competition in e-commerce. So investors may wonder what was overlooked about Amazon? Fundamental research revealed that the company’s recently formed cloud-computing division, Amazon Web Services (AWS), was emerging as the dominant platform being used by web-oriented companies and startups.
“Fundamental Investors is a value-oriented fund, but we have the flexibility to define value in different ways.”
The cloud is a global network of massive facilities filled with computer servers that runs software to store, manage and process data remotely. Cloud providers such as Amazon rent computing services over the internet. This innovation allows startups to reduce their need to invest in technology so they can focus on new product development.
“In the period from 2010 to 2014, our research indicated that AWS was well ahead of its competitors, but Amazon didn’t talk publicly about how well AWS was doing because the company didn’t want to attract the attention of competitors. This created a great opportunity to invest in a hidden asset,” says Mark. “When Amazon first disclosed financial information for AWS in 2015, it was a wake-up call to the investment community, which could finally see that this business was large, highly profitable and fast growing.”
In fact, Amazon’s cloud-computing platform is the fastest-growing business in the history of technology services. AWS grew its revenue from $500 million in 2010 to nearly $5 billion four years later.
Large companies can also take advantage of cloud computing to reduce or even eliminate the cost of maintaining their own data centers. With many non-internet companies still in the early stages of transitioning to cloud-service providers, Mark believes Amazon is well-positioned to remain at the center of corporate computing’s future.
A flexible approach to yield with GE and Citigroup
General Electric is more representative of a growth-and-income fund holding, with a history of having paid a dividend each quarter for over 100 years. A large holding in GE, which has a relatively high dividend yield compared with the market, provides the flexibility to balance owning another stock with a lower yield in achieving the fund’s income objective.
GE is certainly well known, as it was one of the original stocks comprising the Dow Jones Industrial Average in 1896 when the index first consisted entirely of industrials. The company has historically been a manufacturing leader of lighting and appliances as well as transportation, power and medical equipment. However, at the time of the 2008 financial crisis, the company had grown a second primary business in financial services focused on consumer and corporate lending.
The fallout from the financial crisis led GE to reduce its dividend by more than two-thirds and its financial division was subjected to significant regulation, leaving the company out of favor among investors. However, based on her experience as a former capital goods analyst and the likelihood the company would restructure, Dina Perry, one of the fund’s portfolio managers, invested in GE during the depths of the crisis.
“I like investing in unloved companies,” says Dina. “GE is redirecting itself away from finance into manufacturing and making a number of acquisitions. Over time, the market should recognize the growth potential of GE’s enhanced mix of industrial businesses.”
With the sale of its financial services assets nearly complete, GE is expanding its leadership in energy markets. In 2015, GE acquired Alstom’s power and grid business — its largest acquisition ever. Management also announced in October 2016 plans to combine GE’s oil and gas business with Baker Hughes to create the second largest oilfield equipment and services company in the world. These moves are likely to help fuel GE’s core industrial growth, especially if energy markets continue to recover and infrastructure spending increases following the recent U.S. presidential election.
Since 2010, GE has also been steadily rebuilding its dividend, which gives Dina the flexibility to invest in high conviction opportunities with a lower yield. GE’s current 3% dividend yield helps balance a smaller holding such as Citigroup, which yields just 1%.
As losses from bad loans mounted during the 2008 financial crisis, Citigroup was forced to eliminate its dividend following a government bailout.
“When things were darkest, it was difficult but I had conviction that Citigroup would make it,” says Dina. “The stock was slow to recover, but following the recent election, investor sentiment has changed in favor of the financial sector.”
Flexibility within The Capital SystemSM
The Capital System is an investment approach that’s designed to combine individual accountability with teamwork. Under this approach, funds are divided among individual portfolio managers who decide how their respective portion will be invested. “We want everyone to be operating independently,” says Brady Enright, a portfolio manager and the fund’s principal investment officer.
In the case of Fundamental Investors, each portfolio manager is accountable for contributing to both the growth and income objectives of the fund. But rather than being limited to selecting from stocks that fit a very specific profile, portfolio managers have the flexibility to invest according to their strongest convictions to help the fund deliver on its twofold objective. This flexibility allows them to take different paths without limiting their choices among the broad investment universe of companies.
For example, each portfolio manager must generate income in the form of dividends, but not every stock must pay a dividend. Rather, a manager seeks to balance a mix of stocks that, overall, achieves the fund’s income objective.
In addition, capital appreciation comes in more than one form. Growth stocks with relatively high price-to-earnings ratios are often companies that are growing their business at an above-average rate such that their stocks may continue to gain in value if earnings keep pace. At the same time, stocks with relatively low valuation ratios may represent companies that have fallen out of favor or been in distress — but that are now on the mend and may be poised for a rebound.
The fund’s guidelines provide the flexibility to invest up to 35% of its assets outside the United States, including, to a very limited extent, in emerging markets. The fund’s portfolio managers employ the same process and standards for each investment — regardless of the country of domicile — and seek to retain the character of the fund even as the mix of companies changes over time. While this geographic flexibility has served the fund well in the past, its non-U.S. holdings are currently 13% of assets, having troughed near 9% during 2015. The fund’s portfolio managers continue to pay close attention to well-valued companies both in the U.S. and abroad.
The fund’s portfolio managers also have the flexibility to invest among different industries. In 2016, the fund took advantage of early weakness in commodity markets to meaningfully increase its investment in energy companies from 7% to 12%.
“With the flexibility to invest in companies with solid fundamentals and attractive long-term business prospects, we believe that over time the market will recognize that value, providing a solid return,” says Brady.

Dina Perry
Washington, D.C.
39 years of experience

Brady Enright
San Francisco
25 years of experience

Mike Kerr
Los Angeles
34 years of experience

Martin Romo
Los Angeles
25 years of experience

Mark Casey
San Francisco
17 years of experience

Ron Morrow
Los Angeles
49 years of experience

Greg Johnson
Los Angeles
23 years of experience
List of investment professionals and their years of experience are as of the prospectus dated March 1, 2017 (unaudited).
“Fundamental Investors has generated strong returns for shareholders with flexibility helping to balance the fund’s dual growth and income objectives.”
The bank has largely fixed its problems while retaining valuable franchises such as its international network and credit card business. As the Federal Reserve continues to increase rates, profit margins should improve.
Citigroup reinstated its dividend in 2011 and began increasing it in 2015. Citigroup also has the opportunity to support attractive growth in earnings per share by repurchasing stock, which should help meet the fund’s growth objective near term.
A flexible approach to geography with Alphabet and Baidu
Fundamental Investors has been an investor in Google, the most popular search engine in much of the world, since 2004 when it went public at a discount to its peers. Our portfolio managers have the flexibility to take advantage of their deep knowledge of U.S.-based businesses such as Google to buy shares of similar quality businesses abroad at lower valuations.
Members of the investment community who primarily consider stocks in their fund’s benchmark index may have overlooked the opportunity to be an early investor in Google. A company isn’t added to a benchmark such as the Standard & Poor’s 500 Composite Index (an index of 500 leading companies and a broad gauge of U.S. common stocks) at the time of its initial public offering. Google is now the largest subsidiary of parent holding company Alphabet, which management created in 2015 to separate Google’s financial results from the company’s other businesses.
Based on the insights gained from his long-term holding in Google, Mark bought shares of Baidu in 2012, the leading search business in China. There are a number of parallels between Alphabet and Baidu. In addition to dominating their respective internet search markets, both are investing in disruptive technologies such as autonomous driving and artificial intelligence. These investments are a drag on reported earnings for both companies today.
Alphabet’s Google search business is valued at over 20 times earnings. Excluding losses associated with its technology investments, Baidu’s search business is valued at less than 15 times earnings. “You can buy Baidu’s search business at a discount,” say Mark, “while the company is investing in a lot of very interesting technologies with long-term potential.”
Although it will take time to develop fully autonomous cars that can safely operate under all road and weather conditions, the market is essentially overlooking potential new avenues for creating value. Baidu appears to be further ahead in developing autonomous vehicles than any of its competitors in China, with the potential to be a market leader when this technology hits the streets.
A flexible approach to value with Broadcom
Avago Technologies illustrates the flexibility Fundamental Investors’ portfolio managers have to pursue opportunities that are overlooked and difficult to categorize. Now known as Broadcom, the investment has grown to be the fund’s third largest holding.
Avago had several characteristics that made it unlikely to be included in a typical large-cap, U.S. value-oriented growth-and-income fund. As with Google, the fund bought shares of Avago in 2010 before it was added to an index, and, like Baidu, it’s incorporated overseas. Furthermore, Avago didn’t pay a dividend initially.
At the time of its 2009 IPO, Avago was off the radar of many fund managers due to its corporate history. Avago had initially been the semiconductor division of computer giant Hewlett-Packard. HP spun off its semiconductor division together with a mix of technology assets into a new public company called Agilent. A private equity firm later acquired the semiconductor business from Agilent to form Avago, which it incorporated in Singapore.
The semiconductor unit was relatively small and undermanaged when it was part of HP and Agilent, but it possessed valuable underlying technology assets. As an independent company, management refocused Avago’s resources on fast-growing, higher margin proprietary products.
“We really liked the subset of businesses Avago had and thought that over time investors would recognize that it was a higher quality company than was suggested by its low valuation,” says Brady. “There was an opportunity for the company to not only grow its business but also be rewarded with a higher valuation over time if it was successful.”
By 2011, Avago had substantially reduced its debt and begun to pay a dividend. Management later expanded its strategy
to become the leading diversified communications semiconductor company through a series of acquisitions beginning in 2013.
Avago became one of the few members of the S&P 500 incorporated abroad in 2014 when it replaced LSI, which it acquired. In 2016, Avago laid the groundwork for a new phase of growth by acquiring Broadcom and adopting its name in one of the largest technology acquisitions ever.
“Our initial investment in Avago has been a real success story for the fund over a long period of time,” says Brady. “The company first improved the mix of businesses and end markets it serves and more recently integrated a number of acquisitions.”
The holding contributes to both the growth and the income objectives of the fund. While it has never been a high-yielding stock, management has increased the dividend over time. In December, Broadcom doubled the dividend to keep pace with the fast growth of the business.
Pursuing objectives
Flexibility has been instrumental to Fundamental Investors’ success, and the fund has surpassed its primary benchmark index over the long term. Using a global research-driven approach, the fund’s portfolio managers have identified companies with solid fundamentals. “Fundamental Investors has generated strong returns for shareholders with flexibility helping to balance the fund’s dual growth and income objectives,” says Brady. ■
The New Geography of Investing®
While most of the companies that Fundamental Investors invests in are based in the U.S., virtually all of them do business on a global basis. This global perspective helps the fund diversify its customer base and sources of revenue. The chart below shows where the companies we invest in are headquartered, as well as the sources of their revenue. Active management can help investors with a domestic focus gain exposure to the global marketplace.
Equity portion breakdown by domicile (%)
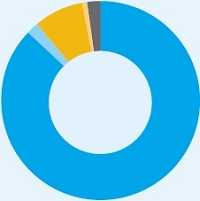
| | Region | | Fund | | Index |
 | United States | | | 87 | % | | | 100 | % |
 | Canada | | | 2 | | | | — | |
 | Europe | | | 8 | | | | — | |
 | Japan | | | 1 | | | | — | |
 | Asia-Pacific ex. Japan | | | — | | | | — | |
 | Emerging markets | | | 2 | | | | — | |
| | Total | | | 100 | % | | | 100 | % |
Equity portion breakdown by revenue (%)
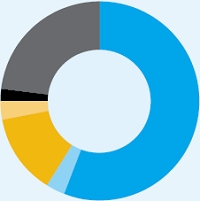
| | Region | | Fund | | Index |
| | United States | | | 56 | % | | | 64 | % |
| | Canada | | | 3 | | | | 2 | |
| | Europe | | | 13 | | | | 12 | |
| | Japan | | | 3 | | | | 2 | |
| | Asia-Pacific ex. Japan | | | 2 | | | | 1 | |
| | Emerging markets | | | 23 | | | | 19 | |
| | Total | | | 100 | % | | | 100 | % |
Compared with the S&P 500 as a percent of net assets. All figures include convertible securities.
Source: Capital Group (as of December 31, 2016).
Summary investment portfolio December 31, 2016
| Industry sector diversification | Percent of net assets |

| Country diversification by domicile | | Percent of
net assets |
| United States | | 84.12 | % |
| United Kingdom | | 4.02 | |
| Euro zone* | | 2.35 | |
| Canada | | 2.16 | |
| Taiwan | | 1.57 | |
| Switzerland | | .75 | |
| China | | .39 | |
| Japan | | .35 | |
| Sweden | | .20 | |
| Other countries | | .42 | |
| Short-term securities & other assets less liabilities | | 3.67 | |
| * | Countries using the euro as a common currency; those represented in the fund’s portfolio are France, Germany, Ireland and the Netherlands. |
| Common stocks 96.24% | | Shares | | | Value
(000) | |
| Information technology 20.74% | | | | | | | | |
| Microsoft Corp. | | | 58,004,100 | | | $ | 3,604,375 | |
| Broadcom Ltd. | | | 13,480,442 | | | | 2,382,938 | |
| Apple Inc. | | | 11,240,000 | | | | 1,301,817 | |
| Taiwan Semiconductor Manufacturing Co., Ltd.1 | | | 190,310,000 | | | | 1,065,743 | |
| Taiwan Semiconductor Manufacturing Co., Ltd. (ADR) | | | 6,438,430 | | | | 185,105 | |
| Alphabet Inc., Class C2 | | | 1,010,618 | | | | 780,015 | |
| Alphabet Inc., Class A2 | | | 442,800 | | | | 350,897 | |
| Texas Instruments Inc. | | | 14,575,300 | | | | 1,063,560 | |
| ASML Holding NV1 | | | 5,355,030 | | | | 599,997 | |
| ASML Holding NV (New York registered) | | | 3,240,000 | | | | 363,528 | |
| Intel Corp. | | | 25,159,600 | | | | 912,539 | |
| Visa Inc., Class A | | | 6,980,000 | | | | 544,579 | |
| Other securities | | | | | | | 3,373,979 | |
| | | | | | | | 16,529,072 | |
| | | | | | | | | |
| Consumer discretionary 14.64% | | | | | | | | |
| Amazon.com, Inc.2 | | | 4,016,000 | | | | 3,011,478 | |
| Comcast Corp., Class A | | | 26,211,000 | | | | 1,809,870 | |
| Home Depot, Inc. | | | 13,066,775 | | | | 1,751,993 | |
| Time Warner Inc. | | | 5,963,000 | | | | 575,608 | |
| Other securities | | | | | | | 4,521,703 | |
| | | | | | | | 11,670,652 | |
| | | | | | | | | |
| Financials 13.38% | | | | | | | | |
| JPMorgan Chase & Co. | | | 19,393,000 | | | | 1,673,422 | |
| Berkshire Hathaway Inc., Class A2 | | | 5,627 | | | | 1,373,669 | |
| Capital One Financial Corp. | | | 12,289,000 | | | | 1,072,092 | |
| BlackRock, Inc. | | | 2,023,100 | | | | 769,871 | |
| CME Group Inc., Class A | | | 6,271,437 | | | | 723,410 | |
| SunTrust Banks, Inc. | | | 12,585,110 | | | | 690,293 | |
| Wells Fargo & Co. | | | 12,315,000 | | | | 678,680 | |
| Citigroup Inc. | | | 11,000,000 | | | | 653,730 | |
| Chubb Ltd. | | | 3,975,000 | | | | 525,177 | |
| Goldman Sachs Group, Inc. | | | 1,970,000 | | | | 471,717 | |
| Other securities | | | | | | | 2,030,717 | |
| | | | | | | | 10,662,778 | |
| | | | | | | | | |
| Energy 12.00% | | | | | | | | |
| Schlumberger Ltd. | | | 19,606,000 | | | | 1,645,924 | |
| Royal Dutch Shell PLC, Class B (ADR) | | | 17,635,334 | | | | 1,022,320 | |
| Royal Dutch Shell PLC, Class B1 | | | 11,577,720 | | | | 330,380 | |
| Royal Dutch Shell PLC, Class A (ADR) | | | 219,224 | | | | 11,921 | |
| Royal Dutch Shell PLC, Class A1 | | | 241,970 | | | | 6,668 | |
| | | | | | Value | |
| | | Shares | | | (000) | |
| Chevron Corp. | | | 5,976,137 | | | $ | 703,391 | |
| Enbridge Inc. (CAD denominated) | | | 16,373,825 | | | | 689,026 | |
| BP PLC1 | | | 88,200,000 | | | | 548,030 | |
| ConocoPhillips | | | 9,875,000 | | | | 495,132 | |
| Other securities | | | | | | | 4,111,994 | |
| | | | | | | | 9,564,786 | |
| | | | | | | | | |
| Industrials 10.71% | | | | | | | | |
| Boeing Co. | | | 9,974,000 | | | | 1,552,752 | |
| General Electric Co. | | | 30,000,000 | | | | 948,000 | |
| Lockheed Martin Corp. | | | 3,283,200 | | | | 820,603 | |
| Parker-Hannifin Corp. | | | 4,550,000 | | | | 637,000 | |
| Union Pacific Corp. | | | 5,775,000 | | | | 598,752 | |
| Other securities | | | | | | | 3,975,668 | |
| | | | | | | | 8,532,775 | |
| | | | | | | | | |
| Health care 9.71% | | | | | | | | |
| Merck & Co., Inc. | | | 20,710,000 | | | | 1,219,198 | |
| UnitedHealth Group Inc. | | | 5,501,500 | | | | 880,460 | |
| Boston Scientific Corp.2 | | | 32,600,000 | | | | 705,138 | |
| Medtronic PLC | | | 7,905,000 | | | | 563,073 | |
| Aetna Inc. | | | 4,492,000 | | | | 557,053 | |
| Express Scripts Holding Co.2 | | | 7,424,710 | | | | 510,746 | |
| Vertex Pharmaceuticals Inc.2 | | | 6,608,600 | | | | 486,855 | |
| Other securities | | | | | | | 2,815,883 | |
| | | | | | | | 7,738,406 | |
| | | | | | | | | |
| Consumer staples 8.75% | | | | | | | | |
| Philip Morris International Inc. | | | 21,812,088 | | | | 1,995,588 | |
| Coca-Cola Co. | | | 27,110,000 | | | | 1,123,981 | |
| Reynolds American Inc. | | | 11,175,340 | | | | 626,266 | |
| British American Tobacco PLC1 | | | 9,017,000 | | | | 511,975 | |
| Walgreens Boots Alliance, Inc. | | | 6,106,000 | | | | 505,333 | |
| Kraft Heinz Co. | | | 5,400,000 | | | | 471,528 | |
| Other securities | | | | | | | 1,742,082 | |
| | | | | | | | 6,976,753 | |
| | | | | | | | | |
| Materials 3.47% | | | | | | | | |
| E.I. du Pont de Nemours and Co. | | | 16,003,500 | | | | 1,174,657 | |
| Praxair, Inc. | | | 6,145,000 | | | | 720,133 | |
| Other securities | | | | | | | 867,760 | |
| | | | | | | | 2,762,550 | |
| | | | | | | | | |
| Other 1.84% | | | | | | | | |
| Other securities | | | | | | | 1,472,503 | |
| | | | | | | | | |
| Miscellaneous 1.00% | | | | | | | | |
| Other common stocks in initial period of acquisition | | | | | | | 797,699 | |
| | | | | | | | | |
| Total common stocks (cost: $49,998,199,000) | | | | | | | 76,707,974 | |
| | | | | | | | | |
| Convertible stocks 0.09% | | | | | | | | |
| Utilities 0.09% | | | | | | | | |
| Other securities | | | | | | | 74,701 | |
| | | | | | | | | |
| Total convertible stocks (cost: $73,815,000) | | | | | | | 74,701 | |
| | | | | | | | | |
| Short-term securities 3.63% | | Principal amount
(000) | | | | | |
| Apple Inc. 0.53%–0.60% due 1/17/2017–1/25/20173 | | $ | 233,400 | | | | 233,339 | |
| Chariot Funding, LLC 0.85% due 1/13/20173 | | | 50,000 | | | | 49,989 | |
| Chevron Corp. 0.51%–0.54% due 1/19/2017–1/24/20173 | | | 120,100 | | | | 120,047 | |
| Coca-Cola Co. 0.76% due 3/15/20173 | | | 25,000 | | | | 24,964 | |
| | | | | | |
| Short-term securities (continued) | Principal amount
(000) | | | Value
(000) | |
| Federal Home Loan Bank 0.31%–0.55% due 1/4/2017–4/18/2017 | | $ | 1,590,900 | | | $ | 1,590,218 | |
| General Electric Co. 0.60% due 1/3/2017 | | | 900 | | | | 900 | |
| Other securities | | | | | | | 872,824 | |
| | | | | | | | | |
| Total short-term securities (cost: $2,892,178,000) | | | | | | | 2,892,281 | |
| Total investment securities 99.96% (cost: $52,964,192,000) | | | | | | | 79,674,956 | |
| Other assets less liabilities 0.04% | | | | | | | 32,646 | |
| | | | | | | | | |
| Net assets 100.00% | | | | | | $ | 79,707,602 | |
This summary investment portfolio is designed to streamline the report and help investors better focus on the fund’s principal holdings. See the inside back cover for details on how to obtain a complete schedule of portfolio holdings.
As permitted by U.S. Securities and Exchange Commission regulations, “Miscellaneous” securities include holdings in their first year of acquisition that have not previously been publicly disclosed.
“Other securities” includes all issues that are not disclosed separately in the summary investment portfolio.
Investments in affiliates
A company is an affiliate of the fund under the Investment Company Act of 1940 if the fund’s holdings in that company represent 5% or more of the outstanding voting shares. The value of the fund’s holdings in affiliated companies is included in “Other securities” under the respective industry sectors in the summary investment portfolio. Further details on these holdings and related transactions during the year ended December 31, 2016, appear below.
| | | Beginning shares | | | Additions | | | Reductions | | | Ending
shares | | | Dividend
income
(000) | | | Value of
affiliates at
12/31/2016
(000) | |
| Peyto Exploration & Development Corp. | | | 10,332,287 | | | | — | | | | — | | | | 10,332,287 | | | $ | 10,270 | | | $ | 255,566 | |
| Grafton Group PLC, units1 | | | 15,037,000 | | | | — | | | | — | | | | 15,037,000 | | | | 2,669 | | | | 101,756 | |
| CNO Financial Group, Inc.4 | | | 11,900,000 | | | | — | | | | 11,900,000 | | | | — | | | | 2,855 | | | | — | |
| FMC Corp.4 | | | 6,758,000 | | | | — | | | | 1,845,928 | | | | 4,912,072 | | | | 3,715 | | | | — | |
| | | | | | | | | | | | | | | | | | | $ | 19,509 | | | $ | 357,322 | |
The following footnotes apply to either the individual securities noted or one or more of the securities aggregated and listed as a single line item.
| 1 | Valued under fair value procedures adopted by authority of the board of trustees. The total value of all such securities, including those in “Miscellaneous” and “Other securities,” was $5,601,890,000, which represented 7.03% of the net assets of the fund. This entire amount relates to certain securities trading outside the U.S. whose values were adjusted as a result of significant market movements following the close of local trading. |
| 2 | Security did not produce income during the last 12 months. |
| 3 | Acquired in a transaction exempt from registration under Section 4(2) of the Securities Act of 1933. May be resold in the U.S. in transactions exempt from registration, normally to qualified institutional buyers. The total value of all such securities, including those in “Other securities,” was $671,880,000, which represented .84% of the net assets of the fund. |
| 4 | Unaffiliated issuer at 12/31/2016. |
Key to abbreviations
ADR = American Depositary Receipts
CAD = Canadian dollars
See Notes to Financial Statements
Financial statements
Statement of assets and liabilities
at December 31, 2016 | (dollars in thousands) |
| Assets: | | | | | | |
| Investment securities, at value: | | | | | | | | |
| Unaffiliated issuers (cost: $52,513,552) | | $ | 79,317,634 | | | | | |
| Affiliated issuers (cost: $450,640) | | | 357,322 | | | $ | 79,674,956 | |
| Cash | | | | | | | 178 | |
| Receivables for: | | | | | | | | |
| Sales of investments | | | 72,860 | | | | | |
| Sales of fund’s shares | | | 140,755 | | | | | |
| Dividends and interest | | | 125,649 | | | | 339,264 | |
| | | | | | | | 80,014,398 | |
| Liabilities: | | | | | | | | |
| Payables for: | | | | | | | | |
| Purchases of investments | | | 32,265 | | | | | |
| Repurchases of fund’s shares | | | 232,149 | | | | | |
| Investment advisory services | | | 16,612 | | | | | |
| Services provided by related parties | | | 19,582 | | | | | |
| Trustees’ deferred compensation | | | 4,194 | | | | | |
| Other | | | 1,994 | | | | 306,796 | |
| Net assets at December 31, 2016 | | | | | | $ | 79,707,602 | |
| | | | | | | | | |
| Net assets consist of: | | | | | | | | |
| Capital paid in on shares of beneficial interest | | | | | | $ | 51,850,072 | |
| Undistributed net investment income | | | | | | | 199,336 | |
| Undistributed net realized gain | | | | | | | 947,856 | |
| Net unrealized appreciation | | | | | | | 26,710,338 | |
| Net assets at December 31, 2016 | | | | | | $ | 79,707,602 | |
(dollars and shares in thousands, except per-share amounts)
Shares of beneficial interest issued and outstanding (no stated par value) —
unlimited shares authorized (1,464,658 total shares outstanding)
| | | | | | Shares | | | Net asset value | |
| | | Net assets | | | outstanding | | | per share | |
| Class A | | $ | 47,307,970 | | | | 868,957 | | | $ | 54.44 | |
| Class B | | | 39,541 | | | | 726 | | | | 54.48 | |
| Class C | | | 2,425,853 | | | | 44,775 | | | | 54.18 | |
| Class F-1 | | | 2,687,925 | | | | 49,398 | | | | 54.41 | |
| Class F-2 | | | 8,424,316 | | | | 154,785 | | | | 54.43 | |
| Class 529-A | | | 1,995,320 | | | | 36,697 | | | | 54.37 | |
| Class 529-B | | | 4,003 | | | | 73 | | | | 54.59 | |
| Class 529-C | | | 479,109 | | | | 8,822 | | | | 54.31 | |
| Class 529-E | | | 79,577 | | | | 1,465 | | | | 54.33 | |
| Class 529-F-1 | | | 97,962 | | | | 1,803 | | | | 54.34 | |
| Class R-1 | | | 144,507 | | | | 2,667 | | | | 54.18 | |
| Class R-2 | | | 744,072 | | | | 13,737 | | | | 54.16 | |
| Class R-2E | | | 20,121 | | | | 371 | | | | 54.24 | |
| Class R-3 | | | 2,181,503 | | | | 40,165 | | | | 54.31 | |
| Class R-4 | | | 2,317,885 | | | | 42,660 | | | | 54.33 | |
| Class R-5E | | | 9,993 | | | | 184 | | | | 54.38 | |
| Class R-5 | | | 1,800,156 | | | | 33,046 | | | | 54.47 | |
| Class R-6 | | | 8,947,789 | | | | 164,327 | | | | 54.45 | |
See Notes to Financial Statements
Statement of operations
for the year ended December 31, 2016 | (dollars in thousands) |
| Investment income: | | | | | | | | |
| Income: | | | | | | | | |
| Dividends (net of non-U.S. taxes of $24,764; also includes $19,509 from affiliates) | | $ | 1,698,898 | | | | | |
| Interest | | | 14,142 | | | $ | 1,713,040 | |
| Fees and expenses*: | | | | | | | | |
| Investment advisory services | | | 183,649 | | | | | |
| Distribution services | | | 172,472 | | | | | |
| Transfer agent services | | | 75,091 | | | | | |
| Administrative services | | | 19,217 | | | | | |
| Reports to shareholders | | | 2,919 | | | | | |
| Registration statement and prospectus | | | 2,287 | | | | | |
| Trustees’ compensation | | | 723 | | | | | |
| Auditing and legal | | | 216 | | | | | |
| Custodian | | | 1,260 | | | | | |
| Other | | | 2,131 | | | | 459,965 | |
| Net investment income | | | | | | | 1,253,075 | |
| | | | | | | | | |
| Net realized gain and unrealized appreciation: | | | | | | | | |
| Net realized gain (loss) on: | | | | | | | | |
| Investments (includes $122,999 net gain from affiliates) | | | 2,965,572 | | | | | |
| Currency transactions | | | (4,762 | ) | | | 2,960,810 | |
| Net unrealized appreciation (depreciation) on: | | | | | | | | |
| Investments | | | 4,819,150 | | | | | |
| Currency translations | | | (104 | ) | | | 4,819,046 | |
| Net realized gain and unrealized appreciation | | | | | | | 7,779,856 | |
| Net increase in net assets resulting from operations | | | | | | $ | 9,032,931 | |
| * | Additional information related to class-specific fees and expenses is included in the Notes to Financial Statements. |
| Statements of changes in net assets | | | | | | |
| | | (dollars in thousands) | |
| | | | |
| | | Year ended December 31 | |
| | | 2016 | | | 2015 | |
| Operations: | | | | | | | | |
| Net investment income | | $ | 1,253,075 | | | $ | 1,053,717 | |
| Net realized gain | | | 2,960,810 | | | | 3,176,138 | |
| Net unrealized appreciation (depreciation) | | | 4,819,046 | | | | (1,817,473 | ) |
| Net increase in net assets resulting from operations | | | 9,032,931 | | | | 2,412,382 | |
| | | | | | | | | |
| Dividends and distributions paid to shareholders: | | | | | | | | |
| Dividends from net investment income | | | (1,241,029 | ) | | | (1,043,315 | ) |
| Distributions from net realized gain on investments | | | (2,426,103 | ) | | | (3,203,313 | ) |
| Total dividends and distributions paid to shareholders | | | (3,667,132 | ) | | | (4,246,628 | ) |
| | | | | | | | | |
| Net capital share transactions | | | 1,577,429 | | | | 2,915,001 | |
| | | | | | | | | |
| Total increase in net assets | | | 6,943,228 | | | | 1,080,755 | |
| | | | | | | | | |
| Net assets: | | | | | | | | |
| Beginning of year | | | 72,764,374 | | | | 71,683,619 | |
| End of year (including undistributed net investment income: $199,336 and $191,802, respectively) | | $ | 79,707,602 | | | $ | 72,764,374 | |
See Notes to Financial Statements
Notes to financial statements
1. Organization
American Funds Fundamental Investors (the “trust”) is registered under the Investment Company Act of 1940 as an open-end, diversified management investment company and has initially issued one series of shares, Fundamental Investors (the “fund”). The fund seeks long-term growth of capital and income.
The fund has 18 share classes consisting of five retail share classes (Classes A, B and C, as well as two F share classes, F-1 and F-2), five 529 college savings plan share classes (Classes 529-A, 529-B, 529-C, 529-E and 529-F-1) and eight retirement plan share classes (Classes R-1, R-2, R-2E, R-3, R-4, R-5E, R-5 and R-6). The 529 college savings plan share classes can be used to save for college education. The retirement plan share classes are generally offered only through eligible employer-sponsored retirement plans. The fund’s share classes are described further in the following table:
| Share class | | Initial sales charge | | Contingent deferred sales charge upon redemption | | Conversion feature | |
| Classes A and 529-A | | Up to 5.75% | | None (except 1% for certain redemptions within one year of purchase without an initial sales charge) | | None | |
| Classes B and 529-B* | | None | | Declines from 5% to 0% for redemptions within six years of purchase | | Classes B and 529-B convert to Classes A and 529-A, respectively, after eight years | |
| Class C | | None | | 1% for redemptions within one year of purchase | | Class C converts to Class F-1 after 10 years | |
| Class 529-C | | None | | 1% for redemptions within one year of purchase | | None | |
| Class 529-E | | None | | None | | None | |
| Classes F-1, F-2 and 529-F-1 | | None | | None | | None | |
| Classes R-1, R-2, R-2E, R-3, R-4, R-5E, R-5 and R-6 | | None | | None | | None | |
| * | Class B and 529-B shares of the fund are not available for purchase. |
Holders of all share classes have equal pro rata rights to the assets, dividends and liquidation proceeds of the fund. Each share class has identical voting rights, except for the exclusive right to vote on matters affecting only its class. Share classes have different fees and expenses (“class-specific fees and expenses”), primarily due to different arrangements for distribution, transfer agent and administrative services. Differences in class-specific fees and expenses will result in differences in net investment income and, therefore, the payment of different per-share dividends by each share class.
2. Significant accounting policies
The fund is an investment company that applies the accounting and reporting guidance issued in Topic 946 by the U.S. Financial Accounting Standards Board. The fund’s financial statements have been prepared to comply with U.S. generally accepted accounting principles (“U.S. GAAP”). These principles require the fund’s investment adviser to make estimates and assumptions that affect reported amounts and disclosures. Actual results could differ from those estimates. Subsequent events, if any, have been evaluated through the date of issuance in the preparation of the financial statements. The fund follows the significant accounting policies described in this section, as well as the valuation policies described in the next section on valuation.
Security transactions and related investment income — Security transactions are recorded by the fund as of the date the trades are executed with brokers. Realized gains and losses from security transactions are determined based on the specific identified cost of the securities. In the event a security is purchased with a delayed payment date, the fund will segregate liquid assets sufficient to meet its payment obligations. Dividend income is recognized on the ex-dividend date and interest income is recognized on an accrual basis. Market discounts, premiums and original issue discounts on fixed-income securities are amortized daily over the expected life of the security.
Class allocations — Income, fees and expenses (other than class-specific fees and expenses) and realized and unrealized gains and losses are allocated daily among the various share classes based on their relative net assets. Class-specific fees and expenses, such as distribution, transfer agent and administrative services, are charged directly to the respective share class.
Dividends and distributions to shareholders — Dividends and distributions to shareholders are recorded on the ex-dividend date.
Currency translation — Assets and liabilities, including investment securities, denominated in currencies other than U.S. dollars are translated into U.S. dollars at the exchange rates supplied by one or more pricing vendors on the valuation date. Purchases and sales of investment securities and income and expenses are translated into U.S. dollars at the exchange rates on the dates of such transactions. The effects of changes in exchange rates on investment securities are included with the net realized gain or loss and net unrealized appreciation or depreciation on investments in the fund’s statement of operations. The realized gain or loss and unrealized appreciation or depreciation resulting from all other transactions denominated in currencies other than U.S. dollars are disclosed separately.
3. Valuation
Capital Research and Management Company (“CRMC”), the fund’s investment adviser, values the fund’s investments at fair value as defined by U.S. GAAP. The net asset value of each share class of the fund is generally determined as of approximately 4:00 p.m. New York time each day the New York Stock Exchange is open.
Methods and inputs — The fund’s investment adviser uses the following methods and inputs to establish the fair value of the fund’s assets and liabilities. Use of particular methods and inputs may vary over time based on availability and relevance as market and economic conditions evolve.
Equity securities are generally valued at the official closing price of, or the last reported sale price on, the exchange or market on which such securities are traded, as of the close of business on the day the securities are being valued or, lacking any sales, at the last available bid price. Prices for each security are taken from the principal exchange or market on which the security trades.
Fixed-income securities, including short-term securities, are generally valued at prices obtained from one or more pricing vendors. Vendors value such securities based on one or more of the inputs described in the following table. The table provides examples of inputs that are commonly relevant for valuing particular classes of fixed-income securities in which the fund is authorized to invest. However, these classifications are not exclusive, and any of the inputs may be used to value any other class of fixed-income security.
| Fixed-income class | | Examples of standard inputs |
| All | | Benchmark yields, transactions, bids, offers, quotations from dealers and trading systems, new issues, spreads and other relationships observed in the markets among comparable securities; and proprietary pricing models such as yield measures calculated using factors such as cash flows, financial or collateral performance and other reference data (collectively referred to as “standard inputs”) |
| Corporate bonds & notes; convertible securities | | Standard inputs and underlying equity of the issuer |
| Bonds & notes of governments & government agencies | | Standard inputs and interest rate volatilities |
| Mortgage-backed; asset-backed obligations | | Standard inputs and cash flows, prepayment information, default rates, delinquency and loss assumptions, collateral characteristics, credit enhancements and specific deal information |
When the fund’s investment adviser deems it appropriate to do so (such as when vendor prices are unavailable or deemed to be not representative), fixed-income securities will be valued in good faith at the mean quoted bid and ask prices that are reasonably and timely available (or bid prices, if ask prices are not available) or at prices for securities of comparable maturity, quality and type.
Securities with both fixed-income and equity characteristics, or equity securities traded principally among fixed-income dealers, are generally valued in the manner described for either equity or fixed-income securities, depending on which method is deemed most appropriate by the fund’s investment adviser.
Securities and other assets for which representative market quotations are not readily available or are considered unreliable by the fund’s investment adviser are fair valued as determined in good faith under fair valuation guidelines adopted by authority of the fund’s board of trustees as further described. The investment adviser follows fair valuation guidelines, consistent with U.S. Securities and Exchange Commission rules and guidance, to consider relevant principles and factors when making fair value determinations. The investment adviser considers relevant indications of value that are reasonably and timely available to it in determining the fair value to be assigned to a particular security, such as the type and cost of the security; contractual or legal restrictions on resale of the security; relevant financial or business developments of the issuer; actively traded similar or related securities; conversion or exchange rights on the security; related corporate actions; significant events occurring after the close of trading in the security; and changes in overall market conditions. In
addition, the closing prices of equity securities that trade in markets outside U.S. time zones may be adjusted to reflect significant events that occur after the close of local trading but before the net asset value of each share class of the fund is determined. Fair valuations and valuations of investments that are not actively trading involve judgment and may differ materially from valuations that would have been used had greater market activity occurred.
Processes and structure — The fund’s board of trustees has delegated authority to the fund’s investment adviser to make fair value determinations, subject to board oversight. The investment adviser has established a Joint Fair Valuation Committee (the “Fair Valuation Committee”) to administer, implement and oversee the fair valuation process, and to make fair value decisions. The Fair Valuation Committee regularly reviews its own fair value decisions, as well as decisions made under its standing instructions to the investment adviser’s valuation teams. The Fair Valuation Committee reviews changes in fair value measurements from period to period and may, as deemed appropriate, update the fair valuation guidelines to better reflect the results of back testing and address new or evolving issues. The Fair Valuation Committee reports any changes to the fair valuation guidelines to the board of trustees with supplemental information to support the changes. The fund’s board and audit committee also regularly review reports that describe fair value determinations and methods.
The fund’s investment adviser has also established a Fixed-Income Pricing Review Group to administer and oversee the fixed-income valuation process, including the use of fixed-income pricing vendors. This group regularly reviews pricing vendor information and market data. Pricing decisions, processes and controls over security valuation are also subject to additional internal reviews, including an annual control self-evaluation program facilitated by the investment adviser’s compliance group.
Classifications — The fund’s investment adviser classifies the fund’s assets and liabilities into three levels based on the inputs used to value the assets or liabilities. Level 1 values are based on quoted prices in active markets for identical securities. Level 2 values are based on significant observable market inputs, such as quoted prices for similar securities and quoted prices in inactive markets. Certain securities trading outside the U.S. may transfer between Level 1 and Level 2 due to valuation adjustments resulting from significant market movements following the close of local trading. Level 3 values are based on significant unobservable inputs that reflect the investment adviser’s determination of assumptions that market participants might reasonably use in valuing the securities. The valuation levels are not necessarily an indication of the risk or liquidity associated with the underlying investment. For example, U.S. government securities are reflected as Level 2 because the inputs used to determine fair value may not always be quoted prices in an active market. The following table presents the fund’s valuation levels as of December 31, 2016 (dollars in thousands):
| | | Investment securities |
| | | Level 1 | | | Level 2* | | | Level 3 | | | Total | |
| Assets: | | | | | | | | | | | | | | | | |
| Common stocks: | | | | | | | | | | | | | | | | |
| Information technology | | $ | 14,587,511 | | | $ | 1,941,561 | | | $ | — | | | $ | 16,529,072 | |
| Consumer discretionary | | | 11,591,447 | | | | 79,205 | | | | — | | | | 11,670,652 | |
| Financials | | | 9,834,136 | | | | 828,642 | | | | — | | | | 10,662,778 | |
| Energy | | | 8,623,570 | | | | 941,216 | | | | — | | | | 9,564,786 | |
| Industrials | | | 8,221,440 | | | | 311,335 | | | | — | | | | 8,532,775 | |
| Health care | | | 7,598,748 | | | | 139,658 | | | | — | | | | 7,738,406 | |
| Consumer staples | | | 6,193,552 | | | | 783,201 | | | | — | | | | 6,976,753 | |
| Materials | | | 2,579,976 | | | | 182,574 | | | | — | | | | 2,762,550 | |
| Other | | | 1,292,717 | | | | 179,786 | | | | — | | | | 1,472,503 | |
| Miscellaneous | | | 582,988 | | | | 214,711 | | | | — | | | | 797,699 | |
| Convertible stocks | | | 74,701 | | | | — | | | | — | | | | 74,701 | |
| Short-term securities | | | — | | | | 2,892,281 | | | | — | | | | 2,892,281 | |
| Total | | $ | 71,180,786 | | | $ | 8,494,170 | | | $ | — | | | $ | 79,674,956 | |
| * | Securities with a value of $5,601,890,000, which represented 7.03% of the net assets of the fund, were classified as Level 2 due to significant market movements following the close of local trading. |
4. Risk factors
Investing in the fund may involve certain risks including, but not limited to, those described below.
Market conditions — The prices of, and the income generated by, the common stocks and other securities held by the fund may decline — sometimes rapidly or unpredictably — due to various factors, including events or conditions affecting the general economy or particular industries; overall market changes; local, regional or global political, social or economic instability; governmental or governmental agency responses to economic conditions; and currency exchange rate, interest rate and commodity price fluctuations.
Issuer risks — The prices of, and the income generated by, securities held by the fund may decline in response to various factors directly related to the issuers of such securities, including reduced demand for an issuer’s goods or services, poor management performance and strategic initiatives such as mergers, acquisitions or dispositions and the market response to any such initiatives.
Investing in growth-oriented stocks — Growth-oriented common stocks and other equity-type securities (such as preferred stocks, convertible preferred stocks and convertible bonds) may involve larger price swings and greater potential for loss than other types of investments.
Investing in income-oriented stocks — Income provided by the fund may be reduced by changes in the dividend policies of, and the capital resources available for dividend payments at, the companies in which the fund invests.
Investing outside the U.S. — Securities of issuers domiciled outside the U.S., or with significant operations or revenues outside the U.S., may lose value because of adverse political, social, economic or market developments (including social instability, regional conflicts, terrorism and war) in the countries or regions in which the issuers operate or generate revenue. These securities may also lose value due to changes in foreign currency exchange rates against the U.S. dollar and/or currencies of other countries. Issuers of these securities may be more susceptible to actions of foreign governments, such as the imposition of price controls or punitive taxes, that could adversely impact the value of these securities. Securities markets in certain countries may be more volatile and/or less liquid than those in the U.S. Investments outside the U.S. may also be subject to different accounting practices and different regulatory, legal and reporting standards and practices, and may be more difficult to value, than those in the U.S. In addition, the value of investments outside the U.S. may be reduced by foreign taxes, including foreign withholding taxes on interest and dividends. Further, there may be increased risks of delayed settlement of securities purchased or sold by the fund. The risks of investing outside the U.S. may be heightened in connection with investments in emerging markets.
Management — The investment adviser to the fund actively manages the fund’s investments. Consequently, the fund is subject to the risk that the methods and analyses employed by the investment adviser in this process may not produce the desired results. This could cause the fund to lose value or its investment results to lag relevant benchmarks or other funds with similar objectives.
5. Taxation and distributions
Federal income taxation — The fund complies with the requirements under Subchapter M of the Internal Revenue Code applicable to mutual funds and intends to distribute substantially all of its net taxable income and net capital gains each year. The fund is not subject to income taxes to the extent such distributions are made. Therefore, no federal income tax provision is required.
As of and during the period ended December 31, 2016, the fund did not have a liability for any unrecognized tax benefits. The fund recognizes interest and penalties, if any, related to unrecognized tax benefits as income tax expense in the statement of operations. During the period, the fund did not incur any interest or penalties.
The fund is not subject to examination by U.S. federal tax authorities for tax years before 2013, by state tax authorities for tax years before 2012 and by tax authorities outside the U.S. for tax years before 2011.
Non-U.S. taxation — Dividend and interest income are recorded net of non-U.S. taxes paid. The fund may file withholding tax reclaims in certain jurisdictions to recover a portion of amounts previously withheld. As a result of rulings from European courts, the fund filed for additional reclaims related to prior years. These reclaims are recorded when the amount is known and there are no significant uncertainties on collectability. Gains realized by the fund on the sale of securities in certain countries are subject to non-U.S. taxes. The fund records an estimated deferred tax liability based on unrealized gains to provide for potential non-U.S. taxes payable upon the sale of these securities.
Distributions — Distributions paid to shareholders are based on net investment income and net realized gains determined on a tax basis, which may differ from net investment income and net realized gains for financial reporting purposes. These differences are due primarily to different treatment for items such as currency gains and losses; short-term capital gains and losses and capital losses related to sales of certain securities within 30 days of purchase. The fiscal year in which amounts are distributed may differ from the year in which the net investment income and net realized gains are recorded by the fund for financial reporting purposes. The fund may also designate a portion of the amount paid to redeeming shareholders as a distribution for tax purposes.
During the year ended December 31, 2016, the fund reclassified $4,450,000 from undistributed net investment income to undistributed net realized gain, $62,000 from undistributed net investment income to capital paid in on shares of beneficial interest and $200,084,000 from undistributed net realized gain to capital paid in on shares of beneficial interest to align financial reporting with tax reporting.
As of December 31, 2016, the tax basis components of distributable earnings, unrealized appreciation (depreciation) and cost of investment securities were as follows (dollars in thousands):
| Undistributed ordinary income | | $ | 223,658 | |
| Undistributed long-term capital gains | | | 943,175 | |
| Gross unrealized appreciation on investment securities | | | 27,211,249 | |
| Gross unrealized depreciation on investment securities | | | (515,931 | ) |
| Net unrealized appreciation on investment securities | | | 26,695,318 | |
| Cost of investment securities | | | 52,979,638 | |
The tax character of distributions paid to shareholders was as follows (dollars in thousands):
| | | Year ended December 31, 2016 | | | Year ended December 31, 2015 | |
| Share class | | Ordinary
income | | | Long-term
capital gains | | | Total
dividends and
distributions paid | | | Ordinary
income | | | Long-term
capital gains | | | Total
dividends and
distributions
paid | |
| Class A | | $ | 746,184 | | | $ | 1,449,642 | | | $ | 2,195,826 | | | $ | 648,551 | | | $ | 1,960,261 | | | $ | 2,608,812 | |
| Class B | | | 389 | | | | 1,774 | | | | 2,163 | | | | 1,371 | | | | 9,638 | | | | 11,009 | |
| Class C | | | 19,944 | | | | 75,143 | | | | 95,087 | | | | 16,060 | | | | 107,683 | | | | 123,743 | |
| Class F-1 | | | 47,226 | | | | 83,051 | | | | 130,277 | | | | 66,483 | | | | 211,242 | | | | 277,725 | |
| Class F-2 | | | 130,117 | | | | 246,987 | | | | 377,104 | | | | 70,402 | | | | 189,640 | | | | 260,042 | |
| Class 529-A | | | 29,350 | | | | 60,425 | | | | 89,775 | | | | 24,279 | | | | 78,648 | | | | 102,927 | |
| Class 529-B | | | 29 | | | | 173 | | | | 202 | | | | 89 | | | | 839 | | | | 928 | |
| Class 529-C | | | 3,625 | | | | 14,686 | | | | 18,311 | | | | 2,633 | | | | 19,903 | | | | 22,536 | |
| Class 529-E | | | 1,007 | | | | 2,426 | | | | 3,433 | | | | 818 | | | | 3,204 | | | | 4,022 | |
| Class 529-F-1 | | | 1,580 | | | | 2,910 | | | | 4,490 | | | | 1,260 | | | | 3,529 | | | | 4,789 | |
| Class R-1 | | | 1,210 | | | | 4,544 | | | | 5,754 | | | | 1,017 | | | | 6,895 | | | | 7,912 | |
| Class R-2 | | | 6,303 | | | | 23,156 | | | | 29,459 | | | | 5,296 | | | | 33,102 | | | | 38,398 | |
| Class R-2E | | | 199 | | | | 566 | | | | 765 | | | | 6 | | | | 31 | | | | 37 | |
| Class R-3 | | | 27,795 | | | | 67,790 | | | | 95,585 | | | | 26,052 | | | | 103,305 | | | | 129,357 | |
| Class R-4 | | | 35,975 | | | | 71,497 | | | | 107,472 | | | | 34,218 | | | | 105,231 | | | | 139,449 | |
| Class R-5E* | | | 81 | | | | 229 | | | | 310 | | | | — | † | | | — | † | | | — | † |
| Class R-5 | | | 34,560 | | | | 57,473 | | | | 92,033 | | | | 33,213 | | | | 85,152 | | | | 118,365 | |
| Class R-6 | | | 155,455 | | | | 263,631 | | | | 419,086 | | | | 111,567 | | | | 285,010 | | | | 396,577 | |
| Total | | $ | 1,241,029 | | | $ | 2,426,103 | | | $ | 3,667,132 | | | $ | 1,043,315 | | | $ | 3,203,313 | | | $ | 4,246,628 | |
| * | Class R-5E shares were offered beginning November 20, 2015. |
| † | Amount less than one thousand. |
6. Fees and transactions with related parties
CRMC, the fund’s investment adviser, is the parent company of American Funds Distributors,® Inc. (“AFD”), the principal underwriter of the fund’s shares, and American Funds Service Company® (“AFS”), the fund’s transfer agent. CRMC, AFD and AFS are considered related parties to the fund.
Investment advisory services — The fund has an investment advisory and service agreement with CRMC that provides for monthly fees accrued daily. These fees are based on a series of decreasing annual rates beginning with 0.390% on the first $1 billion of daily net assets
and decreasing to 0.230% on such assets in excess of $71 billion. For the year ended December 31, 2016, the investment advisory services fee was $183,649,000, which was equivalent to an annualized rate of 0.246% of average daily net assets.
Class-specific fees and expenses — Expenses that are specific to individual share classes are accrued directly to the respective share class. The principal class-specific fees and expenses are further described below:
Distribution services — The fund has plans of distribution for all share classes, except Class F-2, R-5E, R-5 and R-6 shares. Under the plans, the board of trustees approves certain categories of expenses that are used to finance activities primarily intended to sell fund shares and service existing accounts. The plans provide for payments, based on an annualized percentage of average daily net assets, ranging from 0.25% to 1.00% as noted in this section. In some cases, the board of trustees has limited the amounts that may be paid to less than the maximum allowed by the plans. All share classes with a plan may use up to 0.25% of average daily net assets to pay service fees, or to compensate AFD for paying service fees, to firms that have entered into agreements with AFD to provide certain shareholder services. The remaining amounts available to be paid under each plan are paid to dealers to compensate them for their sales activities.
For Class A and 529-A shares, distribution-related expenses include the reimbursement of dealer and wholesaler commissions paid by AFD for certain shares sold without a sales charge. These share classes reimburse AFD for amounts billed within the prior 15 months but only to the extent that the overall annual expense limit of 0.25% is not exceeded. As of December 31, 2016, there were no unreimbursed expenses subject to reimbursement for Class A or 529-A shares.
| Share class | | Currently approved limits | | Plan limits |
| Class A | | | 0.25 | % | | | 0.25 | % |
| Class 529-A | | | 0.25 | | | | 0.50 | |
| Classes B and 529-B | | | 1.00 | | | | 1.00 | |
| Classes C, 529-C and R-1 | | | 1.00 | | | | 1.00 | |
| Class R-2 | | | 0.75 | | | | 1.00 | |
| Class R-2E | | | 0.60 | | | | 0.85 | |
| Classes 529-E and R-3 | | | 0.50 | | | | 0.75 | |
| Classes F-1, 529-F-1 and R-4 | | | 0.25 | | | | 0.50 | |
Transfer agent services — The fund has a shareholder services agreement with AFS under which the fund compensates AFS for providing transfer agent services to each of the fund’s share classes. These services include recordkeeping, shareholder communications and transaction processing. In addition, the fund reimburses AFS for amounts paid to third parties for performing transfer agent services on behalf of fund shareholders.
Administrative services — The fund has an administrative services agreement with CRMC under which the fund compensates CRMC for providing administrative services to Class A, C, F, 529 and R shares. These services include, but are not limited to, coordinating, monitoring, assisting and overseeing third parties that provide services to fund shareholders. Under the agreement, Class A shares pay an annual fee of 0.01% and Class C, F, 529 and R shares pay an annual fee of 0.05% of their respective average daily net assets.
529 plan services — Each 529 share class is subject to service fees to compensate the Virginia College Savings Plan (“Virginia529”) for its oversight and administration of the 529 college savings plan. From January 1, 2016 to June 30, 2016, the quarterly fee was based on a series of decreasing annual rates beginning with 0.10% on the first $30 billion of the net assets invested in Class 529 shares of the American Funds and decreasing to 0.05% on such assets in excess of $70 billion. Effective July 1, 2016, the quarterly fee was amended to annual rates of 0.10% on the first $20 billion of the net assets invested in the Class 529 shares of the American Funds, 0.05% on such assets between $20 billion and $100 billion, and 0.03% on such assets over $100 billion. The fee for any given calendar quarter is accrued and calculated on the basis of the average net assets of Class 529 shares of the American Funds for the last month of the prior calendar quarter. The fee is included in other expenses in the fund’s statement of operations. Virginia529 is not considered a related party to the fund.
For the year ended December 31, 2016, class-specific expenses under the agreements were as follows (dollars in thousands):
| | | | Distribution | | | Transfer agent | | | Administrative | | | 529 plan | |
| Share class | | | services | | | services | | | services | | | services | |
| Class A | | | | $107,466 | | | | $49,956 | | | | $4,532 | | | | Not applicable | |
| Class B | | | | 1,079 | | | | 139 | | | | Not applicable | | | | Not applicable | |
| Class C | | | | 23,820 | | | | 2,606 | | | | 1,194 | | | | Not applicable | |
| Class F-1 | | | | 7,695 | | | | 3,932 | | | | 1,549 | | | | Not applicable | |
| Class F-2 | | | | Not applicable | | | | 7,066 | | | | 3,312 | | | | Not applicable | |
| Class 529-A | | | | 4,047 | | | | 1,695 | | | | 926 | | | | $1,456 | |
| Class 529-B | | | | 98 | | | | 12 | | | | 5 | | | | 8 | |
| Class 529-C | | | | 4,533 | | | | 446 | | | | 229 | | | | 361 | |
| Class 529-E | | | | 372 | | | | 35 | | | | 37 | | | | 59 | |
| Class 529-F-1 | | | | — | | | | 78 | | | | 43 | | | | 67 | |
| Class R-1 | | | | 1,454 | | | | 154 | | | | 73 | | | | Not applicable | |
| Class R-2 | | | | 5,423 | | | | 2,489 | | | | 363 | | | | Not applicable | |
| Class R-2E | | | | 75 | | | | 24 | | | | 6 | | | | Not applicable | |
| Class R-3 | | | | 10,773 | | | | 3,258 | | | | 1,080 | | | | Not applicable | |
| Class R-4 | | | | 5,637 | | | | 2,247 | | | | 1,128 | | | | Not applicable | |
| Class R-5E | | | | Not applicable | | | | 1 | | | | — | * | | | Not applicable | |
| Class R-5 | | | | Not applicable | | | | 895 | | | | 915 | | | | Not applicable | |
| Class R-6 | | | | Not applicable | | | | 58 | | | | 3,825 | | | | Not applicable | |
| Total class-specific expenses | | | | $172,472 | | | | $75,091 | | | | $19,217 | | | | $1,951 | |
| * | Amount less than one thousand. |
Trustees’ deferred compensation — Trustees who are unaffiliated with CRMC may elect to defer the cash payment of part or all of their compensation. These deferred amounts, which remain as liabilities of the fund, are treated as if invested in shares of the fund or other American Funds. These amounts represent general, unsecured liabilities of the fund and vary according to the total returns of the selected funds. Trustees’ compensation of $723,000 in the fund’s statement of operations reflects $430,000 in current fees (either paid in cash or deferred) and a net increase of $293,000 in the value of the deferred amounts.
Affiliated officers and trustees — Officers and certain trustees of the fund are or may be considered to be affiliated with CRMC, AFD and AFS. No affiliated officers or trustees received any compensation directly from the fund.
Security transactions with related funds — The fund may purchase from, or sell securities to, other CRMC-managed funds (or funds managed by certain affiliates of CRMC) under procedures adopted by the fund’s board of trustees. The funds involved in such transactions are considered related by virtue of having a common investment adviser (or affiliated investment advisers), common trustees and/or common officers. When such transactions occur, each transaction is executed at the current market price of the security and no brokerage commissions or fees are paid in accordance with Rule 17a-7 of the 1940 Act.
7. Capital share transactions
Capital share transactions in the fund were as follows (dollars and shares in thousands):
| | | Sales1 | | | Reinvestments of
dividends and distributions | | | Repurchases1 | | | Net (decrease)
increase | |
| Share class | | Amount | | | Shares | | | Amount | | | Shares | | | Amount | | | Shares | | | Amount | | | Shares | |
| | | | | | | | | | | | | | | | | | | | | | | | | | | | | | | | | |
| Year ended December 31, 2016 | | | | | | | | | | | | | | | | | | | | | | | |
| Class A | | $ | 3,668,858 | | | | 70,878 | | | $ | 2,152,655 | | | | 40,029 | | | $ | (6,363,798 | ) | | | (121,293 | ) | | $ | (542,285 | ) | | | (10,386 | ) |
| Class B | | | 1,267 | | | | 25 | | | | 2,150 | | | | 41 | | | | (160,127 | ) | | | (3,101 | ) | | | (156,710 | ) | | | (3,035 | ) |
| Class C | | | 334,153 | | | | 6,487 | | | | 94,051 | | | | 1,748 | | | | (605,220 | ) | | | (11,685 | ) | | | (177,016 | ) | | | (3,450 | ) |
| Class F-1 | | | 579,792 | | | | 11,279 | | | | 128,474 | | | | 2,398 | | | | (3,000,870 | ) | | | (59,335 | ) | | | (2,292,604 | ) | | | (45,658 | ) |
| Class F-2 | | | 4,896,233 | | | | 94,839 | | | | 366,678 | | | | 6,801 | | | | (1,752,884 | ) | | | (33,424 | ) | | | 3,510,027 | | | | 68,216 | |
| Class 529-A | | | 196,725 | | | | 3,786 | | | | 89,756 | | | | 1,669 | | | | (219,848 | ) | | | (4,204 | ) | | | 66,633 | | | | 1,251 | |
| Class 529-B | | | 180 | | | | 3 | | | | 201 | | | | 4 | | | | (13,542 | ) | | | (261 | ) | | | (13,161 | ) | | | (254 | ) |
| Class 529-C | | | 49,169 | | | | 951 | | | | 18,307 | | | | 339 | | | | (72,782 | ) | | | (1,389 | ) | | | (5,306 | ) | | | (99 | ) |
| Class 529-E | | | 7,842 | | | | 151 | | | | 3,433 | | | | 64 | | | | (9,803 | ) | | | (187 | ) | | | 1,472 | | | | 28 | |
| Class 529-F-1 | | | 22,636 | | | | 426 | | | | 4,487 | | | | 84 | | | | (17,792 | ) | | | (342 | ) | | | 9,331 | | | | 168 | |
| Class R-1 | | | 17,930 | | | | 350 | | | | 5,744 | | | | 107 | | | | (40,923 | ) | | | (790 | ) | | | (17,249 | ) | | | (333 | ) |
| Class R-2 | | | 158,632 | | | | 3,088 | | | | 29,440 | | | | 547 | | | | (229,921 | ) | | | (4,446 | ) | | | (41,849 | ) | | | (811 | ) |
| Class R-2E | | | 19,614 | | | | 387 | | | | 764 | | | | 14 | | | | (2,724 | ) | | | (51 | ) | | | 17,654 | | | | 350 | |
| Class R-3 | | | 385,214 | | | | 7,460 | | | | 95,447 | | | | 1,776 | | | | (687,888 | ) | | | (13,285 | ) | | | (207,227 | ) | | | (4,049 | ) |
| Class R-4 | | | 436,244 | | | | 8,412 | | | | 107,443 | | | | 2,001 | | | | (676,046 | ) | | | (12,979 | ) | | | (132,359 | ) | | | (2,566 | ) |
| Class R-5E | | | 10,112 | | | | 179 | | | | 310 | | | | 6 | | | | (31 | ) | | | (1 | ) | | | 10,391 | | | | 184 | |
| Class R-5 | | | 350,180 | | | | 6,782 | | | | 91,985 | | | | 1,715 | | | | (677,151 | ) | | | (13,177 | ) | | | (234,986 | ) | | | (4,680 | ) |
| Class R-6 | | | 2,009,805 | | | | 38,916 | | | | 419,083 | | | | 7,784 | | | | (646,215 | ) | | | (12,289 | ) | | | 1,782,673 | | | | 34,411 | |
| Total net increase (decrease) | | $ | 13,144,586 | | | | 254,399 | | | $ | 3,610,408 | | | | 67,127 | | | $ | (15,177,565 | ) | | | (292,239 | ) | | $ | 1,577,429 | | | | 29,287 | |
| | | | | | | | | | | | | | | | | | | | | | | | | | | | | | | | | |
| Year ended December 31, 2015 | | | | | | | | | | | | | | | | | | | | |
| Class A | | $ | 3,775,879 | | | | 72,112 | | | $ | 2,560,866 | | | | 50,144 | | | $ | (4,548,531 | ) | | | (86,784 | ) | | $ | 1,788,214 | | | | 35,472 | |
| Class B | | | 3,274 | | | | 62 | | | | 10,952 | | | | 215 | | | | (153,198 | ) | | | (2,919 | ) | | | (138,972 | ) | | | (2,642 | ) |
| Class C | | | 351,791 | | | | 6,746 | | | | 122,242 | | | | 2,408 | | | | (418,811 | ) | | | (8,026 | ) | | | 55,222 | | | | 1,128 | |
| Class F-1 | | | 795,630 | | | | 15,159 | | | | 275,791 | | | | 5,404 | | | | (899,255 | ) | | | (17,150 | ) | | | 172,166 | | | | 3,413 | |
| Class F-2 | | | 1,154,329 | | | | 22,042 | | | | 248,911 | | | | 4,876 | | | | (819,817 | ) | | | (15,681 | ) | | | 583,423 | | | | 11,237 | |
| Class 529-A | | | 186,084 | | | | 3,554 | | | | 102,916 | | | | 2,018 | | | | (189,844 | ) | | | (3,623 | ) | | | 99,156 | | | | 1,949 | |
| Class 529-B | | | 446 | | | | 9 | | | | 927 | | | | 18 | | | | (13,717 | ) | | | (261 | ) | | | (12,344 | ) | | | (234 | ) |
| Class 529-C | | | 52,773 | | | | 1,009 | | | | 22,526 | | | | 443 | | | | (57,658 | ) | | | (1,102 | ) | | | 17,641 | | | | 350 | |
| Class 529-E | | | 7,474 | | | | 143 | | | | 4,020 | | | | 79 | | | | (9,211 | ) | | | (176 | ) | | | 2,283 | | | | 46 | |
| Class 529-F-1 | | | 19,418 | | | | 372 | | | | 4,789 | | | | 94 | | | | (15,585 | ) | | | (298 | ) | | | 8,622 | | | | 168 | |
| Class R-1 | | | 24,667 | | | | 474 | | | | 7,900 | | | | 156 | | | | (44,679 | ) | | | (857 | ) | | | (12,112 | ) | | | (227 | ) |
| Class R-2 | | | 158,238 | | | | 3,036 | | | | 38,372 | | | | 756 | | | | (233,513 | ) | | | (4,478 | ) | | | (36,903 | ) | | | (686 | ) |
| Class R-2E | | | 1,070 | | | | 20 | | | | 36 | | | | 1 | | | | (1 | ) | | | — | 2 | | | 1,105 | | | | 21 | |
| Class R-3 | | | 402,063 | | | | 7,693 | | | | 129,235 | | | | 2,536 | | | | (865,867 | ) | | | (16,596 | ) | | | (334,569 | ) | | | (6,367 | ) |
| Class R-4 | | | 438,112 | | | | 8,366 | | | | 139,394 | | | | 2,733 | | | | (883,641 | ) | | | (16,882 | ) | | | (306,135 | ) | | | (5,783 | ) |
| Class R-5E3 | | | 10 | | | | — | 2 | | | — | | | | — | | | | — | | | | — | | | | 10 | | | | — | 2 |
| Class R-5 | | | 343,202 | | | | 6,544 | | | | 118,303 | | | | 2,314 | | | | (479,390 | ) | | | (9,136 | ) | | | (17,885 | ) | | | (278 | ) |
| Class R-6 | | | 1,536,959 | | | | 29,450 | | | | 395,776 | | | | 7,751 | | | | (886,656 | ) | | | (17,020 | ) | | | 1,046,079 | | | | 20,181 | |
| Total net increase (decrease) | | $ | 9,251,419 | | | | 176,791 | | | $ | 4,182,956 | | | | 81,946 | | | $ | (10,519,374 | ) | | | (200,989 | ) | | $ | 2,915,001 | | | | 57,748 | |
| 1 | Includes exchanges between share classes of the fund. |
| 2 | Amount less than one thousand. |
| 3 | Class R-5E shares were offered beginning November 20, 2015. |
8. Investment transactions
The fund made purchases and sales of investment securities, excluding short-term securities and U.S. government obligations, if any, of $17,452,638,000 and $18,486,046,000, respectively, during the year ended December 31, 2016.
Financial highlights
| | | | | | | Income from
investment operations1 | | | Dividends and distributions | | | | | | | | | | | | | | | | | | | | | |
| | | Net asset
value,
beginning
of period | | Net
investment
income2 | | | Net gains
(losses) on
securities (both
realized and
unrealized) | | | Total from
investment
operations | | | Dividends
(from net
investment
income) | | | Distributions
(from capital
gains) | | | Total
dividends
and
distributions | | | Net asset
value,
end
of period | | | Total
return3 | | | Net assets,
end of period
(in millions) | | | Ratio of
expenses to
average
net assets | | | Ratio of
net income
to average
net assets2 | |
| Class A: | | | | | | | | | | | | | | | | | | | | | | | | | | | | | | | | | | | | | | | | | | | | | | | | |
| Year ended 12/31/2016 | | $ | 50.71 | | | $ | .87 | | | $ | 5.43 | | | $ | 6.30 | | | $ | (.87 | ) | | $ | (1.70 | ) | | $ | (2.57 | ) | | $ | 54.44 | | | | 12.54 | % | | $ | 47,308 | | | | .61 | % | | | 1.68 | % |
| Year ended 12/31/2015 | | | 52.06 | | | | .77 | | | | .97 | | | | 1.74 | | | | (.77 | ) | | | (2.32 | ) | | | (3.09 | ) | | | 50.71 | | | | 3.38 | | | | 44,596 | | | | .60 | | | | 1.47 | |
| Year ended 12/31/2014 | | | 51.97 | | | | .98 | | | | 3.63 | | | | 4.61 | | | | (.96 | ) | | | (3.56 | ) | | | (4.52 | ) | | | 52.06 | | | | 8.96 | | | | 43,929 | | | | .61 | | | | 1.85 | |
| Year ended 12/31/2013 | | | 40.78 | | | | .63 | | | | 12.13 | | | | 12.76 | | | | (.65 | ) | | | (.92 | ) | | | (1.57 | ) | | | 51.97 | | | | 31.49 | | | | 41,820 | | | | .63 | | | | 1.35 | |
| Year ended 12/31/2012 | | | 35.39 | | | | .64 | | | | 5.40 | | | | 6.04 | | | | (.65 | ) | | | — | | | | (.65 | ) | | | 40.78 | | | | 17.14 | | | | 32,568 | | | | .65 | | | | 1.66 | |
| Class B: | | | | | | | | | | | | | | | | | | | | | | | | | | | | | | | | | | | | | | | | | | | | | | | | |
| Year ended 12/31/2016 | | | 50.64 | | | | .43 | | | | 5.45 | | | | 5.88 | | | | (.34 | ) | | | (1.70 | ) | | | (2.04 | ) | | | 54.48 | | | | 11.67 | | | | 40 | | | | 1.38 | | | | .85 | |
| Year ended 12/31/2015 | | | 51.95 | | | | .37 | | | | .97 | | | | 1.34 | | | | (.33 | ) | | | (2.32 | ) | | | (2.65 | ) | | | 50.64 | | | | 2.61 | | | | 190 | | | | 1.36 | | | | .70 | |
| Year ended 12/31/2014 | | | 51.86 | | | | .61 | | | | 3.57 | | | | 4.18 | | | | (.53 | ) | | | (3.56 | ) | | | (4.09 | ) | | | 51.95 | | | | 8.13 | | | | 333 | | | | 1.37 | | | | 1.16 | |
| Year ended 12/31/2013 | | | 40.68 | | | | .27 | | | | 12.11 | | | | 12.38 | | | | (.28 | ) | | | (.92 | ) | | | (1.20 | ) | | | 51.86 | | | | 30.53 | | | | 468 | | | | 1.39 | | | | .59 | |
| Year ended 12/31/2012 | | | 35.30 | | | | .34 | | | | 5.39 | | | | 5.73 | | | | (.35 | ) | | | — | | | | (.35 | ) | | | 40.68 | | | | 16.25 | | | | 465 | | | | 1.41 | | | | .89 | |
| Class C: | | | | | | | | | | | | | | | | | | | | | | | | | | | | | | | | | | | | | | | | | | | | | | | | |
| Year ended 12/31/2016 | | | 50.48 | | | | .45 | | | | 5.40 | | | | 5.85 | | | | (.45 | ) | | | (1.70 | ) | | | (2.15 | ) | | | 54.18 | | | | 11.64 | | | | 2,426 | | | | 1.41 | | | | .87 | |
| Year ended 12/31/2015 | | | 51.83 | | | | .35 | | | | .97 | | | | 1.32 | | | | (.35 | ) | | | (2.32 | ) | | | (2.67 | ) | | | 50.48 | | | | 2.56 | | | | 2,435 | | | | 1.40 | | | | .67 | |
| Year ended 12/31/2014 | | | 51.77 | | | | .55 | | | | 3.60 | | | | 4.15 | | | | (.53 | ) | | | (3.56 | ) | | | (4.09 | ) | | | 51.83 | | | | 8.08 | | | | 2,441 | | | | 1.41 | | | | 1.05 | |
| Year ended 12/31/2013 | | | 40.63 | | | | .25 | | | | 12.09 | | | | 12.34 | | | | (.28 | ) | | | (.92 | ) | | | (1.20 | ) | | | 51.77 | | | | 30.44 | | | | 2,352 | | | | 1.43 | | | | .54 | |
| Year ended 12/31/2012 | | | 35.26 | | | | .33 | | | | 5.38 | | | | 5.71 | | | | (.34 | ) | | | — | | | | (.34 | ) | | | 40.63 | | | | 16.21 | | | | 1,852 | | | | 1.45 | | | | .86 | |
| Class F-1: | | | | | | | | | | | | | | | �� | | | | | | | | | | | | | | | | | | | | | | | | | | | | | | | | | |
| Year ended 12/31/2016 | | | 50.69 | | | | .83 | | | | 5.42 | | | | 6.25 | | | | (.83 | ) | | | (1.70 | ) | | | (2.53 | ) | | | 54.41 | | | | 12.45 | | | | 2,688 | | | | .68 | | | | 1.61 | |
| Year ended 12/31/2015 | | | 52.03 | | | | .74 | | | | .97 | | | | 1.71 | | | | (.73 | ) | | | (2.32 | ) | | | (3.05 | ) | | | 50.69 | | | | 3.33 | | | | 4,819 | | | | .67 | | | | 1.40 | |
| Year ended 12/31/2014 | | | 51.95 | | | | .96 | | | | 3.60 | | | | 4.56 | | | | (.92 | ) | | | (3.56 | ) | | | (4.48 | ) | | | 52.03 | | | | 8.87 | | | | 4,769 | | | | .66 | | | | 1.81 | |
| Year ended 12/31/2013 | | | 40.76 | | | | .59 | | | | 12.14 | | | | 12.73 | | | | (.62 | ) | | | (.92 | ) | | | (1.54 | ) | | | 51.95 | | | | 31.42 | | | | 5,306 | | | | .70 | | | | 1.27 | |
| Year ended 12/31/2012 | | | 35.37 | | | | .64 | | | | 5.39 | | | | 6.03 | | | | (.64 | ) | | | — | | | | (.64 | ) | | | 40.76 | | | | 17.12 | | | | 4,503 | | | | .66 | | | | 1.65 | |
| Class F-2: | | | | | | | | | | | | | | | | | | | | | | | | | | | | | | | | | | | | | | | | | | | | | | | | |
| Year ended 12/31/2016 | | | 50.70 | | | | .99 | | | | 5.41 | | | | 6.40 | | | | (.97 | ) | | | (1.70 | ) | | | (2.67 | ) | | | 54.43 | | | | 12.77 | | | | 8,424 | | | | .41 | | | | 1.88 | |
| Year ended 12/31/2015 | | | 52.04 | | | | .88 | | | | .97 | | | | 1.85 | | | | (.87 | ) | | | (2.32 | ) | | | (3.19 | ) | | | 50.70 | | | | 3.61 | | | | 4,389 | | | | .41 | | | | 1.67 | |
| Year ended 12/31/2014 | | | 51.96 | | | | 1.06 | | | | 3.66 | | | | 4.72 | | | | (1.08 | ) | | | (3.56 | ) | | | (4.64 | ) | | | 52.04 | | | | 9.17 | | | | 3,921 | | | | .40 | | | | 1.99 | |
| Year ended 12/31/2013 | | | 40.77 | | | | .74 | | | | 12.13 | | | | 12.87 | | | | (.76 | ) | | | (.92 | ) | | | (1.68 | ) | | | 51.96 | | | | 31.80 | | | | 2,485 | | | | .41 | | | | 1.58 | |
| Year ended 12/31/2012 | | | 35.39 | | | | .76 | | | | 5.37 | | | | 6.13 | | | | (.75 | ) | | | — | | | | (.75 | ) | | | 40.77 | | | | 17.39 | | | | 1,521 | | | | .41 | | | | 1.96 | |
| Class 529-A: | | | | | | | | | | | | | | | | | | | | | | | | | | | | | | | | | | | | | | | | | | | | | | | | |
| Year ended 12/31/2016 | | | 50.65 | | | | .83 | | | | 5.42 | | | | 6.25 | | | | (.83 | ) | | | (1.70 | ) | | | (2.53 | ) | | | 54.37 | | | | 12.44 | | | | 1,995 | | | | .69 | | | | 1.60 | |
| Year ended 12/31/2015 | | | 52.00 | | | | .72 | | | | .97 | | | | 1.69 | | | | (.72 | ) | | | (2.32 | ) | | | (3.04 | ) | | | 50.65 | | | | 3.28 | | | | 1,795 | | | | .70 | | | | 1.37 | |
| Year ended 12/31/2014 | | | 51.92 | | | | .93 | | | | 3.62 | | | | 4.55 | | | | (.91 | ) | | | (3.56 | ) | | | (4.47 | ) | | | 52.00 | | | | 8.85 | | | | 1,742 | | | | .70 | | | | 1.75 | |
| Year ended 12/31/2013 | | | 40.74 | | | | .59 | | | | 12.12 | | | | 12.71 | | | | (.61 | ) | | | (.92 | ) | | | (1.53 | ) | | | 51.92 | | | | 31.39 | | | | 1,590 | | | | .72 | | | | 1.26 | |
| Year ended 12/31/2012 | | | 35.36 | | | | .61 | | | | 5.39 | | | | 6.00 | | | | (.62 | ) | | | — | | | | (.62 | ) | | | 40.74 | | | | 17.03 | | | | 1,183 | | | | .73 | | | | 1.59 | |
| Class 529-B: | | | | | | | | | | | | | | | | | | | | | | | | | | | | | | | | | | | | | | | | | | | | | | | | |
| Year ended 12/31/2016 | | | 50.76 | | | | .38 | | | | 5.45 | | | | 5.83 | | | | (.30 | ) | | | (1.70 | ) | | | (2.00 | ) | | | 54.59 | | | | 11.53 | | | | 4 | | | | 1.50 | | | | .74 | |
| Year ended 12/31/2015 | | | 52.05 | | | | .30 | | | | .98 | | | | 1.28 | | | | (.25 | ) | | | (2.32 | ) | | | (2.57 | ) | | | 50.76 | | | | 2.49 | | | | 17 | | | | 1.49 | | | | .57 | |
| Year ended 12/31/2014 | | | 51.95 | | | | .54 | | | | 3.58 | | | | 4.12 | | | | (.46 | ) | | | (3.56 | ) | | | (4.02 | ) | | | 52.05 | | | | 7.97 | | | | 29 | | | | 1.49 | | | | 1.02 | |
| Year ended 12/31/2013 | | | 40.75 | | | | .21 | | | | 12.13 | | | | 12.34 | | | | (.22 | ) | | | (.92 | ) | | | (1.14 | ) | | | 51.95 | | | | 30.36 | | | | 41 | | | | 1.52 | | | | .46 | |
| Year ended 12/31/2012 | | | 35.36 | | | | .29 | | | | 5.39 | | | | 5.68 | | | | (.29 | ) | | | — | | | | (.29 | ) | | | 40.75 | | | | 16.09 | | | | 41 | | | | 1.54 | | | | .76 | |
See page 27 for footnotes.
Financial highlights (continued)
| | | | | | | Income from
investment operations1 | | | Dividends and distributions | | | | | | | | | | | | | | | | | | | | | |
| | | Net asset
value,
beginning
of period | | Net
investment
income2 | | | Net gains
(losses) on
securities (both
realized and
unrealized) | | | Total from
investment
operations | | | Dividends
(from net
investment
income) | | | Distributions
(from capital
gains) | | | Total
dividends
and
distributions | | | Net asset
value,
end
of period | | | Total
return3 | | | Net assets,
end of period
(in millions) | | | Ratio of
expenses to
average
net assets | | | Ratio of
net income
to average
net assets2 | |
| Class 529-C: | | | | | | | | | | | | | | | | | | | | | | | | | | | | | | | | | | | | | | | | | | | | | | | | |
| Year ended 12/31/2016 | | $ | 50.60 | | | $ | .42 | | | $ | 5.41 | | | $ | 5.83 | | | $ | (.42 | ) | | $ | (1.70 | ) | | $ | (2.12 | ) | | $ | 54.31 | | | | 11.57 | % | | $ | 479 | | | | 1.47 | % | | | .82 | % |
| Year ended 12/31/2015 | | | 51.95 | | | | .31 | | | | .97 | | | | 1.28 | | | | (.31 | ) | | | (2.32 | ) | | | (2.63 | ) | | | 50.60 | | | | 2.48 | | | | 451 | | | | 1.48 | | | | .59 | |
| Year ended 12/31/2014 | | | 51.88 | | | | .51 | | | | 3.62 | | | | 4.13 | | | | (.50 | ) | | | (3.56 | ) | | | (4.06 | ) | | | 51.95 | | | | 7.99 | | | | 445 | | | | 1.49 | | | | .97 | |
| Year ended 12/31/2013 | | | 40.71 | | | | .22 | | | | 12.11 | | | | 12.33 | | | | (.24 | ) | | | (.92 | ) | | | (1.16 | ) | | | 51.88 | | | | 30.37 | | | | 416 | | | | 1.51 | | | | .47 | |
| Year ended 12/31/2012 | | | 35.34 | | | | .30 | | | | 5.38 | | | | 5.68 | | | | (.31 | ) | | | — | | | | (.31 | ) | | | 40.71 | | | | 16.09 | | | | 319 | | | | 1.53 | | | | .79 | |
| Class 529-E: | | | | | | | | | | | | | | | | | | | | | | | | | | | | | | | | | | | | | | | | | | | | | | | | |
| Year ended 12/31/2016 | | | 50.61 | | | | .71 | | | | 5.41 | | | | 6.12 | | | | (.70 | ) | | | (1.70 | ) | | | (2.40 | ) | | | 54.33 | | | | 12.20 | | | | 80 | | | | .93 | | | | 1.36 | |
| Year ended 12/31/2015 | | | 51.96 | | | | .59 | | | | .97 | | | | 1.56 | | | | (.59 | ) | | | (2.32 | ) | | | (2.91 | ) | | | 50.61 | | | | 3.04 | | | | 73 | | | | .94 | | | | 1.13 | |
| Year ended 12/31/2014 | | | 51.89 | | | | .80 | | | | 3.61 | | | | 4.41 | | | | (.78 | ) | | | (3.56 | ) | | | (4.34 | ) | | | 51.96 | | | | 8.58 | | | | 72 | | | | .94 | | | | 1.51 | |
| Year ended 12/31/2013 | | | 40.71 | | | | .47 | | | | 12.13 | | | | 12.60 | | | | (.50 | ) | | | (.92 | ) | | | (1.42 | ) | | | 51.89 | | | | 31.10 | | | | 67 | | | | .96 | | | | 1.02 | |
| Year ended 12/31/2012 | | | 35.34 | | | | .52 | | | | 5.37 | | | | 5.89 | | | | (.52 | ) | | | — | | | | (.52 | ) | | | 40.71 | | | | 16.73 | | | | 50 | | | | .98 | | | | 1.34 | |
| Class 529-F-1: | | | | | | | | | | | | | | | | | | | | | | | | | | | | | | | | | | | | | | | | | | | | | | | | |
| Year ended 12/31/2016 | | | 50.62 | | | | .94 | | | | 5.42 | | | | 6.36 | | | | (.94 | ) | | | (1.70 | ) | | | (2.64 | ) | | | 54.34 | | | | 12.71 | | | | 98 | | | | .48 | | | | 1.82 | |
| Year ended 12/31/2015 | | | 51.97 | | | | .83 | | | | .97 | | | | 1.80 | | | | (.83 | ) | | | (2.32 | ) | | | (3.15 | ) | | | 50.62 | | | | 3.51 | | | | 83 | | | | .48 | | | | 1.59 | |
| Year ended 12/31/2014 | | | 51.89 | | | | 1.04 | | | | 3.63 | | | | 4.67 | | | | (1.03 | ) | | | (3.56 | ) | | | (4.59 | ) | | | 51.97 | | | | 9.10 | | | | 76 | | | | .48 | | | | 1.96 | |
| Year ended 12/31/2013 | | | 40.71 | | | | .69 | | | | 12.12 | | | | 12.81 | | | | (.71 | ) | | | (.92 | ) | | | (1.63 | ) | | | 51.89 | | | | 31.70 | | | | 67 | | | | .51 | | | | 1.47 | |
| Year ended 12/31/2012 | | | 35.33 | | | | .69 | | | | 5.39 | | | | 6.08 | | | | (.70 | ) | | | — | | | | (.70 | ) | | | 40.71 | | | | 17.25 | | | | 48 | | | | .52 | | | | 1.79 | |
| Class R-1: | | | | | | | | | | | | | | | | | | | | | | | | | | | | | | | | | | | | | | | | | | | | | | | | |
| Year ended 12/31/2016 | | | 50.49 | | | | .45 | | | | 5.39 | | | | 5.84 | | | | (.45 | ) | | | (1.70 | ) | | | (2.15 | ) | | | 54.18 | | | | 11.65 | | | | 145 | | | | 1.41 | | | | .88 | |
| Year ended 12/31/2015 | | | 51.83 | | | | .35 | | | | .97 | | | | 1.32 | | | | (.34 | ) | | | (2.32 | ) | | | (2.66 | ) | | | 50.49 | | | | 2.55 | | | | 151 | | | | 1.40 | | | | .66 | |
| Year ended 12/31/2014 | | | 51.77 | | | | .56 | | | | 3.60 | | | | 4.16 | | | | (.54 | ) | | | (3.56 | ) | | | (4.10 | ) | | | 51.83 | | | | 8.08 | | | | 167 | | | | 1.41 | | | | 1.06 | |
| Year ended 12/31/2013 | | | 40.62 | | | | .26 | | | | 12.09 | | | | 12.35 | | | | (.28 | ) | | | (.92 | ) | | | (1.20 | ) | | | 51.77 | | | | 30.50 | | | | 171 | | | | 1.41 | | | | .57 | |
| Year ended 12/31/2012 | | | 35.26 | | | | .34 | | | | 5.37 | | | | 5.71 | | | | (.35 | ) | | | — | | | | (.35 | ) | | | 40.62 | | | | 16.22 | | | | 146 | | | | 1.42 | | | | .88 | |
| Class R-2: | | | | | | | | | | | | | | | | | | | | | | | | | | | | | | | | | | | | | | | | | | | | | | | | |
| Year ended 12/31/2016 | | | 50.47 | | | | .46 | | | | 5.39 | | | | 5.85 | | | | (.46 | ) | | | (1.70 | ) | | | (2.16 | ) | | | 54.16 | | | | 11.65 | | | | 744 | | | | 1.39 | | | | .89 | |
| Year ended 12/31/2015 | | | 51.82 | | | | .37 | | | | .97 | | | | 1.34 | | | | (.37 | ) | | | (2.32 | ) | | | (2.69 | ) | | | 50.47 | | | | 2.61 | | | | 734 | | | | 1.35 | | | | .72 | |
| Year ended 12/31/2014 | | | 51.76 | | | | .57 | | | | 3.60 | | | | 4.17 | | | | (.55 | ) | | | (3.56 | ) | | | (4.11 | ) | | | 51.82 | | | | 8.11 | | | | 790 | | | | 1.38 | | | | 1.08 | |
| Year ended 12/31/2013 | | | 40.62 | | | | .29 | | | | 12.08 | | | | 12.37 | | | | (.31 | ) | | | (.92 | ) | | | (1.23 | ) | | | 51.76 | | | | 30.55 | | | | 777 | | | | 1.36 | | | | .62 | |
| Year ended 12/31/2012 | | | 35.26 | | | | .35 | | | | 5.37 | | | | 5.72 | | | | (.36 | ) | | | — | | | | (.36 | ) | | | 40.62 | | | | 16.24 | | | | 630 | | | | 1.40 | | | | .91 | |
| Class R-2E: | | | | | | | | | | | | | | | | | | | | | | | | | | | | | | | | | | | | | | | | | | | | | | | | |
| Year ended 12/31/2016 | | | 50.56 | | | | .66 | | | | 5.38 | | | | 6.04 | | | | (.66 | ) | | | (1.70 | ) | | | (2.36 | ) | | | 54.24 | | | | 12.04 | | | | 20 | | | | 1.10 | | | | 1.26 | |
| Year ended 12/31/2015 | | | 52.03 | | | | .69 | | | | .90 | | | | 1.59 | | | | (.74 | ) | | | (2.32 | ) | | | (3.06 | ) | | | 50.56 | | | | 3.09 | | | | 1 | | | | 1.13 | | | | 1.37 | |
Period from 8/29/2014
to 12/31/20144,5 | | | 55.04 | | | | .27 | | | | .52 | | | | .79 | | | | (.74 | ) | | | (3.06 | ) | | | (3.80 | ) | | | 52.03 | | | | 1.40 | 6,7 | | | — | 8 | | | .17 | 6,7 | | | .50 | 6,7 |
| Class R-3: | | | | | | | | | | | | | | | | | | | | | | | | | | | | | | | | | | | | | | | | | | | | | | | | |
| Year ended 12/31/2016 | | | 50.60 | | | | .69 | | | | 5.41 | | | | 6.10 | | | | (.69 | ) | | | (1.70 | ) | | | (2.39 | ) | | | 54.31 | | | | 12.15 | | | | 2,181 | | | | .96 | | | | 1.33 | |
| Year ended 12/31/2015 | | | 51.94 | | | | .59 | | | | .97 | | | | 1.56 | | | | (.58 | ) | | | (2.32 | ) | | | (2.90 | ) | | | 50.60 | | | | 3.03 | | | | 2,237 | | | | .95 | | | | 1.12 | |
| Year ended 12/31/2014 | | | 51.87 | | | | .80 | | | | 3.60 | | | | 4.40 | | | | (.77 | ) | | | (3.56 | ) | | | (4.33 | ) | | | 51.94 | | | | 8.56 | | | | 2,627 | | | | .96 | | | | 1.51 | |
| Year ended 12/31/2013 | | | 40.70 | | | | .48 | | | | 12.11 | | | | 12.59 | | | | (.50 | ) | | | (.92 | ) | | | (1.42 | ) | | | 51.87 | | | | 31.09 | | | | 2,795 | | | | .96 | | | | 1.02 | |
| Year ended 12/31/2012 | | | 35.32 | | | | .52 | | | | 5.39 | | | | 5.91 | | | | (.53 | ) | | | — | | | | (.53 | ) | | | 40.70 | | | | 16.78 | | | | 2,367 | | | | .96 | | | | 1.35 | |
| | | | | | | Income from
investment operations1 | | | Dividends and distributions | | | | | | | | | | | | | | | | | | | | | |
| | | Net asset
value,
beginning
of period | | Net
investment
income2 | | | Net gains
(losses) on
securities (both
realized and
unrealized) | | | Total from
investment
operations | | | Dividends
(from net
investment
income) | | | Distributions
(from capital
gains) | | | Total
dividends
and
distributions | | | Net asset
value,
end
of period | | | Total
return3 | | | Net assets,
end of period
(in millions) | | | Ratio of
expenses to
average
net assets | | | Ratio of
net income
to average
net assets2 | |
| Class R-4: | | | | | | | | | | | | | | | | | | | | | | | | | | | | | | | | | | | | | | | | | | | | | | | | |
| Year ended 12/31/2016 | | $ | 50.62 | | | $ | .85 | | | $ | 5.40 | | | $ | 6.25 | | | $ | (.84 | ) | | $ | (1.70 | ) | | $ | (2.54 | ) | | $ | 54.33 | | | | 12.47 | % | | $ | 2,318 | | | | .66 | % | | | 1.63 | % |
| Year ended 12/31/2015 | | | 51.96 | | | | .75 | | | | .97 | | | | 1.72 | | | | (.74 | ) | | | (2.32 | ) | | | (3.06 | ) | | | 50.62 | | | | 3.36 | | | | 2,289 | | | | .65 | | | | 1.42 | |
| Year ended 12/31/2014 | | | 51.88 | | | | .96 | | | | 3.61 | | | | 4.57 | | | | (.93 | ) | | | (3.56 | ) | | | (4.49 | ) | | | 51.96 | | | | 8.90 | | | | 2,651 | | | | .66 | | | | 1.82 | |
| Year ended 12/31/2013 | | | 40.71 | | | | .61 | | | | 12.12 | | | | 12.73 | | | | (.64 | ) | | | (.92 | ) | | | (1.56 | ) | | | 51.88 | | | | 31.47 | | | | 2,842 | | | | .66 | | | | 1.32 | |
| Year ended 12/31/2012 | | | 35.33 | | | | .64 | | | | 5.39 | | | | 6.03 | | | | (.65 | ) | | | — | | | | (.65 | ) | | | 40.71 | | | | 17.13 | | | | 2,390 | | | | .66 | | | | 1.65 | |
| Class R-5E: | | | | | | | | | | | | | | | | | | | | | | | | | | | | | | | | | �� | | | | | | | | | | | | | | | |
| Year ended 12/31/2016 | | | 50.69 | | | | 1.03 | | | | 5.30 | | | | 6.33 | | | | (.94 | ) | | | (1.70 | ) | | | (2.64 | ) | | | 54.38 | | | | 12.62 | | | | 10 | | | | .57 | | | | 1.99 | |
Period from 11/20/2015
to 12/31/20154,9 | | | 53.80 | | | | .11 | | | | (1.16 | ) | | | (1.05 | ) | | | (.35 | ) | | | (1.71 | ) | | | (2.06 | ) | | | 50.69 | | | | (1.95 | )6 | | | — | 8 | | | .05 | 6 | | | .21 | 6 |
| Class R-5: | | | | | | | | | | | | | | | | | | | | | | | | | | | | | | | | | | | | | | | | | | | | | | | | |
| Year ended 12/31/2016 | | | 50.74 | | | | 1.00 | | | | 5.43 | | | | 6.43 | | | | (1.00 | ) | | | (1.70 | ) | | | (2.70 | ) | | | 54.47 | | | | 12.81 | | | | 1,800 | | | | .35 | | | | 1.93 | |
| Year ended 12/31/2015 | | | 52.08 | | | | .90 | | | | .98 | | | | 1.88 | | | | (.90 | ) | | | (2.32 | ) | | | (3.22 | ) | | | 50.74 | | | | 3.66 | | | | 1,914 | | | | .35 | | | | 1.72 | |
| Year ended 12/31/2014 | | | 51.99 | | | | 1.13 | | | | 3.62 | | | | 4.75 | | | | (1.10 | ) | | | (3.56 | ) | | | (4.66 | ) | | | 52.08 | | | | 9.23 | | | | 1,979 | | | | .35 | | | | 2.12 | |
| Year ended 12/31/2013 | | | 40.79 | | | | .76 | | | | 12.14 | | | | 12.90 | | | | (.78 | ) | | | (.92 | ) | | | (1.70 | ) | | | 51.99 | | | | 31.87 | | | | 1,964 | | | | .36 | | | | 1.62 | |
| Year ended 12/31/2012 | | | 35.40 | | | | .75 | | | | 5.40 | | | | 6.15 | | | | (.76 | ) | | | — | | | | (.76 | ) | | | 40.79 | | | | 17.47 | | | | 1,516 | | | | .36 | | | | 1.95 | |
| Class R-6: | | | | | | | | | | | | | | | | | | | | | | | | | | | | | | | | | | | | | | | | | | | | | | | | |
| Year ended 12/31/2016 | | | 50.72 | | | | 1.04 | | | | 5.42 | | | | 6.46 | | | | (1.03 | ) | | | (1.70 | ) | | | (2.73 | ) | | | 54.45 | | | | 12.88 | | | | 8,948 | | | | .31 | | | | 1.99 | |
| Year ended 12/31/2015 | | | 52.06 | | | | .93 | | | | .97 | | | | 1.90 | | | | (.92 | ) | | | (2.32 | ) | | | (3.24 | ) | | | 50.72 | | | | 3.71 | | | | 6,590 | | | | .31 | | | | 1.77 | |
| Year ended 12/31/2014 | | | 51.98 | | | | 1.12 | | | | 3.64 | | | | 4.76 | | | | (1.12 | ) | | | (3.56 | ) | | | (4.68 | ) | | | 52.06 | | | | 9.27 | | | | 5,713 | | | | .31 | | | | 2.12 | |
| Year ended 12/31/2013 | | | 40.78 | | | | .79 | | | | 12.13 | | | | 12.92 | | | | (.80 | ) | | | (.92 | ) | | | (1.72 | ) | | | 51.98 | | | | 31.95 | | | | 4,516 | | | | .31 | | | | 1.68 | |
| Year ended 12/31/2012 | | | 35.39 | | | | .79 | | | | 5.38 | | | | 6.17 | | | | (.78 | ) | | | — | | | | (.78 | ) | | | 40.78 | | | | 17.53 | | | | 2,409 | | | | .31 | | | | 2.03 | |
| | | Year ended December 31 |
| | | 2016 | | 2015 | | 2014 | | 2013 | | 2012 |
| Portfolio turnover rate for all share classes | | 24% | | 27% | | 29% | | 34% | | 28% |
| 1 | Based on average shares outstanding. |
| 2 | For the year ended December 31, 2014, this column reflects the impact of a corporate action event that resulted in a one-time increase to net investment income. If the corporate action event had not occurred, the Class A net investment income per share and ratio of net income to average net assets would have been lower by $.27 and .51 percentage points, respectively. The impact to the other share classes would have been similar. |
| 3 | Total returns exclude any applicable sales charges, including contingent deferred sales charges. |
| 4 | Based on operations for the period shown and, accordingly, is not representative of a full year. |
| 5 | Class R-2E shares were offered beginning August 29, 2014. |
| 6 | Not annualized. |
| 7 | All or a significant portion of assets in this class consisted of seed capital invested by CRMC and/or its affiliates. Certain fees (including, where applicable, fees for distribution services) are not charged or accrued on these seed capital assets. If such fees were paid by the fund on seed capital assets, fund expenses would have been higher and net income and total return would have been lower. |
| 8 | Amount less than $1 million. |
| 9 | Class R-5E shares were offered beginning November 20, 2015. |
See Notes to Financial Statements
Report of Independent Registered Public Accounting Firm
To the Shareholders and Board of Trustees of American Funds Fundamental Investors — Fundamental Investors:
We have audited the accompanying statement of assets and liabilities of American Funds Fundamental Investors – Fundamental Investors (the “Fund”), including the summary investment portfolio, as of December 31, 2016, and the related statement of operations for the year then ended, the statements of changes in net assets for each of the two years in the period then ended, and the financial highlights for each of the periods presented. These financial statements and financial highlights are the responsibility of the Fund’s management. Our responsibility is to express an opinion on these financial statements and financial highlights based on our audits.
We conducted our audits in accordance with the standards of the Public Company Accounting Oversight Board (United States). Those standards require that we plan and perform the audit to obtain reasonable assurance about whether the financial statements and financial highlights are free of material misstatement. The Fund is not required to have, nor were we engaged to perform, an audit of its internal control over financial reporting. Our audits included consideration of internal control over financial reporting as a basis for designing audit procedures that are appropriate in the circumstances, but not for the purpose of expressing an opinion on the effectiveness of the Fund’s internal control over financial reporting. Accordingly, we express no such opinion. An audit also includes examining, on a test basis, evidence supporting the amounts and disclosures in the financial statements, assessing the accounting principles used and significant estimates made by management, as well as evaluating the overall financial statement presentation. Our procedures included confirmation of securities owned as of December 31, 2016, by correspondence with the custodian and brokers; where replies were not received from brokers, we performed other auditing procedures. We believe that our audits provide a reasonable basis for our opinion.
In our opinion, such financial statements and financial highlights referred to above present fairly, in all material respects, the financial position of American Funds Fundamental Investors — Fundamental Investors as of December 31, 2016, the results of its operations for the year then ended, the changes in its net assets for each of the two years in the period then ended, and the financial highlights for each of the periods presented, in conformity with accounting principles generally accepted in the United States of America.
Deloitte & Touche LLP
Costa Mesa, California
February 9, 2017
As a fund shareholder, you incur two types of costs: (1) transaction costs, such as initial sales charges on purchase payments and contingent deferred sales charges on redemptions (loads), and (2) ongoing costs, including management fees, distribution and service (12b-1) fees, and other expenses. This example is intended to help you understand your ongoing costs (in dollars) of investing in the fund so you can compare these costs with the ongoing costs of investing in other mutual funds. The example is based on an investment of $1,000 invested at the beginning of the period and held for the entire six-month period (July 1, 2016, through December 31, 2016).
Actual expenses:
The first line of each share class in the table on the following page provides information about actual account values and actual expenses. You may use the information in this line, together with the amount you invested, to estimate the expenses that you paid over the period. Simply divide your account value by $1,000 (for example, an $8,600 account value divided by $1,000 = 8.6), then multiply the result by the number in the first line under the heading titled “Expenses paid during period” to estimate the expenses you paid on your account during this period.
Hypothetical example for comparison purposes:
The second line of each share class in the table on the following page provides information about hypothetical account values and hypothetical expenses based on the actual expense ratio for the share class and an assumed rate of return of 5.00% per year before expenses, which is not the actual return of the share class. The hypothetical account values and expenses may not be used to estimate the actual ending account balance or expenses you paid for the period. You may use this information to compare the ongoing costs of investing in the fund and other funds. To do so, compare this 5.00% hypothetical example with the 5.00% hypothetical examples that appear in the shareholder reports of the other funds.
Notes:
Retirement plan participants may be subject to certain fees charged by the plan sponsor, and Class F-1, F-2 and 529-F-1 shareholders may be subject to fees charged by financial intermediaries, typically ranging from 0.75% to 1.50% of assets annually depending on services offered. You can estimate the impact of these fees by adding the amount of the fees to the total estimated expenses you paid on your account during the period as calculated above. In addition, your ending account value would be lower by the amount of these fees.
Note that the expenses shown in the table on the following page are meant to highlight your ongoing costs only and do not reflect any transactional costs, such as sales charges (loads). Therefore, the second line of each share class in the table is useful in comparing ongoing costs only and will not help you determine the relative total costs of owning different funds. In addition, if these transactional costs were included, your costs would have been higher.
| | | Beginning | | Ending | | | | | |
| | | account value | | account value | | Expenses paid | | Annualized | |
| | | 7/1/2016 | | 12/31/2016 | | during period* | | expense ratio | |
| Class A - actual return | | $ | 1,000.00 | | $ | 1,082.97 | | $ | 3.20 | | | .61 | % |
| Class A - assumed 5% return | | | 1,000.00 | | | 1,022.13 | | | 3.11 | | | .61 | |
| Class B - actual return | | | 1,000.00 | | | 1,078.87 | | | 7.18 | | | 1.37 | |
| Class B - assumed 5% return | | | 1,000.00 | | | 1,018.30 | | | 6.97 | | | 1.37 | |
| Class C - actual return | | | 1,000.00 | | | 1,078.67 | | | 7.34 | | | 1.40 | |
| Class C - assumed 5% return | | | 1,000.00 | | | 1,018.15 | | | 7.12 | | | 1.40 | |
| Class F-1 - actual return | | | 1,000.00 | | | 1,082.81 | | | 3.52 | | | .67 | |
| Class F-1 - assumed 5% return | | | 1,000.00 | | | 1,021.83 | | | 3.41 | | | .67 | |
| Class F-2 - actual return | | | 1,000.00 | | | 1,084.30 | | | 2.15 | | | .41 | |
| Class F-2 - assumed 5% return | | | 1,000.00 | | | 1,023.14 | | | 2.09 | | | .41 | |
| Class 529-A - actual return | | | 1,000.00 | | | 1,082.56 | | | 3.57 | | | .68 | |
| Class 529-A - assumed 5% return | | | 1,000.00 | | | 1,021.78 | | | 3.47 | | | .68 | |
| Class 529-B - actual return | | | 1,000.00 | | | 1,078.26 | | | 7.75 | | | 1.48 | |
| Class 529-B - assumed 5% return | | | 1,000.00 | | | 1,017.74 | | | 7.53 | | | 1.48 | |
| Class 529-C - actual return | | | 1,000.00 | | | 1,078.43 | | | 7.65 | | | 1.46 | |
| Class 529-C - assumed 5% return | | | 1,000.00 | | | 1,017.85 | | | 7.43 | | | 1.46 | |
| Class 529-E - actual return | | | 1,000.00 | | | 1,081.60 | | | 4.77 | | | .91 | |
| Class 529-E - assumed 5% return | | | 1,000.00 | | | 1,020.62 | | | 4.63 | | | .91 | |
| Class 529-F-1 - actual return | | | 1,000.00 | | | 1,084.03 | | | 2.42 | | | .46 | |
| Class 529-F-1 - assumed 5% return | | | 1,000.00 | | | 1,022.89 | | | 2.35 | | | .46 | |
| Class R-1 - actual return | | | 1,000.00 | | | 1,078.62 | | | 7.44 | | | 1.42 | |
| Class R-1 - assumed 5% return | | | 1,000.00 | | | 1,018.05 | | | 7.22 | | | 1.42 | |
| Class R-2 - actual return | | | 1,000.00 | | | 1,078.60 | | | 7.39 | | | 1.41 | |
| Class R-2 - assumed 5% return | | | 1,000.00 | | | 1,018.10 | | | 7.17 | | | 1.41 | |
| Class R-2E - actual return | | | 1,000.00 | | | 1,080.46 | | | 5.77 | | | 1.10 | |
| Class R-2E - assumed 5% return | | | 1,000.00 | | | 1,019.66 | | | 5.60 | | | 1.10 | |
| Class R-3 - actual return | | | 1,000.00 | | | 1,081.15 | | | 5.04 | | | .96 | |
| Class R-3 - assumed 5% return | | | 1,000.00 | | | 1,020.37 | | | 4.89 | | | .96 | |
| Class R-4 - actual return | | | 1,000.00 | | | 1,082.74 | | | 3.46 | | | .66 | |
| Class R-4 - assumed 5% return | | | 1,000.00 | | | 1,021.88 | | | 3.36 | | | .66 | |
| Class R-5E - actual return | | | 1,000.00 | | | 1,083.52 | | | 2.99 | | | .57 | |
| Class R-5E - assumed 5% return | | | 1,000.00 | | | 1,022.33 | | | 2.91 | | | .57 | |
| Class R-5 - actual return | | | 1,000.00 | | | 1,084.39 | | | 1.89 | | | .36 | |
| Class R-5 - assumed 5% return | | | 1,000.00 | | | 1,023.39 | | | 1.84 | | | .36 | |
| Class R-6 - actual return | | | 1,000.00 | | | 1,084.64 | | | 1.58 | | | .30 | |
| Class R-6 - assumed 5% return | | | 1,000.00 | | | 1,023.69 | | | 1.53 | | | .30 | |
| * | The “expenses paid during period” are equal to the “annualized expense ratio,” multiplied by the average account value over the period, multiplied by the number of days in the period, and divided by 365 (to reflect the one-half year period). |
We are required to advise you of the federal tax status of certain distributions received by shareholders during the fiscal year. The fund hereby designates the following amounts for the fund’s fiscal year ended December 31, 2016:
| Long-term capital gains | $ | 2,626,187,000 |
| Qualified dividend income | | 100% |
| Corporate dividends received deduction | | 100% |
| U.S. government income that may be exempt from state taxation | | $4,607,000 |
Individual shareholders should refer to their Form 1099 or other tax information, which was mailed in January 2017, to determine the calendar year amounts to be included on their 2016 tax returns. Shareholders should consult their tax advisors.
Approval of Investment Advisory and Service Agreement
The Fundamental Investors board has approved the fund’s Investment Advisory and Service Agreement (the “agreement”) with Capital Research and Management Company (“CRMC”) for an additional one-year term through November 30, 2017. The board approved the agreement following the recommendation of the fund’s Contracts Committee (the “committee”), which is composed of all of the fund’s independent board members. The board and the committee determined that the fund’s advisory fee structure was fair and reasonable in relation to the services provided, and that approving the agreement was in the best interests of the fund and its shareholders.
In reaching this decision, the board and the committee took into account information furnished to them throughout the year and otherwise provided to them, as well as information prepared specifically in connection with their review of the agreement, and were advised by their independent counsel. They considered the following factors, among others, but did not identify any single issue or particular piece of information that, in isolation, was the controlling factor, and each board and committee member did not necessarily attribute the same weight to each factor.
1. Nature, extent and quality of services
The board and the committee considered the depth and quality of CRMC’s investment management process, including its global research capabilities; the experience, capability and integrity of its senior management and other personnel; the low turnover rates of its key personnel; the overall financial strength and stability of CRMC and the Capital Group organization; and the ongoing evolution of CRMC’s organizational structure designed to maintain and strengthen these qualities. The board and the committee also considered the nature, extent and quality of administrative, compliance and shareholder services provided by CRMC to the fund under the agreement and other agreements, as well as the benefits to fund shareholders from investing in a fund that is part of a large family of funds. The board and the committee concluded that the nature, extent and quality of the services provided by CRMC have benefited and should continue to benefit the fund and its shareholders.
2. Investment results
The board and the committee considered the investment results of the fund in light of its objective of pursuing long-term growth of capital and income. They compared the fund’s investment results with those of other funds (including funds that currently form the basis of the Lipper index for the category in which the fund is included), and data such as relevant market and fund indexes, over various periods through March 31, 2016. This report, including the letter to shareholders and related disclosures, contains certain information about the fund’s investment results. The board and the committee reviewed the fund’s investment results measured against various indexes, including the Lipper Growth and Income Funds Index and the Standard & Poor’s 500 Composite Index. They noted that the investment results of the fund generally compared favorably to the results of these indexes for the lifetime period, 20-year period, 10-year period and five-year period. The board and the committee concluded that the fund’s investment results have been satisfactory for renewal of the agreement and that CRMC’s record in managing the fund indicated that its continued management should benefit the fund and its shareholders.
3. Advisory fees and total expenses
The board and the committee compared the advisory fees and total expense levels of the fund to those of other relevant funds. They observed that the fund’s advisory fees and expenses generally compared favorably to those of other similar funds included in the Lipper Growth and Income Funds category. The board and the committee also considered the breakpoint discounts in the fund’s advisory fee structure that reduce the level of fees charged by CRMC to the fund as fund assets increase. In addition, they reviewed information regarding the effective advisory fees charged to non-mutual fund clients by CRMC and its affiliates. They noted that, to the extent there were differences between the advisory fees paid by the fund and the advisory fees paid by those clients, the differences appropriately reflected the investment, operational, regulatory and market differences between advising the fund and the other clients. The board and the committee concluded that the fund’s cost structure was fair and reasonable in relation to the services provided, and that the fund’s shareholders receive reasonable value in return for the advisory fees and other amounts paid to CRMC by the fund.
4. Ancillary benefits
The board and the committee considered a variety of other benefits that CRMC and its affiliates receive as a result of CRMC’s relationship with the fund and the other American Funds, including fees for administrative services provided to certain share classes; fees paid to CRMC’s affiliated transfer agent; sales charges and distribution fees received and retained by the fund’s principal underwriter, an affiliate of CRMC; and possible ancillary benefits to CRMC and its institutional management affiliates in managing other investment vehicles. The board and the committee reviewed CRMC’s portfolio trading practices, noting the benefits CRMC receives from the research obtained with commissions from portfolio transactions made on behalf of the fund. The board and the committee took these ancillary benefits into account in evaluating the reasonableness of the advisory fees and other amounts paid to CRMC by the fund.
5. Adviser financial information
The board and the committee reviewed information regarding CRMC’s costs of providing services to the American Funds, including personnel, systems and resources of investment, compliance, trading, accounting and other administrative operations. They considered CRMC’s costs and related cost allocation methodology as well as its willingness to invest in technology, infrastructure and staff to maintain and expand services and capabilities, respond to industry and regulatory developments, and attract and retain qualified personnel. They noted information regarding the compensation structure for CRMC’s investment professionals. The board and the committee also compared CRMC’s profitability and compensation data to the reported results and data of several large, publicly held investment management companies. The board and the committee noted the competitiveness and cyclicality of both the mutual fund industry and the capital markets, and the importance in that environment of CRMC’s long-term profitability for maintaining its independence, company culture and management continuity. They further considered the breakpoint discounts in the fund’s advisory fee structure. The board and the committee concluded that the fund’s advisory fee structure reflected a reasonable sharing of benefits between CRMC and the fund’s shareholders.
Board of trustees and other officers
Independent trustees1
| Name and year of birth | | Year first
elected
a trustee
of the fund2 | | Principal occupation(s) during past five years | | Number of
portfolios in fund
complex overseen
by trustee3 | | Other directorships4
held by trustee |
| Ronald P. Badie, 1942 | | 2008 | | Retired; former Vice Chairman, Deutsche Bank Alex. Brown (retired 2002) | | 3 | | Amphenol Corporation; Nautilus, Inc. |
| Joseph C. Berenato, 1946 | | 2003 | | Former Chairman and CEO, Ducommun Incorporated (aerospace components manufacturer) | | 16 | | Ducommun Incorporated |
| Louise H. Bryson, 1944 | | 2008 | | Chair Emerita of the Board of Trustees, J. Paul Getty Trust; former President, Distribution, Lifetime Entertainment Network (retired 2008); former Executive Vice President and General Manager, Lifetime Movie Network (retired 2008) | | 7 | | None |
| Mary Anne Dolan, 1947 Chairman of the Board (Independent and Non-Executive) | | 2010 | | Founder and President, MAD Ink (communications company) | | 10 | | None |
| John G. Freund, 1953 | | 2010 | | Founder and Managing Director, Skyline Ventures (venture capital investor in health care companies) | | 6 | | Collegium Pharmaceutical, Inc.; Proteon Therapeutics, Inc.; Tetraphase Pharmaceuticals, Inc. |
| Linda Griego, 1947 | | 2015 | | President and CEO, Griego Enterprises, Inc. (business management company) | | 7 | | AECOM Technology Corporation; CBS Corporation |
| Leonade D. Jones, 1947 | | 1998 | | Retired; former Treasurer, The Washington Post Company (retired 1996) | | 10 | | None |
| William H. Kling, 1942 | | 2010 | | President Emeritus and former CEO, American Public Media | | 10 | | None |
| Kenneth M. Simril, 1965 | | 2016 | | President and CEO, Fleischmann’s Ingredients and SCI Ingredients Holdings, Inc. (food manufacturing) | | 3 | | None |
| Christopher E. Stone, 1956 | | 2010 | | President, Open Society Foundations; former Professor of the Practice of Criminal Justice, John F. Kennedy School of Government, Harvard University | | 6 | | None |
Robert J. Denison retired from the fund on December 31, 2016. The trustees thank Mr. Denison for his wise counsel and dedication to the fund.
Interested trustees5,6
Name, year of birth
and position with fund | | Year first
elected
a trustee
or officer
of the fund2 | | Principal occupation(s) during past five years
and positions held with affiliated entities or
the principal underwriter of the fund | | Number of
portfolios in fund
complex overseen
by trustee3 | | Other directorships4
held by trustee |
Dina N. Perry, 1945
Vice Chairman of the Board | | 1994 | | Partner — Capital World Investors, Capital Research and Management Company; Director, The Capital Group Companies, Inc.7 | | 1 | | None |
| Brady L. Enright, 1967 President | | 2015 | | Partner — Capital World Investors, Capital Research and Management Company; Director, Capital Research and Management Company | | 1 | | None |
The fund’s statement of additional information includes further details about fund trustees and is available without charge upon request by calling American Funds Service Company at (800) 421-4225 or by visiting the American Funds website at americanfunds.com. The address for all trustees and officers of the fund is 333 South Hope Street, Los Angeles, CA 90071, Attention: Secretary.
Other officers6
Name, year of birth
and position with fund | | Year first
elected
an officer
of the fund2 | | Principal occupation(s) during past five years and positions held with affiliated entities
or the principal underwriter of the fund |
Paul F. Roye, 1953
Executive Vice President | | 2012 | | Director, Capital Research and Management Company;
Senior Vice President and Senior Counsel — Fund Business Management Group, Capital Research and Management Company |
Michael T. Kerr, 1959
Senior Vice President | | 1995 | | Partner — Capital World Investors, Capital Research and Management Company |
Martin Romo, 1967
Senior Vice President | | 1999 | | Partner — Capital World Investors, Capital Research and Management Company;
President and Director, Capital Research Company;7
Director, The Capital Group Companies, Inc.7 |
Walter R. Burkley, 1966
Vice President | | 2010 | | Senior Vice President and Senior Counsel — Fund Business Management Group, Capital Research and Management Company; Director, Capital Research Company7 |
Mark L. Casey, 1970
Vice President | | 2008 | | Partner — Capital World Investors, Capital Research and Management Company |
Ronald B. Morrow, 1945
Vice President | | 2004 | | Partner — Capital World Investors, Capital Research and Management Company |
Michael W. Stockton, 1967
Secretary | | 2014 | | Vice President — Fund Business Management Group, Capital Research and Management Company |
Brian D. Bullard, 1969
Treasurer | | 2016 | | Senior Vice President — Investment Operations, Capital Research and Management Company |
Julie E. Lawton, 1973
Assistant Secretary | | 2010 | | Assistant Vice President — Fund Business Management Group, Capital Research and Management Company; Secretary, Capital Research Company7 |
Brian C. Janssen, 1972
Assistant Treasurer | | 2016 | | Vice President — Investment Operations, Capital Research and Management Company |
Dori Laskin, 1951
Assistant Treasurer | | 2011 | | Vice President — Investment Operations, Capital Research and Management Company |
| 1 | The term independent trustee refers to a trustee who is not an “interested person” of the fund within the meaning of the Investment Company Act of 1940. |
| 2 | Trustees and officers of the fund serve until their resignation, removal or retirement. |
| 3 | Funds managed by Capital Research and Management Company or its affiliates. |
| 4 | This includes all directorships/trusteeships (other than those in the American Funds or other funds managed by Capital Research and Management Company or its affiliates) that are held by each trustee as a trustee or director of a public company or a registered investment company. |
| 5 | The term interested trustee refers to a trustee who is an “interested person” within the meaning of the Investment Company Act of 1940, on the basis of their affiliation with the fund’s investment adviser, Capital Research and Management Company, or affiliated entities (including the fund’s principal underwriter). |
| 6 | All of the trustees and/or officers listed are officers and/or directors/trustees of one or more of the other funds for which Capital Research and Management Company serves as investment adviser. |
| 7 | Company affiliated with Capital Research and Management Company. |
Office of the fund
6455 Irvine Center Drive
Irvine, CA 92618-4518
Investment adviser
Capital Research and Management Company
333 South Hope Street
Los Angeles, CA 90071-1406
6455 Irvine Center Drive
Irvine, CA 92618-4518
Transfer agent for shareholder accounts
American Funds Service Company
(Write to the address near you.)
P.O. Box 6007
Indianapolis, IN 46206-6007
P.O. Box 2280
Norfolk, VA 23501-2280
Custodian of assets
State Street Bank and Trust Company
One Lincoln Street
Boston, MA 02111
Counsel
Dechert LLP
One Bush Street, Suite 1600
San Francisco, CA 94104-4446
Independent registered public accounting firm
Deloitte & Touche LLP
695 Town Center Drive
Suite 1200
Costa Mesa, CA 92626-7188
Principal underwriter
American Funds Distributors, Inc.
333 South Hope Street
Los Angeles, CA 90071-1406
Investors should carefully consider investment objectives, risks, charges and expenses. This and other important information is contained in the fund prospectus and summary prospectus, which can be obtained from your financial professional and should be read carefully before investing. You may also call American Funds Service Company (AFS) at (800) 421-4225 or visit the American Funds website at americanfunds.com.
“American Funds Proxy Voting Procedures and Principles” — which describes how we vote proxies relating to portfolio securities — is available on the American Funds website or upon request by calling AFS. The fund files its proxy voting record with the U.S. Securities and Exchange Commission (SEC) for the 12 months ended June 30 by August 31. The proxy voting record is available free of charge on the SEC website at sec.gov and on the American Funds website.
A complete December 31, 2016, portfolio of Fundamental Investors’ investments is available free of charge by calling AFS or visiting the SEC website (where it is part of Form N-CSR).
Fundamental Investors files a complete list of its portfolio holdings with the SEC for the first and third quarters of each fiscal year on Form N-Q. This filing is available free of charge on the SEC website. You may also review or, for a fee, copy this filing at the SEC’s Public Reference Room in Washington, D.C. Additional information regarding the operation of the Public Reference Room may be obtained by calling the SEC’s Office of Investor Education and Advocacy at (800) SEC-0330. Additionally, the list of portfolio holdings is available by calling AFS.
This report is for the information of shareholders of Fundamental Investors, but it also may be used as sales literature when preceded or accompanied by the current prospectus or summary prospectus, which gives details about charges, expenses, investment objectives and operating policies of the fund. If used as sales material after March 31, 2017, this report must be accompanied by an American Funds statistical update for the most recently completed calendar quarter.
Standard & Poor’s 500 Composite Index is a product of S&P Dow Jones Indices LLC and/or its affiliates and has been licensed for use by Capital Group. Copyright © 2017 S&P Dow Jones Indices LLC, a division of S&P Global, and/or its affiliates. All rights reserved. Redistribution or reproduction in whole or in part are prohibited without written permission of S&P Dow Jones Indices LLC.
MSCI has not approved, reviewed or produced this report, makes no express or implied warranties or representations and is not liable whatsoever for any data in the report. You may not redistribute the MSCI data or use it as a basis for other indices or investment products.
American Funds from Capital Group
The Capital AdvantageSM
Since 1931, American Funds, part of Capital Group, has helped investors pursue long-term investment success. Our consistent approach — in combination with The Capital SystemSM — has resulted in a superior long-term track record.
Aligned with investor success
We base our decisions on a long-term perspective, which we believe aligns our goals with the interests of our clients. Our portfolio managers average 27 years of investment experience, including 22 years at our company, reflecting a career commitment to our long-term approach.1
The Capital SystemSM
The Capital System combines individual accountability with teamwork. Funds using The Capital System are divided into portions that are managed independently by investment professionals with diverse backgrounds, ages and investment approaches. An extensive global research effort is the backbone of our system.
American Funds’ superior long-term track record
Equity funds have beaten their Lipper peer indexes in 91% of 10-year periods and 95% of 20-year periods. Fixed income funds have beaten their Lipper indexes in 58% of 10-year periods and 58% of 20-year periods.2 Fund management fees have been among the lowest in the industry.3
| | 1 | Portfolio manager experience as of December 31, 2015. |
| | 2 | Based on Class A share results for rolling periods through December 31, 2015. Periods covered are the shorter of the fund’s lifetime or since the comparable Lipper index inception date (except Capital Income Builder and SMALLCAP World Fund, for which the Lipper average was used). Expenses differ for each share class, so results will vary. |
| | 3 | On average, our management fees were in the lowest quintile 68% of the time, based on the 20-year period ended December 31, 2015, versus comparable Lipper categories, excluding funds of funds. |

ITEM 2 – Code of Ethics
The Registrant has adopted a Code of Ethics that applies to its Principal Executive Officer and Principal Financial Officer. The Registrant undertakes to provide to any person without charge, upon request, a copy of the Code of Ethics. Such request can be made to American Funds Service Company at 800/421-9225 or to the Secretary of the Registrant, 6455 Irvine Center Drive, Irvine, California 92618.
ITEM 3 – Audit Committee Financial Expert
The Registrant’s board has determined that Ronald P. Badie, a member of the Registrant’s audit committee, is an “audit committee financial expert” and "independent," as such terms are defined in this Item. This designation will not increase the designee’s duties, obligations or liability as compared to his or her duties, obligations and liability as a member of the audit committee and of the board, nor will it reduce the responsibility of the other audit committee members. There may be other individuals who, through education or experience, would qualify as "audit committee financial experts" if the board had designated them as such. Most importantly, the board believes each member of the audit committee contributes significantly to the effective oversight of the Registrant’s financial statements and condition.
| ITEM 4 – Principal Accountant Fees and Services | |
| | | |
| Registrant: | |
| a) Audit Fees: | |
| | 2015 | $95,000 |
| | 2016 | $105,000 |
| | | |
| b) Audit-Related Fees: | |
| | 2015 | $22,000 |
| | 2016 | $23,000 |
| | | |
| c) Tax Fees: | |
| | 2015 | $8,000 |
| | 2016 | $11,000 |
| | The tax fees consist of professional services relating to the preparation of the Registrant’s tax returns. |
| | | |
| d) All Other Fees: | |
| | 2015 | None |
| | 2016 | None |
| | | |
| | Adviser and affiliates (includes only fees for non-audit services billed to the adviser and affiliates for engagements that relate directly to the operations and financial reporting of the Registrant and were subject to the pre-approval policies described below): |
| a) Audit Fees: | |
| | Not Applicable | |
| | | |
| b) Audit-Related Fees: | |
| | 2015 | $1,183,000 |
| | 2016 | $1,098,000 |
| | The audit-related fees consist of assurance and related services relating to the examination of the Registrant’s transfer agent, principal underwriter and investment adviser conducted in accordance with Statement on Standards for Attestation Engagements Number 16 issued by the American Institute of Certified Public Accountants. |
| | | |
| c) Tax Fees: | |
| | 2015 | None |
| | 2016 | None |
| | The tax fees consist of consulting services relating to the Registrant’s investments. |
| | | |
| | | |
| d) All Other Fees: | |
| | 2015 | $5,000 |
| | 2016 | None |
| | The other fees consist of subscription services related to an accounting research tool. |
| | | |
| All audit and permissible non-audit services that the Registrant’s audit committee considers compatible with maintaining the independent registered public accounting firm’s independence are required to be pre-approved by the committee. The pre-approval requirement will extend to all non-audit services provided to the Registrant, the investment adviser, and any entity controlling, controlled by, or under common control with the investment adviser that provides ongoing services to the Registrant, if the engagement relates directly to the operations and financial reporting of the Registrant. The committee will not delegate its responsibility to pre-approve these services to the investment adviser. The committee may delegate to one or more committee members the authority to review and pre-approve audit and permissible non-audit services. Actions taken under any such delegation will be reported to the full committee at its next meeting. The pre-approval requirement is waived with respect to non-audit services if certain conditions are met. The pre-approval requirement was not waived for any of the non-audit services listed above provided to the Registrant, adviser and affiliates. |
| | | |
| Aggregate non-audit fees paid to the Registrant’s auditors, including fees for all services billed to the Registrant, adviser and affiliates that provide ongoing services to the Registrant, were $1,489,000 for fiscal year 2015 and $1,278,000 for fiscal year 2016. The non-audit services represented by these amounts were brought to the attention of the committee and considered to be compatible with maintaining the auditors’ independence. |
ITEM 5 – Audit Committee of Listed Registrants
Not applicable to this Registrant, insofar as the Registrant is not a listed issuer as defined in Rule 10A-3 under the Securities Exchange Act of 1934.
ITEM 6 – Schedule of Investments
Fundamental Investors®
Investment portfolio
December 31, 2016
Common stocks 96.24%
Information technology 20.74% | Shares | Value
(000) |
| Microsoft Corp. | 58,004,100 | $3,604,375 |
| Broadcom Ltd. | 13,480,442 | 2,382,938 |
| Apple Inc. | 11,240,000 | 1,301,817 |
| Taiwan Semiconductor Manufacturing Co., Ltd.1 | 190,310,000 | 1,065,743 |
| Taiwan Semiconductor Manufacturing Co., Ltd. (ADR) | 6,438,430 | 185,105 |
| Alphabet Inc., Class C2 | 1,010,618 | 780,015 |
| Alphabet Inc., Class A2 | 442,800 | 350,897 |
| Texas Instruments Inc. | 14,575,300 | 1,063,560 |
| ASML Holding NV1 | 5,355,030 | 599,997 |
| ASML Holding NV (New York registered) | 3,240,000 | 363,528 |
| Intel Corp. | 25,159,600 | 912,539 |
| Visa Inc., Class A | 6,980,000 | 544,579 |
| Amphenol Corp., Class A | 6,750,000 | 453,600 |
| Facebook, Inc., Class A2 | 3,485,000 | 400,949 |
| Intuit Inc. | 3,145,000 | 360,448 |
| International Business Machines Corp. | 2,079,300 | 345,143 |
| Baidu, Inc., Class A (ADR)2 | 1,890,000 | 310,735 |
| MasterCard Inc., Class A | 2,700,000 | 278,775 |
| Analog Devices, Inc. | 3,395,000 | 246,545 |
| QUALCOMM Inc. | 3,500,000 | 228,200 |
| Murata Manufacturing Co., Ltd.1 | 1,370,000 | 182,439 |
| TE Connectivity Ltd. | 2,300,000 | 159,344 |
| Accenture PLC, Class A | 1,000,000 | 117,130 |
| Samsung Electronics Co., Ltd.1 | 63,200 | 93,382 |
| Activision Blizzard, Inc. | 2,266,700 | 81,850 |
| KLA-Tencor Corp. | 825,140 | 64,922 |
| Finisar Corp.2 | 852,000 | 25,790 |
| Juniper Networks, Inc. | 875,000 | 24,727 |
| | | 16,529,072 |
| Consumer discretionary 14.64% | | |
| Amazon.com, Inc.2 | 4,016,000 | 3,011,478 |
| Comcast Corp., Class A | 26,211,000 | 1,809,870 |
| Home Depot, Inc. | 13,066,775 | 1,751,993 |
| Time Warner Inc. | 5,963,000 | 575,608 |
| Priceline Group Inc.2 | 284,284 | 416,777 |
| Walt Disney Co. | 3,640,000 | 379,361 |
| Target Corp. | 5,000,000 | 361,150 |
| Twenty-First Century Fox, Inc., Class A | 12,138,602 | 340,366 |
| Newell Brands Inc. | 7,057,000 | 315,095 |
| Ulta Salon, Cosmetics & Fragrance, Inc.2 | 1,215,000 | 309,752 |
| Starbucks Corp. | 5,400,000 | 299,808 |
| Liberty Global PLC, Class C, nonvoting2 | 5,159,811 | 153,246 |
| Liberty Global PLC, Class A2 | 3,863,679 | 118,190 |
| Viacom Inc., Class B | 7,250,000 | 254,475 |
| Hilton Worldwide Holdings Inc. | 8,500,000 | 231,200 |
| Charter Communications, Inc., Class A2 | 782,467 | 225,288 |
Fundamental Investors — Page 1 of 6
Common stocks
Consumer discretionary (continued) | Shares | Value
(000) |
| McDonald’s Corp. | 1,800,000 | $219,096 |
| Royal Caribbean Cruises Ltd. | 2,365,000 | 194,025 |
| Macy’s, Inc. | 4,500,000 | 161,145 |
| Las Vegas Sands Corp. | 3,000,000 | 160,230 |
| Netflix, Inc.2 | 850,000 | 105,230 |
| CBS Corp., Class B | 1,480,000 | 94,158 |
| Sony Corp.1 | 2,850,000 | 79,205 |
| NIKE, Inc., Class B | 915,000 | 46,509 |
| Expedia, Inc. | 334,434 | 37,885 |
| Marriott International, Inc., Class A | 236,000 | 19,512 |
| | | 11,670,652 |
| Financials 13.38% | | |
| JPMorgan Chase & Co. | 19,393,000 | 1,673,422 |
| Berkshire Hathaway Inc., Class A2 | 5,627 | 1,373,669 |
| Capital One Financial Corp. | 12,289,000 | 1,072,092 |
| BlackRock, Inc. | 2,023,100 | 769,871 |
| CME Group Inc., Class A | 6,271,437 | 723,410 |
| SunTrust Banks, Inc. | 12,585,110 | 690,293 |
| Wells Fargo & Co. | 12,315,000 | 678,680 |
| Citigroup Inc. | 11,000,000 | 653,730 |
| Chubb Ltd. | 3,975,000 | 525,177 |
| Goldman Sachs Group, Inc. | 1,970,000 | 471,717 |
| Discover Financial Services | 5,730,000 | 413,076 |
| CIT Group Inc. | 9,203,500 | 392,805 |
| Legal & General Group PLC1 | 109,784,921 | 334,380 |
| American International Group, Inc. | 4,666,700 | 304,782 |
| BNP Paribas SA1 | 4,000,000 | 254,806 |
| Svenska Handelsbanken AB, Class A1 | 11,460,000 | 159,227 |
| National Australia Bank Ltd.1 | 3,635,000 | 80,229 |
| PacWest Bancorp | 1,165,000 | 63,423 |
| HDFC Bank Ltd. (ADR) | 461,250 | 27,989 |
| | | 10,662,778 |
| Energy 12.00% | | |
| Schlumberger Ltd. | 19,606,000 | 1,645,924 |
| Royal Dutch Shell PLC, Class B (ADR) | 17,635,334 | 1,022,320 |
| Royal Dutch Shell PLC, Class B1 | 11,577,720 | 330,380 |
| Royal Dutch Shell PLC, Class A (ADR) | 219,224 | 11,921 |
| Royal Dutch Shell PLC, Class A1 | 241,970 | 6,668 |
| Chevron Corp. | 5,976,137 | 703,391 |
| Enbridge Inc. (CAD denominated) | 16,373,825 | 689,026 |
| BP PLC1 | 88,200,000 | 548,030 |
| ConocoPhillips | 9,875,000 | 495,132 |
| EOG Resources, Inc. | 4,395,000 | 444,335 |
| Suncor Energy Inc. | 12,598,934 | 411,941 |
| Suncor Energy Inc. | 397,100 | 12,984 |
| Baker Hughes Inc. | 5,925,000 | 384,947 |
| Helmerich & Payne, Inc. | 4,900,000 | 379,260 |
| Halliburton Co. | 6,805,000 | 368,082 |
| Concho Resources Inc.2 | 2,734,500 | 362,595 |
| Exxon Mobil Corp. | 3,000,000 | 270,780 |
| Peyto Exploration & Development Corp.3 | 10,332,287 | 255,566 |
| Murphy Oil Corp. | 6,281,900 | 195,556 |
| Cimarex Energy Co. | 1,424,000 | 193,522 |
Fundamental Investors — Page 2 of 6
Common stocks
Energy (continued) | Shares | Value
(000) |
| Noble Energy, Inc. | 4,746,400 | $180,648 |
| Canadian Natural Resources, Ltd. | 5,430,000 | 173,053 |
| TOTAL SA (ADR) | 2,043,798 | 104,172 |
| TOTAL SA1 | 1,099,705 | 56,138 |
| Phillips 66 | 1,709,488 | 147,717 |
| Southwestern Energy Co.2 | 8,000,000 | 86,560 |
| Hess Corp. | 1,350,748 | 84,138 |
| | | 9,564,786 |
| Industrials 10.71% | | |
| Boeing Co. | 9,974,000 | 1,552,752 |
| General Electric Co. | 30,000,000 | 948,000 |
| Lockheed Martin Corp. | 3,283,200 | 820,603 |
| Parker-Hannifin Corp. | 4,550,000 | 637,000 |
| Union Pacific Corp. | 5,775,000 | 598,752 |
| Rockwell Automation | 3,500,000 | 470,400 |
| Caterpillar Inc. | 4,275,000 | 396,464 |
| Northrop Grumman Corp. | 1,640,000 | 381,431 |
| TransDigm Group Inc. | 1,352,000 | 336,594 |
| Johnson Controls International PLC | 7,640,000 | 314,692 |
| Deere & Co. | 3,000,000 | 309,120 |
| Emerson Electric Co. | 4,000,000 | 223,000 |
| Republic Services, Inc. | 3,500,000 | 199,675 |
| Ingersoll-Rand PLC | 2,500,000 | 187,600 |
| FedEx Corp. | 1,000,000 | 186,200 |
| Masco Corp. | 5,233,878 | 165,495 |
| Ryanair Holdings PLC (ADR)2 | 1,803,750 | 150,180 |
| MTU Aero Engines AG1 | 1,120,089 | 129,225 |
| Equifax Inc. | 1,000,000 | 118,230 |
| Grafton Group PLC, units1,3 | 15,037,000 | 101,756 |
| Waste Management, Inc. | 1,400,000 | 99,274 |
| Raytheon Co. | 615,000 | 87,330 |
| Meggitt PLC1 | 11,759,014 | 66,405 |
| KAR Auction Services, Inc. | 906,800 | 38,648 |
| Komatsu Ltd.1 | 618,000 | 13,949 |
| | | 8,532,775 |
| Health care 9.71% | | |
| Merck & Co., Inc. | 20,710,000 | 1,219,198 |
| UnitedHealth Group Inc. | 5,501,500 | 880,460 |
| Boston Scientific Corp.2 | 32,600,000 | 705,138 |
| Medtronic PLC | 7,905,000 | 563,073 |
| Aetna Inc. | 4,492,000 | 557,053 |
| Express Scripts Holding Co.2 | 7,424,710 | 510,746 |
| Vertex Pharmaceuticals Inc.2 | 6,608,600 | 486,855 |
| Bristol-Myers Squibb Co. | 7,698,300 | 449,889 |
| Thermo Fisher Scientific Inc. | 3,100,000 | 437,410 |
| Regeneron Pharmaceuticals, Inc.2 | 1,143,500 | 419,767 |
| Gilead Sciences, Inc. | 5,698,790 | 408,090 |
| Humana Inc. | 1,190,000 | 242,796 |
| Johnson & Johnson | 2,100,000 | 241,941 |
| ResMed Inc. | 3,840,900 | 238,328 |
| Pfizer Inc. | 4,793,000 | 155,677 |
| Novartis AG1 | 1,920,000 | 139,658 |
Fundamental Investors — Page 3 of 6
Common stocks
Health care (continued) | Shares | Value
(000) |
| Abbott Laboratories | 1,656,771 | $63,636 |
| Shire PLC (ADR) | 109,701 | 18,691 |
| | | 7,738,406 |
| Consumer staples 8.75% | | |
| Philip Morris International Inc. | 21,812,088 | 1,995,588 |
| Coca-Cola Co. | 27,110,000 | 1,123,981 |
| Reynolds American Inc. | 11,175,340 | 626,266 |
| British American Tobacco PLC1 | 9,017,000 | 511,975 |
| Walgreens Boots Alliance, Inc. | 6,106,000 | 505,333 |
| Kraft Heinz Co. | 5,400,000 | 471,528 |
| Procter & Gamble Co. | 4,500,000 | 378,360 |
| Altria Group, Inc. | 5,360,000 | 362,443 |
| Nestlé SA1 | 3,781,413 | 271,226 |
| Hershey Co. | 1,800,000 | 186,174 |
| Sysco Corp. | 2,930,000 | 162,234 |
| Kroger Co. | 4,635,000 | 159,954 |
| Costco Wholesale Corp. | 710,000 | 113,678 |
| Coca-Cola European Partners PLC | 2,150,000 | 67,510 |
| Coty Inc., Class A | 2,212,066 | 40,503 |
| | | 6,976,753 |
| Materials 3.47% | | |
| E.I. du Pont de Nemours and Co. | 16,003,500 | 1,174,657 |
| Praxair, Inc. | 6,145,000 | 720,133 |
| FMC Corp. | 4,912,072 | 277,827 |
| LyondellBasell Industries NV | 2,640,000 | 226,459 |
| Syngenta AG1 | 462,000 | 182,574 |
| Potash Corp. of Saskatchewan Inc. | 10,000,000 | 180,900 |
| | | 2,762,550 |
| Real estate 1.06% | | |
| Crown Castle International Corp. REIT | 4,570,326 | 396,567 |
| Weyerhaeuser Co. REIT2 | 9,000,107 | 270,813 |
| American Tower Corp. REIT | 1,099,849 | 116,232 |
| Ventas, Inc. REIT | 1,000,000 | 62,520 |
| | | 846,132 |
| Utilities 0.46% | | |
| Southern Co. | 2,007,600 | 98,754 |
| Dominion Resources, Inc. | 1,159,823 | 88,831 |
| Centrica PLC1 | 29,667,842 | 85,475 |
| SSE PLC1 | 3,813,000 | 72,890 |
| Electricité de France SA1 | 2,108,180 | 21,421 |
| | | 367,371 |
| Telecommunication services 0.32% | | |
| Verizon Communications Inc. | 4,852,004 | 259,000 |
| Miscellaneous 1.00% | | |
| Other common stocks in initial period of acquisition | | 797,699 |
| Total common stocks (cost: $49,998,199,000) | | 76,707,974 |
Fundamental Investors — Page 4 of 6
Convertible stocks 0.09%
Utilities 0.09% | Shares | Value
(000) |
| Dominion Resources, Inc., convertible preferred, Series A, units | 1,476,300 | $74,701 |
| Total convertible stocks (cost: $73,815,000) | | 74,701 |
| Short-term securities 3.63% | Principal amount
(000) | |
| Apple Inc. 0.53%–0.60% due 1/17/2017–1/25/20174 | $233,400 | 233,339 |
| Chariot Funding, LLC 0.85% due 1/13/20174 | 50,000 | 49,989 |
| Chevron Corp. 0.51%–0.54% due 1/19/2017–1/24/20174 | 120,100 | 120,047 |
| Coca-Cola Co. 0.76% due 3/15/20174 | 25,000 | 24,964 |
| Estée Lauder Companies Inc. 0.65%–0.75% due 1/24/2017–2/21/20174 | 89,300 | 89,235 |
| ExxonMobil Corp. 0.54%–0.58% due 1/9/2017–1/25/2017 | 97,200 | 97,160 |
| Fannie Mae 0.41% due 2/1/2017 | 50,000 | 49,983 |
| Federal Farm Credit Banks 0.54%–0.56% due 5/3/2017–5/18/2017 | 106,100 | 105,865 |
| Federal Home Loan Bank 0.31%–0.55% due 1/4/2017–4/18/2017 | 1,590,900 | 1,590,218 |
| Freddie Mac 0.48% due 1/3/2017 | 50,000 | 50,000 |
| General Electric Co. 0.60% due 1/3/2017 | 900 | 900 |
| Paccar Financial Corp. 0.60% due 1/20/2017 | 10,100 | 10,097 |
| Pfizer Inc. 0.67% due 2/13/20174 | 136,100 | 136,011 |
| Qualcomm Inc. 0.54% due 1/18/20174 | 18,300 | 18,295 |
| U.S. Treasury Bills 0.35%–0.49% due 1/12/2017–3/30/2017 | 266,300 | 266,168 |
| Wells Fargo Bank, N.A. 1.01% due 1/17/2017 | 50,000 | 50,010 |
| Total short-term securities (cost: $2,892,178,000) | | 2,892,281 |
| Total investment securities 99.96% (cost: $52,964,192,000) | | 79,674,956 |
| Other assets less liabilities 0.04% | | 32,646 |
| Net assets 100.00% | | $79,707,602 |
As permitted by U.S. Securities and Exchange Commission regulations, “Miscellaneous” securities include holdings in their first year of acquisition that have not previously been publicly disclosed.
The following footnotes apply to either the individual securities noted or one or more of the securities aggregated and listed as a single line item.
| 1 | Valued under fair value procedures adopted by authority of the board of trustees. The total value of all such securities, including those in “Miscellaneous,“ was $5,601,890,000, which represented 7.03% of the net assets of the fund. This entire amount relates to certain securities trading outside the U.S. whose values were adjusted as a result of significant market movements following the close of local trading. |
| 2 | Security did not produce income during the last 12 months. |
| 3 | Represents an affiliated company as defined under the Investment Company Act of 1940. |
| 4 | Acquired in a transaction exempt from registration under Section 4(2) of the Securities Act of 1933. May be resold in the U.S. in transactions exempt from registration, normally to qualified institutional buyers. The total value of all such securities was $671,880,000, which represented .84% of the net assets of the fund. |
| Key to abbreviations |
| ADR = American Depositary Receipts |
| CAD = Canadian dollars |
Refer to the fund’s current shareholder report for additional disclosures.
Investments are not FDIC-insured, nor are they deposits of or guaranteed by a bank or any other entity, so they may lose value.
Fundamental Investors — Page 5 of 6
Investors should carefully consider investment objectives, risks, charges and expenses. This and other important information is contained in the fund prospectus and summary prospectus, which can be obtained from your financial professional and should be read carefully before investing. You may also call American Funds Service Company (AFS) at (800) 421-4225 or visit the American Funds website at americanfunds.com.
| MFGEFPX-010-0217O-S54095 | Fundamental Investors — Page 6 of 6 |
REPORT OF INDEPENDENT REGISTERED PUBLIC ACCOUNTING FIRM
To the Shareholders and Board of Trustees of
American Funds Fundamental Investors - Fundamental Investors:
We have audited the accompanying statement of assets and liabilities of American Funds Fundamental Investors - Fundamental Investors (the “Fund”), including the summary schedule of investments, as of December 31, 2016, and the related statements of operations for the year then ended, the statements of changes in net assets for each of the two years in the period then ended (collectively, the “financial statements”), the financial highlights for each of the five years in the period then ended (the financial statements and financial highlights are included in Item 1 of this Form N-CSR), and the schedule of investments in securities as of December 31, 2016 (included in Item 6 of this Form N-CSR). These financial statements, financial highlights, and schedule of investments in securities are the responsibility of the Fund’s management. Our responsibility is to express an opinion on these financial statements, financial highlights, and schedule of investments in securities based on our audits.
We conducted our audits in accordance with the standards of the Public Company Accounting Oversight Board (United States). Those standards require that we plan and perform the audit to obtain reasonable assurance about whether the financial statements, financial highlights, and schedule of investments in securities are free of material misstatement. An audit includes examining, on a test basis, evidence supporting the amounts and disclosures in the financial statements and schedule of investments in securities, assessing the accounting principles used and significant estimates made by management, as well as evaluating the overall financial statement presentation. Our procedures included confirmation of securities owned as of December 31, 2016, by correspondence with the custodian and brokers; where replies were not received from brokers, we performed other auditing procedures. We believe that our audits provide a reasonable basis for our opinion.
In our opinion, the financial statements, financial highlights, and schedule of investments in securities referred to above present fairly, in all material respects, the financial position of American Funds Fundamental Investors - Fundamental Investors as of December 31, 2016, and the results of its operations for the year then ended, the changes in its net assets for each of the two years in the period then ended, and the financial highlights for each of the five years in the period then ended, in conformity with accounting principles generally accepted in the United States of America.
DELOITTE & TOUCHE LLP
Costa Mesa, California
February 9, 2017
ITEM 7 – Disclosure of Proxy Voting Policies and Procedures for Closed-End Management Investment Companies
Not applicable to this Registrant, insofar as the Registrant is not a closed-end management investment company.
ITEM 8 – Portfolio Managers of Closed-End Management Investment Companies
Not applicable to this Registrant, insofar as the Registrant is not a closed-end management investment company.
ITEM 9 – Purchases of Equity Securities by Closed-End Management Investment Company and Affiliated Purchasers
Not applicable to this Registrant, insofar as the Registrant is not a closed-end management investment company.
ITEM 10 – Submission of Matters to a Vote of Security Holders
There have been no material changes to the procedures by which shareholders may recommend nominees to the Registrant’s board of trustees since the Registrant last submitted a proxy statement to its shareholders. The procedures are as follows. The Registrant has a nominating and governance committee comprised solely of persons who are not considered ‘‘interested persons’’ of the Registrant within the meaning of the Investment Company Act of 1940, as amended. The committee periodically reviews such issues as the board’s composition, responsibilities, committees, compensation and other relevant issues, and recommends any appropriate changes to the full board of trustees. While the committee normally is able to identify from its own resources an ample number of qualified candidates, it will consider shareholder suggestions of persons to be considered as nominees to fill future vacancies on the board. Such suggestions must be sent in writing to the nominating and governance committee of the Registrant, c/o the Registrant’s Secretary, and must be accompanied by complete biographical and occupational data on the prospective nominee, along with a written consent of the prospective nominee for consideration of his or her name by the nominating and governance committee.
ITEM 11 – Controls and Procedures
| (a) | The Registrant’s Principal Executive Officer and Principal Financial Officer have concluded, based on their evaluation of the Registrant’s disclosure controls and procedures (as such term is defined in Rule 30a-3 under the Investment Company Act of 1940), that such controls and procedures are adequate and reasonably designed to achieve the purposes described in paragraph (c) of such rule. |
| | |
| (b) | There were no changes in the Registrant’s internal controls over financial reporting (as defined in Rule 30a-3(d) under the Investment Company Act of 1940) that occurred during the Registrant’s second fiscal quarter of the period covered by this report that has materially affected, or is reasonably likely to materially affect, the Registrant’s internal control over financial reporting. |
ITEM 12 – Exhibits
| (a)(1) | The Code of Ethics that is the subject of the disclosure required by Item 2 is attached as an exhibit hereto. |
| | |
| (a)(2) | The certifications required by Rule 30a-2 of the Investment Company Act of 1940 and Sections 302 and 906 of the Sarbanes-Oxley Act of 2002 are attached as exhibits hereto. |
SIGNATURES
Pursuant to the requirements of the Securities Exchange Act of 1934 and the Investment Company Act of 1940, the Registrant has duly caused this report to be signed on its behalf by the undersigned, thereunto duly authorized.
| | AMERICAN FUNDS FUNDAMENTAL INVESTORS |
| | |
| | By /s/ Paul F. Roye |
| | Paul F. Roye, Executive Vice President and Principal Executive Officer |
| | |
| | Date: February 28, 2017 |
Pursuant to the requirements of the Securities Exchange Act of 1934 and the Investment Company Act of 1940, this report has been signed below by the following persons on behalf of the Registrant and in the capacities and on the dates indicated.
| By /s/ Paul F. Roye |
Paul F. Roye, Executive Vice President and Principal Executive Officer |
| |
| Date: February 28, 2017 |
| By /s/ Brian D. Bullard |
Brian D. Bullard, Treasurer and Principal Financial Officer |
| |
| Date: February 28, 2017 |
