Exhibit 99.2 Slides of Presentation by Michael Hanley, Executive Vice President, Interim Chief Financial Officer, Alcan Inc.
![]()
Forward Looking Statements |
| ||
| Statements made in the course of this presentation which describe the Company's intentions, expectations or predictions may be "forward-looking statements" within the meaning of securities laws. The Company cautions that, by their nature, forward-looking statements involve risk and uncertainty, and actual actions or results could differ materially. Reference should be made to the most recent Form 10-Q and Form 10-K for a summary of major risk factors. In addition, certain non-GAAP measures are used which are reconciled to the comparable GAAP measures herein or on the Company's website at www.alcan.com in the "Investors" section.
| |||
| © 2005 ALCAN INC. | Slide 2 | ||
Agenda |
| ||
| |||
| © 2005 ALCAN INC. | Slide 3 | ||
Value Based Management |
| ||
Governing objective: maximizing shareholder value over the long term | |||
| ■ EVA introduced in 1997 ■ In 2001, implemented a value-based management framework:
■ In 2003, set out three financial targets to support objective:
| |||
| © 2005 ALCAN INC. | Slide 4 | ||
Performance Against Targets |
| |
Partial success | ||
Metric | Target | Achievement |
| Operating EPS growth | 15% / year | |
| Free cash flow | Minimum $400M / year |  in 2002 and 2003 in 2002 and 2003in 2004 |
| EVA | Positive by 2006 | Delayed |
| © 2005 ALCAN INC. | Slide 5 |
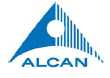
Key Challenges – Currencies |
| ||
| |||
| © 2005 ALCAN INC. | Slide 6 | ||
Key Challenges - Currencies |
| |
Sharp weakening of the U.S. dollar since 1H 2003 | ||
Currency | Current | Change | Annualized | ||
| $ | % | ||||
| CAD | 2 B | US$ | +0.20 | +30 | (220) |
| AUD | 0.5 B | US$ | +0.15 | +25 | (60) |
| Euro-like | 0.5 B | US$ | +0.10 | +10 | (60) |
| Total | (340) | ||||
| © 2005 ALCAN INC. | Slide 7 |
Key Challenges – Raw Material Costs |
| |
Major external cost pressures | ||
| Current Annual Requirements | Change 2003 vs 2005 | Annualized Cost Impact (US$M) | |||
| $ | % | ||||
| Caustic | 600 kt | $/t | +150 | +100 | (90) |
| Coke | 1,500 kt | $/t | +30 | +25 | (50) |
| Resins / films | 1,100 kt | $/t | +265 | +30 | (290) |
| Oil | 6 mbbls | $/bbl | +15 | +60 | (90) |
| Gas | 16 Pj | $/Gj | +4 | +100 | (60) |
| Maritime freight | $/t | +13 | +75 | (120) | |
| Total | (700) | ||||
| © 2005 ALCAN INC. | Slide 8 |
Key Challenges – Operating Earnings |
| |
About 80% of aluminum price benefit offset by higher input costsand currencies | ||
(US$M) | Annualized Impact on Operating Earnings |
| Aluminum * | 800 |
| Raw Materials | (330) |
| Currencies | (340) |
| Total | (670) |
* Based on published sensitivity
| © 2005 ALCAN INC. | Slide 9 |
Portfolio Management |
| ||
Key component of VBM, but not without short-term impacts | |||
| ■ Pechiney acquisition –December 2003
■ NovelisSpin-off – January 2005
■ Gove – Ongoing
■ Non-operating items
| |||
| © 2005 ALCAN INC. | Slide 10 | ||
Priorities – Pechiney Synergy Capture |
|
| ■ Excellent track record ■ Original target of $360M by end of ■ Bulk of benefits to be captured in ■ Target was maintained despite ■ Executing to plan --on track to reach
|
| © 2005 ALCAN INC. | Slide 11 |
Priorities |
| ||
Focused on high impact opportunities | |||
| |||
| © 2005 ALCAN INC. | Slide 12 | ||
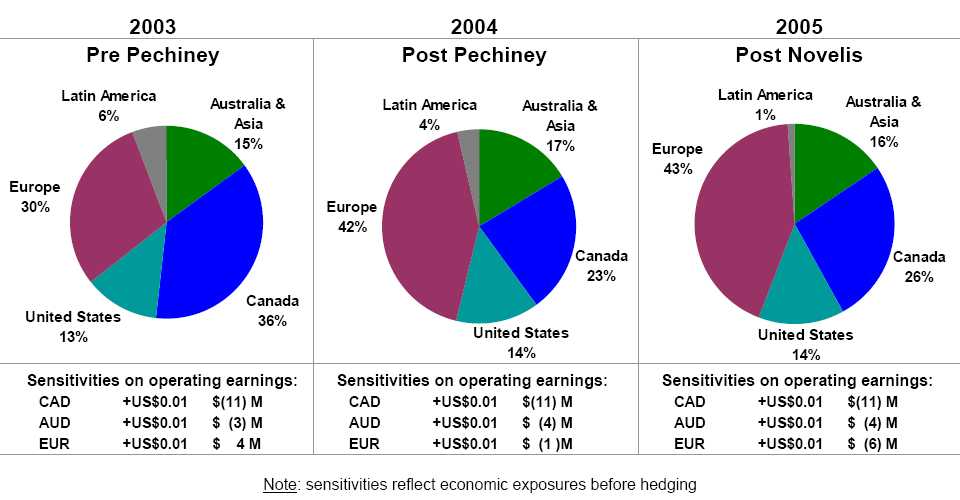
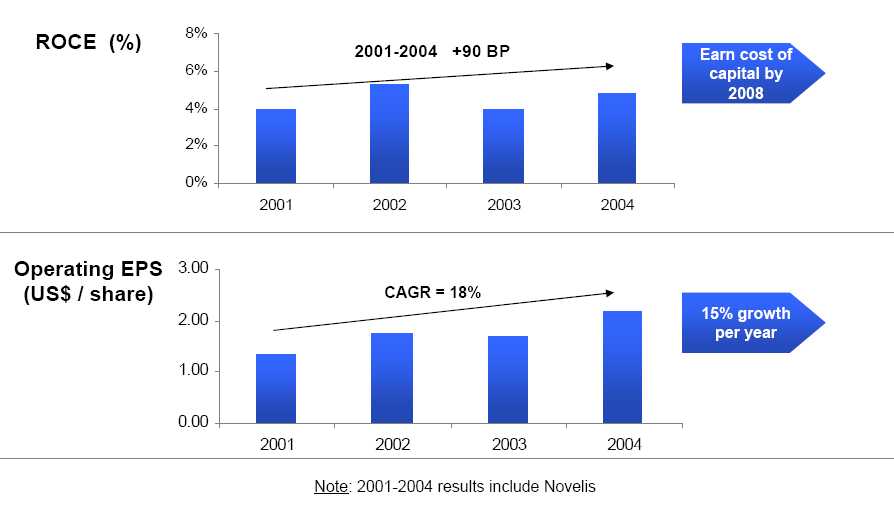
Key Performance Indicators |
| |
Earning and exceeding our cost of capital is priority # 1 | ||
| Metric | Target |
| Return on capital employed | Cover COC by 2008 |
| Operating EPS growth | 15% / year |
| Cash from operations | Min. $2bn from 2006 |
| Debt to Capital | 35% |
Note: based on 5-year plans and forward rates for currency and metal
| © 2005 ALCAN INC. | Slide 13 |
Key Performance Indicators |
| ||
|
| |||
| © 2005 ALCAN INC. | Slide 14 | ||
Key Performance Indicators |
| ||
|
| |||
| © 2005 ALCAN INC. | Slide 15 | ||
Investment Thesis |
| ||
| ■ Track record in managing for value ■ Modern and cost efficient upstream assets
■ Downstream businesses in profitable markets with competitive
■ Financial and capital allocation discipline ■ Commitment to profitable growth
| |||
| © 2005 ALCAN INC. | Slide 16 | ||
APPENDIX
| |
|
| |
| © 2005 ALCAN INC. | Slide 17 |
Key Economic Sensitivities |
|
| Change in Full Year Average | NI ($M) | EPS ($/share) | |
| Aluminum | +US$100/mt | $170 | $0.46 |
| Currency | |||
| CAD | +US$0.10 | $(110) | $(0.30) |
| European | +US$0.10 | $(56) | $(0.15) |
| AUD | +US$0.10 | $(40) | $(0.11) |
|
| |
| © 2005 ALCAN INC. | Slide 18 |
Return on Capital Employed Definition |
| ||
| Income = Net income (loss) from continuing operations Average * Capital Employed = Total debt
* Average of beginning and end of period.
| |||
| © 2005 ALCAN INC. | Slide 19 | ||
Other Specified Items (OSIs) |
| |
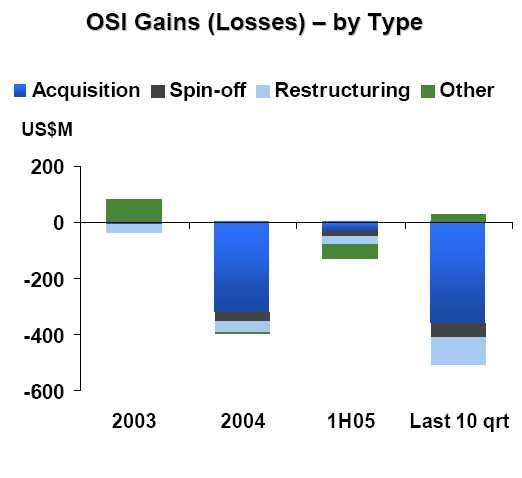 | ■ By their nature, non-operating items are difficult to forecast. ■ Increase in number of OSIs ■ Further rationalization and
|
| © 2005 ALCAN INC. | Slide 20 |
|
| |
| © 2005 ALCAN INC. | Slide 21 |