UNITED STATES
SECURITIES AND EXCHANGE COMMISSION
Washington, D.C. 20549
FORM N-CSR
CERTIFIED SHAREHOLDER REPORT OF REGISTERED
MANAGEMENT INVESTMENT COMPANIES
Investment Company Act file number811- 1677
John Hancock Capital Series
(Exact name of registrant as specified in charter)
200 Berkeley Street, Boston, Massachusetts 02116
(Address of principal executive offices) (Zip code)
Salvatore Schiavone
Treasurer
200 Berkeley Street
Boston, Massachusetts 02116
(Name and address of agent for service)
Registrant's telephone number, including area code:617-663-4497
| Date of fiscal year end: | October 31 | |
| Date of reporting period: | October 31, 2019 |
ITEM 1. REPORTS TO STOCKHOLDERS.
John Hancock
U.S. Global Leaders Growth Fund
Annual report 10/31/19
Beginning on January 1, 2021, as permitted by regulations adopted by the Securities and Exchange Commission, paper copies of the fund's shareholder reports like this one will no longer be sent by mail, unless you specifically request paper copies of the reports from the fund or from your financial intermediary. Instead, the reports will be made available on a website, and you will be notified by mail each time a report is posted and provided with a website link to access the report.
If you already elected to receive shareholder reports electronically, you will not be affected by this change, and you do not need to take any action. You may elect to receive shareholder reports and other communications electronically by calling John Hancock Investment Management at 800-225-5291 (Class A, Class B and Class C shares) or 888-972-8696 (Class I, Class R2 and Class R6 shares) or by contacting your financial intermediary.
You may elect to receive all reports in paper, free of charge, at any time. You can inform John Hancock Investment Management or your financial intermediary that you wish to continue receiving paper copies of your shareholder reports by following the instructions listed above. Your election to receive reports in paper will apply to all funds held with John Hancock Investment Management or your financial intermediary.


A message to shareholders
Dear shareholder,
It was a volatile time for stock investors in the United States during the 12 months ended October 31, 2019, although many segments of the market delivered attractive absolute returns for the period. Uncertainty surrounding trade with China, the impeachment inquiry against President Trump, and the broader health of the global economy led to some dramatic swings in performance. Investors, who had generally shunned riskier assets in the final months of 2018, regained their risk appetites in the first half of 2019. Despite setbacks in May and August, the markets closed the period on record highs. Against this backdrop, the U.S. Federal Reserve pivoted from raising short-term interest rates to an easing stance, cutting interest rates three times in the latter half of the period.
While the economic fundamentals in the United States appear fairly solid, with a strong labor market and a confident consumer base, there are sure to be patches of market turbulence as the year goes on, particularly if the likelihood of a recession is perceived to increase. As always, your best resource in unpredictable markets is your financial advisor, who can help position your portfolio so that it's sufficiently diversified to meet your long-term objectives and to withstand the inevitable bouts of market volatility along the way.
On behalf of everyone at John Hancock Investment Management, I'd like to take this opportunity to welcome new shareholders and thank existing shareholders for the continued trust you've placed in us.
Sincerely,

Andrew G. Arnott
President and CEO,
John Hancock Investment Management
Head of Wealth and Asset Management,
United States and Europe
This commentary reflects the CEO's views as of this report's period end and are subject to change at any time. Diversification does not guarantee investment returns and does not eliminate risk of loss. All investments entail risks, including the possible loss of principal. For more up-to-date information, you can visit our website at jhinvestments.com.
John Hancock
U.S. Global Leaders Growth Fund
Table of contents
| 2 | Your fund at a glance | |
| 4 | Manager's discussion of fund performance | |
| 6 | A look at performance | |
| 8 | Your expenses | |
| 10 | Fund's investments | |
| 12 | Financial statements | |
| 15 | Financial highlights | |
| 21 | Notes to financial statements | |
| 29 | Report of independent registered public accounting firm | |
| 30 | Tax information | |
| 31 | Continuation of investment advisory and subadvisory agreements | |
| 38 | Trustees and Officers | |
| 42 | More information |
INVESTMENT OBJECTIVE
The fund seeks long-term growth of capital.
AVERAGE ANNUAL TOTAL RETURNS AS OF 10/31/19 (%)
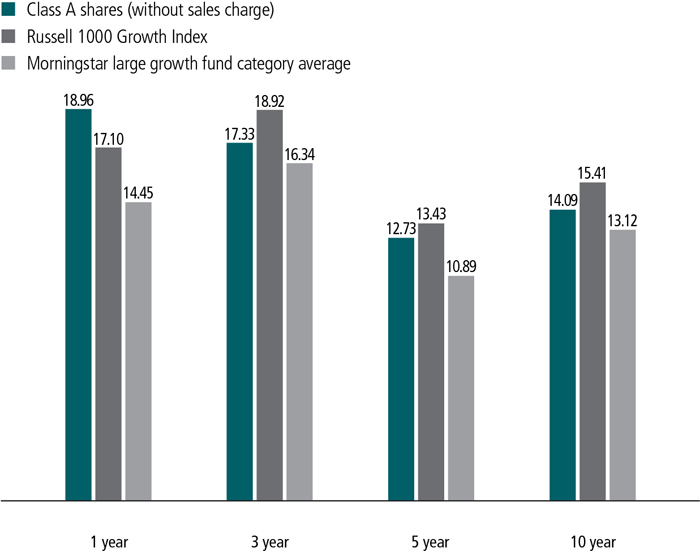
The Russell 1000 Growth Index is an unmanaged index of companies in the Russell 1000 Index (the 1,000 largest U.S. publicly traded companies) with high price-to-book ratios and higher forecasted growth values.
It is not possible to invest directly in an index. Index figures do not reflect expenses or sales charges, which would result in lower returns.
Figures from Morningstar, Inc. include reinvested distributions and do not take into account sales charges. Actual load-adjusted performance is lower.
The past performance shown here reflects reinvested distributions and the beneficial effect of any expense reductions, and does not guarantee future results. Performance of the other share classes will vary based on the difference in the fees and expenses of those classes. Shares will fluctuate in value and, when redeemed, may be worth more or less than their original cost. Current month-end performance may be lower or higher than the performance cited, and can be found at jhinvestments.com or by calling 800-225-5291. For further information on the fund's objectives, risks, and strategy, see the fund's prospectus.
PERFORMANCE HIGHLIGHTS OVER THE LAST TWELVE MONTHS
Stocks advanced sharply
U.S. stocks posted double-digit gains despite slowing global economic growth and rising trade tensions between the United States and China.
The fund outperformed
An emphasis on high-quality businesses with sustainable long-term growth rates helped the fund outpace its benchmark, the Russell 1000 Growth Index, in an uncertain and volatile market environment.
Consumer staples and real estate holdings drove outperformance
Stock selection in the consumer staples and real estate sectors contributed the most to the fund's outperformance.
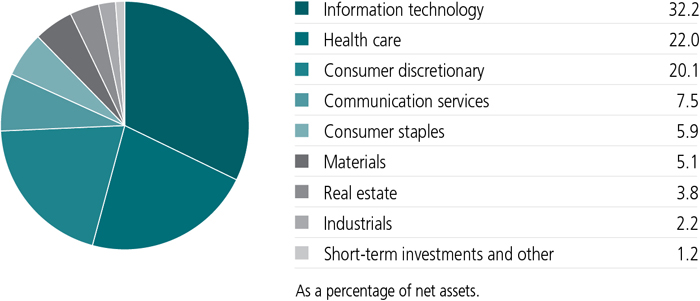
SECTOR COMPOSITION AS OF 10/31/19 (%)
A note about risks
The fund is subject to various risks as described in the fund's prospectus. For more information, please refer to the "Principal risks" section of the prospectus.
U.S. stocks rallied sharply, benefiting from better-than-expected earnings and a shift in central bank policy. Market volatility remained elevated amid signs of slowing global economic growth, escalating trade tensions between the United States and China, and rising political rhetoric. Domestically, the U.S. Federal Reserve (Fed) responded to decelerating U.S. economic growth by lowering its short-term interest-rate target three times late in the period. Growth stocks outperformed, with the fund's benchmark, the Russell 1000 Growth Index, returning 17.10%.
How did the fund perform?
The fund posted a strong gain and outpaced the return of its benchmark. Leading individual contributors included cosmetics producer The Estee Lauder Companies, Inc. and data center operator Equinix, Inc. Estee Lauder consistently exceeded earnings expectations, driven by improved product diversity and greater economies of scale. Equinix delivered robust operational performance and benefited from a boost in the company's credit rating. Other key contributors included payment processor FleetCor Technologies, Inc. and cleaning products maker Ecolab, Inc.
What fund holdings detracted from performance?
A non-benchmark holding in energy equipment and services provider Schlumberger
TOP 10 HOLDINGS AS OF 10/31/19 (%)
| Microsoft Corp. | 4.4 |
| Alphabet, Inc., Class C | 4.4 |
| UnitedHealth Group, Inc. | 4.3 |
| salesforce.com, Inc. | 4.2 |
| Autodesk, Inc. | 4.1 |
| Yum! Brands, Inc. | 4.0 |
| Visa, Inc., Class A | 4.0 |
| Abbott Laboratories | 4.0 |
| Mondelez International, Inc., Class A | 3.9 |
| Amazon.com, Inc. | 3.9 |
| TOTAL | 41.2 |
| As a percentage of net assets. | |
| Cash and cash equivalents are not included. | |
NV, which we eliminated from the portfolio early in the period, weighed on performance as falling oil prices led to reduced energy production. Biotechnology firm Regeneron Pharmaceuticals, Inc. was another significant detractor as increased competition for the company's flagship medication and potential changes to the government's Medicare Part B reimbursement rules put pressure on the stock. Other key detractors included private-label credit card issuer Alliance Data Systems Corp., which we sold during the period, and healthcare provider UnitedHealth Group, Inc.
What changes did you make to the portfolio?
In addition to Schlumberger and Alliance Data, we sold beauty products retailer Ulta Beauty, Inc. and media and entertainment conglomerate The Walt Disney Company after they reached our valuation targets. We also sold open source software provider Red Hat, Inc. after the company was acquired. New holdings added during the period included social media company Facebook, Inc., software makers Intuit, Inc. and Workday, Inc., and online payment processor PayPal Holdings, Inc.
Can you tell us about an upcoming manager change?
Effective January 1, 2020, George P. Fraise will leave the team. Kishore Rao will join the team on the same date.
MANAGED BY
 | George P. Fraise On the fund since 2000 Investing since 1987 |
 | Gordon M. Marchand, CPA, CFA, CIC On the fund since 1995 Investing since 1977 |
 | Robert L. Rohn On the fund since 2003 Investing since 1983 |
![]()
TOTAL RETURNS FOR THE PERIOD ENDED OCTOBER 31, 2019
| Average annual total returns (%) with maximum sales charge | Cumulative total returns (%) with maximum sales charge | ||||||
| 1-year | 5-year | 10-year | 5-year | 10-year | |||
| Class A | 13.02 | 11.58 | 13.51 | 72.98 | 255.09 | ||
| Class B | 13.08 | 11.64 | 13.41 | 73.39 | 252.07 | ||
| Class C | 17.07 | 11.89 | 13.24 | 75.39 | 246.80 | ||
| Class I1 | 19.26 | 13.02 | 14.45 | 84.43 | 285.58 | ||
| Class R21,2 | 18.81 | 12.57 | 14.01 | 80.79 | 271.10 | ||
| Class R61,2 | 19.37 | 13.14 | 14.45 | 85.41 | 285.58 | ||
| Index 1† | 17.10 | 13.43 | 15.41 | 87.79 | 319.38 | ||
| Index 2† | 14.33 | 10.78 | 13.70 | 66.81 | 260.96 | ||
Performance figures assume all distributions have been reinvested. Figures reflect maximum sales charges on Class A shares of 5% and the applicable contingent deferred sales charge (CDSC) on Class B and Class C shares. The Class B shares' CDSC declines annually between years 1 to 6 according to the following schedule: 5%, 4%, 3%, 3%, 2%, 1%. No sales charge will be assessed after the sixth year. Class C shares sold within one year of purchase are subject to a 1% CDSC. Sales charges are not applicable to Class I, Class R2, and Class R6 shares.
The expense ratios of the fund, both net (including any fee waivers and/or expense limitations) and gross (excluding any fee waivers and/or expense limitations), are set forth according to the most recent publicly available prospectus for the fund and may differ from those disclosed in the Financial highlights tables in this report. Net expenses reflect contractual expense limitations in effect until July 31, 2021 and are subject to change. Had the contractual fee waivers and expense limitations not been in place, gross expenses would apply. The expense ratios are as follows:
| Class A | Class B | Class C | Class I | Class R2 | Class R6 | ||
| Gross | 1.16 | 1.91 | 1.91 | 0.92 | 1.31 | 0.81 | |
| Net (%) | 1.15 | 1.90 | 1.90 | 0.91 | 1.30 | 0.80 |
Please refer to the most recent prospectus and annual or semiannual report for more information on expenses and any expense limitation arrangements for each class.
The returns reflect past results and should not be considered indicative of future performance. The return and principal value of an investment will fluctuate so that shares, when redeemed, may be worth more or less than their original cost. Due to market volatility and other factors, the fund's current performance may be higher or lower than the performance shown. For current to the most recent month-end performance data, please call 800-225-5291 or visit the fund's website at jhinvestments.com.
The performance table above and the chart on the next page do not reflect the deduction of taxes that a shareholder would pay on fund distributions or the redemption of fund shares. The fund's performance results reflect any applicable fee waivers or expense reductions, without which the expenses would increase and results would have been less favorable.
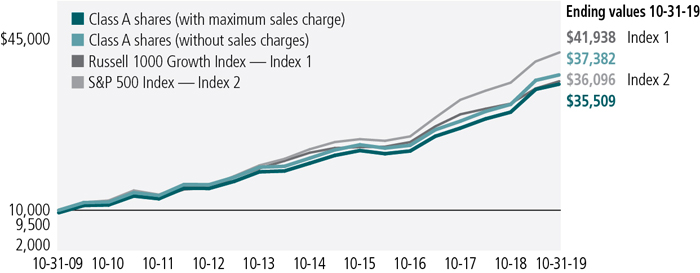
| † | Index 1 is the Russell 1000 Growth Index; Index 2 is the S&P 500 Index. |
See the following page for footnotes.
This chart and table show what happened to a hypothetical $10,000 investment in John Hancock U.S. Global Leaders Growth Fund for the share classes and periods indicated, assuming all distributions were reinvested. For comparison, we've shown the same investment in two separate indexes.
| Start date | With maximum sales charge ($) | Without sales charge ($) | Index 1 ($) | Index 2 ($) | |
| Class B3 | 10-31-09 | 35,207 | 35,207 | 41,938 | 36,096 |
| Class C3 | 10-31-09 | 34,680 | 34,680 | 41,938 | 36,096 |
| Class I1 | 10-31-09 | 38,558 | 38,558 | 41,938 | 36,096 |
| Class R21,2 | 10-31-09 | 37,110 | 37,110 | 41,938 | 36,096 |
| Class R61,2 | 10-31-09 | 38,558 | 38,558 | 41,938 | 36,096 |
The Russell 1000 Growth Index is an unmanaged index of companies in the Russell 1000 Index (the 1,000 largest U.S. publicly traded companies) with high price-to-book ratios and higher forecasted growth values.
The S&P 500 Index is an unmanaged index that includes 500 widely traded common stocks.
It is not possible to invest directly in an index. Index figures do not reflect expenses or sales charges, which would result in lower returns.
Footnotes related to performance pages
| 1 | For certain types of investors, as described in the fund's prospectus. |
| 2 | Class R2 and Class R6 shares were first offered on 3-1-12 and 9-1-11, respectively. Returns prior to these dates are those of Class A shares that have not been adjusted for class-specific expenses; otherwise, returns would vary. |
| 3 | The contingent deferred sales charge is not applicable. |
| Your expenses |

| 8 | JOHN HANCOCK U.S. GLOBAL LEADERS GROWTH FUND | ANNUAL REPORT |
| Account value on 5-1-2019 | Ending value on 10-31-2019 | Expenses paid during period ended 10-31-20191 | Annualized expense ratio | ||
| Class A | Actual expenses/actual returns | $1,000.00 | $1,030.50 | $5.89 | 1.15% |
| Hypothetical example | 1,000.00 | 1,019.40 | 5.85 | 1.15% | |
| Class B | Actual expenses/actual returns | 1,000.00 | 1,026.50 | 9.70 | 1.90% |
| Hypothetical example | 1,000.00 | 1,015.60 | 9.65 | 1.90% | |
| Class C | Actual expenses/actual returns | 1,000.00 | 1,026.40 | 9.70 | 1.90% |
| Hypothetical example | 1,000.00 | 1,015.60 | 9.65 | 1.90% | |
| Class I | Actual expenses/actual returns | 1,000.00 | 1,031.80 | 4.61 | 0.90% |
| Hypothetical example | 1,000.00 | 1,020.70 | 4.58 | 0.90% | |
| Class R2 | Actual expenses/actual returns | 1,000.00 | 1,029.70 | 6.50 | 1.27% |
| Hypothetical example | 1,000.00 | 1,018.80 | 6.46 | 1.27% | |
| Class R6 | Actual expenses/actual returns | 1,000.00 | 1,032.30 | 4.05 | 0.79% |
| Hypothetical example | 1,000.00 | 1,021.20 | 4.02 | 0.79% |
| 1 | Expenses are equal to the annualized expense ratio, multiplied by the average account value over the period, multiplied by 184/365 (to reflect the one-half year period). |
| ANNUAL REPORT | JOHN HANCOCK U.S. GLOBAL LEADERS GROWTH FUND | 9 |
| Fund’s investments |
| Shares | Value | ||||
| Common stocks 98.8% | $1,538,613,134 | ||||
| (Cost $984,097,798) | |||||
| Communication services 7.5% | 117,116,248 | ||||
| Interactive media and services 7.5% | |||||
| Alphabet, Inc., Class C (A) | 54,623 | 68,830,989 | |||
| Facebook, Inc., Class A (A) | 251,945 | 48,285,259 | |||
| Consumer discretionary 20.1% | 312,991,224 | ||||
| Hotels, restaurants and leisure 4.0% | |||||
| Yum! Brands, Inc. | 616,081 | 62,661,599 | |||
| Internet and direct marketing retail 7.1% | |||||
| Amazon.com, Inc. (A) | 33,873 | 60,180,804 | |||
| Booking Holdings, Inc. (A) | 24,808 | 50,825,886 | |||
| Specialty retail 5.1% | |||||
| Lowe's Companies, Inc. | 290,066 | 32,374,266 | |||
| The TJX Companies, Inc. | 819,186 | 47,226,073 | |||
| Textiles, apparel and luxury goods 3.9% | |||||
| NIKE, Inc., Class B | 666,919 | 59,722,596 | |||
| Consumer staples 5.9% | 91,787,964 | ||||
| Food products 3.9% | |||||
| Mondelez International, Inc., Class A | 1,151,743 | 60,408,920 | |||
| Personal products 2.0% | |||||
| The Estee Lauder Companies, Inc., Class A | 168,460 | 31,379,044 | |||
| Health care 22.0% | 343,217,910 | ||||
| Biotechnology 2.4% | |||||
| Regeneron Pharmaceuticals, Inc. (A) | 124,610 | 38,165,551 | |||
| Health care equipment and supplies 10.2% | |||||
| Abbott Laboratories | 740,878 | 61,944,810 | |||
| Becton, Dickinson and Company | 203,118 | 51,998,208 | |||
| Danaher Corp. | 331,512 | 45,688,984 | |||
| Health care providers and services 4.3% | |||||
| UnitedHealth Group, Inc. | 265,123 | 66,996,582 | |||
| Life sciences tools and services 2.1% | |||||
| Illumina, Inc. (A) | 108,623 | 32,100,269 | |||
| Pharmaceuticals 3.0% | |||||
| Novo Nordisk A/S, ADR | 838,890 | 46,323,506 | |||
| Industrials 2.2% | 34,086,016 | ||||
| Professional services 2.2% | |||||
| IHS Markit, Ltd. (A) | 486,804 | 34,086,016 | |||
| 10 | JOHN HANCOCK U.S. GLOBAL LEADERS GROWTH FUND | ANNUAL REPORT | SEE NOTES TO FINANCIAL STATEMENTS |
| Shares | Value | ||||
| Information technology 32.2% | $501,895,599 | ||||
| IT services 13.4% | |||||
| Automatic Data Processing, Inc. | 235,515 | 38,207,598 | |||
| FleetCor Technologies, Inc. (A) | 163,008 | 47,960,214 | |||
| PayPal Holdings, Inc. (A) | 574,622 | 59,818,150 | |||
| Visa, Inc., Class A | 348,044 | 62,251,150 | |||
| Software 18.8% | |||||
| Autodesk, Inc. (A) | 436,186 | 64,276,369 | |||
| Intuit, Inc. | 212,051 | 54,603,133 | |||
| Microsoft Corp. | 480,271 | 68,856,453 | |||
| salesforce.com, Inc. (A) | 422,398 | 66,101,063 | |||
| Workday, Inc., Class A (A) | 245,569 | 39,821,469 | |||
| Materials 5.1% | 79,061,617 | ||||
| Chemicals 5.1% | |||||
| Ecolab, Inc. | 239,299 | 45,962,159 | |||
| Linde PLC | 166,874 | 33,099,458 | |||
| Real estate 3.8% | 58,456,556 | ||||
| Equity real estate investment trusts 3.8% | |||||
| Equinix, Inc. | 103,138 | 58,456,556 | |||
| Yield (%) | Shares | Value | |||
| Short-term investments 1.3% | $19,596,295 | ||||
| (Cost $19,596,295) | |||||
| Money market funds 1.3% | 19,596,295 | ||||
| State Street Institutional U.S. Government Money Market Fund, Premier Class | 1.7521(B) | 19,596,295 | 19,596,295 | ||
| Total investments (Cost $1,003,694,093) 100.1% | $1,558,209,429 | ||||
| Other assets and liabilities, net (0.1%) | (1,149,171) | ||||
| Total net assets 100.0% | $1,557,060,258 | ||||
| The percentage shown for each investment category is the total value of the category as a percentage of the net assets of the fund. | |
| Security Abbreviations and Legend | |
| ADR | American Depositary Receipt |
| (A) | Non-income producing security. |
| (B) | The rate shown is the annualized seven-day yield as of 10-31-19. |
| SEE NOTES TO FINANCIAL STATEMENTS | ANNUAL REPORT | JOHN HANCOCK U.S. GLOBAL LEADERS GROWTH FUND | 11 |
| Financial statements |
| Assets | |
| Unaffiliated investments, at value (Cost $1,003,694,093) | $1,558,209,429 |
| Dividends and interest receivable | 847,119 |
| Receivable for fund shares sold | 3,087,695 |
| Other assets | 78,626 |
| Total assets | 1,562,222,869 |
| Liabilities | |
| Payable for investments purchased | 2,349,828 |
| Payable for fund shares repurchased | 1,150,564 |
| Payable to affiliates | |
| Investment management fees | 955,269 |
| Accounting and legal services fees | 138,894 |
| Transfer agent fees | 141,792 |
| Distribution and service fees | 215,871 |
| Trustees' fees | 1,505 |
| Other liabilities and accrued expenses | 208,888 |
| Total liabilities | 5,162,611 |
| Net assets | $1,557,060,258 |
| Net assets consist of | |
| Paid-in capital | $902,080,764 |
| Total distributable earnings (loss) | 654,979,494 |
| Net assets | $1,557,060,258 |
| Net asset value per share | |
| Based on net asset value and shares outstanding - the fund has an unlimited number of shares authorized with no par value | |
| Class A ($707,349,583 ÷ 13,665,821 shares)1 | $51.76 |
| Class B ($8,655,188 ÷ 204,680 shares)1 | $42.29 |
| Class C ($68,991,446 ÷ 1,630,642 shares)1 | $42.31 |
| Class I ($571,928,649 ÷ 10,178,855 shares) | $56.19 |
| Class R2 ($1,498,373 ÷ 27,387 shares) | $54.71 |
| Class R6 ($198,637,019 ÷ 3,508,964 shares) | $56.61 |
| Maximum offering price per share | |
| Class A (net asset value per share ÷ 95%)2 | $54.48 |
| 1 | Redemption price per share is equal to net asset value less any applicable contingent deferred sales charge. |
| 2 | On single retail sales of less than $50,000. On sales of $50,000 or more and on group sales the offering price is reduced. |
| 12 | JOHN HANCOCK U.S. Global Leaders Growth Fund | ANNUAL REPORT | SEE NOTES TO FINANCIAL STATEMENTS |
| Investment income | |
| Dividends | $14,878,972 |
| Interest | 755,951 |
| Securities lending | 3,432 |
| Less foreign taxes withheld | (148,066) |
| Total investment income | 15,490,289 |
| Expenses | |
| Investment management fees | 10,717,200 |
| Distribution and service fees | 2,471,902 |
| Accounting and legal services fees | 323,102 |
| Transfer agent fees | 1,579,782 |
| Trustees' fees | 27,538 |
| Custodian fees | 156,862 |
| State registration fees | 138,087 |
| Printing and postage | 153,558 |
| Professional fees | 78,228 |
| Other | 47,538 |
| Total expenses | 15,693,797 |
| Less expense reductions | (108,017) |
| Net expenses | 15,585,780 |
| Net investment loss | (95,491) |
| Realized and unrealized gain (loss) | |
| Net realized gain (loss) on | |
| Unaffiliated investments | 111,540,969 |
| Affiliated investments | 201 |
| 111,541,170 | |
| Change in net unrealized appreciation (depreciation) of | |
| Unaffiliated investments | 125,623,184 |
| 125,623,184 | |
| Net realized and unrealized gain | 237,164,354 |
| Increase in net assets from operations | $237,068,863 |
| SEE NOTES TO FINANCIAL STATEMENTS | ANNUAL REPORT | JOHN HANCOCK U.S. Global Leaders Growth Fund | 13 |
| Year ended 10-31-19 | Year ended 10-31-18 | |
| Increase (decrease) in net assets | ||
| From operations | ||
| Net investment loss | $(95,491) | $(877,266) |
| Net realized gain | 111,541,170 | 184,856,299 |
| Change in net unrealized appreciation (depreciation) | 125,623,184 | (13,252,335) |
| Increase in net assets resulting from operations | 237,068,863 | 170,726,698 |
| Distributions to shareholders | ||
| From earnings | ||
| Class A | (69,118,650) | (40,115,324) |
| Class B | (1,675,246) | (1,232,810) |
| Class C | (9,327,579) | (8,254,625) |
| Class I | (72,648,617) | (42,870,457) |
| Class R2 | (169,763) | (354,874) |
| Class R6 | (15,029,985) | (7,877,251) |
| Total distributions | (167,969,840) | (100,705,341) |
| From fund share transactions | (46,191,535) | 6,463,786 |
| Total increase | 22,907,488 | 76,485,143 |
| Net assets | ||
| Beginning of year | 1,534,152,770 | 1,457,667,627 |
| End of year | $1,557,060,258 | $1,534,152,770 |
| 14 | JOHN HANCOCK U.S. Global Leaders Growth Fund | ANNUAL REPORT | SEE NOTES TO FINANCIAL STATEMENTS |
| Financial highlights |
| CLASS A SHARES Period ended | 10-31-19 | 10-31-18 | 10-31-17 | 10-31-16 | 10-31-15 |
| Per share operating performance | |||||
| Net asset value, beginning of period | $49.26 | $47.15 | $41.00 | $43.87 | $45.02 |
| Net investment income (loss)1 | (0.05) | (0.07) | (0.05) | (0.03) | 0.07 |
| Net realized and unrealized gain (loss) on investments | 8.18 | 5.51 | 8.31 | (0.13) | 4.98 |
| Total from investment operations | 8.13 | 5.44 | 8.26 | (0.16) | 5.05 |
| Less distributions | |||||
| From net investment income | — | — | — | (0.04) | (0.10) |
| From net realized gain | (5.63) | (3.33) | (2.11) | (2.67) | (6.10) |
| Total distributions | (5.63) | (3.33) | (2.11) | (2.71) | (6.20) |
| Net asset value, end of period | $51.76 | $49.26 | $47.15 | $41.00 | $43.87 |
| Total return (%)2,3 | 18.96 | 12.11 | 21.12 | (0.42) | 13.19 |
| Ratios and supplemental data | |||||
| Net assets, end of period (in millions) | $707 | $612 | $577 | $608 | $660 |
| Ratios (as a percentage of average net assets): | |||||
| Expenses before reductions | 1.16 | 1.16 | 1.17 | 1.18 | 1.18 |
| Expenses including reductions | 1.15 | 1.15 | 1.16 | 1.17 | 1.17 |
| Net investment income (loss) | (0.11) | (0.14) | (0.12) | (0.07) | 0.16 |
| Portfolio turnover (%) | 32 | 42 | 41 | 44 | 30 |
| 1 | Based on average daily shares outstanding. |
| 2 | Total returns would have been lower had certain expenses not been reduced during the applicable periods. |
| 3 | Does not reflect the effect of sales charges, if any. |
| SEE NOTES TO FINANCIAL STATEMENTS | ANNUAL REPORT | JOHN HANCOCK U.S. Global Leaders Growth Fund | 15 |
| CLASS B SHARES Period ended | 10-31-19 | 10-31-18 | 10-31-17 | 10-31-16 | 10-31-15 |
| Per share operating performance | |||||
| Net asset value, beginning of period | $41.57 | $40.57 | $35.82 | $38.90 | $40.80 |
| Net investment loss1 | (0.33) | (0.37) | (0.32) | (0.29) | (0.22) |
| Net realized and unrealized gain (loss) on investments | 6.68 | 4.70 | 7.18 | (0.12) | 4.42 |
| Total from investment operations | 6.35 | 4.33 | 6.86 | (0.41) | 4.20 |
| Less distributions | |||||
| From net realized gain | (5.63) | (3.33) | (2.11) | (2.67) | (6.10) |
| Net asset value, end of period | $42.29 | $41.57 | $40.57 | $35.82 | $38.90 |
| Total return (%)2,3 | 18.08 | 11.28 | 20.22 | (1.16) | 12.33 |
| Ratios and supplemental data | |||||
| Net assets, end of period (in millions) | $9 | $13 | $16 | $19 | $24 |
| Ratios (as a percentage of average net assets): | |||||
| Expenses before reductions | 1.91 | 1.91 | 1.92 | 1.93 | 1.93 |
| Expenses including reductions | 1.90 | 1.90 | 1.91 | 1.92 | 1.92 |
| Net investment loss | (0.83) | (0.89) | (0.86) | (0.82) | (0.60) |
| Portfolio turnover (%) | 32 | 42 | 41 | 44 | 30 |
| 1 | Based on average daily shares outstanding. |
| 2 | Total returns would have been lower had certain expenses not been reduced during the applicable periods. |
| 3 | Does not reflect the effect of sales charges, if any. |
| 16 | JOHN HANCOCK U.S. Global Leaders Growth Fund | ANNUAL REPORT | SEE NOTES TO FINANCIAL STATEMENTS |
| CLASS C SHARES Period ended | 10-31-19 | 10-31-18 | 10-31-17 | 10-31-16 | 10-31-15 |
| Per share operating performance | |||||
| Net asset value, beginning of period | $41.59 | $40.59 | $35.84 | $38.92 | $40.81 |
| Net investment loss1 | (0.34) | (0.37) | (0.32) | (0.29) | (0.22) |
| Net realized and unrealized gain (loss) on investments | 6.69 | 4.70 | 7.18 | (0.12) | 4.43 |
| Total from investment operations | 6.35 | 4.33 | 6.86 | (0.41) | 4.21 |
| Less distributions | |||||
| From net realized gain | (5.63) | (3.33) | (2.11) | (2.67) | (6.10) |
| Net asset value, end of period | $42.31 | $41.59 | $40.59 | $35.84 | $38.92 |
| Total return (%)2,3 | 18.07 | 11.28 | 20.21 | (1.16) | 12.36 |
| Ratios and supplemental data | |||||
| Net assets, end of period (in millions) | $69 | $70 | $102 | $117 | $136 |
| Ratios (as a percentage of average net assets): | |||||
| Expenses before reductions | 1.91 | 1.91 | 1.92 | 1.93 | 1.93 |
| Expenses including reductions | 1.90 | 1.90 | 1.91 | 1.92 | 1.92 |
| Net investment loss | (0.85) | (0.91) | (0.86) | (0.82) | (0.59) |
| Portfolio turnover (%) | 32 | 42 | 41 | 44 | 30 |
| 1 | Based on average daily shares outstanding. |
| 2 | Total returns would have been lower had certain expenses not been reduced during the applicable periods. |
| 3 | Does not reflect the effect of sales charges, if any. |
| SEE NOTES TO FINANCIAL STATEMENTS | ANNUAL REPORT | JOHN HANCOCK U.S. Global Leaders Growth Fund | 17 |
| CLASS I SHARES Period ended | 10-31-19 | 10-31-18 | 10-31-17 | 10-31-16 | 10-31-15 |
| Per share operating performance | |||||
| Net asset value, beginning of period | $52.86 | $50.25 | $43.45 | $46.27 | $47.12 |
| Net investment income1 | 0.09 | 0.05 | 0.06 | 0.08 | 0.18 |
| Net realized and unrealized gain (loss) on investments | 8.87 | 5.89 | 8.85 | (0.13) | 5.25 |
| Total from investment operations | 8.96 | 5.94 | 8.91 | (0.05) | 5.43 |
| Less distributions | |||||
| From net investment income | — | — | — | (0.10) | (0.18) |
| From net realized gain | (5.63) | (3.33) | (2.11) | (2.67) | (6.10) |
| Total distributions | (5.63) | (3.33) | (2.11) | (2.77) | (6.28) |
| Net asset value, end of period | $56.19 | $52.86 | $50.25 | $43.45 | $46.27 |
| Total return (%)2 | 19.26 | 12.37 | 21.44 | (0.14) | 13.48 |
| Ratios and supplemental data | |||||
| Net assets, end of period (in millions) | $572 | $694 | $751 | $313 | $293 |
| Ratios (as a percentage of average net assets): | |||||
| Expenses before reductions | 0.92 | 0.92 | 0.91 | 0.92 | 0.91 |
| Expenses including reductions | 0.91 | 0.91 | 0.90 | 0.91 | 0.91 |
| Net investment income | 0.17 | 0.09 | 0.13 | 0.19 | 0.41 |
| Portfolio turnover (%) | 32 | 42 | 41 | 44 | 30 |
| 1 | Based on average daily shares outstanding. |
| 2 | Total returns would have been lower had certain expenses not been reduced during the applicable periods. |
| 18 | JOHN HANCOCK U.S. Global Leaders Growth Fund | ANNUAL REPORT | SEE NOTES TO FINANCIAL STATEMENTS |
| CLASS R2 SHARES Period ended | 10-31-19 | 10-31-18 | 10-31-17 | 10-31-16 | 10-31-15 |
| Per share operating performance | |||||
| Net asset value, beginning of period | $51.80 | $49.48 | $42.99 | $45.89 | $46.82 |
| Net investment loss1 | (0.12) | (0.14) | (0.12) | (0.09) | (0.05) |
| Net realized and unrealized gain (loss) on investments | 8.66 | 5.79 | 8.72 | (0.13) | 5.27 |
| Total from investment operations | 8.54 | 5.65 | 8.60 | (0.22) | 5.22 |
| Less distributions | |||||
| From net investment income | — | — | — | (0.01) | (0.05) |
| From net realized gain | (5.63) | (3.33) | (2.11) | (2.67) | (6.10) |
| Total distributions | (5.63) | (3.33) | (2.11) | (2.68) | (6.15) |
| Net asset value, end of period | $54.71 | $51.80 | $49.48 | $42.99 | $45.89 |
| Total return (%)2 | 18.81 | 11.95 | 20.93 | (0.54) | 13.01 |
| Ratios and supplemental data | |||||
| Net assets, end of period (in millions) | $1 | $2 | $5 | $6 | $8 |
| Ratios (as a percentage of average net assets): | |||||
| Expenses before reductions | 1.29 | 1.30 | 1.31 | 1.32 | 1.30 |
| Expenses including reductions | 1.28 | 1.29 | 1.30 | 1.32 | 1.29 |
| Net investment loss | (0.23) | (0.28) | (0.26) | (0.21) | (0.11) |
| Portfolio turnover (%) | 32 | 42 | 41 | 44 | 30 |
| 1 | Based on average daily shares outstanding. |
| 2 | Total returns would have been lower had certain expenses not been reduced during the applicable periods. |
| SEE NOTES TO FINANCIAL STATEMENTS | ANNUAL REPORT | JOHN HANCOCK U.S. Global Leaders Growth Fund | 19 |
| CLASS R6 SHARES Period ended | 10-31-19 | 10-31-18 | 10-31-17 | 10-31-16 | 10-31-15 |
| Per share operating performance | |||||
| Net asset value, beginning of period | $53.17 | $50.47 | $43.59 | $46.39 | $47.23 |
| Net investment income1 | 0.13 | 0.11 | 0.11 | 0.13 | 0.24 |
| Net realized and unrealized gain (loss) on investments | 8.94 | 5.92 | 8.88 | (0.13) | 5.25 |
| Total from investment operations | 9.07 | 6.03 | 8.99 | — | 5.49 |
| Less distributions | |||||
| From net investment income | — | — | — | (0.13) | (0.23) |
| From net realized gain | (5.63) | (3.33) | (2.11) | (2.67) | (6.10) |
| Total distributions | (5.63) | (3.33) | (2.11) | (2.80) | (6.33) |
| Net asset value, end of period | $56.61 | $53.17 | $50.47 | $43.59 | $46.39 |
| Total return (%)2 | 19.37 | 12.50 | 21.56 | (0.03) | 13.61 |
| Ratios and supplemental data | |||||
| Net assets, end of period (in millions) | $199 | $143 | $6 | $5 | $6 |
| Ratios (as a percentage of average net assets): | |||||
| Expenses before reductions | 0.81 | 0.81 | 0.82 | 0.82 | 0.82 |
| Expenses including reductions | 0.80 | 0.80 | 0.80 | 0.80 | 0.80 |
| Net investment income | 0.24 | 0.21 | 0.23 | 0.30 | 0.55 |
| Portfolio turnover (%) | 32 | 42 | 41 | 44 | 30 |
| 1 | Based on average daily shares outstanding. |
| 2 | Total returns would have been lower had certain expenses not been reduced during the applicable periods. |
| 20 | JOHN HANCOCK U.S. Global Leaders Growth Fund | ANNUAL REPORT | SEE NOTES TO FINANCIAL STATEMENTS |
| Notes to financial statements |
| ANNUAL REPORT | JOHN HANCOCK U.S. Global Leaders Growth Fund | 21 |
| 22 | JOHN HANCOCK U.S. Global Leaders Growth Fund | ANNUAL REPORT |
| ANNUAL REPORT | JOHN HANCOCK U.S. Global Leaders Growth Fund | 23 |
| October 31, 2019 | October 31, 2018 | |
| Ordinary income | $7,697,456 | $41,707,086 |
| Long-term capital gains | 160,272,384 | 58,998,255 |
| Total | $167,969,840 | $100,705,341 |
| 24 | JOHN HANCOCK U.S. Global Leaders Growth Fund | ANNUAL REPORT |
| Class | Expense reduction |
| Class A | $48,737 |
| Class B | 785 |
| Class C | 5,162 |
| Class I | 40,931 |
| Class | Expense reduction |
| Class R2 | $121 |
| Class R6 | 12,281 |
| Total | $108,017 |
| Class | Rule 12b-1 Fee | Service fee |
| Class A | 0.25% | — |
| Class B | 1.00% | — |
| Class C | 1.00% | — |
| Class R2 | 0.25% | 0.25% |
| ANNUAL REPORT | JOHN HANCOCK U.S. Global Leaders Growth Fund | 25 |
| Class | Distribution and service fees | Transfer agent fees |
| Class A | $1,655,468 | $772,615 |
| Class B | 106,909 | 12,409 |
| Class C | 701,599 | 81,752 |
| Class I | — | 691,318 |
| Class R2 | 7,926 | 213 |
| Class R6 | — | 21,475 |
| Total | $2,471,902 | $1,579,782 |
| 26 | JOHN HANCOCK U.S. Global Leaders Growth Fund | ANNUAL REPORT |
| Year Ended 10-31-19 | Year Ended 10-31-18 | |||
| Shares | Amount | Shares | Amount | |
| Class A shares | ||||
| Sold | 2,040,596 | $98,162,511 | 1,728,175 | $83,523,760 |
| Distributions reinvested | 1,555,898 | 66,312,369 | 842,616 | 38,431,702 |
| Repurchased | (2,356,982) | (113,435,549) | (2,391,458) | (115,390,942) |
| Net increase | 1,239,512 | $51,039,331 | 179,333 | $6,564,520 |
| Class B shares | ||||
| Sold | 4,107 | $153,671 | 9,909 | $407,228 |
| Distributions reinvested | 43,715 | 1,532,211 | 29,529 | 1,143,957 |
| Repurchased | (152,674) | (6,062,816) | (113,601) | (4,648,778) |
| Net decrease | (104,852) | $(4,376,934) | (74,163) | $(3,097,593) |
| Class C shares | ||||
| Sold | 293,780 | $11,487,433 | 178,632 | $7,356,278 |
| Distributions reinvested | 249,890 | 8,763,643 | 201,802 | 7,821,856 |
| Repurchased | (590,125) | (23,279,807) | (1,228,507) | (50,092,307) |
| Net decrease | (46,455) | $(3,028,731) | (848,073) | $(34,914,173) |
| Class I shares | ||||
| Sold | 3,675,754 | $192,856,193 | 5,104,265 | $266,498,529 |
| Distributions reinvested | 1,521,468 | 70,246,195 | 844,360 | 41,246,991 |
| Repurchased | (8,153,014) | (394,597,753) | (7,761,361) | (396,298,832) |
| Net decrease | (2,955,792) | $(131,495,365) | (1,812,736) | $(88,553,312) |
| Class R2 shares | ||||
| Sold | 7,700 | $393,159 | 15,755 | $780,375 |
| Distributions reinvested | 3,706 | 167,161 | 6,094 | 292,693 |
| Repurchased | (27,804) | (1,433,687) | (88,104) | (4,405,952) |
| Net decrease | (16,398) | $(873,367) | (66,255) | $(3,332,884) |
| Class R6 shares | ||||
| Sold | 1,233,926 | $66,218,577 | 3,154,507 | $160,962,893 |
| Distributions reinvested | 323,400 | 15,028,390 | 160,487 | 7,876,721 |
| Repurchased | (734,039) | (38,703,436) | (741,743) | (39,042,386) |
| Net increase | 823,287 | $42,543,531 | 2,573,251 | $129,797,228 |
| Total net increase (decrease) | (1,060,698) | $(46,191,535) | (48,643) | $6,463,786 |
| ANNUAL REPORT | JOHN HANCOCK U.S. Global Leaders Growth Fund | 27 |
| Dividends and distributions | |||||||||
| Affiliate | Beginning share amount | Shares purchased | Shares sold | Ending share amount | Income distributions received | Capital gain distributions received | Realized gain (loss) | Change in unrealized appreciation (depreciation) | Ending value |
| John Hancock Collateral Trust* | — | 7,615,710 | (7,615,710) | — | — | — | $201 | — | — |
| * | Refer to the Securities lending note within Note 2 for details regarding this investment. |
| 28 | JOHN HANCOCK U.S. Global Leaders Growth Fund | ANNUAL REPORT |
| ANNUAL REPORT | JOHN HANCOCK U.S. GLOBAL LEADERS GROWTH FUND | 29 |
| Tax information (Unaudited) |
| 30 | JOHN HANCOCK U.S. GLOBAL LEADERS GROWTH FUND | ANNUAL REPORT |
Continuation of Investment Advisory and Subadvisory Agreements
Evaluation of Advisory and Subadvisory Agreements by the Board of Trustees
This section describes the evaluation by the Board of Trustees (the Board) of John Hancock Capital Series (the Trust) of the Advisory Agreement (the Advisory Agreement) with John Hancock Investment Management LLC (the Advisor, formerly known as "John Hancock Advisers, LLC") and the Subadvisory Agreement (the Subadvisory Agreement) with Sustainable Growth Advisers, LP (the Subadvisor), for John Hancock U.S. Global Leaders Growth Fund (the fund). The Advisory Agreement and Subadvisory Agreement are collectively referred to as the Agreements. Prior to the June 23-26, 2019 in-person meeting at which the Agreements were approved, the Board also discussed and considered information regarding the proposed continuation of the Agreements at an in-person meeting held on May 28-30, 2019.
Approval of Advisory and Subadvisory Agreements
At in-person meetings held on June 23-26, 2019,the Board, including the Trustees who are not parties to any Agreement or considered to be interested persons of the Trust under the Investment Company Act of 1940, as amended (the 1940 Act) (the Independent Trustees), reapproved for an annual period the continuation of the Advisory Agreement between the Trust and the Advisor and the Subadvisory Agreement between the Advisor and the Subadvisor with respect to the fund.
In considering the Advisory Agreement and the Subadvisory Agreement, the Board received in advance of the meetings a variety of materials relating to the fund, the Advisor and the Subadvisor, including comparative performance, fee and expense information for a peer group of similar funds prepared by an independent third-party provider of fund data, performance information for an applicable benchmark index; and, with respect to the Subadvisor, comparative performance information for comparably managed accounts, as applicable, and other information provided by the Advisor and the Subadvisor regarding the nature, extent and quality of services provided by the Advisor and the Subadvisor under their respective Agreements, as well as information regarding the Advisor's revenues and costs of providing services to the fund and any compensation paid to affiliates of the Advisor. At the meetings at which the renewal of the Advisory Agreement and Subadvisory Agreement are considered, particular focus is given to information concerning fund performance, comparability of fees and total expenses, and profitability. However, the Board noted that the evaluation process with respect to the Advisor and the Subadvisor is an ongoing one. In this regard, the Board also took into account discussions with management and information provided to the Board (including its various committees) at prior meetings with respect to the services provided by the Advisor and the Subadvisor to the fund, including quarterly performance reports prepared by management containing reviews of investment results and prior presentations from the Subadvisor with respect to the fund. The information received and considered by the Board in connection with the May and June meetings and throughout the year was both written and oral. The Board also considered the nature, quality, and extent of non-advisory services, if any, to be provided to the fund by the Advisor's affiliates, including distribution services. The Board considered the Advisory Agreement and the Subadvisory Agreement separately in the course of its review. In doing so, the Board noted the respective roles of the Advisor and Subadvisor in providing services to the fund.
Throughout the process, the Board asked questions of and requested additional information from management. The Board is assisted by counsel for the Trust and the Independent Trustees are also separately assisted by independent legal counsel throughout the process. The Independent Trustees also received a memorandum from their independent legal counsel discussing the legal standards for their consideration of the proposed continuation of the Agreements
and discussed the proposed continuation of the Agreements in private sessions with their independent legal counsel at which no representatives of management were present.
Approval of Advisory Agreement
In approving the Advisory Agreement with respect to the fund, the Board, including the Independent Trustees, considered a variety of factors, including those discussed below. The Board also considered other factors (including conditions and trends prevailing generally in the economy, the securities markets, and the industry) and did not treat any single factor as determinative, and each Trustee may have attributed different weights to different factors. The Board's conclusions may be based in part on its consideration of the advisory and subadvisory arrangements in prior years and on the Board's ongoing regular review of fund performance and operations throughout the year.
Nature, extent, and quality of services. Among the information received by the Board from the Advisor relating to the nature, extent, and quality of services provided to the fund, the Board reviewed information provided by the Advisor relating to its operations and personnel, descriptions of its organizational and management structure, and information regarding the Advisor's compliance and regulatory history, including its Form ADV. The Board also noted that on a regular basis it receives and reviews information from the Trust's Chief Compliance Officer (CCO) regarding the fund's compliance policies and procedures established pursuant to Rule 38a-1 under the 1940 Act. The Board observed that the scope of services provided by the Advisor, and of the undertakings required of the Advisor in connection with those services, including maintaining and monitoring its own and the fund's compliance programs, risk management programs, liquidity management programs and cybersecurity programs, had expanded over time as a result of regulatory, market and other developments. The Board considered that the Advisor is responsible for the management of the day-to-day operations of the fund, including, but not limited to, general supervision of and coordination of the services provided by the Subadvisor, and is also responsible for monitoring and reviewing the activities of the Subadvisor and other third-party service providers. The Board also considered the significant risks assumed by the Advisor in connection with the services provided to the fund including entrepreneurial risk in sponsoring new funds and ongoing risks including investment, operational, enterprise, litigation, regulatory and compliance risks with respect to all funds.
In considering the nature, extent, and quality of the services provided by the Advisor, the Trustees also took into account their knowledge of the Advisor's management and the quality of the performance of the Advisor's duties, through Board meetings, discussions and reports during the preceding year and through each Trustee's experience as a Trustee of the Trust and of the other trusts in the John Hancock group of funds complex (the John Hancock Fund Complex).
In the course of their deliberations regarding the Advisory Agreement, the Board considered, among other things:
| (a) | the skills and competency with which the Advisor has in the past managed the Trust's affairs and its subadvisory relationship, the Advisor's oversight and monitoring of the Subadvisor's investment performance and compliance programs, such as the Subadvisor's compliance with fund policies and objectives, review of brokerage matters, including with respect to trade allocation and best execution and the Advisor's timeliness in responding to performance issues; | |||||||
| (b) | the background, qualifications and skills of the Advisor's personnel; | |||||||
| (c) | the Advisor's compliance policies and procedures and its responsiveness to regulatory changes and fund industry developments; |
The Board concluded that the Advisor may reasonably be expected to continue to provide a high quality of services under the Advisory Agreement with respect to the fund.
Investment performance.In considering the fund's performance, the Board noted that it reviews at its regularly scheduled meetings information about the fund's performance results. In connection with the consideration of the Advisory Agreement, the Board:
| (a) | reviewed information prepared by management regarding the fund's performance; | |
| (b) | considered the comparative performance of an applicable benchmark index; | |
| (c) | considered the performance of comparable funds, if any, as included in the report prepared by an independent third-party provider of fund data; and | |
| (d) | took into account the Advisor's analysis of the fund's performance and its plans and recommendations regarding the Trust's subadvisory arrangements generally. |
The Board noted that while it found the data provided by the independent third-party generally useful it recognized its limitations, including in particular that the data may vary depending on the end date selected and the results of the performance comparisons may vary depending on the selection of the peer group. The Board noted that the fund outperformed its benchmark index for the one-year period and underperformed its benchmark index for the three-, five- and ten-year periods ended December 31, 2018. The Board also noted that the fund outperformed its peer group average for the one-, three-, five- and ten-year periods ended December 31, 2018. The Board took into account management's discussion of the fund's performance, including the favorable performance relative to the benchmark index for the one-year period and the peer group for the one-, three-, five- and ten-year periods. The Board concluded that the fund's performance has generally been in line with or outperformed the historical performance of comparable funds.
Fees and expenses. The Board reviewed comparative information prepared by an independent third-party provider of fund data, including, among other data, the fund's contractual and net management fees (and subadvisory fees, to the extent available) and total expenses as compared to similarly situated investment companies deemed to be comparable to the fund in light of the nature, extent and quality of the management and advisory and subadvisory services provided by the Advisor and the Subadvisor. The Board considered the fund's ranking within a smaller group of peer funds chosen by the independent third-party provider, as well as the fund's ranking within a broader group of funds. In comparing the fund's contractual and net management fees to those of comparable funds, the Board noted that such fees include both advisory and administrative costs. The Board noted that net management fees and net total expenses for the fund are higher than the peer group median.
The Board took into account management's discussion of the fund's expenses. The Board also took into account management's discussion with respect to the overall management fee and the fees of the Subadvisor, including the amount of the advisory fee retained by the Advisor after payment of the subadvisory fee, in each case in light of the services rendered for those amounts and the risks undertaken by the Advisor. The Board also noted that the Advisor pays the subadvisory fee, and that such fees are negotiated at arm's length with respect to the Subadvisor. In addition, the Board took into account that management had agreed to implement an overall fee waiver across the complex, including the fund, which is discussed further below. The Board also noted actions taken over the past several years to reduce the fund's operating expenses. The Board also noted that, in addition, the Advisor is currently waiving fees and/or reimbursing expenses with respect to the fund and that the fund has breakpoints in its contractual management fee schedule that reduce management fees as assets increase. The Board noted that the fund has a voluntary fee waiver and/or expense reimbursement, which reduces certain expenses of the fund. The Board reviewed information provided by the Advisor concerning the investment advisory fee charged by the Advisor or one of its advisory affiliates to other clients (including other funds in the John Hancock Fund Complex) having similar investment mandates, if any. The Board considered any differences between the Advisor's and Subadvisor's services to the fund and the services they provide to other comparable clients or funds. The Board concluded that the advisory fee paid with respect to the fund is reasonable in light of the nature, extent and quality of the services provided to the fund under the Advisory Agreement.
Profitability/indirect benefits. In considering the costs of the services to be provided and the profits to be realized by the Advisor and its affiliates from the Advisor's relationship with the Trust, the Board:
| (a) | reviewed financial information of the Advisor; | |||||||
| (b) | reviewed and considered information presented by the Advisor regarding the net profitability to the Advisor and its affiliates with respect to the fund; | |||||||
| (c) | received and reviewed profitability information with respect to the John Hancock Fund Complex as a whole and with respect to the fund; | |||||||
| (d) | received information with respect to the Advisor's allocation methodologies used in preparing the profitability data and considered that the Advisor hired an independent third-party consultant to provide an analysis of the Advisor's allocation methodologies; | |||||||
| (e) | considered that the John Hancock insurance companies that are affiliates of the Advisor, as shareholders of the Trust directly or through their separate accounts, receive certain tax credits or deductions relating to foreign taxes paid and dividends received by certain funds of the Trust and noted that these tax benefits, which are not available to participants in qualified retirement plans under applicable income tax law, are reflected in the profitability information reviewed by the Board; | |||||||
| (f) | considered that the Advisor also provides administrative services to the fund on a cost basis pursuant to an administrative services agreement; | |||||||
| (g) | noted that affiliates of the Advisor provide transfer agency services and distribution services to the fund, and that the fund's distributor also receives Rule 12b-1 payments to support distribution of the fund; | |||||||
| (h) | noted that the Advisor also derives reputational and other indirect benefits from providing advisory services to the fund; | |||||||
(i) | noted that the subadvisory fee for the fund is paid by the Advisor and is negotiated at arm's length; | |||||||
(j) | considered the Advisor's ongoing costs and expenditures necessary to improve services, meet new regulatory and compliance requirements, and adapt to other challenges impacting the fund industry; and |
(k) | considered that the Advisor should be entitled to earn a reasonable level of profits in exchange for the level of services it provides to the fund and the risks that it assumes as Advisor, including entrepreneurial, operational, reputational, litigation and regulatory risk |
Based upon its review, the Board concluded that the level of profitability, if any, of the Advisor and its affiliates from their relationship with the fund was reasonable and not excessive.
Economies of scale. In considering the extent to which economies of scale would be realized as the fund grows and whether fee levels reflect these economies of scale for the benefit of fund shareholders, the Board:
| (a) | considered that the Advisor has contractually agreed to waive a portion of its management fee for certain funds of the John Hancock Fund Complex, including the fund (the participating portfolios) or otherwise reimburse the expenses of the participating portfolios (the reimbursement). This waiver is based upon aggregate net assets of all the participating portfolios. The amount of the reimbursement is calculated daily and allocated among all the participating portfolios in proportion to the daily net assets of each fund; | |
| (b) | reviewed the fund's advisory fee structure and concluded that: (i) the fund's fee structure contains breakpoints at the subadvisory fee level and that such breakpoints are reflected as breakpoints in the advisory fees for the fund; and (ii) although economies of scale cannot be measured with precision, these arrangements permit shareholders of the fund to benefit from economies of scale if the fund grows. The Board also took into account management's discussion of the fund's advisory fee structure; and | |
| (c) | the Board also considered the effect of the fund's growth in size on its performance and fees. The Board also noted that if the fund's assets increase over time, the fund may realize other economies of scale. |
Approval of Subadvisory Agreement
In making its determination with respect to approval of the Subadvisory Agreement, the Board reviewed:
| (1) | information relating to the Subadvisor's business, including current subadvisory services to the Trust (and other funds in the John Hancock Fund Complex); | |
| (2) | the historical and current performance of the fund and comparative performance information relating to an applicable benchmark index and comparable funds; | |
| (3) | the subadvisory fee for the fund, including any breakpoints, and to the extent available, comparable fee information prepared by an independent third party provider of fund data; and | |
| (4) | information relating to the nature and scope of any material relationships and their significance to the Trust's Advisor and Subadvisor. |
Nature, extent, and quality of services. With respect to the services provided by the Subadvisor, the Board received information provided to the Board by the Subadvisor, including the Subadvisor's Form ADV, as well as took into account information presented throughout the past year. The Board considered the Subadvisor's current level of staffing and its overall resources, as well as received information relating to the Subadvisor's compensation program. The Board reviewed the Subadvisor's history and investment experience, as well as information regarding the qualifications, background, and responsibilities of the Subadvisor's investment and compliance personnel who provide services to the fund. The Board also considered, among other things, the Subadvisor's compliance program and any disciplinary history. The Board also considered the Subadvisor's risk assessment and monitoring process. The Board reviewed the Subadvisor's regulatory history, including whether it was involved in any regulatory actions or
investigations as well as material litigation, and any settlements and amelioratory actions undertaken, as appropriate. The Board noted that the Advisor conducts regular, periodic reviews of the Subadvisor and its operations, including regarding investment processes and organizational and staffing matters. The Board also noted that the Trust's CCO and his staff conduct regular, periodic compliance reviews with the Subadvisor and present reports to the Independent Trustees regarding the same, which includes evaluating the regulatory compliance systems of the Subadvisor and procedures reasonably designed to assure compliance with the federal securities laws. The Board also took into account the financial condition of the Subadvisor.
The Board considered the Subadvisor's investment process and philosophy. The Board took into account that the Subadvisor's responsibilities include the development and maintenance of an investment program for the fund that is consistent with the fund's investment objective, the selection of investment securities and the placement of orders for the purchase and sale of such securities, as well as the implementation of compliance controls related to performance of these services. The Board also received information with respect to the Subadvisor's brokerage policies and practices, including with respect to best execution and soft dollars.
Subadvisor compensation. In considering the cost of services to be provided by the Subadvisor and the profitability to the Subadvisor of its relationship with the fund, the Board noted that the fees under the Subadvisory Agreement are paid by the Advisor and not the fund.
The Board also relied on the ability of the Advisor to negotiate the Subadvisory Agreement with the Subadvisor, which is not affiliated with the Advisor, and the fees thereunder at arm's length. As a result, the costs of the services to be provided and the profits to be realized by the Subadvisor from its relationship with the Trust were not a material factor in the Board's consideration of the Subadvisory Agreement.
The Board also received information regarding the nature and scope (including their significance to the Advisor and its affiliates and to the Subadvisor) of any material relationships with respect to the Subadvisor, which include arrangements in which the Subadvisor or its affiliates provide advisory, distribution, or management services in connection with financial products sponsored by the Advisor or its affiliates, and may include other registered investment companies, a 529 education savings plan, managed separate accounts and exempt group annuity contracts sold to qualified plans. The Board also received information and took into account any other potential conflicts of interest the Advisor might have in connection with the Subadvisory Agreement.
In addition, the Board considered other potential indirect benefits that the Subadvisor and its affiliates may receive from the Subadvisor's relationship with the fund, such as the opportunity to provide advisory services to additional funds in the John Hancock Fund Complex and reputational benefits.
Subadvisory fees. The Board considered that the fund pays an advisory fee to the Advisor and that, in turn, the Advisor pays a subadvisory fee to the Subadvisor. As noted above, the Board also considered the fund's subadvisory fees as compared to similarly situated investment companies deemed to be comparable to the fund as included in the report prepared by the independent third party provider of fund data, to the extent available. The Board noted that the limited size of the Lipper peer group was not sufficient for comparative purposes. The Board also took into account the subadvisory fees paid by the Advisor to the Subadvisor with respect to the fund and compared them to fees charged by the Subadvisor to manage other subadvised portfolios and portfolios not subject to regulation under the 1940 Act, as applicable.
Subadvisor performance. As noted above, the Board considered the fund's performance as compared to the fund's peer group and the benchmark index and noted that the Board reviews information about the fund's performance results at its regularly scheduled meetings. The Board noted the Advisor's expertise and resources in monitoring the
performance, investment style and risk-adjusted performance of the Subadvisor. The Board was mindful of the Advisor's focus on the Subadvisor's performance. The Board also noted the Subadvisor's long-term performance record for similar accounts, as applicable.
The Board's decision to approve the Subadvisory Agreement was based on a number of determinations, including the following:
| (1) | the Subadvisor has extensive experience and demonstrated skills as a manager; | |
| (2) | the performance of the fund has generally been in line with or outperformed the historical performance of comparable funds;; | |
| (3) | the subadvisory fee is reasonable in relation to the level and quality of services being provided under the Subadvisory Agreement; and | |
| (4) | noted that the subadvisory fees are paid by the Advisor not the fund and that the subadvisory fee breakpoints are reflected as breakpoints in the advisory fees for the fund in order to permit shareholders to benefit from economies of scale if the fund grows. | |
| * * * | ||
Based on the Board's evaluation of all factors that the Board deemed to be material, including those factors described above, the Board, including the Independent Trustees, concluded that renewal of the Advisory Agreement and the Subadvisory Agreement would be in the best interest of the fund and its shareholders. Accordingly, the Board, and the Independent Trustees voting separately, approved the Advisory Agreement and Subadvisory Agreement for an additional one-year period.
This chart provides information about the Trustees and Officers who oversee your John Hancock fund. Officers elected by the Trustees manage the day-to-day operations of the fund and execute policies formulated by the Trustees.
Independent Trustees
| Name, year of birth Position(s) held with Trust Principal occupation(s) and other directorships during past 5 years | Trustee of the Trust since1 | Number of John Hancock funds overseen by Trustee |
| Hassell H. McClellan, Born: 1945 | 2012 | 207 |
| Trustee and Chairperson of the Board Director/Trustee, Virtus Funds (since 2008); Director, The Barnes Group (since 2010); Associate Professor, The Wallace E. Carroll School of Management, Boston College (retired 2013). Trustee (since 2005) and Chairperson of the Board (since 2017) of various trusts within the John Hancock Fund Complex. | ||
| Charles L. Bardelis,2 Born: 1941 | 2012 | 207 |
| Trustee Director, Island Commuter Corp. (marine transport). Trustee of various trusts within the John Hancock Fund Complex (since 1988). | ||
| James R. Boyle,Born: 1959 | 2015 | 207 |
| Trustee Chief Executive Officer, Foresters Financial (since 2018); Chairman and Chief Executive Officer, Zillion Group, Inc. (formerly HealthFleet, Inc.) (healthcare) (2014-2018); Executive Vice President and Chief Executive Officer, U.S. Life Insurance Division of Genworth Financial, Inc. (insurance) (January 2014-July 2014); Senior Executive Vice President, Manulife Financial, President and Chief Executive Officer, John Hancock (1999-2012); Chairman and Director, John Hancock Investment Management LLC, John Hancock Investment Management Distributors LLC, and John Hancock Variable Trust Advisers LLC (2005-2010). Trustee of various trusts within the John Hancock Fund Complex (2005-2014 and since 2015). | ||
| Peter S. Burgess,2 Born: 1942 | 2012 | 207 |
| Trustee Consultant (financial, accounting, and auditing matters) (since 1999); Certified Public Accountant; Partner, Arthur Andersen (independent public accounting firm) (prior to 1999); Director, Lincoln Educational Services Corporation (since 2004); Director, Symetra Financial Corporation (2010-2016); Director, PMA Capital Corporation (2004-2010). Trustee of various trusts within the John Hancock Fund Complex (since 2005). | ||
| William H. Cunningham, Born: 1944 | 2005 | 207 |
| Trustee Professor, University of Texas, Austin, Texas (since 1971); former Chancellor, University of Texas System and former President of the University of Texas, Austin, Texas; Chairman (since 2009) and Director (since 2006), Lincoln National Corporation (insurance); Director, Southwest Airlines (since 2000); former Director, LIN Television (2009-2014). Trustee of various trusts within the John Hancock Fund Complex (since 1986). | ||
| Grace K. Fey, Born: 1946 | 2012 | 207 |
| Trustee Chief Executive Officer, Grace Fey Advisors (since 2007); Director and Executive Vice President, Frontier Capital Management Company (1988-2007); Director, Fiduciary Trust (since 2009). Trustee of various trusts within the John Hancock Fund Complex (since 2008). | ||
Independent Trustees (continued)
| Name, year of birth Position(s) held with Trust Principal occupation(s) and other directorships during past 5 years | Trustee of the Trust since1 | Number of John Hancock funds overseen by Trustee |
| Deborah C. Jackson, Born: 1952 | 2008 | 207 |
| Trustee President, Cambridge College, Cambridge, Massachusetts (since 2011); Board of Directors, Massachusetts Women's Forum (since 2018); Board of Directors, National Association of Corporate Directors/New England (since 2015); Board of Directors, Association of Independent Colleges and Universities of Massachusetts (2014-2017); Chief Executive Officer, American Red Cross of Massachusetts Bay (2002-2011); Board of Directors of Eastern Bank Corporation (since 2001); Board of Directors of Eastern Bank Charitable Foundation (since 2001); Board of Directors of American Student Assistance Corporation (1996-2009); Board of Directors of Boston Stock Exchange (2002-2008); Board of Directors of Harvard Pilgrim Healthcare (health benefits company) (2007-2011). Trustee of various trusts within the John Hancock Fund Complex (since 2008). | ||
| James M. Oates,2Born: 1946 | 2012 | 207 |
| Trustee Managing Director, Wydown Group (financial consulting firm) (since 1994); Chairman and Director, Emerson Investment Management, Inc. (2000-2015); Independent Chairman, Hudson Castle Group, Inc. (formerly IBEX Capital Markets, Inc.) (financial services company) (1997-2011); Director, Stifel Financial (since 1996); Director, Investor Financial Services Corporation (1995-2007); Director, Connecticut River Bancorp (1998-2014); Director/Trustee, Virtus Funds (since 1988). Trustee (since 2004) and Chairperson of the Board (2005-2016) of various trusts within the John Hancock Fund Complex. | ||
| Steven R. Pruchansky, Born: 1944 | 2005 | 207 |
| Trustee and Vice Chairperson of the Board Managing Director, Pru Realty (since 2017); Chairman and Chief Executive Officer, Greenscapes of Southwest Florida, Inc. (since 2014); Director and President, Greenscapes of Southwest Florida, Inc. (until 2000); Member, Board of Advisors, First American Bank (until 2010); Managing Director, Jon James, LLC (real estate) (since 2000); Partner, Right Funding, LLC (2014-2017); Director, First Signature Bank & Trust Company (until 1991); Director, Mast Realty Trust (until 1994); President, Maxwell Building Corp. (until 1991). Trustee (since 1992), Chairperson of the Board (2011-2012), and Vice Chairperson of the Board (since 2012) of various trusts within the John Hancock Fund Complex. | ||
| Gregory A. Russo, Born: 1949 | 2009 | 207 |
| Trustee Director and Audit Committee Chairman (since 2012), and Member, Audit Committee and Finance Committee (since 2011), NCH Healthcare System, Inc. (holding company for multi-entity healthcare system); Director and Member (2012-2018) and Finance Committee Chairman (2014-2018), The Moorings, Inc. (nonprofit continuing care community); Vice Chairman, Risk & Regulatory Matters, KPMG LLP (KPMG) (2002-2006); Vice Chairman, Industrial Markets, KPMG (1998-2002); Chairman and Treasurer, Westchester County, New York, Chamber of Commerce (1986-1992); Director, Treasurer, and Chairman of Audit and Finance Committees, Putnam Hospital Center (1989-1995); Director and Chairman of Fundraising Campaign, United Way of Westchester and Putnam Counties, New York (1990-1995). Trustee of various trusts within the John Hancock Fund Complex (since 2008). | ||
Non-Independent Trustees3
| Name, year of birth Position(s) held with Trust Principal occupation(s) and other directorships during past 5 years | Trustee of the Trust since1 | Number of John Hancock funds overseen by Trustee |
| Andrew G. Arnott, Born: 1971 | 2017 | 207 |
| President and Non-Independent Trustee Head of Wealth and Asset Management, United States and Europe, for John Hancock and Manulife (since 2018); Executive Vice President, John Hancock Financial Services (since 2009, including prior positions); Director and Executive Vice President, John Hancock Investment Management LLC (since 2005, including prior positions); Director and Executive Vice President, John Hancock Variable Trust Advisers LLC (since 2006, including prior positions); President, John Hancock Investment Management Distributors LLC (since 2004, including prior positions); President of various trusts within the John Hancock Fund Complex (since 2007, including prior positions). Trustee of various trusts within the John Hancock Fund Complex (since 2017). | ||
| Marianne Harrison, Born: 1963 | 2018 | 207 |
| Non-Independent Trustee President and CEO, John Hancock (since 2017); President and CEO, Manulife Canadian Division (2013-2017); Member, Board of Directors, CAE Inc. (since 2019); Member, Board of Directors, MA Competitive Partnership Board (since 2018); Member, Board of Directors, American Council of Life Insurers (ACLI) (since 2018); Member, Board of Directors, Communitech, an industry-led innovation center that fosters technology companies in Canada (2017-2019); Member, Board of Directors, Manulife Assurance Canada (2015-2017); Board Member, St. Mary's General Hospital Foundation (2014-2017); Member, Board of Directors, Manulife Bank of Canada (2013-2017); Member, Standing Committee of the Canadian Life & Health Assurance Association (2013-2017); Member, Board of Directors, John Hancock USA, John Hancock Life & Health, John Hancock New York (2012-2013). Trustee of various trusts within the John Hancock Fund Complex (since 2018). | ||
Principal officers who are not Trustees
| Name, year of birth Position(s) held with Trust Principal occupation(s) during past 5 years | Officer of the Trust since |
| Francis V. Knox, Jr.,Born: 1947 | 2005 |
| Chief Compliance Officer Vice President, John Hancock Financial Services (since 2005); Chief Compliance Officer, various trusts within the John Hancock Fund Complex, John Hancock Investment Management LLC, and John Hancock Variable Trust Advisers LLC (since 2005). | |
| Charles A. Rizzo, Born: 1957 | 2007 |
| Chief Financial Officer Vice President, John Hancock Financial Services (since 2008); Senior Vice President, John Hancock Investment Management LLC and John Hancock Variable Trust Advisers LLC (since 2008); Chief Financial Officer of various trusts within the John Hancock Fund Complex (since 2007). | |
| Salvatore Schiavone, Born: 1965 | 2010 |
| Treasurer Assistant Vice President, John Hancock Financial Services (since 2007); Vice President, John Hancock Investment Management LLC and John Hancock Variable Trust Advisers LLC (since 2007); Treasurer of various trusts within the John Hancock Fund Complex (since 2007, including prior positions). | |
Principal officers who are notTrustees (continued)
| Name, year of birth Position(s) held with Trust Principal occupation(s) during past 5 years | Officer of the Trust since |
| Christopher (Kit) Sechler,Born: 1973 | 2018 |
| Chief Legal Officer and Secretary Vice President and Deputy Chief Counsel, John Hancock Investments (since 2015); Assistant Vice President and Senior Counsel (2009-2015), John Hancock Investment Management; Chief Legal Officer and Secretary of various trusts within the John Hancock Fund Complex (since 2018); Assistant Secretary of John Hancock Investment Management LLC and John Hancock Variable Trust Advisers LLC (since 2009). | |
The business address for all Trustees and Officers is 200 Berkeley Street, Boston, Massachusetts 02116-5023.
The Statement of Additional Information of the fund includes additional information about members of the Board of Trustees of the Trust and is available without charge, upon request, by calling 800-225-5291.
| 1 | Each Trustee holds office until his or her successor is elected and qualified, or until the Trustee's death, retirement, resignation, or removal. Mr. Boyle has served as Trustee at various times prior to the date listed in the table. |
| 2 | Member of the Audit Committee. |
| 3 | The Trustee is a Non-Independent Trustee due to current or former positions with the Advisor and certain affiliates. |
Trustees Hassell H. McClellan,Chairperson Officers Andrew G. Arnott Francis V. Knox, Jr. Charles A. Rizzo Salvatore Schiavone Christopher (Kit) Sechler | Investment advisor John Hancock Investment Management LLC Subadvisor Sustainable Growth Advisers, LP (SGA) Portfolio Managers George P. Fraise1 Principal distributor John Hancock Investment Management Distributors LLC Custodian State Street Bank and Trust Company Transfer agent John Hancock Signature Services, Inc. Legal counsel K&L Gates LLP Independent registered public accounting firm PricewaterhouseCoopers LLP 1 Effective January 1, 2020, George P. Fraise will no longer serve as a portfolio manager for the fund and Kishore Rao will be added as a portfolio manager for the fund. |
* Member of the Audit Committee
† Non-Independent Trustee
The fund's proxy voting policies and procedures, as well as the fund proxy voting record for the most recent twelve-month period ended June 30, are available free of charge on the Securities and Exchange Commission (SEC) website at sec.gov or on our website.
All of the fund's holdings as of the end of the third month of every fiscal quarter are filed with the SEC on Form N-PORT within 60 days of the end of the fiscal quarter. The fund's Form N-PORT filings are available on our website and the SEC's website, sec.gov.
We make this information on your fund, as well asmonthly portfolio holdings, and other fund details available on our website at jhinvestments.com or by calling 800-225-5291.
| You can also contact us: | |||
| 800-225-5291 jhinvestments.com | Regular mail: John Hancock Signature Services, Inc. | Express mail: John Hancock Signature Services, Inc. | |
John Hancock family of funds
DOMESTIC EQUITY FUNDS Blue Chip Growth Classic Value Disciplined Value Disciplined Value Mid Cap Equity Income Financial Industries Fundamental All Cap Core Fundamental Large Cap Core New Opportunities Regional Bank Small Cap Core Small Cap Growth Small Cap Value U.S. Global Leaders Growth U.S. Quality Growth GLOBAL AND INTERNATIONAL EQUITY FUNDS Disciplined Value International Emerging Markets Emerging Markets Equity Fundamental Global Franchise Global Equity Global Shareholder Yield Global Thematic Opportunities International Dynamic Growth International Growth International Small Company | INCOME FUNDS Bond California Tax-Free Income Emerging Markets Debt Floating Rate Income Government Income High Yield High Yield Municipal Bond Income Investment Grade Bond Money Market Short Duration Bond Short Duration Credit Opportunities Strategic Income Opportunities Tax-Free Bond ALTERNATIVE AND SPECIALTY FUNDS Absolute Return Currency Alternative Asset Allocation Alternative Risk Premia Disciplined Alternative Yield Diversified Macro Infrastructure Multi-Asset Absolute Return Seaport Long/Short |
A fund's investment objectives, risks, charges, and expenses should be considered carefully before investing. The prospectus contains this and other important information about the fund. To obtain a prospectus, contact your financial professional, call John Hancock Investment Management at 800-225-5291, or visit our website at jhinvestments.com. Please read the prospectus carefully before investing or sending money.
ASSET ALLOCATION Balanced Income Allocation Multi-Index Lifetime Portfolios Multi-Index Preservation Portfolios Multimanager Lifestyle Portfolios Multimanager Lifetime Portfolios Retirement Income 2040 EXCHANGE-TRADED FUNDS John Hancock Multifactor Consumer Discretionary ETF John Hancock Multifactor Consumer Staples ETF John Hancock Multifactor Developed International ETF John Hancock Multifactor Emerging Markets ETF John Hancock Multifactor Energy ETF John Hancock Multifactor Financials ETF John Hancock Multifactor Healthcare ETF John Hancock Multifactor Industrials ETF John Hancock Multifactor Large Cap ETF John Hancock Multifactor Materials ETF John Hancock Multifactor Media and John Hancock Multifactor Mid Cap ETF John Hancock Multifactor Small Cap ETF John Hancock Multifactor Technology ETF John Hancock Multifactor Utilities ETF | ENVIRONMENTAL, SOCIAL, AND ESG All Cap Core ESG Core Bond ESG International Equity ESG Large Cap Core CLOSED-END FUNDS Financial Opportunities Hedged Equity & Income Income Securities Trust Investors Trust Preferred Income Preferred Income II Preferred Income III Premium Dividend Tax-Advantaged Dividend Income Tax-Advantaged Global Shareholder Yield |
John Hancock Multifactor ETF shares are bought and sold at market price (not NAV), and are not individually redeemed
from the fund. Brokerage commissions will reduce returns.
John Hancock ETFs are distributed by Foreside Fund Services, LLC, and are subadvised by Dimensional Fund Advisors LP.
Foreside is not affiliated with John Hancock Investment Management Distributors LLC or Dimensional Fund Advisors LP.
Dimensional Fund Advisors LP receives compensation from John Hancock in connection with licensing rights to the
John Hancock Dimensional indexes. Dimensional Fund Advisors LP does not sponsor, endorse, or sell, and makes no
representation as to the advisability of investing in, John Hancock Multifactor ETFs.
John Hancock Investment Management
A trusted brand
John Hancock Investment Management is a premier asset manager
representing one of America's most trusted brands, with a heritage of
financial stewardship dating back to 1862. Helping our shareholders
pursue their financial goals is at the core of everything we do. It's why
we support the role of professional financial advice and operate with
the highest standards of conduct and integrity.
A better way to invest
We serve investors globally through a unique multimanager approach:
We search the world to find proven portfolio teams with specialized
expertise for every strategy we offer, then we apply robust investment
oversight to ensure they continue to meet our uncompromising
standards and serve the best interests of our shareholders.
Results for investors
Our unique approach to asset management enables us to provide
a diverse set of investments backed by some of the world's best
managers, along with strong risk-adjusted returns across asset classes.
![]()
John Hancock Investment Management Distributors LLC n Member FINRA, SIPC
200 Berkeley Street n Boston, MA 02116-5010 n 800-225-5291 n jhinvestments.com
This report is for the information of the shareholders of John Hancock U.S. Global Leaders Growth Fund. It is not authorized for distribution to prospective investors unless preceded or accompanied by a prospectus.

| MF1003898 | 26A 10/19 12/19 |
John Hancock
Classic Value Fund
Annual report 10/31/19
Beginning on January 1, 2021, as permitted by regulations adopted by the Securities and Exchange Commission, paper copies of the fund's shareholder reports like this one will no longer be sent by mail, unless you specifically request paper copies of the reports from the fund or from your financial intermediary. Instead, the reports will be made available on a website, and you will be notified by mail each time a report is posted and provided with a website link to access the report.
If you already elected to receive shareholder reports electronically, you will not be affected by this change, and you do not need to take any action. You may elect to receive shareholder reports and other communications electronically by calling John Hancock Investment Management at 800-225-5291 (Class A, Class B and Class C shares) or 888-972-8696 (Class I, Class R1, Class R2, Class R3, Class R5 and Class R6 shares) or by contacting your financial intermediary.
You may elect to receive all reports in paper, free of charge, at any time. You can inform John Hancock Investment Management or your financial intermediary that you wish to continue receiving paper copies of your shareholder reports by following the instructions listed above. Your election to receive reports in paper will apply to all funds held with John Hancock Investment Management or your financial intermediary.
A message to shareholders
Dear shareholder,
It was a volatile time for stock investors in the United States during the 12 months ended October 31, 2019, although many segments of the market delivered attractive absolute returns for the period. Uncertainty surrounding trade with China, the impeachment inquiry against President Trump, and the broader health of the global economy led to some dramatic swings in performance. Investors, who had generally shunned riskier assets in the final months of 2018, regained their risk appetites in the first half of 2019. Despite setbacks in May and August, the markets closed the period on record highs. Against this backdrop, the U.S. Federal Reserve pivoted from raising short-term interest rates to an easing stance, cutting interest rates three times in the latter half of the period.
While the economic fundamentals in the United States appear fairly solid, with a strong labor market and a confident consumer base, there are sure to be patches of market turbulence as the year goes on, particularly if the likelihood of a recession is perceived to increase. As always, your best resource in unpredictable markets is your financial advisor, who can help position your portfolio so that it's sufficiently diversified to meet your long-term objectives and to withstand the inevitable bouts of market volatility along the way.
On behalf of everyone at John Hancock Investment Management, I'd like to take this opportunity to welcome new shareholders and thank existing shareholders for the continued trust you've placed in us.
Sincerely,
Andrew G. Arnott
President and CEO,
John Hancock Investment Management
Head of Wealth and Asset Management,
United States and Europe
This commentary reflects the CEO's views as of this report's period end and are subject to change at any time. Diversification does not guarantee investment returns and does not eliminate risk of loss. All investments entail risks, including the possible loss of principal. For more up-to-date information, you can visit our website at jhinvestments.com.
John Hancock
Classic Value Fund
Table of contents
| 2 | Your fund at a glance | |
| 4 | Manager's discussion of fund performance | |
| 6 | A look at performance | |
| 8 | Your expenses | |
| 10 | Fund's investments | |
| 13 | Financial statements | |
| 16 | Financial highlights | |
| 25 | Notes to financial statements | |
| 34 | Report of independent registered public accounting firm | |
| 35 | Tax information | |
| 36 | Continuation of investment advisory and subadvisory agreements | |
| 43 | Trustees and Officers | |
| 47 | More information |
INVESTMENT OBJECTIVE
The fund seeks long-term growth of capital.
AVERAGE ANNUAL TOTAL RETURNS AS OF 10/31/19 (%)
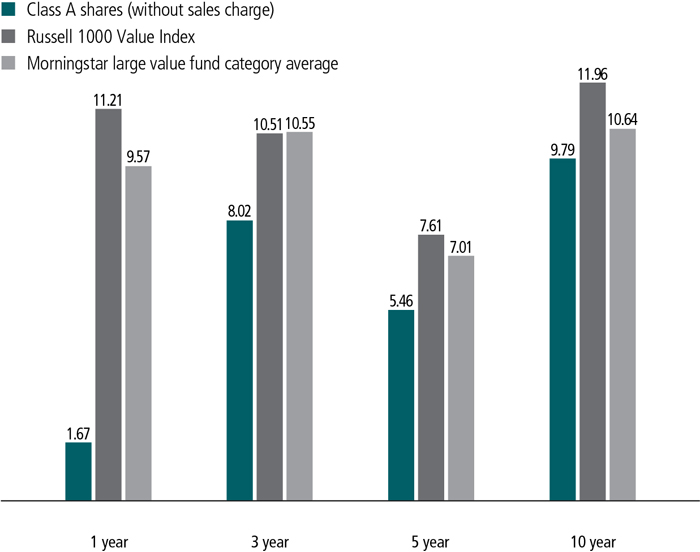
The Russell 1000 Value Index is an unmanaged index containing those securities in the Russell 1000 Index with a less-than-average growth orientation.
It is not possible to invest directly in an index. Index figures do not reflect expenses or sales charges, which would result in lower returns.
Figures from Morningstar, Inc. include reinvested distributions and do not take into account sales charges. Actual load-adjusted performance is lower.
The past performance shown here reflects reinvested distributions and the beneficial effect of any expense reductions, and does not guarantee future results. Performance of the other share classes will vary based on the difference in the fees and expenses of those classes. Shares will fluctuate in value and, when redeemed, may be worth more or less than their original cost. Current month-end performance may be lower or higher than the performance cited, and can be found at jhinvestments.com or by calling 800-225-5291. For further information on the fund's objectives, risks, and strategy, see the fund's prospectus.
PERFORMANCE HIGHLIGHTS OVER THE LAST TWELVE MONTHS
Investors continued to favor growth stocks over value
Despite concerns over a possible recession and the trade conflict between the United States and China, investors still focused on growth and low volatility.
The fund underperformed its benchmark
The fund generated a positive return for the period, but significantly underperformed the Russell 1000 Value Index.
Stock selection in the energy sector was a key detractor
Selection in the consumer discretionary and information technology sectors also significantly contributed to the fund's underperformance, while holdings in financials aided its return.
SECTOR COMPOSITION AS OF 10/31/19 (%)
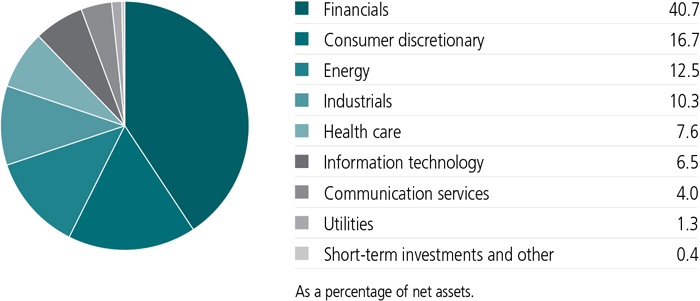
A note about risks
The fund is subject to various risks as described in the fund's prospectus. For more information, please refer to the "Principal risks" section of the prospectus.
The investment environment over the period was dominated by concerns over whether the economy would tip into recession territory and the growing impact of a trade war between the United States and China. An inversion of the U.S. yield curve fed economic concerns and commodity prices fell, which included a decline of over 20% in the price of oil. In an uncertain environment, investors showed a continued preference for growth stocks and low volatility equities, shunning much cheaper cyclicals, where the fund is focused.
How did the fund perform in this environment?
The fund significantly trailed its benchmark, the Russell 1000 Value Index. Driving the underperformance was stock selection within the energy, consumer discretionary, and information technology sectors, which was partially offset by investments in financials and underexposure to the underperforming materials sector.
Holdings in oil field service leaders Halliburton Company and National Oilwell Varco, Inc. were large detractors. Continued oil price weakness has combined with a downturn in exploration and development spending to accelerate the decline in global reserves. Some of the largest individual contributors to the fund's
TOP 10 HOLDINGS AS OF 10/31/19 (%)
| General Electric Company | 4.4 |
| Capital One Financial Corp. | 4.1 |
| Citigroup, Inc. | 4.0 |
| Wells Fargo & Company | 3.9 |
| American International Group, Inc. | 3.8 |
| Lear Corp. | 3.6 |
| National Oilwell Varco, Inc. | 3.6 |
| Hewlett Packard Enterprise Company | 3.3 |
| Bank of America Corp. | 3.3 |
| PVH Corp. | 3.3 |
| TOTAL | 37.3 |
| As a percentage of net assets. | |
| Cash and cash equivalents are not included. | |
performance were financial stocks, including insurance companies American International Group, Inc. (AIG) and MetLife, Inc., and global banking giant Citigroup, Inc.
What changes did you make to the fund over the period?
We increased exposure to the consumer discretionary and industrial sectors while trimming exposure to healthcare and information technology and shifted the fund's energy exposure from integrated energy to oil field services companies. We initiated several new positions, most notably PVH Corp., Wabtec Corp., Mohawk Industries, Inc., and Stanley Black & Decker, Inc. Notable sells included industrials firm Dover Corp., pharmaceutical giant Merck & Company, and Exxon Mobil Corp. We also exited the fund's holding in pharmacy benefit manager Express Scripts Holding Company after it was taken over by Cigna Corp.
How was the fund positioned at period end?
The portfolio remains positioned in economically sensitive names where we're finding a wide range of good businesses and compelling valuations. Many of our holdings are delivering real earnings growth and returning significant amounts of capital to shareholders through dividends and buybacks, yet the market ignores them. In our view, the current market environment represents a compelling value opportunity for investors with a patient, long-term investment horizon.
MANAGED BY
 | Richard S. Pzena On the fund since 1996 Investing since 1980 |
 | John Flynn On the fund since 2017 Investing since 2000 |
 | Benjamin S. Silver, CFA, CPA On the fund since 2012 Investing since 1991 |
![]()
TOTAL RETURNS FOR THE PERIOD ENDED OCTOBER 31, 2019
| Average annual total returns (%) with maximum sales charge | Cumulative total returns (%) with maximum sales charge | ||||||
| 1-year | 5-year | 10-year | 5-year | 10-year | |||
| Class A | -3.41 | 4.38 | 9.23 | 23.90 | 141.79 | ||
| Class B | -4.10 | 4.33 | 9.13 | 23.58 | 139.53 | ||
| Class C | -0.07 | 4.67 | 8.97 | 25.61 | 136.12 | ||
| Class I1 | 1.93 | 5.72 | 10.11 | 32.06 | 162.03 | ||
| Class R11 | 1.27 | 5.05 | 9.41 | 27.92 | 145.69 | ||
| Class R21,2 | 1.50 | 5.30 | 9.74 | 29.45 | 153.36 | ||
| Class R31,2 | 1.38 | 5.16 | 9.50 | 28.62 | 147.91 | ||
| Class R51,2 | 1.97 | 5.79 | 10.16 | 32.47 | 163.09 | ||
| Class R61,2 | 1.99 | 5.83 | 10.12 | 32.73 | 162.22 | ||
| Index† | 11.21 | 7.61 | 11.96 | 44.32 | 209.59 | ||
Performance figures assume all distributions have been reinvested. Figures reflect maximum sales charges on Class A shares of 5% and the applicable contingent deferred sales charge (CDSC) on Class B and Class C shares. The Class B shares' CDSC declines annually between years 1 to 6 according to the following schedule: 5%, 4%, 3%, 3%, 2%, 1%. No sales charge will be assessed after the sixth year. Class C shares held for less than one year are subject to a 1% CDSC. Sales charges are not applicable to Class I, Class R1, Class R2, Class R3, Class R5, and Class R6 shares.
The expense ratios of the fund, both net (including any fee waivers and/or expense limitations) and gross (excluding any fee waivers and/or expense limitations), are set forth according to the most recent publicly available prospectuses for the fund and may differ from those disclosed in the Financial highlights tables in this report. Net expenses reflect contractual expense limitations in effect until July 31, 2021 and are subject to change. Had the contractual fee waivers and expense limitations not been in place, gross expenses would apply. The expense ratios are as follows:
| Class A | Class B | Class C | Class I | Class R1 | Class R2 | Class R3 | Class R5 | Class R6 | |
| Gross (%) | 1.17 | 1.92 | 1.92 | 0.93 | 1.57 | 1.32 | 1.47 | 0.87 | 0.82 |
| Net (%) | 1.16 | 1.91 | 1.91 | 0.92 | 1.56 | 1.31 | 1.46 | 0.86 | 0.81 |
Please refer to the most recent prospectus and annual or semiannual report for more information on expenses and any expense limitation arrangements for each class.
The returns reflect past results and should not be considered indicative of future performance. The return and principal value of an investment will fluctuate so that shares, when redeemed, may be worth more or less than their original cost. Due to market volatility and other factors, the fund's current performance may be higher or lower than the performance shown. For current to the most recent month-end performance data, please call 800-225-5291 or visit the fund's website at jhinvestments.com.
The performance table above and the chart on the next page do not reflect the deduction of taxes that a shareholder would pay on fund distributions or the redemption of fund shares. The fund's performance results reflect any applicable fee waivers or expense reductions, without which the expenses would increase and results would have been less favorable.
| † | Index is the Russell 1000 Value Index. |
See the following page for footnotes.
This chart and table show what happened to a hypothetical $10,000 investment in John Hancock Classic Value Fund for the share classes and periods indicated, assuming all distributions were reinvested. For comparison, we've shown the same investment in the Russell 1000 Value Index.
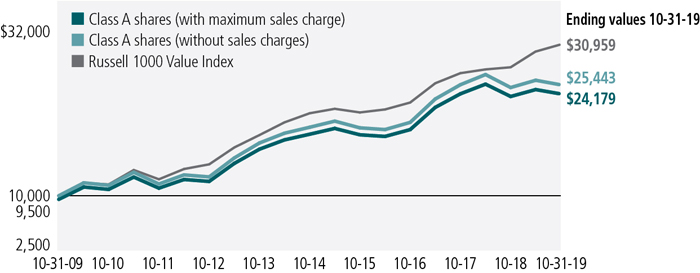
| Start date | With maximum sales charge ($) | Without sales charge ($) | Index ($) | |
| Class B3 | 10-31-09 | 23,953 | 23,953 | 30,959 |
| Class C3 | 10-31-09 | 23,612 | 23,612 | 30,959 |
| Class I1 | 10-31-09 | 26,203 | 26,203 | 30,959 |
| Class R11 | 10-31-09 | 24,569 | 24,569 | 30,959 |
| Class R21,2 | 10-31-09 | 25,336 | 25,336 | 30,959 |
| Class R31,2 | 10-31-09 | 24,791 | 24,791 | 30,959 |
| Class R51,2 | 10-31-09 | 26,309 | 26,309 | 30,959 |
| Class R61,2 | 10-31-09 | 26,222 | 26,222 | 30,959 |
The Russell 1000 Value Index is an unmanaged index containing those securities in the Russell 1000 Index with a less-than-average growth orientation.
It is not possible to invest directly in an index. Index figures do not reflect expenses or sales charges, which would result in lower returns.
Footnotes related to performance pages
| 1 | For certain types of investors, as described in the fund's prospectus. |
| 2 | Class R2 shares were first offered on 3-1-12; Class R3 and Class R5 shares were first offered on 5-22-09; Class R6 shares were first offered on 9-1-11. Returns prior to these dates are those of Class A shares and have not been adjusted for expenses; otherwise, returns would vary. |
| 3 | The contingent deferred sales charge is not applicable. |
| Your expenses |

| 8 | JOHN HANCOCK CLASSIC VALUE FUND | ANNUAL REPORT |
| Account value on 5-1-2019 | Ending value on 10-31-2019 | Expenses paid during period ended 10-31-20191 | Annualized expense ratio | ||
| Class A | Actual expenses/actual returns | $1,000.00 | $977.20 | $5.83 | 1.17% |
| Hypothetical example | 1,000.00 | 1,019.30 | 5.95 | 1.17% | |
| Class B | Actual expenses/actual returns | 1,000.00 | 973.40 | 9.55 | 1.92% |
| Hypothetical example | 1,000.00 | 1,015.50 | 9.75 | 1.92% | |
| Class C | Actual expenses/actual returns | 1,000.00 | 973.70 | 9.55 | 1.92% |
| Hypothetical example | 1,000.00 | 1,015.50 | 9.75 | 1.92% | |
| Class I | Actual expenses/actual returns | 1,000.00 | 978.50 | 4.59 | 0.92% |
| Hypothetical example | 1,000.00 | 1,020.60 | 4.69 | 0.92% | |
| Class R1 | Actual expenses/actual returns | 1,000.00 | 975.10 | 7.77 | 1.56% |
| Hypothetical example | 1,000.00 | 1,017.30 | 7.93 | 1.56% | |
| Class R2 | Actual expenses/actual returns | 1,000.00 | 976.20 | 6.58 | 1.32% |
| Hypothetical example | 1,000.00 | 1,018.60 | 6.72 | 1.32% | |
| Class R3 | Actual expenses/actual returns | 1,000.00 | 975.90 | 6.92 | 1.39% |
| Hypothetical example | 1,000.00 | 1,018.20 | 7.07 | 1.39% | |
| Class R5 | Actual expenses/actual returns | 1,000.00 | 978.50 | 4.29 | 0.86% |
| Hypothetical example | 1,000.00 | 1,020.90 | 4.38 | 0.86% | |
| Class R6 | Actual expenses/actual returns | 1,000.00 | 978.80 | 4.09 | 0.82% |
| Hypothetical example | 1,000.00 | 1,021.10 | 4.18 | 0.82% |
| 1 | Expenses are equal to the annualized expense ratio, multiplied by the average account value over the period, multiplied by 184/365 (to reflect the one-half year period). |
| ANNUAL REPORT | JOHN HANCOCK CLASSIC VALUE FUND | 9 |
| Fund’s investments |
| Shares | Value | ||||
| Common stocks 99.6% | $2,138,846,206 | ||||
| (Cost $1,983,508,470) | |||||
| Communication services 4.0% | 86,544,025 | ||||
| Media 4.0% | |||||
| Omnicom Group, Inc. | 282,609 | 21,814,589 | |||
| The Interpublic Group of Companies, Inc. | 2,976,066 | 64,729,436 | |||
| Consumer discretionary 16.7% | 359,323,536 | ||||
| Auto components 3.6% | |||||
| Lear Corp. | 661,727 | 77,931,589 | |||
| Automobiles 2.6% | |||||
| Ford Motor Company | 6,661,951 | 57,226,159 | |||
| Household durables 5.9% | |||||
| Mohawk Industries, Inc. (A) | 456,020 | 65,384,148 | |||
| Newell Brands, Inc. | 3,201,842 | 60,738,943 | |||
| Textiles, apparel and luxury goods 4.6% | |||||
| Gildan Activewear, Inc. | 1,076,871 | 27,492,517 | |||
| PVH Corp. | 809,433 | 70,550,180 | |||
| Energy 12.5% | 267,239,256 | ||||
| Energy equipment and services 8.8% | |||||
| Baker Hughes, a GE Company | 1,960,899 | 41,963,239 | |||
| Halliburton Company | 3,583,196 | 68,976,523 | |||
| National Oilwell Varco, Inc. | 3,389,173 | 76,663,093 | |||
| Oil, gas and consumable fuels 3.7% | |||||
| Cenovus Energy, Inc. | 4,454,588 | 37,819,452 | |||
| Royal Dutch Shell PLC, ADR, Class A | 721,355 | 41,816,949 | |||
| Financials 40.7% | 874,099,032 | ||||
| Banks 13.9% | |||||
| Bank of America Corp. | 2,287,118 | 71,518,180 | |||
| Citigroup, Inc. | 1,199,732 | 86,212,742 | |||
| JPMorgan Chase & Co. | 454,942 | 56,831,355 | |||
| Wells Fargo & Company | 1,623,844 | 83,839,066 | |||
| Capital markets 9.0% | |||||
| KKR & Company, Inc., Class A | 1,330,285 | 38,352,117 | |||
| Morgan Stanley | 1,518,948 | 69,947,555 | |||
| The Goldman Sachs Group, Inc. | 256,936 | 54,825,004 | |||
| UBS Group AG (A) | 2,577,126 | 30,332,773 | |||
| Consumer finance 4.1% | |||||
| Capital One Financial Corp. | 934,925 | 87,181,756 | |||
| 10 | JOHN HANCOCK CLASSIC VALUE FUND | ANNUAL REPORT | SEE NOTES TO FINANCIAL STATEMENTS |
| Shares | Value | ||||
| Financials (continued) | |||||
| Diversified financial services 4.8% | |||||
| AXA Equitable Holdings, Inc. | 2,807,732 | $60,647,011 | |||
| Voya Financial, Inc. | 791,460 | 42,707,182 | |||
| Insurance 8.9% | |||||
| American International Group, Inc. | 1,535,799 | 81,335,915 | |||
| Axis Capital Holdings, Ltd. | 800,848 | 47,594,397 | |||
| MetLife, Inc. | 1,341,611 | 62,773,979 | |||
| Health care 7.6% | 163,785,580 | ||||
| Biotechnology 2.2% | |||||
| Amgen, Inc. | 219,072 | 46,717,104 | |||
| Health care providers and services 3.9% | |||||
| Cardinal Health, Inc. | 662,244 | 32,747,966 | |||
| McKesson Corp. | 380,432 | 50,597,456 | |||
| Pharmaceuticals 1.5% | |||||
| Mylan NV (A) | 1,760,995 | 33,723,054 | |||
| Industrials 10.3% | 221,257,459 | ||||
| Industrial conglomerates 4.4% | |||||
| General Electric Company | 9,455,687 | 94,367,753 | |||
| Machinery 5.9% | |||||
| Stanley Black & Decker, Inc. | 432,307 | 65,421,018 | |||
| Wabtec Corp. | 886,099 | 61,468,688 | |||
| Information technology 6.5% | 139,364,637 | ||||
| IT services 2.9% | |||||
| Cognizant Technology Solutions Corp., Class A | 1,007,301 | 61,384,923 | |||
| Software 0.3% | |||||
| Oracle Corp. | 115,201 | 6,277,302 | |||
| Technology hardware, storage and peripherals 3.3% | |||||
| Hewlett Packard Enterprise Company | 4,369,434 | 71,702,412 | |||
| Utilities 1.3% | 27,232,681 | ||||
| Electric utilities 1.3% | |||||
| Edison International | 432,952 | 27,232,681 | |||
| Par value^ | Value | ||||
| Short-term investments 0.4% | $8,637,000 | ||||
| (Cost $8,637,000) | |||||
| Repurchase agreement 0.4% | 8,637,000 | ||||
| Repurchase Agreement with State Street Corp. dated 10-31-19 at 0.550% to be repurchased at $8,637,132 on 11-1-19, collateralized by $8,730,000 U.S. Treasury Notes, 1.875% due 1-31-22 (valued at $8,813,319, including interest) | 8,637,000 | 8,637,000 |
| SEE NOTES TO FINANCIAL STATEMENTS | ANNUAL REPORT | JOHN HANCOCK CLASSIC VALUE FUND | 11 |
| Total investments (Cost $1,992,145,470) 100.0% | $2,147,483,206 | ||||
| Other assets and liabilities, net 0.0% | 542,017 | ||||
| Total net assets 100.0% | $2,148,025,223 | ||||
| The percentage shown for each investment category is the total value of the category as a percentage of the net assets of the fund. | |
| ^All par values are denominated in U.S. dollars unless otherwise indicated. | |
| Security Abbreviations and Legend | |
| ADR | American Depositary Receipt |
| (A) | Non-income producing security. |
| 12 | JOHN HANCOCK CLASSIC VALUE FUND | ANNUAL REPORT | SEE NOTES TO FINANCIAL STATEMENTS |
| Financial statements |
| Assets | |
| Unaffiliated investments, at value (Cost $1,992,145,470) | $2,147,483,206 |
| Cash | 180 |
| Dividends and interest receivable | 1,531,056 |
| Receivable for fund shares sold | 3,814,206 |
| Receivable for securities lending income | 43 |
| Other assets | 127,133 |
| Total assets | 2,152,955,824 |
| Liabilities | |
| Payable for fund shares repurchased | 2,879,863 |
| Payable to affiliates | |
| Investment management fees | 1,342,066 |
| Accounting and legal services fees | 189,914 |
| Transfer agent fees | 185,453 |
| Distribution and service fees | 90,377 |
| Trustees' fees | 2,265 |
| Other liabilities and accrued expenses | 240,663 |
| Total liabilities | 4,930,601 |
| Net assets | $2,148,025,223 |
| Net assets consist of | |
| Paid-in capital | $1,904,080,634 |
| Total distributable earnings (loss) | 243,944,589 |
| Net assets | $2,148,025,223 |
| Net asset value per share | |
| Based on net asset value and shares outstanding - the fund has an unlimited number of shares authorized with no par value | |
| Class A ($334,097,085 ÷ 10,671,110 shares)1 | $31.31 |
| Class B ($1,385,195 ÷ 45,073 shares)1 | $30.73 |
| Class C ($20,071,042 ÷ 653,447 shares)1 | $30.72 |
| Class I ($1,429,323,711 ÷ 45,524,642 shares) | $31.40 |
| Class R1 ($2,283,766 ÷ 72,935 shares) | $31.31 |
| Class R2 ($478,938 ÷ 15,334 shares) | $31.23 |
| Class R3 ($571,738 ÷ 18,317 shares) | $31.21 |
| Class R5 ($87,120 ÷ 2,773 shares) | $31.42 |
| Class R6 ($359,726,628 ÷ 11,443,694 shares) | $31.43 |
| Maximum offering price per share | |
| Class A (net asset value per share ÷ 95%)2 | $32.96 |
| 1 | Redemption price per share is equal to net asset value less any applicable contingent deferred sales charge. |
| 2 | On single retail sales of less than $50,000. On sales of $50,000 or more and on group sales the offering price is reduced. |
| SEE NOTES TO FINANCIAL STATEMENTS | ANNUAL REPORT | JOHN HANCOCK Classic Value Fund | 13 |
| Investment income | |
| Dividends | $70,906,098 |
| Interest | 311,564 |
| Securities lending | 18,193 |
| Less foreign taxes withheld | (639,446) |
| Total investment income | 70,596,409 |
| Expenses | |
| Investment management fees | 16,678,972 |
| Distribution and service fees | 1,139,562 |
| Accounting and legal services fees | 491,151 |
| Transfer agent fees | 2,318,423 |
| Trustees' fees | 43,834 |
| Custodian fees | 246,357 |
| State registration fees | 202,862 |
| Printing and postage | 229,824 |
| Professional fees | 91,206 |
| Other | 80,616 |
| Total expenses | 21,522,807 |
| Less expense reductions | (163,671) |
| Net expenses | 21,359,136 |
| Net investment income | 49,237,273 |
| Realized and unrealized gain (loss) | |
| Net realized gain (loss) on | |
| Unaffiliated investments and foreign currency transactions | 46,461,856 |
| Affiliated investments | 5,628 |
| 46,467,484 | |
| Change in net unrealized appreciation (depreciation) of | |
| Unaffiliated investments | (48,665,815) |
| (48,665,815) | |
| Net realized and unrealized loss | (2,198,331) |
| Increase in net assets from operations | $47,038,942 |
| 14 | JOHN HANCOCK Classic Value Fund | ANNUAL REPORT | SEE NOTES TO FINANCIAL STATEMENTS |
| Year ended 10-31-19 | Year ended 10-31-18 | |
| Increase (decrease) in net assets | ||
| From operations | ||
| Net investment income | $49,237,273 | $37,342,487 |
| Net realized gain | 46,467,484 | 24,253,712 |
| Change in net unrealized appreciation (depreciation) | (48,665,815) | (96,996,470) |
| Increase (decrease) in net assets resulting from operations | 47,038,942 | (35,400,271) |
| Distributions to shareholders | ||
| From earnings | ||
| Class A | (7,360,607) | (3,493,763) |
| Class B | (34,706) | (11,751) |
| Class C | (352,002) | (213,388) |
| Class I | (35,683,141) | (17,742,839) |
| Class R1 | (51,460) | (22,029) |
| Class R2 | (170,439) | (60,489) |
| Class R3 | (27,551) | (9,760) |
| Class R41 | (1,632) | (870) |
| Class R5 | (1,701) | (869) |
| Class R6 | (9,493,876) | (4,515,692) |
| Total distributions | (53,177,115) | (26,071,450) |
| From fund share transactions | (139,528,741) | 140,624,274 |
| Total increase (decrease) | (145,666,914) | 79,152,553 |
| Net assets | ||
| Beginning of year | 2,293,692,137 | 2,214,539,584 |
| End of year | $2,148,025,223 | $2,293,692,137 |
| 1 | All Class R4 shares were redeemed on 10-29-19. |
| SEE NOTES TO FINANCIAL STATEMENTS | ANNUAL REPORT | JOHN HANCOCK Classic Value Fund | 15 |
| Financial highlights |
| CLASS A SHARES Period ended | 10-31-19 | 10-31-18 | 10-31-17 | 10-31-16 | 10-31-15 |
| Per share operating performance | |||||
| Net asset value, beginning of period | $31.52 | $32.32 | $26.12 | $25.49 | $25.82 |
| Net investment income1 | 0.61 | 0.46 | 0.34 | 0.43 | 0.28 |
| Net realized and unrealized gain (loss) on investments | (0.15) | (0.94) | 6.38 | 0.54 | (0.39) |
| Total from investment operations | 0.46 | (0.48) | 6.72 | 0.97 | (0.11) |
| Less distributions | |||||
| From net investment income | (0.39) | (0.32) | (0.52) | (0.34) | (0.22) |
| From net realized gain | (0.28) | — | — | — | — |
| Total distributions | (0.67) | (0.32) | (0.52) | (0.34) | (0.22) |
| Net asset value, end of period | $31.31 | $31.52 | $32.32 | $26.12 | $25.49 |
| Total return (%)2,3 | 1.67 | (1.53) | 25.91 | 3.90 | (0.42) |
| Ratios and supplemental data | |||||
| Net assets, end of period (in millions) | $334 | $348 | $354 | $308 | $351 |
| Ratios (as a percentage of average net assets): | |||||
| Expenses before reductions | 1.18 | 1.17 | 1.18 | 1.19 | 1.19 |
| Expenses including reductions | 1.17 | 1.16 | 1.17 | 1.18 | 1.18 |
| Net investment income | 2.00 | 1.37 | 1.12 | 1.76 | 1.07 |
| Portfolio turnover (%) | 35 | 28 | 45 | 21 | 17 |
| 1 | Based on average daily shares outstanding. |
| 2 | Total returns would have been lower had certain expenses not been reduced during the applicable periods. |
| 3 | Does not reflect the effect of sales charges, if any. |
| 16 | JOHN HANCOCK Classic Value Fund | ANNUAL REPORT | SEE NOTES TO FINANCIAL STATEMENTS |
| CLASS B SHARES Period ended | 10-31-19 | 10-31-18 | 10-31-17 | 10-31-16 | 10-31-15 |
| Per share operating performance | |||||
| Net asset value, beginning of period | $30.91 | $31.70 | $25.66 | $25.04 | $25.37 |
| Net investment income1 | 0.42 | 0.22 | 0.12 | 0.25 | 0.08 |
| Net realized and unrealized gain (loss) on investments | (0.19) | (0.92) | 6.26 | 0.52 | (0.38) |
| Total from investment operations | 0.23 | (0.70) | 6.38 | 0.77 | (0.30) |
| Less distributions | |||||
| From net investment income | (0.13) | (0.09) | (0.34) | (0.15) | (0.03) |
| From net realized gain | (0.28) | — | — | — | — |
| Total distributions | (0.41) | (0.09) | (0.34) | (0.15) | (0.03) |
| Net asset value, end of period | $30.73 | $30.91 | $31.70 | $25.66 | $25.04 |
| Total return (%)2,3 | 0.87 | (2.22) | 24.96 | 3.10 | (1.18) |
| Ratios and supplemental data | |||||
| Net assets, end of period (in millions) | $1 | $3 | $4 | $6 | $8 |
| Ratios (as a percentage of average net assets): | |||||
| Expenses before reductions | 1.93 | 1.92 | 1.93 | 1.94 | 1.93 |
| Expenses including reductions | 1.92 | 1.91 | 1.92 | 1.93 | 1.93 |
| Net investment income | 1.41 | 0.65 | 0.40 | 1.03 | 0.32 |
| Portfolio turnover (%) | 35 | 28 | 45 | 21 | 17 |
| 1 | Based on average daily shares outstanding. |
| 2 | Total returns would have been lower had certain expenses not been reduced during the applicable periods. |
| 3 | Does not reflect the effect of sales charges, if any. |
| SEE NOTES TO FINANCIAL STATEMENTS | ANNUAL REPORT | JOHN HANCOCK Classic Value Fund | 17 |
| CLASS C SHARES Period ended | 10-31-19 | 10-31-18 | 10-31-17 | 10-31-16 | 10-31-15 |
| Per share operating performance | |||||
| Net asset value, beginning of period | $30.89 | $31.69 | $25.65 | $25.03 | $25.36 |
| Net investment income1 | 0.39 | 0.26 | 0.11 | 0.24 | 0.08 |
| Net realized and unrealized gain (loss) on investments | (0.14) | (0.97) | 6.27 | 0.53 | (0.38) |
| Total from investment operations | 0.25 | (0.71) | 6.38 | 0.77 | (0.30) |
| Less distributions | |||||
| From net investment income | (0.14) | (0.09) | (0.34) | (0.15) | (0.03) |
| From net realized gain | (0.28) | — | — | — | — |
| Total distributions | (0.42) | (0.09) | (0.34) | (0.15) | (0.03) |
| Net asset value, end of period | $30.72 | $30.89 | $31.69 | $25.65 | $25.03 |
| Total return (%)2,3 | 0.92 | (2.25) | 24.96 | 3.11 | (1.18) |
| Ratios and supplemental data | |||||
| Net assets, end of period (in millions) | $20 | $26 | $75 | $76 | $88 |
| Ratios (as a percentage of average net assets): | |||||
| Expenses before reductions | 1.93 | 1.92 | 1.93 | 1.94 | 1.94 |
| Expenses including reductions | 1.92 | 1.91 | 1.92 | 1.93 | 1.93 |
| Net investment income | 1.31 | 0.76 | 0.38 | 1.01 | 0.32 |
| Portfolio turnover (%) | 35 | 28 | 45 | 21 | 17 |
| 1 | Based on average daily shares outstanding. |
| 2 | Total returns would have been lower had certain expenses not been reduced during the applicable periods. |
| 3 | Does not reflect the effect of sales charges, if any. |
| 18 | JOHN HANCOCK Classic Value Fund | ANNUAL REPORT | SEE NOTES TO FINANCIAL STATEMENTS |
| CLASS I SHARES Period ended | 10-31-19 | 10-31-18 | 10-31-17 | 10-31-16 | 10-31-15 |
| Per share operating performance | |||||
| Net asset value, beginning of period | $31.62 | $32.42 | $26.19 | $25.56 | $25.90 |
| Net investment income1 | 0.69 | 0.55 | 0.41 | 0.51 | 0.35 |
| Net realized and unrealized gain (loss) on investments | (0.16) | (0.95) | 6.41 | 0.53 | (0.40) |
| Total from investment operations | 0.53 | (0.40) | 6.82 | 1.04 | (0.05) |
| Less distributions | |||||
| From net investment income | (0.47) | (0.40) | (0.59) | (0.41) | (0.29) |
| From net realized gain | (0.28) | — | — | — | — |
| Total distributions | (0.75) | (0.40) | (0.59) | (0.41) | (0.29) |
| Net asset value, end of period | $31.40 | $31.62 | $32.42 | $26.19 | $25.56 |
| Total return (%)2 | 1.93 | (1.29) | 26.24 | 4.18 | (0.19) |
| Ratios and supplemental data | |||||
| Net assets, end of period (in millions) | $1,429 | $1,518 | $1,767 | $1,146 | $1,591 |
| Ratios (as a percentage of average net assets): | |||||
| Expenses before reductions | 0.94 | 0.93 | 0.92 | 0.93 | 0.92 |
| Expenses including reductions | 0.93 | 0.92 | 0.91 | 0.92 | 0.91 |
| Net investment income | 2.24 | 1.62 | 1.35 | 2.07 | 1.34 |
| Portfolio turnover (%) | 35 | 28 | 45 | 21 | 17 |
| 1 | Based on average daily shares outstanding. |
| 2 | Total returns would have been lower had certain expenses not been reduced during the applicable periods. |
| SEE NOTES TO FINANCIAL STATEMENTS | ANNUAL REPORT | JOHN HANCOCK Classic Value Fund | 19 |
| CLASS R1 SHARES Period ended | 10-31-19 | 10-31-18 | 10-31-17 | 10-31-16 | 10-31-15 |
| Per share operating performance | |||||
| Net asset value, beginning of period | $31.50 | $32.31 | $26.13 | $25.49 | $25.83 |
| Net investment income1 | 0.51 | 0.33 | 0.21 | 0.34 | 0.17 |
| Net realized and unrealized gain (loss) on investments | (0.16) | (0.94) | 6.40 | 0.55 | (0.38) |
| Total from investment operations | 0.35 | (0.61) | 6.61 | 0.89 | (0.21) |
| Less distributions | |||||
| From net investment income | (0.26) | (0.20) | (0.43) | (0.25) | (0.13) |
| From net realized gain | (0.28) | — | — | — | — |
| Total distributions | (0.54) | (0.20) | (0.43) | (0.25) | (0.13) |
| Net asset value, end of period | $31.31 | $31.50 | $32.31 | $26.13 | $25.49 |
| Total return (%)2 | 1.27 | (1.92) | 25.43 | 3.53 | (0.82) |
| Ratios and supplemental data | |||||
| Net assets, end of period (in millions) | $2 | $3 | $4 | $3 | $3 |
| Ratios (as a percentage of average net assets): | |||||
| Expenses before reductions | 1.57 | 1.56 | 1.57 | 1.55 | 1.57 |
| Expenses including reductions | 1.56 | 1.56 | 1.56 | 1.55 | 1.57 |
| Net investment income | 1.66 | 0.99 | 0.71 | 1.40 | 0.64 |
| Portfolio turnover (%) | 35 | 28 | 45 | 21 | 17 |
| 1 | Based on average daily shares outstanding. |
| 2 | Total returns would have been lower had certain expenses not been reduced during the applicable periods. |
| 20 | JOHN HANCOCK Classic Value Fund | ANNUAL REPORT | SEE NOTES TO FINANCIAL STATEMENTS |
| CLASS R2 SHARES Period ended | 10-31-19 | 10-31-18 | 10-31-17 | 10-31-16 | 10-31-15 |
| Per share operating performance | |||||
| Net asset value, beginning of period | $31.44 | $32.24 | $26.07 | $25.46 | $25.85 |
| Net investment income1 | 0.47 | 0.40 | 0.25 | 0.36 | 0.26 |
| Net realized and unrealized gain (loss) on investments | (0.06) | (0.92) | 6.41 | 0.58 | (0.41) |
| Total from investment operations | 0.41 | (0.52) | 6.66 | 0.94 | (0.15) |
| Less distributions | |||||
| From net investment income | (0.34) | (0.28) | (0.49) | (0.33) | (0.24) |
| From net realized gain | (0.28) | — | — | — | — |
| Total distributions | (0.62) | (0.28) | (0.49) | (0.33) | (0.24) |
| Net asset value, end of period | $31.23 | $31.44 | $32.24 | $26.07 | $25.46 |
| Total return (%)2 | 1.50 | (1.66) | 25.71 | 3.76 | (0.56) |
| Ratios and supplemental data | |||||
| Net assets, end of period (in millions) | $—3 | $9 | $7 | $1 | $—3 |
| Ratios (as a percentage of average net assets): | |||||
| Expenses before reductions | 1.30 | 1.32 | 1.33 | 1.33 | 1.26 |
| Expenses including reductions | 1.29 | 1.31 | 1.32 | 1.32 | 1.26 |
| Net investment income | 1.50 | 1.21 | 0.84 | 1.47 | 0.99 |
| Portfolio turnover (%) | 35 | 28 | 45 | 21 | 17 |
| 1 | Based on average daily shares outstanding. |
| 2 | Total returns would have been lower had certain expenses not been reduced during the applicable periods. |
| 3 | Less than $500,000. |
| SEE NOTES TO FINANCIAL STATEMENTS | ANNUAL REPORT | JOHN HANCOCK Classic Value Fund | 21 |
| CLASS R3 SHARES Period ended | 10-31-19 | 10-31-18 | 10-31-17 | 10-31-16 | 10-31-15 |
| Per share operating performance | |||||
| Net asset value, beginning of period | $31.42 | $32.20 | $26.03 | $25.41 | $25.75 |
| Net investment income1 | 0.64 | 0.39 | 0.24 | 0.36 | 0.20 |
| Net realized and unrealized gain (loss) on investments | (0.27) | (0.94) | 6.38 | 0.53 | (0.39) |
| Total from investment operations | 0.37 | (0.55) | 6.62 | 0.89 | (0.19) |
| Less distributions | |||||
| From net investment income | (0.30) | (0.23) | (0.45) | (0.27) | (0.15) |
| From net realized gain | (0.28) | — | — | — | — |
| Total distributions | (0.58) | (0.23) | (0.45) | (0.27) | (0.15) |
| Net asset value, end of period | $31.21 | $31.42 | $32.20 | $26.03 | $25.41 |
| Total return (%)2 | 1.38 | (1.74) | 25.58 | 3.57 | (0.73) |
| Ratios and supplemental data | |||||
| Net assets, end of period (in millions) | $1 | $1 | $1 | $1 | $1 |
| Ratios (as a percentage of average net assets): | |||||
| Expenses before reductions | 1.45 | 1.40 | 1.47 | 1.48 | 1.48 |
| Expenses including reductions | 1.44 | 1.40 | 1.47 | 1.47 | 1.47 |
| Net investment income | 2.08 | 1.17 | 0.79 | 1.48 | 0.78 |
| Portfolio turnover (%) | 35 | 28 | 45 | 21 | 17 |
| 1 | Based on average daily shares outstanding. |
| 2 | Total returns would have been lower had certain expenses not been reduced during the applicable periods. |
| 22 | JOHN HANCOCK Classic Value Fund | ANNUAL REPORT | SEE NOTES TO FINANCIAL STATEMENTS |
| CLASS R5 SHARES Period ended | 10-31-19 | 10-31-18 | 10-31-17 | 10-31-16 | 10-31-15 |
| Per share operating performance | |||||
| Net asset value, beginning of period | $31.65 | $32.44 | $26.21 | $25.57 | $25.92 |
| Net investment income1 | 0.66 | 0.57 | 0.43 | 0.54 | 0.37 |
| Net realized and unrealized gain (loss) on investments | (0.12) | (0.94) | 6.40 | 0.52 | (0.40) |
| Total from investment operations | 0.54 | (0.37) | 6.83 | 1.06 | (0.03) |
| Less distributions | |||||
| From net investment income | (0.49) | (0.42) | (0.60) | (0.42) | (0.32) |
| From net realized gain | (0.28) | — | — | — | — |
| Total distributions | (0.77) | (0.42) | (0.60) | (0.42) | (0.32) |
| Net asset value, end of period | $31.42 | $31.65 | $32.44 | $26.21 | $25.57 |
| Total return (%)2 | 1.97 | (1.22) | 26.27 | 4.27 | (0.11) |
| Ratios and supplemental data | |||||
| Net assets, end of period (in millions) | $—3 | $—3 | $—3 | $—3 | $—3 |
| Ratios (as a percentage of average net assets): | |||||
| Expenses before reductions | 0.88 | 0.87 | 0.88 | 0.86 | 0.85 |
| Expenses including reductions | 0.87 | 0.87 | 0.87 | 0.86 | 0.84 |
| Net investment income | 2.17 | 1.68 | 1.40 | 2.22 | 1.40 |
| Portfolio turnover (%) | 35 | 28 | 45 | 21 | 17 |
| 1 | Based on average daily shares outstanding. |
| 2 | Total returns would have been lower had certain expenses not been reduced during the applicable periods. |
| 3 | Less than $500,000. |
| SEE NOTES TO FINANCIAL STATEMENTS | ANNUAL REPORT | JOHN HANCOCK Classic Value Fund | 23 |
| CLASS R6 SHARES Period ended | 10-31-19 | 10-31-18 | 10-31-17 | 10-31-16 | 10-31-15 |
| Per share operating performance | |||||
| Net asset value, beginning of period | $31.67 | $32.46 | $26.21 | $25.59 | $25.94 |
| Net investment income1 | 0.72 | 0.57 | 0.47 | 0.52 | 0.39 |
| Net realized and unrealized gain (loss) on investments | (0.17) | (0.93) | 6.39 | 0.54 | (0.42) |
| Total from investment operations | 0.55 | (0.36) | 6.86 | 1.06 | (0.03) |
| Less distributions | |||||
| From net investment income | (0.51) | (0.43) | (0.61) | (0.44) | (0.32) |
| From net realized gain | (0.28) | — | — | — | — |
| Total distributions | (0.79) | (0.43) | (0.61) | (0.44) | (0.32) |
| Net asset value, end of period | $31.43 | $31.67 | $32.46 | $26.21 | $25.59 |
| Total return (%)2 | 1.99 | (1.17) | 26.41 | 4.26 | (0.09) |
| Ratios and supplemental data | |||||
| Net assets, end of period (in millions) | $360 | $384 | $1 | $1 | $1 |
| Ratios (as a percentage of average net assets): | |||||
| Expenses before reductions | 0.83 | 0.82 | 0.83 | 0.83 | 0.83 |
| Expenses including reductions | 0.82 | 0.81 | 0.81 | 0.81 | 0.81 |
| Net investment income | 2.36 | 1.71 | 1.53 | 2.11 | 1.51 |
| Portfolio turnover (%) | 35 | 28 | 45 | 21 | 17 |
| 1 | Based on average daily shares outstanding. |
| 2 | Total returns would have been lower had certain expenses not been reduced during the applicable periods. |
| 24 | JOHN HANCOCK Classic Value Fund | ANNUAL REPORT | SEE NOTES TO FINANCIAL STATEMENTS |
| Notes to financial statements |
| ANNUAL REPORT | JOHN HANCOCK Classic Value Fund | 25 |
| Total value at 10-31-19 | Level 1 quoted price | Level 2 significant observable inputs | Level 3 significant unobservable inputs | |
| Investments in securities: | ||||
| Assets | ||||
| Common stocks | $2,138,846,206 | $2,138,846,206 | — | — |
| Short-term investments | 8,637,000 | — | $8,637,000 | — |
| Total investments in securities | $2,147,483,206 | $2,138,846,206 | $8,637,000 | — |
| 26 | JOHN HANCOCK Classic Value Fund | ANNUAL REPORT |
| ANNUAL REPORT | JOHN HANCOCK Classic Value Fund | 27 |
| October 31, 2019 | October 31, 2018 | |
| Ordinary income | $47,716,993 | $26,071,450 |
| Long-term capital gains | 5,460,122 | — |
| Total | $53,177,115 | $26,071,450 |
| 28 | JOHN HANCOCK Classic Value Fund | ANNUAL REPORT |
| ANNUAL REPORT | JOHN HANCOCK Classic Value Fund | 29 |
| Class | Expense reduction |
| Class A | $24,741 |
| Class B | 148 |
| Class C | 1,747 |
| Class I | 109,319 |
| Class R1 | 198 |
| Class R2 | 226 |
| Class | Expense reduction |
| Class R3 | $70 |
| Class R4 | 4 |
| Class R5 | 5 |
| Class R6 | 27,145 |
| Total | $163,603 |
| Class | Rule 12b-1 Fee | Service fee |
| Class A | 0.25% | — |
| Class B | 1.00% | — |
| Class C | 1.00% | — |
| Class R1 | 0.50% | 0.25% |
| Class R2 | 0.25% | 0.25% |
| Class R3 | 0.50% | 0.15% |
| Class R4 | 0.25% | 0.10% |
| Class R5 | — | 0.05% |
| 30 | JOHN HANCOCK Classic Value Fund | ANNUAL REPORT |
| Class | Distribution and service fees | Transfer agent fees |
| Class A | $840,651 | $391,565 |
| Class B | 20,105 | 2,327 |
| Class C | 237,704 | 27,614 |
| Class I | — | 1,848,202 |
| Class R1 | 20,022 | 350 |
| Class R2 | 14,910 | 437 |
| Class R3 | 5,967 | 126 |
| Class R4 | 169 | 9 |
| Class R5 | 34 | 9 |
| Class R6 | — | 47,784 |
| Total | $1,139,562 | $2,318,423 |
| ANNUAL REPORT | JOHN HANCOCK Classic Value Fund | 31 |
| Borrower or Lender | Weighted Average Loan Balance | Days Outstanding | Weighted Average Interest Rate | Interest Income (Expense) |
| Borrower | $23,773,274 | 10 | 2.260% | ($14,921) |
| Year Ended 10-31-19 | Year Ended 10-31-18 | |||
| Shares | Amount | Shares | Amount | |
| Class A shares | ||||
| Sold | 1,518,751 | $45,251,769 | 2,006,273 | $68,327,765 |
| Distributions reinvested | 243,463 | 6,892,431 | 96,879 | 3,228,010 |
| Repurchased | (2,142,480) | (64,846,582) | (2,014,562) | (67,661,377) |
| Net increase (decrease) | (380,266) | $(12,702,382) | 88,590 | $3,894,398 |
| Class B shares | ||||
| Sold | 1,652 | $45,991 | 2,773 | $90,175 |
| Distributions reinvested | 1,163 | 32,533 | 338 | 11,102 |
| Repurchased | (46,097) | (1,391,416) | (52,999) | (1,750,841) |
| Net decrease | (43,282) | $(1,312,892) | (49,888) | $(1,649,564) |
| Class C shares | ||||
| Sold | 126,750 | $3,582,339 | 78,780 | $2,614,557 |
| Distributions reinvested | 11,105 | 310,501 | 6,124 | 201,289 |
| Repurchased | (337,290) | (10,102,625) | (1,611,127) | (54,059,338) |
| Net decrease | (199,435) | $(6,209,785) | (1,526,223) | $(51,243,492) |
| Class I shares | ||||
| Sold | 10,963,873 | $328,918,979 | 13,499,554 | $456,832,057 |
| Distributions reinvested | 1,206,310 | 34,174,754 | 489,456 | 16,328,256 |
| Repurchased | (14,654,268) | (449,986,617) | (20,486,916) | (680,004,271) |
| Net decrease | (2,484,085) | $(86,892,884) | (6,497,906) | $(206,843,958) |
| Class R1 shares | ||||
| Sold | 8,279 | $246,084 | 13,832 | $464,484 |
| Distributions reinvested | 1,488 | 42,283 | 561 | 18,732 |
| Repurchased | (38,697) | (1,165,919) | (23,545) | (785,740) |
| Net decrease | (28,930) | $(877,552) | (9,152) | $(302,524) |
| Class R2 shares | ||||
| Sold | 12,466 | $372,079 | 120,982 | $4,127,774 |
| Distributions reinvested | 6,014 | 170,086 | 1,813 | 60,331 |
| Repurchased | (289,761) | (9,017,971) | (58,238) | (1,944,693) |
| Net increase (decrease) | (271,281) | $(8,475,806) | 64,557 | $2,243,412 |
| 32 | JOHN HANCOCK Classic Value Fund | ANNUAL REPORT |
| Year Ended 10-31-19 | Year Ended 10-31-18 | |||
| Shares | Amount | Shares | Amount | |
| Class R3 shares | ||||
| Sold | 5,592 | $172,258 | 7,362 | $253,881 |
| Distributions reinvested | 974 | 27,552 | 293 | 9,760 |
| Repurchased | (31,379) | (982,788) | (6,046) | (204,359) |
| Net increase (decrease) | (24,813) | $(782,978) | 1,609 | $59,282 |
| Class R4 shares1 | ||||
| Repurchased | (2,224) | $(70,815) | — | — |
| Net decrease | (2,224) | $(70,815) | — | — |
| Class R5 shares | ||||
| Sold | 1,418 | $43,434 | 313 | $10,451 |
| Distributions reinvested | 60 | 1,701 | 26 | 869 |
| Repurchased | (868) | (26,785) | (230) | (7,723) |
| Net increase | 610 | $18,350 | 109 | $3,597 |
| Class R6 shares | ||||
| Sold | 1,798,177 | $54,768,972 | 14,035,414 | $459,838,473 |
| Distributions reinvested | 334,673 | 9,484,641 | 135,322 | 4,515,692 |
| Repurchased | (2,825,502) | (86,475,610) | (2,070,964) | (69,891,042) |
| Net increase (decrease) | (692,652) | $(22,221,997) | 12,099,772 | $394,463,123 |
| Total net increase (decrease) | (4,126,358) | $(139,528,741) | 4,171,468 | $140,624,274 |
| 1 | All Class R4 shares were redeemed on 10-29-19. |
| Dividends and distributions | |||||||||
| Affiliate | Beginning share amount | Shares purchased | Shares sold | Ending share amount | Income distributions received | Capital gain distributions received | Realized gain (loss) | Change in unrealized appreciation (depreciation) | Ending value |
| John Hancock Collateral Trust* | — | 17,331,668 | (17,331,668) | — | — | — | $5,628 | — | — |
| * | Refer to the Securities lending note within Note 2 for details regarding this investment. |
| ANNUAL REPORT | JOHN HANCOCK Classic Value Fund | 33 |
| 34 | JOHN HANCOCK CLASSIC VALUE FUND | ANNUAL REPORT |
| Tax information (Unaudited) |
| ANNUAL REPORT | JOHN HANCOCK CLASSIC VALUE FUND | 35 |
Continuation of Investment Advisory and Subadvisory Agreements
Evaluation of Advisory and Subadvisory Agreements by the Board of Trustees
This section describes the evaluation by the Board of Trustees (the Board) of John Hancock Capital Series (the Trust) of the Advisory Agreement (the Advisory Agreement) with John Hancock Investment Management LLC (the Advisor, formerly known as "John Hancock Advisers, LLC") and the Subadvisory Agreement (the Subadvisory Agreement) with Pzena Investment Management, LLC (the Subadvisor), for John Hancock Classic Value Fund (the fund). The Advisory Agreement and Subadvisory Agreement are collectively referred to as the Agreements. Prior to the June23-26, 2019 in-person meeting at which the Agreements were approved, the Board also discussed and considered information regarding the proposed continuation of the Agreements at an in-person meeting held on May 28-30, 2019.
Approval of Advisory and Subadvisory Agreements
At in-person meetings held on June 23-26, 2019, the Board, including the Trustees who are not parties to any Agreement or considered to be interested persons of the Trust under the Investment Company Act of 1940, as amended (the 1940 Act) (the Independent Trustees), reapproved for an annual period the continuation of the Advisory Agreement between the Trust and the Advisor and the Subadvisory Agreement between the Advisor and the Subadvisor with respect to the fund.
In considering the Advisory Agreement and the Subadvisory Agreement, the Board received in advance of the meetings a variety of materials relating to the fund, the Advisor and the Subadvisor, including comparative performance, fee and expense information for a peer group of similar funds prepared by an independent third-party provider of fund data, performance information for an applicable benchmark index; and, with respect to the Subadvisor, comparative performance information for comparably managed accounts, as applicable, and other information provided by the Advisor and the Subadvisor regarding the nature, extent and quality of services provided by the Advisor and the Subadvisor under their respective Agreements, as well as information regarding the Advisor's revenues and costs of providing services to the fund and any compensation paid to affiliates of the Advisor. At the meetings at which the renewal of the Advisory Agreement and Subadvisory Agreement are considered, particular focus is given to information concerning fund performance, comparability of fees and total expenses, and profitability. However, the Board noted that the evaluation process with respect to the Advisor and the Subadvisor is an ongoing one. In this regard, the Board also took into account discussions with management and information provided to the Board (including its various committees) at prior meetings with respect to the services provided by the Advisor and the Subadvisor to the fund, including quarterly performance reports prepared by management containing reviews of investment results and prior presentations from the Subadvisor with respect to the fund. The information received and considered by the Board in connection with the May and June meetings and throughout the year was both written and oral. The Board also considered the nature, quality, and extent of non-advisory services, if any, to be provided to the fund by the Advisor's affiliates, including distribution services. The Board considered the Advisory Agreement and the Subadvisory Agreement separately in the course of its review. In doing so, the Board noted the respective roles of the Advisor and Subadvisor in providing services to the fund.
Throughout the process, the Board asked questions of and requested additional information from management. The Board is assisted by counsel for the Trust and the Independent Trustees are also separately assisted by independent legal counsel throughout the process. The Independent Trustees also received a memorandum from their independent legal counsel discussing the legal standards for their consideration of the proposed continuation of the Agreements and discussed the proposed continuation of the Agreements in private sessions with their independent legal counsel at which no representatives of management were present.
Approval of Advisory Agreement
In approving the Advisory Agreement with respect to the fund, the Board, including the Independent Trustees, considered a variety of factors, including those discussed below. The Board also considered other factors (including conditions and trends prevailing generally in the economy, the securities markets, and the industry) and did not treat any single factor as determinative, and each Trustee may have attributed different weights to different factors. The Board's conclusions may be based in part on its consideration of the advisory and subadvisory arrangements in prior years and on the Board's ongoing regular review of fund performance and operations throughout the year.
Nature, extent, and quality of services. Among the information received by the Board from the Advisor relating to the nature, extent, and quality of services provided to the fund, the Board reviewed information provided by the Advisor relating to its operations and personnel, descriptions of its organizational and management structure, and information regarding the Advisor's compliance and regulatory history, including its Form ADV. The Board also noted that on a regular basis it receives and reviews information from the Trust's Chief Compliance Officer (CCO) regarding the fund's compliance policies and procedures established pursuant to Rule 38a-1 under the 1940 Act. The Board observed that the scope of services provided by the Advisor, and of the undertakings required of the Advisor in connection with those services, including maintaining and monitoring its own and the fund's compliance programs, risk management programs, liquidity management programs and cybersecurity programs, had expanded over time as a result of regulatory, market and other developments. The Board considered that the Advisor is responsible for the management of the day-to-day operations of the fund, including, but not limited to, general supervision of and coordination of the services provided by the Subadvisor, and is also responsible for monitoring and reviewing the activities of the Subadvisor and other third-party service providers. The Board also considered the significant risks assumed by the Advisor in connection with the services provided to the fund including entrepreneurial risk in sponsoring new funds and ongoing risks including investment, operational, enterprise, litigation, regulatory and compliance risks with respect to all funds.
In considering the nature, extent, and quality of the services provided by the Advisor, the Trustees also took into account their knowledge of the Advisor's management and the quality of the performance of the Advisor's duties, through Board meetings, discussions and reports during the preceding year and through each Trustee's experience as a Trustee of the Trust and of the other trusts in the John Hancock group of funds complex (the John Hancock Fund Complex).
In the course of their deliberations regarding the Advisory Agreement, the Board considered, among other things:
| (e) | the financial condition of the Advisor and whether it has the financial wherewithal to provide a high level and quality of services to the fund; | |||||||
| (f) | the Advisor's initiatives intended to improve various aspects of the Trust's operations and investor experience with the fund; and | |||||||
| (g) | the Advisor's reputation and experience in serving as an investment advisor to the Trust and the benefit to shareholders of investing in funds that are part of a family of funds offering a variety of investments. |
The Board concluded that the Advisor may reasonably be expected to continue to provide a high quality of services under the Advisory Agreement with respect to the fund.
Investment performance. In considering the fund's performance, the Board noted that it reviews at its regularly scheduled meetings information about the fund's performance results. In connection with the consideration of the Advisory Agreement, the Board:
| (a) | reviewed information prepared by management regarding the fund's performance; | |
| (b) | considered the comparative performance of an applicable benchmark index; | |
| (c) | considered the performance of comparable funds, if any, as included in the report prepared by an independent third-party provider of fund data; and | |
| (d) | took into account the Advisor's analysis of the fund's performance and its plans and recommendations regarding the Trust's subadvisory arrangements generally. |
The Board noted that while it found the data provided by the independent third-party generally useful it recognized its limitations, including in particular that the data may vary depending on the end date selected and the results of the performance comparisons may vary depending on the selection of the peer group. The Board noted that the fund underperformed its benchmark index and peer group average for the one-, three- and five-year periods ended December 31, 2018 and outperformed its benchmark index and peer group average for the ten-year period ended December 31, 2018. The Board took into account management's discussion of the fund's performance, including the favorable performance relative to the benchmark index and peer group average for the ten-year period. The Board also took into account management's discussion of the reasons for the fund's recent underperformance. The Board concluded that the fund's performance is being monitored and reasonably addressed, where appropriate.
Fees and expenses. The Board reviewed comparative information prepared by an independent third-party provider of fund data, including, among other data, the fund's contractual and net management fees (and subadvisory fees, to the extent available) and total expenses as compared to similarly situated investment companies deemed to be comparable to the fund in light of the nature, extent and quality of the management and advisory and subadvisory services provided by the Advisor and the Subadvisor. The Board considered the fund's ranking within a smaller group of peer funds chosen by the independent third-party provider, as well as the fund's ranking within a broader group of funds. In comparing the fund's contractual and net management fees to those of comparable funds, the Board noted that such fees include both advisory and administrative costs. The Board noted that net management fees and net total expenses for the fund are higher than the peer group median.
The Board took into account management's discussion of the fund's expenses. The Board also took into account management's discussion with respect to the overall management fee and the fees of the Subadvisor, including the amount of the advisory fee retained by the Advisor after payment of the subadvisory fee, in each case in light of the services rendered for those amounts and the risks undertaken by the Advisor. The Board also noted that the Advisor pays the subadvisory fee, and that such fees are negotiated at arm's length with respect to the Subadvisor. In addition,
the Board took into account that management had agreed to implement an overall fee waiver across the complex, including the fund, which is discussed further below. The Board also noted actions taken over the past several years to reduce the fund's operating expenses. The Board also noted that, in addition, the Advisor is currently waiving fees and/or reimbursing expenses with respect to the fund and that the fund has breakpoints in its contractual management fee schedule that reduce management fees as assets increase. The Board also noted that the fund's distributor, an affiliate of the Advisor, has agreed to waive a portion of its Rule 12b-1 fee for a share class of the fund. The Board noted that the fund has a voluntary fee waiver and/or expense reimbursement, which reduces certain expenses of the fund. The Board reviewed information provided by the Advisor concerning the investment advisory fee charged by the Advisor or one of its advisory affiliates to other clients (including other funds in the John Hancock Fund Complex) having similar investment mandates, if any. The Board considered any differences between the Advisor's and Subadvisor's services to the fund and the services they provide to other comparable clients or funds. The Board concluded that the advisory fee paid with respect to the fund is reasonable in light of the nature, extent and quality of the services provided to the fund under the Advisory Agreement.
Profitability/Fall out benefits. In considering the costs of the services to be provided and the profits to be realized by the Advisor and its affiliates from the Advisor's relationship with the Trust, the Board:
| (a) | reviewed financial information of the Advisor; | |
| (b) | reviewed and considered information presented by the Advisor regarding the net profitability to the Advisor and its affiliates with respect to the fund; | |
| (c) | received and reviewed profitability information with respect to the John Hancock Fund Complex as a whole and with respect to the fund; | |
| (d) | received information with respect to the Advisor's allocation methodologies used in preparing the profitability data and considered that the Advisor hired an independent third-party consultant to provide an analysis of the Advisor's allocation methodologies; | |
| (e) | considered that the John Hancock insurance companies that are affiliates of the Advisor, as shareholders of the Trust directly or through their separate accounts, receive certain tax credits or deductions relating to foreign taxes paid and dividends received by certain funds of the Trust and noted that these tax benefits, which are not available to participants in qualified retirement plans under applicable income tax law, are reflected in the profitability information reviewed by the Board; | |
| (f) | considered that the Advisor also provides administrative services to the fund on a cost basis pursuant to an administrative services agreement; | |
| (g) | noted that affiliates of the Advisor provide transfer agency services and distribution services to the fund, and that the fund's distributor also receives Rule 12b-1 payments to support distribution of the fund; | |
| (h) | noted that the Advisor also derives reputational and other indirect benefits from providing advisory services to the fund; | |
(i) | noted that the subadvisory fee for the fund is paid by the Advisor and is negotiated at arm's length; | |
(j) | considered the Advisor's ongoing costs and expenditures necessary to improve services, meet new regulatory and compliance requirements, and adapt to other challenges impacting the fund industry; and | |
(k) | considered that the Advisor should be entitled to earn a reasonable level of profits in exchange for the level of services it provides to the fund and the risks that it assumes as Advisor, including entrepreneurial, operational, reputational, litigation and regulatory risk. |
Based upon its review, the Board concluded that the level of profitability, if any, of the Advisor and its affiliates from their relationship with the fund was reasonable and not excessive.
Economies of scale. In considering the extent to which economies of scale would be realized as the fund grows and whether fee levels reflect these economies of scale for the benefit of fund shareholders, the Board:
| (a) | considered that the Advisor has contractually agreed to waive a portion of its management fee for certain funds of the John Hancock Fund Complex, including the fund (the participating portfolios) or otherwise reimburse the expenses of the participating portfolios (the reimbursement). This waiver is based upon aggregate net assets of all the participating portfolios. The amount of the reimbursement is calculated daily and allocated among all the participating portfolios in proportion to the daily net assets of each fund; | |
| (b) | reviewed the fund's advisory fee structure and concluded that: (i) the fund's fee structure contains breakpoints at the subadvisory fee level and that such breakpoints are reflected as breakpoints in the advisory fees for the fund; and (ii) although economies of scale cannot be measured with precision, these arrangements permit shareholders of the fund to benefit from economies of scale if the fund grows. The Board also took into account management's discussion of the fund's advisory fee structure; and | |
| (c) | the Board also considered the effect of the fund's growth in size on its performance and fees. The Board also noted that if the fund's assets increase over time, the fund may realize other economies of scale. |
Approval of Subadvisory Agreement
In making its determination with respect to approval of the Subadvisory Agreement, the Board reviewed:
| (1) | information relating to the Subadvisor's business, including current subadvisory services to the Trust (and other funds in the John Hancock Fund Complex); | |
| (2) | the historical and current performance of the fund and comparative performance information relating to an applicable benchmark index and comparable funds; | |
| (3) | the subadvisory fee for the fund, including any breakpoints, and to the extent available, comparable fee information prepared by an independent third-party provider of fund data; and | |
| (4) | information relating to the nature and scope of any material relationships and their significance to the Trust's Advisor and Subadvisor. |
Nature, extent, and quality of services. With respect to the services provided by the Subadvisor, the Board received information provided to the Board by the Subadvisor, including the Subadvisor's Form ADV, as well as took into account information presented throughout the past year. The Board considered the Subadvisor's current level of staffing and its overall resources, as well as received information relating to the Subadvisor's compensation program. The Board reviewed the Subadvisor's history and investment experience, as well as information regarding the qualifications, background, and responsibilities of the Subadvisor's investment and compliance personnel who provide services to the fund. The Board also considered, among other things, the Subadvisor's compliance program and any disciplinary history. The Board also considered the Subadvisor's risk assessment and monitoring process. The Board reviewed the Subadvisor's regulatory history, including whether it was involved in any regulatory actions or investigations as well as material litigation, and any settlements and amelioratory actions undertaken, as appropriate. The Board noted that the Advisor conducts regular, periodic reviews of the Subadvisor and its operations, including regarding investment processes and organizational and staffing matters. The Board also noted that the Trust's CCO and his staff conduct regular, periodic compliance reviews with the Subadvisor and present reports to the Independent
Trustees regarding the same, which includes evaluating the regulatory compliance systems of the Subadvisor and procedures reasonably designed to assure compliance with the federal securities laws. The Board also took into account the financial condition of the Subadvisor.
The Board considered the Subadvisor's investment process and philosophy. The Board took into account that the Subadvisor's responsibilities include the development and maintenance of an investment program for the fund that is consistent with the fund's investment objective, the selection of investment securities and the placement of orders for the purchase and sale of such securities, as well as the implementation of compliance controls related to performance of these services. The Board also received information with respect to the Subadvisor's brokerage policies and practices, including with respect to best execution and soft dollars.
Subadvisor compensation. In considering the cost of services to be provided by the Subadvisor and the profitability to the Subadvisor of its relationship with the fund, the Board noted that the fees under the Subadvisory Agreement are paid by the Advisor and not the fund.
The Board also relied on the ability of the Advisor to negotiate the Subadvisory Agreement with the Subadvisor, which is not affiliated with the Advisor, and the fees thereunder at arm's length. As a result, the costs of the services to be provided and the profits to be realized by the Subadvisor from its relationship with the Trust were not a material factor in the Board's consideration of the Subadvisory Agreement.
The Board also received information regarding the nature and scope (including their significance to the Advisor and its affiliates and to the Subadvisor) of any material relationships with respect to the Subadvisor, which include arrangements in which the Subadvisor or its affiliates provide advisory, distribution, or management services in connection with financial products sponsored by the Advisor or its affiliates, and may include other registered investment companies, a 529 education savings plan, managed separate accounts and exempt group annuity contracts sold to qualified plans. The Board also received information and took into account any other potential conflicts of interest the Advisor might have in connection with the Subadvisory Agreement.
In addition, the Board considered other potential indirect benefits that the Subadvisor and its affiliates may receive from the Subadvisor's relationship with the fund, such as the opportunity to provide advisory services to additional funds in the John Hancock Fund Complex and reputational benefits.
Subadvisory fees. The Board considered that the fund pays an advisory fee to the Advisor and that, in turn, the Advisor pays a subadvisory fee to the Subadvisor. As noted above, the Board also considered the fund's subadvisory fees as compared to similarly situated investment companies deemed to be comparable to the fund as included in the report prepared by the independent third-party provider of fund data, to the extent available. The Board noted that the limited size of the Lipper peer group was not sufficient for comparative purposes. The Board also took into account the subadvisory fees paid by the Advisor to the Subadvisor with respect to the fund and compared them to fees charged by the Subadvisor to manage other subadvised portfolios and portfolios not subject to regulation under the 1940 Act, as applicable.
Subadvisor performance. As noted above, the Board considered the fund's performance as compared to the fund's peer group and the benchmark index and noted that the Board reviews information about the fund's performance results at its regularly scheduled meetings. The Board noted the Advisor's expertise and resources in monitoring the performance, investment style and risk-adjusted performance of the Subadvisor. The Board was mindful of the Advisor's focus on the Subadvisor's performance. The Board also noted the Subadvisor's long-term performance record for similar accounts, as applicable.
The Board's decision to approve the Subadvisory Agreement was based on a number of determinations, including the following:
| (1) | the Subadvisor has extensive experience and demonstrated skills as a manager; | |
| (2) | the performance of the fund is being monitored and reasonably addressed, where appropriate; | |
| (3) | the subadvisory fee is reasonable in relation to the level and quality of services being provided under the Subadvisory Agreement; and | |
| (4) | noted that the subadvisory fees are paid by the Advisor not the fund and that the subadvisory fee breakpoints are reflected as breakpoints in the advisory fees for the fund in order to permit shareholders to benefit from economies of scale if the fund grows. | |
| * * * | ||
Based on the Board's evaluation of all factors that the Board deemed to be material, including those factors described above, the Board, including the Independent Trustees, concluded that renewal of the Advisory Agreement and the Subadvisory Agreement would be in the best interest of the fund and its shareholders. Accordingly, the Board, and the Independent Trustees voting separately, approved the Advisory Agreement and Subadvisory Agreement for an additional one-year period.
This chart provides information about the Trustees and Officers who oversee your John Hancock fund. Officers elected by the Trustees manage the day-to-day operations of the fund and execute policies formulated by the Trustees.
Independent Trustees
| Name, year of birth Position(s) held with Trust Principal occupation(s) and other directorships during past 5 years | Trustee of the Trust since1 | Number of John Hancock funds overseen by Trustee |
| Hassell H. McClellan, Born: 1945 | 2012 | 207 |
| Trustee and Chairperson of the Board Director/Trustee, Virtus Funds (since 2008); Director, The Barnes Group (since 2010); Associate Professor, The Wallace E. Carroll School of Management, Boston College (retired 2013). Trustee (since 2005) and Chairperson of the Board (since 2017) of various trusts within the John Hancock Fund Complex. | ||
| Charles L. Bardelis,2 Born: 1941 | 2012 | 207 |
| Trustee Director, Island Commuter Corp. (marine transport). Trustee of various trusts within the John Hancock Fund Complex (since 1988). | ||
| James R. Boyle,Born: 1959 | 2015 | 207 |
| Trustee Chief Executive Officer, Foresters Financial (since 2018); Chairman and Chief Executive Officer, Zillion Group, Inc. (formerly HealthFleet, Inc.) (healthcare) (2014-2018); Executive Vice President and Chief Executive Officer, U.S. Life Insurance Division of Genworth Financial, Inc. (insurance) (January 2014-July 2014); Senior Executive Vice President, Manulife Financial, President and Chief Executive Officer, John Hancock (1999-2012); Chairman and Director, John Hancock Investment Management LLC, John Hancock Investment Management Distributors LLC, and John Hancock Variable Trust Advisers LLC (2005-2010). Trustee of various trusts within the John Hancock Fund Complex (2005-2014 and since 2015). | ||
| Peter S. Burgess,2 Born: 1942 | 2012 | 207 |
| Trustee Consultant (financial, accounting, and auditing matters) (since 1999); Certified Public Accountant; Partner, Arthur Andersen (independent public accounting firm) (prior to 1999); Director, Lincoln Educational Services Corporation (since 2004); Director, Symetra Financial Corporation (2010-2016); Director, PMA Capital Corporation (2004-2010). Trustee of various trusts within the John Hancock Fund Complex (since 2005). | ||
| William H. Cunningham, Born: 1944 | 2005 | 207 |
| Trustee Professor, University of Texas, Austin, Texas (since 1971); former Chancellor, University of Texas System and former President of the University of Texas, Austin, Texas; Chairman (since 2009) and Director (since 2006), Lincoln National Corporation (insurance); Director, Southwest Airlines (since 2000); former Director, LIN Television (2009-2014). Trustee of various trusts within the John Hancock Fund Complex (since 1986). | ||
| Grace K. Fey, Born: 1946 | 2012 | 207 |
| Trustee Chief Executive Officer, Grace Fey Advisors (since 2007); Director and Executive Vice President, Frontier Capital Management Company (1988-2007); Director, Fiduciary Trust (since 2009). Trustee of various trusts within the John Hancock Fund Complex (since 2008). | ||
Independent Trustees (continued)
| Name, year of birth Position(s) held with Trust Principal occupation(s) and other directorships during past 5 years | Trustee of the Trust since1 | Number of John Hancock funds overseen by Trustee |
| Deborah C. Jackson, Born: 1952 | 2008 | 207 |
| Trustee President, Cambridge College, Cambridge, Massachusetts (since 2011); Board of Directors, Massachusetts Women's Forum (since 2018); Board of Directors, National Association of Corporate Directors/New England (since 2015); Board of Directors, Association of Independent Colleges and Universities of Massachusetts (2014-2017); Chief Executive Officer, American Red Cross of Massachusetts Bay (2002-2011); Board of Directors of Eastern Bank Corporation (since 2001); Board of Directors of Eastern Bank Charitable Foundation (since 2001); Board of Directors of American Student Assistance Corporation (1996-2009); Board of Directors of Boston Stock Exchange (2002-2008); Board of Directors of Harvard Pilgrim Healthcare (health benefits company) (2007-2011). Trustee of various trusts within the John Hancock Fund Complex (since 2008). | ||
| James M. Oates,2Born: 1946 | 2012 | 207 |
| Trustee Managing Director, Wydown Group (financial consulting firm) (since 1994); Chairman and Director, Emerson Investment Management, Inc. (2000-2015); Independent Chairman, Hudson Castle Group, Inc. (formerly IBEX Capital Markets, Inc.) (financial services company) (1997-2011); Director, Stifel Financial (since 1996); Director, Investor Financial Services Corporation (1995-2007); Director, Connecticut River Bancorp (1998-2014); Director/Trustee, Virtus Funds (since 1988). Trustee (since 2004) and Chairperson of the Board (2005-2016) of various trusts within the John Hancock Fund Complex. | ||
| Steven R. Pruchansky, Born: 1944 | 2005 | 207 |
| Trustee and Vice Chairperson of the Board Managing Director, Pru Realty (since 2017); Chairman and Chief Executive Officer, Greenscapes of Southwest Florida, Inc. (since 2014); Director and President, Greenscapes of Southwest Florida, Inc. (until 2000); Member, Board of Advisors, First American Bank (until 2010); Managing Director, Jon James, LLC (real estate) (since 2000); Partner, Right Funding, LLC (2014-2017); Director, First Signature Bank & Trust Company (until 1991); Director, Mast Realty Trust (until 1994); President, Maxwell Building Corp. (until 1991). Trustee (since 1992), Chairperson of the Board (2011-2012), and Vice Chairperson of the Board (since 2012) of various trusts within the John Hancock Fund Complex. | ||
| Gregory A. Russo, Born: 1949 | 2009 | 207 |
| Trustee Director and Audit Committee Chairman (since 2012), and Member, Audit Committee and Finance Committee (since 2011), NCH Healthcare System, Inc. (holding company for multi-entity healthcare system); Director and Member (2012-2018) and Finance Committee Chairman (2014-2018), The Moorings, Inc. (nonprofit continuing care community); Vice Chairman, Risk & Regulatory Matters, KPMG LLP (KPMG) (2002-2006); Vice Chairman, Industrial Markets, KPMG (1998-2002); Chairman and Treasurer, Westchester County, New York, Chamber of Commerce (1986-1992); Director, Treasurer, and Chairman of Audit and Finance Committees, Putnam Hospital Center (1989-1995); Director and Chairman of Fundraising Campaign, United Way of Westchester and Putnam Counties, New York (1990-1995). Trustee of various trusts within the John Hancock Fund Complex (since 2008). | ||
Non-Independent Trustees3
| Name, year of birth Position(s) held with Trust Principal occupation(s) and other directorships during past 5 years | Trustee of the Trust since1 | Number of John Hancock funds overseen by Trustee |
| Andrew G. Arnott, Born: 1971 | 2017 | 207 |
| President and Non-Independent Trustee Head of Wealth and Asset Management, United States and Europe, for John Hancock and Manulife (since 2018); Executive Vice President, John Hancock Financial Services (since 2009, including prior positions); Director and Executive Vice President, John Hancock Investment Management LLC (since 2005, including prior positions); Director and Executive Vice President, John Hancock Variable Trust Advisers LLC (since 2006, including prior positions); President, John Hancock Investment Management Distributors LLC (since 2004, including prior positions); President of various trusts within the John Hancock Fund Complex (since 2007, including prior positions). Trustee of various trusts within the John Hancock Fund Complex (since 2017). | ||
| Marianne Harrison, Born: 1963 | 2018 | 207 |
| Non-Independent Trustee President and CEO, John Hancock (since 2017); President and CEO, Manulife Canadian Division (2013-2017); Member, Board of Directors, CAE Inc. (since 2019); Member, Board of Directors, MA Competitive Partnership Board (since 2018); Member, Board of Directors, American Council of Life Insurers (ACLI) (since 2018); Member, Board of Directors, Communitech, an industry-led innovation center that fosters technology companies in Canada (2017-2019); Member, Board of Directors, Manulife Assurance Canada (2015-2017); Board Member, St. Mary's General Hospital Foundation (2014-2017); Member, Board of Directors, Manulife Bank of Canada (2013-2017); Member, Standing Committee of the Canadian Life & Health Assurance Association (2013-2017); Member, Board of Directors, John Hancock USA, John Hancock Life & Health, John Hancock New York (2012-2013). Trustee of various trusts within the John Hancock Fund Complex (since 2018). | ||
Principal officers who are not Trustees
| Name, year of birth Position(s) held with Trust Principal occupation(s) during past 5 years | Officer of the Trust since |
| Francis V. Knox, Jr.,Born: 1947 | 2005 |
| Chief Compliance Officer Vice President, John Hancock Financial Services (since 2005); Chief Compliance Officer, various trusts within the John Hancock Fund Complex, John Hancock Investment Management LLC, and John Hancock Variable Trust Advisers LLC (since 2005). | |
| Charles A. Rizzo, Born: 1957 | 2007 |
| Chief Financial Officer Vice President, John Hancock Financial Services (since 2008); Senior Vice President, John Hancock Investment Management LLC and John Hancock Variable Trust Advisers LLC (since 2008); Chief Financial Officer of various trusts within the John Hancock Fund Complex (since 2007). | |
| Salvatore Schiavone, Born: 1965 | 2010 |
| Treasurer Assistant Vice President, John Hancock Financial Services (since 2007); Vice President, John Hancock Investment Management LLC and John Hancock Variable Trust Advisers LLC (since 2007); Treasurer of various trusts within the John Hancock Fund Complex (since 2007, including prior positions). | |
Principal officers who are notTrustees (continued)
| Name, year of birth Position(s) held with Trust Principal occupation(s) during past 5 years | Officer of the Trust since |
| Christopher (Kit) Sechler,Born: 1973 | 2018 |
| Chief Legal Officer and Secretary Vice President and Deputy Chief Counsel, John Hancock Investments (since 2015); Assistant Vice President and Senior Counsel (2009-2015), John Hancock Investment Management; Chief Legal Officer and Secretary of various trusts within the John Hancock Fund Complex (since 2018); Assistant Secretary of John Hancock Investment Management LLC and John Hancock Variable Trust Advisers LLC (since 2009). | |
The business address for all Trustees and Officers is 200 Berkeley Street, Boston, Massachusetts 02116-5023.
The Statement of Additional Information of the fund includes additional information about members of the Board of Trustees of the Trust and is available without charge, upon request, by calling 800-225-5291.
| 1 | Each Trustee holds office until his or her successor is elected and qualified, or until the Trustee's death, retirement, resignation, or removal. Mr. Boyle has served as Trustee at various times prior to the date listed in the table. |
| 2 | Member of the Audit Committee. |
| 3 | The Trustee is a Non-Independent Trustee due to current or former positions with the Advisor and certain affiliates. |
Trustees Hassell H. McClellan,Chairperson Officers Andrew G. Arnott Francis V. Knox, Jr. Charles A. Rizzo Salvatore Schiavone Christopher (Kit) Sechler | Investment advisor John Hancock Investment Management LLC Subadvisor Pzena Investment Management, LLC Portfolio Managers John J. Flynn Principal distributor John Hancock Investment Management Distributors LLC Custodian State Street Bank and Trust Company Transfer agent John Hancock Signature Services, Inc. Legal counsel K&L Gates LLP Independent registered public accounting firm PricewaterhouseCoopers LLP |
* Member of the Audit Committee
† Non-Independent Trustee
The fund's proxy voting policies and procedures, as well as the fund proxy voting record for the most recent twelve-month period ended June 30, are available free of charge on the Securities and Exchange Commission (SEC) website at sec.gov or on our website.
All of the fund's holdings as of the end of the third month of every fiscal quarter are filed with the SEC on Form N-PORT within 60 days of the end of the fiscal quarter. The fund's Form N-PORT filings are available on our website and the SEC's website, sec.gov.
We make this information on your fund, as well asmonthly portfolio holdings, and other fund details available on our website at jhinvestments.com or by calling 800-225-5291.
| You can also contact us: | |||
| 800-225-5291 jhinvestments.com | Regular mail: John Hancock Signature Services, Inc. | Express mail: John Hancock Signature Services, Inc. | |
John Hancock family of funds
DOMESTIC EQUITY FUNDS Blue Chip Growth Classic Value Disciplined Value Disciplined Value Mid Cap Equity Income Financial Industries Fundamental All Cap Core Fundamental Large Cap Core New Opportunities Regional Bank Small Cap Core Small Cap Growth Small Cap Value U.S. Global Leaders Growth U.S. Quality Growth GLOBAL AND INTERNATIONAL EQUITY FUNDS Disciplined Value International Emerging Markets Emerging Markets Equity Fundamental Global Franchise Global Equity Global Shareholder Yield Global Thematic Opportunities International Dynamic Growth International Growth International Small Company | INCOME FUNDS Bond California Tax-Free Income Emerging Markets Debt Floating Rate Income Government Income High Yield High Yield Municipal Bond Income Investment Grade Bond Money Market Short Duration Bond Short Duration Credit Opportunities Strategic Income Opportunities Tax-Free Bond ALTERNATIVE AND SPECIALTY FUNDS Absolute Return Currency Alternative Asset Allocation Alternative Risk Premia Disciplined Alternative Yield Diversified Macro Infrastructure Multi-Asset Absolute Return Seaport Long/Short |
A fund's investment objectives, risks, charges, and expenses should be considered carefully before investing. The prospectus contains this and other important information about the fund. To obtain a prospectus, contact your financial professional, call John Hancock Investment Management at 800-225-5291, or visit our website at jhinvestments.com. Please read the prospectus carefully before investing or sending money.
ASSET ALLOCATION Balanced Income Allocation Multi-Index Lifetime Portfolios Multi-Index Preservation Portfolios Multimanager Lifestyle Portfolios Multimanager Lifetime Portfolios Retirement Income 2040 EXCHANGE-TRADED FUNDS John Hancock Multifactor Consumer Discretionary ETF John Hancock Multifactor Consumer Staples ETF John Hancock Multifactor Developed International ETF John Hancock Multifactor Emerging Markets ETF John Hancock Multifactor Energy ETF John Hancock Multifactor Financials ETF John Hancock Multifactor Healthcare ETF John Hancock Multifactor Industrials ETF John Hancock Multifactor Large Cap ETF John Hancock Multifactor Materials ETF John Hancock Multifactor Media and John Hancock Multifactor Mid Cap ETF John Hancock Multifactor Small Cap ETF John Hancock Multifactor Technology ETF John Hancock Multifactor Utilities ETF | ENVIRONMENTAL, SOCIAL, AND ESG All Cap Core ESG Core Bond ESG International Equity ESG Large Cap Core CLOSED-END FUNDS Financial Opportunities Hedged Equity & Income Income Securities Trust Investors Trust Preferred Income Preferred Income II Preferred Income III Premium Dividend Tax-Advantaged Dividend Income Tax-Advantaged Global Shareholder Yield |
John Hancock Multifactor ETF shares are bought and sold at market price (not NAV), and are not individually redeemed
from the fund. Brokerage commissions will reduce returns.
John Hancock ETFs are distributed by Foreside Fund Services, LLC, and are subadvised by Dimensional Fund Advisors LP.
Foreside is not affiliated with John Hancock Investment Management Distributors LLC or Dimensional Fund Advisors LP.
Dimensional Fund Advisors LP receives compensation from John Hancock in connection with licensing rights to the
John Hancock Dimensional indexes. Dimensional Fund Advisors LP does not sponsor, endorse, or sell, and makes no
representation as to the advisability of investing in, John Hancock Multifactor ETFs.
John Hancock Investment Management
A trusted brand
John Hancock Investment Management is a premier asset manager
representing one of America's most trusted brands, with a heritage of
financial stewardship dating back to 1862. Helping our shareholders
pursue their financial goals is at the core of everything we do. It's why
we support the role of professional financial advice and operate with
the highest standards of conduct and integrity.
A better way to invest
We serve investors globally through a unique multimanager approach:
We search the world to find proven portfolio teams with specialized
expertise for every strategy we offer, then we apply robust investment
oversight to ensure they continue to meet our uncompromising
standards and serve the best interests of our shareholders.
Results for investors
Our unique approach to asset management enables us to provide
a diverse set of investments backed by some of the world's best
managers, along with strong risk-adjusted returns across asset classes.
![]()
John Hancock Investment Management Distributors LLC n Member FINRA, SIPC
200 Berkeley Street n Boston, MA 02116-5010 n 800-225-5291 n jhinvestments.com
This report is for the information of the shareholders of John Hancock Classic Value Fund. It is not authorized for distribution to prospective investors unless preceded or accompanied by a prospectus.
| MF1003833 | 38A 10/19 12/19 |
ITEM 2. CODE OF ETHICS.
As of the end of the period, October 31, 2019, the registrant has adopted a code of ethics, as defined in Item 2 of Form N-CSR, that applies to its Chief Executive Officer, Chief Financial Officer and Treasurer (respectively, the principal executive officer, the principal financial officer and the principal accounting officer, the “Senior Financial Officers”). A copy of the code of ethics is filed as an exhibit to this Form N-CSR.
ITEM 3. AUDIT COMMITTEE FINANCIAL EXPERT.
Peter S. Burgess is the audit committee financial expert and is “independent”, pursuant to general instructions on Form N-CSR Item 3.
ITEM 4. PRINCIPAL ACCOUNTANT FEES AND SERVICES.
(a) Audit Fees
The aggregate fees billed for professional services rendered by the principal accountant for the audits of the registrant’s annual financial statements or services that are normally provided by the accountant in connection with statutory and regulatory filings or engagements amounted to the following for the fiscal years ended October 31, 2019 and 2018. These fees were billed to the registrant and were approved by the registrant’s audit committee.
| Fund | October 31, 2019 | October 31, 2018 |
| John Hancock Classic Value Fund | $34,159 | $37,337 |
| John Hancock U.S. Global Leaders Growth Fund | 32,095 | 35,368 |
| Total | $66,254 | $72,705 |
(b) Audit-Related Services
Audit-related service fees for assurance and related services by the principal accountant are billed to the registrant or to the registrant's investment adviser (not including any sub-adviser whose role is primarily portfolio management and is subcontracted with or overseen by another investment adviser), and any entity controlling, controlled by, or under common control with the adviser (“control affiliates”) that provides ongoing services to the registrant. The nature of the services provided was affiliated service provider internal controls reviews.
| Fund | October 31, 2019 | October 31, 2018 |
| John Hancock Classic Value Fund | $616 | $540 |
| John Hancock U.S. Global Leaders Growth Fund | 616 | 540 |
| Total | $1,232 | $1,080 |
In addition, amounts billed to control affiliates for service provider internal controls reviews were $116,467 and $110,200 for the fiscal years ended October 31, 2019 and 2018, respectively.
(c) Tax Fees
The aggregate fees billed for professional services rendered by the principal accountant for tax compliance, tax advice and tax planning (“tax fees”) amounted to the following for the fiscal years ended October 31, 2019 and 2018. The nature of the services comprising the tax fees was the review of the registrant’s tax returns and tax distribution requirements. These fees were billed to the registrant and were approved by the registrant’s audit committee.
| Fund | October 31, 2019 | October 31, 2018 |
| John Hancock Classic Value Fund | $3,837 | $3,725 |
| John Hancock U.S. Global Leaders Growth Fund | 3,837 | 3,725 |
| Total | $7,674 | $7,450 |
(d) All Other Fees
Other fees billed for professional services rendered by the principal accountant to the registrant or to the control affiliates for the fiscal years ended October 31, 2019 and 2018 amounted to the following:
| Fund | October 31, 2019 | October 31, 2018 |
| John Hancock Classic Value Fund | $84 | $239 |
| John Hancock U.S. Global Leaders Growth Fund | 1,584 | 239 |
| Total | $1,668 | $478 |
(e)(1) Audit Committee Pre-Approval Policies and Procedures:
The trust’s Audit Committee must pre-approve all audit and non-audit services provided by the independent registered public accounting firm (the “Auditor”) relating to the operations or financial reporting of the funds. Prior to the commencement of any audit or non-audit services to a fund, the Audit Committee reviews the services to determine whether they are appropriate and permissible under applicable law.
The trust’s Audit Committee has adopted policies and procedures to, among other purposes, provide a framework for the Committee’s consideration of audit-related and non-audit services by the Auditor. The policies and procedures require that any audit-related and non-audit service provided by the Auditor and any non-audit service provided by the Auditor to a fund service provider that relates directly to the operations and financial reporting of a fund are subject to approval by the Audit Committee before such service is provided. Audit-related services provided by the Auditor that are expected to exceed $25,000 per instance/per fund are subject to specific pre-approval by the Audit Committee. Tax services provided by the Auditor that are expected to exceed $30,000 per instance/per fund are subject to specific pre-approval by the Audit Committee.
All audit services, as well as the audit-related and non-audit services that are expected to exceed the amounts stated above, must be approved in advance of provision of the service by formal resolution of the Audit Committee. At the regularly scheduled Audit Committee meetings, the Committee reviews a report summarizing the services, including fees, provided by the Auditor.
(e)(2) Services approved pursuant to paragraph (c)(7)(i)(C) of Rule 2-01 of Regulation S-X:
Audit-Related Fees, Tax Fees and All Other Fees:
There were no amounts that were approved by the Audit Committee pursuant to the de minimis exception under Rule 2-01 of Regulation S-X.
(f) According to the registrant’s principal accountant, for the fiscal period ended October 31, 2019, the percentage of hours spent on the audit of the registrant's financial statements for the most recent fiscal year that were attributed to work performed by persons who were not full-time, permanent employees of principal accountant was less than 50%.
(g) The aggregate non-audit fees billed by the registrant's accountant for non- audit services rendered to the registrant and rendered to the registrant's control affiliates for the fiscal years ended October 31, 2019 and 2018 amounted to the following:
| Trust | October 31, 2019 | October 31, 2018 |
| John Hancock Capital Series | $967,560 | $2,064,999 |
(h) The audit committee of the registrant has considered the non-audit services provided by the registrant’s principal accountant(s) to the control affiliates and has determined that the services that were not pre-approved are compatible with maintaining the principal accountant(s)' independence.
ITEM 5. AUDIT COMMITTEE OF LISTED REGISTRANTS.
The registrant has a separately-designated standing audit committee comprised of independent trustees. The members of the audit committee are as follows:
Peter S. Burgess - Chairman
Charles L. Bardelis
Theron S. Hoffman
ITEM 6. SCHEDULE OF INVESTMENTS.
(a) Not applicable.
(b) Not applicable.
ITEM 7. DISCLOSURE OF PROXY VOTING POLICIES AND PROCEDURES FOR CLOSED-END MANAGEMENT INVESTMENT COMPANIES.
Not applicable.
ITEM 8. PORTFOLIO MANAGERS OF CLOSED-END MANAGEMENT INVESTMENT COMPANIES.
Not applicable.
ITEM 9. PURCHASES OF EQUITY SECURITIES BY CLOSED-END MANAGEMENT INVESTMENT COMPANY AND AFFILIATED PURCHASERS.
Not applicable.
ITEM 10. SUBMISSION OF MATTERS TO A VOTE OF SECURITY HOLDERS.
There were no material changes to previously disclosed John Hancock Funds – Nominating and Governance Committee Charter.
ITEM 11. CONTROLS AND PROCEDURES.
(a) Based upon their evaluation of the registrant's disclosure controls and procedures as conducted within 90 days of the filing date of this Form N-CSR, the registrant's principal executive officer and principal financial officer have concluded that those disclosure controls and procedures provide reasonable assurance that the material information required to be disclosed by the registrant on this report is recorded, processed, summarized and reported within the time periods specified in the Securities and Exchange Commission's rules and forms.
(b) There were no changes in the registrant's internal control over financial reporting that occurred during the period covered by this report that have materially affected, or are reasonably likely to materially affect, the registrant's internal control over financial reporting.
ITEM 12. DISCLOSURE OF SECURITIES LENDING ACTIVITIES FOR CLOSED-END MANAGEMENT INVESTMENT COMPANIES.
Not applicable.
ITEM 13. EXHIBITS.
(a)(1) Code of Ethics for Senior Financial Officers is attached.
(a)(2) Separate certifications for the registrant's principal executive officer and principal financial officer, as required by Section 302 of the Sarbanes-Oxley Act of 2002 and Rule 30a-2(a) under the Investment Company Act of 1940, are attached.
(b) Separate certifications for the registrant's principal executive officer and principal financial officer, as required by 18 U.S.C. Section 1350, as adopted pursuant to Section 906 of the Sarbanes-Oxley Act of 2002, and Rule 30a-2(b) under the Investment Company Act of 1940, are attached. The certifications furnished pursuant to this paragraph are not deemed to be "filed" for purposes of Section 18 of the Securities Exchange Act of 1934, or otherwise subject to the liability of that section. Such certifications are not deemed to be incorporated by reference into any filing under the Securities Act of 1933 or the Securities Exchange Act of 1934, except to the extent that the Registrant specifically incorporates them by reference.
(c)(1) Submission of Matters to a Vote of Security Holders is attached. See attached “John Hancock Funds – Nominating and Governance Committee Charter”.
SIGNATURES
Pursuant to the requirements of the Securities Exchange Act of 1934 and the Investment Company Act of 1940, the registrant has duly caused this report to be signed on its behalf by the undersigned, thereunto duly authorized.
John Hancock Capital Series
| By: | /s/ Andrew Arnott | |
| Andrew Arnott | ||
| President | ||
| Date: | December 13, 2019 | |
| Pursuant to the requirements of the Securities Exchange Act of 1934 and the Investment Company Act of 1940, this report has been signed below by the following persons on behalf of the registrant and in the capacities and on the dates indicated. | ||
| By: | /s/ Andrew Arnott | |
| Andrew Arnott | ||
| President | ||
| Date: | December 13, 2019 | |
| By: | /s/ Charles A. Rizzo | |
| Charles A. Rizzo | ||
| Chief Financial Officer | ||
| Date: | December 13, 2019 | |