Table of Contents
UNITED STATES
SECURITIES AND EXCHANGE COMMISSION
Washington, D.C. 20549
FORM N-CSR
CERTIFIED SHAREHOLDER REPORT OF REGISTERED
MANAGEMENT INVESTMENT COMPANIES
Investment Company Act file number 811- 01677
John Hancock Capital Series
(Exact name of registrant as specified in charter)
200 Berkeley Street, Boston, Massachusetts 02116
(Address of principal executive offices) (Zip code)
Salvatore Schiavone
Treasurer
200 Berkeley Street
Boston, Massachusetts 02116
(Name and address of agent for service)
Registrant’s telephone number, including area code: 617-663-4497
Date of fiscal year end: October 31
Date of reporting period: October 31, 2020
Table of Contents
| ITEM 1. | REPORTS TO STOCKHOLDERS |
Table of Contents
Table of Contents

Dear shareholder,
Despite heightened fears over the coronavirus (COVID-19), which sent markets tumbling in the first quarter of the calendar year, global financial markets delivered positive returns for the 12 months ended October 31, 2020. In response to the pandemic-led shock, the U.S. Federal Reserve and the government worked quickly to shore up the economy and equity markets began to rise, particularly large-cap U.S. growth stocks, during the period.
Of course, it would be a mistake to consider this market turnaround a trustworthy signal of assured or swift economic recovery. Economic growth has slowed as the ongoing spread of COVID-19 continues to create uncertainty among businesses and investors. Lockdowns and curfews in certain areas have been reinstated, affecting the level of unemployment and the pace of hiring. Consumer spending also remains far below prepandemic levels.
From an investment perspective, we continue to think that maintaining a focus on long-term objectives while pursuing a risk-aware strategy is a prudent way forward. Above all, we believe the counsel of a trusted financial professional continues to matter now more than ever. Periods of heightened uncertainty are precisely the time to review your financial goals and follow a plan that helps you make the most of what continues to be a challenging situation.
On behalf of everyone at John Hancock Investment Management, I’d like to take this opportunity to welcome new shareholders and thank existing shareholders for the continued trust you’ve placed in us.
Sincerely,
Andrew G. Arnott
President and CEO,
John Hancock Investment Management
Head of Wealth and Asset Management,
United States and Europe
This commentary reflects the CEO’s views as of this report’s period end and are subject to change at any time. Diversification does not guarantee investment returns and does not eliminate risk of loss. All investments entail risks, including the possible loss of principal. For more up-to-date information, you can visit our website at jhinvestments.com.
Table of Contents
John Hancock
Classic Value Fund
| Table of contents | ||||||
| 2 | Your fund at a glance | |||||
| 4 | Manager’s discussion of fund performance | |||||
| 6 | A look at performance | |||||
| 8 | ||||||
| 10 | ||||||
| 13 | ||||||
| 17 | ||||||
| 23 | ||||||
| 32 | ||||||
| 33 | ||||||
| 34 | Continuation of investment advisory and subadvisory agreements | |||||
| 41 | ||||||
| 45 | ||||||
| 1 | JOHN HANCOCK CLASSIC VALUE FUND | ANNUAL REPORT |
Table of Contents
|
INVESTMENT OBJECTIVE
The fund seeks long-term growth of capital.
AVERAGE ANNUAL TOTAL RETURNS AS OF 10/31/2020 (%)
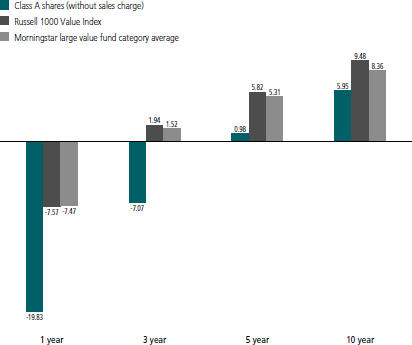
The Russell 1000 Value Index tracks the performance of publicly traded large-cap companies in the United States with lower price-to-book ratios and lower forecasted growth values.
It is not possible to invest directly in an index. Index figures do not reflect expenses or sales charges, which would result in lower returns.
The fund’s Morningstar category average is a group of funds with similar investment objectives and strategies and is the equal-weighted return of all funds per category. Morningstar places funds in certain categories based on their historical portfolio holdings. Figures from Morningstar, Inc. include reinvested distributions and do not take into account sales charges. Actual load-adjusted performance is lower.
The past performance shown here reflects reinvested distributions and the beneficial effect of any expense reductions, and does not guarantee future results. Performance of the other share classes will vary based on the difference in the fees and expenses of those classes. Shares will fluctuate in value and, when redeemed, may be worth more or less than their original cost. Current month-end performance may be lower or higher than the performance cited, and can be found at jhinvestments.com or by calling 800-225-5291. For further information on the fund’s objectives, risks, and strategy, see the fund’s prospectus.
| ANNUAL REPORT | JOHN HANCOCK CLASSIC VALUE FUND | 2 |
Table of Contents
|
PERFORMANCE HIGHLIGHTS OVER THE LAST TWELVE MONTHS
Value stocks were hammered | ||||
The volatility caused by the COVID-19 pandemic hit all equity markets hard, but while growth stocks largely recovered, value stocks didn’t. | ||||
All sectors posted losses for the period | ||||
Sector performance for value stocks was overwhelmingly negative, with energy and financial stocks plummeting the most. | ||||
The fund underperformed its benchmark | ||||
The fund posted a negative return and underperformed the Russell 1000 Value Index. | ||||
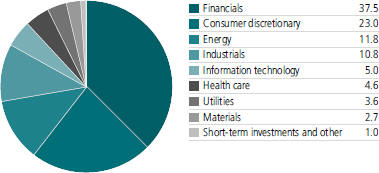
SECTOR COMPOSITION AS OF 10/31/2020 (% of net assets)
A note about risks
The fund may be subject to various risks as described in the fund’s prospectus. A widespread health crisis such as a global pandemic could cause substantial market volatility, exchange trading suspensions and closures, impact the ability to complete redemptions, and affect fund performance. For example, the novel coronavirus disease (COVID-19) has resulted in significant disruptions to global business activity. The impact of a health crisis and other epidemics and pandemics that may arise in the future, could affect the global economy in ways that cannot necessarily be foreseen at the present time. A health crisis may exacerbate other pre-existing political, social, and economic risks. Any such impact could adversely affect the fund’s performance, resulting in losses to your investment. For more information, please refer to the “Principal risks” section of the prospectus.
| 3 | JOHN HANCOCK CLASSIC VALUE FUND | ANNUAL REPORT |
Table of Contents
Manager’s discussion of fund performance
|
How did the markets perform during the 12 months ended October 31, 2020?
An easing of trade tensions between the United States and China propelled stocks higher in the final months of 2019, but market leadership remained intact as growth stocks continued to outperform value. The market’s rise then came to an abrupt halt, with U.S. equities suffering one of their sharpest declines on record in response to the COVID-19 pandemic and associated economic slowdown. Investors, eyeing an imminent recession, abandoned value stocks on concerns that their earnings would come under extreme pressure in an economic contraction.
Domestic equities have since staged a powerful rebound, but it was largely driven by mega-cap growth and momentum stocks, with investors opting for perceived earnings reliability amid the extreme market volatility. At the same time, the market appeared to be discounting value stocks. We view the current valuation gap between growth and value stocks as exploitable, creating a wide range of opportunities in strong business franchises at extremely attractive valuations.
How did the fund perform in this environment?
Given the unfavorable environment for value, the fund produced a loss and significantly trailed the benchmark, the Russell 1000 Value Index, due to poor stock
TOP 10 HOLDINGS AS OF 10/31/2020 (% of net assets) | COUNTRY COMPOSITION AS OF 10/31/2020 (% of net assets) | |||||||||||||||||||
|
| |||||||||||||||||||
General Electric Company | 5.7 |
United States | 89.8 | |||||||||||||||||
American International Group, Inc. | 4.8 | Canada | 4.6 | |||||||||||||||||
Ford Motor Company | 4.2 | Bermuda | 2.9 | |||||||||||||||||
Gildan Activewear, Inc. | 3.9 | Switzerland | 1.5 | |||||||||||||||||
Citigroup, Inc. | 3.8 | Netherlands | 1.2 | |||||||||||||||||
Capital One Financial Corp. | 3.8 | TOTAL | 100.0 | |||||||||||||||||
Lear Corp. | 3.8 | |||||||||||||||||||
Baker Hughes Company | 3.7 | |||||||||||||||||||
Wells Fargo & Company | 3.6 | |||||||||||||||||||
Mohawk Industries, Inc. | 3.5 | |||||||||||||||||||
TOTAL | 40.8 | |||||||||||||||||||
Cash and cash equivalents are not included. | ||||||||||||||||||||
| ||||||||||||||||||||
| ANNUAL REPORT | JOHN HANCOCK CLASSIC VALUE FUND | 4 |
Table of Contents
|
selection. In the sector space, the energy and financials sectors detracted the most due to plunging crude prices and falling interest rates stemming from the economic slowdown. | MANAGED BY
Richard S. Pzena Benjamin S. Silver, CFA, CPA John J. Flynn
| |
What were some of the detractors?
| ||

Money center banks Wells Fargo & Company and Citigroup, Inc. declined significantly during the period as lower interest rates and higher loan loss provisions pressured net income. Restrictions on capital returns (mandated by the U.S. Federal Reserve) also weighed on both companies’ shares. The banks’ strong capital positions and reduced operating risks should allow them to weather the downturn and return capital to shareholders once regulatory approval is received. Oil service company National Oilwell Varco, Inc. also fell in response to the drop in oil prices, but the company was able to generate positive operating cash flow despite a very challenging demand environment. We expect the company’s aggressive cost restructuring actions to significantly benefit the bottom line once demand recovers.
What were some of the key contributors?
Chemical company Dow, Inc. was one of the portfolio’s top contributors, as the stock benefited from improving investor sentiment toward an economic recovery. Stanley Black & Decker, Inc. also performed well due to decisive cost cuts, which helped support margins during the initial downturn, and strong housing demand stemming from the work-from-home trend. We sold the fund’s holdings in the company prior to period end. Car seat manufacturer Lear Corp. rebounded strongly from its March low due to robust auto demand and a strong balance sheet, which enabled the company to take market share from weaker competitors during the period.
The views expressed in this report are exclusively those of Richard S. Pzena, Pzena Investment Management, and are subject to change. They are not meant as investment advice. Please note that the holdings discussed in this report may not have been held by the fund for the entire period. Portfolio composition is subject to review in accordance with the fund’s investment strategy and may vary in the future. Current and future portfolio holdings are subject to risk.
| 5 | JOHN HANCOCK CLASSIC VALUE FUND | ANNUAL REPORT |
Table of Contents
|
| TOTAL RETURNS FOR THE PERIOD ENDED OCTOBER 31, 2020 | ||||||||||||||
Average annual total returns (%) with maximum sales charge | Cumulative total returns (%) with maximum sales charge | |||||||||||||||||||||||||
| 1-year | 5-year | 10-year | 5-year | 10-year | ||||||||||||||||||||||
Class A | -23.84 | -0.05 | 5.41 | -0.25 | 69.30 | |||||||||||||||||||||
Class C | -21.24 | 0.22 | 5.15 | 1.08 | 65.25 | |||||||||||||||||||||
Class I1 | -19.65 | 1.23 | 6.24 | 6.31 | 83.14 | |||||||||||||||||||||
Class R21,2 | -19.93 | 0.83 | 5.89 | 4.23 | 77.20 | |||||||||||||||||||||
Class R51 | -19.56 | 1.30 | 6.31 | 6.68 | 84.47 | |||||||||||||||||||||
Class R61,2 | -19.55 | 1.34 | 6.30 | 6.88 | 84.27 | |||||||||||||||||||||
Index† | -7.57 | 5.82 | 9.48 | 32.70 | 147.32 | |||||||||||||||||||||
Performance figures assume all distributions have been reinvested. Figures reflect maximum sales charges on Class A shares of 5% and the applicable contingent deferred sales charge (CDSC) on Class C shares. Class C shares held for less than one year are subject to a 1% CDSC. Sales charges are not applicable to Class I, Class R2, Class R5, and Class R6 shares.
The expense ratios of the fund, both net (including any fee waivers and/or expense limitations) and gross (excluding any fee waivers and/or expense limitations), are set forth according to the most recent publicly available prospectuses for the fund and may differ from those disclosed in the Financial highlights tables in this report. Net expenses reflect contractual expense limitations in effect until July 31, 2022 and are subject to change. Had the contractual fee waivers and expense limitations not been in place, gross expenses would apply. The expense ratios are as follows:
| Class A | Class C | Class I | Class R2 | Class R5 | Class R6 | |||||||||
Gross (%) | 1.18 | 1.93 | 0.93 | 1.33 | 0.88 | 0.83 | ||||||||
Net (%) | 1.17 | 1.92 | 0.92 | 1.32 | 0.87 | 0.82 | ||||||||
Please refer to the most recent prospectus and annual or semiannual report for more information on expenses and any expense limitation arrangements for each class.
The returns reflect past results and should not be considered indicative of future performance. The return and principal value of an investment will fluctuate so that shares, when redeemed, may be worth more or less than their original cost. Due to market volatility and other factors, the fund’s current performance may be higher or lower than the performance shown. For current to the most recent month-end performance data, please call 800–225–5291 or visit the fund’s website at jhinvestments.com.
The performance table above and the chart on the next page do not reflect the deduction of taxes that a shareholder would pay on fund distributions or the redemption of fund shares. The fund’s performance results reflect any applicable fee waivers or expense reductions, without which the expenses would increase and results would have been less favorable.
| † | Index is the Russell 1000 Value Index. |
See the following page for footnotes.
| ANNUAL REPORT | JOHN HANCOCK CLASSIC VALUE FUND | 6 |
Table of Contents
|
This chart and table show what happened to a hypothetical $10,000 investment in John Hancock Classic Value Fund for the share classes and periods indicated, assuming all distributions were reinvested. For comparison, we’ve shown the same investment in the Russell 1000 Value Index.
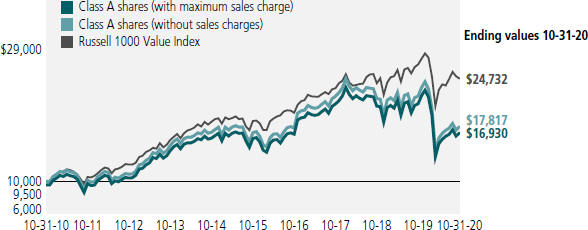
| Start date | With maximum sales charge ($) | Without sales charge ($) | Index ($) | |||||||||||||
Class C3 | 10-31-10 | 16,525 | 16,525 | 24,732 | ||||||||||||
Class I1 | 10-31-10 | 18,314 | 18,314 | 24,732 | ||||||||||||
Class R21,2 | 10-31-10 | 17,720 | 17,720 | 24,732 | ||||||||||||
Class R51 | 10-31-10 | 18,447 | 18,447 | 24,732 | ||||||||||||
Class R61,2 | 10-31-10 | 18,427 | 18,427 | 24,732 | ||||||||||||
The Russell 1000 Value Index is an unmanaged index containing those securities in the Russell 1000 Index with a lower price-to-book ratio and less-than-average growth orientation.
It is not possible to invest directly in an index. Index figures do not reflect expenses or sales charges, which would result in lower returns.
Footnotes related to performance pages
| 1 | For certain types of investors, as described in the fund’s prospectus. |
| 2 | Class R2 shares were first offered on 3-1-12; Class R6 shares were first offered on 9-1-11. Returns prior to these dates are those of Class A shares and have not been adjusted for expenses; otherwise, returns would vary. |
| 3 | The contingent deferred sales charge is not applicable. |
| 7 | JOHN HANCOCK CLASSIC VALUE FUND | ANNUAL REPORT |
Table of Contents
|
These examples are intended to help you understand your ongoing operating expenses of investing in the fund so you can compare these costs with the ongoing costs of investing in other mutual funds.
Understanding fund expenses
As a shareholder of the fund, you incur two types of costs:
| ∎ | Transaction costs, which include sales charges (loads) on purchases or redemptions (varies by share class), minimum account fee charge, etc. |
| ∎ | Ongoing operating expenses, including management fees, distribution and service fees (if applicable), and other fund expenses. |
We are presenting only your ongoing operating expenses here.
Actual expenses/actual returns
The first line of each share class in the table on the following page is intended to provide information about the fund’s actual ongoing operating expenses, and is based on the fund’s actual return. It assumes an account value of $1,000.00 on May 1, 2020, with the same investment held until October 31, 2020.
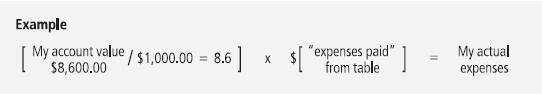
Together with the value of your account, you may use this information to estimate the operating expenses that you paid over the period. Simply divide your account value at October 31, 2020, by $1,000.00, then multiply it by the “expenses paid” for your share class from the table. For example, for an account value of $8,600.00, the operating expenses should be calculated as follows:
Hypothetical example for comparison purposes
The second line of each share class in the table on the following page allows you to compare the fund’s ongoing operating expenses with those of any other fund. It provides an example of the fund’s hypothetical account values and hypothetical expenses based on each class’s actual expense ratio and an assumed 5% annualized return before expenses (which is not the class’s actual return). It assumes an account value of $1,000.00 on May 1, 2020, with the same investment held until October 31, 2020. Look in any other fund shareholder report to find its hypothetical example and you will be able to compare these expenses. Please remember that these hypothetical account values and expenses may not be used to estimate the actual ending account balance or expenses you paid for the period.
| ANNUAL REPORT | JOHN HANCOCK CLASSIC VALUE FUND | 8 |
Table of Contents
|
Remember, these examples do not include any transaction costs, therefore, these examples will not help you to determine the relative total costs of owning different funds. If transaction costs were included, your expenses would have been higher. See the prospectus for details regarding transaction costs.
SHAREHOLDER EXPENSE EXAMPLE CHART
Account
|
Ending
|
Expenses
|
Annualized
| |||||||||||||||
Class A | Actual expenses/actual returns | $ | 1,000.00 | $ | 1,101.00 | $ | 6.28 | 1.19% | ||||||||||
| Hypothetical example | 1,000.00 | 1,019.20 | 6.04 | 1.19% | ||||||||||||||
Class C | Actual expenses/actual returns | 1,000.00 | 1,096.60 | 10.22 | 1.94% | |||||||||||||
| Hypothetical example | 1,000.00 | 1,015.40 | 9.83 | 1.94% | ||||||||||||||
Class I | Actual expenses/actual returns | 1,000.00 | 1,102.20 | 4.97 | 0.94% | |||||||||||||
| Hypothetical example | 1,000.00 | 1,020.40 | 4.77 | 0.94% | ||||||||||||||
Class R2 | Actual expenses/actual returns | 1,000.00 | 1,100.20 | 7.13 | 1.35% | |||||||||||||
| Hypothetical example | 1,000.00 | 1,018.30 | 6.85 | 1.35% | ||||||||||||||
Class R5 | Actual expenses/actual returns | 1,000.00 | 1,102.50 | 4.49 | 0.85% | |||||||||||||
| Hypothetical example | 1,000.00 | 1,020.90 | 4.32 | 0.85% | ||||||||||||||
Class R6 | Actual expenses/actual returns | 1,000.00 | 1,102.50 | 4.39 | 0.83% | |||||||||||||
| Hypothetical example | 1,000.00 | 1,021.00 | 4.22 | 0.83% | ||||||||||||||
| 1 | Expenses are equal to the annualized expense ratio, multiplied by the average account value over the period, multiplied by 184/366 (to reflect the one-half year period). |
| 9 | JOHN HANCOCK CLASSIC VALUE FUND | ANNUAL REPORT |
Table of Contents
|
AS OF 10-31-20 | ||||||||
| Shares | Value | |||||||
Common stocks 99.0% | $ | 1,383,958,295 | ||||||
(Cost $1,500,512,200) | ||||||||
Consumer discretionary 23.0% | 321,559,788 | |||||||
Auto components 3.8% | ||||||||
Lear Corp. | 438,027 | 52,918,042 | ||||||
Automobiles 4.2% | ||||||||
Ford Motor Company | 7,675,886 | 59,334,599 | ||||||
Household durables 6.8% | ||||||||
Mohawk Industries, Inc. (A) | 469,838 | 48,482,583 | ||||||
Newell Brands, Inc. | 2,609,784 | 46,088,785 | ||||||
Internet and direct marketing retail 1.0% | ||||||||
Booking Holdings, Inc. (A) | 8,994 | 14,592,765 | ||||||
Textiles, apparel and luxury goods 7.2% | ||||||||
Gildan Activewear, Inc. (B) | 2,645,088 | 54,938,478 | ||||||
PVH Corp. | 775,511 | 45,204,536 | ||||||
Energy 11.8% | 164,525,437 | |||||||
Energy equipment and services 8.9% | ||||||||
Baker Hughes Company | 3,509,873 | 51,840,824 | ||||||
Halliburton Company | 3,407,175 | 41,090,531 | ||||||
National Oilwell Varco, Inc. | 3,754,800 | 31,540,320 | ||||||
Oil, gas and consumable fuels 2.9% | ||||||||
Cenovus Energy, Inc. | 2,920,347 | 9,578,738 | ||||||
Exxon Mobil Corp. | 421,059 | 13,734,945 | ||||||
Royal Dutch Shell PLC, ADR, Class A (B) | 655,189 | 16,740,079 | ||||||
Financials 37.5% | 524,507,127 | |||||||
Banks 11.4% | ||||||||
Bank of America Corp. | 1,126,031 | 26,686,935 | ||||||
Citigroup, Inc. | 1,285,544 | 53,247,232 | ||||||
JPMorgan Chase & Co. | 290,927 | 28,522,483 | ||||||
Wells Fargo & Company | 2,362,917 | 50,684,570 | ||||||
Capital markets 6.2% | ||||||||
Morgan Stanley | 562,474 | 27,083,123 | ||||||
The Goldman Sachs Group, Inc. | 203,716 | 38,510,473 | ||||||
UBS Group AG (B) | 1,754,343 | 20,508,270 | ||||||
Consumer finance 3.8% | ||||||||
Capital One Financial Corp. | 727,968 | 53,199,901 | ||||||
Diversified financial services 5.4% | ||||||||
Equitable Holdings, Inc. | 2,142,457 | 46,041,401 | ||||||
Voya Financial, Inc. | 626,722 | 30,038,785 | ||||||
| SEE NOTES TO FINANCIAL STATEMENTS | ANNUAL REPORT | JOHN HANCOCK CLASSIC VALUE FUND | 10 |
Table of Contents
|
| Shares | Value | |||||||||||
Financials (continued) | ||||||||||||
Insurance 10.7% | ||||||||||||
American International Group, Inc. | 2,115,631 | $ | 66,621,220 | |||||||||
Axis Capital Holdings, Ltd. | 953,398 | 40,700,561 | ||||||||||
MetLife, Inc. | 1,127,138 | 42,662,173 | ||||||||||
Health care 4.6% | 64,483,752 | |||||||||||
Health care providers and services 3.7% | ||||||||||||
Cardinal Health, Inc. | 385,711 | 17,661,707 | ||||||||||
McKesson Corp. | 230,756 | 34,034,202 | ||||||||||
Pharmaceuticals 0.9% | ||||||||||||
Mylan NV (A) | 879,494 | 12,787,843 | ||||||||||
Industrials 10.8% | 150,866,850 | |||||||||||
Aerospace and defense 2.4% | ||||||||||||
Textron, Inc. | 938,230 | 33,588,634 | ||||||||||
Industrial conglomerates 5.7% | ||||||||||||
General Electric Company | 10,634,378 | 78,907,084 | ||||||||||
Machinery 2.7% | ||||||||||||
Wabtec Corp. | 647,068 | 38,371,132 | ||||||||||
Information technology 5.0% | 70,080,754 | |||||||||||
IT services 2.1% | ||||||||||||
Cognizant Technology Solutions Corp., Class A | 417,580 | 29,823,564 | ||||||||||
Technology hardware, storage and peripherals 2.9% | ||||||||||||
Hewlett Packard Enterprise Company | 4,659,397 | 40,257,190 | ||||||||||
Materials 2.7% | 37,285,014 | |||||||||||
Chemicals 2.7% | ||||||||||||
Dow, Inc. | 819,631 | 37,285,014 | ||||||||||
Utilities 3.6% | 50,649,573 | |||||||||||
Electric utilities 3.6% | ||||||||||||
Edison International | 241,613 | 13,539,993 | ||||||||||
NRG Energy, Inc. | 1,173,611 | 37,109,580 | ||||||||||
| Yield | (%) | Shares | Value | |||||||||
Short-term investments 3.4% | $ | 47,223,441 | ||||||||||
(Cost $47,198,813) | ||||||||||||
Short-term funds 3.4% | 47,223,441 | |||||||||||
John Hancock Collateral Trust (C) | 0.2508 | (D) | 3,886,139 | 38,894,812 | ||||||||
State Street Institutional Treasury Money Market Fund, Premier Class | 0.0139 | (D) | 8,328,629 | 8,328,629 | ||||||||
| 11 | JOHN HANCOCK CLASSIC VALUE FUND | ANNUAL REPORT | SEE NOTES TO FINANCIAL STATEMENTS |
Table of Contents
|
Total investments (Cost $ 1,547,711,013) 102.4% | $ | 1,431,181,736 | ||||||
Other assets and liabilities, net (2.4%) | (33,459,917 | ) | ||||||
Total net assets 100.0% | $ | 1,397,721,819 | ||||||
The percentage shown for each investment category is the total value of the category as a percentage of the net assets of the fund.
Security Abbreviations and Legend
ADR | American Depositary Receipt | |
(A) | Non-income producing security. | |
(B) | All or a portion of this security is on loan as of 10-31-20. | |
(C) | Investment is an affiliate of the fund, the advisor and/or subadvisor. This security represents the investment of cash collateral received for securities lending. | |
(D) | The rate shown is the annualized seven-day yield as of 10-31-20. | |
At 10-31-20, the aggregate cost of investments for federal income tax purposes was $1,582,187,909. Net unrealized depreciation aggregated to $151,006,173, of which $122,486,686 related to gross unrealized appreciation and $273,492,859 related to gross unrealized depreciation.
| SEE NOTES TO FINANCIAL STATEMENTS | ANNUAL REPORT | JOHN HANCOCK CLASSIC VALUE FUND | 12 |
Table of Contents
|
| STATEMENT OF ASSETS AND LIABILITIES 10-31-20 |
| |||
Assets | ||||
Unaffiliated investments, at value (Cost $1,508,840,829) including $37,898,825 of securities loaned | $1,392,286,924 | |||
Affiliated investments, at value (Cost $38,870,184) | 38,894,812 | |||
Total investments, at value (Cost $1,547,711,013) | 1,431,181,736 | |||
Dividends and interest receivable | 1,469,932 | |||
Receivable for fund shares sold | 3,092,792 | |||
Receivable for investments sold | 11,966,532 | |||
Receivable for securities lending income | 8,713 | |||
Other assets | 123,022 | |||
Total assets | 1,447,842,727 | |||
Liabilities | ||||
Payable for investments purchased | 7,351,544 | |||
Payable for fund shares repurchased | 2,572,944 | |||
Payable upon return of securities loaned | 38,814,677 | |||
Payable to affiliates | ||||
Investment management fees | 909,409 | |||
Accounting and legal services fees | 51,662 | |||
Transfer agent fees | 118,361 | |||
Distribution and service fees | 62,764 | |||
Trustees’ fees | 116 | |||
Other liabilities and accrued expenses | 239,431 | |||
Total liabilities | 50,120,908 | |||
Net assets | $1,397,721,819 | |||
Net assets consist of | ||||
Paid-in capital | $1,653,713,616 | |||
Total distributable earnings (loss) | (255,991,797 | ) | ||
Net assets | $1,397,721,819 | |||
| 13 | JOHN HANCOCK CLASSIC VALUE FUND | ANNUAL REPORT | SEE NOTES TO FINANCIAL STATEMENTS |
Table of Contents
|
| STATEMENT OF ASSETS AND LIABILITIES 10-31-20 (continued) |
| |||
Net asset value per share | ||||
Based on net asset value and shares outstanding - the fund has an unlimited number of shares authorized with no par value | ||||
Class A ($248,522,774 ÷ 10,361,271 shares)1 | $23.99 | |||
Class C ($8,565,497 ÷ 364,446 shares)1 | $23.50 | |||
Class I ($885,705,189 ÷ 36,811,354 shares) | $24.06 | |||
Class R2 ($1,774,750 ÷ 74,158 shares) | $23.93 | |||
Class R5 ($27,243 ÷ 1,131 shares) | $24.09 | |||
Class R6 ($253,126,366 ÷ 10,505,952 shares) | $24.09 | |||
Maximum offering price per share | ||||
Class A (net asset value per share ÷ 95%)2 | $25.25 | |||
| 1 | Redemption price per share is equal to net asset value less any applicable contingent deferred sales charge. |
| 2 | On single retail sales of less than $50,000. On sales of $50,000 or more and on group sales the offering price is reduced. |
| SEE NOTES TO FINANCIAL STATEMENTS | ANNUAL REPORT | JOHN HANCOCK CLASSIC VALUE FUND | 14 |
Table of Contents
|
| STATEMENT OF OPERATIONS For the year ended 10-31-20 |
| |||
Investment income | ||||
Dividends | $45,909,634 | |||
Securities lending | 493,328 | |||
Interest | 180,441 | |||
Less foreign taxes withheld | (464,484 | ) | ||
Total investment income | 46,118,919 | |||
Expenses | ||||
Investment management fees | 13,412,683 | |||
Distribution and service fees | 887,220 | |||
Accounting and legal services fees | 331,239 | |||
Transfer agent fees | 1,892,181 | |||
Trustees’ fees | 31,688 | |||
Custodian fees | 217,500 | |||
State registration fees | 209,635 | |||
Printing and postage | 133,004 | |||
Professional fees | 106,601 | |||
Other | 85,551 | |||
Total expenses | 17,307,302 | |||
Less expense reductions | (127,607 | ) | ||
Net expenses | 17,179,695 | |||
Net investment income | 28,939,224 | |||
Realized and unrealized gain (loss) | ||||
Net realized gain (loss) on | ||||
Unaffiliated investments and foreign currency transactions | (151,351,803 | ) | ||
Affiliated investments | 32,912 | |||
| (151,318,891 | ) | |||
Change in net unrealized appreciation (depreciation) of | ||||
Unaffiliated investments | (271,891,641 | ) | ||
Affiliated investments | 24,628 | |||
| (271,867,013 | ) | |||
Net realized and unrealized loss | (423,185,904 | ) | ||
Decrease in net assets from operations | $(394,246,680 | ) | ||
| 15 | JOHN HANCOCK CLASSIC VALUE FUND | ANNUAL REPORT | SEE NOTES TO FINANCIAL STATEMENTS |
Table of Contents
|
STATEMENTS OF CHANGES IN NET ASSETS
|
| |||||||
| Year ended 10-31-20 | Year ended 10-31-19 | |||||||
Increase (decrease) in net assets | ||||||||
From operations | ||||||||
Net investment income | $28,939,224 | $49,237,273 | ||||||
Net realized gain (loss) | (151,318,891 | ) | 46,467,484 | |||||
Change in net unrealized appreciation (depreciation) | (271,867,013 | ) | (48,665,815 | ) | ||||
Increase (decrease) in net assets resulting from operations | (394,246,680 | ) | 47,038,942 | |||||
Distributions to shareholders | ||||||||
From earnings | ||||||||
Class A | (15,791,415 | ) | (7,360,607 | ) | ||||
Class B1 | (54,234 | ) | (34,706 | ) | ||||
Class C | (799,388 | ) | (352,002 | ) | ||||
Class I | (70,961,501 | ) | (35,683,141 | ) | ||||
Class R11 | (100,041 | ) | (51,460 | ) | ||||
Class R2 | (22,226 | ) | (170,439 | ) | ||||
Class R31 | (17,405 | ) | (27,551 | ) | ||||
Class R4 | — | (1,632 | ) | |||||
Class R5 | (4,464 | ) | (1,701 | ) | ||||
Class R6 | (17,939,030 | ) | (9,493,876 | ) | ||||
Total distributions | (105,689,704 | ) | (53,177,115 | ) | ||||
From fund share transactions | (250,367,020 | ) | (139,528,741 | ) | ||||
Total decrease | (750,303,404 | ) | (145,666,914 | ) | ||||
Net assets | ||||||||
Beginning of year | 2,148,025,223 | 2,293,692,137 | ||||||
End of year | $1,397,721,819 | $2,148,025,223 | ||||||
| 1 | Share class was redesignated during the year. Refer to Note 5 for further details. |
| SEE NOTES TO FINANCIAL STATEMENTS | ANNUAL REPORT | JOHN HANCOCK CLASSIC VALUE FUND | 16 |
Table of Contents
|
| CLASS A SHARES Period ended | 10-31-20 | 10-31-19 | 10-31-18 | 10-31-17 | 10-31-16 | |||||||||||||||
Per share operating performance | ||||||||||||||||||||
Net asset value, beginning of period | $31.31 | $31.52 | $32.32 | $26.12 | $25.49 | |||||||||||||||
Net investment income1 | 0.35 | 0.61 | 0.46 | 0.34 | 0.43 | |||||||||||||||
Net realized and unrealized gain (loss) on investments | (6.18 | ) | (0.15 | ) | (0.94 | ) | 6.38 | 0.54 | ||||||||||||
Total from investment operations | (5.83 | ) | 0.46 | (0.48 | ) | 6.72 | 0.97 | |||||||||||||
Less distributions | ||||||||||||||||||||
From net investment income | (0.78 | ) | (0.39 | ) | (0.32 | ) | (0.52 | ) | (0.34 | ) | ||||||||||
From net realized gain | (0.71 | ) | (0.28 | ) | — | — | — | |||||||||||||
Total distributions | (1.49 | ) | (0.67 | ) | (0.32 | ) | (0.52 | ) | (0.34 | ) | ||||||||||
Net asset value, end of period | $23.99 | $31.31 | $31.52 | $32.32 | $26.12 | |||||||||||||||
Total return (%)2,3 | (19.83 | ) | 1.67 | (1.53 | ) | 25.91 | 3.90 | |||||||||||||
Ratios and supplemental data | ||||||||||||||||||||
Net assets, end of period (in millions) | $249 | $334 | $348 | $354 | $308 | |||||||||||||||
Ratios (as a percentage of average net assets): | ||||||||||||||||||||
Expenses before reductions | 1.19 | 1.18 | 1.17 | 1.18 | 1.19 | |||||||||||||||
Expenses including reductions | 1.18 | 1.17 | 1.16 | 1.17 | 1.18 | |||||||||||||||
Net investment income | 1.36 | 2.00 | 1.37 | 1.12 | 1.76 | |||||||||||||||
Portfolio turnover (%) | 35 | 35 | 28 | 45 | 21 | |||||||||||||||
| 1 | Based on average daily shares outstanding. |
| 2 | Total returns would have been lower had certain expenses not been reduced during the applicable periods. |
| 3 | Does not reflect the effect of sales charges, if any. |
| 17 | JOHN HANCOCK CLASSIC VALUE FUND | ANNUAL REPORT | SEE NOTES TO FINANCIAL STATEMENTS |
Table of Contents
|
| CLASS C SHARES Period ended | 10-31-20 | 10-31-19 | 10-31-18 | 10-31-17 | 10-31-16 | |||||||||||||||
Per share operating performance | ||||||||||||||||||||
Net asset value, beginning of period | $30.72 | $30.89 | $31.69 | $25.65 | $25.03 | |||||||||||||||
Net investment income1 | 0.18 | 0.39 | 0.26 | 0.11 | 0.24 | |||||||||||||||
Net realized and unrealized gain (loss) on investments | (6.14 | ) | (0.14 | ) | (0.97 | ) | 6.27 | 0.53 | ||||||||||||
Total from investment operations | (5.96 | ) | 0.25 | (0.71 | ) | 6.38 | 0.77 | |||||||||||||
Less distributions | ||||||||||||||||||||
From net investment income | (0.55 | ) | (0.14 | ) | (0.09 | ) | (0.34 | ) | (0.15 | ) | ||||||||||
From net realized gain | (0.71 | ) | (0.28 | ) | — | — | — | |||||||||||||
Total distributions | (1.26 | ) | (0.42 | ) | (0.09 | ) | (0.34 | ) | (0.15 | ) | ||||||||||
Net asset value, end of period | $23.50 | $30.72 | $30.89 | $31.69 | $25.65 | |||||||||||||||
Total return (%)2,3 | (20.47 | ) | 0.92 | (2.25 | ) | 24.96 | 3.11 | |||||||||||||
Ratios and supplemental data | ||||||||||||||||||||
Net assets, end of period (in millions) | $9 | $20 | $26 | $75 | $76 | |||||||||||||||
Ratios (as a percentage of average net assets): | ||||||||||||||||||||
Expenses before reductions | 1.94 | 1.93 | 1.92 | 1.93 | 1.94 | |||||||||||||||
Expenses including reductions | 1.93 | 1.92 | 1.91 | 1.92 | 1.93 | |||||||||||||||
Net investment income | 0.67 | 1.31 | 0.76 | 0.38 | 1.01 | |||||||||||||||
Portfolio turnover (%) | 35 | 35 | 28 | 45 | 21 | |||||||||||||||
| 1 | Based on average daily shares outstanding. |
| 2 | Total returns would have been lower had certain expenses not been reduced during the applicable periods. |
| 3 | Does not reflect the effect of sales charges, if any. |
| SEE NOTES TO FINANCIAL STATEMENTS | ANNUAL REPORT | JOHN HANCOCK CLASSIC VALUE FUND | 18 |
Table of Contents
|
| CLASS I SHARES Period ended | 10-31-20 | 10-31-19 | 10-31-18 | 10-31-17 | 10-31-16 | |||||||||||||||
Per share operating performance | ||||||||||||||||||||
Net asset value, beginning of period | $31.40 | $31.62 | $32.42 | $26.19 | $25.56 | |||||||||||||||
Net investment income1 | 0.43 | 0.69 | 0.55 | 0.41 | 0.51 | |||||||||||||||
Net realized and unrealized gain (loss) on investments | (6.20 | ) | (0.16 | ) | (0.95 | ) | 6.41 | 0.53 | ||||||||||||
Total from investment operations | (5.77 | ) | 0.53 | (0.40 | ) | 6.82 | 1.04 | |||||||||||||
Less distributions | ||||||||||||||||||||
From net investment income | (0.86 | ) | (0.47 | ) | (0.40 | ) | (0.59 | ) | (0.41 | ) | ||||||||||
From net realized gain | (0.71 | ) | (0.28 | ) | — | — | — | |||||||||||||
Total distributions | (1.57 | ) | (0.75 | ) | (0.40 | ) | (0.59 | ) | (0.41 | ) | ||||||||||
Net asset value, end of period | $24.06 | $31.40 | $31.62 | $32.42 | $26.19 | |||||||||||||||
Total return (%)2 | (19.65 | ) | 1.93 | (1.29 | ) | 26.24 | 4.18 | |||||||||||||
Ratios and supplemental data | ||||||||||||||||||||
Net assets, end of period (in millions) | $886 | $1,429 | $1,518 | $1,767 | $1,146 | |||||||||||||||
Ratios (as a percentage of average net assets): | ||||||||||||||||||||
Expenses before reductions | 0.94 | 0.94 | 0.93 | 0.92 | 0.93 | |||||||||||||||
Expenses including reductions | 0.93 | 0.93 | 0.92 | 0.91 | 0.92 | |||||||||||||||
Net investment income | 1.66 | 2.24 | 1.62 | 1.35 | 2.07 | |||||||||||||||
Portfolio turnover (%) | 35 | 35 | 28 | 45 | 21 | |||||||||||||||
| 1 | Based on average daily shares outstanding. |
| 2 | Total returns would have been lower had certain expenses not been reduced during the applicable periods. |
| 19 | JOHN HANCOCK CLASSIC VALUE FUND | ANNUAL REPORT | SEE NOTES TO FINANCIAL STATEMENTS |
Table of Contents
|
| CLASS R2 SHARES Period ended | 10-31-20 | 10-31-19 | 10-31-18 | 10-31-17 | 10-31-16 | |||||||||||||||
Per share operating performance | ||||||||||||||||||||
Net asset value, beginning of period | $31.23 | $31.44 | $32.24 | $26.07 | $25.46 | |||||||||||||||
Net investment income1 | 0.35 | 0.47 | 0.40 | 0.25 | 0.36 | |||||||||||||||
Net realized and unrealized gain (loss) on investments | (6.20 | ) | (0.06 | ) | (0.92 | ) | 6.41 | 0.58 | ||||||||||||
Total from investment operations | (5.85 | ) | 0.41 | (0.52 | ) | 6.66 | 0.94 | |||||||||||||
Less distributions | ||||||||||||||||||||
From net investment income | (0.74 | ) | (0.34 | ) | (0.28 | ) | (0.49 | ) | (0.33 | ) | ||||||||||
From net realized gain | (0.71 | ) | (0.28 | ) | — | — | — | |||||||||||||
Total distributions | (1.45 | ) | (0.62 | ) | (0.28 | ) | (0.49 | ) | (0.33 | ) | ||||||||||
Net asset value, end of period | $23.93 | $31.23 | $31.44 | $32.24 | $26.07 | |||||||||||||||
Total return (%)2 | (19.93 | ) | 1.50 | (1.66 | ) | 25.71 | 3.76 | |||||||||||||
Ratios and supplemental data | ||||||||||||||||||||
Net assets, end of period (in millions) | $2 | $— | 3 | $9 | $7 | $1 | ||||||||||||||
Ratios (as a percentage of average net assets): | ||||||||||||||||||||
Expenses before reductions | 1.32 | 1.30 | 1.32 | 1.33 | 1.33 | |||||||||||||||
Expenses including reductions | 1.31 | 1.29 | 1.31 | 1.32 | 1.32 | |||||||||||||||
Net investment income | 1.39 | 1.50 | 1.21 | 0.84 | 1.47 | |||||||||||||||
Portfolio turnover (%) | 35 | 35 | 28 | 45 | 21 | |||||||||||||||
| 1 | Based on average daily shares outstanding. |
| 2 | Total returns would have been lower had certain expenses not been reduced during the applicable periods. |
| 3 | Less than $500,000. |
| SEE NOTES TO FINANCIAL STATEMENTS | ANNUAL REPORT | JOHN HANCOCK CLASSIC VALUE FUND | 20 |
Table of Contents
|
| CLASS R5 SHARES Period ended | 10-31-20 | 10-31-19 | 10-31-18 | 10-31-17 | 10-31-16 | |||||||||||||||
Per share operating performance | ||||||||||||||||||||
Net asset value, beginning of period | $31.42 | $31.65 | $32.44 | $26.21 | $25.57 | |||||||||||||||
Net investment income1 | 0.49 | 0.66 | 0.57 | 0.43 | 0.54 | |||||||||||||||
Net realized and unrealized gain (loss) on investments | (6.24 | ) | (0.12 | ) | (0.94 | ) | 6.40 | 0.52 | ||||||||||||
Total from investment operations | (5.75 | ) | 0.54 | (0.37 | ) | 6.83 | 1.06 | |||||||||||||
Less distributions | ||||||||||||||||||||
From net investment income | (0.87 | ) | (0.49 | ) | (0.42 | ) | (0.60 | ) | (0.42 | ) | ||||||||||
From net realized gain | (0.71 | ) | (0.28 | ) | — | — | — | |||||||||||||
Total distributions | (1.58 | ) | (0.77 | ) | (0.42 | ) | (0.60 | ) | (0.42 | ) | ||||||||||
Net asset value, end of period | $24.09 | $31.42 | $31.65 | $32.44 | $26.21 | |||||||||||||||
Total return (%)2 | (19.56 | ) | 1.97 | (1.22 | ) | 26.27 | 4.27 | |||||||||||||
Ratios and supplemental data | ||||||||||||||||||||
Net assets, end of period (in millions) | $— | 3 | $— | 3 | $— | 3 | $— | 3 | $— | 3 | ||||||||||
Ratios (as a percentage of average net assets): | ||||||||||||||||||||
Expenses before reductions | 0.87 | 0.88 | 0.87 | 0.88 | 0.86 | |||||||||||||||
Expenses including reductions | 0.86 | 0.87 | 0.87 | 0.87 | 0.86 | |||||||||||||||
Net investment income | 1.81 | 2.17 | 1.68 | 1.40 | 2.22 | |||||||||||||||
Portfolio turnover (%) | 35 | 35 | 28 | 45 | 21 | |||||||||||||||
| 1 | Based on average daily shares outstanding. |
| 2 | Total returns would have been lower had certain expenses not been reduced during the applicable periods. |
| 3 | Less than $500,000. |
| 21 | JOHN HANCOCK CLASSIC VALUE FUND | ANNUAL REPORT | SEE NOTES TO FINANCIAL STATEMENTS |
Table of Contents
|
| CLASS R6 SHARES Period ended | 10-31-20 | 10-31-19 | 10-31-18 | 10-31-17 | 10-31-16 | |||||||||||||||
Per share operating performance | ||||||||||||||||||||
Net asset value, beginning of period | $31.43 | $31.67 | $32.46 | $26.21 | $25.59 | |||||||||||||||
Net investment income1 | 0.46 | 0.72 | 0.57 | 0.47 | 0.52 | |||||||||||||||
Net realized and unrealized gain (loss) on investments | (6.20 | ) | (0.17 | ) | (0.93 | ) | 6.39 | 0.54 | ||||||||||||
Total from investment operations | (5.74 | ) | 0.55 | (0.36 | ) | 6.86 | 1.06 | |||||||||||||
Less distributions | ||||||||||||||||||||
From net investment income | (0.89 | ) | (0.51 | ) | (0.43 | ) | (0.61 | ) | (0.44 | ) | ||||||||||
From net realized gain | (0.71 | ) | (0.28 | ) | — | — | — | |||||||||||||
Total distributions | (1.60 | ) | (0.79 | ) | (0.43 | ) | (0.61 | ) | (0.44 | ) | ||||||||||
Net asset value, end of period | $24.09 | $31.43 | $31.67 | $32.46 | $26.21 | |||||||||||||||
Total return (%)2 | (19.55 | ) | 1.99 | (1.17 | ) | 26.41 | 4.26 | |||||||||||||
Ratios and supplemental data | ||||||||||||||||||||
Net assets, end of period (in millions) | $253 | $360 | $384 | $1 | $1 | |||||||||||||||
Ratios (as a percentage of average net assets): | ||||||||||||||||||||
Expenses before reductions | 0.83 | 0.83 | 0.82 | 0.83 | 0.83 | |||||||||||||||
Expenses including reductions | 0.82 | 0.82 | 0.81 | 0.81 | 0.81 | |||||||||||||||
Net investment income | 1.76 | 2.36 | 1.71 | 1.53 | 2.11 | |||||||||||||||
Portfolio turnover (%) | 35 | 35 | 28 | 45 | 21 | |||||||||||||||
| 1 | Based on average daily shares outstanding. |
| 2 | Total returns would have been lower had certain expenses not been reduced during the applicable periods. |
| SEE NOTES TO FINANCIAL STATEMENTS | ANNUAL REPORT | JOHN HANCOCK CLASSIC VALUE FUND | 22 |
Table of Contents
|
Note 1 — Organization
John Hancock Classic Value Fund (the fund) is a series of John Hancock Capital Series (the Trust), an open-end management investment company organized as a Massachusetts business trust and registered under the Investment Company Act of 1940, as amended (the 1940 Act). The investment objective of the fund is to seek long-term growth of capital.
The fund may offer multiple classes of shares. The shares currently outstanding are detailed in the Statement of assets and liabilities. Class A and Class C shares are offered to all investors. Class I shares are offered to institutions and certain investors. Class R2 and Class R5 shares are available only to certain retirement and 529 plans. Class R6 shares are only available to certain retirement plans, institutions and other investors. Class C shares convert to Class A shares ten years after purchase (certain exclusions may apply). Shareholders of each class have exclusive voting rights to matters that affect that class. The distribution and service fees, if any, and transfer agent fees for each class may differ.
Effective November 1, 2020, Class C shares convert to Class A shares eight years after purchase (certain exclusions may apply).
Note 2 — Significant accounting policies
The financial statements have been prepared in conformity with accounting principles generally accepted in the United States of America (US GAAP), which require management to make certain estimates and assumptions as of the date of the financial statements. Actual results could differ from those estimates and those differences could be significant. The fund qualifies as an investment company under Topic 946 of Accounting Standards Codification of US GAAP.
Events or transactions occurring after the end of the fiscal period through the date that the financial statements were issued have been evaluated in the preparation of the financial statements. The following summarizes the significant accounting policies of the fund:
Security valuation. Investments are stated at value as of the scheduled close of regular trading on the New York Stock Exchange (NYSE), normally at 4:00 P.M., Eastern Time. In case of emergency or other disruption resulting in the NYSE not opening for trading or the NYSE closing at a time other than the regularly scheduled close, the net asset value (NAV) may be determined as of the regularly scheduled close of the NYSE pursuant to the fund’s Valuation Policies and Procedures.
In order to value the securities, the fund uses the following valuation techniques: Equity securities, including exchange-traded or closed-end funds, are typically valued at the last sale price or official closing price on the exchange or principal market where the security trades. In the event there were no sales during the day or closing prices are not available, the securities are valued using the last available bid price. Investments by the fund in open-end mutual funds, including John Hancock Collateral Trust (JHCT), are valued at their respective NAVs each business day.
In certain instances, the Pricing Committee may determine to value equity securities using prices obtained from another exchange or market if trading on the exchange or market on which prices are typically obtained did not open for trading as scheduled, or if trading closed earlier than scheduled, and trading occurred as normal on another exchange or market.
Other portfolio securities and assets, for which reliable market quotations are not readily available, are valued at fair value as determined in good faith by the fund’s Pricing Committee following procedures established by the Board of Trustees. The frequency with which these fair valuation procedures are used cannot be predicted and fair value of securities may differ significantly from the value that would have been used had a ready market for such securities existed.
| 23 | JOHN HANCOCK CLASSIC VALUE FUND | ANNUAL REPORT |
Table of Contents
|
The fund uses a three-tier hierarchy to prioritize the pricing assumptions, referred to as inputs, used in valuation techniques to measure fair value. Level 1 includes securities valued using quoted prices in active markets for identical securities, including registered investment companies. Level 2 includes securities valued using other significant observable inputs. Observable inputs may include quoted prices for similar securities, interest rates, prepayment speeds and credit risk. Prices for securities valued using these inputs are received from independent pricing vendors and brokers and are based on an evaluation of the inputs described. Level 3 includes securities valued using significant unobservable inputs when market prices are not readily available or reliable, including the fund’s own assumptions in determining the fair value of investments. Factors used in determining value may include market or issuer specific events or trends, changes in interest rates and credit quality. The inputs or methodology used for valuing securities are not necessarily an indication of the risks associated with investing in those securities. Changes in valuation techniques and related inputs may result in transfers into or out of an assigned level within the disclosure hierarchy.
As of October 31, 2020, all investments are categorized as Level 1 under the hierarchy described above.
Security transactions and related investment income. Investment security transactions are accounted for on a trade date plus one basis for daily NAV calculations. However, for financial reporting purposes, investment transactions are reported on trade date. Interest income is accrued as earned. Dividend income is recorded on the ex-date, except for dividends of certain foreign securities where the dividend may not be known until after the ex-date. In those cases, dividend income, net of withholding taxes, is recorded when the fund becomes aware of the dividends. Non-cash dividends, if any, are recorded at the fair market value of the securities received. Gains and losses on securities sold are determined on the basis of identified cost and may include proceeds from litigation.
Securities lending. The fund may lend its securities to earn additional income. The fund receives collateral from the borrower in an amount not less than the market value of the loaned securities. The fund will invest its cash collateral in JHCT, an affiliate of the fund, which has a floating NAV and is registered with the Securities and Exchange Commission (SEC) as an investment company. JHCT invests in short-term money market investments. The fund will receive the benefit of any gains and bear any losses generated by JHCT with respect to the cash collateral.
The fund has the right to recall loaned securities on demand. If a borrower fails to return loaned securities when due, then the lending agent is responsible and indemnifies the fund for the lent securities. The lending agent uses the collateral received from the borrower to purchase replacement securities of the same issue, type, class and series of the loaned securities. If the value of the collateral is less than the purchase cost of replacement securities, the lending agent is responsible for satisfying the shortfall but only to the extent that the shortfall is not due to any decrease in the value of JHCT.
Although the risk of loss on securities lent is mitigated by receiving collateral from the borrower and through lending agent indemnification, the fund could experience a delay in recovering securities or could experience a lower than expected return if the borrower fails to return the securities on a timely basis. The fund receives compensation for lending its securities by retaining a portion of the return on the investment of the collateral and compensation from fees earned from borrowers of the securities. Securities lending income received by the fund is net of fees retained by the securities lending agent. Net income received from JHCT is a component of securities lending income as recorded on the Statement of operations.
Obligations to repay collateral received by the fund are shown on the Statement of assets and liabilities as Payable upon return of securities loaned and are secured by the loaned securities. As of October 31, 2020, the fund loaned securities valued at $37,898,825 and received $38,814,677 of cash collateral.
Foreign investing. Assets, including investments, and liabilities denominated in foreign currencies are translated into U.S. dollar values each day at the prevailing exchange rate. Purchases and sales of securities, income and expenses are translated into U.S. dollars at the prevailing exchange rate on the date of the transaction. The effect
| ANNUAL REPORT | JOHN HANCOCK CLASSIC VALUE FUND | 24 |
Table of Contents
|
of changes in foreign currency exchange rates on the value of securities is reflected as a component of the realized and unrealized gains (losses) on investments. Foreign investments are subject to a decline in the value of a foreign currency versus the U.S. dollar, which reduces the dollar value of securities denominated in that currency.
Funds that invest internationally generally carry more risk than funds that invest strictly in U.S. securities. Risks can result from differences in economic and political conditions, regulations, market practices (including higher transaction costs), accounting standards and other factors.
Foreign taxes. The fund may be subject to withholding tax on income, capital gains or repatriations imposed by certain countries, a portion of which may be recoverable. Foreign taxes are accrued based upon the fund’s understanding of the tax rules and rates that exist in the foreign markets in which it invests. Taxes are accrued based on gains realized by the fund as a result of certain foreign security sales. In certain circumstances, estimated taxes are accrued based on unrealized appreciation of such securities. Investment income is recorded net of foreign withholding taxes.
Overdraft. The fund may have the ability to borrow from banks for temporary or emergency purposes, including meeting redemption requests that otherwise might require the untimely sale of securities. Pursuant to the fund’s custodian agreement, the custodian may loan money to the fund to make properly authorized payments. The fund is obligated to repay the custodian for any overdraft, including any related costs or expenses. The custodian may have a lien, security interest or security entitlement in any fund property that is not otherwise segregated or pledged, to the extent of any overdraft, and to the maximum extent permitted by law.
Line of credit. Effective June 25, 2020, the fund and other affiliated funds have entered into a syndicated line of credit agreement with Citibank, N.A. as the administrative agent that enables them to participate in a $1 billion unsecured committed line of credit. Excluding commitments designated for a certain fund and subject to the needs of all other affiliated funds, the fund can borrow up to an aggregate commitment amount of $850 million, subject to asset coverage and other limitations as specified in the agreement. Each participating fund paid an upfront fee in connection with this line of credit agreement, which is charged based on a combination of fixed and asset-based allocations and amortized over 365 days. Prior to June 25, 2020, the fund and other affiliated funds had a similar agreement that enabled them to participate in a $750 million unsecured committed line of credit. A commitment fee payable at the end of each calendar quarter, based on the average daily unused portion of the line of credit, is charged to each participating fund based on a combination of fixed and asset-based allocations and is reflected in Other expenses on the Statement of operations. For the year ended October 31, 2020, the fund had no borrowings under the line of credit. Commitment fees, including upfront fees, for the year ended October 31, 2020 were $9,444.
Expenses. Within the John Hancock group of funds complex, expenses that are directly attributable to an individual fund are allocated to such fund. Expenses that are not readily attributable to a specific fund are allocated among all funds in an equitable manner, taking into consideration, among other things, the nature and type of expense and the fund’s relative net assets. Expense estimates are accrued in the period to which they relate and adjustments are made when actual amounts are known.
Class allocations. Income, common expenses and realized and unrealized gains (losses) are determined at the fund level and allocated daily to each class of shares based on the net assets of the class. Class-specific expenses, such as distribution and service fees, if any, and transfer agent fees, for all classes, are charged daily at the class level based on the net assets of each class and the specific expense rates applicable to each class.
Federal income taxes. The fund intends to continue to qualify as a regulated investment company by complying with the applicable provisions of the Internal Revenue Code and will not be subject to federal income tax on taxable income that is distributed to shareholders. Therefore, no federal income tax provision is required.
For federal income tax purposes, as of October 31, 2020, the fund has a short-term capital loss carryforward of $8,416,704 and a long-term capital loss carryforward of $117,942,674 available to offset future net realized capital gains. This carryforward does not expire.
| 25 | JOHN HANCOCK CLASSIC VALUE FUND | ANNUAL REPORT |
Table of Contents
|
As of October 31, 2020, the fund had no uncertain tax positions that would require financial statement recognition, derecognition or disclosure. The fund’s federal tax returns are subject to examination by the Internal Revenue Service for a period of three years.
Distribution of income and gains. Distributions to shareholders from net investment income and net realized gains, if any, are recorded on the ex-date. The fund generally declares and pays dividends annually. Capital gain distributions, if any, are typically distributed annually.
The tax character of distributions for the years ended October 31, 2020 and 2019 was as follows:
| October 31, 2020 | October 31, 2019 | |||||||
Ordinary income | $57,562,452 | $47,716,993 | ||||||
Long-term capital gains | 48,127,252 | 5,460,122 | ||||||
Total | $105,689,704 | $53,177,115 | ||||||
Distributions paid by the fund with respect to each class of shares are calculated in the same manner, at the same time and in the same amount, except for the effect of class level expenses that may be applied differently to each class. As of October 31, 2020, the components of distributable earnings on a tax basis consisted of $21,373,753 of undistributed ordinary income.
Such distributions and distributable earnings, on a tax basis, are determined in conformity with income tax regulations, which may differ from US GAAP. Distributions in excess of tax basis earnings and profits, if any, are reported in the fund’s financial statements as a return of capital.
Capital accounts within the financial statements are adjusted for permanent book-tax differences. These adjustments have no impact on net assets or the results of operations. Temporary book-tax differences, if any, will reverse in a subsequent period. Book-tax differences are primarily attributable to wash sale loss deferrals.
Note 3 — Guarantees and indemnifications
Under the Trust’s organizational documents, its Officers and Trustees are indemnified against certain liabilities arising out of the performance of their duties to the Trust, including the fund. Additionally, in the normal course of business, the fund enters into contracts with service providers that contain general indemnification clauses. The fund’s maximum exposure under these arrangements is unknown, as this would involve future claims that may be made against the fund that have not yet occurred. The risk of material loss from such claims is considered remote.
Note 4 — Fees and transactions with affiliates
John Hancock Investment Management LLC (the Advisor) serves as investment advisor for the fund. John Hancock Investment Management Distributors LLC (the Distributor), an affiliate of the Advisor, serves as principal underwriter of the fund. The Advisor and the Distributor are indirect, principally owned subsidiaries of Manulife Financial Corporation.
Management fee. The fund has an investment management agreement with the Advisor under which the fund pays a monthly management fee to the Advisor equivalent on an annual basis to the sum of: (a) 0.750% of the first $2.5 billion of the fund’s average daily net assets; (b) 0.740% of the next $2.5 billion of the fund’s average daily net assets and (c) 0.730% of the fund’s average daily net assets in excess of $5 billion. The Advisor has a subadvisory agreement with Pzena Investment Management, LLC. The fund is not responsible for payment of the subadvisory fees.
The Advisor has contractually agreed to waive a portion of its management fee and/or reimburse expenses for certain funds of the John Hancock group of funds complex, including the fund (the participating portfolios). This waiver is based upon aggregate net assets of all the participating portfolios. The amount of the reimbursement is calculated daily and allocated among all the participating portfolios in proportion to the daily net assets of each
| ANNUAL REPORT | JOHN HANCOCK CLASSIC VALUE FUND | 26 |
Table of Contents
|
fund. During the year ended October 31, 2020, this waiver amounted to 0.01% of the fund’s average daily net assets. This arrangement expires on July 31, 2022, unless renewed by mutual agreement of the fund and the Advisor based upon a determination that this is appropriate under the circumstances at that time.
For the year ended October 31, 2020, the expense reductions described above amounted to the following:
| Class | Expense reduction | |||
Class A | $20,596 | |||
Class B | 59 | |||
Class C | 1,000 | |||
Class I | 84,164 | |||
Class R1 | 131 | |||
| Class | Expense reduction | |||
Class R2 | $31 | |||
Class R3 | 23 | |||
Class R5 | 4 | |||
Class R6 | 21,599 | |||
Total | $127,607 | |||
Expenses waived or reimbursed in the current fiscal period are not subject to recapture in future fiscal periods.
The investment management fees, including the impact of the waivers and reimbursements as described above, incurred for the year ended October 31, 2020, were equivalent to a net annual effective rate of 0.74% of the fund’s average daily net assets.
Accounting and legal services. Pursuant to the Accounting and Legal Services Agreement, the fund reimburses the Advisor for all expenses associated with providing the administrative, financial, legal, compliance, accounting and recordkeeping services to the fund, including the preparation of all tax returns, periodic reports to shareholders and regulatory reports, among other services. These expenses are allocated to each share class based on its relative net assets at the time the expense was incurred. These accounting and legal services fees incurred, for the year ended October 31, 2020, amounted to an annual rate of 0.02% of the fund’s average daily net assets.
Distribution and service plans. The fund has a distribution agreement with the Distributor. The fund has adopted distribution and service plans for certain classes as detailed below pursuant to Rule 12b-1 under the 1940 Act, to pay the Distributor for services provided as the distributor of shares of the fund. In addition, under a service plan for certain classes as detailed below, the fund pays for certain other services. The fund may pay up to the following contractual rates of distribution and service fees under these arrangements, expressed as an annual percentage of average daily net assets for each class of the fund’s shares:
| Class | Rule 12b-1 Fee | Service fee | ||||||
Class A | 0.25% | — | ||||||
Class B | 1.00% | — | ||||||
Class C | 1.00% | — | ||||||
Class R1 | 0.50% | 0.25% | ||||||
Class R2 | 0.25% | 0.25% | ||||||
Class R3 | 0.50% | 0.15% | ||||||
Class R5 | — | 0.05% | ||||||
Class B, Class R1, and Class R3 were redesignated during the year. Refer to Note 5 for further details.
Sales charges. Class A shares are assessed up-front sales charges, which resulted in payments to the Distributor amounting to $119,571 for the year ended October 31, 2020. Of this amount, $19,798 was retained and used for printing prospectuses, advertising, sales literature and other purposes and $99,773 was paid as sales commissions to broker-dealers.
Class A and Class C shares may be subject to contingent deferred sales charges (CDSCs). Certain Class A shares that are acquired through purchases of $1 million or more and are redeemed within one year of purchase are subject to a 1.00% sales charge. Class C shares that are redeemed within one year of purchase are subject to a 1.00% CDSC. CDSCs are applied to the lesser of the current market value at the time of redemption or the original
| 27 | JOHN HANCOCK CLASSIC VALUE FUND | ANNUAL REPORT |
Table of Contents
|
purchase cost of the shares being redeemed. Proceeds from CDSCs are used to compensate the Distributor for providing distribution-related services in connection with the sale of these shares. During the year ended October 31, 2020, CDSCs received by the Distributor amounted to $517 and $827 for Class A and Class C shares, respectively.
Transfer agent fees. The John Hancock group of funds has a complex-wide transfer agent agreement with John Hancock Signature Services, Inc. (Signature Services), an affiliate of the Advisor. The transfer agent fees paid to Signature Services are determined based on the cost to Signature Services (Signature Services Cost) of providing recordkeeping services. It also includes out-of-pocket expenses, including payments made to third-parties for recordkeeping services provided to their clients who invest in one or more John Hancock funds. In addition, Signature Services Cost may be reduced by certain fees that Signature Services receives in connection with retirement and small accounts. Signature Services Cost is calculated monthly and allocated, as applicable, to five categories of share classes: Retail Share and Institutional Share Classes of Non-Municipal Bond Funds, Class R6 Shares, Retirement Share Classes and Municipal Bond Share Classes. Within each of these categories, the applicable costs are allocated to the affected John Hancock affiliated funds and/or classes, based on the relative average daily net assets.
Class level expenses. Class level expenses for the year ended October 31, 2020 were as follows:
| Class | Distribution and service fees | Transfer agent fees | ||||||
Class A | $721,976 | $359,836 | ||||||
Class B | 8,138 | 1,018 | ||||||
Class C | 139,523 | 17,458 | ||||||
Class I | — | 1,474,350 | ||||||
Class R1 | 13,515 | 237 | ||||||
Class R2 | 2,085 | 54 | ||||||
Class R3 | 1,955 | 42 | ||||||
Class R5 | 28 | 8 | ||||||
Class R6 | — | 39,178 | ||||||
Total | $887,220 | $1,892,181 | ||||||
Trustee expenses. The fund compensates each Trustee who is not an employee of the Advisor or its affiliates. The costs of paying Trustee compensation and expenses are allocated to the fund based on its net assets relative to other funds within the John Hancock group of funds complex.
Interfund lending program. Pursuant to an Exemptive Order issued by the SEC, the fund, along with certain other funds advised by the Advisor or its affiliates, may participate in an interfund lending program. This program provides an alternative credit facility allowing the fund to borrow from, or lend money to, other participating affiliated funds. At period end, no interfund loans were outstanding. Interest expense is included in Other expenses on the Statement of operations. The fund’s activity in this program during the period for which loans were outstanding was as follows:
Borrower or Lender | Weighted Average Loan Balance | Days Outstanding | Weighted Average Interest Rate | Interest Income (Expense) | ||||||||||||
Borrower | $115,718,619 | 4 | 0.571% | $(7,342) | ||||||||||||
| ANNUAL REPORT | JOHN HANCOCK CLASSIC VALUE FUND | 28 |
Table of Contents
|
Note 5 — Fund share transactions
Transactions in fund shares for the years ended October 31, 2020 and 2019 were as follows:
| Year Ended 10-31-20 | Year Ended 10-31-19 | |||||||||||||||
| Shares | Amount | Shares | Amount | |||||||||||||
Class A shares | ||||||||||||||||
Sold | 7,919,653 | $195,868,152 | 1,518,751 | $45,251,769 | ||||||||||||
Distributions reinvested | 457,126 | 14,724,039 | 243,463 | 6,892,431 | ||||||||||||
Repurchased | (8,686,618 | ) | (193,698,901 | ) | (2,142,480 | ) | (64,846,582 | ) | ||||||||
Net increase (decrease) | (309,839 | ) | $16,893,290 | (380,266 | ) | $(12,702,382) | ||||||||||
Class B shares | ||||||||||||||||
Sold | 28 | $852 | 1,652 | $45,991 | ||||||||||||
Distributions reinvested | 1,669 | 53,073 | 1,163 | 32,533 | ||||||||||||
Repurchased | (46,770 | ) | (1,152,266 | ) | (46,097 | ) | (1,391,416 | ) | ||||||||
Net decrease | (45,073 | ) | $(1,098,341) | (43,282 | ) | $(1,312,892) | ||||||||||
Class C shares | ||||||||||||||||
Sold | 43,599 | $1,058,312 | 126,750 | $3,582,339 | ||||||||||||
Distributions reinvested | 22,256 | 707,291 | 11,105 | 310,501 | ||||||||||||
Repurchased | (354,856 | ) | (8,613,278 | ) | (337,290 | ) | (10,102,625 | ) | ||||||||
Net decrease | (289,001 | ) | $(6,847,675) | (199,435 | ) | $(6,209,785) | ||||||||||
Class I shares | ||||||||||||||||
Sold | 20,544,889 | $455,855,046 | 10,963,873 | $328,918,979 | ||||||||||||
Distributions reinvested | 2,117,770 | 68,276,892 | 1,206,310 | 34,174,754 | ||||||||||||
Repurchased | (31,375,947 | ) | (751,633,441 | ) | (14,654,268 | ) | (449,986,617 | ) | ||||||||
Net decrease | (8,713,288 | ) | $(227,501,503) | (2,484,085 | ) | $(86,892,884) | ||||||||||
Class R1 shares | ||||||||||||||||
Sold | 9,414 | $224,530 | 8,279 | $246,084 | ||||||||||||
Distributions reinvested | 2,910 | 94,039 | 1,488 | 42,283 | ||||||||||||
Repurchased | (85,259 | ) | (2,203,250 | ) | (38,697 | ) | (1,165,919 | ) | ||||||||
Net decrease | (72,935 | ) | $(1,884,681) | (28,930 | ) | $(877,552) | ||||||||||
Class R2 shares | ||||||||||||||||
Sold | 69,305 | $1,748,980 | 12,466 | $372,079 | ||||||||||||
Distributions reinvested | 676 | 21,749 | 6,014 | 170,086 | ||||||||||||
Repurchased | (11,157 | ) | (285,533 | ) | (289,761 | ) | (9,017,971 | ) | ||||||||
Net increase (decrease) | 58,824 | $1,485,196 | (271,281 | ) | $(8,475,806) | |||||||||||
| 29 | JOHN HANCOCK CLASSIC VALUE FUND | ANNUAL REPORT |
Table of Contents
|
Year Ended 10-31-20 | Year Ended 10-31-19 | |||||||||||||||
| Shares | Amount | Shares | Amount | |||||||||||||
Class R3 shares | ||||||||||||||||
Sold | 1,023 | $25,158 | 5,592 | $172,258 | ||||||||||||
Distributions reinvested | 541 | 17,405 | 974 | 27,552 | ||||||||||||
Repurchased | (19,881 | ) | (542,547) | (31,379 | ) | (982,788) | ||||||||||
Net decrease | (18,317 | ) | $(499,984) | (24,813 | ) | $(782,978) | ||||||||||
Class R4 shares | ||||||||||||||||
Repurchased | — | — | (2,224 | ) | $(70,815) | |||||||||||
Net decrease | — | — | (2,224 | ) | $(70,815) | |||||||||||
Class R5 shares | ||||||||||||||||
Sold | 531 | $13,236 | 1,418 | $43,434 | ||||||||||||
Distributions reinvested | 138 | 4,464 | 60 | 1,701 | ||||||||||||
Repurchased | (2,311 | ) | (53,431) | (868 | ) | (26,785) | ||||||||||
Net increase (decrease) | (1,642 | ) | $(35,731) | 610 | $18,350 | |||||||||||
Class R6 shares | ||||||||||||||||
Sold | 3,856,234 | $86,099,683 | 1,798,177 | $54,768,972 | ||||||||||||
Distributions reinvested | 555,220 | 17,905,834 | 334,673 | 9,484,641 | ||||||||||||
Repurchased | (5,349,196 | ) | (134,883,108) | (2,825,502 | ) | (86,475,610) | ||||||||||
Net decrease | (937,742 | ) | $(30,877,591) | (692,652 | ) | $(22,221,997) | ||||||||||
Total net decrease | (10,329,013 | ) | $(250,367,020) | (4,126,358 | ) | $(139,528,741) | ||||||||||
On June 25, 2020, the Board of Trustees approved redesignations of certain share classes. As a result of the redesignations, Class B, Class R1, and Class R3 were terminated, and shareholders in these classes became shareholders of the respective classes identified below, in each case with the same or lower total net expenses. The following amounts are included in the amount repurchased of the terminated classes and the amount sold of the redesignated classes.
| Redesignation | Effective date | Amount | ||
Class R3 shares as Class R2 shares | October 9, 2020 | $296,579 | ||
Class B shares as Class A shares | October 14, 2020 | $378,846 | ||
Class R1 shares as Class R2 shares | October 23, 2020 | $1,377,284 |
Note 6 — Purchase and sale of securities
Purchases and sales of securities, other than short-term investments, amounted to $608,705,966 and $940,059,355, respectively, for the year ended October 31, 2020.
Note 7 — Investment in affiliated underlying funds
The fund may invest in affiliated underlying funds that are managed by the Advisor and its affiliates. Information regarding the fund’s fiscal year to date purchases and sales of the affiliated underlying funds as well as income and capital gains earned by the fund, if any, is as follows:
| ANNUAL REPORT | JOHN HANCOCK CLASSIC VALUE FUND | 30 |
Table of Contents
|
| Dividends and distributions | ||||||||||||||||||||||||||||||||||||
| Affiliate | | Ending share amount | | Beginning value | | | Cost of purchases | | Proceeds from shares sold | | Realized gain (loss) | | Change in unrealized appreciation (depreciation) | | | Income distributions received | | | Capital gain distributions received | | | Ending value | ||||||||||||||
John Hancock Collateral Trust* | 3,886,139 | — | $396,827,068 | $(357,989,796) | $32,912 | $24,628 | $493,328 | — | $38,894,812 | |||||||||||||||||||||||||||
| * | Refer to the Securities lending note within Note 2 for details regarding this investment. |
Note 8 — Coronavirus (COVID-19) pandemic
The novel COVID-19 disease has resulted in significant disruptions to global business activity. A widespread health crisis such as a global pandemic could cause substantial market volatility, exchange trading suspensions and closures, impact the ability to complete redemptions, and affect fund performance.
| 31 | JOHN HANCOCK CLASSIC VALUE FUND | ANNUAL REPORT |
Table of Contents
|
Report of Independent Registered Public Accounting Firm
To the Board of Trustees of John Hancock Capital Series and Shareholders of John Hancock Classic Value Fund
Opinion on the Financial Statements
We have audited the accompanying statement of assets and liabilities, including the fund’s investments, of John Hancock Classic Value Fund (one of the funds constituting John Hancock Capital Series, referred to hereafter as the “Fund”) as of October 31, 2020, the related statement of operations for the year ended October 31, 2020, the statements of changes in net assets for each of the two years in the period ended October 31, 2020, including the related notes, and the financial highlights for each of the five years in the period ended October 31, 2020 (collectively referred to as the “financial statements”). In our opinion, the financial statements present fairly, in all material respects, the financial position of the Fund as of October 31, 2020, the results of its operations for the year then ended, the changes in its net assets for each of the two years in the period ended October 31, 2020 and the financial highlights for each of the five years in the period ended October 31, 2020 in conformity with accounting principles generally accepted in the United States of America.
Basis for Opinion
These financial statements are the responsibility of the Fund’s management. Our responsibility is to express an opinion on the Fund’s financial statements based on our audits. We are a public accounting firm registered with the Public Company Accounting Oversight Board (United States) (PCAOB) and are required to be independent with respect to the Fund in accordance with the U.S. federal securities laws and the applicable rules and regulations of the Securities and Exchange Commission and the PCAOB.
We conducted our audits of these financial statements in accordance with the standards of the PCAOB. Those standards require that we plan and perform the audit to obtain reasonable assurance about whether the financial statements are free of material misstatement, whether due to error or fraud.
Our audits included performing procedures to assess the risks of material misstatement of the financial statements, whether due to error or fraud, and performing procedures that respond to those risks. Such procedures included examining, on a test basis, evidence regarding the amounts and disclosures in the financial statements. Our audits also included evaluating the accounting principles used and significant estimates made by management, as well as evaluating the overall presentation of the financial statements. Our procedures included confirmation of securities owned as of October 31, 2020 by correspondence with the custodian, transfer agents and brokers; when replies were not received from brokers, we performed other auditing procedures. We believe that our audits provide a reasonable basis for our opinion.
/s/ PricewaterhouseCoopers LLP
Boston, Massachusetts
December 10, 2020
We have served as the auditor of one or more investment companies in the John Hancock group of funds since 1988.
| ANNUAL REPORT | JOHN HANCOCK CLASSIC VALUE FUND | 32 |
Table of Contents
|
For federal income tax purposes, the following information is furnished with respect to the distributions of the fund, if any, paid during its taxable year ended October 31, 2020.
The fund reports the maximum amount allowable of its net taxable income as eligible for the corporate dividends-received deduction.
The fund reports the maximum amount allowable of its net taxable income as qualified dividend income as provided in the Jobs and Growth Tax Relief Reconciliation Act of 2003.
The fund paid $48,127,252 in long term capital gain dividends.
The fund reports the maximum amount allowable of its Section 199A dividends as defined in Proposed Treasury Regulation §1.199A-3(d).
Eligible shareholders will be mailed a 2020 Form 1099-DIV in early 2021. This will reflect the tax character of all distributions paid in calendar year 2020.
Please consult a tax advisor regarding the tax consequences of your investment in the fund.
| 33 | JOHN HANCOCK CLASSIC VALUE FUND | ANNUAL REPORT |
Table of Contents
|
Continuation of Investment Advisory and Subadvisory Agreements
Evaluation of Advisory and Subadvisory Agreements by the Board of Trustees
This section describes the evaluation by the Board of Trustees (the Board) of John Hancock Capital Series (the Trust) of the Advisory Agreement (the Advisory Agreement) with John Hancock Investment Management LLC (the Advisor) and the Subadvisory Agreement (the Subadvisory Agreement) with Pzena Investment Management, LLC (the Subadvisor), for John Hancock Classic Value Fund (the fund). The Advisory Agreement and Subadvisory Agreement are collectively referred to as the Agreements. Prior to the June 23-25, 2020 telephonic1 meeting at which the Agreements were approved, the Board also discussed and considered information regarding the proposed continuation of the Agreements at a telephonic meeting held on May 26-27, 2020.
Approval of Advisory and Subadvisory Agreements
At a telephonic meeting held on June 23-25, 2020, the Board, including the Trustees who are not parties to any Agreement or considered to be interested persons of the Trust under the Investment Company Act of 1940, as amended (the 1940 Act) (the Independent Trustees), reapproved for an annual period the continuation of the Advisory Agreement between the Trust and the Advisor and the Subadvisory Agreement between the Advisor and the Subadvisor with respect to the fund.
In considering the Advisory Agreement and the Subadvisory Agreement, the Board received in advance of the meetings a variety of materials relating to the fund, the Advisor and the Subadvisor, including comparative performance, fee and expense information for a peer group of similar funds prepared by an independent third-party provider of fund data, performance information for an applicable benchmark index; and, with respect to the Subadvisor, comparative performance information for comparably managed accounts, as applicable, and other information provided by the Advisor and the Subadvisor regarding the nature, extent and quality of services provided by the Advisor and the Subadvisor under their respective Agreements, as well as information regarding the Advisor’s revenues and costs of providing services to the fund and any compensation paid to affiliates of the Advisor. At the meetings at which the renewal of the Advisory Agreement and Subadvisory Agreement are considered, particular focus is given to information concerning fund performance, comparability of fees and total expenses, and profitability. However, the Board noted that the evaluation process with respect to the Advisor and the Subadvisor is an ongoing one. In this regard, the Board also took into account discussions with management and information provided to the Board (including its various committees) at prior meetings with respect to the services provided by the Advisor and the Subadvisor to the fund, including quarterly performance reports prepared by management containing reviews of investment results and prior presentations from the Subadvisor with respect to the fund. The information received and considered by the Board in connection with the May and June meetings and throughout the year was both written and oral. The Board also considered the nature, quality, and extent of non-advisory services, if any, to be provided to the fund by the Advisor’s affiliates, including distribution services. The Board considered the Advisory Agreement and the Subadvisory Agreement separately in the course of its review. In doing so, the Board noted the respective roles of the Advisor and Subadvisor in providing services to the fund.
Throughout the process, the Board asked questions of and requested additional information from management. The Board is assisted by counsel for the Trust and the Independent Trustees are also separately assisted by independent legal counsel throughout the process. The Independent Trustees also received a memorandum from
1 On March 25, 2020, as a result of health and safety measures put in place to combat the global COVID-19 pandemic, the Securities and Exchange Commission issued an exemptive order (the “Order”) pursuant to Sections 6(c) and 38(a) of the Investment Company Act of 1940, as amended (the “1940 Act”), that temporarily exempts registered investment management companies from the in-person voting requirements under the 1940 Act, subject to certain requirements, including that votes taken pursuant to the Order are ratified at the next in-person meeting. The Board determined that reliance on the Order was necessary or appropriate due to the circumstances related to current or potential effects of COVID-19 and therefore, the Board’s May and June meetings were held telephonically in reliance on the Order.
| ANNUAL REPORT | JOHN HANCOCK CLASSIC VALUE FUND | 34 |
Table of Contents
|
their independent legal counsel discussing the legal standards for their consideration of the proposed continuation of the Agreements and discussed the proposed continuation of the Agreements in private sessions with their independent legal counsel at which no representatives of management were present.
Approval of Advisory Agreement
In approving the Advisory Agreement with respect to the fund, the Board, including the Independent Trustees, considered a variety of factors, including those discussed below. The Board also considered other factors (including conditions and trends prevailing generally in the economy, the securities markets, and the industry) and did not treat any single factor as determinative, and each Trustee may have attributed different weights to different factors. The Board’s conclusions may be based in part on its consideration of the advisory and subadvisory arrangements in prior years and on the Board’s ongoing regular review of fund performance and operations throughout the year.
Nature, extent, and quality of services. Among the information received by the Board from the Advisor relating to the nature, extent, and quality of services provided to the fund, the Board reviewed information provided by the Advisor relating to its operations and personnel, descriptions of its organizational and management structure, and information regarding the Advisor’s compliance and regulatory history, including its Form ADV. The Board also noted that on a regular basis it receives and reviews information from the Trust’s Chief Compliance Officer (CCO) regarding the fund’s compliance policies and procedures established pursuant to Rule 38a-1 under the 1940 Act. The Board observed that the scope of services provided by the Advisor, and of the undertakings required of the Advisor in connection with those services, including maintaining and monitoring its own and the fund’s compliance programs, risk management programs, liquidity management programs and cybersecurity programs, had expanded over time as a result of regulatory, market and other developments. The Board considered that the Advisor is responsible for the management of the day-to-day operations of the fund, including, but not limited to, general supervision of and coordination of the services provided by the Subadvisor, and is also responsible for monitoring and reviewing the activities of the Subadvisor and other third-party service providers. The Board also considered the significant risks assumed by the Advisor in connection with the services provided to the fund including entrepreneurial risk in sponsoring new funds and ongoing risks including investment, operational, enterprise, litigation, regulatory and compliance risks with respect to all funds.
In considering the nature, extent, and quality of the services provided by the Advisor, the Trustees also took into account their knowledge of the Advisor’s management and the quality of the performance of the Advisor’s duties, through Board meetings, discussions and reports during the preceding year and through each Trustee’s experience as a Trustee of the Trust and of the other trusts in the John Hancock group of funds complex (the John Hancock Fund Complex).
In the course of their deliberations regarding the Advisory Agreement, the Board considered, among other things:
| (a) | the skills and competency with which the Advisor has in the past managed the Trust’s affairs and its subadvisory relationship, the Advisor’s oversight and monitoring of the Subadvisor’s investment performance and compliance programs, such as the Subadvisor’s compliance with fund policies and objectives, review of brokerage matters, including with respect to trade allocation and best execution and the Advisor’s timeliness in responding to performance issues; |
| (b) | the background, qualifications and skills of the Advisor’s personnel; |
| (c) | the Advisor’s compliance policies and procedures and its responsiveness to regulatory changes and fund industry developments; |
| (d) | the Advisor’s administrative capabilities, including its ability to supervise the other service providers for the fund, as well as the Advisor’s oversight of any securities lending activity, its monitoring of class action litigation and collection of class action settlements on behalf of the fund, and bringing loss recovery actions on behalf of the fund; |
| 35 | JOHN HANCOCK CLASSIC VALUE FUND | ANNUAL REPORT |
Table of Contents
|
| (e) | the financial condition of the Advisor and whether it has the financial wherewithal to provide a high level and quality of services to the fund; |
| (f) | the Advisor’s initiatives intended to improve various aspects of the Trust’s operations and investor experience with the fund; and |
| (g) | the Advisor’s reputation and experience in serving as an investment advisor to the Trust and the benefit to shareholders of investing in funds that are part of a family of funds offering a variety of investments. |
The Board concluded that the Advisor may reasonably be expected to continue to provide a high quality of services under the Advisory Agreement with respect to the fund.
Investment performance. In considering the fund’s performance, the Board noted that it reviews at its regularly scheduled meetings information about the fund’s performance results. In connection with the consideration of the Advisory Agreement, the Board:
| (a) | reviewed information prepared by management regarding the fund’s performance; |
| (b) | considered the comparative performance of an applicable benchmark index; |
| (c) | considered the performance of comparable funds, if any, as included in the report prepared by an independent third-party provider of fund data; and |
| (d) | took into account the Advisor’s analysis of the fund’s performance and its plans and recommendations regarding the Trust’s subadvisory arrangements generally. |
The Board noted that while it found the data provided by the independent third-party generally useful it recognized its limitations, including in particular that the data may vary depending on the end date selected and the results of the performance comparisons may vary depending on the selection of the peer group. The Board noted that the fund underperformed its benchmark index and peer group median for the one-, three-, five- and ten-year periods ended December 31, 2019. The Board took into account management’s discussion of the factors that contributed to the fund’s performance for the benchmark index and peer group median for the one-, three-, five- and ten-year periods including the impact of past and current market conditions on the fund’s strategy and management’s plans for the fund. The Board also noted that the fund’s performance was in-line with the peer group median and average for the one-year period. The Board concluded that the fund’s performance is being monitored and reasonably addressed, where appropriate.
Fees and expenses. The Board reviewed comparative information prepared by an independent third-party provider of fund data, including, among other data, the fund’s contractual and net management fees (and subadvisory fees, to the extent available) and total expenses as compared to similarly situated investment companies deemed to be comparable to the fund in light of the nature, extent and quality of the management and advisory and subadvisory services provided by the Advisor and the Subadvisor. The Board considered the fund’s ranking within a smaller group of peer funds chosen by the independent third-party provider, as well as the fund’s ranking within a broader group of funds. In comparing the fund’s contractual and net management fees to those of comparable funds, the Board noted that such fees include both advisory and administrative costs. The Board noted that net management fees and net total expenses for the fund are higher than the peer group median.
The Board took into account management’s discussion of the fund’s expenses. The Board also took into account management’s discussion with respect to the overall management fee and the fees of the Subadvisor, including the amount of the advisory fee retained by the Advisor after payment of the subadvisory fee, in each case in light of the services rendered for those amounts and the risks undertaken by the Advisor. The Board also noted that the Advisor pays the subadvisory fee, and that such fees are negotiated at arm’s length with respect to the Subadvisor. In addition, the Board took into account that management had agreed to implement an overall fee waiver across the complex, including the fund, which is discussed further below. The Board also noted actions taken over the
| ANNUAL REPORT | JOHN HANCOCK CLASSIC VALUE FUND | 36 |
Table of Contents
|
past several years to reduce the fund’s operating expenses. The Board also noted that, in addition, the Advisor is currently waiving fees and/or reimbursing expenses with respect to the fund and that the fund has breakpoints in its contractual management fee schedule that reduce management fees as assets increase. The Board also noted that the fund’s distributor, an affiliate of the Advisor, has agreed to waive a portion of its Rule 12b-1 fee for a share class of the fund. The Board noted that the fund has a voluntary fee waiver and/or expense reimbursement, which reduces certain expenses of the fund. The Board reviewed information provided by the Advisor concerning the investment advisory fee charged by the Advisor or one of its advisory affiliates to other clients (including other funds in the John Hancock Fund Complex) having similar investment mandates, if any. The Board considered any differences between the Advisor’s and Subadvisor’s services to the fund and the services they provide to other comparable clients or funds. The Board concluded that the advisory fee paid with respect to the fund is reasonable in light of the nature, extent and quality of the services provided to the fund under the Advisory Agreement.
Profitability/Fall out benefits. In considering the costs of the services to be provided and the profits to be realized by the Advisor and its affiliates from the Advisor’s relationship with the Trust, the Board:
| (a) | reviewed financial information of the Advisor; |
| (b) | reviewed and considered information presented by the Advisor regarding the net profitability to the Advisor and its affiliates with respect to the fund; |
| (c) | received and reviewed profitability information with respect to the John Hancock Fund Complex as a whole and with respect to the fund; |
| (d) | received information with respect to the Advisor’s allocation methodologies used in preparing the profitability data and considered that the Advisor hired an independent third-party consultant to provide an analysis of the Advisor’s allocation methodologies; |
| (e) | considered that the John Hancock insurance companies that are affiliates of the Advisor, as shareholders of the Trust directly or through their separate accounts, receive certain tax credits or deductions relating to foreign taxes paid and dividends received by certain funds of the Trust and noted that these tax benefits, which are not available to participants in qualified retirement plans under applicable income tax law, are reflected in the profitability information reviewed by the Board; |
| (f) | considered that the Advisor also provides administrative services to the fund on a cost basis pursuant to an administrative services agreement; |
| (g) | noted that affiliates of the Advisor provide transfer agency services and distribution services to the fund, and that the fund’s distributor also receives Rule 12b-1 payments to support distribution of the fund; |
| (h) | noted that the Advisor also derives reputational and other indirect benefits from providing advisory services to the fund; |
| (i) | noted that the subadvisory fee for the fund is paid by the Advisor and is negotiated at arm’s length; |
| (j) | considered the Advisor’s ongoing costs and expenditures necessary to improve services, meet new regulatory and compliance requirements, and adapt to other challenges impacting the fund industry; and |
| (k) | considered that the Advisor should be entitled to earn a reasonable level of profits in exchange for the level of services it provides to the fund and the risks that it assumes as Advisor, including entrepreneurial, operational, reputational, litigation and regulatory risk. |
Based upon its review, the Board concluded that the level of profitability, if any, of the Advisor and its affiliates from their relationship with the fund was reasonable and not excessive.
| 37 | JOHN HANCOCK CLASSIC VALUE FUND | ANNUAL REPORT |
Table of Contents
|
Economies of scale. In considering the extent to which economies of scale would be realized as the fund grows and whether fee levels reflect these economies of scale for the benefit of fund shareholders, the Board:
| (a) | considered that the Advisor has contractually agreed to waive a portion of its management fee for certain funds of the John Hancock Fund Complex, including the fund (the participating portfolios) or otherwise reimburse the expenses of the participating portfolios (the reimbursement). This waiver is based upon aggregate net assets of all the participating portfolios. The amount of the reimbursement is calculated daily and allocated among all the participating portfolios in proportion to the daily net assets of each fund; |
| (b) | reviewed the fund’s advisory fee structure and concluded that: (i) the fund’s fee structure contains breakpoints at the subadvisory fee level and that such breakpoints are reflected as breakpoints in the advisory fees for the fund; and (ii) although economies of scale cannot be measured with precision, these arrangements permit shareholders of the fund to benefit from economies of scale if the fund grows. The Board also took into account management’s discussion of the fund’s advisory fee structure; and |
| (c) | the Board also considered the effect of the fund’s growth in size on its performance and fees. The Board also noted that if the fund’s assets increase over time, the fund may realize other economies of scale. |
Approval of Subadvisory Agreement
In making its determination with respect to approval of the Subadvisory Agreement, the Board reviewed:
| (1) | information relating to the Subadvisor’s business, including current subadvisory services to the Trust (and other funds in the John Hancock Fund Complex); |
| (2) | the historical and current performance of the fund and comparative performance information relating to an applicable benchmark index and comparable funds; |
| (3) | the subadvisory fee for the fund, including any breakpoints, and to the extent available, comparable fee information prepared by an independent third-party provider of fund data; and |
| (4) | information relating to the nature and scope of any material relationships and their significance to the Trust’s Advisor and Subadvisor. |
Nature, extent, and quality of services. With respect to the services provided by the Subadvisor, the Board received information provided to the Board by the Subadvisor, including the Subadvisor’s Form ADV, as well as took into account information presented throughout the past year. The Board considered the Subadvisor’s current level of staffing and its overall resources, as well as received information relating to the Subadvisor’s compensation program. The Board reviewed the Subadvisor’s history and investment experience, as well as information regarding the qualifications, background, and responsibilities of the Subadvisor’s investment and compliance personnel who provide services to the fund. The Board also considered, among other things, the Subadvisor’s compliance program and any disciplinary history. The Board also considered the Subadvisor’s risk assessment and monitoring process. The Board reviewed the Subadvisor’s regulatory history, including whether it was involved in any regulatory actions or investigations as well as material litigation, and any settlements and amelioratory actions undertaken, as appropriate. The Board noted that the Advisor conducts regular, periodic reviews of the Subadvisor and its operations, including regarding investment processes and organizational and staffing matters. The Board also noted that the Trust’s CCO and his staff conduct regular, periodic compliance reviews with the Subadvisor and present reports to the Independent Trustees regarding the same, which includes evaluating the regulatory compliance systems of the Subadvisor and procedures reasonably designed to assure compliance with the federal securities laws. The Board also took into account the financial condition of the Subadvisor.
| ANNUAL REPORT | JOHN HANCOCK CLASSIC VALUE FUND | 38 |
Table of Contents
|
The Board considered the Subadvisor’s investment process and philosophy. The Board took into account that the Subadvisor’s responsibilities include the development and maintenance of an investment program for the fund that is consistent with the fund’s investment objective, the selection of investment securities and the placement of orders for the purchase and sale of such securities, as well as the implementation of compliance controls related to performance of these services. The Board also received information with respect to the Subadvisor’s brokerage policies and practices, including with respect to best execution and soft dollars.
Subadvisor compensation. In considering the cost of services to be provided by the Subadvisor and the profitability to the Subadvisor of its relationship with the fund, the Board noted that the fees under the Subadvisory Agreement are paid by the Advisor and not the fund.
The Board also relied on the ability of the Advisor to negotiate the Subadvisory Agreement with the Subadvisor, which is not affiliated with the Advisor, and the fees thereunder at arm’s length. As a result, the costs of the services to be provided and the profits to be realized by the Subadvisor from its relationship with the Trust were not a material factor in the Board’s consideration of the Subadvisory Agreement.
The Board also received information regarding the nature and scope (including their significance to the Advisor and its affiliates and to the Subadvisor) of any material relationships with respect to the Subadvisor, which include arrangements in which the Subadvisor or its affiliates provide advisory, distribution, or management services in connection with financial products sponsored by the Advisor or its affiliates, and may include other registered investment companies, a 529 education savings plan, managed separate accounts and exempt group annuity contracts sold to qualified plans. The Board also received information and took into account any other potential conflicts of interest the Advisor might have in connection with the Subadvisory Agreement.
In addition, the Board considered other potential indirect benefits that the Subadvisor and its affiliates may receive from the Subadvisor’s relationship with the fund, such as the opportunity to provide advisory services to additional funds in the John Hancock Fund Complex and reputational benefits.
Subadvisory fees. The Board considered that the fund pays an advisory fee to the Advisor and that, in turn, the Advisor pays a subadvisory fee to the Subadvisor. As noted above, the Board also considered the fund’s subadvisory fees as compared to similarly situated investment companies deemed to be comparable to the fund as included in the report prepared by the independent third-party provider of fund data, to the extent available. The Board noted that the limited size of the Lipper peer group was not sufficient for comparative purposes. The Board also took into account the subadvisory fees paid by the Advisor to the Subadvisor with respect to the fund and compared them to fees charged by the Subadvisor to manage other subadvised portfolios and portfolios not subject to regulation under the 1940 Act, as applicable.
Subadvisor performance. As noted above, the Board considered the fund’s performance as compared to the fund’s peer group and the benchmark index and noted that the Board reviews information about the fund’s performance results at its regularly scheduled meetings. The Board noted the Advisor’s expertise and resources in monitoring the performance, investment style and risk-adjusted performance of the Subadvisor. The Board was mindful of the Advisor’s focus on the Subadvisor’s performance. The Board also noted the Subadvisor’s long-term performance record for similar accounts, as applicable.
The Board’s decision to approve the Subadvisory Agreement was based on a number of determinations, including the following:
| (1) | the Subadvisor has extensive experience and demonstrated skills as a manager; |
| (2) | the performance of the fund is being monitored and reasonably addressed, where appropriate; |
| (3) | the subadvisory fee is reasonable in relation to the level and quality of services being provided under the Subadvisory Agreement; and |
| 39 | JOHN HANCOCK CLASSIC VALUE FUND | ANNUAL REPORT |
Table of Contents
|
| (4) | noted that the subadvisory fees are paid by the Advisor not the fund and that the subadvisory fee breakpoints are reflected as breakpoints in the advisory fees for the fund in order to permit shareholders to benefit from economies of scale if the fund grows. |
* * *
Based on the Board’s evaluation of all factors that the Board deemed to be material, including those factors described above, the Board, including the Independent Trustees, concluded that renewal of the Advisory Agreement and the Subadvisory Agreement would be in the best interest of the fund and its shareholders. Accordingly, the Board, and the Independent Trustees voting separately, approved the Advisory Agreement and Subadvisory Agreement for an additional one-year period.
| ANNUAL REPORT | JOHN HANCOCK CLASSIC VALUE FUND | 40 |
Table of Contents
|
This chart provides information about the Trustees and Officers who oversee your John Hancock fund. Officers elected by the Trustees manage the day-to-day operations of the fund and execute policies formulated by the Trustees.
Independent Trustees
| Name, year of birth | Trustee | Number of John | ||||||
| Position(s) held with Trust | of the | Hancock funds | ||||||
| Principal occupation(s) and other | Trust | overseen by | ||||||
directorships during past 5 years
| since1
| Trustee
| ||||||
Hassell H. McClellan, Born: 1945
|
| 2012
|
|
| 196
|
| ||
Trustee and Chairperson of the Board
Director/Trustee, Virtus Funds (since 2008); Director, The Barnes Group (since 2010); Associate Professor, The Wallace E. Carroll School of Management, Boston College (retired 2013). Trustee (since 2005) and Chairperson of the Board (since 2017) of various trusts within the John Hancock Fund Complex. |
| |||||||
Charles L. Bardelis,2 Born: 1941
|
| 2012
|
|
| 196
|
| ||
Trustee
Director, Island Commuter Corp. (marine transport). Trustee, John Hancock Collateral Trust (since 2014), Trustee of various trusts within the John Hancock Fund Complex (since 1988). |
| |||||||
James R. Boyle, Born: 1959
|
| 2015
|
|
| 196
|
| ||
Trustee
Chief Executive Officer, Foresters Financial (since 2018); Chairman and Chief Executive Officer, Zillion Group, Inc. (formerly HealthFleet, Inc.) (healthcare) (2014-2018); Executive Vice President and Chief Executive Officer, U.S. Life Insurance Division of Genworth Financial, Inc. (insurance) (January 2014–July 2014); Senior Executive Vice President, Manulife Financial, President and Chief Executive Officer, John Hancock (1999–2012); Chairman and Director, John Hancock Investment Management LLC, John Hancock Investment Management Distributors LLC, and John Hancock Variable Trust Advisers LLC (2005–2010). Trustee of various trusts within the John Hancock Fund Complex (2005–2014 and since 2015). |
| |||||||
Peter S. Burgess,2 Born: 1942
|
| 2012
|
|
| 196
|
| ||
Trustee
Consultant (financial, accounting, and auditing matters) (since 1999); Certified Public Accountant; Partner, Arthur Andersen (independent public accounting firm) (prior to 1999); Director, Lincoln Educational Services Corporation (since 2004); Director, Symetra Financial Corporation (2010–2016); Director, PMA Capital Corporation (2004–2010). Trustee of various trusts within the John Hancock Fund Complex (since 2005). |
| |||||||
William H. Cunningham, Born: 1944
|
| 2005
|
|
| 196
|
| ||
Trustee
Professor, University of Texas, Austin, Texas (since 1971); former Chancellor, University of Texas System and former President of the University of Texas, Austin, Texas; Chairman (since 2009) and Director (since 2006), Lincoln National Corporation (insurance); Director, Southwest Airlines (since 2000); former Director, LIN Television (2009–2014). Trustee of various trusts within the John Hancock Fund Complex (since 1986). |
| |||||||
Grace K. Fey, Born: 1946
|
| 2012
|
|
| 196
|
| ||
Trustee
Chief Executive Officer, Grace Fey Advisors (since 2007); Director and Executive Vice President, Frontier Capital Management Company (1988–2007); Director, Fiduciary Trust (since 2009). Trustee of various trusts within the John Hancock Fund Complex (since 2008). |
| |||||||
| 41 | JOHN HANCOCK CLASSIC VALUE FUND | ANNUAL REPORT |
Table of Contents
|
Independent Trustees (continued) | ||||||||
| Name, year of birth | Trustee | Number of John | ||||||
| Position(s) held with Trust | of the | Hancock funds | ||||||
| Principal occupation(s) and other | Trust | overseen by | ||||||
directorships during past 5 years
| since1
| Trustee
| ||||||
Deborah C. Jackson, Born: 1952
|
| 2008
|
|
| 196
|
| ||
Trustee
President, Cambridge College, Cambridge, Massachusetts (since 2011); Board of Directors, Massachusetts Women’s Forum (since 2018); Board of Directors, National Association of Corporate Directors/New England (since 2015); Board of Directors, Association of Independent Colleges and Universities of Massachusetts (2014-2017); Chief Executive Officer, American Red Cross of Massachusetts Bay (2002–2011); Board of Directors of Eastern Bank Corporation (since 2001); Board of Directors of Eastern Bank Charitable Foundation (since 2001); Board of Directors of American Student Assistance Corporation (1996–2009); Board of Directors of Boston Stock Exchange (2002–2008); Board of Directors of Harvard Pilgrim Healthcare (health benefits company) (2007–2011). Trustee of various trusts within the John Hancock Fund Complex (since 2008). |
| |||||||
James M. Oates,2 Born: 1946
|
| 2012
|
|
| 196
|
| ||
Trustee
Managing Director, Wydown Group (financial consulting firm) (since 1994); Chairman and Director, Emerson Investment Management, Inc. (2000-2015); Independent Chairman, Hudson Castle Group, Inc. (formerly IBEX Capital Markets, Inc.) (financial services company) (1997–2011); Director, Stifel Financial (since 1996); Director, Investor Financial Services Corporation (1995–2007); Director, Connecticut River Bancorp (1998-2014); Director/Trustee, Virtus Funds (since 1988). Trustee (since 2004) and Chairperson of the Board (2005-2016) of various trusts within the John Hancock Fund Complex. |
| |||||||
Steven R. Pruchansky, Born: 1944
|
| 2005
|
|
| 196
|
| ||
Trustee and Vice Chairperson of the Board
Managing Director, Pru Realty (since 2017); Chairman and Chief Executive Officer, Greenscapes of Southwest Florida, Inc. (since 2014); Director and President, Greenscapes of Southwest Florida, Inc. (2000-2014); Member, Board of Advisors, First American Bank (until 2010); Managing Director, Jon James, LLC (real estate) (since 2000); Partner, Right Funding, LLC (2014-2017); Director, First Signature Bank & Trust Company (until 1991); Director, Mast Realty Trust (until 1994); President, Maxwell Building Corp. (until 1991). Trustee (since 1992), Chairperson of the Board (2011–2012), and Vice Chairperson of the Board (since 2012) of various trusts within the John Hancock Fund Complex. |
| |||||||
Frances G. Rathke,2,* Born: 1960
|
| 2020
|
|
| 196
|
| ||
Trustee
Director, Northern New England Energy Corporation (since 2017); Director, Audit Committee Chair and Compensation Committee Member, Green Mountain Power Corporation (since 2016); Director, Treasurer and Finance & Audit Committee Chair, Flynn Center for Performing Arts (since 2016); Director, Audit Committee Chair and Compensation Committee Member, Planet Fitness (since 2016); Director, Citizen Cider, Inc. (high-end hard cider and hard seltzer company) (since 2016); Chief Financial Officer and Treasurer, Keurig Green Mountain, Inc. (2003-retired 2015); Independent Financial Consultant, Frances Rathke Consulting (strategic and financial consulting services) (2001-2003); Chief Financial Officer and Secretary, Ben & Jerry’s Homemade, Inc. (1989-2000, including prior positions); Senior Manager, Coopers & Lybrand, LLC (independent public accounting firm) (1982-1989). Trustee of various trusts within the John Hancock Fund Complex (since 2020). |
| |||||||
| ANNUAL REPORT | JOHN HANCOCK CLASSIC VALUE FUND | 42 |
Table of Contents
|
| Independent Trustees (continued) | ||||||||
Name, year of birth Position(s) held with Trust Principal occupation(s) and other directorships during past 5 years | | Trustee of the Trust since1 |
| | Number of John Hancock funds overseen by Trustee |
| ||
Gregory A. Russo, Born: 1949 |
| 2009
|
|
| 196
|
| ||
Trustee
Director and Audit Committee Chairman (2012-2020), and Member, Audit Committee and Finance Committee (2011-2020), NCH Healthcare System, Inc. (holding company for multi-entity healthcare system); Director and Member (2012-2018) and Finance Committee Chairman (2014-2018), The Moorings, Inc. (nonprofit continuing care community); Vice Chairman, Risk & Regulatory Matters, KPMG LLP (KPMG) (2002–2006); Vice Chairman, Industrial Markets, KPMG (1998–2002); Chairman and Treasurer, Westchester County, New York, Chamber of Commerce (1986–1992); Director, Treasurer, and Chairman of Audit and Finance Committees, Putnam Hospital Center (1989–1995); Director and Chairman of Fundraising Campaign, United Way of Westchester and Putnam Counties, New York (1990–1995). Trustee of various trusts within the John Hancock Fund Complex (since 2008).
| Non-Independent Trustees3 | ||||||||
Name, year of birth Position(s) held with Trust Principal occupation(s) and other directorships during past 5 years | | Trustee of the Trust since1 |
| | Number of John Hancock funds overseen by Trustee |
| ||
Andrew G. Arnott, Born: 1971
|
| 2017
|
|
| 196
|
| ||
President and Non-Independent Trustee
Head of Wealth and Asset Management, United States and Europe, for John Hancock and Manulife (since 2018); Executive Vice President, John Hancock Financial Services (since 2009, including prior positions); Director and Executive Vice President, John Hancock Investment Management LLC (since 2005, including prior positions); Director and Executive Vice President, John Hancock Variable Trust Advisers LLC (since 2006, including prior positions); President, John Hancock Investment Management Distributors LLC (since 2004, including prior positions); President of various trusts within the John Hancock Fund Complex (since 2007, including prior positions). Trustee of various trusts within the John Hancock Fund Complex (since 2017). |
| |||||||
Marianne Harrison, Born: 1963
|
| 2018
|
|
| 196
|
| ||
Non-Independent Trustee
| ||||||||
President and CEO, John Hancock (since 2017); President and CEO, Manulife Canadian Division (2013–2017); Member, Board of Directors, CAE Inc. (since 2019); Member, Board of Directors, MA Competitive Partnership Board (since 2018); Member, Board of Directors, American Council of Life Insurers (ACLI) (since 2018); Member, Board of Directors, Communitech, an industry-led innovation center that fosters technology companies in Canada (2017-2019); Member, Board of Directors, Manulife Assurance Canada (2015-2017); Board Member, St. Mary’s General Hospital Foundation (2014-2017); Member, Board of Directors, Manulife Bank of Canada (2013- 2017); Member, Standing Committee of the Canadian Life & Health Assurance Association (2013-2017); Member, Board of Directors, John Hancock USA, John Hancock Life & Health, John Hancock New York (2012–2013). Trustee of various trusts within the John Hancock Fund Complex (since 2018).
| 43 | JOHN HANCOCK CLASSIC VALUE FUND | ANNUAL REPORT |
Table of Contents
|
Principal officers who are not Trustees | ||||
Name, year of birth Position(s) held with Trust Principal occupation(s) during past 5 years | | Officer of the Trust since | | |
Charles A. Rizzo, Born: 1957
|
| 2007
|
| |
Chief Financial Officer
| ||||
| Vice President, John Hancock Financial Services (since 2008); Senior Vice President, John Hancock Investment Management LLC and John Hancock Variable Trust Advisers LLC (since 2008); Chief Financial Officer of various trusts within the John Hancock Fund Complex (since 2007). |
| |||
Salvatore Schiavone, Born: 1965
|
| 2010
|
| |
Treasurer
| ||||
| Assistant Vice President, John Hancock Financial Services (since 2007); Vice President, John Hancock Investment Management LLC and John Hancock Variable Trust Advisers LLC (since 2007); Treasurer of various trusts within the John Hancock Fund Complex (since 2007, including prior positions). |
| |||
Christopher (Kit) Sechler, Born: 1973
|
| 2018
|
| |
Chief Legal Officer and Secretary
| ||||
| Vice President and Deputy Chief Counsel, John Hancock Investments (since 2015); Assistant Vice President and Senior Counsel (2009–2015), John Hancock Investments; Chief Legal Officer and Secretary of various trusts within the John Hancock Fund Complex (since 2018); Assistant Secretary of John Hancock Investment Management LLC and John Hancock Variable Trust Advisers LLC (since 2009). |
| |||
Trevor Swanberg, Born: 1979
|
| 2020
|
| |
Chief Compliance Officer
| ||||
| Chief Compliance Officer, various trusts within the John Hancock Fund Complex, John Hancock Investment Management LLC, and John Hancock Variable Trust Advisers LLC (since 2020); Deputy Chief Compliance Officer, various trusts within the John Hancock Fund Complex (2018–2020); Deputy Chief Compliance Officer, John Hancock Investment Management LLC and John Hancock Variable Trust Advisers LLC (2019–2020); Assistant Chief Compliance Officer, various trusts within the John Hancock Fund Complex (2016–2018); Assistant Chief Compliance Officer, John Hancock Investment Management LLC and John Hancock Variable Trust Advisers LLC (2016–2019); Vice President, State Street Global Advisors (2015–2016). |
| |||
The business address for all Trustees and Officers is 200 Berkeley Street, Boston, Massachusetts 02116-5023.
The Statement of Additional Information of the fund includes additional information about members of the Board of Trustees of the Trust and is available without charge, upon request, by calling 800-225-5291.
| 1 | Each Trustee holds office until his or her successor is elected and qualified, or until the Trustee’s death, retirement, resignation, or removal. Mr. Boyle has served as Trustee at various times prior to the date listed in the table. |
| 2 | Member of the Audit Committee. |
| 3 | The Trustee is a Non-Independent Trustee due to current or former positions with the Advisor and certain affiliates. |
| * | Appointed as Independent Trustee effective as of September 15, 2020. |
| ANNUAL REPORT | JOHN HANCOCK CLASSIC VALUE FUND | 44 |
Table of Contents
|
| Trustees | Investment advisor | |
| Hassell H. McClellan, Chairperson | John Hancock Investment Management LLC | |
| Steven R. Pruchansky, Vice Chairperson | ||
| Andrew G. Arnott† | Subadvisor | |
| Charles L. Bardelis* | Pzena Investment Management, LLC | |
| James R. Boyle | ||
| Peter S. Burgess* | Portfolio Managers | |
| William H. Cunningham | John J. Flynn | |
| Grace K. Fey | Richard S. Pzena | |
| Marianne Harrison† | Benjamin S. Silver, CFA, CPA | |
| Deborah C. Jackson | ||
| James M. Oates* | Principal distributor | |
| Frances G. Rathke1,* | John Hancock Investment Management Distributors LLC | |
| Gregory A. Russo | ||
| Custodian | ||
| Officers | State Street Bank and Trust Company | |
| Andrew G. Arnott | ||
| President | Transfer agent | |
| Charles A. Rizzo | John Hancock Signature Services, Inc. | |
| Chief Financial Officer | ||
| Salvatore Schiavone | Legal counsel | |
| Treasurer | K&L Gates LLP | |
| Christopher (Kit) Sechler | ||
| Secretary and Chief Legal Officer | Independent registered public accounting firm | |
| Trevor Swanberg2 | PricewaterhouseCoopers LLP | |
| Chief Compliance Officer | ||
* Member of the Audit Committee
† Non-Independent Trustee
1 Appointed as Independent Trustee effective as of September 15, 2020
2 Effective July 31, 2020
The fund’s proxy voting policies and procedures, as well as the fund proxy voting record for the most recent twelve-month period ended June 30, are available free of charge on the Securities and Exchange Commission (SEC) website at sec.gov or on our website.
All of the fund’s holdings as of the end of the third month of every fiscal quarter are filed with the SEC on Form N-PORT within 60 days of the end of the fiscal quarter. The fund’s Form N-PORT filings are available on our website and the SEC’s website, sec.gov.
We make this information on your fund, as well as monthly portfolio holdings, and other fund details available on our website at jhinvestments.com or by calling 800-225-5291.
| You can also contact us: | ||||||
| 800-225-5291 | Regular mail: | Express mail: | ||||
| jhinvestments.com | John Hancock Signature Services, Inc. | John Hancock Signature Services, Inc. | ||||
| P.O. Box 219909 | 430 W 7th Street | |||||
| Kansas City, MO 64121-9909 | Suite 219909 | |||||
| Kansas City, MO 64105-1407 | ||||||
| 45 | JOHN HANCOCK CLASSIC VALUE FUND | ANNUAL REPORT |
Table of Contents
Protect yourself by using eDelivery
Signing up for the electronic delivery of your statements and other financial publications is a great way to help protect your privacy. eDelivery provides you with secure, instant access to all of your statements in one convenient location.
| BENEFITS OF EDELIVERY
| ||||||||
 | Added security: Password protection helps you safely retrieve documents online | |||||||
| Save time: Receive instant email notification once statements are available
|
jhinvestments.com/login | ||||||
| Reduce clutter: View documents online to reduce the amount of paper for filing, shredding, or recycling | |||||||
| SIGN UP FOR EDELIVERY TODAY!
| ||||||||

Direct shareholders
If you receive statements directly through John Hancock Investment Management and would like to participate in eDelivery, go to jhinvestments.com/login. To log in to your account, click on the “Log in” button on the page’s top right corner. In the “Access your investments account” area, go to the “Individual retirement or mutual fund account” section and select the option that applies to you. Please be aware that you may be required to provide your account number and certain personal account information.
You may revoke your consent at any time by simply visiting jhinvestments.com/login and following the instructions above. You may also revoke consent by calling 800-225-5291 or by writing to us at the following address: John Hancock Signature Services, P.O. Box 219909, Kansas City, MO 64121-9909. We reserve the right to deliver documents to you on paper at any time should the need arise.
Brokerage account shareholders
If you receive statements directly from your bank or broker and would like to participate in eDelivery, go to icsdelivery/live or contact your financial representative.
Not part of the shareholder report
Table of Contents
Get your questions answered by using our shareholder resources
ONLINE
| ||||||
| Visit jhinvestments.com to access a range of resources for individual investors, from account details and fund information to forms and our latest insight on the markets and economy. | |||||
| Use our Fund Compare tool to compare thousands of funds and ETFs across dozens of risk and performance metrics—all powered by Morningstar. | |||||
| Visit our online Tax Center, where you’ll find helpful taxpayer resources all year long, including tax forms, planning guides, and other fund-specific information. | |||||
| Follow us on Facebook, Twitter, and LinkedIn to get the latest updates on the markets and what’s trending now. | |||||
BY PHONE
| ||||||
| Call our customer service representatives at 800-225-5291, Monday to Thursday, 8:00 A.M. to 7:00 P.M., and Friday, 8:00 A.M. to 6:00 P.M., Eastern time. We’re here to help! | ||||||
Not part of the shareholder report
Table of Contents
John Hancock family of funds
|
DOMESTIC EQUITY FUNDS
Blue Chip Growth
Classic Value
Disciplined Value
Disciplined Value Mid Cap
Equity Income
Financial Industries
Fundamental All Cap Core
Fundamental Large Cap Core
New Opportunities
Regional Bank
Small Cap Core
Small Cap Growth
Small Cap Value
U.S. Global Leaders Growth
U.S. Growth
GLOBAL AND INTERNATIONAL EQUITY FUNDS
Disciplined Value International
Emerging Markets
Emerging Markets Equity
Fundamental Global Franchise
Global Equity
Global Shareholder Yield
Global Thematic Opportunities
International Dynamic Growth
International Growth
International Small Company
INCOME FUNDS
Bond
California Tax-Free Income
Emerging Markets Debt
Floating Rate Income
Government Income
High Yield
High Yield Municipal Bond
Income
Investment Grade Bond
Money Market
Short Duration Bond
Short Duration Credit Opportunities
Strategic Income Opportunities
Tax-Free Bond
ALTERNATIVE AND SPECIALTY FUNDS
Absolute Return Currency
Alternative Asset Allocation
Alternative Risk Premia
Diversified Macro
Infrastructure
Multi-Asset Absolute Return
Real Estate Securities
Seaport Long/Short
A fund’s investment objectives, risks, charges, and expenses should be considered carefully before investing. The prospectus contains this and other important information about the fund. To obtain a prospectus, contact your financial professional, call John Hancock Investment Management at 800-225-5291, or visit our website at jhinvestments.com. Please read the prospectus carefully before investing or sending money.
Table of Contents
|
ASSET ALLOCATION
Balanced
Multi-Asset High Income
Multi-Index Lifetime Portfolios
Multi-Index Preservation Portfolios
Multimanager Lifestyle Portfolios
Multimanager Lifetime Portfolios
Retirement Income 2040
EXCHANGE-TRADED FUNDS
John Hancock Multifactor Consumer Discretionary ETF
John Hancock Multifactor Consumer Staples ETF
John Hancock Multifactor Developed International ETF
John Hancock Multifactor Emerging Markets ETF
John Hancock Multifactor Energy ETF
John Hancock Multifactor Financials ETF
John Hancock Multifactor Healthcare ETF
John Hancock Multifactor Industrials ETF
John Hancock Multifactor Large Cap ETF
John Hancock Multifactor Materials ETF
John Hancock Multifactor Media and
Communications ETF
John Hancock Multifactor Mid Cap ETF
John Hancock Multifactor Small Cap ETF
John Hancock Multifactor Technology ETF
John Hancock Multifactor Utilities ETF
ENVIRONMENTAL, SOCIAL, AND
GOVERNANCE FUNDS
ESG All Cap Core
ESG Core Bond
ESG International Equity
ESG Large Cap Core
CLOSED-END FUNDS
Financial Opportunities
Hedged Equity & Income
Income Securities Trust
Investors Trust
Preferred Income
Preferred Income II
Preferred Income III
Premium Dividend
Tax-Advantaged Dividend Income
Tax-Advantaged Global Shareholder Yield
John Hancock Multifactor ETF shares are bought and sold at market price (not NAV), and are not individually redeemed from the fund. Brokerage commissions will reduce returns.
John Hancock ETFs are distributed by Foreside Fund Services, LLC, and are subadvised by Dimensional Fund Advisors LP. Foreside is not affiliated with John Hancock Investment Management Distributors LLC or Dimensional Fund Advisors LP.
Dimensional Fund Advisors LP receives compensation from John Hancock in connection with licensing rights to the John Hancock Dimensional indexes. Dimensional Fund Advisors LP does not sponsor, endorse, or sell, and makes no representation as to the advisability of investing in, John Hancock Multifactor ETFs.
Table of Contents
John Hancock Investment Management
A trusted brand
John Hancock Investment Management is a premier asset manager with a heritage of financial stewardship dating back to 1862. Helping our shareholders pursue their financial goals is at the core of everything we do. It’s why we support the role of professional financial advice and operate with the highest standards of conduct and integrity.
A better way to invest
We serve investors globally through a unique multimanager approach: We search the world to find proven portfolio teams with specialized expertise for every strategy we offer, then we apply robust investment oversight to ensure they continue to meet our uncompromising standards and serve the best interests of our shareholders.
Results for investors
Our unique approach to asset management enables us to provide a diverse set of investments backed by some of the world’s best managers, along with strong risk-adjusted returns across asset classes.
|

John Hancock Investment Management Distributors LLC ∎ Member FINRA, SIPC
200 Berkeley Street ∎ Boston, MA 02116-5010 ∎ 800-225-5291 ∎ jhinvestments.com
This report is for the information of the shareholders of John Hancock Classic Value Fund. It is not authorized for distribution to prospective investors unless preceded or accompanied by a prospectus.

MF1399309 | 38A 10/20 | |||
| 12/2020 |
Table of Contents
Table of Contents
Dear shareholder,
Despite heightened fears over the coronavirus (COVID-19), which sent markets tumbling in the first quarter of the calendar year, global financial markets delivered positive returns for the 12 months ended October 31, 2020. In response to the pandemic-led shock, the U.S. Federal Reserve and the government worked quickly to shore up the economy and equity markets began to rise, particularly large-cap U.S. growth stocks, during the period.
Of course, it would be a mistake to consider this market turnaround a trustworthy signal of assured or swift economic recovery. Economic growth has slowed as the ongoing spread of COVID-19 continues to create uncertainty among businesses and investors. Lockdowns and curfews in certain areas have been reinstated, affecting the level of unemployment and the pace of hiring. Consumer spending also remains far below prepandemic levels.
From an investment perspective, we continue to think that maintaining a focus on long-term objectives while pursuing a risk-aware strategy is a prudent way forward. Above all, we believe the counsel of a trusted financial professional continues to matter now more than ever. Periods of heightened uncertainty are precisely the time to review your financial goals and follow a plan that helps you make the most of what continues to be a challenging situation.
On behalf of everyone at John Hancock Investment Management, I’d like to take this opportunity to welcome new shareholders and thank existing shareholders for the continued trust you’ve placed in us.
Sincerely,
Andrew G. Arnott |
President and CEO, |
John Hancock Investment Management |
Head of Wealth and Asset Management, |
United States and Europe |
This commentary reflects the CEO’s views as of this report’s period end and are subject to change at any time. Diversification does not guarantee investment returns and does not eliminate risk of loss. All investments entail risks, including the possible loss of principal. For more up-to-date information, you can visit our website at jhinvestments.com.
Table of Contents
John Hancock
U.S. Global Leaders Growth Fund
| Table of contents | ||||||
| 2 | Your fund at a glance | |||||
| 4 | Manager’s discussion of fund performance | |||||
| 6 | A look at performance | |||||
| 8 | ||||||
| 10 | ||||||
| 12 | ||||||
| 15 | ||||||
| 20 | ||||||
| 28 | ||||||
| 29 | ||||||
| 30 | Continuation of investment advisory and subadvisory agreements | |||||
| 37 | ||||||
| 41 | ||||||
| 1 | JOHN HANCOCK U.S. GLOBAL LEADERS GROWTH FUND | ANNUAL REPORT |
Table of Contents
|
INVESTMENT OBJECTIVE
The fund seeks long-term growth of capital.
AVERAGE ANNUAL TOTAL RETURNS AS OF 10/31/2020 (%)
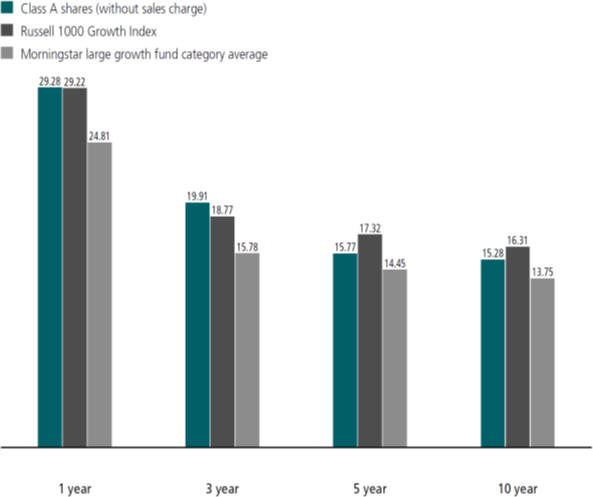
The Russell 1000 Growth Index is an unmanaged index of companies in the Russell 1000 Index (the 1,000 largest U.S. publicly traded companies) with high price-to-book ratios and higher forecasted growth values.
It is not possible to invest directly in an index. Index figures do not reflect expenses or sales charges, which would result in lower returns.
The fund’s Morningstar category average is a group of funds with similar investment objectives and strategies and is the equal-weighted return of all funds per category. Morningstar places funds in certain categories based on their historical portfolio holdings. Figures from Morningstar, Inc. include reinvested distributions and do not take into account sales charges. Actual load-adjusted performance is lower.
The past performance shown here reflects reinvested distributions and the beneficial effect of any expense reductions, and does not guarantee future results. Performance of the other share classes will vary based on the difference in the fees and expenses of those classes. Shares will fluctuate in value and, when redeemed, may be worth more or less than their original cost. Current month-end performance may be lower or higher than the performance cited, and can be found at jhinvestments.com or by calling 800-225-5291. For further information on the fund’s objectives, risks, and strategy, see the fund’s prospectus.
| ANNUAL REPORT | JOHN HANCOCK U.S. GLOBAL LEADERS GROWTH FUND | 2 |
Table of Contents
|
PERFORMANCE HIGHLIGHTS OVER THE LAST TWELVE MONTHS
Stocks overcame pandemic fears to post solid gains | ||||
Stocks advanced for the period despite elevated market volatility resulting from the COVID-19 pandemic and its adverse impact on global trade and economic growth. | ||||
Large-cap growth stocks led the market higher | ||||
In an uncertain economic environment, investors flocked to large, growth-oriented stocks, which posted outsize returns. | ||||
The fund outperformed its benchmark | ||||
Owning companies that produce consistent, predictable earnings and revenue growth regardless of the economic environment helped the fund’s Class A shares (excluding sales charges) outpace the benchmark. | ||||
SECTOR COMPOSITION AS OF 10/31/2020 (% of net assets)
|
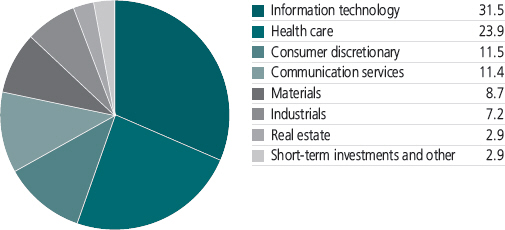
A note about risks
The fund may be subject to various risks as described in the fund’s prospectus. A widespread health crisis such as a global pandemic could cause substantial market volatility, exchange trading suspensions and closures, impact the ability to complete redemptions, and affect fund performance. For example, the novel coronavirus disease (COVID-19) has resulted in significant disruptions to global business activity. The impact of a health crisis and other epidemics and pandemics that may arise in the future, could affect the global economy in ways that cannot necessarily be foreseen at the present time. A health crisis may exacerbate other pre-existing political, social, and economic risks. Any such impact could adversely affect the fund’s performance, resulting in losses to your investment. For more information, please refer to the “Principal risks” section of the prospectus.
| 3 | JOHN HANCOCK U.S. GLOBAL LEADERS GROWTH FUND | ANNUAL REPORT |
Table of Contents
Manager’s discussion of fund performance
|
Can you describe the market environment during the 12 months ended October 31, 2020?
Market volatility escalated in response to the COVID-19 pandemic, which led to widespread shutdowns of traditional commerce and significant economic dislocations. The world’s central banks responded by significantly expanding accommodative monetary policies, while governments announced substantial fiscal stimulus measures. Stocks initially plunged amid the pandemic-driven lockdowns, but the gradual reopening of the U.S. economy during the summer provided enough optimism to fuel a strong stock market recovery. Although a resurgence of coronavirus cases put downward pressure on the market in the last two months, the broad equity market indexes still gained for the period.
How did the fund perform?
The fund’s Class A shares (excluding sales charges) posted a positive return and outpaced the benchmark, the Russell 1000 Growth Index. Our focus on companies exhibiting consistent, sustainable growth was a positive factor given the uncertain economic environment. In addition, our investment approach has historically fared well during periods of heightened market volatility.
TOP 10 HOLDINGS | ||||||||
| AS OF 10/31/2020 (% of net assets) | ||||||||
| ||||||||
| Microsoft Corp. | 4.9 | |||||||
| ||||||||
| Visa, Inc., Class A | 4.8 | |||||||
| ||||||||
| Facebook, Inc., Class A | 4.6 | |||||||
| ||||||||
| Alphabet, Inc., Class C | 4.6 | |||||||
| ||||||||
| Amazon.com, Inc. | 4.6 | |||||||
| ||||||||
| Workday, Inc., Class A | 4.1 | |||||||
| ||||||||
| Abbott Laboratories | 3.9 | |||||||
| ||||||||
| UnitedHealth Group, Inc. | 3.8 | |||||||
| ||||||||
| FleetCor Technologies, Inc. | 3.7 | |||||||
| ||||||||
| Ball Corp. | 3.6 | |||||||
| ||||||||
| TOTAL | 42.6 | |||||||
| Cash and cash equivalents are not included. | ||||||||
| ||||||||
| ANNUAL REPORT | JOHN HANCOCK U.S. GLOBAL LEADERS GROWTH FUND | 4 |
Table of Contents
|
Which fund holdings had a significant impact on performance?
Healthcare stocks contributed the most to relative performance, led by biotechnology firm Regeneron Pharmaceuticals, Inc. In addition to reporting consistently strong earnings, Regeneron benefited from easing concerns about competition for its flagship medication. Another leading contributor was online payment processor PayPal Holdings, Inc., whose | MANAGED BY
Gordon M. Marchand, CPA, CFA, CIC Robert L. Rohn Kishore Rao
| |
expanding user base helped drive strong operating leverage and robust free cash flow generation. On the down side, the most notable detractors included business payments processor FleetCor Technologies, Inc. and online travel services provider Booking Holdings, Inc. FleetCor was adversely affected by the halt in economic activity and a sharp drop in energy prices, which led to lower-than-expected earnings. Weakness in the travel industry weighed on Booking Holdings, and we eliminated the stock from the portfolio. | ||

What other changes did you make to the portfolio during the reporting period?
The increased market volatility provided opportunities to add high-quality companies to the portfolio at attractive valuations. New holdings included medical equipment maker Intuitive Surgical, Inc., semiconductor manufacturer Xilinx, Inc., online dating platform Match Group, Inc., metal container manufacturer Ball Corp., railroad company Union Pacific Corp., and medical instruments manufacturer Thermo Fisher Scientific, Inc. We liquidated the fund’s positions in a number of holdings, including home improvement retailer Lowe’s Companies, Inc., cosmetics producer Estee Lauder Companies, Inc., drugmaker Novo Nordisk A/S, snack food company Mondelez International, Inc., and discount retailer TJX Companies, Inc.
The views expressed in this report are exclusively those of Gordon M. Marchand, CPA, CFA, CIC, Sustainable Growth Advisers, LP, and are subject to change. They are not meant as investment advice. Please note that the holdings discussed in this report may not have been held by the fund for the entire period. Portfolio composition is subject to review in accordance with the fund’s investment strategy and may vary in the future. Current and future portfolio holdings are subject to risk.
| 5 | JOHN HANCOCK U.S. GLOBAL LEADERS GROWTH FUND | ANNUAL REPORT |
Table of Contents
|
TOTAL RETURNS FOR THE PERIOD ENDED OCTOBER 31, 2020
|
| |||||||||||||||||||||
| Average annual total returns (%) | Cumulative total returns (%) | |||||||||||||||||||||
| with maximum sales charge | with maximum sales charge | |||||||||||||||||||||
| 1-year | 5-year | 10-year | 5-year | 10-year | ||||||||||||||||||
Class A | 22.82 | 14.59 | 14.69 | 97.55 | 293.87 | |||||||||||||||||
Class C | 27.30 | 14.90 | 14.42 | 100.28 | 284.56 | |||||||||||||||||
Class I1 | 29.58 | 16.06 | 15.61 | 110.60 | 326.51 | |||||||||||||||||
Class R21,2 | 29.11 | 15.61 | 15.18 | 106.54 | 311.01 | |||||||||||||||||
Class R61,2 | 29.74 | 16.19 | 15.68 | 111.73 | 329.12 | |||||||||||||||||
Index 1† | 29.22 | 17.32 | 16.31 | 122.26 | 352.90 | |||||||||||||||||
Index 2† | 9.71 | 11.71 | 13.01 | 73.97 | 239.87 | |||||||||||||||||
Performance figures assume all distributions have been reinvested. Figures reflect maximum sales charges on Class A shares of 5% and the applicable contingent deferred sales charge (CDSC) on Class C shares. Class C shares sold within one year of purchase are subject to a 1% CDSC. Sales charges are not applicable to Class I, Class R2, and Class R6 shares.
The expense ratios of the fund, both net (including any fee waivers and/or expense limitations) and gross (excluding any fee waivers and/or expense limitations), are set forth according to the most recent publicly available prospectuses for the fund and may differ from those disclosed in the Financial highlights tables in this report. Net expenses reflect contractual expense limitations in effect until July 31, 2022 and are subject to change. Had the contractual fee waivers and expense limitations not been in place, gross expenses would apply. The expense ratios are as follows:
| Class A | Class C | Class I | Class R2 | Class R6 | ||||||||
Gross (%) | 1.16 | 1.91 | 0.91 | 1.31 | 0.81 | |||||||
Net (%) | 1.15 | 1.90 | 0.90 | 1.30 | 0.80 |
Please refer to the most recent prospectus and annual or semiannual report for more information on expenses and any expense limitation arrangements for each class.
The returns reflect past results and should not be considered indicative of future performance. The return and principal value of an investment will fluctuate so that shares, when redeemed, may be worth more or less than their original cost. Due to market volatility and other factors, the fund’s current performance may be higher or lower than the performance shown. For current to the most recent month-end performance data, please call 800–225–5291 or visit the fund’s website at jhinvestments.com.
The performance table above and the chart on the next page do not reflect the deduction of taxes that a shareholder would pay on fund distributions or the redemption of fund shares. The fund’s performance results reflect any applicable fee waivers or expense reductions, without which the expenses would increase and results would have been less favorable.
| † | Index 1 is the Russell 1000 Growth Index; Index 2 is the S&P 500 Index. |
See the following page for footnotes.
| ANNUAL REPORT | JOHN HANCOCK U.S. GLOBAL LEADERS GROWTH FUND | 6 |
Table of Contents
|
This chart and table show what happened to a hypothetical $10,000 investment in John Hancock U.S. Global Leaders Growth Fund for the share classes and periods indicated, assuming all distributions were reinvested. For comparison, we’ve shown the same investment in two separate indexes.
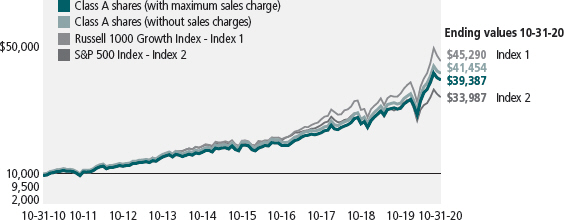
| Start date | With maximum sales charge ($) | Without sales charge ($) | Index 1 ($) | Index 2 ($) | ||||||||||||||||
Class C3 | 10-31-10 | 38,456 | 38,456 | 45,290 | 33,987 | |||||||||||||||
Class I1 | 10-31-10 | 42,651 | 42,651 | 45,290 | 33,987 | |||||||||||||||
Class R21,2 | 10-31-10 | 41,101 | 41,101 | 45,290 | 33,987 | |||||||||||||||
Class R61,2 | 10-31-10 | 42,912 | 42,912 | 45,290 | 33,987 | |||||||||||||||
The Russell 1000 Growth Index is an unmanaged index of companies in the Russell 1000 Index (the 1,000 largest U.S. publicly traded companies) with high price-to-book ratios and higher forecasted growth values. The S&P 500 Index is an unmanaged index that includes 500 widely traded common stocks.
It is not possible to invest directly in an index. Index figures do not reflect expenses or sales charges, which would result in lower returns.
Footnotes related to performance pages
| 1 | For certain types of investors, as described in the fund’s prospectus. |
| 2 | Class R2 and Class R6 shares were first offered on 3-1-12 and 9-1-11, respectively. Returns prior to these dates are those of Class A shares that have not been adjusted for class-specific expenses; otherwise, returns would vary. |
| 3 | The contingent deferred sales charge is not applicable. |
| 7 | JOHN HANCOCK U.S. GLOBAL LEADERS GROWTH FUND | ANNUAL REPORT |
Table of Contents
|
These examples are intended to help you understand your ongoing operating expenses of investing in the fund so you can compare these costs with the ongoing costs of investing in other mutual funds.
Understanding fund expenses
As a shareholder of the fund, you incur two types of costs:
| ∎ | Transaction costs, which include sales charges (loads) on purchases or redemptions (varies by share class), minimum account fee charge, etc. |
| ∎ | Ongoing operating expenses, including management fees, distribution and service fees (if applicable), and other fund expenses. |
We are presenting only your ongoing operating expenses here.
Actual expenses/actual returns
The first line of each share class in the table on the following page is intended to provide information about the fund’s actual ongoing operating expenses, and is based on the fund’s actual return. It assumes an account value of $1,000.00 on May 1, 2020, with the same investment held until October 31, 2020.
Together with the value of your account, you may use this information to estimate the operating expenses that you paid over the period. Simply divide your account value at October 31, 2020, by $1,000.00, then multiply it by the “expenses paid” for your share class from the table. For example, for an account value of $8,600.00, the operating expenses should be calculated as follows:
Hypothetical example for comparison purposes
The second line of each share class in the table on the following page allows you to compare the fund’s ongoing operating expenses with those of any other fund. It provides an example of the fund’s hypothetical account values and hypothetical expenses based on each class’s actual expense ratio and an assumed 5% annualized return before expenses (which is not the class’s actual return). It assumes an account value of $1,000.00 on May 1, 2020, with the same investment held until October 31, 2020. Look in any other fund shareholder report to find its hypothetical example and you will be able to compare these expenses. Please remember that these hypothetical account values and expenses may not be used to estimate the actual ending account balance or expenses you paid for the period.
| ANNUAL REPORT | JOHN HANCOCK U.S. GLOBAL LEADERS GROWTH FUND | 8 |
Table of Contents
|
Remember, these examples do not include any transaction costs, therefore, these examples will not help you to determine the relative total costs of owning different funds. If transaction costs were included, your expenses would have been higher. See the prospectus for details regarding transaction costs.
SHAREHOLDER EXPENSE EXAMPLE CHART
| Account value on 5-1-2020 | Ending value on 10-31-2020 | Expenses paid during period ended 10-31-20201 | Annualized expense ratio | |||||||||||||||
Class A | Actual expenses/actual returns | $1,000.00 | $1,205.70 | $ 6.32 | 1.14% | |||||||||||||
| Hypothetical example | 1,000.00 | 1,019.40 | 5.79 | 1.14% | ||||||||||||||
Class C | Actual expenses/actual returns | 1,000.00 | 1,201.10 | 10.46 | 1.89% | |||||||||||||
| Hypothetical example | 1,000.00 | 1,015.60 | 9.58 | 1.89% | ||||||||||||||
Class I | Actual expenses/actual returns | 1,000.00 | 1,207.10 | 4.94 | 0.89% | |||||||||||||
| Hypothetical example | 1,000.00 | 1,020.70 | 4.52 | 0.89% | ||||||||||||||
Class R2 | Actual expenses/actual returns | 1,000.00 | 1,204.90 | 6.98 | 1.26% | |||||||||||||
| Hypothetical example | 1,000.00 | 1,018.80 | 6.39 | 1.26% | ||||||||||||||
Class R6 | Actual expenses/actual returns | 1,000.00 | 1,207.80 | 4.38 | 0.79% | |||||||||||||
| Hypothetical example | 1,000.00 | 1,021.20 | 4.01 | 0.79% | ||||||||||||||
| 1 | Expenses are equal to the annualized expense ratio, multiplied by the average account value over the period, multiplied by 184/366 (to reflect the one-half year period). |
| 9 | JOHN HANCOCK U.S. GLOBAL LEADERS GROWTH FUND | ANNUAL REPORT |
Table of Contents
|
AS OF 10-31-20
| Shares | Value | |||||||
Common stocks 97.1% | $ | 1,961,537,888 | ||||||
(Cost $1,203,235,565) | ||||||||
Communication services 11.4% | 229,634,129 | |||||||
Interactive media and services 11.4% | ||||||||
Alphabet, Inc., Class C (A) | 57,270 | 92,835,243 | ||||||
Facebook, Inc., Class A (A) | 355,086 | 93,426,677 | ||||||
Match Group, Inc. (A) | 371,401 | 43,372,209 | ||||||
Consumer discretionary 11.5% | 232,457,541 | |||||||
Hotels, restaurants and leisure 3.5% | ||||||||
Yum! Brands, Inc. | 764,347 | 71,336,506 | ||||||
Internet and direct marketing retail 4.6% | ||||||||
Amazon.com, Inc. (A) | 30,355 | 92,162,333 | ||||||
Textiles, apparel and luxury goods 3.4% | ||||||||
NIKE, Inc., Class B | 574,273 | 68,958,702 | ||||||
Health care 23.9% | 483,051,229 | |||||||
Biotechnology 1.9% | ||||||||
Regeneron Pharmaceuticals, Inc. (A) | 70,210 | 38,163,348 | ||||||
Health care equipment and supplies 12.6% | ||||||||
Abbott Laboratories | 748,230 | 78,646,455 | ||||||
Becton, Dickinson and Company | 234,580 | 54,218,475 | ||||||
Danaher Corp. | 313,249 | 71,903,175 | ||||||
Intuitive Surgical, Inc. (A) | 73,993 | 49,359,250 | ||||||
Health care providers and services 3.8% | ||||||||
UnitedHealth Group, Inc. | 251,590 | 76,770,173 | ||||||
Life sciences tools and services 5.6% | ||||||||
Illumina, Inc. (A) | 163,281 | 47,792,349 | ||||||
Thermo Fisher Scientific, Inc. | 139,918 | 66,198,004 | ||||||
Industrials 7.2% | 144,549,587 | |||||||
Professional services 3.6% | ||||||||
IHS Markit, Ltd. | 883,986 | 71,487,948 | ||||||
Road and rail 3.6% | ||||||||
Union Pacific Corp. | 412,335 | 73,061,639 | ||||||
Information technology 31.5% | 636,738,461 | |||||||
IT services 11.9% | ||||||||
FleetCor Technologies, Inc. (A) | 332,818 | 73,522,824 | ||||||
PayPal Holdings, Inc. (A) | 369,040 | 68,689,415 | ||||||
Visa, Inc., Class A | 537,288 | 97,630,602 | ||||||
Semiconductors and semiconductor equipment 2.0% | ||||||||
Xilinx, Inc. | 340,597 | 40,425,458 | ||||||
| SEE NOTES TO FINANCIAL STATEMENTS | ANNUAL REPORT | JOHN HANCOCK U.S. GLOBAL LEADERS GROWTH FUND | 10 |
Table of Contents
|
| Shares | Value | |||||||||||
Information technology (continued) | ||||||||||||
Software 17.6% | ||||||||||||
Autodesk, Inc. (A) | 284,361 | $66,978,390 | ||||||||||
Intuit, Inc. | 120,042 | 37,774,817 | ||||||||||
Microsoft Corp. | 490,100 | 99,230,547 | ||||||||||
salesforce.com, Inc. (A) | 296,986 | 68,980,938 | ||||||||||
Workday, Inc., Class A (A) | 397,418 | 83,505,470 | ||||||||||
Materials 8.7% | 175,908,676 | |||||||||||
Chemicals 5.1% | ||||||||||||
Ecolab, Inc. | 292,816 | 53,758,089 | ||||||||||
Linde PLC | 220,811 | 48,653,497 | ||||||||||
Containers and packaging 3.6% | ||||||||||||
Ball Corp. | 825,810 | 73,497,090 | ||||||||||
Real estate 2.9% | 59,198,265 | |||||||||||
Equity real estate investment trusts 2.9% | ||||||||||||
Equinix, Inc. | 80,956 | 59,198,265 | ||||||||||
| Yield | (%) | Shares | Value | |||||||||
Short-term investments 2.7%
|
|
$54,583,100
|
| |||||||||
(Cost $54,583,100) | ||||||||||||
Short-term funds 2.7% | 54,583,100 | |||||||||||
State Street Institutional U.S. Government Money Market Fund, Premier Class | 0.0257 | (B) | 54,583,100 | 54,583,100 | ||||||||
Total investments (Cost $1,257,818,665) 99.8%
|
|
$2,016,120,988
|
| |||||||||
Other assets and liabilities, net 0.2%
|
|
3,440,728
|
| |||||||||
Total net assets 100.0%
|
|
$2,019,561,716
|
| |||||||||
The percentage shown for each investment category is the total value of the category as a percentage of the net assets of the fund.
Security Abbreviations and Legend
| (A) | Non-income producing security. | |
(B) | The rate shown is the annualized seven-day yield as of 10-31-20. | |
At 10-31-20, the aggregate cost of investments for federal income tax purposes was $1,259,452,121. Net unrealized appreciation aggregated to $756,668,867, of which $756,668,867 related to gross unrealized appreciation and $0 related to gross unrealized depreciation.
| 11 | JOHN HANCOCK U.S. GLOBAL LEADERS GROWTH FUND | ANNUAL REPORT | SEE NOTES TO FINANCIAL STATEMENTS |
Table of Contents
|
| STATEMENT OF ASSETS AND LIABILITIES 10-31-20 |
| |||
Assets | ||||
Unaffiliated investments, at value (Cost $1,257,818,665) | $2,016,120,988 | |||
Dividends and interest receivable | 803,917 | |||
Receivable for fund shares sold | 7,150,687 | |||
Other assets | 101,856 | |||
Total assets | 2,024,177,448 | |||
Liabilities | ||||
Payable for investments purchased | 1,244 | |||
Payable for fund shares repurchased | 2,574,426 | |||
Payable to affiliates | ||||
Investment management fees | 1,290,040 | |||
Accounting and legal services fees | 76,908 | |||
Transfer agent fees | 175,501 | |||
Distribution and service fees | 278,630 | |||
Other liabilities and accrued expenses | 218,983 | |||
Total liabilities | 4,615,732 | |||
Net assets | $2,019,561,716 | |||
Net assets consist of | ||||
Paid-in capital | $1,038,979,354 | |||
Total distributable earnings (loss) | 980,582,362 | |||
Net assets | $2,019,561,716 | |||
Net asset value per share | ||||
Based on net asset value and shares outstanding - the fund has an unlimited number of shares authorized with no par value | ||||
Class A ($921,236,701 ÷ 14,716,705 shares)1 | $62.60 | |||
Class C ($81,726,172 ÷ 1,634,474 shares)1 | $50.00 | |||
Class I ($661,701,566 ÷ 9,660,850 shares) | $68.49 | |||
Class R2 ($1,825,074 ÷ 27,515 shares) | $66.33 | |||
Class R6 ($353,072,203 ÷ 5,108,402 shares) | $69.12 | |||
Maximum offering price per share | ||||
Class A (net asset value per share ÷ 95%)2 | $65.89 | |||
| 1 | Redemption price per share is equal to net asset value less any applicable contingent deferred sales charge. |
| 2 | On single retail sales of less than $50,000. On sales of $50,000 or more and on group sales the offering price is reduced. |
| SEE NOTES TO FINANCIAL STATEMENTS | ANNUAL REPORT | JOHN HANCOCK U.S. GLOBAL LEADERS GROWTH FUND | 12 |
Table of Contents
|
| STATEMENT OF OPERATIONS For the year ended 10-31-20 |
| |||
Investment income | ||||
Dividends | $11,647,217 | |||
Securities lending | 1,219,074 | |||
Interest | 204,490 | |||
Less foreign taxes withheld | (591 | ) | ||
Total investment income | 13,070,190 | |||
Expenses | ||||
Investment management fees | 12,733,117 | |||
Distribution and service fees | 2,835,979 | |||
Accounting and legal services fees | 333,767 | |||
Transfer agent fees | 1,871,759 | |||
Trustees’ fees | 27,287 | |||
Custodian fees | 197,610 | |||
State registration fees | 156,941 | |||
Printing and postage | 68,354 | |||
Professional fees | 87,549 | |||
Other | 62,189 | |||
Total expenses | 18,374,552 | |||
Less expense reductions | (124,419 | ) | ||
Net expenses | 18,250,133 | |||
Net investment loss | (5,179,943 | ) | ||
Realized and unrealized gain (loss) | ||||
Net realized gain (loss) on | ||||
Unaffiliated investments | 248,182,325 | |||
Affiliated investments | 37,489 | |||
| 248,219,814 | ||||
Change in net unrealized appreciation (depreciation) of | ||||
Unaffiliated investments | 203,786,987 | |||
| 203,786,987 | ||||
Net realized and unrealized gain | 452,006,801 | |||
Increase in net assets from operations | $446,826,858 | |||
| 13 | JOHN HANCOCK U.S. GLOBAL LEADERS GROWTH FUND | ANNUAL REPORT | SEE NOTES TO FINANCIAL STATEMENTS |
Table of Contents
|
STATEMENTS OF CHANGES IN NET ASSETS
|
| |||||||
| Year ended 10-31-20 | Year ended 10-31-19 | |||||||
Increase (decrease) in net assets | ||||||||
From operations | ||||||||
Net investment loss | $(5,179,943 | ) | $(95,491 | ) | ||||
Net realized gain | 248,219,814 | 111,541,170 | ||||||
Change in net unrealized appreciation (depreciation) | 203,786,987 | 125,623,184 | ||||||
Increase in net assets resulting from operations | 446,826,858 | 237,068,863 | ||||||
Distributions to shareholders | ||||||||
From earnings | ||||||||
Class A | (47,750,249 | ) | (69,118,650 | ) | ||||
Class B1 | (685,984 | ) | (1,675,246 | ) | ||||
Class C | (5,665,021 | ) | (9,327,579 | ) | ||||
Class I | (35,525,171 | ) | (72,648,617 | ) | ||||
Class R2 | (91,843 | ) | (169,763 | ) | ||||
Class R6 | (12,538,401 | ) | (15,029,985 | ) | ||||
Total distributions | (102,256,669 | ) | (167,969,840 | ) | ||||
From fund share transactions | 117,931,269 | (46,191,535 | ) | |||||
Total increase | 462,501,458 | 22,907,488 | ||||||
Net assets | ||||||||
Beginning of year | 1,557,060,258 | 1,534,152,770 | ||||||
End of year | $2,019,561,716 | $1,557,060,258 | ||||||
| 1 | Share class was redesignated during the year. Refer to Note 5 for further details. |
| SEE NOTES TO FINANCIAL STATEMENTS | ANNUAL REPORT | JOHN HANCOCK U.S. GLOBAL LEADERS GROWTH FUND | 14 |
Table of Contents
|
| CLASS A SHARES Period ended | 10-31-20 | 10-31-19 | 10-31-18 | 10-31-17 | 10-31-16 | |||||||||||||||
Per share operating performance | ||||||||||||||||||||
Net asset value, beginning of period | $51.76 | $49.26 | $47.15 | $41.00 | $43.87 | |||||||||||||||
Net investment loss1 | (0.22 | ) | (0.05 | ) | (0.07 | ) | (0.05 | ) | (0.03 | ) | ||||||||||
Net realized and unrealized gain (loss) on investments | 14.56 | 8.18 | 5.51 | 8.31 | (0.13 | ) | ||||||||||||||
Total from investment operations | 14.34 | 8.13 | 5.44 | 8.26 | (0.16 | ) | ||||||||||||||
Less distributions | ||||||||||||||||||||
From net investment income | — | — | — | — | (0.04 | ) | ||||||||||||||
From net realized gain | (3.50 | ) | (5.63 | ) | (3.33 | ) | (2.11 | ) | (2.67 | ) | ||||||||||
Total distributions | (3.50 | ) | (5.63 | ) | (3.33 | ) | (2.11 | ) | (2.71 | ) | ||||||||||
Net asset value, end of period | $62.60 | $51.76 | $49.26 | $47.15 | $41.00 | |||||||||||||||
Total return (%)2,3 | 29.28 | 18.96 | 12.11 | 21.12 | (0.42 | ) | ||||||||||||||
Ratios and supplemental data | ||||||||||||||||||||
Net assets, end of period (in millions) | $921 | $707 | $612 | $577 | $608 | |||||||||||||||
Ratios (as a percentage of average net assets): | ||||||||||||||||||||
Expenses before reductions | 1.16 | 1.16 | 1.16 | 1.17 | 1.18 | |||||||||||||||
Expenses including reductions | 1.15 | 1.15 | 1.15 | 1.16 | 1.17 | |||||||||||||||
Net investment loss | (0.40 | ) | (0.11 | ) | (0.14 | ) | (0.12 | ) | (0.07 | ) | ||||||||||
Portfolio turnover (%) | 50 | 32 | 42 | 41 | 44 | |||||||||||||||
| 1 | Based on average daily shares outstanding. |
| 2 | Total returns would have been lower had certain expenses not been reduced during the applicable periods. |
| 3 | Does not reflect the effect of sales charges, if any. |
| 15 | JOHN HANCOCK U.S. GLOBAL LEADERS GROWTH FUND | ANNUAL REPORT | SEE NOTES TO FINANCIAL STATEMENTS |
Table of Contents
|
| CLASS C SHARES Period ended | 10-31-20 | 10-31-19 | 10-31-18 | 10-31-17 | 10-31-16 | |||||||||||||||
Per share operating performance | ||||||||||||||||||||
Net asset value, beginning of period | $42.31 | $41.59 | $40.59 | $35.84 | $38.92 | |||||||||||||||
Net investment loss1 | (0.51 | ) | (0.34 | ) | (0.37 | ) | (0.32 | ) | (0.29 | ) | ||||||||||
Net realized and unrealized gain (loss) on investments | 11.70 | 6.69 | 4.70 | 7.18 | (0.12 | ) | ||||||||||||||
Total from investment operations | 11.19 | 6.35 | 4.33 | 6.86 | (0.41 | ) | ||||||||||||||
Less distributions | ||||||||||||||||||||
From net realized gain | (3.50 | ) | (5.63 | ) | (3.33 | ) | (2.11 | ) | (2.67 | ) | ||||||||||
Net asset value, end of period | $50.00 | $42.31 | $41.59 | $40.59 | $35.84 | |||||||||||||||
Total return (%)2,3 | 28.30 | 18.07 | 11.28 | 20.21 | (1.16 | ) | ||||||||||||||
Ratios and supplemental data | ||||||||||||||||||||
Net assets, end of period (in millions) | $82 | $69 | $70 | $102 | $117 | |||||||||||||||
Ratios (as a percentage of average net assets): | ||||||||||||||||||||
Expenses before reductions | 1.91 | 1.91 | 1.91 | 1.92 | 1.93 | |||||||||||||||
Expenses including reductions | 1.90 | 1.90 | 1.90 | 1.91 | 1.92 | |||||||||||||||
Net investment loss | (1.15 | ) | (0.85 | ) | (0.91 | ) | (0.86 | ) | (0.82 | ) | ||||||||||
Portfolio turnover (%) | 50 | 32 | 42 | 41 | 44 | |||||||||||||||
| 1 | Based on average daily shares outstanding. |
| 2 | Total returns would have been lower had certain expenses not been reduced during the applicable periods. |
| 3 | Does not reflect the effect of sales charges, if any. |
| SEE NOTES TO FINANCIAL STATEMENTS | ANNUAL REPORT | JOHN HANCOCK U.S. GLOBAL LEADERS GROWTH FUND | 16 |
Table of Contents
|
| CLASS I SHARES Period ended | 10-31-20 | 10-31-19 | 10-31-18 | 10-31-17 | 10-31-16 | |||||||||||||||
Per share operating performance | ||||||||||||||||||||
Net asset value, beginning of period | $56.19 | $52.86 | $50.25 | $43.45 | $46.27 | |||||||||||||||
Net investment income (loss)1 | (0.09 | ) | 0.09 | 0.05 | 0.06 | 0.08 | ||||||||||||||
Net realized and unrealized gain (loss) on investments | 15.89 | 8.87 | 5.89 | 8.85 | (0.13 | ) | ||||||||||||||
Total from investment operations | 15.80 | 8.96 | 5.94 | 8.91 | (0.05 | ) | ||||||||||||||
Less distributions | ||||||||||||||||||||
From net investment income | — | — | — | — | (0.10 | ) | ||||||||||||||
From net realized gain | (3.50 | ) | (5.63 | ) | (3.33 | ) | (2.11 | ) | (2.67 | ) | ||||||||||
Total distributions | (3.50 | ) | (5.63 | ) | (3.33 | ) | (2.11 | ) | (2.77 | ) | ||||||||||
Net asset value, end of period | $68.49 | $56.19 | $52.86 | $50.25 | $43.45 | |||||||||||||||
Total return (%)2 | 29.58 | 19.26 | 12.37 | 21.44 | (0.14 | ) | ||||||||||||||
Ratios and supplemental data | ||||||||||||||||||||
Net assets, end of period (in millions) | $662 | $572 | $694 | $751 | $313 | |||||||||||||||
Ratios (as a percentage of average net assets): | ||||||||||||||||||||
Expenses before reductions | 0.91 | 0.92 | 0.92 | 0.91 | 0.92 | |||||||||||||||
Expenses including reductions | 0.90 | 0.91 | 0.91 | 0.90 | 0.91 | |||||||||||||||
Net investment income (loss) | (0.15 | ) | 0.17 | 0.09 | 0.13 | 0.19 | ||||||||||||||
Portfolio turnover (%) | 50 | 32 | 42 | 41 | 44 | |||||||||||||||
| 1 | Based on average daily shares outstanding. |
| 2 | Total returns would have been lower had certain expenses not been reduced during the applicable periods. |
| 17 | JOHN HANCOCK U.S. GLOBAL LEADERS GROWTH FUND | ANNUAL REPORT | SEE NOTES TO FINANCIAL STATEMENTS |
Table of Contents
|
CLASS R2 SHARES Period ended | 10-31-20 | 10-31-19 | 10-31-18 | 10-31-17 | 10-31-16 | |||||||||||||||
Per share operating performance | ||||||||||||||||||||
Net asset value, beginning of period | $54.71 | $51.80 | $49.48 | $42.99 | $45.89 | |||||||||||||||
Net investment loss1 | (0.31 | ) | (0.12 | ) | (0.14 | ) | (0.12 | ) | (0.09 | ) | ||||||||||
Net realized and unrealized gain (loss) on investments | 15.43 | 8.66 | 5.79 | 8.72 | (0.13 | ) | ||||||||||||||
Total from investment operations | 15.12 | 8.54 | 5.65 | 8.60 | (0.22 | ) | ||||||||||||||
Less distributions | ||||||||||||||||||||
From net investment income | — | — | — | — | (0.01 | ) | ||||||||||||||
From net realized gain | (3.50 | ) | (5.63 | ) | (3.33 | ) | (2.11 | ) | (2.67 | ) | ||||||||||
Total distributions | (3.50 | ) | (5.63 | ) | (3.33 | ) | (2.11 | ) | (2.68 | ) | ||||||||||
Net asset value, end of period | $66.33 | $54.71 | $51.80 | $49.48 | $42.99 | |||||||||||||||
Total return (%)2 | 29.11 | 18.81 | 11.95 | 20.93 | (0.54 | ) | ||||||||||||||
Ratios and supplemental data | ||||||||||||||||||||
Net assets, end of period (in millions) | $2 | $1 | $2 | $5 | $6 | |||||||||||||||
Ratios (as a percentage of average net assets): | ||||||||||||||||||||
Expenses before reductions | 1.28 | 1.29 | 1.30 | 1.31 | 1.32 | |||||||||||||||
Expenses including reductions | 1.27 | 1.28 | 1.29 | 1.30 | 1.32 | |||||||||||||||
Net investment loss | (0.53 | ) | (0.23 | ) | (0.28 | ) | (0.26 | ) | (0.21 | ) | ||||||||||
Portfolio turnover (%) | 50 | 32 | 42 | 41 | 44 | |||||||||||||||
| 1 | Based on average daily shares outstanding. |
| 2 | Total returns would have been lower had certain expenses not been reduced during the applicable periods. |
| SEE NOTES TO FINANCIAL STATEMENTS | ANNUAL REPORT | JOHN HANCOCK U.S. GLOBAL LEADERS GROWTH FUND | 18 |
Table of Contents
|
CLASS R6 SHARES Period ended | 10-31-20 | 10-31-19 | 10-31-18 | 10-31-17 | 10-31-16 | |||||||||||||||
Per share operating performance | ||||||||||||||||||||
Net asset value, beginning of period | $56.61 | $53.17 | $50.47 | $43.59 | $46.39 | |||||||||||||||
Net investment income (loss)1 | (0.03 | ) | 0.13 | 0.11 | 0.11 | 0.13 | ||||||||||||||
Net realized and unrealized gain (loss) on investments | 16.04 | 8.94 | 5.92 | 8.88 | (0.13 | ) | ||||||||||||||
Total from investment operations | 16.01 | 9.07 | 6.03 | 8.99 | — | |||||||||||||||
Less distributions | ||||||||||||||||||||
From net investment income | — | — | — | — | (0.13 | ) | ||||||||||||||
From net realized gain | (3.50 | ) | (5.63 | ) | (3.33 | ) | (2.11 | ) | (2.67 | ) | ||||||||||
Total distributions | (3.50 | ) | (5.63 | ) | (3.33 | ) | (2.11 | ) | (2.80 | ) | ||||||||||
Net asset value, end of period | $69.12 | $56.61 | $53.17 | $50.47 | $43.59 | |||||||||||||||
Total return (%)2 | 29.74 | 19.37 | 12.50 | 21.56 | (0.03 | ) | ||||||||||||||
Ratios and supplemental data | ||||||||||||||||||||
Net assets, end of period (in millions) | $353 | $199 | $143 | $6 | $5 | |||||||||||||||
Ratios (as a percentage of average net assets): | ||||||||||||||||||||
Expenses before reductions | 0.80 | 0.81 | 0.81 | 0.82 | 0.82 | |||||||||||||||
Expenses including reductions | 0.79 | 0.80 | 0.80 | 0.80 | 0.80 | |||||||||||||||
Net investment income (loss) | (0.06 | ) | 0.24 | 0.21 | 0.23 | 0.30 | ||||||||||||||
Portfolio turnover (%) | 50 | 32 | 42 | 41 | 44 | |||||||||||||||
| 1 | Based on average daily shares outstanding. |
| 2 | Total returns would have been lower had certain expenses not been reduced during the applicable periods. |
| 19 | JOHN HANCOCK U.S. GLOBAL LEADERS GROWTH FUND | ANNUAL REPORT | SEE NOTES TO FINANCIAL STATEMENTS |
Table of Contents
|
Note 1 — Organization
John Hancock U.S. Global Leaders Growth Fund (the fund) is a series of John Hancock Capital Series (the Trust), an open-end management investment company organized as a Massachusetts business trust and registered under the Investment Company Act of 1940, as amended (the 1940 Act). The investment objective of the fund is to seek long-term growth of capital.
The fund may offer multiple classes of shares. The shares currently outstanding are detailed in the Statement of assets and liabilities. Class A and Class C shares are offered to all investors. Class I shares are offered to institutions and certain investors. Class R2 shares are available only to certain retirement and 529 plans. Class R6 shares are only available to certain retirement plans, institutions and other investors. Class C shares convert to Class A shares ten years after purchase (certain exclusions may apply). Shareholders of each class have exclusive voting rights to matters that affect that class. The distribution and service fees, if any, and transfer agent fees for each class may differ.
Effective November 1, 2020, Class C shares convert to Class A shares eight years after purchase (certain exclusions may apply).
Note 2 — Significant accounting policies
The financial statements have been prepared in conformity with accounting principles generally accepted in the United States of America (US GAAP), which require management to make certain estimates and assumptions as of the date of the financial statements. Actual results could differ from those estimates and those differences could be significant. The fund qualifies as an investment company under Topic 946 of Accounting Standards Codification of US GAAP.
Events or transactions occurring after the end of the fiscal period through the date that the financial statements were issued have been evaluated in the preparation of the financial statements. The following summarizes the significant accounting policies of the fund:
Security valuation. Investments are stated at value as of the scheduled close of regular trading on the New York Stock Exchange (NYSE), normally at 4:00 P.M., Eastern Time. In case of emergency or other disruption resulting in the NYSE not opening for trading or the NYSE closing at a time other than the regularly scheduled close, the net asset value (NAV) may be determined as of the regularly scheduled close of the NYSE pursuant to the fund’s Valuation Policies and Procedures.
In order to value the securities, the fund uses the following valuation techniques: Equity securities, including exchange-traded or closed-end funds, are typically valued at the last sale price or official closing price on the exchange or principal market where the security trades. In the event there were no sales during the day or closing prices are not available, the securities are valued using the last available bid price. Investments by the fund in open-end mutual funds are valued at their respective NAVs each business day.
In certain instances, the Pricing Committee may determine to value equity securities using prices obtained from another exchange or market if trading on the exchange or market on which prices are typically obtained did not open for trading as scheduled, or if trading closed earlier than scheduled, and trading occurred as normal on another exchange or market.
Other portfolio securities and assets, for which reliable market quotations are not readily available, are valued at fair value as determined in good faith by the fund’s Pricing Committee following procedures established by the Board of Trustees. The frequency with which these fair valuation procedures are used cannot be predicted and fair value of securities may differ significantly from the value that would have been used had a ready market for such securities existed.
| ANNUAL REPORT | JOHN HANCOCK U.S. GLOBAL LEADERS GROWTH FUND | 20 |
Table of Contents
|
The fund uses a three-tier hierarchy to prioritize the pricing assumptions, referred to as inputs, used in valuation techniques to measure fair value. Level 1 includes securities valued using quoted prices in active markets for identical securities, including registered investment companies. Level 2 includes securities valued using other significant observable inputs. Observable inputs may include quoted prices for similar securities, interest rates, prepayment speeds and credit risk. Prices for securities valued using these inputs are received from independent pricing vendors and brokers and are based on an evaluation of the inputs described. Level 3 includes securities valued using significant unobservable inputs when market prices are not readily available or reliable, including the fund’s own assumptions in determining the fair value of investments. Factors used in determining value may include market or issuer specific events or trends, changes in interest rates and credit quality. The inputs or methodology used for valuing securities are not necessarily an indication of the risks associated with investing in those securities. Changes in valuation techniques and related inputs may result in transfers into or out of an assigned level within the disclosure hierarchy.
As of October 31, 2020, all investments are categorized as Level 1 under the hierarchy described above.
Real estate investment trusts. The fund may invest in real estate investment trusts (REITs). Distributions from REITs may be recorded as income and subsequently characterized by the REIT at the end of the fiscal year as a reduction of cost of investments and/or as a realized gain. As a result, the fund will estimate the components of distributions from these securities. Such estimates are revised when the actual components of the distributions are known.
Security transactions and related investment income. Investment security transactions are accounted for on a trade date plus one basis for daily NAV calculations. However, for financial reporting purposes, investment transactions are reported on trade date. Interest income is accrued as earned. Dividend income is recorded on the ex-date, except for dividends of certain foreign securities where the dividend may not be known until after the ex-date. In those cases, dividend income, net of withholding taxes, is recorded when the fund becomes aware of the dividends. Non-cash dividends, if any, are recorded at the fair market value of the securities received. Gains and losses on securities sold are determined on the basis of identified cost and may include proceeds from litigation.
Securities lending. The fund may lend its securities to earn additional income. The fund receives collateral from the borrower in an amount not less than the market value of the loaned securities. The fund will invest its cash collateral in John Hancock Collateral Trust (JHCT), an affiliate of the fund, which has a floating NAV and is registered with the Securities and Exchange Commission (SEC) as an investment company. JHCT invests in short-term money market investments. The fund will receive the benefit of any gains and bear any losses generated by JHCT with respect to the cash collateral.
The fund has the right to recall loaned securities on demand. If a borrower fails to return loaned securities when due, then the lending agent is responsible and indemnifies the fund for the lent securities. The lending agent uses the collateral received from the borrower to purchase replacement securities of the same issue, type, class and series of the loaned securities. If the value of the collateral is less than the purchase cost of replacement securities, the lending agent is responsible for satisfying the shortfall but only to the extent that the shortfall is not due to any decrease in the value of JHCT.
Although the risk of loss on securities lent is mitigated by receiving collateral from the borrower and through lending agent indemnification, the fund could experience a delay in recovering securities or could experience a lower than expected return if the borrower fails to return the securities on a timely basis. The fund receives compensation for lending its securities by retaining a portion of the return on the investment of the collateral and compensation from fees earned from borrowers of the securities. Securities lending income received by the fund is net of fees retained by the securities lending agent. Net income received from JHCT is a component of securities lending income as recorded on the Statement of operations. As of October 31, 2020, there were no securities on loan.
| 21 | JOHN HANCOCK U.S. GLOBAL LEADERS GROWTH FUND | ANNUAL REPORT |
Table of Contents
|
Foreign taxes. The fund may be subject to withholding tax on income, capital gains or repatriations imposed by certain countries, a portion of which may be recoverable. Foreign taxes are accrued based upon the fund’s understanding of the tax rules and rates that exist in the foreign markets in which it invests. Taxes are accrued based on gains realized by the fund as a result of certain foreign security sales. In certain circumstances, estimated taxes are accrued based on unrealized appreciation of such securities. Investment income is recorded net of foreign withholding taxes.
Overdraft. The fund may have the ability to borrow from banks for temporary or emergency purposes, including meeting redemption requests that otherwise might require the untimely sale of securities. Pursuant to the fund’s custodian agreement, the custodian may loan money to the fund to make properly authorized payments. The fund is obligated to repay the custodian for any overdraft, including any related costs or expenses. The custodian may have a lien, security interest or security entitlement in any fund property that is not otherwise segregated or pledged, to the extent of any overdraft, and to the maximum extent permitted by law.
Line of credit. Effective June 25, 2020, the fund and other affiliated funds have entered into a syndicated line of credit agreement with Citibank, N.A. as the administrative agent that enables them to participate in a $1 billion unsecured committed line of credit. Excluding commitments designated for a certain fund and subject to the needs of all other affiliated funds, the fund can borrow up to an aggregate commitment amount of $850 million, subject to asset coverage and other limitations as specified in the agreement. Each participating fund paid an upfront fee in connection with this line of credit agreement, which is charged based on a combination of fixed and asset-based allocations and amortized over 365 days. Prior to June 25, 2020, the fund and other affiliated funds had a similar agreement that enabled them to participate in a $750 million unsecured committed line of credit. A commitment fee payable at the end of each calendar quarter, based on the average daily unused portion of the line of credit, is charged to each participating fund based on a combination of fixed and asset-based allocations and is reflected in Other expenses on the Statement of operations. For the year ended October 31, 2020, the fund had no borrowings under the line of credit. Commitment fees, including upfront fees, for the year ended October 31, 2020 were $9,562.
Expenses. Within the John Hancock group of funds complex, expenses that are directly attributable to an individual fund are allocated to such fund. Expenses that are not readily attributable to a specific fund are allocated among all funds in an equitable manner, taking into consideration, among other things, the nature and type of expense and the fund’s relative net assets. Expense estimates are accrued in the period to which they relate and adjustments are made when actual amounts are known.
Class allocations. Income, common expenses and realized and unrealized gains (losses) are determined at the fund level and allocated daily to each class of shares based on the net assets of the class. Class-specific expenses, such as distribution and service fees, if any, and transfer agent fees, for all classes, are charged daily at the class level based on the net assets of each class and the specific expense rates applicable to each class.
Federal income taxes. The fund intends to continue to qualify as a regulated investment company by complying with the applicable provisions of the Internal Revenue Code and will not be subject to federal income tax on taxable income that is distributed to shareholders. Therefore, no federal income tax provision is required.
As of October 31, 2020, the fund had no uncertain tax positions that would require financial statement recognition, derecognition or disclosure. The fund’s federal tax returns are subject to examination by the Internal Revenue Service for a period of three years.
Distribution of income and gains. Distributions to shareholders from net investment income and net realized gains, if any, are recorded on the ex-date. The fund generally declares and pays dividends annually. Capital gain distributions, if any, are typically distributed annually.
| ANNUAL REPORT | JOHN HANCOCK U.S. GLOBAL LEADERS GROWTH FUND | 22 |
Table of Contents
|
The tax character of distributions for the years ended October 31, 2020 and 2019 was as follows:
| October 31, 2020 | October 31, 2019 | |||||||
Ordinary income | — | $7,697,456 | ||||||
Long-term capital gains | $102,256,669 | 160,272,384 | ||||||
Total | $102,256,669 | $167,969,840 | ||||||
Distributions paid by the fund with respect to each class of shares are calculated in the same manner, at the same time and in the same amount, except for the effect of class level expenses that may be applied differently to each class. As of October 31, 2020, the components of distributable earnings on a tax basis consisted of $63,359,028 of undistributed ordinary income and $160,554,466 of undistributed long-term capital gains.
Such distributions and distributable earnings, on a tax basis, are determined in conformity with income tax regulations, which may differ from US GAAP. Distributions in excess of tax basis earnings and profits, if any, are reported in the fund’s financial statements as a return of capital.
Capital accounts within the financial statements are adjusted for permanent book-tax differences. These adjustments have no impact on net assets or the results of operations. Temporary book-tax differences, if any, will reverse in a subsequent period. Book-tax differences are primarily attributable to treating a portion of the proceeds from redemptions as distributions for tax purposes, net operating losses and wash sale loss deferrals.
Note 3 — Guarantees and indemnifications
Under the Trust’s organizational documents, its Officers and Trustees are indemnified against certain liabilities arising out of the performance of their duties to the Trust, including the fund. Additionally, in the normal course of business, the fund enters into contracts with service providers that contain general indemnification clauses. The fund’s maximum exposure under these arrangements is unknown, as this would involve future claims that may be made against the fund that have not yet occurred. The risk of material loss from such claims is considered remote.
Note 4 — Fees and transactions with affiliates
John Hancock Investment Management LLC (the Advisor) serves as investment advisor for the fund. John Hancock Investment Management Distributors LLC (the Distributor), an affiliate of the Advisor, serves as principal underwriter of the fund. The Advisor and the Distributor are indirect, principally owned subsidiaries of Manulife Financial Corporation.
Management fee. The fund has an investment management agreement with the Advisor under which the fund pays a monthly management fee to the Advisor equivalent on an annual basis to the sum of: (a) 0.75% of the first $500 million of the fund’s average daily net assets; (b) 0.73% of the next $500 million of the fund’s average daily net assets; (c) 0.71% of the next $1 billion of the fund’s average daily net assets; (d) 0.70% of the next $3 billion of the fund’s average daily net assets; and (e) 0.65% of the fund’s average daily net assets in excess of $5 billion. The Advisor has a subadvisory agreement with Sustainable Growth Advisers, LP. The fund is not responsible for payment of the subadvisory fees.
The Advisor has contractually agreed to waive a portion of its management fee and/or reimburse expenses for certain funds of the John Hancock group of funds complex, including the fund (the participating portfolios). This waiver is based upon aggregate net assets of all the participating portfolios. The amount of the reimbursement is calculated daily and allocated among all the participating portfolios in proportion to the daily net assets of each fund. During the year ended October 31, 2020, this waiver amounted to 0.01% of the fund’s average daily net assets. This arrangement expires on July 31, 2022, unless renewed by mutual agreement of the fund and the Advisor based upon a determination that this is appropriate under the circumstances at that time.
| 23 | JOHN HANCOCK U.S. GLOBAL LEADERS GROWTH FUND | ANNUAL REPORT |
Table of Contents
|
For the year ended October 31, 2020, the expense reductions described above amounted to the following:
| Class | Expense reduction | |||
Class A | $57,107 | |||
Class B | 447 | |||
Class C | 5,350 | |||
Class I | 42,466 | |||
| Class | Expense reduction | |||
Class R2 | $114 | |||
Class R6 | 18,935 | |||
Total | $124,419 | |||
Expenses waived or reimbursed in the current fiscal period are not subject to recapture in future fiscal periods.
The investment management fees, including the impact of the waivers and reimbursements as described above, incurred for the year ended October 31, 2020, were equivalent to a net annual effective rate of 0.72% of the fund’s average daily net assets.
Accounting and legal services. Pursuant to the Accounting and Legal Services Agreement, the fund reimburses the Advisor for all expenses associated with providing the administrative, financial, legal, compliance, accounting and recordkeeping services to the fund, including the preparation of all tax returns, periodic reports to shareholders and regulatory reports, among other services. These expenses are allocated to each share class based on its relative net assets at the time the expense was incurred. These accounting and legal services fees incurred, for the year ended October 31, 2020, amounted to an annual rate of 0.02% of the fund’s average daily net assets.
Distribution and service plans. The fund has a distribution agreement with the Distributor. The fund has adopted distribution and service plans for certain classes as detailed below pursuant to Rule 12b-1 under the 1940 Act, to pay the Distributor for services provided as the distributor of shares of the fund. In addition, under a service plan for certain classes as detailed below, the fund pays for certain other services. The fund may pay up to the following contractual rates of distribution and service fees under these arrangements, expressed as an annual percentage of average daily net assets for each class of the fund’s shares:
| Class | Rule 12b-1 Fee | Service fee | ||||||
Class A | 0.25% | — | ||||||
Class B | 1.00% | — | ||||||
Class C | 1.00% | — | ||||||
Class R2 | 0.25% | 0.25% | ||||||
Class B was redesignated during the year. Refer to Note 5 for further details.
Sales charges. Class A shares are assessed up-front sales charges, which resulted in payments to the Distributor amounting to $831,096 for the year ended October 31, 2020. Of this amount, $139,664 was retained and used for printing prospectuses, advertising, sales literature and other purposes and $691,432 was paid as sales commissions to broker-dealers.
Class A and Class C shares may be subject to contingent deferred sales charges (CDSCs). Certain Class A shares that are acquired through purchases of $1 million or more and are redeemed within one year of purchase are subject to a 1.00% sales charge. Class C shares that are redeemed within one year of purchase are subject to a 1.00% CDSC. CDSCs are applied to the lesser of the current market value at the time of redemption or the original purchase cost of the shares being redeemed. Proceeds from CDSCs are used to compensate the Distributor for providing distribution-related services in connection with the sale of these shares. During the year ended October 31, 2020, CDSCs received by the Distributor amounted to $5,731 and $11,873 for Class A and Class C shares, respectively.
Transfer agent fees. The John Hancock group of funds has a complex-wide transfer agent agreement with John Hancock Signature Services, Inc. (Signature Services), an affiliate of the Advisor. The transfer agent fees paid to Signature Services are determined based on the cost to Signature Services (Signature Services Cost) of providing recordkeeping services. It also includes out-of-pocket expenses, including payments made to third-parties for
| ANNUAL REPORT | JOHN HANCOCK U.S. GLOBAL LEADERS GROWTH FUND | 24 |
Table of Contents
|
recordkeeping services provided to their clients who invest in one or more John Hancock funds. In addition, Signature Services Cost may be reduced by certain fees that Signature Services receives in connection with retirement and small accounts. Signature Services Cost is calculated monthly and allocated, as applicable, to five categories of share classes: Retail Share and Institutional Share Classes of Non-Municipal Bond Funds, Class R6 Shares, Retirement Share Classes and Municipal Bond Share Classes. Within each of these categories, the applicable costs are allocated to the affected John Hancock affiliated funds and/or classes, based on the relative average daily net assets.
Class level expenses. Class level expenses for the year ended October 31, 2020 were as follows:
| Class | Distribution and service fees | Transfer agent fees | ||||||
Class A | $2,011,405 | $996,599 | ||||||
Class B | 62,950 | 7,840 | ||||||
Class C | 753,848 | 93,453 | ||||||
Class I | — | 740,079 | ||||||
Class R2 | 7,776 | 206 | ||||||
Class R6 | — | 33,582 | ||||||
Total | $2,835,979 | $1,871,759 | ||||||
Trustee expenses. The fund compensates each Trustee who is not an employee of the Advisor or its affiliates. The costs of paying Trustee compensation and expenses are allocated to the fund based on its net assets relative to other funds within the John Hancock group of funds complex.
Note 5 — Fund share transactions
Transactions in fund shares for the years ended October 31, 2020 and 2019 were as follows:
Year Ended 10-31-20
| Year Ended 10-31-19
| |||||||||||||||
| Shares | Amount | Shares | Amount | |||||||||||||
Class A shares | ||||||||||||||||
Sold | 2,785,709 | $153,418,941 | 2,040,596 | $98,162,511 | ||||||||||||
Distributions reinvested | 906,110 | 46,003,160 | 1,555,898 | 66,312,369 | ||||||||||||
Repurchased | (2,640,935 | ) | (143,313,123 | ) | (2,356,982 | ) | (113,435,549 | ) | ||||||||
Net increase | 1,050,884 | $56,108,978 | 1,239,512 | $51,039,331 | ||||||||||||
Class B shares | ||||||||||||||||
Sold | 2,415 | $105,252 | 4,107 | $153,671 | ||||||||||||
Distributions reinvested | 15,375 | 627,298 | 43,715 | 1,532,211 | ||||||||||||
Repurchased | (222,470 | ) | (10,357,308 | ) | (152,674 | ) | (6,062,816 | ) | ||||||||
Net decrease | (204,680 | ) | $(9,624,758 | ) | (104,852 | ) | $(4,376,934 | ) | ||||||||
Class C shares | ||||||||||||||||
Sold | 465,711 | $20,787,428 | 293,780 | $11,487,433 | ||||||||||||
Distributions reinvested | 130,283 | 5,319,456 | 249,890 | 8,763,643 | ||||||||||||
Repurchased | (592,162 | ) | (26,516,412 | ) | (590,125 | ) | (23,279,807 | ) | ||||||||
Net increase (decrease) | 3,832 | $(409,528 | ) | (46,455 | ) | $(3,028,731 | ) | |||||||||
| 25 | JOHN HANCOCK U.S. GLOBAL LEADERS GROWTH FUND | ANNUAL REPORT |
Table of Contents
|
Year Ended 10-31-20
| Year Ended 10-31-19
| |||||||||||||||
| Shares | Amount | Shares | Amount | |||||||||||||
Class I shares | ||||||||||||||||
Sold | 3,082,659 | $184,254,985 | 3,675,754 | $192,856,193 | ||||||||||||
Distributions reinvested | 616,231 | 34,157,667 | 1,521,468 | 70,246,195 | ||||||||||||
Repurchased | (4,216,895 | ) | (243,529,781 | ) | (8,153,014 | ) | (394,597,753 | ) | ||||||||
Net decrease | (518,005 | ) | $(25,117,129 | ) | (2,955,792 | ) | $(131,495,365 | ) | ||||||||
Class R2 shares | ||||||||||||||||
Sold | 10,279 | $585,819 | 7,700 | $393,159 | ||||||||||||
Distributions reinvested | 1,623 | 87,417 | 3,706 | 167,161 | ||||||||||||
Repurchased | (11,774 | ) | (656,619 | ) | (27,804 | ) | (1,433,687 | ) | ||||||||
Net increase (decrease) | 128 | $16,617 | (16,398 | ) | $(873,367 | ) | ||||||||||
Class R6 shares | ||||||||||||||||
Sold | 2,439,967 | $149,938,899 | 1,233,926 | $66,218,577 | ||||||||||||
Distributions reinvested | 223,943 | 12,513,939 | 323,400 | 15,028,390 | ||||||||||||
Repurchased | (1,064,472 | ) | (65,495,749 | ) | (734,039 | ) | (38,703,436 | ) | ||||||||
Net increase | 1,599,438 | $96,957,089 | 823,287 | $42,543,531 | ||||||||||||
Total net increase (decrease) | 1,931,597 | $117,931,269 | (1,060,698 | ) | $(46,191,535 | ) | ||||||||||
On June 25, 2020, the Board of Trustees approved redesignations of certain share classes. As a result of the redesignations, Class B was terminated, and shareholders in this class became shareholders of the respective class identified below, with the same or lower total net expenses. The following amount is included in the amount repurchased of the terminated class and the amount sold of the redesignated class.
| Redesignation | Effective date | Amount | ||||||
Class B shares as Class A shares | October 14, 2020 | $4,322,841 | ||||||
Note 6 — Purchase and sale of securities
Purchases and sales of securities, other than short-term investments, amounted to $850,781,104 and $879,811,878, respectively, for the year ended October 31, 2020.
Note 7 — Industry or sector risk
The fund may invest a large percentage of its assets in one or more particular industries or sectors of the economy. If a large percentage of the fund’s assets are economically tied to a single or small number of industries or sectors of the economy, the fund will be less diversified than a more broadly diversified fund, and it may cause the fund to underperform if that industry or sector underperforms. In addition, focusing on a particular industry or sector may make the fund’s NAV more volatile. Further, a fund that invests in particular industries or sectors is particularly susceptible to the impact of market, economic, regulatory and other factors affecting those industries or sectors.
Note 8 — Investment in affiliated underlying funds
The fund may invest in affiliated underlying funds that are managed by the Advisor and its affiliates. Information regarding the fund’s fiscal year to date purchases and sales of the affiliated underlying funds as well as income and capital gains earned by the fund, if any, is as follows:
| ANNUAL REPORT | JOHN HANCOCK U.S. GLOBAL LEADERS GROWTH FUND | 26 |
Table of Contents
|
Dividends and distributions
| ||||||||||||||||||||||||||||||||||||
| Affiliate | Ending share amount | Beginning value | Cost of purchases | Proceeds from shares sold | Realized gain (loss) | Change in unrealized appreciation (depreciation) | Income distributions received | Capital gain distributions received | Ending value | |||||||||||||||||||||||||||
John Hancock Collateral Trust* | — | — | $178,367,962 | $(178,405,451 | ) | $37,489 | — | $1,219,074 | — | — | ||||||||||||||||||||||||||
| * | Refer to the Securities lending note within Note 2 for details regarding this investment. |
Note 9 — Coronavirus (COVID-19) pandemic
The novel COVID-19 disease has resulted in significant disruptions to global business activity. A widespread health crisis such as a global pandemic could cause substantial market volatility, exchange trading suspensions and closures, impact the ability to complete redemptions, and affect fund performance.
| 27 | JOHN HANCOCK U.S. GLOBAL LEADERS GROWTH FUND | ANNUAL REPORT |
Table of Contents
|
Report of Independent Registered Public Accounting Firm
To the Board of Trustees of John Hancock Capital Series and Shareholders of John Hancock U.S. Global Leaders Growth Fund
Opinion on the Financial Statements
We have audited the accompanying statement of assets and liabilities, including the fund’s investments, of John Hancock U.S. Global Leaders Growth Fund (one of the funds constituting John Hancock Capital Series, referred to hereafter as the Fund ) as of October 31, 2020, the related statement of operations for the year ended October 31, 2020, the statements of changes in net assets for each of the two years in the period ended October 31, 2020, including the related notes, and the financial highlights for each of the five years in the period ended October 31, 2020 (collectively referred to as the “financial statements”). In our opinion, the financial statements present fairly, in all material respects, the financial position of the Fund as of October 31, 2020, the results of its operations for the year then ended, the changes in its net assets for each of the two years in the period ended October 31, 2020 and the financial highlights for each of the five years in the period ended October 31, 2020 in conformity with accounting principles generally accepted in the United States of America.
Basis for Opinion
These financial statements are the responsibility of the Fund’s management. Our responsibility is to express an opinion on the Fund’s financial statements based on our audits. We are a public accounting firm registered with the Public Company Accounting Oversight Board (United States) (PCAOB) and are required to be independent with respect to the Fund in accordance with the U.S. federal securities laws and the applicable rules and regulations of the Securities and Exchange Commission and the PCAOB.
We conducted our audits of these financial statements in accordance with the standards of the PCAOB. Those standards require that we plan and perform the audit to obtain reasonable assurance about whether the financial statements are free of material misstatement, whether due to error or fraud.
Our audits included performing procedures to assess the risks of material misstatement of the financial statements, whether due to error or fraud, and performing procedures that respond to those risks. Such procedures included examining, on a test basis, evidence regarding the amounts and disclosures in the financial statements. Our audits also included evaluating the accounting principles used and significant estimates made by management, as well as evaluating the overall presentation of the financial statements. Our procedures included confirmation of securities owned as of October 31, 2020 by correspondence with the custodian and transfer agent. We believe that our audits provide a reasonable basis for our opinion.
/s/ PricewaterhouseCoopers LLP
Boston, Massachusetts
December 10, 2020
We have served as the auditor of one or more investment companies in the John Hancock group of funds since 1988.
| ANNUAL REPORT | JOHN HANCOCK U.S. GLOBAL LEADERS GROWTH FUND | 28 |
Table of Contents
|
For federal income tax purposes, the following information is furnished with respect to the distributions of the fund, if any, paid during its taxable year ended October 31, 2020.
The fund reports the maximum amount allowable of its net taxable income as eligible for the corporate dividends-received deduction.
The fund reports the maximum amount allowable of its net taxable income as qualified dividend income as provided in the Jobs and Growth Tax Relief Reconciliation Act of 2003.
The fund paid $121,223,991 in long term capital gain dividends.
The fund reports the maximum amount allowable of its Section 199A dividends as defined in Proposed Treasury Regulation §1.199A-3(d).
Eligible shareholders will be mailed a 2020 Form 1099-DIV in early 2021. This will reflect the tax character of all distributions paid in calendar year 2020.
Please consult a tax advisor regarding the tax consequences of your investment in the fund.
| 29 | JOHN HANCOCK U.S. GLOBAL LEADERS GROWTH FUND | ANNUAL REPORT |
Table of Contents
|
Continuation of Investment Advisory and Subadvisory Agreements
Evaluation of Advisory and Subadvisory Agreements by the Board of Trustees
This section describes the evaluation by the Board of Trustees (the Board) of John Hancock Capital Series (the Trust) of the Advisory Agreement (the Advisory Agreement) with John Hancock Investment Management LLC (the Advisor) and the Subadvisory Agreement (the Subadvisory Agreement) with Sustainable Growth Advisers, LP (the Subadvisor), for John Hancock U.S. Global Leaders Growth Fund (the fund). The Advisory Agreement and Subadvisory Agreement are collectively referred to as the Agreements. Prior to the June 23-25, 2020 telephonic1 meeting at which the Agreements were approved, the Board also discussed and considered information regarding the proposed continuation of the Agreements at a telephonic meeting held on May 26-27, 2020.
Approval of Advisory and Subadvisory Agreements
At a telephonic meeting held on June 23-25, 2020, the Board, including the Trustees who are not parties to any Agreement or considered to be interested persons of the Trust under the Investment Company Act of 1940, as amended (the 1940 Act) (the Independent Trustees), reapproved for an annual period the continuation of the Advisory Agreement between the Trust and the Advisor and the Subadvisory Agreement between the Advisor and the Subadvisor with respect to the fund.
In considering the Advisory Agreement and the Subadvisory Agreement, the Board received in advance of the meetings a variety of materials relating to the fund, the Advisor and the Subadvisor, including comparative performance, fee and expense information for a peer group of similar funds prepared by an independent third-party provider of fund data, performance information for an applicable benchmark index; and, with respect to the Subadvisor, comparative performance information for comparably managed accounts, as applicable, and other information provided by the Advisor and the Subadvisor regarding the nature, extent and quality of services provided by the Advisor and the Subadvisor under their respective Agreements, as well as information regarding the Advisor’s revenues and costs of providing services to the fund and any compensation paid to affiliates of the Advisor. At the meetings at which the renewal of the Advisory Agreement and Subadvisory Agreement are considered, particular focus is given to information concerning fund performance, comparability of fees and total expenses, and profitability. However, the Board noted that the evaluation process with respect to the Advisor and the Subadvisor is an ongoing one. In this regard, the Board also took into account discussions with management and information provided to the Board (including its various committees) at prior meetings with respect to the services provided by the Advisor and the Subadvisor to the fund, including quarterly performance reports prepared by management containing reviews of investment results and prior presentations from the Subadvisor with respect to the fund. The information received and considered by the Board in connection with the May and June meetings and throughout the year was both written and oral. The Board also considered the nature, quality, and extent of non-advisory services, if any, to be provided to the fund by the Advisor’s affiliates, including distribution services. The Board considered the Advisory Agreement and the Subadvisory Agreement separately in the course of its review. In doing so, the Board noted the respective roles of the Advisor and Subadvisor in providing services to the fund.
1On March 25, 2020, as a result of health and safety measures put in place to combat the global COVID-19 pandemic, the Securities and Exchange Commission issued an exemptive order (the “Order”) pursuant to Sections 6(c) and 38(a) of the Investment Company Act of 1940, as amended (the “1940 Act”), that temporarily exempts registered investment management companies from the in-person voting requirements under the 1940 Act, subject to certain requirements, including that votes taken pursuant to the Order are ratified at the next in-person meeting. The Board determined that reliance on the Order was necessary or appropriate due to the circumstances related to current or potential effects of COVID-19 and therefore, the Board’s May and June meetings were held telephonically in reliance on the Order.
| ANNUAL REPORT | JOHN HANCOCK U.S. GLOBAL LEADERS GROWTH FUND | 30 |
Table of Contents
|
Throughout the process, the Board asked questions of and requested additional information from management. The Board is assisted by counsel for the Trust and the Independent Trustees are also separately assisted by independent legal counsel throughout the process. The Independent Trustees also received a memorandum from their independent legal counsel discussing the legal standards for their consideration of the proposed continuation of the Agreements and discussed the proposed continuation of the Agreements in private sessions with their independent legal counsel at which no representatives of management were present.
Approval of Advisory Agreement
In approving the Advisory Agreement with respect to the fund, the Board, including the Independent Trustees, considered a variety of factors, including those discussed below. The Board also considered other factors (including conditions and trends prevailing generally in the economy, the securities markets, and the industry) and did not treat any single factor as determinative, and each Trustee may have attributed different weights to different factors. The Board’s conclusions may be based in part on its consideration of the advisory and subadvisory arrangements in prior years and on the Board’s ongoing regular review of fund performance and operations throughout the year.
Nature, extent, and quality of services. Among the information received by the Board from the Advisor relating to the nature, extent, and quality of services provided to the fund, the Board reviewed information provided by the Advisor relating to its operations and personnel, descriptions of its organizational and management structure, and information regarding the Advisor’s compliance and regulatory history, including its Form ADV. The Board also noted that on a regular basis it receives and reviews information from the Trust’s Chief Compliance Officer (CCO) regarding the fund’s compliance policies and procedures established pursuant to Rule 38a-1 under the 1940 Act. The Board observed that the scope of services provided by the Advisor, and of the undertakings required of the Advisor in connection with those services, including maintaining and monitoring its own and the fund’s compliance programs, risk management programs, liquidity management programs and cybersecurity programs, had expanded over time as a result of regulatory, market and other developments. The Board considered that the Advisor is responsible for the management of the day-to-day operations of the fund, including, but not limited to, general supervision of and coordination of the services provided by the Subadvisor, and is also responsible for monitoring and reviewing the activities of the Subadvisor and other third-party service providers. The Board also considered the significant risks assumed by the Advisor in connection with the services provided to the fund including entrepreneurial risk in sponsoring new funds and ongoing risks including investment, operational, enterprise, litigation, regulatory and compliance risks with respect to all funds.
In considering the nature, extent, and quality of the services provided by the Advisor, the Trustees also took into account their knowledge of the Advisor’s management and the quality of the performance of the Advisor’s duties, through Board meetings, discussions and reports during the preceding year and through each Trustee’s experience as a Trustee of the Trust and of the other trusts in the John Hancock group of funds complex (the John Hancock Fund Complex).
In the course of their deliberations regarding the Advisory Agreement, the Board considered, among other things:
| (a) | the skills and competency with which the Advisor has in the past managed the Trust’s affairs and its subadvisory relationship, the Advisor’s oversight and monitoring of the Subadvisor’s investment performance and compliance programs, such as the Subadvisor’s compliance with fund policies and objectives, review of brokerage matters, including with respect to trade allocation and best execution and the Advisor’s timeliness in responding to performance issues; |
| (b) | the background, qualifications and skills of the Advisor’s personnel; |
| (c) | the Advisor’s compliance policies and procedures and its responsiveness to regulatory changes and fund industry developments; |
| 31 | JOHN HANCOCK U.S. GLOBAL LEADERS GROWTH FUND | ANNUAL REPORT |
Table of Contents
|
| (d) | the Advisor’s administrative capabilities, including its ability to supervise the other service providers for the fund, as well as the Advisor’s oversight of any securities lending activity, its monitoring of class action litigation and collection of class action settlements on behalf of the fund, and bringing loss recovery actions on behalf of the fund; |
| (e) | the financial condition of the Advisor and whether it has the financial wherewithal to provide a high level and quality of services to the fund; |
| (f) | the Advisor’s initiatives intended to improve various aspects of the Trust’s operations and investor experience with the fund; and |
| (g) | the Advisor’s reputation and experience in serving as an investment advisor to the Trust and the benefit to shareholders of investing in funds that are part of a family of funds offering a variety of investments. |
The Board concluded that the Advisor may reasonably be expected to continue to provide a high quality of services under the Advisory Agreement with respect to the fund.
Investment performance. In considering the fund’s performance, the Board noted that it reviews at its regularly scheduled meetings information about the fund’s performance results. In connection with the consideration of the Advisory Agreement, the Board:
| (a) | reviewed information prepared by management regarding the fund’s performance; |
| (b) | considered the comparative performance of an applicable benchmark index; |
| (c) | considered the performance of comparable funds, if any, as included in the report prepared by an independent third-party provider of fund data; and |
| (d) | took into account the Advisor’s analysis of the fund’s performance and its plans and recommendations regarding the Trust’s subadvisory arrangements generally. |
The Board noted that while it found the data provided by the independent third-party generally useful it recognized its limitations, including in particular that the data may vary depending on the end date selected and the results of the performance comparisons may vary depending on the selection of the peer group. The Board noted that the fund underperformed its benchmark index for the one-, three-, five- and ten-year periods ended December 31, 2019. The Board also noted that the fund outperformed its peer group median for the one-, three-, five- and ten-year periods ended December 31, 2019. The Board took into account management’s discussion of the fund’s performance, including the favorable performance relative to the peer group for the one-, three-, five-and ten-year periods. The Board concluded that the fund’s performance has generally been in line with or outperformed the historical performance of comparable funds.
Fees and expenses. The Board reviewed comparative information prepared by an independent third-party provider of fund data, including, among other data, the fund’s contractual and net management fees (and subadvisory fees, to the extent available) and total expenses as compared to similarly situated investment companies deemed to be comparable to the fund in light of the nature, extent and quality of the management and advisory and subadvisory services provided by the Advisor and the Subadvisor. The Board considered the fund’s ranking within a smaller group of peer funds chosen by the independent third-party provider, as well as the fund’s ranking within a broader group of funds. In comparing the fund’s contractual and net management fees to those of comparable funds, the Board noted that such fees include both advisory and administrative costs. The Board noted that net management fees and net total expenses for the fund are higher than the peer group median.
The Board took into account management’s discussion of the fund’s expenses. The Board also took into account management’s discussion with respect to the overall management fee and the fees of the Subadvisor, including the amount of the advisory fee retained by the Advisor after payment of the subadvisory fee, in each case in light
| ANNUAL REPORT | JOHN HANCOCK U.S. GLOBAL LEADERS GROWTH FUND | 32 |
Table of Contents
|
of the services rendered for those amounts and the risks undertaken by the Advisor. The Board also noted that the Advisor pays the subadvisory fee, and that such fees are negotiated at arm’s length with respect to the Subadvisor. In addition, the Board took into account that management had agreed to implement an overall fee waiver across the complex, including the fund, which is discussed further below. The Board also noted actions taken over the past several years to reduce the fund’s operating expenses. The Board also noted that, in addition, the Advisor is currently waiving fees and/or reimbursing expenses with respect to the fund and that the fund has breakpoints in its contractual management fee schedule that reduce management fees as assets increase. The Board noted that the fund has a voluntary fee waiver and/or expense reimbursement, which reduces certain expenses of the fund. The Board reviewed information provided by the Advisor concerning the investment advisory fee charged by the Advisor or one of its advisory affiliates to other clients (including other funds in the John Hancock Fund Complex) having similar investment mandates, if any. The Board considered any differences between the Advisor’s and Subadvisor’s services to the fund and the services they provide to other comparable clients or funds. The Board concluded that the advisory fee paid with respect to the fund is reasonable in light of the nature, extent and quality of the services provided to the fund under the Advisory Agreement.
Profitability/Fall out benefits. In considering the costs of the services to be provided and the profits to be realized by the Advisor and its affiliates from the Advisor’s relationship with the Trust, the Board:
| (a) | reviewed financial information of the Advisor; |
| (b) | reviewed and considered information presented by the Advisor regarding the net profitability to the Advisor and its affiliates with respect to the fund; |
| (c) | received and reviewed profitability information with respect to the John Hancock Fund Complex as a whole and with respect to the fund; |
| (d) | received information with respect to the Advisor’s allocation methodologies used in preparing the profitability data and considered that the Advisor hired an independent third-party consultant to provide an analysis of the Advisor’s allocation methodologies; |
| (e) | considered that the John Hancock insurance companies that are affiliates of the Advisor, as shareholders of the Trust directly or through their separate accounts, receive certain tax credits or deductions relating to foreign taxes paid and dividends received by certain funds of the Trust and noted that these tax benefits, which are not available to participants in qualified retirement plans under applicable income tax law, are reflected in the profitability information reviewed by the Board; |
| (f) | considered that the Advisor also provides administrative services to the fund on a cost basis pursuant to an administrative services agreement; |
| (g) | noted that affiliates of the Advisor provide transfer agency services and distribution services to the fund, and that the fund’s distributor also receives Rule 12b-1 payments to support distribution of the fund; |
| (h) | noted that the Advisor also derives reputational and other indirect benefits from providing advisory services to the fund; |
| (i) | noted that the subadvisory fee for the fund is paid by the Advisor and is negotiated at arm’s length; |
| (j) | considered the Advisor’s ongoing costs and expenditures necessary to improve services, meet new regulatory and compliance requirements, and adapt to other challenges impacting the fund industry; and |
| (k) | considered that the Advisor should be entitled to earn a reasonable level of profits in exchange for the level of services it provides to the fund and the risks that it assumes as Advisor, including entrepreneurial, operational, reputational, litigation and regulatory risk |
| 33 | JOHN HANCOCK U.S. GLOBAL LEADERS GROWTH FUND | ANNUAL REPORT |
Table of Contents
|
Based upon its review, the Board concluded that the level of profitability, if any, of the Advisor and its affiliates from their relationship with the fund was reasonable and not excessive.
Economies of scale. In considering the extent to which economies of scale would be realized as the fund grows and whether fee levels reflect these economies of scale for the benefit of fund shareholders, the Board:
| (a) | considered that the Advisor has contractually agreed to waive a portion of its management fee for certain funds of the John Hancock Fund Complex, including the fund (the participating portfolios) or otherwise reimburse the expenses of the participating portfolios (the reimbursement). This waiver is based upon aggregate net assets of all the participating portfolios. The amount of the reimbursement is calculated daily and allocated among all the participating portfolios in proportion to the daily net assets of each fund; |
| (b) | reviewed the fund’s advisory fee structure and concluded that: (i) the fund’s fee structure contains breakpoints at the subadvisory fee level and that such breakpoints are reflected as breakpoints in the advisory fees for the fund; and (ii) although economies of scale cannot be measured with precision, these arrangements permit shareholders of the fund to benefit from economies of scale if the fund grows. The Board also took into account management’s discussion of the fund’s advisory fee structure; and |
| (c) | the Board also considered the effect of the fund’s growth in size on its performance and fees. The Board also noted that if the fund’s assets increase over time, the fund may realize other economies of scale. |
Approval of Subadvisory Agreement
In making its determination with respect to approval of the Subadvisory Agreement, the Board reviewed:
| (1) | information relating to the Subadvisor’s business, including current subadvisory services to the Trust (and other funds in the John Hancock Fund Complex); |
| (2) | the historical and current performance of the fund and comparative performance information relating to an applicable benchmark index and comparable funds; |
| (3) | the subadvisory fee for the fund, including any breakpoints, and to the extent available, comparable fee information prepared by an independent third party provider of fund data; and |
| (4) | information relating to the nature and scope of any material relationships and their significance to the Trust’s Advisor and Subadvisor. |
Nature, extent, and quality of services. With respect to the services provided by the Subadvisor, the Board received information provided to the Board by the Subadvisor, including the Subadvisor’s Form ADV, as well as took into account information presented throughout the past year. The Board considered the Subadvisor’s current level of staffing and its overall resources, as well as received information relating to the Subadvisor’s compensation program. The Board reviewed the Subadvisor’s history and investment experience, as well as information regarding the qualifications, background, and responsibilities of the Subadvisor’s investment and compliance personnel who provide services to the fund. The Board also considered, among other things, the Subadvisor’s compliance program and any disciplinary history. The Board also considered the Subadvisor’s risk assessment and monitoring process. The Board reviewed the Subadvisor’s regulatory history, including whether it was involved in any regulatory actions or investigations as well as material litigation, and any settlements and amelioratory actions undertaken, as appropriate. The Board noted that the Advisor conducts regular, periodic reviews of the Subadvisor and its operations, including regarding investment processes and organizational and staffing matters. The Board also noted that the Trust’s CCO and his staff conduct regular, periodic compliance reviews with the Subadvisor and
| ANNUAL REPORT | JOHN HANCOCK U.S. GLOBAL LEADERS GROWTH FUND | 34 |
Table of Contents
|
present reports to the Independent Trustees regarding the same, which includes evaluating the regulatory compliance systems of the Subadvisor and procedures reasonably designed to assure compliance with the federal securities laws. The Board also took into account the financial condition of the Subadvisor.
The Board considered the Subadvisor’s investment process and philosophy. The Board took into account that the Subadvisor’s responsibilities include the development and maintenance of an investment program for the fund that is consistent with the fund’s investment objective, the selection of investment securities and the placement of orders for the purchase and sale of such securities, as well as the implementation of compliance controls related to performance of these services. The Board also received information with respect to the Subadvisor’s brokerage policies and practices, including with respect to best execution and soft dollars.
Subadvisor compensation. In considering the cost of services to be provided by the Subadvisor and the profitability to the Subadvisor of its relationship with the fund, the Board noted that the fees under the Subadvisory Agreement are paid by the Advisor and not the fund.
The Board also relied on the ability of the Advisor to negotiate the Subadvisory Agreement with the Subadvisor, which is not affiliated with the Advisor, and the fees thereunder at arm’s length. As a result, the costs of the services to be provided and the profits to be realized by the Subadvisor from its relationship with the Trust were not a material factor in the Board’s consideration of the Subadvisory Agreement.
The Board also received information regarding the nature and scope (including their significance to the Advisor and its affiliates and to the Subadvisor) of any material relationships with respect to the Subadvisor, which include arrangements in which the Subadvisor or its affiliates provide advisory, distribution, or management services in connection with financial products sponsored by the Advisor or its affiliates, and may include other registered investment companies, a 529 education savings plan, managed separate accounts and exempt group annuity contracts sold to qualified plans. The Board also received information and took into account any other potential conflicts of interest the Advisor might have in connection with the Subadvisory Agreement.
In addition, the Board considered other potential indirect benefits that the Subadvisor and its affiliates may receive from the Subadvisor’s relationship with the fund, such as the opportunity to provide advisory services to additional funds in the John Hancock Fund Complex and reputational benefits.
Subadvisory fees. The Board considered that the fund pays an advisory fee to the Advisor and that, in turn, the Advisor pays a subadvisory fee to the Subadvisor. As noted above, the Board also considered the fund’s subadvisory fees as compared to similarly situated investment companies deemed to be comparable to the fund as included in the report prepared by the independent third party provider of fund data, to the extent available. The Board noted that the limited size of the Lipper peer group was not sufficient for comparative purposes. The Board also took into account the subadvisory fees paid by the Advisor to the Subadvisor with respect to the fund and compared them to fees charged by the Subadvisor to manage other subadvised portfolios and portfolios not subject to regulation under the 1940 Act, as applicable.
Subadvisor performance. As noted above, the Board considered the fund’s performance as compared to the fund’s peer group and the benchmark index and noted that the Board reviews information about the fund’s performance results at its regularly scheduled meetings. The Board noted the Advisor’s expertise and resources in monitoring the performance, investment style and risk-adjusted performance of the Subadvisor. The Board was mindful of the Advisor’s focus on the Subadvisor’s performance. The Board also noted the Subadvisor’s long-term performance record for similar accounts, as applicable.
The Board’s decision to approve the Subadvisory Agreement was based on a number of determinations, including the following:
| (1) | the Subadvisor has extensive experience and demonstrated skills as a manager; |
| 35 | JOHN HANCOCK U.S. GLOBAL LEADERS GROWTH FUND | ANNUAL REPORT |
Table of Contents
|
| (2) | the performance of the fund has generally been in line with or outperformed the historical performance of comparable funds; |
| (3) | the subadvisory fee is reasonable in relation to the level and quality of services being provided under the Subadvisory Agreement; and |
| (4) | noted that the subadvisory fees are paid by the Advisor not the fund and that the subadvisory fee breakpoints are reflected as breakpoints in the advisory fees for the fund in order to permit shareholders to benefit from economies of scale if the fund grows. |
* * *
Based on the Board’s evaluation of all factors that the Board deemed to be material, including those factors described above, the Board, including the Independent Trustees, concluded that renewal of the Advisory Agreement and the Subadvisory Agreement would be in the best interest of the fund and its shareholders. Accordingly, the Board, and the Independent Trustees voting separately, approved the Advisory Agreement and Subadvisory Agreement for an additional one-year period.
| ANNUAL REPORT | JOHN HANCOCK U.S. GLOBAL LEADERS GROWTH FUND | 36 |
Table of Contents
|
This chart provides information about the Trustees and Officers who oversee your John Hancock fund. Officers elected by the Trustees manage the day-to-day operations of the fund and execute policies formulated by the Trustees.
Independent Trustees
Name, year of birth Position(s) held with Trust Principal occupation(s) and other directorships during past 5 years | | Trustee of the Trust since | 1 | | Number of John Hancock funds overseen by Trustee | | ||
Hassell H. McClellan, Born: 1945 | 2012 | 196 | ||||||
Trustee and Chairperson of the Board
Director/Trustee, Virtus Funds (since 2008); Director, The Barnes Group (since 2010); Associate Professor, The Wallace E. Carroll School of Management, Boston College (retired 2013). Trustee (since 2005) and Chairperson of the Board (since 2017) of various trusts within the John Hancock Fund Complex.
Charles L. Bardelis,2 Born: 1941 | 2012 | 196 | ||||||
Trustee
Director, Island Commuter Corp. (marine transport). Trustee, John Hancock Collateral Trust (since 2014), Trustee of various trusts within the John Hancock Fund Complex (since 1988).
James R. Boyle, Born: 1959 | 2015 | 196 | ||||||
Trustee
Chief Executive Officer, Foresters Financial (since 2018); Chairman and Chief Executive Officer, Zillion Group, Inc. (formerly HealthFleet, Inc.) (healthcare) (2014-2018); Executive Vice President and Chief Executive Officer, U.S. Life Insurance Division of Genworth Financial, Inc. (insurance) (January 2014–July 2014); Senior Executive Vice President, Manulife Financial, President and Chief Executive Officer, John Hancock (1999–2012); Chairman and Director, John Hancock Investment Management LLC, John Hancock Investment Management Distributors LLC, and John Hancock Variable Trust Advisers LLC (2005–2010). Trustee of various trusts within the John Hancock Fund Complex (2005–2014 and since 2015).
Peter S. Burgess,2 Born: 1942 | 2012 | 196 | ||||||
Trustee
Consultant (financial, accounting, and auditing matters) (since 1999); Certified Public Accountant; Partner, Arthur Andersen (independent public accounting firm) (prior to 1999); Director, Lincoln Educational Services Corporation (since 2004); Director, Symetra Financial Corporation (2010–2016); Director, PMA Capital Corporation (2004–2010). Trustee of various trusts within the John Hancock Fund Complex (since 2005).
William H. Cunningham, Born: 1944 | 2005 | 196 | ||||||
Trustee
Professor, University of Texas, Austin, Texas (since 1971); former Chancellor, University of Texas System and former President of the University of Texas, Austin, Texas; Chairman (since 2009) and Director (since 2006), Lincoln National Corporation (insurance); Director, Southwest Airlines (since 2000); former Director, LIN Television (2009–2014). Trustee of various trusts within the John Hancock Fund Complex (since 1986).
Grace K. Fey, Born: 1946 | 2012 | 196 | ||||||
Trustee
Chief Executive Officer, Grace Fey Advisors (since 2007); Director and Executive Vice President, Frontier Capital Management Company (1988–2007); Director, Fiduciary Trust (since 2009). Trustee of various trusts within the John Hancock Fund Complex (since 2008).
| 37 | JOHN HANCOCK U.S. GLOBAL LEADERS GROWTH FUND | ANNUAL REPORT |
Table of Contents
|
Independent Trustees (continued)
Name, year of birth Position(s) held with Trust Principal occupation(s) and other directorships during past 5 years | | Trustee of the Trust since | 1 | | Number of John Hancock funds overseen by Trustee | | ||
Deborah C. Jackson, Born: 1952 | 2008 | 196 | ||||||
Trustee
President, Cambridge College, Cambridge, Massachusetts (since 2011); Board of Directors, Massachusetts Women’s Forum (since 2018); Board of Directors, National Association of Corporate Directors/New England (since 2015); Board of Directors, Association of Independent Colleges and Universities of Massachusetts (2014-2017); Chief Executive Officer, American Red Cross of Massachusetts Bay (2002–2011); Board of Directors of Eastern Bank Corporation (since 2001); Board of Directors of Eastern Bank Charitable Foundation (since 2001); Board of Directors of American Student Assistance Corporation (1996–2009); Board of Directors of Boston Stock Exchange (2002–2008); Board of Directors of Harvard Pilgrim Healthcare (health benefits company) (2007–2011). Trustee of various trusts within the John Hancock Fund Complex (since 2008).
James M. Oates,2 Born: 1946 | 2012 | 196 | ||||
Trustee
Managing Director, Wydown Group (financial consulting firm) (since 1994); Chairman and Director, Emerson Investment Management, Inc. (2000-2015); Independent Chairman, Hudson Castle Group, Inc. (formerly IBEX Capital Markets, Inc.) (financial services company) (1997–2011); Director, Stifel Financial (since 1996); Director, Investor Financial Services Corporation (1995–2007); Director, Connecticut River Bancorp (1998-2014); Director/Trustee, Virtus Funds (since 1988). Trustee (since 2004) and Chairperson of the Board (2005-2016) of various trusts within the John Hancock Fund Complex.
Steven R. Pruchansky, Born: 1944 | 2005 | 196 | ||||
Trustee and Vice Chairperson of the Board
Managing Director, Pru Realty (since 2017); Chairman and Chief Executive Officer, Greenscapes of Southwest Florida, Inc. (since 2014); Director and President, Greenscapes of Southwest Florida, Inc. (2000-2014); Member, Board of Advisors, First American Bank (until 2010); Managing Director, Jon James, LLC (real estate) (since 2000); Partner, Right Funding, LLC (2014-2017); Director, First Signature Bank & Trust Company (until 1991); Director, Mast Realty Trust (until 1994); President, Maxwell Building Corp. (until 1991). Trustee (since 1992), Chairperson of the Board (2011–2012), and Vice Chairperson of the Board (since 2012) of various trusts within the John Hancock Fund Complex.
Frances G. Rathke,2,* Born: 1960 | 2020 | 196 | ||||
Trustee
Director, Northern New England Energy Corporation (since 2017); Director, Audit Committee Chair and Compensation Committee Member, Green Mountain Power Corporation (since 2016); Director, Treasurer and Finance & Audit Committee Chair, Flynn Center for Performing Arts (since 2016); Director, Audit Committee Chair and Compensation Committee Member, Planet Fitness (since 2016); Director, Citizen Cider, Inc. (high-end hard cider and hard seltzer company) (since 2016); Chief Financial Officer and Treasurer, Keurig Green Mountain, Inc. (2003-retired 2015); Independent Financial Consultant, Frances Rathke Consulting (strategic and financial consulting services) (2001-2003); Chief Financial Officer and Secretary, Ben & Jerry’s Homemade, Inc. (1989-2000, including prior positions); Senior Manager, Coopers & Lybrand, LLC (independent public accounting firm) (1982-1989). Trustee of various trusts within the John Hancock Fund Complex (since 2020).
| ANNUAL REPORT | JOHN HANCOCK U.S. GLOBAL LEADERS GROWTH FUND | 38 |
Table of Contents
|
Independent Trustees (continued)
Name, year of birth Position(s) held with Trust Principal occupation(s) and other directorships during past 5 years | | Trustee of the Trust since | 1 | | Number of John Hancock funds overseen by Trustee | | ||
Gregory A. Russo, Born: 1949 | 2009 | 196 | ||||||
Trustee
Director and Audit Committee Chairman (2012-2020), and Member, Audit Committee and Finance Committee (2011-2020), NCH Healthcare System, Inc. (holding company for multi-entity healthcare system); Director and Member (2012-2018) and Finance Committee Chairman (2014-2018), The Moorings, Inc. (nonprofit continuing care community); Vice Chairman, Risk & Regulatory Matters, KPMG LLP (KPMG) (2002–2006); Vice Chairman, Industrial Markets, KPMG (1998–2002); Chairman and Treasurer,Westchester County, New York, Chamber of Commerce (1986–1992); Director, Treasurer, and Chairman of Audit and Finance Committees, Putnam Hospital Center (1989–1995); Director and Chairman of Fundraising Campaign, United Way of Westchester and Putnam Counties, New York (1990–1995). Trustee of various trusts within the John Hancock Fund Complex (since 2008).
Non-Independent Trustees3
Name, year of birth Position(s) held with Trust Principal occupation(s) and other directorships during past 5 years | | Trustee of the Trust since | 1 | | Number of John Hancock funds overseen by Trustee | | ||
Andrew G. Arnott, Born: 1971 | 2017 | 196 | ||||||
President and Non-Independent Trustee
Head of Wealth and Asset Management, United States and Europe, for John Hancock and Manulife (since 2018); Executive Vice President, John Hancock Financial Services (since 2009, including prior positions); Director and Executive Vice President, John Hancock Investment Management LLC (since 2005, including prior positions); Director and Executive Vice President, John Hancock Variable Trust Advisers LLC (since 2006, including prior positions); President, John Hancock Investment Management Distributors LLC (since 2004, including prior positions); President of various trusts within the John Hancock Fund Complex (since 2007, including prior positions). Trustee of various trusts within the John Hancock Fund Complex (since 2017).
Marianne Harrison, Born: 1963 | 2018 | 196 | ||||||
Non-Independent Trustee
President and CEO, John Hancock (since 2017); President and CEO, Manulife Canadian Division (2013–2017); Member, Board of Directors, CAE Inc. (since 2019); Member, Board of Directors,MA Competitive Partnership Board (since 2018); Member, Board of Directors, American Council of Life Insurers (ACLI) (since 2018); Member, Board of Directors, Communitech, an industry-led innovation center that fosters technology companies in Canada (2017-2019); Member, Board of Directors, Manulife Assurance Canada (2015-2017); Board Member, St. Mary’s General Hospital Foundation (2014-2017); Member, Board of Directors, Manulife Bank of Canada (2013- 2017); Member, Standing Committee of the Canadian Life & Health Assurance Association (2013-2017); Member, Board of Directors, John Hancock USA, John Hancock Life & Health, John Hancock New York (2012–2013). Trustee of various trusts within the John Hancock Fund Complex (since 2018).
| 39 | JOHN HANCOCK U.S. GLOBAL LEADERS GROWTH FUND | ANNUAL REPORT |
Table of Contents
|
Principal officers who are not Trustees | ||||
Name, year of birth Position(s) held with Trust Principal occupation(s) during past 5 years
| Officer
| |||
Charles A. Rizzo, Born: 1957 | 2007 | |||
| Chief Financial Officer | ||||
| Vice President, John Hancock Financial Services (since 2008); Senior Vice President, John Hancock Investment Management LLC and John Hancock Variable Trust Advisers LLC (since 2008); Chief Financial Officer of various trusts within the John Hancock Fund Complex (since 2007). | ||||
Salvatore Schiavone, Born: 1965 | 2010 | |||
| Treasurer | ||||
| Assistant Vice President, John Hancock Financial Services (since 2007); Vice President, John Hancock Investment Management LLC and John Hancock Variable Trust Advisers LLC (since 2007); Treasurer of various trusts within the John Hancock Fund Complex (since 2007, including prior positions). | ||||
Christopher (Kit) Sechler, Born: 1973 | 2018 | |||
| Chief Legal Officer and Secretary | ||||
| Vice President and Deputy Chief Counsel, John Hancock Investments (since 2015); Assistant Vice President and Senior Counsel (2009–2015), John Hancock Investments; Chief Legal Officer and Secretary of various trusts within the John Hancock Fund Complex (since 2018); Assistant Secretary of John Hancock Investment Management LLC and John Hancock Variable Trust Advisers LLC (since 2009). | ||||
Trevor Swanberg, Born: 1979 | 2020 | |||
| Chief Compliance Officer | ||||
| Chief Compliance Officer, various trusts within the John Hancock Fund Complex, John Hancock Investment Management LLC, and John Hancock Variable Trust Advisers LLC (since 2020); Deputy Chief Compliance Officer, various trusts within the John Hancock Fund Complex (2018–2020); Deputy Chief Compliance Officer, John Hancock Investment Management LLC and John Hancock Variable Trust Advisers LLC (2019–2020); Assistant Chief Compliance Officer, various trusts within the John Hancock Fund Complex (2016–2018); Assistant Chief Compliance Officer, John Hancock Investment Management LLC and John Hancock Variable Trust Advisers LLC (2016–2019); Vice President, State Street Global Advisors (2015–2016). | ||||
The business address for all Trustees and Officers is 200 Berkeley Street, Boston, Massachusetts 02116-5023. |
The Statement of Additional Information of the fund includes additional information about members of the Board of Trustees of the Trust and is available without charge, upon request, by calling 800-225-5291. |
| 1 | Each Trustee holds office until his or her successor is elected and qualified, or until the Trustee’s death, retirement, resignation, or removal. Mr. Boyle has served as Trustee at various times prior to the date listed in the table. |
| 2 | Member of the Audit Committee. |
| 3 | The Trustee is a Non-Independent Trustee due to current or former positions with the Advisor and certain affiliates. |
| * | Appointed as Independent Trustee effective as of September 15, 2020. |
| ANNUAL REPORT | JOHN HANCOCK U.S. GLOBAL LEADERS GROWTH FUND | 40 |
Table of Contents
|
Trustees
Hassell H. McClellan, Chairperson
Steven R. Pruchansky, Vice Chairperson
Andrew G. Arnott†
Charles L. Bardelis*
James R. Boyle
Peter S. Burgess*
William H. Cunningham
Grace K. Fey
Marianne Harrison†
Deborah C. Jackson
James M. Oates*
Frances G. Rathke1,*
Gregory A. Russo
Officers
Andrew G. Arnott
President
Charles A. Rizzo
Chief Financial Officer
Salvatore Schiavone
Treasurer
Christopher (Kit) Sechler
Secretary and Chief Legal Officer
Trevor Swanberg2
Chief Compliance Officer
Investment advisor
John Hancock Investment Management LLC
Subadvisor
Sustainable Growth Advisers, LP (SGA)
Portfolio Managers
Gordon M. Marchand, CFA, CPA, CIC
Robert L. Rohn
Kishore Rao
Principal distributor
John Hancock Investment Management
Distributors LLC
Custodian
State Street Bank and Trust Company
Transfer agent
John Hancock Signature Services, Inc.
Legal counsel
K&L Gates LLP
Independent registered public accounting firm
PricewaterhouseCoopers LLP
| * | Member of the Audit Committee |
| † | Non-Independent Trustee |
| 1 | Appointed as Independent Trustee effective as of September 15, 2020 |
| 2 | Effective July 31, 2020 |
The fund’s proxy voting policies and procedures, as well as the fund proxy voting record for the most recent twelve-month period ended June 30, are available free of charge on the Securities and Exchange Commission (SEC) website at sec.gov or on our website.
All of the fund’s holdings as of the end of the third month of every fiscal quarter are filed with the SEC on Form N-PORT within 60 days of the end of the fiscal quarter. The fund’s Form N-PORT filings are available on our website and the SEC’s website, sec.gov.
We make this information on your fund, as well as monthly portfolio holdings, and other fund details available on our website at jhinvestments.com or by calling 800-225-5291.
| You can also contact us: | ||||
| 800-225-5291 | Regular mail: | Express mail: | ||
| jhinvestments.com | John Hancock Signature Services, Inc. | John Hancock Signature Services, Inc. | ||
| P.O. Box 219909 | 430 W 7th Street | |||
| Kansas City, MO 64121-9909 | Suite 219909 | |||
| Kansas City, MO 64105-1407 | ||||
| 41 | JOHN HANCOCK U.S. GLOBAL LEADERS GROWTH FUND | ANNUAL REPORT |
Table of Contents
Protect yourself by using eDelivery
|
Signing up for the electronic delivery of your statements and other financial publications is a great way to help protect your privacy. eDelivery provides you with secure, instant access to all of your statements in one convenient location.
BENEFITS OF EDELIVERY
| ◾ |
Added security: Password protection helps you safely retrieve documents online | |||
| ◾ |
Save time: Receive instant email notification once statements are available |  | ||
| ◾ |
Reduce clutter: View documents online to reduce the amount of paper for filing, shredding, or recycling | jhinvestments.com/login |
SIGN UP FOR EDELIVERY TODAY!
Direct shareholders
If you receive statements directly through John Hancock Investment Management and would like to participate in eDelivery, go to jhinvestments.com/login. To log in to your account, click on the “Log in” button on the page’s top right corner. In the “Access your investments account” area, go to the “Individual retirement or mutual fund account” section and select the option that applies to you. Please be aware that you may be required to provide your account number and certain personal account information.
You may revoke your consent at any time by simply visiting jhinvestments.com/login and following the instructions above. You may also revoke consent by calling 800-225-5291 or by writing to us at the following address: John Hancock Signature Services, P.O. Box 219909, Kansas City, MO 64121-9909. We reserve the right to deliver documents to you on paper at any time should the need arise.
Brokerage account shareholders
If you receive statements directly from your bank or broker and would like to participate in eDelivery, go to icsdelivery/live or contact your financial representative.
| Not part of the shareholder report |
Table of Contents
Get your questions answered by using our shareholder resources
|
ONLINE
| ◾ |
Visit jhinvestments.com to access a range of resources for individual investors, from account details and fund information to forms and our latest insight on the markets and economy. | |
| ◾ |
Use our Fund Compare tool to compare thousands of funds and ETFs across dozens of risk and performance metrics—all powered by Morningstar. | |
| ◾ |
Visit our online Tax Center, where you’ll find helpful taxpayer resources all year long, including tax forms, planning guides, and other fund-specific information. | |
| ◾ |
Follow us on Facebook, Twitter, and LinkedIn to get the latest updates on the markets and what’s trending now. |
BY PHONE
Call our customer service representatives at 800-225-5291, Monday to Thursday, 8:00A.M. to 7:00P.M., and Friday, 8:00A.M. to 6:00P.M., Eastern time. We’re here to help!
| Not part of the shareholder report |
Table of Contents
John Hancock family of funds
|
DOMESTIC EQUITY FUNDS
Blue Chip Growth
Classic Value
Disciplined Value
Disciplined Value Mid Cap
Equity Income
Financial Industries
Fundamental All Cap Core
Fundamental Large Cap Core
New Opportunities
Regional Bank
Small Cap Core
Small Cap Growth
Small Cap Value
U.S. Global Leaders Growth
U.S. Growth
GLOBAL AND INTERNATIONAL EQUITY FUNDS
Disciplined Value International
Emerging Markets
Emerging Markets Equity
Fundamental Global Franchise
Global Equity
Global Shareholder Yield
Global Thematic Opportunities
International Dynamic Growth
International Growth
International Small Company
INCOME FUNDS
Bond
California Tax-Free Income
Emerging Markets Debt
Floating Rate Income
Government Income
High Yield
High Yield Municipal Bond
Income
Investment Grade Bond
Money Market
Short Duration Bond
Short Duration Credit Opportunities
Strategic Income Opportunities
Tax-Free Bond
ALTERNATIVE AND SPECIALTY FUNDS
Absolute Return Currency
Alternative Asset Allocation
Alternative Risk Premia
Diversified Macro
Infrastructure
Multi-Asset Absolute Return
Real Estate Securities
Seaport Long/Short
A fund’s investment objectives, risks, charges, and expenses should be considered carefully before investing. The prospectus contains this and other important information about the fund. To obtain a prospectus, contact your financial professional, call John Hancock Investment Management at 800-225-5291, or visit our website at jhinvestments.com. Please read the prospectus carefully before investing or sending money.
Table of Contents
|
ASSET ALLOCATION
Balanced
Multi-Asset High Income
Multi-Index Lifetime Portfolios
Multi-Index Preservation Portfolios
Multimanager Lifestyle Portfolios
Multimanager Lifetime Portfolios
Retirement Income 2040
EXCHANGE-TRADED FUNDS
John Hancock Multifactor Consumer Discretionary ETF
John Hancock Multifactor Consumer Staples ETF
John Hancock Multifactor Developed International ETF
John Hancock Multifactor Emerging Markets ETF
John Hancock Multifactor Energy ETF
John Hancock Multifactor Financials ETF
John Hancock Multifactor Healthcare ETF
John Hancock Multifactor Industrials ETF
John Hancock Multifactor Large Cap ETF
John Hancock Multifactor Materials ETF
John Hancock Multifactor Media and
Communications ETF
John Hancock Multifactor Mid Cap ETF
John Hancock Multifactor Small Cap ETF
John Hancock Multifactor Technology ETF
John Hancock Multifactor Utilities ETF
ENVIRONMENTAL, SOCIAL, AND
GOVERNANCE FUNDS
ESG All Cap Core
ESG Core Bond
ESG International Equity
ESG Large Cap Core
CLOSED-END FUNDS
Financial Opportunities
Hedged Equity & Income
Income Securities Trust
Investors Trust
Preferred Income
Preferred Income II
Preferred Income III
Premium Dividend
Tax-Advantaged Dividend Income
Tax-Advantaged Global Shareholder Yield
John Hancock Multifactor ETF shares are bought and sold at market price (not NAV), and are not individually redeemed from the fund. Brokerage commissions will reduce returns.
John Hancock ETFs are distributed by Foreside Fund Services, LLC, and are subadvised by Dimensional Fund Advisors LP. Foreside is not affiliated with John Hancock Investment Management Distributors LLC or Dimensional Fund Advisors LP.
Dimensional Fund Advisors LP receives compensation from John Hancock in connection with licensing rights to the John Hancock Dimensional indexes. Dimensional Fund Advisors LP does not sponsor, endorse, or sell, and makes no representation as to the advisability of investing in, John Hancock Multifactor ETFs.
Table of Contents
John Hancock Investment Management
A trusted brand
John Hancock Investment Management is a premier asset manager with a heritage of financial stewardship dating back to 1862. Helping our shareholders pursue their financial goals is at the core of everything we do. It’s why we support the role of professional financial advice and operate with the highest standards of conduct and integrity.
A better way to invest
We serve investors globally through a unique multimanager approach: We search the world to find proven portfolio teams with specialized expertise for every strategy we offer, then we apply robust investment oversight to ensure they continue to meet our uncompromising standards and serve the best interests of our shareholders.
Results for investors
Our unique approach to asset management enables us to provide a diverse set of investments backed by some of the world’s best managers, along with strong risk-adjusted returns across asset classes.
|

John Hancock Investment Management Distributors LLC ∎ Member FINRA, SIPC
200 Berkeley Street ∎ Boston, MA 02116-5010 ∎ 800-225-5291 ∎ jhinvestments.com
This report is for the information of the shareholders of John Hancock U.S. Global Leaders Growth Fund. It is not authorized for distribution to prospective investors unless preceded or accompanied by a prospectus.

MF1399381 | 26A 10/20 | |||
| 12/2020 |
Table of Contents
| ITEM 2. | CODE OF ETHICS. |
As of the end of the year, October 31, 2020, the registrant has adopted a code of ethics, as defined in Item 2 of Form N-CSR, that applies to its Chief Executive Officer, Chief Financial Officer and Treasurer (respectively, the principal executive officer, the principal financial officer and the principal accounting officer, the “Senior Financial Officers”). A copy of the code of ethics is filed as an exhibit to this Form N-CSR.
| ITEM 3. | AUDIT COMMITTEE FINANCIAL EXPERT. |
Peter S. Burgess is the audit committee financial expert and is “independent”, pursuant to general instructions on Form N-CSR Item 3.
| ITEM 4. | PRINCIPAL ACCOUNTANT FEES AND SERVICES. |
(a) Audit Fees
The aggregate fees billed for professional services rendered by the principal accountant for the audits of the registrant’s annual financial statements or services that are normally provided by the accountant in connection with statutory and regulatory filings or engagements amounted to the following for the fiscal years ended October 31, 2020 and 2019. These fees were billed to the registrant and were approved by the registrant’s audit committee.
Fund | October 31, 2020 | October 31, 2019 | ||||||
John Hancock Classic Value Fund | $ | 40,115 | $ | 34,159 | ||||
John Hancock U.S. Global Leaders Growth Fund | 40,115 | 32,095 | ||||||
|
|
|
| |||||
Total | $ | 80,230 | $ | 66,254 | ||||
|
|
|
| |||||
(b) Audit-Related Services
Audit-related service fees for assurance and related services by the principal accountant are billed to the registrant or to the registrant’s investment adviser (not including any sub-adviser whose role is primarily portfolio management and is subcontracted with or overseen by another investment adviser), and any entity controlling, controlled by, or under common control with the adviser (“control affiliates”) that provides ongoing services to the registrant. The nature of the services provided was affiliated service provider internal controls reviews.
Fund | October 31, 2020 | October 31, 2019 | ||||||
John Hancock Classic Value Fund | $ | 604 | $ | 616 | ||||
John Hancock U.S. Global Leaders Growth Fund | 604 | 616 | ||||||
|
|
|
| |||||
Total | $ | 1,208 | $ | 1,232 | ||||
|
|
|
| |||||
In addition, amounts billed to control affiliates for service provider internal controls reviews were $116,000 and $116,647 for the fiscal years ended October 31, 2020 and 2019, respectively.
(c) Tax Fees
The aggregate fees billed for professional services rendered by the principal accountant for tax compliance, tax advice and tax planning (“tax fees”) amounted to the following for the fiscal years ended October 31, 2020 and 2019. The nature of the services comprising the tax fees was the review of the registrant’s tax returns and tax distribution requirements. These fees were billed to the registrant and were approved by the registrant’s audit committee.
Fund | October 31, 2020 | October 31, 2019 | ||||||
John Hancock Classic Value Fund | $ | 3,837 | $ | 3,837 | ||||
John Hancock U.S. Global Leaders Growth Fund | 5,087 | 3,837 | ||||||
|
|
|
| |||||
Total | $ | 8,924 | $ | 7,674 | ||||
|
|
|
| |||||
Table of Contents
(d) All Other Fees
Other fees billed for professional services rendered by the principal accountant to the registrant or to the control affiliates for the fiscal years ended October 31, 2020 and 2019 amounted to the following:
Fund | October 31, 2020 | October 31, 2019 | ||||||
John Hancock Classic Value Fund | $ | 89 | $ | 84 | ||||
John Hancock U.S. Global Leaders Growth Fund | 89 | 1,584 | ||||||
|
|
|
| |||||
Total | $ | 178 | $ | 1,668 | ||||
|
|
|
| |||||
(e)(1) Audit Committee Pre-Approval Policies and Procedures:
The trust’s Audit Committee must pre-approve all audit and non-audit services provided by the independent registered public accounting firm (the “Auditor”) relating to the operations or financial reporting of the funds. Prior to the commencement of any audit or non-audit services to a fund, the Audit Committee reviews the services to determine whether they are appropriate and permissible under applicable law.
The trust’s Audit Committee has adopted policies and procedures to, among other purposes, provide a framework for the Committee’s consideration of audit-related and non-audit services by the Auditor. The policies and procedures require that any audit-related and non-audit service provided by the Auditor and any non-audit service provided by the Auditor to a fund service provider that relates directly to the operations and financial reporting of a fund are subject to approval by the Audit Committee before such service is provided. Audit-related services provided by the Auditor that are expected to exceed $25,000 per instance/per fund are subject to specific pre-approval by the Audit Committee. Tax services provided by the Auditor that are expected to exceed $30,000 per instance/per fund are subject to specific pre-approval by the Audit Committee.
All audit services, as well as the audit-related and non-audit services that are expected to exceed the amounts stated above, must be approved in advance of provision of the service by formal resolution of the Audit Committee. At the regularly scheduled Audit Committee meetings, the Committee reviews a report summarizing the services, including fees, provided by the Auditor.
(e)(2) Services approved pursuant to paragraph (c)(7)(i)(C) of Rule 2-01 of Regulation S-X:
Audit-Related Fees, Tax Fees and All Other Fees:
There were no amounts that were approved by the Audit Committee pursuant to the de minimis exception under Rule 2-01 of Regulation S-X.
(f) According to the registrant’s principal accountant, for the fiscal period ended October 31, 2020, the percentage of hours spent on the audit of the registrant’s financial statements for the most recent fiscal year that were attributed to work performed by persons who were not full-time, permanent employees of principal accountant was less than 50%.
(g) The aggregate non-audit fees billed by the registrant’s accountant for non- audit services rendered to the registrant and rendered to the registrant’s control affiliates for the fiscal years ended October 31, 2020 and 2019 amounted to the following:
Trust | October 31, 2020 | October 31, 2019 | ||||||
John Hancock Capital Series | $ | 1,135,881 | $ | 967,560 | ||||
(h) The audit committee of the registrant has considered the non-audit services provided by the registrant’s principal accountant(s) to the control affiliates and has determined that the services that were not pre-approved are compatible with maintaining the principal accountant(s)’ independence.
Table of Contents
| ITEM 5. | AUDIT COMMITTEE OF LISTED REGISTRANTS. |
The registrant has a separately-designated standing audit committee comprised of independent trustees. The members of the audit committee are as follows:
Peter S. Burgess - Chairman
Charles L. Bardelis
James M. Oates
Frances G. Rathke
| ITEM 6. | SCHEDULE OF INVESTMENTS. |
(a) Not applicable.
(b) Not applicable.
| ITEM 7. | DISCLOSURE OF PROXY VOTING POLICIES AND PROCEDURES FOR CLOSED-END MANAGEMENT INVESTMENT COMPANIES. |
Not applicable.
| ITEM 8. | PORTFOLIO MANAGERS OF CLOSED-END MANAGEMENT INVESTMENT COMPANIES. |
Not applicable.
| ITEM 9. | PURCHASES OF EQUITY SECURITIES BY CLOSED-END MANAGEMENT INVESTMENT COMPANY AND AFFILIATED PURCHASERS. |
Not applicable.
| ITEM 10. | SUBMISSION OF MATTERS TO A VOTE OF SECURITY HOLDERS. |
There were no material changes to previously disclosed John Hancock Funds – Nominating and Governance Committee Charter.
| ITEM 11. | CONTROLS AND PROCEDURES. |
(a) Based upon their evaluation of the registrant’s disclosure controls and procedures as conducted within 90 days of the filing date of this Form N-CSR, the registrant’s principal executive officer and principal financial officer have concluded that those disclosure controls and procedures provide reasonable assurance that the material information required to be disclosed by the registrant on this report is recorded, processed, summarized and reported within the time periods specified in the Securities and Exchange Commission’s rules and forms.
(b) There were no changes in the registrant’s internal control over financial reporting that occurred during the period covered by this report that have materially affected, or are reasonably likely to materially affect, the registrant’s internal control over financial reporting.
| ITEM 12. | DISCLOSURE OF SECURITIES LENDING ACTIVITIES FOR CLOSED-END MANAGEMENT INVESTMENT COMPANIES. |
Not applicable.
| ITEM 13. | EXHIBITS. |
(a)(1) Code of Ethics for Senior Financial Officers is attached.
Table of Contents
Table of Contents
SIGNATURES
Pursuant to the requirements of the Securities Exchange Act of 1934 and the Investment Company Act of 1940, the registrant has duly caused this report to be signed on its behalf by the undersigned, thereunto duly authorized.
John Hancock Capital Series
| By: | /s/ Andrew Arnott | |
| Andrew Arnott | ||
| President |
Date: December 11, 2020
Pursuant to the requirements of the Securities Exchange Act of 1934 and the Investment Company Act of 1940, this report has been signed below by the following persons on behalf of the registrant and in the capacities and on the dates indicated.
| By: | /s/ Andrew Arnott | |
| Andrew Arnott | ||
| President |
Date: December 11, 2020
| By: | /s/ Charles A. Rizzo | |
| Charles A. Rizzo | ||
| Chief Financial Officer |
Date: December 11, 2020