QuickLinks -- Click here to rapidly navigate through this document
FORM 18-K
For Foreign Governments and Political Subdivisions Thereof
SECURITIES AND EXCHANGE COMMISSION
Washington, DC 20549
ANNUAL REPORT
of
HYDRO-QUÉBEC
QUÉBEC, CANADA
(Name of Registrant)
Date of end of last fiscal year: December 31, 2002
SECURITIES REGISTERED*
(As of close of fiscal year)
|
Title of issue
| | Amounts as to
which registration
is effective
| | Name of
exchanges on
which registered
|
|---|
|
| N/A | | N/A | | N/A |
|
Name and address of persons authorized to receive notices
and communications from the Securities and Exchange Commission:
DELEGATE GENERAL OF QUÉBEC
Québec Government House
Rockefeller Center
One Rockefeller Plaza
26th Floor
New York, NY 10020-2102
Copies to:
MR. ROBERT E. BUCKHOLZ, JR.
Sullivan & Cromwell
125 Broad Street
New York, NY 10004-2498 | | MR. PAUL ROBILLARD
Corporate Treasurer
Hydro-Québec
75 René-Lévesque Boulevard West
Montréal, Québec, Canada H2Z 1A4 |
*The Registrant is filing this annual report on a voluntary basis
| The information set forth below is to be furnished: |
1. |
In respect of each issue of securities of the registrant registered, a brief statement as to: |
|
(a) |
The general effect of any material modifications, not previously reported, of the rights of the holders of such securities. |
|
|
Not applicable. |
|
(b) |
The title and the material provisions of any law, decree or administrative action, not previously reported, by reason of which the security is not being serviced in accordance with the terms thereof. |
|
|
Not applicable. |
|
(c) |
The circumstances of any other failure, not previously reported, to pay principal, interest, or any sinking fund or amortization installment. |
|
|
Not applicable. |
2. |
A statement as of the close of the last fiscal year of the registrant giving the total outstanding of: |
|
(a) |
Internal funded debt of the registrant. (Total to be stated in the currency of the registrant. If any internal funded debt is payable in a foreign currency, it should not be included under this paragraph (a), but under paragraph (b) of this item.) |
|
|
Reference is made to pages 49, 63 and 64 of Exhibit (d) hereto. |
|
(b) |
External funded debt of the registrant. (Totals to be stated in the respective currencies in which payable. No statement need be furnished as to intergovernmental debt.) |
|
|
Reference is made to pages 49 and 64 to 68 of Exhibit (d) hereto. |
3. |
A statement giving the title, date of issue, date of maturity, interest rate and amount outstanding, together with the currency or currencies in which payable, of each issue of funded debt of the registrant outstanding as of the close of the last fiscal year of the registrant. |
|
|
Reference is made to pages 63 to 68 of Exhibit (d) hereto. |
| | | | |
4. |
(a) |
As to each issue of securities of the registrant which is registered, there should be furnished a break-down of the total amount outstanding, as shown in Item 3, into the following: |
|
|
(1) |
Total amount held by or for the account of the registrant. |
|
|
|
None. |
|
|
(2) |
Total estimated amount held by nationals of the registrant (or if registrant is other than a national government by the nationals of its national government); this estimate need be furnished only if it is practicable to do so. |
|
|
|
Not practicable to do so. |
|
|
(3) |
Total amount otherwise outstanding. |
|
|
|
Not applicable.* |
|
(b) |
If a substantial amount is set forth in answer to paragraph (a) (1) above, describe briefly the method employed by the registrant to reacquire such securities. |
|
|
Not applicable. |
5. |
A statement as of the close of the last fiscal year of the registrant giving the estimated total of: |
|
(a) |
Internal floating indebtedness of the registrant. (Total to be stated in the currency of the registrant.) |
|
|
Reference is made to page 36 of Exhibit (d) hereto. The item "floating indebtedness" refers to indebtedness with an original maturity of less than one year. |
|
(b) |
External floating indebtedness of the registrant. (Total to be stated in the respective currencies in which payable.) |
|
|
None. The item "floating indebtedness" refers to indebtedness with an original maturity of less than one year. |
6. |
Statements of the receipts, classified by source, and of the expenditures, classified by purpose, of the registrant for each fiscal year of the registrant ended since the close of the latest fiscal year for which such information was previously reported. These statements should be so itemized as to be reasonably informative and should cover both ordinary and extraordinary receipts and expenditures; there should be indicated separately, if practicable, the amount of receipts pledged or otherwise specifically allocated to any issue registered, indicating the issue. |
|
|
Reference is made to pages 35 to 62 of Exhibit (d) hereto. |
|
| * No securities of the registrant are registered under the U.S. Exchange Act of 1934, as amended. |
| | | | |
ii
7. |
(a) |
If any foreign exchange control, not previously reported, has been established by the registrant (or if the registrant is other than a national government, by its national government), briefly describe the effect of any such action, not previously reported. |
|
|
None. |
|
(b) |
If any foreign exchange control previously reported has been discontinued or materially modified, briefly describe the effect of any such action, not previously reported. |
|
|
Not applicable. |
This annual report comprises: |
|
(a) |
The cover page and pages numbered 2 to 4 consecutively. |
|
(b) |
The following exhibits: |
|
|
(a) |
None |
|
|
(b) |
None |
|
|
(c) |
None |
|
|
(d) |
Description of Hydro-Québec, dated as of May 7, 2003 (including audited consolidated financial statements of Hydro-Québec for the year ended December 31, 2002). |
|
|
(e) |
Consent of Samson Bélair/Deloitte & Touche and PricewaterhouseCoopers LLP. |
This annual report is filed subject to the Instructions for Form 18-K for Foreign Governments and Political Subdivisions Thereof.
iii
SIGNATURE
Pursuant to the requirements of the Securities Exchange Act of 1934, the registrant has duly caused this annual report to be signed on its behalf by the undersigned, thereunto duly authorized, in Montréal, Canada, on the 7th day of May, 2003.
| | | HYDRO-QUÉBEC |
|
|
By: |
/s/ PAUL ROBILLARD
Paul Robillard
Corporate Treasurer |
EXHIBIT INDEX
Exhibits
| | Description
|
|---|
| (d) | | Description of Hydro-Québec, dated as of May 7, 2003, including audited consolidated financial statements of Hydro-Québec for the year ended December 31, 2002. |
| (e) | | Consent of Samson Bélair/Deloitte & Touche and PricewaterhouseCoopers LLP. |
iv

| | | |
| | | |
| | | |
| | | |
| | | |
| | | |
| | | |
| | | |
| | | |
| | | |
| | | The description of Hydro-Québec is dated as of May 7, 2003 and appears as Exhibit (d) to Hydro-Québec's annual report on Form 18-K to the U.S. Securities and Exchange Commission for the fiscal year ended December 31, 2002. |
This document may be delivered to you at any time but you should assume that the information is accurate only as of May 7, 2003. Hydro-Québec's business, financial condition, results of operations and prospects may have changed since that date.
This document does not constitute an offer to sell or the solicitation of an offer to buy any securities of Hydro-Québec, unless it is included in a registration statement filed under the Securities Act of 1933, as amended.
TABLE OF CONTENTS
| | Page
|
|---|
| FOREIGN EXCHANGE | | 3 |
| SUMMARY | | 4 |
| MAP | | 6 |
| HYDRO-QUÉBEC | | 7 |
| | GENERAL | | 7 |
| | DISTRIBUTION | | 7 |
| | | Facilities | | 7 |
| | | Québec Market | | 8 |
| | | Rates | | 8 |
| | | Electricity Sales and Revenue | | 9 |
| | TRANSMISSION | | 9 |
| | | Transmission System in Québec | | 10 |
| | | International | | 11 |
| | GENERATION | | 11 |
| | | Generation Operations | | 12 |
| | | Wholesale and Trading Operations | | 14 |
| | OIL AND GAS | | 15 |
| | CONSTRUCTION | | 16 |
| | CORPORATE AND OTHER ACTIVITIES | | 16 |
| | CORPORATE OUTLOOK | | 17 |
| | | Development Strategy | | 17 |
| | | Capital Investment Program | | 18 |
| | | Regulatory Framework | | 21 |
| | | Litigation | | 23 |
| | | Employees | | 24 |
| | MANAGEMENT'S FINANCIAL DISCUSSION | | 25 |
| | | Financial Objectives | | 25 |
| | | Consolidated Financial Results for the year ended December 31, 2002 | | 25 |
| | | Financial Results of the Distribution Segment | | 27 |
| | | Financial Results of the Transmission Segment | | 28 |
| | | Financial Results of the Generation Segment | | 28 |
| | | Financial Results of the Oil and Gas Segment | | 29 |
| | | Financial Results of the Construction and Corporate and Other Activities Segments | | 29 |
| WHERE YOU CAN FIND MORE INFORMATION | | 30 |
| FORWARD-LOOKING STATEMENTS | | 30 |
| SUMMARY OF CERTAIN DIFFERENCES BETWEEN CANADIAN GAAP AND US GAAP | | 31 |
| AUDITORS' REPORT | | 34 |
| CONSOLIDATED FINANCIAL STATEMENTS | | 35 |
| LONG-TERM DEBT BY ISSUE | | 63 |
FOREIGN EXCHANGE
Canada maintains a floating exchange rate for the Canadian dollar in order to permit the rate to be determined by fundamental forces without intervention except as required to maintain orderly conditions. Annual average noon spot exchange rates for major foreign currencies in which debt of Hydro-Québec is denominated, expressed in Canadian dollars, are shown below.
Foreign Currency
| | 1998
| | 1999
| | 2000
| | 2001
| | 2002
| | 2003(1)
|
|---|
| United States Dollar | | $ | 1.4831 | | $ | 1.4858 | | $ | 1.4852 | | $ | 1.5484 | | $ | 1.5704 | | $ | 1.4970 |
| Deutsche Mark | | | 0.8450 | | | 0.8102 | | | 0.7007 | | | 0.7091 | | | n/a | | | n/a |
| French Franc | | | 0.2520 | | | 0.2416 | | | 0.2089 | | | 0.2114 | | | n/a | | | n/a |
| Euro | | | n/a | | | 1.5847 | | | 1.3704 | | | 1.3868 | | | 1.4832 | | | 1.6115 |
| Swiss Franc | | | 1.0258 | | | 0.9901 | | | 0.8793 | | | 0.9184 | | | 1.0112 | | | 1.0936 |
| Pound Sterling | | | 2.4587 | | | 2.4038 | | | 2.2499 | | | 2.2298 | | | 2.3582 | | | 2.3888 |
| 100 Japanese Yen | | | 1.1390 | | | 1.3110 | | | 1.3780 | | | 1.2755 | | | 1.2554 | | | 1.2561 |
- (1)
- Monthly average through the end of April 2003.
Source: Bank of Canada.
In this document, unless otherwise specified or the context otherwise requires, all dollar amounts are expressed in Canadian dollars.
3
SUMMARY
The information below is qualified in its entirety by the detailed information contained elsewhere in this document.
| | Years ended December 31
|
|---|
| | 1998
| | 1999
| | 2000
| | 2001
| | 2002
|
|---|
| | (dollar amounts in millions)
|
|---|
| Statistical Information — Electricity | | | | | | | | | | | | | | | |
| Electricity sales (in TWh) | | | | | | | | | | | | | | | |
| | Québec | | | 142.8 | | | 147.0 | | | 152.8 | | | 152.2 | | | 158.6 |
| | Outside Québec | | | 18.6 | | | 24.7 | | | 37.3 | | | 42.8 | | | 54.7 |
| | |
| |
| |
| |
| |
|
| | | | 161.4 | | | 171.7 | | | 190.1 | | | 195.0 | | | 213.3 |
| | |
| |
| |
| |
| |
|
| Revenue from electricity sales | | | | | | | | | | | | | | | |
| | Québec | | $ | 7,227 | | $ | 7,448 | | $ | 7,794 | | $ | 7,803 | | $ | 8,112 |
| | Outside Québec | | | 814 | | | 1,051 | | | 2,380 | | | 3,120 | | | 3,507 |
| | |
| |
| |
| |
| |
|
| | | $ | 8,041 | | $ | 8,499 | | $ | 10,174 | | $ | 10,923 | | $ | 11,619 |
| | |
| |
| |
| |
| |
|
| Average rate increase (Québec) as of May 1 | | | 1.6% | | | 0.0% | | | 0.0% | | | 0.0% | | | 0.0% |
| Customer accounts at end of year (in thousands) | | | 3,481 | | | 3,505 | | | 3,529 | | | 3,557 | | | 3,597 |
| Installed capacity at end of period (in MW)(1) | | | 32,615 | | | 32,648 | | | 32,655 | | | 32,654 | | | 32,661 |
Peak power requirements in Québec for winter beginning
in December (in MW) | | | 31,995 | | | 31,470 | | | 30,412 | | | 30,080 | | | 34,989 |
Consolidated financial information |
|
|
|
|
|
|
|
|
|
|
|
|
|
|
|
| Total revenue | | $ | 8,879 | | $ | 9,608 | | $ | 11,429 | | $ | 12,578 | | $ | 13,002 |
| Interest expenses (including capitalized interest) | | $ | 3,365 | | $ | 3,231 | | $ | 3,289 | | $ | 3,158 | | $ | 2,966 |
| Net income(2)(3) | | $ | 218 | | $ | 1,223 | | $ | 873 | | $ | 595 | | $ | 1,526 |
| Earnings before interest, depreciation, amortization, decommissioning and non-controlling interest(2) | | $ | 4,903 | | $ | 5,981 | | $ | 5,795 | | $ | 5,317 | | $ | 6,239 |
| Capital expenditures | | $ | 2,326 | | $ | 2,098 | | $ | 3,490 | | $ | 1,878 | | $ | 2,449 |
| Interest coverage(4) | | | 1.25 | | | 1.33 | | | 1.37 | | | 1.43 | | | 1.56 |
| Total assets(2) | | $ | 56,936 | | $ | 57,150 | | $ | 58,881 | | $ | 58,663 | | $ | 59,078 |
| Long-term and perpetual debt(2)(5) | | $ | 38,446 | | $ | 36,593 | | $ | 35,565 | | $ | 37,906 | | $ | 37,331 |
| Shareholder's equity(2)(6) | | $ | 12,409 | | $ | 13,175 | | $ | 13,513 | | $ | 13,539 | | $ | 14,215 |
| Capitalization ratio(2)(7)(8) | | | 23.7% | | | 25.4% | | | 25.1% | | | 25.0% | | | 26.2% |
| Permanent employees at end of year (in thousands)(9) | | | 17.5 | | | 17.3 | | | 17.3 | | | 17.7 | | | 18.0 |
- (1)
- Of total installed and minimum firm available capacity at December 31, 2002, 93% was hydroelectric and 7% was thermal. In addition, we have access to most of the generation of the Churchill Falls power plants and to all the output from the Matane and Cap-Chat wind farms. Installed capacity shown for the generation stations reflects the capacity of alternators in winter conditions. The data previously reported from 1998 to 2001 has been restated accordingly.
- (2)
- Financial statements have been restated as a result of the retroactive application of a new Canadian accounting standard on foreign currency translation which eliminates the deferral and amortization of foreign exchange gains and losses related to unhedged foreign-denominated monetary items and requires that such gains or losses be recognized in the year's income.
- (3)
- Net income reported for the years 1998 to 2001 was $679 million, $906 million, $1,078 million and $1,108 million, respectively.
- (4)
- Sum of operating income and net investment income divided by gross interest expense.
- (5)
- The perpetual debt is translated at the closing foreign exchange rate in effect at the balance sheet date, whereas prior to the change in accounting standard it was translated at the rate in effect on the date of issue.
- (6)
- Shareholder's equity reported for the years 1998 to 2001 was $13,288 million, $13,741 million, $14,280 million and $14,834 million, respectively.
- (7)
- Shareholder's equity divided by the sum of shareholder's equity, long-term debt, perpetual debt, short-term borrowings and current portion of long-term debt less financial assets related to debt.
- (8)
- The capitalization ratio reported for the years 1998 to 2001 was 25.0%, 26.2%, 26.2% and 26.8%, respectively.
- (9)
- Excludes employees of subsidiaries and joint ventures.
4
Units of measurement:
| |
| |
| |
|
|---|
| GW: | | gigawatt, or 1 million kilowatts | | GWh: | | gigawatthour, or 1 million kilowatthours |
| MW: | | megawatt, or 1 million watts | | TWh: | | terawatthour, or 1 billion kilowatthours |
| kWh: | | kilowatthour, or 1 thousand watthours | | kV: | | kilovolt, or 1 thousand volts |
5
6
HYDRO-QUÉBEC
GENERAL
We operate one of the two largest systems in Canada for the generation and distribution of electric power. We supply virtually all electric power distributed in Québec, the largest province in Canada in land area and the second largest in population.
Hydro-Québec was created in 1944 by the Hydro-Québec Act of the Parliament of Québec and is an agent of Québec. All capital stock of Hydro-Québec is held by the Minister of Finance on behalf of the government of Québec (the "Government").
Our head office is located at 75 René-Lévesque Boulevard West, Montréal, Québec, Canada H2Z 1A4.
Our operations are allocated among six business segments:
- •
- Distribution: Hydro-Québec Distribution develops and operates our distribution system and is responsible for sales and service to Québec customers.
- •
- Transmission: Hydro-Québec TransÉnergie develops and operates our transmission system in Québec, in addition to managing our foreign investments in transmission assets. It also manages our internal telecommunication network.
- •
- Generation: Hydro-Québec Production operates and develops our generation facilities in Québec and abroad. It guarantees the supply of heritage pool electricity to the Québec market (see "Regulatory Framework — Energy Board Act"). It participates in the Québec wholesale market by responding to calls for tenders from Hydro-Québec Distribution. It also sells electricity on external markets and engages in energy trading activities.
- •
- Oil and Gas: Hydro-Québec Pétrole et Gaz comprises all activities related to the pipeline transmission of oil, natural gas and liquid natural gas, as well as gas distribution. Activities arising from the exploration of oil and gas are also included in this segment.
- •
- Construction: Hydro-Québec Équipement and our wholly-owned subsidiary, Société d'énergie de la Baie James ("SEBJ"), provide engineering services and carry out construction projects in Québec and in other parts of the world.
- •
- Corporate and Other Activities: includes corporate activities related to financial services, human resources, strategic planning and corporate affairs, research and development, venture capital and the commercialization of our technologies.
DISTRIBUTION
The primary responsibility of Hydro-Québec Distribution is to supply Québec customers with the electricity they need. To fulfill this responsibility, the division purchases 165 TWh/year of heritage pool electricity from Hydro-Québec Production, at a regulated average fixed price of 2.79 cents per kWh. Beyond this volume, we must supply our Québec customers by issuing calls for tenders from suppliers in the market (see "Regulatory Framework — Energy Board Act"). Hydro-Québec Distribution oversees the activities of Hydro-Québec ValTech inc., a subsidiary set up to market technology related to the mission of Hydro-Québec Distribution.
Facilities
Our distribution system is made up of 66,400 miles of medium voltage lines (almost exclusively 25 kV), as well as 37,200 miles of low voltage lines. Approximately 9% of all such lines are underground.
7
Québec Market
We sell to a wide range of customers, from industrial users, which accounted for 43.3% of sales volume in 2002, to residential customers and farms, which represented 33.6% of sales volume in the same period. Revenues are also derived from sales to other types of customers, such as commercial and institutional customers as well as municipalities.
Through marketing efforts, we have developed some flexibility in the management of our system. We currently have 900 MW of interruptible power and 870 MW of concurrent peak-saving capacity in our residential dual-energy market.
Our rate structure offers large power customers options designed to meet their requirements, such as real-time pricing (based on what it costs on an hourly basis to generate, transmit and distribute electricity), guaranteed rates and U.S. dollar payment. These options permit us to improve demand management and increase sales revenue.
We have in place seven risk and profit-sharing agreements, signed between 1983 and 1991, with certain industrial customers for whom electricity costs represent a substantial portion of total production costs. These agreements provide for the sale, on a long-term basis, of firm energy at prices that vary in accordance with a formula based on the market price of the commodity produced by such customers. We manage the exposure to fluctuations in aluminum and other commodity prices resulting from these contracts by entering into financial transactions such as futures or swaps (see Note 14 to the Consolidated Financial Statements). In 2002, deliveries under such agreements (primarily to aluminum producers) accounted for approximately 29.4% of the total energy deliveries to industrial users.
Rates
Under the applicable provisions of the Energy Board Act, rates are fixed or modified by the Energy Board (see "Regulatory Framework — Energy Board Act"). In accordance with the transitional provisions of the Energy Board Act, the Government approved an increase of 1.6% for all electricity rates as of May 1, 1998, followed by a rate freeze for the 1999-2002 period. In our Strategic Plan 2002-2006, we have stated that the rate freeze will be extended until April 2004, and we will request moderate rate increases for 2004, 2005 and 2006.
The following table indicates our average rate increases and the real rates of increase after giving effect to inflation rates over the periods subsequent to the effective dates:
| | May 1
|
|---|
| | 1998
| | 1999
| | 2000
| | 2001
| | 2002
| |
| | 2003
| |
|
|---|
| Average rate increase | | 1.6% | | nil | | nil | | nil | | nil | | | | nil | | |
| Real rate increase (decrease)(1) | | 0.6% | | (2.2% | ) | (2.9% | ) | (2.1% | ) | (3.1% | ) | (2) | | (2.8% | ) | (2) |
- (1)
- Based on the monthly average of the Canadian Consumer Price Index.
- (2)
- Estimate.
8
Electricity Sales and Revenue
The following table summarizes electricity sales and revenue in Québec by class of customer for the years 1998 through 2002:
ELECTRICITY SALES AND REVENUE IN QUÉBEC
| | 1998
| | 1999
| | 2000
| | 2001
| | 2002
|
|---|
| | (TWh)
|
|---|
| ELECTRICITY SALES | | | | | | | | | | | | | | | |
| | Residential and farm | | | 47.7 | | | 49.3 | | | 51.7 | | | 50.8 | | | 53.2 |
| | General and institutional | | | 28.8 | | | 29.8 | | | 30.5 | | | 30.4 | | | 31.7 |
| | Industrial | | | 61.8 | | | 63.4 | | | 66.0 | | | 66.3 | | | 68.6 |
| | Other | | | 4.5 | | | 4.5 | | | 4.6 | | | 4.7 | | | 5.1 |
| | |
| |
| |
| |
| |
|
| | TOTAL SALES | | | 142.8 | | | 147.0 | | | 152.8 | | | 152.2 | | | 158.6 |
| | |
| |
| |
| |
| |
|
| | (millions of dollars)
|
|---|
| REVENUE FROM ELECTRICITY SALES | | | | | | | | | | | | | | | |
| | Residential and farm | | $ | 2,906 | | $ | 3,034 | | $ | 3,167 | | $ | 3,131 | | $ | 3,246 |
| | General and institutional | | | 1,894 | | | 1,963 | | | 2,002 | | | 1,973 | | | 2,058 |
| | Industrial | | | 2,214 | | | 2,236 | | | 2,405 | | | 2,482 | | | 2,577 |
| | Other | | | 213 | | | 215 | | | 220 | | | 217 | | | 231 |
| | |
| |
| |
| |
| |
|
| | TOTAL REVENUE FROM ELECTRICITY SALES | | $ | 7,227 | | $ | 7,448 | | $ | 7,794 | | $ | 7,803 | | $ | 8,112 |
| | |
| |
| |
| |
| |
|
| NUMBER OF CUSTOMER ACCOUNTS | | | | | | | | | | | | | | | |
| | Residential and farm | | | 3,182,033 | | | 3,206,211 | | | 3,228,610 | | | 3,257,361 | | | 3,295,544 |
| | General and institutional | | | 280,067 | | | 280,383 | | | 281,107 | | | 280,796 | | | 281,696 |
| | Industrial | | | 12,803 | | | 12,732 | | | 13,081 | | | 13,215 | | | 13,509 |
| | Other | | | 6,066 | | | 5,986 | | | 5,941 | | | 5,919 | | | 5,793 |
TRANSMISSION
In Québec, Hydro-Québec TransÉnergie delivers electricity to its customers, its largest being Hydro-Québec Distribution, our distribution division. At the end of 2002, 23 customers, including some Québec distributors, private generators, neighboring networks and Canadian and U.S. power marketers, were also accredited to transmit power over our transmission system. The transmission division is also responsible for the management of our foreign investments in transmission assets.
The following subsidiaries, affiliates and interests are also part of this segment:
- •
- TransÉnergie HQ Inc. (wholly-owned; participation in transmission companies and transmission project development and management)
- •
- TransÉnergie U.S., Ltd (wholly-owned; acquisition, development and management of strategic assets in electric power transmission in the U.S.)
- •
- Cedars Rapids Transmission Company, Limited (wholly-owned; interconnection between our Les Cèdres plant and the networks of Cornwall Electric, in Ontario, and Niagara Mohawk, in the U.S.)
9
- •
- Consorcio TransMantaro S.A. ("Consorcio TransMantaro") (56.66% interest; transmission line in Peru)
- •
- Cross Sound Cable Company (New York) LLC (75% interest; underwater transmission line between Connecticut and Long Island, New York)
- •
- Directlink (33.33% interest in unincorporated joint venture; underground merchant transmission line in Australia)
- •
- HQI Transelec Chile S.A. ("Transelec") (as of April 30, 2003, 89%; the largest electricity transmission provider in Chile)
- •
- Murraylink Transmission Partnership ("Murraylink") (50% interest; underground merchant transmission line in Australia)
- •
- TransÉnergie Services Inc. (wholly-owned; consulting in non-regulated transmission system planning and operation in North America)
- •
- TransÉnergie Technologies Inc. (wholly-owned; marketing of the Hydro-Québec TransÉnergie value-added technological products and solutions in Québec and worldwide)
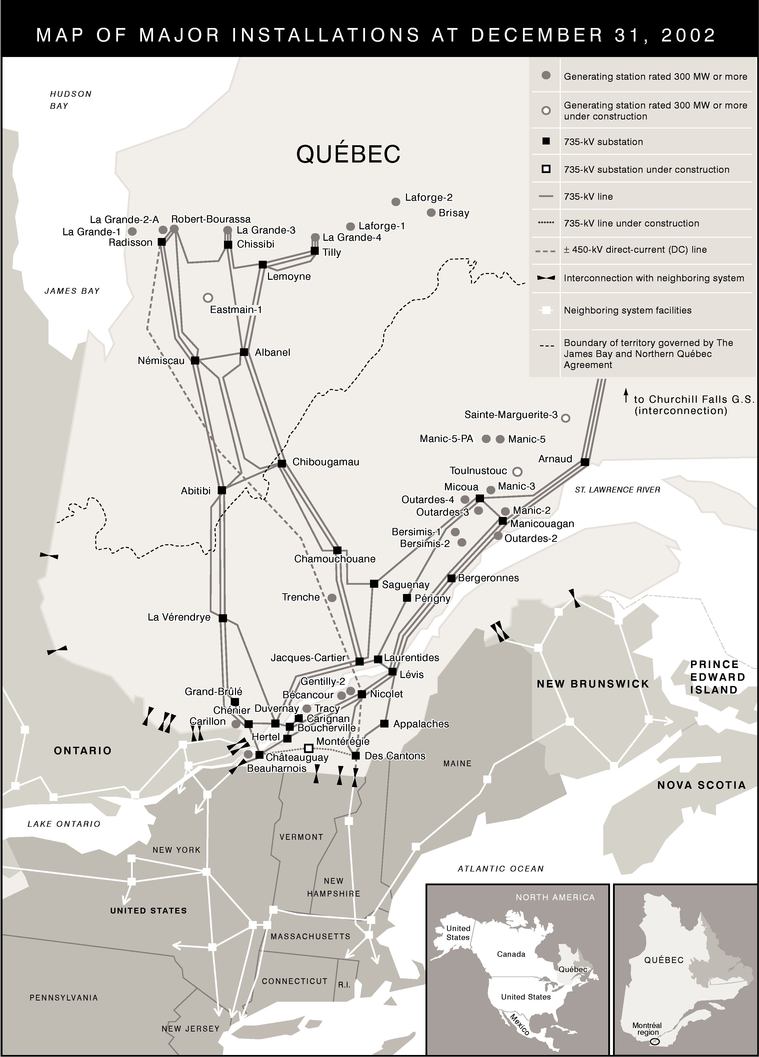
Transmission System in Québec
In Québec, our generation stations are located at substantial distances from consumer centers. As a result, our power transmission system is one of the most extensive and comprehensive in North America, comprising more than 20,000 miles of lines.
This system includes the following facilities:
Voltage
| | Substations
| | Lines (miles)(1)
|
|---|
| 735 kV and 765 kV | | 37 | | 7,009 |
| ± 450 kV HVDC | | 2 | | 757 |
| 315 kV | | 59 | | 3,071 |
| 230 kV | | 50 | | 1,915 |
| 161 kV | | 40 | | 1,161 |
| 120 kV | | 216 | | 4,061 |
| 49 kV and 69 kV | | 101 | | 2,106 |
| | |
| |
|
| TOTAL | | 505 | | 20,080 |
| | |
| |
|
- (1)
- Miles covered by the transmission system. Many facilities carry two lines on the same infrastructure.
In May 1997, we opened access to our transmission grid in accordance with the Hydro-Québec Open Access Transmission Tariff. Consequently, electric distributors, producers and marketers in and outside Québec have the option to enter into transactions with distributors and producers located outside Québec to buy or sell electricity and to wheel in, wheel out or wheel through Hydro-Québec TransÉnergie's transmission lines at specified rates. The capacity available on the system is posted on the OASIS (Open Access Same-Time Information System) website. Due to Hydro-Québec's cost advantage, to date relatively little electricity has been wheeled through our transmission system.
Hydro-Québec TransÉnergie's System Control Center in Montréal and regional control centers are designed to optimize energy resources, supervise power flow and monitor system security. The transmission system is linked with other major power systems in Canada and the Northeastern United States.
10
The following table shows existing interconnections with neighboring systems outside Québec, excluding the lines to Churchill Falls:
INTERCONNECTIONS WITH NEIGHBORING SYSTEMS OUTSIDE QUÉBEC
| | Maximum Carrying Capacity
| |
| | Hydro-Québec's Current Reception Capacity
| | Voltage
|
|---|
| | (MW)
| | (MW)
| | (kV)
|
|---|
| CANADA | | | | | | | | |
| | Ontario | | 1,270 | | (1) | | 670 | | 120 and 230 |
| | New Brunswick | | 1,200 | | | | 785 | | 230, 315 and 345 |
| UNITED STATES | | | | | | | | |
| | New York | | 2,125 | | (1) | | 1,000 | | 120 and 765 |
| | New England | | 2,305 | | | | 1,870 | | 120 and 450 |
- (1)
- Ontario and New York State are partially served by the same installations, limiting the simultaneous export capacity to these two systems to 2,700 MW.
International
Outside Québec, we have made capital investments in the following international projects:
- •
- a transmission provider in Chile (Transelec);
- •
- transmission lines in Peru (Consorcio TransMantaro) and Australia (Directlink and Murraylink); and
- •
- the Cross-Sound project, a submarine interconnection line between Long Island, New York and Connecticut.
GENERATION
Hydro-Québec Production supplies electricity to the Québec market and is an active player in energy markets in the northeastern part of North America. We sell surplus electricity generated in Québec, purchase electricity for resale and perform energy trading operations. We continue to assert our presence on international markets through foreign investments in the Northeastern United States, Latin America and China.
The following subsidiaries, affiliates and interests are also part of this segment:
- •
- Bucksport Energy LLC (69.44% interest; cogeneration plant in Maine)
- •
- Churchill Falls (Labrador) Corporation Limited ("CF(L)Co") (34.2% interest; generation activities)
- •
- Empresa de Generación Eléctrica Fortuna S.A. (16.3% interest; hydroelectric plant in Panama)
- •
- Gestion Production H.Q. inc. (wholly-owned; investment in local generation businesses and consulting)
- •
- Hidroeléctrica Río Lajas S.A. (50% interest; hydroelectric plant in Costa Rica)
- •
- H.Q. Energy Marketing Inc. ("HQEM") (wholly-owned; energy trading activities and investment in energy trading companies in other Canadian provinces and the U.S.)
- •
- H.Q. Energy Services (U.S.) Inc. ("HQUS") (wholly-owned; power marketer in the U.S.)
11
- •
- Hunan C.C. Power Ltd. (30% interest; hydroelectric plant in the Hunan Province, China)
- •
- Meiya Power Co. (20% interest; holding company with various participations in electric generation facilities in China)
Generation Operations
In Québec, our electric generation system comprises 81 power stations currently in service, of which 51 are hydroelectric, 29 are thermal and one is a wind farm, with a total installed capacity of 32,661 MW as of December 31, 2002. The following table lists the generation facilities in service as of such date.
GENERATION FACILITIES IN SERVICE IN QUÉBEC(1)
Hydroelectric
|
|---|
Name of Facility
| | Years Commissioned(2)
| | Capacity (MW)
|
|---|
| Robert-Bourassa | | 1979-1981 | | 5,616 |
| La Grande-4 | | 1984-1986 | | 2,779 |
| La Grande-3 | | 1982-1984 | | 2,418 |
| La Grande-2A | | 1991-1992 | | 2,106 |
| Beauharnois | | 1932 and 1961 | | 1,652 |
| Manic-5 | | 1970-1971 | | 1,528 |
| La Grande-1 | | 1994-1995 | | 1,436 |
| Manic-3 | | 1975-1976 | | 1,244 |
| Bersimis-1 | | 1956-1959 | | 1,125 |
| Manic-5-PA | | 1989-1990 | | 1,064 |
| Manic-2 | | 1965-1967 | | 1,024 |
| Others (less than 1,000 MW — 40 facilities)(3) | | 1910-1999 | | 8,400 |
| | | | |
|
| Total | | | | 30,392 |
| | | | |
|
Thermal
|
|---|
Name of Facility
| | Years Commissioned(2)
| | Capacity (MW)
|
|---|
| Gentilly-2 (nuclear)(4) | | 1983 | | 675 |
| Tracy (oil) | | 1964-1968 | | 600 |
| Bécancour, La Citière and Cadillac (gas-turbine) | | 1976-1993 | | 870 |
| Others (diesel — 24 plants) | | 1946-2001 | | 122 |
| | | | |
|
| Total | | | | 2,267 |
| | | | |
|
Wind Farm
|
|---|
Name of Facility
| | Year Commissioned(2)
| | Capacity (MW)
|
|---|
| Saint-Ulric | | 2001 | | 2 |
- (1)
- Installed capacity shown for the generation stations reflects the capacity of alternators in winter conditions.
- (2)
- Indicates years when facilities began commercial operation.
- (3)
- Some facilities are owned by Hydro-Québec Distribution.
12
- (4)
- The Gentilly-2 plant has a Canada-Deuterium-Uranium heavy water moderated reactor, using heavy water as a moderator and coolant, and uranium dioxide as fuel.
We purchase power and energy from the Churchill Falls generation station in Labrador through agreements with CF(L)Co and from Newfoundland and Labrador Hydro ("N&LH"). Pursuant to the terms of the power contract with CF(L)Co, we have agreed to purchase, through the year 2041, 4,083 MW of power and energy. In June 1999, we signed another agreement with CF(L)Co to guarantee us the availability of 682 MW of additional power until 2041 for each November 1 to March 31 period. In February 2001, we agreed to purchase approximately 1.5 TWh annually from N&LH until March 2004. In 2002, the purchases under the CF(L)Co and N&LH agreements amounted to 32.2 TWh at a cost of $146 million as compared to 29.6 TWh at a cost of $142 million in 2001.
We also have an agreement with New Brunswick Power Corporation for the purchase of 200 MW of peak power, per contract year, during the winter months until October 31, 2011.
In addition, we purchase power under long-term contracts with approximately 80 independent power producers located in Québec. During 2002, 3.3 TWh were purchased under these contracts, at a total cost of $188 million. Starting in 2003, we expect to purchase approximately 4 TWh of power and energy annually over the initial term of these contracts, which extend through 2029; the majority of these contracts include renewal clauses.
We also purchase power in connection with our trading operations (see "Wholesale and Trading Operations").
We use energy purchased from our neighboring systems, which experience different demand patterns, to meet a portion of our peak power needs in Québec (see "Wholesale and Trading Operations"). The following table summarizes our peak power requirements in Québec and installed capacity as at December 31 for the years 1998 through 2002:
| | Peak Power Requirements(1)
| | Installed Capacity(2)(3)
| | Total Average Load(4)
|
|---|
| | (MW)
|
|---|
| 1998 | | 31,995 | | 32,615 | | 20,118 |
| 1999 | | 31,470 | | 32,648 | | 21,461 |
| 2000 | | 30,412 | | 32,655 | | 22,525 |
| 2001 | | 30,080 | | 32,654 | | 21,307 |
| 2002 | | 34,989 | | 32,661 | | 22,022 |
- (1)
- Power requirements at the annual demand peak in Québec for the winter beginning in the preceding December. The 2002-2003 winter peak occurred at 5:30 p.m. on January 22, 2003.
- (2)
- In addition to the output of our own generation stations, we have access to most of the generation of the Churchill Falls power plant (4,765 MW) and to all the output from 133 turbines (each rated 100 MW) of the Matane and Cap-Chat wind farms.
- (3)
- Installed capacity shown for the generation stations reflects the capacity of alternators at 41OF, in winter conditions. The data previously reported from 1998 to 2001 which were based on summer conditions, at 59OF, have been restated accordingly.
- (4)
- Annual energy requirements, including sales outside Québec, divided by the number of hours in the year.
13
In addition to our facilities in Québec, we have invested in generation projects in the U.S., Latin America and China.
We hold an indirect minority interest in Empresa de Generación Eléctrica Fortuna, S.A., which owns and operates a 300 MW hydroelectric plant, the largest generator in Panama. The company's largest shareholder is the Government of the Republic of Panama.
We also own an indirect interest in Hidroeléctrica Rio Lajas S.A., which owns and operates an 11 MW hydroelectric plant with a 34.5 kV transmission line of 5.1 miles, at a distance of 49.7 miles from San José, the capital of Costa Rica.
Further, we hold an indirect interest in Bucksport Energy LLC, a thermal energy plant located in Maine. The plant, which started its commercial operations in January 2001, produces about 1 TWh of electricity per year. HQUS supplies the plant with natural gas and receives most of the electricity under fifteen-year contracts through 2015.
Meiya Power Company Limited, a holding company in which we have an indirect interest, manages a portfolio of investments in ten projects, including hydroelectric, thermal and cogeneration plants ranging from 30 MW to 700 MW. These facilities are located in the People's Republic of China, Taiwan and South Korea. We also hold an indirect interest in Hunan C.C. Power Ltd., which owns and operates the 20 MW Qingshan Hydro Power Station.
Wholesale and Trading Operations
The Québec wholesale electricity market has been open since May 1, 1997. This market is comprised of 11 distributors: Hydro-Québec Distribution, nine distributors operating municipal systems and one regional electricity cooperative. As a result of the opening of the wholesale market, the municipal systems can, subject to the Government's authorization, purchase electricity from suppliers other than us, and independent generators in Québec can sell their electricity on the wholesale market using our transmission facilities.
In 2002, Hydro-Québec Distribution launched a call for tenders for the supply of 1,200 MW, to be delivered beginning in March 2007. Hydro-Québec Production and an independent generator were each awarded a contract for the supply of 600 MW. We expect that more calls for tenders will be made in the coming years in order to meet the growing demand in Québec (see "Regulatory Framework — Energy Board Act").
Currently, our main markets outside Québec consist of neighboring networks located in Canada and the Northeastern United States.
In 2002, electricity sales outside Québec accounted for 25.6% of our total electricity sales volume, up from 22.0% in 2001. Additional sale commitments were met using electricity purchases and our surplus Québec generation capacity.
Our wholly-owned U.S. energy-trading subsidiary, HQUS, is a member of New York ISO, ISO NE (New England) and of PJM Interconnection (Pennsylvania, New Jersey, Maryland, Delaware, Virginia and the District of Columbia). ISO's or Independent Systems Operators enable participants to buy and sell energy, schedule bilateral transactions and reserve transmission service. In November 1997, HQUS received a permit from the U.S. Federal Energy Regulatory Commission to sell at market-based rates.
14
HQEM, our wholly-owned energy-trading subsidiary operating in Canada, has been trading in the Ontario wholesale market which opened on May 1, 2002.
We have long-term export contracts for the sale of energy or power. One such contract is a seasonal diversity contract with Consolidated Edison Company of New York, Inc. ("Con Edison") under which we deliver electricity in the summer and may receive electricity in the winter. The following table summarizes our principal energy export agreements:
PRINCIPAL ENERGY EXPORT AGREEMENTS
| | Start of Deliveries
| | Expiry Date
| | Power (MW)
| |
| | Maximum Annual Deliveries (TWh)
|
|---|
| Seasonal diversity(1) | | | | | | | | | | |
| | Con Edison | | 1999 | | 2004 | | 400-700 | | | | 3.0 |
Long-term sales — power and energy (not interruptible) |
|
|
|
|
|
|
|
|
|
|
| | Cornwall Electric — Canada | | 2000 | | 2019 | | 45 | | | | 0.2 |
| | Vermont Joint Owners ("VJO") | | 1990 | | 2020 | | 335 | | (2) | | 2.0 |
- (1)
- Quantities to be delivered are subject to annual negotiations; deliveries are made between April and October.
- (2)
- By separate agreement with a VJO Member, 25 MW are being bought back until April 30, 2012.
The following table summarizes electricity sales and revenue outside Québec by category for the years 1998 through 2002:
ELECTRICITY SALES AND REVENUE OUTSIDE QUÉBEC
| | 1998
| | 1999
| | 2000
| | 2001
| | 2002
|
|---|
| | (TWh)
|
|---|
| ELECTRICITY SALES | | | | | | | | | | | | | | | |
| | Long-term sales | | | 8.1 | | | 8.7 | | | 6.8 | | | 4.1 | | | 2.7 |
| | Short-term sales | | | 10.5 | | | 16.0 | | | 30.5 | | | 38.7 | | | 52.0 |
| | |
| |
| |
| |
| |
|
| | TOTAL SALES | | | 18.6 | | | 24.7 | | | 37.3 | | | 42.8 | | | 54.7 |
| | |
| |
| |
| |
| |
|
|
|
(millions of dollars)
|
|---|
| REVENUE FROM ELECTRICITY SALES | | | | | | | | | | | | | | | |
| | Long-term sales | | $ | 391 | | $ | 427 | | $ | 377 | | $ | 326 | | $ | 275 |
| | Short-term sales | | | 423 | | | 624 | | | 2,003 | | | 2,794 | | | 3,232 |
| | |
| |
| |
| |
| |
|
| | TOTAL REVENUE FROM ELECTRICITY SALES | | $ | 814 | | $ | 1,051 | | $ | 2,380 | | $ | 3,120 | | $ | 3,507 |
| | |
| |
| |
| |
| |
|
OIL AND GAS
Hydro-Québec Pétrole et Gaz holds our 41.2% interest and options to acquire an additional 9.2% in Noverco Inc. ("Noverco"). Noverco is a holding company involved mainly in natural gas pipelines and distribution of gas in Québec, Ontario and the Northeastern United States.
In 2002, we embarked on the development of the oil and gas potential of eastern Québec. To limit our risks, the exploration work is expected to be undertaken jointly with strategic partners. A decision was made to invest $330 million until 2010 in oil and gas exploration in the Gulf of St-Lawrence, the
15
estuary and the Gaspé Peninsula. This amount represents approximately 20% of the total cost of the exploration work.
Noverco holds indirectly a 77.4% interest in Gaz Métropolitain and Company, Limited Partnership ("Gaz Métropolitain"), the main natural gas distributor in Québec.
As at September 30, 2002, Gaz Métropolitain had assets of $2,350 million and sales for the fiscal year then ended totalled $1,608 million. As at December 31, 2002, Gaz Métropolitain had assets of $2,481 million and sales for the first quarter ended December 31, 2002 were $502 million. Gaz Métropolitain holds directly or indirectly interests in the following companies:
- •
- Champion Pipe Line Corporation Ltd (wholly-owned; operates two gas pipelines that cross the Ontario border to supply Gaz Métropolitain's distribution system in northwestern Québec)
- •
- Portland Natural Gas Transmission System ("PNGTS") (20.7% interest; owns a pipeline originating at the Québec border and extending to the suburbs of Boston)
- •
- TQM Pipeline and Company, Limited Partnership (50% interest; operates a gas pipeline that connects upstream with that of TransCanada PipeLines and downstream with that of PNGTS)
- •
- Vermont Gas Systems, Inc. (wholly-owned; the sole gas distributor in Vermont)
As at December 31, 2002, Noverco held 9.8% of the common shares of Enbridge Inc. ("Enbridge"), which is primarily involved in the transportation of crude oil and liquids and operates the world's longest pipeline from Alberta to Eastern Canada. Enbridge also has diversified business in natural gas transportation, through its interest in the Alliance Pipeline, and natural gas distribution primarily through Enbridge Consumers Gas, Canada's largest gas distribution company. Enbridge owns a 32.0% interest in Noverco.
CONSTRUCTION
Hydro-Québec Équipement offers consulting services in engineering, environment and project management, and acts as general contractor for our other divisions, mainly Hydro-Québec Production and Hydro-Québec TransÉnergie. SEBJ develops projects for us in the territory governed by the James Bay and Northern Québec Agreement, and fulfills contracts obtained through tenders both inside and outside Québec.
CORPORATE AND OTHER ACTIVITIES
This division is responsible for the procurement of goods and services, the management of our information technologies, research and development and other corporate services grouped under the following affiliated companies, divisions and business units:
- •
- Hydro-Québec CapiTech inc. ("HQ CapiTech") (wholly-owned; a venture capital company investing in businesses that provide energy-related high-technology products and services; in 2000, the Board of Directors of Hydro-Québec authorized the creation of a second investment fund with a value of $192 million; the first investment fund had a value of $108 million)
- •
- Hydro-Québec IndusTech inc. (wholly-owned; holds a 50% interest in AVESTOR, Limited Partnership ("AVESTOR") (formed in 2001 to pursue the development of rechargeable lithium-metal-polymer battery technology))
- •
- IREQ (our energy-technology research and development division)
16
CORPORATE OUTLOOK
Development Strategy
In October 2001, we presented our five-year Strategic Plan (the "Business Plan") for the 2002-2006 period. The Business Plan sets forth two major goals, namely, to supply high-quality electric power to our Québec customers and to manage our activities so as to create value for our shareholder. More specifically, we have committed to the following goals:
- •
- to serve our customers well by building upon progress we have made in terms of quality of service while improving profitability;
- •
- to deploy a corporate succession plan which provides for the replacement of the aging segment of our workforce with employees with the appropriate new skills and for knowledge maintenance and transfer generally;
- •
- to create value for our shareholder and Québec society by continuing to develop our generation facilities and electricity sales in our local retail market and in wholesale markets;
- •
- to maintain our leadership in technology and to emphasize technological innovation as a key means to improving our overall performance; and
- •
- to improve overall efficiency and synergy by setting specific targets for each of our business divisions, allocating capital, applying efficient financial controls and risk management, minimizing financial expenses, managing talent and developing leadership among our management staff.
The Business Plan requires Hydro-Québec Distribution to continue improving customer service. Also, it is expected to improve profitability and efficiency by controlling costs, developing its most profitable markets and improving demand management and energy efficiency. We intend to request moderate rate increases for 2004, 2005 and 2006.
We have set concrete targets for improving power supply reliability: one of our principal objectives remains that of ensuring a secure electricity supply for Québec customers on competitive terms. Our distributor's existing supply is at an average fixed price of 2.79 cents per kWh (see "Regulatory Framework — Energy Board Act") and additional supply, which may be needed by 2006, will be obtained through competitive bidding. The Business Plan assumes that Québec sales will grow by 13.0 TWh between 2001 and 2006. More than 7.4 TWh of these new sales are expected to be to large-power customers, largely as the result of growing industrial output and the penetration of high-performance electrotechnologies.
According to the Business Plan, Hydro-Québec Production, our generation division, is expected to work to sustain growth of electricity sales in wholesale markets and of generation facilities in Québec. We expect to meet this additional demand by increasing our annual generation capacity in Québec by at least 12 TWh through:
- •
- the commissioning of the Sainte-Marguerite-3 and the new Grand-Mère generation stations for an additional 3 TWh;
- •
- the partial diversion of rivers toward existing generation stations and the commissioning of other committed projects for a gain of 4 TWh; and
- •
- selected generation projects for an additional 7 TWh.
The Business Plan restates the three conditions for undertaking new hydroelectric projects: they must be profitable, environmentally acceptable and well received by local communities. We signed agreements in 1999 with local communities for the partial diversion of rivers towards existing generation stations in the Betsiamites basin and the construction of a new generation station on the Toulnustouc river. In 2002, agreements were reached between us and local communities (see
17
"Litigation — James Bay Cree") with respect to the Eastmain-1 and Eastmain-1-A/Rupert diversion projects.
We intend to continue to take full advantage of opportunities in the wholesale market of the Northeastern United States. Net electricity sales under long-term export contracts have decreased in recent years to approximately 2 TWh and we intend to use available energy to increase the volume of short-term sales transactions in such markets while meeting demand growth in Québec.
Capital Investment Program
Our capital investment program includes capital expenditures for fixed assets and investments in, and advances to, affiliates. The following table is a summary of our capital investment program for the years 1998 through 2002. The table also includes estimates for 2003 and the three-year period from 2004 to 2006. The latter estimates are based, among other factors, on expected annual growth in demand for electricity in Québec of 1.3% for the period of 2002 to 2006.
CAPITAL INVESTMENT PROGRAM
| |
| |
| |
| |
| |
| | Estimated
|
|---|
| | 1998
| | 1999
| | 2000
| | 2001
| | 2002
| | 2003
| | 2004 through 2006
|
|---|
| |
| |
| | (millions of dollars)
| |
| |
|
|---|
| Distribution | | $ | 605 | | $ | 369 | | $ | 436 | | $ | 467 | | $ | 527 | | $ | 648 | | $ | 1,862 |
| Transmission(1)(2) | | | 778 | | | 587 | | | 2,265 | | | 550 | | | 668 | | | 892 | | | 2,564 |
| Generation | | | 597 | | | 766 | | | 642 | | | 668 | | | 1,021 | | | 1,466 | | | 4,070 |
| Construction | | | 3 | | | 4 | | | 1 | | | 1 | | | 9 | | | 5 | | | 15 |
| Oil and Gas | | | 222 | | | 163 | | | 81 | | | 131 | | | 75 | | | 108 | | | 245 |
| Corporate and Other Activities | | | 121 | | | 209 | | | 65 | | | 61 | | | 149 | | | 181 | | | 503 |
| | |
| |
| |
| |
| |
| |
| |
|
| | | $ | 2,326$ | | $ | 2,098 | | $ | 3,490 | | $ | 1,878 | | $ | 2,449 | | $ | 3,300 | | $ | 9,259 |
| | |
| |
| |
| |
| |
| |
| |
|
- (1)
- Includes sub-transmission.
- (2)
- For 2000, includes the acquisition of Transelec.
In 2002, capital investments were $207 million less than the forecasted $2.7 billion, investment for the refurbishing or upgrade of generation and transmission facilities was $100 million more than forecast. Project development expenses and interests in joint ventures were lower than forecast by $307 million due to delays in, or cancellation of, some HQI projects.
Changes in the marketplace and the growth strategy described in our Business Plan call for an increased capital expenditure program over the next four years. Additional work went on at the 882 MW Sainte-Marguerite-3 generation station, with a view to commissioning in 2003. We are completing the construction of the new Grand-Mère hydroelectric complex for 2004 and the Toulnustouc hydroelectric project for 2005. We are currently examining other generation projects, including the new combined cycle gas-fired power plant in Beauharnois, Québec (le "Suroît") with an expected capacity of 800 MW.
Further to agreements signed with the James Bay Cree, we have undertaken in 2002 the Eastmain-1 hydroelectric project, with an installed capacity of 480 MW, at an estimated total cost of $2.0 billion. We will also undertake the Eastmain-1-A project with an installed capacity of 770 MW, which involves the partial diversion of the Rupert River and is estimated to cost $2.1 billion. Also, we
18
are completing draft design studies for the construction of a 385 MW generation station on the Péribonka River, which will require an investment of approximately $1 billion.
We will also complete, at an expected cost of $173 million, work on the transmission loop for the Montérégie area, which is expected to be in service in 2004.
The total estimated capital investment program for 2003, together with long-term debt repayment and sinking fund requirements of $3.6 billion, represent cash requirements of approximately $6.9 billion. We expect to obtain approximately 50% of our 2003 requirements from internal sources and the remainder from additional borrowings. Our self-financing ratio is expected to decrease in 2003, due to long-term debt maturities of $2.4 billion, as compared to $2.1 billion in 2002.
We estimate that, for the period 2004 through 2006, capital investments, long-term debt repayment and the sinking fund will require approximately $14.5 billion in cash.
Allocation of capital expenditures for the Distribution, Transmission and Generation segments
The following tables summarize the allocation of estimated capital expenditures for 2003 and for the period from 2004 through 2006 among the three major segments.
DISTRIBUTION SEGMENT
| | Estimated Capital Expenditures
| |
|---|
| | 2003
| | 2004 through 2006
| |
|---|
| | (millions of dollars)
| |
|---|
| DISTRIBUTION SYSTEM(1) | | | | | | | |
| | System maintenance | | $ | 184 | | $ | 610 | |
| | System improvements & customers and demand growth | | | 273 | | | 833 | |
| OTHER | | | 191 | (2) | | 419 | (3) |
| | |
| |
| |
| | | $ | 648 | | $ | 1,862 | |
| | |
| |
| |
- (1)
- Includes investments in distribution facilities and investments in generation and transmission facilities of our off-grid systems.
- (2)
- Includes 71.9% in equipment, 8.5% in buildings, 2.2% in telecommunications and technology, 9.5% in commercial programs, 7.9% in investments and advances to affiliates and in interests in joint ventures.
- (3)
- Includes 74% in equipment, 6% in buildings, 3% in telecommunications and technology, 13% in commercial programs and 4% in investments and advances to affiliates.
19
TRANSMISSION SEGMENT
| |
| | Estimated Capital Expenditures
| |
|---|
| | Planned Date of Operation
| | 2003
| | 2004 through 2006
| |
|---|
| |
| | (millions of dollars)
| |
|---|
| TRANSMISSION FACILITIES(1) | | | | | | | | | |
| | Equipment improvement(2) | | Continuous program | | $ | 317 | | $ | 920 | |
| | System improvement program | | | | | | | | | |
| | | Transmission line for Montérégie area | | 2004 | | | 173 | | | — | |
| | | Interconnection with Ontario | | To be determined | | | 5 | | | 225 | |
| | | Other projects | | Continuous program | | | 71 | | | 461 | |
| OTHER | | | | | 326 | (3) | | 958 | (4) |
| | | | |
| |
| |
| | | | | $ | 892 | | $ | 2,564 | |
| | | | |
| |
| |
- (1)
- Includes sub-transmission facilities.
- (2)
- Includes system maintenance & customers and demand growth.
- (3)
- Includes 11% in equipment, 1.4% in buildings, 22.2% in telecommunications, 2.9% in technology, 62.5% in investments and advances to affiliates and in interests in joint ventures.
- (4)
- Includes 6% in equipment, 2% in buildings, 29% in telecommunications and 63% in investments and advances to affiliates and in interests in joint ventures.
20
GENERATION SEGMENT
| |
| |
| | Estimated Capital Expenditures
| |
|---|
| | Available Power
| | Planned Date of Operation
| | 2003
| | 2004 through 2006
| |
|---|
| | (MW)
| |
| | (millions of dollars)
| |
|---|
| MAIN REHABILITATION PROJECTS | | | | | | | | | | | |
| | Outardes-3 | | — | | 2003-2006 | | $ | 33 | | $ | 78 | |
| | Improvement and rebuilding of facilities | | — | | Continuous
program | | | 278 | | | 1,174 | |
| ONGOING GENERATION STATION AND PARTIAL DIVERSION PROJECTS | | | | | | | | | | | |
| | Grand-Mère | | 220 | | 2004 | | | 126 | | | 85 | |
| | Manouane | | — | | 2004 | | | 61 | | | 3 | |
| | Mercier | | 60 | | 2006 | | | 51 | | | 51 | |
| | Toulnustouc | | 526 | | 2005 | | | 248 | | | 317 | |
| | Eastmain-1 | | 480 | | 2007 | | | 276 | | | 1,060 | |
| | Sainte-Marguerite-3 | | 882 | | 2003 | | | 83 | | | — | |
| | Other projects | | — | | — | | | 10 | | | — | |
| GENERATION STATION AND PARTIAL DIVERSION PROJECTS UNDER STUDY | | | | | | | | | | | |
| | Suroît | | 800 | | 2007 | | | 19 | | | 529 | |
| | Eastmain-1-A / Rupert diversion | | 770 | | 2010 | | | 35 | | | 19(1) | |
| | Péribonka | | 385 | | 2008 | | | 6 | | | 161 | |
| | Other projects | | — | | — | | | 6 | | | 490 | |
| OTHER | | — | | — | | | 234 | (2) | | 103 | (3) |
| | | | | | |
| |
| |
| | | | | | | $ | 1,466 | | $ | 4,070 | |
| | | | | | |
| |
| |
- (1)
- Refers to the draft design project.
- (2)
- Includes 10% in equipment and 90% in investments and advances to affiliates.
- (3)
- Includes 71% in equipment and 29% in investments and advances to affiliates.
Regulatory Framework
Hydro-Québec Act
Under the Hydro-Québec Act, our objectives are to supply power and to pursue endeavors in energy- related research and promotion, energy conversion and conservation, and any field connected with or related to power or energy. The Hydro-Québec Act provides that we shall estimate the energy needs of Québec and the means of meeting them within the scope of the Government's energy policies.
Under the Hydro-Québec Act, the Government is entitled to declare a dividend from Hydro-Québec when certain financial criteria are met (see Note 16 to the Consolidated Financial Statements).
In December 1996, the National Assembly of Québec adopted the Act respecting the Régie de l'énergie (the "Energy Board Act"). The Energy Board Act established the Régie de l'énergie (the "Energy Board") which has jurisdiction over certain aspects of our activities and those of natural gas distributors in Québec.
21
Under the Energy Board Act, we have been granted exclusive rights for the distribution of electric power throughout Québec, excluding the territories served by distributors operating a municipal or private electric system as of May 13, 1997.
The Energy Board has the authority to:
- •
- fix, or modify, after holding public hearings, our rates and conditions for the transmission and distribution of electric power;
- •
- approve our electric power supply plan;
- •
- approve operating standards, including standards of reliability for our transmission system;
- •
- authorize our transmission and distribution investment projects;
- •
- approve our distribution commercial programs; and
- •
- rule upon complaints from customers concerning rates or service.
Generation. Under the Energy Board Act as amended, the Energy Board's jurisdiction does not extend to generation but we are required to supply heritage pool electricity. Heritage pool electricity corresponds to the net annual consumption of Québec markets, up to 165 TWh per year, for which the average cost is set at 2.79 cents per kWh. In December 2001, we filed an application for the approval of our determination of the heritage pool electricity cost attributable to each class of customers for 2002. A decision ratifying our determination was issued in October 2002. Some industrial customers filed a motion for review of that decision. A final decision is pending.
Energy generated in excess of the heritage pool electricity may be sold on the market at market based rates. Import and export transactions are unregulated under the Energy Board Act.
Transmission. Transmission rates and conditions are subject to approval by the Energy Board.
Distribution. Electricity required to meet Québec's market needs in excess of the heritage pool electricity must be purchased through a competitive bidding process. We are therefore required to obtain approval from the Energy Board for a supply plan, as well as for a Call for Tenders and Contract Awarding Procedure and a Code of Ethics on Conducting Calls for Tenders.
Rates applicable to a particular class of customers must be uniform throughout the whole distribution system and the Energy Board may not modify rates applicable to a class of customers in order to alleviate the cross-subsidization of rates applicable to other classes of customers.
Our exports of electric power are subject to the National Energy Board Act, which provides that a permit or license must be obtained from the National Energy Board of Canada (the "National Board") for such exports. We hold the following four permits:
- •
- two permits expiring on December 31, 2010 and authorizing us to export annually, for a continuous period of no more than five years for any single contract, up to 30 TWh of interruptible energy and up to 20 TWh of firm energy to the United States;
- •
- two permits granted to our subsidiary, HQEM, expiring on April 7, 2009. They allow HQEM, as a power marketer outside Québec, to export annually to the United States up to 30 TWh of firm and interruptible energy from interconnections located in other provinces, under contracts with a term of five years or less.
22
Each of these contracts allows us to take advantage of the spot market in the United States; however? long-term export contracts (more than five years) require prior issuance of specific permits or licenses by the National Board.
On March 5, 2003, HQEM's permit to export natural gas to the United States was renewed for a two year period.
Our activities are subject to federal, provincial and municipal environmental laws, regulations and by-laws.
Before beginning new construction, our projects are subject to environmental impact assessment studies as well as information and consultation processes. The studies are submitted for review and approval by government departments and agencies responsible for issuing governmental authorizations. In some instances, the approval process includes public hearings by an independent body.
We have formal policies, procedures and guidelines regarding environmental matters. Since the early 1970's, we have responded to environmental concerns in the planning, design and construction of new facilities. For example, we conduct studies and research on mercury levels in reservoirs, the biological effects of electric and magnetic fields of our transmission lines and greenhouse gas emissions of our hydroelectric generation stations with reservoirs.
We also carry out projects in the areas of recycling. Moreover, we have been working since 1997 on the implementation of ISO 14001, the environmental management standard of the International Organization for Standardization. So far, we have obtained the following certifications:
- •
- our distribution division has been certified for all its activities related to electricity distribution;
- •
- our transmission division has been certified for all its activities;
- •
- we have obtained certification for our generation business unit;
- •
- certificates have been granted to the procurement unit of the Shared Services Centre of our Corporate and Other Activities segment;
- •
- our business units responsible for environmental evaluations, engineering and construction of new installations and refurbishing projects have obtained certification; and
- •
- certificates have been granted to the two sites of our research and development unit.
We have yet to obtain certificates for the customer service unit of our distribution division and for the electricity generation activities of our distribution division which are located in remote communities and not linked to our transmission grid.
Litigation
In April 1990, representatives of the James Bay Cree instituted an action against Canada, Québec and us, among others, seeking judicial recognition of aboriginal rights and of title over certain areas of land in Québec and an order restraining us from proceeding with the Grande-Baleine project. This action also alleges breaches of the 1975 James Bay and Northern Québec Agreement (the "Agreement") between us, the Federal and Québec governments, and representatives of the James Bay native peoples, namely the Cree and the Inuit.
In a second action instituted against the same defendants and served upon us in February 1997, representatives of the James Bay Cree are seeking damages or compensation of $2.8 billion for the
23
breaches of the Agreement alleged in the 1990 action and breaches of various other undertakings and commitments. Alternatively, plaintiffs are seeking performance by the defendants of their obligations under the Agreement and damages or compensation of $400 million.
In a response by plaintiffs to a motion for particulars, plaintiffs indicated that the claim for damages or compensation would be increased to $5.4 billion and, possibly, to a greater amount. Plaintiffs later revised their claim to $3.0 billion. Such actions are still at a preliminary stage of proceedings.
Under an agreement signed between the Government and the James Bay Cree on February 7, 2002, however, the James Bay Cree agreed to discontinue certain claims made in such actions against the Government and to suspend for a period of three years the remaining claims against the defendants other than Canada so as to facilitate their resolution through an agreed upon dispute resolution mechanism. A mediator was appointed and discussions are ongoing as part of the mediation process.
In January 1998, Québec experienced a severe ice storm and our transmission and distribution systems were heavily damaged. At the end of January 1998, the Government and we were served with a motion seeking authorization to institute a class action against us, as joint and several defendants, on behalf of individuals having suffered damages (the aggregate amount of which has not been ascertained) as a result of power failures caused by the ice storm which left close to 1.4 million customers without electricity for varying periods of time. We have contested this petition. No date is presently set for the hearing of the motion.
In January 2001, 18 actions for damages, many of them by insurance companies, were instituted against us claiming more than $320 million plus interest as compensation for damages allegedly suffered as a result of the power outages caused by the ice storm. All these actions have been settled out of court.
Employees
We had 18,025 permanent employees as at December 31, 2002, and an average of 3,632 temporary employees during the year 2002. These numbers do not include employees of our subsidiaries and joint ventures. Unionized employees represent 84.9% of Hydro-Québec's workforce.
Unionized employees are covered by seven collective agreements which will terminate in December 2003 and one which will terminate in December 2004. These collective agreements provide for an annual average salary increase of approximately 2.5% and a profit-sharing plan tied to the attainment of Hydro-Québec's objectives. In March 2003, we reached an agreement with the union representing most of our unionized employees for a new five-year collective agreement effective January 1, 2004. This new collective agreement will continue to provide for a profit-sharing plan. Employees will receive an annual salary increase of 2% for the years 2004 to 2006 and salaries will be subject to negotiation for the years 2007 to 2008.
24
MANAGEMENT'S FINANCIAL DISCUSSION
Financial Objectives
Our business objectives are to promote continuously improved customer service, sustainable growth and profitability. Our ability to meet these objectives and our financial position are dependent upon certain key economic variables, including:
- •
- the rate of economic growth in Québec and, consequently, the growth rate of electricity sales in Québec;
- •
- the average interest rate on Hydro-Québec's borrowings;
- •
- exchange rates between the Canadian dollar and other currencies; and
- •
- the world price of crude oil and other commodities, upon which electricity prices under certain sales or purchase contracts are pegged.
We have been seeking to alleviate the impact of some of these variables by pursuing the following objectives:
- •
- to diversify our sources of financing through public issues of debt securities, private borrowings and medium term-note issues in North America, Europe and Asia;
- •
- minimize foreign exchange risk by conducting a large portion of our financing activities in Canadian dollars when market conditions are favorable and by using swaps to manage foreign exchange risks associated with issues in foreign currencies other than United States dollars; the latter are used to hedge our future sales in United States dollars;
- •
- to stagger debt refinancing by seeking maturities that offer the best conditions in terms of cost, while avoiding large repayments in a single year; and
- •
- to maintain floating-rate debt at approximately 25% of Hydro-Québec's total debt.
Consolidated Financial Results for the year ended December 31, 2002
In 2002, our revenue grew to $13 billion, as compared to $12.6 billion in 2001, which represents an increase of $424 million or 3.4%. The increase in revenue results mainly from growth in electricity sales in all markets.
Effective January 1, 2002, the Canadian Institute of Chartered Accountants (CICA) introduced a revision to the CICA accounting standards whereby all unrealized exchange gains and losses related to unhedged monetary items denominated in foreign currencies must henceforth be charged to income for the year. Consequently, we have applied this change retroactively and restated prior years' comparative figures. The 2001 financial expenses have been adjusted upward by $513 million to reflect the retroactive application of the new accounting standard on foreign currency translation.
Net income for the year was $1,526 million, up $931 million, or 1.6 times 2001 restated net income. Our profit margin was 11.7%, higher than the 4.7% margin for 2001. Lower financial expenses and higher sales revenue explain this growth.
Self-financing (defined as cash from operations less dividends paid, divided by the sum of investments, maturity of long-term debt and sinking fund redemption) was 71.6% in 2002, as compared to 54.6% in 2001. This number takes into account maturity of long-term debt and sinking fund redemption of $2.1 billion in 2002.
25
In 2002, expenditure rose by $301 million, or 3.7%, to $8,403 million, largely due to the rise in depreciation, amortization and decommissioning expense.
Operating Expenses. In 2002, operating expenses of $2,225 million were higher by $91 million, or 4.3%, as compared to the previous year.
Electricity and Fuel Purchased. Purchases of electricity and fuel amounted to $3,536 million or approximately the same as in 2001.
Depreciation, Amortization and Decommissioning. These expenses increased to $2,062 million from $1,845 million in 2001 mostly as a result of the commissioning of facilities, the use of the sinking fund method of depreciation and the addition of $63 million to the provision for decommissioning of our Gentilly-2 nuclear generation station to reflect allocated interest in compliance with the Act Respecting the Long-Term Management of Nuclear Fuel Waste (Canada).
Taxes. Tax expense decreased by $11 million, or 1.9%, to $580 million.
In 2002, financial expenses decreased by $820 million from $3,863 million to $3,043 million. We reduced our interest expense by taking advantage of lower short-term interest rates on the variable portion of our long-term debt, which we maintained at 25%, and obtained refinancing at lower long-term rates.
At the end of 2001, we adapted our foreign exchange risk management strategy to mitigate any income volatility that could be caused by the application of the new accounting standard. Although the average Canadian dollar exchange rate fell from US$0.646 in 2001 to US$0.637 in 2002, the decrease had only a minor effect on our bottom line.
Our power distribution and transmission activities in Québec are regulated. Consequently, our financial results reflect the following regulated revenues and charges:
- •
- transmission rates approved by the Energy Board;
- •
- electricity rates for Québec customers set in 1998 and frozen until 2004; and
- •
- an average fixed price of 2.79 cents per kWh to be charged by Hydro-Québec Production to Hydro-Québec Distribution for heritage pool electricity (165 TWh per year), regardless of whether the electricity is generated or purchased.
All intersegment revenue and expenses not related to electricity are valued at full cost. Revenue, operating expenses and purchases of electricity and fuel are earned or incurred directly by the respective segments.
Depreciation, amortization and decommissioning expenses related to fixed or other assets are allocated to the respective segments. Taxes and financial expenses are managed by corporate units but allocated to the operating segments. Taxes are generally allocated according to the net assets managed by the segments. Financial expenses are allocated based on the financing rates applied to the net assets of each segment. Finally, expenses related to corporate activities, or corporate expenses, are generally allocated to the segments based on their operating expenses.
The following table shows segmented results for the year 2002 and changes from the previous year.
26
SEGMENT RESULTS FOR 2002
| | Distribution
| | Transmission
| | Generation
| | Construction
| | Oil and Gas
| | Corporate(1)
| | Eliminations(2)
| | Consolidated
|
|---|
| | (millions of dollars)
|
|---|
| Revenue | | | | | | | | | | | | | | | | |
| External customers | | 8,196 | | 293 | | 3,638 | | 6 | | 849 | | 20 | | — | | 13,002 |
| Change 2001-2002 | | 262 | | (8 | ) | 420 | | (1 | ) | (217 | ) | (32 | ) | — | | 424 |
| Intersegment revenue | | 36 | | 2,734 | | 4,260 | | 1,111 | | — | | 730 | | (8,871 | ) | — |
| Change 2001-2002 | | 13 | | (51 | ) | 185 | | 441 | | — | | 0 | | (588 | ) | — |
| | |
| |
| |
| |
| |
| |
| |
| |
|
| Total Revenue | | 8,232 | | 3,027 | | 7,898 | | 1,117 | | 849 | | 750 | | (8,871 | ) | 13,002 |
| | |
| |
| |
| |
| |
| |
| |
| |
|
| Change 2001-2002 | | 275 | | (59 | ) | 605 | | 440 | | (217 | ) | (32 | ) | (588 | ) | 424 |
| Net income (loss)(3) | | (399 | ) | 389 | | 1,556 | | 1 | | 35 | | (56 | ) | — | | 1,526 |
| Change restated 2001-2002 | | 134 | | (105 | ) | 365 | | 5 | | 14 | | 518 | (4) | — | | 931 |
- (1)
- Corporate and Other Activities.
- (2)
- Intersegment eliminations for consolidation purposes.
- (3)
- By a final ruling in January 2003, the Energy Board authorized new transmission rates retroactive to January 1, 2001. Net income for 2001 for the Transmission and Generation segments were restated to reflect increases of $58 million and $21 million, respectively, and net income of the Distribution segment was reduced by $79 million.
- (4)
- Includes the effect of the accounting change for foreign currency translation.
Financial Results of the Distribution Segment
The segment's total revenue increased by $275 million in 2002. Net income increased by $134 million in 2002. This improvement is mainly due to purchase and sale transactions which contributed $122 million more than in 2001 to the profit margin.
In 2002, increased demand for electricity in Québec and colder temperatures in the last quarter generated additional revenue of $301 million. The increase in demand was fueled by the recovery of several Québec economic sectors in 2002. Rising employment and low interest rates, coupled with a high rental occupancy rate, spurred residential construction which continued to be a driving force for economic growth in Québec. Electricity sales increased by 6.1 TWh, or 4.0%, from 2001 to 158.3 TWh and electricity sales revenue totaled $8,104 million.
The following table shows the variation in sales and revenue by category of customers between 2001 and 2002.
27
ELECTRICITY SALES IN QUÉBEC, BY CATEGORY
| | Sales
| | Revenue
|
|---|
| | 2002
| | Change 2001-2002
| | 2002
| | Change 2001-2002
|
|---|
| | (TWh)
| | (TWh)
| | (%)
| | ($M)
| | ($M)
| | (%)
|
|---|
| Residential and farm | | 53.2 | | 2.4 | | 4.7 | | 3,246 | | 115 | | 3.7 |
| General and institutional | | 31.7 | | 1.3 | | 4.3 | | 2,058 | | 85 | | 4.3 |
| Industrial | | 68.6 | | 2.3 | | 3.5 | | 2,577 | | 95 | | 3.8 |
| Other | | 4.8 | | 0.1 | | 2.1 | | 223 | | 6 | | 2.8 |
| | |
| |
| |
| |
| |
| |
|
| Total | | 158.3 | | 6.1 | | 4.0 | | 8,104 | | 301 | | 3.9 |
| | |
| |
| |
| |
| |
| |
|
Residential and Farm Category. Electricity sales to this group of customers increased by 2.4 TWh, or 4.7%, to 53.2 TWh. Rising employment, low interest rates and a high rental occupancy rate bolstered household confidence and consumption. Also, this category's heating requirements make it the most sensitive to climatic changes. It is largely accountable for the increase in sales of 1.8 TWh or $84 million as a result of the colder temperatures during the last quarter.
General and Institutional Category. Overall, electricity sales and revenue increased by 1.3 TWh, or 4.3%, to 31.7 TWh and by $85 million, or 4.3%, to $2,058 million, respectively.
Industrial Category. Demand from industrial customers showed the strongest growth, with a 2.2 TWh increase in sales adding $98 million in revenue. This growth was mainly driven by the arrival of major new customers in the pulp and paper and metal smelting and refining manufacturers in the third quarter of 2001. Also, the upswing in the manufacturing sector boosted demand from small and medium power industrial customers.
Other Category. This category consists of independent distributors, namely nine municipal networks and one regional cooperative. An increase in revenue of $6 million results from the effects of colder temperatures and increased demand. None of the distributors have yet taken advantage of the deregulation of the wholesale market which began in May 1997.
Financial Results of the Transmission Segment
In 2002, revenue of $3,027 million was down $59 million or 1.9% from 2001. Fewer customer reservations for long-term transmission resulted in a shortfall in revenue of $49 million. Most of our revenue from transmission was generated by tolling charges collected from Hydro-Québec Distribution and was related to the electricity transmission requirements of our Québec customers. Net income declined by $105 million or 21.3% over the previous year to $389 million, primarily due to the reduction in sales, higher depreciation and amortization expenses for telecommunications facilities and to international activities.
Total expenditure before financial expenses amounted to $1,576 million, up $123 million or 8.5% over 2001. This increase results mainly from the increase of depreciation and amortization expense as a result of the downward revision of the service lives of certain facilities. Financial expenses allocated to the segment declined by $77 million to $1,062 million. However, this decrease was partially offset by the increase in foreign exchange losses of $42 million related to the activities of our Chilean subsidiary, Transelec and resulting from the devaluation of the Chilean peso.
Financial Results of the Generation Segment
In 2002, revenue from electricity sales of $7.9 billion was up $0.6 billion from 2001. This growth was driven by higher sales on all markets.
28
Electricity and fuel purchases amounted to $3.0 billion in 2002, representing a $0.3 billion increase over 2001. A total of $2.3 billion of electricity was purchased on U.S. short-term markets. The average price for these purchases fell in 2002, consistent with the general trend in electricity market prices.
The segment's net income totaled $1.6 billion in 2002, up $0.4 billion from 2001. This was mainly due to a higher volume of sales on all markets and favourable terms for sales outside Québec.
Electricity sales to our distribution division amounted to 158.0 TWh for revenues of $4.2 billion in 2002 as compared to 151.9 TWh or $4.1 billion in 2001. Sales of heritage pool electricity to the distributor are at an average rate of 2.79 cents per KWh, subject to an adjustment to reflect certain contracts, for a maximum annual volume of 165 TWh.
In 2002, revenue from electricity sales outside Québec, mostly to the United States, reached $3.5 billion, up $0.4 billion from 2001. Electricity sales reached 54.2 TWh.
Electricity sales in connection with energy trading on the U.S. and Ontario markets reached 41.6 TWh and sales of Québec-generated electricity on markets outside Québec were 12.6 TWh.
International sales of electricity, including sales by our joint ventures, primarily in Panama, contributed additional revenues of $40 million, up $2 million over 2001.
Financial Results of the Oil and Gas Segment
Revenue for the division totaled $849 million in 2002, down $217 million from 2001. This decrease is explained by the lower market price of natural gas during the year. However, since natural gas purchased by Gaz Métropolitain must be billed to customers at cost under Energy Board regulation, fluctuations in natural gas prices have no effect on the gross margin of Gaz Métropolitain.
Net income of this segment increased to $35 million in 2002, up from $21 million in 2001. Our interest in Noverco generated net income of $38 million, up $20 million over that of the preceding year mainly due to a $6 million dilution gain from the issuance of shares by Enbridge, Enbridge's improved operating results, lower financial expenses for Noverco due to a drop in interest rates and improved results of Gaz Métropolitain.
Financial Results of the Construction and Corporate and Other Activities Segments
In 2002, the Construction segment completed orders of $1 billion, up $300 million or 43% over 2001. This revenue represents almost entirely charges to other divisions for costs of capital projects undertaken on their behalf. This significant growth was derived from numerous Transmission and Generation projects and Government approvals obtained for the construction of new facilities. SEBJ generated revenue of $107 million in 2002, compared with $9 million in 2001. Further to the signing of agreements with the Cree communities, SEBJ commenced work for the construction of the Eastmain-1 facilities, the draft design studies for Eastmain-1-A generation station and the Rupert River diversion. SEBJ also conducted preliminary studies to assess hydroelectric potential in Nunavik and continued construction of the Les Cèdres-Cornwall transmission line for Cedars Rapids Transmission Company.
The Corporate and Other Activities Segment covers corporate activities including finance, human resources, strategic planning and corporate affairs and operates the Shared Services Centre for procurement and information technology services. Also grouped under this division are research and development, venture capital activities and the commercialization of Hydro-Québec technologies. In 2002, the division incurred a loss of $56 million, slightly less than the loss of $61 million for 2001. HQ
29
CapiTech, which makes venture capital investments in energy-related technologies, posted a $29 million loss including a write down of $25 million for the value of its investment portfolio. This weak performance is largely due to the sluggishness of the stock markets. AVESTOR, opened its first plant in September 2002 for the manufacturing of lithium-metal-polymer batteries to be marketed to the telecommunications industry, the automotive markets and potentially for power producers and distributors. It reported a loss of $24 million, or $4 million less than in 2001, reflecting startup costs.
WHERE YOU CAN FIND MORE INFORMATION
This document appears as an exhibit to Hydro-Québec's annual report filed with the U.S. Securities and Exchange Commission (the "SEC") on Form 18-K for the fiscal year ended December 31, 2002. Additional information with respect to Hydro-Québec is available in the annual report or in other exhibits or amendments to the annual report. You may read and copy any document Hydro-Québec files with the SEC at the SEC's public reference rooms at 450 West Street, N.W., Washington, DC 20549. Please call the SEC's toll free number at 1-800-SEC-0330 if you need further information about the operation of the SEC's public reference rooms. These filings are also available on the SEC's website at www.sec.gov. In addition, you may request a copy of these filings at no cost by telephoning Hydro-Québec at (514) 289-2519. This document is also available on Hydro-Québec's website at www.hydroquebec.com; however, any other information available on such home page (such website listed in the 18-K is an inactive textual reference only) shall not be deemed to form a part of this document or the annual report to which it appears as an exhibit.
FORWARD-LOOKING STATEMENTS
Various statements made throughout this document are forward looking and contain information about financial results, economic conditions and trends, including, without limitation, the statements under the caption Corporate Outlook. The words "estimate", "believe", "expect", "forecast", "anticipate", "intend" and "plan" and similar expressions identify forward-looking statements. You are cautioned that any such forward-looking statements are not guarantees of future performance. Forward-looking statements involve risks and uncertainties, and actual results may differ materially from those in the forward-looking statements as a result of various factors. Such factors may include, among others, business risks, such as variations in runoff that affect hydroelectric plant performance, and general levels of economic activity which affect demand for electricity, and risks related to economic parameters, such as changes in interest and exchange rates. You are cautioned not to place undue reliance on these forward-looking statements which speak only as of the date of this document. We undertake no obligation to publicly release the result of any revisions to these forward-looking statements which may be made to reflect events or circumstances after the date hereof or to reflect the occurrence of unanticipated events.
30
SUMMARY OF CERTAIN DIFFERENCES BETWEEN CANADIAN GAAP AND US GAAP
BACKGROUND
Financial statements in the U.S. are prepared in accordance with generally accepted accounting principles issued by the Financial Accounting Standards Board ("US GAAP"). In Canada, financial statements are prepared in accordance with generally accepted accounting principles issued by the Canadian Institute of Chartered Accountants ("Canadian GAAP"). As well, some accounting practices applicable to regulated entities, such as Hydro-Québec, differ from accounting practices otherwise applied by unregulated companies (see Note 1 to the Consolidated Financial Statements). Certain differences between US GAAP and Canadian GAAP relating to measurement are set out below and do not include presentation and disclosure differences. The matters discussed below have not been audited and do not necessarily include all applicable differences between US GAAP and Canadian GAAP.
CERTAIN DIFFERENCES ARISING BETWEEN US GAAP AND CANADIAN GAAP IN RESPECT OF THE CONSOLIDATED FINANCIAL STATEMENTS OF HYDRO-QUÉBEC
Regulated Enterprises — Accounting for the Effects of Certain Types of Regulation
As mentioned above, Hydro-Québec follows some accounting practices applicable to regulated enterprises for certain of its transmission and distribution activities which differ from accounting practices otherwise applied by unregulated enterprises (see Note 1 to the Consolidated Financial Statements).
Under US GAAP, SFAS 71 requires that an enterprise's operations meet three criteria in order to qualify as a regulated enterprise: 1) the enterprise's rates for regulated services or products provided to its customers are established by or are subject to approval by an independent, third-party regulator or by its own governing board empowered by statute or contract to establish rates that bind customers; 2) the regulated rates are designed to recover the enterprise's costs of providing the regulated services or products; and 3) in view of the demand for the regulated services or products and the level of competition, direct and indirect, it is reasonable to assume that rates set at levels that will enable the enterprise to recover its costs can be charged to and collected from customers. This last criterion requires consideration of anticipated changes in levels of demand or competition during the recovery period for any capitalized costs.
Under US GAAP, Hydro-Québec Distribution does not meet the criteria of a regulated enterprise.
Foreign Currency Translation
Under Canadian GAAP, exchange gains or losses resulting from the translation of long-term monetary items are included in the consolidated statement of operations, unless a debt is designated as hedging future revenue streams in U.S. dollars, in which case they are deferred to the year such sales are made. These revenues may include firmly committed and anticipated sales.
Under US GAAP, exchange gains or losses resulting from the translation of long-term monetary items are always included in consolidated statement of operations. However, SFAS 133 requires that a non derivative financial instrument that may give rise to a foreign currency transaction gain or loss can only be designated as a fair value hedge of an unrecognized firm commitment attributable to foreign currency exchange rates. Changes in fair value, attributable to foreign exchange rates, on both the non derivative financial instrument and the firm commitment, are included in consolidated statement of operations.
31
Joint Ventures
Under Canadian GAAP, interests in joint ventures are accounted for using the proportionate consolidation method, whereas, under US GAAP, they are accounted for using the equity method.
Fixed Assets
Under Canadian GAAP, fixed assets are carried at cost, which includes materials, labor and other costs directly contributing to construction activities. US GAAP require that certain costs be expensed when incurred.
Internal Use Software
Under Canadian GAAP, computer system development costs for internal use software are capitalized when the project is expected to be of continuing benefit, and otherwise expensed. Under US GAAP, certain development costs for internal use software, particularly costs associated with the preliminary stage of the project and project overhead costs, should be expensed when incurred.
Depreciation Method
Under Canadian GAAP, the sinking fund method of depreciation of fixed assets is allowed, whereas, under US GAAP this method is generally not used. The sinking fund method is an increasing expense method whereby the annual depreciation expense is equal to a fixed amount plus a variable compounded interest amount calculated on the accumulated balance of the sinking fund.
Development Expenses
Under Canadian GAAP, development expenses are deferred and amortized on a straight-line basis over a maximum of five years after the year in which they were incurred, if they satisfy specific criteria. If the criteria are not met, the development costs should be charged to expense in the period incurred. US GAAP require that development costs be expensed when incurred.
Pre-operating Expenses
Under Canadian GAAP, pre-operating expenses that meet certain criteria are deferred and amortized on a straight-line basis. US GAAP require that pre-operating expenses be expensed when incurred.
Employee Future Benefits
In 1999, new Canadian standards for employee future benefits were adopted principally to harmonize Canadian GAAP with US GAAP.
Derivative Instruments and Hedging Activities
Under US GAAP, the Financial Accounting Standards Board issued SFAS 133 "Accounting for Derivative Instruments and Hedging Activities", amended by SFAS 137 and SFAS 138. SFAS 133, as amended, requires that all derivatives be recognized at fair value on the balance sheet and all changes in fair value be recognized currently in earnings or deferred as a component of other comprehensive income, depending on the intended use of the derivative, its designation and its effectiveness if designated as a hedge. Under Canadian GAAP, there is no such requirement.
32
Energy Trading Contracts
Under US GAAP, the Emerging Issues Task Force of the Financial Accounting Standards Board issued EITF 98-10 which requires that energy trading contracts be measured at fair value determined as of the balance sheet date, with related gains and losses included in earnings and separately disclosed in the financial statements or notes. Under Canadian GAAP, when employed for hedging purposes, derivative instruments used to manage risks related to energy price fluctuations are accounted for at cost and the related gains or losses are deferred and charged to operations on a basis consistent with the recognition of the gains and losses of the underlying offsetting/opposite risk position. Under Canadian GAAP, derivative instruments used for trading purposes, as well as open positions on energy trading, are valued at fair market value. Realized and unrealized changes in fair market value are recognized in income as they occur.
Comprehensive Income
Under US GAAP, comprehensive income and its components must be reported in a specific financial statement. There is no such requirement in Canada.
Change in Accounting Policy
Under Canadian GAAP, the change in the accounting policy concerning foreign currency translation has been applied retroactively and the figures for the prior years have been restated. Under US GAAP, most changes in accounting policies are recognized by recording, in net income in the period of the change, the cumulative effect of the change at the beginning of the period.
33
AUDITORS' REPORT
To the Minister of Finance of Québec:
We have audited the consolidated balance sheets of Hydro-Québec as at December 31, 2002 and 2001, and the consolidated statements of operations, retained earnings and cash flows for each of the years in the five-year period ended December 31, 2002. These financial statements are the responsibility of Hydro-Québec's Management. Our responsibility is to express an opinion on these financial statements based on our audits.
We conducted our audits in accordance with Canadian generally accepted auditing standards. Those standards require that we plan and perform an audit to obtain reasonable assurance whether the financial statements are free of material misstatement. An audit includes examining, on a test basis, evidence supporting the amounts and disclosures in the financial statements. An audit also includes assessing the accounting principles used and significant estimates made by Management, as well as evaluating the overall financial statement presentation.
In our opinion, these consolidated financial statements present fairly, in all material respects, the financial position of Hydro-Québec as at December 31, 2002 and 2001, and the results of its operations and its cash flows for each of the years in the five-year period ended December 31, 2002 in accordance with Canadian generally accepted accounting principles as described in note 1. As required by the Auditor General Act (R.S.Q., c. V-5.01), we report that, in our opinion, after giving retroactive effect to the change in the accounting policy on foreign currency translation and except for the prospective application of the recommendations concerning goodwill and other intangible assets as explained in note 2, these principles have been applied on a basis consistent with that of the preceding year.
| |
|
|---|
Samson Bélair/Deloitte & Touche
Chartered Accountants | | PricewaterhouseCoopers LLP
Chartered Accountants |
Montréal, Québec
February 20, 2003
34
CONSOLIDATED FINANCIAL STATEMENTS
HYDRO-QUÉBEC
CONSOLIDATED STATEMENTS OF OPERATIONS
| | For the year ended December 31
|
|---|
| |
| | (restated — note 2)
|
|---|
| | 2002
| | 2001
| | 2000
| | 1999
| | 1998
|
|---|
| | (in millions of dollars)
|
|---|
| Revenue | | $ | 13,002 | | $ | 12,578 | | $ | 11,429 | | $ | 9,608 | | $ | 8,879 |
Expenditure |
|
|
|
|
|
|
|
|
|
|
|
|
|
|
|
| | Operations | | | 2,225 | | | 2,134 | | | 2,135 | | | 1,912 | | | 1,681 |
| | Electricity and fuel purchased | | | 3,536 | | | 3,532 | | | 2,408 | | | 1,109 | | | 899 |
| | Depreciation, amortization and decommissioning (note 3) | | | 2,062 | | | 1,845 | | | 1,896 | | | 1,731 | | | 1,589 |
| | Taxes (note 4) | | | 580 | | | 591 | | | 525 | | | 592 | | | 610 |
| | |
| |
| |
| |
| |
|
| | | | 8,403 | | | 8,102 | | | 6,964 | | | 5,344 | | | 4,779 |
| | |
| |
| |
| |
| |
|
| Operating income | | | 4,599 | | | 4,476 | | | 4,465 | | | 4,264 | | | 4,100 |
| Financial expenses (note 5) | | | 3,043 | | | 3,863 | | | 3,574 | | | 3,028 | | | 3,871 |
| | |
| |
| |
| |
| |
|
| Income before non-controlling interest | | | 1,556 | | | 613 | | | 891 | | | 1,236 | | | 229 |
| Non-controlling interest | | | 30 | | | 18 | | | 18 | | | 13 | | | 11 |
| | |
| |
| |
| |
| |
|
| Net income | | $ | 1,526 | | $ | 595 | | $ | 873 | | $ | 1,223 | | $ | 218 |
| | |
| |
| |
| |
| |
|
CONSOLIDATED STATEMENTS OF RETAINED EARNINGS
| | For the year ended December 31
| |
|---|
| |
| | (restated — note 2)
| |
|---|
| | 2002
| | 2001
| | 2000
| | 1999
| | 1998
| |
|---|
| | (in millions of dollars)
| |
|---|
| Balance at beginning of year, as previously reported | | $ | 10,460 | | $ | 9,906 | | $ | 9,367 | | $ | 8,914 | | $ | 8,514 | |
| Adjustment for the retroactive application of changes in accounting policies and other changes (note 2) | | | (1,326 | ) | | (813 | ) | | (608 | ) | | (925 | ) | | (464 | ) |
| | |
| |
| |
| |
| |
| |
| Balance at beginning of year, as restated | | | 9,134 | | | 9,093 | | | 8,759 | | | 7,989 | | | 8,050 | |
| Net income | | | 1,526 | | | 595 | | | 873 | | | 1,223 | | | 218 | |
| | |
| |
| |
| |
| |
| |
| | | | 10,660 | | | 9,688 | | | 9,632 | | | 9,212 | | | 8,268 | |
| Dividends (note 16) | | | 763 | | | 554 | | | 539 | | | 453 | | | 279 | |
| | |
| |
| |
| |
| |
| |
| Balance at end of year | | $ | 9,897 | | $ | 9,134 | | $ | 9,093 | | $ | 8,759 | | $ | 7,989 | |
| | |
| |
| |
| |
| |
| |
35
CONSOLIDATED FINANCIAL STATEMENTS
HYDRO-QUÉBEC
CONSOLIDATED BALANCE SHEETS
| | As at December 31
|
|---|
| | 2002
| | 2001
|
|---|
| |
| | (restated — note 2)
|
|---|
| | (in millions of dollars)
|
|---|
| ASSETS | | | | | | |
Fixed assets (note 6) |
|
$ |
49,694 |
|
$ |
49,309 |
Current assets |
|
|
|
|
|
|
| | Cash and cash equivalents | | | 293 | | | 251 |
| | Investments | | | 939 | | | 617 |
| | Accounts receivable | | | 1,924 | | | 1,766 |
| | Financial assets related to debt | | | 34 | | | 106 |
| | Materials, fuel and supplies | | | 418 | | | 427 |
| | |
| |
|
| | | | 3,608 | | | 3,167 |
| | |
| |
|
Other long-term assets |
|
|
|
|
|
|
| | Investments (note 7) | | | 852 | | | 841 |
| | Deferred charges (note 8) | | | 3,391 | | | 3,808 |
| | Financial assets related to debt (note 9) | | | 325 | | | 299 |
| | Goodwill | | | 302 | | | 306 |
| | Intangible assets (note 10) | | | 760 | | | 751 |
| | Government reimbursement for the 1998 ice storm | | | 146 | | | 182 |
| | |
| |
|
| | | | 5,776 | | | 6,187 |
| | |
| |
|
| | | $ | 59,078 | | $ | 58,663 |
| | |
| |
|
LIABILITIES AND EQUITY |
|
|
|
|
|
|
| Long-term debt (note 11) | | $ | 36,699 | | $ | 37,269 |
| | |
| |
|
Current liabilities |
|
|
|
|
|
|
| | Borrowings | | | 64 | | | 88 |
| | Dividends payable | | | 763 | | | 554 |
| | Accounts payable | | | 1,467 | | | 1,317 |
| | Accrued interest | | | 1,157 | | | 1,201 |
| | Current portion of long-term debt | | | 2,969 | | | 3,087 |
| | |
| |
|
| | | | 6,420 | | | 6,247 |
| | |
| |
|
| Other long-term liabilities (note 12) | | | 888 | | | 755 |
| | |
| |
|
| Perpetual debt (note 13) | | | 632 | | | 637 |
| | |
| |
|
| Non-controlling interest | | | 224 | | | 216 |
| | |
| |
|
Shareholder's equity (note 16) |
|
|
|
|
|
|
| | Share capital | | | 4,374 | | | 4,374 |
| | Retained earnings | | | 9,897 | | | 9,134 |
| | Translation adjustment | | | (56 | ) | | 31 |
| | |
| |
|
| | | | 14,215 | | | 13,539 |
| | |
| |
|
| | | $ | 59,078 | | $ | 58,663 |
| | |
| |
|
36
CONSOLIDATED FINANCIAL STATEMENTS
HYDRO-QUÉBEC
CONSOLIDATED STATEMENTS OF CASH FLOWS
| | For the year ended December 31
| |
|---|
| |
| | (restated — note 2)
| |
|---|
| | 2002
| | 2001
| | 2000
| | 1999
| | 1998
| |
|---|
| | (in millions of dollars)
| |
|---|
| Operating activities | | | | | | | | | | | | | | | | |
| | Net income | | $ | 1,526 | | $ | 595 | | $ | 873 | | $ | 1,223 | | $ | 218 | |
| | Depreciation and amortization of fixed assets and intangible assets | | | 1,796 | | | 1,705 | | | 1,594 | | | 1,543 | | | 1,384 | |
| | Amortization of deferred charges | | | 320 | | | 1,100 | | | 647 | | | 60 | | | 859 | |
| | Change in non-cash working capital items (note 17) | | | (31 | ) | | 50 | | | 24 | | | 105 | | | (118 | ) |
| | Other | | | 201 | | | 13 | | | 142 | | | (47 | ) | | (118 | ) |
| | |
| |
| |
| |
| |
| |
| | | | 3,812 | | | 3,463 | | | 3,280 | | | 2,884 | | | 2,225 | |
| | |
| |
| |
| |
| |
| |
Investing activities |
|
|
|
|
|
|
|
|
|
|
|
|
|
|
|
|
| | Fixed assets and intangible assets | | | (2,456 | ) | | (1,810 | ) | | (1,812 | ) | | (1,642 | ) | | (2,092 | ) |
| | Business acquisition (note 18) | | | — | | | — | | | (1,576 | ) | | (95 | ) | | — | |
| | Long-term investments | | | (40 | ) | | 21 | | | (65 | ) | | (216 | ) | | (160 | ) |
| | Net change in short-term investments | | | (318 | ) | | (46 | ) | | (131 | ) | | (129 | ) | | 49 | |
| | Other | | | 47 | | | (89 | ) | | (37 | ) | | (145 | ) | | (74 | ) |
| | |
| |
| |
| |
| |
| |
| | | | (2,767 | ) | | (1,924 | ) | | (3,621 | ) | | (2,227 | ) | | (2,277 | ) |
| | |
| |
| |
| |
| |
| |
Financing activities |
|
|
|
|
|
|
|
|
|
|
|
|
|
|
|
|
| | Issue of long-term debt | | | 2,098 | | | 4,544 | | | 2,200 | | | 2,302 | | | 1,295 | |
| | Maturity of long-term debt and sinking fund redemption | | | (2,102 | ) | | (3,471 | ) | | (2,317 | ) | | (2,279 | ) | | (1,400 | ) |
| | Repayment in advance of long-term debt | | | (462 | ) | | (289 | ) | | (737 | ) | | (406 | ) | | (48 | ) |
| | Receipts resulting from credit risk management | | | 51 | | | 25 | | | — | | | — | | | 427 | |
| | Net change in short-term borrowings | | | (30 | ) | | (1,827 | ) | | 1,678 | | | 40 | | | — | |
| | Dividends paid | | | (554 | ) | | (539 | ) | | (453 | ) | | (279 | ) | | (357 | ) |
| | Other | | | (4 | ) | | 157 | | | (18 | ) | | 32 | | | 71 | |
| | |
| |
| |
| |
| |
| |
| | | | (1,003 | ) | | (1,400 | ) | | 353 | | | (590 | ) | | (12 | ) |
| | |
| |
| |
| |
| |
| |
| Net change in cash and cash equivalents | | | 42 | | | 139 | | | 12 | | | 67 | | | (64 | ) |
| Cash and cash equivalents at beginning of year | | | 251 | | | 112 | | | 100 | | | 33 | | | 97 | |
| | |
| |
| |
| |
| |
| |
| Cash and cash equivalents at end of year | | $ | 293 | | $ | 251 | | $ | 112 | | $ | 100 | | $ | 33 | |
| | |
| |
| |
| |
| |
| |
Supplementary information |
|
|
|
|
|
|
|
|
|
|
|
|
|
|
|
|
| | Interest paid | | | 2,696 | | | 3,018 | | | 2,967 | | | 3,004 | | | 3,086 | |
37
HYDRO-QUÉBEC
NOTES TO CONSOLIDATED FINANCIAL STATEMENTS
Note 1 — Significant Accounting Policies
Under the provisions of Hydro-Québec Act, the publicly owned corporation Hydro-Québec (the "Corporation") is mandated to supply power and to pursue endeavors in energy-related research and promotion, energy conversion and conservation, and any field connected with or related to power or energy.
The consolidated financial statements include the accounts of the Corporation, its subsidiaries, all of which are wholly owned, and its joint ventures (collectively "Hydro-Québec").
Regulation
The Act respecting the Régie de l'énergie grants the Régie de l'énergie exclusive authority to determine or modify the rates and conditions under which electricity is transmitted and distributed by the Corporation. Consequently, electricity transmission and distribution activities in Québec are said to be regulated.
In April 2002, the Régie de l'énergie rendered a decision on the application to amend electricity transmission rates. In its decision, the Régie de l'énergie recognized the current accounting policies used and accepted the changes requested, including the capitalization of financial expenses to fixed assets in progress at the cost of capital rate.
In July 2002, the Corporation filed an application with the Régie de l'énergie for approval of the cost of power distribution services as well as certain regulatory and accounting principles.
The joint venture Noverco Inc. wholly owns Gaz Métropolitain, inc., whose main subsidiary, Gaz Métropolitain and Company, Limited Partnership, is involved primarily in the distribution of natural gas by pipeline in Québec. Most aspects of the limited partnership's operations are monitored and controlled by the Régie de l'énergie.
The consolidated financial statements take into account certain regulatory accounting practices which differ from the accounting practices applied in unregulated enterprises, and which relate specifically to certain deferred charges and the depreciation of fixed assets that are disposed of.
Consolidation
The interests in joint ventures are accounted for using the proportionate consolidation method. Investments in companies over which Hydro-Québec can exercise a significant influence are accounted for on an equity basis, whereas venture capital investments are generally recorded at cost. Other long-term investments are also recorded at cost.
The operations and cash flows of Noverco Inc. and of Hydro-Québec International (HQI) holdings are consolidated with a one-quarter lag. The financial positions of these companies disclosed in the consolidated balance sheet of Hydro-Québec are as at September 30.
Use of estimates
The preparation of financial statements in accordance with Canadian generally accepted accounting principles requires Management to make estimates and assumptions that affect the amounts reported in the financial statements. Actual amounts could differ from those estimates.
38
Revenue
Revenue is recognized when electricity is delivered or services are rendered. Revenue from sales of electricity in Québec is recorded on the basis of cyclical billings and also includes revenue accrued in respect of electricity delivered but as yet unbilled.
Income taxes
The Corporation and certain of its incorporated subsidiaries have not recorded any income taxes since they are government-owned and therefore tax-exempt.
The incorporated second-tier subsidiaries and joint ventures subject to income tax use the liability method to account for income taxes.
Foreign currency translation
Revenue and expenditure resulting from transactions in foreign currencies are translated into the Canadian dollar equivalent at exchange rates in effect at the transaction date. Monetary assets and liabilities are translated into Canadian dollars at the closing exchange rates in effect at the balance sheet date, and non-monetary items are translated into Canadian dollars at exchange rates in effect at the transaction date.
The exchange gains or losses resulting from the translation of current monetary items are included in the consolidated statement of operations. Since January 1, 2002, those resulting from the translation of long-term monetary items are also included in the statement of operations, unless they relate to liabilities hedging sales in U.S. dollars, in which case they are deferred to the year such sales are made.
Currency swaps used to manage exchange risk related to principal payments on long-term debt and sales in U.S. dollars are translated at the closing exchange rates in effect at the balance sheet date. Those that constitute financial assets are presented as Financial assets related to debt, while those representing financial liabilities are presented as Long-term debt. Gains or losses on currency swaps related to principal payments on long-term debt are included in the statement of operations, while gains or losses on currency swaps related to sales in U.S. dollars are deferred to the end of the swap contract, that is, the year the sales are made.
Hydro-Québec uses the temporal method for translating the financial statements of foreign operations considered to be integrated in terms of financial and operational management. The financial statements of the main foreign operations considered to be self-sustaining in terms of financial and operational management are translated on a current rate basis using the foreign currency as the measuring unit. Exchange gains or losses are presented as a translation adjustment under Shareholder's equity.
Fixed assets
Fixed assets are carried at cost, which comprises materials, labor, other costs directly contributing to construction activities and borrowing costs capitalized during construction.
The costs of fixed assets in progress are transferred to fixed assets in service when construction is completed and the facilities are in commercial operation. As for generating facilities, the costs are transferred in installments as generating units of the facilities are completed and commissioned.
39
Fixed assets are depreciated over their useful lives, primarily under the sinking fund method, at a rate of 3%. Under the Hydro-Québec Act, the depreciation period is restricted to a maximum of 50 years. The depreciation periods for the main classes of fixed assets are as follows:
| Distribution substations and lines | | 25 to 40 years |
| Transmission substations and lines | | 30 to 50 years |
| Hydraulic generation | | 45 to 50 years |
| Thermal generation, including nuclear | | 15 to 30 years |
Financial expenses capitalized to fixed assets in progress are determined using the average cost of long-term debt of the Corporation at the end of the previous year. Financial expenses capitalized to fixed assets in progress to be used in regulated transmission activities take a return on shareholder's equity into account. The portion that corresponds to the return on shareholder's equity is included in Revenue in the statement of operations.
As of January 1, 2002, when non-regulated fixed assets are disposed of, the cost of such assets and the cost of their dismantlement, net of accumulated depreciation and salvage value, are charged to operations for the year. Upon disposal of regulated fixed assets, these costs are charged to a separate account and amortized over a maximum period of 10 years, under the sinking fund method, at a rate of 3%.
Cash and cash equivalents and short-term investments
Cash and cash equivalents comprise cash and liquid short-term investments with a maturity of three months or less from the date of acquisition. Investments with a maturity of three to twelve months are disclosed separately under Current assets in the balance sheet.
Short-term investments are shown at amortized cost. The book value of the investments approximates their fair value.
Employee future benefits
The Corporation offers all its employees a contributory defined benefit pension plan, based on final pay, as well as other post-retirement and post-employment benefits.
The cost of pension benefits and other post-retirement benefits provided in exchange for services rendered during the year is calculated using the projected benefit method prorated on years of service, and is based on best estimate economic and demographic assumptions as determined by Management.
In order to establish its employee future benefit obligations, the Corporation has adopted the following policies:
- •
- Past service costs arising from plan amendments and transitional balances relating to the Pension Plan and other post-retirement benefits as at January 1, 1999, are amortized on a straight-line basis over the employees' expected average remaining service life. The transitional obligation relating to post-employment benefits is amortized on a straight-line basis over a period of five years.
- •
- Amortization of actuarial gains or losses is recognized in the expense for the year if the unamortized net actuarial gain or loss at the beginning of the year exceeds 10% of the value of the accrued benefit obligation or 10% of the market-related value of the assets of the plan fund,
40
Goodwill and intangible assets
The excess of the cost of the investments in the subsidiaries and joint ventures over the share of the fair value of the net assets acquired is recorded as goodwill. Effective January 1, 2002, goodwill and intangible assets with indefinite useful lives are no longer amortized. These assets are tested for impairment, annually or more frequently, if events indicate a potential impairment in value. The excess of the carrying value over the fair value is recorded in the year in which the impairment is determined. Intangible assets with definite useful lives are amortized over those estimated useful lives. Intangible assets are amortized according to the following methods and periods:
| Software, licenses and patents | | straight-line | | 3 to 15 years |
| Rights | | sinking fund at 3% | | 40 years |
| Environmental studies | | sinking fund at 3% | | 5 years |
Sinking funds
Sinking funds are created through the purchase of the Corporation's debentures, Government of Canada bonds, or bonds issued or guaranteed by the Québec government. The Corporation's debentures are deducted from long-term debt, while the other securities are presented as Financial assets related to debt.
Sinking fund securities are carried at unamortized cost, a method whereby the difference between the cost and the par value at maturity is amortized over the remaining term of the security.
Derivative instruments
Hydro-Québec uses various derivative instruments to manage foreign exchange and interest rate risk associated with long-term debt, foreign exchange risk related to sales and the risk related to fluctuating energy and raw material prices.
According to corporate policy, in order for a derivative instrument to qualify for hedge accounting, Hydro-Québec must be reasonably certain that the risk will materialize and that the hedge will be effective throughout the hedging period.
When the conditions for applying hedge accounting are not satisfied or hedging is discontinued, derivative instruments are valued at market value. Derivative instruments used for trading purposes, such as forward contracts, options and swaps, as well as open positions on energy trading, are also valued at market value. Realized and unrealized changes in fair value are recognized in income as they occur.
41
The fair value of derivative instruments is based on the spot rates or forward rates or prices in effect at market closing at the balance sheet date. In the absence of this information for a given instrument, Management uses the available forward rate or price for an equivalent instrument. Different valuation models recognized by financial markets are used to estimate the fair value of options.
Interest rate exchanges, all of which are accounted for as hedges and which arise from currency swap agreements used to change long-term exposure to interest rate risk, are matched to interest expense on the borrowings to which they are related. The corresponding amounts payable or receivable are recorded as adjustments to accrued interest.
Derivative instruments used in the short term to manage financial risk over a period of no more than three years are, under hedge accounting, recorded at cost. Realized gains or losses related to these instruments are deferred and charged to operations on a basis consistent with the recognition of the gains or losses of the underlying reverse risk position.
When employed for hedging purposes, derivative instruments used to manage risks related to energy price fluctuations are accounted for at cost and the related gains or losses are deferred and charged to operations on a basis consistent with the recognition of the gains and losses of the underlying reverse risk position.
Decommissioning of nuclear generating station
The future costs of decommissioning Gentilly-2 nuclear generating station are charged progressively to operations and reflected in Other long-term liabilities. These estimated costs essentially relate to the cost of dismantling the station and removal of the irradiated fuel, increased by the interest capitalized annually to the accrued amounts. Interest is calculated at the expected nominal rate on Hydro-Québec's long-term borrowings. Future decommissioning costs are charged to operations annually under a sinking fund method over the remaining useful life of the plant.
The Corporation revises these costs periodically based on the various assumptions and estimates underlying the calculations, possible technological advances and changes in the standards and regulations governing the decommissioning of nuclear generating stations. The restatements resulting from these revisions are accounted for on a prospective basis.
Personnel reduction and renewal measures
The Corporation introduced various temporary measures to facilitate the reduction and renewal of its personnel from 1997 to 2000. The most significant of these measures involved improvements to the Pension Plan as well as severance pay, the cost of which is amortized on a straight-line basis over a period of 60 months, beginning the month following each individual commitment. The cost of the measures relating to the Pension Plan is included in the accrued benefit obligation of the Pension Plan, the cost of severance pay is presented as Deferred charges, and the amortization is recorded in Expenditure — Operations.
Reclassification
Some figures of the previous year have been reclassified in order to respect the presentation adopted in the current year.
42
Note 2 — Changes in Accounting Policies
Foreign currency translation
The Canadian Institute of Chartered Accountants (CICA) has revised Section 1650 of the CICA Handbook, entitled "Foreign Currency Translation," effective January 1, 2002. All unrealized exchange gains and losses related to monetary items denominated in foreign currencies must henceforth be charged to income for the year, including gains and losses on long-term monetary assets and liabilities, which were formerly deferred and amortized on a straight-line basis over the remaining term of the corresponding asset or liability. To reduce volatility resulting from the elimination of the deferral and amortization of unrealized gains and losses, the Corporation adapted its foreign exchange risk management strategy in 2002. In accordance with the new standard, Hydro-Québec has applied these changes retroactively and the prior year's comparative figures have been restated.
Goodwill and other intangible assets
On January 1, 2002, Hydro-Québec also adopted the recommendations of Section 3062 of the CICA Handbook, entitled "Goodwill and Other Intangible Assets." Thus, goodwill and intangible assets with indefinite useful lives are henceforth no longer amortized and are subject to an impairment test.
The Corporation conducted the impairment tests required by the new standard and concluded that no impairment charges were necessary.
Transitional information
The following table presents the effects of applying the new accounting standards:
| | 2002
| | 2001
| | 2000
| | 1999
| | 1998
|
|---|
| | (in millions of dollars)
|
|---|
| Net income reported | | $ | 1,526 | | $ | 1,108 | | $ | 1,078 | | $ | 906 | | $ | 679 |
| Restatements | | | — | | | 513 | | | 205 | | | (317 | ) | | 461 |
| | |
| |
| |
| |
| |
|
| Restated net income | | | 1,526 | | | 595 | | | 873 | | | 1,223 | | | 218 |
| Amortization of goodwill and intangible assets with indefinite useful lives | | | — | | | 21 | | | 14 | | | 14 | | | 13 |
| | |
| |
| |
| |
| |
|
| Adjusted net income | | $ | 1,526 | | $ | 616 | | $ | 887 | | $ | 1,237 | | $ | 231 |
| | |
| |
| |
| |
| |
|
As at January 1, 2002, the retroactive application of the new recommendations had the principal effect of reducing deferred charges by $1,197 million and increasing perpetual debt by $85 million
43
Note 3 — Depreciation, Amortization and Decommissioning
| | 2002
| | 2001
| | 2000
| | 1999
| | 1998
|
|---|
| | (in millions of dollars)
|
|---|
| Depreciation of fixed assets | | $ | 1,670 | | $ | 1,617 | | $ | 1,552 | | $ | 1,525 | | $ | 1,367 |
| Amortization of intangible assets | | | 126 | | | 88 | | | 75 | | | 47 | | | 17 |
| Decommissioning of nuclear generating station | | | 77 | | | 13 | | | 12 | | | 10 | | | 9 |
| Write-off of projects | | | 105 | | | 1 | | | 81 | | | 7 | | | 7 |
| Other | | | 84 | | | 126 | | | 176 | | | 142 | | | 189 |
| | |
| |
| |
| |
| |
|
| | | $ | 2,062 | | $ | 1,845 | | $ | 1,896 | | $ | 1,731 | | $ | 1,589 |
| | |
| |
| |
| |
| |
|
Note 4 — Taxes
| | 2002
| | 2001
| | 2000
| | 1999
| | 1998
|
|---|
| | (in millions of dollars)
|
|---|
| Capital tax | | $ | 281 | | $ | 284 | | $ | 243 | | $ | 320 | | $ | 334 |
| Tax on gross revenue as municipal real estate tax on certain immovables | | | 229 | | | 228 | | | 218 | | | 211 | | | 216 |
| Municipal, school and other taxes | | | 70 | | | 79 | | | 64 | | | 61 | | | 60 |
| | |
| |
| |
| |
| |
|
| | | $ | 580 | | $ | 591 | | $ | 525 | | $ | 592 | | $ | 610 |
| | |
| |
| |
| |
| |
|
Note 5 — Financial Expenses
| | 2002
| | 2001
| | 2000
| | 1999
| | 1998
|
|---|
| |
| | (restated — note 2)
|
|---|
| | (in millions of dollars)
|
|---|
| Interest | | | | | | | | | | | | | | | |
| | Interest on debt securities | | $ | 2,921 | | $ | 3,105 | | $ | 3,231 | | $ | 3,177 | | $ | 3,309 |
| | Amortization of borrowing discount and expenses | | | 45 | | | 53 | | | 58 | | | 54 | | | 56 |
| | |
| |
| |
| |
| |
|
| | | | 2,966 | | | 3,158 | | | 3,289 | | | 3,231 | | | 3,365 |
| | |
| |
| |
| |
| |
|
| Exchange loss | | | 234 | | | 819 | | | 379 | | | (183 | ) | | 597 |
| Loan guarantee fees | | | 188 | | | 185 | | | 187 | | | 197 | | | 189 |
| | |
| |
| |
| |
| |
|
| | | | 422 | | | 1,004 | | | 566 | | | 14 | | | 786 |
| | |
| |
| |
| |
| |
|
| Less | | | | | | | | | | | | | | | |
| | Capitalized borrowing costs | | | 318 | | | 248 | | | 239 | | | 198 | | | 165 |
| | Net investment income | | | 27 | | | 51 | | | 42 | | | 19 | | | 115 |
| | |
| |
| |
| |
| |
|
| | | | 345 | | | 299 | | | 281 | | | 217 | | | 280 |
| | |
| |
| |
| |
| |
|
| | | $ | 3,043 | | $ | 3,863 | | $ | 3,574 | | $ | 3,028 | | $ | 3,871 |
| | |
| |
| |
| |
| |
|
44
Note 6 — Fixed Assets
| | 2002
|
|---|
| | In service
| | Accumulated depreciation
| | In progress
| | Total
|
|---|
| | (in millions of dollars)
|
|---|
| Distribution | | | | | | | | | | | | |
| | Substations and lines | | $ | 9,636 | | $ | 2,912 | | $ | 214 | | $ | 6,938 |
| | Other | | | 1,982 | | | 1,073 | | | 92 | | | 1,001 |
| | |
| |
| |
| |
|
| | | | 11,618 | | | 3,985 | | | 306 | | | 7,939 |
| | |
| |
| |
| |
|
Transmission |
|
|
|
|
|
|
|
|
|
|
|
|
| | Substations and lines | | | 19,306 | | | 4,653 | | | 1,145 | | | 15,798 |
| | Other | | | 2,234 | | | 1,207 | | | 110 | | | 1,137 |
| | |
| |
| |
| |
|
| | | | 21,540 | | | 5,860 | | | 1,255 | | | 16,935 |
| | |
| |
| |
| |
|
Generation |
|
|
|
|
|
|
|
|
|
|
|
|
| | Hydraulic | | | 24,145 | | | 5,877 | | | 3,484 | | | 21,752 |
| | Thermal, including nuclear | | | 2,429 | | | 1,253 | | | 41 | | | 1,217 |
| | Other | | | 839 | | | 311 | | | 61 | | | 589 |
| | |
| |
| |
| |
|
| | | | 27,413 | | | 7,441 | | | 3,586 | | | 23,558 |
| | |
| |
| |
| |
|
| Construction | | | 62 | | | 45 | | | 7 | | | 24 |
| Oil and Gas | | | 1,323 | | | 442 | | | 7 | | | 888 |
| Other | | | 800 | | | 517 | | | 67 | | | 350 |
| | |
| |
| |
| |
|
| | | $ | 62,756 | | $ | 18,290 | | $ | 5,228 | | $ | 49,694 |
| | |
| |
| |
| |
|
|
|
2001
|
|---|
| | In service
| | Accumulated depreciation
| | In progress
| | Total
|
|---|
| | (in millions of dollars)
|
|---|
| Distribution | | | | | | | | | | | | |
| | Substations and lines | | $ | 9,267 | | $ | 2,622 | | $ | 201 | | $ | 6,846 |
| | Other | | | 2,018 | | | 1,073 | | | 79 | | | 1,024 |
| | |
| |
| |
| |
|
| | | | 11,285 | | | 3,695 | | | 280 | | | 7,870 |
| | |
| |
| |
| |
|
Transmission |
|
|
|
|
|
|
|
|
|
|
|
|
| | Substations and lines | | | 19,174 | | | 4,292 | | | 785 | | | 15,667 |
| | Other | | | 2,137 | | | 1,040 | | | 213 | | | 1,310 |
| | |
| |
| |
| |
|
| | | | 21,311 | | | 5,332 | | | 998 | | | 16,977 |
| | |
| |
| |
| |
|
Generation |
|
|
|
|
|
|
|
|
|
|
|
|
| | Hydraulic | | | 23,891 | | | 5,435 | | | 2,885 | | | 21,341 |
| | Thermal, including nuclear | | | 2,409 | | | 1,152 | | | 22 | | | 1,279 |
| | Other | | | 848 | | | 278 | | | 92 | | | 662 |
| | |
| |
| |
| |
|
| | | | 27,148 | | | 6,865 | | | 2,999 | | | 23,282 |
| | |
| |
| |
| |
|
| | | | | | | | | | | | | |
45
| Construction | | | 55 | | | 42 | | | 6 | | | 19 |
| Oil and Gas | | | 1,285 | | | 406 | | | 3 | | | 882 |
| Other | | | 722 | | | 485 | | | 42 | | | 279 |
| | |
| |
| |
| |
|
| | | $ | 61,806 | | $ | 16,825 | | $ | 4,328 | | $ | 49,309 |
| | |
| |
| |
| |
|
As at December 31, 2002, the Corporation had cumulative costs related to suspended draft design projects amounting to $336 million ($514 million as at December 31, 2001) for which financial expenses are not capitalized. These suspended draft design projects are recorded under Fixed assets in progress.
As certain projects have longer completion timelines, their cumulative costs are periodically reviewed.
During such reviews, Management must use estimates and make assumptions that have an impact on the amounts reported for draft design projects at the balance sheet date. Such projects are assessed in terms of profitability based on prevailing market conditions at the time of their commissioning, compliance with sustainable development principles and how well they are received by local communities. A significant change in the assessment based on these criteria could result in a reduction of the balance for draft design projects.
When a major project related to regulated fixed assets is discontinued, the costs determined to be non-recoverable are deferred over a period of three years using the straight-line method.
46
Note 7 — Investments
| | 2002
| | 2001
|
|---|
| | (in millions of dollars)
|
|---|
| At cost | | | | | | |
| Noverco Inc. (note 15) | | | | | | |
| | Notes(a) | | $ | 141 | | $ | 141 |
| Churchill Falls (Labrador) Corporation Limited (note 20) | | | | | | |
| | Bonds(b) | | | 57 | | | 58 |
| Other(c) | | | 230 | | | 269 |
| | |
| |
|
| | | | 428 | | | 468 |
| | |
| |
|
At equity |
|
|
|
|
|
|
| Enbridge Inc. | | | 244 | | | 211 |
| Churchill Falls (Labrador) Corporation Limited (note 20) | | | 45 | | | 39 |
| Connexim, Limited Partnership | | | 35 | | | 32 |
| Meiya Power Company Limited | | | 98 | | | 91 |
| Other | | | 2 | | | — |
| | |
| |
|
| | | | 424 | | | 373 |
| | |
| |
|
| | | $ | 852 | | $ | 841 |
| | |
| |
|
- (a)
- Subordinate debentures, interest rate based on the annual average rate of Government of Canada bonds with terms of over 10 years plus 4.45%, due in 2031, redeemable.
- (b)
- Bonds secured by a general mortgage, 7.50%, due in 2010 (par value of $63 million in 2002 and $64 million in 2001).
- (c)
- Includes venture capital investments at a cost of $122 million and with a fair value of $117 million as at December 31, 2002 ($118 million and $118 million as at December 31, 2001). The fair value of listed shares is based on the trading price at the balance sheet date; the fair value of unlisted shares is cost.
Note 8 — Deferred Charges
| | 2002
| | 2001
|
|---|
| |
| | (restated-note 2)
|
|---|
| | (in millions of dollars)
|
|---|
| Deferred charges related to debt(a) | | $ | 2,335 | | $ | 2,776 |
| Employee future benefit asset (note 19) | | | 752 | | | 635 |
| Other | | | 304 | | | 397 |
| | |
| |
|
| | | $ | 3,391 | | $ | 3,808 |
| | |
| |
|
- (a)
- Mainly comprises a deferred exchange loss of $2,290 million ($2,640 million as at December 31, 2001).
47
Note 9 — Financial Assets Related to Debt
| | 2002
| | 2001
|
|---|
| | (in millions of dollars)
|
|---|
| Currency swaps and contracts | | $ | 291 | | $ | 316 |
| Sinking funds | | | 68 | | | 89 |
| | |
| |
|
| | | | 359 | | | 405 |
| Less | | | | | | |
| Current portion | | | 34 | | | 106 |
| | |
| |
|
| | | $ | 325 | | $ | 299 |
| | |
| |
|
Note 10 — Intangible Assets
| | 2002
| | 2001
|
|---|
| | Cost
| | Accumulated amortization
| | Total
| | Cost
| | Accumulated amortization
| | Total
|
|---|
| | (in millions of dollars)
|
|---|
| Subject to amortization | | | | | | | | | | | | |
| Software and licenses | | 560 | | 279 | | 281 | | 496 | | 238 | | 258 |
| Rights | | 109 | | 29 | | 80 | | 136 | | 54 | | 82 |
| Environmental studies | | 112 | | 95 | | 17 | | 95 | | 64 | | 31 |
| Patents | | 36 | | 9 | | 27 | | 33 | | 4 | | 29 |
| | |
| |
| |
| |
| |
| |
|
| | | 817 | | 412 | | 405 | | 760 | | 360 | | 400 |
| | |
| |
| |
| |
| |
| |
|
Not subject to amortization |
|
|
|
|
|
|
|
|
|
|
|
|
| Servitudes | | 496 | | 141 | | 355 | | 493 | | 142 | | 351 |
| | |
| |
| |
| |
| |
| |
|
| | | 496 | | 141 | | 355 | | 493 | | 142 | | 351 |
| | |
| |
| |
| |
| |
| |
|
| | | 1,313 | | 553 | | 760 | | 1,253 | | 502 | | 751 |
| | |
| |
| |
| |
| |
| |
|
Note 11 — Long-Term Debt
Composition and maturities
Debentures, other long-term debt and currency swaps representing financial liabilities, translated into Canadian dollars at the closing exchange rates in effect at the balance sheet date, are summarized
48
in the following table. These amounts are presented by year of maturity, and take into account the requirements of the sinking funds.
| | 2002
| | 2001
|
|---|
| | Debt of the Corporation
| |
| |
| |
|
|---|
Year of maturity
| | Canadian dollars
| | U.S. dollars
| | Other currencies
| | Total
| | Subsidiaries and joint ventures
| | Total
| | Total
|
|---|
| | (in millions of dollars)
|
|---|
| 2002 | | $ | — | | $ | — | | $ | — | | $ | — | | $ | — | | $ | — | | $ | 3,087 |
| 2003 | | | 970 | | | 1,501 | | | 290 | | | 2,761 | | | 208 | | | 2,969 | | | 3,305 |
| 2004 | | | 1,586 | | | 26 | | | 56 | | | 1,668 | | | 66 | | | 1,734 | | | 1,599 |
| 2005 | | | 1,531 | | | 646 | | | 172 | | | 2,349 | | | 353 | | | 2,702 | | | 2,528 |
| 2006 | | | 1,051 | | | 1,749 | | | 422 | | | 3,222 | | | 29 | | | 3,251 | | | 2,629 |
| 2007 | | | 683 | | | 641 | | | 27 | | | 1,351 | | | 270 | | | 1,621 | | | — |
| | |
| |
| |
| |
| |
| |
| |
|
| 1 to 5 years | | | 5,821 | | | 4,563 | | | 967 | | | 11,351 | | | 926 | | | 12,277 | | | 13,148 |
| 6 to 10 years | | | 3,906 | | | 1,840 | | | 1,340 | | | 7,086 | | | 1,061 | | | 8,147 | | | 7,115 |
| 11 to 15 years | | | 16 | | | 2,189 | | | 632 | | | 2,837 | | | 124 | | | 2,961 | | | 4,358 |
| 16 to 20 years | | | 4,657 | | | 3,167 | | | — | | | 7,824 | | | 65 | | | 7,889 | | | 4,766 |
| 21 to 25 years | | | 8 | | | 1,422 | | | — | | | 1,430 | | | 62 | | | 1,492 | | | 4,563 |
| 26 to 30 years | | | 1,084 | | | 2,843 | | | — | | | 3,927 | | | 96 | | | 4,023 | | | 4,517 |
| 31 to 35 years | | | 2,146 | | | — | | | — | | | 2,146 | | | — | | | 2,146 | | | 1,183 |
| 36 to 40 years | | | 280 | | | — | | | — | | | 280 | | | — | | | 280 | | | 276 |
| 41 to 45 years | | | — | | | — | | | — | | | — | | | — | | | — | | | 2 |
| 46 to 50 years | | | 50 | | | — | | | — | | | 50 | | | — | | | 50 | | | 50 |
| 51 to 55 years | | | — | | | — | | | — | | | — | | | — | | | — | | | — |
| 56 to 60 years | | | 403 | | | — | | | — | | | 403 | | | — | | | 403 | | | 378 |
| | |
| |
| |
| |
| |
| |
| |
|
| | | | 18,371 | (a) | | 16,024 | | | 2,939 | | | 37,334 | (b) | | 2,334 | | | 39,668 | | | 40,356 |
| Less | | | | | | | | | | | | | | | | | | | | | |
| | Current portion | | | 970 | | | 1,501 | | | 290 | | | 2,761 | | | 208 | | | 2,969 | | | 3,087 |
| | |
| |
| |
| |
| |
| |
| |
|
| | | $ | 17,401 | | $ | 14,523 | | $ | 2,649 | | $ | 34,573 | | $ | 2,126 | | $ | 36,699 | | $ | 37,269 |
| | |
| |
| |
| |
| |
| |
| |
|
- (a)
- Includes $125 million and $277 million in zero-coupon bonds, reported at their discounted value at a semi-annually compounded interest rate of 10.95% and 10.67% respectively. Their par value will reach $282 million and $1,729 million in 2010 and 2020 respectively. A specific sinking fund was created for this debt and totaled $81 million as at December 31, 2002. Other bonds, reported at their discounted value and amounting to $1,126 million, will reach a par value of $1,333 million on maturity.
- (b)
- Includes $36,596 million in bonds guaranteed by the Québec government ($36,835 million as at December 31, 2001).
49
Allocation of debt by currency at time of issue and impact of financial assets related to debt
The following table summarizes long-term debt, including the current portion, in Canadian dollars and currency units. Also shown are the effects of currency swaps and sinking funds allocated to repay debt, which are presented on the balance sheet under Financial assets related to debt.
| | 2002
| | 2001
|
|---|
| | Long-term debt
| | Financial assets related to debt
| |
| |
|
|---|
| | In Canadian dollars and currency units
| | At the closing exchange rates at the balance sheet date(a)
| | Currency swaps and sinking funds
| | Total
| | Total
|
|---|
| | (in millions of dollars or millions of currency units)
|
|---|
| Debt of the Corporation | | | | | | | | | | | | | | |
| Canadian dollars | | 18,371 | | $ | 18,371 | | $ | (67 | ) | $ | 18,304 | | $ | 16,982 |
| U.S. dollars | | 10,007 | | | 16,024 | | | (85 | ) | | 15,939 | | | 17,530 |
| Other currencies | | | | | | | | | | | | | | |
| | Euros | | 727 | | | 1,322 | | | (62 | ) | | 1,260 | | | 1,516 |
| | Yen | | 46,500 | | | 704 | | | (67 | ) | | 637 | | | 794 |
| | Pounds sterling | | 300 | | | 802 | | | (39 | ) | | 763 | | | 766 |
| | Swiss francs | | 97 | | | 111 | | | (15 | ) | | 96 | | | 96 |
| | | | |
| |
| |
| |
|
| | | | | | 2,939 | | | (183 | ) | | 2,756 | | | 3,172 |
| | | | |
| |
| |
| |
|
| | | | �� | | 37,334 | | | (335 | ) | | 36,999 | | | 37,684 |
| Subsidiaries and joint ventures(b) | | | | | 2,334 | | | (24 | ) | | 2,310 | | | 2,267 |
| | | | |
| |
| |
| |
|
| | | | | $ | 39,668 | | $ | (359 | ) | $ | 39,309 | | $ | 39,951 |
| | | | |
| |
| |
| |
|
- (a)
- Includes $474 million of financial liabilities composed of currency swaps ($945 million as at December 31, 2001) and $561 million of Hydro-Québec securities held in the sinking funds ($452 million as at December 31, 2001).
- (b)
- Includes $818 million in Canadian dollars, $1,167 million in U.S. dollars, $321 million in Unidades de Fomento (indexed Chilean pesos) and $4 million in Chinese renminbi ($835 million in Canadian dollars, $1,092 million in U.S. dollars, $336 million in Unidades de Fomento and $4 million in Chinese renminbi as at December 31, 2001).
50
Allocation of debt by currency at time of issue and at time of repayment
The following table shows the allocation of debt, net of sinking funds, converted into Canadian dollars after taking swaps into account, according to the currency at time of issue and the currency at time of repayment.
| | 2002
| | 2001
| |
|---|
| | At time of issue
| | At time of repayment
| | At time of issue
| | At time of repayment
| |
|---|
| | (in millions of dollars)
| |
|---|
| Debt of the Corporation | | | | | | | | | | | | | |
| Canadian dollars | | $ | 18,304 | | $ | 17,778 | | $ | 16,982 | | $ | 17,371 | |
| U.S. dollars | | | 15,939 | | | 19,221 | (a) | | 17,530 | | | 20,313 | (a) |
| Other currencies | | | 2,756 | | | — | | | 3,172 | | | — | |
| | |
| |
| |
| |
| |
| | | | 36,999 | | | 36,999 | | | 37,684 | | | 37,684 | |
| | |
| |
| |
| |
| |
Debt of subsidiaries and joint ventures |
|
|
|
|
|
|
|
|
|
|
|
|
|
| Canadian dollars | | | 818 | | | 818 | | | 835 | | | 835 | |
| U.S. dollars | | | 1,167 | | | 920 | | | 1,092 | | | 937 | |
| Other currencies | | | 325 | | | 572 | | | 340 | | | 495 | |
| | |
| |
| |
| |
| |
| | | | 2,310 | | | 2,310 | | | 2,267 | | | 2,267 | |
| | |
| |
| |
| |
| |
| | | $ | 39,309 | | $ | 39,309 | | $ | 39,951 | | $ | 39,951 | |
| | |
| |
| |
| |
| |
- (a)
- One hundred percent of the balances as at December 31, 2002, (83% in 2001) hedging sales in U.S. dollars.
Interest rates
The Hydro-Québec interest rates presented in the following table take into account nominal interest rates on borrowings, the related discounts and expenses, and the effect of interest rate swaps.
Year of maturity
| | Canadian dollars
| | U.S. dollars
| | Other currencies
| | 2002 weighted average
| | 2001 weighted average
|
|---|
| 1 to 5 years | | 2.76 | | 7.16 | | 4.84 | | 4.65 | | 4.87 |
| 6 to 10 years | | 8.29 | | 5.45 | | 5.69 | | 6.98 | | 5.56 |
| 11 to 15 years | | 10.25 | | 7.17 | | 9.21 | | 7.70 | | 9.29 |
| 16 to 20 years | | 10.61 | | 9.17 | | 6.20 | | 9.97 | | 10.50 |
| 21 to 25 years | | 8.80 | | 8.56 | | — | | 8.57 | | 9.16 |
| 26 to 30 years | | 6.68 | | 9.21 | | — | | 8.44 | | 8.46 |
| 31 to 35 years | | 6.26 | | — | | — | | 6.26 | | 6.34 |
| 36 to 40 years | | 6.41 | | — | | — | | 6.41 | | 6.41 |
| 41 to 45 years | | — | | — | | — | | — | | 6.56 |
| 46 to 50 years | | 6.44 | | — | | — | | 6.44 | | 6.44 |
| 51 to 55 years | | — | | — | | — | | — | | — |
| 56 to 60 years | | 6.62 | | — | | — | | 6.62 | | 6.62 |
Weighted average |
|
7.88 |
|
8.16 |
|
6.77 |
|
7.95 |
|
8.05 |
51
The variable-rate portion of Hydro-Québec's debt amounted to 23.2%, or 24.4% after perpetual debt, as at December 31, 2002 (24.6%, or 25.8% after perpetual debt, as at December 31, 2001). For information purposes, a change of 1% in the interest rate would change net income by $97 million ($105 million in 2001), not including the impact of derivative instruments used to manage short-term financial risk (note 14).
Fair value
As at December 31, 2002, the fair value of Hydro-Québec's debt, net of sinking funds and after swaps, amounted to $49,231 million ($47,468 million as at December 31, 2001).
Fair value is obtained by discounting future cash flows, based on term and closing interest rates as at the balance sheet date for similar instruments available on financial markets. Changes in fair value reflect sensitivity to financial market interest rates. However, Management intends to retain these debt securities until maturity. Therefore, as at December 31, 2002, Hydro-Québec did not foresee any significant debt repayments that could result in the realization of this fair value.
Hydro-Québec has undrawn revolving standby credits totaling US$1,500 million and expiring between 2003 and 2006. Any borrowing under these lines of credit will bear interest at a rate based on the London Interbank Offered Rate (LIBOR).
52
Note 12 — Other Long-Term Liabilities
| | 2002
| | 2001
|
|---|
| |
| | (restated — note 2)
|
|---|
| | (in millions of dollars)
|
|---|
| Accounts payable | | $ | 355 | | $ | 312 |
| Employee future benefit liability (note 19) | | | 376 | | | 343 |
| Decommissioning of nuclear generating station(a)(b) | | | 157 | | | 100 |
| | |
| |
|
| | | $ | 888 | | $ | 755 |
| | |
| |
|
- (a)
- The Minister of Natural Resources Canada recently announced the coming into force, on November 15, 2002, of An Act Respecting the Long-Term Management of Nuclear Fuel Waste. The legislation calls for nuclear fuel waste owners in Canada to form a separate legal entity known as the Waste Management Organization (WMO) and to set up a trust with a financial institution in order to finance the implementation of the nuclear fuel waste management proposal that will be adopted by the Government of Canada. In order to satisfy the financial responsibilities incumbent on the nuclear fuel waste owners, the Corporation deposited an initial amount of $20 million in a trust within 10 days of the date the Act came into force. The Corporation will also be required to deposit an additional $4 million per year in the same trust until the Waste Management Organization determines the amount to be paid by each nuclear plant owner. The amount deposited in the trust ($20 million in 2002) is presented as a reduction of the provision for decommissioning of the nuclear generating station.
- (b)
- When Gentilly-2 nuclear generating station was designed, the Corporation planned to operate it for 30 years, until 2013. In 2001, the Corporation initiated a draft design study, to be completed in 2004, in order to evaluate whether its useful life could be extended by 25 years through refurbishment. If the refurbishment is not carried out, the plant could be decommissioned a few years earlier, depending on technical and economic factors. Pending a decision on the refurbishment project and hence the useful life of the plant, the financial statements continue to reflect a decommissioning in 2013. Once the decision is made, future decommissioning and amortization costs may vary significantly from the amounts reported in these financial statements based on the end-of-life date retained and the increase inherent in the methods used to calculate depreciation and amortization and the costs of decommissioning the plant. As at December 31, 2002, the net book value of Gentilly-2 was $790 million, and the portion for which a provision remained to be made for future decommissioning costs approximated $660 million, based on decommissioning in 2013.
Note 13 — Perpetual Debt
Perpetual notes in the amount of US$400 million bear interest at a rate established semi-annually based on LIBOR. They are guaranteed by the Québec government and are only redeemable at the Corporation's option. Effective January 1, 2002, these notes are shown on the balance sheet at the closing rate in effect at the balance sheet date, whereas in 2001 they were shown at the rate in effect on the date of issue. For comparative purposes, the book value of these notes has been restated to December 31, 2001, in order to present these amounts at the rate in effect at the balance sheet date.
As at December 31, 2002, their fair value was $540 million ($566 million as at December 31, 2001). As at December 31, 2002 and 2001, the LIBOR for perpetual notes was 1.94% and 3.09%, respectively.
Note 14 — Derivative Instruments
Derivative instruments used by Hydro-Québec for hedging purposes are always associated with a reverse risk position.
Hydro-Québec concludes currency swaps in order to manage the foreign exchange risk associated with payments of principal on long-term debt, interest payments and sales in U.S. dollars. Some of these currency swaps allow for interest rate exchanges to change long-term exposure to interest rate risk. Interest rate swaps that do not allow for exchanges of principal are also used to manage this risk.
53
The valuation of these swaps, with terms through 2022, showed a positive fair value of $407 million (negative fair value of $338 million as at December 31, 2001).
The following table shows the notional amount of these swaps, expressed in Canadian dollars or other currencies.
| | 2002(a)
| | 2001(a)
| |
|---|
| | (in millions of currency units)
| |
|---|
| Canadian dollars | | 526 | | (389 | ) |
| U.S. dollars | | (1,991 | ) | (1,768 | ) |
| Other currencies | | | | | |
| | Yen | | 46,500 | | 57,500 | |
| | Euros | | 727 | | 880 | |
| | Pounds sterling | | 300 | | 300 | |
| | Swiss francs | | 97 | | 97 | |
| | Unidades de Fomento (indexed Chilean pesos) | | (7 | ) | (4 | ) |
- (a)
- Figures in parentheses represent amounts to be paid.
In managing short-term financial risks, Hydro-Québec assesses, on an ongoing basis, the overall impact of variations in exchange rates, interest rates and the prices of commodities. Hydro-Québec holds options and forward contracts designed to hedge several positions. It also uses derivative instruments to manage market risks resulting from fluctuations in energy prices. The fair value of these instruments is presented by specific risk in the following table. These derivative instruments mature through March 2005.
54
The fair value of derivative instruments reflects the amount that Hydro-Québec would receive (financial assets) or pay (financial liabilities) as at the balance sheet date in terminating these instruments.
| | 2002
| | 2001
| |
|---|
| | (in millions of dollars)
| |
|---|
| Exchange risk | | | | | | | |
| Forward exchange contracts and options | | | | | | | |
| | Financial assets | | $ | 22 | | $ | 38 | |
| | Financial liabilities | | | (7 | ) | | (2 | ) |
| | |
| |
| |
| | | | 15 | | | 36 | |
| | |
| |
| |
Interest rate risk |
|
|
|
|
|
|
|
| Forward rate agreements, options and swaps | | | | | | | |
| | Financial assets | | | 7 | | | 33 | |
| | Financial liabilities | | | (101 | ) | | (89 | ) |
| | |
| |
| |
| | | | (94 | ) | | (56 | ) |
| | |
| |
| |
Risk of change in energy and commodity prices |
|
|
|
|
|
|
|
| Forward contracts, options and swaps | | | | | | | |
| | Financial assets | | | 29 | | | 32 | |
| | Financial liabilities | | | (18 | ) | | (60 | ) |
| | |
| |
| |
| | | | 11 | | | (28 | ) |
| | |
| |
| |
| | | $ | (68 | ) | $ | (48 | ) |
| | |
| |
| |
Credit risk
Derivative instruments include an element of risk, since a counterparty might not meet its obligations. However, this risk is moderate as Hydro-Québec deals only with Canadian and international financial institutions with high credit ratings. Credit risk exposure is also reduced by applying a credit policy limiting credit risk concentrations and a customer credit risk evaluation program, as well as by adopting credit limits, where necessary. As at December 31, 2002, Hydro-Québec did not foresee any material loss arising from counterparty default.
Note 15 — Interests in Joint Ventures
The share of the principal joint venture items included in the consolidated financial statements is presented in the following table. These joint ventures specifically include the interest in Noverco Inc.
55
and the Corporation's interests in various foreign joint ventures, mainly through Hydro-Québec International.
| | 2002
| | 2001
| |
|---|
| | (in millions of dollars)
| |
|---|
| Operations | | | | | | | |
| | Revenue | | $ | 933 | | $ | 1,148 | |
| | Expenditure and financial expenses | | | 871 | | | 1,095 | |
| | Non-controlling interest | | | 20 | | | 18 | |
| | |
| |
| |
| | Net income | | $ | 42 | | $ | 35 | |
| | |
| |
| |
Balance sheet |
|
|
|
|
|
|
|
| | Current assets | | $ | 192 | | $ | 186 | |
| | Long-term assets | | | 1,925 | | | 1,793 | |
| | Current liabilities | | | 213 | | | 216 | |
| | Long-term liabilities | | | 1,102 | | | 1,096 | |
| | Non-controlling interest | | | 216 | | | 174 | |
| | |
| |
| |
| | Net assets | | $ | 586 | | $ | 493 | |
| | |
| |
| |
Cash flows |
|
|
|
|
|
|
|
| | Operating activities | | $ | 156 | | $ | 125 | |
| | Investing activities | | | (121 | ) | | (121 | ) |
| | Financing activities | | | (5 | ) | | (1 | ) |
| | |
| |
| |
| | Net change in cash and cash equivalents | | $ | 30 | | $ | 3 | |
| | |
| |
| |
Noverco Inc.
Hydro-Québec holds 41.2% of the outstanding common shares of Noverco Inc. and options on an additional 9.2%. Under the Noverco Inc. shareholders' agreement, the Corporation agreed to mechanisms enabling the joint owners to convert their interests into liquidities under certain conditions.
Noverco Inc., through its interest in Gaz Métropolitain and Company, Limited Partnership (GMCLP), disclosed unrecorded future income taxes of $94 million on regulated activities in 2002 ($98 million in 2001). In the past, the Régie de l'énergie and the National Energy Board have allowed these future income taxes to be included in rates as they become payable.
GMCLP charges pension and other retirement benefits to income as the amounts are disbursed, in accordance with regulatory practice.
Foreign joint ventures
The Corporation holds interests in joint ventures, primarily through HQI. These joint ventures are essentially involved in the operation and construction of transmission systems and hydroelectric generating stations. They mainly operate in South and Central America and Australia.
Note 16 — Shareholder's Equity
The authorized share capital comprises 50,000,000 shares with a par value of $100 each, and 43,741,090 shares were issued and paid.
Under the Hydro-Québec Act, any dividends to be paid by the Corporation are declared once a year by the Québec government, which also determines the terms and conditions of payment. For a
56
given fiscal year, they cannot exceed the distributable surplus, equal to 75% of the year's operating income and net investment income, less interest on debt securities and amortization of borrowing discounts and expenses. This calculation is made on the basis of the consolidated financial statements.
However, in respect of a given fiscal year, no dividend may be declared in an amount that would have the effect of reducing the rate of capitalization to less than 25% at the end of the year. The government declares the dividends for a given year within 30 days after the Corporation has sent the government the financial data relative to the distributable surplus. On expiry of the time prescribed, any distributable surplus or part thereof that has not been subject to a dividend declaration may no longer be distributed to the shareholder as a dividend.
For 2002, the Québec government declared dividends of $763 million, which is less than the maximum permitted.
Dividends declared are deducted from the retained earnings of the year for which they were declared.
Note 17 — Change in Non-Cash Working Capital Items
| | 2002
| | 2001
| |
|---|
| | (in millions of dollars)
| |
|---|
| Accounts receivable | | $ | (136 | ) | $ | 26 | |
| Materials, fuel and supplies | | | 7 | | | (23 | ) |
| Accounts payable | | | 142 | | | 85 | |
| Accrued interest | | | (44 | ) | | (38 | ) |
| | |
| |
| |
| | | $ | (31 | ) | $ | 50 | |
| | |
| |
| |
Note 18 — Business Acquisition
On October 23, 2000, the Corporation, through HQI, acquired the aggregate of the outstanding common shares of Compañía Nacional de Transmisión Eléctrica S.A. (Transelec), a major Chilean power transmission company. The acquisition was recorded using the purchase method.
Following the finalization of the acquisition price on June 29, 2001 for an amount of $1,635 million, the fair value of the assets acquired and liabilities assumed are as follows:
| Cash | | 50 | |
| Current assets | | 13 | |
| Long-term assets | | 1,529 | |
| | |
| |
| | | 1,592 | |
| Current liabilities | | (14 | ) |
| Long-term liabilities | | (15 | ) |
| | |
| |
| Net assets | | 1,563 | |
| Goodwill | | 72 | |
| | |
| |
| Purchase price | | 1,635 | |
| | |
| |
| Consideration comprises: | | | |
| Cash, net of cash acquired | | 1,576 | |
| Other | | 9 | |
| | |
| |
| | | 1,585 | |
| | |
| |
57
As at December 31, 2000, no results had been recorded, pursuant to Hydro-Québec's practice of consolidating international interests on a quarter lag basis.
Note 19 — Employee Future Benefits
The Corporation's pension plan (the "Pension Plan") is a funded plan that ensures pension benefits based on number of years of service and average five best years of earnings. The post-retirement and post-employment benefits offered by the Corporation also include group life, medical and hospitalization, and salary insurance plans. However, most of these plans are not funded, with the exception of the long-term disability salary insurance plan, which is fully funded, and the supplementary group life insurance plan, which is partially funded.
The following table presents information concerning the defined benefit plans, established by independent actuaries:
| | 2002 Pension Plan
| | 2001 Pension Plan
| | 2002 Other plans
| | 2001 Other plans
| |
|---|
| | (in millions of dollars)
| |
|---|
| Accrued benefit obligation | | | | | | | | | | | | | |
| | Balance at beginning of year | | $ | 7,231 | | $ | 6,966 | | $ | 511 | | $ | 522 | |
| | Current service cost | | | 220 | | | 214 | | | 22 | | | 19 | |
| | Benefit payments and refunds | | | (319 | ) | | (321 | ) | | (31 | ) | | (31 | ) |
| | Interest on obligation | | | 484 | | | 451 | | | 34 | | | 33 | |
| | Actuarial losses (gains) | | | 321 | | | (79 | ) | | 28 | | | (20 | ) |
| | Adjustments arising from plan amendments | | | — | | | — | | | — | | | (12 | ) |
| | |
| |
| |
| |
| |
| | Balance at end of year | | $ | 7,937 | | $ | 7,231 | | $ | 564 | | $ | 511 | |
| | |
| |
| |
| |
| |
Plan assets at fair value |
|
|
|
|
|
|
|
|
|
|
|
|
|
| | Balance at beginning of year | | $ | 9,149 | | $ | 9,452 | | $ | 40 | | $ | 31 | |
| | Actual return on plan assets during the year | | | (480 | ) | | 33 | | | 1 | | | 1 | |
| | Employee contributions | | | 6 | | | 13 | | | — | | | — | |
| | Hydro-Québec contributions | | | — | | | — | | | 12 | | | 13 | |
| | Benefit payments and refunds | | | (319 | ) | | (321 | ) | | (7 | ) | | (5 | ) |
| | Administrative fees | | | (30 | ) | | (28 | ) | | — | | | — | |
| | |
| |
| |
| |
| |
| | Balance at end of year | | $ | 8,326 | | $ | 9,149 | | $ | 46 | | $ | 40 | |
| | |
| |
| |
| |
| |
| Surplus (deficit) at end of year | | $ | 389 | | $ | 1,918 | | $ | (518 | ) | $ | (471 | ) |
| | Unamortized past service costs | | | 270 | | | 348 | | | 1 | | | 2 | |
| | Unamortized net loss (gain) | | | 1,766 | | | 194 | | | (9 | ) | | (39 | ) |
| | Unamortized transitional obligation (asset) | | | (1,673 | ) | | (1,825 | ) | | 150 | | | 165 | |
| | |
| |
| |
| |
| |
| Accrued benefit asset (liability) | | $ | 752 | | $ | 635 | | $ | (376 | ) | $ | (343 | ) |
| | |
| |
| |
| |
| |
Significant actuarial assumptions (%) |
|
|
|
|
|
|
|
|
|
|
|
|
|
| | Discount rate | | | 6.58 | | | 6.62 | | | 6.58 | | | 6.62 | |
| | Expected rate of return on plan assets | | | 7.45 | | | 7.67 | | | 3.00 | | | 4.98 | |
| | Salary escalation rate (a) | | | 3.15 | | | 2.95 | | | — | | | — | |
- (a)
- This rate is a weighted average which takes salary increases into account as well as promotion opportunities while in service.
As at December 31, 2002, health-care costs were based on an annual growth rate of 7.9% in 2003. Thereafter, based on the assumption used, this rate gradually decreases until it reaches the ultimate rate of 3.7% in 2013.
58
Plan assets include securities issued by the Corporation and certain related companies. These securities are grouped under the following asset classes:
| | 2002 Pension Plan
| | 2001 Pension Plan
| | 2002 Other plans
| | 2001 Other plans
| |
|---|
| | (in millions of dollars)
| |
|---|
| Bonds and debentures | | $ | 551 | | $ | 689 | | $ | — | | $ | — | |
| Shares | | | 7 | | | 12 | | | — | | | — | |
| Short-term investments | | | 27 | | | — | | | 40 | | | 35 | |
| | |
| |
| |
| |
| |
| | | $ | 585 | | $ | 701 | | $ | 40 | | $ | 35 | |
| | |
| |
| |
| |
| |
Plan expense (credit) |
|
|
|
|
|
|
|
|
|
|
|
|
|
| | Current service cost (a) | | $ | 197 | | $ | 185 | | $ | 22 | | $ | 19 | |
| | Administrative fees (b) | | | 30 | | | 28 | | | — | | | — | |
| | Interest on obligation | | | 484 | | | 451 | | | 34 | | | 32 | |
| | Expected return on plan assets | | | (754 | ) | | (718 | ) | | (1 | ) | | (1 | ) |
| | Amortization of transitional obligation (asset) | | | (152 | ) | | (152 | ) | | 14 | | | 16 | |
| | Amortization of net actuarial loss (gain) | | | — | | | — | | | 2 | | | (1 | ) |
| | Amortization of past service costs | | | 78 | | | 116 | | | — | | | 4 | |
| | |
| |
| |
| |
| |
| Expense (credit) for the year | | $ | (117 | ) | $ | (90 | ) | $ | 71 | | $ | 69 | |
| | |
| |
| |
| |
| |
- (a)
- For the long-term disability salary insurance plan, current service cost corresponds to the cost of new disability cases for the year.
- (b)
- Administrative fees chargeable to the Pension Plan are fully billed by the Corporation.
The Corporation and all of its employees have been benefiting from a holiday on pension plan contributions since May 10, 1999.
Note 20 — Commitments and Contingent Liabilities
Electricity purchased
On May 12, 1969, the Corporation signed a contract with Churchill Falls (Labrador) Corporation Limited (CF(L)Co) whereby the Corporation undertook to purchase substantially all the energy generated at Churchill Falls generating station, which has a rated capacity of 5,428 MW. Under this agreement, the Corporation could be required to provide additional funding to service the debt of CF(L)Co and to pay its expenses should CF(L)Co be unable to do so. Expiring in 2016, this contract will be automatically renewed for a further 25 years under agreed-upon terms and conditions. On June 18, 1999, the Corporation and CF(L)Co also entered into a contract to guarantee the availability of 682 MW of additional power until 2041 for the November 1 to March 31 winter period.
As at December 31, 2002, the Corporation was committed under 80 contracts to purchase electricity from independent power producers for a potential capacity of about 930 MW. The Corporation expects to purchase approximately 4 TWh of energy annually over the initial term of these contracts, which extend through 2029. The majority of these contracts include renewal clauses.
Guarantees
Hydro-Québec had issued letters of credit or guarantees for an amount of $1,903 million as at December 31, 2002.
59
Capital expenditures
The Corporation expects to invest approximately $2,600 million in fixed assets in 2003.
Agreement respecting the Eastmain-1 project
Within the scope of the Eastmain-1 project, Hydro-Québec signed various agreements with the Grand Council of the Crees (Eeyou Istchee), the Cree Regional Authority, the Eastmain Band, the Cree Nation of Mistissini, the Nemaska Band and the Waskaganish Band. The amounts paid are based on work completion and are included in the cost of the project in the year they are paid.
Litigation
In the normal course of business, Hydro-Québec is party to claims and legal proceedings. Management is of the opinion that the outcome of these legal actions, which can currently be determined with reasonable certainty, will not have an adverse effect on the consolidated financial position or operating results of Hydro-Québec, given the provision for such expenditures.
Note 21 — Segmented Information
Hydro-Québec's operations are divided into five segments based on its organizational structure, which reflects how the Corporation's activities are managed:
Distribution: Hydro-Québec Distribution develops and operates the Corporation's distribution system and is responsible for sales and service to Québec customers.
Transmission: Hydro-Québec TransÉnergie develops and operates the Corporation's transmission system in Québec, in addition to managing and operating foreign transmission systems and carrying out development projects. The division also manages Hydro-Québec's telecommunications network.
Generation: Hydro-Québec Production operates and develops the Corporation's generating facilities in Québec and a number of foreign facilities. It also sells electricity on external markets and engages in energy trading activities. In addition, it participates in the Québec wholesale market by responding to calls for tenders from Hydro-Québec Distribution.
Construction: Hydro-Québec Équipement and SEBJ provide engineering services and carry out construction projects in Québec and in other parts of the world.
Oil and Gas: Hydro-Québec Pétrole et gaz comprises all activities related to the pipeline transmission of oil, natural gas and liquid natural gas, as well as gas distribution. Activities arising from the Québec Oil and Gas Exploration Plan 2002-2010 are also included in this segment.
Corporate and Other Activities: Corporate and Other Activities includes corporate activities such as financial services, human resources, strategic planning and corporate affairs, as well as the activities of the Shared Services Centre, research and development, capital venturing and the commercialization of Hydro-Québec technologies.
The amounts presented for each segment are based on the financial information used to establish the consolidated financial statements. The accounting policies used to calculate these amounts are as described in note 1.
Intersegment transactions related to electricity sales are recorded based on the supply and transmission rates provided under the Act respecting the Régie de l'énergie. The Act sets a supply rate for a maximum annual volume of heritage pool electricity of 165 TWh for Québec markets. This volume was not reached in 2002.
60
In 2002, the Régie de l'énergie authorized Hydro-Québec TransÉnergie to modify its transmission rates retroactive to January 1, 2001. The new rates applied retroactive to 2001 were recorded in the 2001 fiscal year and affect intersegment revenue and, thus, the net income of the Generation, Transmission and Distribution segments. For fiscal 2001, the new rates increased net income by $58 million for the Transmission segment and $21 million for the Generation segment and decreased this item by $79 million for the Distribution segment.
Other intersegment products and services are valued at full cost.
The following tables contain information related to operations and assets by segment and certain geographical information:
SEGMENTS
| | 2002
|
|---|
| | Distribution
| | Transmission
| | Generation
| | Construction
| | Oil and Gas
| | Corporate and Other Activities
| | Intersegment(a)
| | Total
|
|---|
| | (in millions of dollars)
|
|---|
| Revenue | | | | | | | | | | | | | | | | | | | | | | | | |
| | External customers | | $ | 8,196 | | $ | 293 | | $ | 3,638 | | $ | 6 | | $ | 849 | | $ | 20 | | $ | — | | $ | 13,002 |
| | Intersegment | | $ | 36 | | $ | 2,734 | | $ | 4,260 | | $ | 1,111 | (b) | $ | — | | $ | 730 | | $ | (8,871 | ) | $ | — |
| Depreciation, amortization and decommissioning | | $ | 446 | | $ | 639 | | $ | 828 | | $ | 3 | | $ | 68 | | $ | 78 | | $ | — | | $ | 2,062 |
| Financial expenses | | $ | 499 | | $ | 1,062 | | $ | 1,345 | | $ | — | | $ | 85 | | $ | 53 | | $ | (1 | ) | $ | 3,043 |
| Net income (loss) | | $ | (399 | ) | $ | 389 | | $ | 1,556 | | $ | 1 | | $ | 35 | | $ | (56 | ) | $ | — | | $ | 1,526 |
| Capital expenditures (including intangibles) | | $ | 525 | | $ | 702 | | $ | 1,033 | | $ | 8 | | $ | 49 | | $ | 139 | | $ | — | | $ | 2,456 |
| Total assets | | $ | 9,755 | | $ | 18,259 | | $ | 24,583 | | $ | 251 | | $ | 1,771 | | $ | 975 | | $ | 3,484 | | $ | 59,078 |
|
|
2001
|
|---|
| | Distribution
| | Transmission
| | Generation
| | Construction
| | Oil and Gas
| | Corporate and Other Activities
| | Intersegment(a)
| | Total
|
|---|
| | (in millions of dollars)
|
|---|
| Revenue | | | | | | | | | | | | | | | | | | | | | | | | |
| | External customers | | $ | 7,934 | | $ | 301 | | $ | 3,218 | | $ | 7 | | $ | 1,066 | | $ | 52 | | $ | — | | $ | 12,578 |
| | Intersegment | | $ | 23 | | $ | 2,785 | | $ | 4,075 | | $ | 670 | (b) | $ | — | | $ | 730 | | $ | (8,283 | ) | $ | — |
| Depreciation, amortization and decommissioning | | $ | 429 | | $ | 578 | | $ | 671 | | $ | 5 | | $ | 71 | | $ | 91 | | $ | — | | $ | 1,845 |
| Financial expenses | | $ | 573 | | $ | 1,139 | | $ | 1,502 | | $ | — | | $ | 95 | | $ | 560 | | $ | (6 | ) | $ | 3,863 |
| Net income (loss) | | $ | (533 | ) | $ | 494 | | $ | 1,191 | | $ | (4 | ) | $ | 21 | | $ | (574 | ) | $ | — | | $ | 595 |
| Capital expenditures (including intangibles) | | $ | 483 | | $ | 548 | | $ | 664 | | $ | 1 | | $ | 41 | | $ | 73 | | $ | — | | $ | 1,810 |
| Total assets | | $ | 9,545 | | $ | 18,223 | | $ | 24,275 | | $ | 126 | | $ | 1,735 | | $ | 953 | | $ | 3,806 | | $ | 58,663 |
- (a)
- Includes assets related to long-term financing that have not been allocated to the operating segments.
- (b)
- Intersegment revenue generated by the Construction segment includes an amount of $963 million ($630 million in 2001) that corresponds to capital expenditures in respect of its clients segments.
61
GEOGRAPHICAL INFORMATION
| | 2002
| | 2001
|
|---|
| | Revenue
| | Fixed assets and goodwill
| | Revenue
| | Fixed assets and goodwill
|
|---|
| | (in millions of dollars)
|
|---|
| Québec | | $ | 9,041 | | $ | 47,772 | | $ | 9,051 | | $ | 47,399 |
| Canada, outside Québec | | | 362 | | | 2 | | | 140 | | | 2 |
| United States | | | 3,305 | | | 401 | | | 3,067 | | | 277 |
| Chile | | | 204 | | | 1,468 | | | 229 | | | 1,585 |
| Other countries | | | 90 | | | 353 | | | 91 | | | 352 |
| | |
| |
| |
| |
|
| | | $ | 13,002 | | $ | 49,996 | | $ | 12,578 | | $ | 49,615 |
| | |
| |
| |
| |
|
62
LONG-TERM DEBT BY ISSUE
The following table sets forth the non-consolidated long-term debt of Hydro-Québec outstanding as of December 31, 2002, expressed in Canadian dollars and in currency units:
| |
| |
| |
| | December 31, 2002
| |
|
|---|
Series
| | Interest Rate %
| |
| | Year of Maturity
| |
|
|---|
| | Year of Issue
| | Canadian Dollars
| | References*
|
|---|
| |
| |
| |
| | (in thousands)
| |
|
|---|
| Payable in Canadian Dollars | | | | | | | | | |
IE |
|
9.00 |
|
1992 |
|
2003 |
|
$ |
38,000 |
|
|
| JE | | 5.50 | | 97/98 | | 2003 | | | 676,785 | | |
| IM | | 7.00 | | 1994 | | 2004 | | | 1,000,000 | | |
| IR | | 8.50 | | 95/96 | | 2005 | | | 800,000 | | |
| JI | | Floating | | 2000 | | 2005 | | | 500,000 | | |
| FT2 | | 12.25 | | 85/88 | | 2006 | | | 203,000 | | |
| JA | | 7.00 | | 1996 | | 2007 | | | 745,046 | | |
| GO | | 9.75 | | 1987 | | 2007 | | | 15,000 | | (a)(d) |
| GZ | | 11.25 | | 1988 | | 2008 | | | 100,000 | | |
| GC2 | | 11.25 | | 1985 | | 2008 | | | 100,000 | | (b) |
| JH | | 6.00 | | 1999 | | 2009 | | | 500,000 | | |
| HN | | — | | 1990 | | 2010 | | | 125,309 | | |
| HF | | 10.00 | | 89/98 | | 2011 | | | 577,635 | | |
| JK | | 6.50 | | 2000/01 | | 2011 | | | 1,300,000 | | |
| GU2 | | 10.25 | | 87/90 | | 2012 | | | 1,117,000 | | |
| HG | | 10.00 | | 1989 | | 2019 | | | 100,000 | | |
| II | | 10.25 | | 1993 | | 2020 | | | 166,899 | | |
| HL | | 11.00 | | 90/91 | | 2020 | | | 1,110,000 | | |
| HM | | — | | 90/91 | | 2020 | | | 276,609 | | |
| HX | | 10.50 | | 1991 | | 2021 | | | 1,100,000 | | |
| IC | | 9.625 | | 92/95 | | 2022 | | | 1,950,000 | | |
| IH | | 11.00 | | 1993 | | 2031 | | | 229,821 | | |
| JG | | 6.00 | | 1999/2001 | | 2031 | | | 825,675 | | |
Medium-term notes issued under Canadian MTN program |
0001 |
|
7.50 |
|
1996 |
|
2003 |
|
|
22,000 |
|
|
| 0013 | | Floating | | 1998 | | 2003 | | | 50,000 | | (g) |
| 0025 | | 7.00 | | 1999 | | 2003 | | | 150,000 | | |
| 0027 | | Floating | | 2000 | | 2003 | | | 129,650 | | |
| 0005 | | 6.25 | | 1996 | | 2004 | | | 25,000 | | (h) |
| 0023 | | 5.50 | | 1999 | | 2004 | | | 15,000 | | |
| 0024 | | 7.00 | | 1999 | | 2004 | | | 110,000 | | |
| 0029 | | 6.00 | | 2000 | | 2004 | | | 20,000 | | |
| 0035 | | Floating | | 2001 | | 2004 | | | 292,000 | | |
| 0036 | | Floating | | 2001 | | 2004 | | | 50,000 | | |
| 0041 | | Floating | | 2001 | | 2004 | | | 45,000 | | |
| 0043 | | Floating | | 2001 | | 2004 | | | 75,000 | | |
| 0026 | | 6.50 | | 1999 | | 2005 | | | 20,000 | | |
| 0034 | | 6.00 | | 2001 | | 2005 | | | 135,000 | | |
| 0042 | | Floating | | 2001 | | 2005 | | | 15,000 | | |
| 0044 | | Floating | | 2001 | | 2005 | | | 105,000 | | |
| 0045 | | Floating | | 2002 | | 2005 | | | 20,000 | | |
63
| 0046 | | Floating | | 2002 | | 2005 | | | 25,000 | | |
| 0030 | | 6.20 | | 2000 | | 2006 | | | 205,000 | | |
| 0047 | | Floating | | 2002 | | 2006 | | | 636,400 | | |
| 0008 | | 5.50 | | 1998 | | 2008 | | | 10,000 | | |
| 0015 | | 5.75 | | 1998 | | 2008 | | | 55,000 | | |
| 0010 | | 6.00 | | 1998 | | 2010 | | | 15,000 | | |
| 0006 | | 7.00 | | 1997 | | 2012 | | | 15,000 | | |
| 0003 | | Various | | 1996 | | 2021 | | | 28,737 | | (i) |
| 0017 | | 6.50 | | 1999 | | 2029 | | | 75,000 | | |
| 0038 | | 6.00 | | 2001 | | 2031 | | | 4,325 | | |
| 0009 | | 6.50 | | 1998 | | 2035 | | | 686,500 | | |
| 0011 | | Various | | 1998 | | 2035 | | | 15,047 | | (l) |
| 0012 | | Various | | 1998 | | 2035 | | | 38,944 | | (m) |
| 0014 | | Various | | 1998 | | 2035 | | | 14,194 | | (j) |
| 0016 | | Various | | 1998 | | 2035 | | | 101,223 | | (k) |
| 0018 | | 6.50 | | 1999 | | 2035 | | | 1,294,000 | | |
| 0019 | | 6.00 | | 1999 | | 2040 | | | 270,500 | | |
| 0032 | | 6.00 | | 2000 | | 2050 | | | 50,000 | | |
| 0033 | | Various | | 2000 | | 2060 | | | 219,340 | | (o) |
| 0037 | | Various | | 2001 | | 2060 | | | 35,359 | | (p) |
| 0039 | | Various | | 2001 | | 2060 | | | 132,293 | | (q) |
| 0040 | | Various | | 2001 | | 2060 | | | 16,542 | | (r) |
| Opimiscow Agreement | | | 32,068 | | |
| Present value of lease obligations for regional offices and service facilities for a period not exceeding 25 years ending in 2010 | | | 35,007 | | |
| Others | | | 5,653 | | |
| Less: Sinking Funds Investments | | | (547,510 | ) | |
| | | | | | | | |
| | |
| Debt and swaps classified by currency of issue | | | 18,304,051 | | |
| Obligations under swaps | | | (526,027 | ) | |
| | | | | | | | |
| | |
| Debt and swaps classified by currency of repayment | | | 17,778,024 | | |
| | | | | | | | |
| | |
|
|
|
|
|
|
|
|
December 31, 2002
|
|
|
|---|
Series
| | Interest Rate %
| | Year of Issue
| | Year of Maturity
| | Canadian Dollars
| |
| | Currency Units
| | References*
|
|---|
| |
| |
| |
| | (in thousands)
| |
|
|---|
| Payable in U.S. Dollars | | | | | | | | | | | | | | |
IF1 |
|
7.375 |
|
1993 |
|
2003 |
|
$ |
789,800 |
|
|
|
US$ |
500,000 |
|
|
| IJ | | Floating | | 1993 | | 2005 | | | 315,920 | | | | | 200,000 | | |
| JL | | 6.30 | | 2001 | | 2011 | | | 1,184,700 | | | | | 750,000 | | |
| FU | | 11.75 | | 1985 | | 2012 | | | 315,920 | | | | | 200,000 | | (a) |
| IF2 | | 8.00 | | 1993 | | 2013 | | | 1,579,600 | | | | | 1,000,000 | | |
| IU | | 7.50 | | 1996 | | 2016 | | | 631,840 | | | | | 400,000 | | |
| GW | | 9.75 | | 1988 | | 2018 | | | 394,900 | | | | | 250,000 | | (c) |
| HS | | 9.40 | | 1991 | | 2021 | | | 1,421,640 | | | | | 900,000 | | |
| HY | | 8.40 | | 1992 | | 2022 | | | 1,579,600 | | | | | 1,000,000 | | |
| IO | | 8.05 | | 94/95 | | 2024 | | | 1,579,600 | | | | | 1,000,000 | | (e) |
| | | | | | | | | | | | | | | | | |
64
| GF | | 8.875 | | 1986 | | 2026 | | | 394,900 | | | | | 250,000 | | (a) |
| GH | | 8.25 | | 1986 | | 2026 | | | 394,900 | | | | | 250,000 | | (a) |
| GQ | | 8.25 | | 1987 | | 2027 | | | 394,900 | | | | | 250,000 | | |
| HE | | 8.625 | | 1989 | | 2029 | | | 394,900 | | | | | 250,000 | | |
| HH | | 8.50 | | 1989 | | 2029 | | | 789,800 | | | | | 500,000 | | |
| HK | | 9.375 | | 1990 | | 2030 | | | 789,800 | | | | | 500,000 | | |
| HQ | | 9.50 | | 1990 | | 2030 | | | 789,800 | | | | | 500,000 | | |
Medium-term notes issued under U.S. MTN program |
|
|
|
|
|
|
|
|
|
|
B-66 |
|
7.52 |
|
1992 |
|
2003 |
|
|
11,057 |
|
|
|
|
7,000 |
|
|
| B-67 | | 7.55 | | 1992 | | 2003 | | | 7,898 | | | | | 5,000 | | |
| B-68 | | 7.55 | | 1992 | | 2003 | | | 10,504 | | | | | 6,650 | | |
| B-69 | | 7.63 | | 1992 | | 2003 | | | 15,796 | | | | | 10,000 | | |
| B-70 | | 7.63 | | 1992 | | 2003 | | | 15,796 | | | | | 10,000 | | |
| B-71 | | 7.61 | | 1992 | | 2003 | | | 6,318 | | | | | 4,000 | | |
| B-72 | | 7.54 | | 1992 | | 2003 | | | 11,057 | | | | | 7,000 | | |
| B-73 | | 7.54 | | 1992 | | 2003 | | | 3,159 | | | | | 2,000 | | |
| B-74 | | 7.50 | | 1992 | | 2003 | | | 7,898 | | | | | 5,000 | | |
| B-75 | | 7.49 | | 1992 | | 2003 | | | 31,592 | | | | | 20,000 | | |
| B-107 | | 6.53 | | 1993 | | 2003 | | | 15,796 | | | | | 10,000 | | |
| B-113 | | 6.54 | | 1993 | | 2003 | | | 39,490 | | | | | 25,000 | | |
| B-114 | | 6.49 | | 1993 | | 2003 | | | 8,846 | | | | | 5,600 | | |
| B-115 | | 6.49 | | 1993 | | 2003 | | | 18,166 | | | | | 11,500 | | |
| B-116 | | 6.50 | | 1993 | | 2003 | | | 8,530 | | | | | 5,400 | | |
| B-117 | | 6.48 | | 1993 | | 2003 | | | 28,433 | | | | | 18,000 | | |
| B-84 | | 6.98 | | 1993 | | 2005 | | | 66,343 | | | | | 42,000 | | |
| B-85 | | 6.98 | | 1993 | | 2005 | | | 11,057 | | | | | 7,000 | | |
| B-86 | | 7.00 | | 1993 | | 2005 | | | 19,113 | | | | | 12,100 | | |
| B-87 | | 6.98 | | 1993 | | 2005 | | | 3,870 | | | | | 2,450 | | |
| B-88 | | 6.97 | | 1993 | | 2005 | | | 15,796 | | | | | 10,000 | | |
| B-89 | | 6.94 | | 1993 | | 2005 | | | 15,796 | | | | | 10,000 | | |
| B-90 | | 6.87 | | 1993 | | 2005 | | | 6,318 | | | | | 4,000 | | |
| B-91 | | 6.72 | | 1993 | | 2005 | | | 4,739 | | | | | 3,000 | | |
| B-92 | | 6.77 | | 1993 | | 2005 | | | 3,159 | | | | | 2,000 | | |
| B-93 | | 6.62 | | 1993 | | 2005 | | | 4,739 | | | | | 3,000 | | |
| B-94 | | 6.72 | | 1993 | | 2005 | | | 15,006 | | | | | 9,500 | | |
| B-95 | | 7.00 | | 1993 | | 2005 | | | 16,586 | | | | | 10,500 | | |
| B-96 | | 7.01 | | 1993 | | 2005 | | | 5,529 | | | | | 3,500 | | |
| B-96 | | 7.01 | | 1993 | | 2005 | | | 1,580 | | | | | 1,000 | | |
| B-97 | | 7.02 | | 1993 | | 2005 | | | 39,490 | | | | | 25,000 | | |
| B-98 | | 6.85 | | 1993 | | 2005 | | | 7,898 | | | | | 5,000 | | |
| B-99 | | 6.82 | | 1993 | | 2005 | | | 7,898 | | | | | 5,000 | | |
| B-100 | | 6.86 | | 1993 | | 2005 | | | 39,490 | | | | | 25,000 | | |
| B-101 | | 6.99 | | 1993 | | 2005 | | | 7,898 | | | | | 5,000 | | |
| B-102 | | 6.94 | | 1993 | | 2005 | | | 4,739 | | | | | 3,000 | | |
| B-103 | | 6.92 | | 1993 | | 2005 | | | 3,159 | | | | | 2,000 | | |
| B-104 | | 7.01 | | 1993 | | 2005 | | | 7,898 | | | | | 5,000 | | |
65
| B-105 | | 7.00 | | 1993 | | 2005 | | | 15,796 | | | | | 10,000 | | |
| B-106 | | 7.00 | | 1993 | | 2005 | | | 4,739 | | | | | 3,000 | | |
| B-118 | | 6.52 | | 1994 | | 2006 | | | 78,980 | | | | | 50,000 | | |
| B-119 | | 6.52 | | 1994 | | 2006 | | | 31,592 | | | | | 20,000 | | |
| B-120 | | 6.49 | | 1994 | | 2006 | | | 39,490 | | | | | 25,000 | | |
| B-121 | | 6.49 | | 1994 | | 2006 | | | 7,898 | | | | | 5,000 | | |
| B-122 | | 6.51 | | 1994 | | 2006 | | | 1,580 | | | | | 1,000 | | |
| B-129 | | 6.75 | | 1997 | | 2007 | | | 126,368 | | | | | 80,000 | | |
| B-123 | | 9.125 | | 1994 | | 2009 | | | 39,490 | | | | | 25,000 | | |
| B-126 | | 7.58 | | 1995 | | 2010 | | | 23,694 | | | | | 15,000 | | |
| B-30 | | 8.62 | | 1991 | | 2011 | | | 63,184 | | | | | 40,000 | | |
| B-37 | | 8.54 | | 1991 | | 2011 | | | 31,592 | | | | | 20,000 | | |
| B-7 | | 9.40 | | 1990 | | 2020 | | | 15,796 | | | | | 10,000 | | |
| B-48 | | 8.68 | | 1991 | | 2021 | | | 78,980 | | | | | 50,000 | | |
| B-49 | | 9.80 | | 1992 | | 2022 | | | 78,980 | | | | | 50,000 | | |
| B-64 | | 9.75 | | 1992 | | 2022 | | �� | 31,592 | | | | | 20,000 | | |
| B-124 | | 8.91 | | 1994 | | 2024 | | | 39,490 | | | | | 25,000 | | |
| B-125 | | 8.40 | | 1995 | | 2025 | | | 86,878 | | | | | 55,000 | | |
| B-127 | | 6.27 | | 1996 | | 2026 | | | 78,980 | | | | | 50,000 | | (n) |
| B-63 | | 9.50 | | 1992 | | 2027 | | | 31,592 | | | | | 20,000 | | |
| B-130 | | 6.625 | | 1998 | | 2028 | | | 78,980 | | | | | 50,000 | | |
Medium-term note issued under Euro MTN program |
|
|
|
|
|
|
|
|
|
|
35 |
|
7.01 |
|
1997 |
|
2007 |
|
|
473,880 |
|
|
|
|
300,000 |
|
|
| Conditional sale transaction (Turbines) | | | 123,389 | | | | | 78,114 | | |
| | | | | | | | |
| | | |
| | |
| Long-term debt before swaps | | | 15,873,897 | | (1) | | | 10,049,314 | | |
| Net currency swaps(2) | | | 146,993 | | | | | — | | |
| Less Sinking Fund Investments | | | (80,753 | ) | | | | (42,000 | ) | |
| | | | | | | | |
| | | |
| | |
| Debt and swaps classified by currency of issue | | | 15,940,137 | | | | US$ | 10,007,314 | | |
| | | | | | | | |
| | | |
| | |
| Debt and swaps classified by currency of repayment | | | 19,220,873 | | | | US$ | 12,168,209 | | |
| | | | | | | | |
| | | |
| | |
Payable in Euro |
|
|
|
|
|
|
|
|
|
|
|
|
|
|
IT |
|
Floating |
|
1996 |
|
2006 |
|
$ |
89,585 |
|
|
|
€ |
54,084 |
|
|
| D15B | | 6.00 | | 1986 | | 2016 | | | 100,260 | | | | | 60,529 | | (a) |
Medium-term notes issued under Euro MTN program |
|
|
|
|
|
|
|
|
|
|
33 |
|
5.875 |
|
1997 |
|
2008 |
|
|
378,776 |
|
|
|
|
228,674 |
|
|
| 36 | | 5.375 | | 1998 | | 2008 | | | 635,178 | | | | | 383,469 | | |
| | | | | | | | |
| | | |
| | |
| Long-term debt before swaps | | | 1,203,799 | | (1) | | | 726,756 | | |
| Net currency swaps(2) | | | 56,580 | | | | | — | | |
| | | | | | | | |
| | | |
| | |
| Debt and swaps classified by currency of issue | | | 1,260,379 | | | | € | 726,756 | | |
| | | | | | | | |
| | | |
| | |
| Debt and swaps classified by currency of repayment | | | — | | | | € | — | | |
| | | | | | | | |
| | | |
| | |
66
Payable in Japanese Yen |
|
|
|
|
|
|
|
|
|
|
|
|
|
|
J6 |
|
Floating |
|
1995 |
|
2005 |
|
$ |
66,510 |
|
|
|
|
¥5,000,000 |
|
|
Medium-term notes issued under Euro MTN program |
|
|
|
|
|
|
|
|
|
|
17 |
|
3.05 |
|
1995 |
|
2003 |
|
|
26,604 |
|
|
|
|
2,000,000 |
|
|
| 22 | | 3.265 | | 1996 | | 2003 | | | 66,510 | | | | | 5,000,000 | | |
| 16 | | 3.00 | | 1995 | | 2004 | | | 39,906 | | | | | 3,000,000 | | |
| 11 | | 4.00 | | 1995 | | 2005 | | | 17,293 | | | | | 1,300,000 | | |
| 15 | | 4.10 | | 1995 | | 2005 | | | 14,632 | | | | | 1,100,000 | | |
| 18 | | 4.30 | | 1995 | | 2005 | | | 19,953 | | | | | 1,500,000 | | |
| 19 | | 4.00 | | 1995 | | 2005 | | | 26,604 | | | | | 2,000,000 | | |
| 21 | | 4.40 | | 1996 | | 2006 | | | 133,020 | | | | | 10,000,000 | | |
| 23 | | 4.17 | | 1996 | | 2006 | | | 46,557 | | | | | 3,500,000 | | |
| 24 | | 4.02 | | 1996 | | 2006 | | | 15,962 | | | | | 1,200,000 | | |
| 25 | | 4.00 | | 1996 | | 2006 | | | 13,302 | | | | | 1,000,000 | | |
| 26 | | 3.90 | | 1996 | | 2006 | | | 39,906 | | | | | 3,000,000 | | |
| 27 | | 3.90 | | 1996 | | 2006 | | | 13,302 | | | | | 1,000,000 | | |
| 28 | | 3.70 | | 1996 | | 2006 | | | 18,623 | | | | | 1,400,000 | | |
| 29 | | 3.10 | | 1997 | | 2007 | | | 13,302 | | | | | 1,000,000 | | |
| 30 | | 3.15 | | 1997 | | 2007 | | | 13,302 | | | | | 1,000,000 | | |
| 38 | | 2.50 | | 1999 | | 2009 | | | 6,651 | | | | | 500,000 | | |
| 32 | | 4.40 | | 1997 | | 2012 | | | 13,302 | | | | | 1,000,000 | | |
| 34 | | 4.85 | | 1997 | | 2017 | | | 13,302 | | | | | 1,000,000 | | |
| | | | | | | | |
| | | |
| | |
| Long-term debt before swaps | | | 618,543 | | (1) | | | 46,500,000 | | |
| Net currency swaps(2) | | | 17,967 | | | | | — | | |
| | | | | | | | |
| | | |
| | |
| Debt and swaps classified by currency of issue | | | 636,510 | | | | ¥ | 46,500,000 | | |
| | | | | | | | |
| | | |
| | |
| Debt and swaps classified by currency of repayment | | | — | | | | ¥ | — | | |
| | | | | | | | |
| | | |
| | |
| Payable in Swiss Francs | | | | | | | | | | | | | | |
Medium-term note issued under Euro MTN program |
|
|
|
|
|
|
|
|
|
|
37 |
|
3.60 |
|
1998 |
|
2008 |
|
$ |
110,203 |
|
|
|
SF |
96,500 |
|
|
| | | | | | | | |
| | | |
| | |
| Long-term debt before swaps | | | 110,203 | | (1) | | | 96,500 | | |
| Net currency swaps(2) | | | (14,709 | ) | | | | — | | |
| | | | | | | | |
| | | |
| | |
| Debt and swaps classified by currency of issue | | | 95,494 | | | | SF | 96,500 | | |
| | | | | | | | |
| | | |
| | |
| Debt and swaps classified by currency of repayment | | | — | | | | SF | — | | |
| | | | | | | | |
| | | |
| | |
Payable in Pounds Sterling |
|
|
|
|
|
|
|
|
|
|
|
|
|
|
FH |
|
13.24 |
|
1983 |
|
2003 |
|
$ |
152,568 |
|
|
|
£ |
60,000 |
|
|
| EG | | 15.00 | | 1981 | | 2011 | | | 101,712 | | | | | 40,000 | | |
| HI | | 12.625 | | 1990 | | 2015 | | | 381,420 | | | | | 150,000 | | (f) |
| FA | | 12.75 | | 1982 | | 2015 | | | 127,140 | | | | | 50,000 | | |
| | | | | | | | |
| | | |
| | |
| Long-term debt before swaps | | | 762,840 | | (1) | | | 300,000 | | |
| Net currency swaps(2) | | | (514 | ) | | | | — | | |
| | | | | | | | |
| | | |
| | |
67
| Debt and swaps classified by currency of issue | | | 762,326 | | | | £ | 300,000 | | |
| | | | | | | | |
| | | |
| | |
| Debt and swaps classified by currency of repayment | | | — | | | | £ | — | | |
| | | | | | | | |
| | | |
| | |
| Total Long-Term Debt | | $ | 36,998,897 | | | | | | | |
| | | | | | | | |
| | | | | | | |
- (1)
- Translated at rates in effect at December 31, 2002.
- (2)
- Difference between the rate established under swaps and the rate at December 31, 2002 applied on the portion of the debt covered by swaps.
- (a)
- Sinking-fund debentures.
- (b)
- Redeemable at par at the option of Hydro-Québec at any time from September 25, 2003.
- (c)
- Redeemable at par at the option of Hydro-Québec at any time from January 15, 2003.
- (d)
- Redeemable at par in annual installments for sinking fund purposes one year after the date of issue.
- (e)
- Redeemable at par at the option of the Holder in whole, or in part, on July 7, 2006.
- (f)
- Redeemable anytime at the highest of par or adjusted price as per the Fiscal Agency Agreement at the option of Hydro-Québec.
- (g)
- A payment of Index Return on July 4, 2003 based on the return of the DS Barra Government Bond Index plus 40 basis points compounded annually at Index flat. Extendible at the option of Hydro-Québec to July 4, 2011 bearing fixed interest rate.
- (h)
- Extendible at par, at their maturity date, at the option of the Holder, to November 7, 2024 bearing interest at 7.5%.
- (i)
- Aggregate principal amount of $88 million sold at deep discount maturing semi-annually from February 15, 2011 to August 15, 2021 in equal payments.
- (j)
- Aggregate principal amount of $73.5 million sold at deep discount maturing semi-annually from January 16, 2025 to July 16, 2035 in various payment amounts.
- (k)
- Interest coupons of $3 million semi-annually from January 16, 1999 to January 16, 2014. Interest coupons of $5.525 million semi-annually from July 16, 2024 to January 16, 2035.
- (l)
- Fixed coupon amounts of $1.6 million semi-annually from January 16, 2022.
- (m)
- Fixed rate coupon of 6.5% semi-annually commencing on January 16, 2026.
- (n)
- Redeemable at par at the option of the Holder on January 3, 2003.
- (o)
- No interest payment until February 15, 2030 exclusive. Fixed rate coupon of 45% semi-annually commencing on February 15, 2030.
- (p)
- No interest payment until February 15, 2041 exclusive. Interest coupons of $50 million annually from February 15, 2041 to February 15, 2045. Interest coupons of $35 million annually from February 15, 2046 to February 15, 2050. Interest coupons of $20 million annually from February 15, 2051 to February 15, 2055. Interest coupons of $10 million annually from February 15, 2056 to February 15, 2059.
- (q)
- No interest payment until February 15, 2040 exclusive. Fixed rate coupon of 100% semi-annually commencing on February 15, 2040.
- (r)
- No interest payment until February 15, 2050 exclusive. Interest coupons of $45 million annually from February 15, 2050 to February 15, 2052. Interest coupons of $40 million annually from February 15, 2053 to February 15, 2055. Interest coupons of $35 million annually from February 15, 2056 to February 15, 2058. Interest coupon of $30 million on February 15, 2059.
- *
- Not redeemable unless otherwise specified.
68
Exhibit (e)
INDEPENDENT AUDITORS' CONSENT
We hereby consent to the inclusion of our report dated February 20, 2003 concerning the Consolidated Financial Statements for each of the years in the five-year period ended December 31, 2002 in the annual report on Form 18-K of Hydro-Québec for the year ended December 31, 2002 and to the incorporation by reference in the Registration Statement No. 33-76074.
| |
|
|---|
Samson Bélair/Deloitte & Touche
Chartered Accountants
Montréal, Québec | | PricewaterhouseCoopers LLP
Chartered Accountants
Montréal, Québec |
May 7, 2003
69
QuickLinks
SIGNATUREEXHIBIT INDEXTABLE OF CONTENTSFOREIGN EXCHANGESUMMARYHYDRO-QUÉBECINTERCONNECTIONS WITH NEIGHBORING SYSTEMS OUTSIDE QUÉBECGENERATION FACILITIES IN SERVICE IN QUÉBEC(1)PRINCIPAL ENERGY EXPORT AGREEMENTSELECTRICITY SALES AND REVENUE OUTSIDE QUÉBECCAPITAL INVESTMENT PROGRAMDISTRIBUTION SEGMENTTRANSMISSION SEGMENTGENERATION SEGMENTSEGMENT RESULTS FOR 2002ELECTRICITY SALES IN QUÉBEC, BY CATEGORYAUDITORS' REPORTHYDRO-QUÉBEC NOTES TO CONSOLIDATED FINANCIAL STATEMENTSLONG-TERM DEBT BY ISSUEINDEPENDENT AUDITORS' CONSENT