Washington, D.C. 20549
P.O. Box 7650, One Market, Steuart Tower
Here are the average annual total returns on a $1,000 investment with all distributions reinvested for periods ended December 31, 2012 (the most recent calendar quarter-end):
The total annual fund operating expense ratio was 0.59% for Class A shares as of the prospectus dated October 1, 2012.
Investment results assume all distributions are reinvested and reflect applicable fees and expenses. When applicable, investment results reflect fee waivers, without which results would have been lower. Visit americanfunds.com for more information.
Results for other share classes can be found on page 41.
The return of principal for bond funds and for funds with significant underlying bond holdings is not guaranteed. Fund shares are subject to the same interest rate, inflation and credit risks associated with the underlying bond holdings. High-yield bonds are subject to greater fluctuations in value and risk of loss of income and principal than investment-grade bonds. Bond ratings, which typically range from Aaa/AAA (highest) to D (lowest), are assigned by credit rating agencies such as Moody’s, Standard & Poor’s and/or Fitch as an indication of an issuer’s creditworthiness. Investing outside the United States may be subject to additional risks, such as currency fluctuations, periods of illiquidity and price volatility. These risks may be heightened in connection with investments in developing countries. Refer to the fund prospectus and the Risk Factors section of this report for more information on these and other risks associated with investing in the fund.
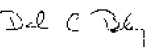
For the six months ended January 31, 2013, The Income Fund of America (IFA) gained 7.6% for those who reinvested dividends paid during the period totaling 35 cents a share.
Though the fund’s return trailed that of the unmanaged Standard & Poor’s 500 Composite Index, which gained 9.9%, it finished well ahead of the –0.3% return posted by the unmanaged Barclays U.S. Aggregate Index, a measure of the U.S. bond market.
The fund also meaningfully outpaced its income-fund peers as gauged by the Lipper Income Funds Index, which gained 5.5%. In addition, as noted in the table on page 5, IFA holds a meaningful advantage over this benchmark for most of the time periods shown.
The period saw global stock markets moving steadily upward on a combination of moves by central bankers to boost liquidity and signs of a continuing U.S. recovery — particularly in the housing sector. The U.S. market stalled in the final quarter of calendar year 2012 as investors were kept on edge by worries over decelerating Chinese growth, a moderating outlook for corporate profitability and the lack of resolution over the American fiscal-cliff
situation. However, the new year saw it come back to life as fiscal reform in the U.S., a strong start to the corporate earnings season and signs of healing in the European banking system lifted investor sentiment.
Generally favorable economic news meant more economically sensitive sectors such as financials, consumer discretionary, industrials and materials posted the strongest returns. In general, stock returns for utilities and telecommunication services companies were negative over the six months.
Beyond the sector trends visible within the broader market, there were few identifiable themes within IFA’s portfolio. One exception was the strong results turned in by a number of companies connected to the housing market. These included building products manufacturer Masco (52.9%), Weyerhaeuser (29.0%), top-10 holding Home Depot (28.2%) and steelmaker Nucor (17.4%).
Other key contributors came from a range of industries. They included New Zealand building products manufacturer Fletcher Building (61.5%), asset management firm BlackRock (38.8%), Schneider Electric (34.5%), Time Warner (29.1%) and publisher McGraw-Hill (22.5%).
Fund results were supported by investments throughout IFA’s broad-based portfolio —important during a period when returns for its 10 largest holdings were generally more muted. Though many of the investments have been solid long-term contributors to the fund, the only top-10 holding other than Home Depot to outpace the broader market was Pfizer (13.5%). That said, General Electric (7.4%), Chevron (5.1%), Royal Dutch Shell (3.2%) and Bristol-Myers Squibb (1.5%) all finished in positive territory; DuPont (–4.5%), Verizon (–3.4%), Merck (–2.1%) and health care real-estate investment trust (REIT) HCP (–1.7%) all declined.
With income as its primary objective, the fund continues to maintain sizable investments in bonds. As of period-end, 25.0% of assets were in fixed-income securities. The strongest results within this asset class came from high-yield issues which, as a group, appreciated significantly as they often do during periods of relative economic optimism. Given the low interest rate environment, higher quality fixed-income securities such as U.S. Treasuries were a drag on results. Despite this, we continue to value the stability they bring to IFA’s portfolio.
We found opportunity among select pharmaceutical companies, which led us to increase our investments in this area. We believe we have a solid grasp of their patent expiry challenges and see reason for optimism in the drug pipelines of many. In addition, their valuations and yields are both attractive. We likewise found appealing investments among cyclical companies that we believe have solid total-return potential.
Reductions were made among some of the fund’s European telecommunications companies whose dividends had come under pressure amid the fiscal austerity being promoted in the European Union. Finding attractive opportunities elsewhere, we also pared some of our holdings among food and tobacco companies, which had been productive investments but were trading near the upper end of their historical valuations.
Another holding we reduced was Home Depot, which had been an excellent contributor during this and other recent reporting periods. A review of the investment’s history and our decision to reduce our position in it illustrates a pattern that has been repeated throughout the fund’s lifetime and has been central to IFA’s success. We began building a position in the company several years ago. Back then, it was struggling, a fact reflected in its low valuation but also in its high dividend yield. Both facts drew our attention and, through intensive research, we developed conviction that, over a multi-year period, the firm’s new management team would do the painstaking work necessary to improve the enterprise.
It was also our view that, even in the face of a challenging housing market, the company’s initiatives could translate into a higher stock price. Furthermore, we believed that a pickup in housing could put more wind into the company’s sails. Both possibilities were realized and the investment paid off well for the fund. Yet as the share price rose, the yield fell back in line with that of the broader market, making the investment less compatible with IFA’s primary objective — income. Our decision to reduce the holding does not speak to a loss of conviction in the company but rather demonstrates the kind of disciplined commitment to the fund’s income objective that we have practiced over its lifetime.
We continue to be cautiously optimistic. In the U.S., the prospect of greater energy independence, the return of some industrial production, improving employment figures and strengthening consumer confidence brighten our outlook. Yet our recognition that Europe remains bedeviled by meaningful challenges tempers that view. In this climate, we’ll continue to perform the fundamental research necessary to uncover opportunities for the fund.
We thank you for your continuing commitment to long-term investing.
The indexes are unmanaged and, therefore, have no expenses.
All numbers calculated by Lipper. The 12-month dividend rate is calculated by taking the total of the trailing 12 months’ dividends and dividing the month-end net asset value adjusted for capital gains.
The following summary investment portfolio is designed to streamline the report and help investors better focus on the fund’s principal holdings. See the inside back cover for details on how to obtain a complete schedule of portfolio holdings.
As permitted by U.S. Securities and Exchange Commission regulations, “Miscellaneous” securities include holdings in their first year of acquisition that have not previously been publicly disclosed.
“Other securities” includes all issues that are not disclosed separately in the summary investment portfolio, including securities which were valued under fair value procedures adopted by authority of the board of trustees. The total value of all such securities was $64,622,000, which represented .08% of the net assets of the fund. One of these securities (with a value of $12,877,000, a cost of $24,618,000, and which represented .02% of the net assets of the fund) was acquired from 9/17/2009 to 9/9/2011 through private placement transactions exempt from registration under the Securities Act of 1933, which may subject it to legal or contractual restrictions on resale.
A company is considered to be an affiliate of the fund under the Investment Company Act of 1940 if the fund’s holdings in that company represent 5% or more of the outstanding voting shares. The value of the fund’s affiliated-company holdings is either shown in the summary investment portfolio or included in the value of “Other securities” under the respective industry sectors. Further details on such holdings and related transactions during the six months ended January 31, 2013, appear below.
The following footnotes apply to either the individual securities noted or one or more of the securities aggregated and listed as a single line item.
*Additional information related to class-specific fees and expenses is included in the Notes to Financial Statements.
*Unaudited.
The Income Fund of America (the “fund”) is registered under the Investment Company Act of 1940 as an open-end, diversified management investment company. The fund seeks current income while secondarily striving for capital growth through investments in stocks and fixed-income securities.
The fund has 16 share classes consisting of five retail share classes (Classes A, B and C, as well as two F share classes, F-1 and F-2), five 529 college savings plan share classes (Classes 529-A, 529-B, 529-C, 529-E and 529-F-1) and six retirement plan share classes (Classes R-1, R-2, R-3, R-4, R-5 and R-6). The 529 college savings plan share classes can be used to save for college education. The retirement plan share classes are generally offered only through eligible employer-sponsored retirement plans. The fund’s share classes are further described below:
* Class B and 529-B shares of the fund are not available for purchase.
Holders of all share classes have equal pro rata rights to assets, dividends and liquidation proceeds. Each share class has identical voting rights, except for the exclusive right to vote on matters affecting only its class. Share classes have different fees and expenses (“class-specific fees and expenses”), primarily due to different arrangements for distribution, administrative and shareholder services. Differences in class-specific fees and expenses will result in differences in net investment income and, therefore, the payment of different per-share dividends by each class.
The financial statements have been prepared to comply with accounting principles generally accepted in the United States of America. These principles require management to make estimates and assumptions that affect reported amounts and disclosures. Actual results could differ from those estimates. The fund follows the significant accounting policies described below, as well as the valuation policies described in the next section on valuation.
Capital Research and Management Company (“CRMC”), the fund’s investment adviser, values the fund’s investments at fair value as defined by accounting principles generally accepted in the United States of America. The net asset value of each share class of the fund is generally determined as of approximately 4:00 p.m. New York time each day the New York Stock Exchange is open.
Equity securities are generally valued at the official closing price of, or the last reported sale price on, the exchange or market on which such securities are traded, as of the close of business on the day the securities are being valued or, lacking any sales, at the last available bid price. Prices for each security are taken from the principal exchange or market on which the security trades.
Fixed-income securities, including short-term securities purchased with more than 60 days left to maturity, are generally valued at prices obtained from one or more pricing vendors. Vendors value such securities based on one or more of the inputs described in the following table. The table provides examples of inputs that are commonly relevant for valuing particular classes of fixed-income securities in which the fund is authorized to invest. However, these classifications are not exclusive, and any of the inputs may be used to value any other class of fixed-income security.
When the fund’s investment adviser deems it appropriate to do so (such as when vendor prices are unavailable or not deemed to be representative), fixed-income securities will be valued in good faith at the mean quoted bid and ask prices that are reasonably and timely available (or bid prices, if ask prices are not available) or at prices for securities of comparable maturity, quality and type.
Securities with both fixed-income and equity characteristics, or equity securities traded principally among fixed-income dealers, are generally valued in the manner described above for either equity or fixed-income securities, depending on which method is deemed most appropriate by the fund’s investment adviser. Short-term securities purchased within
60 days to maturity are valued at amortized cost, which approximates fair value. The value of short-term securities originally purchased with maturities greater than 60 days is determined based on an amortized value to par when they reach 60 days.
Securities and other assets for which representative market quotations are not readily available or are considered unreliable by the fund’s investment adviser are fair valued as determined in good faith under fair value guidelines adopted by authority of the fund’s board of trustees as further described below. The investment adviser follows fair valuation guidelines, consistent with U.S. Securities and Exchange Commission rules and guidance, to consider relevant principles and factors when making fair value determinations. The investment adviser considers relevant indications of value that are reasonably and timely available to it in determining the fair value to be assigned to a particular security, such as the type and cost of the security; contractual or legal restrictions on resale of the security; relevant financial or business developments of the issuer; actively traded similar or related securities; conversion or exchange rights on the security; related corporate actions; significant events occurring after the close of trading in the security; and changes in overall market conditions. In addition, the closing prices of equity securities that trade in markets outside U.S. time zones may be adjusted to reflect significant events that occur after the close of local trading but before the net asset value of each share class of the fund is determined. Fair valuations and valuations of investments that are not actively trading involve judgment and may differ materially from valuations that would have been used had greater market activity occurred.
The fund’s investment adviser has also established a Fixed-Income Pricing Review Group to administer and oversee the fixed-income valuation process, including the use of fixed-income pricing vendors. This group regularly reviews pricing vendor information and market data. Pricing decisions, processes and controls over security valuation are also subject to additional internal reviews, including an annual control self-evaluation program facilitated by the investment adviser’s compliance group.
Investing in the fund may involve certain risks including, but not limited to, those described below.
Bonds and other debt securities are subject to credit risk, which is the possibility that the credit strength of an issuer will weaken and/or an issuer of a debt security will fail to make timely payments of principal or interest and the security will go into default.
As of and during the period ended January 31, 2013, the fund did not have a liability for any unrecognized tax benefits. The fund recognizes interest and penalties, if any, related to unrecognized tax benefits as income tax expense in the statement of operations. During the period, the fund did not incur any interest or penalties.
The fund is not subject to examination by U.S. federal tax authorities for tax years before 2008 and by state tax authorities for tax years before 2007.
Under the Regulated Investment Company Modernization Act of 2010 (the “Act”), net capital losses recognized after July 31, 2011, may be carried forward indefinitely, and their character is retained as short-term and/or long-term losses. Previously, net capital losses were carried forward for eight years and treated as short-term losses. As a transition rule, the Act requires that post-enactment net capital losses be used before pre-enactment net capital losses.
As of January 31, 2013, the tax basis unrealized appreciation (depreciation) and cost of investment securities were as follows (dollars in thousands):
Tax-basis distributions paid to shareholders from ordinary income were as follows (dollars in thousands):
CRMC, the fund’s investment adviser, is the parent company of American Funds Distributors,® Inc. (“AFD”), the principal underwriter of the fund’s shares, and American Funds Service Company® (“AFS”), the fund’s transfer agent. CRMC, AFD and AFS are considered related parties to the fund.
Capital share transactions in the fund were as follows (dollars and shares in thousands):
*Includes exchanges between share classes of the fund.
The fund made purchases and sales of investment securities, excluding short-term securities and U.S. government obligations, if any, of $15,735,122,000 and $14,914,095,000, respectively, during the six months ended January 31, 2013.
See page 35 for footnotes.
See page 35 for footnotes.
As a shareholder of the fund, you incur two types of costs: (1) transaction costs, such as initial sales charges on purchase payments and contingent deferred sales charges on redemptions (loads), and (2) ongoing costs, including management fees, distribution and service (12b-1) fees, and other expenses. This example is intended to help you understand your ongoing costs (in dollars) of investing in the fund so you can compare these costs with the ongoing costs of investing in other mutual funds. The example is based on an investment of $1,000 invested at the beginning of the period and held for the entire six- month period (August 1, 2012, through January 31, 2013).
The first line of each share class in the table on the next page provides information about actual account values and actual expenses. You may use the information in this line, together with the amount you invested, to estimate the expenses that you paid over the period. Simply divide your account value by $1,000 (for example, an $8,600 account value divided by $1,000 = 8.6), then multiply the result by the number in the first line under the heading entitled “Expenses paid during period” to estimate the expenses you paid on your account during this period.
The second line of each share class in the table on the next page provides information about hypothetical account values and hypothetical expenses based on the actual expense ratio for the share class and an assumed rate of return of 5.00% per year before expenses, which is not the actual return of the share class. The hypothetical account values and expenses may not be used to estimate the actual ending account balance or expenses you paid for the period. You may use this information to compare the ongoing costs of investing in the fund and other funds. To do so, compare this 5.00% hypothetical example with the 5.00% hypothetical examples that appear in the shareholder reports of the other funds.
There are some account fees that are charged to certain types of accounts, such as individual retirement accounts and 529 college savings plan accounts (generally, a $10 fee is charged to set up the account and an additional $10 fee is charged to the account annually), that would increase the amount of expenses paid on your account. In addition, retirement plan participants may be subject to certain fees charged by the plan sponsor, and Class F-1, F-2 and 529-F-1 shareholders may be subject to fees charged by financial intermediaries, typically ranging from 0.75% to 1.50% of assets annually depending on services offered. You can estimate the impact of these fees by adding the amount of the fees to the total estimated expenses you paid on your account during the period as calculated above. In addition, your ending account value would be lower by the amount of these fees.
Note that the expenses shown in the table are meant to highlight your ongoing costs only and do not reflect any transactional costs, such as sales charges (loads). Therefore, the second line of each share class in the table is useful in comparing ongoing costs only and will not help you determine the relative total costs of owning different funds. In addition, if these transactional costs were included, your costs would have been higher.
The fund’s board has approved the fund’s Investment Advisory and Service Agreement (the “agreement”) with Capital Research and Management Company (“CRMC”) for an additional one-year term through December 31, 2013. The board approved the agreement following the recommendation of the fund’s Contracts Committee (the “committee”), which is composed of all of the fund’s independent board members. The board and the committee determined that the fund’s advisory fee structure was fair and reasonable in relation to the services provided and that approving the agreement was in the best interests of the fund and its shareholders.
In reaching this decision, the board and the committee took into account information furnished to them throughout the year, as well as information prepared specifically in connection with their review of the agreement, and were advised by their independent counsel. They considered the factors discussed below, among others, but did not identify any single issue or particular piece of information that, in isolation, was the controlling factor.
The board and the committee considered the depth and quality of CRMC’s investment management process, including its global research capabilities; the experience, capability and integrity of its senior management and other personnel; the low turnover rates of its key personnel; the overall financial strength and stability of its organization; and the ongoing evolution of CRMC’s organizational structure designed to maintain and strengthen these qualities. The board and the committee also considered the nature, extent and quality of administrative, compliance and shareholder services provided by CRMC to the fund under the agreement and other agreements, as well as the benefits to fund shareholders from investing in a fund that is part of a large family of funds. The board and the committee concluded that the nature, extent and quality of the services provided by CRMC have benefited and should continue to benefit the fund and its shareholders.
The board and the committee considered the investment results of the fund in light of its objectives of providing current income and, secondarily, growth of capital. They compared the fund’s total returns with those of other relevant funds (including the other funds that are the basis of the Lipper index for the category in which the fund is included) and market data such as relevant market indices, in each case as available at the time of the related board and committee meetings. This report, including the letter to shareholders and related disclosures, contains certain information about the fund’s investment results. The board
and the committee concluded that the fund’s long-term results have been satisfactory and that CRMC’s record in managing the fund indicated that its continued management should benefit the fund and its shareholders.
The board and the committee compared the advisory fees and total expense levels of the fund to those of other relevant funds. They observed that the fund’s advisory fees and expenses remain significantly below those of most other relevant funds. The board and the committee also noted the breakpoint discounts in the fund’s advisory fee structure that reduce the level of fees charged by CRMC to the fund as fund assets increase. In addition, they reviewed information regarding the advisory fees paid by clients of an affiliate of CRMC. They noted that, to the extent there were differences between the advisory fees paid by the fund and the advisory fees paid by those clients, the differences appropriately reflected the investment, operational and regulatory differences between advising the fund and the other clients. The board and the committee concluded that the fund’s cost structure was fair and reasonable in relation to the services provided, and that the shareholders receive reasonable value in return for the advisory fees and other amounts paid to CRMC by the fund.
The board and the committee considered a variety of other benefits received by CRMC and its affiliates as a result of CRMC’s relationship with the fund and the other American Funds, including fees for administrative services provided to certain share classes; fees paid to CRMC’s affiliated transfer agent; sales charges and distribution fees received and retained by the fund’s principal underwriter, an affiliate of CRMC; and possible ancillary benefits to CRMC’s institutional management affiliates. The board and the committee reviewed CRMC’s portfolio trading practices, noting that while CRMC receives the benefit of research provided by broker-dealers executing portfolio transactions on behalf of the fund, it does not obtain third-party research or other services in return for allocating brokerage to such broker-dealers. The board and the committee took these ancillary benefits into account in evaluating the reasonableness of the advisory fees and other amounts paid to CRMC by the fund.
The board and the committee reviewed information regarding CRMC’s costs of providing services to the American Funds, including personnel, systems and resources of investment, compliance, trading, accounting and other administrative operations. They
considered CRMC’s costs and willingness to invest in technology, infrastructure and staff to maintain and expand services and capabilities, respond to industry and regulatory developments, and attract and retain qualified personnel. They noted information regarding the compensation structure for CRMC’s investment professionals. The board and the committee also compared CRMC’s profitability to the reported results of several large, publicly held investment management companies. The board and the committee noted the competitiveness and cyclicality of both the mutual fund industry and the capital markets, and the importance in that environment of CRMC’s long-term profitability for maintaining its independence, company culture and management continuity. They further considered the breakpoint discounts in the fund’s advisory fee structure. The board and the committee concluded that the fund’s advisory fee structure reflected a reasonable sharing of benefits between CRMC and the fund’s shareholders.
Average annual total returns for periods ended December 31, 2012 (the most recent calendar quarter-end):
Investment results assume all distributions are reinvested and reflect applicable fees and expenses. When applicable, investment results reflect fee waivers, without which results would have been lower. Visit americanfunds.com for more information.
For information regarding the differences among the various share classes, refer to the fund prospectus.
Mailing address: P.O. Box 7650
P.O. Box 6007
P.O. Box 2280
American Funds Distributors, Inc.
This page intentionally left blank.
This page intentionally left blank.
“American Funds Proxy Voting Procedures and Principles” — which describes how we vote proxies relating to portfolio securities — is available on the American Funds website or upon request by calling AFS. The fund files its proxy voting record with the U.S. Securities and Exchange Commission (SEC) for the 12 months ended June 30 by August 31. The proxy voting record is available free of charge on the SEC website at sec.gov and on the American Funds website.
A complete January 31, 2013, portfolio of The Income Fund of America’s investments is available free of charge by calling AFS or visiting the SEC website (where it is part of Form N-CSR).
The Income Fund of America files a complete list of its portfolio holdings with the SEC for the first and third quarters of each fiscal year on Form N-Q. This filing is available free of charge on the SEC website. You may also review or, for a fee, copy this filing at the SEC’s Public Reference Room in Washington, D.C. Additional information regarding the operation of the Public Reference Room may be obtained by calling the SEC’s Office of Investor Education and Advocacy at 800/SEC-0330. Additionally, the list of portfolio holdings is available by calling AFS.
This report is for the information of shareholders of The Income Fund of America, but it also may be used as sales literature when preceded or accompanied by the current prospectus or summary prospectus, which gives details about charges, expenses, investment objectives and operating policies of the fund. If used as sales material after March 31, 2013, this report must be accompanied by an American Funds statistical update for the most recently completed calendar quarter.
Since 1931, American Funds has helped investors pursue long-term investment success. Our consistent approach — in combination with a proven system — has resulted in a superior long-term track record.
Not applicable for filing of semi-annual reports to shareholders.
Not applicable for filing of semi-annual reports to shareholders.
Not applicable for filing of semi-annual reports to shareholders.
Not applicable to this Registrant, insofar as the Registrant is not a listed issuer as defined in Rule 10A-3 under the Securities Exchange Act of 1934.
| Common stocks — 68.68% | Shares | Value (000) |
| | | |
| FINANCIALS — 9.30% | | |
| HCP, Inc. | 20,907,513 | $ 969,900 |
| HSBC Holdings PLC (United Kingdom) | 36,388,722 | 413,626 |
| HSBC Holdings PLC (Hong Kong) | 28,586,382 | 325,474 |
| Weyerhaeuser Co.1 | 17,902,528 | 539,224 |
| CME Group Inc., Class A | 8,850,000 | 511,884 |
| BlackRock, Inc. | 2,000,000 | 472,560 |
| Digital Realty Trust, Inc.2 | 6,500,000 | 441,415 |
| Prologis, Inc. | 8,947,500 | 357,005 |
| Macerich Co. | 4,805,000 | 286,955 |
| Sanlam Ltd. | 43,646,184 | 222,209 |
| Public Storage | 1,380,000 | 212,423 |
| M&T Bank Corp. | 2,065,000 | 212,055 |
| Hospitality Properties Trust2 | 8,031,000 | 202,542 |
| Arthur J. Gallagher & Co. | 5,000,000 | 184,750 |
| Toronto-Dominion Bank | 2,150,000 | 179,540 |
| Prudential PLC | 11,775,000 | 178,908 |
| British Land Co. PLC | 19,395,438 | 172,878 |
| Industrial and Commercial Bank of China Ltd., Class H | 176,959,000 | 133,254 |
| New York Community Bancorp, Inc. | 9,160,000 | 122,286 |
| Eaton Vance Corp., nonvoting shares | 3,000,000 | 108,600 |
| IG Group Holdings PLC | 14,650,000 | 103,628 |
| Sumitomo Mitsui Financial Group, Inc. | 2,500,000 | 100,333 |
| Cullen/Frost Bankers, Inc. | 1,700,000 | 100,113 |
| DDR Corp. | 5,670,000 | 94,065 |
| Boardwalk Real Estate Investment Trust | 1,199,000 | 78,920 |
| Bank of Nova Scotia | 1,300,000 | 76,444 |
| Trustmark Corp.2 | 3,257,000 | 75,334 |
| Capitol Federal Financial, Inc. | 5,294,700 | 62,213 |
| Northwest Bancshares, Inc.2 | 4,850,000 | 59,170 |
| AXA SA | 2,735,000 | 50,653 |
| Allianz SE | 350,000 | 50,065 |
| Mercury General Corp. | 1,213,342 | 48,048 |
| City Holding Co. | 741,000 | 28,002 |
| United Overseas Bank Ltd. | 1,679,000 | 25,572 |
| American Tower Corp. | 42,271 | 3,219 |
| | | 7,203,267 |
| | | |
| | | |
| INDUSTRIALS — 9.07% | | |
| General Electric Co. | 72,066,500 | 1,605,642 |
| Lockheed Martin Corp. | 10,005,000 | 869,134 |
| Waste Management, Inc. | 20,472,153 | 744,777 |
| Eaton Corp. PLC | 9,500,000 | 541,025 |
| Iron Mountain Inc.2 | 12,457,211 | 426,161 |
| Schneider Electric SA | 5,343,606 | 407,036 |
| Masco Corp. | 16,996,751 | 312,570 |
| Hubbell Inc., Class B | 3,430,000 | 312,302 |
| Siemens AG | 1,715,000 | 188,246 |
| Ryanair Holdings PLC (ADR) | 4,615,000 | 179,754 |
| PACCAR Inc | 3,382,500 | 159,181 |
| AB SKF, Class B | 6,290,000 | 156,116 |
| Keppel Corp. Ltd. | 16,300,000 | 151,456 |
| CCR SA, ordinary nominative | 14,607,300 | 150,742 |
| United Technologies Corp. | 1,500,000 | 131,355 |
| Boeing Co. | 1,700,000 | 125,579 |
| Norfolk Southern Corp. | 1,800,000 | 123,966 |
| R.R. Donnelley & Sons Co.2 | 13,345,400 | 122,778 |
| Honeywell International Inc. | 1,575,000 | 107,478 |
| Leighton Holdings Ltd. | 3,697,000 | 79,726 |
| Atlas Copco AB, Class B | 2,825,000 | 72,071 |
| Geberit AG | 158,758 | 37,123 |
| Douglas Dynamics, Inc.2 | 1,350,000 | 17,793 |
| Nortek, Inc.1 | 17,225 | 1,243 |
| Atrium Corp.1,3,4 | 1,807 | 63 |
| | | 7,023,317 |
| | | |
| | | |
| HEALTH CARE — 8.67% | | |
| Bristol-Myers Squibb Co. | 50,700,000 | 1,832,298 |
| Merck & Co., Inc. | 41,192,440 | 1,781,573 |
| Pfizer Inc | 43,357,000 | 1,182,779 |
| AstraZeneca PLC | 13,570,000 | 657,067 |
| Johnson & Johnson | 4,545,000 | 335,967 |
| Roche Holding AG | 1,200,000 | 265,568 |
| Novartis AG | 2,203,000 | 150,086 |
| Novartis AG (ADR) | 500,000 | 33,910 |
| Baxter International Inc. | 2,675,000 | 181,472 |
| Sonic Healthcare Ltd. | 10,324,622 | 147,178 |
| Eli Lilly and Co. | 2,000,000 | 107,380 |
| Sanofi | 343,018 | 33,469 |
| | | 6,708,747 |
| | | |
| | | |
| ENERGY — 7.04% | | |
| Royal Dutch Shell PLC, Class B (ADR) | 10,426,000 | 758,179 |
| Royal Dutch Shell PLC, Class A (ADR) | 6,000,000 | 423,120 |
| Royal Dutch Shell PLC, Class B | 3,797,147 | 138,151 |
| Chevron Corp. | 9,434,800 | 1,086,417 |
| Kinder Morgan, Inc. | 21,732,800 | 814,111 |
| Spectra Energy Corp | 21,975,500 | 610,479 |
| ConocoPhillips | 6,614,000 | 383,612 |
| Crescent Point Energy Corp. | 9,905,000 | 383,131 |
| Husky Energy Inc. | 8,277,500 | 258,101 |
| EnCana Corp. | 9,000,000 | 173,972 |
| TOTAL SA (ADR) | 3,110,000 | 168,842 |
| Diamond Offshore Drilling, Inc. | 1,885,200 | 141,560 |
| Keyera Corp. | 1,332,700 | 69,347 |
| Penn West Petroleum Ltd. | 3,796,300 | 38,405 |
| General Maritime Corp.1,3,4 | 5,506 | 203 |
| | | 5,447,630 |
| | | |
| | | |
| CONSUMER STAPLES — 7.01% | | |
| PepsiCo, Inc. | 8,605,000 | 626,874 |
| Procter & Gamble Co. | 8,173,985 | 614,357 |
| Nestlé SA | 8,145,000 | 571,909 |
| Altria Group, Inc. | 14,930,000 | 502,842 |
| H.J. Heinz Co. | 7,500,000 | 454,725 |
| Kimberly-Clark Corp. | 4,870,000 | 435,914 |
| Philip Morris International Inc. | 3,610,800 | 318,328 |
| Costco Wholesale Corp. | 2,800,000 | 286,552 |
| Unilever NV, depository receipts | 6,795,000 | 274,942 |
| Unilever PLC | 6,075,000 | 247,329 |
| Sysco Corp. | 6,458,500 | 205,187 |
| Coca-Cola Co. | 5,000,000 | 186,200 |
| Coca-Cola Amatil Ltd. | 11,640,441 | 167,999 |
| Hershey Co. | 2,000,000 | 158,900 |
| British American Tobacco PLC | 2,940,000 | 153,081 |
| General Mills, Inc. | 3,605,000 | 151,194 |
| Mondelez International, Inc. | 2,450,000 | 68,085 |
| | | 5,424,418 |
| | | |
| | | |
| UTILITIES — 5.46% | | |
| National Grid PLC | 80,801,656 | 886,167 |
| GDF SUEZ | 29,738,377 | 610,123 |
| Power Assets Holdings Ltd. | 59,138,000 | 512,427 |
| FirstEnergy Corp. | 10,802,983 | 437,413 |
| PG&E Corp. | 9,800,000 | 417,872 |
| Duke Energy Corp. | 5,237,057 | 359,995 |
| DTE Energy Co. | 5,000,000 | 316,550 |
| Exelon Corp. | 9,000,000 | 282,960 |
| Snam SpA | 34,046,588 | 172,155 |
| ONEOK, Inc. | 2,760,000 | 129,748 |
| DUET Group | 45,288,266 | 103,898 |
| Prime AET&D Holdings No 1 Pty Ltd.1,4 | 22,756,141 | — |
| | | 4,229,308 |
| | | |
| | | |
| CONSUMER DISCRETIONARY — 5.12% | | |
| Home Depot, Inc. | 23,406,200 | 1,566,343 |
| Time Warner Inc. | 13,815,000 | 697,934 |
| Time Warner Cable Inc. | 5,400,000 | 482,436 |
| McGraw-Hill Companies, Inc. | 5,270,000 | 303,130 |
| SES SA, Class A (FDR) | 6,940,000 | 212,445 |
| Marks and Spencer Group PLC | 30,000,000 | 180,661 |
| McDonald’s Corp. | 1,500,000 | 142,935 |
| H & M Hennes & Mauritz AB, Class B | 3,649,500 | 134,434 |
| Genuine Parts Co. | 1,765,580 | 120,112 |
| VF Corp. | 710,000 | 104,782 |
| Cooper-Standard Holdings Inc.1 | 586,012 | 22,855 |
| Adelphia Recovery Trust, Series ACC-11 | 19,531,478 | 20 |
| | | 3,968,087 |
| | | |
| | | |
| MATERIALS — 4.58% | | |
| E.I. du Pont de Nemours and Co. | 19,241,000 | 912,985 |
| Nucor Corp. | 13,580,000 | 624,816 |
| Dow Chemical Co. | 18,504,900 | 595,858 |
| MeadWestvaco Corp.2 | 11,281,000 | 353,659 |
| Cliffs Natural Resources Inc.2 | 8,366,000 | 312,136 |
| Fletcher Building Ltd. | 34,239,000 | 273,541 |
| BASF SE | 1,500,000 | 152,060 |
| LyondellBasell Industries NV, Class A | 2,150,000 | 136,353 |
| Israel Chemicals Ltd. | 6,935,332 | 91,885 |
| Impala Platinum Holdings Ltd. | 4,287,112 | 77,830 |
| NewPage Holdings Inc.1,4,5 | 118,460 | 12,877 |
| | | 3,544,000 |
| | | |
| | | |
| TELECOMMUNICATION SERVICES — 3.95% | | |
| Verizon Communications Inc. | 21,153,425 | 922,501 |
| Telstra Corp. Ltd. | 141,700,000 | 679,718 |
| AT&T Inc. | 7,199,621 | 250,475 |
| Advanced Info Service PCL | 35,408,300 | 249,354 |
| HKT Trust, units | 263,458,000 | 245,609 |
| CenturyLink, Inc. | 5,711,120 | 231,015 |
| TalkTalk Telecom Group PLC2 | 57,242,000 | 214,799 |
| OJSC MegaFon (GDR)1,3 | 5,483,200 | 148,101 |
| OJSC Megafon (GDR)1 | 766,800 | 20,711 |
| Bell Aliant Inc. | 1,895,000 | 49,342 |
| Portugal Telecom, SGPS, SA | 7,528,000 | 43,953 |
| | | 3,055,578 |
| | | |
| | | |
| INFORMATION TECHNOLOGY — 3.65% | | |
| Microsoft Corp. | 18,015,000 | 494,872 |
| Maxim Integrated Products, Inc. | 14,156,000 | 445,206 |
| Taiwan Semiconductor Manufacturing Co. Ltd. | 127,503,000 | 438,303 |
| Paychex, Inc. | 11,653,182 | 380,243 |
| Analog Devices, Inc. | 6,500,000 | 283,660 |
| KLA-Tencor Corp. | 3,900,000 | 214,149 |
| Cisco Systems, Inc. | 8,000,000 | 164,560 |
| Intel Corp. | 7,000,000 | 147,280 |
| Texas Instruments Inc. | 3,750,000 | 124,050 |
| Canon, Inc. | 2,000,000 | 73,596 |
| Nintendo Co., Ltd. | 630,000 | 61,454 |
| | | 2,827,373 |
| | | |
| | | |
| MISCELLANEOUS — 4.83% | | |
| Other common stocks in initial period of acquisition | | 3,739,334 |
| | | |
| | | |
| Total common stocks (cost: $43,220,459,000) | | 53,171,059 |
| | | |
| | | |
| | | |
| Preferred stocks — 0.43% | | |
| | | |
| FINANCIALS — 0.28% | | |
| Vornado Realty Trust, Series I, 6.625% | 3,380,000 | 85,278 |
| Citigroup Inc. 7.875% preferred | 2,637,610 | 73,725 |
| HSBC Holdings PLC, Series 2, 8.00% | 1,825,000 | 50,940 |
| Zions Bancorporation, Series C, 9.50% noncumulative depositary shares | 273,063 | 7,138 |
| Fannie Mae, Series S, 8.25% noncumulative1 | 1,511,450 | 2,815 |
| | | 219,896 |
| | | |
| | | |
| MISCELLANEOUS — 0.15% | | |
| Other preferred stocks in initial period of acquisition | | 115,637 |
| | | |
| | | |
| Total preferred stocks (cost: $348,999,000) | | 335,533 |
| | | |
| | | |
| | | |
| Warrants — 0.00% | | |
| | | |
| ENERGY — 0.00% | | |
| General Maritime Corp., warrants, expire 20171,3,4 | 8,514 | 64 |
| | | |
| | | |
| Total warrants (cost: $2,171,000) | | 64 |
| | | |
| | | |
| | | |
| | Shares or | Value |
| Convertible securities — 1.10% | principal amount | (000) |
| | | |
| CONSUMER DISCRETIONARY — 0.57% | | |
| General Motors Co., Series B, 4.75% convertible preferred 2013 | 9,641,250 | $417,659 |
| MGM Resorts International 4.25% convertible notes 2015 | $19,845,000 | 21,557 |
| | | 439,216 |
| | | |
| | | |
| UTILITIES — 0.16% | | |
| PPL Corp. 9.50% convertible preferred 2013, units | 2,297,168 | 124,185 |
| | | |
| | | |
| ENERGY — 0.12% | | |
| Apache Corp., Series D, 6.00% convertible preferred 2013 | 1,930,000 | 91,347 |
| | | |
| | | |
| INDUSTRIALS — 0.11% | | |
| United Continental Holdings, Inc. 4.50% convertible notes 2021 | $72,600,000 | 71,729 |
| AMR Corp. 6.25% convertible notes 20146 | $14,467,000 | 13,952 |
| | | 85,681 |
| | | |
| | | |
| MATERIALS — 0.07% | | |
| Alcoa Inc. 5.25% convertible notes 2014 | $41,500,000 | 59,656 |
| | | |
| | | |
| CONSUMER STAPLES — 0.04% | | |
| Bunge Ltd. 4.875% convertible preferred | 272,700 | 29,424 |
| | | |
| | | |
| TELECOMMUNICATION SERVICES — 0.03% | | |
| Leap Wireless International, Inc. 4.50% convertible notes 2014 | $25,000,000 | 24,250 |
| | | |
| | | |
| Total convertible securities (cost: $872,313,000) | | 853,759 |
| | | |
| | | |
| | Principal amount | |
| Bonds & notes — 24.99% | (000) | |
| | | |
| FINANCIALS — 4.38% | | |
| Westfield Capital Corp. Ltd., WT Finance (Australia) Pty Ltd. and WEA Finance LLC 5.125% 20143 | $18,485 | 19,823 |
| Westfield Group 7.50% 20143 | 5,555 | 6,021 |
| Westfield Group 5.75% 20153 | 10,250 | 11,399 |
| Westfield Group 5.70% 20163 | 44,075 | 50,164 |
| Westfield Group 7.125% 20183 | 39,925 | 49,115 |
| Westfield Group 6.75% 20193 | 30,000 | 37,058 |
| Westfield Group 4.625% 20213 | 20,000 | 22,148 |
| CIT Group Inc., Series C, 4.75% 20153 | 99,815 | 105,305 |
| CIT Group Inc. 4.25% 2017 | 14,000 | 14,560 |
| CIT Group Inc. 5.00% 2017 | 43,900 | 47,083 |
| CIT Group Inc., Series C, 5.50% 20193 | 13,650 | 14,674 |
| Realogy Corp., Term Loan B, 4.456% 20167,8,9 | 94,810 | 95,581 |
| Realogy Corp., Letter of Credit, 4.456% 20167,8,9 | 7,414 | 7,475 |
| Realogy Corp. 7.875% 20193 | 54,174 | 59,862 |
| Realogy Corp. 9.00% 20203 | 12,540 | 14,609 |
| Prologis, Inc. 7.625% 2014 | 11,000 | 11,989 |
| Prologis, Inc. 6.25% 2017 | 8,900 | 10,334 |
| Prologis, Inc. 6.625% 2018 | 57,365 | 69,132 |
| Prologis, Inc. 6.625% 2019 | 5,686 | 6,872 |
| Prologis, Inc. 7.375% 2019 | 22,690 | 28,567 |
| Prologis, Inc. 6.875% 2020 | 37,875 | 46,453 |
| Wells Fargo & Co. 3.676% 2016 | 10,000 | 10,838 |
| Wells Fargo & Co. 4.60% 2021 | 45,000 | 50,945 |
| Wells Fargo & Co., Series K, junior subordinated 7.98% (undated)7 | 86,566 | 99,659 |
| Citigroup Inc. 1.16% 20137 | 13,159 | 13,159 |
| Citigroup Inc. 4.587% 2015 | 10,885 | 11,841 |
| Citigroup Inc. 3.953% 2016 | 27,115 | 29,121 |
| Citigroup Inc. 8.50% 2019 | 4,894 | 6,535 |
| Citigroup Inc., Series B, junior subordinated 5.90% (undated)7 | 15,000 | 15,373 |
| Citigroup Inc., Series A, junior subordinated 5.95% (undated)7 | 83,897 | 84,841 |
| Goldman Sachs Group, Inc. 3.625% 2016 | 22,600 | 23,938 |
| Murray Street Investment Trust I 4.647% 2017 | 14,160 | 15,350 |
| Goldman Sachs Group, Inc. 2.375% 2018 | 13,515 | 13,565 |
| Goldman Sachs Group, Inc. 5.25% 2021 | 40,000 | 45,259 |
| Goldman Sachs Group, Inc. 5.75% 2022 | 45,000 | 52,555 |
| Goldman Sachs Group, Inc. 3.625% 2023 | 5,240 | 5,243 |
| Simon Property Group, LP 6.75% 2014 | 5,310 | 5,637 |
| Simon Property Group, LP 5.25% 2016 | 73,435 | 83,870 |
| Simon Property Group, LP 6.10% 2016 | 4,250 | 4,879 |
| Simon Property Group, LP 5.875% 2017 | 22,265 | 25,992 |
| Simon Property Group, LP 1.50% 20183 | 7,345 | 7,280 |
| Simon Property Group, LP 6.125% 2018 | 10,790 | 13,125 |
| Simon Property Group, LP 10.35% 2019 | 5,000 | 7,213 |
| SMFG Preferred Capital USD 3 Ltd., junior subordinated 9.50% (undated)3,7 | 116,330 | 147,448 |
| JPMorgan Chase & Co. 3.45% 2016 | 10,000 | 10,668 |
| JPMorgan Chase & Co. 1.80% 2018 | 8,500 | 8,481 |
| JPMorgan Chase & Co. 3.25% 2022 | 10,000 | 10,034 |
| JPMorgan Chase & Co. 3.20% 2023 | 15,000 | 14,939 |
| JPMorgan Chase & Co., Series I, junior subordinated 7.90% (undated)7 | 74,825 | 86,392 |
| Bank of America Corp., Series L, 3.625% 2016 | 7,060 | 7,493 |
| Bank of America Corp. 3.75% 2016 | 9,975 | 10,648 |
| Bank of America Corp. 5.75% 2017 | 8,100 | 9,362 |
| Bank of America Corp. 5.625% 2020 | 12,445 | 14,458 |
| Bank of America Corp. 5.00% 2021 | 4,185 | 4,690 |
| Bank of America Corp. 5.70% 2022 | 22,905 | 26,913 |
| Bank of America Corp. 3.30% 2023 | 4,285 | 4,236 |
| Bank of America Corp., Series M, junior subordinated 8.125% noncumulative (undated)7 | 30,924 | 35,042 |
| PNC Bank 0.80% 2016 | 5,000 | 5,003 |
| PNC Financial Services Group, Inc. 2.854% 2022 | 17,515 | 17,288 |
| PNC Preferred Funding Trust I, junior subordinated 1.958% (undated)3,7 | 23,800 | 20,111 |
| PNC Financial Services Group, Inc., Series O, junior subordinated 6.75% (undated)7 | 10,250 | 11,811 |
| PNC Preferred Funding Trust III, junior subordinated 8.70% (undated)3,7 | 40,700 | 41,191 |
| iStar Financial Inc., Term Loan B, 5.75% 20177,8,9 | 51,053 | 51,994 |
| iStar Financial Inc., Series B, 9.00% 2017 | 37,360 | 41,656 |
| Developers Diversified Realty Corp. 5.50% 2015 | 15,776 | 17,111 |
| Developers Diversified Realty Corp. 9.625% 2016 | 6,820 | 8,362 |
| Developers Diversified Realty Corp. 7.50% 2017 | 32,887 | 39,329 |
| Developers Diversified Realty Corp. 4.75% 2018 | 5,000 | 5,535 |
| Developers Diversified Realty Corp. 7.875% 2020 | 6,505 | 8,280 |
| Zions Bancorporation 5.50% 2015 | 40,017 | 41,338 |
| Zions Bancorporation 6.00% 2015 | 32,732 | 34,916 |
| Kimco Realty Corp., Series C, 4.82% 2014 | 3,000 | 3,158 |
| Kimco Realty Corp., Series C, 4.904% 2015 | 4,500 | 4,831 |
| Kimco Realty Corp., Series C, 5.783% 2016 | 15,000 | 16,931 |
| Kimco Realty Corp. 5.70% 2017 | 23,485 | 27,169 |
| Kimco Realty Corp. 4.30% 2018 | 3,000 | 3,328 |
| Kimco Realty Corp. 6.875% 2019 | 10,844 | 13,671 |
| Mizuho Capital Investment (USD) 2 Ltd, junior subordinated 14.95% (undated)3,7 | 55,766 | 65,548 |
| International Lease Finance Corp. 4.875% 2015 | 62,155 | 65,107 |
| Hospitality Properties Trust 5.125% 20152 | 3,160 | 3,316 |
| Hospitality Properties Trust 6.30% 20162 | 19,827 | 21,877 |
| Hospitality Properties Trust 5.625% 20172 | 10,169 | 11,220 |
| Hospitality Properties Trust 6.70% 20182 | 12,625 | 14,506 |
| Hospitality Properties Trust 5.00% 20222 | 7,000 | 7,440 |
| Royal Bank of Scotland PLC 3.40% 2013 | 7,950 | 8,054 |
| Royal Bank of Scotland PLC 3.95% 2015 | 10,000 | 10,741 |
| Royal Bank of Scotland Group PLC 4.70% 2018 | 14,000 | 14,042 |
| RBS Capital Trust II 6.425% noncumulative trust (undated)7 | 11,005 | 10,015 |
| Royal Bank of Scotland Group PLC, junior subordinated 6.99% (undated)3,6,7 | 12,735 | 12,098 |
| Synovus Financial Corp. 5.125% 2017 | 31,353 | 31,275 |
| Synovus Financial Corp. 7.875% 2019 | 18,816 | 21,497 |
| Standard Chartered PLC 3.85% 20153 | 6,945 | 7,342 |
| Standard Chartered PLC 3.20% 20163 | 13,123 | 13,841 |
| Standard Chartered Bank 6.40% 20173 | 25,000 | 29,108 |
| HBOS PLC 6.75% 20183 | 17,300 | 19,052 |
| LBG Capital No.1 PLC, Series 2, 7.875% 20203 | 20,000 | 22,120 |
| HBOS PLC 6.00% 20333 | 2,200 | 2,115 |
| HBOS Capital Funding LP 6.071% (undated)3,7 | 5,000 | 4,425 |
| Regions Financial Corp. 7.75% 2014 | 20,323 | 22,533 |
| Regions Financial Corp. 5.20% 2015 | 3,115 | 3,317 |
| Regions Financial Corp. 5.75% 2015 | 18,301 | 19,948 |
| American Tower Corp. 4.625% 2015 | 9,280 | 9,966 |
| American Tower Corp. 7.00% 2017 | 12,431 | 14,835 |
| American Tower Corp. 7.25% 2019 | 15,025 | 18,522 |
| Société Générale, junior subordinated 5.922% (undated)3,7 | 45,073 | 42,821 |
| MetLife Global Funding I 5.125% 20133 | 12,000 | 12,103 |
| MetLife Global Funding I 2.50% 20153 | 10,000 | 10,422 |
| MetLife Capital Trust IV, junior subordinated 7.875% 20673,7 | 14,430 | 18,038 |
| MetLife Capital Trust X, junior subordinated 9.25% 20683,7 | 500 | 690 |
| UnumProvident Finance Co. PLC 6.85% 20153 | 28,500 | 32,109 |
| Unum Group 7.125% 2016 | 6,740 | 7,882 |
| Springleaf Finance Corp., Term Loan B, 5.50% 20177,8,9 | 34,345 | 34,530 |
| HSBK (Europe) BV 7.25% 20173 | 30,570 | 34,009 |
| American International Group, Inc. 3.00% 2015 | 14,000 | 14,547 |
| American International Group, Inc. 4.875% 2016 | 4,000 | 4,471 |
| American International Group, Inc. 3.80% 2017 | 11,000 | 11,869 |
| Ford Motor Credit Co. 2.50% 2016 | 7,000 | 7,104 |
| Ford Motor Credit Co. 8.00% 2016 | 1,500 | 1,801 |
| Ford Motor Credit Co. 2.375% 2018 | 21,500 | 21,241 |
| Lazard Group LLC 7.125% 2015 | 25,187 | 28,032 |
| NASDAQ OMX Group, Inc. 5.25% 2018 | 23,050 | 25,445 |
| ERP Operating LP 5.20% 2013 | 2,500 | 2,518 |
| ERP Operating LP 5.25% 2014 | 2,000 | 2,144 |
| ERP Operating LP 6.584% 2015 | 2,705 | 3,035 |
| ERP Operating LP 5.75% 2017 | 4,000 | 4,681 |
| ERP Operating LP 7.125% 2017 | 10,000 | 11,994 |
| Berkshire Hathaway Inc. 2.20% 2016 | 11,500 | 12,014 |
| Berkshire Hathaway Inc. 1.55% 2018 | 5,000 | 5,009 |
| Berkshire Hathaway Inc. 3.00% 2023 | 2,500 | 2,493 |
| Berkshire Hathaway Inc. 4.40% 2042 | 3,000 | 2,949 |
| Liberty Mutual Group Inc., Series A, 7.80% 20873,7 | 19,415 | 22,133 |
| HCP, Inc. 3.75% 2016 | 20,000 | 21,384 |
| Crescent Resources 10.25% 20173 | 18,975 | 20,398 |
| New York Life Global Funding 4.65% 20133 | 19,000 | 19,213 |
| Toyota Motor Credit Corp. 1.375% 2013 | 10,000 | 10,058 |
| Toyota Motor Credit Corp. 0.875% 2015 | 8,500 | 8,550 |
| BNP Paribas 3.60% 2016 | 10,000 | 10,628 |
| BNP Paribas 5.00% 2021 | 7,000 | 7,842 |
| Monumental Global Funding 5.50% 20133 | 10,000 | 10,105 |
| Monumental Global Funding III 0.504% 20143,7 | 8,000 | 7,999 |
| Prudential Financial, Inc. 4.50% 2021 | 3,000 | 3,319 |
| Prudential Holdings, LLC, Series C, 8.695% 20233,8 | 10,250 | 13,219 |
| BBVA Bancomer SA 4.50% 20163 | 7,500 | 7,969 |
| BBVA Bancomer SA 6.50% 20213 | 7,200 | 8,280 |
| Morgan Stanley, Series F, 2.875% 2014 | 10,000 | 10,186 |
| Morgan Stanley 3.80% 2016 | 5,125 | 5,416 |
| Mack-Cali Realty Corp. 2.50% 2017 | 15,235 | 15,388 |
| American Express Co. 6.15% 2017 | 12,610 | 15,042 |
| Host Hotels & Resorts, LP, Series Q, 6.75% 2016 | 5,362 | 5,523 |
| Host Hotels & Resorts LP 6.00% 2020 | 1,000 | 1,100 |
| Host Hotels & Resorts LP 6.00% 2021 | 6,400 | 7,352 |
| Boston Properties, Inc. 3.70% 2018 | 12,000 | 13,072 |
| FelCor Lodging Trust Inc. 5.625% 20233 | 11,950 | 12,084 |
| ANZ National (International) Ltd. 3.125% 20153 | 10,000 | 10,520 |
| Bank of New York Mellon Corp., Series G, 2.50% 2016 | 10,000 | 10,485 |
| UBS AG 2.25% 2014 | 10,000 | 10,158 |
| US Bancorp., Series T, 1.65% 2017 | 10,000 | 10,124 |
| Principal Life Insurance Co. 5.30% 2013 | 10,000 | 10,107 |
| Westpac Banking Corp. 3.00% 2015 | 9,000 | 9,534 |
| Bank of Nova Scotia 2.55% 2017 | 9,000 | 9,421 |
| Toronto-Dominion Bank 2.375% 2016 | 9,000 | 9,409 |
| Nationwide Mutual Insurance Co. 5.81% 20243,7 | 8,150 | 8,232 |
| ACE INA Holdings Inc. 2.60% 2015 | 7,445 | 7,830 |
| Santander Issuances, SA Unipersonal 6.50% 20193,7 | 7,500 | 7,743 |
| Brandywine Operating Partnership, LP 5.40% 2014 | 6,000 | 6,409 |
| Barclays Bank PLC 5.125% 2020 | 5,500 | 6,256 |
| Goodman Funding Pty Ltd. 6.00% 20223 | 4,935 | 5,520 |
| AXA SA, Series B, junior subordinated 6.379% (undated)3,7 | 4,155 | 4,155 |
| VEB Finance Ltd. 6.80% 20253 | 3,000 | 3,653 |
| UDR, Inc., Series A, 5.25% 2015 | 3,000 | 3,228 |
| Allstate Corp., Series B, junior subordinated 6.125% 20677 | 2,445 | 2,580 |
| CNA Financial Corp. 6.50% 2016 | 1,750 | 2,020 |
| Development Bank of Kazakhstan 5.50% 2015 | 930 | 1,007 |
| Development Bank of Kazakhstan 5.50% 20153 | 637 | 690 |
| AvalonBay Communities, Inc. 2.85% 2023 | 1,415 | 1,380 |
| | | 3,392,791 |
| | | |
| | | |
| MORTGAGE-BACKED OBLIGATIONS8 — 3.18% | | |
| Fannie Mae 5.50% 2018 | 90 | 96 |
| Fannie Mae 6.00% 2021 | 348 | 389 |
| Fannie Mae, Series 2012-M17, Class A2, multifamily 2.184% 2022 | 8,000 | 7,893 |
| Fannie Mae, Series 2012-M14, Class A2, multifamily 2.301% 20227 | 4,285 | 4,222 |
| Fannie Mae, Series 2012-M9, Class A2, multifamily 2.482% 2022 | 12,231 | 12,340 |
| Fannie Mae 2.50% 2022 | 24,757 | 25,774 |
| Fannie Mae, Series 2012-M5, Class A2, multifamily 2.715% 2022 | 7,000 | 7,214 |
| Fannie Mae, Series 2003-48, Class TJ, 4.50% 2022 | 984 | 989 |
| Fannie Mae 2.50% 2023 | 26,283 | 27,366 |
| Fannie Mae 4.50% 2024 | 4,286 | 4,608 |
| Fannie Mae 5.50% 2024 | 484 | 522 |
| Fannie Mae 3.50% 2025 | 13,078 | 13,846 |
| Fannie Mae 3.50% 2025 | 9,852 | 10,431 |
| Fannie Mae 3.50% 2025 | 8,176 | 8,657 |
| Fannie Mae 3.50% 2025 | 7,825 | 8,285 |
| Fannie Mae 3.50% 2025 | 7,009 | 7,420 |
| Fannie Mae 3.50% 2025 | 4,346 | 4,602 |
| Fannie Mae 3.50% 2025 | 1,081 | 1,144 |
| Fannie Mae 3.50% 2025 | 443 | 469 |
| Fannie Mae 3.50% 2025 | 372 | 394 |
| Fannie Mae 4.50% 2025 | 4,723 | 5,092 |
| Fannie Mae 4.50% 2025 | 2,696 | 2,931 |
| Fannie Mae 4.50% 2025 | 2,710 | 2,922 |
| Fannie Mae 4.50% 2025 | 2,707 | 2,919 |
| Fannie Mae, Series 2001-4, Class GA, 9.623% 20257 | 240 | 278 |
| Fannie Mae, Series 2001-4, Class NA, 11.153% 20257 | 9 | 11 |
| Fannie Mae 3.50% 2026 | 7,473 | 7,912 |
| Fannie Mae 6.00% 2026 | 6,626 | 7,340 |
| Fannie Mae 7.00% 2026 | 885 | 1,020 |
| Fannie Mae 2.50% 2027 | 23,882 | 24,863 |
| Fannie Mae 2.50% 2027 | 22,569 | 23,465 |
| Fannie Mae 2.50% 2027 | 2,036 | 2,119 |
| Fannie Mae 2.50% 2027 | 1,558 | 1,621 |
| Fannie Mae 2.50% 2027 | 1,402 | 1,462 |
| Fannie Mae 2.50% 2027 | 1,274 | 1,325 |
| Fannie Mae 2.50% 2027 | 753 | 783 |
| Fannie Mae 2.50% 2027 | 628 | 654 |
| Fannie Mae 2.50% 2027 | 611 | 635 |
| Fannie Mae 3.00% 2027 | 31,093 | 32,876 |
| Fannie Mae 2.00% 2028 | 30,250 | 30,607 |
| Fannie Mae 2.00% 2028 | 22,500 | 22,713 |
| Fannie Mae 2.50% 2028 | 62,221 | 64,729 |
| Fannie Mae 2.50% 2028 | 50,750 | 52,574 |
| Fannie Mae 2.50% 2028 | 17,278 | 17,975 |
| Fannie Mae 2.50% 2028 | 16,704 | 17,377 |
| Fannie Mae 3.00% 2028 | 98,022 | 102,938 |
| Fannie Mae 3.00% 2028 | 34,500 | 36,171 |
| Fannie Mae 3.50% 2028 | 7,000 | 7,406 |
| Fannie Mae 6.00% 2028 | 7,628 | 8,474 |
| Fannie Mae 7.00% 2028 | 2,845 | 3,292 |
| Fannie Mae 7.00% 2028 | 391 | 452 |
| Fannie Mae, Series 2001-20, Class E, 9.584% 20317 | 232 | 264 |
| Fannie Mae 5.50% 2033 | 1,168 | 1,279 |
| Fannie Mae 4.50% 2034 | 34,935 | 37,689 |
| Fannie Mae 5.50% 2035 | 1,172 | 1,280 |
| Fannie Mae 5.50% 2036 | 9,217 | 9,988 |
| Fannie Mae 6.00% 2036 | 5,072 | 5,550 |
| Fannie Mae, Series 2006-43, Class PX, 6.00% 2036 | 3,308 | 3,728 |
| Fannie Mae 6.00% 2036 | 3,157 | 3,455 |
| Fannie Mae 6.00% 2036 | 2,342 | 2,563 |
| Fannie Mae 2.729% 20377 | 3,415 | 3,620 |
| Fannie Mae, Series 2007-33, Class HE, 5.50% 2037 | 11,287 | 12,578 |
| Fannie Mae 6.00% 2037 | 61,676 | 67,469 |
| Fannie Mae 6.00% 2037 | 9,101 | 9,987 |
| Fannie Mae, Series 2007-24, Class P, 6.00% 2037 | 7,800 | 8,865 |
| Fannie Mae 6.00% 2037 | 6,499 | 7,104 |
| Fannie Mae 6.00% 2037 | 6,391 | 6,991 |
| Fannie Mae 6.00% 2037 | 485 | 526 |
| Fannie Mae 6.00% 2037 | 449 | 491 |
| Fannie Mae 6.50% 2037 | 3,354 | 3,720 |
| Fannie Mae 6.50% 2037 | 2,530 | 2,802 |
| Fannie Mae 6.50% 2037 | 2,416 | 2,698 |
| Fannie Mae 6.50% 2037 | 978 | 1,085 |
| Fannie Mae 7.00% 2037 | 1,553 | 1,744 |
| Fannie Mae 7.00% 2037 | 1,146 | 1,287 |
| Fannie Mae 7.50% 2037 | 1,425 | 1,626 |
| Fannie Mae 7.50% 2037 | 487 | 556 |
| Fannie Mae 7.50% 2037 | 112 | 128 |
| Fannie Mae 8.00% 2037 | 106 | 121 |
| Fannie Mae 5.50% 2038 | 2,393 | 2,597 |
| Fannie Mae 6.00% 2038 | 11,448 | 12,519 |
| Fannie Mae 6.00% 2038 | 9,741 | 10,631 |
| Fannie Mae 6.00% 2038 | 4,062 | 4,445 |
| Fannie Mae 6.00% 2038 | 2,959 | 3,295 |
| Fannie Mae 4.50% 2039 | 43,389 | 47,741 |
| Fannie Mae 6.00% 2039 | 3,834 | 4,187 |
| Fannie Mae 6.00% 2039 | 2,819 | 3,081 |
| Fannie Mae 6.50% 2039 | 2,137 | 2,387 |
| Fannie Mae 4.00% 2040 | 17,283 | 18,400 |
| Fannie Mae 4.00% 2040 | 13,661 | 14,519 |
| Fannie Mae 4.00% 2040 | 12,599 | 13,413 |
| Fannie Mae 4.186% 20407 | 1,744 | 1,858 |
| Fannie Mae 4.50% 2040 | 36,523 | 39,334 |
| Fannie Mae 4.50% 2040 | 3,336 | 3,593 |
| Fannie Mae 4.50% 2040 | 144 | 159 |
| Fannie Mae 4.50% 2040 | 125 | 138 |
| Fannie Mae 5.00% 2040 | 16,114 | 17,447 |
| Fannie Mae 3.764% 20417 | 2,528 | 2,689 |
| Fannie Mae 4.00% 2041 | 33,814 | 36,000 |
| Fannie Mae 4.00% 2041 | 11,707 | 12,464 |
| Fannie Mae 4.50% 2041 | 79,417 | 85,680 |
| Fannie Mae 4.50% 2041 | 50,624 | 54,616 |
| Fannie Mae 4.50% 2041 | 8,874 | 9,574 |
| Fannie Mae 4.50% 2041 | 5,401 | 5,827 |
| Fannie Mae 4.50% 2041 | 432 | 478 |
| Fannie Mae 5.00% 2041 | 2,319 | 2,605 |
| Fannie Mae 5.00% 2041 | 854 | 960 |
| Fannie Mae 5.00% 2041 | 794 | 881 |
| Fannie Mae 5.00% 2041 | 627 | 705 |
| Fannie Mae 5.00% 2041 | 598 | 672 |
| Fannie Mae, Series 2001-50, Class BA, 7.00% 2041 | 645 | 735 |
| Fannie Mae, Series 2001-T10, Class A-1, 7.00% 2041 | 531 | 612 |
| Fannie Mae, Series 2002-W3, Class A-5, 7.50% 2041 | 364 | 434 |
| Fannie Mae 3.50% 2042 | 42,186 | 44,810 |
| Fannie Mae 3.50% 2042 | 30,477 | 32,372 |
| Fannie Mae 3.50% 2042 | 11,448 | 12,203 |
| Fannie Mae 3.50% 2042 | 4,744 | 5,016 |
| Fannie Mae, Series 2002-W1, Class 2A, 6.928% 20427 | 931 | 1,079 |
| Fannie Mae 3.00% 2043 | 18,250 | 18,855 |
| Fannie Mae 3.50% 2043 | 172,862 | 182,396 |
| Fannie Mae 6.00% 2043 | 34,000 | 37,118 |
| Fannie Mae 6.50% 2047 | 1,158 | 1,264 |
| Fannie Mae 6.50% 2047 | 1,123 | 1,226 |
| Fannie Mae 6.50% 2047 | 1,077 | 1,176 |
| Fannie Mae 6.50% 2047 | 735 | 803 |
| Fannie Mae 6.50% 2047 | 650 | 710 |
| Fannie Mae 6.50% 2047 | 127 | 139 |
| Fannie Mae 7.00% 2047 | 1,140 | 1,274 |
| Fannie Mae 7.00% 2047 | 1,011 | 1,130 |
| Fannie Mae 7.00% 2047 | 727 | 813 |
| Fannie Mae 7.00% 2047 | 695 | 776 |
| Freddie Mac, Series K711, Class A2, multifamily 1.73% 2019 | 11,000 | 11,114 |
| Freddie Mac, Series K710, Class A2, multifamily 1.883% 2019 | 6,906 | 7,024 |
| Freddie Mac, Series K709, Class A2, multifamily 2.086% 2019 | 5,880 | 6,078 |
| Freddie Mac, Series 2890, Class KT, 4.50% 2019 | 25,425 | 28,024 |
| Freddie Mac, Series K019, Class A2, multifamily 2.272% 2022 | 8,000 | 8,006 |
| Freddie Mac, Series K023, Class A2, multifamily 2.307% 2022 | 8,995 | 8,897 |
| Freddie Mac, Series K021, Class A2, multifamily 2.396% 2022 | 8,280 | 8,296 |
| Freddie Mac, Series 2289, Class NB, 10.58% 20227 | 32 | 35 |
| Freddie Mac 5.00% 2023 | 5,960 | 6,384 |
| Freddie Mac 5.00% 2023 | 5,868 | 6,278 |
| Freddie Mac 5.00% 2023 | 5,460 | 5,842 |
| Freddie Mac 5.00% 2023 | 1,871 | 2,012 |
| Freddie Mac 6.00% 2026 | 1,098 | 1,219 |
| Freddie Mac 6.00% 2027 | 1,888 | 2,098 |
| Freddie Mac 2.728% 20357 | 2,529 | 2,711 |
| Freddie Mac 4.50% 2035 | 37,167 | 39,656 |
| Freddie Mac, Series 3061, Class PN, 5.50% 2035 | 2,062 | 2,287 |
| Freddie Mac, Series 3257, Class PA, 5.50% 2036 | 11,150 | 12,261 |
| Freddie Mac, Series 3286, Class JN, 5.50% 2037 | 11,938 | 13,188 |
| Freddie Mac, Series 3312, Class PA, 5.50% 2037 | 11,273 | 12,452 |
| Freddie Mac, Series 3318, Class JT, 5.50% 2037 | 6,710 | 7,413 |
| Freddie Mac 5.50% 2037 | 2,458 | 2,660 |
| Freddie Mac, Series 3271, Class OA, 6.00% 2037 | 10,471 | 11,834 |
| Freddie Mac 5.50% 2038 | 6,123 | 6,622 |
| Freddie Mac 6.50% 2038 | 6,217 | 7,062 |
| Freddie Mac 4.50% 2039 | 2,613 | 2,781 |
| Freddie Mac 5.00% 2039 | 5,872 | 6,545 |
| Freddie Mac 5.00% 2039 | 4,549 | 4,961 |
| Freddie Mac 5.00% 2039 | 2,671 | 2,878 |
| Freddie Mac 5.50% 2039 | 3,331 | 3,605 |
| Freddie Mac 5.50% 2039 | 3,045 | 3,293 |
| Freddie Mac 4.50% 2040 | 69,424 | 74,160 |
| Freddie Mac 4.00% 2041 | 3,976 | 4,303 |
| Freddie Mac 4.50% 2041 | 7,343 | 7,860 |
| Freddie Mac 4.50% 2041 | 5,643 | 6,040 |
| Freddie Mac 4.50% 2041 | 5,595 | 5,989 |
| Freddie Mac 5.00% 2041 | 546 | 615 |
| Freddie Mac 5.00% 2041 | 297 | 335 |
| Freddie Mac 4.50% 2042 | 10,786 | 11,482 |
| Freddie Mac 4.50% 2042 | 7,280 | 7,750 |
| Government National Mortgage Assn. 10.00% 2021 | 446 | 495 |
| Government National Mortgage Assn. 10.00% 2025 | 437 | 501 |
| Government National Mortgage Assn. 4.00% 2040 | 78,922 | 86,349 |
| Government National Mortgage Assn. 4.50% 2041 | 3,965 | 4,318 |
| Government National Mortgage Assn. 5.00% 2041 | 12,253 | 13,404 |
| Government National Mortgage Assn. 3.50% 2043 | 12,000 | 12,906 |
| J.P. Morgan Chase Commercial Mortgage Securities Corp., Series 2006-LDP7, Class A-4, 5.872% 20457 | 14,700 | 16,812 |
| J.P. Morgan Chase Commercial Mortgage Securities Corp., Series 2011-C4, Class A-2, 3.341% 20463 | 7,500 | 8,040 |
| J.P. Morgan Chase Commercial Mortgage Securities Corp., Series 2011-C3A, Class A-2, 3.673% 20463 | 24,000 | 26,006 |
| J.P. Morgan Chase Commercial Mortgage Securities Corp., Series 2005-LDP1, Class A-2, 4.625% 2046 | 1,803 | 1,805 |
| J.P. Morgan Chase Commercial Mortgage Securities Corp., Series 2007-CB19, Class A-4, 5.726% 20497 | 15,450 | 18,031 |
| American Tower Trust I, Series 2007-1A, Class A-FX, 5.42% 20373 | 7,250 | 7,385 |
| American Tower Trust I, Series 2007-1A, Class B, 5.537% 20373 | 20,000 | 20,651 |
| American Tower Trust I, Series 2007-1A, Class D, 5.957% 20373 | 29,375 | 30,108 |
| American Tower Trust I, Series 2007-1A, Class E, 6.249% 20373 | 5,000 | 5,213 |
| American Tower Trust I, Series 2007-1A, Class F, 6.639% 20373 | 550 | 559 |
| GE Commercial Mortgage Corp., Series 2006-C1, Class A-4, 5.296% 20447 | 13,000 | 14,511 |
| GE Commercial Mortgage Corp., Series 2005-C4, Class A-3A, 5.308% 20457 | 17,000 | 17,089 |
| ML-CFC Commercial Mortgage Trust, Series 2006-4, Class A-3, 5.172% 20497 | 27,410 | 30,975 |
| Greenwich Capital Commercial Funding Corp., Series 2005-GG5, Class A-2, 5.117% 2037 | 220 | 220 |
| Greenwich Capital Commercial Funding Corp., Series 2005-GG5, Class A-4-1, 5.243% 20377 | 10,000 | 10,012 |
| Greenwich Capital Commercial Funding Corp., Series 2006-GG7, Class A-4, 5.867% 20387 | 7,000 | 7,984 |
| Greenwich Capital Commercial Funding Corp., Series 2007-GG9, Class A-4, 5.444% 2039 | 10,000 | 11,441 |
| J.P. Morgan Chase Commercial Mortgage Securities Trust, Series 2006-LDP6, Class A-4, 5.475% 20437 | 19,896 | 22,403 |
| Citigroup-Deutsche Bank Commercial Mortgage Trust, Series 2005-CD1, Class A-4, 5.219% 20447 | 5,500 | 6,069 |
| Citigroup-Deutsche Bank Commercial Mortgage Trust, Series 2006-CD3, Class A-5, 5.617% 2048 | 13,250 | 15,074 |
| Banc of America Commercial Mortgage Inc., Series 2005-5, Class A-4, 5.115% 20457 | 3,000 | 3,300 |
| Banc of America Commercial Mortgage Inc., Series 2005-5, Class A-3B, 5.23% 20457 | 11,467 | 11,519 |
| Banc of America Commercial Mortgage Inc., Series 2007-3, Class A-4, 5.592% 20497 | 5,000 | 5,767 |
| LB-UBS Commercial Mortgage Trust, Series 2005-C7, Class A-4, 5.197% 20307 | 11,422 | 12,524 |
| Countrywide Alternative Loan Trust, Series 2005-54CB, Class 2-A-5, 5.50% 2035 | 9,757 | 7,908 |
| Countrywide Alternative Loan Trust, Series 2007-HY4, Class 3-A-1, 5.159% 20477 | 6,098 | 4,296 |
| Crown Castle Towers LLC, Series 2010-1, Class C, 4.523% 20353 | 10,000 | 10,650 |
| Bank of Montreal 2.85% 20153 | 10,000 | 10,532 |
| L.A. Arena Funding, LLC, Series 1, Class A, 7.656% 20263 | 7,675 | 8,863 |
| IndyMac INDX Mortgage Loan Trust, Series 2006-AR5, Class 2-A-1, 4.776% 20367 | 9,722 | 8,447 |
| DBUBS Mortgage Trust, Series 2011-LC1A, Class A1, 3.742% 20463 | 7,484 | 8,069 |
| Commonwealth Bank of Australia 0.75% 20163 | 7,000 | 6,985 |
| CS First Boston Mortgage Securities Corp., Series 2004-5, Class IV-A-1, 6.00% 2034 | 1,893 | 1,955 |
| CS First Boston Mortgage Securities Corp., Series 2005-C3, Class A-AB, 4.614% 2037 | 4,414 | 4,554 |
| Structured Adjustable Rate Mortgage Loan Trust, Series 2006-4, Class 6-A, 5.315% 20367 | 7,516 | 6,365 |
| Wachovia Bank Commercial Mortgage Trust, Series 2005-C16, Class A-PB, 4.692% 2041 | 5,454 | 5,559 |
| Residential Accredit Loans, Inc., Series 2005-QR1, Class A, 6.00% 2034 | 3,773 | 3,865 |
| GSR Mortgage Loan Trust, Series 2004-2F, Class VIIA-1, 4.50% 2019 | 3,077 | 3,138 |
| FDIC Structured Sale Guaranteed Notes, Series 2010-L2A, Class A, 3.00% 20193 | 1,317 | 1,342 |
| National Credit Union Administration, Series 2011-M1, Class A2, 1.40% 2015 | 709 | 724 |
| Financial Asset Securitization, Inc., Series 1997-NAM1, Class B-1, 7.75% 2027 | 168 | 172 |
| Bear Stearns Commercial Mortgage Securities Inc., Series 1999-C1, Class X, interest only, 0.703% 20313,7 | 14,025 | 99 |
| | | 2,465,671 |
| | | |
| | | |
| U.S. TREASURY BONDS & NOTES — 3.04% | | |
| U.S. TREASURY — 2.42% | | |
| U.S. Treasury 1.375% 2013 | 245,375 | 246,266 |
| U.S. Treasury 1.50% 2013 | 40,000 | 40,484 |
| U.S. Treasury 2.75% 2013 | 109,500 | 111,620 |
| U.S. Treasury 3.50% 2013 | 92,125 | 93,148 |
| U.S. Treasury 1.875% 2014 | 17,555 | 17,921 |
| U.S. Treasury 1.50% 2016 | 13,500 | 13,957 |
| U.S. Treasury 1.50% 2016 | 7,625 | 7,884 |
| U.S. Treasury 1.75% 2016 | 95,000 | 98,979 |
| U.S. Treasury 2.00% 2016 | 122,375 | 128,130 |
| U.S. Treasury 2.375% 2016 | 100,000 | 106,047 |
| U.S. Treasury 4.50% 2016 | 10,925 | 12,267 |
| U.S. Treasury 4.875% 2016 | 3,500 | 4,033 |
| U.S. Treasury 7.50% 2016 | 20,000 | 25,169 |
| U.S. Treasury 0.625% 2017 | 3,000 | 2,970 |
| U.S. Treasury 2.625% 2018 | 69,500 | 75,546 |
| U.S. Treasury 3.50% 2018 | 22,650 | 25,581 |
| U.S. Treasury 8.75% 2020 | 26,900 | 41,033 |
| U.S. Treasury 8.00% 2021 | 9,025 | 13,694 |
| U.S. Treasury 1.625% 2022 | 250,750 | 242,839 |
| U.S. Treasury 6.25% 2023 | 135,000 | 189,570 |
| U.S. Treasury 6.75% 2026 | 4,575 | 6,886 |
| U.S. Treasury 4.50% 2036 | 106,685 | 135,107 |
| U.S. Treasury 4.625% 2040 | 54,550 | 70,774 |
| U.S. Treasury 3.125% 2041 | 3,575 | 3,576 |
| U.S. Treasury 3.75% 2041 | 74,350 | 83,650 |
| U.S. Treasury 4.75% 2041 | 59,125 | 78,206 |
| U.S. Treasury 2.75% 2042 | 1,725 | 1,589 |
| | | 1,876,926 |
| | | |
| | | |
| U.S. TREASURY INFLATION-PROTECTED SECURITIES10 — 0.62% | | |
| U.S. Treasury Inflation-Protected Security 0.625% 2013 | 15,988 | 16,036 |
| U.S. Treasury Inflation-Protected Security 1.875% 2013 | 31,342 | 32,044 |
| U.S. Treasury Inflation-Protected Security 1.875% 2015 | 44,984 | 49,457 |
| U.S. Treasury Inflation-Protected Security 0.125% 2017 | 183,871 | 197,969 |
| U.S. Treasury Inflation-Protected Security 0.125% 2022 | 80,703 | 87,253 |
| U.S. Treasury Inflation-Protected Security 0.125% 2022 | 3,357 | 3,632 |
| U.S. Treasury Inflation-Protected Security 0.125% 2023 | 38,538 | 41,338 |
| U.S. Treasury Inflation-Protected Security 2.125% 2041 | 1,262 | 1,817 |
| U.S. Treasury Inflation-Protected Security 0.75% 2042 | 44,633 | 47,485 |
| | | 477,031 |
| | | |
| | | |
| | | |
| Total U.S. Treasury bonds & notes | | 2,353,957 |
| | | |
| | | |
| CONSUMER DISCRETIONARY — 2.53% | | |
| Boyd Gaming Corp. 6.75% 2014 | 17,059 | 17,059 |
| Boyd Gaming Corp. 7.125% 2016 | 13,925 | 13,995 |
| Boyd Gaming Corp. 9.125% 2018 | 88,575 | 92,561 |
| Boyd Gaming Corp. 9.00% 20203 | 5,000 | 5,100 |
| MGM Resorts International 5.875% 2014 | 51,925 | 53,872 |
| MGM Resorts International 6.625% 2015 | 22,500 | 24,412 |
| MGM Resorts International 7.50% 2016 | 8,425 | 9,267 |
| MGM Resorts International 8.625% 2019 | 2,425 | 2,777 |
| MGM Resorts International 6.75% 20203 | 7,350 | 7,736 |
| MGM Resorts International 6.625% 2021 | 7,950 | 8,198 |
| MGM Resorts International 7.75% 2022 | 19,000 | 20,805 |
| Comcast Corp. 5.90% 2016 | 10,000 | 11,448 |
| Comcast Corp. 6.30% 2017 | 3,000 | 3,640 |
| Comcast Corp. 3.125% 2022 | 9,405 | 9,449 |
| Comcast Corp. 2.85% 2023 | 9,000 | 8,871 |
| Comcast Corp. 4.25% 2033 | 4,000 | 3,913 |
| Comcast Corp. 5.65% 2035 | 7,000 | 7,929 |
| Comcast Corp. 6.45% 2037 | 25,000 | 31,040 |
| Comcast Corp. 6.95% 2037 | 10,275 | 13,430 |
| Comcast Corp. 4.65% 2042 | 5,565 | 5,605 |
| Toys “R” Us-Delaware, Inc., Term Loan B, 6.00% 20167,8,9 | 6,183 | 6,153 |
| Toys “R” Us-Delaware, Inc. 7.375% 20163 | 8,255 | 8,503 |
| Toys “R” Us Property Co. II, LLC 8.50% 2017 | 14,125 | 14,937 |
| Toys “R” Us Property Co. I, LLC 10.75% 2017 | 31,775 | 34,317 |
| Toys “R” Us-Delaware, Inc., Term Loan B2, 5.25% 20187,8,9 | 26,472 | 25,985 |
| Virgin Media Secured Finance PLC 6.50% 2018 | 8,800 | 9,460 |
| Virgin Media Finance PLC 8.375% 20193 | 41,674 | 47,352 |
| Virgin Media Finance PLC 4.875% 2022 | 5,825 | 5,840 |
| Virgin Media Finance PLC 5.25% 2022 | 25,000 | 26,250 |
| Time Warner Inc. 5.875% 2016 | 8,000 | 9,352 |
| Time Warner Companies, Inc. 7.25% 2017 | 1,500 | 1,868 |
| Time Warner Inc. 4.75% 2021 | 15,500 | 17,558 |
| Time Warner Inc. 3.40% 2022 | 2,150 | 2,209 |
| Time Warner Cable Inc. 4.00% 2022 | 39,350 | 42,583 |
| Time Warner Inc. 6.25% 2041 | 6,650 | 8,007 |
| EchoStar DBS Corp 7.75% 2015 | 7,350 | 8,250 |
| DISH DBS Corp. 4.625% 2017 | 45,105 | 47,360 |
| DISH DBS Corp 7.875% 2019 | 1,425 | 1,692 |
| DISH DBS Corp 6.75% 2021 | 17,400 | 19,575 |
| DISH DBS Corp. 5.875% 2022 | 2,450 | 2,615 |
| Time Warner Cable Inc. 7.50% 2014 | 7,900 | 8,513 |
| Time Warner Cable Inc. 6.75% 2018 | 22,500 | 27,903 |
| Time Warner Cable Inc. 5.00% 2020 | 19,000 | 21,756 |
| Time Warner Cable Inc. 4.125% 2021 | 16,000 | 17,278 |
| Time Warner Cable Inc. 4.50% 2042 | 1,000 | 934 |
| Limited Brands, Inc. 5.25% 2014 | 1,585 | 1,676 |
| Limited Brands, Inc. 8.50% 2019 | 16,105 | 19,890 |
| Limited Brands, Inc. 7.00% 2020 | 21,271 | 24,568 |
| Limited Brands, Inc. 6.625% 2021 | 23,754 | 27,139 |
| Univision Communications Inc., Term Loan B, 4.452% 20177,8,9 | 58,250 | 58,534 |
| Univision Communications Inc. 8.50% 20213 | 3,030 | 3,242 |
| Charter Communications Operating, LLC and Charter Communications Operating Capital Corp. 7.25% 2017 | 38,100 | 41,529 |
| Charter Communications Operating, LLC and Charter Communications Operating Capital Corp. 7.875% 2018 | 8,425 | 9,046 |
| CCO Holdings LLC and CCO Holdings Capital Corp. 7.00% 2019 | 10,000 | 10,862 |
| CityCenter Holdings, LLC and CityCenter Finance Corp. 7.625% 2016 | 49,200 | 53,321 |
| Caesars Entertainment Operating Co. 11.25% 2017 | 24,365 | 26,192 |
| Caesars Entertainment Operating Co. 9.00% 20203 | 10,975 | 11,222 |
| Caesars Entertainment Operating Co. 9.00% 20203 | 3,475 | 3,553 |
| Videotron Ltd. 6.375% 2015 | 4,905 | 4,979 |
| Quebecor Media Inc. 7.75% 2016 | 7,037 | 7,178 |
| Quebecor Media Inc. 5.75% 20233 | 23,975 | 25,234 |
| Cox Communications, Inc. 5.45% 2014 | 1,599 | 1,741 |
| Cox Communications, Inc. 5.875% 20163 | 25,000 | 29,160 |
| Cox Communications, Inc. 3.25% 20223 | 2,930 | 2,940 |
| DaimlerChrysler North America Holding Corp. 6.50% 2013 | 5,400 | 5,641 |
| DaimlerChrysler North America Holding Corp. 1.30% 20153 | 8,500 | 8,549 |
| DaimlerChrysler North America Holding Corp. 2.625% 20163 | 2,000 | 2,085 |
| DaimlerChrysler North America Holding Corp. 2.40% 20173 | 14,000 | 14,425 |
| DaimlerChrysler North America Holding Corp. 8.50% 2031 | 2,000 | 3,082 |
| Home Depot, Inc. 5.95% 2041 | 25,000 | 32,909 |
| Burlington Coat Factory Warehouse Corp., Term Loan B1, 5.50% 20177,8,9 | 24,079 | 24,421 |
| Burlington Coat Factory Warehouse Corp. 10.00% 2019 | 6,700 | 7,320 |
| Neiman Marcus Group, Inc., Term Loan B, 4.75% 20187,8,9 | 31,320 | 31,551 |
| Tousa, Inc. 9.00% 20104,6 | 10,675 | 6,437 |
| Tousa, Inc. 9.00% 20104,6 | 7,815 | 4,712 |
| Tousa, Inc. 9.25% 20113,4,6,7 | 33,175 | 20,005 |
| Marriott International, Inc., Series J, 5.625% 2013 | 8,330 | 8,341 |
| Marriott International, Inc., Series I, 6.375% 2017 | 19,000 | 22,121 |
| Marriott International, Inc., Series L, 3.25% 2022 | 500 | 492 |
| Cinemark USA, Inc. 8.625% 2019 | 23,075 | 25,671 |
| Cinemark USA, Inc. 5.125% 20223 | 5,000 | 5,087 |
| Target Corp. 6.00% 2018 | 24,500 | 29,845 |
| Volkswagen International Finance NV 0.918% 20143,7 | 10,000 | 10,033 |
| Volkswagen International Finance NV 2.875% 20163 | 4,000 | 4,225 |
| Volkswagen International Finance NV 2.375% 20173 | 14,500 | 14,897 |
| Michaels Stores, Inc. 7.75% 2018 | 25,500 | 28,018 |
| News America Inc. 5.30% 2014 | 20,000 | 21,693 |
| News America Inc. 8.00% 2016 | 1,000 | 1,224 |
| News America Inc. 3.00% 2022 | 5,000 | 4,968 |
| CSC Holdings, Inc. 8.625% 2019 | 4,175 | 5,073 |
| Cablevision Systems Corp. 8.00% 2020 | 20,000 | 22,700 |
| Royal Caribbean Cruises Ltd. 11.875% 2015 | 22,175 | 27,026 |
| Revel Entertainment, Term Loan B, 9.00% 20177,8,9 | 63,227 | 26,792 |
| Walt Disney Co. 0.875% 2014 | 19,000 | 19,173 |
| Walt Disney Co. 1.10% 2017 | 7,575 | 7,530 |
| Cequel Communications Holdings I, LLC and Cequel Capital Corp. 6.375% 20203 | 25,125 | 26,444 |
| NBCUniversal Media, LLC 2.10% 2014 | 3,000 | 3,049 |
| NBCUniversal Media, LLC 2.875% 2016 | 10,000 | 10,505 |
| NBCUniversal Media, LLC 4.375% 2021 | 3,750 | 4,138 |
| NBCUniversal Media, LLC 2.875% 2023 | 7,515 | 7,347 |
| NBCUniversal Media, LLC 4.45% 2043 | 1,105 | 1,067 |
| DIRECTV Holdings LLC and DIRECTV Financing Co., Inc. 3.50% 2016 | 24,463 | 25,950 |
| Mediacom LLC and Mediacom Capital Corp. 9.125% 2019 | 15,000 | 16,725 |
| Mediacom LLC and Mediacom Capital Corp. 7.25% 2022 | 7,775 | 8,514 |
| PETCO Animal Supplies, Inc. 9.25% 20183 | 21,600 | 24,003 |
| Burger King Corp 0%/11.00% 20193,11 | 23,475 | 20,188 |
| Mohegan Tribal Gaming Authority 10.50% 20163 | 6,275 | 6,322 |
| Mohegan Tribal Gaming Authority 11.00% 20183,7,12 | 13,725 | 12,009 |
| Warner Music Group 11.50% 2018 | 5,700 | 6,655 |
| Warner Music Group 6.00% 20213 | 10,800 | 11,529 |
| J.C. Penney Co., Inc. 5.75% 2018 | 9,178 | 8,214 |
| J.C. Penney Co., Inc. 5.65% 2020 | 11,135 | 9,312 |
| Needle Merger Sub Corp. 8.125% 20193 | 16,220 | 16,788 |
| Marina District Finance Co., Inc. 9.50% 2015 | 14,500 | 14,826 |
| Sally Holdings LLC and Sally Capital Inc. 6.875% 2019 | 11,950 | 13,265 |
| Laureate Education, Inc. 9.25% 20193 | 11,750 | 12,866 |
| Tenneco Inc. 6.875% 2020 | 11,300 | 12,458 |
| Allison Transmission Holdings, Inc., Term Loan B, 2.71% 20147,8,9 | 12,315 | 12,372 |
| Seminole Tribe of Florida 6.535% 20203,8 | 10,000 | 10,919 |
| Federated Department Stores, Inc. 6.90% 2029 | 7,925 | 9,545 |
| NCL Corp. Ltd. 9.50% 2018 | 8,325 | 9,199 |
| Education Management LLC and Education Management Finance Corp. 8.75% 2014 | 10,965 | 9,156 |
| Staples, Inc. 9.75% 2014 | 8,000 | 8,639 |
| Seneca Gaming Corp. 8.25% 20183 | 7,925 | 8,460 |
| Thomson Reuters Corp. 5.95% 2013 | 3,625 | 3,712 |
| Thomson Reuters Corp. 6.50% 2018 | 3,000 | 3,717 |
| CBS Corp. 1.95% 2017 | 7,000 | 7,123 |
| Jarden Corp. 8.00% 2016 | 5,725 | 6,033 |
| Local T.V. Finance LLC 9.25% 20153,7,12 | 5,730 | 5,802 |
| Dynacast International LLC 9.25% 2019 | 5,325 | 5,711 |
| WPP Finance 2010 4.75% 2021 | 4,750 | 5,122 |
| Omnicom Group Inc. 3.625% 2022 | 4,000 | 4,116 |
| | | 1,957,209 |
| | | |
| | | |
| INDUSTRIALS — 2.09% | | |
| General Electric Co. 0.85% 2015 | 10,000 | 10,023 |
| General Electric Capital Corp. 1.00% 2015 | 7,350 | 7,391 |
| General Electric Capital Corp., Series A, 2.25% 2015 | 12,000 | 12,416 |
| General Electric Capital Corp. 2.95% 2016 | 4,650 | 4,916 |
| General Electric Capital Corp. 1.60% 2017 | 8,500 | 8,490 |
| General Electric Capital Corp. 2.10% 2019 | 2,975 | 2,991 |
| General Electric Capital Corp., Series A, 6.00% 2019 | 9,000 | 10,901 |
| General Electric Capital Corp. 3.10% 2023 | 14,000 | 13,860 |
| General Electric Co. 4.125% 2042 | 15,000 | 14,898 |
| General Electric Capital Corp., Series B, junior subordinated 6.25% (undated)7 | 56,000 | 61,394 |
| General Electric Capital Corp., Series A, junior subordinated 7.125% (undated)7 | 130,600 | 150,366 |
| Hawker Beechcraft Acquisition Co., LLC, Debtor in Possession Delayed Draw, 9.75% 20137,8,9 | 23,961 | 24,490 |
| Hawker Beechcraft Acquisition Co., LLC, Letter of Credit, 2.211% 20147,8,9 | 3,090 | 1,678 |
| Hawker Beechcraft Acquisition Co., LLC, Term Loan B, 4.25% 20147,8,9 | 141,942 | 77,075 |
| Hawker Beechcraft Acquisition Co., LLC, Term Loan B, 10.75% 20147,8,9 | 24,818 | 14,053 |
| Hawker Beechcraft Acquisition Co., LLC 8.50% 20156 | 3,570 | 321 |
| Hawker Beechcraft Acquisition Co., LLC 8.875% 20156,12 | 14,057 | 1,265 |
| Hawker Beechcraft Acquisition Co., LLC 9.75% 20176 | 4,450 | 3 |
| CEVA Group PLC 11.625% 20163 | 3,725 | 3,874 |
| CEVA Group PLC 8.375% 20173 | 13,950 | 14,334 |
| CEVA Group PLC 11.50% 20183 | 28,080 | 24,921 |
| CEVA Group PLC 12.75% 20203 | 77,775 | 61,442 |
| Ply Gem Industries, Inc. 9.375% 2017 | 9,000 | 9,810 |
| Ply Gem Industries, Inc. 8.25% 2018 | 82,175 | 89,776 |
| US Investigations Services, Inc., Term Loan B, 2.955% 20157,8,9 | 13,204 | 12,676 |
| US Investigations Services, Inc., Term Loan D, 7.75% 20157,8,9 | 18,652 | 18,594 |
| US Investigations Services, Inc. 10.50% 20153 | 49,850 | 44,366 |
| US Investigations Services, Inc. 11.75% 20163 | 19,814 | 15,356 |
| United Air Lines, Inc., Term Loan B, 2.25% 20147,8,9 | 16,162 | 16,248 |
| Continental Airlines, Inc., Series 1997-1, Class A, 7.461% 20168 | 1,445 | 1,508 |
| Continental Airlines, Inc., Series 2001-1, Class B, 7.373% 20178 | 2,194 | 2,339 |
| Continental Airlines, Inc., Series 1998-1, Class B, 6.748% 20188 | 586 | 607 |
| Continental Airlines, Inc., Series 1997-4B, Class B, 6.90% 20188 | 134 | 138 |
| Continental Airlines, Inc., Series 1998-1, Class A, 6.648% 20198 | 6,838 | 7,348 |
| Continental Airlines, Inc., Series 1997-4, Class A, 6.90% 20198 | 2,301 | 2,513 |
| United Air Lines, Inc., Series 1996-A2, 7.87% 20194,6,8 | 2,421 | — |
| Continental Airlines, Inc., Series 2000-2, Class B, 8.307% 20198 | 301 | 318 |
| Continental Airlines, Inc., Series 1999-1, Class A, 6.545% 20208 | 13,224 | 14,580 |
| Continental Airlines, Inc., Series 1999-1, Class B, 6.795% 20208 | 370 | 388 |
| Continental Airlines, Inc., Series 1999-2, Class A-1, 7.256% 20218 | 519 | 569 |
| United Air Lines, Inc., Series 2007-1, Class B, 7.336% 20213,8 | 4,420 | 4,486 |
| Continental Airlines, Inc., Series 1999-2, Class B, 7.566% 20218 | 1,441 | 1,512 |
| Continental Airlines, Inc., Series 2001-1, Class A-1, 6.703% 20228 | 3,579 | 3,911 |
| Continental Airlines, Inc., Series 2007-1, Class B, 6.903% 20228 | 10,743 | 11,555 |
| Continental Airlines, Inc., Series 2000-2, Class A-1, 7.707% 20228 | 2,815 | 3,212 |
| Continental Airlines, Inc., Series 2000-1, Class A-1, 8.048% 20228 | 5,162 | 5,943 |
| Continental Airlines, Inc., Series 2000-1, Class B, 8.388% 20228 | 458 | 491 |
| United Air Lines, Inc., Series 2007-1, Class A, 6.636% 20248 | 7,232 | 7,856 |
| Associated Materials, LLC and AMH New Finance, Inc. 9.125% 2017 | 75,245 | 77,502 |
| DAE Aviation Holdings, Inc. 11.25% 20153 | 1,786 | 1,844 |
| DAE Aviation Holdings, Inc. and Standard Aero Ltd., Term Loan B 6.25% 20187,8,9 | 37,544 | 38,341 |
| DAE Aviation Holdings, Inc., Term Loan B2 6.25% 20187,8,9 | 17,020 | 17,381 |
| BE Aerospace, Inc. 5.25% 2022 | 49,405 | 52,246 |
| JELD-WEN Escrow Corp. 12.25% 20173 | 43,750 | 51,187 |
| Nortek Inc. 10.00% 2018 | 22,255 | 25,371 |
| Nortek Inc. 8.50% 2021 | 21,625 | 24,598 |
| Northwest Airlines, Inc., Term Loan B, 3.81% 20137,8,9 | 2,248 | 2,219 |
| Northwest Airlines, Inc., Term Loan A, 2.06% 20187,8,9 | 43,516 | 40,905 |
| Delta Air Lines, Inc., Series 2002-1, Class G-1, MBIA insured, 6.718% 20248 | 5,195 | 5,793 |
| Nielsen Finance LLC and Nielsen Finance Co. 11.625% 2014 | 25,868 | 28,519 |
| Nielsen Finance LLC and Nielsen Finance Co. 7.75% 2018 | 1,000 | 1,119 |
| Nielsen Finance LLC and Nielsen Finance Co. 4.50% 20203 | 14,250 | 14,107 |
| TransDigm Inc. 7.75% 2018 | 17,395 | 19,417 |
| TransDigm Inc. 5.50% 20203 | 22,000 | 23,045 |
| Esterline Technologies Corp. 6.625% 2017 | 13,025 | 13,383 |
| Esterline Technologies Corp. 7.00% 2020 | 16,590 | 18,498 |
| Union Pacific Corp. 5.125% 2014 | 15,325 | 16,023 |
| Union Pacific Corp. 5.75% 2017 | 2,065 | 2,459 |
| Union Pacific Corp. 5.70% 2018 | 8,000 | 9,665 |
| Union Pacific Corp. 2.95% 2023 | 3,000 | 3,062 |
| Navios Maritime Acquisition Corporation and Navios Acquisition Finance (US) Inc. 8.625% 2017 | 14,115 | 13,374 |
| Navios Maritime Holdings Inc. 8.875% 2017 | 7,750 | 7,692 |
| Navios Maritime Holdings Inc. and Navios Maritime Finance II (US) Inc. 8.125% 2019 | 11,580 | 9,901 |
| Euramax International, Inc. 9.50% 2016 | 31,755 | 30,961 |
| Burlington Northern Santa Fe LLC 7.00% 2014 | 13,885 | 14,752 |
| Burlington Northern Santa Fe LLC 4.10% 2021 | 7,000 | 7,700 |
| Burlington Northern Santa Fe LLC 3.05% 2022 | 2,350 | 2,392 |
| Burlington Northern Santa Fe LLC 4.375% 2042 | 850 | 858 |
| United Technologies Corp. 1.80% 2017 | 6,905 | 7,060 |
| United Technologies Corp. 3.10% 2022 | 11,400 | 11,813 |
| United Technologies Corp. 4.50% 2042 | 3,765 | 4,064 |
| ARAMARK Corp. 8.50% 2015 | 20,500 | 20,654 |
| ARAMARK Corp. 8.625% 20163,7,12 | 2,000 | 2,053 |
| HD Supply, Inc. 11.50% 20203 | 18,350 | 21,148 |
| Honeywell International Inc. 3.875% 2014 | 13,605 | 14,091 |
| TRAC Intermodal 11.00% 20193 | 12,225 | 13,020 |
| Florida East Coast Railway Corp. 8.125% 2017 | 12,075 | 13,011 |
| CNH Capital LLC 3.875% 20153 | 12,000 | 12,390 |
| Norfolk Southern Corp. 5.75% 2016 | 6,710 | 7,620 |
| Norfolk Southern Corp. 5.75% 2018 | 2,000 | 2,383 |
| Norfolk Southern Corp. 3.00% 2022 | 1,000 | 1,015 |
| Norfolk Southern Corp. 3.95% 2042 | 1,350 | 1,287 |
| AMR Corp. 10.00% 20216 | 3,000 | 2,775 |
| American Airlines, Inc., Series 2011-2, Class A, 8.625% 20238 | 8,461 | 8,847 |
| Kansas City Southern de México, SA de CV 8.00% 2018 | 10,000 | 11,050 |
| RBS Global, Inc. and Rexnord LLC 8.50% 2018 | 9,950 | 10,945 |
| Silver II Borrower S.C.A./Silver II U.S. Holdings, LLC, Term Loan B, 5.00% 20197,8,9 | 10,000 | 10,123 |
| Volvo Treasury AB 5.95% 20153 | 8,835 | 9,649 |
| ADS Waste Escrow, Term Loan B, 5.25% 20197,8,9 | 4,525 | 4,576 |
| ADS Waste Escrow 8.25% 20203 | 4,675 | 5,026 |
| CSX Corp. 5.75% 2013 | 4,960 | 4,989 |
| CSX Corp. 6.25% 2015 | 3,460 | 3,862 |
| Atlas Copco AB 5.60% 20173 | 7,405 | 8,601 |
| R.R. Donnelley & Sons Co. 6.125% 20172 | 2,475 | 2,463 |
| R.R. Donnelley & Sons Co. 7.25% 20182 | 5,150 | 5,099 |
| ERAC USA Finance Co. 5.25% 20203 | 5,000 | 5,703 |
| Canadian National Railway Co. 1.45% 2016 | 5,010 | 5,103 |
| Odebrecht Finance Ltd 5.125% 20223 | 2,050 | 2,214 |
| Odebrecht Finance Ltd 7.125% 20423 | 2,250 | 2,616 |
| Danaher Corp. 2.30% 2016 | 2,000 | 2,101 |
| BakerCorp International, Inc. 8.25% 2019 | 2,000 | 2,035 |
| ABB Finance (USA) Inc. 1.625% 2017 | 1,000 | 1,010 |
| ABB Finance (USA) Inc. 2.875% 2022 | 1,000 | 1,004 |
| John Deere Capital Corp., Series D, 5.75% 2018 | 575 | 698 |
| | | 1,613,614 |
| | | |
| | | |
| ENERGY — 1.82% | | |
| Transocean Inc. 5.05% 2016 | 22,500 | 25,145 |
| Transocean Inc. 2.50% 2017 | 2,080 | 2,089 |
| Transocean Inc. 6.375% 2021 | 60,490 | 71,324 |
| Transocean Inc. 3.80% 2022 | 5,865 | 5,823 |
| Transocean Inc. 7.35% 2041 | 1,340 | 1,666 |
| TransCanada PipeLines Ltd. 7.625% 2039 | 10,750 | 15,808 |
| TransCanada PipeLines Ltd., junior subordinated 6.35% 20677 | 61,150 | 65,246 |
| Kinder Morgan Energy Partners, LP 3.50% 2016 | 33,950 | 36,119 |
| Kinder Morgan Energy Partners, LP 6.00% 2017 | 2,950 | 3,414 |
| Kinder Morgan Energy Partners, LP 9.00% 2019 | 1,660 | 2,208 |
| Kinder Morgan Energy Partners, LP 4.15% 2022 | 12,145 | 12,970 |
| Kinder Morgan Energy Partners, LP 3.45% 2023 | 15,000 | 14,990 |
| Kinder Morgan Energy Partners, LP 6.95% 2038 | 750 | 945 |
| Kinder Morgan Energy Partners, LP 5.00% 2042 | 2,500 | 2,533 |
| Total Capital SA 3.00% 2015 | 11,500 | 12,120 |
| Total Capital SA 3.125% 2015 | 1,200 | 1,274 |
| Total Capital International 1.55% 2017 | 20,000 | 20,165 |
| Total Capital Canada Ltd. 1.45% 2018 | 5,810 | 5,817 |
| Total Capital International 2.875% 2022 | 7,430 | 7,614 |
| Total Capital International 2.70% 2023 | 12,565 | 12,513 |
| Total Capital Canada Ltd. 2.75% 2023 | 8,860 | 8,878 |
| Alpha Natural Resources, Inc. 9.75% 2018 | 27,265 | 29,855 |
| Alpha Natural Resources, Inc. 6.00% 2019 | 18,350 | 16,607 |
| Alpha Natural Resources, Inc. 6.25% 2021 | 18,675 | 16,807 |
| Anadarko Petroleum Corp. 5.95% 2016 | 10,500 | 12,053 |
| Anadarko Petroleum Corp. 6.375% 2017 | 3,500 | 4,152 |
| Anadarko Petroleum Corp. 8.70% 2019 | 31,625 | 42,214 |
| Anadarko Petroleum Corp. 6.20% 2040 | 500 | 590 |
| Petrobras International Finance Co. 5.75% 2020 | 6,535 | 7,335 |
| Petrobras International Finance Co. 5.375% 2021 | 45,215 | 49,771 |
| Petrobras International Finance Co. 6.75% 2041 | 580 | 681 |
| StatoilHydro ASA 3.875% 2014 | 10,000 | 10,392 |
| StatoilHydro ASA 1.80% 2016 | 15,000 | 15,464 |
| Statoil ASA 3.125% 2017 | 10,000 | 10,794 |
| StatoilHydro ASA 5.25% 2019 | 2,000 | 2,395 |
| Statoil ASA 3.15% 2022 | 4,000 | 4,205 |
| StatoilHydro ASA 2.45% 2023 | 10,775 | 10,506 |
| Statoil ASA 4.25% 2041 | 3,000 | 3,120 |
| Ras Laffan Liquefied Natural Gas III 5.50% 20143 | 2,400 | 2,565 |
| Ras Laffan Liquefied Natural Gas III 6.75% 2019 | 4,000 | 5,026 |
| Ras Laffan Liquefied Natural Gas III 6.75% 20193 | 1,000 | 1,256 |
| Ras Laffan Liquefied Natural Gas II 5.298% 20203,8 | 24,862 | 27,933 |
| Ras Laffan Liquefied Natural Gas III 5.838% 20273,8 | 10,325 | 12,493 |
| Peabody Energy Corp. 6.00% 2018 | 26,740 | 28,144 |
| Peabody Energy Corp. 6.25% 2021 | 17,475 | 18,349 |
| CONSOL Energy Inc. 8.00% 2017 | 6,750 | 7,324 |
| CONSOL Energy Inc. 8.25% 2020 | 31,450 | 34,202 |
| Laredo Petroleum, Inc. 9.50% 2019 | 34,200 | 38,817 |
| El Paso Pipeline Partners Operating Co., LLC 5.00% 2021 | 15,745 | 17,551 |
| El Paso Pipeline Partners Operating Co., LLC 4.70% 2042 | 21,015 | 20,117 |
| Chevron Corp. 1.104% 2017 | 6,375 | 6,380 |
| Chevron Corp. 4.95% 2019 | 4,600 | 5,478 |
| Chevron Corp. 2.355% 2022 | 26,250 | 25,789 |
| Arch Coal, Inc. 7.00% 2019 | 23,875 | 21,667 |
| Arch Coal, Inc. 7.25% 2021 | 15,375 | 13,838 |
| Sabine Pass Liquefaction, LLC 5.625% 20213 | 35,000 | 35,175 |
| Shell International Finance BV 1.875% 2013 | 10,000 | 10,023 |
| Shell International Finance BV 4.00% 2014 | 20,000 | 20,813 |
| Enbridge Energy Partners, LP, Series B, 6.50% 2018 | 5,225 | 6,309 |
| Enbridge Energy Partners, LP 9.875% 2019 | 10,500 | 14,245 |
| Enbridge Energy Partners, LP, Series B, 7.50% 2038 | 6,000 | 7,591 |
| Enterprise Products Operating LLC 5.65% 2013 | 10,000 | 10,072 |
| Enterprise Products Operating LLC 5.20% 2020 | 11,250 | 13,174 |
| Enterprise Products Operating LLC 4.05% 2022 | 3,900 | 4,219 |
| BG Energy Capital PLC 2.50% 20153 | 7,000 | 7,317 |
| BG Energy Capital PLC 2.875% 20163 | 11,505 | 12,260 |
| BG Energy Capital PLC 4.00% 20213 | 6,550 | 7,096 |
| QGOG Atlantic/Alaskan Rigs Ltd. 5.25% 20183,8 | 24,484 | 25,586 |
| PDC Energy Inc. 7.75% 20223 | 23,375 | 24,427 |
| Reliance Holdings Ltd. 4.50% 2020 | 11,250 | 11,982 |
| Reliance Holdings Ltd. 4.50% 20203 | 1,260 | 1,342 |
| Reliance Holdings Ltd. 5.40% 20223 | 8,350 | 9,283 |
| Reliance Holdings Ltd. 6.25% 20403 | 1,250 | 1,424 |
| Woodside Finance Ltd. 4.60% 20213 | 21,655 | 23,910 |
| Energy Transfer Partners, L.P. 3.60% 2023 | 19,400 | 19,226 |
| Energy Transfer Partners, L.P. 6.50% 2042 | 955 | 1,106 |
| Energy Transfer Partners, L.P. 5.15% 2043 | 3,000 | 2,984 |
| Enbridge Inc. 5.60% 2017 | 20,067 | 22,989 |
| Southwestern Energy Co. 4.10% 2022 | 21,010 | 22,275 |
| Williams Partners L.P. 4.125% 2020 | 6,500 | 7,000 |
| Williams Partners L.P. and Williams Partners Finance Corp. 5.25% 2020 | 1,960 | 2,246 |
| Williams Partners L.P. 4.00% 2021 | 11,820 | 12,438 |
| Spectra Energy Partners, LP 2.95% 2016 | 3,750 | 3,853 |
| Spectra Energy Partners 4.60% 2021 | 15,730 | 16,614 |
| Apache Corp. 2.625% 2023 | 17,000 | 16,472 |
| Apache Corp. 4.25% 2044 | 3,250 | 3,122 |
| Cenovus Energy Inc. 4.50% 2014 | 12,000 | 12,709 |
| Cenovus Energy Inc. 3.00% 2022 | 2,720 | 2,696 |
| Cenovus Energy Inc. 6.75% 2039 | 2,500 | 3,287 |
| NGPL PipeCo LLC 7.119% 20173 | 3,100 | 3,394 |
| NGPL PipeCo LLC 9.625% 20193 | 12,950 | 15,022 |
| Regency Energy Partners LP and Regency Energy Finance Corp. 6.50% 2021 | 2,800 | 3,073 |
| Regency Energy Partners LP and Regency Energy Finance Corp. 5.50% 2023 | 12,075 | 12,860 |
| Devon Energy Corp. 1.875% 2017 | 6,990 | 7,023 |
| Devon Energy Corp. 3.25% 2022 | 8,000 | 8,057 |
| Energy Transfer Partners, LP 7.50% 2020 | 12,250 | 14,179 |
| MarkWest Energy Partners, LP 4.50% 2023 | 13,550 | 13,499 |
| Gazprom OJSC 3.85% 20203 | 2,750 | 2,759 |
| Gazprom OJSC, Series 9, 6.51% 2022 | 2,000 | 2,340 |
| Gazprom OJSC 6.51% 20223 | 500 | 585 |
| Gazprom OJSC 7.288% 20373 | 4,650 | 5,836 |
| Petróleos Mexicanos 5.50% 2044 | 9,800 | 10,094 |
| Petróleos Mexicanos 5.50% 20443 | 1,000 | 1,030 |
| Access Midstream Partners, L.P. 4.875% 2023 | 9,150 | 9,116 |
| Canadian Natural Resources Ltd. 5.70% 2017 | 7,350 | 8,626 |
| Marathon Oil Corp. 0.90% 2015 | 8,500 | 8,511 |
| ConocoPhillips 1.05% 2017 | 8,500 | 8,445 |
| Western Gas Partners LP 4.00% 2022 | 7,325 | 7,589 |
| PTT Exploration & Production Ltd. 5.692% 20213 | 500 | 581 |
| PTT Exploration & Production Ltd. 6.35% 20423 | 5,830 | 6,950 |
| Denbury Resources Inc. 4.625% 2023 | 6,125 | 6,010 |
| XTO Energy Inc. 5.50% 2018 | 1,750 | 2,136 |
| Odebrecht Drilling Norbe VIII/IX Ltd 6.35% 20213,8 | 1,767 | 1,988 |
| Husky Energy Inc. 5.90% 2014 | 1,000 | 1,070 |
| Transportadora de Gas Internacional 5.70% 20223 | 850 | 956 |
| Dolphin Energy Ltd. 5.50% 20213 | 325 | 375 |
| | | 1,409,900 |
| | | |
| | | |
| TELECOMMUNICATION SERVICES — 1.70% | | |
| Clearwire Communications and Clearwire Finance, Inc., Series B, 12.00% 20153 | 79,320 | 86,112 |
| Clearwire Communications and Clearwire Finance, Inc., Series A, 12.00% 20153 | 72,825 | 79,061 |
| Clearwire Communications and Clearwire Finance, Inc. 14.75% 20163 | 6,125 | 8,606 |
| Clearwire Communications and Clearwire Finance, Inc. 12.00% 20173 | 38,045 | 44,988 |
| Wind Acquisition SA 11.75% 20173 | 102,805 | 111,029 |
| Wind Acquisition SA 7.25% 20183 | 50,980 | 53,911 |
| Wind Acquisition SA 7.25% 20183 | 15,040 | 15,867 |
| Sprint Nextel Corp. 8.375% 2017 | 19,675 | 22,848 |
| Sprint Nextel Corp. 9.125% 2017 | 39,446 | 46,546 |
| Sprint Nextel Corp. 9.00% 20183 | 5,000 | 6,200 |
| Sprint Nextel Corp. 7.00% 2020 | 49,000 | 53,287 |
| Sprint Nextel Corp. 11.50% 2021 | 20,975 | 28,762 |
| Frontier Communications Corp. 8.25% 2017 | 36,875 | 42,867 |
| Frontier Communications Corp. 8.125% 2018 | 2,467 | 2,868 |
| Frontier Communications Corp. 8.50% 2020 | 15,475 | 17,951 |
| Frontier Communications Corp. 9.25% 2021 | 20,625 | 24,441 |
| Frontier Communications Corp. 8.75% 2022 | 6,425 | 7,469 |
| Frontier Communications Corp. 7.125% 2023 | 30,825 | 32,867 |
| Verizon Communications Inc. 5.55% 2014 | 37,250 | 38,967 |
| Verizon Communications Inc. 0.70% 2015 | 11,000 | 11,005 |
| Verizon Communications Inc. 3.00% 2016 | 17,000 | 18,092 |
| Verizon Communications Inc. 1.10% 2017 | 10,000 | 9,892 |
| Verizon Communications Inc. 2.45% 2022 | 3,250 | 3,122 |
| Verizon Communications Inc. 4.75% 2041 | 2,075 | 2,198 |
| Verizon Communications Inc. 6.00% 2041 | 32,925 | 41,039 |
| Vodafone Group PLC, Term Loan B, 6.875% 20158,9,12 | 69,082 | 71,327 |
| Vodafone Group PLC, Term Loan B, 6.25% 20164,8,9,12 | 19,623 | 20,261 |
| LightSquared, Term Loan B, 12.00% 20146,8,9,12 | 96,867 | 89,117 |
| Cricket Communications, Inc. 7.75% 2016 | 55,790 | 58,998 |
| Cricket Communications, Inc. 7.75% 2020 | 15,500 | 16,159 |
| Telecom Italia Capital SA, Series B, 5.25% 2013 | 4,000 | 4,115 |
| Telecom Italia Capital SA 5.25% 2015 | 10,535 | 11,299 |
| Telecom Italia Capital SA 6.999% 2018 | 24,140 | 28,295 |
| Telecom Italia Capital SA 7.175% 2019 | 2,000 | 2,393 |
| SBC Communications Inc. 5.10% 2014 | 3,500 | 3,747 |
| AT&T Inc. 2.40% 2016 | 9,000 | 9,395 |
| SBC Communications Inc. 5.625% 2016 | 10,000 | 11,479 |
| AT&T Inc. 1.40% 2017 | 10,750 | 10,682 |
| AT&T Inc. 4.30% 20423 | 9,000 | 8,585 |
| France Télécom 2.75% 2016 | 9,000 | 9,410 |
| France Télécom 4.125% 2021 | 15,000 | 16,227 |
| Deutsche Telekom International Finance BV 4.875% 2014 | 10,000 | 10,579 |
| Deutsche Telekom International Finance BV 9.25% 2032 | 8,420 | 13,125 |
| Deutsche Telekom International Finance BV 4.875% 20423 | 350 | 360 |
| tw telecom holdings inc. 8.00% 2018 | 20,000 | 21,950 |
| tw telecom holdings inc. 5.375% 2022 | 1,825 | 1,925 |
| Trilogy International Partners, LLC, 10.25% 20163 | 24,750 | 22,523 |
| Crown Castle International Corp. 7.125% 2019 | 19,000 | 21,209 |
| Telefónica Emisiones, SAU 3.992% 2016 | 10,000 | 10,427 |
| Telefónica Emisiones, SAU 5.134% 2020 | 7,950 | 8,437 |
| Syniverse Holdings, Inc. 9.125% 2019 | 7,800 | 8,521 |
| Qwest Capital Funding, Inc. 7.625% 2021 | 3,900 | 4,274 |
| SBA Communications Corp. 5.75% 20203 | 3,375 | 3,556 |
| Level 3 Communications, Inc. 11.875% 2019 | 3,000 | 3,495 |
| | | 1,311,865 |
| | | |
| | | |
| HEALTH CARE — 1.64% | | |
| Amgen Inc. 2.50% 2016 | 21,375 | 22,415 |
| Amgen Inc. 2.125% 2017 | 8,500 | 8,760 |
| Amgen Inc. 3.875% 2021 | 20,400 | 22,186 |
| Amgen Inc. 3.625% 2022 | 5,885 | 6,242 |
| Amgen Inc. 5.15% 2041 | 2,750 | 3,022 |
| Amgen Inc. 5.375% 2043 | 49,060 | 56,282 |
| inVentiv Health Inc. 9.00% 20183 | 35,035 | 36,042 |
| inVentiv Health Inc. 10.00% 20183 | 22,915 | 20,394 |
| inVentiv Health Inc. 10.25% 20183 | 53,835 | 47,913 |
| Quintiles, Term Loan B-2, 4.50% 20187,8,9 | 65,827 | 66,670 |
| Express Scripts Inc. 2.75% 2014 | 1,000 | 1,031 |
| Express Scripts Inc. 6.25% 2014 | 4,000 | 4,293 |
| Medco Health Solutions, Inc. 2.75% 2015 | 6,305 | 6,575 |
| Express Scripts Inc. 3.125% 2016 | 24,864 | 26,250 |
| Express Scripts Inc. 7.25% 2019 | 8,985 | 11,434 |
| Express Scripts Inc. 4.75% 2021 | 1,000 | 1,124 |
| Express Scripts Inc. 3.90% 2022 | 8,500 | 9,026 |
| Express Scripts Inc. 6.125% 2041 | 2,750 | 3,423 |
| Kinetic Concepts, Inc. 10.50% 20183 | 38,097 | 40,954 |
| Kinetic Concepts, Inc. 12.50% 20193 | 21,930 | 21,327 |
| Boston Scientific Corp. 6.40% 2016 | 21,735 | 24,959 |
| Boston Scientific Corp. 6.00% 2020 | 23,580 | 27,331 |
| AbbVie Inc. 1.75% 20173 | 8,500 | 8,529 |
| AbbVie Inc. 2.90% 20223 | 10,000 | 9,909 |
| AbbVie Inc. 4.40% 20423 | 30,520 | 30,797 |
| Novartis Capital Corp. 4.125% 2014 | 17,250 | 17,875 |
| Novartis Capital Corp. 2.90% 2015 | 14,000 | 14,709 |
| Novartis Securities Investment Ltd. 5.125% 2019 | 10,500 | 12,530 |
| Novartis Capital Corp. 2.40% 2022 | 1,000 | 980 |
| VPI Escrow Corp. 6.375% 20203 | 39,970 | 41,669 |
| Elan Finance PLC and Elan Finance Corp. 6.25% 20193 | 36,545 | 39,286 |
| VWR Funding, Inc. 7.25% 20173 | 36,795 | 39,141 |
| Roche Holdings, Inc. 6.00% 20193 | 17,750 | 21,967 |
| Roche Holdings, Inc. 7.00% 20393 | 9,500 | 13,884 |
| GlaxoSmithKline Capital Inc. 4.85% 2013 | 13,500 | 13,675 |
| GlaxoSmithKline Capital Inc. 1.50% 2017 | 10,160 | 10,267 |
| GlaxoSmithKline Capital Inc. 2.85% 2022 | 11,000 | 11,136 |
| PTS Acquisition Corp. 9.50% 201512 | 34,252 | 34,766 |
| Patheon Inc., Term Loan B1, 7.25% 20187,8,9 | 34,027 | 34,580 |
| Symbion Inc. 8.00% 2016 | 32,230 | 33,922 |
| Gilead Sciences, Inc. 3.05% 2016 | 10,265 | 11,000 |
| Gilead Sciences, Inc. 4.40% 2021 | 15,010 | 16,856 |
| Gilead Sciences, Inc. 5.65% 2041 | 4,715 | 5,765 |
| Tenet Healthcare Corp. 9.25% 2015 | 22,805 | 25,884 |
| Tenet Healthcare Corp. 4.50% 20213 | 7,040 | 6,943 |
| Centene Corp. 5.75% 2017 | 23,240 | 24,925 |
| Aetna Inc. 1.50% 2017 | 11,335 | 11,327 |
| Aetna Inc. 2.75% 2022 | 13,000 | 12,610 |
| Grifols Inc. 8.25% 2018 | 21,643 | 23,861 |
| Merge Healthcare Inc 11.75% 2015 | 21,065 | 22,645 |
| Pfizer Inc 5.35% 2015 | 20,000 | 21,951 |
| Humana Inc. 4.625% 2042 | 20,000 | 19,494 |
| UnitedHealth Group Inc. 0.85% 2015 | 830 | 833 |
| UnitedHealth Group Inc. 1.40% 2017 | 460 | 460 |
| UnitedHealth Group Inc. 6.00% 2017 | 12,430 | 14,820 |
| UnitedHealth Group Inc. 2.75% 2023 | 660 | 653 |
| UnitedHealth Group Inc. 4.625% 2041 | 1,790 | 1,874 |
| UnitedHealth Group Inc. 3.95% 2042 | 210 | 198 |
| Surgical Care Affiliates, Inc. 8.875% 20153 | 6,591 | 6,756 |
| Surgical Care Affiliates, Inc. 10.00% 20173 | 9,500 | 9,987 |
| HCA Inc. 6.375% 2015 | 7,400 | 7,992 |
| HCA Inc., Term Loan B2, 3.561% 20177,8,9 | 6,292 | 6,347 |
| HCA Inc. 7.50% 2022 | 1,850 | 2,141 |
| Teva Pharmaceutical Financial IV LLC, 2.25% 2020 | 15,655 | 15,647 |
| Cardinal Health, Inc. 4.00% 2015 | 3,000 | 3,224 |
| Cardinal Health, Inc. 5.80% 2016 | 10,000 | 11,587 |
| Cardinal Health, Inc. 1.90% 2017 | 740 | 751 |
| McKesson Corp. 0.95% 2015 | 1,135 | 1,139 |
| McKesson Corp. 3.25% 2016 | 7,525 | 8,043 |
| McKesson Corp. 4.75% 2021 | 3,475 | 3,973 |
| McKesson Corp. 2.70% 2022 | 1,895 | 1,861 |
| Rotech Healthcare Inc. 10.50% 2018 | 19,690 | 12,897 |
| Multiplan Inc. 9.875% 20183 | 11,200 | 12,544 |
| Merck & Co., Inc. 1.10% 2018 | 11,500 | 11,425 |
| WellPoint, Inc. 6.00% 2014 | 10,000 | 10,549 |
| Alkermes Inc., Term Loan B, 4.50% 20197,8,9 | 10,369 | 10,518 |
| Sanofi 0.51% 20137 | 10,000 | 10,005 |
| Endo Pharmaceuticals Holdings Inc. 7.00% 2019 | 2,450 | 2,677 |
| Endo Pharmaceuticals Holdings Inc. 7.00% 2020 | 6,350 | 6,969 |
| Coventry Health Care, Inc. 6.30% 2014 | 8,370 | 9,016 |
| Bausch & Lomb Inc. 9.875% 2015 | 8,616 | 8,918 |
| Biogen Idec Inc. 6.00% 2013 | 6,000 | 6,024 |
| DENTSPLY International Inc. 2.75% 2016 | 5,620 | 5,819 |
| INC Research LLC 11.50% 20193 | 1,630 | 1,728 |
| Catholic Health Initiatives, Series 2012, 1.60% 2017 | 1,000 | 1,007 |
| | | 1,268,918 |
| | | |
| | | |
| INFORMATION TECHNOLOGY — 1.22% | | |
| First Data Corp. 9.875% 2015 | 4,958 | 5,094 |
| First Data Corp. 9.875% 2015 | 1,451 | 1,495 |
| First Data Corp. 10.55% 201512 | 13,581 | 14,031 |
| First Data Corp. 11.25% 2016 | 156,200 | 156,200 |
| First Data Corp., Term Loan D, 5.205% 20177,8,9 | 50,125 | 50,274 |
| First Data Corp. 7.375% 20193 | 28,325 | 29,954 |
| First Data Corp. 6.75% 20203 | 5,200 | 5,369 |
| First Data Corp. 8.25% 20213 | 32,230 | 33,358 |
| First Data Corp. 12.625% 2021 | 18,339 | 19,622 |
| First Data Corp. 8.75% 20223,7,12 | 85,616 | 89,469 |
| SRA International, Inc., Term Loan B, 6.50% 20187,8,9 | 68,070 | 67,814 |
| SRA International, Inc. 11.00% 2019 | 58,195 | 60,959 |
| Freescale Semiconductor, Inc., Term Loan, 4.46% 20167,8,9 | 13,647 | 13,700 |
| Freescale Semiconductor, Inc. 10.125% 2016 | 4,500 | 4,635 |
| Freescale Semiconductor, Inc. 9.25% 20183 | 18,000 | 19,890 |
| Freescale Semiconductor, Inc. 10.125% 20183 | 24,756 | 27,479 |
| Freescale Semiconductor, Inc., Term Loan B, 6.00% 20197,8,9 | 27,691 | 27,881 |
| SunGard Data Systems Inc. 7.375% 2018 | 31,600 | 33,733 |
| SunGard Data Systems Inc., Term Loan B, 4.50% 20197,8,9 | 10,350 | 10,538 |
| SunGard Data Systems Inc. 7.625% 2020 | 21,165 | 23,176 |
| International Business Machines Corp. 1.95% 2016 | 10,000 | 10,385 |
| International Business Machines Corp. 2.00% 2016 | 35,000 | 36,281 |
| International Business Machines Corp. 1.875% 2022 | 2,000 | 1,895 |
| International Business Machines Corp. 5.60% 2039 | 96 | 120 |
| International Business Machines Corp. 4.00% 2042 | 1,910 | 1,948 |
| Blackboard Inc., Term Loan B2, 6.25% 20187,8,9 | 16,619 | 16,619 |
| Blackboard Inc., Term Loan B, 7.50% 20187,8,9 | 24,984 | 25,365 |
| Jabil Circuit, Inc. 8.25% 2018 | 20,925 | 25,110 |
| Jabil Circuit, Inc. 5.625% 2020 | 11,150 | 12,154 |
| Jabil Circuit, Inc. 4.70% 2022 | 2,050 | 2,112 |
| Cisco Systems, Inc. 2.90% 2014 | 10,000 | 10,429 |
| Cisco Systems, Inc. 4.95% 2019 | 20,000 | 23,651 |
| Lawson Software, Inc., Term Loan B2, 5.25% 20187,8,9 | 4,988 | 5,067 |
| Lawson Software, Inc. 9.375% 2019 | 15,500 | 17,593 |
| Ceridian Corp. 11.25% 2015 | 15,000 | 15,263 |
| Hughes Satellite Systems Corp. 6.50% 2019 | 9,550 | 10,601 |
| Hughes Satellite Systems Corp. 7.625% 2021 | 1,175 | 1,351 |
| Serena Software, Inc. 10.375% 2016 | 10,776 | 11,045 |
| Oracle Corp. 1.20% 2017 | 10,065 | 10,048 |
| Xerox Corp. 6.40% 2016 | 768 | 865 |
| Xerox Corp. 2.95% 2017 | 7,940 | 8,067 |
| Xerox Corp. 6.75% 2017 | 360 | 416 |
| Samsung Electronics America, Inc. 1.75% 20173 | 3,500 | 3,533 |
| NXP BV and NXP Funding LLC 9.75% 20183 | 1,795 | 2,073 |
| | | 946,662 |
| | | |
| | | |
| MATERIALS — 1.09% | | |
| ArcelorMittal 5.375% 2013 | 4,750 | 4,800 |
| ArcelorMittal 4.25% 20157 | 10,000 | 10,306 |
| ArcelorMittal 5.00% 20177 | 15,680 | 16,069 |
| ArcelorMittal 6.00% 20217 | 7,430 | 7,823 |
| ArcelorMittal 6.75% 20227 | 33,295 | 36,685 |
| ArcelorMittal 7.25% 20417 | 43,736 | 43,811 |
| Reynolds Group Inc. 8.50% 2018 | 19,595 | 20,673 |
| Reynolds Group Inc. 7.125% 2019 | 8,000 | 8,580 |
| Reynolds Group Inc. 7.875% 2019 | 3,850 | 4,254 |
| Reynolds Group Inc. 9.875% 2019 | 11,570 | 12,669 |
| Reynolds Group Inc. 5.75% 2020 | 57,520 | 58,958 |
| Georgia Gulf Corp. 9.00% 20173 | 48,132 | 54,028 |
| Georgia Gulf Corp. 4.625% 20213 | 7,750 | 7,828 |
| Georgia Gulf Corp. 4.875% 20233 | 16,560 | 16,746 |
| Inmet Mining Corp. 8.75% 20203 | 40,340 | 44,979 |
| Inmet Mining Corp. 7.50% 20213 | 10,800 | 11,664 |
| FMG Resources 6.375% 20163 | 3,000 | 3,098 |
| FMG Resources, Term Loan, 5.25% 20177,8,9 | 14,299 | 14,518 |
| FMG Resources 6.00% 20173 | 21,180 | 21,868 |
| FMG Resources 8.25% 20193 | 1,150 | 1,239 |
| Cliffs Natural Resources Inc. 4.875% 20212 | 32,512 | 32,138 |
| Cliffs Natural Resources Inc. 6.25% 20402 | 1,000 | 970 |
| Xstrata Canada Financial Corp. 2.85% 20143 | 5,000 | 5,140 |
| Xstrata Canada Financial Corp. 2.45% 20173 | 7,500 | 7,571 |
| Xstrata Canada Financial Corp. 3.60% 20173 | 5,000 | 5,266 |
| Xstrata Canada Financial Corp. 4.95% 20213 | 11,500 | 12,250 |
| Xstrata Canada Financial Corp. 4.00% 20223 | 2,000 | 2,003 |
| Newpage Corp., Term Loan B, 7.75% 20197,8,9 | 28,130 | 28,763 |
| U.S. Coatings Acquisition Inc. and Flash Dutch 2 BV, Term Loan B, 4.75% 20207,8,9 | 23,715 | 24,110 |
| U.S. Coatings Acquisition Inc. and Flash Dutch 2 BV 7.375% 20213 | 1,560 | 1,613 |
| Newcrest Finance Pty Ltd. 4.45% 20213 | 11,895 | 12,505 |
| Newcrest Finance Pty Ltd. 4.20% 20223 | 9,920 | 10,191 |
| Newcrest Finance Pty Ltd. 5.75% 20413 | 2,000 | 2,177 |
| Rio Tinto Finance (USA) Ltd. 8.95% 2014 | 2,500 | 2,753 |
| Rio Tinto Finance (USA) Ltd. 2.25% 2016 | 9,000 | 9,335 |
| Rio Tinto Finance (USA) Ltd. 1.625% 2017 | 8,500 | 8,529 |
| Rio Tinto Finance (USA) Ltd. 9.00% 2019 | 3,000 | 4,169 |
| Consolidated Minerals Ltd. 8.875% 20163 | 26,455 | 24,471 |
| Ryerson Inc. 9.00% 20173 | 18,200 | 19,633 |
| Ryerson Inc. 11.25% 20183 | 4,625 | 4,608 |
| Ball Corp. 7.125% 2016 | 12,700 | 13,621 |
| Ball Corp. 5.75% 2021 | 8,615 | 9,283 |
| Ball Corp. 5.00% 2022 | 940 | 1,001 |
| Walter Energy, Inc. 9.875% 20203 | 20,515 | 22,720 |
| International Paper Co. 7.40% 2014 | 12,500 | 13,487 |
| International Paper Co. 7.30% 2039 | 5,615 | 7,333 |
| BHP Billiton Finance (USA) Ltd. 5.50% 2014 | 11,730 | 12,414 |
| BHP Billiton Finance (USA) Ltd. 1.00% 2015 | 3,000 | 3,029 |
| BHP Billiton Finance (USA) Ltd. 1.625% 2017 | 3,000 | 3,042 |
| JMC Steel Group Inc. 8.25% 20183 | 13,500 | 14,445 |
| MacDermid 9.50% 20173 | 12,850 | 13,428 |
| Teck Resources Ltd. 3.15% 2017 | 2,500 | 2,600 |
| Teck Resources Ltd. 4.75% 2022 | 7,745 | 8,416 |
| Teck Resources Ltd. 6.25% 2041 | 1,750 | 1,980 |
| Dow Chemical Co. 7.60% 2014 | 6,192 | 6,728 |
| Dow Chemical Co. 5.25% 2041 | 4,000 | 4,319 |
| E.I. du Pont de Nemours and Co. 0.73% 20147 | 10,000 | 10,047 |
| Sherwin-Williams Co. 1.35% 2017 | 10,000 | 9,983 |
| Ecolab Inc. 3.00% 2016 | 7,455 | 7,934 |
| Ecolab Inc. 4.35% 2021 | 1,000 | 1,112 |
| Ecolab Inc. 5.50% 2041 | 750 | 889 |
| Praxair, Inc. 4.375% 2014 | 1,000 | 1,044 |
| Praxair, Inc. 1.05% 2017 | 8,500 | 8,455 |
| OMNOVA Solutions Inc. 7.875% 2018 | 8,500 | 8,904 |
| Smurfit Capital Funding PLC 7.50% 2025 | 7,125 | 7,642 |
| Anglo American Capital PLC 2.15% 20133 | 5,000 | 5,035 |
| PQ Corp. 8.75% 20183 | 4,700 | 4,994 |
| Taminco Global Chemical Corp. 9.75% 20203 | 4,440 | 4,906 |
| Ardagh Packaging Finance 4.875% 20223 | 3,535 | 3,526 |
| Packaging Dynamics Corp. 8.75% 20163 | 2,865 | 3,008 |
| Arbermarle Corp. 5.10% 2015 | 2,570 | 2,765 |
| Crown Holdings, Inc. 4.50% 20233 | 2,315 | 2,292 |
| Airgas, Inc. 7.125% 2018 | 1,250 | 1,343 |
| CEMEX España, SA 9.25% 20203 | 979 | 1,062 |
| | | 841,578 |
| | | |
| | | |
| CONSUMER STAPLES — 1.03% | | |
| Anheuser-Busch InBev NV 0.665% 20147 | 15,150 | 15,208 |
| Anheuser-Busch InBev NV 3.625% 2015 | 21,000 | 22,357 |
| Anheuser-Busch InBev NV 4.125% 2015 | 10,000 | 10,664 |
| Anheuser-Busch InBev NV 0.80% 2016 | 2,500 | 2,499 |
| Anheuser-Busch InBev NV 1.375% 2017 | 11,500 | 11,554 |
| Anheuser-Busch InBev NV 1.25% 2018 | 2,500 | 2,484 |
| Anheuser-Busch InBev NV 7.75% 2019 | 25,000 | 33,042 |
| Anheuser-Busch InBev NV 2.625% 2023 | 2,000 | 1,977 |
| Anheuser-Busch InBev NV 4.00% 2043 | 2,000 | 1,991 |
| Altria Group, Inc. 9.70% 2018 | 6,081 | 8,403 |
| Altria Group, Inc. 9.25% 2019 | 18,542 | 25,639 |
| Altria Group, Inc. 4.75% 2021 | 3,000 | 3,342 |
| Altria Group, Inc. 9.95% 2038 | 23,500 | 38,446 |
| Altria Group, Inc. 4.25% 2042 | 23,000 | 21,689 |
| Rite Aid Corp. 9.75% 2016 | 10,000 | 10,750 |
| Rite Aid Corp. 10.375% 2016 | 11,488 | 12,206 |
| Rite Aid Corp. 10.25% 2019 | 19,590 | 22,626 |
| Rite Aid Corp. 8.00% 2020 | 11,450 | 13,110 |
| Kraft Foods Inc. 1.625% 2015 | 2,000 | 2,035 |
| Kraft Foods Inc. 2.25% 2017 | 4,105 | 4,231 |
| Kraft Foods Inc. 5.375% 2020 | 6,021 | 7,138 |
| Kraft Foods Inc. 3.50% 2022 | 3,000 | 3,144 |
| Kraft Foods Inc. 6.50% 2040 | 3,000 | 3,857 |
| Kraft Foods Inc. 5.00% 2042 | 32,000 | 34,893 |
| SABMiller Holdings Inc. 1.85% 20153 | 2,000 | 2,037 |
| SABMiller Holdings Inc. 2.45% 20173 | 14,865 | 15,389 |
| SABMiller Holdings Inc. 3.75% 20223 | 22,500 | 23,946 |
| SABMiller Holdings Inc. 4.95% 20423 | 10,500 | 11,652 |
| Albertson’s, Inc. 7.25% 2013 | 10,730 | 10,891 |
| SUPERVALU Inc. 7.50% 2014 | 39,290 | 39,634 |
| SUPERVALU Inc., Term Loan B, 8.00% 20187,8,9 | 680 | 693 |
| Pernod Ricard SA 2.95% 20173 | 23,000 | 24,047 |
| Pernod Ricard SA 4.45% 20223 | 7,000 | 7,609 |
| Pernod Ricard SA 5.50% 20423 | 3,000 | 3,385 |
| Coca-Cola Co. 1.50% 2015 | 14,090 | 14,493 |
| Coca-Cola Co. 1.80% 2016 | 12,000 | 12,403 |
| Coca-Cola Co. 3.15% 2020 | 4,000 | 4,300 |
| Constellation Brands, Inc. 8.375% 2014 | 3,675 | 4,107 |
| Constellation Brands, Inc. 7.25% 2017 | 16,425 | 19,032 |
| Constellation Brands, Inc. 6.00% 2022 | 2,825 | 3,192 |
| Wesfarmers Ltd. 6.998% 20133 | 25,000 | 25,247 |
| British American Tobacco International Finance PLC 2.125% 20173 | 10,500 | 10,670 |
| British American Tobacco International Finance PLC 9.50% 20183 | 8,705 | 12,057 |
| ConAgra Foods, Inc. 1.30% 2016 | 2,295 | 2,303 |
| ConAgra Foods, Inc. 1.90% 2018 | 4,365 | 4,389 |
| ConAgra Foods, Inc. 3.20% 2023 | 9,665 | 9,699 |
| ConAgra Foods, Inc. 4.65% 2043 | 5,410 | 5,440 |
| Wal-Mart Stores, Inc. 2.875% 2015 | 10,000 | 10,501 |
| Wal-Mart Stores, Inc. 2.80% 2016 | 10,000 | 10,653 |
| Stater Bros. Holdings Inc. 7.75% 2015 | 11,325 | 11,467 |
| Stater Bros. Holdings Inc. 7.375% 2018 | 8,575 | 9,293 |
| Procter & Gamble Co. 3.50% 2015 | 17,250 | 18,276 |
| Unilever Capital Corp. 3.65% 2014 | 17,500 | 18,051 |
| PepsiCo, Inc. 3.10% 2015 | 10,000 | 10,477 |
| PepsiCo, Inc. 2.50% 2016 | 5,000 | 5,254 |
| General Mills, Inc. 0.66% 20147 | 15,000 | 15,051 |
| Tyson Foods, Inc. 6.60% 20167 | 11,500 | 13,272 |
| Diageo Capital PLC 5.50% 2016 | 11,161 | 12,924 |
| Kimberly-Clark Corp. 7.50% 2018 | 9,000 | 11,967 |
| Reynolds American Inc. 3.25% 2022 | 8,790 | 8,719 |
| Reynolds American Inc. 4.75% 2042 | 3,000 | 2,946 |
| Heineken NV 1.40% 20173 | 7,485 | 7,433 |
| Heineken NV 2.75% 20233 | 3,000 | 2,899 |
| Kroger Co. 6.40% 2017 | 8,250 | 9,859 |
| Kraft Foods Inc. 6.125% 2018 | 2,500 | 3,016 |
| Kraft Foods Inc. 5.375% 2020 | 5,479 | 6,522 |
| Brown-Forman Corp. 1.00% 2018 | 3,000 | 2,966 |
| Brown-Forman Corp. 2.25% 2023 | 2,500 | 2,422 |
| Brown-Forman Corp. 3.75% 2043 | 960 | 932 |
| Smithfield Foods, Inc. 7.75% 2017 | 2,000 | 2,325 |
| Smithfield Foods, Inc. 6.625% 2022 | 3,400 | 3,749 |
| Philip Morris International Inc. 1.125% 2017 | 2,000 | 1,990 |
| Philip Morris International Inc. 1.625% 2017 | 2,000 | 2,032 |
| Philip Morris International Inc. 2.50% 2022 | 2,000 | 1,975 |
| Del Monte Corp. 7.625% 2019 | 5,125 | 5,368 |
| Brasil Foods SA 5.875% 20223 | 2,500 | 2,769 |
| Brasil Foods SA 5.875% 2022 | 1,500 | 1,661 |
| TreeHouse Foods, Inc. 7.75% 2018 | 3,100 | 3,364 |
| | | 800,033 |
| | | |
| | | |
| UTILITIES — 0.73% | | |
| TXU, Term Loan, 3.708% 20147,8,9 | 3,000 | 2,265 |
| TXU, Term Loan, 4.708% 20177,8,9 | 84,442 | 55,771 |
| Texas Competitive Electric Holdings Co. LLC 11.50% 20203 | 44,680 | 35,521 |
| Consumers Energy Co., First Mortgage Bonds, 6.70% 2019 | 26,800 | 34,521 |
| Consumers Energy Co. 5.65% 2020 | 7,155 | 8,705 |
| CMS Energy Corp. 6.25% 2020 | 20,369 | 24,148 |
| Consumers Energy Co. 2.85% 2022 | 11,538 | 11,766 |
| CMS Energy Corp. 5.05% 2022 | 8,817 | 9,871 |
| Nevada Power Co., General and Refunding Mortgage Notes, Series M, 5.95% 2016 | 13,700 | 15,668 |
| Nevada Power Co., General and Refunding Mortgage Notes, Series V, 7.125% 2019 | 11,839 | 15,035 |
| NV Energy, Inc 6.25% 2020 | 17,500 | 20,926 |
| MidAmerican Energy Co. 5.95% 2017 | 10,625 | 12,708 |
| PacifiCorp., First Mortgage Bonds, 5.65% 2018 | 5,500 | 6,700 |
| MidAmerican Energy Holdings Co. 5.75% 2018 | 10,000 | 11,998 |
| MidAmerican Energy Holdings Co. 5.95% 2037 | 3,375 | 4,159 |
| AES Corp. 7.75% 2015 | 10,000 | 11,225 |
| AES Corp. 8.00% 2017 | 4,000 | 4,640 |
| AES Corp. 8.00% 2020 | 7,000 | 8,085 |
| AES Corp. 7.375% 2021 | 10,125 | 11,340 |
| NRG Energy, Inc. 8.25% 2020 | 3,850 | 4,370 |
| NRG Energy, Inc. 6.625% 20233 | 27,700 | 29,847 |
| Electricité de France SA 5.50% 20143 | 19,000 | 19,874 |
| Electricité de France SA 6.95% 20393 | 8,000 | 10,445 |
| National Rural Utilities Cooperative Finance Corp. 5.50% 2013 | 13,850 | 14,139 |
| National Rural Utilities Cooperative Finance Corp. 1.00% 2015 | 8,250 | 8,311 |
| E.ON International Finance BV 5.80% 20183 | 17,000 | 20,387 |
| American Electric Power Co. 1.65% 2017 | 2,295 | 2,296 |
| American Electric Power Co. 2.95% 2022 | 16,085 | 15,897 |
| CenterPoint Energy Resources Corp. 4.50% 2021 | 16,130 | 18,061 |
| Intergen Power 9.00% 20173 | 18,000 | 16,830 |
| Abu Dhabi National Energy Co. PJSC (TAQA) 6.165% 2017 | 10,000 | 11,737 |
| Abu Dhabi National Energy Co. PJSC (TAQA) 6.165% 20173 | 4,000 | 4,695 |
| Carolina Power & Light Co. d/b/a Progress Energy Carolinas, Inc. 5.25% 2015 | 6,000 | 6,784 |
| Progress Energy, Inc. 7.00% 2031 | 5,500 | 7,004 |
| Progress Energy, Inc. 7.75% 2031 | 500 | 678 |
| Midwest Generation, LLC, Series B, 8.56% 20168 | 9,761 | 9,859 |
| Entergy Corp. 4.70% 2017 | 8,000 | 8,708 |
| Eskom Holdings Ltd. 5.75% 20213 | 6,820 | 7,570 |
| Teco Finance, Inc. 4.00% 2016 | 227 | 244 |
| Teco Finance, Inc. 5.15% 2020 | 5,172 | 5,984 |
| Xcel Energy Inc. 4.70% 2020 | 5,000 | 5,797 |
| Virginia Electric and Power Co., Series B, 5.95% 2017 | 4,500 | 5,448 |
| Israel Electric Corp. Ltd. 8.10% 20963 | 4,905 | 5,115 |
| AES Panamá, SA 6.35% 20163 | 4,500 | 4,984 |
| National Grid PLC 6.30% 2016 | 4,000 | 4,646 |
| CEZ, a s 4.25% 20223 | 2,820 | 2,980 |
| Enel Finance International SA 6.00% 20393 | 3,000 | 2,947 |
| Veolia Environnement 6.00% 2018 | 2,500 | 2,918 |
| Colbun SA 6.00% 20203 | 2,000 | 2,260 |
| Iberdrola Finance Ireland 5.00% 20193 | 1,060 | 1,125 |
| | | 566,992 |
| | | |
| | | |
| FEDERAL AGENCY BONDS & NOTES — 0.29% | | |
| Freddie Mac 0.375% 2014 | 6,850 | 6,861 |
| Freddie Mac 1.75% 2015 | 3,500 | 3,619 |
| Freddie Mac 2.50% 2016 | 22,500 | 23,922 |
| Freddie Mac 1.00% 2017 | 56,000 | 56,251 |
| Freddie Mac 1.00% 2017 | 3,215 | 3,234 |
| Freddie Mac 0.75% 2018 | 9,000 | 8,887 |
| Fannie Mae 0.75% 2013 | 17,825 | 17,903 |
| Fannie Mae 1.125% 2017 | 14,350 | 14,539 |
| Fannie Mae 6.25% 2029 | 32,000 | 44,753 |
| Fannie Mae 6.625% 2030 | 1,250 | 1,849 |
| CoBank, ACB 7.875% 20183 | 10,000 | 12,707 |
| CoBank, ACB 0.908% 20223,7 | 8,315 | 7,506 |
| United States Agency for International Development, Republic of Egypt 4.45% 2015 | 10,000 | 10,988 |
| Federal Farm Credit Banks, Consolidated Systemwide Designated Bonds, 1.625% 2014 | 6,975 | 7,134 |
| Tennessee Valley Authority, Series A, 3.875% 2021 | 850 | 976 |
| Tennessee Valley Authority 1.875% 2022 | 850 | 828 |
| Tennessee Valley Authority, Series 2008, Class A, 4.875% 2048 | 700 | 839 |
| Federal Home Loan Bank 4.125% 2020 | 1,600 | 1,872 |
| | | 224,668 |
| | | |
| | | |
| BONDS & NOTES OF GOVERNMENTS & GOVERNMENT AGENCIES OUTSIDE THE U.S. — 0.13% | | |
| Polish Government 5.25% 2014 | 1,500 | 1,567 |
| Polish Government 6.375% 2019 | 15,985 | 19,829 |
| Polish Government 5.00% 2022 | 3,000 | 3,457 |
| Israeli Government 5.125% 2019 | 3,000 | 3,488 |
| Israeli Government 4.00% 2022 | 8,500 | 9,136 |
| Croatian Government 6.25% 20173 | 485 | 535 |
| Croatian Government 6.75% 2019 | 4,800 | 5,530 |
| Croatian Government 6.375% 2021 | 5,000 | 5,675 |
| Hungarian Government 6.25% 2020 | 10,335 | 11,394 |
| France Government Agency-Guaranteed, Société Finance 2.875% 20143 | 10,000 | 10,392 |
| Turkey (Republic of) 5.625% 2021 | 5,400 | 6,318 |
| Turkey (Republic of) 6.75% 2040 | 2,500 | 3,269 |
| Russian Federation 3.25% 20173 | 2,800 | 2,975 |
| Russian Federation 3.25% 2017 | 2,000 | 2,125 |
| Russian Federation 7.50% 20308 | 1,604 | 2,008 |
| Latvia (Republic of) 5.25% 20173 | 5,240 | 5,819 |
| Romanian Government 6.75% 20223 | 3,000 | 3,623 |
| KfW 1.00% 2015 | 1,825 | 1,843 |
| | | 98,983 |
| | | |
| | | |
| ASSET-BACKED OBLIGATIONS8 — 0.07% | | |
| Chase Issuance Trust, Series 2008-4, Class A, 4.65% 2015 | 10,000 | 10,048 |
| AEP Texas Central Transitioning Funding II LLC, Secured Transition Bonds, Series A, Class A-3, 5.09% 2017 | 8,265 | 8,749 |
| Hertz Vehicle Financing LLC, Rental Car Asset-backed Notes, Series 2013-1A, Class A-1, 1.12% 20173 | 8,500 | 8,508 |
| First Horizon ABS Trust, Series 2006-HE2, Class A, FSA insured, 0.334% 20267 | 2,362 | 2,058 |
| First Horizon ABS Trust, Series 2007-HE1, Class A, FSA insured, 0.334% 20297 | 5,165 | 4,460 |
| CWHEQ Revolving Home Equity Loan Trust, Series 2006-I, Class 2-A, FSA insured, 0.346% 20377 | 2,550 | 2,007 |
| CWHEQ Revolving Home Equity Loan Trust, Series 2007-B, Class A, FSA insured, 0.356% 20377 | 4,538 | 3,557 |
| Countryplace Manufactured Housing Contract, Series 2005-1, Class A-3, AMBAC insured, 4.80% 20353 | 3,077 | 3,180 |
| Countryplace Manufactured Housing Contract, Series 2005-1, Class A-4, AMBAC insured, 5.20% 20353,7 | 1,145 | 1,282 |
| Citibank Credit Card Issuance Trust, Series 2008, Class A5, 4.85% 2015 | 3,000 | 3,029 |
| Conseco Finance Home Loan Trust, Series 1999-G, Class B-2, 10.96% 2029 | 13,630 | 2,721 |
| IndyMac Home Equity Mortgage Loan Asset-backed Trust, Series 2007-H1, Class A-1, FSA insured, 0.364% 20377 | 2,579 | 1,973 |
| RAMP Trust, Series 2003-RZ4, Class A-7, 4.79% 20337 | 1,729 | 1,819 |
| Home Equity Mortgage Trust, Series 2006-6, Class 2A-1, 0.304% 20377 | 14,427 | 1,223 |
| | | 54,614 |
| | | |
| | | |
| MUNICIPALS — 0.04% | | |
| State of California, Various Purpose General Obligation Bonds (Federally Taxable), 6.20% 2019 | 24,675 | 29,741 |
| State of New Jersey, Economic Development Authority, Energy Facility Revenue Bonds (ACR Energy Partners, LLC Project), | | |
| Series 2011-B, 12.00% 20303 | 1,875 | 2,025 |
| State of South Dakota, Educational Enhancement Funding Corp., Tobacco Settlement Asset-backed Bonds, | | |
| Series 2002-A, 6.72% 2025 | 1,819 | 1,876 |
| | | 33,642 |
| | | |
| | | |
| MISCELLANEOUS — 0.01% | | |
| Other bonds & notes in initial period of acquisition | | 6,608 |
| | | |
| | | |
| Total bonds & notes (cost: $18,269,867,000) | | 19,347,705 |
| | | |
| | | |
| | | |
| | Principal amount | |
| Short-term securities — 5.03% | (000) | |
| | | |
| Fannie Mae 0.10%–0.18% due 2/4–12/16/2013 | $856,050 | 855,803 |
| Freddie Mac 0.075%–0.205% due 2/1–7/23/2013 | 724,620 | 724,452 |
| Federal Home Loan Bank 0.10%–0.21% due 2/1/2013–1/2/2014 | 651,800 | 651,583 |
| U.S. Treasury Bills 0.08%–0.195% due 4/4–9/19/2013 | 563,900 | 563,743 |
| Federal Farm Credit Banks 0.13%–0.22% due 3/19–10/21/2013 | 315,500 | 315,350 |
| Coca-Cola Co. 0.13%–0.19% due 2/21–4/17/20133 | 192,500 | 192,457 |
| Chariot Funding, LLC 0.15% due 2/12/20133 | 75,000 | 74,996 |
| Jupiter Securitization Co., LLC 0.12%–0.21% due 2/1–3/19/20133 | 37,200 | 37,192 |
| National Rural Utilities Cooperative Finance Corp. 0.13%–0.14% due 2/7–3/8/2013 | 100,000 | 99,992 |
| General Electric Co. 0.11% due 2/1/2013 | 85,000 | 85,000 |
| Walt Disney Co. 0.13%–0.14% due 4/16–5/13/20133 | 73,000 | 72,965 |
| Paccar Financial Corp. 0.10%–0.14% due 2/20–5/1/2013 | 66,800 | 66,789 |
| Private Export Funding Corp. 0.19% due 3/20/20133 | 50,000 | 49,988 |
| E.I. duPont de Nemours and Co. 0.09% due 2/5/20133 | 35,000 | 35,000 |
| Medtronic Inc. 0.17% due 5/9/20133 | 33,100 | 33,083 |
| Variable Funding Capital Company LLC 0.17% due 4/15/20133 | 23,648 | 23,638 |
| Google Inc. 0.12% due 4/9/20133 | 10,300 | 10,297 |
| | | |
| Total short-term securities (cost: $3,891,895,000) | | 3,892,328 |
| | | |
| | | |
| Total investment securities (cost: $66,605,704,000) | | 77,600,448 |
| Other assets less liabilities | | (181,908) |
| | | |
| Net assets | | $77,418,540 |
As permitted by U.S. Securities and Exchange Commission regulations, “Miscellaneous” securities include holdings in their first year of acquisition that have not previously been publicly disclosed.
ITEM 7 – Disclosure of Proxy Voting Policies and Procedures for Closed-End Management Investment Companies
Not applicable to this Registrant, insofar as the Registrant is not a closed-end management investment company.
Not applicable to this Registrant, insofar as the Registrant is not a closed-end management investment company.
ITEM 9 – Purchases of Equity Securities by Closed-End Management Investment Company and Affiliated Purchasers
Not applicable to this Registrant, insofar as the Registrant is not a closed-end management investment company.
There have been no material changes to the procedures by which shareholders may recommend nominees to the Registrant’s board of trustees since the Registrant last submitted a proxy statement to its shareholders. The procedures are as follows. The Registrant has a nominating and governance committee comprised solely of persons who are not considered ‘‘interested persons’’ of the Registrant within the meaning of the Investment Company Act of 1940, as amended. The committee periodically reviews such issues as the board’s composition, responsibilities, committees, compensation and other relevant issues, and recommends any appropriate changes to the full board of trustees. While the committee normally is able to identify from its own resources an ample number of qualified candidates, it will consider shareholder suggestions of persons to be considered as nominees to fill future vacancies on the board. Such suggestions must be sent in writing to the nominating and governance committee of the Registrant, c/o the Registrant’s Secretary, and must be accompanied by complete biographical and occupational data on the prospective nominee, along with a written consent of the prospective nominee for consideration of his or her name by the nominating and governance committee.
Pursuant to the requirements of the Securities Exchange Act of 1934 and the Investment Company Act of 1940, the Registrant has duly caused this report to be signed on its behalf by the undersigned, thereunto duly authorized.
Pursuant to the requirements of the Securities Exchange Act of 1934 and the Investment Company Act of 1940, this report has been signed below by the following persons on behalf of the Registrant and in the capacities and on the dates indicated.