Washington, D.C. 20549
The Income Fund of America seeks current income while secondarily striving for capital growth through investments in stocks and fixed-income securities.
This fund is one of more than 40 offered by one of the nation’s largest mutual fund families, American Funds, from Capital Group. For more than 80 years, Capital has invested with a long-term focus based on thorough research and attention to risk.
Here are the average annual total returns on a $1,000 investment with all distributions reinvested for periods ended December 31, 2013 (the most recent calendar quarter-end):
For other share class results, visit americanfunds.com and americanfundsretirement.com.
The total annual fund operating expense ratio was 0.58% for Class A shares as of the prospectus dated October 1, 2013.
Investment results assume all distributions are reinvested and reflect applicable fees and expenses. When applicable, investment results reflect fee waivers, without which results would have been lower. Visit americanfunds.com for more information.
The return of principal for bond funds and for funds with significant underlying bond holdings is not guaranteed. Fund shares are subject to the same interest rate, inflation and credit risks associated with the underlying bond holdings. High-yield bonds are subject to greater fluctuations in value and risk of loss of income and principal than investment-grade bonds. Bond ratings, which typically range from Aaa/AAA (highest) to D (lowest), are assigned by credit rating agencies such as Moody’s, Standard & Poor’s and/or Fitch as an indication of an issuer’s creditworthiness. Investing outside the United States may be subject to additional risks, such as currency fluctuations, periods of illiquidity and price volatility. These risks may be heightened in connection with investments in developing countries. Refer to the fund prospectus and the Risk Factors section of this report for more information on these and other risks associated with investing in the fund.
For the six months ended January 31, 2014, The Income Fund of America (IFA) gained 4.9% for those who reinvested dividends paid during the period totaling 33 cents a share.
The fund’s results trailed the broader equity market, as measured by the unmanaged Standard & Poor’s 500 Composite Index, which gained 6.8%. IFA’s returns surpassed those of the unmanaged Barclays U.S. Aggregate Index — a gauge of the U.S. investment-grade bond market — which rose 1.8%.
The fund also fared well relative to its peer group, as the Lipper Income Funds Index climbed 3.5%.
As shown in the table on page 5, the fund compares favorably to the Barclays and Lipper benchmarks for the longer periods shown; it also stacks up well compared with the S&P 500 over the 10-year and lifetime periods and has generated these returns while remaining considerably less volatile than the broader stock market.
Stocks began the period on a relatively weak note as investors anticipated the winding down of the Federal Reserve’s quantitative easing program. But September saw markets reversing course and reaching new highs as Europe technically emerged
from recession, Chinese growth exceeded expectations and the Fed elected not to taper its bond-buying program. The rally continued through the end of calendar 2013, using positive economic and earnings data to overcome challenges posed by the budget battle, the partial government shutdown and the eventual decision of the Fed to scale back its bond-buying program.
In the new year, however, stocks stumbled globally. Political and economic instability in some emerging markets, mixed earnings reports and a slowdown in China all served to unsettle investors.
One beneficiary of that uncertainty was the U.S. investment-grade bond market, which rallied as investors spooked by emerging markets turmoil sought refuge in the perceived safety of high-quality “safe haven” instruments such as U.S. Treasury securities. This uptick followed a calendar year in which the U.S. investment-grade bond market finished in the red for the first time since 1999.
Not surprisingly, among the areas of the stock market that fared best were sectors such as information technology, materials and industrials that tend to register solid gains during periods of economic improvement.
Conversely, so-called defensive sectors, whose fortunes are less pegged to the economic cycle, did not fare as well. These included areas like consumer staples, utilities and telecommunications services.
This particular market dynamic could have represented a challenging environment for the fund. That’s because companies in defensive industries have traditionally offered yields that are higher than the broader market and thus may have featured heavily in IFA’s portfolio.
However, the fund’s flexibility and company-by-company approach to portfolio construction mean its results are not necessarily dependent on the returns of a handful of sectors.
Indeed, a look at the fund’s 10 largest investments reveals support from a variety of sources. Chemical companies Dow Chemical (29.9%) and DuPont (5.8%), industrial giants Lockheed Martin (25.6%) and General Electric (3.1%), and technology stalwart Microsoft
(18.9%) all fall toward the economically sensitive end of the spectrum; U.K.-domiciled electric utility National Grid (8.4%) would be considered a more defensive investment.
Pharmaceutical companies, four of which round out the fund’s 10-largest positions, fall somewhere in between. As we noted last year at this time, we increased our holdings in a number of these firms. In addition to featuring healthy dividends that make them appealing relative to IFA’s income objective, we were drawn by their attractive product pipelines and believed we had a solid grasp of their patent expiry challenges. As a group, these investments were strong contributors. AstraZeneca (25.0%), Bristol-Myers Squibb (15.6%) and Merck (10.0%) all posted excellent gains. Pfizer (4.0%) recorded a more modest increase.
Although the telecommunications services area of the market generally fared poorly, some of the fund’s investments bucked the trend. Shares of U.K.-based Vodafone (24.0%) benefited from the announcement that its joint venture with Verizon Wireless would be acquired by Verizon. Another U.K.-domiciled company, TalkTalk Telecom (36.5%), was also additive.
In recent years, European telecommunications companies have suffered through a challenging period marked by increased regulation and scrutiny of their dividend levels. However, fund analysts believe that operating conditions are becoming more favorable and that investment opportunities may be emerging among these companies. Accordingly, the fund has selectively added to its holdings in this area.
Much of the insight and conviction that helped analysts anticipate the Vodafone/ Verizon transaction and identify opportunity against a difficult sector backdrop was developed within the fund’s telecommunications industry cluster. The cluster is a working group that provides IFA’s telecom analysts, who are located worldwide, with a forum for collaborating and sharing information.
We believe that clusters are an essential tool for covering the increasingly interconnected global economy and the fund is well served by a number of them.
A number of the companies detracting from results were those adjusting to a global energy picture being re-shaped by new technology that has led to vastly increased estimates of U.S. natural gas reserves. Among companies whose share prices fell
were FirstEnergy (-17.3%), Kinder Morgan (-9.9%), PG&E (-8.2%) and Crescent Point Energy (-8.8%).
Fixed-income securities continue to play an important part in helping the fund meet its income objective. In particular, the high-yield portion of the bond portfolio has provided significant income. It has also experienced significant price appreciation, as high-yield bonds typically fare well in an improving economy.
With many emerging economies experiencing tumult, Europe trying to find its footing and further Fed moves potentially in the offing, we will, as always, remain opportunistic but vigilant in the coming months.
We thank you for your continuing commitment to long-term investing.
Hilda L. Applbaum
David C. Barclay
The market indexes are unmanaged and, therefore, have no expenses. Investors cannot invest directly in an index.
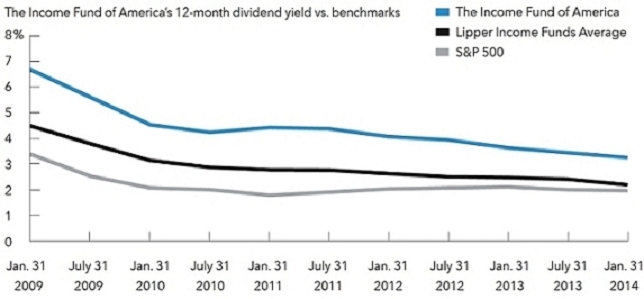
All numbers calculated by Lipper. The 12-month dividend rate is calculated by taking the total of the trailing 12 months’ dividends and dividing the month-end net asset value adjusted for capital gains.
This summary investment portfolio is designed to streamline the report and help investors better focus on the fund’s principal holdings. See the inside back cover for details on how to obtain a complete schedule of portfolio holdings.
As permitted by U.S. Securities and Exchange Commission regulations, “Miscellaneous” securities include holdings in their first year of acquisition that have not previously been publicly disclosed.
“Other securities” includes all issues that are not disclosed separately in the summary investment portfolio. Some of these securities (with an aggregate value of $5,576,863,000, which represented 6.40% of the net assets of the fund) were acquired in transactions exempt from registration under Rule 144A or section 4(2) of the Securities Act of 1933 and may be resold in the U.S. in transactions exempt from registration, normally to qualified institutional buyers.
The fund has entered into forward currency contracts to sell currencies as shown in the following table. The average notional amount of open forward currency contracts was $284,437,000 over the prior seven-month period.
A company is an affiliate of the fund under the Investment Company Act of 1940 if the fund’s holdings in that company represent 5% or more of the outstanding voting shares. The value of the fund’s affiliated-company holdings is either shown in the summary investment portfolio or included in the value of “Other securities” under the respective industry sectors. Further details on such holdings and related transactions during the six months ended January 31, 2014, appear below.
The following footnotes apply to either the individual securities noted or one or more of the securities aggregated and listed as a single line item.
*Additional information related to class-specific fees and expenses is included in the Notes to Financial Statements.
*Unaudited.
The Income Fund of America (the “fund”) is registered under the Investment Company Act of 1940 as an open-end, diversified management investment company. The fund seeks current income while secondarily striving for capital growth through investments in stocks and fixed-income securities.
The fund has 16 share classes consisting of five retail share classes (Classes A, B and C, as well as two F share classes, F-1 and F-2), five 529 college savings plan share classes (Classes 529-A, 529-B, 529-C, 529-E and 529-F-1) and six retirement plan share classes (Classes R-1, R-2, R-3, R-4, R-5 and R-6). The 529 college savings plan share classes can be used to save for college education. The retirement plan share classes are generally offered only through eligible employer-sponsored retirement plans. The fund’s share classes are further described:
* Class B and 529-B shares of the fund are not available for purchase.
Holders of all share classes have equal pro rata rights to assets, dividends and liquidation proceeds. Each share class has identical voting rights, except for the exclusive right to vote on matters affecting only its class. Share classes have different fees and expenses (“class-specific fees and expenses”), primarily due to different arrangements for distribution, administrative and shareholder services. Differences in class-specific fees and expenses will result in differences in net investment income and, therefore, the payment of different per-share dividends by each share class.
The financial statements have been prepared to comply with accounting principles generally accepted in the United States of America. These principles require management to make estimates and assumptions that affect reported amounts and disclosures. Actual results could differ from those estimates. The fund follows the significant accounting policies described in this section, as well as the valuation policies described in the next section on valuation.
Capital Research and Management Company (“CRMC”), the fund’s investment adviser, values the fund’s investments at fair value as defined by accounting principles generally accepted in the United States of America. The net asset value of each share class of the fund is generally determined as of approximately 4:00 p.m. New York time each day the New York Stock Exchange is open.
Equity securities are generally valued at the official closing price of, or the last reported sale price on, the exchange or market on which such securities are traded, as of the close of business on the day the securities are being valued or, lacking any sales, at the last available bid price. Prices for each security are taken from the principal exchange or market on which the security trades.
Fixed-income securities, including short-term securities purchased with more than 60 days left to maturity, are generally valued at prices obtained from one or more pricing vendors. Vendors value such securities based on one or more of the inputs described in the following table. The table provides examples of inputs that are commonly relevant for valuing particular classes of fixed-income securities in which the fund is authorized to invest. However, these classifications are not exclusive, and any of the inputs may be used to value any other class of fixed-income security.
When the fund’s investment adviser deems it appropriate to do so (such as when vendor prices are unavailable or not deemed to be representative), fixed-income securities will be valued in good faith at the mean quoted bid and ask prices that are reasonably and timely available (or bid prices, if ask prices are not available) or at prices for securities of comparable maturity, quality and type.
Securities with both fixed-income and equity characteristics, or equity securities traded principally among fixed-income dealers, are generally valued in the manner described for either equity or fixed-income securities, depending on which method is deemed most appropriate by the fund’s investment adviser. Short-term securities purchased within 60 days to maturity are valued at amortized cost, which approximates fair value. The value of short-term securities originally purchased with maturities greater than 60 days is determined based on an amortized value to par when they reach 60 days. Forward currency contracts are valued at the mean of representative quoted bid and ask prices, generally based on prices supplied by one or more pricing vendors.
Securities and other assets for which representative market quotations are not readily available or are considered unreliable by the fund’s investment adviser are fair valued as determined in good faith under fair valuation guidelines adopted by authority of the fund’s board of trustees as further described. The investment adviser follows fair valuation guidelines, consistent with U.S. Securities and Exchange Commission rules and guidance, to consider relevant principles and factors when making fair value determinations. The investment adviser considers relevant indications of value that are reasonably and timely available to it in determining the fair value to be assigned to a particular security, such as the type and cost of the security; contractual or legal restrictions on resale of the security; relevant financial or business developments of the issuer; actively traded similar or related securities; conversion or exchange rights on the security; related corporate actions; significant events occurring after the close of trading in the security; and changes in overall market conditions. In addition, the closing prices of equity securities that trade in markets outside U.S. time zones may be adjusted to reflect significant events that occur after the close of local trading but before the net asset value of each share class of the fund is determined. Fair valuations and valuations of investments that are not actively trading involve judgment and may differ materially from valuations that would have been used had greater market activity occurred.
The fund’s investment adviser has also established a Fixed-Income Pricing Review Group to administer and oversee the fixed-income valuation process, including the
use of fixed-income pricing vendors. This group regularly reviews pricing vendor information and market data. Pricing decisions, processes and controls over security valuation are also subject to additional internal reviews, including an annual control self-evaluation program facilitated by the investment adviser’s compliance group.
Investing in the fund may involve certain risks including, but not limited to, those described below.
Bonds and other debt securities are subject to credit risk, which is the possibility that the credit strength of an issuer will weaken and/or an issuer of a debt security will fail to make timely payments of principal or interest and the security will go into default. Credit risk is gauged, in part, by the credit ratings of the securities in which the fund invests. However, ratings are only the opinions of the rating agencies issuing them and are not guarantees as to credit quality or an evaluation of market risk. The fund’s investment adviser relies on its own credit analysts to research issuers and issues in seeking to mitigate the risks of an issuer defaulting on its obligations.
On a daily basis, the fund’s investment adviser values forward currency contracts and records unrealized appreciation or depreciation for open forward currency contracts in the fund’s statement of assets and liabilities. Realized gains or losses are recorded at the time the forward currency contract is closed or offset by another contract with the same broker for the same settlement date and currency.
Closed forward currency contracts that have not reached their settlement date are included in the respective receivables or payables for closed forward currency contracts in the fund’s statement of assets and liabilities. Net realized gains or losses from closed
forward currency contracts and net unrealized appreciation or depreciation from open forward currency contracts are recorded in the fund’s statement of operations.
The following tables present the financial statement impacts resulting from the fund’s use of forward currency contracts as of January 31, 2014 (dollars in thousands):
As of and during the period ended January 31, 2014, the fund did not have a liability for any unrecognized tax benefits. The fund recognizes interest and penalties, if any, related to unrecognized tax benefits as income tax expense in the statement of operations. During the period, the fund did not incur any interest or penalties.
The fund is not subject to examination by U.S. federal tax authorities for tax years before 2009 and by state tax authorities for tax years before 2008.
income and net realized gains for financial reporting purposes. These differences are due primarily to different treatment for items such as currency gains and losses; short-term capital gains and losses; capital losses related to sales of certain securities within 30 days of purchase; cost of investments sold; and net capital losses. The fiscal year in which amounts are distributed may differ from the year in which the net investment income and net realized gains are recorded by the fund for financial reporting purposes.
The components of distributable earnings on a tax basis are reported as of the fund’s most recent year-end. As of July 31, 2013, the components of distributable earnings on a tax basis were as follows (dollars in thousands):
Under the Regulated Investment Company Modernization Act of 2010 (the “Act”), net capital losses recognized after July 31, 2011, may be carried forward indefinitely, and their character is retained as short-term and/or long-term losses. Previously, net capital losses were carried forward for eight years and treated as short-term losses. As a transition rule, the Act requires that post-enactment net capital losses be used before pre-enactment net capital losses.
As of January 31, 2014, the tax basis unrealized appreciation (depreciation) and cost of investment securities were as follows (dollars in thousands):
Tax-basis distributions paid to shareholders from ordinary income were as follows (dollars in thousands):
CRMC, the fund’s investment adviser, is the parent company of American Funds Distributors®, Inc. (“AFD”), the principal underwriter of the fund’s shares, and American Funds Service Company® (“AFS”), the fund’s transfer agent. CRMC, AFD and AFS are considered related parties to the fund.
For Class A and 529-A shares, distribution-related expenses include the reimbursement of dealer and wholesaler commissions paid by AFD for certain shares sold without a sales charge. These share classes reimburse AFD for amounts billed within the prior 15 months but only to the extent that the overall annual expense limit of 0.25% is not exceeded. As of January 31, 2014, there were no unreimbursed expenses subject to reimbursement for Class A or 529-A shares.
For the six months ended January 31, 2014, class-specific expenses under the agreements were as follows (dollars in thousands):
Capital share transactions in the fund were as follows (dollars and shares in thousands):
* Includes exchanges between share classes of the fund.
The fund made purchases and sales of investment securities, excluding short-term securities and U.S. government obligations, if any, of $15,400,631,000 and $15,003,810,000, respectively, during the six months ended January 31, 2014.
See page 37 for footnotes.
See page 37 for footnotes.
As a fund shareholder, you incur two types of costs: (1) transaction costs, such as initial sales charges on purchase payments and contingent deferred sales charges on redemptions (loads), and (2) ongoing costs, including management fees, distribution and service (12b-1) fees, and other expenses. This example is intended to help you understand your ongoing costs (in dollars) of investing in the fund so you can compare these costs with the ongoing costs of investing in other mutual funds. The example is based on an investment of $1,000 invested at the beginning of the period and held for the entire six-month period (August 1, 2013, through January 31, 2014).
The first line of each share class in the table on the following page provides information about actual account values and actual expenses. You may use the information in this line, together with the amount you invested, to estimate the expenses that you paid over the period. Simply divide your account value by $1,000 (for example, an $8,600 account value divided by $1,000 = 8.6), then multiply the result by the number in the first line under the heading entitled “Expenses paid during period” to estimate the expenses you paid on your account during this period.
The second line of each share class in the table on the following page provides information about hypothetical account values and hypothetical expenses based on the actual expense ratio for the share class and an assumed rate of return of 5.00% per year before expenses, which is not the actual return of the share class. The hypothetical account values and expenses may not be used to estimate the actual ending account balance or expenses you paid for the period. You may use this information to compare the ongoing costs of investing in the fund and other funds. To do so, compare this 5.00% hypothetical example with the 5.00% hypothetical examples that appear in the shareholder reports of the other funds.
There are some account fees that are charged to certain types of accounts, such as individual retirement accounts and 529 college savings plan accounts (generally, a $10 fee is charged to set up the account and an additional $10 fee is charged to the account annually), that would increase the amount of expenses paid on your account. In addition, retirement plan participants may be subject to certain fees charged by the plan sponsor, and Class F-1, F-2 and 529-F-1 shareholders may be subject to fees charged by financial intermediaries, typically ranging from 0.75% to 1.50% of assets annually depending on services offered. You can estimate the impact of these fees by adding the amount of the fees to the total estimated expenses you paid on your account during the period as calculated above. In addition, your ending account value would be lower by the amount of these fees.
Note that the expenses shown in the table on the following page are meant to highlight your ongoing costs only and do not reflect any transactional costs, such as sales charges (loads). Therefore, the second line of each share class in the table is useful in comparing ongoing costs only and will not help you determine the relative total costs of owning different funds. In addition, if these transactional costs were included, your costs would have been higher.
The Income Fund of America’s board has approved the fund’s Investment Advisory and Service Agreement (the “agreement”) with Capital Research and Management Company (“CRMC”) for an additional one-year term through December 31, 2014. The board approved the agreement following the recommendation of the fund’s Contracts Committee (the “committee”), which is composed of all of the fund’s independent board members. The board and the committee determined that the fund’s advisory fee structure was fair and reasonable in relation to the services provided and that approving the agreement was in the best interests of the fund and its shareholders.
In reaching this decision, the board and the committee took into account information furnished to them throughout the year and otherwise provided to them, as well as information prepared specifically in connection with their review of the agreement and were advised by their independent counsel. They considered the following factors, among others, but did not identify any single issue or particular piece of information that, in isolation, was the controlling factor, and each board and committee member did not necessarily attribute the same weight to each factor.
The board and the committee considered the depth and quality of CRMC’s investment management process, including its global research capabilities; the experience, capability and integrity of its senior management and other personnel; the low turnover rates of its key personnel; the overall financial strength and stability of its organization; and the ongoing evolution of CRMC’s organizational structure designed to maintain and strengthen these qualities. The board and the committee also considered the nature, extent and quality of administrative, compliance and shareholder services provided by CRMC to the fund under the agreement and other agreements, as well as the benefits to fund shareholders from investing in a fund that is part of a large family of funds. The board and the committee concluded that the nature, extent and quality of the services provided by CRMC have benefited and should continue to benefit the fund and its shareholders.
The board and the committee considered the investment results of the fund in light of its objectives of providing current income and, secondarily, growth of capital. They compared the fund’s investment results with those of other relevant funds (including funds that form the basis of the Lipper index for the category in which the fund is included), and data such as relevant market and fund indexes, over various periods through June 30, 2013. This report, including the letter to shareholders and related disclosures, contains certain information about the fund’s investment results. The board and the committee reviewed the fund’s investment results measured against various indexes, including the Lipper Income Funds Index, the S&P 500 Index and the Barclays U. S. Aggregate Index. They noted that the investment results of the fund generally exceeded those of these indexes for the lifetime, 20-year, 10-year, 5- year and shorter periods, except for the S&P 500 Index where comparisons were mixed. They also noted that the volatility of the fund’s monthly returns for such periods was less than that of the S&P 500 Index but greater than that of the Lipper Income Funds Index. The board and the committee concluded that the fund’s investment results have been satisfactory and that CRMC’s record in managing the fund indicated that its continued management should benefit the fund and its shareholders.
The board and the committee compared the advisory fees and total expense levels of the fund to those of other relevant funds. They observed that the fund’s advisory fees and expenses generally compared favorably to those of other similar funds included in the Lipper Income Funds category. The board and the committee also considered the breakpoint discounts in the fund’s advisory fee structure that reduce the level of fees charged by CRMC to the fund as fund assets increase. In addition, they reviewed information regarding the effective advisory fees charged to non-mutual fund clients by CRMC and its affiliates. They noted that, to the extent there were differences between the advisory fees paid by the fund and the advisory fees paid by those clients, the differences appropriately reflected the investment, operational and regulatory differences between advising the fund and the other clients. The board and the committee concluded that the fund’s cost structure was fair and reasonable in relation to the services provided, and that the fund’s shareholders receive reasonable value in return for the advisory fees and other amounts paid to CRMC by the fund.
The board and the committee considered a variety of other benefits that CRMC and its affiliates receive as a result of CRMC’s relationship with the fund and the other American Funds, including fees for administrative services provided to certain share classes; fees paid to CRMC’s affiliated transfer agent; sales charges and distribution fees received and retained by the fund’s principal underwriter, an affiliate of CRMC; and possible ancillary benefits to CRMC and its institutional management affiliates in managing other investment vehicles. The board and the committee reviewed CRMC’s portfolio trading practices, noting that while CRMC receives the benefit of research provided by broker-dealers executing portfolio transactions on behalf of the fund, it does not obtain third-party research or other services in return for allocating brokerage to such broker-dealers. The board and the committee took these ancillary benefits into account in evaluating the reasonableness of the advisory fees and other amounts paid to CRMC by the fund.
The board and the committee reviewed information regarding CRMC’s costs of providing services to the American Funds, including personnel, systems and resources of investment, compliance, trading, accounting and other administrative operations. They considered CRMC’s costs and willingness to invest in technology, infrastructure and staff to maintain and expand services and capabilities, respond to industry and regulatory developments, and attract and retain qualified personnel. They noted information regarding the compensation structure for CRMC’s investment professionals. The board and the committee also compared CRMC’s profitability and compensation data to the reported results and data of several large, publicly-held investment management companies. The board and the committee noted the competitiveness and cyclicality of both the mutual fund industry and the capital markets, and the importance in that environment of CRMC’s long-term profitability for maintaining its independence, company culture and management continuity. They further considered the breakpoint discounts in the fund’s advisory fee structure. The board and the committee concluded that the fund’s advisory fee structure reflected a reasonable sharing of benefits between CRMC and the fund’s shareholders.
P.O. Box 6007
Indianapolis, IN 46206-6007
P.O. Box 2280
Norfolk, VA 23501-2280
American Funds Distributors, Inc.
333 South Hope Street
Los Angeles, CA 90071-1406
This page was intentionally left blank.
This page was intentionally left blank.
“American Funds Proxy Voting Procedures and Principles” — which describes how we vote proxies relating to portfolio securities — is available on the American Funds website or upon request by calling AFS. The fund files its proxy voting record with the U.S. Securities and Exchange Commission (SEC) for the 12 months ended June 30 by August 31. The proxy voting record is available free of charge on the SEC website at sec.gov and on the American Funds website.
A complete January 31, 2014, portfolio of The Income Fund of America’s investments is available free of charge by calling AFS or visiting the SEC website (where it is part of Form N-CSR).
The Income Fund of America files a complete list of its portfolio holdings with the SEC for the first and third quarters of each fiscal year on Form N-Q. This filing is available free of charge on the SEC website. You may also review or, for a fee, copy this filing at the SEC’s Public Reference Room in Washington, D.C. Additional information regarding the operation of the Public Reference Room may be obtained by calling the SEC’s Office of Investor Education and Advocacy at (800) SEC-0330. Additionally, the list of portfolio holdings is available by calling AFS.
This report is for the information of shareholders of The Income Fund of America, but it also may be used as sales literature when preceded or accompanied by the current prospectus or summary prospectus, which gives details about charges, expenses, investment objectives and operating policies of the fund. If used as sales material after March 31, 2014, this report must be accompanied by an American Funds statistical update for the most recently completed calendar quarter.
Since 1931, American Funds, part of Capital Group, has helped investors pursue long-term investment success. Our consistent approach — in combination with The Capital SystemSM — has resulted in a superior long-term track record.
Not applicable for filing of semi-annual reports to shareholders.
Not applicable for filing of semi-annual reports to shareholders.
Not applicable for filing of semi-annual reports to shareholders.
Not applicable to this Registrant, insofar as the Registrant is not a listed issuer as defined in Rule 10A-3 under the Securities Exchange Act of 1934.
| Common stocks 73.11% | | |
| | | Value |
| Health care 10.76% | Shares | (000) |
| | | |
| Merck & Co., Inc. | 47,729,140 | $ 2,528,213 |
| Bristol-Myers Squibb Co. | 39,275,000 | 1,962,572 |
| Pfizer Inc. | 51,693,000 | 1,571,467 |
| AstraZeneca PLC | 22,920,000 | 1,453,813 |
| AbbVie Inc. | 8,532,500 | 420,055 |
| Johnson & Johnson | 3,733,000 | 330,258 |
| Roche Holding AG | 1,200,000 | 329,962 |
| Novartis AG | 2,953,000 | 233,856 |
| Novartis AG (ADR) | 500,000 | 39,535 |
| Eli Lilly and Co. | 4,000,000 | 216,040 |
| Baxter International Inc. | 2,675,000 | 182,702 |
| Sonic Healthcare Ltd. | 7,527,841 | 108,768 |
| Rotech Healthcare Inc.1,2,3 | 543,172 | 5,024 |
| | | 9,382,265 |
| Industrials 9.93% | | |
| | | |
| General Electric Co. | 69,579,500 | 1,748,533 |
| Lockheed Martin Corp. | 9,105,000 | 1,374,035 |
| Waste Management, Inc. | 22,822,153 | 953,510 |
| BAE Systems PLC | 71,745,000 | 506,087 |
| Hubbell Inc., Class B | 3,430,000 | 400,384 |
| KONE Oyj, Class B | 9,136,000 | 372,116 |
| Masco Corp. | 15,796,751 | 334,259 |
| Iron Mountain Inc.3 | 12,457,211 | 328,995 |
| Siemens AG | 2,370,000 | 300,335 |
| Norfolk Southern Corp. | 3,000,000 | 277,770 |
| R.R. Donnelley & Sons Co.3 | 13,345,400 | 246,490 |
| Ryanair Holdings PLC (ADR)1 | 4,615,000 | 218,059 |
| United Parcel Service, Inc., Class B | 2,170,000 | 206,649 |
| PACCAR Inc | 3,382,500 | 189,420 |
| Boeing Co. | 1,500,000 | 187,890 |
| Delta Air Lines, Inc. | 5,609,588 | 171,709 |
| United Technologies Corp. | 1,500,000 | 171,030 |
| Honeywell International Inc. | 1,575,000 | 143,687 |
| Beech Holdings, LLC1,2,4 | 14,049,124 | 114,290 |
| Schneider Electric SA | 1,407,606 | 113,697 |
| Vallourec SA | 2,250,000 | 112,416 |
| Atlas Copco AB, Class B | 2,825,000 | 70,675 |
| CEVA Group PLC1,2,5 | 37,722 | 47,419 |
| Geberit AG | 158,758 | 46,087 |
| Douglas Dynamics, Inc.3 | 1,405,146 | 20,403 |
| Atrium Corp.1,2 | 1,807 | 2 |
| | | 8,655,947 |
| Common stocks | | |
| | | Value |
| Financials 9.22% | Shares | (000) |
| | | |
| Wells Fargo & Co. | 19,692,000 | $ 892,835 |
| CME Group Inc., Class A | 10,140,400 | 758,096 |
| HSBC Holdings PLC (United Kingdom) | 34,998,722 | 360,741 |
| HSBC Holdings PLC (Hong Kong)2 | 28,586,382 | 299,977 |
| BlackRock, Inc. | 2,000,000 | 600,940 |
| JPMorgan Chase & Co. | 9,880,000 | 546,957 |
| Suncorp Group Ltd. | 48,244,898 | 514,258 |
| Weyerhaeuser Co.1 | 16,440,213 | 491,234 |
| Digital Realty Trust, Inc.3 | 8,346,000 | 425,563 |
| McGraw Hill Financial, Inc. | 4,725,000 | 359,289 |
| Health Care REIT, Inc. | 5,545,000 | 321,166 |
| Public Storage | 1,757,000 | 276,886 |
| Hospitality Properties Trust3 | 9,608,335 | 246,934 |
| Prudential PLC | 11,775,000 | 237,703 |
| HCP, Inc. | 5,764,800 | 225,692 |
| Kimco Realty Corp. | 7,835,000 | 163,830 |
| British Land Co. PLC | 14,792,941 | 159,648 |
| AXA SA | 5,495,000 | 144,517 |
| Sun Hung Kai Properties Ltd.2 | 11,099,235 | 136,140 |
| Cullen/Frost Bankers, Inc. | 1,700,000 | 125,834 |
| Arthur J. Gallagher & Co. | 2,500,000 | 115,575 |
| Link Real Estate Investment Trust2 | 20,401,812 | 92,494 |
| Macerich Co. | 1,620,000 | 91,692 |
| SEGRO PLC | 13,460,309 | 74,591 |
| Toronto-Dominion Bank | 800,000 | 69,186 |
| Northwest Bancshares, Inc.3 | 4,850,000 | 68,191 |
| Allianz SE | 350,000 | 58,439 |
| Bank of Nova Scotia | 910,065 | 49,926 |
| New York Community Bancorp, Inc. | 3,065,000 | 49,622 |
| Redwood Trust, Inc. | 2,479,888 | 46,374 |
| City Holding Co. | 741,000 | 33,063 |
| American Tower Corp. | 42,271 | 3,419 |
| Prime AET&D Holdings No 1 Pty Ltd.1,2 | 22,756,141 | — |
| | | 8,040,812 |
| Information technology 6.69% | | |
| | | |
| Microsoft Corp. | 53,716,100 | 2,033,154 |
| Texas Instruments Inc. | 20,430,000 | 866,232 |
| Analog Devices, Inc. | 11,650,000 | 562,345 |
| Taiwan Semiconductor Manufacturing Co. Ltd.2 | 127,503,000 | 440,239 |
| Cisco Systems, Inc. | 19,925,500 | 436,568 |
| Intel Corp. | 13,000,000 | 319,020 |
| Paychex, Inc. | 7,458,182 | 311,901 |
| Maxim Integrated Products, Inc. | 7,796,000 | 235,907 |
| Quanta Computer Inc.2 | 82,811,955 | 203,805 |
| STMicroelectronics NV | 24,162,000 | 198,359 |
| KLA-Tencor Corp. | 2,850,000 | 175,190 |
| Fidessa group PLC | 1,240,000 | 47,149 |
| | | 5,829,869 |
| Consumer staples 6.27% | | |
| | | |
| Kimberly-Clark Corp. | 9,570,000 | 1,046,671 |
| PepsiCo, Inc. | 12,177,588 | 978,591 |
| Procter & Gamble Co. | 10,500,000 | 804,510 |
| Common stocks | | |
| | | Value |
| Consumer staples (continued) | Shares | (000) |
| | | |
| Philip Morris International Inc. | 9,499,200 | $ 742,267 |
| Nestlé SA | 5,690,000 | 412,951 |
| Altria Group, Inc. | 10,667,000 | 375,692 |
| Kellogg Co. | 4,500,000 | 260,910 |
| General Mills, Inc. | 3,605,000 | 173,112 |
| Kraft Foods Group, Inc. | 3,216,667 | 168,393 |
| British American Tobacco PLC | 3,318,000 | 159,052 |
| Hershey Co. | 1,500,000 | 149,100 |
| Lorillard, Inc. | 2,450,000 | 120,589 |
| Coca-Cola Co. | 2,000,000 | 75,640 |
| | | 5,467,478 |
| Consumer discretionary 5.43% | | |
| | | |
| Home Depot, Inc. | 12,365,000 | 950,250 |
| Carnival Corp., units | 16,000,000 | 627,040 |
| Time Warner Inc. | 8,065,000 | 506,724 |
| Time Warner Cable Inc. | 3,642,690 | 485,461 |
| SJM Holdings Ltd.2 | 104,800,000 | 329,868 |
| Wolters Kluwer NV | 9,819,814 | 271,237 |
| SES SA, Class A (FDR) | 7,800,000 | 250,530 |
| Marks and Spencer Group PLC | 30,000,000 | 232,234 |
| Genuine Parts Co. | 2,350,000 | 193,287 |
| VF Corp. | 2,840,000 | 165,998 |
| H & M Hennes & Mauritz AB, Class B | 3,649,500 | 157,313 |
| McDonald’s Corp. | 1,500,000 | 141,255 |
| Nokian Renkaat Oyj | 3,049,000 | 128,711 |
| ProSiebenSat.1 Media AG | 2,745,000 | 123,246 |
| Wynn Resorts, Ltd. | 387,000 | 84,142 |
| Daimler AG | 553,800 | 46,406 |
| Cooper-Standard Holdings Inc.1 | 586,012 | 33,989 |
| Revel AC, Inc.1,2,3,4 | 529,539 | 673 |
| Adelphia Recovery Trust, Series ACC-11,2 | 19,531,478 | 195 |
| | | 4,728,559 |
| Energy 5.41% | | |
| | | |
| Spectra Energy Corp | 25,390,500 | 912,788 |
| Royal Dutch Shell PLC, Class B (ADR) | 7,965,000 | 580,091 |
| Royal Dutch Shell PLC, Class B | 3,797,147 | 138,887 |
| ConocoPhillips | 10,889,000 | 707,241 |
| Chevron Corp. | 6,030,800 | 673,218 |
| Kinder Morgan, Inc. | 16,964,000 | 576,946 |
| Occidental Petroleum Corp. | 4,675,000 | 409,390 |
| Crescent Point Energy Corp. | 10,905,000 | 377,159 |
| Diamond Offshore Drilling, Inc. | 3,135,200 | 152,183 |
| Keyera Corp. | 1,332,700 | 78,975 |
| TOTAL SA (ADR) | 1,050,000 | 60,028 |
| Husky Energy Inc. | 1,750,000 | 51,993 |
| General Maritime Corp.1,2 | 5,506 | 162 |
| | | 4,719,061 |
| Utilities 5.21% | | |
| | | |
| National Grid PLC | 99,702,637 | 1,293,180 |
| Duke Energy Corp. | 8,733,957 | 616,792 |
| PG&E Corp. | 11,300,000 | 476,295 |
| Common stocks | | |
| | | Value |
| Utilities (continued) | Shares | (000) |
| | | |
| DTE Energy Co. | 5,000,000 | $ 341,100 |
| Power Assets Holdings Ltd.2 | 43,586,000 | 328,891 |
| EDP — Energias de Portugal, SA | 80,824,000 | 303,695 |
| FirstEnergy Corp. | 8,867,983 | 279,253 |
| ONEOK, Inc. | 3,575,000 | 244,852 |
| Dominion Resources, Inc. | 3,570,000 | 242,439 |
| Exelon Corp. | 6,000,000 | 174,000 |
| Snam SpA | 30,547,000 | 167,679 |
| DUET Group, units | 19,686,734 | 36,008 |
| Ratchaburi Electricity Generating Holding PCL | 24,568,000 | 35,538 |
| | | 4,539,722 |
| Materials 5.15% | | |
| | | |
| E.I. du Pont de Nemours and Co. | 21,261,000 | 1,297,133 |
| Dow Chemical Co. | 24,104,900 | 1,097,014 |
| Nucor Corp.3 | 17,233,293 | 833,230 |
| MeadWestvaco Corp.3 | 11,281,000 | 406,906 |
| BASF SE | 2,500,000 | 268,155 |
| Air Products and Chemicals, Inc. | 1,905,000 | 200,292 |
| Cliffs Natural Resources Inc.3 | 7,354,581 | 142,090 |
| Fletcher Building Ltd. | 17,974,000 | 131,967 |
| Israel Chemicals Ltd.2 | 5,943,040 | 48,784 |
| Impala Platinum Holdings Ltd. | 4,287,112 | 44,540 |
| NewPage Holdings Inc.1,2,4 | 118,460 | 14,126 |
| | | 4,484,237 |
| Telecommunication services 4.81% | | |
| | | |
| Verizon Communications Inc. | 19,215,000 | 922,704 |
| Vodafone Group PLC | 226,644,000 | 844,080 |
| Telstra Corp. Ltd. | 141,451,533 | 636,287 |
| Orange | 40,975,000 | 507,093 |
| TalkTalk Telecom Group PLC3 | 57,242,000 | 293,592 |
| HKT Trust, units2 | 289,748,000 | 278,353 |
| BT Group PLC | 33,330,000 | 210,015 |
| Advanced Info Service PCL | 25,013,400 | 158,370 |
| CenturyLink, Inc. | 5,050,000 | 145,743 |
| OJSC MegaFon (GDR)5 | 3,194,200 | 95,283 |
| OJSC MegaFon (GDR) | 266,800 | 7,959 |
| AT&T Inc. | 2,765,000 | 92,130 |
| | | 4,191,609 |
| Miscellaneous 4.23% | | |
| | | |
| Other common stocks in initial period of acquisition | | 3,689,641 |
| Total common stocks (cost: $49,425,860,000) | | 63,729,200 |
| Preferred stocks 0.53% | | |
| | | |
| Financials 0.45% | | |
| | | |
| Vornado Realty Trust, Series I, 6.625% | 3,380,000 | 81,120 |
| Citigroup Inc. 7.875% preferred | 2,637,610 | 71,697 |
| U.S. Bancorp, Series G, noncumulative convertible preferred | 2,270,400 | 62,734 |
| PNC Financial Services Group, Inc., Series P, noncumulative depositary shares | 2,000,000 | 51,188 |
| Preferred stocks | | |
| | | Value |
| Financials (continued) | Shares | (000) |
| | | |
| HSBC Holdings PLC, Series 2, 8.00% | 1,825,000 | $ 49,218 |
| Citigroup Inc., Series K, depositary shares | 1,508,781 | 38,870 |
| Goldman Sachs Group, Inc., Series J, 5.50% depositary shares | 1,724,000 | 39,975 |
| | | 394,802 |
| Miscellaneous 0.08% | | |
| | | |
| Other preferred stocks in initial period of acquisition | | 70,022 |
| Total preferred stocks (cost: $459,641,000) | | 464,824 |
| Warrants 0.00% | | |
| | | |
| Energy 0.00% | | |
| | | |
| General Maritime Corp., warrants, expire 20171,2 | 8,514 | 26 |
| Total warrants (cost: $2,171,000) | | 26 |
| Convertible securities 0.54% | | |
| | Shares or | |
| Industrials 0.20% | principal amount | |
| | | |
| United Continental Holdings, Inc. 4.50% convertible notes 2021 | $72,600,000 | 102,699 |
| CEVA Group PLC, Series A-2, 2.239% convertible preferred2,4 | 13,633 | 17,137 |
| CEVA Group PLC, Series A-1, 3.239% convertible preferred2 | 31,778 | 53,262 |
| | | 173,098 |
| Materials 0.15% | | |
| | | |
| Alcoa Inc. 5.25% convertible notes 2014 | $41,500,000 | 74,259 |
| Cliffs Natural Resources Inc., Series A, 7.00% convertible preferred 20163 | 2,925,000 | 55,546 |
| | | 129,805 |
| Energy 0.10% | | |
| | | |
| Chesapeake Energy Corporation 5.75% convertible preferred5 | 73,000 | 84,087 |
| Consumer staples 0.03% | | |
| | | |
| Bunge Ltd. 4.875% convertible preferred | 272,700 | 28,224 |
| Consumer discretionary 0.03% | | |
| | | |
| MGM Resorts International 4.25% convertible notes 2015 | $19,845,000 | 27,895 |
| Telecommunication services 0.03% | | |
| | | |
| Leap Wireless International, Inc. 4.50% convertible notes 2014 | $25,000,000 | 25,313 |
| Total convertible securities (cost: $398,779,000) | | 468,422 |
| Bonds, notes & other debt instruments 20.33% | | |
| Corporate bonds & notes 15.64% | Principal amount | |
| Financials 3.13% | (000) | |
| | | |
| Wells Fargo & Co. 1.25% 2016 | $18,000 | 18,185 |
| Wells Fargo & Co. 3.676% 2016 | 10,000 | 10,670 |
| Wells Fargo & Co. 4.60% 2021 | 45,000 | 49,652 |
| Bonds, notes & other debt instruments | | |
| | Principal amount | Value |
| Corporate bonds & notes — Financials (continued) | (000) | (000) |
| | | |
| Wells Fargo & Co., Series K, junior subordinated 7.98% (undated)6 | $ 86,566 | $ 98,036 |
| JPMorgan Chase & Co. 3.45% 2016 | 10,000 | 10,504 |
| JPMorgan Chase & Co. 3.25% 2022 | 5,000 | 4,862 |
| JPMorgan Chase & Co. 3.20% 2023 | 8,000 | 7,694 |
| JPMorgan Chase & Co. 3.875% 2024 | 5,500 | 5,509 |
| JPMorgan Chase & Co., Series-S, junior subordinated, perpetual, 6.75% (undated)6 | 36,535 | 37,211 |
| JPMorgan Chase & Co., Series I, junior subordinated 7.90% (undated)6 | 74,825 | 82,847 |
| SMFG Preferred Capital USD 3 Ltd., junior subordinated 9.50% (undated)5,6 | 116,330 | 145,296 |
| CIT Group Inc., Series C, 4.75% 20155 | 61,150 | 63,137 |
| CIT Group Inc. 4.25% 2017 | 14,000 | 14,578 |
| CIT Group Inc. 5.00% 2017 | 43,300 | 46,331 |
| CIT Group Inc., Series C, 5.50% 20195 | 13,650 | 14,606 |
| Simon Property Group, LP 6.75% 2014 | 5,310 | 5,318 |
| Simon Property Group, LP 5.25% 2016 | 73,435 | 81,218 |
| Simon Property Group, LP 6.10% 2016 | 4,250 | 4,683 |
| Simon Property Group, LP 5.875% 2017 | 15,000 | 16,916 |
| Simon Property Group, LP 6.125% 2018 | 10,790 | 12,683 |
| Simon Property Group, LP 10.35% 2019 | 5,000 | 6,822 |
| Westfield Group 5.75% 20155 | 10,250 | 11,024 |
| Westfield Group 5.70% 20165 | 36,825 | 41,095 |
| Westfield Group 7.125% 20185 | 39,175 | 46,782 |
| Westfield Group 6.75% 20195 | 3,250 | 3,894 |
| Westfield Group 4.625% 20215 | 20,000 | 21,478 |
| Goldman Sachs Group, Inc. 3.625% 2016 | 22,600 | 23,708 |
| Goldman Sachs Group, Inc. 2.625% 2019 | 38,800 | 38,905 |
| Goldman Sachs Group, Inc. 5.25% 2021 | 23,000 | 25,287 |
| Goldman Sachs Group, Inc. 5.75% 2022 | 20,000 | 22,653 |
| Goldman Sachs Group, Inc. 3.625% 2023 | 8,500 | 8,322 |
| Citigroup Inc. 4.587% 2015 | 10,885 | 11,618 |
| Citigroup Inc. 3.953% 2016 | 7,115 | 7,582 |
| Citigroup Inc. 2.50% 2018 | 6,000 | 6,045 |
| Citigroup Inc. 8.50% 2019 | 4,894 | 6,309 |
| Citigroup Inc. 3.875% 2023 | 13,650 | 13,508 |
| Citigroup Inc., Series D, junior subordinated 5.35% (undated)6 | 44,032 | 39,159 |
| Citigroup Inc., Series B, junior subordinated 5.90% (undated)6 | 20,000 | 19,179 |
| Citigroup Inc., Series A, junior subordinated 5.95% (undated)6 | 13,295 | 12,713 |
| Bank of America Corp., Series L, 3.625% 2016 | 7,060 | 7,439 |
| Bank of America Corp. 3.75% 2016 | 9,975 | 10,590 |
| Bank of America Corp. 5.75% 2017 | 8,100 | 9,236 |
| Bank of America Corp. 5.625% 2020 | 9,000 | 10,290 |
| Bank of America Corp. 5.00% 2021 | 3,500 | 3,840 |
| Bank of America Corp. 3.30% 2023 | 4,000 | 3,848 |
| Bank of America Corp. 4.10% 2023 | 900 | 911 |
| Bank of America Corp. 4.125% 2024 | 10,300 | 10,435 |
| Bank of America Corp. 5.00% 2044 | 6,500 | 6,589 |
| Bank of America Corp., Series M, junior subordinated 8.125% noncumulative (undated)6 | 30,924 | 34,566 |
| Realogy Corp. 3.375% 20165 | 3,000 | 3,038 |
| Realogy Corp., Letter of Credit, 4.50% 20166,7,8 | 7,340 | 7,340 |
| Realogy Corp. 7.875% 20195 | 54,355 | 59,519 |
| Realogy Corp., Term Loan B, 4.50% 20206,7,8 | 26,018 | 26,255 |
| Developers Diversified Realty Corp. 5.50% 2015 | 15,776 | 16,624 |
| Developers Diversified Realty Corp. 9.625% 2016 | 8,395 | 9,798 |
| Developers Diversified Realty Corp. 7.50% 2017 | 35,087 | 40,871 |
| Bonds, notes & other debt instruments | | |
| | Principal amount | Value |
| Corporate bonds & notes — Financials (continued) | (000) | (000) |
| | | |
| Developers Diversified Realty Corp. 4.75% 2018 | $ 5,000 | $ 5,442 |
| Developers Diversified Realty Corp. 7.875% 2020 | 7,795 | 9,716 |
| DDR Corp. 3.50% 2021 | 4,000 | 3,968 |
| iStar Financial Inc., Term Loan B, 4.50% 20176,7,8 | 23,757 | 23,908 |
| iStar Financial Inc., Series B, 9.00% 2017 | 37,360 | 44,085 |
| iStar Financial Inc., 4.875% 2018 | 11,575 | 11,691 |
| Hospitality Properties Trust 5.125% 20153 | 2,160 | 2,203 |
| Hospitality Properties Trust 6.30% 20163 | 19,827 | 21,366 |
| Hospitality Properties Trust 5.625% 20173 | 10,169 | 11,081 |
| Hospitality Properties Trust 6.70% 20183 | 12,625 | 14,245 |
| Hospitality Properties Trust 5.00% 20223 | 6,500 | 6,750 |
| Hospitality Properties Trust 4.50% 20233 | 11,060 | 10,956 |
| Mizuho Capital Investment (USD) 2 Ltd, junior subordinated 14.95% (undated)5,6 | 55,766 | 59,044 |
| Prologis, Inc. 2.75% 2019 | 3,500 | 3,517 |
| Prologis, Inc. 3.35% 2021 | 2,750 | 2,724 |
| Prologis, Inc. 4.25% 2023 | 46,755 | 47,205 |
| International Lease Finance Corp. 4.875% 2015 | 51,400 | 53,392 |
| Kimco Realty Corp., Series C, 5.783% 2016 | 15,000 | 16,440 |
| Kimco Realty Corp. 5.70% 2017 | 17,250 | 19,296 |
| Kimco Realty Corp. 4.30% 2018 | 1,000 | 1,083 |
| Kimco Realty Corp. 6.875% 2019 | 10,844 | 13,035 |
| Société Générale, junior subordinated 5.922% (undated)5,6 | 45,073 | 48,119 |
| Lloyds Banking Group PLC 2.30% 2018 | 3,625 | 3,649 |
| HBOS PLC 6.75% 20185 | 17,300 | 19,719 |
| LBG Capital No.1 PLC, Series 2, 7.875% 20205 | 20,000 | 21,650 |
| PNC Financial Services Group, Inc. 2.854% 2022 | 11,862 | 11,340 |
| PNC Preferred Funding Trust I, junior subordinated 1.893% (undated)5,6 | 23,800 | 21,658 |
| PNC Financial Services Group, Inc., Series O, junior subordinated 6.75% (undated)6 | 10,250 | 10,835 |
| UnumProvident Finance Co. PLC 6.85% 20155 | 28,500 | 31,177 |
| Unum Group 7.125% 2016 | 6,740 | 7,711 |
| Standard Chartered PLC 3.85% 20155 | 6,945 | 7,199 |
| Standard Chartered Bank 6.40% 20175 | 25,000 | 28,374 |
| HSBK (Europe) BV 7.25% 20175 | 30,570 | 33,413 |
| American Tower Corp. 7.00% 2017 | 6,200 | 7,293 |
| American Tower Corp. 3.40% 2019 | 6,400 | 6,626 |
| American Tower Corp. 7.25% 2019 | 15,025 | 18,204 |
| Crescent Resources 10.25% 20175 | 26,885 | 29,708 |
| Icahn Enterprises Finance Corp. 3.50% 20175 | 23,550 | 23,638 |
| Icahn Enterprises Finance Corp. 4.875% 20195 | 5,250 | 5,243 |
| MetLife Global Funding I 2.50% 20155 | 10,000 | 10,325 |
| MetLife Capital Trust IV, junior subordinated 7.875% 20675,6 | 14,430 | 16,703 |
| MetLife Capital Trust X, junior subordinated 9.25% 20685,6 | 500 | 645 |
| Morgan Stanley 1.75% 2016 | 15,000 | 15,229 |
| Morgan Stanley 3.80% 2016 | 5,125 | 5,422 |
| Morgan Stanley 2.50% 2019 | 6,645 | 6,640 |
| Synovus Financial Corp. 5.125% 2017 | 10,409 | 10,955 |
| Synovus Financial Corp. 7.875% 2019 | 13,816 | 15,664 |
| BNP Paribas 3.60% 2016 | 10,000 | 10,543 |
| BNP Paribas 2.40% 2018 | 8,000 | 8,026 |
| BNP Paribas 5.00% 2021 | 7,000 | 7,704 |
| American International Group, Inc. 4.875% 2016 | 4,000 | 4,397 |
| American International Group, Inc. 3.80% 2017 | 8,000 | 8,575 |
| American International Group, Inc. 3.375% 2020 | 13,000 | 13,282 |
| Bonds, notes & other debt instruments | | |
| | Principal amount | Value |
| Corporate bonds & notes — Financials (continued) | (000) | (000) |
| | | |
| Rabobank Nederland 2.25% 2019 | $ 8,000 | $ 8,016 |
| Rabobank Nederland 4.625% 2023 | 17,280 | 17,553 |
| Liberty Mutual Group Inc. 4.25% 20235 | 4,400 | 4,382 |
| Liberty Mutual Group Inc., Series A, 7.80% 20875,6 | 19,415 | 20,968 |
| Intercontinentalexchange, Inc. 2.50% 2018 | 12,000 | 12,242 |
| Intercontinentalexchange, Inc. 4.00% 2023 | 9,045 | 9,313 |
| HCP, Inc. 3.75% 2016 | 20,000 | 21,074 |
| Regions Financial Corp. 7.75% 2014 | 4,791 | 5,053 |
| Regions Financial Corp. 5.75% 2015 | 14,761 | 15,658 |
| Berkshire Hathaway Inc. 2.20% 2016 | 11,500 | 11,930 |
| Berkshire Hathaway Inc. 2.90% 2020 | 6,000 | 6,078 |
| Berkshire Hathaway Inc. 4.40% 2042 | 1,500 | 1,430 |
| Berkshire Hathaway Finance Corp. 4.30% 2043 | 1,000 | 929 |
| US Bancorp., Series T, 1.65% 2017 | 10,000 | 10,158 |
| US Bancorp. 3.70% 2024 | 10,000 | 10,104 |
| RBS Capital Trust II 6.425% noncumulative trust (undated)6 | 6,005 | 5,690 |
| Royal Bank of Scotland Group PLC, junior subordinated 6.99% (undated)5,6,9 | 12,735 | 13,626 |
| BPCE SA group 5.15% 20245 | 17,930 | 17,682 |
| BB&T Corp., 2.05% 2018 | 2,350 | 2,360 |
| BB&T Corp. 2.25% 2019 | 15,000 | 15,023 |
| QBE Insurance Group Ltd. 2.40% 20185 | 16,910 | 16,413 |
| Leucadia National Corp. 5.50% 2023 | 15,380 | 15,816 |
| BBVA Bancomer SA 4.50% 20165 | 7,500 | 7,950 |
| BBVA Bancomer SA 6.50% 20215 | 7,200 | 7,767 |
| Corporate Office Properties Trust 3.60% 2023 | 1,005 | 935 |
| Corporate Office Properties LP 5.25% 2024 | 14,000 | 14,728 |
| DCT Industrial Trust Inc. 4.50% 20235 | 15,550 | 15,558 |
| Prudential Financial, Inc. 4.50% 2021 | 2,400 | 2,600 |
| Prudential Holdings, LLC, Series C, 8.695% 20235,7 | 9,811 | 12,717 |
| ERP Operating LP 6.584% 2015 | 2,705 | 2,896 |
| ERP Operating LP 7.125% 2017 | 10,000 | 11,728 |
| American Express Co. 6.15% 2017 | 12,610 | 14,607 |
| FelCor Lodging Trust Inc. 5.625% 2023 | 13,350 | 13,083 |
| Boston Properties, Inc. 3.70% 2018 | 12,000 | 12,789 |
| New York Life Global Funding 2.10% 20195 | 11,000 | 11,042 |
| Bank of New York Mellon Corp., Series G, 2.50% 2016 | 10,000 | 10,366 |
| ANZ National (International) Ltd. 3.125% 20155 | 10,000 | 10,351 |
| Ryman Hospitality Properties, Inc. 5.00% 2021 | 10,375 | 10,245 |
| Westpac Banking Corp. 3.00% 2015 | 9,000 | 9,410 |
| Bank of Nova Scotia 2.55% 2017 | 9,000 | 9,396 |
| Toronto-Dominion Bank 2.375% 2016 | 9,000 | 9,352 |
| Nationwide Mutual Insurance Co. 5.81% 20245,6 | 8,150 | 8,282 |
| Brandywine Operating Partnership, LP 5.40% 2014 | 6,000 | 6,198 |
| Brandywine Operating Partnership, LP 5.70% 2017 | 20 | 22 |
| Brandywine Operating Partnership, LP 3.95% 2023 | 1,729 | 1,685 |
| ACE INA Holdings Inc. 2.60% 2015 | 7,445 | 7,710 |
| Santander Issuances, SA Unipersonal 6.50% 20195,6 | 7,500 | 7,650 |
| Host Hotels & Resorts LP 6.00% 2021 | 6,400 | 7,146 |
| Discover Financial Services 4.20% 2023 | 6,780 | 6,852 |
| Barclays Bank PLC 5.125% 2020 | 5,500 | 6,214 |
| UDR, Inc., Series A, 5.25% 2015 | 3,000 | 3,119 |
| UDR, Inc. 3.70% 2020 | 2,320 | 2,376 |
| Zions Bancorporation 5.50% 2015 | 3,731 | 3,945 |
| Zions Bancorporation 6.00% 2015 | 1,357 | 1,440 |
| Bonds, notes & other debt instruments | | |
| | Principal amount | Value |
| Corporate bonds & notes — Financials (continued) | (000) | (000) |
| | | |
| CME Group Inc. 5.30% 2043 | $ 4,000 | $ 4,357 |
| AXA SA, Series B, junior subordinated 6.379% (undated)5,6 | 4,155 | 4,165 |
| Essex Portfolio L.P. 3.25% 2023 | 4,400 | 4,116 |
| VEB Finance Ltd. 6.80% 20255 | 3,000 | 3,109 |
| Alexandria Real Estate Equities, Inc. 3.90% 2023 | 3,250 | 3,104 |
| Goodman Funding Pty Ltd. 6.00% 20225 | 2,685 | 2,970 |
| American Campus Communities, Inc. 3.75% 2023 | 2,985 | 2,836 |
| AvalonBay Communities, Inc. 3.625% 2020 | 1,790 | 1,841 |
| Development Bank of Kazakhstan 5.50% 2015 | 930 | 985 |
| Development Bank of Kazakhstan 5.50% 20155 | 637 | 675 |
| Piedmont Operating Partnership LP 3.40% 2023 | 1,750 | 1,622 |
| Genworth Holdings, Inc. 4.90% 2023 | 1,565 | 1,589 |
| | | 2,731,047 |
| Consumer discretionary 2.09% | | |
| | | |
| Neiman Marcus Group LTD Inc., Term Loan B, 5.00% 20206,7,8 | 36,533 | 37,008 |
| Neiman Marcus Group LTD Inc. 8.00% 20215 | 47,550 | 50,046 |
| Neiman Marcus Group LTD Inc. 8.75% 20215,6,10 | 16,510 | 17,418 |
| EchoStar DBS Corp. 7.75% 2015 | 7,350 | 7,975 |
| DISH DBS Corp. 4.625% 2017 | 45,105 | 47,360 |
| DISH DBS Corp. 4.25% 2018 | 35,500 | 36,299 |
| DISH DBS Corp. 7.875% 2019 | 1,425 | 1,630 |
| DISH DBS Corp. 5.125% 2020 | 10,900 | 10,927 |
| Boyd Gaming Corp. 9.125% 2018 | 88,575 | 96,325 |
| Boyd Gaming Corp. 9.00% 2020 | 5,000 | 5,438 |
| MGM Resorts International 5.875% 2014 | 24,905 | 24,986 |
| MGM Resorts International 6.625% 2015 | 20,725 | 22,228 |
| MGM Resorts International 7.50% 2016 | 8,425 | 9,457 |
| MGM Resorts International 8.625% 2019 | 2,425 | 2,868 |
| MGM Resorts International 6.75% 2020 | 7,350 | 7,938 |
| MGM Resorts International 7.75% 2022 | 17,000 | 19,210 |
| Caesars Entertainment Operating Co. 11.25% 2017 | 24,365 | 24,852 |
| Caesars Entertainment,Term Loan B, 7.00% 20206,7,8 | 5,000 | 5,068 |
| Caesars Entertainment Operating Co. 8.00% 20205 | 17,475 | 18,218 |
| Caesars Entertainment Operating Co. 9.00% 2020 | 19,450 | 18,915 |
| Caesars Entertainment Operating Co. 9.00% 2020 | 9,000 | 8,775 |
| Limited Brands, Inc. 5.25% 2014 | 1,585 | 1,635 |
| Limited Brands, Inc. 8.50% 2019 | 16,105 | 19,527 |
| Limited Brands, Inc. 7.00% 2020 | 21,271 | 24,036 |
| Limited Brands, Inc. 6.625% 2021 | 23,754 | 26,040 |
| Time Warner Cable Inc. 7.50% 2014 | 7,900 | 7,987 |
| Time Warner Cable Inc. 6.75% 2018 | 18,630 | 21,084 |
| Time Warner Cable Inc. 5.00% 2020 | 35,000 | 36,101 |
| Comcast Corp. 5.90% 2016 | 10,000 | 11,040 |
| Comcast Corp. 5.65% 2035 | 7,000 | 7,747 |
| Comcast Corp. 6.45% 2037 | 25,000 | 29,964 |
| Comcast Corp. 6.95% 2037 | 7,000 | 8,874 |
| NBCUniversal Media, LLC 2.875% 2016 | 10,000 | 10,428 |
| NBC Universal Enterprise, Inc. 0.924% 20185,6 | 8,625 | 8,647 |
| NBC Universal Enterprise, Inc. 5.25% (undated)5 | 37,105 | 37,476 |
| Cox Communications, Inc. 5.45% 2014 | 1,599 | 1,666 |
| Cox Communications, Inc. 5.875% 20165 | 25,000 | 28,124 |
| Cox Communications, Inc. 2.95% 20235 | 23,875 | 21,883 |
| Ford Motor Credit Co. 1.70% 2016 | 8,500 | 8,607 |
| Bonds, notes & other debt instruments | | |
| | Principal amount | Value |
| Corporate bonds & notes — Consumer discretionary (continued) | (000) | (000) |
| | | |
| Ford Motor Credit Co. 2.50% 2016 | $ 7,000 | $ 7,191 |
| Ford Motor Credit Co. 8.00% 2016 | 1,500 | 1,772 |
| Ford Motor Credit Co. 2.375% 2018 | 10,905 | 11,052 |
| Ford Motor Credit Co. 4.375% 2023 | 17,850 | 18,185 |
| Ford Motor Co. 4.75% 2043 | 150 | 141 |
| Hilton Worldwide, Term Loan B, 4.00% 20206,7,8 | 20,704 | 20,876 |
| Hilton Hotels Corp. 5.625% 20215 | 24,715 | 25,626 |
| Time Warner Inc. 5.875% 2016 | 8,000 | 9,026 |
| Time Warner Inc. 4.75% 2021 | 15,000 | 16,501 |
| Time Warner Inc. 4.05% 2023 | 6,220 | 6,344 |
| Time Warner Inc. 6.25% 2041 | 6,650 | 7,689 |
| Time Warner Inc. 5.35% 2043 | 4,525 | 4,746 |
| Myriad International Holdings 6.00% 20205 | 40,000 | 42,200 |
| Virgin Media Secured Finance PLC 6.50% 2018 | 8,800 | 9,130 |
| Virgin Media Finance PLC 8.375% 20195 | 14,150 | 15,335 |
| Virgin Media Secured Finance PLC 5.375% 20215 | 17,600 | 17,732 |
| Dollar General Corp. 3.25% 2023 | 40,288 | 37,350 |
| Toys “R” Us-Delaware, Inc. 7.375% 20165 | 11,525 | 10,200 |
| Toys “R” Us Property Co. II, LLC 8.50% 2017 | 13,300 | 13,566 |
| Toys “R” Us-Delaware, Inc., Term Loan B2, 5.25% 20186,7,8 | 15,649 | 12,910 |
| Cequel Communications Holdings I, LLC and Cequel Capital Corp. 6.375% 20205 | 35,425 | 36,399 |
| Citycenter, Term Loan B, 5.00% 20206,7,8 | 35,125 | 35,604 |
| Home Depot, Inc. 5.95% 2041 | 25,000 | 30,238 |
| DaimlerChrysler North America Holding Corp. 1.30% 20155 | 8,500 | 8,591 |
| DaimlerChrysler North America Holding Corp. 2.625% 20165 | 2,000 | 2,074 |
| DaimlerChrysler North America Holding Corp. 2.40% 20175 | 14,000 | 14,370 |
| DaimlerChrysler North America Holding Corp. 2.375% 20185 | 2,000 | 2,028 |
| DaimlerChrysler North America Holding Corp. 8.50% 2031 | 2,000 | 2,972 |
| Charter Communications Operating, LLC and Charter Communications Operating Capital Corp. 7.25% 2017 | 19,600 | 20,800 |
| CCO Holdings LLC and CCO Holdings Capital Corp. 7.00% 2019 | 8,000 | 8,460 |
| Volkswagen International Finance NV 0.857% 20145,6 | 10,000 | 10,008 |
| Volkswagen International Finance NV 2.875% 20165 | 4,000 | 4,164 |
| Volkswagen International Finance NV 2.375% 20175 | 14,500 | 15,013 |
| Michaels Stores, Inc. 7.50% 20185,6,10 | 5,000 | 5,150 |
| Michaels Stores, Inc. 7.75% 2018 | 17,000 | 18,232 |
| Michaels Stores, Inc. 5.875% 20205 | 5,500 | 5,514 |
| News America Inc. 5.30% 2014 | 20,000 | 20,817 |
| News America Inc. 3.00% 2022 | 3,000 | 2,882 |
| News America Inc. 6.15% 2041 | 3,500 | 4,035 |
| Univision Communications Inc. 6.875% 20195 | 3,200 | 3,448 |
| Univision Communications Inc., Term Loan C3, 4.00% 20206,7,8 | 17,319 | 17,435 |
| Univision Communications Inc., Term Loan D, 4.00% 20206,7,8 | 4,000 | 4,027 |
| Univision Communications Inc. 5.125% 20235 | 685 | 685 |
| Royal Caribbean Cruises Ltd. 11.875% 2015 | 21,425 | 24,532 |
| PETCO Animal Supplies, Inc. 9.25% 20185 | 21,600 | 23,274 |
| Mediacom LLC and Mediacom Capital Corp. 9.125% 2019 | 13,750 | 14,884 |
| Mediacom LLC and Mediacom Capital Corp. 7.25% 2022 | 7,775 | 8,319 |
| Cablevision Systems Corp. 8.00% 2020 | 20,000 | 22,550 |
| Marriott International, Inc., Series I, 6.375% 2017 | 19,000 | 21,759 |
| Burger King Corp 0%/11.00% 20195,11 | 23,475 | 21,245 |
| Stackpole Intl. 7.75% 20215 | 19,840 | 20,782 |
| Videotron Ltd. 6.375% 2015 | 4,905 | 4,932 |
| Quebecor Media Inc. 7.75% 2016 | 7,037 | 7,125 |
| Quebecor Media Inc. 5.75% 2023 | 8,500 | 8,309 |
| Bonds, notes & other debt instruments | | |
| | Principal amount | Value |
| Corporate bonds & notes — Consumer discretionary (continued) | (000) | (000) |
| | | |
| Carnival Corp. 3.95% 2020 | $ 18,040 | $ 18,545 |
| Gannett Co., Inc. 5.125% 20195 | 7,925 | 8,202 |
| Gannett Co., Inc. 6.375% 20235 | 8,950 | 9,196 |
| Cinemark USA, Inc. 5.125% 2022 | 9,500 | 9,298 |
| Cinemark USA, Inc. 4.875% 2023 | 8,300 | 7,885 |
| Needle Merger Sub Corp. 8.125% 20195 | 16,220 | 16,950 |
| Warner Music Group 11.50% 2018 | 5,700 | 6,512 |
| Warner Music Group 6.00% 20215 | 9,720 | 10,109 |
| Mohegan Tribal Gaming Authority 11.00% 20185,6,10 | 13,725 | 13,837 |
| J.C. Penney Co., Inc. 5.75% 2018 | 18,528 | 13,525 |
| Sally Holdings LLC and Sally Capital Inc. 6.875% 2019 | 11,950 | 13,205 |
| RCI Banque 3.50% 20185 | 12,500 | 12,909 |
| Laureate Education, Inc. 9.25% 20195 | 11,750 | 12,690 |
| General Motors Financial Co. 3.25% 20185 | 9,830 | 9,941 |
| General Motors Financial Co. 6.75% 2018 | 1,720 | 1,974 |
| Cumulus Media Inc., Term Loan B, 4.25% 20206,7,8 | 11,300 | 11,433 |
| Seminole Tribe of Florida 6.535% 20205,7 | 10,000 | 11,100 |
| Clear Channel Worldwide Holdings, Inc. 7.625% 2020 | 10,010 | 10,611 |
| Playa Resorts Holding BV, Term Loan B, 4.75% 20196,7,8 | 4,813 | 4,867 |
| Playa Resorts Holding BV 8.00% 20205 | 4,900 | 5,243 |
| Federated Department Stores, Inc. 6.90% 2029 | 7,925 | 9,602 |
| President & Fellows of Harvard College 3.619% 2037 | 10,000 | 8,980 |
| Toyota Motor Credit Corp. 0.875% 2015 | 8,500 | 8,565 |
| Seneca Gaming Corp. 8.25% 20185 | 7,925 | 8,559 |
| Walt Disney Co. 1.10% 2017 | 7,575 | 7,520 |
| Burlington Coat Factory Warehouse Corp. 10.00% 2019 | 6,700 | 7,504 |
| Six Flags Entertainment Corp. 5.25% 20215 | 6,400 | 6,352 |
| Dynacast International LLC 9.25% 2019 | 5,575 | 6,181 |
| Schaeffler Holding Finance BV 6.875% 20185,6,10 | 5,450 | 5,804 |
| CBS Corp. 1.95% 2017 | 5,000 | 5,059 |
| Viacom Inc. 4.25% 2023 | 2,950 | 3,027 |
| Viacom Inc. 5.85% 2043 | 1,750 | 1,919 |
| Thomson Reuters Corp. 1.30% 2017 | 1,510 | 1,509 |
| Thomson Reuters Corp. 4.30% 2023 | 1,285 | 1,315 |
| Thomson Reuters Corp. 5.65% 2043 | 1,425 | 1,503 |
| Allison Transmission Holdings, Inc., Term Loan B2, 3.16% 20176,7,8 | 3,474 | 3,487 |
| Weather Company, Term Loan, 7.00% 20206,7,8 | 2,500 | 2,528 |
| NCL Corp. Ltd. 5.00% 2018 | 575 | 598 |
| | | 1,820,080 |
| Telecommunication services 2.09% | | |
| | | |
| Clearwire Communications and Clearwire Finance, Inc. 14.75% 20165 | 6,125 | 8,231 |
| Sprint Nextel Corp. 8.375% 2017 | 29,525 | 34,249 |
| Sprint Nextel Corp. 9.125% 2017 | 39,446 | 46,546 |
| Sprint Nextel Corp. 9.00% 20185 | 5,000 | 6,050 |
| Sprint Nextel Corp. 7.00% 2020 | 66,570 | 72,062 |
| Sprint Corp. 7.25% 20215 | 32,350 | 34,978 |
| Sprint Nextel Corp. 11.50% 2021 | 20,975 | 27,582 |
| Sprint Corp. 7.875% 20235 | 97,075 | 103,870 |
| Sprint Corp. 7.125% 20245 | 14,000 | 14,105 |
| Verizon Communications Inc. 3.00% 2016 | 17,000 | 17,758 |
| Verizon Communications Inc. 1.993% 20186 | 7,000 | 7,333 |
| Verizon Communications Inc. 5.15% 2023 | 105,485 | 115,043 |
| Verizon Communications Inc. 6.00% 2041 | 28,000 | 31,449 |
| Verizon Communications Inc. 6.55% 2043 | 104,810 | 126,575 |
| Wind Acquisition SA 11.75% 20175 | 128,405 | 135,628 |
| Bonds, notes & other debt instruments | | |
| | Principal amount | Value |
| Corporate bonds & notes — Telecommunication services (continued) | (000) | (000) |
| | | |
| Wind Acquisition SA 7.25% 20185 | $ 50,980 | $ 53,657 |
| Wind Acquisition SA 7.25% 20185 | 15,040 | 15,830 |
| NII Capital Corp. 10.00% 2016 | 54,575 | 34,382 |
| NII Capital Corp. 7.875% 20195 | 42,475 | 32,281 |
| NII Capital Corp. 8.875% 2019 | 45,100 | 21,423 |
| NII Capital Corp. 11.375% 20195 | 60,600 | 50,601 |
| NII Capital Corp. 7.625% 2021 | 109,110 | 46,917 |
| T-Mobile US, Inc. 6.542% 2020 | 54,450 | 57,853 |
| MetroPCS Wireless, Inc. 6.25% 20215 | 50,075 | 52,203 |
| MetroPCS Wireless, Inc. 6.625% 20235 | 61,150 | 63,672 |
| Leap Wireless International, Inc., Term Loan C, 4.75% 20206,7,8 | 62,337 | 62,543 |
| Cricket Communications, Inc. 7.75% 2020 | 53,075 | 60,439 |
| LightSquared, Term Loan B, 12.00% 20147,8,9,10 | 96,867 | 115,756 |
| Frontier Communications Corp. 8.125% 2018 | 4,997 | 5,709 |
| Frontier Communications Corp. 8.50% 2020 | 15,475 | 17,390 |
| Frontier Communications Corp. 9.25% 2021 | 20,625 | 23,719 |
| Frontier Communications Corp. 8.75% 2022 | 6,425 | 7,043 |
| Frontier Communications Corp. 7.125% 2023 | 27,825 | 27,755 |
| Frontier Communications Corp. 7.625% 2024 | 28,125 | 28,055 |
| Intelsat Jackson Holding Co. 7.25% 2020 | 7,750 | 8,448 |
| Intelsat Jackson Holding Co. 6.625% 20225 | 54,310 | 56,347 |
| Telecom Italia Capital SA 6.999% 2018 | 26,440 | 29,679 |
| Telecom Italia Capital SA 7.175% 2019 | 9,000 | 10,215 |
| Telecom Italia Capital SA 7.721% 2038 | 1,750 | 1,811 |
| Telefónica Emisiones, SAU 3.992% 2016 | 10,000 | 10,537 |
| Telefónica Emisiones, SAU 3.192% 2018 | 8,500 | 8,772 |
| Telefónica Emisiones, SAU 5.134% 2020 | 7,950 | 8,605 |
| Telefónica Emisiones, SAU 4.57% 2023 | 4,500 | 4,547 |
| France Télécom 2.75% 2016 | 9,000 | 9,351 |
| France Télécom 4.125% 2021 | 15,000 | 15,295 |
| Orange, SA 5.50% 2044 | 3,000 | 3,058 |
| Trilogy International Partners, LLC 10.25% 20165 | 24,750 | 25,121 |
| Deutsche Telekom International Finance BV 4.875% 2014 | 10,000 | 10,187 |
| Deutsche Telekom International Finance BV 9.25% 2032 | 8,420 | 12,949 |
| Deutsche Telekom International Finance BV 4.875% 20425 | 350 | 344 |
| SBC Communications Inc. 5.10% 2014 | 3,500 | 3,600 |
| AT&T Inc. 2.40% 2016 | 9,000 | 9,289 |
| Altice Finco SA 6.50% 20225 | 12,000 | 12,210 |
| Syniverse Holdings, Inc. 9.125% 2019 | 7,800 | 8,551 |
| Qwest Capital Funding, Inc. 7.625% 2021 | 3,900 | 4,193 |
| SBA Communications Corp. 5.75% 2020 | 3,375 | 3,527 |
| Level 3 Communications, Inc. 11.875% 2019 | 3,000 | 3,465 |
| | | 1,818,788 |
| Energy 1.77% | | |
| | | |
| TransCanada PipeLines Ltd. 7.625% 2039 | 10,750 | 14,820 |
| TransCanada PipeLines Ltd., junior subordinated 6.35% 20676 | 61,150 | 63,179 |
| Kinder Morgan Energy Partners, LP 3.50% 2016 | 9,750 | 10,237 |
| Kinder Morgan Energy Partners, LP 2.65% 2019 | 1,890 | 1,890 |
| Kinder Morgan Energy Partners, LP 9.00% 2019 | 1,660 | 2,126 |
| Kinder Morgan Energy Partners, LP 4.15% 2022 | 12,145 | 12,341 |
| Kinder Morgan Energy Partners, LP 3.45% 2023 | 15,000 | 14,189 |
| Kinder Morgan Energy Partners, LP 3.50% 2023 | 6,250 | 5,882 |
| Kinder Morgan Energy Partners, LP 4.15% 2024 | 5,350 | 5,279 |
| Bonds, notes & other debt instruments | | |
| | Principal amount | Value |
| Corporate bonds & notes — Energy (continued) | (000) | (000) |
| | | |
| Kinder Morgan Energy Partners, LP 6.95% 2038 | $ 750 | $ 890 |
| Kinder Morgan Energy Partners, LP 5.00% 2043 | 20,000 | 18,939 |
| Anadarko Petroleum Corp. 5.95% 2016 | 10,500 | 11,722 |
| Anadarko Petroleum Corp. 6.375% 2017 | 13,500 | 15,525 |
| Anadarko Petroleum Corp. 8.70% 2019 | 32,880 | 42,027 |
| Anadarko Petroleum Corp. 6.45% 2036 | 1,095 | 1,287 |
| Anadarko Petroleum Corp. 6.20% 2040 | 500 | 576 |
| Transocean Inc. 5.05% 2016 | 22,500 | 24,811 |
| Transocean Inc. 2.50% 2017 | 2,080 | 2,113 |
| Transocean Inc. 6.375% 2021 | 36,190 | 40,450 |
| Transocean Inc. 3.80% 2022 | 3,890 | 3,684 |
| Peabody Energy Corp. 6.00% 2018 | 40,345 | 43,169 |
| Peabody Energy Corp. 6.25% 2021 | 22,125 | 22,457 |
| NGPL PipeCo LLC 7.119% 20175 | 15,200 | 14,440 |
| NGPL PipeCo LLC 9.625% 20195 | 46,380 | 46,264 |
| CONSOL Energy Inc. 8.00% 2017 | 6,750 | 7,096 |
| CONSOL Energy Inc. 8.25% 2020 | 46,251 | 50,356 |
| Alpha Natural Resources, Inc. 9.75% 2018 | 27,265 | 28,833 |
| Alpha Natural Resources, Inc. 6.00% 2019 | 12,635 | 10,519 |
| Alpha Natural Resources, Inc. 6.25% 2021 | 20,635 | 16,972 |
| StatoilHydro ASA 3.875% 2014 | 10,000 | 10,066 |
| StatoilHydro ASA 1.80% 2016 | 10,000 | 10,241 |
| Statoil ASA 3.125% 2017 | 10,000 | 10,644 |
| StatoilHydro ASA 5.25% 2019 | 2,000 | 2,309 |
| Statoil ASA 3.15% 2022 | 150 | 151 |
| StatoilHydro ASA 2.65% 2024 | 4,000 | 3,725 |
| Statoil ASA 3.70% 2024 | 15,750 | 16,050 |
| Statoil ASA 4.25% 2041 | 3,000 | 2,890 |
| Enbridge Inc. 5.60% 2017 | 20,067 | 22,334 |
| Enbridge Inc. 4.00% 2023 | 30,650 | 31,030 |
| Petrobras Global Finance Co. 3.00% 2019 | 2,760 | 2,610 |
| Petrobras International Finance Co. 5.75% 2020 | 6,535 | 6,779 |
| Petrobras International Finance Co. 5.375% 2021 | 31,695 | 31,483 |
| Petrobras Global Finance Co. 4.375% 2023 | 5,000 | 4,461 |
| Petrobras International Finance Co. 6.75% 2041 | 580 | 525 |
| Petrobras Global Finance Co. 5.625% 2043 | 1,410 | 1,115 |
| Petróleos Mexicanos 3.50% 2018 | 14,280 | 14,637 |
| Petróleos Mexicanos 5.50% 2021 | 3,165 | 3,387 |
| Petróleos Mexicanos 4.875% 2022 | 435 | 444 |
| Petróleos Mexicanos 4.875% 20245 | 1,750 | 1,748 |
| Petróleos Mexicanos 4.875% 2024 | 1,270 | 1,271 |
| Petróleos Mexicanos 6.375% 20455 | 23,870 | 23,987 |
| Enbridge Energy Partners, LP, Series B, 6.50% 2018 | 5,225 | 6,137 |
| Enbridge Energy Partners, LP 9.875% 2019 | 10,500 | 13,828 |
| Enbridge Energy Partners, LP, Series B, 7.50% 2038 | 6,000 | 7,568 |
| Enbridge Energy Partners, LP 5.50% 2040 | 16,200 | 16,584 |
| Ras Laffan Liquefied Natural Gas III 5.50% 20145 | 2,400 | 2,472 |
| Ras Laffan Liquefied Natural Gas III 6.75% 2019 | 4,000 | 4,740 |
| Ras Laffan Liquefied Natural Gas III 6.75% 20195 | 1,000 | 1,185 |
| Ras Laffan Liquefied Natural Gas II 5.298% 20205,7 | 22,140 | 23,801 |
| Ras Laffan Liquefied Natural Gas III 5.838% 20275,7 | 10,325 | 11,074 |
| El Paso Pipeline Partners Operating Co., LLC 5.00% 2021 | 5,000 | 5,343 |
| El Paso Pipeline Partners Operating Co., LLC 4.70% 2042 | 41,015 | 36,469 |
| Spectra Energy Partners, LP 2.95% 2016 | 3,750 | 3,913 |
| Bonds, notes & other debt instruments | | |
| | Principal amount | Value |
| Corporate bonds & notes — Energy (continued) | (000) | (000) |
| | | |
| Spectra Energy Partners, LP 4.60% 2021 | $15,730 | $16,692 |
| Spectra Energy Partners, LP 4.75% 2024 | 18,460 | 19,541 |
| Samson Investment Co., Term Loan B, 5.00% 20186,7,8 | 1,450 | 1,467 |
| Samson Investment Co. 10.50% 20205 | 34,555 | 38,183 |
| Laredo Petroleum, Inc. 9.50% 2019 | 34,200 | 38,261 |
| Arch Coal, Inc. 7.00% 2019 | 27,575 | 21,543 |
| Arch Coal, Inc. 9.875% 2019 | 2,250 | 1,980 |
| Arch Coal, Inc. 7.25% 2021 | 18,675 | 14,240 |
| Enterprise Products Operating LLC 5.20% 2020 | 5,500 | 6,239 |
| Enterprise Products Operating LLC 3.35% 2023 | 26,420 | 25,761 |
| Enterprise Products Operating LLC 4.85% 2044 | 2,200 | 2,182 |
| Odebrecht Drilling Norbe VIII/IX Ltd 6.35% 20215,7 | 1,674 | 1,719 |
| Odebrecht Offshore Drilling Finance Ltd. 6.75% 20225,7 | 30,877 | 31,572 |
| Chevron Corp. 2.355% 2022 | 20,000 | 18,775 |
| Chevron Corp. 3.191% 2023 | 13,800 | 13,674 |
| Williams Partners L.P. 4.125% 2020 | 6,500 | 6,812 |
| Williams Partners L.P. and Williams Partners Finance Corp. 5.25% 2020 | 1,960 | 2,178 |
| Williams Partners L.P. 4.00% 2021 | 11,820 | 11,998 |
| Williams Partners L.P. 3.35% 2022 | 5,000 | 4,752 |
| Williams Partners L.P. 4.50% 2023 | 6,000 | 6,102 |
| Total Capital SA 3.00% 2015 | 10,000 | 10,367 |
| Total Capital International 2.125% 2018 | 6,500 | 6,609 |
| Total Capital International 3.70% 2024 | 5,000 | 5,060 |
| Total Capital International 3.75% 2024 | 6,050 | 6,155 |
| PDC Energy Inc. 7.75% 2022 | 25,975 | 28,118 |
| Sabine Pass Liquefaction, LLC 5.625% 20215 | 22,150 | 22,205 |
| Sabine Pass Liquefaction, LLC 5.625% 2023%5 | 5,000 | 4,775 |
| Shell International Finance BV 4.00% 2014 | 20,000 | 20,097 |
| Shell International Finance BV 2.00% 2018 | 4,990 | 5,050 |
| Regency Energy Partners LP and Regency Energy Finance Corp. 6.50% 2021 | 11,800 | 12,596 |
| Regency Energy Partners LP and Regency Energy Finance Corp. 5.50% 2023 | 10,875 | 10,657 |
| Devon Energy Corp. 2.25% 2018 | 5,850 | 5,888 |
| Devon Energy Corp. 3.25% 2022 | 15,250 | 14,855 |
| Devon Energy Corp. 4.75% 2042 | 1,700 | 1,638 |
| Cenovus Energy Inc. 3.00% 2022 | 5,970 | 5,690 |
| Cenovus Energy Inc. 3.80% 2023 | 12,500 | 12,435 |
| Cenovus Energy Inc. 6.75% 2039 | 2,500 | 3,083 |
| QGOG Atlantic/Alaskan Rigs Ltd. 5.25% 20195,7 | 20,266 | 20,975 |
| Denbury Resources Inc. 4.625% 2023 | 22,250 | 20,637 |
| Woodside Finance Ltd. 4.60% 20215 | 18,935 | 20,302 |
| Gaz Capital SA, Series 7, 6.212% 2016 | 5,600 | 6,201 |
| Gazprom OJSC 3.85% 20205 | 2,750 | 2,626 |
| Gazprom OJSC, Series 9, 6.51% 2022 | 2,000 | 2,120 |
| Gazprom OJSC 6.51% 20225 | 500 | 530 |
| Gazprom OJSC 4.95% 20285 | 3,000 | 2,595 |
| Gazprom OJSC 7.288% 20375 | 4,650 | 4,865 |
| Schlumberger Investment SA 3.65% 2023 | 18,015 | 18,246 |
| Teekay Corp. 8.50% 2020 | 13,769 | 15,301 |
| Reliance Holdings Ltd. 4.50% 2020 | 10,000 | 10,059 |
| Reliance Holdings Ltd. 4.50% 20205 | 1,260 | 1,267 |
| Reliance Holdings Ltd. 5.40% 20225 | 3,500 | 3,621 |
| BG Energy Capital PLC 2.50% 20155 | 7,000 | 7,230 |
| BG Energy Capital PLC 2.875% 20165 | 7,395 | 7,717 |
| Halliburton Co. 2.00% 2018 | 14,000 | 14,114 |
| Bonds, notes & other debt instruments | | |
| | Principal amount | Value |
| Corporate bonds & notes — Energy (continued) | (000) | (000) |
| | | |
| Kinder Morgan Energy Partners, LP 5.00% 20215 | $ 10,425 | $ 10,401 |
| Canadian Natural Resources Ltd. 5.70% 2017 | 7,350 | 8,348 |
| Canadian Natural Resources Ltd. 6.50% 2037 | 1,000 | 1,183 |
| Oasis Petroleum Inc. 6.875% 20225 | 8,000 | 8,520 |
| Bonanza Creek Energy, Inc. 6.75% 2021 | 6,200 | 6,510 |
| Diamond Offshore Drilling, Inc. 4.875% 2043 | 5,850 | 5,798 |
| CNOOC Finance (2013) Ltd. 3.00% 2023 | 5,150 | 4,586 |
| Ecopetrol SA 7.625% 2019 | 450 | 529 |
| Ecopetrol SA 5.875% 2023 | 3,750 | 3,909 |
| Transportadora de Gas Peru SA 4.25% 20285,7 | 4,425 | 3,850 |
| Western Gas Partners LP 4.00% 2022 | 3,075 | 3,034 |
| Transportadora de Gas Internacional 5.70% 20225 | 850 | 878 |
| Access Midstream Partners, L.P. 5.875% 2021 | 650 | 692 |
| | | 1,542,667 |
| Industrials 1.60% | | |
| | | |
| General Electric Co. 0.85% 2015 | 10,000 | 10,057 |
| General Electric Capital Corp., Series A, 2.25% 2015 | 12,000 | 12,360 |
| General Electric Capital Corp. 2.95% 2016 | 4,650 | 4,871 |
| General Electric Capital Corp., Series A, 6.00% 2019 | 9,000 | 10,653 |
| General Electric Co. 2.70% 2022 | 7,750 | 7,433 |
| General Electric Capital Corp. 3.10% 2023 | 8,500 | 8,219 |
| General Electric Co. 4.125% 2042 | 11,000 | 10,352 |
| General Electric Capital Corp., Series B, junior subordinated 6.25% (undated)6 | 50,000 | 52,343 |
| General Electric Capital Corp., Series A, junior subordinated 7.125% (undated)6 | 112,300 | 126,399 |
| DAE Aviation Holdings, Inc. 11.25% 20155 | 1,786 | 1,787 |
| DAE Aviation Holdings, Inc. and Standard Aero Ltd., Term Loan B, 6.25% 20186,7,8 | 70,583 | 71,259 |
| DAE Aviation Holdings, Inc., Term Loan B2, 6.25% 20186,7,8 | 31,668 | 31,971 |
| DAE Aviation Holdings, Inc. and Standard Aero Ltd., Term Loan, 7.75% 20196,7,8 | 4,275 | 4,328 |
| US Investigations Services, Inc., Term Loan B, 4.75% 20156,7,8 | 14,233 | 13,774 |
| US Investigations Services, Inc., Term Loan D, 7.75% 20156,7,8 | 18,437 | 18,298 |
| US Investigations Services, Inc. 10.50% 20155 | 49,850 | 43,743 |
| US Investigations Services, Inc. 11.75% 20165 | 19,814 | 13,870 |
| Associated Materials, LLC and AMH New Finance, Inc. 9.125% 2017 | 79,655 | 84,335 |
| Navios Maritime Holdings Inc. and Navios Maritime Finance II (US) Inc. 8.125% 2019 | 16,685 | 17,102 |
| Navios Maritime Acquisition Corporation and Navios Acquisition Finance (US) Inc. 8.125% 20215 | 22,000 | 22,550 |
| Navios Maritime Holdings Inc. 7.375% 20225 | 32,475 | 32,800 |
| Continental Airlines, Inc., Series 1997-1, Class A, 7.461% 20167 | 833 | 857 |
| Continental Airlines, Inc., Series 2001-1, Class B, 7.373% 20177 | 2,194 | 2,339 |
| Continental Airlines, Inc., Series 1998-1, Class B, 6.748% 20187 | 435 | 464 |
| Continental Airlines, Inc., Series 1997-4B, Class B, 6.90% 20187 | 48 | 50 |
| Continental Airlines, Inc., Series 1998-1, Class A, 6.648% 20197 | 5,148 | 5,460 |
| Continental Airlines, Inc., Series 1997-4, Class A, 6.90% 20197 | 1,784 | 1,934 |
| United Air Lines, Inc., Series 1996-A2, 7.87% 20192,7,9 | 2,421 | — |
| Continental Airlines, Inc., Series 2000-2, Class B, 8.307% 20197 | 246 | 262 |
| Continental Airlines, Inc., Series 1999-1, Class A, 6.545% 20207 | 12,068 | 13,226 |
| Continental Airlines, Inc., Series 1999-1, Class B, 6.795% 20207 | 255 | 269 |
| Continental Airlines, Inc., Series 1999-2, Class A-1, 7.256% 20217 | 472 | 527 |
| United Air Lines, Inc., Series 2007-1, Class B, 7.336% 20215,7 | 4,198 | 4,477 |
| Continental Airlines, Inc., Series 1999-2, Class B, 7.566% 20217 | 801 | 846 |
| Continental Airlines, Inc., Series 2001-1, Class A-1, 6.703% 20227 | 3,548 | 3,912 |
| Continental Airlines, Inc., Series 2007-1, Class B, 6.903% 20227 | 10,510 | 11,174 |
| Continental Airlines, Inc., Series 2000-2, Class A-1, 7.707% 20227 | 2,715 | 3,086 |
| Bonds, notes & other debt instruments | | |
| | Principal amount | Value |
| Corporate bonds & notes — Industrials (continued) | (000) | (000) |
| | | |
| Continental Airlines, Inc., Series 2000-1, Class A-1, 8.048% 20227 | $ 4,978 | $ 5,691 |
| Continental Airlines, Inc., Series 2000-1, Class B, 8.388% 20227 | 259 | 275 |
| United Air Lines, Inc., Series 2007-1, Class A, 6.636% 20247 | 6,788 | 7,339 |
| Nortek Inc. 10.00% 2018 | 22,255 | 24,647 |
| Nortek Inc. 8.50% 2021 | 33,565 | 37,257 |
| JELD-WEN Escrow Corp. 12.25% 20175 | 45,670 | 51,493 |
| BE Aerospace, Inc. 5.25% 2022 | 48,570 | 49,177 |
| Northwest Airlines, Inc., Term Loan A, 2.00% 20186,7,8 | 39,056 | 36,322 |
| Delta Air Lines, Inc., Series 2002-1, Class G-1, MBIA insured, 6.718% 20247 | 4,963 | 5,670 |
| TransDigm Inc. 7.75% 2018 | 17,395 | 18,700 |
| TransDigm Inc. 5.50% 2020 | 22,000 | 21,890 |
| R.R. Donnelley & Sons Co. 7.25% 20183 | 11,400 | 13,110 |
| R.R. Donnelley & Sons Co. 7.00% 20223 | 16,735 | 17,906 |
| R.R. Donnelley & Sons Co. 6.50% 20233 | 9,300 | 9,393 |
| HD Supply, Inc. 11.50% 2020 | 31,580 | 37,501 |
| Euramax International, Inc. 9.50% 2016 | 31,755 | 32,152 |
| Nielsen Finance LLC and Nielsen Finance Co. 7.75% 2018 | 1,000 | 1,080 |
| Nielsen Finance LLC and Nielsen Finance Co. 4.50% 2020 | 16,250 | 16,128 |
| Nielsen Finance LLC and Nielsen Finance Co. 5.50% 20215 | 14,035 | 14,491 |
| Beechcraft Holdings, LLC., Term Loan, 5.75% 20206,7,8 | 30,900 | 31,026 |
| Union Pacific Corp. 5.125% 2014 | 15,325 | 15,345 |
| Union Pacific Corp. 2.25% 2019 | 625 | 633 |
| Union Pacific Corp. 3.646% 2024 | 9,310 | 9,366 |
| Union Pacific Corp. 3.75% 2024 | 4,075 | 4,144 |
| Union Pacific Corp. 4.85% 2044 | 305 | 317 |
| Burlington Northern Santa Fe LLC 7.00% 2014 | 13,885 | 13,885 |
| Burlington Northern Santa Fe LLC 4.10% 2021 | 7,000 | 7,327 |
| Burlington Northern Santa Fe LLC 3.00% 2023 | 4,580 | 4,380 |
| Burlington Northern Santa Fe LLC 5.15% 2043 | 2,750 | 2,917 |
| Gardner Denver, Inc. Term Loan B, 4.25% 20206,7,8 | 26,933 | 26,936 |
| Silver II Borrower S.C.A./Silver II U.S. Holdings, LLC 7.75% 20205 | 18,050 | 19,223 |
| ARAMARK Corp., Term Loan D, 4.00% 20196,7,8 | 19,000 | 19,142 |
| Esterline Technologies Corp. 7.00% 2020 | 16,590 | 18,000 |
| TRAC Intermodal 11.00% 2019 | 12,225 | 13,998 |
| Builders Firstsource 7.625% 20215 | 12,995 | 13,742 |
| Honeywell International Inc. 3.875% 2014 | 13,605 | 13,618 |
| Florida East Coast Railway Corp. 8.125% 2017 | 12,075 | 12,615 |
| CNH Capital LLC 3.25% 2017 | 11,500 | 11,716 |
| Watco Companies 6.375% 20235 | 10,670 | 10,617 |
| Ply Gem Industries, Inc. 6.50% 20225 | 10,325 | 10,209 |
| American Airlines, Inc., Series 2013-2, Class A, 4.95% 20245,7 | 9,073 | 9,754 |
| Norfolk Southern Corp. 5.75% 2016 | 6,710 | 7,339 |
| Norfolk Southern Corp. 5.75% 2018 | 2,000 | 2,302 |
| Volvo Treasury AB 5.95% 20155 | 8,835 | 9,336 |
| Atlas Copco AB 5.60% 20175 | 7,405 | 8,249 |
| United Technologies Corp. 4.50% 2042 | 5,965 | 6,049 |
| Safway Group Holding 7.00% 20185 | 5,500 | 5,830 |
| European Aeronautic Defence and Space Company 2.70% 20235 | 6,000 | 5,682 |
| ERAC USA Finance Co. 5.25% 20205 | 5,000 | 5,589 |
| Canadian National Railway Co. 1.45% 2016 | 5,010 | 5,088 |
| ADS Waste Escrow 8.25% 2020 | 4,675 | 5,049 |
| CEVA Group PLC 11.625% 20165 | 2,450 | 2,585 |
| CEVA Group PLC 8.375% 20175 | 1,743 | 1,828 |
| CSX Corp. 6.25% 2015 | 3,460 | 3,686 |
| Bonds, notes & other debt instruments | | |
| | Principal amount | Value |
| Corporate bonds & notes — Industrials (continued) | (000) | (000) |
| | | |
| HDTFS Inc. 5.875% 2020 | $ 3,000 | $ 3,120 |
| Iron Mountain Inc. 6.00% 20233 | 950 | 982 |
| Iron Mountain Inc. 5.75% 20243 | 2,175 | 2,044 |
| BakerCorp International, Inc. 8.25% 2019 | 2,000 | 2,040 |
| ABB Finance (USA) Inc. 1.625% 2017 | 1,000 | 1,001 |
| ABB Finance (USA) Inc. 2.875% 2022 | 1,000 | 977 |
| Hawker Beechcraft Acquisition Co., LLC, Letter of Credit, 0.022% 20146,7,8 | 3,054 | 1,663 |
| Odebrecht Finance Ltd 7.125% 20425 | 1,450 | 1,367 |
| | | 1,398,325 |
| Health care 1.50% | | |
| | | |
| inVentiv Health Inc. 9.00% 20185 | 35,035 | 36,962 |
| inVentiv Health Inc. 11.00% 20185 | 53,835 | 48,855 |
| inVentiv Health Inc. 11.00% 20185 | 23,915 | 21,763 |
| Kinetic Concepts, Inc., Term Loan E1, 4.00% 20186,7,8 | 3,362 | 3,396 |
| Kinetic Concepts, Inc. 10.50% 2018 | 64,442 | 74,431 |
| Kinetic Concepts, Inc. 12.50% 2019 | 24,950 | 28,443 |
| VPI Escrow Corp. 6.75% 20185 | 26,700 | 29,403 |
| VPI Escrow Corp. 6.375% 20205 | 36,355 | 38,991 |
| VPI Escrow Corp. 5.625% 20215 | 11,270 | 11,693 |
| VPI Escrow Corp. 7.50% 20215 | 18,785 | 21,016 |
| Forest Laboratories, Inc. 4.375% 20195 | 37,400 | 37,587 |
| Forest Laboratories, Inc. 4.875% 20215 | 6,950 | 6,933 |
| Forest Laboratories, Inc. 5.00% 20215 | 44,600 | 44,488 |
| Tenet Healthcare Corp. 4.75% 2020 | 8,060 | 8,080 |
| Tenet Healthcare Corp. 6.00% 20205 | 40,255 | 42,444 |
| Tenet Healthcare Corp. 4.50% 2021 | 7,040 | 6,846 |
| DJO Finance LLC 9.75% 2017 | 10,603 | 10,974 |
| DJO Finance LLC 7.75% 2018 | 8,800 | 9,042 |
| DJO Finance LLC 8.75% 2018 | 18,175 | 20,129 |
| DJO Finance LLC 9.875% 2018 | 7,285 | 7,959 |
| VWR Funding, Inc. 7.25% 2017 | 44,025 | 47,107 |
| Humana Inc. 4.625% 2042 | 45,000 | 42,752 |
| Select Medical Holdings Corp. 6.375% 2021 | 40,530 | 40,885 |
| Rotech Healthcare Inc., Term Loan A, 5.50% 20182,3,6,7,8 | 12,070 | 12,070 |
| Rotech Healthcare Inc., Term Loan B, 10.00% 20192,3,6,7,8 | 9,200 | 9,200 |
| Rotech Healthcare Inc., Term Loan, 13.00% 20202,3,6,7,8,10 | 17,742 | 17,742 |
| HCA Inc. 6.375% 2015 | 7,400 | 7,724 |
| HCA Inc., Term Loan B5, 2.91% 20176,7,8 | 6,276 | 6,295 |
| HCA Inc. 6.50% 2020 | 22,595 | 24,967 |
| Express Scripts Inc. 2.75% 2014 | 1,000 | 1,018 |
| Medco Health Solutions, Inc. 2.75% 2015 | 6,305 | 6,514 |
| Express Scripts Inc. 3.125% 2016 | 13,564 | 14,168 |
| Express Scripts Inc. 2.65% 2017 | 2,595 | 2,691 |
| Express Scripts Inc. 7.25% 2019 | 8,985 | 11,115 |
| Patheon Inc., Term Loan B1, 7.25% 20186,7,8 | 31,769 | 31,829 |
| Patheon Inc. 7.50% 20225 | 2,845 | 2,849 |
| Symbion Inc. 8.00% 2016 | 32,230 | 34,043 |
| INC Research LLC 11.50% 20195 | 29,160 | 32,878 |
| Novartis Capital Corp. 4.125% 2014 | 17,250 | 17,259 |
| Novartis Capital Corp. 2.90% 2015 | 14,000 | 14,443 |
| Boston Scientific Corp. 6.40% 2016 | 21,735 | 24,279 |
| Boston Scientific Corp. 6.00% 2020 | 5,375 | 6,257 |
| AbbVie Inc. 2.90% 2022 | 11,875 | 11,407 |
| AbbVie Inc. 4.40% 2042 | 19,270 | 18,682 |
| Bonds, notes & other debt instruments | | |
| | Principal amount | Value |
| Corporate bonds & notes — Health care (continued) | (000) | (000) |
| | | |
| Roche Holdings, Inc. 6.00% 20195 | $12,983 | $ 15,387 |
| Roche Holdings, Inc. 7.00% 20395 | 9,250 | 12,746 |
| Thermo Fisher Scientific Inc. 1.30% 2017 | 8,630 | 8,626 |
| Thermo Fisher Scientific Inc. 2.40% 2019 | 8,405 | 8,430 |
| Thermo Fisher Scientific Inc. 4.15% 2024 | 10,250 | 10,455 |
| Amgen Inc. 5.375% 2043 | 25,000 | 26,812 |
| Centene Corp. 5.75% 2017 | 23,240 | 24,867 |
| Cardinal Health, Inc. 4.00% 2015 | 3,000 | 3,137 |
| Cardinal Health, Inc. 5.80% 2016 | 10,000 | 11,245 |
| Cardinal Health, Inc. 1.90% 2017 | 740 | 745 |
| Cardinal Health, Inc. 1.70% 2018 | 9,125 | 9,151 |
| Cardinal Health, Inc. 3.20% 2023 | 580 | 561 |
| Grifols Inc. 8.25% 2018 | 21,643 | 23,131 |
| Endo Pharmaceuticals Holdings Inc. 7.00% 2019 | 2,450 | 2,621 |
| Endo Pharmaceuticals Holdings Inc. 7.00% 2020 | 6,350 | 6,810 |
| Endo Pharmaceuticals Holdings Inc. 5.75% 20225 | 11,430 | 11,430 |
| UnitedHealth Group Inc. 6.00% 2017 | 12,430 | 14,285 |
| UnitedHealth Group Inc. 1.625% 2019 | 4,500 | 4,410 |
| UnitedHealth Group Inc. 2.75% 2023 | 660 | 623 |
| UnitedHealth Group Inc. 2.875% 2023 | 1,500 | 1,433 |
| GlaxoSmithKline Capital Inc. 1.50% 2017 | 10,160 | 10,243 |
| GlaxoSmithKline Capital Inc. 2.80% 2023 | 7,500 | 7,181 |
| GlaxoSmithKline Capital Inc. 4.20% 2043 | 2,000 | 1,931 |
| Merck & Co., Inc. 1.10% 2018 | 6,710 | 6,633 |
| Merck & Co., Inc. 2.80% 2023 | 11,500 | 11,021 |
| PRA Holdings, Inc. 9.50% 20235 | 14,435 | 15,662 |
| Catalent Pharma Solutions Inc., Term Loan, 6.50% 20176,7,8 | 15,430 | 15,649 |
| Baxter International Inc. 1.85% 2018 | 5,180 | 5,200 |
| Baxter International Inc. 3.20% 2023 | 9,000 | 8,832 |
| McKesson Corp. 0.95% 2015 | 1,135 | 1,138 |
| McKesson Corp. 3.25% 2016 | 7,525 | 7,888 |
| McKesson Corp. 1.40% 2018 | 745 | 734 |
| McKesson Corp. 4.75% 2021 | 3,475 | 3,792 |
| Multiplan Inc. 9.875% 20185 | 11,200 | 12,208 |
| Gilead Sciences, Inc. 3.05% 2016 | 10,265 | 10,852 |
| Gilead Sciences, Inc. 5.65% 2041 | 465 | 545 |
| Coventry Health Care, Inc. 6.30% 2014 | 8,370 | 8,627 |
| Aetna Inc. 1.50% 2017 | 1,335 | 1,327 |
| Community Health Systems, Inc., Term Loan D1, 4.25% 20216,7,8 | 8,125 | 8,219 |
| IMS Health Inc. 7.375% 20185,10 | 7,320 | 7,604 |
| ConvaTec Finance International SA 8.25% 20195,10 | 7,350 | 7,570 |
| DENTSPLY International Inc. 2.75% 2016 | 5,620 | 5,847 |
| Teve Pharmaceutical Finance Company BV, 2.95% 2022 | 2,000 | 1,855 |
| WellPoint, Inc. 2.30% 2018 | 1,370 | 1,381 |
| Catholic Health Initiatives, Series 2012, 1.60% 2017 | 1,000 | 986 |
| | | 1,307,439 |
| Materials 1.00% | | |
| | | |
| FMG Resources 6.375% 20165 | 3,000 | 3,113 |
| FMG Resources 6.00% 20175 | 56,380 | 59,798 |
| FMG Resources 6.875% 20185 | 36,535 | 38,499 |
| FMG Resources 8.25% 20195 | 9,450 | 10,442 |
| FMG Resources 6.875% 20225 | 11,975 | 12,978 |
| ArcelorMittal 4.25% 20156 | 4,000 | 4,135 |
| ArcelorMittal 5.00% 20176 | 15,680 | 16,542 |
| Bonds, notes & other debt instruments | | |
| | Principal amount | Value |
| Corporate bonds & notes — Materials (continued) | (000) | (000) |
| | | |
| ArcelorMittal 6.00% 20216 | $ 7,430 | $ 7,802 |
| ArcelorMittal 6.75% 20226 | 29,045 | 31,478 |
| ArcelorMittal 7.25% 20416 | 51,046 | 49,196 |
| Inmet Mining Corp. 8.75% 20205 | 60,272 | 68,861 |
| Inmet Mining Corp. 7.50% 20215 | 29,835 | 33,564 |
| Xstrata Canada Financial Corp. 2.85% 20145 | 5,000 | 5,070 |
| Glencore Xstrata LLC 1.70% 20165 | 3,000 | 3,007 |
| Xstrata Canada Financial Corp. 2.70% 20175,6 | 7,500 | 7,602 |
| Xstrata Canada Financial Corp. 3.60% 20175 | 5,000 | 5,255 |
| Glencore Xstrata LLC 1.599% 20195,6 | 3,000 | 2,927 |
| Glencore Xstrata LLC 2.50% 20195 | 10,000 | 9,684 |
| Xstrata Canada Financial Corp. 4.95% 20215 | 11,500 | 11,868 |
| Glencore Xstrata LLC 4.125% 20235 | 29,140 | 27,352 |
| Xstrata Canada Financial Corp. 5.55% 20425,6 | 5,750 | 5,373 |
| Reynolds Group Inc. 7.125% 2019 | 8,000 | 8,500 |
| Reynolds Group Inc. 7.875% 2019 | 1,555 | 1,718 |
| Reynolds Group Inc. 9.875% 2019 | 3,225 | 3,580 |
| Reynolds Group Inc. 5.75% 2020 | 61,840 | 63,541 |
| JMC Steel Group Inc. 8.25% 20185 | 41,158 | 42,701 |
| Rio Tinto Finance (USA) Ltd. 1.375% 2016 | 3,000 | 3,031 |
| Rio Tinto Finance (USA) Ltd. 2.25% 2016 | 9,000 | 9,256 |
| Rio Tinto Finance (USA) Ltd. 1.625% 2017 | 8,500 | 8,538 |
| Rio Tinto Finance (USA) Ltd. 2.25% 2018 | 8,995 | 9,054 |
| Rio Tinto Finance (USA) Ltd. 9.00% 2019 | 3,000 | 3,944 |
| Ryerson Inc. 9.00% 2017 | 18,800 | 20,374 |
| Ryerson Inc. 11.25% 2018 | 10,975 | 12,045 |
| BHP Billiton Finance (USA) Ltd. 5.50% 2014 | 11,730 | 11,827 |
| BHP Billiton Finance (USA) Ltd. 5.00% 2043 | 12,690 | 13,187 |
| Cliffs Natural Resources Inc. 3.95% 20183 | 3,250 | 3,239 |
| Cliffs Natural Resources Inc. 4.875% 20213 | 20,437 | 19,313 |
| Cliffs Natural Resources Inc. 6.25% 20403 | 1,000 | 810 |
| Walter Energy, Inc. 9.50% 20195 | 12,725 | 12,980 |
| Walter Energy, Inc. 9.875% 2020 | 12,150 | 9,234 |
| Teck Resources Ltd. 4.75% 2022 | 5,745 | 5,967 |
| Teck Resources Ltd. 6.25% 2041 | 1,750 | 1,806 |
| Teck Resources Ltd. 5.20% 2042 | 5,315 | 4,793 |
| Teck Resources Ltd. 5.40% 2043 | 9,435 | 8,931 |
| U.S. Coatings Acquisition Inc. (Flash Dutch 2 BV), Term Loan B, 4.00% 20206,7,8 | 12,133 | 12,275 |
| U.S. Coatings Acquisition Inc. (Flash Dutch 2 BV) 7.375% 20215 | 7,310 | 7,913 |
| Newcrest Finance Pty Ltd. 4.45% 20215 | 11,165 | 9,645 |
| Newcrest Finance Pty Ltd. 4.20% 20225 | 9,920 | 8,296 |
| LSB Industries, Inc. 7.75% 20195 | 16,800 | 17,892 |
| Georgia Gulf Corp. 4.625% 20215 | 14,625 | 14,351 |
| Georgia Gulf Corp. 4.875% 20235 | 2,400 | 2,295 |
| Holcim Ltd. 6.00% 20195 | 1,607 | 1,859 |
| Holcim Ltd. 5.15% 20235 | 12,595 | 13,504 |
| Newpage Corp., Term Loan B, 7.75% 20186,7,8 | 14,370 | 14,684 |
| Ball Corp. 5.75% 2021 | 8,615 | 9,089 |
| Ball Corp. 5.00% 2022 | 4,915 | 4,909 |
| Ecolab Inc. 3.00% 2016 | 7,455 | 7,844 |
| Ecolab Inc. 4.35% 2021 | 1,000 | 1,070 |
| Ecolab Inc. 5.50% 2041 | 750 | 839 |
| OMNOVA Solutions Inc. 7.875% 2018 | 8,500 | 9,180 |
| PQ Corp. 8.75% 20185 | 7,700 | 8,412 |
| Bonds, notes & other debt instruments | | |
| | Principal amount | Value |
| Corporate bonds & notes — Materials (continued) | (000) | (000) |
| | | |
| Smurfit Capital Funding PLC 7.50% 2025 | $ 7,125 | $ 7,838 |
| International Paper Co. 7.30% 2039 | 5,615 | 7,296 |
| Taminco Global Chemical Corp. 9.75% 20205 | 4,940 | 5,607 |
| Dow Chemical Co. 5.25% 2041 | 4,000 | 4,128 |
| Graphic Packaging International, Inc. 4.75% 2021 | 3,550 | 3,523 |
| Arbermarle Corp. 5.10% 2015 | 2,570 | 2,675 |
| Caraustar, Term Loan, 7.50% 20196,7,8 | 2,131 | 2,190 |
| Packaging Dynamics Corp. 8.75% 20165 | 1,970 | 2,024 |
| Praxair, Inc. 4.375% 2014 | 1,000 | 1,006 |
| Mosaic Co. 4.25% 2023 | 800 | 803 |
| | | 874,062 |
| Information technology 0.98% | | |
| | | |
| First Data Corp. 7.375% 20195 | 28,325 | 30,308 |
| First Data Holdings, Inc. 14.50% 20195,10 | 36,675 | 33,242 |
| First Data Corp. 6.75% 20205 | 19,025 | 20,119 |
| First Data Corp. 8.25% 20215 | 10,250 | 10,916 |
| First Data Corp. 11.75% 20215 | 120,595 | 124,514 |
| First Data Corp. 11.75% 20215 | 25,925 | 26,768 |
| First Data Corp. 12.625% 2021 | 42,539 | 49,770 |
| First Data Corp. 8.75% 20225,6,10 | 74,691 | 79,919 |
| SRA International, Inc., Term Loan B, 6.50% 20186,7,8 | 70,195 | 69,990 |
| SRA International, Inc. 11.00% 2019 | 58,195 | 60,959 |
| Freescale Semiconductor, Inc. 10.125% 2016 | 4,500 | 4,613 |
| Freescale Semiconductor, Inc. 5.00% 20215 | 49,340 | 49,217 |
| Freescale Semiconductor, Inc. 6.00% 20225 | 19,075 | 19,886 |
| SunGard Data Systems Inc. 7.375% 2018 | 32,050 | 34,053 |
| SunGard Data Systems Inc. 7.625% 2020 | 29,540 | 32,605 |
| Alcatel-Lucent USA Inc. 4.625% 20175 | 36,150 | 36,240 |
| Alcatel-Lucent USA Inc. 6.75% 20205 | 4,350 | 4,481 |
| Alcatel-Lucent USA Inc. 8.875% 20205 | 15,675 | 17,438 |
| Jabil Circuit, Inc. 8.25% 2018 | 20,925 | 24,796 |
| Jabil Circuit, Inc. 5.625% 2020 | 10,650 | 11,129 |
| Lawson Software, Inc. 9.375% 2019 | 25,800 | 29,154 |
| International Business Machines Corp. 1.95% 2016 | 10,000 | 10,313 |
| International Business Machines Corp. 2.00% 2016 | 10,000 | 10,285 |
| International Business Machines Corp. 1.625% 2020 | 4,000 | 3,810 |
| Ceridian Corp. 11.25% 2015 | 15,000 | 15,150 |
| Hughes Satellite Systems Corp. 6.50% 2019 | 9,550 | 10,433 |
| Hughes Satellite Systems Corp. 7.625% 2021 | 1,175 | 1,340 |
| Serena Software, Inc. 10.375% 2016 | 10,776 | 10,776 |
| Xerox Corp. 6.40% 2016 | 768 | 850 |
| Xerox Corp. 2.95% 2017 | 7,940 | 8,211 |
| Xerox Corp. 6.75% 2017 | 360 | 411 |
| NXP BV and NXP Funding LLC 3.75% 20185 | 7,100 | 7,135 |
| Oracle Corp. 2.375% 2019 | 4,000 | 4,082 |
| Samsung Electronics America, Inc. 1.75% 20175 | 3,500 | 3,506 |
| Compucom Systems Inc., 7.00% 20215 | 1,425 | 1,429 |
| | | 857,848 |
| Consumer staples 0.82% | | |
| | | |
| Altria Group, Inc. 9.70% 2018 | 6,081 | 8,117 |
| Altria Group, Inc. 9.25% 2019 | 18,542 | 24,695 |
| Altria Group, Inc. 4.75% 2021 | 2,500 | 2,736 |
| Altria Group, Inc. 4.00% 2024 | 2,600 | 2,605 |
| Bonds, notes & other debt instruments | | |
| | Principal amount | Value |
| Corporate bonds & notes — Consumer staples (continued) | (000) | (000) |
| | | |
| Altria Group, Inc. 9.95% 2038 | $23,500 | $37,406 |
| Altria Group, Inc. 4.25% 2042 | 20,000 | 17,646 |
| Altria Group, Inc. 4.50% 2043 | 22,000 | 20,249 |
| Altria Group, Inc. 5.375% 2044 | 7,000 | 7,235 |
| Anheuser-Busch InBev NV 3.625% 2015 | 21,000 | 21,807 |
| Anheuser-Busch InBev NV 4.125% 2015 | 10,000 | 10,352 |
| Anheuser-Busch InBev NV 1.375% 2017 | 7,500 | 7,508 |
| Anheuser-Busch InBev NV 7.75% 2019 | 25,000 | 31,431 |
| Anheuser-Busch InBev NV 3.70% 2024 | 4,000 | 4,075 |
| Kraft Foods Inc. 2.25% 2017 | 3,500 | 3,598 |
| Kraft Foods Inc. 5.375% 2020 | 4,712 | 5,397 |
| Kraft Foods Inc. 5.00% 2042 | 32,000 | 32,824 |
| SABMiller Holdings Inc. 2.45% 20175 | 1,100 | 1,138 |
| SABMiller Holdings Inc. 2.20% 20185 | 12,200 | 12,343 |
| SABMiller Holdings Inc. 3.75% 20225 | 20,000 | 20,533 |
| SABMiller Holdings Inc. 4.95% 20425 | 7,000 | 7,280 |
| Coca-Cola Co. 1.50% 2015 | 10,590 | 10,801 |
| Coca-Cola Co. 1.80% 2016 | 10,000 | 10,267 |
| Coca-Cola Co. 2.45% 2020 | 1,500 | 1,494 |
| Coca-Cola Co. 3.20% 2023 | 15,725 | 15,511 |
| Constellation Brands, Inc. 8.375% 2014 | 2,175 | 2,300 |
| Constellation Brands, Inc. 7.25% 2017 | 16,425 | 19,053 |
| Constellation Brands, Inc. 3.75% 2021 | 1,750 | 1,678 |
| Constellation Brands, Inc. 6.00% 2022 | 2,825 | 3,093 |
| Constellation Brands, Inc. 4.25% 2023 | 8,250 | 7,817 |
| CVS Caremark Corp. 2.25% 2018 | 8,750 | 8,838 |
| CVS Caremark Corp. 4.00% 2023 | 23,300 | 23,927 |
| CVS Caremark Corp. 5.30% 2043 | 750 | 811 |
| Pernod Ricard SA 2.95% 20175 | 23,000 | 23,962 |
| Pernod Ricard SA 4.45% 20225 | 8,500 | 8,832 |
| Wal-Mart Stores, Inc. 2.875% 2015 | 10,000 | 10,301 |
| Wal-Mart Stores, Inc. 2.80% 2016 | 10,000 | 10,489 |
| Wal-Mart Stores, Inc. 2.55% 2023 | 3,250 | 3,052 |
| Wal-Mart Stores, Inc. 4.00% 2043 | 2,750 | 2,578 |
| Reynolds American Inc. 3.25% 2022 | 11,150 | 10,542 |
| Reynolds American Inc. 4.85% 2023 | 9,535 | 10,002 |
| Reynolds American Inc. 4.75% 2042 | 3,000 | 2,790 |
| Reynolds American Inc. 6.15% 2043 | 2,500 | 2,807 |
| WM. Wrigley Jr. Co 2.40% 20185 | 1,200 | 1,212 |
| WM. Wrigley Jr. Co 3.375% 20205 | 22,500 | 22,876 |
| Rite Aid Corp. 10.25% 2019 | 10,090 | 11,212 |
| Rite Aid Corp. 8.00% 2020 | 8,000 | 9,020 |
| Procter & Gamble Co. 3.50% 2015 | 17,250 | 17,811 |
| Unilever Capital Corp. 3.65% 2014 | 17,500 | 17,516 |
| Imperial Tobacco Finance PLC 2.05% 20185 | 5,000 | 4,981 |
| Imperial Tobacco Finance PLC 3.50% 20235 | 12,500 | 11,970 |
| PepsiCo, Inc. 3.10% 2015 | 10,000 | 10,261 |
| PepsiCo, Inc. 2.50% 2016 | 5,000 | 5,193 |
| ConAgra Foods, Inc. 1.90% 2018 | 3,750 | 3,742 |
| ConAgra Foods, Inc. 3.20% 2023 | 11,580 | 11,086 |
| Ingles Markets, Inc. 5.75% 2023 | 14,450 | 14,197 |
| British American Tobacco International Finance PLC 2.125% 20175 | 2,000 | 2,044 |
| British American Tobacco International Finance PLC 9.50% 20185 | 8,705 | 11,569 |
| Tyson Foods, Inc. 6.60% 20166 | 11,500 | 12,836 |
| Bonds, notes & other debt instruments | | |
| | Principal amount | Value |
| Corporate bonds & notes — Consumer staples (continued) | (000) | (000) |
| | | |
| Smithfield Foods, Inc. 7.75% 2017 | $ 2,000 | $ 2,322 |
| Smithfield Foods, Inc. 5.25% 20185 | 1,500 | 1,566 |
| Smithfield Foods, Inc. 5.875% 20215 | 3,250 | 3,307 |
| Smithfield Foods, Inc. 6.625% 2022 | 4,900 | 5,182 |
| Philip Morris International Inc. 1.875% 2019 | 1,400 | 1,392 |
| Philip Morris International Inc. 3.60% 2023 | 10,565 | 10,500 |
| Stater Bros. Holdings Inc. 7.75% 2015 | 11,325 | 11,396 |
| Kimberly-Clark Corp. 7.50% 2018 | 9,000 | 11,312 |
| Mondelez International, Inc. 4.00% 2024 | 8,400 | 8,533 |
| Del Monte Corp. 7.625% 2019 | 6,125 | 6,370 |
| Brasil Foods SA 5.875% 20225 | 3,250 | 3,226 |
| Brasil Foods SA 5.875% 2022 | 1,500 | 1,489 |
| TreeHouse Foods, Inc. 7.75% 2018 | 3,100 | 3,232 |
| Kroger Co. 4.00% 2024 | 2,935 | 2,965 |
| | | 710,238 |
| Utilities 0.66% | | |
| | | |
| Sierra Pacific Power Co. 6.00% 2016 | 4,000 | 4,471 |
| MidAmerican Energy Co. 5.95% 2017 | 10,625 | 12,290 |
| PacifiCorp., First Mortgage Bonds, 5.65% 2018 | 5,500 | 6,401 |
| MidAmerican Energy Holdings Co. 5.75% 2018 | 10,000 | 11,532 |
| Nevada Power Co., General and Refunding Mortgage Notes, Series V, 7.125% 2019 | 14,859 | 18,308 |
| NV Energy, Inc 6.25% 2020 | 20,420 | 24,259 |
| MidAmerican Energy Holdings Co. 3.75% 20235 | 6,000 | 5,988 |
| MidAmerican Energy Holdings Co. 5.15% 20435 | 6,865 | 7,320 |
| Consumers Energy Co., First Mortgage Bonds, 6.70% 2019 | 26,800 | 32,915 |
| CMS Energy Corp. 8.75% 2019 | 695 | 902 |
| CMS Energy Corp. 6.25% 2020 | 20,415 | 23,970 |
| CMS Energy Corp. 5.05% 2022 | 13,891 | 15,426 |
| Electricité de France SA 1.15% 20175 | 3,500 | 3,511 |
| Electricité de France SA 6.95% 20395 | 8,000 | 10,071 |
| Electricité de France SA 5.25% (undated)5,6 | 25,505 | 24,688 |
| NRG Energy, Inc. 8.25% 2020 | 3,850 | 4,225 |
| NRG Energy, Inc. 6.25% 20225 | 13,700 | 13,768 |
| NRG Energy, Inc. 6.625% 2023 | 18,300 | 18,780 |
| AES Corp. 7.75% 2015 | 10,000 | 11,000 |
| AES Corp. 8.00% 2017 | 4,000 | 4,680 |
| AES Corp. 8.00% 2020 | 7,000 | 8,138 |
| AES Corp. 7.375% 2021 | 10,125 | 11,264 |
| Duke Energy Corp. 3.95% 2023 | 6,000 | 6,134 |
| Progress Energy, Inc. 7.00% 2031 | 3,000 | 3,810 |
| Progress Energy, Inc. 7.75% 2031 | 3,000 | 4,031 |
| Duke Energy Indiana, Inc. 4.90% 2043 | 17,000 | 18,419 |
| FirstEnergy Corp., Series B, 4.25% 2023 | 31,465 | 30,641 |
| EDP Finance BV 5.25% 20215 | 22,500 | 22,962 |
| Enel Finance International SA 6.00% 20395 | 3,000 | 3,007 |
| Enel Società per Azioni 8.75% 20735,6 | 17,000 | 18,519 |
| TXU, Term Loan, 3.668% 20146,7,8 | 3,000 | 2,115 |
| TXU, Term Loan, 4.668% 20176,7,8 | 26,204 | 18,282 |
| Xcel Energy Inc. 4.70% 2020 | 5,341 | 5,994 |
| Northern States Power Co., First Mortgage Bonds, 2.60% 2023 | 14,389 | 13,618 |
| Northern States Power Co., First Mortgage Bonds, 7.125% 2025 | 72 | 94 |
| E.ON International Finance BV 5.80% 20185 | 17,000 | 19,593 |
| American Electric Power Co. 1.65% 2017 | 2,295 | 2,274 |
| American Electric Power Co. 2.95% 2022 | 16,085 | 15,351 |
| Bonds, notes & other debt instruments | | |
| | Principal amount | Value |
| Corporate bonds & notes — Utilities (continued) | (000) | (000) |
| | | |
| CenterPoint Energy Resources Corp. 4.50% 2021 | $ 16,130 | $ 17,611 |
| Abu Dhabi National Energy Co. PJSC (TAQA) 6.165% 2017 | 10,000 | 11,413 |
| Abu Dhabi National Energy Co. PJSC (TAQA) 6.165% 20175 | 2,000 | 2,283 |
| Eskom Holdings Ltd. 5.75% 20215 | 6,820 | 6,701 |
| Eskom Holdings SOC Ltd. 6.75% 20235 | 5,000 | 5,064 |
| Midwest Generation, LLC, Series B, 8.56% 20167,9 | 9,761 | 11,176 |
| Pacific Gas and Electric Co. 3.85% 2023 | 10,460 | 10,601 |
| Entergy Corp. 4.70% 2017 | 8,000 | 8,611 |
| National Rural Utilities Cooperative Finance Corp. 1.00% 2015 | 8,250 | 8,303 |
| Teco Finance, Inc. 5.15% 2020 | 5,731 | 6,425 |
| Tampa Electric Co. 2.60% 2022 | 700 | 665 |
| Virginia Electric and Power Co., Series B, 5.95% 2017 | 4,500 | 5,228 |
| Israel Electric Corp. Ltd. 8.10% 20965 | 4,905 | 5,205 |
| AES Panamá, SA 6.35% 20165 | 4,727 | 5,104 |
| National Grid PLC 6.30% 2016 | 4,000 | 4,501 |
| CEZ, a s 4.25% 20225 | 2,820 | 2,886 |
| Colbun SA 6.00% 20205 | 2,000 | 2,190 |
| Comision Federal de Electricidad 4.875% 20245 | 2,000 | 1,980 |
| Veolia Environnement 6.00% 2018 | 625 | 716 |
| Veolia Environnement 6.75% 2038 | 500 | 579 |
| Iberdrola Finance Ireland 5.00% 20195 | 1,060 | 1,161 |
| | | 577,154 |
| Total corporate bonds & notes | | 13,637,648 |
| U.S. Treasury bonds & notes 2.39% | | |
| U.S. Treasury 2.15% | | |
| | | |
| U.S. Treasury 0.25% 2014 | 47,048 | 47,083 |
| U.S. Treasury 0.75% 2014 | 29,047 | 29,118 |
| U.S. Treasury 1.875% 2014 | 143,000 | 143,179 |
| U.S. Treasury 2.625% 2014 | 64,000 | 64,797 |
| U.S. Treasury 2.625% 2014 | 11,905 | 12,028 |
| U.S. Treasury 1.50% 2016 | 80,500 | 82,477 |
| U.S. Treasury 1.75% 2016 | 95,000 | 97,875 |
| U.S. Treasury 2.00% 2016 | 117,000 | 120,871 |
| U.S. Treasury 2.375% 2016 | 100,000 | 104,270 |
| U.S. Treasury 7.50% 2016 | 20,000 | 23,800 |
| U.S. Treasury 1.625% 2022 | 198,250 | 184,047 |
| U.S. Treasury 2.50% 2023 | 264,300 | 261,514 |
| U.S. Treasury 6.25% 2023 | 135,000 | 177,663 |
| U.S. Treasury 5.50% 2028 | 55,500 | 71,023 |
| U.S. Treasury 5.375% 2031 | 38,475 | 49,185 |
| U.S. Treasury 4.50% 2036 | 87,935 | 102,719 |
| U.S. Treasury 4.625% 2040 | 15,150 | 18,054 |
| U.S. Treasury 3.75% 2041 | 52,350 | 54,133 |
| U.S. Treasury 2.75% 2042 | 7,325 | 6,182 |
| U.S. Treasury 2.75% 2042 | 6,950 | 5,879 |
| U.S. Treasury 3.00% 2042 | 56,175 | 50,202 |
| U.S. Treasury 2.875% 2043 | 2,497 | 2,158 |
| U.S. Treasury 3.125% 2043 | 84,075 | 76,686 |
| U.S. Treasury 3.625% 2043 | 87,500 | 87,808 |
| | | 1,872,751 |
| Bonds, notes & other debt instruments | | |
| U.S. Treasury bonds & notes (continued) | Principal amount | Value |
| U.S. Treasury inflation-protected securities12 0.24% | (000) | (000) |
| | | |
| U.S. Treasury Inflation-Protected Security 1.875% 2015 | $45,536 | $ 48,021 |
| U.S. Treasury Inflation-Protected Security 0.125% 2017 | 41,048 | 42,530 |
| U.S. Treasury Inflation-Protected Security 0.625% 2024 | 69,922 | 70,656 |
| U.S. Treasury Inflation-Protected Security 0.75% 2042 | 49,256 | 42,701 |
| U.S. Treasury Inflation-Protected Security 0.625% 2043 | 7,097 | 5,905 |
| | | 209,813 |
| Total U.S. Treasury bonds & notes | | 2,082,564 |
| Mortgage-backed obligations7 1.74% | | |
| | | |
| Fannie Mae 5.50% 2018 | 60 | 64 |
| Fannie Mae 6.00% 2021 | 240 | 264 |
| Fannie Mae 4.50% 2024 | 2,897 | 3,110 |
| Fannie Mae 5.50% 2024 | 313 | 343 |
| Fannie Mae 4.50% 2025 | 2,903 | 3,114 |
| Fannie Mae 4.50% 2025 | 1,979 | 2,130 |
| Fannie Mae 4.50% 2025 | 1,848 | 1,983 |
| Fannie Mae 4.50% 2025 | 1,772 | 1,901 |
| Fannie Mae, Series 2001-4, Class GA, 9.529% 20256 | 162 | 187 |
| Fannie Mae, Series 2001-4, Class NA, 10.598% 20256 | 5 | 5 |
| Fannie Mae 6.00% 2026 | 4,824 | 5,326 |
| Fannie Mae 7.00% 2026 | 645 | 737 |
| Fannie Mae 2.50% 2027 | 1,855 | 1,864 |
| Fannie Mae 2.50% 2027 | 1,423 | 1,430 |
| Fannie Mae 2.50% 2027 | 1,257 | 1,263 |
| Fannie Mae 2.50% 2027 | 1,167 | 1,172 |
| Fannie Mae 2.50% 2027 | 702 | 706 |
| Fannie Mae 2.50% 2027 | 573 | 576 |
| Fannie Mae 2.50% 2027 | 567 | 570 |
| Fannie Mae 2.50% 2028 | 45,467 | 45,797 |
| Fannie Mae 2.50% 2028 | 15,295 | 15,368 |
| Fannie Mae 2.50% 2028 | 4,045 | 4,071 |
| Fannie Mae 2.50% 2028 | 4,003 | 4,029 |
| Fannie Mae 2.50% 2028 | 3,819 | 3,843 |
| Fannie Mae 2.50% 2028 | 3,627 | 3,650 |
| Fannie Mae 2.50% 2028 | 3,087 | 3,107 |
| Fannie Mae 2.50% 2028 | 2,672 | 2,689 |
| Fannie Mae 2.50% 2028 | 2,463 | 2,475 |
| Fannie Mae 2.50% 2028 | 1,971 | 1,984 |
| Fannie Mae 2.50% 2028 | 1,969 | 1,982 |
| Fannie Mae 2.50% 2028 | 1,947 | 1,959 |
| Fannie Mae 2.50% 2028 | 1,313 | 1,321 |
| Fannie Mae 2.50% 2028 | 1,300 | 1,308 |
| Fannie Mae 2.50% 2028 | 1,213 | 1,219 |
| Fannie Mae 2.50% 2028 | 1,199 | 1,206 |
| Fannie Mae 2.50% 2028 | 1,068 | 1,074 |
| Fannie Mae 2.50% 2028 | 1,045 | 1,050 |
| Fannie Mae 2.50% 2028 | 987 | 994 |
| Fannie Mae 2.50% 2028 | 984 | 990 |
| Fannie Mae 2.50% 2028 | 983 | 990 |
| Fannie Mae 2.50% 2028 | 980 | 986 |
| Fannie Mae 2.50% 2028 | 966 | 972 |
| Fannie Mae 2.50% 2028 | 699 | 704 |
| Bonds, notes & other debt instruments | | |
| | Principal amount | Value |
| Mortgage-backed obligations7 (continued) | (000) | (000) |
| | | |
| Fannie Mae 2.50% 2028 | $ 236 | $ 237 |
| Fannie Mae 2.50% 2028 | 142 | 143 |
| Fannie Mae 6.00% 2028 | 5,134 | 5,695 |
| Fannie Mae 7.00% 2028 | 1,786 | 2,033 |
| Fannie Mae 7.00% 2028 | 309 | 352 |
| Fannie Mae, Series 2001-20, Class E, 9.572% 20316 | 172 | 195 |
| Fannie Mae 5.50% 2033 | 755 | 835 |
| Fannie Mae 4.50% 2034 | 22,316 | 24,059 |
| Fannie Mae 5.50% 2035 | 733 | 810 |
| Fannie Mae 5.50% 2036 | 5,248 | 5,788 |
| Fannie Mae 6.00% 2036 | 2,283 | 2,533 |
| Fannie Mae, Series 2006-43, Class PX, 6.00% 2036 | 2,148 | 2,394 |
| Fannie Mae 6.00% 2036 | 1,676 | 1,867 |
| Fannie Mae 6.00% 2036 | 1,052 | 1,168 |
| Fannie Mae 2.451% 20376 | 2,479 | 2,606 |
| Fannie Mae, Series 2007-33, Class HE, 5.50% 2037 | 7,900 | 8,645 |
| Fannie Mae 6.00% 2037 | 24,532 | 27,302 |
| Fannie Mae 6.00% 2037 | 4,650 | 5,210 |
| Fannie Mae, Series 2007-24, Class P, 6.00% 2037 | 4,587 | 5,077 |
| Fannie Mae 6.00% 2037 | 3,964 | 4,412 |
| Fannie Mae 6.00% 2037 | 258 | 279 |
| Fannie Mae 6.50% 2037 | 1,681 | 1,881 |
| Fannie Mae 6.50% 2037 | 1,433 | 1,619 |
| Fannie Mae 6.50% 2037 | 1,060 | 1,179 |
| Fannie Mae 6.50% 2037 | 385 | 430 |
| Fannie Mae 7.00% 2037 | 972 | 1,094 |
| Fannie Mae 7.00% 2037 | 633 | 713 |
| Fannie Mae 7.50% 2037 | 944 | 1,080 |
| Fannie Mae 7.50% 2037 | 112 | 129 |
| Fannie Mae 7.50% 2037 | 86 | 98 |
| Fannie Mae 8.00% 2037 | 106 | 122 |
| Fannie Mae 5.50% 2038 | 1,252 | 1,379 |
| Fannie Mae 6.00% 2038 | 6,029 | 6,689 |
| Fannie Mae 6.00% 2038 | 4,860 | 5,411 |
| Fannie Mae 6.00% 2038 | 2,515 | 2,788 |
| Fannie Mae 4.50% 2039 | 34,512 | 37,207 |
| Fannie Mae 6.00% 2039 | 2,724 | 3,024 |
| Fannie Mae 6.50% 2039 | 1,174 | 1,311 |
| Fannie Mae 4.00% 2040 | 15,972 | 16,759 |
| Fannie Mae 4.00% 2040 | 10,155 | 10,654 |
| Fannie Mae 4.00% 2040 | 9,491 | 9,968 |
| Fannie Mae 4.00% 2040 | 555 | 583 |
| Fannie Mae 4.194% 20406 | 1,222 | 1,303 |
| Fannie Mae 4.50% 2040 | 114 | 123 |
| Fannie Mae 4.50% 2040 | 112 | 120 |
| Fannie Mae 5.00% 2040 | 12,280 | 13,455 |
| Fannie Mae 4.00% 2041 | 13,113 | 13,767 |
| Fannie Mae 4.00% 2041 | 10,025 | 10,523 |
| Fannie Mae 4.00% 2041 | 960 | 1,008 |
| Fannie Mae 4.00% 2041 | 564 | 592 |
| Fannie Mae 4.00% 2041 | 452 | 475 |
| Fannie Mae 4.00% 2041 | 319 | 335 |
| Fannie Mae 4.50% 2041 | 344 | 370 |
| Fannie Mae 5.00% 2041 | 738 | 811 |
| Bonds, notes & other debt instruments | | |
| | Principal amount | Value |
| Mortgage-backed obligations7 (continued) | (000) | (000) |
| | | |
| Fannie Mae 5.00% 2041 | $ 660 | $ 723 |
| Fannie Mae 5.00% 2041 | 534 | 586 |
| Fannie Mae 5.00% 2041 | 447 | 488 |
| Fannie Mae, Series 2001-50, Class BA, 7.00% 2041 | 552 | 624 |
| Fannie Mae, Series 2001-T10, Class A-1, 7.00% 2041 | 442 | 516 |
| Fannie Mae, Series 2002-W3, Class A-5, 7.50% 2041 | 295 | 348 |
| Fannie Mae 3.50% 2042 | 37,572 | 38,178 |
| Fannie Mae 3.50% 2042 | 27,851 | 28,302 |
| Fannie Mae 3.50% 2042 | 10,590 | 10,768 |
| Fannie Mae 4.00% 2042 | 32,173 | 33,773 |
| Fannie Mae 4.00% 2042 | 11,375 | 11,943 |
| Fannie Mae 4.00% 2042 | 4,814 | 5,056 |
| Fannie Mae 4.00% 2042 | 1,582 | 1,661 |
| Fannie Mae, Series 2002-W1, Class 2A, 6.659% 20426 | 822 | 971 |
| Fannie Mae 3.00% 2043 | 18,250 | 17,802 |
| Fannie Mae 3.00% 2043 | 13,318 | 12,991 |
| Fannie Mae 3.00% 2043 | 1,703 | 1,660 |
| Fannie Mae 3.00% 2043 | 1,154 | 1,125 |
| Fannie Mae 3.00% 2043 | 1,078 | 1,051 |
| Fannie Mae 4.00% 2043 | 11,540 | 12,130 |
| Fannie Mae 4.00% 2043 | 11,108 | 11,673 |
| Fannie Mae 4.00% 2043 | 5,003 | 5,253 |
| Fannie Mae 4.00% 2043 | 4,212 | 4,426 |
| Fannie Mae 4.00% 2043 | 3,962 | 4,168 |
| Fannie Mae 4.00% 2043 | 3,943 | 4,143 |
| Fannie Mae 4.00% 2043 | 3,646 | 3,831 |
| Fannie Mae 4.00% 2043 | 3,230 | 3,398 |
| Fannie Mae 4.00% 2043 | 2,937 | 3,084 |
| Fannie Mae 4.00% 2043 | 991 | 1,040 |
| Fannie Mae 3.50% 2044 | 42,362 | 43,007 |
| Fannie Mae 4.50% 2044 | 30,500 | 32,722 |
| Fannie Mae 6.50% 2047 | 1,070 | 1,173 |
| Fannie Mae 6.50% 2047 | 796 | 873 |
| Fannie Mae 6.50% 2047 | 463 | 508 |
| Fannie Mae 6.50% 2047 | 420 | 460 |
| Fannie Mae 6.50% 2047 | 377 | 413 |
| Fannie Mae 6.50% 2047 | 126 | 138 |
| Fannie Mae 7.00% 2047 | 1,045 | 1,157 |
| Fannie Mae 7.00% 2047 | 404 | 447 |
| Fannie Mae 7.00% 2047 | 323 | 357 |
| Fannie Mae 7.00% 2047 | 295 | 327 |
| Freddie Mac, Series 2890, Class KT, 4.50% 2019 | 25,425 | 27,186 |
| Freddie Mac, Series 2289, Class NB, 10.025% 20226 | 19 | 21 |
| Freddie Mac, Series 2013-DN2, Class M-1, 1.608% 20236 | 3,950 | 3,971 |
| Freddie Mac, Series 2013-DN1, Class M-1, 3.558% 20236 | 4,548 | 4,719 |
| Freddie Mac 5.00% 2023 | 3,875 | 4,176 |
| Freddie Mac 5.00% 2023 | 3,653 | 3,934 |
| Freddie Mac 5.00% 2023 | 3,579 | 3,857 |
| Freddie Mac 5.00% 2023 | 1,255 | 1,358 |
| Freddie Mac 6.00% 2026 | 712 | 790 |
| Freddie Mac 6.00% 2027 | 1,250 | 1,384 |
| Freddie Mac 2.476% 20356 | 1,958 | 2,082 |
| Freddie Mac 4.50% 2035 | 23,140 | 24,868 |
| Freddie Mac, Series 3061, Class PN, 5.50% 2035 | 1,324 | 1,458 |
| Bonds, notes & other debt instruments | | |
| | Principal amount | Value |
| Mortgage-backed obligations7 (continued) | (000) | (000) |
| | | |
| Freddie Mac, Series 3257, Class PA, 5.50% 2036 | $ 7,951 | $ 8,783 |
| Freddie Mac, Series 3286, Class JN, 5.50% 2037 | 7,501 | 8,217 |
| Freddie Mac, Series 3312, Class PA, 5.50% 2037 | 7,413 | 8,121 |
| Freddie Mac, Series 3318, Class JT, 5.50% 2037 | 4,122 | 4,516 |
| Freddie Mac 5.50% 2037 | 1,258 | 1,378 |
| Freddie Mac, Series 3271, Class OA, 6.00% 2037 | 7,677 | 8,501 |
| Freddie Mac 5.50% 2038 | 3,242 | 3,551 |
| Freddie Mac 6.50% 2038 | 3,607 | 4,029 |
| Freddie Mac 4.50% 2039 | 1,902 | 2,040 |
| Freddie Mac 5.00% 2039 | 4,455 | 4,903 |
| Freddie Mac 5.00% 2039 | 2,905 | 3,201 |
| Freddie Mac 5.00% 2039 | 1,904 | 2,075 |
| Freddie Mac 5.50% 2039 | 1,648 | 1,804 |
| Freddie Mac 4.50% 2040 | 47,654 | 51,131 |
| Freddie Mac 4.00% 2041 | 2,739 | 2,865 |
| Freddie Mac 4.50% 2041 | 4,652 | 4,994 |
| Freddie Mac 4.50% 2041 | 4,514 | 4,842 |
| Freddie Mac 4.50% 2041 | 4,062 | 4,360 |
| Freddie Mac 5.00% 2041 | 266 | 290 |
| Freddie Mac 4.50% 2042 | 7,392 | 7,929 |
| Freddie Mac 4.50% 2042 | 4,726 | 5,068 |
| Freddie Mac 4.00% 2043 | 7,780 | 8,148 |
| Freddie Mac 4.00% 2043 | 7,172 | 7,515 |
| Freddie Mac 4.00% 2043 | 5,770 | 6,053 |
| Freddie Mac 4.00% 2043 | 4,509 | 4,725 |
| Freddie Mac 4.00% 2043 | 3,607 | 3,788 |
| Freddie Mac 4.00% 2043 | 3,421 | 3,582 |
| J.P. Morgan Chase Commercial Mortgage Securities Trust, Series 2006-LDP6, Class A-4, 5.475% 20436 | 19,446 | 21,027 |
| J.P. Morgan Chase Commercial Mortgage Securities Corp., Series 2006-LDP7, Class A-4, 5.873% 20456 | 14,700 | 16,072 |
| J.P. Morgan Chase Commercial Mortgage Securities Corp., Series 2011-C4, Class A-2, 3.341% 20465 | 7,500 | 7,853 |
| J.P. Morgan Chase Commercial Mortgage Securities Corp., Series 2011-C3A, Class A-2, 3.673% 20465 | 24,000 | 25,247 |
| J.P. Morgan Chase Commercial Mortgage Securities Corp., Series 2005-LDP1, Class A-2, 4.625% 2046 | 441 | 441 |
| J.P. Morgan Chase Commercial Mortgage Securities Corp., Series 2007-CB19, Class A-4, 5.709% 20496 | 15,450 | 17,269 |
| J.P. Morgan Chase Commercial Mortgage Securities Corp., Series 2007-C1, Class A-4, 5.716% 2051 | 5,000 | 5,525 |
| J.P. Morgan Chase Commercial Mortgage Securities Corp., Series 2007-LD12, Class A-M, 5.994% 20516 | 20,950 | 23,252 |
| Government National Mortgage Assn. 10.00% 2021 | 356 | 416 |
| Government National Mortgage Assn. 10.00% 2025 | 336 | 385 |
| Government National Mortgage Assn. 4.50% 2041 | 2,388 | 2,604 |
| Government National Mortgage Assn. 4.00% 2043 | 65,340 | 69,437 |
| CS First Boston Mortgage Securities Corp., Series 2004-5, Class IV-A-1, 6.00% 2034 | 1,673 | 1,814 |
| CS First Boston Mortgage Securities Corp., Series 2005-C3, Class A-AB, 4.614% 2037 | 1,956 | 1,979 |
| CS First Boston Mortgage Securities Corp., Series 2006-C5, Class A-M, 5.343% 2039 | 15,020 | 16,197 |
| CS First Boston Mortgage Securities Corp., Series 2007-C5, Class A4, 5.695% 20406 | 13,000 | 14,427 |
| CS First Boston Mortgage Securities Corp., Series 2007-C2, Class A-M, 5.615% 20496 | 10,000 | 10,773 |
| ML-CFC Commercial Mortgage Trust, Series 2006-4, Class A-3, 5.172% 2049 | 27,410 | 29,762 |
| ML-CFC Commercial Mortgage Trust, Series 2007-8, Class A-3, 5.894% 20496 | 11,290 | 12,720 |
| Wachovia Bank Commercial Mortgage Trust, Series 2005-C16, Class A-PB, 4.692% 2041 | 2,116 | 2,120 |
| Wachovia Bank Commercial Mortgage Trust, Series 2007-C30, Class A-5, 5.342% 2043 | 8,000 | 8,835 |
| Wachovia Bank Commercial Mortgage Trust, Series 2007-C31, Class A-M, 5.591% 20476 | 19,050 | 20,897 |
| Wachovia Bank Commercial Mortgage Trust, Series 2007-C33, Class A-M, 5.922% 20516 | 8,500 | 9,541 |
| LB-UBS Commercial Mortgage Trust, Series 2007-C2, Class A-3, 5.43% 2040 | 9,941 | 11,011 |
| LB-UBS Commercial Mortgage Trust, Series 2007-C2, Class A-M, 5.493% 20406 | 15,000 | 16,011 |
| LB-UBS Commercial Mortgage Trust, Series 2007-C6, Class A-M, 6.114% 20406 | 10,035 | 11,134 |
| Greenwich Capital Commercial Funding Corp., Series 2005-GG5, Class A-4-1, 5.243% 20376 | 7,520 | 7,530 |
| Bonds, notes & other debt instruments | | |
| | Principal amount | Value |
| Mortgage-backed obligations7 (continued) | (000) | (000) |
| | | |
| Greenwich Capital Commercial Funding Corp., Series 2006-GG7, Class A-4, 5.82% 20386 | $ 6,865 | $ 7,494 |
| Greenwich Capital Commercial Funding Corp., Series 2007-GG9, Class A-4, 5.444% 2039 | 10,000 | 11,051 |
| Greenwich Capital Commercial Funding Corp., Series 2007-GG11, Class A-M, 5.867% 20496 | 7,879 | 8,734 |
| GE Commercial Mortgage Corp., Series 2006-C1, Class A-4, 5.281% 20446 | 13,000 | 13,901 |
| GE Commercial Mortgage Corp., Series 2005-C4, Class A-3A, 5.311% 20456 | 9,784 | 9,817 |
| Citigroup-Deutsche Bank Commercial Mortgage Trust, Series 2005-CD1, Class A-4, 5.219% 20446 | 5,500 | 5,828 |
| Citigroup-Deutsche Bank Commercial Mortgage Trust, Series 2006-CD3, Class A-5, 5.617% 2048 | 13,250 | 14,451 |
| J.P. Morgan Chase Commercial Mortgage Securities Trust, Series 2006-LDP9, Class A-M, 5.372% 2047 | 15,500 | 16,425 |
| Aventura Mall Trust, Series A, 3.743% 20325,6 | 12,250 | 12,818 |
| LB-UBS Commercial Mortgage Trust, Series 2005-C7, Class A-4, 5.197% 20306 | 11,422 | 12,033 |
| Countrywide Alternative Loan Trust, Series 2005-54CB, Class 2-A-5, 5.50% 2035 | 8,169 | 7,266 |
| Countrywide Alternative Loan Trust, Series 2007-HY4, Class 3-A-1, 4.741% 20476 | 5,089 | 3,606 |
| Crown Castle Towers LLC, Series 2010-1, Class C, 4.523% 20355 | 10,000 | 10,338 |
| Bank of Montreal 2.85% 20155 | 10,000 | 10,332 |
| Banc of America Commercial Mortgage Inc., Series 2005-5, Class A-4, 5.115% 20456 | 3,000 | 3,162 |
| Banc of America Commercial Mortgage Inc., Series 2007-3, Class A-4, 5.62% 20496 | 5,000 | 5,554 |
| L.A. Arena Funding, LLC, Series 1, Class A, 7.656% 20265 | 6,728 | 7,683 |
| DBUBS Mortgage Trust, Series 2011-LC1A, Class A1, 3.742% 20465 | 7,166 | 7,516 |
| Commonwealth Bank of Australia 0.75% 20175 | 7,000 | 7,017 |
| IndyMac INDX Mortgage Loan Trust, Series 2006-AR5, Class 2-A-1, 4.544% 20366 | 8,129 | 6,885 |
| Hilton USA Trust, Series 2013-HLF-AFX, 2.662% 20305 | 6,555 | 6,605 |
| National Australia Bank 1.25% 20185 | 5,000 | 4,941 |
| Structured Adjustable Rate Mortgage Loan Trust, Series 2006-4, Class 6-A, 5.057% 20366 | 5,935 | 4,925 |
| Merrill Lynch Mortgage Trust, Series 2007-C1, Class A-4, 5.841% 20506 | 3,460 | 3,862 |
| Commercial Mortgage Trust, Series 2013-LC13, Class A-5, 4.205% 2046 | 2,865 | 3,019 |
| Citigroup Commercial Mortgage Trust, Series 2013-CG15, Class A-4, 4.371% 2046 | 2,226 | 2,367 |
| GSR Mortgage Loan Trust, Series 2004-2F, Class VIIA-1, 4.50% 2019 | 1,768 | 1,783 |
| National Credit Union Administration, Series 2011-M1, Class A2, 1.40% 2015 | 709 | 716 |
| Financial Asset Securitization, Inc., Series 1997-NAM1, Class B-1, 7.75% 2027 | 136 | 139 |
| Bear Stearns Commercial Mortgage Securities Inc., Series 1999-C1, Class X, interest only, 1.454% 20315,6 | 1,338 | 25 |
| | | 1,513,232 |
| Federal agency bonds & notes 0.32% | | |
| | | |
| Freddie Mac 2.50% 2016 | 22,500 | 23,527 |
| Freddie Mac 1.00% 2017 | 56,000 | 55,882 |
| Freddie Mac 0.75% 2018 | 9,000 | 8,807 |
| Freddie Mac, Series K711, Class A2, multifamily 1.73% 20197 | 11,000 | 10,794 |
| Freddie Mac, Series K712, Class A2, multifamily 1.869% 20197 | 7,265 | 7,173 |
| Freddie Mac, Series K710, Class A2, multifamily 1.883% 20197 | 6,906 | 6,858 |
| Freddie Mac, Series K709, Class A2, multifamily 2.086% 20197 | 5,880 | 5,912 |
| Freddie Mac, Series K714, Class A-2, multifamily 3.034% 20207 | 4,095 | 4,236 |
| Freddie Mac, Series K019, Class A2, multifamily 2.272% 20227 | 8,000 | 7,624 |
| Freddie Mac, Series K023, Class A2, multifamily 2.307% 20227 | 8,995 | 8,521 |
| Freddie Mac, Series K021, Class A2, multifamily 2.396% 20227 | 8,280 | 7,930 |
| Freddie Mac, Series K025, Class A2, multifamily 2.682% 20227 | 7,000 | 6,792 |
| Freddie Mac, Series K028, Class A2, multifamily 3.111% 20237 | 9,800 | 9,803 |
| Fannie Mae, Series 2012-M17, Class A2, multifamily 2.184% 20227 | 8,000 | 7,480 |
| Fannie Mae, Series 2012-M14, Class A2, multifamily 2.301% 20226,7 | 4,285 | 4,038 |
| Fannie Mae, Series 2012-M9, Class A2, multifamily 2.482% 20227 | 12,231 | 11,780 |
| Fannie Mae, Series 2012-M5, Class A2, multifamily 2.715% 20227 | 7,000 | 6,878 |
| Fannie Mae, Series 2013-M14, Class A2, multifamily 3.329% 20236,7 | 9,141 | 9,169 |
| Fannie Mae, Series 2014-M-1, multifamily 3.396% 20236,7 | 450 | 454 |
| Fannie Mae 6.25% 2029 | 32,000 | 41,482 |
| Fannie Mae 7.125% 2030 | 1,500 | 2,110 |
| Bonds, notes & other debt instruments | | |
| | Principal amount | Value |
| Federal agency bonds & notes (continued) | (000) | (000) |
| | | |
| CoBank, ACB 7.875% 20185 | $10,000 | $ 12,127 |
| CoBank, ACB 0.843% 20225,6 | 8,315 | 7,608 |
| United States Agency for International Development, Republic of Egypt 4.45% 2015 | 10,000 | 10,637 |
| Tennessee Valley Authority, Series A, 3.875% 2021 | 850 | 926 |
| Tennessee Valley Authority 1.875% 2022 | 850 | 780 |
| Tennessee Valley Authority, Series 2008, Class A, 4.875% 2048 | 700 | 715 |
| Private Export Funding Corp. 3.55% 2024 | 545 | 558 |
| Federal Home Loan Bank 5.50% 2036 | 100 | 121 |
| | | 280,722 |
| Bonds & notes of governments & government agencies outside the U.S. 0.13% | | |
| | | |
| Polish Government 6.375% 2019 | 13,385 | 15,711 |
| Polish Government 5.00% 2022 | 3,000 | 3,217 |
| Polish Government 4.00% 2024 | 9,665 | 9,520 |
| Croatian Government 6.75% 2019 | 4,800 | 5,142 |
| Croatian Government 6.375% 2021 | 5,000 | 5,200 |
| Croatian Government 5.50% 20235 | 625 | 598 |
| Spanish Government 4.00% 20185 | 10,000 | 10,517 |
| France Government Agency-Guaranteed, Société Finance 2.875% 20145 | 10,000 | 10,165 |
| Colombia (Republic of) Global 5.625% 2044 | 10,000 | 9,775 |
| Israeli Government 5.125% 2019 | 3,000 | 3,396 |
| Israeli Government 4.00% 2022 | 2,700 | 2,799 |
| Israeli Government 4.50% 2043 | 3,195 | 2,909 |
| Russian Federation 3.25% 2017 | 3,000 | 3,147 |
| Russian Federation 3.25% 20175 | 2,800 | 2,937 |
| Russian Federation 7.50% 20307 | 980 | 1,130 |
| United Mexican States Government Global 5.55% 2045 | 7,000 | 6,930 |
| Turkey (Republic of) 4.557% 20185 | 1,200 | 1,187 |
| Turkey (Republic of) 5.625% 2021 | 5,400 | 5,420 |
| Indonesia (Republic of) 5.875% 20245 | 4,750 | 4,851 |
| Latvia (Republic of) 2.75% 2020 | 4,250 | 4,067 |
| Hungarian Government 6.25% 2020 | 3,410 | 3,666 |
| | | 112,284 |
| Asset-backed obligations7 0.04% | | |
| | | |
| Hertz Vehicle Financing LLC, Rental Car Asset-backed Notes, Series 2013-1A, Class A-1, 1.12% 20175 | 8,500 | 8,511 |
| First Horizon ABS Trust, Series 2006-HE2, Class A, FSA insured, 0.288% 20266 | 1,873 | 1,739 |
| First Horizon ABS Trust, Series 2007-HE1, Class A, FSA insured, 0.288% 20296 | 4,139 | 3,895 |
| CWHEQ Revolving Home Equity Loan Trust, Series 2006-I, Class 2-A, FSA insured, 0.30% 20376 | 2,169 | 1,913 |
| CWHEQ Revolving Home Equity Loan Trust, Series 2007-B, Class A, FSA insured, 0.31% 20376 | 3,801 | 3,413 |
| AEP Texas Central Transitioning Funding II LLC, Secured Transition Bonds, Series A, Class A-3, 5.09% 2017 | 4,484 | 4,634 |
| Countryplace Manufactured Housing Contract, Series 2005-1, Class A-3, AMBAC insured, 4.80% 20355 | 2,031 | 2,078 |
| Countryplace Manufactured Housing Contract, Series 2005-1, Class A-4, AMBAC insured, 5.20% 20355,6 | 1,145 | 1,231 |
| Hyundai Auto Receivables Trust, Series 2014-A, Class A2, 0.46% 2017 | 2,760 | 2,761 |
| Home Equity Mortgage Trust, Series 2006-6, Class 2A-1, 0.258% 20376 | 13,988 | 2,605 |
| Conseco Finance Home Loan Trust, Series 1999-G, Class B-2, 10.96% 2029 | 13,630 | 2,266 |
| IndyMac Home Equity Mortgage Loan Asset-backed Trust, | | |
| Series 2007-H1, Class A-1, FSA insured, 0.318% 20376 | 2,194 | 1,876 |
| RAMP Trust, Series 2003-RZ4, Class A-7, 4.79% 20336 | 883 | 936 |
| | | 37,858 |
| Bonds, notes & other debt instruments | | |
| | Principal amount | Value |
| Municipals 0.04% | (000) | (000) |
| | | |
| State of California, Various Purpose General Obligation Bonds, 6.20% 2019 | $ 24,675 | $ 29,443 |
| State of Washington, Energy Northwest, Columbia Generating Station Electric Revenue Bonds, | | |
| Series 2012-E, 2.197% 2019 | 6,500 | 6,497 |
| State of New Jersey, Economic Development Authority, | | |
| Energy Facility Revenue Bonds (ACR Energy Partners, LLC Project), Series 2011-B, 12.00% 20305 | 1,875 | 1,784 |
| | | 37,724 |
| Miscellaneous 0.03% | | |
| | | |
| Other bonds & notes in initial period of acquisition | | 23,307 |
| Total bonds, notes & other debt instruments (cost: $16,985,522,000) | | 17,725,339 |
| Short-term securities 5.42% | | |
| | | |
| Freddie Mac 0.09%–0.16% due 2/4–11/17/2014 | 1,606,700 | 1,606,235 |
| Federal Home Loan Bank 0.055%–0.18% due 2/3–12/15/2014 | 1,182,065 | 1,181,813 |
| Fannie Mae 0.105%–0.16% due 2/3–10/27/2014 | 695,700 | 695,473 |
| Coca-Cola Co. 0.06%–0.14% due 3/13–4/24/20145 | 229,300 | 229,262 |
| General Electric Co. 0.05% due 2/13/2014 | 100,000 | 99,998 |
| General Electric Capital Corp. 0.14% due 2/19–2/21/2014 | 89,500 | 89,496 |
| Federal Farm Credit Banks 0.11%–0.15% due 4/10–11/4/2014 | 182,100 | 182,020 |
| Private Export Funding Corp. 0.13%–0.235% due 2/13–8/15/20145 | 97,300 | 97,273 |
| Emerson Electric Co. 0.08%–0.10% due 2/20–4/17/20145 | 91,700 | 91,692 |
| Cisco Systems, Inc. 0.07% due 3/20/20145 | 65,600 | 65,588 |
| Wells Fargo & Co. 0.20%–0.22% due 2/4–6/17/2014 | 60,000 | 59,974 |
| National Rural Utilities Cooperative Finance Corp. 0.09% due 2/11/2014 | 50,000 | 49,999 |
| Chevron Corp. 0.07% due 3/24/20145 | 50,000 | 49,990 |
| John Deere Financial Ltd. 0.07% due 2/10–2/12/20145 | 47,600 | 47,599 |
| Medtronic Inc. 0.07% due 3/13/20145 | 45,100 | 45,096 |
| Regents of the University of California 0.12% due 2/6/2014 | 30,196 | 30,195 |
| Walt Disney Co. 0.07% due 2/27/20145 | 28,475 | 28,474 |
| Abbott Laboratories 0.10% due 4/4/20145 | 25,800 | 25,798 |
| Jupiter Securitization Co., LLC 0.28% due 10/14/20145 | 25,000 | 24,949 |
| ExxonMobil Corp. 0.06% due 3/13/2014 | 18,300 | 18,299 |
| Google Inc. 0.07% due 3/11/20145 | 3,600 | 3,600 |
| Total short-term securities (cost: $4,722,143,000) | | 4,722,823 |
| Total investment securities (cost: $71,994,116,000) | | 87,110,634 |
| Other assets less liabilities | | 60,491 |
| Net assets | | $87,171,125 |
As permitted by U.S. Securities and Exchange Commission regulations, “Miscellaneous” securities include holdings in their first year of acquisition that have not previously been publicly disclosed.
ITEM 7 – Disclosure of Proxy Voting Policies and Procedures for Closed-End Management Investment Companies
Not applicable to this Registrant, insofar as the Registrant is not a closed-end management investment company.
Not applicable to this Registrant, insofar as the Registrant is not a closed-end management investment company.
ITEM 9 – Purchases of Equity Securities by Closed-End Management Investment Company and Affiliated Purchasers
Not applicable to this Registrant, insofar as the Registrant is not a closed-end management investment company.
There have been no material changes to the procedures by which shareholders may recommend nominees to the Registrant’s board of trustees since the Registrant last submitted a proxy statement to its shareholders. The procedures are as follows. The Registrant has a nominating and governance committee comprised solely of persons who are not considered ‘‘interested persons’’ of the Registrant within the meaning of the Investment Company Act of 1940, as amended. The committee periodically reviews such issues as the board’s composition, responsibilities, committees, compensation and other relevant issues, and recommends any appropriate changes to the full board of trustees. While the committee normally is able to identify from its own resources an ample number of qualified candidates, it will consider shareholder suggestions of persons to be considered as nominees to fill future vacancies on the board. Such suggestions must be sent in writing to the nominating and governance committee of the Registrant, c/o the Registrant’s Secretary, and must be accompanied by complete biographical and occupational data on the prospective nominee, along with a written consent of the prospective nominee for consideration of his or her name by the nominating and governance committee.
Pursuant to the requirements of the Securities Exchange Act of 1934 and the Investment Company Act of 1940, the Registrant has duly caused this report to be signed on its behalf by the undersigned, thereunto duly authorized.
Pursuant to the requirements of the Securities Exchange Act of 1934 and the Investment Company Act of 1940, this report has been signed below by the following persons on behalf of the Registrant and in the capacities and on the dates indicated.