UNITED STATES
SECURITIES AND EXCHANGE COMMISSION
Washington, D.C. 20549
FORM N-CSR
Certified Shareholder Report of
Registered Management Investment Companies
Investment Company Act File Number: 811-01880
The Income Fund of America
(Exact Name of Registrant as Specified in Charter)
6455 Irvine Center Drive
Irvine, California 92618
(Address of Principal Executive Offices)
Registrant's telephone number, including area code: (213) 486-9200
Date of fiscal year end: July 31
Date of reporting period: January 31, 2016
Michael W. Stockton
The Income Fund of America
333 South Hope Street
Los Angeles, California 90071
(Name and Address of Agent for Service)
ITEM 1 – Reports to Stockholders

| | | |
 | | The Income Fund
of America®
Semi-annual report
for the six months ended
January 31, 2016 |
The Income Fund of America seeks to provide you with current income while secondarily striving for capital growth.
This fund is one of more than 40 offered by one of the nation’s largest mutual fund families, American Funds, from Capital Group. For more than 80 years, Capital has invested with a long-term focus based on thorough research and attention to risk.
Fund results shown in this report, unless otherwise indicated, are for Class A shares at net asset value. If a sales charge (maximum 5.75%) had been deducted, the results would have been lower. Results are for past periods and are not predictive of results for future periods. Current and future results may be lower or higher than those shown. Share prices and returns will vary, so investors may lose money. Investing for short periods makes losses more likely. Investments are not FDIC-insured, nor are they deposits of or guaranteed by a bank or any other entity, so they may lose value. For current information and month-end results, visit americanfunds.com.
Here are the average annual total returns on a $1,000 investment with all distributions reinvested for periods ended December 31, 2015 (the most recent calendar quarter-end):
| Class A shares | | 1 year | | 5 years | | 10 years |
| | | | | | | |
| Reflecting 5.75% maximum sales charge | | –7.15% | | 7.07% | | 5.71% |
For other share class results, visit americanfunds.com and americanfundsretirement.com.
The total annual fund operating expense ratio was 0.55% for Class A shares as of the prospectus dated October 1, 2015.
Investment results assume all distributions are reinvested and reflect applicable fees and expenses. When applicable, investment results reflect fee waivers, without which results would have been lower. Visit americanfunds.com for more information.
The fund’s 30-day yield for Class A shares as of February 29, 2016, calculated in accordance with the U.S. Securities and Exchange Commission (SEC) formula, was 3.15%. The fund’s 12-month distribution rate for Class A shares as of that date was 3.09%. Both reflect the 5.75% maximum sales charge. The SEC yield reflects the rate at which the fund is earning income on its current portfolio of securities while the distribution rate reflects the fund’s past dividends paid to shareholders. Accordingly, the fund’s SEC yield and distribution rate may differ.
The return of principal for bond funds and for funds with significant underlying bond holdings is not guaranteed. Fund shares are subject to the same interest rate, inflation and credit risks associated with the underlying bond holdings. Lower rated bonds are subject to greater fluctuations in value and risk of loss of income and principal than higher rated bonds. Investing outside the United States involves risks, such as currency fluctuations, periods of illiquidity and price volatility, as more fully described in the prospectus. These risks may be heightened in connection with investments in developing countries. Refer to the fund prospectus and the Risk Factors section of this report for more information on these and other risks associated with investing in the fund.
| | Navigating
a volatile
investment
environment |
Fellow investors:
Amid a challenging market environment, The Income Fund of America declined 3.98% for the first half of its fiscal year. For the six months ended January 31, 2016, the fund paid dividends totaling 33 cents a share. In addition, there was a capital gain distribution of 37 cents paid in December.
The fund’s results outpaced the broader equity market and its peer group, the Lipper Income Funds Index. The unmanaged Standard & Poor’s 500 Composite Index, a market capitalization-weighted index based on the results of 500 widely held common stocks, fell 6.77%. The Lipper Income Funds Index dropped 4.68%. Bonds outpaced equity results. The unmanaged Barclays U.S. Aggregate Index, a gauge of the U.S. investment-grade bond market, rose 1.33%.
Volatility bookends the period
Markets were confronted with a variety of geopolitical and macroeconomic issues at both the start and finish of the six-month period. In August and again in January, equity markets in China experienced swift and steep declines. Many of the world’s equity markets followed suit, including those in the U.S. Indeed, 2016 began in a swirl of volatility, stemming in large part from ongoing uncertainty in the Chinese economy and the continuing slide in commodity prices.
U.S. economic results were mixed. Gross Domestic Product (GDP) growth faltered in the fourth quarter, rising only 1.0%. Private companies nonetheless added workers at a brisk clip. The unemployment rate stood at 4.9% at the end of January. Consumer confidence climbed, with U.S. auto sales hitting a record 17.5 million cars and light trucks in 2015. Low gas prices and affordable loans also helped sell vehicles.
| The Income Fund of America | 1 |
After nearly a decade, the U.S. Federal Reserve deemed the economy strong enough to raise its key overnight lending rate in December by a quarter-point to a range of 0.25% to 0.50%. The Fed has repeatedly maintained that it expects to raise rates at a gradual pace.
Energy crisis
Energy has been one of the weakest sectors in the S&P 500 for several years, and that trend continued at the start of 2016. Oil dropped below $27 a barrel near the end of January to its lowest level since 2003. The Income Fund of America’s returns were dampened by several companies in the energy sector. Royal Dutch Shell and Spectra Energy fell 27.6% and 9.3%, respectively, while ConocoPhillips experienced a decline of 22.4% over the six-month period. In February ConocoPhillips announced its first dividend cut in 25 years and further reduced its capital spending plans.
Two of the fund’s largest holdings in the materials sector, Dow Chemical and DuPont, lost ground. The precipitous decline in the price of oil and worries about its impact on petrochemical profitability, combined with investor uncertainty around the structure of a merger agreement announced by the companies in December, pressured share prices.
Large holdings drive fund returns
Seven of the fund’s top 10 holdings registered positive returns. Microsoft, the fund’s largest position, advanced 18.0%, bolstered by its Office 365 subscription-based productivity suites and impressive strides in cloud computing. Microsoft entered the cloud arena in 2010 with a service called Azure that, for a fee, offered customers access to basically unlimited supercomputing power from its servers. In late January the company announced that revenue from Azure had more than doubled, while that for Office 365 jumped nearly 70%.
Among holdings in the industrials sector, Lockheed Martin (1.9%) and General Electric (11.5%) made positive contributions. Lockheed, a global aerospace and defense company, reported better-than-expected earnings and continues to benefit from a steady flow of contracts with the Pentagon. The company acquired helicopter-maker Sikorsky Aircraft from United Technologies in November 2015, a move that helped consolidate its position as the Pentagon’s largest supplier of military equipment. In addition to a robust order book, Lockheed has demonstrated its commitment to rewarding shareholders by significantly increasing its dividend during the past two years.
General Electric rose for the period as it moved to sell its financial and appliance arms in order to focus on its industrial, health care and energy divisions. Shares rallied in 2015 after the company announced it would repurchase $50 billion in shares, one of the biggest buybacks on record. GE aviation, a leading provider of jet and turboprop
| 2 | The Income Fund of America |
engines, component and integrated systems for commercial, military, business and general aviation aircraft, helped drive the company’s growth.
Among health care holdings, Merck and Pfizer struggled. Their declines appeared to be more about political rhetoric than company fundamentals as the level of debate about drug pricing heated up among U.S. presidential candidates.
Consumers do their part
In the consumer discretionary sector, global fast-food giant McDonald’s jumped 24%. While the company continues to fine-tune its menu options, its initiation of all-day breakfast in October had a quick and positive impact on sales that should lead to more sustainable earnings growth.
Overall, investments in consumer staples were additive. In fact, Procter & Gamble, Coca-Cola, Philip Morris International and Reynolds American — the fund’s four largest positions in the sector — all advanced.
Financials affected by energy, interest rates
The ramifications of falling oil prices extended to other areas, including financials, as some banks braced for an increase in losses on loans to oil and gas companies. For much of 2015, banks were helped by the expectation of rising rates. However, financial shares have tumbled thus far in 2016 on fears of recession and the possibility that interest rates could remain lower for longer. JPMorgan Chase, a top 10 holding for the fund, dipped 13.2% — despite reporting its largest annual profit ever. Profits were driven by its credit card and commercial banking divisions.
Bonds vexed by commodities
Bonds issued by energy and natural resource companies were hurt by falling commodity prices, and the negative sentiment spread to the broader high-yield sector. As such, the fund’s holdings in this segment of the bond market, which play an important role in delivering income, were a drag on returns.
In an effort to protect the fund from potential liquidity concerns, the fixed-income portion of the portfolio holds a position in U.S. Treasuries. This relatively liquid position provides portfolio managers the flexibility to take advantage of future investment opportunities while also helping to preserve investor capital.
Outlook
We remain optimistic that the U.S. economy will continue its modest growth. We are, however, mindful of the many difficulties currently testing the markets. The recent
| The Income Fund of America | 3 |
volatility, while unsettling, can provide an occasion to invest at relatively attractive valuations in firms we believe have the potential to prosper over the long run. Such periods also highlight the importance of investing in companies with sustainable dividends, which historically have been an important component of total return. We thank you for your commitment to The Income Fund of America and look forward to reporting to you again in six months.
Cordially,

Hilda L. Applbaum
Vice Chairman and Principal Executive Officer

David C. Barclay
President
March 15, 2016
For current information about the fund, visit americanfunds.com.
| 4 | The Income Fund of America |
The Income Fund of America at a glance
Fund results shown are for Class A shares at net asset value. If a sales charge (maximum 5.75%) had been deducted, the results would have been lower. Results are for past periods and are not predictive of results for future periods. Current and future results may be lower or higher than those shown. Share prices and returns will vary, so investors may lose money. For current information and month-end results, visit americanfunds.com.
Results at a glance (with dividends reinvested or interest compounded)
For periods ended January 31, 2016
| | | Cumulative
total returns | | Average annual total returns |
| | | 6 months | | 12 months | | 5 years | | 10 years | | Lifetime1 |
| | | | | | | | | | | |
| The Income Fund of America (Class A shares) | | | –3.98 | % | | | –3.00 | % | | | 7.51 | % | | | 5.80 | % | | | 10.95 | % |
| Standard & Poor’s 500 Composite Index2 | | | –6.77 | | | | –0.67 | | | | 10.91 | | | | 6.48 | | | | 10.68 | |
| Barclays U.S. Aggregate Index2,3 | | | 1.33 | | | | –0.16 | | | | 3.51 | | | | 4.66 | | | | 7.58 | |
| Lipper Income Funds Index | | | –4.68 | | | | –3.61 | | | | 4.35 | | | | 4.31 | | | | — | 4 |
| Consumer Price Index (inflation)5 | | | –0.73 | | | | 1.37 | | | | 1.47 | | | | 1.80 | | | | 3.97 | |
| 1 | Since December 1, 1973, when Capital Research and Management Company became the fund’s investment adviser. |
| 2 | The market indexes are unmanaged and, therefore, have no expenses. Investors cannot invest directly in an index. |
| 3 | From December 1, 1973, through December 31, 1975, the Barclays U.S. Government/Credit Index was used because the Barclays U.S. Aggregate Index did not yet exist. |
| 4 | The inception date for the index was December 31, 1988. Lipper indexes track the largest mutual funds (no more than 30), represented by one share class per fund, in the corresponding Lipper category. |
| 5 | Computed from data supplied by the U.S. department of Labor, Bureau of Labor Statistics. |
A history of relatively high current income
For the five years ended January 31, 2016
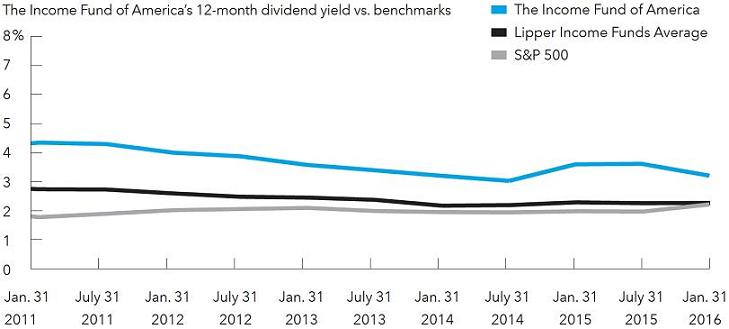
All numbers calculated by Lipper. The 12-month dividend rate is calculated by taking the total of the trailing 12 months’ dividends and dividing the month-end net asset value adjusted for capital gains.
| The Income Fund of America | 5 |
The portfolio at a glance
| January 31, 2016 (unaudited) | | Percent of
net assets |
| Investment mix by security type | | | | |
| U.S. common stocks | | | 53.48 | % |
| Common stocks of issuers outside the U.S. | | | 16.74 | |
| U.S. Treasury & agency bonds & notes | | | 5.83 | |
| Convertible securities, preferred securities & rights & warrants | | | 1.26 | |
| Other fixed-income securities | | | 17.51 | |
| Short-term securities & other assets less liabilities | | | 5.18 | |
| | | | | |
| Five largest sectors in common stock holdings | | | | |
| Industrials | | | 9.91 | % |
| Consumer staples | | | 9.26 | |
| Financials | | | 9.04 | |
| Information technology | | | 9.03 | |
| Health care | | | 7.53 | |
| | | | | |
| Ten largest common stock holdings | | | | |
| Microsoft | | | 3.72 | % |
| Merck | | | 2.49 | |
| General Electric | | | 2.47 | |
| McDonald’s | | | 2.23 | |
| Lockheed Martin | | | 1.84 | |
| Intel | | | 1.72 | |
| Verizon Communications | | | 1.66 | |
| JPMorgan Chase | | | 1.54 | |
| Procter & Gamble | | | 1.53 | |
| Pfizer | | | 1.45 | |
| | | | | |
| Country diversification by domicile | | | | |
| United States | | | 74.67 | % |
| United Kingdom | | | 7.62 | |
| Euro zone* | | | 4.69 | |
| Hong Kong | | | 1.83 | |
| Australia | | | 1.34 | |
| Canada | | | 1.22 | |
| Taiwan | | | 0.94 | |
| Switzerland | | | 0.82 | |
| Japan | | | 0.48 | |
| Other countries | | | 1.21 | |
| Short-term securities & other assets less liabilities | | | 5.18 | |
| * | Countries using the euro as a common currency; those represented in the fund’s portfolio are Belgium, Finland, France, Germany, Ireland, Italy, Luxembourg, the Netherlands, Portugal, Slovenia and Spain. |
| July 31, 2015 | | Percent of
net assets |
| Investment mix by security type | | | | |
| U.S. common stocks | | | 52.26 | % |
| Common stocks of issuers outside the U.S. | | | 19.02 | |
| U.S. Treasury & agency bonds & notes | | | 3.87 | |
| Convertible securities, preferred securities & rights & warrants | | | 1.82 | |
| Other fixed-income securities | | | 16.10 | |
| Short-term securities & other assets less liabilities | | | 6.93 | |
| | | | | |
| Five largest sectors in common stock holdings | | | | |
| Industrials | | | 10.47 | % |
| Health care | | | 9.85 | |
| Financials | | | 9.64 | |
| Information technology | | | 8.20 | |
| Consumer staples | | | 6.89 | |
| | | | | |
| Ten largest common stock holdings | | | | |
| Merck | | | 3.05 | % |
| Microsoft | | | 2.96 | |
| Pfizer | | | 2.28 | |
| General Electric | | | 2.07 | |
| Bristol-Myers Squibb | | | 1.64 | |
| Lockheed Martin | | | 1.56 | |
| Verizon Communications | | | 1.55 | |
| JPMorgan Chase | | | 1.37 | |
| Wells Fargo | | | 1.23 | |
| Procter & Gamble | | | 1.22 | |
| | | | | |
| Country diversification by domicile | | | | |
| United States | | | 70.54 | % |
| United Kingdom | | | 7.62 | |
| Euro zone† | | | 5.65 | |
| Australia | | | 2.08 | |
| Hong Kong | | | 1.83 | |
| Canada | | | 1.50 | |
| Switzerland | | | 1.13 | |
| Other countries | | | 2.72 | |
| Short-term securities & other assets less liabilities | | | 6.93 | |
| † | Countries using the euro as a common currency; those represented in the fund’s portfolio are Belgium, Finland, France, Germany, Ireland, Italy, Luxembourg, the Netherlands, Portugal, Slovenia and Spain. |
| 6 | The Income Fund of America |
| Summary investment portfolio January 31, 2016 | unaudited |
| Common stocks 70.22% | | Shares | | | Value
(000) | |
| Industrials 9.91% | | | | | | | | |
| General Electric Co. | | | 77,722,474 | | | $ | 2,261,724 | |
| Lockheed Martin Corp. | | | 7,999,400 | | | | 1,687,873 | |
| BAE Systems PLC1 | | | 131,426,883 | | | | 970,013 | |
| Waste Management, Inc. | | | 16,181,128 | | | | 856,791 | |
| Ryanair Holdings PLC (ADR) | | | 6,452,401 | | | | 505,546 | |
| Other securities | | | | | | | 2,797,202 | |
| | | | | | | | 9,079,149 | |
| | | | | | | | | |
| Consumer staples 9.26% | | | | | | | | |
| Procter & Gamble Co. | | | 17,161,700 | | | | 1,401,939 | |
| Coca-Cola Co. | | | 28,511,000 | | | | 1,223,692 | |
| Philip Morris International Inc. | | | 12,805,004 | | | | 1,152,579 | |
| Reynolds American Inc. | | | 18,601,668 | | | | 929,153 | |
| Altria Group, Inc. | | | 11,076,000 | | | | 676,854 | |
| British American Tobacco PLC1 | | | 11,758,200 | | | | 653,701 | |
| Kellogg Co. | | | 5,550,000 | | | | 407,592 | |
| Other securities | | | | | | | 2,029,919 | |
| | | | | | | | 8,475,429 | |
| | | | | | | | | |
| Financials 9.04% | | | | | | | | |
| JPMorgan Chase & Co. | | | 23,673,157 | | | | 1,408,553 | |
| Wells Fargo & Co. | | | 21,365,915 | | | | 1,073,210 | |
| CME Group Inc., Class A | | | 10,140,400 | | | | 911,115 | |
| Crown Castle International Corp. | | | 9,554,000 | | | | 823,555 | |
| Public Storage | | | 2,240,000 | | | | 567,974 | |
| Digital Realty Trust, Inc. | | | 6,885,000 | | | | 551,351 | |
| Other securities | | | | | | | 2,946,670 | |
| | | | | | | | 8,282,428 | |
| | | | | | | | | |
| Information technology 9.03% | | | | | | | | |
| Microsoft Corp. | | | 61,766,639 | | | | 3,402,724 | |
| Intel Corp. | | | 50,876,100 | | | | 1,578,177 | |
| Texas Instruments Inc. | | | 15,550,000 | | | | 823,062 | |
| Analog Devices, Inc. | | | 14,116,091 | | | | 760,293 | |
| Taiwan Semiconductor Manufacturing Co., Ltd.1 | | | 166,349,000 | | | | 708,558 | |
| Taiwan Semiconductor Manufacturing Co., Ltd. (ADR) | | | 1,234,900 | | | | 27,600 | |
| Other securities | | | | | | | 969,434 | |
| | | | | | | | 8,269,848 | |
| | | | | | | | | |
| Health care 7.53% | | | | | | | | |
| Merck & Co., Inc. | | | 44,948,227 | | | | 2,277,527 | |
| Pfizer Inc. | | | 43,625,000 | | | | 1,330,126 | |
| GlaxoSmithKline PLC1 | | | 44,865,000 | | | | 924,245 | |
| AstraZeneca PLC1 | | | 10,671,583 | | | | 682,698 | |
| Bristol-Myers Squibb Co. | | | 10,850,500 | | | | 674,467 | |
| Eli Lilly and Co. | | | 6,855,700 | | | | 542,286 | |
| Other securities | | | | | | | 467,048 | |
| | | | | | | | 6,898,397 | |
| The Income Fund of America | 7 |
| Common stocks (continued) | | Shares | | | Value
(000) | |
| Consumer discretionary 6.09% | | | | | | | | |
| McDonald’s Corp. | | | 16,506,815 | | | $ | 2,043,214 | |
| Target Corp. | | | 12,143,000 | | | | 879,396 | |
| Home Depot, Inc. | | | 5,595,000 | | | | 703,627 | |
| General Motors Co. | | | 14,742,512 | | | | 436,968 | |
| Other securities | | | | | | | 1,516,690 | |
| | | | | | | | 5,579,895 | |
| | | | | | | | | |
| Energy 4.70% | | | | | | | | |
| ConocoPhillips | | | 29,894,562 | | | | 1,168,280 | |
| Chevron Corp. | | | 10,920,000 | | | | 944,252 | |
| Spectra Energy Corp | | | 26,735,500 | | | | 733,890 | |
| BP PLC1 | | | 91,850,000 | | | | 497,667 | |
| Other securities | | | | | | | 958,356 | |
| | | | | | | | 4,302,445 | |
| | | | | | | | | |
| Telecommunication services 4.06% | | | | | | | | |
| Verizon Communications Inc. | | | 30,407,921 | | | | 1,519,484 | |
| Telstra Corp. Ltd.1 | | | 173,321,533 | | | | 696,196 | |
| Other securities | | | | | | | 1,502,817 | |
| | | | | | | | 3,718,497 | |
| | | | | | | | | |
| Materials 3.39% | | | | | | | | |
| Dow Chemical Co. | | | 18,957,976 | | | | 796,235 | |
| E.I. du Pont de Nemours and Co. | | | 14,124,268 | | | | 745,197 | |
| Other securities | | | | | | | 1,564,468 | |
| | | | | | | | 3,105,900 | |
| | | | | | | | | |
| Utilities 3.32% | | | | | | | | |
| Power Assets Holdings Ltd.1 | | | 73,605,500 | | | | 673,222 | |
| DTE Energy Co. | | | 5,275,000 | | | | 448,428 | |
| Duke Energy Corp. | | | 5,874,999 | | | | 442,387 | |
| EDP - Energias de Portugal, SA1 | | | 112,077,366 | | | | 391,797 | |
| Other securities | | | | | | | 1,080,497 | |
| | | | | | | | 3,036,331 | |
| | | | | | | | | |
| Miscellaneous 3.89% | | | | | | | | |
| Other common stocks in initial period of acquisition | | | | | | | 3,559,570 | |
| | | | | | | | | |
| Total common stocks (cost: $54,019,211,000) | | | | | | | 64,307,889 | |
| | | | | | | | | |
| Preferred securities 0.50% | | | | | | | | |
| Financials 0.50% | | | | | | | | |
| Wells Fargo & Co., Class A, Series Q, 5.85% depositary shares preferred noncumulative | | | 1,600,000 | | | | 41,360 | |
| Other securities | | | | | | | 414,361 | |
| | | | | | | | | |
| Total preferred securities (cost: $436,429,000) | | | | | | | 455,721 | |
| 8 | The Income Fund of America |
| Rights & warrants 0.00% | | Shares | | | Value
(000) | |
| Energy 0.00% | | | | | | | | |
| Other securities | | | | | | | — | |
| | | | | | | | | |
| Total rights & warrants (cost: $2,171,000) | | | | | | | — | |
| | | | | | | | | |
| Convertible stocks 0.59% | | | | | | | | |
| Other 0.25% | | | | | | | | |
| Other securities | | | | | | $ | 226,349 | |
| | | | | | | | | |
| Miscellaneous 0.34% | | | | | | | | |
| Other convertible stocks in initial period of acquisition | | | | | | | 307,838 | |
| | | | | | | | | |
| Total convertible stocks (cost: $772,184,000) | | | | | | | 534,187 | |
| | | | | | | | | |
| Convertible bonds 0.67% | | Principal amount
(000) | | | | | |
| Other 0.67% | | | | | | | | |
| Other securities | | | | | | | 616,231 | |
| | | | | | | | | |
| Total convertible bonds (cost: $810,924,000) | | | | | | | 616,231 | |
| | | | | | | | | |
| Bonds, notes & other debt instruments 22.84% | | | | | | | | |
| Corporate bonds & notes 14.38% | | | | | | | | |
| Chevron Corp. 1.96%–2.41% 2020–2022 | | $ | 10,100 | | | | 9,911 | |
| Coca-Cola Co. 1.80% 2016 | | | 10,000 | | | | 10,061 | |
| General Electric Capital Corp. 0.96%–6.00% 2016–20202 | | | 25,568 | | | | 26,024 | |
| General Electric Co. 2.70%–5.00% 2022–2049 | | | 216,599 | | | | 222,302 | |
| JPMorgan Chase & Co. 1.35%–3.25% 2017–2022 | | | 38,390 | | | | 38,329 | |
| JPMorgan Chase & Co., junior subordinated 5.30%–7.90% 2049 | | | 147,785 | | | | 151,412 | |
| Lockheed Martin Corp. 1.85%–4.70% 2018–2046 | | | 23,690 | | | | 24,381 | |
| McDonald’s Corp. 2.75%–4.88% 2020–2045 | | | 4,765 | | | | 4,837 | |
| Merck & Co., Inc. 1.10% 2018 | | | 6,710 | | | | 6,722 | |
| Microsoft Corp. 2.65%–4.20% 2022–2035 | | | 12,000 | | | | 12,204 | |
| Pfizer Inc. 7.20% 2039 | | | 1,353 | | | | 1,872 | |
| Philip Morris International Inc. 3.60%–4.25% 2023–2044 | | | 9,245 | | | | 9,690 | |
| Reynolds American Inc. 2.30%–6.15% 2018–2045 | | | 62,930 | | | | 67,777 | |
| Verizon Communications Inc. 3.00%–6.55% 2021–2048 | | | 219,587 | | | | 201,187 | |
| Wells Fargo & Co. 1.36%–4.90% 2016–20454 | | | 89,526 | | | | 94,408 | |
| Wells Fargo & Co., Series K, junior subordinated 7.98% (undated) | | | 86,566 | | | | 90,570 | |
| Other securities | | | | | | | 12,198,460 | |
| | | | | | | | 13,170,147 | |
| | | | | | | | | |
| U.S. Treasury bonds & notes 5.73% | | | | | | | | |
| U.S. Treasury 5.10% | | | | | | | | |
| U.S. Treasury 0.50% 2017 | | | 10,000 | | | | 9,986 | |
| U.S. Treasury 0.63%–6.25% 2016–20455 | | | 4,473,961 | | | | 4,656,837 | |
| | | | | | | | 4,666,823 | |
| | | | | | | | | |
| U.S. Treasury inflation-protected securities 0.63% | | | | | | | | |
| U.S. Treasury Inflation-Protected Securities 0.13%–1.38% 2024–20456 | | | 595,544 | | | | 582,119 | |
| | | | | | | | | |
| Total U.S. Treasury bonds & notes | | | | | | | 5,248,942 | |
| The Income Fund of America | 9 |
| Bonds, notes & other debt instruments (continued) | | Principal amount
(000) | | | Value
(000) | |
| Mortgage-backed obligations 2.09% | | | | | | | | |
| Fannie Mae 2.30%–9.73% 2018–20473,4,7 | | $ | 550,529 | | | $ | 592,561 | |
| Freddie Mac 1.68%–9.00% 2019–20463,4,7 | | | 433,891 | | | | 460,161 | |
| Other securities | | | | | | | 856,861 | |
| | | | | | | | 1,909,583 | |
| | | | | | | | | |
| Federal agency bonds & notes 0.10% | | | | | | | | |
| Fannie Mae 6.25%–7.13% 2029–2030 | | | 33,500 | | | | 47,399 | |
| Federal Home Loan Bank 5.50% 2036 | | | 100 | | | | 136 | |
| Freddie Mac 2.50% 2016 | | | 22,500 | | | | 22,642 | |
| Other securities | | | | | | | 18,892 | |
| | | | | | | | 89,069 | |
| | | | | | | | | |
| Other bonds & notes 0.54% | | | | | | | | |
| Other securities | | | | | | | 498,032 | |
| | | | | | | | | |
| Total bonds, notes & other debt instruments (cost: $21,740,717,000) | | | | | | | 20,915,773 | |
| | | | | | | | | |
| Short-term securities 5.55% | | | | | | | | |
| Coca-Cola Co. 0.47% due 5/18/20162 | | | 50,000 | | | | 49,921 | |
| Fannie Mae 0.20%–0.37% due 2/1/2016–5/11/2016 | | | 305,500 | | | | 305,363 | |
| Federal Home Loan Bank 0.15%–0.63% due 2/1/2016–1/26/2017 | | | 2,902,609 | | | | 2,900,585 | |
| Freddie Mac 0.15%–0.50% due 2/3/2016–6/16/2016 | | | 706,500 | | | | 706,224 | |
| U.S. Treasury Bills 0.21%–0.55% due 2/18/2016–6/16/2016 | | | 348,500 | | | | 348,380 | |
| Wells Fargo Bank, N.A. 0.47%–0.61% due 5/3/2016–5/23/2016 | | | 100,000 | | | | 99,964 | |
| Other securities | | | | | | | 677,054 | |
| | | | | | | | | |
| Total short-term securities (cost: $5,087,813,000) | | | | | | | 5,087,491 | |
| Total investment securities 100.37% (cost: $82,869,449,000) | | | | | | | 91,917,292 | |
| Other assets less liabilities (0.37)% | | | | | | | (338,386 | ) |
| | | | | | | | | |
| Net assets 100.00% | | | | | | $ | 91,578,906 | |
This summary investment portfolio is designed to streamline the report and help investors better focus on the fund’s principal holdings. See the inside back cover for details on how to obtain a complete schedule of portfolio holdings.
As permitted by U.S. Securities and Exchange Commission regulations, “Miscellaneous” securities include holdings in their first year of acquisition that have not previously been publicly disclosed.
“Other securities” includes all issues that are not disclosed separately in the summary investment portfolio. Some of these securities in “Other securities” (with an aggregate value of $24,546,000, an aggregate cost of $43,110,000, and which represented .03% of the net assets of the fund) were acquired on 5/2/2013 through private placement transactions exempt from registration under the Securities Act of 1933, which may subject them to legal or contractual restrictions on resale.
| 10 | The Income Fund of America |
Forward currency contracts
The fund has entered into forward currency contracts as shown in the following table. The average month-end notional amount of open forward currency contracts while held was $406,803,000.
| | | | | | | | | | | Unrealized | |
| | | | | | | | | | | (depreciation) | |
| | | | | | | Contract amount | | appreciation | |
| | | Settlement | | | | Receive | | Deliver | | at 1/31/2016 | |
| | | date | | Counterparty | | (000) | | (000) | | (000) | |
| Sales: | | | | | | | | | | | |
| Australian dollars | | 2/29/2016 | | JPMorgan Chase | | $97,101 | | A$142,200 | | | $(3,396 | ) |
| Australian dollars | | 3/3/2016 | | HSBC Bank | | $125,080 | | A$182,300 | | | (3,739 | ) |
| British pounds | | 3/2/2016 | | Barclays Bank PLC | | $32,356 | | £22,800 | | | (133 | ) |
| British pounds | | 3/3/2016 | | Bank of America, N.A. | | $68,041 | | £48,000 | | | (357 | ) |
| Euros | | 2/23/2016 | | Citibank | | $22,168 | | €20,346 | | | 115 | |
| Euros | | 3/3/2016 | | Bank of America, N.A. | | $3,824 | | €3,500 | | | 29 | |
| Euros | | 3/22/2016 | | UBS AG | | $107,903 | | €98,600 | | | 937 | |
| Japanese yen | | 3/1/2016 | | Bank of New York Mellon | | $12,218 | | ¥1,447,100 | | | 258 | |
| | | | | | | | | | | | $(6,286 | ) |
Investments in affiliates
A company is an affiliate of the fund under the Investment Company Act of 1940 if the fund’s holdings in that company represent 5% or more of the outstanding voting shares. The value of the fund’s holdings in affiliated companies is included in “Other securities” under the respective industry sectors in the summary investment portfolio. Further details on these holdings and related transactions during the six months ended January 31, 2016, appear below.
| | | Beginning | | | | | | | | | Ending | | | Dividend | | | Value of | |
| | | shares or | | | | | | | | | shares or | | | or interest | | | affiliates at | |
| | | principal | | | | | | | | | principal | | | income | | | 1/31/2016 | |
| | | amount | | | Additions | | | Reductions | | | amount | | | (000) | | | (000) | |
| Iron Mountain Inc. | | | 13,644,780 | | | | 80,000 | | | | — | | | | 13,724,780 | | | $ | 13,100 | | | $ | 377,980 | |
| Iron Mountain Inc. 6.00% 20202 | | | — | | | $ | 31,925,000 | | | | — | | | $ | 31,925,000 | | | | 654 | | | | 34,080 | |
| Iron Mountain Inc. 5.75% 2024 | | $ | 4,325,000 | | | | — | | | | — | | | $ | 4,325,000 | | | | 133 | | | | 4,287 | |
| Iron Mountain Inc. 6.00% 2023 | | $ | 950,000 | | | | — | | | | — | | | $ | 950,000 | | | | 29 | | | | 992 | |
| R.R. Donnelley & Sons Co. | | | 13,345,400 | | | | — | | | | — | | | | 13,345,400 | | | | 6,940 | | | | 186,435 | |
| R.R. Donnelley & Sons Co. 7.00% 2022 | | $ | 17,500,000 | | | | — | | | | — | | | $ | 17,500,000 | | | | 609 | | | | 16,472 | |
| R.R. Donnelley & Sons Co. 6.50% 2023 | | $ | 11,580,000 | | | $ | 6,300,000 | | | | — | | | $ | 17,880,000 | | | | 433 | | | | 15,801 | |
| R.R. Donnelley & Sons Co. 7.875% 2021 | | $ | 3,050,000 | | | $ | 11,395,000 | | | | — | | | $ | 14,445,000 | | | | 336 | | | | 14,274 | |
| R.R. Donnelley & Sons Co. 7.25% 2018 | | $ | 7,234,000 | | | $ | 2,000,000 | | | | — | | | $ | 9,234,000 | | | | 271 | | | | 9,673 | |
| R.R. Donnelley & Sons Co. 7.625% 2020 | | | — | | | $ | 8,750,000 | | | | — | | | $ | 8,750,000 | | | | 152 | | | | 8,838 | |
| Outfront Media Inc. | | | 9,064,824 | | | | — | | | | — | | | | 9,064,824 | | | | 6,164 | | | | 197,160 | |
| CBS Outdoor Americas Inc. 5.25% 2022 | | $ | 25,000,000 | | | $ | 4,500,000 | | | | — | | | $ | 29,500,000 | | | | 756 | | | | 30,274 | |
| The Income Fund of America | 11 |
| | | Beginning | | | | | | | | | Ending | | | Dividend | | | Value of | |
| | | shares or | | | | | | | | | shares or | | | or interest | | | affiliates at | |
| | | principal | | | | | | | | | principal | | | income | | | 1/31/2016 | |
| | | amount | | | Additions | | | Reductions | | | amount | | | (000) | | | (000) | |
| CBS Outdoor Americas Inc. 5.625% 2024 | | | — | | | $ | 10,146,000 | | | $ | 3,250,000 | | | $ | 6,896,000 | | | $ | 13 | | | $ | 7,077 | |
| Outfront Media Inc. 5.625% 20242 | | $ | 7,650,000 | | | | — | | | $ | 7,650,000 | | | | — | | | | 163 | | | | — | |
| TalkTalk Telecom Group PLC1 | | | 58,313,942 | | | | 107,949 | | | | — | | | | 58,421,891 | | | | 4,708 | | | | 183,979 | |
| Diebold, Inc. | | | 3,925,000 | | | | 297,000 | | | | — | | | | 4,222,000 | | | | 2,342 | | | | 117,034 | |
| Redwood Trust, Inc. | | | 5,079,717 | | | | 365,000 | | | | — | | | | 5,444,717 | | | | 2,947 | | | | 58,640 | |
| Rotech Healthcare Inc., Term Loan, 13.00% 20201,3,4,8,9 | | $ | 20,743,820 | | | $ | 1,182,656 | | | | — | | | $ | 21,926,476 | | | | 1,354 | | | | 18,847 | |
| Rotech Healthcare Inc., Term Loan A, 5.50% 20181,3,4,9 | | $ | 11,888,250 | | | | — | | | $ | 60,500 | | | $ | 11,827,750 | | | | 333 | | | | 11,496 | |
| Rotech Healthcare Inc., Term Loan B, 10.00% 20191,3,4,9 | | $ | 9,200,000 | | | | — | | | | — | | | $ | 9,200,000 | | | | 470 | | | | 9,154 | |
| Rotech Healthcare Inc.1,10 | | | 543,172 | | | | — | | | | — | | | | 543,172 | | | | — | | | | 4,079 | |
| NII Holdings, Inc., Class B10 | | | 7,992,669 | | | | — | | | | 700 | | | | 7,991,969 | | | | — | | | | 29,171 | |
| Douglas Dynamics, Inc. | | | 1,444,000 | | | | — | | | | — | | | | 1,444,000 | | | | 643 | | | | 28,678 | |
| Cliffs Natural Resources Inc. 8.25% 20202 | | $ | 7,475,000 | | | $ | 2,825,000 | | | | — | | | $ | 10,300,000 | | | | 439 | | | | 7,468 | |
| Cliffs Natural Resources Inc., Series A, 7.00% convertible preferred 2016 | | $ | 2,925,000 | | | | — | | | $ | 225,000 | | | $ | 2,700,000 | | | | 1,181 | | | | 3,861 | |
| Cliffs Natural Resources Inc. 4.875% 2021 | | $ | 4,945,000 | | | | — | | | | — | | | $ | 4,945,000 | | | | 129 | | | | 754 | |
| Baytex Energy Corp.11 | | | 12,060,956 | | | | 299,802 | | | | 12,360,758 | | | | — | | | | 932 | | | | — | |
| Baytex Energy Corp. 5.125% 20212,11 | | $ | 10,050,000 | | | | — | | | | — | | | $ | 10,050,000 | | | | 280 | | | | — | |
| Baytex Energy Corp. 5.625% 20242,11 | | $ | 3,450,000 | | | | — | | | | — | | | $ | 3,450,000 | | | | 101 | | | | — | |
| | | | | | | | | | | | | | | | | | | $ | 45,612 | | | $ | 1,376,504 | |
| 12 | The Income Fund of America |
The following footnotes apply to either the individual securities noted or one or more of the securities aggregated and listed as a single line item.
| 1 | Valued under fair value procedures adopted by authority of the board of trustees. The total value of all such securities, including those in “Miscellaneous” and “Other securities,” was $13,707,622,000, which represented 14.97% of the net assets of the fund. This amount includes $13,573,579,000 related to certain securities trading outside the U.S. whose values were adjusted as a result of significant market movements following the close of local trading. |
| 2 | Acquired in a transaction exempt from registration under Rule 144A or Section 4(2) of the Securities Act of 1933. May be resold in the U.S. in transactions exempt from registration, normally to qualified institutional buyers. The total value of all such securities, including those in “Other securities,” was $5,308,141,000, which represented 5.80% of the net assets of the fund. |
| 3 | Principal payments may be made periodically. Therefore, the effective maturity date may be earlier than the stated maturity date. |
| 4 | Coupon rate may change periodically. |
| 5 | A portion of this security was pledged as collateral. The total value of pledged collateral was $6,917,000, which represented .01% of the net assets of the fund. |
| 6 | Index-linked bond whose principal amount moves with a government price index. |
| 7 | Purchased on a TBA basis. |
| 8 | Payment in kind; the issuer has the option of paying additional securities in lieu of cash. |
| 9 | Loan participations and assignments; may be subject to legal or contractual restrictions on resale. The total value of all such loans was $406,320,000, which represented .44% of the net assets of the fund. |
| 10 | Security did not produce income during the last 12 months. |
| 11 | Unaffiliated issuer at 1/31/2016. |
Key to abbreviations and symbols
ADR = American Depositary Receipts
TBA = To-be-announced
A$ = Australian dollars
€ = Euros
£ = British pounds
¥ = Japanese yen
See Notes to Financial Statements
| The Income Fund of America | 13 |
Financial statements
| Statement of assets and liabilities | unaudited |
| at January 31, 2016 | (dollars in thousands) |
| Assets: | | | | | | | | |
| Investment securities, at value: | | | | | | | | |
| Unaffiliated issuers (cost: $81,049,739) | | $ | 90,540,788 | | | | | |
| Affiliated issuers (cost: $1,819,710) | | | 1,376,504 | | | $ | 91,917,292 | |
| Cash denominated in currencies other than U.S. dollars (cost: $1,920) | | | | | | | 1,920 | |
| Cash | | | | | | | 485 | |
| Unrealized appreciation on open forward currency contracts | | | | | | | 1,339 | |
| Receivables for: | | | | | | | | |
| Sales of investments | | | 936,932 | | | | | |
| Sales of fund’s shares | | | 90,231 | | | | | |
| Closed forward currency contracts | | | 55 | | | | | |
| Dividends and interest | | | 384,060 | | | | | |
| Other | | | 2,397 | | | | 1,413,675 | |
| | | | | | | | 93,334,711 | |
| Liabilities: | | | | | | | | |
| Unrealized depreciation on open forward currency contracts | | | | | | | 7,625 | |
| Payables for: | | | | | | | | |
| Purchases of investments | | | 1,617,962 | | | | | |
| Repurchases of fund’s shares | | | 78,664 | | | | | |
| Closed forward currency contracts | | | 81 | | | | | |
| Investment advisory services | | | 14,084 | | | | | |
| Services provided by related parties | | | 29,142 | | | | | |
| Trustees’ deferred compensation | | | 4,064 | | | | | |
| Other | | | 4,183 | | | | 1,748,180 | |
| Net assets at January 31, 2016 | | | | | | $ | 91,578,906 | |
| | | | | | | | | |
| Net assets consist of: | | | | | | | | |
| Capital paid in on shares of beneficial interest | | | | | | $ | 82,475,800 | |
| Undistributed net investment income | | | | | | | 365,139 | |
| Accumulated net realized loss | | | | | | | (302,578 | ) |
| Net unrealized appreciation | | | | | | | 9,040,545 | |
| Net assets at January 31, 2016 | | | | | | $ | 91,578,906 | |
See Notes to Financial Statements
| 14 | The Income Fund of America |
(dollars and shares in thousands, except per-share amounts)
Shares of beneficial interest issued and outstanding (no stated par value) —
unlimited shares authorized (4,638,238 total shares outstanding)
| | | | | | Shares | | | Net asset value | |
| | | Net assets | | | outstanding | | | per share | |
| Class A | | $ | 68,651,198 | | | | 3,473,212 | | | $ | 19.77 | |
| Class B | | | 188,216 | | | | 9,580 | | | | 19.65 | |
| Class C | | | 5,795,358 | | | | 296,783 | | | | 19.53 | |
| Class F-1 | | | 3,957,017 | | | | 200,658 | | | | 19.72 | |
| Class F-2 | | | 4,042,836 | | | | 204,658 | | | | 19.75 | |
| Class 529-A | | | 1,387,057 | | | | 70,310 | | | | 19.73 | |
| Class 529-B | | | 12,135 | | | | 616 | | | | 19.71 | |
| Class 529-C | | | 425,494 | | | | 21,656 | | | | 19.65 | |
| Class 529-E | | | 59,408 | | | | 3,020 | | | | 19.67 | |
| Class 529-F-1 | | | 53,139 | | | | 2,694 | | | | 19.73 | |
| Class R-1 | | | 123,948 | | | | 6,310 | | | | 19.64 | |
| Class R-2 | | | 533,296 | | | | 27,271 | | | | 19.56 | |
| Class R-2E | | | 4,663 | | | | 236 | | | | 19.74 | |
| Class R-3 | | | 1,133,606 | | | | 57,568 | | | | 19.69 | |
| Class R-4 | | | 1,085,578 | | | | 55,013 | | | | 19.73 | |
| Class R-5E | | | 9 | | | | 1 | | | | 19.76 | |
| Class R-5 | | | 561,966 | | | | 28,431 | | | | 19.77 | |
| Class R-6 | | | 3,563,982 | | | | 180,221 | | | | 19.78 | |
See Notes to Financial Statements
| The Income Fund of America | 15 |
| Statement of operations | unaudited |
| for the six months ended January 31, 2016 | (dollars in thousands) |
| Investment income: | | | | | | | | |
| Income: | | | | | | | | |
| Dividends (net of non-U.S. taxes of $2,501; also includes $38,956 from affiliates) | | $ | 1,136,738 | | | | | |
| Interest (includes $6,656 from affiliates) | | | 491,088 | | | $ | 1,627,826 | |
| Fees and expenses*: | | | | | | | | |
| Investment advisory services | | | 99,815 | | | | | |
| Distribution services | | | 130,965 | | | | | |
| Transfer agent services | | | 37,388 | | | | | |
| Administrative services | | | 9,302 | | | | | |
| Reports to shareholders | | | 1,761 | | | | | |
| Registration statement and prospectus | | | 1,194 | | | | | |
| Trustees’ compensation | | | 21 | | | | | |
| Auditing and legal | | | 1,482 | | | | | |
| Custodian | | | 1,416 | | | | | |
| Other | | | 965 | | | | 284,309 | |
| Net investment income | | | | | | | 1,343,517 | |
| | | | | | | | | |
| Net realized loss and unrealized depreciation: | | | | | | | | |
| Net realized (loss) gain on: | | | | | | | | |
| Investments (includes $315,327 net loss from affiliates) | | | (296,692 | ) | | | | |
| Forward currency contracts | | | 24,487 | | | | | |
| Currency transactions | | | (7,841 | ) | | | (280,046 | ) |
| Net unrealized depreciation on: | | | | | | | | |
| Investments (net of non-U.S. taxes of $118) | | | (4,932,157 | ) | | | | |
| Forward currency contracts | | | (12,239 | ) | | | | |
| Currency translations | | | (277 | ) | | | (4,944,673 | ) |
| Net realized loss and unrealized depreciation | | | | | | | (5,224,719 | ) |
| | | | | | | | | |
| Net decrease in net assets resulting from operations | | | | | | $ | (3,881,202 | ) |
*Additional information related to class-specific fees and expenses is included in the Notes to Financial Statements.
See Notes to Financial Statements
| 16 | The Income Fund of America |
| Statements of changes in net assets | |
| | (dollars in thousands) |
| | | Six months ended | | | Year ended | |
| | | January 31,
2016* | | | July 31,
2015 | |
| Operations: | | | | | | | | |
| Net investment income | | $ | 1,343,517 | | | $ | 3,032,727 | |
| Net realized (loss) gain | | | (280,046 | ) | | | 3,852,401 | |
| Net unrealized depreciation | | | (4,944,673 | ) | | | (4,115,199 | ) |
| Net (decrease) increase in net assets resulting from operations | | | (3,881,202 | ) | | | 2,769,929 | |
| | | | | | | | | |
| Dividends and distributions paid to shareholders: | | | | | | | | |
| Dividends from net investment income | | | (1,470,494 | ) | | | (3,456,253 | ) |
| Distributions from net realized gain on investments | | | (1,680,491 | ) | | | — | |
| Total dividends and distributions paid to shareholders | | | (3,150,985 | ) | | | (3,456,253 | ) |
| | | | | | | | | |
| Net capital share transactions | | | 1,619,082 | | | | 3,840,273 | |
| | | | | | | | | |
| Total (decrease) increase in net assets | | | (5,413,105 | ) | | | 3,153,949 | |
| | | | | | | | | |
| Net assets: | | | | | | | | |
| Beginning of period | | | 96,992,011 | | | | 93,838,062 | |
| End of period (including undistributed net investment income: $365,139 and $492,116, respectively) | | $ | 91,578,906 | | | $ | 96,992,011 | |
*Unaudited.
See Notes to Financial Statements
| The Income Fund of America | 17 |
| Notes to financial statements | unaudited |
1. Organization
The Income Fund of America (the "fund") is registered under the Investment Company Act of 1940 as an open-end, diversified management investment company. The fund seeks current income while secondarily striving for capital growth.
The fund has 18 share classes consisting of five retail share classes (Classes A, B and C, as well as two F share classes, F-1 and F-2), five 529 college savings plan share classes (Classes 529-A, 529-B, 529-C, 529-E and 529-F-1) and eight retirement plan share classes (Classes R-1, R-2, R-2E, R-3, R-4, R-5E, R-5 and R-6). The 529 college savings plan share classes can be used to save for college education. The retirement plan share classes are generally offered only through eligible employer-sponsored retirement plans. The fund’s share classes are described further in the following table:
| Share class | | Initial sales charge | | Contingent deferred sales
charge upon redemption | | Conversion feature | |
| Classes A and 529-A | | Up to 5.75% | | None (except 1% for certain redemptions within one year of purchase without an initial sales charge) | | None | |
| Classes B and 529-B* | | None | | Declines from 5% to 0% for redemptions within six years of purchase | | Classes B and 529-B convert to Classes A and 529-A, respectively, after eight years | |
| Class C | | None | | 1% for redemptions within one year of purchase | | Class C converts to Class F-1 after 10 years | |
| Class 529-C | | None | | 1% for redemptions within one year of purchase | | None | |
| Class 529-E | | None | | None | | None | |
| Classes F-1, F-2 and 529-F-1 | | None | | None | | None | |
| Classes R-1, R-2, R-2E, R-3, R-4, R-5E, R-5 and R-6 | | None | | None | | None | |
*Class B and 529-B shares of the fund are not available for purchase.
On November 20, 2015, the fund made an additional retirement plan share class (Class R-5E) available for sale pursuant to an amendment to its registration statement filed with the U.S. Securities and Exchange Commission. Refer to the fund’s prospectus for more details.
Holders of all share classes have equal pro rata rights to the assets, dividends and liquidation proceeds of the fund. Each share class has identical voting rights, except for the exclusive right to vote on matters affecting only its class. Share classes have different fees and expenses (“class-specific fees and expenses”), primarily due to different arrangements for distribution, transfer agent and administrative services. Differences in class-specific fees and expenses will result in differences in net investment income and, therefore, the payment of different per-share dividends by each share class.
| 18 | The Income Fund of America |
2. Significant accounting policies
The fund is an investment company that applies the accounting and reporting guidance issued in Topic 946 by the U.S. Financial Accounting Standards Board. The fund’s financial statements have been prepared to comply with U.S. generally accepted accounting principles (“U.S. GAAP“). These principles require the fund’s investment adviser to make estimates and assumptions that affect reported amounts and disclosures. Actual results could differ from those estimates. Subsequent events, if any, have been evaluated through the date of issuance in the preparation of the financial statements. The fund follows the significant accounting policies described in this section, as well as the valuation policies described in the next section on valuation.
Security transactions and related investment income — Security transactions are recorded by the fund as of the date the trades are executed with brokers. Realized gains and losses from security transactions are determined based on the specific identified cost of the securities. In the event a security is purchased with a delayed payment date, the fund will segregate liquid assets sufficient to meet its payment obligations. Dividend income is recognized on the ex-dividend date and interest income is recognized on an accrual basis. Market discounts, premiums and original issue discounts on fixed-income securities are amortized daily over the expected life of the security.
Class allocations — Income, fees and expenses (other than class-specific fees and expenses) and realized and unrealized gains and losses are allocated daily among the various share classes based on their relative net assets. Class-specific fees and expenses, such as distribution, transfer agent and administrative services, are charged directly to the respective share class.
Dividends and distributions to shareholders — Dividends and distributions to shareholders are recorded on the ex-dividend date.
Currency translation — Assets and liabilities, including investment securities, denominated in currencies other than U.S. dollars are translated into U.S. dollars at the exchange rates supplied by one or more pricing vendors on the valuation date. Purchases and sales of investment securities and income and expenses are translated into U.S. dollars at the exchange rates on the dates of such transactions. The effects of changes in exchange rates on investment securities are included with the net realized gain or loss and net unrealized appreciation or depreciation on investments in the fund’s statement of operations. The realized gain or loss and unrealized appreciation or depreciation resulting from all other transactions denominated in currencies other than U.S. dollars are disclosed separately.
| The Income Fund of America | 19 |
3. Valuation
Capital Research and Management Company (“CRMC”), the fund’s investment adviser, values the fund’s investments at fair value as defined by U.S. GAAP. The net asset value of each share class of the fund is generally determined as of approximately 4:00 p.m. New York time each day the New York Stock Exchange is open.
Methods and inputs — The fund’s investment adviser uses the following methods and inputs to establish the fair value of the fund’s assets and liabilities. Use of particular methods and inputs may vary over time based on availability and relevance as market and economic conditions evolve.
Equity securities are generally valued at the official closing price of, or the last reported sale price on, the exchange or market on which such securities are traded, as of the close of business on the day the securities are being valued or, lacking any sales, at the last available bid price. Prices for each security are taken from the principal exchange or market on which the security trades.
Fixed-income securities, including short-term securities, are generally valued at prices obtained from one or more pricing vendors. Vendors value such securities based on one or more of the inputs described in the following table. The table provides examples of inputs that are commonly relevant for valuing particular classes of fixed-income securities in which the fund is authorized to invest. However, these classifications are not exclusive, and any of the inputs may be used to value any other class of fixed-income security.
| Fixed-income class | | Examples of standard inputs |
| All | | Benchmark yields, transactions, bids, offers, quotations from dealers and trading systems, new issues, spreads and other relationships observed in the markets among comparable securities; and proprietary pricing models such as yield measures calculated using factors such as cash flows, financial or collateral performance and other reference data (collectively referred to as “standard inputs”) |
| Corporate bonds & notes; convertible securities | | Standard inputs and underlying equity of the issuer |
| Bonds & notes of governments & government agencies | | Standard inputs and interest rate volatilities |
| Mortgage-backed; asset-backed obligations | | Standard inputs and cash flows, prepayment information, default rates, delinquency and loss assumptions, collateral characteristics, credit enhancements and specific deal information |
| Municipal securities | | Standard inputs and, for certain distressed securities, cash flows or liquidation values using a net present value calculation based on inputs that include, but are not limited to, financial statements and debt contracts |
| 20 | The Income Fund of America |
When the fund’s investment adviser deems it appropriate to do so (such as when vendor prices are unavailable or deemed to be not representative), fixed-income securities will be valued in good faith at the mean quoted bid and ask prices that are reasonably and timely available (or bid prices, if ask prices are not available) or at prices for securities of comparable maturity, quality and type.
Securities with both fixed-income and equity characteristics, or equity securities traded principally among fixed-income dealers, are generally valued in the manner described for either equity or fixed-income securities, depending on which method is deemed most appropriate by the fund’s investment adviser. Forward currency contracts are valued at the mean of representative quoted bid and ask prices, generally based on prices supplied by one or more pricing vendors.
Securities and other assets for which representative market quotations are not readily available or are considered unreliable by the fund’s investment adviser are fair valued as determined in good faith under fair valuation guidelines adopted by authority of the fund’s board of trustees as further described. The investment adviser follows fair valuation guidelines, consistent with U.S. Securities and Exchange Commission rules and guidance, to consider relevant principles and factors when making fair value determinations. The investment adviser considers relevant indications of value that are reasonably and timely available to it in determining the fair value to be assigned to a particular security, such as the type and cost of the security; contractual or legal restrictions on resale of the security; relevant financial or business developments of the issuer; actively traded similar or related securities; conversion or exchange rights on the security; related corporate actions; significant events occurring after the close of trading in the security; and changes in overall market conditions. In addition, the closing prices of equity securities that trade in markets outside U.S. time zones may be adjusted to reflect significant events that occur after the close of local trading but before the net asset value of each share class of the fund is determined. Fair valuations and valuations of investments that are not actively trading involve judgment and may differ materially from valuations that would have been used had greater market activity occurred.
Processes and structure — The fund’s board of trustees has delegated authority to the fund’s investment adviser to make fair value determinations, subject to board oversight. The investment adviser has established a Joint Fair Valuation Committee (the “Fair Valuation Committee”) to administer, implement and oversee the fair valuation process, and to make fair value decisions. The Fair Valuation Committee regularly reviews its own fair value decisions, as well as decisions made under its standing instructions to the investment adviser’s valuation teams. The Fair Valuation Committee reviews changes in fair value measurements from period to period and may, as deemed appropriate, update the fair valuation guidelines to better reflect the results of back testing and address new or evolving issues. The Fair Valuation Committee reports any changes to the fair valuation guidelines to the board of trustees with supplemental information to support the changes. The fund’s board and audit committee also regularly review reports that describe fair value determinations and methods.
| The Income Fund of America | 21 |
The fund’s investment adviser has also established a Fixed-Income Pricing Review Group to administer and oversee the fixed-income valuation process, including the use of fixed-income pricing vendors. This group regularly reviews pricing vendor information and market data. Pricing decisions, processes and controls over security valuation are also subject to additional internal reviews, including an annual control self-evaluation program facilitated by the investment adviser’s compliance group.
Classifications — The fund’s investment adviser classifies the fund’s assets and liabilities into three levels based on the inputs used to value the assets or liabilities. Level 1 values are based on quoted prices in active markets for identical securities. Level 2 values are based on significant observable market inputs, such as quoted prices for similar securities and quoted prices in inactive markets. Certain securities trading outside the U.S. may transfer between Level 1 and Level 2 due to valuation adjustments resulting from significant market movements following the close of local trading. Level 3 values are based on significant unobservable inputs that reflect the investment adviser’s determination of assumptions that market participants might reasonably use in valuing the securities. The valuation levels are not necessarily an indication of the risk or liquidity associated with the underlying investment. For example, U.S. government securities are reflected as Level 2 because the inputs used to determine fair value may not always be quoted prices in an active market. The following tables present the fund’s valuation levels as of January 31, 2016 (dollars in thousands):
| | | Investment securities |
| | | Level 1 | | | Level 2* | | | Level 3 | | | Total | |
| Assets: | | | | | | | | | | | | | | | | |
| Common stocks: | | | | | | | | | | | | | | | | |
| Industrials | | $ | 7,354,973 | | | $ | 1,724,174 | | | $ | 2 | | | $ | 9,079,149 | |
| Consumer staples | | | 7,498,008 | | | | 977,421 | | | | — | | | | 8,475,429 | |
| Financials | | | 7,735,672 | | | | 546,756 | | | | — | | | | 8,282,428 | |
| Information technology | | | 7,468,162 | | | | 801,686 | | | | — | | | | 8,269,848 | |
| Health care | | | 5,000,641 | | | | 1,893,677 | | | | 4,079 | | | | 6,898,397 | |
| Consumer discretionary | | | 4,771,565 | | | | 808,330 | | | | — | | | | 5,579,895 | |
| Energy | | | 3,413,009 | | | | 889,436 | | | | — | | | | 4,302,445 | |
| Telecommunication services | | | 1,842,928 | | | | 1,875,569 | | | | — | | | | 3,718,497 | |
| Materials | | | 2,496,805 | | | | 609,095 | | | | — | | | | 3,105,900 | |
| Utilities | | | 1,343,784 | | | | 1,692,547 | | | | — | | | | 3,036,331 | |
| Miscellaneous | | | 1,765,962 | | | | 1,770,740 | | | | 22,868 | | | | 3,559,570 | |
| Preferred securities | | | 455,721 | | | | — | | | | — | | | | 455,721 | |
| Convertible stocks | | | 509,641 | | | | 24,546 | | | | — | | | | 534,187 | |
| Convertible bonds | | | — | | | | 616,231 | | | | — | | | | 616,231 | |
| Bonds, notes & other debt instruments: | | | | | | | | | | | | | | | | |
| Corporate bonds & notes | | | — | | | | 13,118,296 | | | | 51,851 | | | | 13,170,147 | |
| U.S. Treasury bonds & notes | | | — | | | | 5,248,942 | | | | — | | | | 5,248,942 | |
| Mortgage-backed obligations | | | — | | | | 1,909,583 | | | | — | | | | 1,909,583 | |
| Other | | | — | | | | 587,101 | | | | — | | | | 587,101 | |
| Short-term securities | | | — | | | | 5,087,491 | | | | — | | | | 5,087,491 | |
| Total | | $ | 51,656,871 | | | $ | 40,181,621 | | | $ | 78,800 | | | $ | 91,917,292 | |
| 22 | The Income Fund of America |
| | | Other investments† |
| | | Level 1 | | | Level 2 | | | Level 3 | | | Total | |
| Assets: | | | | | | | | | | | | | | | | |
| Unrealized appreciation on open forward currency contracts | | $ | — | | | $ | 1,339 | | | $ | — | | | $ | 1,339 | |
| Liabilities: | | | | | | | | | | | | | | | | |
| Unrealized depreciation on open forward currency contracts | | | — | | | | (7,625 | ) | | | — | | | | (7,625 | ) |
| Total | | $ | — | | | $ | (6,286 | ) | | $ | — | | | $ | (6,286 | ) |
| * | Securities with a value of $12,702,478,000, which represented 13.87% of the net assets of the fund, transferred from Level 1 to Level 2 since the prior fiscal year-end, primarily due to significant market movements following the close of local trading. |
| † | Forward currency contracts are not included in the investment portfolio. |
4. Risk factors
Investing in the fund may involve certain risks including, but not limited to, those described below.
Market conditions — The prices of, and the income generated by, the common stocks and other securities held by the fund may decline — sometimes rapidly or unpredictably — due to various factors, including events or conditions affecting the general economy or particular industries; overall market changes; local, regional or global political, social or economic instability; governmental or governmental agency responses to economic conditions; and currency exchange rate, interest rate and commodity price fluctuations.
Issuer risks — The prices of, and the income generated by, securities held by the fund may decline in response to various factors directly related to the issuers of such securities, including reduced demand for an issuer’s goods or services, poor management performance and strategic initiatives such as mergers, acquisitions or dispositions and the market response to any such initiatives.
Investing in income-oriented stocks — Income provided by the fund may be reduced by changes in the dividend policies of, and the capital resources available for dividend payments at, the companies in which the fund invests.
Investing in debt instruments — The prices of, and the income generated by, bonds and other debt securities held by the fund may be affected by changing interest rates and by changes in the effective maturities and credit ratings of these securities.
Rising interest rates will generally cause the prices of bonds and other debt securities to fall. Falling interest rates may cause an issuer to redeem, call or refinance a debt security before its stated maturity, which may result in the fund having to reinvest the proceeds in
| The Income Fund of America | 23 |
lower yielding securities. Longer maturity debt securities generally have greater sensitivity to changes in interest rates and may be subject to greater price fluctuations than shorter maturity debt securities.
Bonds and other debt securities are also subject to credit risk, which is the possibility that the credit strength of an issuer will weaken and/or an issuer of a debt security will fail to make timely payments of principal or interest and the security will go into default. Lower quality debt securities generally have higher rates of interest and may be subject to greater price fluctuations than higher quality debt securities. Credit risk is gauged, in part, by the credit ratings of the debt securities in which the fund invests. However, ratings are only the opinions of the rating agencies issuing them and are not guarantees as to credit quality or an evaluation of market risk. The fund’s investment adviser relies on its own credit analysts to research issuers and issues in seeking to mitigate various credit and default risks.
Investing in lower rated debt instruments — Lower rated bonds and other lower rated debt securities generally have higher rates of interest and involve greater risk of default or price declines due to changes in the issuer’s creditworthiness than those of higher quality debt securities. The market prices of these securities may fluctuate more than the prices of higher quality debt securities and may decline significantly in periods of general economic difficulty. These risks may be increased with respect to investments in junk bonds.
Investing outside the U.S. — Securities of issuers domiciled outside the U.S., or with significant operations or revenues outside the U.S., may lose value because of adverse political, social, economic or market developments (including social instability, regional conflicts, terrorism and war) in the countries or regions in which the issuers operate or generate revenue. These securities may also lose value due to changes in foreign currency exchange rates against the U.S. dollar and/or currencies of other countries. Issuers of these securities may be more susceptible to actions of foreign governments, such as the imposition of price controls or punitive taxes, that could adversely impact revenues. Securities markets in certain countries may be more volatile and/or less liquid than those in the U.S. Investments outside the U.S. may also be subject to different accounting practices and different regulatory, legal and reporting standards and practices, and may be more difficult to value, than those in the U.S. In addition, the value of investments outside the U.S. may be reduced by foreign taxes, including foreign withholding taxes on interest and dividends. Further, there may be increased risks of delayed settlement of securities purchased or sold by the fund. The risks of investing outside the U.S. may be heightened in connection with investments in emerging markets.
Management — The investment adviser to the fund actively manages the fund’s investments. Consequently, the fund is subject to the risk that the methods and analyses employed by the investment adviser in this process may not produce the desired results. This could cause the fund to lose value or its investment results to lag relevant benchmarks or other funds with similar objectives.
| 24 | The Income Fund of America |
5. Certain investment techniques
Mortgage dollar rolls — The fund has entered into mortgage dollar roll transactions in which the fund sells a mortgage-backed security to a counterparty and simultaneously enters into an agreement with the same counterparty to buy back a similar security on a specific future date at a predetermined price. Mortgage dollar rolls are accounted for as purchase and sale transactions, which may increase the fund’s portfolio turnover rate.
Loan transactions — The fund has entered into loan transactions in which the fund acquires a loan either through an agent, by assignment from another holder, or as a participation interest in another holder’s portion of a loan. The loan is often administered by a financial institution that acts as agent for the holders of the loan, and the fund may be required to receive approval from the agent and/or borrower prior to the sale of the investment. The loan’s interest rate and maturity date may change based on the terms of the loan, including potential early payments of principal.
Forward currency contracts — The fund has entered into forward currency contracts, which represent agreements to exchange currencies on specific future dates at predetermined rates. The fund’s investment adviser uses forward currency contracts to manage the fund’s exposure to changes in exchange rates. Upon entering into these contracts, risks may arise from the potential inability of counterparties to meet the terms of their contracts and from possible movements in exchange rates.
On a daily basis, the fund’s investment adviser values forward currency contracts and records unrealized appreciation or depreciation for open forward currency contracts in the fund’s statement of assets and liabilities. Realized gains or losses are recorded at the time the forward currency contract is closed or offset by another contract with the same broker for the same settlement date and currency.
Closed forward currency contracts that have not reached their settlement date are included in the respective receivables or payables for closed forward currency contracts in the fund’s statement of assets and liabilities. Net realized gains or losses from closed forward currency contracts and net unrealized appreciation or depreciation from open forward currency contracts are recorded in the fund’s statement of operations.
| The Income Fund of America | 25 |
The following tables present the financial statement impacts resulting from the fund’s use of forward currency contracts as of, or for the six months ended, January 31, 2016 (dollars in thousands):
| | | | | Assets | | | Liabilities |
| Contract | | Risk type | | Location on statement of
assets and liabilities | | Value | | | Location on statement of
assets and liabilities | | Value | |
| Forward currency | | Currency | | Unrealized appreciation on open forward currency contracts | | $ | 1,339 | | | Unrealized depreciation on open forward currency contracts | | $ | 7,625 | |
| | | | | | | | | | | | | | | |
| Forward currency | | Currency | | Receivables for closed forward currency contracts | | | 55 | | | Payables for closed forward currency contracts | | | 81 | |
| | | | | | | $ | 1,394 | | | | | $ | 7,706 | |
| | | | | | | | | | | | | | | |
| | | | | Net realized gain | | | Net unrealized depreciation |
| Contract | | Risk type | | Location on statement of
operations | | Value | | | Location on statement of
operations | | Value | |
| Forward currency | | Currency | | Net realized gain on forward currency contracts | | $ | 24,487 | | | Net unrealized depreciation on forward currency contracts | | $ | (12,239 | ) |
Collateral — The fund participates in a collateral program due to its use of forward currency contracts. The program calls for the fund to either receive or pledge collateral based on the net gain or loss on unsettled forward currency contracts by counterparty. The purpose of the collateral is to cover potential losses that could occur in the event that either party cannot meet its contractual obligations.
Rights of offset — The fund has entered into enforceable master netting agreements with certain counterparties for forward currency contracts, where on any date amounts payable by each party to the other (in the same currency with respect to the same transaction) may be closed or offset by each party’s payment obligation. If an early termination date occurs under these agreements following an event of default or termination event, all obligations of each party to its counterparty are settled net through a single payment in a single currency (“close-out netting”). For financial reporting purposes, the fund does not offset financial assets and financial liabilities that are subject to these master netting arrangements in the statement of assets and liabilities.
| 26 | The Income Fund of America |
The following table presents the fund’s forward currency contracts by counterparty that are subject to master netting agreements but that are not offset in the fund’s statement of assets and liabilities. The net amount column shows the impact of offsetting on the fund’s statement of assets and liabilities as of January 31, 2016 (dollars in thousands) if close-out netting was exercised:
| | | Gross amounts
recognized in the | | | Gross amounts not offset in the
statement of assets and liabilities and
subject to a master netting agreement | | | | | |
| Counterparty | | statement of assets
and liabilities | | | Available
to offset | | | Non-cash
collateral* | | | Cash
collateral | | | Net
amount | |
| Assets: | | | | | | | | | | | | | | | | | | | | |
| Bank of America, N.A. | | $ | 29 | | | $ | (29 | ) | | $ | — | | | $ | — | | | $ | — | |
| Bank of New York Mellon | | | 258 | | | | — | | | | — | | | | — | | | | 258 | |
| Citibank | | | 115 | | | | — | | | | — | | | | — | | | | 115 | |
| UBS AG | | | 992 | | | | — | | | | (582 | ) | | | — | | | | 410 | |
| Total | | $ | 1,394 | | | $ | (29 | ) | | $ | (582 | ) | | $ | — | | | $ | 783 | |
| Liabilities: | | | | | | | | | | | | | | | | | | | | |
| Bank of America, N.A. | | $ | 358 | | | $ | (29 | ) | | $ | (329 | ) | | $ | — | | | $ | — | |
| Barclays Bank PLC | | | 214 | | | | — | | | | (214 | ) | | | — | | | | — | |
| HSBC Bank | | | 3,738 | | | | — | | | | (2,590 | ) | | | — | | | | 1,148 | |
| JPMorgan Chase | | | 3,396 | | | | — | | | | (2,506 | ) | | | — | | | | 890 | |
| Total | | $ | 7,706 | | | $ | (29 | ) | | $ | (5,639 | ) | | $ | — | | | $ | 2,038 | |
*Non-cash collateral is shown on a settlement basis.
6. Taxation and distributions
Federal income taxation — The fund complies with the requirements under Subchapter M of the Internal Revenue Code applicable to mutual funds and intends to distribute substantially all of its net taxable income and net capital gains each year. The fund is not subject to income taxes to the extent such distributions are made. Therefore, no federal income tax provision is required.
As of and during the period ended January 31, 2016, the fund did not have a liability for any unrecognized tax benefits. The fund recognizes interest and penalties, if any, related to unrecognized tax benefits as income tax expense in the statement of operations. During the period, the fund did not incur any interest or penalties.
The fund is not subject to examination by U.S. federal tax authorities for tax years before 2011 and by state tax authorities for tax years before 2010.
Non-U.S. taxation — Dividend and interest income are recorded net of non-U.S. taxes paid. The fund may file withholding tax reclaims in certain jurisdictions to recover a portion of amounts previously withheld. As a result of rulings from European courts, the fund filed for additional reclaims related to prior years. These reclaims are recorded when the amount is known and there are no significant uncertainties on collectability. Gains
| The Income Fund of America | 27 |
realized by the fund on the sale of securities in certain countries are subject to non-U.S. taxes. The fund records a liability based on unrealized gains to provide for potential non-U.S. taxes payable upon the sale of these securities.
Distributions — Distributions paid to shareholders are based on net investment income and net realized gains determined on a tax basis, which may differ from net investment income and net realized gains for financial reporting purposes. These differences are due primarily to different treatment for items such as currency gains and losses; short-term capital gains and losses; capital losses related to sales of certain securities within 30 days of purchase; unrealized appreciation of certain investments in securities outside the U.S.; deferred expenses; and income on certain investments. The fiscal year in which amounts are distributed may differ from the year in which the net investment income and net realized gains are recorded by the fund for financial reporting purposes.
The components of distributable earnings on a tax basis are reported as of the fund’s most recent year-end. As of July 31, 2015, the components of distributable earnings on a tax basis were as follows (dollars in thousands):
| Undistributed ordinary income | | $ | 501,041 | |
| Undistributed long-term capital gains | | | 1,677,798 | |
As of January 31, 2016, the tax basis unrealized appreciation (depreciation) and cost of investment securities were as follows (dollars in thousands):
| Gross unrealized appreciation on investment securities | | $ | 14,005,246 | |
| Gross unrealized depreciation on investment securities | | | (4,998,608 | ) |
| Net unrealized appreciation on investment securities | | | 9,006,638 | |
| Cost of investment securities | | | 82,910,654 | |
| 28 | The Income Fund of America |
The tax character of distributions paid to shareholders was as follows (dollars in thousands):
| | | Six months ended January 31, 2016 | | Year ended July 31, 2015 |
| Share class | | Ordinary
income | | Long-term
capital
gains | | Total
dividends and
distributions
paid | | Ordinary
income | | Long-term
capital
gains | | Total
dividends and
distributions
paid |
| Class A | | $ | 1,124,553 | | | $ | 1,259,675 | | | $ | 2,384,228 | | | $ | 2,652,016 | | | $ | — | | | $ | 2,652,016 | |
| Class B | | | 2,741 | | | | 3,780 | | | | 6,521 | | | | 12,848 | | | | — | | | | 12,848 | |
| Class C | | | 72,777 | | | | 108,381 | | | | 181,158 | | | | 188,824 | | | | — | | | | 188,824 | |
| Class F-1 | | | 62,912 | | | | 72,956 | | | | 135,868 | | | | 140,923 | | | | — | | | | 140,923 | |
| Class F-2 | | | 67,723 | | | | 73,652 | | | | 141,375 | | | | 142,230 | | | | — | | | | 142,230 | |
| Class 529-A | | | 22,047 | | | | 25,552 | | | | 47,599 | | | | 53,022 | | | | — | | | | 53,022 | |
| Class 529-B | | | 166 | | | | 247 | | | | 413 | | | | 730 | | | | — | | | | 730 | |
| Class 529-C | | | 5,093 | | | | 7,919 | | | | 13,012 | | | | 13,212 | | | | — | | | | 13,212 | |
| Class 529-E | | | 878 | | | | 1,101 | | | | 1,979 | | | | 2,176 | | | | — | | | | 2,176 | |
| Class 529-F-1 | | | 920 | | | | 989 | | | | 1,909 | | | | 2,101 | | | | — | | | | 2,101 | |
| Class R-1 | | | 1,544 | | | | 2,291 | | | | 3,835 | | | | 3,933 | | | | — | | | | 3,933 | |
| Class R-2 | | | 6,752 | | | | 10,059 | | | | 16,811 | | | | 18,272 | | | | — | | | | 18,272 | |
| Class R-2E1 | | | 3 | | | | 6 | | | | 9 | | | | 1 | | | | — | | | | 1 | |
| Class R-3 | | | 16,895 | | | | 21,237 | | | | 38,132 | | | | 44,001 | | | | — | | | | 44,001 | |
| Class R-4 | | | 17,794 | | | | 20,359 | | | | 38,153 | | | | 43,909 | | | | — | | | | 43,909 | |
| Class R-5E2 | | | — | 3 | | | — | 3 | | | — | 3 | | | | | | | | | | | | |
| Class R-5 | | | 10,746 | | | | 11,143 | | | | 21,889 | | | | 24,087 | | | | — | | | | 24,087 | |
| Class R-6 | | | 56,950 | | | | 61,144 | | | | 118,094 | | | | 113,968 | | | | — | | | | 113,968 | |
| Total | | $ | 1,470,494 | | | $ | 1,680,491 | | | $ | 3,150,985 | | | $ | 3,456,253 | | | $ | — | | | $ | 3,456,253 | |
| 1 | Class R-2E shares were offered beginning August 29, 2014. |
| 2 | Class R-5E shares were offered beginning November 20, 2015. |
| 3 | Amount less than one thousand. |
7. Fees and transactions with related parties
CRMC, the fund’s investment adviser, is the parent company of American Funds Distributors,® Inc. (“AFD”), the principal underwriter of the fund’s shares, and American Funds Service Company® (“AFS”), the fund’s transfer agent. CRMC, AFD and AFS are considered related parties to the fund.
Investment advisory services — The fund has an investment advisory and service agreement with CRMC that provides for monthly fees accrued daily. These fees are based on a series of decreasing annual rates beginning with 0.250% on the first $500 million of daily net assets and decreasing to 0.123% on such assets in excess of $89 billion. The agreement also provides for monthly fees, accrued daily, of 2.25% of the fund’s monthly gross income. On December 3, 2015, the fund’s board of trustees approved an amended investment advisory and service agreement effective February 1, 2016, decreasing the
| The Income Fund of America | 29 |
annual rates on daily net assets in excess of $115 billion to 0.121%. For the six months ended January 31, 2016, the investment advisory services fee was $99,815,000, which was equivalent to an annualized rate of 0.213% of average daily net assets.
Class-specific fees and expenses — Expenses that are specific to individual share classes are accrued directly to the respective share class. The principal class-specific fees and expenses are further described below:
Distribution services — The fund has plans of distribution for all share classes, except Class F-2, R-5E, R-5 and R-6 shares. Under the plans, the board of trustees approves certain categories of expenses that are used to finance activities primarily intended to sell fund shares and service existing accounts. The plans provide for payments, based on an annualized percentage of average daily net assets, ranging from 0.25% to 1.00% as noted in this section. In some cases, the board of trustees has limited the amounts that may be paid to less than the maximum allowed by the plans. All share classes with a plan may use up to 0.25% of average daily net assets to pay service fees, or to compensate AFD for paying service fees, to firms that have entered into agreements with AFD to provide certain shareholder services. The remaining amounts available to be paid under each plan are paid to dealers to compensate them for their sales activities.
For Class A and 529-A shares, distribution-related expenses include the reimbursement of dealer and wholesaler commissions paid by AFD for certain shares sold without a sales charge. These share classes reimburse AFD for amounts billed within the prior 15 months but only to the extent that the overall annual expense limit of 0.25% is not exceeded. As of January 31, 2016, there were no unreimbursed expenses subject to reimbursement for Class A or 529-A shares.
| | Share class | | Currently approved limits | | Plan limits |
| | Class A | | | 0.25 | % | | | 0.25 | % |
| | Class 529-A | | | 0.25 | | | | 0.50 | |
| | Classes B and 529-B | | | 1.00 | | | | 1.00 | |
| | Classes C, 529-C and R-1 | | | 1.00 | | | | 1.00 | |
| | Class R-2 | | | 0.75 | | | | 1.00 | |
| | Class R-2E | | | 0.60 | | | | 0.85 | |
| | Classes 529-E and R-3 | | | 0.50 | | | | 0.75 | |
| | Classes F-1, 529-F-1 and R-4 | | | 0.25 | | | | 0.50 | |
Transfer agent services — The fund has a shareholder services agreement with AFS under which the fund compensates AFS for providing transfer agent services to each of the fund’s share classes. These services include recordkeeping, shareholder communications and transaction processing. In addition, the fund reimburses AFS for amounts paid to third parties for performing transfer agent services on behalf of fund shareholders.
| 30 | The Income Fund of America |
Administrative services — The fund has an administrative services agreement with CRMC under which the fund compensates CRMC for providing administrative services to Class A, C, F, 529 and R shares. These services include, but are not limited to, coordinating, monitoring, assisting and overseeing third parties that provide services to fund shareholders. Under the agreement, Class A shares pay an annual fee of 0.01% and Class C, F, 529 and R shares pay an annual fee of 0.05% of their respective average daily net assets.
529 plan services — Each 529 share class is subject to service fees to compensate the Virginia College Savings Plan (“Virginia529“) for its oversight and administration of the 529 college savings plan. The quarterly fee is based on a series of decreasing annual rates beginning with 0.10% on the first $30 billion of the net assets invested in Class 529 shares of the American Funds and decreasing to 0.05% on such assets in excess of $70 billion. The fee for any given calendar quarter is accrued and calculated on the basis of the average net assets of Class 529 shares of the American Funds for the last month of the prior calendar quarter. The fee is included in other expenses in the fund’s statement of operations. Virginia529 is not considered a related party to the fund.
For the six months ended January 31, 2016, class-specific expenses under the agreements were as follows (dollars in thousands):
| | Share class | | Distribution
services | | | Transfer agent
services | | | Administrative
services | | 529 plan
services |
| | Class A | | | $83,296 | | | | $26,903 | | | | $3,529 | | | Not applicable |
| | Class B | | | 1,188 | | | | 100 | | | | Not applicable | | | Not applicable |
| | Class C | | | 30,229 | | | | 2,333 | | | | 1,514 | | | Not applicable |
| | Class F-1 | | | 5,062 | | | | 2,326 | | | | 1,012 | | | Not applicable |
| | Class F-2 | | | Not applicable | | | | 2,170 | | | | 1,005 | | | Not applicable |
| | Class 529-A | | | 1,584 | | | | 504 | | | | 358 | | | $634 |
| | Class 529-B | | | 77 | | | | 8 | | | | 4 | | | 7 |
| | Class 529-C | | | 2,198 | | | | 169 | | | | 111 | | | 196 |
| | Class 529-E | | | 154 | | | | 9 | | | | 15 | | | 27 |
| | Class 529-F-1 | | | — | | | | 20 | | | | 14 | | | 25 |
| | Class R-1 | | | 652 | | | | 68 | | | | 33 | | | Not applicable |
| | Class R-2 | | | 2,099 | | | | 1,013 | | | | 141 | | | Not applicable |
| | Class R-2E | | | 1 | | | | — | * | | | — | * | | Not applicable |
| | Class R-3 | | | 2,996 | | | | 987 | | | | 301 | | | Not applicable |
| | Class R-4 | | | 1,429 | | | | 608 | | | | 286 | | | Not applicable |
| | Class R-5E† | | | Not applicable | | | | — | * | | | — | * | | Not applicable |
| | Class R-5 | | | Not applicable | | | | 163 | | | | 155 | | | Not applicable |
| | Class R-6 | | | Not applicable | | | | 7 | | | | 824 | | | Not applicable |
| | Total class-specific expenses | | | $130,965 | | | | $37,388 | | | | $9,302 | | | $889 |
| | * | Amount less than one thousand. |
| | † | Class R-5E shares were offered beginning November 20, 2015. |
| The Income Fund of America | 31 |
Trustees’ deferred compensation — Trustees who are unaffiliated with CRMC may elect to defer the cash payment of part or all of their compensation. These deferred amounts, which remain as liabilities of the fund, are treated as if invested in shares of the fund or other American Funds. These amounts represent general, unsecured liabilities of the fund and vary according to the total returns of the selected funds. Trustees’ compensation of $21,000 in the fund’s statement of operations includes $203,000 in current fees (either paid in cash or deferred) and a net decrease of $182,000 in the value of the deferred amounts.
Affiliated officers and trustees — Officers and certain trustees of the fund are or may be considered to be affiliated with CRMC, AFD and AFS. No affiliated officers or trustees received any compensation directly from the fund.
8. Capital share transactions
Capital share transactions in the fund were as follows (dollars and shares in thousands):
| | | Sales1 | | | Reinvestments of
dividends and
distributions | | | Repurchases1 | | | Net increase
(decrease) |
| Share class | | | Amount | | | | Shares | | | | Amount | | | | Shares | | | | Amount | | | | Shares | | | | Amount | | | | Shares | |
| | | | | | | | | | | | | | | | | | | | | | | | | | | | | | | | | |
| Six months ended January 31, 2016 | | | | | | | | | | | | | | | | | | | | | | | | | |
| | | | | | | | | | | | | | | | | | | | | | | | | | | | | | | | | |
| Class A | | $ | 2,866,517 | | | | 140,588 | | | $ | 2,324,233 | | | | 115,650 | | | $ | (4,211,670 | ) | | | (206,735 | ) | | $ | 979,080 | | | | 49,503 | |
| Class B | | | 1,230 | | | | 61 | | | | 6,433 | | | | 322 | | | | (102,411 | ) | | | (5,017 | ) | | | (94,748 | ) | | | (4,634 | ) |
| Class C | | | 387,287 | | | | 19,197 | | | | 175,491 | | | | 8,837 | | | | (700,796 | ) | | | (34,725 | ) | | | (138,018 | ) | | | (6,691 | ) |
| Class F-1 | | | 412,701 | | | | 20,177 | | | | 130,778 | | | | 6,524 | | | | (440,094 | ) | | | (21,710 | ) | | | 103,385 | | | | 4,991 | |
| Class F-2 | | | 641,988 | | | | 31,359 | | | | 132,500 | | | | 6,600 | | | | (468,498 | ) | | | (23,120 | ) | | | 305,990 | | | | 14,839 | |
| Class 529-A | | | 74,802 | | | | 3,676 | | | | 47,582 | | | | 2,372 | | | | (116,662 | ) | | | (5,723 | ) | | | 5,722 | | | | 325 | |
| Class 529-B | | | 173 | | | | 9 | | | | 412 | | | | 20 | | | | (6,875 | ) | | | (336 | ) | | | (6,290 | ) | | | (307 | ) |
| Class 529-C | | | 25,274 | | | | 1,246 | | | | 13,006 | | | | 651 | | | | (45,468 | ) | | | (2,237 | ) | | | (7,188 | ) | | | (340 | ) |
| Class 529-E | | | 3,513 | | | | 173 | | | | 1,979 | | | | 99 | | | | (5,801 | ) | | | (284 | ) | | | (309 | ) | | | (12 | ) |
| Class 529-F-1 | | | 4,980 | | | | 244 | | | | 1,908 | | | | 95 | | | | (7,398 | ) | | | (361 | ) | | | (510 | ) | | | (22 | ) |
| Class R-1 | | | 10,832 | | | | 534 | | | | 3,828 | | | | 192 | | | | (19,649 | ) | | | (967 | ) | | | (4,989 | ) | | | (241 | ) |
| Class R-2 | | | 54,253 | | | | 2,693 | | | | 16,795 | | | | 844 | | | | (93,732 | ) | | | (4,653 | ) | | | (22,684 | ) | | | (1,116 | ) |
| Class R-2E | | | 4,788 | | | | 245 | | | | 9 | | | | 1 | | | | (270 | ) | | | (14 | ) | | | 4,527 | | | | 232 | |
| Class R-3 | | | 100,296 | | | | 4,945 | | | | 38,011 | | | | 1,898 | | | | (189,849 | ) | | | (9,346 | ) | | | (51,542 | ) | | | (2,503 | ) |
| Class R-4 | | | 109,056 | | | | 5,364 | | | | 38,141 | | | | 1,901 | | | | (179,128 | ) | | | (8,811 | ) | | | (31,931 | ) | | | (1,546 | ) |
| Class R-5E2 | | | 10 | | | | 1 | | | | — | | | | — | | | | — | | | | — | | | | 10 | | | | 1 | |
| Class R-5 | | | 50,474 | | | | 2,491 | | | | 21,884 | | | | 1,089 | | | | (122,725 | ) | | | (6,032 | ) | | | (50,367 | ) | | | (2,452 | ) |
| Class R-6 | | | 687,747 | | | | 34,077 | | | | 118,002 | | | | 5,872 | | | | (176,805 | ) | | | (8,707 | ) | | | 628,944 | | | | 31,242 | |
| Total net increase (decrease) | | $ | 5,435,921 | | | | 267,080 | | | $ | 3,070,992 | | | | 152,967 | | | $ | (6,887,831 | ) | | | (338,778 | ) | | $ | 1,619,082 | | | | 81,269 | |
| 32 | The Income Fund of America |
| | | Sales1 | | | Reinvestments of
dividends and
distributions | | | Repurchases1 | | | Net increase
(decrease) |
| Share class | | | Amount | | | | Shares | | | | Amount | | | | Shares | | | | Amount | | | | Shares | | | | Amount | | | | Shares | |
| | | | | | | | | | | | | | | | | | | | | | | | | | | | | | | | | |
| Year ended July 31, 2015 | | | | | | | | | | | | | | | | | | | | | | | | | |
| | | | | | | | | | | | | | | | | | | | | | | | | | |
| Class A | | $ | 6,799,575 | | | | 313,392 | | | $ | 2,564,923 | | | | 118,409 | | | $ | (7,191,840 | ) | | | (331,631 | ) | | $ | 2,172,658 | | | | 100,170 | |
| Class B | | | 6,142 | | | | 286 | | | | 12,632 | | | | 586 | | | | (319,960 | ) | | | (14,873 | ) | | | (301,186 | ) | | | (14,001 | ) |
| Class C | | | 1,134,135 | | | | 52,855 | | | | 180,877 | | | | 8,438 | | | | (1,476,126 | ) | | | (68,920 | ) | | | (161,114 | ) | | | (7,627 | ) |
| Class F-1 | | | 1,142,485 | | | | 52,837 | | | | 134,607 | | | | 6,228 | | | | (928,887 | ) | | | (42,846 | ) | | | 348,205 | | | | 16,219 | |
| Class F-2 | | | 1,557,560 | | | | 71,770 | | | | 131,617 | | | | 6,083 | | | | (580,458 | ) | | | (26,780 | ) | | | 1,108,719 | | | | 51,073 | |
| Class 529-A | | | 181,865 | | | | 8,403 | | | | 53,006 | | | | 2,452 | | | | (198,921 | ) | | | (9,201 | ) | | | 35,950 | | | | 1,654 | |
| Class 529-B | | | 915 | | | | 42 | | | | 729 | | | | 34 | | | | (16,095 | ) | | | (746 | ) | | | (14,451 | ) | | | (670 | ) |
| Class 529-C | | | 61,911 | | | | 2,870 | | | | 13,208 | | | | 612 | | | | (75,581 | ) | | | (3,512 | ) | | | (462 | ) | | | (30 | ) |
| Class 529-E | | | 8,791 | | | | 407 | | | | 2,176 | | | | 101 | | | | (10,867 | ) | | | (504 | ) | | | 100 | | | | 4 | |
| Class 529-F-1 | | | 13,159 | | | | 608 | | | | 2,099 | | | | 97 | | | | (9,349 | ) | | | (432 | ) | | | 5,909 | | | | 273 | |
| Class R-1 | | | 31,622 | | | | 1,464 | | | | 3,913 | | | | 181 | | | | (28,794 | ) | | | (1,338 | ) | | | 6,741 | | | | 307 | |
| Class R-2 | | | 126,784 | | | | 5,904 | | | | 18,246 | | | | 850 | | | | (177,349 | ) | | | (8,260 | ) | | | (32,319 | ) | | | (1,506 | ) |
| Class R-2E3 | | | 94 | | | | 4 | | | | 1 | | | | — | 4 | | | — | 4 | | | — | 4 | | | 95 | | | | 4 | |
| Class R-3 | | | 248,510 | | | | 11,496 | | | | 43,878 | | | | 2,032 | | | | (365,620 | ) | | | (16,941 | ) | | | (73,232 | ) | | | (3,413 | ) |
| Class R-4 | | | 306,349 | | | | 14,154 | | | | 43,888 | | | | 2,029 | | | | (330,284 | ) | | | (15,265 | ) | | | 19,953 | | | | 918 | |
| Class R-5 | | | 195,218 | | | | 8,999 | | | | 24,077 | | | | 1,112 | | | | (123,241 | ) | | | (5,683 | ) | | | 96,054 | | | | 4,428 | |
| Class R-6 | | | 1,252,456 | | | | 57,974 | | | | 113,878 | | | | 5,257 | | | | (737,681 | ) | | | (33,850 | ) | | | 628,653 | | | | 29,381 | |
| Total net increase (decrease) | | $ | 13,067,571 | | | | 603,465 | | | $ | 3,343,755 | | | | 154,501 | | | $ | (12,571,053 | ) | | | (580,782 | ) | | $ | 3,840,273 | | | | 177,184 | |
| 1 | Includes exchanges between share classes of the fund. |
| 2 | Class R-5E shares were offered beginning November 20, 2015. |
| 3 | Class R-2E shares were offered beginning August 29, 2014. |
| 4 | Amount less than one thousand. |
9. Investment transactions
The fund made purchases and sales of investment securities, excluding short-term securities and U.S. government obligations, if any, of $21,181,437,000 and $21,111,918,000, respectively, during the six months ended January 31, 2016.
| The Income Fund of America | 33 |
Financial highlights
| | | | | | | (Loss) income from investment operations1 | |
| | | Net asset
value,
beginning
of period | | | Net
investment
income2 | | | Net (losses)
gains on
securities (both
realized and
unrealized) | | | Total from
investment
operations | |
| Class A: | | | | | | | | | | | | | | | | |
| Six months ended 1/31/20164,5 | | $ | 21.31 | | | $ | .30 | | | $ | (1.14 | ) | | $ | (.84 | ) |
| Year ended 7/31/2015 | | | 21.45 | | | | .69 | | | | (.04 | ) | | | .65 | |
| Year ended 7/31/2014 | | | 19.64 | | | | .78 | | | | 1.69 | | | | 2.47 | |
| Year ended 7/31/2013 | | | 17.66 | | | | .67 | | | | 1.99 | | | | 2.66 | |
| Year ended 7/31/2012 | | | 16.97 | | | | .66 | | | | .73 | | | | 1.39 | |
| Year ended 7/31/2011 | | | 15.48 | | | | .71 | | | | 1.53 | | | | 2.24 | |
| Class B: | | | | | | | | | | | | | | | | |
| Six months ended 1/31/20164,5 | | | 21.17 | | | | .23 | | | | (1.14 | ) | | | (.91 | ) |
| Year ended 7/31/2015 | | | 21.30 | | | | .53 | | | | (.05 | ) | | | .48 | |
| Year ended 7/31/2014 | | | 19.50 | | | | .61 | | | | 1.69 | | | | 2.30 | |
| Year ended 7/31/2013 | | | 17.53 | | | | .53 | | | | 1.97 | | | | 2.50 | |
| Year ended 7/31/2012 | | | 16.85 | | | | .53 | | | | .71 | | | | 1.24 | |
| Year ended 7/31/2011 | | | 15.37 | | | | .58 | | | | 1.52 | | | | 2.10 | |
| Class C: | | | | | | | | | | | | | | | | |
| Six months ended 1/31/20164,5 | | | 21.06 | | | | .22 | | | | (1.13 | ) | | | (.91 | ) |
| Year ended 7/31/2015 | | | 21.21 | | | | .51 | | | | (.04 | ) | | | .47 | |
| Year ended 7/31/2014 | | | 19.42 | | | | .60 | | | | 1.69 | | | | 2.29 | |
| Year ended 7/31/2013 | | | 17.47 | | | | .51 | | | | 1.97 | | | | 2.48 | |
| Year ended 7/31/2012 | | | 16.80 | | | | .52 | | | | .71 | | | | 1.23 | |
| Year ended 7/31/2011 | | | 15.33 | | | | .57 | | | | 1.51 | | | | 2.08 | |
| Class F-1: | | | | | | | | | | | | | | | | |
| Six months ended 1/31/20164,5 | | | 21.26 | | | | .29 | | | | (1.14 | ) | | | (.85 | ) |
| Year ended 7/31/2015 | | | 21.40 | | | | .67 | | | | (.04 | ) | | | .63 | |
| Year ended 7/31/2014 | | | 19.60 | | | | .76 | | | | 1.68 | | | | 2.44 | |
| Year ended 7/31/2013 | | | 17.62 | | | | .65 | | | | 2.00 | | | | 2.65 | |
| Year ended 7/31/2012 | | | 16.94 | | | | .65 | | | | .72 | | | | 1.37 | |
| Year ended 7/31/2011 | | | 15.46 | | | | .70 | | | | 1.52 | | | | 2.22 | |
| Class F-2: | | | | | | | | | | | | | | | | |
| Six months ended 1/31/20164,5 | | | 21.30 | | | | .32 | | | | (1.15 | ) | | | (.83 | ) |
| Year ended 7/31/2015 | | | 21.44 | | | | .73 | | | | (.04 | ) | | | .69 | |
| Year ended 7/31/2014 | | | 19.63 | | | | .80 | | | | 1.71 | | | | 2.51 | |
| Year ended 7/31/2013 | | | 17.65 | | | | .70 | | | | 1.99 | | | | 2.69 | |
| Year ended 7/31/2012 | | | 16.97 | | | | .69 | | | | .72 | | | | 1.41 | |
| Year ended 7/31/2011 | | | 15.48 | | | | .74 | | | | 1.53 | | | | 2.27 | |
| Class 529-A: | | | | | | | | | | | | | | | | |
| Six months ended 1/31/20164,5 | | | 21.27 | | | | .29 | | | | (1.14 | ) | | | (.85 | ) |
| Year ended 7/31/2015 | | | 21.41 | | | | .67 | | | | (.04 | ) | | | .63 | |
| Year ended 7/31/2014 | | | 19.60 | | | | .75 | | | | 1.70 | | | | 2.45 | |
| Year ended 7/31/2013 | | | 17.63 | | | | .65 | | | | 1.98 | | | | 2.63 | |
| Year ended 7/31/2012 | | | 16.95 | | | | .64 | | | | .72 | | | | 1.36 | |
| Year ended 7/31/2011 | | | 15.46 | | | | .69 | | | | 1.53 | | | | 2.22 | |
| 34 | The Income Fund of America |
| Dividends and distributions | | | | | | | | | | | | | | | | | | | | | |
Dividends
(from net
investment
income) | | | Distributions
(from capital
gains) | | | Total
dividends
and
distributions | | | Net asset
value, end
of period | | | Total
return3 | | | Net assets,
end of period
(in millions) | | | Ratio of
expenses
to average
net assets2 | | | Ratio of net
income
to average
net assets2 | |
| | | | | | | | | | | | | | | | | | | | | | | | | | | | | | | |
| $ | (.33 | ) | | $ | (.37 | ) | | $ | (.70 | ) | | $ | 19.77 | | | | (3.98 | )%6 | | $ | 68,651 | | | | .55 | %7 | | | 2.92 | %7 |
| | (.79 | ) | | | — | | | | (.79 | ) | | | 21.31 | | | | 3.01 | | | | 72,952 | | | | .55 | | | | 3.19 | |
| | (.66 | ) | | | — | | | | (.66 | ) | | | 21.45 | | | | 12.78 | | | | 71,290 | | | | .57 | | | | 3.76 | |
| | (.68 | ) | | | — | | | | (.35 | ) | | | 19.64 | | | | 15.33 | | | | 63,968 | | | | .58 | | | | 3.58 | |
| | (.70 | ) | | | — | | | | (.70 | ) | | | 17.66 | | | | 8.45 | | | | 56,153 | | | | .59 | | | | 3.92 | |
| | (.75 | ) | | | — | | | | (.75 | ) | | | 16.97 | | | | 14.68 | | | | 52,940 | | | | .58 | | | | 4.24 | |
| | | | | | | | | | | | | | | | | | | | | | | | | | | | | | | |
| | (.24 | ) | | | (.37 | ) | | | (.61 | ) | | | 19.65 | | | | (4.32 | )6 | | | 188 | | | | 1.31 | 7 | | | 2.21 | 7 |
| | (.61 | ) | | | — | | | | (.61 | ) | | | 21.17 | | | | 2.23 | | | | 301 | | | | 1.30 | | | | 2.45 | |
| | (.50 | ) | | | — | | | | (.50 | ) | | | 21.30 | | | | 11.92 | | | | 601 | | | | 1.32 | | | | 2.99 | |
| | (.53 | ) | | | — | | | | (.28 | ) | | | 19.50 | | | | 14.48 | | | | 818 | | | | 1.33 | | | | 2.86 | |
| | (.56 | ) | | | — | | | | (.56 | ) | | | 17.53 | | | | 7.56 | | | | 1,161 | | | | 1.34 | | | | 3.19 | |
| | (.62 | ) | | | — | | | | (.62 | ) | | | 16.85 | | | | 13.82 | | | | 1,760 | | | | 1.34 | | | | 3.48 | |
| | | | | | | | | | | | | | | | | | | | | | | | | | | | | | | |
| | (.25 | ) | | | (.37 | ) | | | (.62 | ) | | | 19.53 | | | | (4.37 | )6 | | | 5,795 | | | | 1.35 | 7 | | | 2.12 | 7 |
| | (.62 | ) | | | — | | | | (.62 | ) | | | 21.06 | | | | 2.19 | | | | 6,390 | | | | 1.35 | | | | 2.39 | |
| | (.50 | ) | | | — | | | | (.50 | ) | | | 21.21 | | | | 11.91 | | | | 6,597 | | | | 1.37 | | | | 2.95 | |
| | (.53 | ) | | | — | | | | (.28 | ) | | | 19.42 | | | | 14.41 | | | | 6,389 | | | | 1.38 | | | | 2.79 | |
| | (.56 | ) | | | — | | | | (.56 | ) | | | 17.47 | | | | 7.55 | | | | 6,096 | | | | 1.38 | | | | 3.13 | |
| | (.61 | ) | | | — | | | | (.61 | ) | | | 16.80 | | | | 13.77 | | | | 6,157 | | | | 1.39 | | | | 3.43 | |
| | | | | | | | | | | | | | | | | | | | | | | | | | | | | | | |
| | (.32 | ) | | | (.37 | ) | | | (.69 | ) | | | 19.72 | | | | (4.03 | )6 | | | 3,957 | | | | .64 | 7 | | | 2.83 | 7 |
| | (.77 | ) | | | — | | | | (.77 | ) | | | 21.26 | | | | 2.94 | | | | 4,160 | | | | .64 | | | | 3.10 | |
| | (.64 | ) | | | — | | | | (.64 | ) | | | 21.40 | | | | 12.66 | | | | 3,841 | | | | .65 | | | | 3.71 | |
| | (.67 | ) | | | — | | | | (.34 | ) | | | 19.60 | | | | 15.30 | | | | 3,554 | | | | .65 | | | | 3.50 | |
| | (.69 | ) | | | — | | | | (.69 | ) | | | 17.62 | | | | 8.35 | | | | 2,563 | | | | .64 | | | | 3.87 | |
| | (.74 | ) | | | — | | | | (.74 | ) | | | 16.94 | | | | 14.58 | | | | 2,025 | | | | .64 | | | | 4.19 | |
| | | | | | | | | | | | | | | | | | | | | | | | | | | | | | | |
| | (.35 | ) | | | (.37 | ) | | | (.72 | ) | | | 19.75 | | | | (3.94 | )6 | | | 4,043 | | | | .38 | 7 | | | 3.08 | 7 |
| | (.83 | ) | | | — | | | | (.83 | ) | | | 21.30 | | | | 3.20 | | | | 4,042 | | | | .38 | | | | 3.35 | |
| | (.70 | ) | | | — | | | | (.70 | ) | | | 21.44 | | | | 12.97 | | | | 2,975 | | | | .40 | | | | 3.89 | |
| | (.71 | ) | | | — | | | | (.37 | ) | | | 19.63 | | | | 15.53 | | | | 1,434 | | | | .41 | | | | 3.74 | |
| | (.73 | ) | | | — | | | | (.73 | ) | | | 17.65 | | | | 8.59 | | | | 1,020 | | | | .40 | | | | 4.09 | |
| | (.78 | ) | | | — | | | | (.78 | ) | | | 16.97 | | | | 14.90 | | | | 747 | | | | .40 | | | | 4.42 | |
| | | | | | | | | | | | | | | | | | | | | | | | | | | | | | | |
| | (.32 | ) | | | (.37 | ) | | | (.69 | ) | | | 19.73 | | | | (4.04 | )6 | | | 1,387 | | | | .66 | 7 | | | 2.81 | 7 |
| | (.77 | ) | | | — | | | | (.77 | ) | | | 21.27 | | | | 2.92 | | | | 1,489 | | | | .65 | | | | 3.09 | |
| | (.64 | ) | | | — | | | | (.64 | ) | | | 21.41 | | | | 12.69 | | | | 1,463 | | | | .67 | | | | 3.66 | |
| | (.66 | ) | | | — | | | | (.34 | ) | | | 19.60 | | | | 15.19 | | | | 1,298 | | | | .68 | | | | 3.48 | |
| | (.68 | ) | | | — | | | | (.68 | ) | | | 17.63 | | | | 8.30 | | | | 1,102 | | | | .68 | | | | 3.82 | |
| | (.73 | ) | | | — | | | | (.73 | ) | | | 16.95 | | | | 14.62 | | | | 939 | | | | .67 | | | | 4.15 | |
See page 40 for footnotes.
| The Income Fund of America | 35 |
Financial highlights (continued)
| | | | | | | (Loss) income from investment operations1 | |
| | | Net asset
value,
beginning
of period | | | Net
investment
income2 | | | Net (losses)
gains on
securities (both
realized and
unrealized) | | | Total from
investment
operations | |
| Class 529-B: | | | | | | | | | | | | | | | | |
| Six months ended 1/31/20164,5 | | $ | 21.23 | | | $ | .21 | | | $ | (1.14 | ) | | $ | (.93 | ) |
| Year ended 7/31/2015 | | | 21.36 | | | | .50 | | | | (.05 | ) | | | .45 | |
| Year ended 7/31/2014 | | | 19.55 | | | | .58 | | | | 1.70 | | | | 2.28 | |
| Year ended 7/31/2013 | | | 17.57 | | | | .50 | | | | 1.99 | | | | 2.49 | |
| Year ended 7/31/2012 | | | 16.89 | | | | .51 | | | | .71 | | | | 1.22 | |
| Year ended 7/31/2011 | | | 15.41 | | | | .56 | | | | 1.52 | | | | 2.08 | |
| Class 529-C: | | | | | | | | | | | | | | | | |
| Six months ended 1/31/20164,5 | | | 21.18 | | | | .21 | | | | (1.13 | ) | | | (.92 | ) |
| Year ended 7/31/2015 | | | 21.33 | | | | .50 | | | | (.05 | ) | | | .45 | |
| Year ended 7/31/2014 | | | 19.53 | | | | .59 | | | | 1.69 | | | | 2.28 | |
| Year ended 7/31/2013 | | | 17.56 | | | | .50 | | | | 1.99 | | | | 2.49 | |
| Year ended 7/31/2012 | | | 16.89 | | | | .51 | | | | .71 | | | | 1.22 | |
| Year ended 7/31/2011 | | | 15.41 | | | | .56 | | | | 1.53 | | | | 2.09 | |
| Class 529-E: | | | | | | | | | | | | | | | | |
| Six months ended 1/31/20164,5 | | | 21.21 | | | | .26 | | | | (1.14 | ) | | | (.88 | ) |
| Year ended 7/31/2015 | | | 21.35 | | | | .62 | | | | (.04 | ) | | | .58 | |
| Year ended 7/31/2014 | | | 19.55 | | | | .70 | | | | 1.69 | | | | 2.39 | |
| Year ended 7/31/2013 | | | 17.58 | | | | .60 | | | | 1.99 | | | | 2.59 | |
| Year ended 7/31/2012 | | | 16.91 | | | | .60 | | | | .71 | | | | 1.31 | |
| Year ended 7/31/2011 | | | 15.43 | | | | .65 | | | | 1.52 | | | | 2.17 | |
| Class 529-F-1: | | | | | | | | | | | | | | | | |
| Six months ended 1/31/20164,5 | | | 21.27 | | | | .31 | | | | (1.14 | ) | | | (.83 | ) |
| Year ended 7/31/2015 | | | 21.41 | | | | .72 | | | | (.04 | ) | | | .68 | |
| Year ended 7/31/2014 | | | 19.60 | | | | .80 | | | | 1.70 | | | | 2.50 | |
| Year ended 7/31/2013 | | | 17.63 | | | | .69 | | | | 1.98 | | | | 2.67 | |
| Year ended 7/31/2012 | | | 16.95 | | | | .68 | | | | .72 | | | | 1.40 | |
| Year ended 7/31/2011 | | | 15.46 | | | | .73 | | | | 1.53 | | | | 2.26 | |
| Class R-1: | | | | | | | | | | | | | | | | |
| Six months ended 1/31/20164,5 | | | 21.18 | | | | .21 | | | | (1.14 | ) | | | (.93 | ) |
| Year ended 7/31/2015 | | | 21.33 | | | | .51 | | | | (.05 | ) | | | .46 | |
| Year ended 7/31/2014 | | | 19.53 | | | | .60 | | | | 1.69 | | | | 2.29 | |
| Year ended 7/31/2013 | | | 17.56 | | | | .52 | | | | 1.98 | | | | 2.50 | |
| Year ended 7/31/2012 | | | 16.89 | | | | .52 | | | | .71 | | | | 1.23 | |
| Year ended 7/31/2011 | | | 15.41 | | | | .57 | | | | 1.52 | | | | 2.09 | |
| Class R-2: | | | | | | | | | | | | | | | | |
| Six months ended 1/31/20164,5 | | | 21.09 | | | | .21 | | | | (1.13 | ) | | | (.92 | ) |
| Year ended 7/31/2015 | | | 21.23 | | | | .52 | | | | (.04 | ) | | | .48 | |
| Year ended 7/31/2014 | | | 19.45 | | | | .60 | | | | 1.68 | | | | 2.28 | |
| Year ended 7/31/2013 | | | 17.49 | | | | .52 | | | | 1.98 | | | | 2.50 | |
| Year ended 7/31/2012 | | | 16.82 | | | | .52 | | | | .71 | | | | 1.23 | |
| Year ended 7/31/2011 | | | 15.35 | | | | .57 | | | | 1.51 | | | | 2.08 | |
| 36 | The Income Fund of America |
| Dividends and distributions | | | | | | | | | | | | | | | | | | | | | |
Dividends
(from net
investment
income) | | | Distributions
(from capital
gains) | | | Total
dividends
and
distributions | | | Net asset
value, end
of period | | | Total
return3 | | | Net assets,
end of period
(in millions) | | | Ratio of
expenses
to average
net assets2 | | | Ratio of net
income
to average
net assets2 | |
| | | | | | | | | | | | | | | | | | | | | | | | | | | | | | | |
| $ | (.22 | ) | | $ | (.37 | ) | | $ | (.59 | ) | | $ | 19.71 | | | | (4.39 | )%6 | | $ | 12 | | | | 1.45 | %7 | | | 2.06 | %7 |
| | (.58 | ) | | | — | | | | (.58 | ) | | | 21.23 | | | | 2.10 | | | | 20 | | | | 1.43 | | | | 2.33 | |
| | (.47 | ) | | | — | | | | (.47 | ) | | | 21.36 | | | | 11.79 | | | | 34 | | | | 1.45 | | | | 2.85 | |
| | (.51 | ) | | | — | | | | (.27 | ) | | | 19.55 | | | | 14.35 | | | | 45 | | | | 1.46 | | | | 2.73 | |
| | (.54 | ) | | | — | | | | (.54 | ) | | | 17.57 | | | | 7.41 | | | | 58 | | | | 1.47 | | | | 3.06 | |
| | (.60 | ) | | | — | | | | (.60 | ) | | | 16.89 | | | | 13.66 | | | | 76 | | | | 1.46 | | | | 3.37 | |
| | | | | | | | | | | | | | | | | | | | | | | | | | | | | | | |
| | (.24 | ) | | | (.37 | ) | | | (.61 | ) | | | 19.65 | | | | (4.39 | )6 | | | 426 | | | | 1.43 | 7 | | | 2.04 | 7 |
| | (.60 | ) | | | — | | | | (.60 | ) | | | 21.18 | | | | 2.09 | | | | 466 | | | | 1.42 | | | | 2.32 | |
| | (.48 | ) | | | — | | | | (.48 | ) | | | 21.33 | | | | 11.82 | | | | 470 | | | | 1.44 | | | | 2.88 | |
| | (.52 | ) | | | — | | | | (.27 | ) | | | 19.53 | | | | 14.36 | | | | 420 | | | | 1.45 | | | | 2.71 | |
| | (.55 | ) | | | — | | | | (.55 | ) | | | 17.56 | | | | 7.43 | | | | 370 | | | | 1.47 | | | | 3.04 | |
| | (.61 | ) | | | — | | | | (.61 | ) | | | 16.89 | | | | 13.71 | | | | 331 | | | | 1.46 | | | | 3.37 | |
| | | | | | | | | | | | | | | | | | | | | | | | | | | | | | | |
| | (.29 | ) | | | (.37 | ) | | | (.66 | ) | | | 19.67 | | | | (4.17 | )6 | | | 59 | | | | .89 | 7 | | | 2.58 | 7 |
| | (.72 | ) | | | — | | | | (.72 | ) | | | 21.21 | | | | 2.68 | | | | 64 | | | | .89 | | | | 2.85 | |
| | (.59 | ) | | | — | | | | (.59 | ) | | | 21.35 | | | | 12.39 | | | | 65 | | | | .91 | | | | 3.41 | |
| | (.62 | ) | | | — | | | | (.32 | ) | | | 19.55 | | | | 14.95 | | | | 59 | | | | .92 | | | | 3.24 | |
| | (.64 | ) | | | — | | | | (.64 | ) | | | 17.58 | | | | 7.99 | | | | 52 | | | | .93 | | | | 3.57 | |
| | (.69 | ) | | | — | | | | (.69 | ) | | | 16.91 | | | | 14.27 | | | | 44 | | | | .94 | | | | 3.88 | |
| | | | | | | | | | | | | | | | | | | | | | | | | | | | | | | |
| | (.34 | ) | | | (.37 | ) | | | (.71 | ) | | | 19.73 | | | | (3.92 | )6 | | | 53 | | | | .43 | 7 | | | 3.04 | 7 |
| | (.82 | ) | | | — | | | | (.82 | ) | | | 21.27 | | | | 3.16 | | | | 58 | | | | .42 | | | | 3.31 | |
| | (.69 | ) | | | — | | | | (.69 | ) | | | 21.41 | | | | 12.94 | | | | 52 | | | | .44 | | | | 3.89 | |
| | (.70 | ) | | | — | | | | (.36 | ) | | | 19.60 | | | | 15.44 | | | | 44 | | | | .45 | | | | 3.70 | |
| | (.72 | ) | | | — | | | | (.72 | ) | | | 17.63 | | | | 8.53 | | | | 36 | | | | .46 | | | | 4.04 | |
| | (.77 | ) | | | — | | | | (.77 | ) | | | 16.95 | | | | 14.87 | | | | 31 | | | | .45 | | | | 4.37 | |
| | | | | | | | | | | | | | | | | | | | | | | | | | | | | | | |
| | (.24 | ) | | | (.37 | ) | | | (.61 | ) | | | 19.64 | | | | (4.41 | )6 | | | 124 | | | | 1.38 | 7 | | | 2.09 | 7 |
| | (.61 | ) | | | — | | | | (.61 | ) | | | 21.18 | | | | 2.16 | | | | 139 | | | | 1.36 | | | | 2.38 | |
| | (.49 | ) | | | — | | | | (.49 | ) | | | 21.33 | | | | 11.88 | | | | 133 | | | | 1.39 | | | | 2.93 | |
| | (.53 | ) | | | — | | | | (.28 | ) | | | 19.53 | | | | 14.43 | | | | 120 | | | | 1.39 | | | | 2.78 | |
| | (.56 | ) | | | — | | | | (.56 | ) | | | 17.56 | | | | 7.50 | | | | 122 | | | | 1.40 | | | | 3.11 | |
| | (.61 | ) | | | — | | | | (.61 | ) | | | 16.89 | | | | 13.76 | | | | 109 | | | | 1.41 | | | | 3.42 | |
| | | | | | | | | | | | | | | | | | | | | | | | | | | | | | | |
| | (.24 | ) | | | (.37 | ) | | | (.61 | ) | | | 19.56 | | | | (4.37 | )6 | | | 533 | | | | 1.38 | 7 | | | 2.10 | 7 |
| | (.62 | ) | | | — | | | | (.62 | ) | | | 21.09 | | | | 2.24 | | | | 599 | | | | 1.32 | | | | 2.42 | |
| | (.50 | ) | | | — | | | | (.50 | ) | | | 21.23 | | | | 11.85 | | | | 635 | | | | 1.37 | | | | 2.95 | |
| | (.54 | ) | | | — | | | | (.28 | ) | | | 19.45 | | | | 14.47 | | | | 609 | | | | 1.36 | | | | 2.80 | |
| | (.56 | ) | | | — | | | | (.56 | ) | | | 17.49 | | | | 7.52 | | | | 567 | | | | 1.40 | | | | 3.11 | |
| | (.61 | ) | | | — | | | | (.61 | ) | | | 16.82 | | | | 13.75 | | | | 552 | | | | 1.41 | | | | 3.41 | |
See page 40 for footnotes.
| The Income Fund of America | 37 |
Financial highlights (continued)
| | | | | | | (Loss) income from investment operations1 | |
| | | Net asset
value,
beginning
of period | | | Net
investment
income2 | | | Net (losses)
gains on
securities (both
realized and
unrealized) | | | Total from
investment
operations | |
| Class R-2E: | | | | | | | | | | | | | | | | |
| Six months ended 1/31/20164,5 | | $ | 21.29 | | | $ | .14 | | | $ | (1.02 | ) | | $ | (.88 | ) |
| Period from 8/29/2014 to 7/31/20155,8 | | | 21.98 | | | | .54 | | | | (.47 | ) | | | .07 | |
| Class R-3: | | | | | | | | | | | | | | | | |
| Six months ended 1/31/20164,5 | | | 21.23 | | | | .26 | | | | (1.14 | ) | | | (.88 | ) |
| Year ended 7/31/2015 | | | 21.37 | | | | .61 | | | | (.04 | ) | | | .57 | |
| Year ended 7/31/2014 | | | 19.57 | | | | .69 | | | | 1.69 | | | | 2.38 | |
| Year ended 7/31/2013 | | | 17.60 | | | | .60 | | | | 1.98 | | | | 2.58 | |
| Year ended 7/31/2012 | | | 16.92 | | | | .60 | | | | .72 | | | | 1.32 | |
| Year ended 7/31/2011 | | | 15.44 | | | | .64 | | | | 1.53 | | | | 2.17 | |
| Class R-4: | | | | | | | | | | | | | | | | |
| Six months ended 1/31/20164,5 | | | 21.27 | | | | .29 | | | | (1.14 | ) | | | (.85 | ) |
| Year ended 7/31/2015 | | | 21.42 | | | | .68 | | | | (.06 | ) | | | .62 | |
| Year ended 7/31/2014 | | | 19.61 | | | | .76 | | | | 1.70 | | | | 2.46 | |
| Year ended 7/31/2013 | | | 17.63 | | | | .66 | | | | 1.99 | | | | 2.65 | |
| Year ended 7/31/2012 | | | 16.95 | | | | .65 | | | | .72 | | | | 1.37 | |
| Year ended 7/31/2011 | | | 15.46 | | | | .70 | | | | 1.53 | | | | 2.23 | |
| Class R-5E: | | | | | | | | | | | | | | | | |
| Period from 11/20/2015 to 1/31/20164,5,11 | | | 21.03 | | | | .10 | | | | (.82 | ) | | | (.72 | ) |
| Class R-5: | | | | | | | | | | | | | | | | |
| Six months ended 1/31/20164,5 | | | 21.31 | | | | .32 | | | | (1.14 | ) | | | (.82 | ) |
| Year ended 7/31/2015 | | | 21.45 | | | | .74 | | | | (.04 | ) | | | .70 | |
| Year ended 7/31/2014 | | | 19.64 | | | | .82 | | | | 1.70 | | | | 2.52 | |
| Year ended 7/31/2013 | | | 17.66 | | | | .71 | | | | 1.99 | | | | 2.70 | |
| Year ended 7/31/2012 | | | 16.97 | | | | .70 | | | | .73 | | | | 1.43 | |
| Year ended 7/31/2011 | | | 15.48 | | | | .75 | | | | 1.53 | | | | 2.28 | |
| Class R-6: | | | | | | | | | | | | | | | | |
| Six months ended 1/31/20164,5 | | | 21.32 | | | | .33 | | | | (1.14 | ) | | | (.81 | ) |
| Year ended 7/31/2015 | | | 21.46 | | | | .75 | | | | (.04 | ) | | | .71 | |
| Year ended 7/31/2014 | | | 19.65 | | | | .83 | | | | 1.70 | | | | 2.53 | |
| Year ended 7/31/2013 | | | 17.66 | | | | .72 | | | | 2.00 | | | | 2.72 | |
| Year ended 7/31/2012 | | | 16.98 | | | | .71 | | | | .72 | | | | 1.43 | |
| Year ended 7/31/2011 | | | 15.49 | | | | .76 | | | | 1.52 | | | | 2.28 | |
| | | Six months
ended
January 31, | | Year ended July 31 |
| Portfolio turnover rate for all share classes12 | | 20164,5,6 | | | 2015 | | | 2014 | | | 2013 | | | 2012 | | | 2011 |
| Including mortgage dollar roll transactions | | | 26 | % | | | 45 | % | | | 39 | % | | | 47 | % | | | 41 | % | | | 38 | % |
| Excluding mortgage dollar roll transactions | | | 21 | % | | | 32 | % | | | Not available |
See Notes to Financial Statements
| 38 | The Income Fund of America |
| Dividends and distributions | | | | | | | | | | | | | | | | | | | | | |
Dividends
(from net
investment
income) | | | Distributions
(from capital
gains) | | | Total
dividends
and
distributions | | | Net asset
value, end
of period | | | Total
return3 | | | Net assets,
end of period
(in millions) | | | Ratio of
expenses
to average
net assets2 | | | Ratio of net
income
to average
net assets2 | |
| | | | | | | | | | | | | | | | | | | | | | | | | | | | | | | |
| $ | (.30 | ) | | $ | (.37 | ) | | $ | (.67 | ) | | $ | 19.74 | | | | (4.16 | )%6 | | $ | 5 | | | | .83 | %7 | | | 1.42 | %7 |
| | (.76 | ) | | | — | | | | (.76 | ) | | | 21.29 | | | | .28 | 6,9 | | | — | 10 | | | .96 | 7,9 | | | 2.73 | 7,9 |
| | | | | | | | | | | | | | | | | | | | | | | | | | | | | | | |
| | (.29 | ) | | | (.37 | ) | | | (.66 | ) | | | 19.69 | | | | (4.18 | )6 | | | 1,134 | | | | .94 | 7 | | | 2.54 | 7 |
| | (.71 | ) | | | — | | | | (.71 | ) | | | 21.23 | | | | 2.65 | | | | 1,275 | | | | .92 | | | | 2.83 | |
| | (.58 | ) | | | — | | | | (.58 | ) | | | 21.37 | | | | 12.35 | | | | 1,357 | | | | .94 | | | | 3.38 | |
| | (.61 | ) | | | — | | | | (.32 | ) | | | 19.57 | | | | 14.91 | | | | 1,323 | | | | .94 | | | | 3.22 | |
| | (.64 | ) | | | — | | | | (.64 | ) | | | 17.60 | | | | 8.01 | | | | 1,204 | | | | .96 | | | | 3.55 | |
| | (.69 | ) | | | — | | | | (.69 | ) | | | 16.92 | | | | 14.23 | | | | 1,118 | | | | .96 | | | | 3.86 | |
| | | | | | | | | | | | | | | | | | | | | | | | | | | | | | | |
| | (.32 | ) | | | (.37 | ) | | | (.69 | ) | | | 19.73 | | | | (4.02 | )6 | | | 1,086 | | | | .63 | 7 | | | 2.84 | 7 |
| | (.77 | ) | | | — | | | | (.77 | ) | | | 21.27 | | | | 2.90 | | | | 1,203 | | | | .62 | | | | 3.12 | |
| | (.65 | ) | | | — | | | | (.65 | ) | | | 21.42 | | | | 12.71 | | | | 1,192 | | | | .64 | | | | 3.67 | |
| | (.67 | ) | | | — | | | | (.34 | ) | | | 19.61 | | | | 15.29 | | | | 1,045 | | | | .64 | | | | 3.52 | |
| | (.69 | ) | | | — | | | | (.69 | ) | | | 17.63 | | | | 8.33 | | | | 880 | | | | .65 | | | | 3.86 | |
| | (.74 | ) | | | — | | | | (.74 | ) | | | 16.95 | | | | 14.62 | | | | 809 | | | | .66 | | | | 4.17 | |
| | | | | | | | | | | | | | | | | | | | | | | | | | | | | | | |
| | (.18 | ) | | | (.37 | ) | | | (.55 | ) | | | 19.76 | | | | (3.47 | )6 | | | — | 10 | | | .08 | 6 | | | .50 | 6 |
| | | | | | | | | | | | | | | | | | | | | | | | | | | | | | | |
| | (.35 | ) | | | (.37 | ) | | | (.72 | ) | | | 19.77 | | | | (3.86 | )6 | | | 562 | | | | .33 | 7 | | | 3.16 | 7 |
| | (.84 | ) | | | — | | | | (.84 | ) | | | 21.31 | | | | 3.25 | | | | 658 | | | | .32 | | | | 3.41 | |
| | (.71 | ) | | | — | | | | (.71 | ) | | | 21.45 | | | | 13.03 | | | | 567 | | | | .34 | | | | 3.98 | |
| | (.72 | ) | | | — | | | | (.37 | ) | | | 19.64 | | | | 15.60 | | | | 525 | | | | .34 | | | | 3.83 | |
| | (.74 | ) | | | — | | | | (.74 | ) | | | 17.66 | | | | 8.70 | | | | 462 | | | | .35 | | | | 4.17 | |
| | (.79 | ) | | | — | | | | (.79 | ) | | | 16.97 | | | | 14.94 | | | | 478 | | | | .36 | | | | 4.46 | |
| | | | | | | | | | | | | | | | | | | | | | | | | | | | | | | |
| | (.36 | ) | | | (.37 | ) | | | (.73 | ) | | | 19.78 | | | | (3.84 | )6 | | | 3,564 | | | | .28 | 7 | | | 3.17 | 7 |
| | (.85 | ) | | | — | | | | (.85 | ) | | | 21.32 | | | | 3.30 | | | | 3,176 | | | | .28 | | | | 3.45 | |
| | (.72 | ) | | | — | | | | (.72 | ) | | | 21.46 | | | | 13.08 | | | | 2,566 | | | | .29 | | | | 4.03 | |
| | (.73 | ) | | | — | | | | (.38 | ) | | | 19.65 | | | | 15.72 | | | | 1,631 | | | | .29 | | | | 3.85 | |
| | (.75 | ) | | | — | | | | (.75 | ) | | | 17.66 | | | | 8.69 | | | | 1,025 | | | | .30 | | | | 4.21 | |
| | (.79 | ) | | | — | | | | (.79 | ) | | | 16.98 | | | | 14.99 | | | | 758 | | | | .31 | | | | 4.51 | |
See page 40 for footnotes.
| The Income Fund of America | 39 |
Financial highlights (continued)
| 1 | Based on average shares outstanding. |
| 2 | For the year ended July 31, 2014, this column reflects the impact of a corporate action event that resulted in a one-time increase to net investment income. If the corporate action event had not occurred, the Class A net investment income per share would have been lower by $.11; the Class A ratio of expenses to average net assets would have been lower by .01 percentage points; and the Class A ratio of net income to average net assets would have been lower by .51 percentage points. The impact to the other share classes would have been similar. |
| 3 | Total returns exclude any applicable sales charges, including contingent deferred sales charges. |
| 4 | Unaudited. |
| 5 | Based on operations for the period shown and, accordingly, is not representative of a full year. |
| 6 | Not annualized. |
| 7 | Annualized. |
| 8 | Class R-2E shares were offered beginning August 29, 2014. |
| 9 | All or a significant portion of assets in this class consisted of seed capital invested by Capital Research and Management Company and/or its affiliates. Fees for distribution services are not charged or accrued on these seed capital assets. If such fees were paid by the fund on seed capital assets, fund expenses would have been higher and net income and total return would have been lower. |
| 10 | Amount less than $1 million. |
| 11 | Class R-5E shares were offered beginning November 20, 2015. |
| 12 | Refer to Note 5 for more information on mortgage dollar rolls. |
| | |
| 40 | The Income Fund of America |
As a fund shareholder, you incur two types of costs: (1) transaction costs, such as initial sales charges on purchase payments and contingent deferred sales charges on redemptions (loads), and (2) ongoing costs, including management fees, distribution and service (12b-1) fees, and other expenses. This example is intended to help you understand your ongoing costs (in dollars) of investing in the fund so you can compare these costs with the ongoing costs of investing in other mutual funds. The example is based on an investment of $1,000 invested at the beginning of the period and held for the entire six-month period (August 1, 2015, through January 31, 2016).
Actual expenses:
The first line of each share class in the table on the following page provides information about actual account values and actual expenses. You may use the information in this line, together with the amount you invested, to estimate the expenses that you paid over the period. Simply divide your account value by $1,000 (for example, an $8,600 account value divided by $1,000 = 8.6), then multiply the result by the number in the first line under the heading entitled “Expenses paid during period” to estimate the expenses you paid on your account during this period.
Hypothetical example for comparison purposes:
The second line of each share class in the table on the following page provides information about hypothetical account values and hypothetical expenses based on the actual expense ratio for the share class and an assumed rate of return of 5.00% per year before expenses, which is not the actual return of the share class. The hypothetical account values and expenses may not be used to estimate the actual ending account balance or expenses you paid for the period. You may use this information to compare the ongoing costs of investing in the fund and other funds. To do so, compare this 5.00% hypothetical example with the 5.00% hypothetical examples that appear in the shareholder reports of the other funds.
Notes:
Retirement plan participants may be subject to certain fees charged by the plan sponsor, and Class F-1, F-2 and 529-F-1 shareholders may be subject to fees charged by financial intermediaries, typically ranging from 0.75% to 1.50% of assets annually depending on services offered. You can estimate the impact of these fees by adding the amount of the fees to the total estimated expenses you paid on your account during the period as calculated above. In addition, your ending account value would be lower by the amount of these fees.
Note that the expenses shown in the table on the following page are meant to highlight your ongoing costs only and do not reflect any transactional costs, such as sales charges (loads). Therefore, the second line of each share class in the table is useful in comparing ongoing costs only and will not help you determine the relative total costs of owning different funds. In addition, if these transactional costs were included, your costs would have been higher.
| The Income Fund of America | 41 |
| | | Beginning
account value
8/1/2015 | | | Ending
account value
1/31/2016 | | | Expenses paid
during period* | | | Annualized
expense ratio | |
| Class A - actual return | | $ | 1,000.00 | | | $ | 960.25 | | | $ | 2.71 | | | | .55 | % |
| Class A - assumed 5% return | | | 1,000.00 | | | | 1,022.37 | | | | 2.80 | | | | .55 | |
| Class B - actual return | | | 1,000.00 | | | | 956.76 | | | | 6.44 | | | | 1.31 | |
| Class B - assumed 5% return | | | 1,000.00 | | | | 1,018.55 | | | | 6.65 | | | | 1.31 | |
| Class C - actual return | | | 1,000.00 | | | | 956.27 | | | | 6.64 | | | | 1.35 | |
| Class C - assumed 5% return | | | 1,000.00 | | | | 1,018.35 | | | | 6.85 | | | | 1.35 | |
| Class F-1 - actual return | | | 1,000.00 | | | | 959.71 | | | | 3.15 | | | | .64 | |
| Class F-1 - assumed 5% return | | | 1,000.00 | | | | 1,021.92 | | | | 3.25 | | | | .64 | |
| Class F-2 - actual return | | | 1,000.00 | | | | 960.56 | | | | 1.87 | | | | .38 | |
| Class F-2 - assumed 5% return | | | 1,000.00 | | | | 1,023.23 | | | | 1.93 | | | | .38 | |
| Class 529-A - actual return | | | 1,000.00 | | | | 959.65 | | | | 3.25 | | | | .66 | |
| Class 529-A - assumed 5% return | | | 1,000.00 | | | | 1,021.82 | | | | 3.35 | | | | .66 | |
| Class 529-B - actual return | | | 1,000.00 | | | | 956.07 | | | | 7.13 | | | | 1.45 | |
| Class 529-B - assumed 5% return | | | 1,000.00 | | | | 1,017.85 | | | | 7.35 | | | | 1.45 | |
| Class 529-C - actual return | | | 1,000.00 | | | | 956.09 | | | | 7.03 | | | | 1.43 | |
| Class 529-C - assumed 5% return | | | 1,000.00 | | | | 1,017.95 | | | | 7.25 | | | | 1.43 | |
| Class 529-E - actual return | | | 1,000.00 | | | | 958.34 | | | | 4.38 | | | | .89 | |
| Class 529-E - assumed 5% return | | | 1,000.00 | | | | 1,020.66 | | | | 4.52 | | | | .89 | |
| Class 529-F-1 - actual return | | | 1,000.00 | | | | 960.77 | | | | 2.12 | | | | .43 | |
| Class 529-F-1 - assumed 5% return | | | 1,000.00 | | | | 1,022.97 | | | | 2.19 | | | | .43 | |
| Class R-1 - actual return | | | 1,000.00 | | | | 955.88 | | | | 6.78 | | | | 1.38 | |
| Class R-1 - assumed 5% return | | | 1,000.00 | | | | 1,018.20 | | | | 7.00 | | | | 1.38 | |
| Class R-2 - actual return | | | 1,000.00 | | | | 956.27 | | | | 6.79 | | | | 1.38 | |
| Class R-2 - assumed 5% return | | | 1,000.00 | | | | 1,018.20 | | | | 7.00 | | | | 1.38 | |
| Class R-2E - actual return | | | 1,000.00 | | | | 958.42 | | | | 4.09 | | | | .83 | |
| Class R-2E - assumed 5% return | | | 1,000.00 | | | | 1,020.96 | | | | 4.22 | | | | .83 | |
| Class R-3 - actual return | | | 1,000.00 | | | | 958.17 | | | | 4.63 | | | | .94 | |
| Class R-3 - assumed 5% return | | | 1,000.00 | | | | 1,020.41 | | | | 4.77 | | | | .94 | |
| Class R-4 - actual return | | | 1,000.00 | | | | 959.77 | | | | 3.10 | | | | .63 | |
| Class R-4 - assumed 5% return | | | 1,000.00 | | | | 1,021.97 | | | | 3.20 | | | | .63 | |
| Class R-5E - actual return† | | | 1,000.00 | | | | 965.32 | | | | .83 | | | | .43 | |
| Class R-5E - assumed 5% return† | | | 1,000.00 | | | | 1,022.97 | | | | 2.19 | | | | .43 | |
| Class R-5 - actual return | | | 1,000.00 | | | | 961.36 | | | | 1.63 | | | | .33 | |
| Class R-5 - assumed 5% return | | | 1,000.00 | | | | 1,023.48 | | | | 1.68 | | | | .33 | |
| Class R-6 - actual return | | | 1,000.00 | | | | 961.62 | | | | 1.38 | | | | .28 | |
| Class R-6 - assumed 5% return | | | 1,000.00 | | | | 1,023.73 | | | | 1.42 | | | | .28 | |
| * | The “expenses paid during period” are equal to the “annualized expense ratio,” multiplied by the average account value over the period, multiplied by the number of days in the period, and divided by 366 (to reflect the one-half year period). |
| † | The period for the “annualized expense ratio” and “actual return” line is based on the number of days since the initial sale of the share class on November 20, 2015. The “assumed 5% return” line is based on 184 days. |
| 42 | The Income Fund of America |
Approval of Investment Advisory and Service Agreement
The Income Fund of America board has approved the fund’s Investment Advisory and Service Agreement (the “agreement”) with Capital Research and Management Company (“CRMC”) for an additional one-year term through January 31, 2017. The agreement was amended to add an additional advisory fee breakpoint if and when the fund’s net assets exceed $115 billion. The board approved the agreement following the recommendation of the fund’s Contracts Committee (the “committee”), which is composed of all of the fund’s independent board members. The board and the committee determined that the fund’s advisory fee structure was fair and reasonable in relation to the services provided, and that approving the agreement was in the best interests of the fund and its shareholders.
In reaching this decision, the board and the committee took into account information furnished to them throughout the year and otherwise provided to them, as well as information prepared specifically in connection with their review of the agreement, and were advised by their independent counsel. They considered the following factors, among others, but did not identify any single issue or particular piece of information that, in isolation, was the controlling factor, and each board and committee member did not necessarily attribute the same weight to each factor.
1. Nature, extent and quality of services
The board and the committee considered the depth and quality of CRMC’s investment management process, including its global research capabilities; the experience, capability and integrity of its senior management and other personnel; the low turnover rates of its key personnel; the overall financial strength and stability of CRMC and the Capital Group organization; and the ongoing evolution of CRMC’s organizational structure designed to maintain and strengthen these qualities. The board and the committee also considered the nature, extent and quality of administrative, compliance and shareholder services provided by CRMC to the fund under the agreement and other agreements, as well as the benefits to fund shareholders from investing in a fund that is part of a large family of funds. The board and the committee concluded that the nature, extent and quality of the services provided by CRMC have benefited and should continue to benefit the fund and its shareholders.
2. Investment results
The board and the committee considered the investment results of the fund in light of its objectives of providing current income and, secondarily, growth of capital. They compared the fund’s investment results with those of other funds (including funds that form the basis of the Lipper index for the category in which the fund is included), and data such as relevant market and fund indexes, over various periods through May 31, 2015. This report, including the letter to shareholders and related disclosures, contains certain information about the fund’s investment results. The board and the committee reviewed the fund’s investment results measured against various indexes, including the Lipper Income Funds Index, the Lipper Equity Income Funds Index, the Standard & Poor’s 500 Composite Index and the Barclays U.S. Aggregate Index. They noted that the investment results of the fund generally compared favorably to those of these indexes for the lifetime, 20-year, 10-year and five-year periods, except the S&P 500 Index and the Lipper Equity Income Funds Index for the five-year period. They also noted that the volatility of the fund’s monthly returns for such periods was lower than that of the S&P 500 Index and the Lipper Equity Income Funds
| The Income Fund of America | 43 |
Index, although greater than the other indexes. The board and the committee concluded that the fund’s investment results have been satisfactory for renewal of the agreement, and that CRMC’s record in managing the fund indicated that its continued management should benefit the fund and its shareholders.
3. Advisory fees and total expenses
The board and the committee compared the advisory fees and total expense levels of the fund to those of other relevant funds. They observed that the fund’s advisory fees and expenses generally compared favorably to those of other similar funds included in the Lipper Income Funds category. The board and the committee also considered the breakpoint discounts in the fund’s advisory fee structure that reduce the level of fees charged by CRMC to the fund as fund assets increase. In addition, they reviewed information regarding the effective advisory fees charged to non-mutual fund clients by CRMC and its affiliates. They noted that, to the extent there were differences between the advisory fees paid by the fund and the advisory fees paid by those clients, the differences appropriately reflected the investment, operational and regulatory differences between advising the fund and the other clients. The board and the committee concluded that the fund’s cost structure was fair and reasonable in relation to the services provided, and that the fund’s shareholders receive reasonable value in return for the advisory fees and other amounts paid to CRMC by the fund.
4. Ancillary benefits
The board and the committee considered a variety of other benefits that CRMC and its affiliates receive as a result of CRMC’s relationship with the fund and the other American Funds, including fees for administrative services provided to certain share classes; fees paid to CRMC’s affiliated transfer agent; sales charges and distribution fees received and retained by the fund’s principal underwriter, an affiliate of CRMC; and possible ancillary benefits to CRMC and its institutional management affiliates in managing other investment vehicles. The board and the committee reviewed CRMC’s portfolio trading practices, noting the benefits CRMC receives from the research obtained with commissions from portfolio transactions made on behalf of the fund. The board and the committee took these ancillary benefits into account in evaluating the reasonableness of the advisory fees and other amounts paid to CRMC by the fund.
5. Adviser financial information
The board and the committee reviewed information regarding CRMC’s costs of providing services to the American Funds, including personnel, systems and resources of investment, compliance, trading, accounting and other administrative operations. They considered CRMC’s costs and related cost allocation methodology as well as its willingness to invest in technology, infrastructure and staff to maintain and expand services and capabilities, respond to industry and regulatory developments, and attract and retain qualified personnel. They noted information regarding the compensation structure for CRMC’s investment professionals. The board and the committee also compared CRMC’s profitability and compensation data to the reported results and data of several large, publicly held investment management companies. The board and the committee noted the competitiveness and cyclicality of both the mutual fund industry and the capital markets, and the importance in that environment of CRMC’s long-term profitability for maintaining its independence, company culture and management continuity. They further considered the breakpoint discounts in the fund’s advisory fee structure. The board and the committee concluded that the fund’s advisory fee structure reflected a reasonable sharing of benefits between CRMC and the fund’s shareholders.
| 44 | The Income Fund of America |
Office of the fund
6455 Irvine Center Drive
Irvine, CA 92618-4518
Investment adviser
Capital Research and Management Company
333 South Hope Street
Los Angeles, CA 90071-1406
6455 Irvine Center Drive
Irvine, CA 92618-4518
Transfer agent for shareholder accounts
American Funds Service Company
(Write to the address near you.)
P.O. Box 6007
Indianapolis, IN 46206-6007
P.O. Box 2280
Norfolk, VA 23501-2280
Custodian of assets
JPMorgan Chase Bank
270 Park Avenue
New York, NY 10017-2070
Counsel
Morgan, Lewis & Bockius LLP
300 South Grand Avenue, 22nd Floor
Los Angeles, CA 90071-3132
Independent registered public accounting firm
Deloitte & Touche LLP
695 Town Center Drive
Suite 1200
Costa Mesa, CA 92626-7188
Principal underwriter
American Funds Distributors, Inc.
333 South Hope Street
Los Angeles, CA 90071-1406
Investors should carefully consider investment objectives, risks, charges and expenses. This and other important information is contained in the fund prospectus and summary prospectus, which can be obtained from your financial professional and should be read carefully before investing. You may also call American Funds Service Company (AFS) at (800) 421-4225 or visit the American Funds website at americanfunds.com.
“American Funds Proxy Voting Procedures and Principles” — which describes how we vote proxies relating to portfolio securities — is available on the American Funds website or upon request by calling AFS. The fund files its proxy voting record with the U.S. Securities and Exchange Commission (SEC) for the 12 months ended June 30 by August 31. The proxy voting record is available free of charge on the SEC website at sec.gov and on the American Funds website.
A complete January 31, 2016, portfolio of The Income Fund of America’s investments is available free of charge by calling AFS or visiting the SEC website (where it is part of Form N-CSR).
The Income Fund of America files a complete list of its portfolio holdings with the SEC for the first and third quarters of each fiscal year on Form N-Q. This filing is available free of charge on the SEC website. You may also review or, for a fee, copy this filing at the SEC’s Public Reference Room in Washington, D.C. Additional information regarding the operation of the Public Reference Room may be obtained by calling the SEC’s Office of Investor Education and Advocacy at (800) SEC-0330. Additionally, the list of portfolio holdings is available by calling AFS.
This report is for the information of shareholders of The Income Fund of America, but it also may be used as sales literature when preceded or accompanied by the current prospectus or summary prospectus, which gives details about charges, expenses, investment objectives and operating policies of the fund. If used as sales material after March 31, 2016, this report must be accompanied by an American Funds statistical update for the most recently completed calendar quarter.
The American Funds Advantage
Since 1931, American Funds, part of Capital Group, has helped investors pursue long-term investment success. Our consistent approach — in combination with The Capital SystemSM — has resulted in a superior long-term track record.
| | Aligned with investor success |
| | We base our decisions on a long-term perspective, which we believe aligns our goals with the interests of our clients. Our portfolio managers average 27 years of investment experience, including 22 years at our company, reflecting a career commitment to our long-term approach.1 |
| | |
| | The Capital SystemSM |
| | The Capital System combines individual accountability with teamwork. Funds using The Capital System are divided into portions that are managed independently by investment professionals with diverse backgrounds, ages and investment approaches. An extensive global research effort is the backbone of our system. |
| | |
| | Superior long-term track record |
| | Our equity funds have beaten their Lipper peer indexes in 91% of 10-year periods and 95% of 20-year periods. Our fixed-income funds have beaten their Lipper indexes in 58% of 10-year periods and 58% of 20-year periods.2 Our fund management fees have been among the lowest in the industry.3 |
| | |
| | 1 | Portfolio manager experience as of December 31, 2015. |
| | 2 | Based on Class A share results for rolling periods through December 31, 2015. Periods covered are the shorter of the fund’s lifetime or since the comparable Lipper index inception date (except Capital Income Builder and SMALLCAP World Fund, for which the Lipper average was used). |
| | 3 | On average, our management fees were in the lowest quintile 68% of the time, based on the 20-year period ended December 31, 2015, versus comparable Lipper categories, excluding funds of funds. |

ITEM 2 – Code of Ethics
Not applicable for filing of semi-annual reports to shareholders.
ITEM 3 – Audit Committee Financial Expert
Not applicable for filing of semi-annual reports to shareholders.
ITEM 4 – Principal Accountant Fees and Services
Not applicable for filing of semi-annual reports to shareholders.
ITEM 5 – Audit Committee of Listed Registrants
Not applicable to this Registrant, insofar as the Registrant is not a listed issuer as defined in Rule 10A-3 under the Securities Exchange Act of 1934.
ITEM 6 – Schedule of Investments
The Income Fund of America®
Investment portfolio
January 31, 2016
Common stocks 70.22%
Industrials 9.91% | Shares | Value
(000) |
| General Electric Co. | 77,722,474 | $2,261,724 |
| Lockheed Martin Corp. | 7,999,400 | 1,687,873 |
| BAE Systems PLC1 | 131,426,883 | 970,013 |
| Waste Management, Inc. | 16,181,128 | 856,791 |
| Ryanair Holdings PLC (ADR) | 6,452,401 | 505,546 |
| KONE Oyj, Class B1 | 7,723,000 | 339,264 |
| Norfolk Southern Corp. | 4,400,000 | 310,200 |
| Hubbell Inc., Class B | 3,430,000 | 310,175 |
| PACCAR Inc | 5,952,500 | 292,089 |
| Caterpillar Inc. | 4,630,000 | 288,171 |
| Boeing Co. | 2,220,000 | 266,689 |
| Edenred SA1 | 11,360,000 | 215,338 |
| R.R. Donnelley & Sons Co.2 | 13,345,400 | 186,435 |
| Macquarie Infrastructure Corp. | 2,490,000 | 166,979 |
| TransDigm Group Inc.3 | 630,000 | 141,580 |
| Abertis Infraestructuras, SA, Class A1 | 9,267,930 | 138,690 |
| United Technologies Corp. | 593,482 | 52,043 |
| Geberit AG1 | 127,000 | 45,016 |
| Douglas Dynamics, Inc.2 | 1,444,000 | 28,678 |
| CEVA Group PLC1,3,4 | 35,229 | 15,853 |
| Atrium Corp.1,3,4 | 1,807 | 2 |
| | | 9,079,149 |
| Consumer staples 9.26% | | |
| Procter & Gamble Co. | 17,161,700 | 1,401,939 |
| Coca-Cola Co. | 28,511,000 | 1,223,692 |
| Philip Morris International Inc. | 12,805,004 | 1,152,579 |
| Reynolds American Inc. | 18,601,668 | 929,153 |
| Altria Group, Inc. | 11,076,000 | 676,854 |
| British American Tobacco PLC1 | 11,758,200 | 653,701 |
| Kellogg Co. | 5,550,000 | 407,592 |
| Costco Wholesale Corp. | 2,441,530 | 368,964 |
| Nestlé SA1 | 4,395,000 | 323,720 |
| Kimberly-Clark Corp. | 2,100,000 | 269,682 |
| Hershey Co. | 3,000,000 | 264,330 |
| Campbell Soup Co. | 4,500,000 | 253,845 |
| General Mills, Inc. | 4,170,000 | 235,647 |
| PepsiCo, Inc. | 2,350,000 | 233,355 |
| Kraft Heinz Co. | 1,029,667 | 80,376 |
| | | 8,475,429 |
| Financials 9.04% | | |
| JPMorgan Chase & Co. | 23,673,157 | 1,408,553 |
| Wells Fargo & Co. | 21,365,915 | 1,073,210 |
| CME Group Inc., Class A | 10,140,400 | 911,115 |
| Crown Castle International Corp. | 9,554,000 | 823,555 |
| Public Storage | 2,240,000 | 567,974 |
The Income Fund of America — Page 1 of 35
Common stocks
Financials (continued) | Shares | Value
(000) |
| Digital Realty Trust, Inc. | 6,885,000 | $551,351 |
| Iron Mountain Inc.2 | 13,724,780 | 377,980 |
| Lamar Advertising Co., Class A | 5,253,322 | 294,764 |
| Prologis, Inc. | 6,772,464 | 267,309 |
| PacWest Bancorp | 5,868,000 | 215,414 |
| Toronto-Dominion Bank (CAD denominated) | 5,639,579 | 213,965 |
| Outfront Media Inc.2 | 9,064,824 | 197,160 |
| BlackRock, Inc. | 500,000 | 157,130 |
| New York Community Bancorp, Inc. | 7,315,000 | 113,236 |
| Link Real Estate Investment Trust1 | 19,651,812 | 112,487 |
| Camden Property Trust | 1,270,300 | 96,924 |
| Sun Hung Kai Properties Ltd.1 | 7,850,234 | 85,364 |
| Simon Property Group, Inc. | 450,000 | 83,826 |
| Umpqua Holdings Corp. | 5,541,365 | 80,239 |
| Apollo Global Management, LLC, Class A | 5,479,700 | 74,414 |
| Fibra Uno Administración, SA de CV | 34,500,000 | 69,161 |
| AXA SA1 | 2,685,000 | 66,493 |
| Equity Residential | 812,000 | 62,597 |
| Redwood Trust, Inc.2 | 5,444,717 | 58,640 |
| Allianz SE1 | 350,000 | 56,490 |
| HSBC Holdings PLC (HKD denominated)1 | 7,637,734 | 54,050 |
| Banco Santander, SA1 | 12,216,563 | 52,760 |
| Svenska Handelsbanken AB, Class A1 | 2,880,000 | 36,184 |
| City Holding Co. | 741,000 | 32,945 |
| Foxtons Group PLC1 | 13,689,000 | 32,910 |
| Suncorp Group Ltd.1 | 3,474,508 | 28,828 |
| Prudential PLC1 | 1,078,000 | 21,190 |
| Weyerhaeuser Co.3 | 164,405 | 4,210 |
| | | 8,282,428 |
| Information technology 9.03% | | |
| Microsoft Corp. | 61,766,639 | 3,402,724 |
| Intel Corp. | 50,876,100 | 1,578,177 |
| Texas Instruments Inc. | 15,550,000 | 823,062 |
| Analog Devices, Inc. | 14,116,091 | 760,293 |
| Taiwan Semiconductor Manufacturing Co., Ltd.1 | 166,349,000 | 708,558 |
| Taiwan Semiconductor Manufacturing Co., Ltd. (ADR) | 1,234,900 | 27,600 |
| KLA-Tencor Corp. | 3,700,290 | 247,882 |
| Maxim Integrated Products, Inc. | 7,046,000 | 235,336 |
| Cisco Systems, Inc. | 6,000,000 | 142,740 |
| Paychex, Inc. | 2,785,500 | 133,314 |
| Diebold, Inc.2 | 4,222,000 | 117,034 |
| Quanta Computer Inc.1 | 33,916,655 | 54,226 |
| STMicroelectronics NV1 | 5,898,744 | 38,902 |
| | | 8,269,848 |
| Health care 7.53% | | |
| Merck & Co., Inc. | 44,948,227 | 2,277,527 |
| Pfizer Inc. | 43,625,000 | 1,330,126 |
| GlaxoSmithKline PLC1 | 44,865,000 | 924,245 |
| AstraZeneca PLC1 | 10,671,583 | 682,698 |
| Bristol-Myers Squibb Co. | 10,850,500 | 674,467 |
| Eli Lilly and Co. | 6,855,700 | 542,286 |
| Novartis AG1 | 2,355,000 | 182,670 |
| Novartis AG (ADR) | 500,000 | 38,985 |
The Income Fund of America — Page 2 of 35
Common stocks
Health care (continued) | Shares | Value
(000) |
| AbbVie Inc. | 2,500,000 | $137,250 |
| Roche Holding AG, non-registered shares, non-voting1 | 400,000 | 104,064 |
| Rotech Healthcare Inc.1,2,3 | 543,172 | 4,079 |
| | | 6,898,397 |
| Consumer discretionary 6.09% | | |
| McDonald’s Corp. | 16,506,815 | 2,043,214 |
| Target Corp. | 12,143,000 | 879,396 |
| Home Depot, Inc. | 5,595,000 | 703,627 |
| General Motors Co. | 14,742,512 | 436,968 |
| Hasbro, Inc. | 4,018,246 | 298,475 |
| Marks and Spencer Group PLC1 | 40,000,000 | 242,920 |
| Time Warner Cable Inc. | 1,050,000 | 191,110 |
| ProSiebenSat.1 Media SE1 | 3,345,000 | 166,515 |
| Starwood Hotels & Resorts Worldwide, Inc. | 2,650,000 | 164,936 |
| Compass Group PLC1 | 7,411,761 | 127,766 |
| SES SA, Class A (FDR)1 | 4,870,000 | 127,617 |
| Nokian Renkaat Oyj1 | 2,247,723 | 76,312 |
| Wynn Macau, Ltd.1 | 61,868,493 | 67,200 |
| Cooper-Standard Holdings Inc.3 | 526,100 | 36,438 |
| TopBuild Corp.3 | 649,777 | 17,401 |
| Adelphia Recovery Trust, Series ACC-11,3 | 9,913,675 | — |
| | | 5,579,895 |
| Energy 4.70% | | |
| ConocoPhillips | 29,894,562 | 1,168,280 |
| Chevron Corp. | 10,920,000 | 944,252 |
| Spectra Energy Corp | 26,735,500 | 733,890 |
| BP PLC1 | 91,850,000 | 497,667 |
| Royal Dutch Shell PLC, Class B (ADR) | 6,196,000 | 273,429 |
| Royal Dutch Shell PLC, Class B1 | 5,047,147 | 110,364 |
| Coal India Ltd.1 | 59,400,000 | 281,405 |
| Helmerich & Payne, Inc. | 4,100,000 | 208,280 |
| Keyera Corp. | 2,665,400 | 73,061 |
| Husky Energy Inc. | 1,187,553 | 11,817 |
| | | 4,302,445 |
| Telecommunication services 4.06% | | |
| Verizon Communications Inc. | 30,407,921 | 1,519,484 |
| Telstra Corp. Ltd.1 | 173,321,533 | 696,196 |
| BT Group PLC1 | 45,572,915 | 316,991 |
| AT&T Inc. | 7,720,000 | 278,383 |
| HKT Trust and HKT Ltd., units1 | 189,354,135 | 248,851 |
| TalkTalk Telecom Group PLC1,2 | 58,421,891 | 183,979 |
| NTT DoCoMo, Inc.1 | 8,090,000 | 180,470 |
| Orange1 | 9,000,000 | 161,208 |
| TDC A/S1 | 20,520,000 | 87,874 |
| NII Holdings, Inc., Class B2,3 | 7,991,969 | 29,171 |
| Mobile TeleSystems OJSC (ADR) | 2,270,000 | 15,890 |
| | | 3,718,497 |
| Materials 3.39% | | |
| Dow Chemical Co. | 18,957,976 | 796,235 |
| E.I. du Pont de Nemours and Co. | 14,124,268 | 745,197 |
| LyondellBasell Industries NV | 4,830,000 | 376,595 |
The Income Fund of America — Page 3 of 35
Common stocks
Materials (continued) | Shares | Value
(000) |
| Air Products and Chemicals, Inc. | 2,048,886 | $259,614 |
| BASF SE1 | 3,500,000 | 231,944 |
| Rio Tinto PLC1 | 6,718,000 | 165,233 |
| Rexam PLC1 | 16,120,088 | 138,075 |
| WestRock Co. | 3,874,832 | 136,704 |
| Potash Corp. of Saskatchewan Inc. | 6,400,000 | 104,320 |
| Nucor Corp. | 2,000,000 | 78,140 |
| Amcor Ltd.1 | 7,785,000 | 73,843 |
| | | 3,105,900 |
| Utilities 3.32% | | |
| Power Assets Holdings Ltd.1 | 73,605,500 | 673,222 |
| DTE Energy Co. | 5,275,000 | 448,428 |
| Duke Energy Corp. | 5,874,999 | 442,387 |
| EDP - Energias de Portugal, SA1 | 112,077,366 | 391,797 |
| Dominion Resources, Inc. | 5,070,000 | 365,902 |
| SSE PLC1 | 11,050,005 | 229,597 |
| HK Electric Investments and HK Electric Investments Ltd., units1 | 230,870,000 | 180,270 |
| National Grid PLC1 | 11,900,000 | 167,724 |
| NextEra Energy, Inc. | 640,000 | 71,494 |
| Ratchaburi Electricity Generating Holding PCL1 | 35,748,000 | 49,937 |
| PG&E Corp. | 283,607 | 15,573 |
| | | 3,036,331 |
| Miscellaneous 3.89% | | |
| Other common stocks in initial period of acquisition | | 3,559,570 |
| Total common stocks (cost: $54,019,211,000) | | 64,307,889 |
Preferred securities 0.50%
Financials 0.50% | | |
| Citigroup Inc., Series K, depositary shares | 2,463,848 | 67,682 |
| Citigroup Inc. 7.875% preferred | 2,637,610 | 67,444 |
| Vornado Realty Trust, Series I, 6.625% | 3,380,000 | 87,136 |
| U.S. Bancorp, Series G, noncumulative convertible preferred | 2,270,400 | 60,075 |
| PNC Financial Services Group, Inc., Series P, noncumulative depositary shares | 2,000,000 | 55,760 |
| Wells Fargo & Co., Class A, Series Q, 5.85% depositary shares preferred noncumulative | 1,600,000 | 41,360 |
| HSBC Holdings PLC, Series 2, 8.00% | 1,505,000 | 39,220 |
| Goldman Sachs Group, Inc., Series J, 5.50% depositary shares | 1,200,000 | 29,964 |
| Morgan Stanley, Series I, depositary shares | 272,400 | 7,080 |
| Total preferred securities (cost: $436,429,000) | | 455,721 |
Rights & warrants 0.00%
Energy 0.00% | | |
| Gener8 Maritime, Inc., warrants, expire 20171,3,4 | 8,514 | — |
| Total rights & warrants (cost: $2,171,000) | | — |
The Income Fund of America — Page 4 of 35
Convertible stocks 0.59%
Materials 0.08% | Shares | Value
(000) |
| Alcoa Inc., Class B, Series 1, cummulative convertible preferred 2017 | 2,500,000 | $65,875 |
| Cliffs Natural Resources Inc., Series A, 7.00% convertible preferred 20162 | 2,700,000 | 3,861 |
| | | 69,736 |
| Financials 0.06% | | |
| American Tower Corp., Series A, convertible preferred | 600,000 | 59,496 |
| Energy 0.05% | | |
| Southwestern Energy Co., Series B, 6.25% convertible preferred 2018 | 2,060,000 | 42,024 |
| Chesapeake Energy Corporation 5.75% convertible preferred4 | 13,000 | 1,950 |
| | | 43,974 |
| Consumer staples 0.03% | | |
| Bunge Ltd. 4.875% convertible preferred | 322,700 | 28,597 |
| Industrials 0.03% | | |
| CEVA Group PLC, Series A-1, 3.622% convertible preferred1,5 | 29,937 | 18,411 |
| CEVA Group PLC, Series A-2, 2.622% convertible preferred1,5 | 13,633 | 6,135 |
| | | 24,546 |
| Miscellaneous 0.34% | | |
| Other convertible stocks in initial period of acquisition | | 307,838 |
| Total convertible stocks (cost: $772,184,000) | | 534,187 |
Convertible bonds 0.67%
Financials 0.67% | Principal amount
(000) | |
| Barclays PLC, Equity Linked Notes (Weyerhaeuser Co.), 4.52% 2016 | $ 4,206 | 105,799 |
| Barclays PLC, Equity Linked Notes (Weyerhaeuser Co.), 4.10% 2016 | 7,090 | 182,035 |
| Goldman Sachs, Equity Linked Notes (VF Corp), 4.30% 2016 | 2,161 | 134,783 |
| Goldman Sachs, Equity Linked Notes (Weyerhaeuser Co.), 4.10% 2016 | 6,562 | 166,213 |
| Lloyds Banking Group PLC, convertible notes, 7.50% 2049 | 21,200 | 21,995 |
| | | 610,825 |
| Energy 0.00% | | |
| American Energy (Permian Basin), convertible notes, 8.00% 20221,4,6 | 23,400 | 3,510 |
| American Energy Utica, LLC, convertible notes, 3.50% 20211,4,6 | 54,164 | 1,896 |
| | | 5,406 |
| Total convertible bonds (cost: $810,924,000) | | 616,231 |
Bonds, notes & other debt instruments 22.84%
Corporate bonds & notes 14.38%
Financials 2.58% | | |
| ACE INA Holdings Inc. 2.30% 2020 | 4,485 | 4,502 |
| ACE INA Holdings Inc. 2.875% 2022 | 9,345 | 9,478 |
| ACE INA Holdings Inc. 3.15% 2025 | 9,885 | 9,957 |
| ACE INA Holdings Inc. 3.35% 2026 | 9,345 | 9,538 |
| ACE INA Holdings Inc. 4.35% 2045 | 1,395 | 1,468 |
| Alexandria Real Estate Equities, Inc. 2.75% 2020 | 795 | 793 |
| Alexandria Real Estate Equities, Inc. 3.90% 2023 | 1,600 | 1,615 |
The Income Fund of America — Page 5 of 35
Bonds, notes & other debt instruments
Corporate bonds & notes (continued)
Financials (continued) | Principal amount
(000) | Value
(000) |
| Alexandria Real Estate Equities, Inc. 4.30% 2026 | $2,200 | $2,238 |
| Alexandria Real Estate Equities, Inc. 4.50% 2029 | 1,355 | 1,365 |
| American Campus Communities, Inc. 3.35% 2020 | 3,380 | 3,434 |
| American Campus Communities, Inc. 3.75% 2023 | 3,985 | 3,972 |
| American Campus Communities, Inc. 4.125% 2024 | 19,700 | 19,979 |
| American Express Co. 6.15% 2017 | 12,610 | 13,444 |
| American Express Credit Co. 1.55% 2017 | 7,730 | 7,737 |
| American International Group, Inc. 2.30% 2019 | 9,785 | 9,827 |
| American International Group, Inc. 3.75% 2025 | 1,500 | 1,442 |
| American International Group, Inc. 3.875% 2035 | 5,000 | 4,139 |
| American Tower Corp. 3.40% 2019 | 6,400 | 6,562 |
| American Tower Corp. 7.25% 2019 | 15,025 | 17,124 |
| AXA SA, Series B, junior subordinated 6.379% (undated)4 | 4,155 | 4,446 |
| Bank of America Corp. 3.75% 2016 | 9,975 | 10,091 |
| Bank of America Corp. 5.75% 2017 | 8,100 | 8,619 |
| Bank of America Corp. 2.625% 2020 | 3,633 | 3,595 |
| Bank of America Corp. 5.625% 2020 | 9,000 | 9,988 |
| Bank of America Corp. 5.00% 2021 | 3,500 | 3,839 |
| Bank of America Corp. 3.30% 2023 | 5,200 | 5,129 |
| Bank of America Corp., Series AA, 6.10% (undated) | 7,900 | 8,042 |
| Bank of America Corp., junior subordinated 6.50% noncumulative (undated) | 5,600 | 5,847 |
| Bank of America Corp., Series M, junior subordinated 8.125% noncumulative (undated) | 30,924 | 31,407 |
| Barclays Bank PLC 3.25% 2021 | 8,600 | 8,648 |
| Barclays Bank PLC 3.65% 2025 | 16,785 | 16,122 |
| Barclays Bank PLC 4.375% 2026 | 5,460 | 5,522 |
| BB&T Corp. 2.45% 2020 | 19,000 | 19,263 |
| Berkshire Hathaway Finance Corp. 4.30% 2043 | 1,800 | 1,767 |
| Berkshire Hathaway Inc. 2.20% 2016 | 11,500 | 11,596 |
| Berkshire Hathaway Inc. 2.90% 2020 | 6,000 | 6,296 |
| BNP Paribas 3.60% 2016 | 10,000 | 10,016 |
| BPCE SA group 2.65% 2021 | 4,000 | 4,015 |
| BPCE SA group 5.70% 20234 | 5,500 | 5,742 |
| BPCE SA group 4.625% 20244 | 6,400 | 6,279 |
| BPCE SA group 5.15% 20244 | 6,060 | 6,082 |
| Brandywine Operating Partnership, LP 5.70% 2017 | 20 | 21 |
| Brandywine Operating Partnership, LP 3.95% 2023 | 1,729 | 1,722 |
| CIT Group Inc. 4.25% 2017 | 9,000 | 9,112 |
| CIT Group Inc. 5.00% 2017 | 11,000 | 11,261 |
| CIT Group Inc. 3.875% 2019 | 61,255 | 60,918 |
| CIT Group Inc., Series C, 5.50% 20194 | 13,650 | 14,128 |
| Citigroup Inc. 3.953% 2016 | 7,115 | 7,203 |
| Citigroup Inc. 8.50% 2019 | 4,894 | 5,819 |
| Citigroup Inc. 3.70% 2026 | 32,800 | 32,855 |
| Citigroup Inc. 4.45% 2027 | 17,845 | 17,695 |
| Citigroup Inc, Series O, 5.875% (undated) | 10,675 | 10,381 |
| Citigroup Inc., Series P, 5.95% (undated) | 25,090 | 24,376 |
| Citigroup Inc., Series A, junior subordinated 5.95% (undated) | 13,295 | 12,979 |
| CNA Financial Corp. 3.95% 2024 | 5,000 | 5,069 |
| Communications Sales & Leasing, Inc. 6.00% 20234 | 15,000 | 14,362 |
| Communications Sales & Leasing, Inc. 8.25% 2023 | 17,213 | 15,277 |
| Corporate Office Properties LP 5.25% 2024 | 9,630 | 9,884 |
| Corporate Office Properties LP 5.00% 2025 | 4,145 | 4,188 |
| Corporate Office Properties Trust 3.60% 2023 | 320 | 298 |
| Credit Agricole SA 4.375% 20254 | 21,920 | 21,253 |
The Income Fund of America — Page 6 of 35
Bonds, notes & other debt instruments
Corporate bonds & notes (continued)
Financials (continued) | Principal amount
(000) | Value
(000) |
| Credit Suisse Group Funding (Guernsey) Ltd. 4.875% 2045 | $3,000 | $2,972 |
| Crescent Resources 10.25% 20174 | 36,046 | 36,181 |
| Crown Castle International Corp. 4.875% 2022 | 9,800 | 10,302 |
| DCT Industrial Trust Inc. 4.50% 2023 | 5,150 | 5,275 |
| DDR Corp. 3.625% 2025 | 5,000 | 4,786 |
| Developers Diversified Realty Corp. 9.625% 2016 | 2,525 | 2,550 |
| Developers Diversified Realty Corp. 7.50% 2017 | 38,892 | 41,254 |
| Developers Diversified Realty Corp. 4.75% 2018 | 5,000 | 5,246 |
| Developers Diversified Realty Corp. 7.875% 2020 | 6,505 | 7,888 |
| Discover Financial Services 4.20% 2023 | 5,460 | 5,573 |
| EPR Properties 4.50% 2025 | 7,945 | 7,770 |
| ERP Operating LP 7.125% 2017 | 10,000 | 10,887 |
| Essex Portfolio L.P. 3.625% 2022 | 9,550 | 9,783 |
| Essex Portfolio L.P. 3.25% 2023 | 4,400 | 4,351 |
| Essex Portfolio L.P. 3.875% 2024 | 12,650 | 12,960 |
| Essex Portfolio L.P. 3.50% 2025 | 5,620 | 5,504 |
| Goldman Sachs Group, Inc. 3.625% 2016 | 22,600 | 22,607 |
| Goldman Sachs Group, Inc. 1.312% 20177 | 19,550 | 19,515 |
| Goldman Sachs Group, Inc. 2.55% 2019 | 16,200 | 16,231 |
| Goldman Sachs Group, Inc. 1.712% 20207 | 10,440 | 10,398 |
| Goldman Sachs Group, Inc. 2.60% 2020 | 7,900 | 7,857 |
| Goldman Sachs Group, Inc. 5.25% 2021 | 3,000 | 3,333 |
| Goldman Sachs Group, Inc. 5.75% 2022 | 20,000 | 22,738 |
| Goldman Sachs Group, Inc. 3.85% 2024 | 8,620 | 8,760 |
| Goldman Sachs Group, Inc. 4.75% 2045 | 9,580 | 9,534 |
| Goldman Sachs Group, Inc. 5.15% 2045 | 900 | 877 |
| HBOS PLC 6.75% 20184 | 17,300 | 18,950 |
| Hospitality Properties Trust 6.30% 2016 | 8,650 | 8,676 |
| Hospitality Properties Trust 5.625% 2017 | 10,169 | 10,504 |
| Hospitality Properties Trust 6.70% 2018 | 12,625 | 13,359 |
| Hospitality Properties Trust 4.25% 2021 | 20,500 | 20,400 |
| Hospitality Properties Trust 5.00% 2022 | 6,500 | 6,723 |
| Hospitality Properties Trust 4.50% 2023 | 11,060 | 11,026 |
| Hospitality Properties Trust 4.50% 2025 | 5,940 | 5,752 |
| Host Hotels & Resorts LP 4.50% 2026 | 6,380 | 6,405 |
| HSBC Holdings PLC 4.25% 2024 | 9,000 | 8,920 |
| HSBK (Europe) BV 7.25% 20174 | 22,570 | 22,910 |
| Icahn Enterprises Finance Corp. 3.50% 2017 | 23,075 | 22,960 |
| Intercontinentalexchange, Inc. 2.50% 2018 | 12,000 | 12,235 |
| Intesa Sanpaolo SpA 5.017% 20244 | 28,110 | 27,013 |
| Iron Mountain Inc. 6.00% 20202,4 | 31,925 | 34,080 |
| Iron Mountain Inc. 6.00% 20232 | 950 | 992 |
| Iron Mountain Inc. 5.75% 20242 | 4,325 | 4,287 |
| iStar Financial Inc. 4.00% 2017 | 28,625 | 27,051 |
| iStar Financial Inc. 4.875% 2018 | 11,575 | 11,098 |
| iStar Financial Inc. 5.00% 2019 | 14,275 | 13,472 |
| iStar Financial Inc., Series B, 9.00% 2017 | 37,360 | 38,341 |
| JPMorgan Chase & Co. 1.35% 2017 | 12,240 | 12,241 |
| JPMorgan Chase & Co. 2.25% 2020 | 10,000 | 9,924 |
| JPMorgan Chase & Co. 2.55% 2020 | 11,150 | 11,124 |
| JPMorgan Chase & Co. 3.25% 2022 | 5,000 | 5,040 |
| JPMorgan Chase & Co., Series Z, junior subordinated 5.30% (undated) | 36,425 | 36,197 |
| JPMorgan Chase & Co., Series S, junior subordinated 6.75% (undated) | 36,535 | 39,595 |
| JPMorgan Chase & Co., Series I, junior subordinated 7.90% (undated) | 74,825 | 75,620 |
The Income Fund of America — Page 7 of 35
Bonds, notes & other debt instruments
Corporate bonds & notes (continued)
Financials (continued) | Principal amount
(000) | Value
(000) |
| Keybank National Association 2.50% 2019 | $9,000 | $9,124 |
| Kimco Realty Corp. 5.70% 2017 | 17,250 | 18,085 |
| Kimco Realty Corp. 6.875% 2019 | 10,000 | 11,484 |
| Kimco Realty Corp. 3.40% 2022 | 5,460 | 5,532 |
| Kimco Realty Corp., Series C, 5.783% 2016 | 15,000 | 15,070 |
| Leucadia National Corp. 5.50% 2023 | 13,255 | 12,633 |
| Liberty Mutual Group Inc. 4.25% 20234 | 4,400 | 4,529 |
| Liberty Mutual Group Inc., Series A, 7.80% 20874 | 19,415 | 22,182 |
| Lloyds Banking Group PLC 2.30% 2018 | 3,625 | 3,663 |
| Lloyds Banking Group PLC 4.50% 2024 | 19,000 | 19,526 |
| MetLife Capital Trust IV, junior subordinated 7.875% 20674 | 14,430 | 17,388 |
| MetLife Capital Trust X, junior subordinated 9.25% 20684 | 500 | 671 |
| MetLife Global Funding I 2.30% 20194 | 8,435 | 8,494 |
| MetLife Global Funding I 2.00% 20204 | 5,135 | 5,057 |
| MetLife Global Funding I 2.50% 20204 | 4,000 | 4,012 |
| Metlife, Inc. 3.60% 2025 | 535 | 538 |
| Metlife, Inc. 4.60% 2046 | 545 | 535 |
| MetLife, Inc. 5.25% 2049 | 12,850 | 12,585 |
| Morgan Stanley 3.80% 2016 | 5,125 | 5,161 |
| Morgan Stanley 1.996% 20197 | 5,407 | 5,437 |
| Morgan Stanley 3.875% 2026 | 30,195 | 30,568 |
| Morgan Stanley 4.35% 2026 | 10,200 | 10,253 |
| Morgan Stanley 4.30% 2045 | 3,375 | 3,197 |
| Nationwide Mutual Insurance Co. 2.802% 20244,7 | 8,150 | 7,902 |
| New York Life Global Funding 2.10% 20194 | 11,000 | 11,076 |
| New York Life Global Funding 1.95% 20204 | 1,820 | 1,812 |
| Nordea Bank AB 2.50% 20204 | 7,425 | 7,477 |
| PNC Bank 2.40% 2019 | 7,825 | 7,906 |
| PNC Financial Services Group, Inc. 2.854% 2022 | 8,395 | 8,399 |
| PNC Financial Services Group, Inc. 3.90% 2024 | 9,386 | 9,787 |
| PNC Financial Services Group, Inc., Series O, junior subordinated 6.75% (undated) | 10,250 | 11,019 |
| PNC Preferred Funding Trust I, junior subordinated 2.162% (undated)4,7 | 23,800 | 21,182 |
| Prologis, Inc. 3.35% 2021 | 1,950 | 1,995 |
| Prologis, Inc. 4.25% 2023 | 25,000 | 26,484 |
| Prologis, Inc. 3.75% 2025 | 1,520 | 1,536 |
| Prudential Financial, Inc. 3.50% 2024 | 9,000 | 8,937 |
| Prudential Financial, Inc. 4.60% 2044 | 2,500 | 2,411 |
| QBE Insurance Group Ltd. 2.40% 20184 | 16,910 | 16,954 |
| Rabobank Nederland 2.25% 2019 | 8,000 | 8,093 |
| Rabobank Nederland 2.50% 2021 | 6,525 | 6,578 |
| Rabobank Nederland 4.375% 2025 | 9,000 | 9,181 |
| RBS Capital Trust II 6.425% noncumulative trust (undated) | 6,005 | 6,515 |
| Realogy Corp. 4.50% 20194 | 38,250 | 38,967 |
| Realogy Corp. 5.25% 20214 | 23,600 | 24,131 |
| Realogy Corp., Barclays PLC LOC, 4.40% 20167,8,9 | 3,374 | 3,326 |
| Royal Bank of Scotland Group PLC, junior subordinated 6.99% (undated)4 | 12,735 | 14,645 |
| Scentre Group 2.375% 20214 | 4,575 | 4,496 |
| Scentre Group 3.25% 20254 | 7,580 | 7,305 |
| Scentre Group 3.50% 20254 | 17,280 | 17,060 |
| Select Income REIT 3.60% 2020 | 5,775 | 5,837 |
| Select Income REIT 4.15% 2022 | 3,300 | 3,222 |
| Select Income REIT 4.50% 2025 | 2,540 | 2,353 |
| SMFG Preferred Capital USD 3 Ltd., junior subordinated 9.50% (undated)4 | 67,890 | 78,854 |
| Société Générale, junior subordinated 5.922% (undated)4 | 45,073 | 45,749 |
The Income Fund of America — Page 8 of 35
Bonds, notes & other debt instruments
Corporate bonds & notes��(continued)
Financials (continued) | Principal amount
(000) | Value
(000) |
| Synovus Financial Corp. 7.875% 2019 | $23,506 | $25,768 |
| Travelers Property Casualty Corp. 4.30% 2045 | 1,500 | 1,561 |
| UBS Group AG 2.95% 20204 | 10,000 | 9,964 |
| UBS Group AG 4.125% 20254 | 4,425 | 4,427 |
| UDR, Inc. 4.00% 2025 | 1,000 | 1,039 |
| Unum Group 7.125% 2016 | 6,740 | 6,985 |
| Unum Group 3.875% 2025 | 1,885 | 1,884 |
| US Bancorp. 3.70% 2024 | 10,000 | 10,649 |
| US Bancorp., Series T, 1.65% 2017 | 10,000 | 10,065 |
| US Bancorp., junior subordinated 5.125% (undated) | 5,525 | 5,574 |
| WEA Finance LLC 1.75% 20174 | 12,360 | 12,298 |
| WEA Finance LLC 2.70% 20194 | 15,195 | 15,221 |
| WEA Finance LLC 3.25% 20204 | 10,195 | 10,391 |
| WEA Finance LLC 3.75% 20244 | 8,200 | 8,272 |
| Wells Fargo & Co. 3.676% 2016 | 10,000 | 10,101 |
| Wells Fargo & Co. 1.358% 20187 | 5,091 | 5,099 |
| Wells Fargo & Co. 2.55% 2020 | 14,435 | 14,502 |
| Wells Fargo & Co. 4.60% 2021 | 45,000 | 49,486 |
| Wells Fargo & Co. 3.55% 2025 | 5,000 | 5,098 |
| Wells Fargo & Co. 4.90% 2045 | 10,000 | 10,122 |
| Wells Fargo & Co., Series K, junior subordinated 7.98% (undated) | 86,566 | 90,570 |
| | | 2,365,782 |
| Consumer discretionary 2.06% | | |
| 21st Century Fox America, Inc. 3.70% 2025 | 1,340 | 1,327 |
| 21st Century Fox America, Inc. 4.95% 2045 | 415 | 402 |
| Amazon.com, Inc. 4.80% 2034 | 12,000 | 12,666 |
| American Honda Finance Corp. 2.25% 2019 | 8,500 | 8,638 |
| American Honda Finance Corp. 2.45% 2020 | 3,200 | 3,256 |
| Boyd Gaming Corp. 9.00% 2020 | 33,000 | 34,980 |
| Boyd Gaming Corp. 6.875% 2023 | 16,125 | 16,447 |
| Burger King Corp. 4.625% 20224 | 9,000 | 9,067 |
| Burger King Corp. 6.00% 20224 | 26,025 | 27,050 |
| Cablevision Systems Corp. 7.75% 2018 | 20,800 | 21,112 |
| Cablevision Systems Corp. 8.00% 2020 | 20,000 | 18,950 |
| Cablevision Systems Corp. 6.75% 2021 | 8,724 | 8,637 |
| Carnival Corp. 3.95% 2020 | 11,290 | 11,855 |
| CBS Corp. 1.95% 2017 | 5,000 | 5,024 |
| CBS Outdoor Americas Inc. 5.25% 20222 | 29,500 | 30,274 |
| CBS Outdoor Americas Inc. 5.625% 20242 | 6,896 | 7,077 |
| CCO Holdings LLC and CCO Holdings Capital Corp. 7.00% 2019 | 3,429 | 3,506 |
| CCO Holdings LLC and CCO Holdings Capital Corp. 3.579% 20204 | 11,045 | 11,117 |
| CCO Holdings LLC and CCO Holdings Capital Corp. 6.50% 2021 | 12,600 | 13,167 |
| CCO Holdings LLC and CCO Holdings Capital Corp. 4.464% 20224 | 9,715 | 9,745 |
| CCO Holdings LLC and CCO Holdings Capital Corp. 6.625% 2022 | 1,400 | 1,486 |
| CCO Holdings LLC and CCO Holdings Capital Corp. 4.908% 20254 | 42,510 | 42,577 |
| CCO Holdings LLC and CCO Holdings Capital Corp. 5.75% 20264 | 59,125 | 58,970 |
| CCO Holdings LLC and CCO Holdings Capital Corp. 6.384% 20354 | 8,750 | 8,820 |
| CCO Holdings LLC and CCO Holdings Capital Corp. 6.484% 20454 | 6,475 | 6,529 |
| Cengage Learning Acquisitions, Inc., Term Loan B, 7.00% 20207,8,9 | 9,459 | 9,228 |
| Cequel Communications Holdings I, LLC and Cequel Capital Corp. 6.375% 20204 | 74,974 | 72,725 |
| Clear Channel Worldwide Holdings, Inc. 7.625% 2020 | 40,410 | 33,439 |
| Comcast Corp. 6.45% 2037 | 25,000 | 31,147 |
| Comcast Corp. 4.75% 2044 | 4,855 | 4,982 |
The Income Fund of America — Page 9 of 35
Bonds, notes & other debt instruments
Corporate bonds & notes (continued)
Consumer discretionary (continued) | Principal amount
(000) | Value
(000) |
| Cox Communications, Inc. 5.875% 20164 | $25,000 | $25,782 |
| Cumulus Media Holdings Inc. 7.75% 2019 | 34,160 | 13,365 |
| Cumulus Media Inc., Term Loan B, 4.25% 20207,8,9 | 10,624 | 7,844 |
| DaimlerChrysler North America Holding Corp. 2.625% 20164 | 2,000 | 2,017 |
| DaimlerChrysler North America Holding Corp. 1.375% 20174 | 8,585 | 8,532 |
| DaimlerChrysler North America Holding Corp. 2.25% 20194 | 14,000 | 13,913 |
| DaimlerChrysler North America Holding Corp. 2.25% 20204 | 12,800 | 12,637 |
| DaimlerChrysler North America Holding Corp. 3.25% 20244 | 770 | 763 |
| DaimlerChrysler North America Holding Corp. 3.30% 20254 | 2,000 | 1,987 |
| DaimlerChrysler North America Holding Corp. 8.50% 2031 | 2,000 | 2,953 |
| Delta 2 (Formula One), Term Loan B, 7.75% 20227,8,9 | 22,125 | 18,548 |
| DISH DBS Corp. 4.625% 2017 | 23,825 | 24,421 |
| DISH DBS Corp. 4.25% 2018 | 27,875 | 28,119 |
| DISH DBS Corp. 7.875% 2019 | 1,425 | 1,550 |
| Family Tree Escrow LLC 5.25% 20204 | 4,025 | 4,246 |
| Family Tree Escrow LLC 5.75% 20234 | 8,050 | 8,523 |
| Federated Department Stores, Inc. 6.90% 2029 | 7,925 | 8,668 |
| Ford Motor Credit Co. 1.70% 2016 | 8,500 | 8,513 |
| Ford Motor Credit Co. 8.00% 2016 | 1,500 | 1,579 |
| Ford Motor Credit Co. 2.145% 2018 | 8,170 | 8,147 |
| Ford Motor Credit Co. 2.375% 2018 | 10,905 | 10,893 |
| Ford Motor Credit Co. 2.597% 2019 | 7,270 | 7,156 |
| Ford Motor Credit Co. 2.943% 2019 | 9,000 | 9,026 |
| Ford Motor Credit Co. 3.157% 2020 | 10,000 | 9,949 |
| Ford Motor Credit Co. 3.20% 2021 | 2,000 | 1,986 |
| Ford Motor Credit Co. 3.219% 2022 | 16,000 | 15,619 |
| Ford Motor Credit Co. 4.375% 2023 | 8,850 | 9,052 |
| Ford Motor Credit Co. 3.664% 2024 | 7,000 | 6,781 |
| Ford Motor Credit Co. 4.134% 2025 | 5,000 | 4,968 |
| Ford Motor Credit Co. 4.389% 2026 | 2,000 | 2,020 |
| Gannett Co., Inc. 5.125% 2019 | 7,925 | 8,321 |
| Gannett Co., Inc. 4.875% 20214 | 8,085 | 8,146 |
| Gannett Co., Inc. 5.50% 20244 | 6,500 | 6,549 |
| General Motors Co. 4.00% 2025 | 9,345 | 8,758 |
| General Motors Co. 5.20% 2045 | 8,000 | 7,143 |
| General Motors Financial Co. 6.75% 2018 | 2,760 | 2,988 |
| General Motors Financial Co. 3.50% 2019 | 8,795 | 8,859 |
| General Motors Financial Co. 3.70% 2020 | 2,725 | 2,717 |
| General Motors Financial Co. 4.375% 2021 | 21,275 | 21,649 |
| General Motors Financial Co. 3.45% 2022 | 33,990 | 32,696 |
| Hilton Worldwide Finance LLC 5.625% 2021 | 9,565 | 9,900 |
| Hilton Worldwide, Term Loan B, 3.50% 20207,8,9 | 14,579 | 14,572 |
| Home Depot, Inc. 5.95% 2041 | 12,500 | 15,442 |
| Hyundai Capital America 2.60% 20204 | 3,250 | 3,245 |
| Hyundai Capital America 3.00% 20204 | 2,000 | 2,017 |
| iHeartCommunications, Inc. 10.625% 2023 | 10,020 | 6,513 |
| International Game Technology 6.25% 20224 | 14,000 | 13,545 |
| La Quinta Properties, Inc., First Lien Term Loan B, 3.75% 20217,8,9 | 18,257 | 17,724 |
| Limited Brands, Inc. 8.50% 2019 | 16,105 | 18,803 |
| Limited Brands, Inc. 7.00% 2020 | 21,271 | 23,983 |
| Limited Brands, Inc. 6.625% 2021 | 23,754 | 26,545 |
| Limited Brands, Inc. 6.875% 20354 | 31,975 | 33,174 |
| McDonald’s Corp. 2.75% 2020 | 625 | 635 |
| McDonald’s Corp. 3.70% 2026 | 1,355 | 1,374 |
The Income Fund of America — Page 10 of 35
Bonds, notes & other debt instruments
Corporate bonds & notes (continued)
Consumer discretionary (continued) | Principal amount
(000) | Value
(000) |
| McDonald’s Corp. 4.70% 2035 | $620 | $629 |
| McDonald’s Corp. 4.875% 2045 | 2,165 | 2,199 |
| Mediacom Broadband LLC and Mediacom Broadband Corp. 5.50% 2021 | 17,225 | 16,773 |
| Mediacom LLC and Mediacom Capital Corp. 7.25% 2022 | 7,775 | 7,843 |
| MGM Resorts International 7.50% 2016 | 8,425 | 8,581 |
| MGM Resorts International 8.625% 2019 | 13,000 | 14,536 |
| MGM Resorts International 6.75% 2020 | 7,350 | 7,681 |
| MGM Resorts International 7.75% 2022 | 17,000 | 18,084 |
| Michaels Stores, Inc. 5.875% 20204 | 14,125 | 14,584 |
| Mohegan Tribal Gaming Authority 11.00% 20184,6 | 4,318 | 4,329 |
| Myriad International Holdings 6.00% 20204 | 40,000 | 42,529 |
| NBC Universal Enterprise, Inc. 1.307% 20184,7 | 8,625 | 8,618 |
| NBC Universal Enterprise, Inc. 5.25% (undated)4 | 37,105 | 39,424 |
| NBCUniversal Media, LLC 2.875% 2016 | 10,000 | 10,036 |
| NCL Corp. Ltd. 5.25% 20194 | 8,050 | 8,130 |
| Needle Merger Sub Corp. 8.125% 20194 | 33,920 | 27,475 |
| Neiman Marcus Group LTD Inc. 8.00% 20214 | 67,130 | 51,187 |
| Neiman Marcus Group LTD Inc. 8.75% 20214,6 | 14,555 | 9,315 |
| Neiman Marcus, Term Loan B, 4.25% 20207,8,9 | 36,707 | 31,987 |
| PETCO Animal Supplies, Inc. 9.25% 20184 | 21,600 | 22,232 |
| PETCO Animal Supplies, Inc., Term Loan B-1, 5.75% 20237,8,9 | 6,700 | 6,573 |
| PETsMART, Inc. 7.125% 20234 | 10,525 | 10,630 |
| Pinnacle Entertainment, Inc. 6.375% 2021 | 12,275 | 13,073 |
| Playa Resorts Holding BV 8.00% 20204 | 24,490 | 25,041 |
| Playa Resorts Holding BV, Term Loan B, 4.00% 20197,8,9 | 5,373 | 5,212 |
| President & Fellows of Harvard College 3.619% 2037 | 10,000 | 10,132 |
| RCI Banque 3.50% 20184 | 13,150 | 13,189 |
| Sally Holdings LLC and Sally Capital Inc. 5.625% 2025 | 11,325 | 11,750 |
| Schaeffler Holding Finance BV 7.625% 20184,6 | 5,450 | 5,614 |
| Schaeffler Holding Finance BV 6.25% 20194,6 | 11,500 | 12,032 |
| Seminole Tribe of Florida 6.535% 20204,8 | 7,580 | 7,732 |
| Sotheby’s Holdings, Inc. 5.25% 20224 | 7,775 | 7,036 |
| Standard Pacific Corp. 8.375% 2021 | 2,475 | 2,840 |
| Starbucks Corp. 2.70% 2022 | 2,140 | 2,181 |
| Starbucks Corp. 4.30% 2045 | 3,120 | 3,335 |
| Station Casinos LLC 7.50% 2021 | 2,500 | 2,588 |
| Thomson Reuters Corp. 1.30% 2017 | 1,510 | 1,504 |
| Thomson Reuters Corp. 1.65% 2017 | 4,350 | 4,341 |
| Thomson Reuters Corp. 4.30% 2023 | 1,285 | 1,342 |
| Thomson Reuters Corp. 5.65% 2043 | 1,425 | 1,490 |
| TI Automotive Ltd. 8.75% 20234 | 8,635 | 7,793 |
| Time Warner Cable Inc. 6.75% 2018 | 18,630 | 20,358 |
| Time Warner Cable Inc. 5.00% 2020 | 35,000 | 37,263 |
| Time Warner Inc. 4.75% 2021 | 15,000 | 16,196 |
| Time Warner Inc. 3.60% 2025 | 21,900 | 21,312 |
| Toyota Motor Credit Corp. 1.45% 2018 | 2,000 | 2,007 |
| Toyota Motor Credit Corp. 2.125% 2019 | 1,500 | 1,517 |
| Toyota Motor Credit Corp. 2.15% 2020 | 15,000 | 15,207 |
| Univision Communications Inc. 8.50% 20214 | 6,480 | 6,456 |
| Univision Communications Inc. 6.75% 20224 | 305 | 315 |
| Univision Communications Inc. 5.125% 20234 | 1,250 | 1,219 |
| Univision Communications Inc. 5.125% 20254 | 1,305 | 1,240 |
| Univision Communications Inc., Term Loan C3, 4.00% 20207,8,9 | 16,962 | 16,593 |
| Virgin Media Secured Finance PLC 5.375% 20214,8 | 15,840 | 16,256 |
The Income Fund of America — Page 11 of 35
Bonds, notes & other debt instruments
Corporate bonds & notes (continued)
Consumer discretionary (continued) | Principal amount
(000) | Value
(000) |
| Volkswagen International Finance NV 2.375% 20174 | $14,500 | $14,481 |
| Warner Music Group 6.00% 20214 | 15,146 | 15,487 |
| Warner Music Group 5.625% 20224 | 10,637 | 10,344 |
| Warner Music Group 6.75% 20224 | 14,925 | 13,209 |
| WPP Finance 2010 3.75% 2024 | 2,000 | 1,997 |
| Wynn Las Vegas, LLC and Wynn Capital Corp. 5.375% 2022 | 6,725 | 6,448 |
| Wynn Las Vegas, LLC and Wynn Capital Corp. 4.25% 20234 | 5,325 | 4,546 |
| Wynn Macau, Ltd. 5.25% 20214 | 31,225 | 27,322 |
| ZF Friedrichshafen AG 4.00% 20204 | 5,065 | 5,075 |
| ZF Friedrichshafen AG 4.50% 20224 | 10,995 | 10,624 |
| ZF Friedrichshafen AG 4.75% 20254 | 21,530 | 20,265 |
| | | 1,886,392 |
| Health care 2.06% | | |
| AbbVie Inc. 2.90% 2022 | 7,200 | 7,087 |
| AbbVie Inc. 3.20% 2022 | 2,675 | 2,680 |
| AbbVie Inc. 3.60% 2025 | 15,500 | 15,556 |
| AbbVie Inc. 4.50% 2035 | 5,705 | 5,584 |
| AbbVie Inc. 4.40% 2042 | 7,985 | 7,525 |
| AbbVie Inc. 4.70% 2045 | 15,830 | 15,616 |
| Actavis Funding SCS 2.35% 2018 | 11,135 | 11,190 |
| Actavis Funding SCS 3.00% 2020 | 16,590 | 16,818 |
| Actavis Funding SCS 3.45% 2022 | 20,180 | 20,507 |
| Actavis Funding SCS 3.80% 2025 | 35,940 | 36,533 |
| Actavis Funding SCS 4.55% 2035 | 18,570 | 18,375 |
| Actavis Funding SCS 4.75% 2045 | 16,090 | 16,180 |
| Amgen Inc. 2.70% 2022 | 5,100 | 5,047 |
| AstraZeneca PLC 3.375% 2025 | 24,230 | 24,402 |
| AstraZeneca PLC 4.375% 2045 | 5,250 | 5,270 |
| Baxalta Inc. 2.875% 20204 | 14,410 | 14,207 |
| Baxalta Inc. 4.00% 20254 | 10,140 | 10,101 |
| Bayer AG 2.375% 20194 | 9,760 | 9,901 |
| Becton, Dickinson and Co. 2.675% 2019 | 3,600 | 3,663 |
| Becton, Dickinson and Co. 3.734% 2024 | 1,305 | 1,338 |
| Becton, Dickinson and Co. 4.685% 2044 | 3,800 | 3,872 |
| Biogen Inc. 2.90% 2020 | 10,700 | 10,788 |
| Biogen Inc. 3.625% 2022 | 3,615 | 3,719 |
| Biogen Inc. 4.05% 2025 | 11,509 | 11,811 |
| Biogen Inc. 5.20% 2045 | 12,953 | 13,189 |
| Boston Scientific Corp. 2.85% 2020 | 7,875 | 7,896 |
| Boston Scientific Corp. 6.00% 2020 | 5,375 | 6,002 |
| Boston Scientific Corp. 3.375% 2022 | 14,300 | 14,285 |
| Boston Scientific Corp. 3.85% 2025 | 11,200 | 11,155 |
| Catholic Health Initiatives, Series 2012, 1.60% 2017 | 1,000 | 999 |
| Celgene Corp. 3.55% 2022 | 6,910 | 7,021 |
| Celgene Corp. 3.625% 2024 | 13,610 | 13,537 |
| Celgene Corp. 3.875% 2025 | 5,855 | 5,924 |
| Celgene Corp. 4.625% 2044 | 6,050 | 5,703 |
| Celgene Corp. 5.00% 2045 | 18,285 | 18,334 |
| Centene Corp. 5.75% 2017 | 10,060 | 10,450 |
| Centene Corp. 5.625% 20214 | 29,400 | 30,025 |
| Centene Corp. 4.75% 2022 | 32,363 | 31,230 |
| Centene Corp. 6.125% 20244 | 8,175 | 8,369 |
| Concordia Healthcare Corp. 9.50% 20224 | 20,045 | 19,669 |
The Income Fund of America — Page 12 of 35
Bonds, notes & other debt instruments
Corporate bonds & notes (continued)
Health care (continued) | Principal amount
(000) | Value
(000) |
| Concordia Healthcare Corp. 7.00% 20234 | $10,585 | $9,262 |
| ConvaTec Finance International SA 8.25% 20194,6 | 24,170 | 21,602 |
| DaVita HealthCare Partners Inc. 5.00% 2025 | 14,450 | 14,251 |
| DENTSPLY International Inc. 2.75% 2016 | 5,620 | 5,661 |
| DJO Finance LLC 10.75% 20204 | 13,253 | 11,000 |
| DJO Finco Inc. 8.125% 20214 | 48,860 | 41,287 |
| EMD Finance LLC 1.70% 20184 | 18,900 | 18,820 |
| EMD Finance LLC 2.40% 20204 | 22,050 | 21,751 |
| EMD Finance LLC 2.95% 20224 | 18,600 | 18,430 |
| EMD Finance LLC 3.25% 20254 | 29,900 | 28,958 |
| Endo Finance LLC & Endo Finco Inc. 6.00% 20234 | 17,135 | 17,306 |
| Endo Pharmaceuticals Holdings Inc. 5.75% 20224 | 18,575 | 18,575 |
| Express Scripts Inc. 3.125% 2016 | 13,564 | 13,648 |
| Express Scripts Inc. 7.25% 2019 | 8,985 | 10,419 |
| Gilead Sciences, Inc. 3.05% 2016 | 10,265 | 10,437 |
| Gilead Sciences, Inc. 1.85% 2018 | 4,610 | 4,647 |
| Gilead Sciences, Inc. 2.55% 2020 | 9,247 | 9,370 |
| Gilead Sciences, Inc. 3.25% 2022 | 10,015 | 10,295 |
| Gilead Sciences, Inc. 3.65% 2026 | 2,200 | 2,256 |
| Gilead Sciences, Inc. 4.80% 2044 | 1,615 | 1,653 |
| Gilead Sciences, Inc. 4.50% 2045 | 3,400 | 3,362 |
| Gilead Sciences, Inc. 4.75% 2046 | 2,920 | 2,992 |
| HCA Inc. 3.75% 2019 | 25,557 | 25,813 |
| HCA Inc. 6.50% 2020 | 24,050 | 26,575 |
| HCA Inc. 4.75% 2023 | 580 | 583 |
| HCA Inc. 5.00% 2024 | 2,080 | 2,111 |
| HCA Inc. 5.375% 2025 | 50,000 | 50,625 |
| HealthSouth Corp. 5.75% 20244 | 4,575 | 4,539 |
| HealthSouth Corp. 5.75% 20254 | 11,242 | 10,959 |
| Hologic, Inc. 5.25% 20224 | 4,765 | 4,950 |
| Humana Inc. 3.85% 2024 | 4,400 | 4,486 |
| Humana Inc. 4.95% 2044 | 12,800 | 12,768 |
| inVentiv Health Inc., Term Loan B4, 7.75% 20187,8,9 | 15,530 | 15,433 |
| inVentiv Health Inc. 9.00% 20184 | 36,955 | 37,579 |
| inVentiv Health Inc. 10.00% 2018 | 22,533 | 21,519 |
| inVentiv Health Inc. 10.00% 2018 | 13,010 | 12,555 |
| inVentiv Health Inc. 12.00% 20184,6 | 52,542 | 48,855 |
| Kindred Healthcare, Inc. 8.00% 2020 | 15,625 | 14,336 |
| Kindred Healthcare, Inc. 8.75% 2023 | 8,865 | 7,967 |
| Kinetic Concepts, Inc. 10.50% 2018 | 109,087 | 106,360 |
| Kinetic Concepts, Inc. 12.50% 2019 | 30,610 | 27,472 |
| Laboratory Corporation of America Holdings 3.20% 2022 | 5,335 | 5,283 |
| Laboratory Corporation of America Holdings 3.60% 2025 | 4,440 | 4,366 |
| Laboratory Corporation of America Holdings 4.70% 2045 | 1,375 | 1,293 |
| Mallinckrodt PLC 4.875% 20204 | 18,140 | 17,437 |
| Mallinckrodt PLC 5.75% 20224 | 2,783 | 2,672 |
| Mallinckrodt PLC 5.625% 20234 | 12,415 | 11,701 |
| McKesson Corp. 3.25% 2016 | 7,525 | 7,539 |
| McKesson Corp. 2.284% 2019 | 5,875 | 5,892 |
| McKesson Corp. 3.796% 2024 | 12,005 | 12,187 |
| MEDNAX, Inc. 5.25% 20234 | 2,110 | 2,168 |
| Medtronic, Inc. 2.50% 2020 | 16,775 | 17,047 |
| Medtronic, Inc. 3.50% 2025 | 4,700 | 4,833 |
| Medtronic, Inc. 4.375% 2035 | 8,675 | 8,880 |
The Income Fund of America — Page 13 of 35
Bonds, notes & other debt instruments
Corporate bonds & notes (continued)
Health care (continued) | Principal amount
(000) | Value
(000) |
| Medtronic, Inc. 4.625% 2045 | $11,035 | $11,621 |
| Merck & Co., Inc. 1.10% 2018 | 6,710 | 6,722 |
| Molina Healthcare, Inc. 5.375% 20224 | 16,745 | 16,787 |
| Ortho-Clinical Diagnostics Inc. 6.625% 20224 | 13,940 | 9,375 |
| Ortho-Clinical Diagnostics Inc., Term Loan B, 4.75% 20217,8,9 | 19,885 | 17,611 |
| Pfizer Inc. 7.20% 2039 | 1,353 | 1,872 |
| PRA Holdings, Inc. 9.50% 20234 | 9,626 | 10,589 |
| Quintiles Transnational Corp. 4.875% 20234 | 32,325 | 32,891 |
| Roche Holdings, Inc. 2.875% 20214 | 15,000 | 15,522 |
| Rotech Healthcare Inc., Term Loan A, 5.50% 20181,2,7,8,9 | 11,828 | 11,496 |
| Rotech Healthcare Inc., Term Loan B, 10.00% 20191,2,7,8,9 | 9,200 | 9,154 |
| Rotech Healthcare Inc., Term Loan, 13.00% 20201,2,6,7,8,9 | 21,926 | 18,847 |
| St. Jude Medical, Inc. 2.80% 2020 | 9,100 | 9,214 |
| Tenet Healthcare Corp. 4.375% 2021 | 10,800 | 10,706 |
| Tenet Healthcare Corp. 8.125% 2022 | 884 | 893 |
| Tenet Healthcare Corp. 6.75% 2023 | 11,236 | 10,379 |
| Tenet Healthcare Corp., First Lien, 6.25% 2018 | 2,500 | 2,656 |
| Tenet Healthcare Corp., First Lien, 4.75% 2020 | 12,190 | 12,403 |
| Tenet Healthcare Corp., First Lien, 6.00% 2020 | 39,030 | 41,567 |
| Tenet Healthcare Corp., First Lien, 4.50% 2021 | 19,365 | 19,075 |
| Thermo Fisher Scientific Inc. 2.40% 2019 | 6,000 | 6,041 |
| Thermo Fisher Scientific Inc. 4.15% 2024 | 4,000 | 4,148 |
| Thermo Fisher Scientific Inc. 5.30% 2044 | 365 | 394 |
| UnitedHealth Group Inc. 1.40% 2017 | 6,500 | 6,513 |
| UnitedHealth Group Inc. 6.00% 2017 | 12,430 | 13,224 |
| UnitedHealth Group Inc. 3.35% 2022 | 7,030 | 7,280 |
| UnitedHealth Group Inc. 3.75% 2025 | 10,710 | 11,162 |
| UnitedHealth Group Inc. 4.625% 2035 | 1,080 | 1,153 |
| UnitedHealth Group Inc. 4.75% 2045 | 1,800 | 1,935 |
| VPI Escrow Corp. 6.75% 20184 | 33,825 | 33,740 |
| VPI Escrow Corp. 6.375% 20204 | 52,913 | 51,326 |
| VPI Escrow Corp. 7.50% 20214 | 17,770 | 17,681 |
| VRX Escrow Corp. 5.375% 20204 | 33,820 | 32,129 |
| VRX Escrow Corp. 5.875% 20234 | 14,545 | 13,091 |
| VRX Escrow Corp. 6.125% 20254 | 34,315 | 30,926 |
| WellPoint, Inc. 2.30% 2018 | 1,370 | 1,379 |
| WellPoint, Inc. 2.25% 2019 | 12,500 | 12,344 |
| Zimmer Holdings, Inc. 2.00% 2018 | 4,640 | 4,627 |
| Zimmer Holdings, Inc. 2.70% 2020 | 13,770 | 13,722 |
| Zimmer Holdings, Inc. 3.15% 2022 | 24,360 | 24,143 |
| Zimmer Holdings, Inc. 3.55% 2025 | 13,770 | 13,446 |
| | | 1,884,107 |
| Energy 1.91% | | |
| Alpha Natural Resources, Inc. 7.50% 20204,10 | 35,950 | 539 |
| Alpha Natural Resources, Inc. 7.50% 20204,10 | 24,559 | 368 |
| American Energy - Woodford LLC 12.00% 20204,6 | 11,838 | 1,756 |
| American Energy (Marcellus), Term Loan B, 5.25% 20207,8,9 | 25,050 | 5,386 |
| American Energy (Marcellus), Term Loan A, 8.50% 20217,8,9 | 23,825 | 735 |
| American Energy (Permian Basin), 6.804% 20194,7 | 10,000 | 2,825 |
| American Energy (Permian Basin) 7.125% 20204 | 24,550 | 6,997 |
| American Energy (Permian Basin) 7.375% 20214 | 15,350 | 4,375 |
| Anadarko Petroleum Corp. 5.95% 2016 | 10,500 | 10,659 |
| Anadarko Petroleum Corp. 6.375% 2017 | 13,500 | 13,641 |
The Income Fund of America — Page 14 of 35
Bonds, notes & other debt instruments
Corporate bonds & notes (continued)
Energy (continued) | Principal amount
(000) | Value
(000) |
| Anadarko Petroleum Corp. 8.70% 2019 | $32,255 | $34,266 |
| Anadarko Petroleum Corp. 6.45% 2036 | 1,095 | 879 |
| Anadarko Petroleum Corp. 6.20% 2040 | 500 | 380 |
| APT Pipelines Ltd. 4.20% 20254 | 15,140 | 14,605 |
| Baytex Energy Corp. 5.125% 20214 | 10,050 | 6,080 |
| Baytex Energy Corp. 5.625% 20244 | 3,450 | 2,018 |
| BG Energy Capital PLC 2.875% 20164 | 7,395 | 7,461 |
| Blue Racer Midstream LLC / Blue Racer Finance Corp. 6.125% 20224 | 9,810 | 7,382 |
| Boardwalk Pipeline Partners 3.375% 2023 | 3,000 | 2,350 |
| Boardwalk Pipelines, LP 4.95% 2024 | 6,705 | 5,689 |
| Bonanza Creek Energy, Inc. 6.75% 2021 | 6,200 | 2,464 |
| Canadian Natural Resources Ltd. 5.70% 2017 | 7,350 | 7,289 |
| Canadian Natural Resources Ltd. 3.80% 2024 | 1,440 | 1,140 |
| Canadian Natural Resources Ltd. 6.50% 2037 | 1,000 | 748 |
| Cenovus Energy Inc. 3.00% 2022 | 5,970 | 4,968 |
| Cenovus Energy Inc. 3.80% 2023 | 19,005 | 15,926 |
| Chesapeake Energy Corp. 4.875% 2022 | 14,675 | 3,962 |
| Chevron Corp. 1.961% 2020 | 6,310 | 6,221 |
| Chevron Corp. 2.411% 2022 | 3,790 | 3,690 |
| Concho Resources Inc. 5.50% 2023 | 7,000 | 6,387 |
| CONSOL Energy Inc. 5.875% 2022 | 38,375 | 25,040 |
| DCP Midstream Operating LP 4.95% 2022 | 7,850 | 5,905 |
| Denbury Resources Inc. 4.625% 2023 | 41,475 | 13,894 |
| Devon Energy Corp. 2.25% 2018 | 3,600 | 3,111 |
| Devon Energy Corp. 5.00% 2045 | 12,815 | 8,519 |
| Diamond Offshore Drilling, Inc. 4.875% 2043 | 38,270 | 22,167 |
| Ecopetrol SA 5.375% 2026 | 10,935 | 8,775 |
| Ecopetrol SA 5.875% 2045 | 2,115 | 1,475 |
| El Paso Pipeline Partners Operating Co., LLC 5.00% 2021 | 5,000 | 4,731 |
| El Paso Pipeline Partners Operating Co., LLC 4.70% 2042 | 33,265 | 23,359 |
| Enbridge Energy Partners, LP 9.875% 2019 | 10,500 | 11,640 |
| Enbridge Energy Partners, LP 4.375% 2020 | 16,770 | 15,892 |
| Enbridge Energy Partners, LP 5.875% 2025 | 23,370 | 21,958 |
| Enbridge Energy Partners, LP 5.50% 2040 | 1,200 | 909 |
| Enbridge Energy Partners, LP 7.375% 2045 | 36,315 | 34,245 |
| Enbridge Energy Partners, LP, Series B, 6.50% 2018 | 5,225 | 5,348 |
| Enbridge Energy Partners, LP, Series B, 7.50% 2038 | 6,000 | 5,822 |
| Enbridge Inc. 5.60% 2017 | 20,067 | 20,671 |
| Enbridge Inc. 4.00% 2023 | 27,650 | 25,005 |
| Enbridge Inc. 3.50% 2024 | 3,015 | 2,564 |
| Energy Transfer Partners, LP 4.15% 2020 | 5,000 | 4,431 |
| Energy Transfer Partners, LP 7.50% 2020 | 2,275 | 2,013 |
| Energy Transfer Partners, LP 5.875% 2024 | 13,500 | 10,564 |
| Energy Transfer Partners, LP 4.75% 2026 | 11,850 | 10,038 |
| Energy Transfer Partners, LP 5.50% 2027 | 12,175 | 8,675 |
| Energy Transfer Partners, LP 6.125% 2045 | 7,325 | 5,798 |
| EnLink Midstream Partners, LP 2.70% 2019 | 1,660 | 1,294 |
| EnLink Midstream Partners, LP 4.40% 2024 | 7,310 | 5,225 |
| EnLink Midstream Partners, LP 4.15% 2025 | 11,760 | 8,065 |
| EnLink Midstream Partners, LP 5.05% 2045 | 9,810 | 5,749 |
| Ensco PLC 5.20% 2025 | 11,300 | 6,849 |
| Ensco PLC 5.75% 2044 | 13,045 | 7,454 |
| Enterprise Products Operating LLC 5.20% 2020 | 5,500 | 5,783 |
| Enterprise Products Operating LLC 3.70% 2026 | 615 | 554 |
The Income Fund of America — Page 15 of 35
Bonds, notes & other debt instruments
Corporate bonds & notes (continued)
Energy (continued) | Principal amount
(000) | Value
(000) |
| Enterprise Products Operating LLC 4.85% 2044 | $2,805 | $2,317 |
| Enterprise Products Operating LLC 4.90% 2046 | 1,040 | 868 |
| EOG Resources, Inc. 4.15% 2026 | 8,040 | 7,973 |
| EP Energy Corp. 9.375% 2020 | 16,275 | 6,998 |
| EP Energy Corp. 6.375% 2023 | 13,850 | 4,917 |
| Exxon Mobil Corp. 1.305% 2018 | 3,860 | 3,855 |
| Exxon Mobil Corp. 1.819% 2019 | 1,280 | 1,286 |
| Exxon Mobil Corp. 1.912% 2020 | 2,310 | 2,305 |
| Exxon Mobil Corp. 2.397% 2022 | 4,535 | 4,513 |
| Exxon Mobil Corp. 2.709% 2025 | 15,440 | 15,295 |
| Exxon Mobil Corp. 3.567% 2045 | 1,410 | 1,280 |
| Genesis Energy, LP 6.75% 2022 | 13,050 | 10,766 |
| Halliburton Co. 3.375% 2022 | 20,155 | 19,818 |
| Halliburton Co. 3.80% 2025 | 10,395 | 9,743 |
| Halliburton Co. 4.85% 2035 | 1,115 | 1,029 |
| Halliburton Co. 5.00% 2045 | 1,860 | 1,663 |
| Jupiter Resources Inc. 8.50% 20224 | 31,425 | 11,313 |
| Kinder Morgan Energy Partners, LP 3.50% 2016 | 9,750 | 9,767 |
| Kinder Morgan Energy Partners, LP 2.65% 2019 | 1,890 | 1,750 |
| Kinder Morgan Energy Partners, LP 9.00% 2019 | 1,660 | 1,803 |
| Kinder Morgan Energy Partners, LP 4.15% 2022 | 12,145 | 10,731 |
| Kinder Morgan Energy Partners, LP 3.45% 2023 | 7,500 | 6,252 |
| Kinder Morgan Energy Partners, LP 3.50% 2023 | 4,850 | 4,005 |
| Kinder Morgan Energy Partners, LP 4.25% 2024 | 8,265 | 6,990 |
| Kinder Morgan Energy Partners, LP 6.95% 2038 | 460 | 402 |
| Kinder Morgan Energy Partners, LP 5.00% 2043 | 20,000 | 14,466 |
| Kinder Morgan Energy Partners, LP 5.40% 2044 | 9,660 | 7,283 |
| Kinder Morgan Energy Partners, LP 5.50% 2044 | 7,206 | 5,620 |
| Kinder Morgan, Inc. 3.05% 2019 | 8,070 | 7,477 |
| Kinder Morgan, Inc. 4.30% 2025 | 23,890 | 20,734 |
| Kinder Morgan, Inc. 5.55% 2045 | 6,160 | 4,842 |
| Laredo Petroleum, Inc. 5.625% 2022 | 2,000 | 1,430 |
| Matador Resources Co. 6.875% 2023 | 2,025 | 1,752 |
| NGL Energy Partners LP 5.125% 2019 | 8,390 | 6,167 |
| NGL Energy Partners LP 6.875% 2021 | 20,105 | 14,174 |
| NGPL PipeCo LLC 7.119% 20174 | 57,420 | 54,262 |
| NGPL PipeCo LLC 9.625% 20194 | 53,655 | 50,704 |
| NGPL PipeCo LLC, Term Loan B, 6.75% 20177,8,9 | 1,833 | 1,737 |
| Noble Corp PLC 4.00% 2018 | 7,555 | 6,028 |
| Noble Corp PLC 5.95% 2025 | 23,605 | 11,903 |
| Noble Corp PLC 6.95% 2045 | 25,605 | 11,349 |
| Oasis Petroleum Inc. 6.875% 2022 | 3,650 | 2,135 |
| Odebrecht Drilling Norbe VIII/IX Ltd 6.35% 20214,8 | 1,460 | 540 |
| Odebrecht Offshore Drilling Finance Ltd. 6.75% 20224,8 | 4,343 | 977 |
| PDC Energy Inc. 7.75% 2022 | 46,625 | 44,527 |
| Peabody Energy Corp. 6.00% 2018 | 123,645 | 11,128 |
| Peabody Energy Corp. 6.50% 2020 | 4,500 | 281 |
| Peabody Energy Corp. 6.25% 2021 | 32,150 | 1,849 |
| Petrobras Global Finance Co. 6.85% 2115 | 2,775 | 1,769 |
| Petrobras International Finance Co. 5.75% 2020 | 6,535 | 5,153 |
| Petrobras International Finance Co. 5.375% 2021 | 28,655 | 21,599 |
| Petróleos Mexicanos 3.50% 2018 | 14,280 | 14,023 |
| Petróleos Mexicanos 5.50% 20194 | 13,925 | 14,143 |
| Petróleos Mexicanos 6.375% 20214 | 5,935 | 6,027 |
The Income Fund of America — Page 16 of 35
Bonds, notes & other debt instruments
Corporate bonds & notes (continued)
Energy (continued) | Principal amount
(000) | Value
(000) |
| Petróleos Mexicanos 3.50% 2023 | $11,000 | $9,405 |
| Petróleos Mexicanos 4.50% 20264 | 8,775 | 7,568 |
| Petróleos Mexicanos 6.875% 20264 | 13,550 | 13,804 |
| Petróleos Mexicanos 5.625% 20464 | 7,290 | 5,641 |
| Phillips 66 Partners LP 3.605% 2025 | 1,640 | 1,416 |
| Phillips 66 Partners LP 4.68% 2045 | 245 | 180 |
| Pioneer Natural Resources Co. 3.45% 2021 | 7,015 | 6,583 |
| Pioneer Natural Resources Co. 4.45% 2026 | 3,160 | 2,889 |
| QGOG Atlantic/Alaskan Rigs Ltd. 5.25% 20194,8 | 11,058 | 7,188 |
| Range Resources Corp. 4.875% 20254 | 25,375 | 20,649 |
| Ras Laffan Liquefied Natural Gas II 5.298% 20204,8 | 16,370 | 17,148 |
| Ras Laffan Liquefied Natural Gas III 5.838% 20274,8 | 10,325 | 10,467 |
| Ras Laffan Liquefied Natural Gas III 6.75% 2019 | 4,000 | 4,540 |
| Ras Laffan Liquefied Natural Gas III 6.75% 20194 | 1,000 | 1,135 |
| Regency Energy Partners LP and Regency Energy Finance Corp. 6.50% 2021 | 14,855 | 14,261 |
| Regency Energy Partners LP and Regency Energy Finance Corp. 5.00% 2022 | 35 | 29 |
| Regency Energy Partners LP and Regency Energy Finance Corp. 5.50% 2023 | 10,875 | 9,162 |
| Rice Energy Inc. 6.25% 2022 | 31,350 | 23,904 |
| Rice Energy Inc. 7.25% 2023 | 1,350 | 1,043 |
| Sabine Pass Liquefaction, LLC 5.625% 2021 | 41,375 | 38,065 |
| Sabine Pass Liquefaction, LLC 6.25% 2022 | 15,000 | 13,894 |
| Sabine Pass Liquefaction, LLC 5.625% 2023 | 5,500 | 4,854 |
| Sabine Pass Liquefaction, LLC 5.75% 2024 | 14,975 | 13,215 |
| Sabine Pass Liquefaction, LLC 5.625% 2025 | 29,730 | 25,679 |
| Samson Investment Co. 9.75% 2020 | 9,820 | 15 |
| Samson Investment Co., Term Loan B, 5.00% 20187,8,9,10 | 1,450 | 33 |
| Schlumberger BV 3.00% 20204 | 9,390 | 9,200 |
| Schlumberger BV 3.625% 20224 | 18,780 | 18,405 |
| Schlumberger BV 4.00% 20254 | 13,375 | 13,055 |
| Seven Generations Energy Ltd. 6.75% 20234 | 17,066 | 14,250 |
| Shell International Finance BV 2.125% 2020 | 8,145 | 7,985 |
| Shell International Finance BV 2.25% 2020 | 6,530 | 6,405 |
| Shell International Finance BV 3.25% 2025 | 7,040 | 6,748 |
| SM Energy Co. 5.625% 2025 | 21,975 | 11,866 |
| Southwestern Energy Co. 4.10% 2022 | 6,690 | 4,282 |
| Southwestern Energy Co. 4.95% 2025 | 34,595 | 21,673 |
| Spectra Energy Partners, LP 4.75% 2024 | 3,250 | 3,154 |
| Statoil ASA 3.125% 2017 | 10,000 | 10,207 |
| Statoil ASA 2.75% 2021 | 3,085 | 3,047 |
| Statoil ASA 3.25% 2024 | 850 | 821 |
| Statoil ASA 4.25% 2041 | 3,000 | 2,744 |
| StatoilHydro ASA 1.80% 2016 | 10,000 | 10,045 |
| Targa Resources Corp. 4.125% 2019 | 10,205 | 8,623 |
| Targa Resources Partners LP 6.75% 20244 | 4,500 | 3,724 |
| TC PipeLines, LP 4.375% 2025 | 11,815 | 10,157 |
| Teekay Corp. 8.50% 20204 | 36,000 | 22,860 |
| Teekay Corp. 8.50% 2020 | 32,741 | 20,791 |
| Tesoro Logistics LP 5.50% 20194 | 9,410 | 8,787 |
| Tesoro Logistics LP 6.25% 20224 | 7,900 | 7,189 |
| TransCanada PipeLines Ltd. 7.625% 2039 | 10,750 | 12,835 |
| TransCanada PipeLines Ltd., junior subordinated 6.35% 2067 | 61,150 | 40,970 |
| TransCanada PipeLines Ltd., junior subordinated 5.625% 2075 | 2,820 | 2,402 |
| Transocean Inc. 5.80% 2016 | 18,395 | 17,912 |
| Transocean Inc. 7.125% 2021 | 20,000 | 11,800 |
The Income Fund of America — Page 17 of 35
Bonds, notes & other debt instruments
Corporate bonds & notes (continued)
Energy (continued) | Principal amount
(000) | Value
(000) |
| Transportadora de Gas Peru SA 4.25% 20284,8 | $1,700 | $1,581 |
| Weatherford International PLC 4.50% 2022 | 27,140 | 17,980 |
| Weatherford International PLC 7.00% 2038 | 39,545 | 24,617 |
| Weatherford International PLC 6.75% 2040 | 62,595 | 38,809 |
| Weatherford International PLC 5.95% 2042 | 5,000 | 2,800 |
| Western Gas Partners LP 2.60% 2018 | 1,150 | 1,053 |
| Western Gas Partners LP 3.95% 2025 | 3,045 | 2,270 |
| Williams Companies, Inc. 3.70% 2023 | 19,705 | 12,889 |
| Williams Partners LP 5.25% 2020 | 1,960 | 1,634 |
| Williams Partners LP 4.00% 2021 | 2,900 | 2,192 |
| Williams Partners LP 4.50% 2023 | 6,000 | 4,450 |
| Williams Partners LP 4.30% 2024 | 7,670 | 5,723 |
| Williams Partners LP 3.90% 2025 | 14,300 | 10,205 |
| Williams Partners LP 4.00% 2025 | 14,725 | 10,423 |
| Williams Partners LP 5.40% 2044 | 760 | 500 |
| Williams Partners LP 4.90% 2045 | 3,260 | 2,048 |
| Williams Partners LP 5.10% 2045 | 6,965 | 4,530 |
| Woodside Finance Ltd. 4.60% 20214 | 18,935 | 19,168 |
| WPX Energy Inc. 7.50% 2020 | 10,450 | 6,616 |
| | | 1,750,618 |
| Telecommunication services 1.63% | | |
| Altice Financing SA 6.625% 20234 | 36,550 | 36,093 |
| Altice Finco SA 6.50% 20224 | 12,500 | 12,500 |
| Altice Finco SA 7.625% 20254 | 1,475 | 1,364 |
| Altice Finco SA, First Lien, 7.75% 20224 | 12,550 | 11,766 |
| AT&T Inc. 2.40% 2016 | 9,000 | 9,062 |
| AT&T Inc. 2.80% 2021 | 10,910 | 10,891 |
| AT&T Inc. 3.40% 2025 | 12,810 | 12,290 |
| AT&T Inc. 4.125% 2026 | 17,100 | 17,089 |
| AT&T Inc. 8.25% 2031 | 3,804 | 5,260 |
| AT&T Inc. 4.50% 2035 | 12,650 | 11,458 |
| AT&T Inc. 4.30% 2042 | 3,235 | 2,683 |
| AT&T Inc. 4.35% 2045 | 1,195 | 993 |
| AT&T Inc. 4.75% 2046 | 7,674 | 6,812 |
| AT&T Inc. 5.65% 2047 | 1,010 | 1,011 |
| CenturyLink, Inc. Series V, 5.625% 2020 | 1,750 | 1,713 |
| Clearwire Communications and Clearwire Finance, Inc. 14.75% 20164 | 6,125 | 6,685 |
| Deutsche Telekom International Finance BV 9.25% 2032 | 8,420 | 12,465 |
| France Télécom 2.75% 2016 | 9,000 | 9,087 |
| France Télécom 4.125% 2021 | 15,000 | 16,001 |
| Frontier Communications Corp. 8.125% 2018 | 16,547 | 16,961 |
| Frontier Communications Corp. 8.875% 20204 | 6,450 | 6,490 |
| Frontier Communications Corp. 9.25% 2021 | 22,395 | 21,695 |
| Frontier Communications Corp. 8.75% 2022 | 1,000 | 905 |
| Frontier Communications Corp. 10.50% 20224 | 35,750 | 35,080 |
| Frontier Communications Corp. 7.125% 2023 | 6,225 | 5,213 |
| Frontier Communications Corp. 7.625% 2024 | 20,000 | 16,950 |
| Frontier Communications Corp. 11.00% 20254 | 105,226 | 101,806 |
| Intelsat Jackson Holding Co. 7.25% 2019 | 15,275 | 13,938 |
| Intelsat Jackson Holding Co. 7.25% 2020 | 23,004 | 19,898 |
| Intelsat Jackson Holding Co. 6.625% 2022 | 50,425 | 32,902 |
| Intelsat Luxembourg Holding Co. 6.75% 2018 | 2,500 | 1,844 |
| LightSquared, Term Loan, 9.75% 20207,8,9 | 124,106 | 113,557 |
The Income Fund of America — Page 18 of 35
Bonds, notes & other debt instruments
Corporate bonds & notes (continued)
Telecommunication services (continued) | Principal amount
(000) | Value
(000) |
| MetroPCS Wireless, Inc. 6.25% 2021 | $52,775 | $54,094 |
| MetroPCS Wireless, Inc. 6.625% 2023 | 46,600 | 47,882 |
| Numericable Group SA 4.875% 20194 | 69,225 | 69,138 |
| Numericable Group SA 6.00% 20224 | 12,850 | 12,722 |
| Orange SA 5.50% 2044 | 3,000 | 3,252 |
| Qwest Capital Funding, Inc. 7.625% 2021 | 3,900 | 4,004 |
| SoftBank Corp. 4.50% 20204 | 50,050 | 49,956 |
| Sprint Capital Corp. 6.90% 2019 | 5,025 | 4,045 |
| Sprint Nextel Corp. 9.00% 20184 | 5,000 | 5,119 |
| Sprint Nextel Corp. 7.00% 2020 | 53,605 | 39,668 |
| Sprint Nextel Corp. 7.25% 2021 | 36,155 | 26,212 |
| Sprint Nextel Corp. 11.50% 2021 | 21,305 | 18,003 |
| Sprint Nextel Corp. 7.875% 2023 | 63,400 | 45,648 |
| Sprint Nextel Corp. 7.125% 2024 | 14,000 | 9,520 |
| Telefónica Emisiones, SAU 3.992% 2016 | 10,000 | 10,010 |
| Telefónica Emisiones, SAU 3.192% 2018 | 8,500 | 8,650 |
| Telefónica Emisiones, SAU 5.134% 2020 | 7,950 | 8,626 |
| T-Mobile US, Inc. 6.542% 2020 | 36,700 | 37,985 |
| T-Mobile US, Inc. 6.731% 2022 | 3,695 | 3,815 |
| T-Mobile US, Inc. 6.375% 2025 | 6,650 | 6,692 |
| T-Mobile US, Inc. 6.50% 2026 | 69,950 | 69,950 |
| Trilogy International Partners, LLC 10.25% 20164 | 47,050 | 45,378 |
| Verizon Communications Inc. 3.00% 2021 | 2,516 | 2,535 |
| Verizon Communications Inc. 5.15% 2023 | 1,484 | 1,645 |
| Verizon Communications Inc. 4.272% 2036 | 78,675 | 70,538 |
| Verizon Communications Inc. 6.00% 2041 | 28,000 | 29,874 |
| Verizon Communications Inc. 6.55% 2043 | 4,402 | 5,119 |
| Verizon Communications Inc. 4.522% 2048 | 104,510 | 91,476 |
| Wind Acquisition SA 4.75% 20204 | 78,510 | 77,529 |
| Wind Acquisition SA 7.375% 20214 | 67,200 | 64,218 |
| | | 1,495,765 |
| Industrials 1.29% | | |
| ABB Finance (USA) Inc. 1.625% 2017 | 1,000 | 1,003 |
| ABB Finance (USA) Inc. 2.875% 2022 | 1,000 | 1,008 |
| ABC Supply Co., Inc. 5.625% 20214 | 325 | 333 |
| ADS Waste Escrow 8.25% 2020 | 4,675 | 4,348 |
| ADT Corp. 4.125% 2019 | 18,500 | 19,284 |
| American Airlines, Inc., Series 2013-2, Class A, 4.95% 20248 | 7,855 | 8,312 |
| American Builders & Contractors Supply Co. Inc. 5.75% 20234 | 1,400 | 1,432 |
| ARAMARK Corp. 5.125% 20244 | 4,525 | 4,683 |
| Associated Materials, LLC and AMH New Finance, Inc. 9.125% 2017 | 79,655 | 59,144 |
| Atlas Copco AB 5.60% 20174 | 5,500 | 5,751 |
| Boeing Company 1.65% 2020 | 2,535 | 2,519 |
| Boeing Company 2.20% 2022 | 2,145 | 2,137 |
| Builders Firstsource 7.625% 20214 | 16,945 | 17,750 |
| Builders Firstsource 10.75% 20234 | 4,775 | 4,494 |
| Canadian National Railway Co. 1.45% 2016 | 5,010 | 5,030 |
| CEVA Group PLC 7.00% 20214 | 2,250 | 1,868 |
| CEVA Group PLC 9.00% 20214 | 1,050 | 757 |
| CEVA Group PLC, Apollo Global Securities LLC LOC, 6.50% 20217,8,9 | 4,870 | 4,067 |
| CEVA Group PLC, Term Loan B, 6.50% 20217,8,9 | 6,960 | 5,811 |
| CEVA Group PLC, Term Loan, 6.50% 20217,8,9 | 5,046 | 4,213 |
| CEVA Group PLC, Term Loan, 6.50% 20217,8,9 | 870 | 726 |
The Income Fund of America — Page 19 of 35
Bonds, notes & other debt instruments
Corporate bonds & notes (continued)
Industrials (continued) | Principal amount
(000) | Value
(000) |
| Continental Airlines, Inc., Series 1999-2, Class B, 7.566% 20218 | $342 | $345 |
| Continental Airlines, Inc., Series 1998-1, Class B, 6.748% 20188 | 435 | 445 |
| Continental Airlines, Inc., Series 1997-4B, Class B, 6.90% 20188 | 15 | 16 |
| Continental Airlines, Inc., Series 1998-1, Class A, 6.648% 20198 | 2,309 | 2,356 |
| Continental Airlines, Inc., Series 1997-4, Class A, 6.90% 20198 | 516 | 528 |
| Continental Airlines, Inc., Series 2000-2, Class B, 8.307% 20198 | 65 | 69 |
| Continental Airlines, Inc., Series 1999-1, Class A, 6.545% 20208 | 9,968 | 10,622 |
| Continental Airlines, Inc., Series 1999-1, Class B, 6.795% 20208 | 107 | 108 |
| Continental Airlines, Inc., Series 1999-2, Class A-1, 7.256% 20218 | 355 | 389 |
| Continental Airlines, Inc., Series 2001-1, Class A-1, 6.703% 20228 | 1,881 | 1,952 |
| Continental Airlines, Inc., Series 2007-1, Class B, 6.903% 20228 | 8,313 | 8,567 |
| Continental Airlines, Inc., Series 2000-2, Class A-1, 7.707% 20228 | 1,746 | 1,905 |
| Continental Airlines, Inc., Series 2000-1, Class A-1, 8.048% 20228 | 3,244 | 3,600 |
| Continental Airlines, Inc., Series 2000-1, Class B, 8.388% 20228 | 36 | 37 |
| Corporate Risk Holdings LLC 9.50% 20194 | 45,000 | 38,250 |
| Corporate Risk Holdings LLC 13.50% 20201,4,6 | 13,313 | 12,354 |
| DAE Aviation Holdings, Inc. 10.00% 20234 | 40,090 | 39,088 |
| Delta Air Lines, Inc., Series 2002-1, Class G-1, MBIA insured, 6.718% 20248 | 4,413 | 5,008 |
| ERAC USA Finance Co. 5.25% 20204 | 5,000 | 5,549 |
| Euramax International, Inc. 12.00% 20204 | 23,100 | 20,905 |
| European Aeronautic Defence and Space Company 2.70% 20234 | 3,000 | 2,914 |
| Gardner Denver, Inc. 6.875% 20214 | 9,425 | 6,975 |
| Gardner Denver, Inc., Term Loan B, 4.25% 20207,8,9 | 30,804 | 27,820 |
| Gates Global LLC 6.00% 20224 | 24,825 | 18,433 |
| Gates Global LLC, Term Loan B, 4.25% 20217,8,9 | 6 | 5 |
| General Electric Capital Corp. 0.964% 20164 | 5,146 | 5,149 |
| General Electric Capital Corp. 2.95% 2016 | 4,650 | 4,678 |
| General Electric Capital Corp. 2.342% 20204 | 13,195 | 13,255 |
| General Electric Capital Corp., Series A, 6.00% 2019 | 2,577 | 2,942 |
| General Electric Co. 2.70% 2022 | 7,750 | 7,898 |
| General Electric Co. 4.125% 2042 | 11,000 | 10,867 |
| General Electric Co. 5.00% (undated) | 197,849 | 203,537 |
| Hardwoods Acquisition Inc 7.50% 20214 | 14,040 | 10,600 |
| Hawker Beechcraft Acquisition Co., LLC, LOC, 0.102% 20161,7,8,9,10 | 523 | — |
| HD Supply, Inc. 7.50% 2020 | 6,650 | 6,949 |
| HD Supply, Inc. 11.50% 2020 | 14,664 | 16,240 |
| HD Supply, Inc. 5.25% 20214 | 23,250 | 24,006 |
| HDTFS Inc. 5.875% 2020 | 9,825 | 9,702 |
| KLX Inc. 5.875% 20224 | 28,250 | 26,552 |
| LMI Aerospace Inc. 7.375% 2019 | 15,600 | 14,820 |
| Lockheed Martin Corp. 1.85% 2018 | 2,535 | 2,557 |
| Lockheed Martin Corp. 2.50% 2020 | 6,250 | 6,307 |
| Lockheed Martin Corp. 3.10% 2023 | 695 | 708 |
| Lockheed Martin Corp. 3.55% 2026 | 3,480 | 3,575 |
| Lockheed Martin Corp. 4.50% 2036 | 7,670 | 7,982 |
| Lockheed Martin Corp. 4.70% 2046 | 3,060 | 3,252 |
| Navios Maritime Acquisition Corp. and Navios Acquisition Finance (US) Inc. 8.125% 20214 | 29,500 | 23,563 |
| Navios Maritime Holdings Inc. 7.375% 20224 | 25,840 | 9,399 |
| Navios Maritime Holdings Inc. and Navios Maritime Finance II (US) Inc. 8.125% 2019 | 10,510 | 3,206 |
| Nielsen Finance LLC and Nielsen Finance Co. 4.50% 2020 | 19,250 | 19,599 |
| Nielsen Finance LLC and Nielsen Finance Co. 5.50% 20214 | 25,750 | 26,555 |
| Nielsen Finance LLC and Nielsen Finance Co. 5.00% 20224 | 16,950 | 17,162 |
| Nortek Inc. 8.50% 2021 | 35,772 | 37,113 |
| Ply Gem Industries, Inc. 6.50% 2022 | 24,250 | 21,613 |
The Income Fund of America — Page 20 of 35
Bonds, notes & other debt instruments
Corporate bonds & notes (continued)
Industrials (continued) | Principal amount
(000) | Value
(000) |
| Ply Gem Industries, Inc. 6.50% 2022 | $11,075 | $9,663 |
| PrimeSource Building Products Inc 9.00% 20234 | 1,645 | 1,538 |
| R.R. Donnelley & Sons Co. 7.25% 20182 | 9,234 | 9,673 |
| R.R. Donnelley & Sons Co. 7.625% 20202 | 8,750 | 8,838 |
| R.R. Donnelley & Sons Co. 7.875% 20212 | 14,445 | 14,274 |
| R.R. Donnelley & Sons Co. 7.00% 20222 | 17,500 | 16,472 |
| R.R. Donnelley & Sons Co. 6.50% 20232 | 17,880 | 15,801 |
| Siemens AG 4.40% 20454 | 2,000 | 2,082 |
| Silver II Borrower S.C.A./Silver II U.S. Holdings, LLC 7.75% 20204 | 51,640 | 35,632 |
| TRAC Intermodal 11.00% 2019 | 8,475 | 9,111 |
| TransDigm Inc. 5.50% 2020 | 27,125 | 26,786 |
| TransDigm Inc. 6.00% 2022 | 5,000 | 4,925 |
| TransDigm Inc. 6.50% 2024 | 39,000 | 38,317 |
| TransDigm Inc. 6.50% 20254 | 16,650 | 16,130 |
| United Air Lines, Inc., Series 1996-A2, 7.87% 20191,8,10 | 2,421 | — |
| United Air Lines, Inc., Series 2007-1, Class A, 6.636% 20248 | 5,809 | 6,158 |
| United Air Lines, Inc., Series 2007-1, Class B, 7.336% 20214,8 | 3,539 | 3,733 |
| United Rentals, Inc. 5.50% 2025 | 5,350 | 4,788 |
| Virgin Australia Holdings Ltd. 8.50% 20194 | 41,650 | 40,765 |
| Watco Companies 6.375% 20234 | 10,670 | 10,297 |
| | | 1,177,679 |
| Utilities 0.83% | | |
| Abu Dhabi National Energy Co. PJSC (TAQA) 6.165% 20174 | 2,000 | 2,117 |
| AES Corp. 8.00% 2020 | 12,800 | 14,016 |
| AES Corp. 7.375% 2021 | 26,500 | 27,427 |
| AES Corp. 4.875% 2023 | 2,000 | 1,780 |
| AES Corp. 5.50% 2024 | 7,500 | 6,778 |
| AES Corp. 5.50% 2025 | 16,900 | 15,252 |
| Ameren Corp. 3.65% 2026 | 2,215 | 2,285 |
| American Electric Power Co. 2.95% 2022 | 12,065 | 12,102 |
| Berkshire Hathaway Energy Co. 2.40% 2020 | 11,410 | 11,492 |
| Calpine Corp. 6.00% 20224 | 2,075 | 2,166 |
| Calpine Corp. 5.375% 2023 | 23,810 | 21,786 |
| Calpine Corp. 7.875% 20234 | 4,637 | 4,973 |
| Calpine Corp. 5.50% 2024 | 3,270 | 2,902 |
| CenterPoint Energy Resources Corp. 4.50% 2021 | 13,130 | 13,895 |
| CMS Energy Corp. 8.75% 2019 | 12,279 | 14,804 |
| CMS Energy Corp. 6.25% 2020 | 27,800 | 31,618 |
| CMS Energy Corp. 5.05% 2022 | 1,322 | 1,470 |
| CMS Energy Corp. 3.875% 2024 | 10,000 | 10,432 |
| CMS Energy Corp. 3.60% 2025 | 1,929 | 1,959 |
| CMS Energy Corp. 4.70% 2043 | 2,701 | 2,739 |
| CMS Energy Corp. 4.875% 2044 | 1,870 | 1,951 |
| Colbun SA 6.00% 20204 | 2,000 | 2,144 |
| Colbun SA 4.50% 20244 | 1,500 | 1,460 |
| Comision Federal de Electricidad 4.875% 20244 | 2,000 | 2,000 |
| Commonwealth Edison Company 4.35% 2045 | 1,155 | 1,198 |
| Consumers Energy Co., First Mortgage Bonds, 6.70% 2019 | 13,400 | 15,560 |
| Consumers Energy Co. 5.65% 2020 | 366 | 419 |
| Consumers Energy Co. 3.375% 2023 | 360 | 374 |
| Consumers Energy Co., First Mortgage Bonds, 3.125% 2024 | 2,520 | 2,564 |
| Dominion Gas Holdings LLC 2.50% 2019 | 4,865 | 4,919 |
| Duke Energy Corp. 3.75% 2024 | 13,505 | 13,781 |
The Income Fund of America — Page 21 of 35
Bonds, notes & other debt instruments
Corporate bonds & notes (continued)
Utilities (continued) | Principal amount
(000) | Value
(000) |
| Duke Energy Indiana, Inc. 4.90% 2043 | $14,785 | $16,353 |
| Duke Energy Progress Inc. 4.15% 2044 | 3,935 | 3,961 |
| Dynegy Finance Inc. 6.75% 2019 | 16,275 | 15,807 |
| Dynegy Finance Inc. 7.375% 2022 | 25,960 | 23,104 |
| Dynegy Finance Inc. 7.625% 2024 | 33,715 | 29,838 |
| E.ON International Finance BV 5.80% 20184 | 15,000 | 16,203 |
| EDP Finance BV 4.125% 20204 | 6,000 | 6,043 |
| EDP Finance BV 5.25% 20214 | 22,500 | 23,156 |
| Electricité de France SA 1.15% 20174 | 2,000 | 1,995 |
| Electricité de France SA 3.625% 20254 | 8,740 | 8,731 |
| Electricité de France SA 4.75% 20354 | 1,500 | 1,520 |
| Electricité de France SA 6.95% 20394 | 8,000 | 10,080 |
| Electricité de France SA 4.875% 20444 | 3,850 | 3,803 |
| Electricité de France SA 5.25% (undated)4 | 29,005 | 26,104 |
| Empresa Nacional de Electricidad SA 4.25% 2024 | 900 | 896 |
| Enel Finance International SA 6.00% 20394 | 3,000 | 3,401 |
| Enel Società per Azioni 8.75% 20734 | 12,000 | 13,260 |
| Entergy Corp. 4.70% 2017 | 8,000 | 8,175 |
| Eskom Holdings Ltd. 5.75% 20214 | 6,820 | 5,962 |
| Eskom Holdings SOC Ltd. 6.75% 20234 | 5,000 | 4,244 |
| Eversource Energy 2.80% 2023 | 2,331 | 2,266 |
| Exelon Corp. 2.85% 2020 | 215 | 215 |
| FirstEnergy Corp., Series B, 4.25% 2023 | 31,465 | 32,249 |
| Iberdrola Finance Ireland 5.00% 20194 | 1,060 | 1,157 |
| Israel Electric Corp. Ltd. 8.10% 20964 | 4,905 | 5,494 |
| MidAmerican Energy Co. 5.95% 2017 | 10,625 | 11,283 |
| MidAmerican Energy Co. 2.40% 2019 | 9,000 | 9,184 |
| MidAmerican Energy Holdings Co. 5.75% 2018 | 10,000 | 10,833 |
| National Rural Utilities Cooperative Finance Corp. 2.30% 2020 | 1,415 | 1,420 |
| National Rural Utilities Cooperative Finance Corp. 3.25% 2025 | 1,113 | 1,137 |
| Nevada Power Co., General and Refunding Mortgage Notes, Series V, 7.125% 2019 | 4,867 | 5,571 |
| Niagara Mohawk Power Corp. 3.508% 20244 | 4,150 | 4,283 |
| Niagara Mohawk Power Corp. 4.278% 20344 | 3,000 | 3,053 |
| Northeast Utilities 3.15% 2025 | 5,000 | 4,911 |
| Northern States Power Co., First Mortgage Bonds, 7.125% 2025 | 4 | 5 |
| Northern States Power Co. 4.125% 2044 | 11,000 | 11,246 |
| NRG Energy, Inc. 6.25% 2022 | 7,215 | 5,988 |
| NV Energy, Inc 6.25% 2020 | 20,000 | 23,116 |
| Ohio Power Co., Series G, 6.60% 2033 | 2,090 | 2,614 |
| Ohio Power Co., Series H, 6.60% 2033 | 353 | 429 |
| Pacific Gas and Electric Co. 3.25% 2023 | 2,695 | 2,748 |
| Pacific Gas and Electric Co. 3.85% 2023 | 13,350 | 14,129 |
| Pacific Gas and Electric Co. 3.40% 2024 | 8,278 | 8,508 |
| Pacific Gas and Electric Co. 3.75% 2024 | 567 | 596 |
| Pacific Gas and Electric Co. 4.30% 2045 | 1,900 | 1,911 |
| Pacific Gas and Electric Co. 4.25% 2046 | 5,000 | 4,994 |
| PacifiCorp., First Mortgage Bonds, 5.65% 2018 | 5,500 | 6,003 |
| PacifiCorp., First Mortgage Bonds, 2.95% 2023 | 1,041 | 1,054 |
| PacifiCorp., First Mortgage Bonds, 7.70% 2031 | 2,905 | 4,124 |
| PG&E Corp. 2.40% 2019 | 2,500 | 2,515 |
| Progress Energy, Inc. 7.05% 2019 | 250 | 286 |
| Progress Energy, Inc. 7.00% 2031 | 3,972 | 5,040 |
| Progress Energy, Inc. 7.75% 2031 | 2,653 | 3,526 |
| Public Service Co. of Colorado 5.125% 2019 | 1,486 | 1,649 |
The Income Fund of America — Page 22 of 35
Bonds, notes & other debt instruments
Corporate bonds & notes (continued)
Utilities (continued) | Principal amount
(000) | Value
(000) |
| Public Service Co. of Colorado 2.90% 2025 | $5,556 | $5,623 |
| Puget Energy Inc. 3.65% 2025 | 4,493 | 4,484 |
| Puget Sound Energy, Inc., First Lien, 6.50% 2020 | 6,317 | 7,363 |
| Puget Sound Energy, Inc., First Lien, 6.00% 2021 | 3,945 | 4,515 |
| Puget Sound Energy, Inc., First Lien, 5.625% 2022 | 6,581 | 7,397 |
| Southern California Edison Co. 1.845% 20228 | 7,730 | 7,746 |
| Tampa Electric Co. 2.60% 2022 | 2,925 | 2,901 |
| Tampa Electric Co. 4.35% 2044 | 8,330 | 8,555 |
| Teco Finance, Inc. 4.00% 2016 | 3,031 | 3,042 |
| Teco Finance, Inc. 5.15% 2020 | 6,536 | 7,086 |
| TXU, Term Loan, 3.737% 20147,8,9,10 | 3,000 | 886 |
| TXU, Term Loan, 4.65% 20177,8,9,10 | 26,205 | 7,940 |
| Veolia Environnement 6.75% 2038 | 500 | 627 |
| Virginia Electric and Power Co. 3.45% 2024 | 560 | 584 |
| Virginia Electric and Power Co. 3.10% 2025 | 2,625 | 2,657 |
| Virginia Electric and Power Co., Series B, 5.95% 2017 | 4,500 | 4,834 |
| Xcel Energy Inc. 4.70% 2020 | 7,452 | 8,082 |
| Xcel Energy Inc. 3.30% 2025 | 5,010 | 5,051 |
| Xcel Energy Inc. 6.50% 2036 | 7,643 | 9,634 |
| Xcel Energy Inc. 4.80% 2041 | 949 | 996 |
| | | 764,539 |
| Materials 0.83% | | |
| ArcelorMittal 5.50% 2017 | 6,180 | 6,072 |
| ArcelorMittal 6.50% 2021 | 19,077 | 15,595 |
| ArcelorMittal 7.25% 2022 | 25,110 | 20,527 |
| ArcelorMittal 6.125% 2025 | 16,675 | 12,173 |
| ArcelorMittal 7.75% 2041 | 61,355 | 43,562 |
| Ball Corp. 4.375% 2020 | 15,225 | 15,786 |
| BHP Billiton Finance Ltd. 6.75% 20754 | 13,165 | 12,408 |
| Chemours Co. 6.625% 20234 | 35,285 | 21,788 |
| Chemours Co. 7.00% 20254 | 24,165 | 14,801 |
| Cliffs Natural Resources Inc. 8.25% 20202,4 | 10,300 | 7,468 |
| Cliffs Natural Resources Inc. 4.875% 20212 | 4,945 | 754 |
| CRH America, Inc. 3.875% 20254 | 2,000 | 2,032 |
| CRH America, Inc. 5.125% 20454 | 2,000 | 2,034 |
| Dow Chemical Co. 5.25% 2041 | 4,000 | 3,852 |
| Eastman Chemical Co. 2.70% 2020 | 12,000 | 11,693 |
| Ecolab Inc. 3.00% 2016 | 7,455 | 7,562 |
| First Quantum Minerals Ltd. 6.75% 20204 | 77,788 | 35,880 |
| First Quantum Minerals Ltd. 7.00% 20214 | 78,287 | 35,816 |
| First Quantum Minerals Ltd. 7.25% 20224 | 14,125 | 6,427 |
| FMG Resources 9.75% 20224 | 93,675 | 81,731 |
| Freeport-McMoRan Copper & Gold Inc. 3.55% 2022 | 20,390 | 8,819 |
| Georgia Gulf Corp. 4.625% 2021 | 24,475 | 23,802 |
| Georgia-Pacific Corp. 2.539% 20194 | 12,000 | 12,009 |
| Glencore Xstrata LLC 4.625% 20244 | 7,000 | 4,779 |
| Graphic Packaging International, Inc. 4.75% 2021 | 4,510 | 4,578 |
| Holcim Ltd. 6.00% 20194 | 1,607 | 1,795 |
| Holcim Ltd. 5.15% 20234 | 12,595 | 13,665 |
| Huntsman International LLC 4.875% 2020 | 12,750 | 11,379 |
| International Paper Co. 7.30% 2039 | 5,615 | 6,508 |
| JMC Steel Group Inc. 8.25% 20184 | 70,998 | 53,248 |
| LSB Industries, Inc. 7.75% 2019 | 9,800 | 8,109 |
The Income Fund of America — Page 23 of 35
Bonds, notes & other debt instruments
Corporate bonds & notes (continued)
Materials (continued) | Principal amount
(000) | Value
(000) |
| Monsanto Co. 4.40% 2044 | $13,090 | $10,630 |
| Owens-Illinois, Inc. 5.00% 20224 | 3,360 | 3,238 |
| Owens-Illinois, Inc. 5.875% 20234 | 12,780 | 12,564 |
| Owens-Illinois, Inc. 5.375% 20254 | 2,515 | 2,355 |
| Owens-Illinois, Inc. 6.375% 20254 | 10,210 | 10,076 |
| Paperworks Industries Inc. 9.50% 20194 | 2,458 | 2,274 |
| Platform Specialty Products Corp. 10.375% 20214 | 18,426 | 17,274 |
| Platform Specialty Products Corp. 6.50% 20224 | 1,010 | 798 |
| Praxair, Inc. 2.25% 2020 | 7,130 | 7,176 |
| Rayonier Advanced Materials Inc. 5.50% 20244 | 24,907 | 18,898 |
| Reynolds Group Inc. 5.75% 2020 | 87,105 | 87,432 |
| Reynolds Group Inc. 6.875% 2021 | 5,000 | 5,188 |
| Rio Tinto Finance (USA) Ltd. 1.625% 2017 | 8,500 | 8,333 |
| Ryerson Inc. 9.00% 2017 | 27,771 | 21,106 |
| Ryerson Inc. 11.25% 2018 | 20,433 | 13,690 |
| Smurfit Capital Funding PLC 7.50% 2025 | 2,425 | 2,680 |
| Summit Materials, Inc. 6.125% 2023 | 9,325 | 9,045 |
| Tembec Industries Inc. 9.00% 20194 | 7,520 | 4,794 |
| U.S. Coatings Acquisition Inc. (Flash Dutch 2 BV) 7.375% 20214 | 5,060 | 5,326 |
| Walter Energy, Inc. 9.50% 20194,10 | 35,950 | 9,706 |
| | | 759,235 |
| Consumer staples 0.68% | | |
| Altria Group, Inc. 9.25% 2019 | 18,542 | 22,711 |
| Altria Group, Inc. 2.625% 2020 | 10,420 | 10,578 |
| Altria Group, Inc. 4.00% 2024 | 1,500 | 1,591 |
| Altria Group, Inc. 9.95% 2038 | 23,500 | 38,114 |
| Altria Group, Inc. 4.25% 2042 | 20,000 | 18,552 |
| Altria Group, Inc. 4.50% 2043 | 4,000 | 3,865 |
| Altria Group, Inc. 5.375% 2044 | 2,595 | 2,835 |
| Anheuser-Busch InBev NV 7.75% 2019 | 25,000 | 28,966 |
| Anheuser-Busch InBev NV 2.65% 2021 | 46,765 | 47,114 |
| Anheuser-Busch InBev NV 3.30% 2023 | 14,475 | 14,731 |
| Anheuser-Busch InBev NV 3.65% 2026 | 45,990 | 46,605 |
| Anheuser-Busch InBev NV 4.70% 2036 | 8,730 | 8,892 |
| Anheuser-Busch InBev NV 4.90% 2046 | 7,770 | 8,068 |
| British American Tobacco International Finance PLC 9.50% 20184 | 8,705 | 10,448 |
| British American Tobacco International Finance PLC 3.95% 20254 | 8,000 | 8,346 |
| Coca-Cola Co. 1.80% 2016 | 10,000 | 10,061 |
| Constellation Brands, Inc. 7.25% 2017 | 15,400 | 16,285 |
| Constellation Brands, Inc. 3.875% 2019 | 6,000 | 6,195 |
| Constellation Brands, Inc. 6.00% 2022 | 2,825 | 3,150 |
| Constellation Brands, Inc. 4.25% 2023 | 6,000 | 6,157 |
| CVS Caremark Corp. 2.25% 2019 | 6,015 | 6,064 |
| CVS Caremark Corp. 3.50% 2022 | 6,000 | 6,187 |
| CVS Caremark Corp. 5.125% 2045 | 6,815 | 7,373 |
| H.J Heinz Co. 4.875% 20254 | 11,214 | 12,010 |
| Imperial Tobacco Finance PLC 3.50% 20234 | 10,000 | 9,916 |
| Ingles Markets, Inc. 5.75% 2023 | 10,750 | 10,831 |
| Kimberly-Clark Corp. 7.50% 2018 | 9,000 | 10,420 |
| Kraft Foods Inc. 5.00% 2042 | 30,000 | 30,750 |
| Kroger Co. 2.60% 2021 | 1,165 | 1,181 |
| Kroger Co. 3.50% 2026 | 585 | 595 |
| Mead Johnson Nutrition Co. 3.00% 2020 | 1,960 | 1,985 |
The Income Fund of America — Page 24 of 35
Bonds, notes & other debt instruments
Corporate bonds & notes (continued)
Consumer staples (continued) | Principal amount
(000) | Value
(000) |
| Mead Johnson Nutrition Co. 4.125% 2025 | $635 | $652 |
| Pernod Ricard SA 2.95% 20174 | 20,000 | 20,208 |
| Pernod Ricard SA 4.45% 20224 | 9,500 | 10,064 |
| Philip Morris International Inc. 3.60% 2023 | 7,245 | 7,731 |
| Philip Morris International Inc. 4.25% 2044 | 2,000 | 1,959 |
| Reynolds American Inc. 2.30% 2018 | 1,990 | 2,010 |
| Reynolds American Inc. 3.25% 2020 | 5,510 | 5,663 |
| Reynolds American Inc. 3.25% 2022 | 6,150 | 6,234 |
| Reynolds American Inc. 4.00% 2022 | 890 | 943 |
| Reynolds American Inc. 4.45% 2025 | 22,110 | 23,506 |
| Reynolds American Inc. 5.70% 2035 | 3,760 | 4,136 |
| Reynolds American Inc. 6.15% 2043 | 1,820 | 2,081 |
| Reynolds American Inc. 5.85% 2045 | 20,700 | 23,204 |
| SABMiller Holdings Inc. 4.95% 20424 | 7,000 | 7,105 |
| The JM Smucker Co. 2.50% 2020 | 1,825 | 1,836 |
| The JM Smucker Co. 3.00% 2022 | 2,850 | 2,886 |
| The JM Smucker Co. 3.50% 2025 | 3,425 | 3,468 |
| Tyson Foods, Inc. 6.60% 2016 | 11,500 | 11,602 |
| Tyson Foods, Inc. 3.95% 2024 | 6,000 | 6,224 |
| Tyson Foods, Inc. 5.15% 2044 | 5,460 | 5,734 |
| Walgreens Boots Alliance, Inc. 3.30% 2021 | 13,000 | 13,021 |
| Walgreens Boots Alliance, Inc. 3.80% 2024 | 4,385 | 4,326 |
| Wal-Mart Stores, Inc. 2.80% 2016 | 10,000 | 10,047 |
| Wal-Mart Stores, Inc. 3.30% 2024 | 10,755 | 11,287 |
| WM. Wrigley Jr. Co 2.40% 20184 | 1,200 | 1,211 |
| WM. Wrigley Jr. Co 2.90% 20194 | 1,200 | 1,223 |
| WM. Wrigley Jr. Co 3.375% 20204 | 22,500 | 23,202 |
| | | 622,139 |
| Information technology 0.51% | | |
| Alcatel-Lucent USA Inc. 4.625% 20174 | 17,585 | 18,376 |
| Alcatel-Lucent USA Inc. 6.75% 20204 | 5,467 | 5,898 |
| Alcatel-Lucent USA Inc. 8.875% 20204 | 23,185 | 24,924 |
| Compucom Systems Inc., 7.00% 20214 | 3,425 | 1,464 |
| First Data Corp. 6.75% 20204 | 12,350 | 13,045 |
| First Data Corp. 5.375% 20234 | 11,400 | 11,656 |
| First Data Corp. 7.00% 20234 | 118,950 | 120,437 |
| First Data Corp. 5.75% 20244 | 7,650 | 7,631 |
| Freescale Semiconductor, Inc. 5.00% 20214 | 50,300 | 51,557 |
| Freescale Semiconductor, Inc. 6.00% 20224 | 18,275 | 19,189 |
| Harris Corp. 2.70% 2020 | 1,315 | 1,308 |
| Harris Corp. 3.832% 2025 | 740 | 749 |
| Harris Corp. 4.854% 2035 | 2,775 | 2,792 |
| Harris Corp. 5.054% 2045 | 5,735 | 5,813 |
| Hewlett-Packard Co. 4.40% 20224 | 10,000 | 9,889 |
| Infor Inc. 5.75% 20204 | 7,275 | 7,348 |
| Jabil Circuit, Inc. 8.25% 2018 | 20,925 | 22,834 |
| Jabil Circuit, Inc. 5.625% 2020 | 10,650 | 11,116 |
| KLA-Tencor Corp. 4.65% 2024 | 5,000 | 5,075 |
| Microsoft Corp. 2.65% 2022 | 6,000 | 6,102 |
| Microsoft Corp. 4.20% 2035 | 6,000 | 6,102 |
| NXP BV and NXP Funding LLC 4.125% 20204 | 21,000 | 20,947 |
| Oracle Corp. 2.50% 2022 | 19,000 | 18,808 |
| Qorvo, Inc. 7.00% 20254 | 13,775 | 13,706 |
The Income Fund of America — Page 25 of 35
Bonds, notes & other debt instruments
Corporate bonds & notes (continued)
Information technology (continued) | Principal amount
(000) | Value
(000) |
| Serena Software, Inc., Term Loan B, 7.50% 20207,8,9 | $32,032 | $29,256 |
| Visa Inc. 3.15% 2025 | 8,000 | 8,145 |
| Visa Inc. 4.15% 2035 | 10,000 | 10,368 |
| Visa Inc. 4.30% 2045 | 9,000 | 9,356 |
| | | 463,891 |
| Total corporate bonds & notes | | 13,170,147 |
U.S. Treasury bonds & notes 5.73%
U.S. Treasury 5.10% | | |
| U.S. Treasury 1.50% 201611 | 20,500 | 20,589 |
| U.S. Treasury 1.75% 2016 | 85,000 | 85,371 |
| U.S. Treasury 0.50% 2017 | 10,000 | 9,986 |
| U.S. Treasury 0.875% 2017 | 40,000 | 40,094 |
| U.S. Treasury 1.00% 2017 | 10,000 | 10,041 |
| U.S. Treasury 0.625% 2018 | 120,000 | 119,368 |
| U.S. Treasury 0.75% 2018 | 100,000 | 99,832 |
| U.S. Treasury 1.25% 2018 | 86,000 | 86,703 |
| U.S. Treasury 1.75% 2019 | 41,000 | 41,902 |
| U.S. Treasury 3.625% 2019 | 82,000 | 89,163 |
| U.S. Treasury 1.25% 2020 | 180,000 | 180,304 |
| U.S. Treasury 1.375% 2020 | 85,000 | 85,236 |
| U.S. Treasury 1.375% 2020 | 40,000 | 40,127 |
| U.S. Treasury 1.375% 2020 | 31,000 | 31,179 |
| U.S. Treasury 1.50% 2020 | 203,300 | 205,420 |
| U.S. Treasury 1.625% 2020 | 162,850 | 165,203 |
| U.S. Treasury 1.625% 2020 | 88,250 | 89,570 |
| U.S. Treasury 1.75% 2020 | 21,210 | 21,628 |
| U.S. Treasury 1.375% 2021 | 10,000 | 10,022 |
| U.S. Treasury 1.75% 2022 | 166,100 | 167,288 |
| U.S. Treasury 2.00% 2022 | 104,000 | 106,319 |
| U.S. Treasury 6.25% 2023 | 69,000 | 91,271 |
| U.S. Treasury 2.25% 2024 | 61,775 | 63,646 |
| U.S. Treasury 2.00% 2025 | 607,188 | 611,165 |
| U.S. Treasury 2.25% 2025 | 94,636 | 97,379 |
| U.S. Treasury 5.50% 2028 | 52,000 | 71,459 |
| U.S. Treasury 4.50% 2036 | 36,186 | 48,534 |
| U.S. Treasury 4.625% 2040 | 15,150 | 20,678 |
| U.S. Treasury 4.375% 2041 | 20,800 | 27,518 |
| U.S. Treasury 4.75% 2041 | 30,900 | 43,021 |
| U.S. Treasury 2.75% 2042 | 16,275 | 16,374 |
| U.S. Treasury 2.75% 2042 | 10,900 | 10,988 |
| U.S. Treasury 3.125% 2043 | 33,675 | 36,393 |
| U.S. Treasury 3.00% 2044 | 161,350 | 169,632 |
| U.S. Treasury 3.125% 2044 | 131,950 | 142,249 |
| U.S. Treasury 3.375% 2044 | 148,415 | 167,848 |
| U.S. Treasury 2.50% 2045 | 55,925 | 53,046 |
| U.S. Treasury 2.875% 2045 | 954,360 | 977,770 |
| U.S. Treasury 3.00% 2045 | 219,791 | 231,134 |
| U.S. Treasury 3.00% 2045 | 77,475 | 81,373 |
| | | 4,666,823 |
The Income Fund of America — Page 26 of 35
Bonds, notes & other debt instruments
U.S. Treasury bonds & notes (continued)
U.S. Treasury inflation-protected securities 0.63% | Principal amount
(000) | Value
(000) |
| U.S. Treasury Inflation-Protected Security 0.125% 202412 | $21,492 | $20,864 |
| U.S. Treasury Inflation-Protected Security 0.625% 202412 | 79,802 | 80,551 |
| U.S. Treasury Inflation-Protected Security 0.25% 202512 | 56,919 | 55,466 |
| U.S. Treasury Inflation-Protected Security 0.375% 202512 | 182,961 | 180,854 |
| U.S. Treasury Inflation-Protected Security 0.75% 204212 | 47,895 | 43,475 |
| U.S. Treasury Inflation-Protected Security 1.375% 204412 | 100,314 | 105,295 |
| U.S. Treasury Inflation-Protected Security 0.75% 204512 | 106,161 | 95,614 |
| | | 582,119 |
| Total U.S. Treasury bonds & notes | | 5,248,942 |
| Mortgage-backed obligations 2.09% | | |
| Aventura Mall Trust, Series A, 3.867% 20324,7,8 | 12,250 | 12,953 |
| Banc of America Commercial Mortgage Inc., Series 2007-3, Class A-4, 5.742% 20497,8 | 4,253 | 4,377 |
| Bank of America Merrill Lynch Large Loan Inc., Series 2015-200P, Class A, 3.218% 20334,8 | 5,575 | 5,595 |
| Bellemeade Re Ltd., Series 2015-1-A, Class M-1, 2.922% 20251,4,7,8 | 6,639 | 6,637 |
| Citigroup-Deutsche Bank Commercial Mortgage Trust, Series 2006-CD3, Class A-5, 5.617% 20488 | 8,862 | 8,968 |
| COMM Mortgage Trust, Series 2014-277P, Class A, 3.611% 20494,7,8 | 17,000 | 17,683 |
| Connecticut Avenue Securities, Series 2015-C01, Class 1-M-1, 1.922% 20257,8 | 2,402 | 2,404 |
| Core Industrial Trust, Series 2015-CALW, Class A, 3.04% 20344,8 | 16,900 | 17,131 |
| Countrywide Alternative Loan Trust, Series 2005-54CB, Class 2-A-5, 5.50% 20358 | 5,686 | 5,157 |
| Countrywide Alternative Loan Trust, Series 2007-HY4, Class 3-A-1, 2.90% 20477,8 | 3,693 | 3,051 |
| CS First Boston Mortgage Securities Corp., Series 2006-C5, Class A-M, 5.343% 20398 | 8,000 | 8,150 |
| CS First Boston Mortgage Securities Corp., Series 2004-5, Class IV-A-1, 6.00% 20348 | 1,186 | 1,218 |
| CS First Boston Mortgage Securities Corp., Series 2007-C5, Class A4, 5.695% 20407,8 | 11,519 | 11,964 |
| CS First Boston Mortgage Securities Corp., Series 2007-C2, Class A-M, 5.615% 20497,8 | 10,000 | 10,315 |
| CSAIL Commercial Mortgage Trust, Series 2015-C-4, Class ASB, 3.6167% 20488 | 3,400 | 3,548 |
| DBUBS Mortgage Trust, Series 2011-LC2A, Class A-2, 3.386% 20444,8 | 2,980 | 2,988 |
| DBUBS Mortgage Trust, Series 2011-LC1A, Class A1, 3.742% 20464,8 | 1,151 | 1,155 |
EQTY 2014-INNS Mortgage Trust Commercial Mortgage Pass-Through Certificates,
Series 2014-A, 1.045% 20314,7,8 | 5,114 | 5,016 |
| Fannie Mae 5.50% 20188 | 19 | 19 |
| Fannie Mae 6.00% 20218 | 129 | 140 |
| Fannie Mae 4.50% 20248 | 1,751 | 1,893 |
| Fannie Mae 5.50% 20248 | 171 | 187 |
| Fannie Mae 4.50% 20258 | 1,670 | 1,790 |
| Fannie Mae 4.50% 20258 | 1,041 | 1,127 |
| Fannie Mae 4.50% 20258 | 909 | 986 |
| Fannie Mae 4.50% 20258 | 900 | 964 |
| Fannie Mae 6.00% 20268 | 2,947 | 3,333 |
| Fannie Mae 7.00% 20268 | 510 | 590 |
| Fannie Mae 2.50% 20278 | 1,296 | 1,333 |
| Fannie Mae 2.50% 20278 | 1,041 | 1,070 |
| Fannie Mae 2.50% 20278 | 968 | 996 |
| Fannie Mae 2.50% 20278 | 748 | 769 |
| Fannie Mae 2.50% 20278 | 533 | 548 |
| Fannie Mae 2.50% 20278 | 463 | 476 |
| Fannie Mae 2.50% 20278 | 459 | 472 |
| Fannie Mae 2.50% 20288 | 34,002 | 34,975 |
| Fannie Mae 2.50% 20288 | 11,629 | 11,964 |
| Fannie Mae 2.50% 20288 | 1,629 | 1,674 |
| Fannie Mae 2.50% 20288 | 1,520 | 1,562 |
| Fannie Mae 2.50% 20288 | 1,397 | 1,433 |
| Fannie Mae 2.50% 20288 | 1,233 | 1,267 |
The Income Fund of America — Page 27 of 35
Bonds, notes & other debt instruments
Mortgage-backed obligations (continued) | Principal amount
(000) | Value
(000) |
| Fannie Mae 2.50% 20288 | $1,226 | $1,254 |
| Fannie Mae 2.50% 20288 | 1,092 | 1,122 |
| Fannie Mae 2.50% 20288 | 1,071 | 1,100 |
| Fannie Mae 2.50% 20288 | 792 | 814 |
| Fannie Mae 2.50% 20288 | 790 | 812 |
| Fannie Mae 2.50% 20288 | 782 | 803 |
| Fannie Mae 2.50% 20288 | 576 | 592 |
| Fannie Mae 2.50% 20288 | 501 | 514 |
| Fannie Mae 2.50% 20288 | 490 | 503 |
| Fannie Mae 2.50% 20288 | 471 | 482 |
| Fannie Mae 2.50% 20288 | 459 | 472 |
| Fannie Mae 2.50% 20288 | 434 | 445 |
| Fannie Mae 2.50% 20288 | 427 | 439 |
| Fannie Mae 2.50% 20288 | 410 | 422 |
| Fannie Mae 2.50% 20288 | 402 | 413 |
| Fannie Mae 2.50% 20288 | 399 | 410 |
| Fannie Mae 2.50% 20288 | 393 | 403 |
| Fannie Mae 2.50% 20288 | 277 | 284 |
| Fannie Mae 2.50% 20288 | 94 | 96 |
| Fannie Mae 2.50% 20288 | 55 | 57 |
| Fannie Mae 6.00% 20288 | 3,068 | 3,495 |
| Fannie Mae 7.00% 20288 | 1,165 | 1,353 |
| Fannie Mae 7.00% 20288 | 254 | 294 |
| Fannie Mae 5.50% 20338 | 458 | 516 |
| Fannie Mae 3.00% 20358 | 3,632 | 3,783 |
| Fannie Mae 3.50% 20358 | 3,342 | 3,541 |
| Fannie Mae 5.50% 20358 | 434 | 489 |
| Fannie Mae 5.50% 20368 | 2,901 | 3,271 |
| Fannie Mae 6.00% 20368 | 1,200 | 1,362 |
| Fannie Mae 6.00% 20368 | 852 | 966 |
| Fannie Mae 6.00% 20368 | 416 | 471 |
| Fannie Mae 6.00% 20378 | 13,097 | 14,987 |
| Fannie Mae 6.00% 20378 | 2,216 | 2,544 |
| Fannie Mae 6.00% 20378 | 1,846 | 2,105 |
| Fannie Mae 6.00% 20378 | 121 | 138 |
| Fannie Mae 6.50% 20378 | 817 | 947 |
| Fannie Mae 6.50% 20378 | 607 | 695 |
| Fannie Mae 6.50% 20378 | 545 | 612 |
| Fannie Mae 6.50% 20378 | 115 | 133 |
| Fannie Mae 7.00% 20378 | 530 | 590 |
| Fannie Mae 7.00% 20378 | 154 | 171 |
| Fannie Mae 7.50% 20378 | 282 | 320 |
| Fannie Mae 7.50% 20378 | 112 | 122 |
| Fannie Mae 7.50% 20378 | 86 | 93 |
| Fannie Mae 5.50% 20388 | 641 | 718 |
| Fannie Mae 6.00% 20388 | 2,956 | 3,355 |
| Fannie Mae 6.00% 20388 | 1,987 | 2,267 |
| Fannie Mae 6.00% 20388 | 1,436 | 1,629 |
| Fannie Mae 4.50% 20398 | 22,924 | 25,239 |
| Fannie Mae 6.00% 20398 | 1,790 | 2,026 |
| Fannie Mae 6.50% 20398 | 584 | 668 |
| Fannie Mae 4.00% 20408 | 11,508 | 12,380 |
| Fannie Mae 4.00% 20408 | 6,932 | 7,428 |
| Fannie Mae 4.00% 20408 | 449 | 485 |
| Fannie Mae 4.50% 20408 | 80 | 87 |
The Income Fund of America — Page 28 of 35
Bonds, notes & other debt instruments
Mortgage-backed obligations (continued) | Principal amount
(000) | Value
(000) |
| Fannie Mae 4.50% 20408 | $54 | $59 |
| Fannie Mae 5.00% 20408 | 7,910 | 8,777 |
| Fannie Mae 4.00% 20418 | 9,930 | 10,714 |
| Fannie Mae 4.00% 20418 | 7,452 | 8,040 |
| Fannie Mae 4.00% 20418 | 748 | 808 |
| Fannie Mae 4.00% 20418 | 457 | 494 |
| Fannie Mae 4.00% 20418 | 359 | 388 |
| Fannie Mae 4.00% 20418 | 237 | 257 |
| Fannie Mae 4.50% 20418 | 234 | 255 |
| Fannie Mae 5.00% 20418 | 465 | 518 |
| Fannie Mae 5.00% 20418 | 428 | 476 |
| Fannie Mae 5.00% 20418 | 370 | 413 |
| Fannie Mae 5.00% 20418 | 302 | 338 |
| Fannie Mae 3.50% 20428 | 17,857 | 18,730 |
| Fannie Mae 4.00% 20428 | 8,692 | 9,380 |
| Fannie Mae 4.00% 20428 | 3,640 | 3,935 |
| Fannie Mae 4.00% 20428 | 1,221 | 1,320 |
| Fannie Mae 4.00% 20438 | 9,574 | 10,387 |
| Fannie Mae 4.00% 20438 | 8,971 | 9,733 |
| Fannie Mae 4.00% 20438 | 3,522 | 3,825 |
| Fannie Mae 4.00% 20438 | 3,470 | 3,756 |
| Fannie Mae 4.00% 20438 | 3,274 | 3,546 |
| Fannie Mae 4.00% 20438 | 3,157 | 3,419 |
| Fannie Mae 4.00% 20438 | 2,798 | 3,038 |
| Fannie Mae 4.00% 20438 | 2,391 | 2,584 |
| Fannie Mae 4.00% 20458 | 57,068 | 61,575 |
| Fannie Mae 4.00% 20458 | 9,306 | 10,041 |
| Fannie Mae 3.00% 20468,13 | 2,655 | 2,709 |
| Fannie Mae 4.00% 20468,13 | 7,700 | 8,223 |
| Fannie Mae 4.50% 20468,13 | 137,070 | 148,743 |
| Fannie Mae 6.50% 20478 | 470 | 532 |
| Fannie Mae 6.50% 20478 | 333 | 377 |
| Fannie Mae 6.50% 20478 | 291 | 330 |
| Fannie Mae 6.50% 20478 | 184 | 209 |
| Fannie Mae 6.50% 20478 | 123 | 140 |
| Fannie Mae 6.50% 20478 | 79 | 89 |
| Fannie Mae 7.00% 20478 | 522 | 599 |
| Fannie Mae 7.00% 20478 | 289 | 332 |
| Fannie Mae 7.00% 20478 | 193 | 221 |
| Fannie Mae 7.00% 20478 | 101 | 116 |
| Fannie Mae, Series 2012-M14, Class A2, multifamily 2.301% 20227,8 | 4,285 | 4,301 |
| Fannie Mae, Series 2012-M9, Class A2, multifamily 2.482% 20228 | 12,231 | 12,495 |
| Fannie Mae, Series 2012-M5, Class A2, multifamily 2.715% 20228 | 7,000 | 7,221 |
| Fannie Mae, Series 2013-M14, Class A2, multifamily 3.329% 20237,8 | 8,367 | 8,875 |
| Fannie Mae, Series 2014-M2, Class A2, multifamily 3.513% 20237,8 | 10,100 | 10,845 |
| Fannie Mae, Series 2014-M9, multifamily 3.103% 20247,8 | 7,990 | 8,288 |
| Fannie Mae, Series 2014-M3, Class A2, multifamily 3.475% 20247,8 | 10,000 | 10,654 |
| Fannie Mae, Series 2001-4, Class GA, 9.393% 20257,8 | 74 | 83 |
| Fannie Mae, Series 2001-4, Class NA, 9.736% 20257,8 | 1 | 2 |
| Fannie Mae, Series 2001-20, Class E, 9.571% 20317,8 | 78 | 86 |
| Fannie Mae, Series 2007-33, Class HE, 5.50% 20378 | 4,629 | 5,187 |
| Fannie Mae, Series 2007-24, Class P, 6.00% 20378 | 2,631 | 2,929 |
| Fannie Mae, Series 2001-50, Class BA, 7.00% 20418 | 389 | 450 |
| Fannie Mae, Series 2001-T10, Class A-1, 7.00% 20418 | 353 | 423 |
| Fannie Mae, Series 2002-W3, Class A-5, 7.50% 20418 | 235 | 276 |
The Income Fund of America — Page 29 of 35
Bonds, notes & other debt instruments
Mortgage-backed obligations (continued) | Principal amount
(000) | Value
(000) |
| Fannie Mae, Series 2002-W1, Class 2A, 6.335% 20427,8 | $626 | $735 |
| Financial Asset Securitization, Inc., Series 1997-NAM1, Class B-1, 7.75% 20278 | 7 | 8 |
| Freddie Mac 5.00% 20238 | 2,046 | 2,219 |
| Freddie Mac 5.00% 20238 | 2,049 | 2,219 |
| Freddie Mac 5.00% 20238 | 1,898 | 2,054 |
| Freddie Mac 5.00% 20238 | 674 | 737 |
| Freddie Mac 6.00% 20268 | 436 | 495 |
| Freddie Mac 6.00% 20278 | 736 | 833 |
| Freddie Mac 3.50% 20348 | 33,874 | 35,883 |
| Freddie Mac 3.00% 20358 | 14,818 | 15,431 |
| Freddie Mac 3.50% 20358 | 33,674 | 35,673 |
| Freddie Mac 3.50% 20358 | 30,633 | 32,454 |
| Freddie Mac 3.50% 20358 | 3,976 | 4,212 |
| Freddie Mac 4.50% 20358 | 13,702 | 14,931 |
| Freddie Mac 5.50% 20378 | 564 | 626 |
| Freddie Mac 5.50% 20388 | 1,653 | 1,847 |
| Freddie Mac 6.50% 20388 | 1,818 | 2,072 |
| Freddie Mac 4.50% 20398 | 1,226 | 1,333 |
| Freddie Mac 5.00% 20398 | 3,217 | 3,593 |
| Freddie Mac 5.00% 20398 | 2,053 | 2,283 |
| Freddie Mac 5.00% 20398 | 1,259 | 1,384 |
| Freddie Mac 5.50% 20398 | 808 | 902 |
| Freddie Mac 4.50% 20408 | 29,567 | 32,215 |
| Freddie Mac 4.00% 20418 | 2,031 | 2,171 |
| Freddie Mac 4.50% 20418 | 2,872 | 3,125 |
| Freddie Mac 4.50% 20418 | 2,004 | 2,180 |
| Freddie Mac 4.50% 20418 | 1,902 | 2,066 |
| Freddie Mac 5.00% 20418 | 191 | 212 |
| Freddie Mac 4.50% 20428 | 4,664 | 5,078 |
| Freddie Mac 4.50% 20428 | 2,836 | 3,085 |
| Freddie Mac 4.00% 20438 | 6,452 | 6,958 |
| Freddie Mac 4.00% 20438 | 6,197 | 6,695 |
| Freddie Mac 4.00% 20438 | 4,970 | 5,380 |
| Freddie Mac 4.00% 20438 | 3,709 | 4,007 |
| Freddie Mac 4.00% 20438 | 3,071 | 3,331 |
| Freddie Mac 4.00% 20438 | 2,958 | 3,191 |
| Freddie Mac 4.00% 20458 | 35,486 | 38,290 |
| Freddie Mac 3.50% 20468,13 | 30,000 | 31,345 |
| Freddie Mac, Series 2890, Class KT, 4.50% 20198 | 11,682 | 12,146 |
| Freddie Mac, Series K019, Class A2, multifamily 2.272% 20228 | 8,000 | 8,054 |
| Freddie Mac, Series K021, Class A2, multifamily 2.396% 20228 | 8,280 | 8,425 |
| Freddie Mac, Series K025, Class A2, multifamily 2.682% 20228 | 7,000 | 7,212 |
| Freddie Mac, Series 2289, Class NB, 9.00% 20227,8 | 8 | 8 |
| Freddie Mac, Series 2013-DN2, Class M-1, 1.872% 20237,8 | 2,161 | 2,158 |
| Freddie Mac, Series K036, Class A1, multifamily 2.777% 20238 | 11,872 | 12,365 |
| Freddie Mac, Series K028, Class A2, multifamily 3.111% 20238 | 9,800 | 10,343 |
| Freddie Mac, Series K035, Class A2, multifamily 3.458% 20237,8 | 3,000 | 3,212 |
| Freddie Mac, Series K036, Class A2, multifamily 3.527% 20237,8 | 9,465 | 10,195 |
| Freddie Mac, Series 2013-DN1, Class M-1, 3.822% 20237,8 | 2,704 | 2,761 |
| Freddie Mac, Series 2014-HQ2, Class M-1, 1.872% 20247,8 | 4,244 | 4,255 |
| Freddie Mac, Series 2014-HQ3, Class M-1, 2.072% 20247,8 | 1,672 | 1,676 |
| Freddie Mac, Series 2014-HQ2, Class M-2, 2.622% 20247,8 | 5,815 | 5,744 |
| Freddie Mac, Series 2014-DN4, Class M-2, 2.822% 20247,8 | 5,911 | 5,962 |
| Freddie Mac, Series K043, Class A2, multifamily 3.062% 20248 | 26,000 | 26,916 |
| Freddie Mac, Series K041, Class A2, multifamily 3.171% 20248 | 1,300 | 1,362 |
The Income Fund of America — Page 30 of 35
Bonds, notes & other debt instruments
Mortgage-backed obligations (continued) | Principal amount
(000) | Value
(000) |
| Freddie Mac, Series K040, Class A2, multifamily 3.241% 20248 | $8,945 | $9,433 |
| Freddie Mac, Series 2015-DN1, Class M-1, 1.672% 20257,8 | 882 | 883 |
| Freddie Mac, Series 2015-HQ2, Class M-2, 2.372% 20257,8 | 3,600 | 3,475 |
| Freddie Mac, Series 3257, Class PA, 5.50% 20368 | 5,095 | 5,853 |
| Freddie Mac, Series 3286, Class JN, 5.50% 20378 | 4,194 | 4,704 |
| Freddie Mac, Series 3318, Class JT, 5.50% 20378 | 2,237 | 2,509 |
| Government National Mortgage Assn. 10.00% 20218 | 183 | 202 |
| Government National Mortgage Assn. 10.00% 20258 | 155 | 169 |
| Government National Mortgage Assn. 4.50% 20418 | 1,443 | 1,561 |
| Government National Mortgage Assn. 3.50% 20458 | 17,506 | 18,491 |
| Government National Mortgage Assn. 4.50% 20458 | 9,696 | 10,472 |
| Government National Mortgage Assn. 3.50% 20468,13 | 90,500 | 95,414 |
| Government National Mortgage Assn. 4.00% 20468,13 | 244,799 | 261,160 |
| Government National Mortgage Assn. 4.00% 20468,13 | 44,316 | 47,356 |
| Greenwich Capital Commercial Funding Corp., Series 2006-GG7, Class A-4, 7.568% 20387,8 | 2,629 | 2,638 |
| Greenwich Capital Commercial Funding Corp., Series 2007-GG9, Class A-4, 5.444% 20398 | 8,434 | 8,641 |
| Greenwich Capital Commercial Funding Corp., Series 2007-GG11, Class A-M, 5.867% 20497,8 | 7,879 | 8,172 |
| GS Mortgage Securities Corp. II, Series 2015-GS-1, Class AAB, 3.553% 20488 | 4,000 | 4,183 |
| GSR Mortgage Loan Trust, Series 2004-2F, Class VIIA-1, 4.50% 20198 | 491 | 490 |
| Hilton USA Trust, Series 2013-HLF, AFX, 2.662% 20304,8 | 6,555 | 6,562 |
| IndyMac INDX Mortgage Loan Trust, Series 2006-AR5, Class 2-A-1, 4.191% 20367,8 | 5,930 | 4,894 |
| J.P. Morgan Chase Commercial Mortgage Securities Corp., Series 2007-LD12, Class A-M, 6.009% 20517,8 | 20,950 | 22,030 |
| J.P. Morgan Chase Commercial Mortgage Securities Corp., Series 2006-LDP7, Class A-4, 6.106% 20457,8 | 9,024 | 9,049 |
| J.P. Morgan Chase Commercial Mortgage Securities Corp., Series 2011-C4, Class A-2, 3.341% 20464,8 | 2,747 | 2,749 |
| J.P. Morgan Chase Commercial Mortgage Securities Corp., Series 2011-C3A, Class A-2, 3.673% 20464,8 | 2,506 | 2,547 |
| J.P. Morgan Chase Commercial Mortgage Securities Corp., Series 2007-CB19, Class A-1-A, 5.883% 20497,8 | 13,570 | 14,162 |
| J.P. Morgan Chase Commercial Mortgage Securities Corp., Series 2007-CB19, Class A-4, 5.936% 20497,8 | 14,999 | 15,469 |
| J.P. Morgan Chase Commercial Mortgage Securities Corp., Series 2007-C1, Class A-4, 5.716% 20518 | 4,710 | 4,940 |
| J.P. Morgan Chase Commercial Mortgage Securities Trust, Series 2006-LDP9, Class A-M, 5.372% 20478 | 17,000 | 17,161 |
| JPMBB Commercial Mortgage Securities Trust, Series 2015-C-33, Class ASB, 3.5623% 20488 | 3,500 | 3,649 |
| L.A. Arena Funding, LLC, Series 1, Class A, 7.656% 20264,8 | 4,498 | 5,045 |
| LB-UBS Commercial Mortgage Trust, Series 2007-C2, Class A-1-A, 5.387% 20408 | 9,062 | 9,299 |
| LB-UBS Commercial Mortgage Trust, Series 2007-C2, Class A-3, 5.43% 20408 | 9,745 | 9,968 |
| LB-UBS Commercial Mortgage Trust, Series 2007-C2, Class A-M, 5.493% 20407,8 | 18,000 | 18,412 |
| LB-UBS Commercial Mortgage Trust, Series 2007-C6, Class A-M, 6.114% 20407,8 | 10,035 | 10,476 |
| Merrill Lynch Mortgage Trust, Series 2007-C1, Class A-4, 5.837% 20507,8 | 3,460 | 3,573 |
| ML-CFC Commercial Mortgage Trust, Series 2006-4, Class A-3, 5.172% 20498 | 22,324 | 22,689 |
| ML-CFC Commercial Mortgage Trust, Series 2007-8, Class A-3, 5.877% 20497,8 | 11,290 | 11,782 |
| Morgan Stanley Bank of America Merrill Lynch Trust, Series 2015-C-27, Class ASB, 3.557% 20478 | 4,215 | 4,398 |
| Morgan Stanley Capital I Trust, Series 2014-CPT, Class A, 3.35% 20294,8 | 8,745 | 9,065 |
| Morgan Stanley Capital I Trust, Series 2011-C3, Class A-2, 3.224% 20498 | 4,530 | 4,565 |
| National Australia Bank 1.25% 20184,8 | 5,000 | 4,981 |
| Structured Adjustable Rate Mortgage Loan Trust, Series 2006-4, Class 6-A, 4.328% 20367,8 | 3,732 | 2,938 |
| Wachovia Bank Commercial Mortgage Trust, Series 2007-C30, Class A-5, 5.342% 20438 | 8,000 | 8,185 |
| Wachovia Bank Commercial Mortgage Trust, Series 2007-C31, Class A-M, 5.591% 20477,8 | 19,050 | 19,682 |
| Wachovia Bank Commercial Mortgage Trust, Series 2007-C32, Class A-3, 5.713% 20497,8 | 8,500 | 8,725 |
| Wachovia Bank Commercial Mortgage Trust, Series 2007-C33, Class A-M, 5.952% 20517,8 | 8,500 | 8,867 |
| Wells Fargo Commercial Mortgage Trust, Series 2015-NXS-42, Class ASB, 3.522% 20488 | 3,590 | 3,732 |
| | | 1,909,583 |
| Asset-backed obligations 0.40% | | |
| Aesop Funding LLC, Series 2014-2A, Class A, 2.50% 20214,8 | 10,500 | 10,521 |
| Aesop Funding LLC, Series 2015-1, Class A, 2.50% 20214,8 | 10,000 | 10,157 |
| Aesop Funding LLC, Series 2015-2-A, Class A, 2.63% 20214,8 | 5,680 | 5,698 |
| American Express Credit Account Master Trust, Series 2014-4, Class A, 1.43% 20208 | 7,155 | 7,194 |
The Income Fund of America — Page 31 of 35
Bonds, notes & other debt instruments
Asset-backed obligations (continued) | Principal amount
(000) | Value
(000) |
| AmeriCredit Automobile Receivables Trust, Series 2015-2, Class C, 2.40% 20218 | $6,000 | $5,996 |
| AmeriCredit Automobile Receivables Trust, Series 2015-1, Class A-3, 1.26% 20198 | 6,130 | 6,113 |
| AmeriCredit Automobile Receivables Trust, Series 2014-4, Class A-3, 1.27% 20198 | 4,810 | 4,807 |
| Avant Loans Funding Trust, Series 2015-A, Class A, 4.00% 20211,4,8 | 2,829 | 2,801 |
| Bank of the West Auto Trust, Series 2014-1, Class A-3, 1.09% 20194,8 | 2,930 | 2,924 |
| Capital One Multi-asset Execution Trust, Series 2014-A5, Class A, 1.48% 20208 | 8,000 | 8,041 |
| CarMaxAuto Owner Trust, Series 2014-1, Class A-3, 0.79% 20188 | 4,937 | 4,929 |
| CarMaxAuto Owner Trust, Series 2014-4, Class A-3, 1.25% 20198 | 6,600 | 6,601 |
| Chesapeake Funding LLC, Series 2014-1-A, Class A, 0.689% 20264,7,8 | 3,686 | 3,683 |
| Citibank Credit Card Issuance Trust, Series 2008-A-2, Class A2, 1.57% 20207,8 | 14,000 | 14,217 |
| Conseco Finance Home Loan Trust, Series 1999-G, Class B-2, 10.96% 20298 | 13,630 | 1,150 |
| Countryplace Manufactured Housing Contract, Series 2005-1, Class A-3, AMBAC insured, 4.80% 20354,8 | 545 | 549 |
| Countryplace Manufactured Housing Contract, Series 2005-1, Class A-4, AMBAC insured, 5.20% 20354,7,8 | 1,145 | 1,185 |
| CWHEQ Revolving Home Equity Loan Trust, Series 2006-I, Class 2-A, FSA insured, 0.566% 20377,8 | 1,602 | 1,454 |
| CWHEQ Revolving Home Equity Loan Trust, Series 2007-B, Class A, FSA insured, 0.576% 20377,8 | 2,854 | 2,596 |
| Discover Card Execution Note Trust, Series 2014-A4, Class A4, 2.12% 20218 | 7,175 | 7,288 |
| Discover Card Execution Note Trust, Series 2015-A2, Class A, 1.90% 20228 | 10,000 | 10,069 |
| Drive Auto Receivables Trust, Series 2015-B-A, Class C, 2.76% 20214,8 | 7,970 | 7,953 |
| Drive Auto Receivables Trust, Series 2015-AA, Class C, 3.06% 20214,8 | 8,900 | 8,930 |
| Drive Auto Receivables Trust, Series 2015-DA, Class C, 3.38% 20214,8 | 7,225 | 7,243 |
| Drive Auto Receivables Trust, Series 2016-AA, Class C, 3.91% 20214,8 | 10,000 | 10,010 |
| Enterprise Fleet Financing LLC, Series 2014-1, Class A2, 0.87% 20194,8 | 1,325 | 1,323 |
| Fifth Third Auto Trust, Series 2014-3, Class A3, 0.96% 20198 | 4,000 | 3,993 |
| Ford Credit Auto Owner Trust, Series 2014-B-A3, 0.90% 20188 | 5,542 | 5,537 |
| Ford Credit Auto Owner Trust, Series 2014-1-A, 2.26% 20254,8 | 2,405 | 2,439 |
| Ford Credit Auto Owner Trust, Series 2015-1 Class A, 2.12% 20264,8 | 6,300 | 6,335 |
| Ford Credit Auto Owner Trust, Series 2014-2-A, 2.31% 20264,8 | 10,110 | 10,249 |
| Ford Credit Auto Owner Trust, Series 2015-2, Class A, 2.44% 20274,8 | 17,160 | 17,436 |
| Ford Credit Floorplan Master Owner Trust, Series 2015-2, Class A-1, 1.98% 20228 | 7,780 | 7,811 |
| Hertz Fleet Lease Funding LP, Series 2014-1-A, 0.693% 20284,7,8 | 1,942 | 1,943 |
| Hertz Vehicle Financing LLC, Rental Car Asset-backed Notes, Series 2013-1A, Class A-1, 1.12% 20174,8 | 8,500 | 8,493 |
| Hertz Vehicle Financing LLC, Rental Car Asset-backed Notes, Series 2013-1A, Class A-2, 1.83% 20194,8 | 8,500 | 8,452 |
| Hertz Vehicle Financing LLC, Rental Car Asset-backed Notes, Series 2015-3A, Class A, 2.67% 20214,8 | 6,290 | 6,343 |
| Hertz Vehicle Financing LLC, Rental Car Asset-backed Notes, Series 2015-1, Class A, 2.73% 20214,8 | 7,518 | 7,602 |
| Hertz Vehicle Financing LLC, Rental Car Asset-backed Notes, Series 2015-1, Class A, 3.52% 20214,8 | 2,210 | 2,194 |
| Home Equity Mortgage Trust, Series 2006-6, Class 2A-1, 0.397% 20377,8 | 13,099 | 1,500 |
| Honda Auto Receivables Owner Trust, Series 2015-1, Class A-2, 0.70% 20178 | 3,090 | 3,088 |
| Honda Auto Receivables Owner Trust, Series 2014-3, Class A-3, 0.88% 20188 | 7,560 | 7,555 |
| Honda Auto Receivables Owner Trust, Series 2014-4, Class A-3, 0.99% 20188 | 6,120 | 6,116 |
IndyMac Home Equity Mortgage Loan Asset-backed Trust, Series 2007-H1, Class A-1,
FSA insured, 0.587% 20377,8 | 1,649 | 1,465 |
| Mercedes-Benz Auto Receivables Trust, Series 2014-1, Class A3, 0.87% 20188 | 7,000 | 6,991 |
| RAMP Trust, Series 2003-RZ4, Class A-7, 4.79% 20337,8 | 195 | 202 |
| Santander Drive Auto Receivables Trust, Series 2014-3, Class A3, 0.81% 20188 | 4,186 | 4,184 |
| Santander Drive Auto Receivables Trust, Series 2014-4, Class A3, 1.08% 20188 | 6,685 | 6,685 |
| Santander Drive Auto Receivables Trust, Series 2013-3, Class B, 1.19% 20188 | 2,883 | 2,883 |
| Santander Drive Auto Receivables Trust, Series 2012-6, Class C, 1.94% 20188 | 6,538 | 6,548 |
| Santander Drive Auto Receivables Trust, Series 2014-5, Class A-3, 1.15% 20198 | 2,300 | 2,297 |
| Santander Drive Auto Receivables Trust, Series 2014-4, Class B, 1.82% 20198 | 6,000 | 6,021 |
| Santander Drive Auto Receivables Trust, Series 2014-2, Class C, 2.33% 20198 | 5,000 | 5,031 |
| Santander Drive Auto Receivables Trust, Series 2015-2, Class C, 2.44% 20218 | 16,550 | 16,542 |
| Santander Drive Auto Receivables Trust, Series 2015-1, Class C, 2.57% 20218 | 5,340 | 5,365 |
| Santander Drive Auto Receivables Trust, Series 2015-5, Class C, 2.74% 20218 | 6,915 | 6,937 |
| Social Professional Loan Program LLC, Series 2015-D, Class A-2, 2.72% 20364,8 | 9,069 | 9,124 |
| Toyota Auto Receivables Owner Trust, Series 2014-B, Class A3, 0.76% 20188 | 11,750 | 11,744 |
The Income Fund of America — Page 32 of 35
Bonds, notes & other debt instruments
Asset-backed obligations (continued) | Principal amount
(000) | Value
(000) |
| Volkswagen Auto Loan Enhanced Trust, Series 2014-2, Class A-3 0.95% 20198 | $9,000 | $8,902 |
| World Omni Auto Receivables Trust, Series 2014-B, Class A-3, 1.14% 20208 | 4,625 | 4,621 |
| | | 366,060 |
| Federal agency bonds & notes 0.10% | | |
| CoBank, ACB 7.875% 20184 | 10,000 | 11,245 |
| CoBank, ACB 1.112% 20224,7 | 3,700 | 3,469 |
| Fannie Mae 6.25% 2029 | 32,000 | 45,123 |
| Fannie Mae 7.125% 2030 | 1,500 | 2,276 |
| Federal Home Loan Bank 5.50% 2036 | 100 | 136 |
| Freddie Mac 2.50% 2016 | 22,500 | 22,642 |
| Private Export Funding Corp. 3.55% 2024 | 1,660 | 1,830 |
| Tennessee Valley Authority, Series B, 3.50% 2042 | 500 | 487 |
| Tennessee Valley Authority, Series 2008, Class A, 4.875% 2048 | 700 | 814 |
| United States Agency for International Development, Jordan (Kingdom of) 3.00% 2025 | 1,000 | 1,047 |
| | | 89,069 |
| Bonds & notes of governments & government agencies outside the U.S. 0.09% | | |
| Croatian Government 6.75% 2019 | 3,200 | 3,494 |
| Croatian Government 6.375% 2021 | 5,000 | 5,429 |
| Hungarian Government 6.25% 2020 | 3,410 | 3,800 |
| Polish Government 6.375% 2019 | 6,060 | 6,862 |
| Polish Government 5.00% 2022 | 3,000 | 3,319 |
| Slovenia (Republic of) 5.50% 2022 | 9,000 | 10,152 |
| Spanish Government 4.00% 20184 | 31,765 | 33,321 |
| United Mexican States Government Global 3.60% 2025 | 6,000 | 5,843 |
| United Mexican States Government Global 4.125% 2026 | 6,900 | 6,924 |
| United Mexican States Government Global 5.55% 2045 | 3,500 | 3,547 |
| | | 82,691 |
| Municipals 0.05% | | |
| State of California, Various Purpose G.O. Bonds, 6.20% 2019 | 24,675 | 28,088 |
| State of New Jersey, Econ. Dev. Auth., School Facs. Contruction Rev. Ref. Bonds, Series 2015-YY, 4.447% 2020 | 6,000 | 6,109 |
State of New Jersey, Transportation Trust Fund Auth., Transportation System Rev. Ref. Bonds,
Series 2013-B, 1.758% 2018 | 8,500 | 8,472 |
State of Washington, Energy Northwest, Columbia Generating Station Electric Rev. Bonds,
Series 2012-E, 2.197% 2019 | 6,500 | 6,612 |
| | | 49,281 |
| Total bonds, notes & other debt instruments (cost: $21,740,717,000) | | 20,915,773 |
| Short-term securities 5.55% | | |
| Apple Inc. 0.44% due 3/21/20164 | 55,100 | 55,069 |
| CAFCO, LLC 0.40% due 2/26/2016 | 50,000 | 49,985 |
| Ciesco LLC 0.32%–0.50% due 2/22/2016–5/2/2016 | 100,000 | 99,909 |
| Coca-Cola Co. 0.47% due 5/18/20164 | 50,000 | 49,921 |
| Emerson Electric Co. 0.42%–0.51% due 3/24/2016–4/18/20164 | 89,100 | 89,021 |
| ExxonMobil Corp. 0.33% due 2/3/2016 | 46,700 | 46,698 |
| Fannie Mae 0.20%–0.37% due 2/1/2016–5/11/2016 | 305,500 | 305,363 |
| Federal Farm Credit Banks 0.22%–0.30% due 2/11/2016–5/17/2016 | 63,100 | 63,039 |
| Federal Home Loan Bank 0.15%–0.63% due 2/1/2016–1/26/2017 | 2,902,609 | 2,900,585 |
| Freddie Mac 0.15%–0.50% due 2/3/2016–6/16/2016 | 706,500 | 706,224 |
| Honeywell International Inc. 0.42% due 3/14/20164 | 15,100 | 15,092 |
| Kimberly-Clark Corp. 0.37% due 2/16/20164 | 22,500 | 22,496 |
The Income Fund of America — Page 33 of 35
| Short-term securities | Principal amount
(000) | Value
(000) |
| Paccar Financial Corp. 0.38% due 2/24/2016 | $30,000 | $29,992 |
| U.S. Treasury Bills 0.21%–0.55% due 2/18/2016–6/16/2016 | 348,500 | 348,380 |
| Wal-Mart Stores, Inc. 0.45% due 4/28/20164 | 95,000 | 94,890 |
| Walt Disney Co. 0.48% due 4/22/2016–5/9/20164 | 111,000 | 110,863 |
| Wells Fargo Bank, N.A. 0.47%–0.61% due 5/3/2016–5/23/2016 | 100,000 | 99,964 |
| Total short-term securities (cost: $5,087,813,000) | | 5,087,491 |
| Total investment securities 100.37% (cost: $82,869,449,000) | | 91,917,292 |
| Other assets less liabilities (0.37)% | | (338,386) |
| Net assets 100.00% | | $91,578,906 |
As permitted by U.S. Securities and Exchange Commission regulations, “Miscellaneous” securities include holdings in their first year of acquisition that have not previously been publicly disclosed.
Forward currency contracts
The fund has entered into forward currency contracts as shown in the following table. The average month-end notional amount of open forward currency contracts while held was $406,803,000.
| | Settlement
date | Counterparty | Contract amount | Unrealized
(depreciation)
appreciation
at 1/31/2016
(000) |
Receive
(000) | Deliver
(000) |
| Sales: | | | | | |
| Australian dollars | 2/29/2016 | JPMorgan Chase | $97,101 | A$142,200 | $(3,396) |
| Australian dollars | 3/3/2016 | HSBC Bank | $125,080 | A$182,300 | (3,739) |
| British pounds | 3/2/2016 | Barclays Bank PLC | $32,356 | £22,800 | (133) |
| British pounds | 3/3/2016 | Bank of America, N.A. | $68,041 | £48,000 | (357) |
| Euros | 2/23/2016 | Citibank | $22,168 | €20,346 | 115 |
| Euros | 3/3/2016 | Bank of America, N.A. | $3,824 | €3,500 | 29 |
| Euros | 3/22/2016 | UBS AG | $107,903 | €98,600 | 937 |
| Japanese yen | 3/1/2016 | Bank of New York Mellon | $12,218 | ¥1,447,100 | 258 |
| | | | | | $(6,286) |
| 1 | Valued under fair value procedures adopted by authority of the board of trustees. The total value of all such securities, including those in “Miscellaneous,“ was $13,707,622,000, which represented 14.97% of the net assets of the fund. This amount includes $13,573,579,000 related to certain securities trading outside the U.S. whose values were adjusted as a result of significant market movements following the close of local trading. |
| 2 | Represents an affiliated company as defined under the Investment Company Act of 1940. |
| 3 | Security did not produce income during the last 12 months. |
| 4 | Acquired in a transaction exempt from registration under Rule 144A or Section 4(2) of the Securities Act of 1933. May be resold in the U.S. in transactions exempt from registration, normally to qualified institutional buyers. The total value of all such securities was $5,308,141,000, which represented 5.80% of the net assets of the fund. |
| 5 | Acquired through a private placement transaction exempt from registration under the Securities Act of 1933. May be subject to legal or contractual restrictions on resale. Further details on these holdings appear below. |
| 6 | Payment in kind; the issuer has the option of paying additional securities in lieu of cash. |
| 7 | Coupon rate may change periodically. |
| 8 | Principal payments may be made periodically. Therefore, the effective maturity date may be earlier than the stated maturity date. |
| 9 | Loan participations and assignments; may be subject to legal or contractual restrictions on resale. The total value of all such loans was $406,320,000, which represented .44% of the net assets of the fund. |
| 10 | Scheduled interest and/or principal payment was not received. |
| 11 | A portion of this security was pledged as collateral. The total value of pledged collateral was $6,917,000, which represented .01% of the net assets of the fund. |
| 12 | Index-linked bond whose principal amount moves with a government price index. |
| 13 | Purchased on a TBA basis. |
The Income Fund of America — Page 34 of 35
| Private placement securities | Acquisition
date | Cost
(000) | Value
(000) | Percent
of net
assets |
| CEVA Group PLC, Series A-1, 3.622% convertible preferred | 5/2/2013 | $29,938 | $18,411 | .02% |
| CEVA Group PLC, Series A-2, 2.622% convertible preferred | 5/2/2013 | 13,172 | 6,135 | .01 |
| Total private placement securities | | $ 43,110 | $ 24,546 | .03% |
| Key to abbreviations and symbols | |
| ADR = American Depositary Receipts | Auth. = Authority |
| FDR = Fiduciary Depositary Receipts | Dev. = Development |
| TBA = To-be-announced | Econ. = Economic |
| A$ = Australian dollars | Facs. = Facilities |
| CAD = Canadian dollars | G.O. = General Obligation |
| € = Euros | LOC = Letter of Credit |
| £ = British pounds | Ref. = Refunding |
| HKD = Hong Kong dollars | Rev. = Revenue |
| ¥ = Japanese yen | |
Investments are not FDIC-insured, nor are they deposits of or guaranteed by a bank or any other entity, so they may lose value.
Investors should carefully consider investment objectives, risks, charges and expenses. This and other important information is contained in the fund prospectus and summary prospectus, which can be obtained from your financial professional and should be read carefully before investing. You may also call American Funds Service Company (AFS) at (800) 421-4225 or visit the American Funds website at americanfunds.com.
| MFGEFPX-006-0316O-S49195 | The Income Fund of America — Page 35 of 35 |
ITEM 7 – Disclosure of Proxy Voting Policies and Procedures for Closed-End Management Investment Companies
Not applicable to this Registrant, insofar as the Registrant is not a closed-end management investment company.
ITEM 8 – Portfolio Managers of Closed-End Management Investment Companies
Not applicable to this Registrant, insofar as the Registrant is not a closed-end management investment company.
ITEM 9 – Purchases of Equity Securities by Closed-End Management Investment Company and Affiliated Purchasers
Not applicable to this Registrant, insofar as the Registrant is not a closed-end management investment company.
ITEM 10 – Submission of Matters to a Vote of Security Holders
There have been no material changes to the procedures by which shareholders may recommend nominees to the Registrant’s board of trustees since the Registrant last submitted a proxy statement to its shareholders. The procedures are as follows. The Registrant has a nominating and governance committee comprised solely of persons who are not considered ‘‘interested persons’’ of the Registrant within the meaning of the Investment Company Act of 1940, as amended. The committee periodically reviews such issues as the board’s composition, responsibilities, committees, compensation and other relevant issues, and recommends any appropriate changes to the full board of trustees. While the committee normally is able to identify from its own resources an ample number of qualified candidates, it will consider shareholder suggestions of persons to be considered as nominees to fill future vacancies on the board. Such suggestions must be sent in writing to the nominating and governance committee of the Registrant, c/o the Registrant’s Secretary, and must be accompanied by complete biographical and occupational data on the prospective nominee, along with a written consent of the prospective nominee for consideration of his or her name by the nominating and governance committee.
ITEM 11 – Controls and Procedures
| (a) | The Registrant’s Principal Executive Officer and Principal Financial Officer have concluded, based on their evaluation of the Registrant’s disclosure controls and procedures (as such term is defined in Rule 30a-3 under the Investment Company Act of 1940), that such controls and procedures are adequate and reasonably designed to achieve the purposes described in paragraph (c) of such rule. |
| | |
| (b) | There were no changes in the Registrant’s internal controls over financial reporting (as defined in Rule 30a-3(d) under the Investment Company Act of 1940) that occurred during the Registrant’s second fiscal quarter of the period covered by this report that has materially affected, or is reasonably likely to materially affect, the Registrant’s internal control over financial reporting. |
ITEM 12 – Exhibits
| (a)(1) | Not applicable for filing of semi-annual reports to shareholders. |
| | |
| (a)(2) | The certifications required by Rule 30a-2 of the Investment Company Act of 1940 and Sections 302 and 906 of the Sarbanes-Oxley Act of 2002 are attached as exhibits hereto. |
SIGNATURES
Pursuant to the requirements of the Securities Exchange Act of 1934 and the Investment Company Act of 1940, the Registrant has duly caused this report to be signed on its behalf by the undersigned, thereunto duly authorized.
| | THE INCOME FUND OF AMERICA |
| | |
| | By /s/ Hilda L. Applbaum |
| | Hilda L. Applbaum, Vice Chairman and Principal Executive Officer |
| | |
| | Date: March 31, 2016 |
Pursuant to the requirements of the Securities Exchange Act of 1934 and the Investment Company Act of 1940, this report has been signed below by the following persons on behalf of the Registrant and in the capacities and on the dates indicated.
| By /s/ Hilda L. Applbaum |
Hilda L. Applbaum, Vice Chairman and Principal Executive Officer |
| |
| Date: March 31, 2016 |
| By /s/ Kimberley H. Monasterio |
Kimberley H. Monasterio, Treasurer and Principal Financial Officer |
| |
| Date: March 31, 2016 |