UNITED STATES
SECURITIES AND EXCHANGE COMMISSION
Washington, D.C. 20549
FORM N-CSR
Certified Shareholder Report of
Registered Management Investment Companies
Investment Company Act File Number: 811-01880
The Income Fund of America
(Exact Name of Registrant as Specified in Charter)
One Market, Steuart Tower
Suite 2000
San Francisco, California 94105
(Address of Principal Executive Offices)
Registrant's telephone number, including area code: (415) 421-9360
Date of fiscal year end: July 31
Date of reporting period: July 31, 2013
Patrick F. Quan
The Income Fund of America
One Market, Steuart Tower
Suite 2000
San Francisco, California 94105
(Name and Address of Agent for Service)
Copies to:
Michael Glazer
Bingham McCutchen LLP
355 South Grand Avenue, Suite 4400
Los Angeles, California 90071
(Counsel for the Registrant)
ITEM 1 – Reports to Stockholders
![]()
Investment insights
gained through an
income focus
 | The Income Fund of America® Annual Report for the year ended July 31, 2013 |
The Income Fund of America seeks current income while secondarily striving for capital growth through investments in stocks and fixed-income securities.
This fund is one of more than 40 offered by one of the nation’s largest mutual fund families, American Funds, from Capital Group. For more than 80 years, Capital has invested with a long-term focus based on thorough research and attention to risk.
Fund results shown in this report, unless otherwise indicated, are for Class A shares at net asset value. If a sales charge (maximum 5.75%) had been deducted, the results would have been lower. Results are for past periods and are not predictive of results for future periods. Current and future results may be lower or higher than those shown. Share prices and returns will vary, so investors may lose money. Investing for short periods makes losses more likely. Investments are not FDIC-insured, nor are they deposits of or guaranteed by a bank or any other entity, so they may lose value. For current information and month-end results, visit americanfunds.com.
Here are the average annual total returns on a $1,000 investment with all distributions reinvested for periods ended June 30, 2013 (the most recent calendar quarter-end):
| Class A shares | 1 year | 5 years | 10 years | |||||||
| Reflecting 5.75% maximum sales charge | 7.25% | 5.46% | 7.00% |
For other share class results, visit americanfunds.com and americanfundsretirement.com.
The total annual fund operating expense ratio is 0.58% for Class A shares as of the prospectus dated October 1, 2013 (unaudited).
Investment results assume all distributions are reinvested and reflect applicable fees and expenses. When applicable, investment results reflect fee waivers, without which results would have been lower. Visit americanfunds.com for more information.
The fund’s 30-day yield for Class A shares as of August 31, 2013, calculated in accordance with the U.S. Securities and Exchange Commission (SEC) formula, was 2.89%. The fund’s 12-month distribution rate for Class A shares as of that date was 3.34%. Both reflect the 5.75% maximum sales charge. The SEC yield reflects the rate at which the fund is earning income on its current portfolio of securities while the distribution rate reflects the fund’s past dividends paid to shareholders. Accordingly, the fund’s SEC yield and distribution rate may differ.
The return of principal for bond funds and for funds with significant underlying bond holdings is not guaranteed. Fund shares are subject to the same interest rate, inflation and credit risks associated with the underlying bond holdings. High-yield bonds are subject to greater fluctuations in value and risk of loss of income and principal than investment-grade bonds. Bond ratings, which typically range from Aaa/AAA (highest) to D (lowest), are assigned by credit rating agencies such as Moody’s, Standard & Poor’s and/or Fitch as an indication of an issuer’s creditworthiness. Investing outside the United States may be subject to additional risks, such as currency fluctuations, periods of illiquidity and price volatility. These risks may be heightened in connection with investments in developing countries. Refer to the fund prospectus and the Risk Factors section of this report for more information on these and other risks associated with investing in the fund.

The Income Fund of
America faced some
significant headwinds on
its way to producing solid
results for the period.
For the 12 months ended July 31, 2013, The Income Fund of America (IFA) gained 15.3% for those who reinvested quarterly dividends totaling 68 cents per share that were paid during the period. The fund’s return trailed the broader equity market, as measured by the unmanaged Standard & Poor’s 500 Composite Index, which rose 25.0%. The fund significantly outpaced the –1.9% return of the bond market, as represented by the unmanaged Barclays U.S. Aggregate Index. IFA also registered a considerably higher gain than its Lipper income fund peer group, which rose 8.8%.
As you can see in the table below, the fund has fared well against its benchmarks for the 10-year and lifetime periods and bested all but the S&P 500 for the five-year time frame.
Strength bookends the fiscal year
Market strength characterized the beginning and end of the fund’s fiscal year
Results at a glance
For periods ended July 31, 2013, with all distributions reinvested
| Cumulative total returns | Average annual total returns | |||||||||||||||
| 1 year | 5 years | 10 years | Lifetime1 | |||||||||||||
| The Income Fund of America (Class A shares) | 15.3 | % | 7.6 | % | 8.0 | % | 11.4 | % | ||||||||
| Standard & Poor’s 500 Composite Index2 | 25.0 | 8.3 | 7.6 | 10.8 | ||||||||||||
| Lipper Income Funds Index | 8.8 | 5.8 | 5.8 | — | 3 | |||||||||||
| Barclays U.S. Aggregate Index2 | –1.9 | 5.2 | 4.9 | 7.9 | 4 | |||||||||||
| Consumer Price Index (inflation)5 | 2.0 | 1.2 | 2.4 | 4.2 | ||||||||||||
| 1 | Since December 1, 1973, when Capital Research and Management Company became the fund’s investment adviser. |
| 2 | The indexes are unmanaged and, therefore, have no expenses. |
| 3 | The inception date for the index was December 31, 1988. |
| 4 | From December 1, 1973, through December 31, 1975, the Barclays U.S. Government/Credit Index was used because the Barclays U.S. Aggregate Index did not yet exist. |
| 5 | Computed from data supplied by the U.S. Department of Labor, Bureau of Labor Statistics. |
| The Income Fund of America | 1 |
as signs of continuing recovery in the U.S., robust corporate earnings and favorable moves by central bankers in the U.S. and Europe buoyed markets. These positive developments trumped concerns over the U.S. fiscal-cliff situation and worries over decelerating Chinese demand that unsettled investors during the final quarter of calendar 2012.
Japan turned in excellent results as investors responded favorably to aggressive quantitative easing plans announced by the country’s central bank. In Europe, interest rate cuts and signs of softening in the region’s austerity measures helped markets fare relatively well given the challenging environment.
The bond market was rattled in May and June when the U.S. Federal Reserve signaled that it might soon begin winding down its asset-purchase program in an effort to gradually normalize interest rates.
Faring well despite headwinds
IFA faced some significant headwinds on its way to posting solid results for the period. For one, companies in the higher yielding sectors of the stock market such as utilities, telecommunication services and, to a lesser extent, consumer staples, turned in lower results than the broader market. Because of IFA’s income focus, our holdings in these sectors are typically sizable, and this weighed on results. Moreover, as a group, financial companies turned in the best results of any sector, but low yields precluded IFA from investing in many of the companies that had the best returns.
Almost all markets outside the U.S. trailed their American counterparts and, as a group, IFA’s investments in companies domiciled abroad held back returns. Returns for non-U.S. investments were further eroded by currency translation as the U.S. dollar strengthened relative to most major currencies.
Despite all these challenges, IFA was well supported by a number of its larger equity holdings. These included Home Depot (51.5%), Lockheed Martin (34.6%), HSBC Holdings (27.3%), Procter & Gamble (24.4%), Waste Management (22.2%), Pfizer (21.6%) and Bristol-Myers Squibb (21.5%). Indeed, stocks of over 50 of the companies the fund held for the full period outpaced the broader market as measured by the S&P 500.
All but one of the fund’s 20 largest holdings turned in positive results, but some of those investments nonetheless held back returns. Among them were Royal Dutch Shell (0.3%), energy company Kinder Morgan (5.5%), Microsoft (8.0%) and Merck (9.1%).
High yield better than high quality
As in recent years, high-yield bonds, which play an essential role in providing income for the fund, were the strongest area of IFA’s fixed-income portfolio. This is not surprising as an improving economy often bolsters high-yield bond prices because the ability of the issuers to service their debts is thought to improve.
Higher quality bonds, on the other hand, did not fare well; low rates limited their
Striking a balance between return and volatility
The Income Fund of America takes a prudent path to income. Looking back 10 years, as shown at right, the fund has provided higher returns than stocks, bonds and the average income fund and lower volatility than stocks. In addition, as can be seen on page 1, the fund’s lifetime results surpass those of both the stock and bond indexes.
For the 10-year period ended July 31, 2013
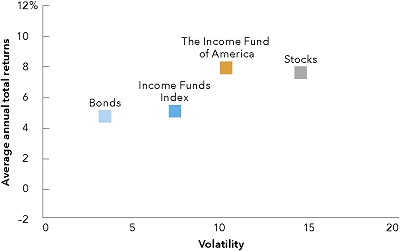
Sources: Stocks — S&P 500; Bonds — Barclays U.S. Aggregate Index; Income Funds Index — Lipper. Returns include reinvestment of all distributions. Volatility is calculated at net asset value by Lipper using annualized standard deviation (based on monthly returns), a measure of how returns over time have varied from the mean; a lower number signifies lower volatility.
| 2 | The Income Fund of America |
appeal and fears over rising rates also weighed them down. Despite the difficult environment, high-quality fixed-income securities retain an important role in the fund — providing income and helping mitigate volatility.
A portfolio changes with the landscape
In evaluating the risk/reward properties of securities with the potential to contribute to IFA’s objectives, we found that attractive income and total-return opportunities were more plentiful among dividend-paying stocks than among bonds.
Consequently, during the 12 months we added significantly to our stock holdings in the energy, utilities and pharmaceuticals areas.
At the same time, we reduced our fixed-income investments; bond holdings currently stand at 21.9% of fund assets, down from 26.7% at the end of fiscal 2012.
Rising stock prices led to a decline in dividend yields for a number of IFA’s investments. Because income is our primary objective, we selectively reduced or eliminated some of these holdings in favor of opportunities that we believe offer more attractive income and total-return potential.
The flexibility to capitalize
The fund’s opportunity set is a shifting one. Whereas much of our recent investment has been in companies domiciled in the U.S., economic improvement in Europe could mean that companies located there will become of greater interest to us.
In addition, continued stabilization and strength in the U.S. economy could result in interest rates gradually rising, resulting in more opportunity down the road within the bond market.
Whatever the economic and investing landscape, we’ll continue to pursue a company-by-company and issuer-by-issuer approach to building the fund’s portfolio. Over the long term, this has enabled us to deliver on IFA’s income and capital appreciation objectives.
We thank you for your continuing commitment to long-term investing.
Cordially,

Hilda L. Applbaum
Vice Chairman and Principal Executive Officer

David C. Barclay
President
September 9, 2013
For current information about the fund, visit americanfunds.com.
A lifetime of high current income
The Income Fund of America’s 12-month dividend yield vs. benchmarks
Year ended July 31
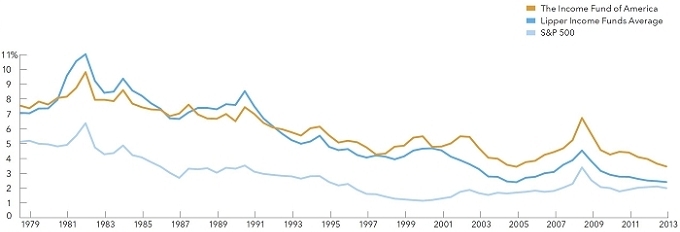
All numbers calculated by Lipper.
| The Income Fund of America | 3 |
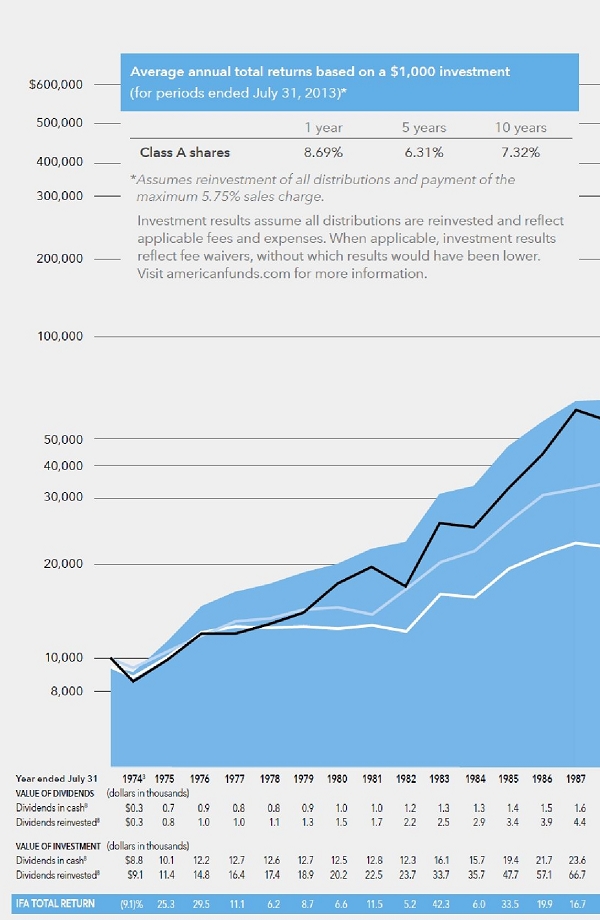
The value of a long-term perspective
Fund results shown are for Class A shares and reflect deduction of the maximum sales charge of 5.75% on the $10,000 investment.1 Thus, the net amount invested was $9,425.2 Results are for past periods and are not predictive of results for future periods. Current and future results may be lower or higher than those shown. Share prices and returns will vary, so investors may lose money. For current information and month-end results, visit americanfunds.com.
The results shown are before taxes on fund distributions and sale of fund shares.
| 1 | As outlined in the prospectus, the sales charge is reduced for accounts (and aggregated investments) of $25,000 or more and is eliminated for purchases of $1 million or more. There is no sales charge on dividends or capital gain distributions that are reinvested in additional shares. |
| 2 | The maximum initial sales charge was 8.5% prior to July 1, 1988. |
| 3 | For the period December 1, 1973 (when Capital Research and Management Company became the fund’s investment adviser), through July 31, 1974. |
| 4 | Includes reinvested dividends of $378,471 and reinvested capital gain distributions of $131,223. |
| 5 | The indexes are unmanaged and, therefore, have no expenses. |
| 6 | From December 1, 1973, through December 31, 1975, the Barclays U.S. Government/Credit Index was used because the Barclays U.S. Aggregate Index did not yet exist. |
| 7 | Includes capital gain distributions of $24,067, but does not reflect income dividends of $67,940 taken in cash. |
| 8 | From April 1990 to September 1994, and from September 2003 to March 2009, the fund accrued dividends daily but paid quarterly. Dividends reflect quarterly dividends actually paid during the period, while year-end values are adjusted for cumulative dividends accrued but not yet paid. |
| 4 | The Income Fund of America |
How a $10,000 investment has grown
There have always been reasons not to invest. If you look beyond the negative headlines, however, you will find that despite occasional stumbles, financial markets have tended to reward investors over the long term. Active management — bolstered by experience and careful research — can add even more value. As the chart below shows, over its lifetime, The Income Fund of America (IFA) has delivered higher returns than both the broader stock and bond markets. Dividends, particularly when reinvested, have accounted for a large portion of the fund’s overall results.

| The Income Fund of America | 5 |

gained through an income focus
Once upon a time, dividend-paying companies fit a fairly familiar profile and were generally drawn from a handful of industries. Increasingly however, companies with attractive payouts can be found more broadly in the equity market. A crucial part of our job is to find out what’s behind the dividend, and in seeking to answer that question we learn a great deal.
Hilda Applbaum
When considering investments for The Income Fund of America’s (IFA’s) portfolio, the fund’s analysts focus on companies in their coverage area that could contribute to the fund’s income objective. For equity analysts, this means firms whose stocks feature high dividend yields. Yet dividend yield is just a starting point. True insight into a company’s current and potential value comes from looking behind the dividend. Why is it high? Is it sustainable? Can it grow? In pursuing answers to these questions, analysts gain a greater understanding of companies, sectors and the economy as a whole.
In the following pages, we’ll take a closer look at how the careful examination of yield necessitated by IFA’s income focus helps uncover crucial investing insights.
Yield frames opportunity
The regular quarterly dividends IFA pays its investors come primarily from two sources: interest payments from the fund’s bond holdings and dividends paid by its stock investments.
“As a fund that seeks to provide a high level of income, when it comes to stocks IFA naturally gravitates toward companies that offer healthy and sustainable payouts,” explains fund vice chairman and principal executive officer, Hilda Applbaum. “Once upon a time, dividend-paying companies fit a fairly familiar profile and were generally drawn from a handful of industries. Increasingly however, companies with attractive payouts can be found more broadly in the equity market. The high yields may be a function of any number of factors. A crucial part of our job is to find out what’s behind the dividend, and in seeking to answer that question we learn a great deal.”
Historical sector differences
Often, a company’s high dividend is a function of the type of business it’s in, as certain sectors have historically offered higher yields than others. To a large extent, yield is correlated to an industry’s ability to generate free cash throughout market cycles; utilities, telecommunications companies and consumer staples firms fit this description and have been high dividend payers. Consequently, they’ve historically played an important part in IFA’s portfolio.
However, the fund doesn’t just indiscriminately buy stocks from high-
| The Income Fund of America | 7 |
I try to think as a retiree would. If I can get a healthy yield from an established company with a strong balance sheet, then that is a good start. If I can find one with a growing dividend and prospects for a few percentage points of annual earnings growth, then I have found the Sorcerer’s Stone.
Peter Eliot
yielding sectors. Instead, analysts seek companies they believe have the long-term wherewithal to pay and potentially grow their quarterly dividend, as well as offer capital appreciation. Identifying such companies is an intensive process that centers on gaining a deep understanding of the company’s business. A firm’s management, product mix, the sources of its cash flow and the intricacies of its balance sheet all factor into analysts’ evaluation of the company and, by extension, its dividend. These factors also shape their views on the company’s growth prospects and its potential for share-price appreciation, another of the fund’s goals.
In explaining his approach to identifying investments for the fund, chemicals analyst Peter Eliot offers: “I try to think as a retiree would. If I can get a healthy yield from an established company with a strong balance sheet, then that is a good start. If I can find one with a growing dividend and prospects for a few percentage points of annual earnings growth, then I have found the Sorcerer’s Stone.”
Standing out from the crowd
That same intensive research is crucial when considering another category of investment opportunity: companies with yields meaningfully higher than their peers. That’s because high relative yield often results from a decrease in stock price, perhaps indicating that a company has fallen out of favor with investors. The prevailing view is often well founded, but The Income Fund of America has a long history of using research and a long-term investment time horizon to cut against the grain and capitalize on companies others have shunned.
In these cases, the sustainability of the dividend is of particular import because the quarterly payout provides the lion’s share of return as the company works to right itself or awaits a change in investor sentiment.
A beacon amid crisis
Sometimes it’s not imperiled companies that attract IFA’s attention, but entire industries or even the market as a whole. This was the case in 2008, when the financial crisis led many investors to abandon the equity markets. The wholesale selloff that ensued took down good and bad companies alike, which created widespread opportunity for income-focused investors.
At the time, all stocks seemed heavily cloaked in risk, but the fund’s income mandate provided a clear rationale and framework for evaluating opportunities others were forsaking.
Retail analyst Anne-Marie Peterson explains: “Leading up to the 2008 financial crisis, I covered companies featuring yields that would have made them eligible for IFA. But they were either businesses that I didn’t believe in or companies I liked but whose valuations were higher than I was willing to pay. However, when the market collapsed in the wake of the crisis, one of the retailers I admired saw its share price plummet along with the rest of the market. I sharpened my pencil, revisited my research and became convinced that the company would be able to maintain its dividend and that when normalcy was restored its stock price would increase. The dividend gave us a compelling reason to invest during a period of crisis, and it turned out to be a good investment.”
Cyclical opportunity
The search for income also leads us to opportunities among so-called cyclical companies. These are firms in industries such as energy, commodities and industrials, whose business prospects — and stock prices — typically rise and fall with the economic cycle. It’s not uncommon for cyclical companies to feature modest yields when the economy is riding high, but more attractive yields during economic downturns, when stock prices have fallen. Given this pattern, IFA is often investing in such companies nearer the bottom of the economic cycle. Once again, yield is the beacon, and evaluating the sustainability of the dividend helps analysts determine whether stock price
| 8 | The Income Fund of America |
![]()
Shifting sector yields
Economic and market cycles as well as industry trends have led to changing dividend yields for the 10 sectors of the S&P 500.
Yet thanks in part to renewed recognition of the importance of tangible return, nine of the 10 sectors have higher yields than they did a decade ago.
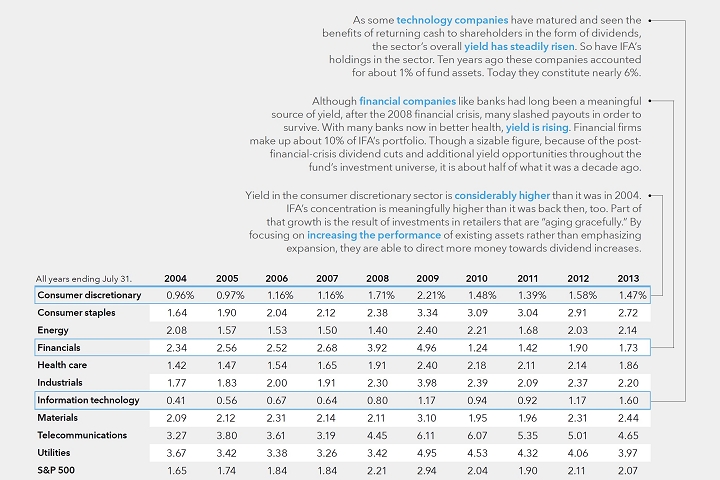
Source: FactSet
| The Income Fund of America | 9 |

weakness is attributable to cyclical factors rather than fundamental problems at a particular company.
Real estate investment trusts, or “REITs,” are another area offering cyclical opportunity with significant income. “During a real estate downturn, depressed asset values can lead to investment bargains with elevated yields among the REITs. And because REITs must pay out at least 90% of their taxable earnings in the form of dividends, the yield is usually a particularly clear representation of a company’s health and profitability,” explains REIT analyst Rich Wolf. “Thus, high dividend yields can offer an enticement to invest in REITs during a low point in the commercial real-estate cycle, when REITs themselves trade at a discount to what all of their buildings would sell for on the open market. Once again, in deciding whether to invest, we focus on the underlying assets and health of the company. We want to find solid, well-priced companies whose growth potential may be underappreciated.”
Harbingers of revival
While many of IFA’s investments are in companies whose yields have risen due to falling stock prices, in some cases rising yields actually signal an industry’s return to health. The U.S. banking sector offers a case in point.
“During the financial crisis, dividends for many banks were slashed as most of the earnings went toward offsetting loan losses or rebuilding capital reserves,” says bank analyst Julian Abdey. “The fact that many have begun giving back some of their earnings to shareholders is a sign of their health and that of the overall industry. That’s because dividend decisions at banks are dependent on their regulators and the outcome of tests aimed at determining the banks’ health. More broadly, the restoration of dividends can be seen as a key indication that the financial crisis has passed.”
Interestingly, Julian notes that prior to the financial crisis, the high dividend yields of banks weren’t an indication of health, but of excess profitability and risk taking, all with relatively low levels of capital. Neither the earnings, nor the dividends, were sustainable, unlike today’s reset levels appear to be. This is a reminder of the potential pitfalls of “buying yield” without evaluating it against the overall industry and economic backdrop.
True commitment to strategy
Looking at a company’s dividend trajectory can also be an important way of confirming its strategic vision. For example, committing to a quarterly payout may signal that management is less interested in launching new products or expanding its store base than on improving operational efficiency or exiting businesses that offer lower returns on capital.
Deciding to limit expansion or focus on efficiency is rarely the type of splashy strategic move that grabs headlines. Indeed, because such moves may result in revenue reductions, investors sometimes balk at them. But these initiatives can also increase margins and free up cash, increasing the pool of money returnable to shareholders in the form of dividends.
“One of the semiconductor companies I cover made the decision to get out of the mobile computing chip business which, while high growth, is a relentlessly competitive space characterized by short design cycles, high R&D and a concentrated customer base. Instead it chose to focus on its core analog and
| 10 | The Income Fund of America |
IFA has helped me realize that examining companies from an income and total-return standpoint is constructive and results in insights I might not otherwise have gotten.
Anne-Marie Peterson
embedded processing business, a space with much better competitive dynamics and one in which the company had some advantages,” explains technology analyst Mathews Cherian. “Many investors were disappointed initially by the move as the company was walking away from billions in revenue, but I believed this would result in a few years in a much higher margin, high-quality business that could sustainably deliver high levels of free cash flow. The company has, in fact, more than doubled the dividend payout in recent years — confirmation of the stability of cash flow generated by its new business model.”
Aging gracefully
Often, the kind of strategic decisions outlined by Mathews do not come easily to companies. Instead, managers often regard them as an admission that their firms are entering a less exciting phase. If there are fewer products to invest in, acquisitions to make or markets to penetrate, the thinking goes, the company will be seen as an also-ran. But analysts pay close attention to companies that effectively manage such transitions.
“Companies have life cycles just the way that people do. In our 20s, we are trying to establish ourselves, in our 30s our incomes are growing rapidly, in our 40s and 50s we are financial stalwarts and from then on we are financially mature and harvesting our wealth. Companies work the same way,” says Peter. “In The Income Fund of America I am looking for mature companies that are distributing cash to shareholders, need less capital to fund growth, and have the structural wherewithal — and reasonable valuation — to weather storms. One might argue that committing to a dividend doesn’t simply confirm a company’s maturation, but helps promote good ongoing decision making.”
Sometimes, these company transitions reflect broader shifts within industries and even the dividend climate as a whole. For example, most information technology companies once eschewed dividends almost entirely, and yields on pharmaceutical companies previously stood at much lower levels. Yet over the past decade, yields for nine of the 10 sector groups that comprise Standard & Poor’s 500 Composite Index have increased and some, such as information technology, have risen by many multiples (see chart on page 9).
“As an investor, I had always gravitated toward early-stage growth companies, believing that rising share prices were the most appealing path to long-term return,” says Anne-Marie. “But IFA has helped me realize that examining companies from an income and total-return standpoint is constructive and results in insights I might not otherwise have gotten.”
The importance of dividends in the total-return equation seems to be gaining wider acceptance. “The good news is that as we look out over the investment landscape there seem to be more companies and industries increasingly open to returning cash to shareholders through dividends,” says Hilda. “Thankfully, our extensive research resources can help identify those companies that can contribute to IFA’s long-term income and capital appreciation objectives.” n
| The Income Fund of America | 11 |
Fund results shown are for Class A shares at net asset value. If a sales charge (maximum 5.75%) had been deducted, the results would have been lower. Results are for past periods and are not predictive of results for future periods. Current and future results may be lower or higher than those shown. Share prices and returns will vary, so investors may lose money. For current information and month-end results, visit americanfunds.com.
| Resilience during stock market declines | The Income Fund of America (IFA) vs. the S&P 500 during market declines* | |||||||||||
| Dates of decline | S&P 500 | IFA cumulative | IFA advantage | |||||||||
| cumulative total return | total return | (percentage points) | ||||||||||
| September 21, 1976, through March 6, 1978 | –13.5 | % | 1.9 | % | 15.4 | % | ||||||
| November 28, 1980, through August 12, 1982 | –20.2 | 19.0 | 39.2 | |||||||||
| August 25 through December 4, 1987 | –32.8 | –13.6 | 19.2 | |||||||||
| July 16 through October 11, 1990 | –19.2 | –10.2 | 9.0 | |||||||||
| July 17 through August 31, 1998 | –19.1 | –9.5 | 9.6 | |||||||||
| March 24, 2000, through October 9, 2002 | –47.4 | 0.7 | 48.1 | |||||||||
| October 9, 2007, through March 9, 2009 | –55.2 | –43.5 | 11.7 | |||||||||
| April 29 through October 3, 2011 | –18.6 | –11.6 | 7.0 | |||||||||
| * | Periods show S&P 500 price declines of 15% or greater (without dividends reinvested) based on 100% recovery after each decline (except for 1976–1978 and 2007–2009 declines, which recovered 78% and 77%, respectively). The index is unmanaged. |
Withdrawing income: the dividend advantage
Most fund investors reinvest their dividends, but some use dividends to meet current expenses. As the charts below show, the fund’s income has allowed withdrawals to be made without invading principal.
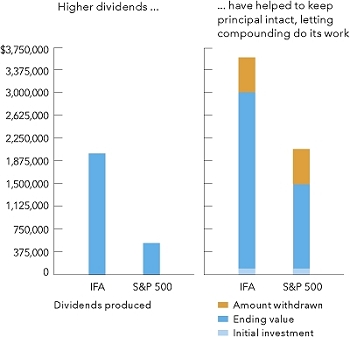
Charts show hypothetical $100,000 investments in the fund (at net asset value) and the S&P 500 from January 1, 1974, to July 31, 2013. Example assumes an annual withdrawal equaling $5,000 the first year on December 31, 1974, and increased by 5% each year thereafter. Over the period, total withdrawals from each of the fund and the index come to $570,475. Source: Thomson InvestmentView.
Historical benefits of income
This chart shows one-year snapshots of the annual income produced by three hypothetical $10,000 investments made on July 31, 1974, in each of The Income Fund of America, the S&P 500, and three-month certificates of deposit (CDs). Over the past 39 years, income from the fund has been substantially higher.

All results are calculated at net asset value with dividends and capital gains (where applicable) reinvested. Source for CDs is the Federal Reserve. CD income assumes reinvestment of both principal and interest at prevailing rates at the time of purchase. CDs are guaranteed; the fund is not. Source: Thomson InvestmentView.
| 12 | The Income Fund of America |
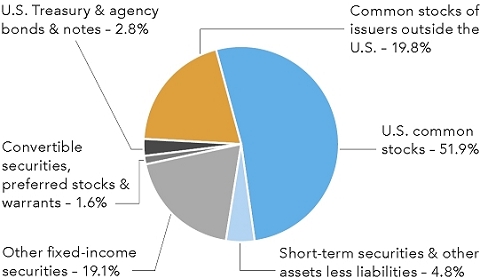
| The portfolio at a glance |
July 31, 2013
| Investment mix by security type | Percent of net assets |
| Five largest sectors in common stock holdings | Percent of net assets | |||
| Health care | 9.9 | % | ||
| Financials | 9.3 | |||
| Industrials | 8.6 | |||
| Energy | 7.5 | |||
| Consumer staples | 6.7 | |||
| Ten largest common stock holdings | Percent of net assets | |||
| Bristol-Myers Squibb | 2.7 | % | ||
| Merck | 2.4 | |||
| General Electric | 2.0 | |||
| Pfizer | 1.7 | |||
| Home Depot | 1.6 | |||
| DuPont | 1.5 | |||
| Lockheed Martin | 1.5 | |||
| National Grid | 1.4 | |||
| Microsoft | 1.3 | |||
| Chevron | 1.3 | |||
| Country diversification | Percent of net assets | |||
| United States | 71.3 | % | ||
| United Kingdom | 8.1 | |||
| Euro zone* | 5.5 | |||
| Canada | 2.1 | |||
| Australia | 1.9 | |||
| Hong Kong | 1.6 | |||
| Other countries | 4.7 | |||
| Short-term securities & other assets less liabilities | 4.8 | |||
| * | Countries using the euro as a common currency; those represented in the fund’s portfolio are Belgium, Finland, France, Germany, Ireland, Italy, Luxembourg, the Netherlands, Portugal and Spain. |
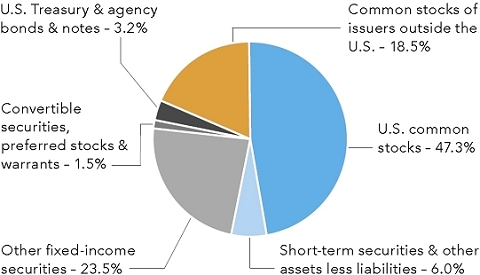
July 31, 2012
| Investment mix by security type | Percent of net assets |
| Five largest sectors in common stock holdings | Percent of net assets | |||
| Industrials | 8.9 | % | ||
| Health care | 8.0 | |||
| Financials | 7.5 | |||
| Consumer staples | 7.0 | |||
| Energy | 6.8 | |||
| Ten largest common stock holdings | Percent of net assets | |||
| Merck | 2.6 | % | ||
| Bristol-Myers Squibb | 2.5 | |||
| Verizon | 2.3 | |||
| General Electric | 2.3 | |||
| Home Depot | 2.0 | |||
| Royal Dutch Shell | 1.6 | |||
| Chevron | 1.4 | |||
| HCP | 1.3 | |||
| Waste Management | 1.3 | |||
| DuPont | 1.3 | |||
| Country diversification | Percent of net assets | |||
| United States | 71.1 | % | ||
| Euro zone† | 5.8 | |||
| United Kingdom | 5.7 | |||
| Canada | 2.6 | |||
| Australia | 2.1 | |||
| Switzerland | 1.5 | |||
| Other countries | 5.2 | |||
| Short-term securities & other assets less liabilities | 6.0 | |||
| † | Countries using the euro as a common currency; those represented in the fund’s portfolio were Belgium, France, Germany, Ireland, Italy, the Netherlands, Portugal and Spain. |
| The Income Fund of America | 13 |
Summary investment portfolio July 31, 2013
| Common stocks 71.74% | Shares | Value (000) | Percent of net assets | |||||||||
| Health care 9.94% | ||||||||||||
| Bristol-Myers Squibb Co. | 51,306,200 | $ | 2,218,480 | 2.66 | % | |||||||
| Merck & Co., Inc. | 41,089,440 | 1,979,278 | 2.38 | |||||||||
| Pfizer Inc. | 48,957,000 | 1,431,013 | 1.72 | |||||||||
| AstraZeneca PLC | 17,210,969 | 873,176 | 1.05 | |||||||||
| AbbVie Inc. | 8,532,500 | 388,058 | .46 | |||||||||
| Other securities | 1,391,169 | 1.67 | ||||||||||
| 8,281,174 | 9.94 | |||||||||||
| Financials 9.30% | ||||||||||||
| HSBC Holdings PLC (United Kingdom) | 41,998,722 | 477,774 | .96 | |||||||||
| HSBC Holdings PLC (Hong Kong) | 28,586,382 | 321,226 | ||||||||||
| CME Group Inc., Class A | 10,140,400 | 750,187 | .90 | |||||||||
| Wells Fargo & Co. | 15,980,000 | 695,130 | .83 | |||||||||
| BlackRock, Inc. | 2,000,000 | 563,920 | .68 | |||||||||
| Weyerhaeuser Co.1 | 17,902,528 | 508,432 | .61 | |||||||||
| Macerich Co.2 | 7,505,000 | 465,685 | .56 | |||||||||
| Digital Realty Trust, Inc.2 | 7,950,000 | 439,556 | .53 | |||||||||
| Other securities | 3,522,904 | 4.23 | ||||||||||
| 7,744,814 | 9.30 | |||||||||||
| Industrials 8.64% | ||||||||||||
| General Electric Co. | 68,066,500 | 1,658,781 | 1.99 | |||||||||
| Lockheed Martin Corp. | 10,105,000 | 1,213,813 | 1.46 | |||||||||
| Waste Management, Inc. | 22,572,153 | 948,708 | 1.14 | |||||||||
| Other securities | 3,376,751 | 4.05 | ||||||||||
| 7,198,053 | 8.64 | |||||||||||
| Energy 7.45% | ||||||||||||
| Chevron Corp. | 8,459,800 | 1,065,004 | 1.28 | |||||||||
| Royal Dutch Shell PLC, Class B (ADR) | 10,426,000 | 738,891 | ||||||||||
| Royal Dutch Shell PLC, Class A (ADR) | 2,500,000 | 170,875 | 1.25 | |||||||||
| Royal Dutch Shell PLC, Class B | 3,797,147 | 133,984 | ||||||||||
| Kinder Morgan, Inc. | 24,082,800 | 909,366 | 1.09 | |||||||||
| Spectra Energy Corp | 25,140,500 | 904,807 | 1.08 | |||||||||
| ConocoPhillips | 9,614,000 | 623,564 | .75 | |||||||||
| Occidental Petroleum Corp. | 4,675,000 | 416,309 | .50 | |||||||||
| Crescent Point Energy Corp. | 10,905,000 | 413,543 | .50 | |||||||||
| Other securities | 831,458 | 1.00 | ||||||||||
| 6,207,801 | 7.45 | |||||||||||
| Consumer staples 6.66% | ||||||||||||
| PepsiCo, Inc. | 11,848,100 | 989,790 | 1.19 | |||||||||
| Procter & Gamble Co. | 10,200,000 | 819,060 | .98 | |||||||||
| Kimberly-Clark Corp. | 7,670,000 | 757,796 | .91 | |||||||||
| Altria Group, Inc. | 17,680,000 | 619,861 | .75 | |||||||||
| Nestlé SA | 5,690,000 | 385,502 | .46 | |||||||||
| Other securities | 1,973,449 | 2.37 | ||||||||||
| 5,545,458 | 6.66 | |||||||||||
| Utilities 5.84% | ||||||||||||
| National Grid PLC | 99,702,637 | 1,192,905 | 1.43 | |||||||||
| GDF SUEZ | 30,614,261 | 642,276 | .77 | |||||||||
| Duke Energy Corp. | 8,361,656 | 593,678 | .71 | |||||||||
| Power Assets Holdings Ltd. | 59,138,000 | 531,095 | .64 | |||||||||
| PG&E Corp. | 11,300,000 | 518,557 | .62 | |||||||||
| FirstEnergy Corp. | 10,867,983 | 413,744 | .50 | |||||||||
| Other securities | 973,679 | 1.17 | ||||||||||
| 4,865,934 | 5.84 | |||||||||||
| 14 | The Income Fund of America |
| Shares | Value (000) | Percent of net assets | ||||||||||
| Information technology 5.81% | ||||||||||||
| Microsoft Corp. | 33,536,100 | $ | 1,067,454 | 1.28 | % | |||||||
| Texas Instruments Inc. | 19,430,000 | 761,656 | .91 | |||||||||
| Paychex, Inc. | 12,803,182 | 504,958 | .61 | |||||||||
| Taiwan Semiconductor Manufacturing Co. Ltd. | 127,503,000 | 435,831 | .52 | |||||||||
| Maxim Integrated Products, Inc. | 14,156,000 | 404,862 | .49 | |||||||||
| Cisco Systems, Inc. | 15,500,000 | 396,025 | .48 | |||||||||
| Analog Devices, Inc. | 7,750,000 | 382,540 | .46 | |||||||||
| Other securities | 880,548 | 1.06 | ||||||||||
| 4,833,874 | 5.81 | |||||||||||
| Consumer discretionary 5.56% | ||||||||||||
| Home Depot, Inc. | 16,416,200 | 1,297,372 | 1.56 | |||||||||
| Time Warner Inc. | 11,815,000 | 735,602 | .88 | |||||||||
| Time Warner Cable Inc. | 6,070,000 | 692,405 | .83 | |||||||||
| Other securities | 1,908,202 | 2.29 | ||||||||||
| 4,633,581 | 5.56 | |||||||||||
| Materials 4.31% | ||||||||||||
| E.I. du Pont de Nemours and Co. | 21,261,000 | 1,226,547 | 1.47 | |||||||||
| Nucor Corp.2 | 16,280,000 | 761,578 | .92 | |||||||||
| Dow Chemical Co. | 20,004,900 | 700,972 | .84 | |||||||||
| MeadWestvaco Corp.2 | 11,281,000 | 416,833 | .50 | |||||||||
| Other securities | 484,908 | .58 | ||||||||||
| 3,590,838 | 4.31 | |||||||||||
| Telecommunication services 4.26% | ||||||||||||
| Verizon Communications Inc. | 19,153,425 | 947,711 | 1.14 | |||||||||
| Telstra Corp. Ltd. | 141,700,000 | 635,562 | .77 | |||||||||
| Vodafone Group PLC | 158,019,000 | 474,763 | .57 | |||||||||
| Other securities | 1,484,885 | 1.78 | ||||||||||
| 3,542,921 | 4.26 | |||||||||||
| Miscellaneous 3.97% | ||||||||||||
| Other common stocks in initial period of acquisition | 3,305,324 | 3.97 | ||||||||||
| Total common stocks (cost: $46,796,414,000) | 59,749,772 | 71.74 | ||||||||||
| Preferred stocks 0.53% | ||||||||||||
| Financials 0.44% | ||||||||||||
| HSBC Holdings PLC, Series 2, 8.00% | 1,825,000 | 49,674 | .06 | |||||||||
| Other securities | 318,569 | .38 | ||||||||||
| 368,243 | .44 | |||||||||||
| Miscellaneous 0.09% | ||||||||||||
| Other preferred stocks in initial period of acquisition | 71,137 | .09 | ||||||||||
| Total preferred stocks (cost: $427,054,000) | 439,380 | .53 | ||||||||||
| Warrants 0.00% | ||||||||||||
| Energy 0.00% | ||||||||||||
| Other securities | 60 | .00 | ||||||||||
| Total warrants (cost: $2,171,000) | 60 | .00 | ||||||||||
| The Income Fund of America | 15 |
| Convertible securities 1.06% | Shares | Value (000) | Percent of net assets | |||||||||
| Consumer discretionary 0.63% | ||||||||||||
| General Motors Co., Series B, 4.75% convertible preferred 2013 | 10,000,000 | $ | 499,400 | .60 | % | |||||||
| Other securities | 23,181 | .03 | ||||||||||
| 522,581 | .63 | |||||||||||
| Other 0.43% | ||||||||||||
| Other securities | 359,927 | .43 | ||||||||||
| Total convertible securities (cost: $844,179,000) | 882,508 | 1.06 | ||||||||||
| Bonds, notes & other debt instruments 21.91% | Principal amount (000) | ||||||||||||
| Financials 3.88% | |||||||||||||
| Wells Fargo & Co.: | |||||||||||||
| Series K, junior subordinated 7.98% (undated)3 | $ | 86,566 | 97,603 | ||||||||||
| 1.25%–4.60% 2016–2021 | 84,000 | 88,819 | .22 | ||||||||||
| Other securities | 3,048,878 | 3.66 | |||||||||||
| 3,235,300 | 3.88 | ||||||||||||
| U.S. Treasury bonds & notes 2.52% | |||||||||||||
| U.S. Treasury — 2.21% | |||||||||||||
| 0.50%–7.50% 2013–2043 | 1,762,537 | 1,836,766 | 2.21 | ||||||||||
| U. S. Treasury inflation-protected securities 4— 0.31% | |||||||||||||
| 0.125%–1.875% 2015–2043 | 262,990 | 258,989 | .31 | ||||||||||
| Total U.S. Treasury bonds & notes | 2,095,755 | 2.52 | |||||||||||
| Consumer discretionary 2.22% | |||||||||||||
| Home Depot, Inc. 5.95% 2041 | 25,000 | 30,710 | .04 | ||||||||||
| Other securities | 1,816,362 | 2.18 | |||||||||||
| 1,847,072 | 2.22 | ||||||||||||
| Mortgage-backed obligations5 2.20% | |||||||||||||
| Fannie Mae 2.50%–10.906% 2018–20473 | 949,685 | 992,817 | 1.19 | ||||||||||
| Freddie Mac 2.478%–10.348% 2019–20423 | 228,458 | 244,628 | .30 | ||||||||||
| Other securities | 592,365 | .71 | |||||||||||
| 1,829,810 | 2.20 | ||||||||||||
| Telecommunication services 1.94% | |||||||||||||
| Verizon Communications Inc. 3.00%–6.00% 2014–2041 | 107,884 | 113,615 | .13 | ||||||||||
| Other securities | 1,504,622 | 1.81 | |||||||||||
| 1,618,237 | 1.94 | ||||||||||||
| Energy 1.84% | |||||||||||||
| Chevron Corp. 1.104%–2.355% 2017–2022 | 26,385 | 24,845 | .03 | ||||||||||
| Shell International Finance BV 4.00% 2014 | 20,000 | 20,446 | .02 | ||||||||||
| Other securities | 1,488,513 | 1.79 | |||||||||||
| 1,533,804 | 1.84 | ||||||||||||
| Industrials 1.72% | |||||||||||||
| General Electric Co. 0.85%–4.125% 2015–2042 | 21,000 | 20,311 | |||||||||||
| General Electric Capital Corp.: | |||||||||||||
| 1.00%–6.00% 2015–2023 | 57,500 | 58,509 | |||||||||||
| Junior subordinated 5.25%–7.125% (undated)3 | 197,100 | 212,391 | .35 | ||||||||||
| Other securities | 1,145,196 | 1.37 | |||||||||||
| 1,436,407 | 1.72 | ||||||||||||
| Health care 1.45% | |||||||||||||
| Merck & Co., Inc. 1.10%–4.15% 2018–2043 | 13,460 | 12,937 | .01 | ||||||||||
| Other securities | 1,195,761 | 1.44 | |||||||||||
| 1,208,698 | 1.45 | ||||||||||||
| 16 | The Income Fund of America |
| Principal amount (000) | Value (000) | Percent of net assets | ||||||||||
| Materials 1.05% | ||||||||||||
| E.I. du Pont de Nemours and Co. 0.693% 20143 | $ | 10,000 | $ | 10,029 | .01 | % | ||||||
| Other securities | 864,618 | 1.04 | ||||||||||
| 874,647 | 1.05 | |||||||||||
| Consumer staples 0.85% | ||||||||||||
| Procter & Gamble Co. 3.50% 2015 | 17,250 | 18,035 | .02 | |||||||||
| PepsiCo, Inc. 2.50%–3.10% 2015–2016 | 15,000 | 15,575 | .02 | |||||||||
| Other securities | 673,065 | .81 | ||||||||||
| 706,675 | .85 | |||||||||||
| Utilities 0.68% | ||||||||||||
| National Grid PLC 6.30% 2016 | 4,000 | 4,544 | .01 | |||||||||
| Other securities | 562,276 | .67 | ||||||||||
| 566,820 | .68 | |||||||||||
| Federal agency bonds & notes 0.32% | ||||||||||||
| Freddie Mac 0.75%–3.111% 2016–2023 | 160,626 | 158,100 | .19 | |||||||||
| Fannie Mae 2.184%–7.125% 2022–20303 | 65,016 | 73,351 | .09 | |||||||||
| Other securities | 33,063 | .04 | ||||||||||
| 264,514 | .32 | |||||||||||
| Other 1.20% | ||||||||||||
| Other securities | 996,439 | 1.20 | ||||||||||
| Miscellaneous 0.04% | ||||||||||||
| Other bonds, notes & other debt instruments in initial period of acquisition | 28,832 | .04 | ||||||||||
| Total bonds, notes & other debt instruments (cost: $17,578,451,000) | 18,243,010 | 21.91 | ||||||||||
| Short-term securities 4.98% | ||||||||||||
| Freddie Mac 0.09%–0.16% due 8/1/2013–6/10/2014 | 1,352,900 | 1,352,224 | 1.62 | |||||||||
| Federal Home Loan Bank 0.07%–0.18% due 8/2/2013–6/20/2014 | 827,740 | 827,384 | .99 | |||||||||
| Fannie Mae 0.06%–0.16% due 8/15/2013–3/3/2014 | 789,739 | 789,451 | .95 | |||||||||
| General Electric Capital Corp. 0.14%–0.17% due 9/10–10/28/2013 | 132,900 | 132,879 | ||||||||||
| General Electric Co. 0.10% due 9/16/2013 | 55,500 | 55,492 | .23 | |||||||||
| Wells Fargo & Co. 0.15%–0.18% due 8/14–12/16/2013 | 155,000 | 154,889 | .19 | |||||||||
| Procter & Gamble Co. 0.10%–0.14% due 8/16–11/5/20136 | 90,000 | 89,989 | .11 | |||||||||
| Merck & Co. Inc. 0.12% due 9/19/20136 | 50,000 | 49,996 | .06 | |||||||||
| U.S. Treasury Bill 0.176% due 9/19/2013 | 42,300 | 42,299 | .05 | |||||||||
| Other securities | 653,154 | .78 | ||||||||||
| Total short-term securities (cost: $4,147,278,000) | 4,147,757 | 4.98 | ||||||||||
| Total investment securities (cost: $69,795,547,000) | 83,462,487 | 100.22 | ||||||||||
| Other assets less liabilities | (180,203 | ) | (.22 | ) | ||||||||
| Net assets | $ | 83,282,284 | 100.00 | % | ||||||||
This summary investment portfolio is designed to streamline the report and help investors better focus on the fund’s principal holdings. See the inside back cover for details on how to obtain a complete schedule of portfolio holdings.
As permitted by U.S. Securities and Exchange Commission regulations, “Miscellaneous” securities include holdings in their first year of acquisition that have not previously been publicly disclosed.
“Other securities” includes all issues that are not disclosed separately in the summary investment portfolio, including loan participations and assignments which may be subject to legal or contractual restrictions on resale. The total value of all such loans was $957,538,000, which represented 1.15% of the net assets of the fund.
| The Income Fund of America | 17 |
Forward currency contracts
The fund has entered into a forward currency contract to sell currency as shown in the following table. The open forward currency contract shown is generally indicative of the level of activity over the prior 12-month period.
| Unrealized | ||||||||||||||||||
| Contract amount | appreciation | |||||||||||||||||
| Settlement date | Counterparty | Receive (000) | Deliver (000) | at 7/31/2013 (000) | ||||||||||||||
| Sales: | ||||||||||||||||||
| British pounds | 9/10/2013 | Citibank | $199,964 | £131,766 | $— | |||||||||||||
| 18 | The Income Fund of America |
Investment in affiliates
A company is considered to be an affiliate of the fund under the Investment Company Act of 1940 if the fund’s holdings in that company represent 5% or more of the outstanding voting shares. The value of the fund’s affiliated-company holdings is either shown in the summary investment portfolio or included in the value of “Other securities” under the respective industry sectors. Further details on such holdings and related transactions during the year ended July 31, 2013, appear below.
| Beginning Shares or principal amount | Additions | Reductions | Ending shares or principal amount | Dividend or interest income (000) | Value of affiliates at 7/31/2013 (000) | |||||||||||||||||||
| Nucor Corp. | 13,580,000 | 2,700,000 | — | 16,280,000 | $ | 21,215 | $ | 761,578 | ||||||||||||||||
| Macerich Co. | 3,250,000 | 4,255,000 | — | 7,505,000 | 8,629 | 465,685 | ||||||||||||||||||
| Digital Realty Trust, Inc. | 3,475,000 | 4,475,000 | — | 7,950,000 | 16,479 | 439,556 | ||||||||||||||||||
| MeadWestvaco Corp. | 11,201,000 | 80,000 | — | 11,281,000 | 11,281 | 416,833 | ||||||||||||||||||
| Iron Mountain Inc. | 11,117,270 | 1,339,941 | — | 12,457,211 | 58,413 | 346,310 | ||||||||||||||||||
| Hospitality Properties Trust | 8,015,000 | 1,058,335 | — | 9,073,335 | 15,814 | 258,499 | ||||||||||||||||||
| Hospitality Properties Trust 6.30% 2016 | $19,827,000 | — | — | $19,827,000 | 1,045 | 21,678 | ||||||||||||||||||
| Hospitality Properties Trust 6.70% 2018 | $12,625,000 | — | — | $12,625,000 | 852 | 14,222 | ||||||||||||||||||
| Hospitality Properties Trust 5.625% 2017 | $10,169,000 | — | — | $10,169,000 | 637 | 11,073 | ||||||||||||||||||
| Hospitality Properties Trust 4.50% 2023 | — | $11,060,000 | — | $11,060,000 | 75 | 10,778 | ||||||||||||||||||
| Hospitality Properties Trust 5.00% 2022 | — | $7,000,000 | $500,000 | $6,500,000 | 337 | 6,587 | ||||||||||||||||||
| Hospitality Properties Trust 5.125% 2015 | $3,160,000 | — | $1,000,000 | $2,160,000 | 205 | 2,238 | ||||||||||||||||||
| Hospitality Properties Trust 6.75% 2013 | $12,650,000 | — | $12,650,000 | — | 96 | — | ||||||||||||||||||
| R.R. Donnelley & Sons Co. | 13,345,400 | — | — | 13,345,400 | 13,879 | 253,429 | ||||||||||||||||||
| R.R. Donnelley & Sons Co. 7.25% 2018 | — | $11,400,000 | — | $11,400,000 | 466 | 12,341 | ||||||||||||||||||
| R.R. Donnelley & Sons Co. 7.875% 2021 | — | $21,815,000 | $16,815,000 | $5,000,000 | 222 | 5,425 | ||||||||||||||||||
| R.R. Donnelley & Sons Co. 6.125% 2017 | — | $2,475,000 | $2,475,000 | — | 59 | — | ||||||||||||||||||
| Cliffs Natural Resources Inc. | 5,573,000 | 5,547,581 | 3,766,000 | 7,354,581 | 10,940 | 143,488 | ||||||||||||||||||
| Cliffs Natural Resources Inc., Series A, 7.00% convertible preferred 2016 | — | 2,925,000 | — | 2,925,000 | 2,232 | 55,283 | ||||||||||||||||||
| Cliffs Natural Resources Inc. 4.875% 2021 | $28,275,000 | $5,662,000 | $3,695,000 | $30,242,000 | 1,473 | 27,762 | ||||||||||||||||||
| Cliffs Natural Resources Inc. 3.95% 2018 | — | $3,250,000 | — | $3,250,000 | 6 | 3,140 | ||||||||||||||||||
| Cliffs Natural Resources Inc. 6.25% 2040 | $2,480,000 | — | $1,480,000 | $1,000,000 | 98 | 855 | ||||||||||||||||||
| TalkTalk Telecom Group PLC | 57,242,000 | — | — | 57,242,000 | 9,174 | 215,086 | ||||||||||||||||||
| Northwest Bancshares, Inc. | 4,850,000 | — | — | 4,850,000 | 2,959 | 67,027 | ||||||||||||||||||
| Revel AC, Inc.1,7,8 | — | 529,539 | — | 529,539 | — | 26,406 | ||||||||||||||||||
| Revel Entertainment, Term Loan B, 9.00% 2017 | $48,950,000 | $15,000,000 | $63,950,000 | — | 5,252 | — | ||||||||||||||||||
| Douglas Dynamics, Inc. | 1,350,000 | — | — | 1,350,000 | 1,117 | 19,400 | ||||||||||||||||||
| Fletcher Building Ltd.9 | 34,239,000 | — | 14,124,000 | 20,115,000 | 8,917 | — | ||||||||||||||||||
| Masco Corp.9 | 19,796,751 | — | 4,000,000 | 15,796,751 | 5,225 | — | ||||||||||||||||||
| Trustmark Corp.9 | 3,257,000 | — | 2,410,225 | 846,775 | 2,996 | — | ||||||||||||||||||
| Waste Management, Inc.9 | 27,471,706 | 2,100,000 | 6,999,553 | 22,572,153 | 32,990 | — | ||||||||||||||||||
| $ | 233,083 | $ | 3,584,679 | |||||||||||||||||||||
The following footnotes apply to either the individual securities noted or one or more of the securities aggregated and listed as a single line item.
| 1 | Security did not produce income during the last 12 months. |
| 2 | Represents an affiliated company as defined under the Investment Company Act of 1940. |
| 3 | Coupon rate may change periodically. |
| 4 | Index-linked bond whose principal amount moves with a government price index. |
| 5 | Principal payments may be made periodically. Therefore, the effective maturity date may be earlier than the stated maturity date. |
| 6 | Acquired in a transaction exempt from registration under Rule 144A or section 4(2) of the Securities Act of 1933. May be resold in the U.S. in transactions exempt from registration, normally to qualified institutional buyers. The total value of all such securities, including those in “Other securities,” was $5,027,287,000, which represented 6.04% of the net assets of the fund. |
| 7 | Valued under fair value procedures adopted by authority of the board of trustees. The total value of all such securities, including those in “Other securities,” was $218,340,000, which represented .26% of the net assets of the fund. |
| 8 | Acquired through a private placement transaction exempt from registration under the Securities Act of 1933. This security (acquired from 2/14/2011 to 10/25/2012 at a cost of $56,224,000) may be subject to legal or contractual restrictions on resale. The total value of all such securities, including those in “Other securities,” was $145,464,000, which represented .17% of the net assets of the fund. These securities were acquired from 11/21/2008 to 5/2/2013 at an aggregate cost of $236,238,000. |
| 9 | Unaffiliated issuer at 7/31/2013. |
Key to abbreviation and symbol
ADR = American Depositary Receipts
£ = British pounds
See Notes to Financial Statements
| The Income Fund of America | 19 |
| Statement of assets and liabilities | ||||||||
| at July 31, 2013 | (dollars in thousands) | |||||||
| Assets: | ||||||||
| Investment securities, at value: | ||||||||
| Unaffiliated issuers (cost: $66,179,255) | $ | 79,877,808 | ||||||
| Affiliated issuers (cost: $3,616,292) | 3,584,679 | $ | 83,462,487 | |||||
| Cash denominated in currencies other than U.S. dollars (cost: $670) | 670 | |||||||
| Cash | 1,229 | |||||||
| Receivables for: | ||||||||
| Sales of investments | 394,076 | |||||||
| Sales of fund’s shares | 109,044 | |||||||
| Dividends and interest | 419,880 | 923,000 | ||||||
| 84,387,386 | ||||||||
| Liabilities: | ||||||||
| Payables for: | ||||||||
| Purchases of investments | 964,624 | |||||||
| Repurchases of fund’s shares | 83,387 | |||||||
| Closed forward currency contracts | 21 | |||||||
| Investment advisory services | 14,807 | |||||||
| Services provided by related parties | 37,400 | |||||||
| Trustees’ deferred compensation | 4,375 | |||||||
| Other | 488 | 1,105,102 | ||||||
| Net assets at July 31, 2013 | $ | 83,282,284 | ||||||
| Net assets consist of: | ||||||||
| Capital paid in on shares of beneficial interest | $ | 74,209,919 | ||||||
| Undistributed net investment income | 392,405 | |||||||
| Accumulated net realized loss | (4,987,045 | ) | ||||||
| Net unrealized appreciation | 13,667,005 | |||||||
| Net assets at July 31, 2013 | $ | 83,282,284 | ||||||
(dollars and shares in thousands, except per share amounts)
Shares of beneficial interest issued and outstanding (no stated par value) —
unlimited shares authorized (4,246,376 total shares outstanding)
| Shares | Net asset value | |||||||||||
| Net assets | outstanding | per share | ||||||||||
| Class A | $ | 63,967,921 | 3,257,584 | $ | 19.64 | |||||||
| Class B | 817,721 | 41,940 | 19.50 | |||||||||
| Class C | 6,388,691 | 328,983 | 19.42 | |||||||||
| Class F-1 | 3,553,941 | 181,357 | 19.60 | |||||||||
| Class F-2 | 1,433,487 | 73,031 | 19.63 | |||||||||
| Class 529-A | 1,297,943 | 66,212 | 19.60 | |||||||||
| Class 529-B | 45,445 | 2,325 | 19.55 | |||||||||
| Class 529-C | 420,352 | 21,524 | 19.53 | |||||||||
| Class 529-E | 58,638 | 2,999 | 19.55 | |||||||||
| Class 529-F-1 | 44,353 | 2,262 | 19.60 | |||||||||
| Class R-1 | 120,333 | 6,162 | 19.53 | |||||||||
| Class R-2 | 609,484 | 31,342 | 19.45 | |||||||||
| Class R-3 | 1,322,879 | 67,602 | 19.57 | |||||||||
| Class R-4 | 1,044,605 | 53,275 | 19.61 | |||||||||
| Class R-5 | 525,235 | 26,747 | 19.64 | |||||||||
| Class R-6 | 1,631,256 | 83,031 | 19.65 | |||||||||
See Notes to Financial Statements
| 20 | The Income Fund of America |
| Statement of operations | ||||||||
| for the year ended July 31, 2013 | (dollars in thousands) | |||||||
| Investment income: | ||||||||
| Income: | ||||||||
| Dividends (net of non-U.S. taxes of $62,754; also includes $222,260 from affiliates) | $ | 2,223,433 | ||||||
| Interest (includes $10,823 from affiliates) | 1,010,291 | $ | 3,233,724 | |||||
| Fees and expenses*: | ||||||||
| Investment advisory services | 178,820 | |||||||
| Distribution services | 244,233 | |||||||
| Transfer agent services | 70,403 | |||||||
| Administrative services | 14,443 | |||||||
| Reports to shareholders | 2,583 | |||||||
| Registration statement and prospectus | 666 | |||||||
| Trustees’ compensation | 915 | |||||||
| Auditing and legal | 191 | |||||||
| Custodian | 2,684 | |||||||
| Other | 2,269 | 517,207 | ||||||
| Net investment income | 2,716,517 | |||||||
| Net realized gain and unrealized appreciation on investments, forward currency contracts and currency: | ||||||||
| Net realized gain (loss) on: | ||||||||
| Investments (includes $227,039 net loss from affiliates) | 1,485,156 | |||||||
| Forward currency contracts | (21 | ) | ||||||
| Currency transactions | (3,475 | ) | 1,481,660 | |||||
| Net unrealized appreciation on: | ||||||||
| Investments | 6,792,779 | |||||||
| Currency translations | 745 | 6,793,524 | ||||||
| Net realized gain and unrealized appreciation on investments, forward currency contracts and currency | 8,275,184 | |||||||
| Net increase in net assets resulting from operations | $ | 10,991,701 | ||||||
| * | Additional information related to class-specific fees and expenses is included in the Notes to Financial Statements. |
| Statements of changes in net assets | ||||||||
| (dollars in thousands) | ||||||||
| Year ended July 31 | ||||||||
| 2013 | 2012 | |||||||
| Operations: | ||||||||
| Net investment income | $ | 2,716,517 | $ | 2,621,849 | ||||
| Net realized gain on investments, forward currency contracts and currency transactions | 1,481,660 | 1,001,534 | ||||||
| Net unrealized appreciation on investments and currency translations | 6,793,524 | 1,913,338 | ||||||
| Net increase in net assets resulting from operations | 10,991,701 | 5,536,721 | ||||||
| Dividends paid to shareholders from net investment income | (2,756,869 | ) | (2,766,884 | ) | ||||
| Net capital share transactions | 2,176,097 | 1,227,028 | ||||||
| Total increase in net assets | 10,410,929 | 3,996,865 | ||||||
| Net assets: | ||||||||
| Beginning of year | 72,871,355 | 68,874,490 | ||||||
| End of year (including undistributed net investment income: $392,405 and $408,336, respectively) | $ | 83,282,284 | $ | 72,871,355 | ||||
See Notes to Financial Statements
| The Income Fund of America | 21 |
Notes to financial statements
1. Organization
The Income Fund of America (the “fund”) is registered under the Investment Company Act of 1940 as an open-end, diversified management investment company. The fund seeks current income while secondarily striving for capital growth through investments in stocks and fixed-income securities.
The fund has 16 share classes consisting of five retail share classes (Classes A, B and C, as well as two F share classes, F-1 and F-2), five 529 college savings plan share classes (Classes 529-A, 529-B, 529-C, 529-E and 529-F-1) and six retirement plan share classes (Classes R-1, R-2, R-3, R-4, R-5 and R-6). The 529 college savings plan share classes can be used to save for college education. The retirement plan share classes are generally offered only through eligible employer-sponsored retirement plans. The fund’s share classes are further described below:
| Share class | Initial sales charge | Contingent deferred sales charge upon redemption | Conversion feature | |||
| Classes A and 529-A | Up to 5.75% | None (except 1% for certain redemptions within one year of purchase without an initial sales charge) | None | |||
| Classes B and 529-B* | None | Declines from 5% to 0% for redemptions within six years of purchase | Classes B and 529-B convert to Classes A and 529-A, respectively, after eight years | |||
| Class C | None | 1% for redemptions within one year of purchase | Class C converts to Class F-1 after 10 years | |||
| Class 529-C | None | 1% for redemptions within one year of purchase | None | |||
| Class 529-E | None | None | None | |||
| Classes F-1, F-2 and 529-F-1 | None | None | None | |||
| Classes R-1, R-2, R-3, R-4, R-5 and R-6 | None | None | None |
| * | Class B and 529-B shares of the fund are not available for purchase. |
Holders of all share classes have equal pro rata rights to assets, dividends and liquidation proceeds. Each share class has identical voting rights, except for the exclusive right to vote on matters affecting only its class. Share classes have different fees and expenses (“class-specific fees and expenses”), primarily due to different arrangements for distribution, administrative and shareholder services. Differences in class-specific fees and expenses will result in differences in net investment income and, therefore, the payment of different per-share dividends by each share class.
2. Significant accounting policies
The financial statements have been prepared to comply with accounting principles generally accepted in the United States of America. These principles require management to make estimates and assumptions that affect reported amounts and disclosures. Actual results could differ from those estimates. The fund follows the significant accounting policies described below, as well as the valuation policies described in the next section on valuation.
Security transactions and related investment income — Security transactions are recorded by the fund as of the date the trades are executed with brokers. Realized gains and losses from security transactions are determined based on the specific identified cost of the securities. In the event a security is purchased with a delayed payment date, the fund will segregate liquid assets sufficient to meet its payment obligations. Dividend income is recognized on the ex-dividend date and interest income is recognized on an accrual basis. Market discounts, premiums and original issue discounts on fixed-income securities are amortized daily over the expected life of the security.
Class allocations — Income, fees and expenses (other than class-specific fees and expenses) and realized and unrealized gains and losses are allocated daily among the various share classes based on their relative net assets. Class-specific fees and expenses, such as distribution, administrative and shareholder services, are charged directly to the respective share class.
Dividends and distributions to shareholders — Dividends and distributions to shareholders are recorded on the ex-dividend date.
| 22 | The Income Fund of America |
Currency translation — Assets and liabilities, including investment securities, denominated in currencies other than U.S. dollars are translated into U.S. dollars at the exchange rates supplied by one or more pricing vendors on the valuation date. Purchases and sales of investment securities and income and expenses are translated into U.S. dollars at the exchange rates on the dates of such transactions. On the accompanying financial statements, the effects of changes in exchange rates on investment securities are included with the net realized gain or loss and net unrealized appreciation or depreciation on investments. The realized gain or loss and unrealized appreciation or depreciation resulting from all other transactions denominated in currencies other than U.S. dollars are disclosed separately.
3. Valuation
Capital Research and Management Company (“CRMC”), the fund’s investment adviser, values the fund’s investments at fair value as defined by accounting principles generally accepted in the United States of America. The net asset value of each share class of the fund is generally determined as of approximately 4:00 p.m. New York time each day the New York Stock Exchange is open.
Methods and inputs — The fund’s investment adviser uses the following methods and inputs to establish the fair value of the fund’s assets and liabilities. Use of particular methods and inputs may vary over time based on availability and relevance as market and economic conditions evolve.
Equity securities are generally valued at the official closing price of, or the last reported sale price on, the exchange or market on which such securities are traded, as of the close of business on the day the securities are being valued or, lacking any sales, at the last available bid price. Prices for each security are taken from the principal exchange or market on which the security trades.
Fixed-income securities, including short-term securities purchased with more than 60 days left to maturity, are generally valued at prices obtained from one or more pricing vendors. Vendors value such securities based on one or more of the inputs described in the following table. The table provides examples of inputs that are commonly relevant for valuing particular classes of fixed-income securities in which the fund is authorized to invest. However, these classifications are not exclusive, and any of the inputs may be used to value any other class of fixed-income security.
| Fixed-income class | Examples of standard inputs | |
| All | Benchmark yields, transactions, bids, offers, quotations from dealers and trading systems, new issues, spreads and other relationships observed in the markets among comparable securities; and proprietary pricing models such as yield measures calculated using factors such as cash flows, financial or collateral performance and other reference data (collectively referred to as “standard inputs”) | |
| Corporate bonds & notes; convertible securities | Standard inputs and underlying equity of the issuer | |
| Bonds & notes of governments & government agencies | Standard inputs and interest rate volatilities | |
| Mortgage-backed; asset-backed obligations | Standard inputs and cash flows, prepayment information, default rates, delinquency and loss assumptions, collateral characteristics, credit enhancements and specific deal information | |
| Municipal securities | Standard inputs and, for certain distressed securities, cash flows or liquidation values using a net present value calculation based on inputs that include, but are not limited to, financial statements and debt contracts |
When the fund’s investment adviser deems it appropriate to do so (such as when vendor prices are unavailable or not deemed to be representative), fixed-income securities will be valued in good faith at the mean quoted bid and ask prices that are reasonably and timely available (or bid prices, if ask prices are not available) or at prices for securities of comparable maturity, quality and type.
Securities with both fixed-income and equity characteristics, or equity securities traded principally among fixed-income dealers, are generally valued in the manner described above for either equity or fixed-income securities, depending on which method is deemed most appropriate by the fund’s investment adviser. Short-term securities purchased within 60 days to maturity are valued at amortized cost, which approximates fair value. The value of short-term securities originally purchased with maturities greater than 60 days is determined based on an amortized value to par when they reach 60 days. Forward currency contracts are valued at the mean of representative quoted bid and ask prices, generally based on prices supplied by one or more pricing vendors.
Securities and other assets for which representative market quotations are not readily available or are considered unreliable by the fund’s investment adviser are fair valued as determined in good faith under fair valuation guidelines adopted by authority of the fund’s board of trustees as further described below. The investment adviser follows fair valuation guidelines, consistent with U.S. Securities and Exchange Commission rules and guidance, to consider relevant principles and factors when making fair value determinations. The
| The Income Fund of America | 23 |
investment adviser considers relevant indications of value that are reasonably and timely available to it in determining the fair value to be assigned to a particular security, such as the type and cost of the security; contractual or legal restrictions on resale of the security; relevant financial or business developments of the issuer; actively traded similar or related securities; conversion or exchange rights on the security; related corporate actions; significant events occurring after the close of trading in the security; and changes in overall market conditions. In addition, the closing prices of equity securities that trade in markets outside U.S. time zones may be adjusted to reflect significant events that occur after the close of local trading but before the net asset value of each share class of the fund is determined. Fair valuations and valuations of investments that are not actively trading involve judgment and may differ materially from valuations that would have been used had greater market activity occurred.
Processes and structure — The fund’s board of trustees has delegated authority to the fund’s investment adviser to make fair value determinations, subject to board oversight. The investment adviser has established a Joint Fair Valuation Committee (the “Fair Valuation Committee”) to administer, implement and oversee the fair valuation process, and to make fair value decisions. The Fair Valuation Committee regularly reviews its own fair value decisions, as well as decisions made under its standing instructions to the investment adviser’s valuation teams. The Fair Valuation Committee reviews changes in fair value measurements from period to period and may, as deemed appropriate, update the fair valuation guidelines to better reflect the results of back testing and address new or evolving issues. The Fair Valuation Committee reports any changes to the fair valuation guidelines to the board of trustees with supplemental information to support the changes. The fund’s board and audit committee also regularly review reports that describe fair value determinations and methods.
The fund’s investment adviser has also established a Fixed-Income Pricing Review Group to administer and oversee the fixed-income valuation process, including the use of fixed-income pricing vendors. This group regularly reviews pricing vendor information and market data. Pricing decisions, processes and controls over security valuation are also subject to additional internal reviews, including an annual control self-evaluation program facilitated by the investment adviser’s compliance group.
Classifications — The fund’s investment adviser classifies the fund’s assets and liabilities into three levels based on the inputs used to value the assets or liabilities. Level 1 values are based on quoted prices in active markets for identical securities. Level 2 values are based on significant observable market inputs, such as quoted prices for similar securities and quoted prices in inactive markets. Certain securities trading outside the U.S. may transfer between Level 1 and Level 2 due to valuation adjustments resulting from significant market movements following the close of local trading. Level 3 values are based on significant unobservable inputs that reflect the investment adviser’s determination of assumptions that market participants might reasonably use in valuing the securities. The valuation levels are not necessarily an indication of the risk or liquidity associated with the underlying investment. For example, U.S. government securities are reflected as Level 2 because the inputs used to determine fair value may not always be quoted prices in an active market. The following table presents the fund’s valuation levels as of July 31, 2013 (dollars in thousands):
| Investment securities | ||||||||||||||||
| Level 1 | Level 2 | Level 3 | Total | |||||||||||||
| Assets: | ||||||||||||||||
| Common stocks: | ||||||||||||||||
| Health care | $ | 8,281,174 | $ | — | $ | — | $ | 8,281,174 | ||||||||
| Financials | 7,744,814 | — | — | 7,744,814 | ||||||||||||
| Industrials | 7,069,251 | — | 128,802 | 7,198,053 | ||||||||||||
| Energy | 6,207,598 | — | 203 | 6,207,801 | ||||||||||||
| Consumer staples | 5,545,458 | — | — | 5,545,458 | ||||||||||||
| Utilities | 4,865,934 | — | — | 4,865,934 | ||||||||||||
| Information technology | 4,833,874 | — | — | 4,833,874 | ||||||||||||
| Consumer discretionary | 4,607,175 | — | 26,406 | 4,633,581 | ||||||||||||
| Materials | 3,578,724 | — | 12,114 | 3,590,838 | ||||||||||||
| Telecommunication services | 3,542,921 | — | — | 3,542,921 | ||||||||||||
| Miscellaneous | 3,305,324 | — | — | 3,305,324 | ||||||||||||
| Preferred stocks | 156,583 | 282,797 | — | 439,380 | ||||||||||||
| Warrants | — | — | 60 | 60 | ||||||||||||
| Convertible securities | 651,362 | 182,065 | 49,081 | 882,508 | ||||||||||||
| Bonds, notes & other debt instruments: | ||||||||||||||||
| Corporate bonds & notes | — | 13,025,986 | 1,674 | 13,027,660 | ||||||||||||
| U.S. Treasury bonds & notes | — | 2,095,755 | — | 2,095,755 | ||||||||||||
| Mortgage-backed obligations | — | 1,829,810 | — | 1,829,810 | ||||||||||||
| Federal agency bonds & notes | — | 264,514 | — | 264,514 | ||||||||||||
| Other | — | 996,439 | — | 996,439 | ||||||||||||
| Miscellaneous | — | 28,832 | — | 28,832 | ||||||||||||
| Short-term securities | — | 4,147,757 | — | 4,147,757 | ||||||||||||
| Total | $ | 60,390,192 | $ | 22,853,955 | $ | 218,340 | $ | 83,462,487 | ||||||||
| 24 | The Income Fund of America |
4. Risk factors
Investing in the fund may involve certain risks including, but not limited to, those described below.
Market conditions — The prices of, and the income generated by, the common stocks and other securities held by the fund may decline due to market conditions and other factors, including those directly involving the issuers of securities held by the fund.
Investing in income-oriented stocks — Income provided by the fund may be reduced by changes in the dividend policies of, and the capital resources available at, the companies in which the fund invests.
Investing in bonds — Rising interest rates will generally cause the prices of bonds and other debt securities to fall. Longer maturity debt securities may be subject to greater price fluctuations than shorter maturity debt securities. In addition, falling interest rates may cause an issuer to redeem, call or refinance a debt security before its stated maturity, which may result in the fund having to reinvest the proceeds in lower yielding securities.
Bonds and other debt securities are subject to credit risk, which is the possibility that the credit strength of an issuer will weaken and/or an issuer of a debt security will fail to make timely payments of principal or interest and the security will go into default. Credit risk is gauged, in part, by the credit ratings of the securities in which the fund invests. However, ratings are only the opinions of the rating agencies issuing them and are not guarantees as to credit quality or an evaluation of market risk. The fund’s investment adviser relies on its own credit analysts to research issuers and issues in seeking to mitigate the risks of an issuer defaulting on its obligations.
Investing in lower rated bonds — Lower rated bonds and other lower rated debt securities generally have higher rates of interest and involve greater risk of default or price declines due to changes in the issuer’s creditworthiness than those of higher quality debt securities. The market prices of these securities may fluctuate more than the prices of higher quality debt securities and may decline significantly in periods of general economic difficulty. These risks may be increased with respect to investments in junk bonds.
Investing outside the U.S. — Securities of issuers domiciled outside the U.S., or with significant operations outside the U.S., may lose value because of adverse political, social, economic or market developments in the countries or regions in which the issuers operate. These securities may also lose value due to changes in foreign currency exchange rates against the U.S. dollar and/or currencies of other countries. Securities markets in certain countries may be more volatile and/or less liquid than those in the U.S. Investments outside the U.S. may also be subject to different settlement and accounting practices and different regulatory, legal and reporting standards, and may be more difficult to value, than those in the U.S. The risks of investing outside the U.S. may be heightened in connection with investments in emerging markets.
Management — The investment adviser to the fund actively manages the fund’s investments. Consequently, the fund is subject to the risk that the methods and analyses employed by the investment adviser in this process may not produce the desired results. This could cause the fund to lose value or its investment results to lag relevant benchmarks or other funds with similar objectives.
5. Certain investment techniques
Loan transactions — The fund has entered into loan transactions in which the fund acquires a loan either through an agent, by assignment from another holder, or as a participation interest in another holder’s portion of a loan. The loan is often administered by a financial institution that acts as agent for the holders of the loan, and the fund may be required to receive approval from the agent and/or borrower prior to the sale of the investment. The loan’s interest rate and maturity date may change based on the terms of the loan, including potential early payments of principal.
Forward currency contracts — The fund has entered into forward currency contracts, which represent agreements to exchange currencies on specific future dates at predetermined rates. The fund’s investment adviser uses forward currency contracts to manage the fund’s exposure to changes in exchange rates. Upon entering into these contracts, risks may arise from the potential inability of counterparties to meet the terms of their contracts and from possible movements in exchange rates.
| The Income Fund of America | 25 |
On a daily basis, the fund’s investment adviser values forward currency contracts and records unrealized appreciation or depreciation for open forward currency contracts in the fund’s statement of assets and liabilities. Realized gains or losses are recorded at the time the forward currency contract is closed or offset by another contract with the same broker for the same settlement date and currency. Closed forward currency contracts that have not reached their settlement date are included in the respective receivables or payables for closed forward currency contracts in the fund’s statement of assets and liabilities. Net realized gains or losses from closed forward currency contracts and net unrealized appreciation or depreciation from open forward currency contracts are recorded in the fund’s statement of operations.
6. Taxation and distributions
Federal income taxation — The fund complies with the requirements under Subchapter M of the Internal Revenue Code applicable to mutual funds and intends to distribute substantially all of its net taxable income and net capital gains each year. The fund is not subject to income taxes to the extent such distributions are made. Therefore, no federal income tax provision is required.
As of and during the period ended July 31, 2013, the fund did not have a liability for any unrecognized tax benefits. The fund recognizes interest and penalties, if any, related to unrecognized tax benefits as income tax expense in the statement of operations. During the period, the fund did not incur any interest or penalties.
The fund is not subject to examination by U.S. federal tax authorities for tax years before 2009 and by state tax authorities for tax years before 2008.
Non-U.S. taxation — Dividend and interest income are recorded net of non-U.S. taxes paid. Gains realized by the fund on the sale of securities in certain countries are subject to non-U.S. taxes. The fund records a liability based on unrealized gains to provide for potential non-U.S. taxes payable upon the sale of these securities.
Distributions — Distributions paid to shareholders are based on net investment income and net realized gains determined on a tax basis, which may differ from net investment income and net realized gains for financial reporting purposes. These differences are due primarily to different treatment for items such as currency gains and losses; short-term capital gains and losses; capital losses related to sales of certain securities within 30 days of purchase; deferred expenses; cost of investments sold; paydowns on fixed-income securities; net capital losses; and income on certain investments. The fiscal year in which amounts are distributed may differ from the year in which the net investment income and net realized gains are recorded by the fund for financial reporting purposes.
During the year ended July 31, 2013, the fund reclassified $24,497,000 from accumulated net realized loss to undistributed net investment income and $76,000 from undistributed net investment income to capital paid in on shares of beneficial interest to align financial reporting with tax reporting.
Under the Regulated Investment Company Modernization Act of 2010 (the “Act”), net capital losses recognized after July 31, 2011, may be carried forward indefinitely, and their character is retained as short-term and/or long-term losses. Previously, net capital losses were carried forward for eight years and treated as short-term losses. As a transition rule, the Act requires that post-enactment net capital losses be used before pre-enactment net capital losses.
As of July 31, 2013, the tax basis components of distributable earnings, unrealized appreciation (depreciation) and cost of investment securities were as follows (dollars in thousands):
| Undistributed ordinary income | $ | 395,319 | ||
| Capital loss carryforward expiring 2018* | (4,858,854 | ) | ||
| Gross unrealized appreciation on investment securities | 15,208,352 | |||
| Gross unrealized depreciation on investment securities | (1,679,176 | ) | ||
| Net unrealized appreciation on investment securities | 13,529,176 | |||
| Cost of investment securities | 69,933,311 |
| * | Reflects the utilization of capital loss carryforward of $1,462,280,000. The capital loss carryforward will be used to offset any capital gains realized by the fund in future years through the expiration date. The fund will not make distributions from capital gains while a capital loss carryforward remains. |
| 26 | The Income Fund of America |
Tax-basis distributions paid to shareholders from ordinary income were as follows (dollars in thousands):
| Year ended July 31 | ||||||||
| Share class | 2013 | 2012 | ||||||
| Class A | $ | 2,171,974 | $ | 2,184,216 | ||||
| Class B | 27,748 | 46,211 | ||||||
| Class C | 178,582 | 200,257 | ||||||
| Class F-1 | 107,595 | 89,867 | ||||||
| Class F-2 | 46,177 | 36,868 | ||||||
| Class 529-A | 42,441 | 40,081 | ||||||
| Class 529-B | 1,393 | 2,067 | ||||||
| Class 529-C | 10,954 | 11,153 | ||||||
| Class 529-E | 1,814 | 1,773 | ||||||
| Class 529-F-1 | 1,496 | 1,404 | ||||||
| Class R-1 | 3,417 | 3,657 | ||||||
| Class R-2 | 17,045 | 18,298 | ||||||
| Class R-3 | 41,523 | 42,360 | ||||||
| Class R-4 | 33,835 | 33,776 | ||||||
| Class R-5 | 18,939 | 18,601 | ||||||
| Class R-6 | 51,936 | 36,295 | ||||||
| Total | $ | 2,756,869 | $ | 2,766,884 | ||||
7. Fees and transactions with related parties
CRMC, the fund’s investment adviser, is the parent company of American Funds Distributors,® Inc. (“AFD”), the principal underwriter of the fund’s shares, and American Funds Service Company® (“AFS”), the fund’s transfer agent. CRMC, AFD and AFS are considered related parties to the fund.
Investment advisory services — The fund has an investment advisory and service agreement with CRMC that provides for monthly fees accrued daily. These fees are based on a series of decreasing annual rates beginning with 0.250% on the first $500 million of daily net assets and decreasing to 0.123% on such assets in excess of $89 billion. The agreement also provides for monthly fees, accrued daily, of 2.25% of the fund’s monthly gross income. For the year ended July 31, 2013, the investment advisory services fee was $178,820,000, which was equivalent to an annualized rate of 0.230% of average daily net assets.
Class-specific fees and expenses — Expenses that are specific to individual share classes are accrued directly to the respective share class. The principal class-specific fees and expenses are described below:
| Distribution services — The fund has plans of distribution for all share classes, except Class F-2, R-5 and R-6 shares. Under the plans, the board of trustees approves certain categories of expenses that are used to finance activities primarily intended to sell fund shares and service existing accounts. The plans provide for payments, based on an annualized percentage of average daily net assets, ranging from 0.25% to 1.00% as noted below. In some cases, the board of trustees has limited the amounts that may be paid to less than the maximum allowed by the plans. All share classes with a plan may use up to 0.25% of average daily net assets to pay service fees, or to compensate AFD for paying service fees, to firms that have entered into agreements with AFD to provide certain shareholder services. The remaining amounts available to be paid under each plan are paid to dealers to compensate them for their sales activities. | |
| For Class A and 529-A shares, distribution-related expenses include the reimbursement of dealer and wholesaler commissions paid by AFD for certain shares sold without a sales charge. These share classes reimburse AFD for amounts billed within the prior 15 months but only to the extent that the overall annual expense limit of 0.25% is not exceeded. As of July 31, 2013, there were no unreimbursed expenses subject to reimbursement for Class A or 529-A shares. |
| Share class | Currently approved limits | Plan limits | ||||||
| Class A | 0.25 | % | 0.25 | % | ||||
| Class 529-A | 0.25 | 0.50 | ||||||
| Classes B and 529-B | 1.00 | 1.00 | ||||||
| Classes C, 529-C and R-1 | 1.00 | 1.00 | ||||||
| Class R-2 | 0.75 | 1.00 | ||||||
| Classes 529-E and R-3 | 0.50 | 0.75 | ||||||
| Classes F-1, 529-F-1 and R-4 | 0.25 | 0.50 | ||||||
| The Income Fund of America | 27 |
| Transfer agent services — The fund has a shareholder services agreement with AFS under which the fund compensates AFS for providing transfer agent services to each of the fund’s share classes. These services include recordkeeping, shareholder communications and transaction processing. In addition, the fund reimburses AFS for amounts paid to third parties for performing transfer agent services on behalf of fund shareholders. | |
| Administrative services — The fund has an administrative services agreement with CRMC under which the fund compensates CRMC for providing administrative services to Class A, C, F, 529 and R shares. These services include, but are not limited to, coordinating, monitoring, assisting and overseeing third parties that provide services to fund shareholders. Under the agreement, Class A shares pay an annual fee of 0.01% and Class C, F, 529 and R shares pay an annual fee of 0.05% of their respective average daily net assets. | |
| 529 plan services — Each 529 share class is subject to service fees to compensate the Commonwealth of Virginia for the maintenance of the 529 college savings plan. The quarterly fee is based on a series of decreasing annual rates beginning with 0.10% on the first $30 billion of the net assets invested in Class 529 shares of the American Funds and decreasing to 0.06% on such assets between $120 billion and $150 billion. The fee for any given calendar quarter is accrued and calculated on the basis of the average net assets of Class 529 shares of the American Funds for the last month of the prior calendar quarter. The fee is included in other expenses on the accompanying financial statements. The Commonwealth of Virginia is not considered a related party. | |
| For the year ended July 31, 2013, class-specific expenses under the agreements were as follows (dollars in thousands): |
| Distribution | Transfer agent | Administrative | 529 plan | |||||||||
| Share class | services | services | services | services | ||||||||
| Class A | $143,231 | $52,629 | $5,981 | Not applicable | ||||||||
| Class B | 9,706 | 925 | Not applicable | Not applicable | ||||||||
| Class C | 62,202 | 5,567 | 3,113 | Not applicable | ||||||||
| Class F-1 | 7,482 | 3,431 | 1,500 | Not applicable | ||||||||
| Class F-2 | Not applicable | 1,442 | 609 | Not applicable | ||||||||
| Class 529-A | 2,691 | 770 | 600 | $1,182 | ||||||||
| Class 529-B | 508 | 40 | 25 | 51 | ||||||||
| Class 529-C | 3,915 | 280 | 197 | 388 | ||||||||
| Class 529-E | 274 | 19 | 27 | 54 | ||||||||
| Class 529-F-1 | — | 26 | 20 | 39 | ||||||||
| Class R-1 | 1,196 | 122 | 60 | Not applicable | ||||||||
| Class R-2 | 4,377 | 1,956 | 295 | Not applicable | ||||||||
| Class R-3 | 6,282 | 2,005 | 633 | Not applicable | ||||||||
| Class R-4 | 2,369 | 940 | 475 | Not applicable | ||||||||
| Class R-5 | Not applicable | 245 | 244 | Not applicable | ||||||||
| Class R-6 | Not applicable | 6 | 664 | Not applicable | ||||||||
| Total class-specific expenses | $244,233 | $70,403 | $14,443 | $1,714 | ||||||||
Trustees’ deferred compensation — Trustees who are unaffiliated with CRMC may elect to defer the cash payment of part or all of their compensation. These deferred amounts, which remain as liabilities of the fund, are treated as if invested in shares of the fund or other American Funds. These amounts represent general, unsecured liabilities of the fund and vary according to the total returns of the selected funds. Trustees’ compensation of $915,000, shown on the accompanying financial statements, includes $392,000 in current fees (either paid in cash or deferred) and a net increase of $523,000 in the value of the deferred amounts.
Affiliated officers and trustees — Officers and certain trustees of the fund are or may be considered to be affiliated with CRMC, AFD and AFS. No affiliated officers or trustees received any compensation directly from the fund.
| 28 | The Income Fund of America |
8. Capital share transactions
Capital share transactions in the fund were as follows (dollars and shares in thousands):
| Sales* | Reinvestments of dividends | Repurchases* | Net increase (decrease) | |||||||||||||||||||||||||||||
| Share class | Amount | Shares | Amount | Shares | Amount | Shares | Amount | Shares | ||||||||||||||||||||||||
| Year ended July 31, 2013 | ||||||||||||||||||||||||||||||||
| Class A | $ | 6,799,757 | 364,100 | $ | 2,086,314 | 112,144 | $ | (7,414,778 | ) | (398,937 | ) | $ | 1,471,293 | 77,307 | ||||||||||||||||||
| Class B | 26,969 | 1,464 | 27,089 | 1,471 | (501,122 | ) | (27,222 | ) | (447,064 | ) | (24,287 | ) | ||||||||||||||||||||
| Class C | 916,082 | 49,436 | 168,957 | 9,181 | (1,450,582 | ) | (78,597 | ) | (365,543 | ) | (19,980 | ) | ||||||||||||||||||||
| Class F-1 | 1,181,426 | 63,117 | 104,438 | 5,616 | (610,314 | ) | (32,789 | ) | 675,550 | 35,944 | ||||||||||||||||||||||
| Class F-2 | 472,751 | 25,296 | 40,087 | 2,153 | (227,692 | ) | (12,190 | ) | 285,146 | 15,259 | ||||||||||||||||||||||
| Class 529-A | 199,233 | 10,735 | 42,425 | 2,284 | (173,700 | ) | (9,356 | ) | 67,958 | 3,663 | ||||||||||||||||||||||
| Class 529-B | 2,397 | 130 | 1,392 | 75 | (21,711 | ) | (1,176 | ) | (17,922 | ) | (971 | ) | ||||||||||||||||||||
| Class 529-C | 68,835 | 3,713 | 10,950 | 591 | (71,129 | ) | (3,849 | ) | 8,656 | 455 | ||||||||||||||||||||||
| Class 529-E | 8,507 | 460 | 1,814 | 98 | (9,309 | ) | (505 | ) | 1,012 | 53 | ||||||||||||||||||||||
| Class 529-F-1 | 10,094 | 542 | 1,496 | 80 | (7,795 | ) | (421 | ) | 3,795 | 201 | ||||||||||||||||||||||
| Class R-1 | 23,012 | 1,239 | 3,404 | 184 | (40,798 | ) | (2,215 | ) | (14,382 | ) | (792 | ) | ||||||||||||||||||||
| Class R-2 | 152,857 | 8,296 | 17,014 | 923 | (190,058 | ) | (10,314 | ) | (20,187 | ) | (1,095 | ) | ||||||||||||||||||||
| Class R-3 | 292,660 | 15,756 | 41,436 | 2,235 | (348,587 | ) | (18,798 | ) | (14,491 | ) | (807 | ) | ||||||||||||||||||||
| Class R-4 | 301,902 | 16,195 | 33,823 | 1,820 | (272,131 | ) | (14,655 | ) | 63,594 | 3,360 | ||||||||||||||||||||||
| Class R-5 | 146,132 | 7,769 | 18,918 | 1,018 | (151,577 | ) | (8,195 | ) | 13,473 | 592 | ||||||||||||||||||||||
| Class R-6 | 549,910 | 29,473 | 51,849 | 2,780 | (136,550 | ) | (7,264 | ) | 465,209 | 24,989 | ||||||||||||||||||||||
| Total net increase (decrease) | $ | 11,152,524 | 597,721 | $ | 2,651,406 | 142,653 | $ | (11,627,833 | ) | (626,483 | ) | $ | 2,176,097 | 113,891 | ||||||||||||||||||
| Year ended July 31, 2012 | ||||||||||||||||||||||||||||||||
| Class A | $ | 6,409,309 | 380,692 | $ | 2,076,112 | 123,088 | $ | (7,424,453 | ) | (442,493 | ) | $ | 1,060,968 | 61,287 | ||||||||||||||||||
| Class B | 53,846 | 3,232 | 44,577 | 2,668 | (732,865 | ) | (44,184 | ) | (634,442 | ) | (38,284 | ) | ||||||||||||||||||||
| Class C | 772,114 | 46,260 | 186,801 | 11,185 | (1,246,159 | ) | (75,003 | ) | (287,244 | ) | (17,558 | ) | ||||||||||||||||||||
| Class F-1 | 855,471 | 50,731 | 87,301 | 5,178 | (502,848 | ) | (29,980 | ) | 439,924 | 25,929 | ||||||||||||||||||||||
| Class F-2 | 357,474 | 21,135 | 30,977 | 1,834 | (155,227 | ) | (9,207 | ) | 233,224 | 13,762 | ||||||||||||||||||||||
| Class 529-A | 205,725 | 12,229 | 40,070 | 2,377 | (125,549 | ) | (7,469 | ) | 120,246 | 7,137 | ||||||||||||||||||||||
| Class 529-B | 4,732 | 283 | 2,066 | 123 | (27,015 | ) | (1,622 | ) | (20,217 | ) | (1,216 | ) | ||||||||||||||||||||
| Class 529-C | 69,306 | 4,131 | 11,149 | 663 | (55,114 | ) | (3,294 | ) | 25,341 | 1,500 | ||||||||||||||||||||||
| Class 529-E | 10,662 | 636 | 1,772 | 105 | (6,783 | ) | (404 | ) | 5,651 | 337 | ||||||||||||||||||||||
| Class 529-F-1 | 9,503 | 564 | 1,404 | 84 | (7,312 | ) | (431 | ) | 3,595 | 217 | ||||||||||||||||||||||
| Class R-1 | 31,835 | 1,893 | 3,647 | 217 | (26,611 | ) | (1,603 | ) | 8,871 | 507 | ||||||||||||||||||||||
| Class R-2 | 152,861 | 9,155 | 18,275 | 1,093 | (177,532 | ) | (10,631 | ) | (6,396 | ) | (383 | ) | ||||||||||||||||||||
| Class R-3 | 291,667 | 17,334 | 42,296 | 2,514 | (294,208 | ) | (17,542 | ) | 39,755 | 2,306 | ||||||||||||||||||||||
| Class R-4 | 260,468 | 15,470 | 33,752 | 2,002 | (256,507 | ) | (15,282 | ) | 37,713 | 2,190 | ||||||||||||||||||||||
| Class R-5 | 120,163 | 7,104 | 18,581 | 1,102 | (168,184 | ) | (10,211 | ) | (29,440 | ) | (2,005 | ) | ||||||||||||||||||||
| Class R-6 | 248,413 | 14,532 | 36,215 | 2,144 | (55,149 | ) | (3,263 | ) | 229,479 | 13,413 | ||||||||||||||||||||||
| Total net increase (decrease) | $ | 9,853,549 | 585,381 | $ | 2,634,995 | 156,377 | $ | (11,261,516 | ) | (672,619 | ) | $ | 1,227,028 | 69,139 | ||||||||||||||||||
| * | Includes exchanges between share classes of the fund. |
9. Investment transactions
The fund made purchases and sales of investment securities, excluding short-term securities and U.S. government obligations, if any, of $33,988,968,000 and $31,510,511,000, respectively, during the year ended July 31, 2013.
| The Income Fund of America | 29 |
Financial highlights
| Income (loss) from investment operations1 | ||||||||||||||||||||||||||||||||||||||||||||
| Net asset value, beginning of period | Net investment income | Net gains (losses) on securities (both realized and unrealized) | Total from investment operations | Dividends (from net investment income) | Net asset value, end of period | Total return2,3 | Net assets, end of period (in millions) | Ratio of expenses to average net assets before waivers | Ratio of expenses to average net assets after waivers3 | Ratio of net income to average net assets3 | ||||||||||||||||||||||||||||||||||
| Class A: | ||||||||||||||||||||||||||||||||||||||||||||
| Year ended 7/31/2013 | $ | 17.66 | $ | .67 | $ | 1.99 | $ | 2.66 | $ | (.68 | ) | $ | 19.64 | 15.33 | % | $ | 63,968 | .58 | % | .58 | % | 3.58 | % | |||||||||||||||||||||
| Year ended 7/31/2012 | 16.97 | .66 | .73 | 1.39 | (.70 | ) | 17.66 | 8.45 | 56,153 | .59 | .59 | 3.92 | ||||||||||||||||||||||||||||||||
| Year ended 7/31/2011 | 15.48 | .71 | 1.53 | 2.24 | (.75 | ) | 16.97 | 14.68 | 52,940 | .58 | .58 | 4.24 | ||||||||||||||||||||||||||||||||
| Year ended 7/31/2010 | 14.04 | .73 | 1.37 | 2.10 | (.66 | ) | 15.48 | 15.09 | 48,437 | .61 | .61 | 4.82 | ||||||||||||||||||||||||||||||||
| Year ended 7/31/2009 | 16.98 | .74 | (2.98 | ) | (2.24 | ) | (.70 | ) | 14.04 | (12.72 | ) | 45,569 | .64 | .63 | 5.50 | |||||||||||||||||||||||||||||
| Class B: | ||||||||||||||||||||||||||||||||||||||||||||
| Year ended 7/31/2013 | 17.53 | .53 | 1.97 | 2.50 | (.53 | ) | 19.50 | 14.48 | 818 | 1.33 | 1.33 | 2.86 | ||||||||||||||||||||||||||||||||
| Year ended 7/31/2012 | 16.85 | .53 | .71 | 1.24 | (.56 | ) | 17.53 | 7.56 | 1,161 | 1.34 | 1.34 | 3.19 | ||||||||||||||||||||||||||||||||
| Year ended 7/31/2011 | 15.37 | .58 | 1.52 | 2.10 | (.62 | ) | 16.85 | 13.82 | 1,760 | 1.34 | 1.34 | 3.48 | ||||||||||||||||||||||||||||||||
| Year ended 7/31/2010 | 13.94 | .60 | 1.37 | 1.97 | (.54 | ) | 15.37 | 14.24 | 2,421 | 1.38 | 1.38 | 4.01 | ||||||||||||||||||||||||||||||||
| Year ended 7/31/2009 | 16.87 | .63 | (2.95 | ) | (2.32 | ) | (.61 | ) | 13.94 | (13.37 | ) | 2,835 | 1.41 | 1.39 | 4.74 | |||||||||||||||||||||||||||||
| Class C: | ||||||||||||||||||||||||||||||||||||||||||||
| Year ended 7/31/2013 | 17.47 | .51 | 1.97 | 2.48 | (.53 | ) | 19.42 | 14.41 | 6,389 | 1.38 | 1.38 | 2.79 | ||||||||||||||||||||||||||||||||
| Year ended 7/31/2012 | 16.80 | .52 | .71 | 1.23 | (.56 | ) | 17.47 | 7.55 | 6,096 | 1.38 | 1.38 | 3.13 | ||||||||||||||||||||||||||||||||
| Year ended 7/31/2011 | 15.33 | .57 | 1.51 | 2.08 | (.61 | ) | 16.80 | 13.77 | 6,157 | 1.39 | 1.39 | 3.43 | ||||||||||||||||||||||||||||||||
| Year ended 7/31/2010 | 13.91 | .60 | 1.36 | 1.96 | (.54 | ) | 15.33 | 14.17 | 5,882 | 1.43 | 1.43 | 4.00 | ||||||||||||||||||||||||||||||||
| Year ended 7/31/2009 | 16.84 | .62 | (2.94 | ) | (2.32 | ) | (.61 | ) | 13.91 | (13.43 | ) | 5,637 | 1.45 | 1.44 | 4.69 | |||||||||||||||||||||||||||||
| Class F-1: | ||||||||||||||||||||||||||||||||||||||||||||
| Year ended 7/31/2013 | 17.62 | .65 | 2.00 | 2.65 | (.67 | ) | 19.60 | 15.30 | 3,554 | .65 | .65 | 3.50 | ||||||||||||||||||||||||||||||||
| Year ended 7/31/2012 | 16.94 | .65 | .72 | 1.37 | (.69 | ) | 17.62 | 8.35 | 2,563 | .64 | .64 | 3.87 | ||||||||||||||||||||||||||||||||
| Year ended 7/31/2011 | 15.46 | .70 | 1.52 | 2.22 | (.74 | ) | 16.94 | 14.58 | 2,025 | .64 | .64 | 4.19 | ||||||||||||||||||||||||||||||||
| Year ended 7/31/2010 | 14.02 | .73 | 1.37 | 2.10 | (.66 | ) | 15.46 | 15.08 | 1,815 | .65 | .65 | 4.78 | ||||||||||||||||||||||||||||||||
| Year ended 7/31/2009 | 16.95 | .74 | (2.97 | ) | (2.23 | ) | (.70 | ) | 14.02 | (12.71 | ) | 1,801 | .66 | .65 | 5.49 | |||||||||||||||||||||||||||||
| Class F-2: | ||||||||||||||||||||||||||||||||||||||||||||
| Year ended 7/31/2013 | 17.65 | .70 | 1.99 | 2.69 | (.71 | ) | 19.63 | 15.53 | 1,434 | .41 | .41 | 3.74 | ||||||||||||||||||||||||||||||||
| Year ended 7/31/2012 | 16.97 | .69 | .72 | 1.41 | (.73 | ) | 17.65 | 8.59 | 1,020 | .40 | .40 | 4.09 | ||||||||||||||||||||||||||||||||
| Year ended 7/31/2011 | 15.48 | .74 | 1.53 | 2.27 | (.78 | ) | 16.97 | 14.90 | 747 | .40 | .40 | 4.42 | ||||||||||||||||||||||||||||||||
| Year ended 7/31/2010 | 14.04 | .77 | 1.36 | 2.13 | (.69 | ) | 15.48 | 15.31 | 460 | .42 | .42 | 5.04 | ||||||||||||||||||||||||||||||||
| Year ended 7/31/2009 | 16.91 | .68 | (2.82 | ) | (2.14 | ) | (.73 | ) | 14.04 | (12.19 | ) | 350 | .44 | .43 | 5.39 | |||||||||||||||||||||||||||||
| Class 529-A: | ||||||||||||||||||||||||||||||||||||||||||||
| Year ended 7/31/2013 | 17.63 | .65 | 1.98 | 2.63 | (.66 | ) | 19.60 | 15.19 | 1,298 | .68 | .68 | 3.48 | ||||||||||||||||||||||||||||||||
| Year ended 7/31/2012 | 16.95 | .64 | .72 | 1.36 | (.68 | ) | 17.63 | 8.30 | 1,102 | .68 | .68 | 3.82 | ||||||||||||||||||||||||||||||||
| Year ended 7/31/2011 | 15.46 | .69 | 1.53 | 2.22 | (.73 | ) | 16.95 | 14.62 | 939 | .67 | .67 | 4.15 | ||||||||||||||||||||||||||||||||
| Year ended 7/31/2010 | 14.03 | .73 | 1.35 | 2.08 | (.65 | ) | 15.46 | 14.95 | 753 | .69 | .69 | 4.77 | ||||||||||||||||||||||||||||||||
| Year ended 7/31/2009 | 16.96 | .73 | (2.96 | ) | (2.23 | ) | (.70 | ) | 14.03 | (12.72 | ) | 608 | .70 | .68 | 5.44 | |||||||||||||||||||||||||||||
| Class 529-B: | ||||||||||||||||||||||||||||||||||||||||||||
| Year ended 7/31/2013 | 17.57 | .50 | 1.99 | 2.49 | (.51 | ) | 19.55 | 14.35 | 45 | 1.46 | 1.46 | 2.73 | ||||||||||||||||||||||||||||||||
| Year ended 7/31/2012 | 16.89 | .51 | .71 | 1.22 | (.54 | ) | 17.57 | 7.41 | 58 | 1.47 | 1.47 | 3.06 | ||||||||||||||||||||||||||||||||
| Year ended 7/31/2011 | 15.41 | .56 | 1.52 | 2.08 | (.60 | ) | 16.89 | 13.66 | 76 | 1.46 | 1.46 | 3.37 | ||||||||||||||||||||||||||||||||
| Year ended 7/31/2010 | 13.98 | .59 | 1.37 | 1.96 | (.53 | ) | 15.41 | 14.10 | 92 | 1.49 | 1.49 | 3.92 | ||||||||||||||||||||||||||||||||
| Year ended 7/31/2009 | 16.92 | .62 | (2.96 | ) | (2.34 | ) | (.60 | ) | 13.98 | (13.47 | ) | 91 | 1.51 | 1.50 | 4.63 | |||||||||||||||||||||||||||||
| Class 529-C: | ||||||||||||||||||||||||||||||||||||||||||||
| Year ended 7/31/2013 | 17.56 | .50 | 1.99 | 2.49 | (.52 | ) | 19.53 | 14.36 | 420 | 1.45 | 1.45 | 2.71 | ||||||||||||||||||||||||||||||||
| Year ended 7/31/2012 | 16.89 | .51 | .71 | 1.22 | (.55 | ) | 17.56 | 7.43 | 370 | 1.47 | 1.47 | 3.04 | ||||||||||||||||||||||||||||||||
| Year ended 7/31/2011 | 15.41 | .56 | 1.53 | 2.09 | (.61 | ) | 16.89 | 13.71 | 331 | 1.46 | 1.46 | 3.37 | ||||||||||||||||||||||||||||||||
| Year ended 7/31/2010 | 13.99 | .60 | 1.35 | 1.95 | (.53 | ) | 15.41 | 14.04 | 281 | 1.48 | 1.48 | 3.97 | ||||||||||||||||||||||||||||||||
| Year ended 7/31/2009 | 16.93 | .62 | (2.96 | ) | (2.34 | ) | (.60 | ) | 13.99 | (13.45 | ) | 241 | 1.50 | 1.49 | 4.63 | |||||||||||||||||||||||||||||
| Class 529-E: | ||||||||||||||||||||||||||||||||||||||||||||
| Year ended 7/31/2013 | 17.58 | .60 | 1.99 | 2.59 | (.62 | ) | 19.55 | 14.95 | 59 | .92 | .92 | 3.24 | ||||||||||||||||||||||||||||||||
| Year ended 7/31/2012 | 16.91 | .60 | .71 | 1.31 | (.64 | ) | 17.58 | 7.99 | 52 | .93 | .93 | 3.57 | ||||||||||||||||||||||||||||||||
| Year ended 7/31/2011 | 15.43 | .65 | 1.52 | 2.17 | (.69 | ) | 16.91 | 14.27 | 44 | .94 | .94 | 3.88 | ||||||||||||||||||||||||||||||||
| Year ended 7/31/2010 | 14.00 | .68 | 1.36 | 2.04 | (.61 | ) | 15.43 | 14.66 | 35 | .97 | .97 | 4.49 | ||||||||||||||||||||||||||||||||
| Year ended 7/31/2009 | 16.93 | .68 | (2.95 | ) | (2.27 | ) | (.66 | ) | 14.00 | (12.98 | ) | 29 | 1.00 | .98 | 5.14 | |||||||||||||||||||||||||||||
| 30 | The Income Fund of America |
| Income (loss) from investment operations1 | ||||||||||||||||||||||||||||||||||||||||||||
| Net asset value, beginning of period | Net investment income | Net gains (losses) on securities (both realized and unrealized) | Total from investment operations | Dividends (from net investment income) | Net asset value, end of period | Total return3 | Net assets, end of period (in millions) | Ratio of expenses to average net assets before waivers | Ratio of expenses to average net assets after waivers3 | Ratio of net income to average net assets3 | ||||||||||||||||||||||||||||||||||
| Class 529-F-1: | ||||||||||||||||||||||||||||||||||||||||||||
| Year ended 7/31/2013 | $ | 17.63 | $ | .69 | $ | 1.98 | $ | 2.67 | $ | (.70 | ) | $ | 19.60 | 15.44 | % | $ | 44 | .45 | % | .45 | % | 3.70 | % | |||||||||||||||||||||
| Year ended 7/31/2012 | 16.95 | .68 | .72 | 1.40 | (.72 | ) | 17.63 | 8.53 | 36 | .46 | .46 | 4.04 | ||||||||||||||||||||||||||||||||
| Year ended 7/31/2011 | 15.46 | .73 | 1.53 | 2.26 | (.77 | ) | 16.95 | 14.87 | 31 | .45 | .45 | 4.37 | ||||||||||||||||||||||||||||||||
| Year ended 7/31/2010 | 14.03 | .76 | 1.35 | 2.11 | (.68 | ) | 15.46 | 15.19 | 22 | .47 | .47 | 4.99 | ||||||||||||||||||||||||||||||||
| Year ended 7/31/2009 | 16.96 | .75 | (2.96 | ) | (2.21 | ) | (.72 | ) | 14.03 | (12.56 | ) | 19 | .50 | .48 | 5.64 | |||||||||||||||||||||||||||||
| Class R-1: | ||||||||||||||||||||||||||||||||||||||||||||
| Year ended 7/31/2013 | 17.56 | .52 | 1.98 | 2.50 | (.53 | ) | 19.53 | 14.43 | 120 | 1.39 | 1.39 | 2.78 | ||||||||||||||||||||||||||||||||
| Year ended 7/31/2012 | 16.89 | .52 | .71 | 1.23 | (.56 | ) | 17.56 | 7.50 | 122 | 1.40 | 1.40 | 3.11 | ||||||||||||||||||||||||||||||||
| Year ended 7/31/2011 | 15.41 | .57 | 1.52 | 2.09 | (.61 | ) | 16.89 | 13.76 | 109 | 1.41 | 1.41 | 3.42 | ||||||||||||||||||||||||||||||||
| Year ended 7/31/2010 | 13.99 | .61 | 1.35 | 1.96 | (.54 | ) | 15.41 | 14.10 | 91 | 1.44 | 1.44 | 4.03 | ||||||||||||||||||||||||||||||||
| Year ended 7/31/2009 | 16.92 | .62 | (2.95 | ) | (2.33 | ) | (.60 | ) | 13.99 | (13.36 | ) | 74 | 1.46 | 1.44 | 4.68 | |||||||||||||||||||||||||||||
| Class R-2: | ||||||||||||||||||||||||||||||||||||||||||||
| Year ended 7/31/2013 | 17.49 | .52 | 1.98 | 2.50 | (.54 | ) | 19.45 | 14.47 | 609 | 1.36 | 1.36 | 2.80 | ||||||||||||||||||||||||||||||||
| Year ended 7/31/2012 | 16.82 | .52 | .71 | 1.23 | (.56 | ) | 17.49 | 7.52 | 567 | 1.40 | 1.40 | 3.11 | ||||||||||||||||||||||||||||||||
| Year ended 7/31/2011 | 15.35 | .57 | 1.51 | 2.08 | (.61 | ) | 16.82 | 13.75 | 552 | 1.41 | 1.41 | 3.41 | ||||||||||||||||||||||||||||||||
| Year ended 7/31/2010 | 13.93 | .60 | 1.35 | 1.95 | (.53 | ) | 15.35 | 14.10 | 518 | 1.47 | 1.47 | 3.97 | ||||||||||||||||||||||||||||||||
| Year ended 7/31/2009 | 16.86 | .61 | (2.95 | ) | (2.34 | ) | (.59 | ) | 13.93 | (13.54 | ) | 463 | 1.56 | 1.54 | 4.58 | |||||||||||||||||||||||||||||
| Class R-3: | ||||||||||||||||||||||||||||||||||||||||||||
| Year ended 7/31/2013 | 17.60 | .60 | 1.98 | 2.58 | (.61 | ) | 19.57 | 14.91 | 1,323 | .94 | .94 | 3.22 | ||||||||||||||||||||||||||||||||
| Year ended 7/31/2012 | 16.92 | .60 | .72 | 1.32 | (.64 | ) | 17.60 | 8.01 | 1,204 | .96 | .96 | 3.55 | ||||||||||||||||||||||||||||||||
| Year ended 7/31/2011 | 15.44 | .64 | 1.53 | 2.17 | (.69 | ) | 16.92 | 14.23 | 1,118 | .96 | .96 | 3.86 | ||||||||||||||||||||||||||||||||
| Year ended 7/31/2010 | 14.01 | .68 | 1.35 | 2.03 | (.60 | ) | 15.44 | 14.63 | 1,056 | .99 | .99 | 4.45 | ||||||||||||||||||||||||||||||||
| Year ended 7/31/2009 | 16.94 | .68 | (2.95 | ) | (2.27 | ) | (.66 | ) | 14.01 | (12.99 | ) | 936 | 1.00 | .99 | 5.14 | |||||||||||||||||||||||||||||
| Class R-4: | ||||||||||||||||||||||||||||||||||||||||||||
| Year ended 7/31/2013 | 17.63 | .66 | 1.99 | 2.65 | (.67 | ) | 19.61 | 15.29 | 1,045 | .64 | .64 | 3.52 | ||||||||||||||||||||||||||||||||
| Year ended 7/31/2012 | 16.95 | .65 | .72 | 1.37 | (.69 | ) | 17.63 | 8.33 | 880 | .65 | .65 | 3.86 | ||||||||||||||||||||||||||||||||
| Year ended 7/31/2011 | 15.46 | .70 | 1.53 | 2.23 | (.74 | ) | 16.95 | 14.62 | 809 | .66 | .66 | 4.17 | ||||||||||||||||||||||||||||||||
| Year ended 7/31/2010 | 14.03 | .72 | 1.36 | 2.08 | (.65 | ) | 15.46 | 14.95 | 740 | .68 | .68 | 4.77 | ||||||||||||||||||||||||||||||||
| Year ended 7/31/2009 | 16.96 | .72 | (2.95 | ) | (2.23 | ) | (.70 | ) | 14.03 | (12.72 | ) | 629 | .70 | .69 | 5.43 | |||||||||||||||||||||||||||||
| Class R-5: | ||||||||||||||||||||||||||||||||||||||||||||
| Year ended 7/31/2013 | 17.66 | .71 | 1.99 | 2.70 | (.72 | ) | 19.64 | 15.60 | 525 | .34 | .34 | 3.83 | ||||||||||||||||||||||||||||||||
| Year ended 7/31/2012 | 16.97 | .70 | .73 | 1.43 | (.74 | ) | 17.66 | 8.70 | 462 | .35 | .35 | 4.17 | ||||||||||||||||||||||||||||||||
| Year ended 7/31/2011 | 15.48 | .75 | 1.53 | 2.28 | (.79 | ) | 16.97 | 14.94 | 478 | .36 | .36 | 4.46 | ||||||||||||||||||||||||||||||||
| Year ended 7/31/2010 | 14.04 | .77 | 1.37 | 2.14 | (.70 | ) | 15.48 | 15.36 | 447 | .38 | .38 | 5.07 | ||||||||||||||||||||||||||||||||
| Year ended 7/31/2009 | 16.97 | .76 | (2.96 | ) | (2.20 | ) | (.73 | ) | 14.04 | (12.53 | ) | 395 | .40 | .38 | 5.72 | |||||||||||||||||||||||||||||
| Class R-6: | ||||||||||||||||||||||||||||||||||||||||||||
| Year ended 7/31/2013 | 17.66 | .72 | 2.00 | 2.72 | (.73 | ) | 19.65 | 15.72 | 1,631 | .29 | .29 | 3.85 | ||||||||||||||||||||||||||||||||
| Year ended 7/31/2012 | 16.98 | .71 | .72 | 1.43 | (.75 | ) | 17.66 | 8.69 | 1,025 | .30 | .30 | 4.21 | ||||||||||||||||||||||||||||||||
| Year ended 7/31/2011 | 15.49 | .76 | 1.52 | 2.28 | (.79 | ) | 16.98 | 14.99 | 758 | .31 | .31 | 4.51 | ||||||||||||||||||||||||||||||||
| Year ended 7/31/2010 | 14.05 | .79 | 1.35 | 2.14 | (.70 | ) | 15.49 | 15.40 | 480 | .33 | .33 | 5.20 | ||||||||||||||||||||||||||||||||
| Period from 5/1/2009 to 7/31/20094 | 12.55 | .19 | 1.48 | 1.67 | (.17 | ) | 14.05 | 13.42 | 272 | .09 | .09 | 1.45 | ||||||||||||||||||||||||||||||||
| Year ended July 31 | ||||||||||||||||||||
| 2013 | 2012 | 2011 | 2010 | 2009 | ||||||||||||||||
| Portfolio turnover rate for all share classes | 47% | 41% | 38% | 35% | 49% | |||||||||||||||
| 1 | Based on average shares outstanding. |
| 2 | Total returns exclude any applicable sales charges, including contingent deferred sales charges. |
| 3 | This column reflects the impact, if any, of certain waivers from CRMC. During one of the periods shown, CRMC reduced fees for investment advisory services. |
| 4 | Based on operations for the period shown and, accordingly, is not representative of a full year. |
See Notes to Financial Statements
| The Income Fund of America | 31 |
Report of Independent Registered Public Accounting Firm
To the Shareholders and Board of Trustees of The Income Fund of America:
We have audited the accompanying statement of assets and liabilities of The Income Fund of America (the “Fund”), including the summary investment portfolio, as of July 31, 2013, and the related statement of operations for the year then ended, the statements of changes in net assets for each of the two years in the period then ended, and the financial highlights for each of the periods presented. These financial statements and financial highlights are the responsibility of the Fund’s management. Our responsibility is to express an opinion on these financial statements and financial highlights based on our audits.
We conducted our audits in accordance with the standards of the Public Company Accounting Oversight Board (United States). Those standards require that we plan and perform the audit to obtain reasonable assurance about whether the financial statements and financial highlights are free of material misstatement. The Fund is not required to have, nor were we engaged to perform, an audit of its internal control over financial reporting. Our audits included consideration of internal control over financial reporting as a basis for designing audit procedures that are appropriate in the circumstances, but not for the purpose of expressing an opinion on the effectiveness of the Fund’s internal control over financial reporting. Accordingly, we express no such opinion. An audit also includes examining, on a test basis, evidence supporting the amounts and disclosures in the financial statements, assessing the accounting principles used and significant estimates made by management, as well as evaluating the overall financial statement presentation. Our procedures included confirmation of securities owned as of July 31, 2013, by correspondence with the custodian and brokers; where replies were not received from brokers, we performed other auditing procedures. We believe that our audits provide a reasonable basis for our opinion.
In our opinion, such financial statements and financial highlights referred to above present fairly, in all material respects, the financial position of The Income Fund of America as of July 31, 2013, the results of its operations for the year then ended, the changes in its net assets for each of the two years in the period then ended, and the financial highlights for each of the periods presented, in conformity with accounting principles generally accepted in the United States of America.
Deloitte & Touche LLP
Costa Mesa, California
September 9, 2013
| 32 | The Income Fund of America |
| Expense example | unaudited |
As a fund shareholder, you incur two types of costs: (1) transaction costs, such as initial sales charges on purchase payments and contingent deferred sales charges on redemptions (loads), and (2) ongoing costs, including management fees, distribution and service (12b-1) fees, and other expenses. This example is intended to help you understand your ongoing costs (in dollars) of investing in the fund so you can compare these costs with the ongoing costs of investing in other mutual funds. The example is based on an investment of $1,000 invested at the beginning of the period and held for the entire six-month period (February 1, 2013, through July 31, 2013).
Actual expenses:
The first line of each share class in the table on the following page provides information about actual account values and actual expenses. You may use the information in this line, together with the amount you invested, to estimate the expenses that you paid over the period. Simply divide your account value by $1,000 (for example, an $8,600 account value divided by $1,000 = 8.6), then multiply the result by the number in the first line under the heading entitled “Expenses paid during period” to estimate the expenses you paid on your account during this period.
Hypothetical example for comparison purposes:
The second line of each share class in the table on the following page provides information about hypothetical account values and hypothetical expenses based on the actual expense ratio for the share class and an assumed rate of return of 5.00% per year before expenses, which is not the actual return of the share class. The hypothetical account values and expenses may not be used to estimate the actual ending account balance or expenses you paid for the period. You may use this information to compare the ongoing costs of investing in the fund and other funds. To do so, compare this 5.00% hypothetical example with the 5.00% hypothetical examples that appear in the shareholder reports of the other funds.
Notes:
There are some account fees that are charged to certain types of accounts, such as individual retirement accounts and 529 college savings plan accounts (generally, a $10 fee is charged to set up the account and an additional $10 fee is charged to the account annually), that would increase the amount of expenses paid on your account. In addition, retirement plan participants may be subject to certain fees charged by the plan sponsor, and Class F-1, F-2 and 529-F-1 shareholders may be subject to fees charged by financial intermediaries, typically ranging from 0.75% to 1.50% of assets annually depending on services offered. You can estimate the impact of these fees by adding the amount of the fees to the total estimated expenses you paid on your account during the period as calculated above. In addition, your ending account value would be lower by the amount of these fees.
Note that the expenses shown in the table on the following page are meant to highlight your ongoing costs only and do not reflect any transactional costs, such as sales charges (loads). Therefore, the second line of each share class in the table is useful in comparing ongoing costs only and will not help you determine the relative total costs of owning different funds. In addition, if these transactional costs were included, your costs would have been higher.
| The Income Fund of America | 33 |
| Beginning account value 2/1/2013 | Ending account value 7/31/2013 | Expenses paid during period* | Annualized expense ratio | |||||||||||||
| Class A — actual return | $ | 1,000.00 | $ | 1,071.91 | $ | 2.93 | .57 | % | ||||||||
| Class A — assumed 5% return | 1,000.00 | 1,021.97 | 2.86 | .57 | ||||||||||||
| Class B — actual return | 1,000.00 | 1,068.15 | 6.82 | 1.33 | ||||||||||||
| Class B — assumed 5% return | 1,000.00 | 1,018.20 | 6.66 | 1.33 | ||||||||||||
| Class C — actual return | 1,000.00 | 1,067.91 | 7.02 | 1.37 | ||||||||||||
| Class C — assumed 5% return | 1,000.00 | 1,018.00 | 6.85 | 1.37 | ||||||||||||
| Class F-1 — actual return | 1,000.00 | 1,071.73 | 3.34 | .65 | ||||||||||||
| Class F-1 — assumed 5% return | 1,000.00 | 1,021.57 | 3.26 | .65 | ||||||||||||
| Class F-2 — actual return | 1,000.00 | 1,072.82 | 2.06 | .40 | ||||||||||||
| Class F-2 — assumed 5% return | 1,000.00 | 1,022.81 | 2.01 | .40 | ||||||||||||
| Class 529-A — actual return | 1,000.00 | 1,071.49 | 3.44 | .67 | ||||||||||||
| Class 529-A — assumed 5% return | 1,000.00 | 1,021.47 | 3.36 | .67 | ||||||||||||
| Class 529-B — actual return | 1,000.00 | 1,067.35 | 7.48 | 1.46 | ||||||||||||
| Class 529-B — assumed 5% return | 1,000.00 | 1,017.55 | 7.30 | 1.46 | ||||||||||||
| Class 529-C — actual return | 1,000.00 | 1,067.16 | 7.43 | 1.45 | ||||||||||||
| Class 529-C — assumed 5% return | 1,000.00 | 1,017.60 | 7.25 | 1.45 | ||||||||||||
| Class 529-E — actual return | 1,000.00 | 1,069.87 | 4.72 | .92 | ||||||||||||
| Class 529-E — assumed 5% return | 1,000.00 | 1,020.23 | 4.61 | .92 | ||||||||||||
| Class 529-F-1 — actual return | 1,000.00 | 1,072.16 | 2.31 | .45 | ||||||||||||
| Class 529-F-1 — assumed 5% return | 1,000.00 | 1,022.56 | 2.26 | .45 | ||||||||||||
| Class R-1 — actual return | 1,000.00 | 1,067.45 | 7.13 | 1.39 | ||||||||||||
| Class R-1 — assumed 5% return | 1,000.00 | 1,017.90 | 6.95 | 1.39 | ||||||||||||
| Class R-2 — actual return | 1,000.00 | 1,067.98 | 6.92 | 1.35 | ||||||||||||
| Class R-2 — assumed 5% return | 1,000.00 | 1,018.10 | 6.76 | 1.35 | ||||||||||||
| Class R-3 — actual return | 1,000.00 | 1,070.24 | 4.83 | .94 | ||||||||||||
| Class R-3 — assumed 5% return | 1,000.00 | 1,020.13 | 4.71 | .94 | ||||||||||||
| Class R-4 — actual return | 1,000.00 | 1,071.71 | 3.29 | .64 | ||||||||||||
| Class R-4 — assumed 5% return | 1,000.00 | 1,021.62 | 3.21 | .64 | ||||||||||||
| Class R-5 — actual return | 1,000.00 | 1,073.17 | 1.75 | .34 | ||||||||||||
| Class R-5 — assumed 5% return | 1,000.00 | 1,023.11 | 1.71 | .34 | ||||||||||||
| Class R-6 — actual return | 1,000.00 | 1,073.38 | 1.49 | .29 | ||||||||||||
| Class R-6 — assumed 5% return | 1,000.00 | 1,023.36 | 1.45 | .29 | ||||||||||||
| * | The “expenses paid during period” are equal to the “annualized expense ratio,” multiplied by the average account value over the period, multiplied by the number of days in the period, and divided by 365 (to reflect the one-half year period). |
| Tax information | unaudited |
We are required to advise you of the federal tax status of certain distributions received by shareholders during the fiscal year. The fund hereby designates the following amounts for the fund’s fiscal year ended July 31, 2013:
| Qualified dividend income | $2,374,470,000 | |
| Corporate dividends received deduction | $1,525,095,000 | |
| U.S. government income that may be exempt from state taxation | $36,481,000 |
Individual shareholders should refer to their Form 1099 or other tax information, which will be mailed in January 2014, to determine the calendar year amounts to be included on their 2013 tax returns. Shareholders should consult their tax advisors.
| 34 | The Income Fund of America |
Board of trustees and other officers
“Independent” trustees1
| Name and age | Year first elected a trustee of the fund2 | Principal occupation(s) during past five years | Number of portfolios in fund complex3 overseen by trustee | Other directorships4 held by trustee | ||||
| William H. Baribault, 68 | 2012 | Chairman of the Board and CEO, Oakwood Enterprises (private investment and consulting) | 68 | None | ||||
| Vanessa C. L. Chang, 61 | 2012 | Director, EL & EL Investments (real estate) | 6 | Edison International; Transocean Ltd. | ||||
| Linda Griego, 65 | 2012 | President and CEO, Griego Enterprises, Inc. (business management company); President, Zapgo Entertainment LLC (television production company focused on programming for the Latino market) | 3 | AECOM Technology Corporation; CBS Corporation | ||||
| Leonade D. Jones, 65 | 1993 | Retired; former Treasurer, The Washington Post Company (1987–1996) | 9 | None | ||||
| William D. Jones, 58 | 2008 | Real estate developer/owner, President and CEO, CityLink Investment Corporation (acquires, develops and manages real estate ventures in selected urban communities) and City Scene Management Company (provides commercial asset and property management services) | 7 | Sempra Energy | ||||
| James J. Postl, 67 | 2008 | Retired; former President and CEO, Pennzoil-Quaker State Company (automotive products and services) (1998–2002) | 3 | Pulte, Inc. | ||||
| Margaret Spellings, 55 | 2012 | President, George W. Bush Foundation; former President and CEO, Margaret Spellings & Company (public policy and strategic consulting); former President, U.S. Chamber Foundation and Senior Advisor to the President and CEO, U.S. Chamber of Commerce; former U.S. Secretary of Education, U.S. Department of Education | 68 | None | ||||
| Isaac Stein, 66 Chairman of the Board (Independent and Non-Executive) | 2004 | President, Waverley Associates (private investment fund); Chairman Emeritus of the Board of Trustees, Stanford University | 3 | Alexza Pharmaceuticals, Inc.; Maxygen, Inc. |
Robert A. Fox, John Lillie and John G. McDonald have retired from the board. Mr. Fox was first elected a trustee of the fund in 1972, Mr. Lillie in 2003 and Prof. McDonald in 1976. The trustees thank Messrs. Fox and Lillie and Prof. McDonald for their dedication and service to the fund.
“Interested” trustee5,6
| Name, age and position with fund | Year first elected a trustee or officer of the fund2 | Principal occupation(s) during past five years and positions held with affiliated entities or the principal underwriter of the fund | Number of portfolios in fund complex3 overseen by trustee | Other directorships4 held by trustee | ||||
| Hilda L. Applbaum, 52 Vice Chairman of the Board | 1998 | Senior Vice President — Capital World Investors, Capital Research and Management Company | 1 | None |
The fund’s statement of additional information includes further details about fund trustees and is available without charge upon request by calling American Funds Service Company at (800) 421- 4225 or by visiting the American Funds website at americanfunds.com. The address for all trustees and officers of the fund is 333 South Hope Street, Los Angeles, CA 90071, Attention: Secretary.
See page 36 for footnotes.
| The Income Fund of America | 35 |
Other officers6
| Name, age and position with fund | Year first elected an officer of the fund2 | Principal occupation(s) during past five years and positions held with affiliated entities or the principal underwriter of the fund | ||
| David C. Barclay, 56 President | 1998 | Senior Vice President — Fixed Income, Capital Research and Management Company; Director, Capital Research and Management Company | ||
| Dina N. Perry, 67 Senior Vice President | 1994 | Senior Vice President — Capital World Investors, Capital Research and Management Company; Director, Capital Research and Management Company | ||
| Paul F. Roye, 59 Senior Vice President | 2007 | Senior Vice President — Fund Business Management Group, Capital Research and Management Company; Director, American Funds Service Company7 | ||
| Andrew B. Suzman, 46 Senior Vice President | 2004 | Senior Vice President — Capital World Investors, Capital Research Company;7 Senior Vice President — Capital World Investors, Capital Bank and Trust Company;7 Director, American Funds Distributors, Inc.;7 Director, Capital Strategy Research, Inc.7 | ||
| Joanna F. Jonsson, 50 Vice President | 2006 | Director, Capital Research and Management Company; Senior Vice President — Capital World Investors, Capital Research Company;7 Director, Capital International Limited7 | ||
| Donald H. Rolfe, 41 Vice President | 2012 | Chief Compliance Officer, Capital Research Company;7 Chief Compliance Officer, Capital Research and Management Company; Vice President and Senior Counsel — Fund Business Management Group, Capital Research and Management Company | ||
| John H. Smet, 57 Vice President | 1994 | Senior Vice President — Fixed Income, Capital Research and Management Company; Director, The Capital Group Companies, Inc.7 | ||
| Steven T. Watson, 58 Vice President | 2006 | Director, Capital Research Company;7 Senior Vice President — Capital World Investors, Capital Research Company;7 Senior Vice President — Capital World Investors, Capital Bank and Trust Company7 | ||
| Patrick F. Quan, 55 Secretary | 1986 | Vice President — Fund Business Management Group, Capital Research and Management Company | ||
| Jeffrey P. Regal, 42 Treasurer | 2011 | Vice President — Fund Business Management Group, Capital Research and Management Company | ||
| Julie E. Lawton, 40 Assistant Secretary | 2009 | Assistant Vice President — Fund Business Management Group, Capital Research and Management Company | ||
| Dori Laskin, 62 Assistant Treasurer | 2011 | Vice President — Fund Business Management Group, Capital Research and Management Company | ||
| Ari M. Vinocor, 38 Assistant Treasurer | 2012 | Vice President — Fund Business Management Group, Capital Research and Management Company |
| 1 | The term “independent” trustee refers to a trustee who is not an “interested person” of the fund within the meaning of the Investment Company Act of 1940. |
| 2 | Trustees and officers of the fund serve until their resignation, removal or retirement. |
| 3 | Capital Research and Management Company manages the American Funds. Capital Research and Management Company also manages American Funds Insurance Series,® which is composed of 22 funds and serves as the underlying investment vehicle for certain variable insurance contracts; American Funds Target Date Retirement Series,® which is composed of 10 funds and is available through tax-deferred retirement plans and IRAs; American Funds Portfolio Series,SM which is composed of eight funds; and American Funds College Target Date Series,SM which is composed of seven funds. |
| 4 | This includes all directorships (other than those in the American Funds or other funds managed by Capital Research and Management Company) that are held by each trustee as a trustee or director of a public company or a registered investment company. |
| 5 | “Interested persons” within the meaning of the Investment Company Act of 1940, on the basis of their affiliation with the fund’s investment adviser, Capital Research and Management Company, or affiliated entities (including the fund’s principal underwriter). |
| 6 | All of the officers listed are officers and/or directors/trustees of one or more of the other funds for which Capital Research and Management Company serves as investment adviser. |
| 7 | Company affiliated with Capital Research and Management Company. |
| 36 | The Income Fund of America |
Office of the fund
One Market
Steuart Tower, Suite 2000
San Francisco, CA 94105-1409
Investment adviser
Capital Research and Management Company
333 South Hope Street
Los Angeles, CA 90071-1406
6455 Irvine Center Drive
Irvine, CA 92618
Transfer agent for shareholder accounts
American Funds Service Company
(Write to the address near you.)
P.O. Box 6007
Indianapolis, IN 46206-6007
P.O. Box 2280
Norfolk, VA 23501-2280
Custodian of assets
JPMorgan Chase Bank
270 Park Avenue
New York, NY 10017-2070
Counsel
Bingham McCutchen LLP
355 South Grand Avenue, Suite 4400
Los Angeles, CA 90071-3106
Independent registered public accounting firm
Deloitte & Touche LLP
695 Town Center Drive
Suite 1200
Costa Mesa, CA 92626-7188
Principal underwriter
American Funds Distributors, Inc.
333 South Hope Street
Los Angeles, CA 90071-1406
Investors should carefully consider investment objectives, risks, charges and expenses. This and other important information is contained in the fund prospectus and summary prospectus, which can be obtained from your financial professional and should be read carefully before investing. You may also call American Funds Service Company (AFS) at (800) 421-4225 or visit the American Funds website at americanfunds.com.
“American Funds Proxy Voting Procedures and Principles” — which describes how we vote proxies relating to portfolio securities — is available on the American Funds website or upon request by calling AFS. The fund files its proxy voting record with the U.S. Securities and Exchange Commission (SEC) for the 12 months ended June 30 by August 31. The proxy voting record is available free of charge on the SEC website at sec.gov and on the American Funds website.
A complete July 31, 2013, portfolio of The Income Fund of America’s investments is available free of charge by calling AFS or visiting the SEC website (where it is part of Form N-CSR).
The Income Fund of America files a complete list of its portfolio holdings with the SEC for the first and third quarters of each fiscal year on Form N-Q. This filing is available free of charge on the SEC website. You may also review or, for a fee, copy this filing at the SEC’s Public Reference Room in Washington, D.C. Additional information regarding the operation of the Public Reference Room may be obtained by calling the SEC’s Office of Investor Education and Advocacy at (800) SEC-0330. Additionally, the list of portfolio holdings is available by calling AFS.
This report is for the information of shareholders of The Income Fund of America, but it also may be used as sales literature when preceded or accompanied by the current prospectus or summary prospectus, which gives details about charges, expenses, investment objectives and operating policies of the fund. If used as sales material after September 30, 2013, this report must be accompanied by an American Funds statistical update for the most recently completed calendar quarter.
The American Funds Advantage
Since 1931, American Funds, part of Capital Group, has helped investors pursue long-term investment success. Our consistent approach — in combination with The Capital SystemSM — has resulted in a superior long-term track record.
Aligned with investor success
We base our decisions on a long-term perspective, which we believe aligns our goals with the interests of our clients. Our portfolio managers average 25 years of investment experience, including 20 years at our company, reflecting a career commitment to our long-term approach.1
The Capital SystemSM
Our investment process, The Capital System, combines individual accountability with teamwork. Each fund is divided into portions that are managed independently by investment professionals with diverse backgrounds, ages and investment approaches. An extensive global research effort is the backbone of our system.
Superior long-term track record
Our equity funds have beaten their Lipper peer indexes in 90% of 10-year periods and 96% of 20-year periods. Our fixed-income funds have beaten their Lipper indexes in 58% of 10-year periods and 63% of 20-year periods.2 Our fund management fees have been among the lowest in the industry.3
| 1 | Portfolio manager experience as of December 31, 2012. |
| 2 | Based on Class A share results for rolling periods through December 31, 2012. Periods covered are the shorter of the fund’s lifetime or since the comparable Lipper index inception date. |
| 3 | Based on management fees for the 20-year period ended December 31, 2012, versus comparable Lipper categories, excluding funds of funds. |

ITEM 2 – Code of Ethics
The Registrant has adopted a Code of Ethics that applies to its Principal Executive Officer and Principal Financial Officer. The Registrant undertakes to provide to any person without charge, upon request, a copy of the Code of Ethics. Such request can be made to American Funds Service Company at 800/421-9225 or to the Secretary of the Registrant, One Market, Steuart Tower, Suite 2000, San Francisco, California 94105.
ITEM 3 – Audit Committee Financial Expert
The Registrant’s board has determined that Vanessa C.L. Chang, a member of the Registrant’s audit committee, is an “audit committee financial expert” and "independent," as such terms are defined in this Item. This designation will not increase the designee’s duties, obligations or liability as compared to his or her duties, obligations and liability as a member of the audit committee and of the board, nor will it reduce the responsibility of the other audit committee members. There may be other individuals who, through education or experience, would qualify as "audit committee financial experts" if the board had designated them as such. Most importantly, the board believes each member of the audit committee contributes significantly to the effective oversight of the Registrant’s financial statements and condition.
ITEM 4 – Principal Accountant Fees and Services
| Registrant: | ||||
| a) Audit Fees: | ||||
| 2012 | $120,000 | |||
| 2013 | $134,000 | |||
| b) Audit-Related Fees: | ||||
| 2012 | $22,000 | |||
| 2013 | $25,000 | |||
| The audit-related fees consist of assurance and related services relating to the examination of the Registrant’s investment adviser conducted in accordance with Statement on Standards for Attestation Engagements Number 16 issued by the American Institute of Certified Public Accountants. | ||||
| c) Tax Fees: | ||||
| 2012 | $7,000 | |||
| 2013 | $7,000 | |||
| The tax fees consist of professional services relating to the preparation of the Registrant’s tax returns including returns relating to the Registrant’s investments in non-U.S. jurisdictions. | ||||
| d) All Other Fees: | ||||
| 2012 | None | |||
| 2013 | None | |||
| Adviser and affiliates (includes only fees for non-audit services billed to the adviser and affiliates for engagements that relate directly to the operations and financial reporting of the Registrant and were subject to the pre-approval policies described below): | ||||
| a) Audit Fees: | ||||
| Not Applicable | ||||
| b) Audit-Related Fees: | ||||
| 2012 | $763,000 | |||
| 2013 | $1,280,000 | |||
| The audit-related fees consist of assurance and related services relating to the examination of the Registrant’s transfer agent, principal underwriter and investment adviser conducted in accordance with Statement on Standards for Attestation Engagements Number 16 issued by the American Institute of Certified Public Accountants. | ||||
| c) Tax Fees: | ||||
| 2012 | $39,000 | |||
| 2013 | $28,000 | |||
| The tax fees consist of consulting services relating to the Registrant’s investments. | ||||
| d) All Other Fees: | ||||
| 2012 | $2,000 | |||
| 2013 | $2,000 | |||
| The other fees consist of subscription services related to an accounting research tool. | ||||
All audit and permissible non-audit services that the Registrant’s audit committee considers compatible with maintaining the independent registered public accounting firm’s independence are required to be pre-approved by the committee. The pre-approval requirement will extend to all non-audit services provided to the Registrant, the investment adviser, and any entity controlling, controlled by, or under common control with the investment adviser that provides ongoing services to the Registrant, if the engagement relates directly to the operations and financial reporting of the Registrant. The committee will not delegate its responsibility to pre-approve these services to the investment adviser. The committee may delegate to one or more committee members the authority to review and pre-approve audit and permissible non-audit services. Actions taken under any such delegation will be reported to the full committee at its next meeting. The pre-approval requirement is waived with respect to non-audit services if certain conditions are met. The pre-approval requirement was not waived for any of the non-audit services listed above provided to the Registrant, adviser and affiliates.
Aggregate non-audit fees paid to the Registrant’s auditors, including fees for all services billed to the Registrant, adviser and affiliates that provide ongoing services to the Registrant, were $1,411,000 for fiscal year 2012 and $1,718,000 for fiscal year 2013. The non-audit services represented by these amounts were brought to the attention of the committee and considered to be compatible with maintaining the auditors’ independence.
ITEM 5 – Audit Committee of Listed Registrants
Not applicable to this Registrant, insofar as the Registrant is not a listed issuer as defined in Rule 10A-3 under the Securities Exchange Act of 1934.
ITEM 6 – Schedule of Investments
 |
The Income Fund of America® Investment portfolio July 31, 2013 |
As permitted by U.S. Securities and Exchange Commission regulations, “Miscellaneous” securities include holdings in their first year of acquisition that have not previously been publicly disclosed.
| 1 | Security did not produce income during the last 12 months. |
| 2 | Represents an affiliated company as defined under the Investment Company Act of 1940. |
| 3 | Valued under fair value procedures adopted by authority of the board of trustees. The total value of all such securities was $218,340,000, which represented .26% of the net assets of the fund. |
| 4 | Acquired through a private placement transaction exempt from registration under the Securities Act of 1933. May be subject to legal or contractual restrictions on resale. Further details on these holdings appear below. |
| Cost | Value | Percent of | ||
| Acquisition date(s) | (000) | (000) | net assets | |
| Beech Holdings, LLC | 11/21/2008–2/15/2013 | $ 142,477 | $ 94,574 | .11% |
| Revel AC, Inc. | 2/14/2011–10/25/2012 | 56,224 | 26,406 | .03 |
| CEVA Group PLC, Series A-2, 2.268% convertible preferred | 5/2/2013 | 13,171 | 12,370 | .02 |
| NewPage Holdings Inc. | 9/17/2009–9/9/2011 | 24,366 | 12,114 | .01 |
| Total restricted securities | $236,238 | $145,464 | .17% |
| 5 | Acquired in a transaction exempt from registration under Rule 144A or section 4(2) of the Securities Act of 1933. May be resold in the U.S. in transactions exempt from registration, normally to qualified institutional buyers. The total value of all such securities was $5,027,287,000, which represented 6.04% of the net assets of the fund. |
| 6 | Coupon rate may change periodically. |
| 7 | Payment in kind; the issuer has the option of paying additional securities in lieu of cash. |
| 8 | Principal payments may be made periodically. Therefore, the effective maturity date may be earlier than the stated maturity date. |
| 9 | Loan participations and assignments; may be subject to legal or contractual restrictions on resale. The total value of all such loans was $957,538,000, which represented 1.15% of the net assets of the fund. |
| 10 | Scheduled interest and/or principal payment was not received. |
| 11 | Index-linked bond whose principal amount moves with a government price index. |
| 12 | Step bond; coupon rate will increase at a later date. |
Key to abbreviations
ADR = American Depositary Receipts
FDR = Fiduciary Depositary Receipts
GDR = Global Depositary Receipts
Investments are not FDIC-insured, nor are they deposits of or guaranteed by a bank or any other entity, so they may lose value.
Investors should carefully consider investment objectives, risks, charges and expenses. This and other important information is contained in the fund prospectus and summary prospectus, which can be obtained from your financial professional and should be read carefully before investing. You may also call American Funds Service Company (AFS) at (800) 421-4225 or visit the American Funds website at americanfunds.com.
MFGEFPX-006-0913O-S37723
REPORT OF INDEPENDENT REGISTERED PUBLIC ACCOUNTING FIRM ON INVESTMENT PORTFOLIO
To the Shareholders and Board of Trustees of
The Income Fund of America:
We have audited, in accordance with the standards of the Public Company Accounting Oversight Board (United States), the financial statements of The Income Fund of America (the “Fund”) as of July 31, 2013, and for the year then ended and have issued our report thereon dated September 9, 2013, which report and financial statements are included in Item 1 of this Certified Shareholder Report on Form N-CSR. Our audit also included the Fund’s investment portfolio (the “Schedule”) as of July 31, 2013, appearing in Item 6 of this Form N-CSR. This Schedule is the responsibility of the Fund’s management. Our responsibility is to express an opinion based on our audit. In our opinion, the Schedule referred to above, when considered in relation to the basic financial statements taken as a whole of the Fund referred to above, presents fairly, in all material respects, the information set forth therein.
DELOITTE & TOUCHE LLP
Costa Mesa, California
September 9, 2013
ITEM 7 – Disclosure of Proxy Voting Policies and Procedures for Closed-End Management Investment Companies
Not applicable to this Registrant, insofar as the Registrant is not a closed-end management investment company.
ITEM 8 – Portfolio Managers of Closed-End Management Investment Companies
Not applicable to this Registrant, insofar as the Registrant is not a closed-end management investment company.
ITEM 9 – Purchases of Equity Securities by Closed-End Management Investment Company and Affiliated Purchasers
Not applicable to this Registrant, insofar as the Registrant is not a closed-end management investment company.
ITEM 10 – Submission of Matters to a Vote of Security Holders
There have been no material changes to the procedures by which shareholders may recommend nominees to the Registrant’s board of trustees since the Registrant last submitted a proxy statement to its shareholders. The procedures are as follows. The Registrant has a nominating and governance committee comprised solely of persons who are not considered ‘‘interested persons’’ of the Registrant within the meaning of the Investment Company Act of 1940, as amended. The committee periodically reviews such issues as the board’s composition, responsibilities, committees, compensation and other relevant issues, and recommends any appropriate changes to the full board of trustees. While the committee normally is able to identify from its own resources an ample number of qualified candidates, it will consider shareholder suggestions of persons to be considered as nominees to fill future vacancies on the board. Such suggestions must be sent in writing to the nominating and governance committee of the Registrant, c/o the Registrant’s Secretary, and must be accompanied by complete biographical and occupational data on the prospective nominee, along with a written consent of the prospective nominee for consideration of his or her name by the nominating and governance committee.
ITEM 11 – Controls and Procedures
| (a) | The Registrant’s Principal Executive Officer and Principal Financial Officer have concluded, based on their evaluation of the Registrant’s disclosure controls and procedures (as such term is defined in Rule 30a-3 under the Investment Company Act of 1940), that such controls and procedures are adequate and reasonably designed to achieve the purposes described in paragraph (c) of such rule. |
| (b) | There were no changes in the Registrant’s internal controls over financial reporting (as defined in Rule 30a-3(d) under the Investment Company Act of 1940) that occurred during the Registrant’s second fiscal quarter of the period covered by this report that has materially affected, or is reasonably likely to materially affect, the Registrant’s internal control over financial reporting. |
ITEM 12 – Exhibits
| (a)(1) | The Code of Ethics that is the subject of the disclosure required by Item 2 is attached as an exhibit hereto. |
| (a)(2) | The certifications required by Rule 30a-2 of the Investment Company Act of 1940 and Sections 302 and 906 of the Sarbanes-Oxley Act of 2002 are attached as exhibits hereto. |
SIGNATURES
Pursuant to the requirements of the Securities Exchange Act of 1934 and the Investment Company Act of 1940, the Registrant has duly caused this report to be signed on its behalf by the undersigned, thereunto duly authorized.
| THE INCOME FUND OF AMERICA | |
| By /s/ Hilda L. Applbaum | |
Hilda L. Applbaum, Vice Chairman and Principal Executive Officer | |
| Date: September 30, 2013 |
Pursuant to the requirements of the Securities Exchange Act of 1934 and the Investment Company Act of 1940, this report has been signed below by the following persons on behalf of the Registrant and in the capacities and on the dates indicated.
| By /s/ Hilda L. Applbaum |
Hilda L. Applbaum, Vice Chairman and Principal Executive Officer |
| Date: September 30, 2013 |
| By /s/ Jeffrey P. Regal |
Jeffrey P. Regal, Treasurer and Principal Financial Officer |
| Date: September 30, 2013 |