UNITED STATES
SECURITIES AND EXCHANGE COMMISSION
Washington, D.C. 20549
FORM N-CSR
Certified Shareholder Report of
Registered Management Investment Companies
Investment Company Act File Number: 811-01880
The Income Fund of America
(Exact Name of Registrant as Specified in Charter)
One Market, Steuart Tower
Suite 2000
San Francisco, California 94105
(Address of Principal Executive Offices)
Registrant's telephone number, including area code: (415) 421-9360
Date of fiscal year end: July 31
Date of reporting period: July 31, 2014
Michael W. Stockton
The Income Fund of America
One Market, Steuart Tower
Suite 2000
San Francisco, California 94105
(Name and Address of Agent for Service)
Copies to:
Michael Glazer
Bingham McCutchen LLP
355 South Grand Avenue, Suite 4400
Los Angeles, California 90071
(Counsel for the Registrant)
ITEM 1 – Reports to Stockholders

A worldwide
network in pursuit
of income
 | The Income Fund of America®
Annual report
for the year ended
July 31, 2014 |
The Income Fund of America seeks current income while secondarily striving for capital growth through investments in stocks and fixed-income securities.
This fund is one of more than 40 offered by one of the nation’s largest mutual fund families, American Funds, from Capital Group. For more than 80 years, Capital has invested with a long-term focus based on thorough research and attention to risk.
Fund results shown in this report, unless otherwise indicated, are for Class A shares at net asset value. If a sales charge (maximum 5.75%) had been deducted, the results would have been lower. Results are for past periods and are not predictive of results for future periods. Current and future results may be lower or higher than those shown. Share prices and returns will vary, so investors may lose money. Investing for short periods makes losses more likely. Investments are not FDIC-insured, nor are they deposits of or guaranteed by a bank or any other entity, so they may lose value. For current information and month-end results, visit americanfunds.com.
Here are the average annual total returns on a $1,000 investment with all distributions reinvested for periods ended June 30, 2014 (the most recent calendar quarter-end):
| Class A shares | | 1 year | | 5 years | | 10 years |
| | | | | | | |
| Reflecting 5.75% maximum sales charge | | 11.03% | | 13.71% | | 7.14% |
For other share class results, visit americanfunds.com and americanfundsretirement.com.
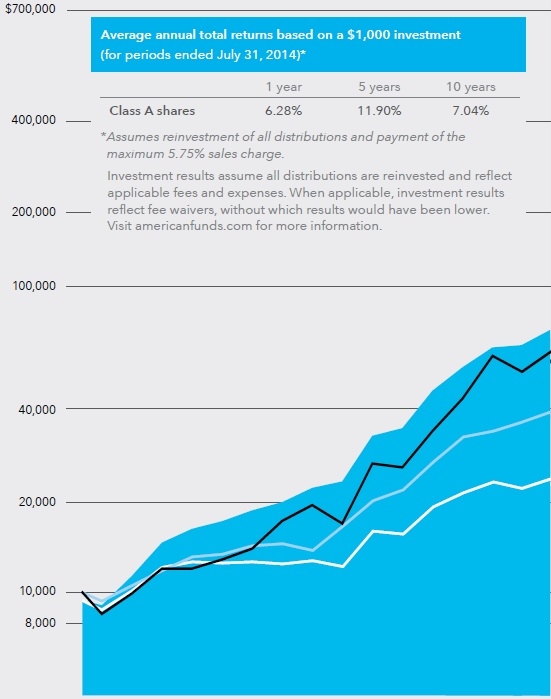
The total annual fund operating expense ratio is 0.57% for Class A shares as of the prospectus dated October 1, 2014 (unaudited).
Investment results assume all distributions are reinvested and reflect applicable fees and expenses. When applicable, investment results reflect fee waivers, without which results would have been lower. Visit americanfunds.com for more information.
The fund’s 30-day yield for Class A shares as of August 31, 2014, calculated in accordance with the U.S. Securities and Exchange Commission (SEC) formula, was 2.67%. The fund’s 12-month distribution rate for Class A shares as of that date was 2.83%. Both reflect the 5.75% maximum sales charge. The SEC yield reflects the rate at which the fund is earning income on its current portfolio of securities while the distribution rate reflects the fund’s past dividends paid to shareholders. Accordingly, the fund’s SEC yield and distribution rate may differ.
The return of principal for bond funds and for funds with significant underlying bond holdings is not guaranteed. Fund shares are subject to the same interest rate, inflation and credit risks associated with the underlying bond holdings. High-yield bonds are subject to greater fluctuations in value and risk of loss of income and principal than investment-grade bonds. Bond ratings, which typically range from AAA/Aaa (highest) to D (lowest), are assigned by credit rating agencies such as Standard & Poor’s, Moody’s and/or Fitch as an indication of an issuer’s creditworthiness. Investing outside the United States may be subject to additional risks, such as currency fluctuations, periods of illiquidity and price volatility. These risks may be heightened in connection with investments in developing countries. Refer to the fund prospectus and the Risk Factors section of this report for more information on these and other risks associated with investing in the fund.

Companies spanning a
variety of sectors, both
in the U.S. and abroad,
helped The Income Fund
of America produce solid
results for the period.
Fellow investors:
For the 12 months ended July 31, 2014, The Income Fund of America (IFA) advanced 12.78% for those who reinvested quarterly dividends totaling 66 cents per share that were paid during the period. The fund’s return trailed the broader equity market, as measured by the unmanaged Standard & Poor’s 500 Composite Index (S&P 500), which rose 16.92%. The fund significantly outpaced the 3.97% return of the bond market, as represented by the unmanaged Barclays U.S. Aggregate Index. IFA also registered a considerably higher gain than its peers in the Lipper Income Funds Index, which climbed 8.77%.
Investors will note that the fund’s lifetime return has surpassed its benchmarks for the same period, as shown in the table below.
Uncertainty amidst improvement
The fund’s fiscal year began on a relatively weak note for stocks as investors anticipated
Results at a glance
For periods ended July 31, 2014, with all distributions reinvested
| | | Cumulative | | |
| | | total returns | | Average annual total returns |
| | | 1 year | | 5 years | | 10 years | | Lifetime1 |
| | | | | | | | | |
| The Income Fund of America (Class A shares) | | 12.78 | % | | 13.24 | % | | 7.67 | % | | 11.41 | % |
| Standard & Poor’s 500 Composite Index2 | | 16.92 | | | 16.78 | | | 7.99 | | | 10.99 | |
| Lipper Income Funds Index | | 8.77 | | | 8.87 | | | 5.88 | | | — | 3 |
| Barclays U.S. Aggregate Index2 | | 3.97 | | | 4.47 | | | 4.80 | | | 7.76 | 4 |
| Consumer Price Index (inflation)5 | | 1.99 | | | 2.04 | | | 2.32 | | | 4.13 | |
| 1 | Since December 1, 1973, when Capital Research and Management Company became the fund’s investment adviser. |
| 2 | The market indexes are unmanaged and, therefore, have no expenses. Investors cannot invest directly in an index. |
| 3 | The inception date for the index was December 31, 1988. |
| 4 | From December 1, 1973, through December 31, 1975, the Barclays U.S. Government/Credit Index was used because the Barclays U.S. Aggregate Index did not yet exist. |
| 5 | Computed from data supplied by the U.S. Department of Labor, Bureau of Labor Statistics. |
| The Income Fund of America | 1 |
the winding down of the Federal Reserve’s quantitative easing program. By September the outlook began to improve, and the calendar year ended with stocks registering strong gains in developed economies. However, increased geopolitical instability — fueled by Russia’s incursion into Ukraine and renewed violence in the Middle East — roiled markets during the second half of the fund’s fiscal year.
Yet in spite of these events, many companies in the U.S. and elsewhere made steady progress and stock prices increased during the period, with the S&P 500 reaching record highs. Indeed, the S&P 500 notched its sixth consecutive quarterly rise as the second calendar quarter ended on June 30, 2014. While first-quarter U.S. GDP contracted by an annualized 2.1%, signs of improving economic conditions strengthened confidence in the country’s ability to recover from a harsh winter.
The bond market benefited from the uncertainty, which bolstered demand for U.S. Treasury securities and investment-grade bonds. Corporate bond sales continued at a rapid pace, setting a new annual record in 2013, and remained relatively strong through the fund’s fiscal year-end.
Broad support from stock holdings
Companies spanning a variety of sectors and industries contributed to fund returns during the period. Information technology and pharmaceutical firms provided some of the strongest support on an absolute basis.
Over the past few years, the technology sector has become a significant source of dividends, and many firms now provide income as well as the potential for capital appreciation. Microsoft, one of the fund’s top 10 holdings, rose 35.60%. Cisco Systems — which designs, manufactures and sells networking equipment — also played a role in the fund. Cisco is one of a growing number of technology firms that has shifted from a reliance on one-time sales to a subscription/service model that can generate recurring revenue and provide cash that can be used to sustain and grow dividends.
The pharmaceuticals industry provided the largest lift to the fund’s absolute returns, with three global companies among the top five contributors. During the past several years, health care has become the largest sector weighting in the fund as we have invested in a number of select firms that have sustainable growth prospects due to strong product pipelines, solid balance sheets and healthy cash flow. British drug maker AstraZeneca led the way, advancing 43.60%. The company has several new products in development and continues to have strong sales in emerging markets. The fund’s largest holding during the period, Merck, climbed 17.79%, and Bristol-Myers Squibb, another top 10 holding, rose 17.07%.
Strength overseas
The fund can invest up to 25% of its assets in stocks of issuers domiciled outside of the United States, and during the past fiscal year several of our European holdings contributed to the fund’s returns. They included Orange, a French multinational telecommunications company, and National Grid, a British multinational electricity and gas utility firm, which was up 20.38%. Many European companies have a strong dividend culture, and the region offers
Striking a balance between return and volatility
The Income Fund of America takes a prudent path to income. Looking back 10 years, the fund has provided higher returns than bonds and the average income fund, and lower volatility than stocks. In addition, as can be seen on page 1, the fund’s lifetime results surpass those of both the stock and bond indexes.
For the 10-year period ended July 31, 2014
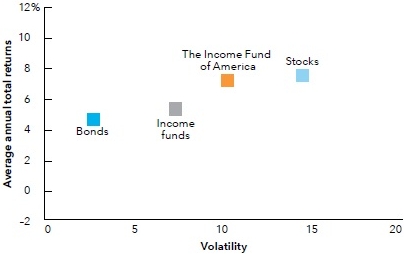
Sources: Stocks — S&P 500; Bonds — Barclays U.S. Aggregate Index; Income funds — Lipper Income Funds Index. Returns include reinvestment of all distributions. Volatility is calculated at net asset value by Lipper using annualized standard deviation (based on monthly returns), a measure of how returns over time have varied from the mean; a lower number signifies lower volatility.
| 2 | The Income Fund of America |
opportunities for income investors. Some investments, of course, detracted from fund returns during the period. Energy firm Diamond Offshore Drilling declined 30.62%. Finnish tire maker Nokian Renkaat, which derives about a third of its sales from Russia, fell 22.16% on weakened consumer demand in that country amid the Ukraine crisis.
Bonds play their part
The fund’s bond holdings made up 19.4% of the portfolio, down from 21.9% a year ago. This allocation to bonds is relatively low for IFA. The fund’s flexible mandate enables us to direct assets toward the types of income-producing securities that we believe offer attractive risk/reward profiles. Based on those criteria, we have, broadly speaking, viewed stocks as more appealing than bonds and directed a greater share of assets toward them.
As in recent years, high-yield bonds provided significant income, as well as return. The appreciation of high-yield bonds is partly attributable to an improving economy, which usually bolsters prices for the bonds because it makes it more likely that issuers will be able to service their debt. Higher quality bonds also contributed to the fund’s return as the continuing recovery in the U.S. and robust corporate earnings buoyed markets. Higher quality bonds play a pivotal role in the fund’s portfolio by providing a measure of stability during market volatility.
Outlook
We are seeing steady but uneven improvement in the U.S. economy, although the progress can sometimes seem slow. Abroad, China’s ongoing economic sluggishness continues to merit attention, and the recovery in Europe remains fragile. A number of emerging markets experienced tumult during the past year, but we believe many will continue to experience significant growth and become a market for goods and services for companies around the world.
Regardless of the economic issues or investment environment, we continue to build the portfolio on a company-by-company basis. Our investment selections take into account numerous factors, but the primary focus is on company fundamentals. We remain optimistic that we will continue to find investments that can provide investors with income and the potential for capital appreciation.
We thank you for your commitment to The Income Fund of America.
Cordially,

Hilda L. Applbaum
Vice Chairman and Principal Executive Officer

David C. Barclay
President
September 10, 2014
For current information about the fund, visit americanfunds.com.
A lifetime of high current income
The Income Fund of America’s 12-month dividend yield vs. benchmarks
Year ended July 31
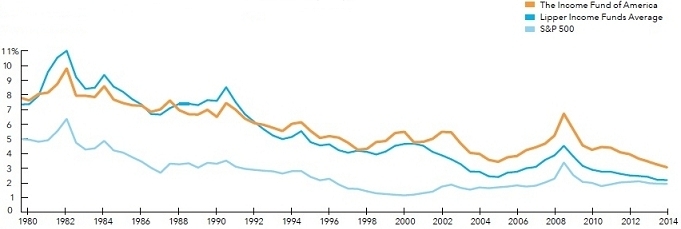
All numbers calculated by Lipper.
| The Income Fund of America | 3 |
The value of a long-term perspective
Fund results shown are for Class A shares and reflect deduction of the maximum sales charge of 5.75% on the $10,000 investment.1 Thus, the net amount invested was $9,425.2 Results are for past periods and are not predictive of results for future periods. Current and future results may be lower or higher than those shown. Share prices and returns will vary, so investors may lose money. For current information and month-end results, visit americanfunds.com.
The results shown are before taxes on fund distributions and sale of fund shares.
| 1 | As outlined in the prospectus, the sales charge is reduced for accounts (and aggregated investments) of $25,000 or more and is eliminated for purchases of $1 million or more. There is no sales charge on dividends or capital gain distributions that are reinvested in additional shares. |
| 2 | The maximum initial sales charge was 8.5% prior to July 1, 1988. |
| 3 | For the period December 1, 1973 (when Capital Research and Management Company became the fund’s investment advisor), through July 31, 1974. |
| 4 | Includes reinvested dividends of $401,476 and reinvested capital gain distributions of $131,223. |
| 5 | The indexes are unmanaged and, therefore, have no expenses. Investors cannot invest directly in an index. |
| 6 | From December 1, 1973, through December 31, 1975, the Barclays U.S. Government/Credit Index was used because the Barclays U.S. Aggregate Index did not exist. |
| 7 | Includes capital gain distributions of $24,067, but does not reflect income dividends of $70,008 taken in cash. |
| 8 | From April 1990 to September 1994 and from September 2003 to March 2009, the fund accrued dividends daily but paid quarterly. Dividends reflect quarterly dividends actually paid during the period, while year-end values are adjusted for cumulative dividends accrued but not yet paid. |
| Year ended July 31 | | 19743 | | 1975 | | 1976 | | 1977 | | 1978 | | 1979 | | 1980 | | 1981 | | 1982 | | 1983 | | 1984 | | 1985 | | 1986 | | 1987 | | 1988 | |
| VALUE OF DIVIDENDS | | (dollars in thousands) | | | | | | | | | | | | | | | | | | | | | | | |
| Dividends in cash8 | | $ | 0.3 | | 0.7 | | 0.9 | | 0.8 | | 0.8 | | 0.9 | | 1.0 | | 1.0 | | 1.2 | | 1.3 | | 1.3 | | 1.4 | | 1.5 | | 1.6 | | 1.5 | |
| Dividends reinvested8 | | $ | 0.3 | | 0.8 | | 1.0 | | 1.0 | | 1.1 | | 1.3 | | 1.5 | | 1.7 | | 2.2 | | 2.5 | | 2.9 | | 3.4 | | 3.9 | | 4.4 | | 4.5 | |
| | | | | | | | | | | | | | | | | | | | | | | | | | | | | | | | | |
| VALUE OF INVESTMENT | | (dollars in thousands) | | | | | | | | | | | | | | | | | | | | | | | |
| Dividends in cash8 | | $ | 8.8 | | 10.1 | | 12.2 | | 12.7 | | 12.6 | | 12.7 | | 12.5 | | 12.8 | | 12.3 | | 16.1 | | 15.7 | | 19.4 | | 21.7 | | 23.6 | | 22.3 | |
| Dividends reinvested8 | | $ | 9.1 | | 11.4 | | 14.8 | | 16.4 | | 17.4 | | 18.9 | | 20.2 | | 22.5 | | 23.7 | | 33.7 | | 35.7 | | 47.7 | | 57.1 | | 66.7 | | 67.8 | |
| | | | | | | | | | | | | | | | | | | | | | | | | | | | | | | | | |
| IFA TOTAL RETURN | | | (9.1 | )% | 25.3 | | 29.5 | | 11.1 | | 6.2 | | 8.7 | | 6.6 | | 11.5 | | 5.2 | | 42.3 | | 6.0 | | 33.5 | | 19.9 | | 16.7 | | 1.7 | |
| 4 | The Income Fund of America |
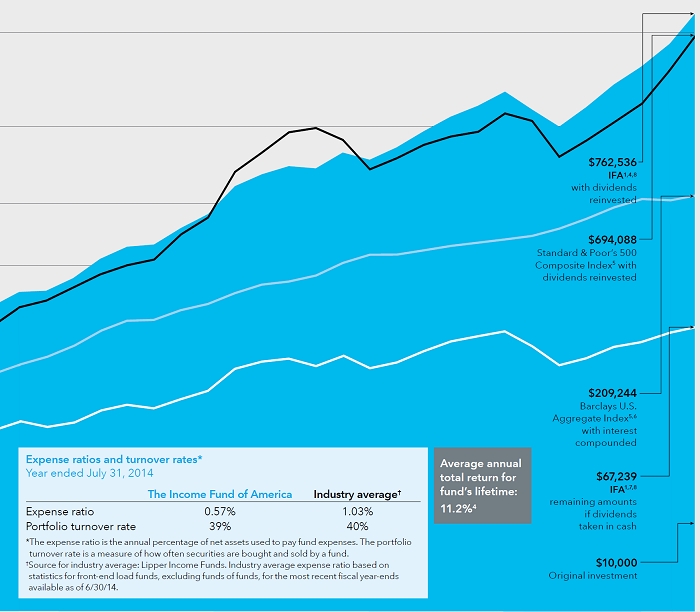
How a $10,000 investment has grown
There always have been reasons not to invest. If you look beyond the negative headlines, however, you will find that despite occasional stumbles, financial markets have tended to reward investors over the long term. Active management — bolstered by experience and careful research — can add even more value. As the chart below shows, over its lifetime, The Income Fund of America (IFA) has delivered higher returns than both the broader stock and bond markets. Dividends, particularly when reinvested, have accounted for a large portion of the fund’s overall results.
| 1989 | | 1990 | | 1991 | | 1992 | | 1993 | | 1994 | | 1995 | | 1996 | | 1997 | | 1998 | | 1999 | | 2000 | | 2001 | | 2002 | | 2003 | | 2004 | | 2005 | | 2006 | | 2007 | | 2008 | | 2009 | | 2010 | | 2011 | | 2012 | | 2013 | | 2014 |
| | | | | | | | | | | | | | | | | | | | | | | | | | | | | | | | | | | | | | | | | | | | | | | | | | | |
| 1.7 | | 1.6 | | 1.8 | | 1.7 | | 1.7 | | 1.7 | | 1.8 | | 1.8 | | 2.0 | | 2.0 | | 2.2 | | 2.3 | | 2.2 | | 2.3 | | 2.1 | | 1.9 | | 1.9 | | 2.2 | | 2.7 | | 2.8 | | 2.5 | | 2.1 | | 2.3 | | 2.2 | | 2.1 | | 2.1 |
| 5.3 | | 5.3 | | 6.3 | | 6.6 | | 7.0 | | 7.5 | | 8.0 | | 8.6 | | 10.1 | | 10.5 | | 12.4 | | 13.7 | | 13.9 | | 14.9 | | 14.3 | | 14.1 | | 13.9 | | 17.0 | | 22.2 | | 23.7 | | 22.2 | | 19.6 | | 23.2 | | 22.6 | | 22.9 | | 23.0 |
| | | | | | | | | | | | | | | | | | | | | | | | | | | | | | | | | | | | | | | | | | | | | | | | | | | |
| 25.6 | | 24.4 | | 25.4 | | 28.4 | | 29.9 | | 28.8 | | 31.6 | | 34.0 | | 41.7 | | 44.4 | | 45.6 | | 42.3 | | 46.5 | | 41.4 | | 44.1 | | 49.1 | | 54.0 | | 57.0 | | 61.9 | | 53.5 | | 44.0 | | 48.5 | | 53.2 | | 55.4 | | 61.6 | | 67.2 |
| 83.7 | | 84.6 | | 95.0 | | 113.2 | | 126.7 | | 129.2 | | 150.4 | | 170.6 | | 220.6 | | 245.5 | | 264.7 | | 259.2 | | 299.4 | | 280.4 | | 314.6 | | 364.1 | | 415.5 | | 456.1 | | 518.4 | | 469.2 | | 409.6 | | 471.4 | | 540.6 | | 586.3 | | 676.2 | | 762.5 |
| | | | | | | | | | | | | | | | | | | | | | | | | | | | | | | | | | | | | | | | | | | | | | | | | | | |
| 23.4 | | 1.1 | | 12.3 | | 19.1 | | 11.9 | | 2.0 | | 16.4 | | 13.5 | | 29.3 | | 11.3 | | 7.8 | | (2.1) | | 15.5 | | (6.4) | | 12.2 | | 15.8 | | 14.1 | | 9.8 | | 13.6 | | (9.5) | | (12.7) | | 15.1 | | 14.7 | | 8.4 | | 15.3 | | 12.8 |
| The Income Fund of America | 5 |


A worldwide network in pursuit of income
The Income Fund of America’s large network of investment professionals around the world is constantly searching for opportunities aligned with the income objective of the fund.
Our portfolio managers and analysts collaborate in “clusters” that allow them to share their ideas and explore trends in industries and the investment environment. They are instrumental in not only identifying themes and opportunities but also avoiding risks.
“The Income Fund of America is of course largely invested in U.S. companies,” portfolio manager Hilda Applbaum says. “But because so many companies now operate worldwide, we have analysts based on different continents who cover the same industry. They form clusters that enable us to connect the dots globally and make sense of these firms and industries.
“We have research offices in North America, Europe and Asia. They are staffed by portfolio managers and analysts who have a deep familiarity not only with companies and industries but with the people and cultures. All of this enriches our dialogue and yields insights that might not otherwise be possible.”
Clusters operate in “real-time”
While analysts meet regularly to share insights from their areas of coverage, they are constantly in touch via email about developments in their industries that could have ramifications for the broader sector. They also often travel together, visiting companies around the world.
“Let’s just say we have a very robust email chain. There’s a rich amount of information sharing,” says San Francisco-based investment analyst Mathews Cherian. He’s part of a cluster that covers technology, a sector he says demands a global reach. “Our group tends to operate in real-time. We are in constant communication. We always try to be aware of the changes around us, which allows us to more readily gauge the impact a development might have on a company.”
Mathews, who covers the global telecommunications equipment industry, says the ongoing stream of communication can lead to potentially rewarding investment opportunities. For example, when a French telecommunications equipment company announced it had hired a new chief executive officer, it seemed to go unnoticed by the market. This particular firm had a history of poor leadership, so it seemed entirely possible that this latest addition would be just another in a line of mediocre executives.
“But one of my colleagues, whose focus is European telecommunications service providers, had known the new CEO for more than a decade. He had been an executive at two of the large carriers in
| The Income Fund of America | 7 |
| | | The Income Fund of America is of course largely invested in U.S. companies ... because so many companies now operate worldwide, we have analysts based on different continents who cover the same industry. They form clusters that enable us to connect the dots globally. |
| | | |
| | | Hilda Applbaum |

Europe,” Mathews continues. “It was very helpful to hear from him that the new leader was highly credible and very operationally focused — a ‘no-nonsense’ manager — which was precisely what this company needed. As a result, we felt confident in making a significant investment in the company. But it was really our institutional knowledge and a culture of collaboration that brought about the opportunity.”
Longtime analysts, long-term value
Given that American Funds analysts have an average of 13 years in the industry, it’s not unusual for many investment professionals to have working relationships with executives as they ascend the corporate ladder. This affords us not only a high degree of access to managements, but also a deep and enduring understanding of those companies.
Investment analyst Paul Benjamin explains that these longstanding relationships can prove crucial in covering a company and making an investment decision. Paul says an experience with Cisco Systems, the global networking equipment company, highlights the value of both experience and collaboration. Cisco is a top 10 holding in IFA.
“Cisco is a great example of how effective the clusters can be,” Paul explains. “When the market perceived a threat to Cisco’s business from a process called software-defined networking, we discussed the issue on a call among ourselves. There were members of the cluster who had relationships that went back several years with the leadership at some of Cisco’s largest customers. They were able to meet with those people and determine that the perceived threat was being overstated by the market, and we were able to increase our investment at a relatively attractive valuation. It takes years of covering companies and meeting with managements to have access like that.”
On the road again
Portfolio manager Jody Jonsson’s recollection of a recent research trip to China highlights the scope of the collaboration among investment professionals. The trip included investment analysts, equity and fixed-income portfolio managers, and macroeconomic analysts.
“We went to Beijing, Shanghai, Shenzhen and Hong Kong. We met with dozens of companies, industry experts and government officials. We also had a chance to mingle with people in each city,” Jody shares. “We then all came together in Hong Kong for three days to discuss our impressions from the company meetings. We left with a much better understanding of the importance of China to the global companies that we cover.”
Jody says perhaps the most valuable element of the clusters is the diversity among investment professionals. “One of the most exciting parts of the trip was hearing the various viewpoints everyone brought to the table. We had people from all over the world traveling with us — it brought a wonderful richness to our investment discussions. I think that’s the beauty of our system. It allows for a diversity of opinion, and everyone has something to offer to the discussion based on his or her own background and experience,” she adds.
Indeed, American Funds investment professionals represent 53 countries of origin and speak more than three dozen languages. Analysts are hired, when possible, from the countries where they will be based, which allows them to bring an added dimension to the investment process. American Funds has research offices outside the U.S. in Geneva, London,
| 8 | The Income Fund of America |
Tokyo, Hong Kong, Beijing, Singapore and Mumbai.
Jody says these far-flung analysts are crucial in an increasingly interconnected world. “There are very few industries where one doesn’t have to think in global terms when investing. For example, most of the companies that manufacture luxury goods are based in Europe, but you can’t regard them as strictly European. Their growth potential is in developing countries where disposable income is increasing and people are becoming more affluent. It’s essential that we have analysts in those countries who can share their knowledge of local markets and specific companies. We’re able to get a much clearer picture of a company’s global potential.”
The buzz on the bus
That diversity among analysts is evident in the consumer staples cluster, which includes Juliette Amos and David Carpenter. Juliette is London-based, while David is in Los Angeles. Their cluster colleagues span the globe from Geneva to Beijing. “We help each other make better decisions, and in a very real way, I can effectively be in more than one place at a time,” David says.
Though they are based around the world, these analysts travel as a group at least once a year to meet with companies in their coverage areas. In addition to visiting U.S. companies, they have traveled to China, Brazil and India. The group may have up to six meetings a day with executives and others. They travel by bus when they are in a city, which affords them the opportunity to share impressions of the people and companies they have met during the day.
“We get back on the bus and it’s a buzz fest,” says David. “Everyone has a
| | | Search for sustainable income |
More than a century ago, a man named Gillette was among those who developed a business strategy that’s come to be known as the razor and blades model: Give customers the razor and then sell them the blades. Over and over again.
Known as the recurring revenue model, it has become the Holy Grail for companies in industries ranging from technology to consumer products. For companies, this kind of recurring revenue means relatively reliable and ongoing cash flow. For investors, it means a growing number and diversity of companies that are potential sources of income. Indeed, during the past few years there has been a marked increase in dividends paid by sectors that once dismissed them, including information technology. In fact, software is now referred to as the razor of the 21st century for its ability to produce an ongoing revenue stream.
Once predominately a hardware manufacturer, Cisco Systems, for example, has moved away from one-time sales in favor of ongoing revenue from software and service. Evidence of the shift can be seen in the company’s service revenue, which has increased from about $2 billion to $10 billion since 2000.
The recurring revenue model also enables companies to maintain a degree of stability in volatile market environments — a potential benefit for long-term investors looking for an income portfolio with sustainable dividends and the potential for growth.
The rising level of service revenue at Cisco Systems
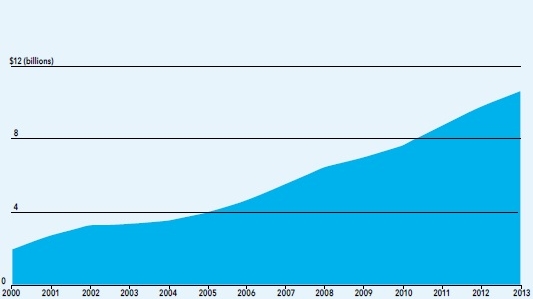
Source: Reuters Global Fundamentals and FactSet. Cisco service revenue data, a proxy for the company’s recurring revenue, are as of July for each year. Total dividends paid are for the trailing 12 months ended April 30, 2014.
| The Income Fund of America | 9 |
| | We work with these companies for years; we know what’s in their DNA. We have the ability and luxury to be patient, which allows us to focus on the big picture over the long term. |
| | | |
| | | Juliette Amos |

perspective on what’s been said, so there’s validation — or refutation — of what we just heard from the management of a company. It’s hugely valuable and a ton of fun.”
The system encourages analysts to go beyond traditional research and explore new avenues. One analyst, for example, found beneficial information on technology companies by visiting the patent office.
On a recent research trip to Los Angeles, Juliette spoke with several beer distributors to get their perspective on the non-U.S. beverage companies she covers. “I’m a big believer in on-the-ground research,” she says. “The companies I cover may be global, but they are operating in local markets.” The information she gleans from distributors equips her to go back to her coverage companies and ask executives more specific and directed questions.
Indeed, sources of information can range from local retailers to high-ranking executives. While in Brazil, for example, Juliette’s contacts suggested she speak with a former executive at Coca-Cola, who was now involved with many of the families that run bottling plants for Coke, a company among David’s research responsibilities. Juliette arranged a meeting in Atlanta, and together she and David discussed the beverage giant’s distribution system with the former executive. “That’s another benefit of the cluster. We introduce each other to the leadership of companies around the world, so we all end up with global contacts,” she adds.
“We had a two-hour breakfast meeting in Atlanta and talked about Coke’s effort to rationalize its incredibly complicated distribution system, which involves about 98 family-owned bottling companies,” David explains. “I initially didn’t think there was much opportunity to streamline that process — it seemed like herding cats to me. But as a result of what we learned at that meeting, I was persuaded that there was a greater possibility than I had initially thought for an amicable resolution to the situation. It now looks like there may be a way for Coke to restructure this part of the manufacturing process — and that could mean greater profitability for the company.”
The value of patience
Another benefit of the ongoing relationships among analysts is that they meet with management teams repeatedly — in up cycles and down, good times and bad. “There’s constant calibration,” David says.
“We work with these companies for years; we know what’s in their DNA,” Juliette concludes. “We have the ability and luxury to be patient, which allows us to focus on the big picture over the long term.” ■
About your fund
Fund results shown are for Class A shares at net asset value. If a sales charge (maximum 5.75%) had been deducted, the results would have been lower. Results are for past periods and are not predictive of results for future periods. Current and future results may be lower or higher than those shown. Share prices and returns will vary, so investors may lose money. For current information and month-end results, visit americanfunds.com.
| Resilience during stock market declines | The Income Fund of America (IFA) vs. the S&P 500 during market declines* |
| Dates of decline | | S&P 500 | | IFA cumulative | | IFA advantage |
| | | cumulative total return | | total return | | (percentage points) |
| September 21, 1976, through March 6, 1978 | | | –13.5 | % | | | 1.9 | % | | | 15.4 | % |
| November 28, 1980, through August 12, 1982 | | | –20.2 | | | | 19.0 | | | | 39.2 | |
| August 25 through December 4, 1987 | | | –32.8 | | | | –13.6 | | | | 19.2 | |
| July 16 through October 11, 1990 | | | –19.2 | | | | –10.2 | | | | 9.0 | |
| July 17 through August 31, 1998 | | | –19.1 | | | | –9.5 | | | | 9.6 | |
| March 24, 2000, through October 9, 2002 | | | –47.4 | | | | 0.7 | | | | 48.1 | |
| October 9, 2007, through March 9, 2009 | | | –55.2 | | | | –43.5 | | | | 11.7 | |
| April 29 through October 3, 2011 | | | –18.6 | | | | –11.6 | | | | 7.0 | |
| * | Periods shown reflect S&P 500 price declines of 15% or greater (without dividends reinvested) based on 100% recovery after each decline (except for 1976–1978 and 2007–2009 declines, which recovered 78% and 77%, respectively). The index is unmanaged and, therefore, has no expenses. Investors cannot invest directly in an index. |
Withdrawing income: the dividend advantage
Most fund investors reinvest their dividends, but some use dividends to meet current expenses. As shown below, the fund’s income has allowed withdrawals to be made without invading principal.
| Higher dividends ... | ... have helped to keep principal intact, letting compounding do its work. |

Charts show hypothetical $100,000 investments in the fund (at net asset value) and in the S&P 500 from January 1, 1974, to July 31, 2014. Example assumes an annual withdrawal equaling $5,000 the first year on December 31, 1974, and then increasing by 5% each year thereafter. Over the period, total withdrawals from each of the fund and the index come to $603,999.
Historical benefits of income
This chart shows one-year snapshots of the annual income produced by three hypothetical $10,000 investments made on July 31, 1974, in each of the The Income Fund of America, the S&P 500 and three-month U.S. Treasury bills. Over the past 40 years, income from the fund has been substantially higher.
Year ended July 31
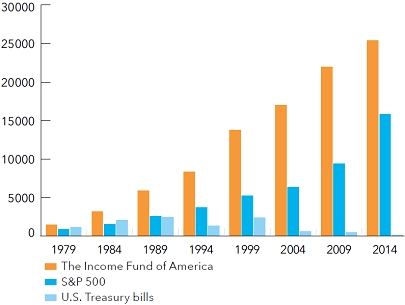
All results are calculated at net asset value with dividends and capital gains (where applicable) reinvested. Source for Treasury bills is the Federal Reserve. Income from three-month Treasury bills assumes reinvestment of both principal and interest at prevailing rates at the time of purchase. Securities backed by the U.S. Treasury or the full faith and credit of the U.S. government are guaranteed only as to the timely payment of interest and principal when held to maturity; the fund is not guaranteed.
Source: Thomson InvestmentView.
| The Income Fund of America | 11 |
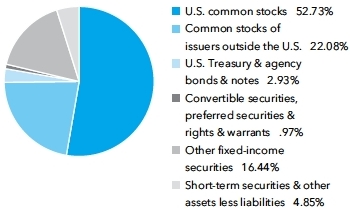
The portfolio at a glance
July 31, 2014
Investment mix by security type
Percent of net assets
Five largest sectors in common stock holdings
| | | Percent of net assets |
| Health care | | | 10.49 | % |
| Industrials | | | 9.66 | |
| Financials | | | 9.50 | |
| Information technology | | | 8.07 | |
| Consumer staples | | | 7.74 | |
Ten largest common stock holdings
| | | Percent of net assets |
| Merck | | | 3.00 | % |
| Microsoft | | | 2.80 | |
| General Electric | | | 2.01 | |
| Verizon | | | 1.91 | |
| Bristol-Myers Squibb | | | 1.78 | |
| Pfizer | | | 1.72 | |
| AstraZeneca | | | 1.46 | |
| DuPont | | | 1.46 | |
| Cisco Systems | | | 1.40 | |
| PepsiCo | | | 1.38 | |
Country diversification
| | | Percent of net assets |
| United States | | | 69.81 | % |
| United Kingdom | | | 8.64 | |
| Euro zone* | | | 6.93 | |
| Canada | | | 2.20 | |
| Australia | | | 1.97 | |
| Switzerland | | | 1.75 | |
| Hong Kong | | | 1.69 | |
| Taiwan | | | .79 | |
| India | | | .18 | |
| Japan | | | .18 | |
| Other countries | | | 1.01 | |
| Short-term securities & other assets less liabilities | | | 4.85 | |
| * | Countries using the euro as a common currency; those represented in the fund’s portfolio are Belgium, Finland, France, Germany, Ireland, Italy, Luxembourg, the Netherlands, Portugal and Spain. |
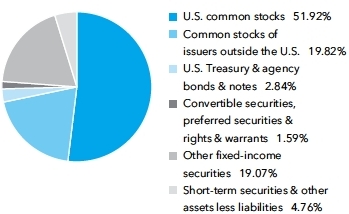
July 31, 2013
Investment mix by security type
Percent of net assets
Five largest sectors in common stock holdings
| | | Percent of net assets |
| Health care | | | 9.94 | % |
| Financials | | | 9.30 | |
| Industrials | | | 8.64 | |
| Energy | | | 7.45 | |
| Consumer staples | | | 6.66 | |
Ten largest common stock holdings
| | | Percent of net assets |
| Bristol-Myers Squibb | | | 2.66 | % |
| Merck | | | 2.38 | |
| General Electric | | | 1.99 | |
| Pfizer | | | 1.72 | |
| Home Depot | | | 1.56 | |
| DuPont | | | 1.47 | |
| Lockheed Martin | | | 1.46 | |
| National Grid | | | 1.43 | |
| Microsoft | | | 1.28 | |
| Chevron | | | 1.28 | |
Country diversification
| | | Percent of net assets |
| United States | | | 71.28 | % |
| United Kingdom | | | 8.07 | |
| Euro zone† | | | 5.45 | |
| Canada | | | 2.11 | |
| Australia | | | 1.94 | |
| Hong Kong | | | 1.63 | |
| Switzerland | | | 1.50 | |
| Taiwan | | | .75 | |
| Japan | | | .58 | |
| Thailand | | | .42 | |
| Other countries | | | 1.51 | |
| Short-term securities & other assets less liabilities | | | 4.76 | |
| † | Countries using the euro as a common currency; those represented in the fund’s portfolio are Belgium, Finland, France, Germany, Ireland, Italy, Luxembourg, the Netherlands, Portugal and Spain. |
| 12 | The Income Fund of America |
Summary investment portfolio July 31, 2014
| Common stocks 74.81% | | Shares | | | Value
(000) | |
| Health care 10.49% | | | | | | | | |
| Merck & Co., Inc. | | | 49,692,840 | | | $ | 2,819,572 | |
| Bristol-Myers Squibb Co. | | | 32,912,500 | | | | 1,666,031 | |
| Pfizer Inc. | | | 56,230,000 | | | | 1,613,801 | |
| AstraZeneca PLC1 | | | 18,841,700 | | | | 1,372,720 | |
| AbbVie Inc. | | | 8,520,000 | | | | 445,937 | |
| Other securities | | | | | | | 1,923,862 | |
| | | | | | | | 9,841,923 | |
| | | | | | | | | |
| Industrials 9.66% | | | | | | | | |
| General Electric Co. | | | 74,980,000 | | | | 1,885,747 | |
| Lockheed Martin Corp. | | | 7,567,400 | | | | 1,263,529 | |
| Waste Management, Inc.2 | | | 27,982,868 | | | | 1,256,151 | |
| BAE Systems PLC1 | | | 81,823,984 | | | | 590,537 | |
| Other securities | | | | | | | 4,068,691 | |
| | | | | | | | 9,064,655 | |
| | | | | | | | | |
| Financials 9.50% | | | | | | | | |
| Wells Fargo & Co. | | | 21,692,000 | | | | 1,104,123 | |
| JPMorgan Chase & Co. | | | 15,130,200 | | | | 872,559 | |
| Banco Santander, SA1,3 | | | 76,499,601 | | | | 768,815 | |
| Banco Santander, SA, interim shares, non-registered shares1,3 | | | 1,561,216 | | | | 15,690 | |
| CME Group Inc., Class A | | | 10,140,400 | | | | 749,781 | |
| Suncorp Group Ltd.1 | | | 51,279,898 | | | | 676,599 | |
| HSBC Holdings PLC (GBP denominated)1 | | | 30,420,722 | | | | 325,664 | |
| HSBC Holdings PLC (HKD denominated)1 | | | 28,586,382 | | | | 307,117 | |
| Digital Realty Trust, Inc.2 | | | 8,346,000 | | | | 537,399 | |
| Other securities | | | | | | | 3,561,266 | |
| | | | | | | | 8,919,013 | |
| | | | | | | | | |
| Information technology 8.07% | | | | | | | | |
| Microsoft Corp. | | | 60,846,100 | | | | 2,626,118 | |
| Cisco Systems, Inc. | | | 51,980,000 | | | | 1,311,455 | |
| Texas Instruments Inc. | | | 19,380,000 | | | | 896,325 | |
| Analog Devices, Inc. | | | 11,650,000 | | | | 578,189 | |
| Taiwan Semiconductor Manufacturing Co. Ltd.1 | | | 127,503,000 | | | | 512,262 | |
| Other securities | | | | | | | 1,644,157 | |
| | | | | | | | 7,568,506 | |
| | | | | | | | | |
| Consumer staples 7.74% | | | | | | | | |
| PepsiCo, Inc. | | | 14,752,588 | | | | 1,299,703 | |
| Procter & Gamble Co. | | | 15,173,700 | | | | 1,173,230 | |
| Philip Morris International Inc. | | | 12,168,200 | | | | 997,914 | |
| Kimberly-Clark Corp. | | | 6,183,110 | | | | 642,240 | |
| Altria Group, Inc. | | | 15,102,000 | | | | 613,141 | |
| Nestlé SA1 | | | 6,440,000 | | | | 478,080 | |
| Imperial Tobacco Group PLC1 | | | 10,583,991 | | | | 458,401 | |
| Other securities | | | | | | | 1,598,113 | |
| | | | | | | | 7,260,822 | |
| | | | | | | | | |
| Energy 6.75% | | | | | | | | |
| ConocoPhillips | | | 13,565,162 | | | | 1,119,126 | |
| Royal Dutch Shell PLC, Class B (ADR) | | | 10,431,000 | | | | 898,526 | |
| Royal Dutch Shell PLC, Class B1 | | | 4,499,147 | | | | 193,839 | |
| Spectra Energy Corp | | | 25,390,500 | | | | 1,038,979 | |
| Chevron Corp. | | | 5,215,000 | | | | 673,987 | |
| BP PLC1 | | | 64,900,000 | | | | 530,145 | |
| Crescent Point Energy Corp. | | | 10,905,000 | | | | 444,961 | |
| Other securities | | | | | | | 1,439,393 | |
| | | | | | | | 6,338,956 | |
| The Income Fund of America | 13 |
| Common stocks (continued) | | Shares | | | Value
(000) | |
| Materials 5.27% | | | | | | | | |
| E.I. du Pont de Nemours and Co. | | | 21,261,000 | | | $ | 1,367,295 | |
| Dow Chemical Co. | | | 18,772,234 | | | | 958,698 | |
| Potash Corp. of Saskatchewan Inc. | | | 18,250,000 | | | | 647,693 | |
| Nucor Corp. | | | 12,890,485 | | | | 647,360 | |
| MeadWestvaco Corp.2 | | | 11,281,000 | | | | 471,546 | |
| Other securities | | | | | | | 850,283 | |
| | | | | | | | 4,942,875 | |
| | | | | | | | | |
| Telecommunication services 5.24% | | | | | | | | |
| Verizon Communications Inc. | | | 35,581,336 | | | | 1,794,011 | |
| Telstra Corp. Ltd.1 | | | 141,451,533 | | | | 717,109 | |
| Deutsche Telekom AG1 | | | 38,600,000 | | | | 625,675 | |
| Orange1 | | | 36,435,000 | | | | 570,406 | |
| Other securities | | | | | | | 1,212,877 | |
| | | | | | | | 4,920,078 | |
| | | | | | | | | |
| Utilities 4.64% | | | | | | | | |
| National Grid PLC1 | | | 63,482,420 | | | | 914,344 | |
| Duke Energy Corp. | | | 8,912,057 | | | | 642,827 | |
| EDP - Energias de Portugal, SA1 | | | 113,440,000 | | | | 530,617 | |
| PG&E Corp. | | | 11,300,000 | | | | 504,771 | |
| Other securities | | | | | | | 1,764,827 | |
| | | | | | | | 4,357,386 | |
| | | | | | | | | |
| Consumer discretionary 4.14% | | | | | | | | |
| Home Depot, Inc. | | | 10,430,000 | | | | 843,266 | |
| Carnival Corp., units | | | 13,368,500 | | | | 484,207 | |
| Other securities | | | | | | | 2,554,437 | |
| | | | | | | | 3,881,910 | |
| | | | | | | | | |
| Miscellaneous 3.31% | | | | | | | | |
| Other common stocks in initial period of acquisition | | | | | | | 3,102,166 | |
| | | | | | | | | |
| Total common stocks (cost: $52,802,769,000) | | | | | | | 70,198,290 | |
| | | | | | | | | |
| Preferred securities 0.52% | | | | | | | | |
| Financials 0.52% | | | | | | | | |
| Wells Fargo & Co., Class A, Series Q, 5.85% depositary shares preferred noncumulative | | | 1,600,000 | | | | 40,960 | |
| Other securities | | | | | | | 445,061 | |
| | | | | | | | | |
| Total preferred securities (cost: $463,126,000) | | | | | | | 486,021 | |
| | | | | | | | | |
| Rights & warrants 0.00% | | | | | | | | |
| Energy 0.00% | | | | | | | | |
| Other securities | | | | | | | 40 | |
| | | | | | | | | |
| Miscellaneous 0.00% | | | | | | | | |
| Other rights & warrants in initial period of acquisition | | | | | | | 2,325 | |
| | | | | | | | | |
| Total rights & warrants (cost: $2,171,000) | | | | | | | 2,365 | |
| | | | | | | | | |
| Convertible stocks 0.33% | | | | | | | | |
| Other 0.31% | | | | | | | | |
| Other securities | | | | | | | 287,634 | |
| | | | | | | | | |
| Miscellaneous 0.02% | | | | | | | | |
| Other convertible stocks in initial period of acquisition | | | | | | | 22,070 | |
| | | | | | | | | |
| Total convertible stocks (cost: $305,530,000) | | | | | | | 309,704 | |
| 14 | The Income Fund of America |
| Convertible bonds 0.12% | | Principal amount
(000) | | | Value
(000) | |
| Other 0.10% | | | | | | | | |
| Other securities | | | | | | $ | 93,652 | |
| | | | | | | | | |
| Miscellaneous 0.02% | | | | | | | | |
| Other convertible bonds in initial period of acquisition | | | | | | | 22,313 | |
| | | | | | | | | |
| Total convertible bonds (cost: $90,268,000) | | | | | | | 115,965 | |
| | | | | | | | | |
| Bonds, notes & other debt instruments 19.37% | | | | | | | | |
| Corporate bonds & notes 14.26% | | | | | | | | |
| Financials 2.69% | | | | | | | | |
| JPMorgan Chase & Co. 1.35%-3.25% 2017-2023 | | $ | 25,240 | | | | 25,117 | |
| JPMorgan Chase & Co., junior subordinated 5.00%-7.90% (undated)4 | | | 135,360 | | | | 145,738 | |
| Wells Fargo & Co., Series K, junior subordinated 7.98% (undated)4 | | | 86,566 | | | | 98,599 | |
| Wells Fargo & Co. 2.13%-4.60% 2016-2026 | | | 85,450 | | | | 90,842 | |
| Other securities | | | | | | | 2,163,824 | |
| | | | | | | | 2,524,120 | |
| | | | | | | | | |
| Telecommunication services 1.86% | | | | | | | | |
| Verizon Communications Inc. 0.63%-6.55% 2016-20434 | | | 258,581 | | | | 300,776 | |
| Other securities | | | | | | | 1,450,157 | |
| | | | | | | | 1,750,933 | |
| | | | | | | | | |
| Energy 1.73% | | | | | | | | |
| Shell International Finance BV 2.00% 2018 | | | 4,990 | | | | 5,042 | |
| Spectra Energy Partners, LP 2.95%-4.75% 2016-2024 | | | 22,000 | | | | 23,665 | |
| Other securities | | | | | | | 1,594,044 | |
| | | | | | | | 1,622,751 | |
| | | | | | | | | |
| Health care 1.52% | | | | | | | | |
| Merck & Co., Inc. 1.10%-2.80% 2018-2023 | | | 7,255 | | | | 7,142 | |
| Pfizer Inc. 2.10%-4.40% 2019-2044 | | | 84,500 | | | | 85,337 | |
| Other securities | | | | | | | 1,331,315 | |
| | | | | | | | 1,423,794 | |
| | | | | | | | | |
| Industrials 1.49% | | | | | | | | |
| General Electric Co. 0.85%-4.13% 2015-2042 | | | 28,750 | | | | 28,564 | |
| General Electric Capital Corp., junior subordinated 6.25%-7.13% (undated)4 | | | 162,300 | | | | 187,185 | |
| General Electric Capital Corp. 2.25%-6.00% 2015-2024 | | | 47,650 | | | | 50,100 | |
| Other securities | | | | | | | 1,131,542 | |
| | | | | | | | 1,397,391 | |
| | | | | | | | | |
| Materials 0.85% | | | | | | | | |
| Dow Chemical Co. 5.25% 2041 | | | 4,000 | | | | 4,347 | |
| Other securities | | | | | | | 795,405 | |
| | | | | | | | 799,752 | |
| | | | | | | | | |
| Consumer staples 0.65% | | | | | | | | |
| Philip Morris International Inc. 3.60%-4.88% 2023-2043 | | | 16,065 | | | | 16,638 | |
| Procter & Gamble Co. 3.50% 2015 | | | 17,250 | | | | 17,541 | |
| Other securities | | | | | | | 575,086 | |
| | | | | | | | 609,265 | |
| | | | | | | | | |
| Other 3.47% | | | | | | | | |
| Other securities | | | | | | | 3,253,866 | |
| | | | | | | | | |
| Total corporate bonds & notes | | | | | | | 13,381,872 | |
| The Income Fund of America | 15 |
| Bonds, notes & other debt instruments (continued) | | Principal amount
(000) | | | Value
(000) | |
| U.S. Treasury bonds & notes 2.58% | | | | | | | | |
| U.S. Treasury 2.15% | | | | | | | | |
| U.S. Treasury 0.25%-6.25% 2014-20445 | | $ | 1,951,855 | | | $ | 2,013,034 | |
| | | | | | | | | |
| U.S. Treasury inflation-protected securities 0.43% | | | | | | | | |
| U.S. Treasury Inflation-Protected Security 0.13%-1.88% 2015-20446 | | | 395,431 | | | | 407,979 | |
| | | | | | | | | |
| Total U.S. Treasury bonds & notes | | | | | | | 2,421,013 | |
| | | | | | | | | |
| Mortgage-backed obligations 1.84% | | | | | | | | |
| Fannie Mae 2.50%-10.30% 2018-20474,7,8 | | | 869,896 | | | | 915,802 | |
| Freddie Mac 1.61%-9.61% 2019-20434,7 | | | 216,111 | | | | 232,600 | |
| Other securities | | | | | | | 576,905 | |
| | | | | | | | 1,725,307 | |
| | | | | | | | | |
| Federal agency bonds & notes 0.35% | | | | | | | | |
| Fannie Mae 2.18%-7.13% 2022-20304,7 | | | 109,197 | | | | 122,077 | |
| Federal Home Loan Bank 5.50% 2036 | | | 100 | | | | 129 | |
| Freddie Mac 0.75%-3.53% 2016-20244,7 | | | 175,307 | | | | 175,140 | |
| Other securities | | | | | | | 33,574 | |
| | | | | | | | 330,920 | |
| | | | | | | | | |
| Other 0.33% | | | | | | | | |
| Other securities | | | | | | | 312,105 | |
| | | | | | | | | |
| Miscellaneous 0.01% | | | | | | | | |
| Other bonds & notes in initial period of acquisition | | | | | | | 8,291 | |
| | | | | | | | | |
| Total bonds, notes & other debt instruments (cost: $17,531,247,000) | | | | | | | 18,179,508 | |
| | | | | | | | | |
| Short-term securities 4.79% | | | | | | | | |
| Chariot Funding, LLC 0.26%-0.28% due 12/9/2014-12/22/20149 | | | 66,200 | | | | 66,157 | |
| Fannie Mae 0.08%-0.15% due 8/1/2014-7/1/2015 | | | 409,600 | | | | 409,456 | |
| Federal Farm Credit Banks 0.10%-0.15% due 8/8/2014-7/2/2015 | | | 474,100 | | | | 473,905 | |
| Federal Home Loan Bank 0.05%-0.17% due 8/4/2014-7/10/2015 | | | 1,451,034 | | | | 1,450,793 | |
| Freddie Mac 0.05%-0.16% due 8/1/2014-6/10/2015 | | | 1,148,800 | | | | 1,148,484 | |
| General Electric Capital Corp. 0.12%-0.19% due 8/20/2014-1/14/2015 | | | 110,000 | | | | 109,945 | |
| Jupiter Securitization Co., LLC 0.25%-0.28% due 10/14/2014-3/3/20159 | | | 50,000 | | | | 49,952 | |
| Microsoft Corp. 0.09% due 8/27/20149 | | | 35,100 | | | | 35,099 | |
| Procter & Gamble Co. 0.09%-0.15% due 9/5/2014-1/7/20159 | | | 149,300 | | | | 149,283 | |
| Other securities | | | | | | | 597,952 | |
| | | | | | | | | |
| Total short-term securities (cost: $4,490,612,000) | | | | | | | 4,491,026 | |
| Total investment securities 99.94% (cost: $75,685,723,000) | | | | | | | 93,782,879 | |
| Other assets less liabilities 0.06% | | | | | | | 55,183 | |
| | | | | | | | | |
| Net assets 100.00% | | | | | | $ | 93,838,062 | |
This summary investment portfolio is designed to streamline the report and help investors better focus on the fund’s principal holdings. See the inside back cover for details on how to obtain a complete schedule of portfolio holdings.
As permitted by U.S. Securities and Exchange Commission regulations, “Miscellaneous” securities include holdings in their first year of acquisition that have not previously been publicly disclosed.
“Other securities” includes all issues that are not disclosed separately in the summary investment portfolio, including loan participations and assignments which may be subject to legal or contractual restrictions on resale. The total value of all such loans was $885,970,000, which represented .94% of the net assets of the fund. Some securities in “Other securities” (with an aggregate value of $22,869,000, an aggregate cost of $81,648,000, and which represented .02% of the net assets of the fund) were acquired from 2/14/2011 to 5/2/2013 through private placement transactions exempt from registration under the Securities Act of 1933, which may subject them to legal or contractual restrictions on resale.
| 16 | The Income Fund of America |
The following footnotes apply to either the individual securities noted or one or more of the securities aggregated and listed as a single line item.
| 1 | Valued under fair value procedures adopted by authority of the board of trustees. The total value of all such securities, including those in “Miscellaneous” and “Other securities,” was $17,800,699,000, which represented 18.97% of the net assets of the fund. This amount includes $17,040,369,000 related to certain securities trading outside the U.S. whose values were adjusted as a result of significant market movements following the close of local trading. |
| 2 | Represents an affiliated company as defined under the Investment Company Act of 1940. |
| 3 | Security did not produce income during the last 12 months. |
| 4 | Coupon rate may change periodically. |
| 5 | A portion of this security was pledged as collateral. The total value of pledged collateral was $1,124,000, which represented less than .01% of the net assets of the fund. |
| 6 | Index-linked bond whose principal amount moves with a government price index. |
| 7 | Principal payments may be made periodically. Therefore, the effective maturity date may be earlier than the stated maturity date. |
| 8 | A portion or all of this security purchased on a TBA basis. |
| 9 | Acquired in a transaction exempt from registration under Rule 144A or Section 4(2) of the Securities Act of 1933. May be resold in the U.S. in transactions exempt from registration, normally to qualified institutional buyers. The total value of all such securities, including those in “Other securities,” was $5,375,119,000, which represented 5.73% of the net assets of the fund. |
Forward currency contracts
The fund has entered into forward currency contracts to sell currencies as shown in the following table. The average notional amount of open forward currency contracts was $349,947,000 over the prior 12-month period.
| | | | | | | | | | | Unrealized | |
| | | | | | | Contract amount | | appreciation | |
| | | | | | | Receive | | Deliver | | at 7/31/2014 | |
| | | Settlement date | | Counterparty | | (000) | | (000) | | (000) | |
| Sales: | | | | | | | | | | | | |
| Australian dollars | | 8/11/2014 | | JPMorgan Chase | | $152,886 | | A$163,200 | | | $1,341 | |
| Australian dollars | | 8/15/2014 | | UBS AG | | $71,144 | | A$76,000 | | | 591 | |
| Australian dollars | | 8/15/2014 | | Barclays Bank PLC | | $25,556 | | A$27,300 | | | 213 | |
| Australian dollars | | 8/19/2014 | | Bank of America, N.A. | | $10,031 | | A$10,700 | | | 101 | |
| Australian dollars | | 8/29/2014 | | Citibank | | $79,891 | | A$85,075 | | | 995 | |
| Australian dollars | | 9/11/2014 | | Bank of America, N.A. | | $56,153 | | A$60,700 | | | 25 | |
| | | | | | | | | | | | $3,266 | |
Investments in affiliates
A company is an affiliate of the fund under the Investment Company Act of 1940 if the fund’s holdings in that company represent 5% or more of the outstanding voting shares. The value of the fund’s affiliated-company holdings is either shown in the summary investment portfolio or included in the value of “Other securities” under the respective industry sectors. Further details on such holdings and related transactions during the year ended July 31, 2014, appear below.
| | | Beginning | | | | | | | | | Ending | | | Dividend | | | Value of | |
| | | shares or | | | | | | | | | shares or | | | or interest | | | affiliates at | |
| | | principal | | | | | | | | | principal | | | income | | | 7/31/2014 | |
| | | amount | | | Additions | | | Reductions | | | amount | | | (000) | | | (000) | |
| Waste Management, Inc. | | | 22,572,153 | | | | 5,541,200 | | | | 130,485 | | | | 27,982,868 | | | $ | 36,959 | | | $ | 1,256,151 | |
| Digital Realty Trust, Inc. | | | 7,950,000 | | | | 396,000 | | | | — | | | | 8,346,000 | | | | 20,218 | | | | 537,399 | |
| MeadWestvaco Corp. | | | 11,281,000 | | | | — | | | | — | | | | 11,281,000 | | | | 22,562 | | | | 471,546 | |
| Iron Mountain Inc. | | | 12,457,211 | | | | — | | | | — | | | | 12,457,211 | | | | 13,454 | | | | 417,441 | |
| Iron Mountain Inc. 5.75% 2024 | | | — | | | $ | 2,175,000 | | | | — | | | $ | 2,175,000 | | | | 110 | | | | 2,186 | |
| Iron Mountain Inc. 6.00% 2023 | | | — | | | $ | 950,000 | | | | — | | | $ | 950,000 | | | | 47 | | | | 995 | |
| TalkTalk Telecom Group PLC1 | | | 57,242,000 | | | | — | | | | — | | | | 57,242,000 | | | | 11,547 | | | | 302,965 | |
| R.R. Donnelley & Sons Co. | | | 13,345,400 | | | | — | | | | — | | | | 13,345,400 | | | | 13,879 | | | | 231,676 | |
| R.R. Donnelley & Sons Co. 7.00% 2022 | | | — | | | $ | 16,735,000 | | | | — | | | $ | 16,735,000 | | | | 1,087 | | | | 18,325 | |
| R.R. Donnelley & Sons Co. 6.50% 2023 | | | — | | | $ | 11,125,000 | | | | — | | | $ | 11,125,000 | | | | 490 | | | | 11,487 | |
| R.R. Donnelley & Sons Co. 7.25% 2018 | | $ | 11,400,000 | | | | — | | | $ | 4,166,000 | | | $ | 7,234,000 | | | | 712 | | | | 8,229 | |
| R.R. Donnelley & Sons Co. 7.875% 2021 | | $ | 5,000,000 | | | $ | 3,050,000 | | | $ | 5,000,000 | | | $ | 3,050,000 | | | | 62 | | | | 3,462 | |
| CBS Outdoor Americas, Inc. | | | — | | | | 7,800,000 | | | | — | | | | 7,800,000 | | | | — | | | | 259,662 | |
| Healthscope Ltd.1,2 | | | — | | | | 101,831,569 | | | | — | | | | 101,831,569 | | | | — | | | | 213,868 | |
| Cliffs Natural Resources Inc. | | | 7,354,581 | | | | — | | | | — | | | | 7,354,581 | | | | 4,413 | | | | 128,337 | |
| Cliffs Natural Resources Inc., Series A, 7.00% convertible preferred 2016 | | | 2,925,000 | | | | — | | | | — | | | | 2,925,000 | | | | 5,119 | | | | 47,151 | |
| Cliffs Natural Resources Inc. 4.875% 2021 | | $ | 30,242,000 | | | | — | | | $ | 25,297,000 | | | $ | 4,945,000 | | | | 875 | | | | 4,847 | |
| Cliffs Natural Resources Inc. 3.95% 2018 | | $ | 3,250,000 | | | | — | | | $ | 3,250,000 | | | | — | | | | 116 | | | | — | |
| Cliffs Natural Resources Inc. 6.25% 2040 | | $ | 1,000,000 | | | | — | | | $ | 1,000,000 | | | | — | | | | 40 | | | | — | |
| Diebold, Inc. | | | — | | | | 3,925,000 | | | | — | | | | 3,925,000 | | | | 1,129 | | | | 147,894 | |
| The Income Fund of America | 17 |
| | | Beginning | | | | | | | | | Ending | | | Dividend | | | Value of | |
| | | shares or | | | | | | | | | shares or | | | or interest | | | affiliates at | |
| | | principal | | | | | | | | | principal | | | income | | | 7/31/2014 | |
| | | amount | | | Additions | | | Reductions | | | amount | | | (000) | | | (000) | |
| Northwest Bancshares, Inc. | | | 4,850,000 | | | | — | | | | — | | | | 4,850,000 | | | $ | 7,857 | | | $ | 60,140 | |
| Rotech Healthcare Inc., Term Loan, 13.00% 20203,4,5,6 | | | — | | | $ | 18,566,454 | | | | — | | | $ | 18,566,454 | | | | 1,958 | | | | 18,474 | |
| Rotech Healthcare Inc., Term Loan A, 5.50% 20183,4,6 | | | — | | | $ | 12,100,000 | | | $ | 90,750 | | | $ | 12,009,250 | | | | 566 | | | | 11,949 | |
| Rotech Healthcare Inc., Term Loan B, 10.00% 20193,4,6 | | | — | | | $ | 9,200,000 | | | | — | | | $ | 9,200,000 | | | | 785 | | | | 9,154 | |
| Rotech Healthcare Inc.1,2 | | | — | | | | 543,172 | | | | — | | | | 543,172 | | | | — | | | | 7,333 | |
| Rotech Healthcare Inc. 10.50% 2018 | | $ | 19,690,000 | | | | — | | | $ | 19,690,000 | | | | — | | | | 371 | | | | — | |
| Douglas Dynamics, Inc. | | | 1,350,000 | | | | 94,000 | | | | — | | | | 1,444,000 | | | | 1,195 | | | | 24,115 | |
| Hospitality Properties Trust7 | | | 9,073,335 | | | | 535,000 | | | | 9,608,335 | | | | — | | | | 13,191 | | | | — | |
| Hospitality Properties Trust 4.50% 20237 | | $ | 11,060,000 | | | | — | | | | — | | | $ | 11,060,000 | | | | 499 | | | | — | |
| Hospitality Properties Trust 5.00% 20227 | | $ | 6,500,000 | | | | — | | | | — | | | $ | 6,500,000 | | | | 334 | | | | — | |
| Hospitality Properties Trust 5.125% 20157 | | $ | 2,160,000 | | | | — | | | | — | | | $ | 2,160,000 | | | | 184 | | | | — | |
| Hospitality Properties Trust 5.625% 20177 | | $ | 10,169,000 | | | | — | | | | — | | | $ | 10,169,000 | | | | 643 | | | | — | |
| Hospitality Properties Trust 6.30% 20167 | | $ | 19,827,000 | | | | — | | | | — | | | $ | 19,827,000 | | | | 1,036 | | | | — | |
| Hospitality Properties Trust 6.70% 20187 | | $ | 12,625,000 | | | | — | | | | — | | | $ | 12,625,000 | | | | 852 | | | | — | |
| Macerich Co.7 | | | 7,505,000 | | | | — | | | | 5,885,000 | | | | 1,620,000 | | | | 1,848 | | | | — | |
| Maxim Integrated Products, Inc.7 | | | 14,156,000 | | | | — | | | | 6,360,000 | | | | 7,796,000 | | | | 11,415 | | | | — | |
| Nucor Corp.7 | | | 16,280,000 | | | | 1,150,000 | | | | 4,539,515 | | | | 12,890,485 | | | | 22,279 | | | | — | |
| Revel AC, Inc.2,7,8 | | | 529,539 | | | | — | | | | — | | | | 529,539 | | | | — | | | | — | |
| | | | | | | | | | | | | | | | | | | $ | 197,832 | | | $ | 4,194,786 | |
| 1 | Valued under fair value procedures adopted by authority of the board of trustees. The total value of all such securities including those in “Miscellaneous” and “Other securities,” was $17,800,699,000, which represented 18.97% of the net assets of the fund. This amount includes $17,040,369,000 related to certain securities trading outside the U.S. whose values were adjusted as a result of significant market movements following the close of local trading. |
| 2 | Security did not produce income during the last 12 months. |
| 3 | Coupon rate may change periodically. |
| 4 | Loan participations and assignments; may be subject to legal or contractual restrictions on resale. The total value of all such loans was $885,970,000, which represented .94% of the net assets of the fund. |
| 5 | Payment in kind; the issuer has the option of paying additional securities in lieu of cash. |
| 6 | Principal payments may be made periodically. Therefore, the effective maturity date may be earlier than the stated maturity date. |
| 7 | Unaffiliated issuer at 7/31/2014. |
| 8 | Acquired in a transaction exempt from registration under Rule 144A or Section 4(2) of the Securities Act of 1933. May be resold in the U.S. in transactions exempt from registration, normally to qualified institutional buyers. The total value of all such securities , including those in “Other securities,” was $5,375,119,000, which represented 5.73% of the net assets of the fund. |
Key to abbreviations
ADR = American Depositary Receipts
TBA = To be announced
A$ = Australian dollars
GBP = British pounds
HKD = Hong Kong dollars
See Notes to Financial Statements
| 18 | The Income Fund of America |
Financial statements
| Statement of assets and liabilities | | | | | | | | |
| at July 31, 2014 | | | (dollars in thousands) | |
| | | | | |
| Assets: | | | | | | | | |
| Investment securities, at value: | | | | | | | | |
| Unaffiliated issuers (cost: $72,052,919) | | $ | 89,588,093 | | | | | |
| Affiliated issuers (cost: $3,632,804) | | | 4,194,786 | | | $ | 93,782,879 | |
| Cash denominated in currencies other than U.S. dollars (cost: $10,041) | | | | | | | 10,041 | |
| Cash | | | | | | | 18,415 | |
| Unrealized appreciation on open forward currency contracts | | | | | | | 3,266 | |
| Receivables for: | | | | | | | | |
| Sales of investments | | | 843,183 | | | | | |
| Sales of fund’s shares | | | 96,260 | | | | | |
| Dividends and interest | | | 430,438 | | | | 1,369,881 | |
| | | | | | | | 95,184,482 | |
| Liabilities: | | | | | | | | |
| Payables for: | | | | | | | | |
| Purchases of investments | | | 1,204,270 | | | | | |
| Repurchases of fund’s shares | | | 81,971 | | | | | |
| Closed forward currency contracts | | | 110 | | | | | |
| Investment advisory services | | | 16,695 | | | | | |
| Services provided by related parties | | | 37,926 | | | | | |
| Trustees’ deferred compensation | | | 5,066 | | | | | |
| Other | | | 382 | | | | 1,346,420 | |
| Net assets at July 31, 2014 | | | | | | $ | 93,838,062 | |
| | | | | | | | | |
| Net assets consist of: | | | | | | | | |
| Capital paid in on shares of beneficial interest | | | | | | $ | 76,959,631 | |
| Undistributed net investment income | | | | | | | 904,906 | |
| Accumulated net realized loss | | | | | | | (2,126,892 | ) |
| Net unrealized appreciation | | | | | | | 18,100,417 | |
| Net assets at July 31, 2014 | | | | | | $ | 93,838,062 | |
| (dollars and shares in thousands, except per-share amounts) | |
| | |
Shares of beneficial interest issued and outstanding (no stated par value) —
unlimited shares authorized (4,379,785 total shares outstanding) | |
| | |
| | | Net assets | | | Shares
outstanding | | | Net asset value
per share | |
| Class A | | $ | 71,290,003 | | | | 3,323,539 | | | $ | 21.45 | |
| Class B | | | 601,025 | | | | 28,215 | | | | 21.30 | |
| Class C | | | 6,597,110 | | | | 311,101 | | | | 21.21 | |
| Class F-1 | | | 3,840,948 | | | | 179,448 | | | | 21.40 | |
| Class F-2 | | | 2,974,687 | | | | 138,746 | | | | 21.44 | |
| Class 529-A | | | 1,463,057 | | | | 68,331 | | | | 21.41 | |
| Class 529-B | | | 34,028 | | | | 1,593 | | | | 21.36 | |
| Class 529-C | | | 469,746 | | | | 22,026 | | | | 21.33 | |
| Class 529-E | | | 64,665 | | | | 3,028 | | | | 21.35 | |
| Class 529-F-1 | | | 52,323 | | | | 2,443 | | | | 21.41 | |
| Class R-1 | | | 133,143 | | | | 6,244 | | | | 21.33 | |
| Class R-2 | | | 634,741 | | | | 29,893 | | | | 21.23 | |
| Class R-3 | | | 1,356,839 | | | | 63,484 | | | | 21.37 | |
| Class R-4 | | | 1,191,637 | | | | 55,641 | | | | 21.42 | |
| Class R-5 | | | 567,474 | | | | 26,455 | | | | 21.45 | |
| Class R-6 | | | 2,566,636 | | | | 119,598 | | | | 21.46 | |
See Notes to Financial Statements
| The Income Fund of America | 19 |
| Statement of operations | | | | | | | | |
| for the year ended July 31, 2014 | | | (dollars in thousands) | |
| | | | | |
| Investment income: | | | | | | | | |
| Income: | | | | | | | | |
| Dividends (net of non-U.S. taxes of $60,864; also includes $187,065 from affiliates) | | $ | 2,893,460 | | | | | |
| Interest (includes $10,767 from affiliates) | | | 953,375 | | | $ | 3,846,835 | |
| Fees and expenses*: | | | | | | | | |
| Investment advisory services | | | 206,680 | | | | | |
| Distribution services | | | 268,987 | | | | | |
| Transfer agent services | | | 70,002 | | | | | |
| Administrative services | | | 16,933 | | | | | |
| Reports to shareholders | | | 2,651 | | | | | |
| Registration statement and prospectus | | | 1,011 | | | | | |
| Trustees’ compensation | | | 1,126 | | | | | |
| Auditing and legal | | | 198 | | | | | |
| Custodian | | | 2,601 | | | | | |
| Other | | | 2,202 | | | | 572,391 | |
| Net investment income | | | | | | | 3,274,444 | |
| | | | | | | | | |
| Net realized gain and unrealized appreciation on investments, forward currency contracts and currency: | | | | | | | | |
| Net realized gain (loss) on: | | | | | | | | |
| Investments (includes $2,501 net gain from affiliates) | | | 2,878,943 | | | | | |
| Forward currency contracts | | | (15,000 | ) | | | | |
| Currency transactions | | | 3,586 | | | | 2,867,529 | |
| Net unrealized appreciation (depreciation) on: | | | | | | | | |
| Investments | | | 4,430,216 | | | | | |
| Forward currency contracts | | | 3,266 | | | | | |
| Currency translations | | | (70 | ) | | | 4,433,412 | |
| Net realized gain and unrealized appreciation on investments, forward currency contracts and currency | | | | | | | 7,300,941 | |
| | | | | | | | | |
| Net increase in net assets resulting from operations | | | | | | $ | 10,575,385 | |
*Additional information related to class-specific fees and expenses is included in the Notes to Financial Statements.
| Statements of changes in net assets | | | | | | | | |
| | | | (dollars in thousands) | |
| | | | | | | | | |
| | | Year ended July 31 | |
| | | 2014 | | | 2013 | |
| Operations: | | | | | | | | |
| Net investment income | | $ | 3,274,444 | | | $ | 2,716,517 | |
| Net realized gain on investments, forward currency contracts and currency transactions | | | 2,867,529 | | | | 1,481,660 | |
| Net unrealized appreciation on investments, forward currency contracts and currency translations | | | 4,433,412 | | | | 6,793,524 | |
| Net increase in net assets resulting from operations | | | 10,575,385 | | | | 10,991,701 | |
| | | | | | | | | |
| Dividends paid to shareholders from net investment income | | | (2,769,274 | ) | | | (2,756,869 | ) |
| | | | | | | | | |
| Net capital share transactions | | | 2,749,667 | | | | 2,176,097 | |
| | | | | | | | | |
| Total increase in net assets | | | 10,555,778 | | | | 10,410,929 | |
| | | | | | | | | |
| Net assets: | | | | | | | | |
| Beginning of year | | | 83,282,284 | | | | 72,871,355 | |
| End of year (including undistributed net investment income: $904,906 and $392,405, respectively) | | $ | 93,838,062 | | | $ | 83,282,284 | |
See Notes to Financial Statements
| 20 | The Income Fund of America |
Notes to financial statements
1. Organization
The Income Fund of America (the “fund”) is registered under the Investment Company Act of 1940 as an open-end, diversified management investment company. The fund seeks current income while secondarily striving for capital growth through investments in stocks and fixed-income securities.
The fund has 16 share classes consisting of five retail share classes (Classes A, B and C, as well as two F share classes, F-1 and F-2), five 529 college savings plan share classes (Classes 529-A, 529-B, 529-C, 529-E and 529-F-1) and six retirement plan share classes (Classes R-1, R-2, R-3, R-4, R-5 and R-6). The 529 college savings plan share classes can be used to save for college education. The retirement plan share classes are generally offered only through eligible employer-sponsored retirement plans. The fund’s share classes are described further in the following table:
| Share class | | Initial sales charge | | Contingent deferred sales charge upon
redemption | | Conversion feature |
| Classes A and 529-A | | Up to 5.75% | | None (except 1% for certain redemptions within one year of purchase without an initial sales charge) | | None |
| Classes B and 529-B* | | None | | Declines from 5% to 0% for redemptions within six years of purchase | | Classes B and 529-B convert to Classes A and 529-A, respectively, after eight years |
| Class C | | None | | 1% for redemptions within one year of purchase | | Class C converts to Class F-1 after 10 years |
| Class 529-C | | None | | 1% for redemptions within one year of purchase | | None |
| Class 529-E | | None | | None | | None |
| Classes F-1, F-2 and 529-F-1 | | None | | None | | None |
| Classes R-1, R-2, R-3, R-4, R-5 and R-6 | | None | | None | | None |
*Class B and 529-B shares of the fund are not available for purchase.
Holders of all share classes have equal pro rata rights to the assets, dividends and liquidation proceeds held. Each share class has identical voting rights, except for the exclusive right to vote on matters affecting only its class. Share classes have different fees and expenses (“class-specific fees and expenses”), primarily due to different arrangements for distribution, transfer agent and administrative services. Differences in class-specific fees and expenses will result in differences in net investment income and, therefore, the payment of different per-share dividends by each share class.
2. Significant accounting policies
The fund is an investment company that applies the accounting and reporting guidance issued in Topic 946 by the U.S. Financial Accounting Standards Board. The fund’s financial statements have been prepared to comply with U.S. generally accepted accounting principles (“U.S. GAAP”). These principles require the fund’s investment adviser to make estimates and assumptions that affect reported amounts and disclosures. Actual results could differ from those estimates. The fund follows the significant accounting policies described in this section, as well as the valuation policies described in the next section on valuation.
Security transactions and related investment income — Security transactions are recorded by the fund as of the date the trades are executed with brokers. Realized gains and losses from security transactions are determined based on the specific identified cost of the securities. In the event a security is purchased with a delayed payment date, the fund will segregate liquid assets sufficient to meet its payment obligations. Dividend income is recognized on the ex-dividend date and interest income is recognized on an accrual basis. Market discounts, premiums and original issue discounts on fixed-income securities are amortized daily over the expected life of the security.
Class allocations — Income, fees and expenses (other than class-specific fees and expenses) and realized and unrealized gains and losses are allocated daily among the various share classes based on their relative net assets. Class-specific fees and expenses, such as distribution, transfer agent and administrative services, are charged directly to the respective share class.
Dividends and distributions to shareholders — Dividends and distributions to shareholders are recorded on the ex-dividend date.
| The Income Fund of America | 21 |
Currency translation — Assets and liabilities, including investment securities, denominated in currencies other than U.S. dollars are translated into U.S. dollars at the exchange rates supplied by one or more pricing vendors on the valuation date. Purchases and sales of investment securities and income and expenses are translated into U.S. dollars at the exchange rates on the dates of such transactions. The effects of changes in exchange rates on investment securities are included with the net realized gain or loss and net unrealized appreciation or depreciation on investments in the fund’s statement of operations. The realized gain or loss and unrealized appreciation or depreciation resulting from all other transactions denominated in currencies other than U.S. dollars are disclosed separately.
3. Valuation
Capital Research and Management Company (“CRMC”), the fund’s investment adviser, values the fund’s investments at fair value as defined by U.S. GAAP. The net asset value of each share class of the fund is generally determined as of approximately 4:00 p.m. New York time each day the New York Stock Exchange is open.
Methods and inputs — The fund’s investment adviser uses the following methods and inputs to establish the fair value of the fund’s assets and liabilities. Use of particular methods and inputs may vary over time based on availability and relevance as market and economic conditions evolve.
Equity securities are generally valued at the official closing price of, or the last reported sale price on, the exchange or market on which such securities are traded, as of the close of business on the day the securities are being valued or, lacking any sales, at the last available bid price. Prices for each security are taken from the principal exchange or market on which the security trades.
Fixed-income securities, including short-term securities, are generally valued at prices obtained from one or more pricing vendors. Vendors value such securities based on one or more of the inputs described in the following table. The table provides examples of inputs that are commonly relevant for valuing particular classes of fixed-income securities in which the fund is authorized to invest. However, these classifications are not exclusive, and any of the inputs may be used to value any other class of fixed-income security.
| Fixed-income class | Examples of standard inputs |
| All | Benchmark yields, transactions, bids, offers, quotations from dealers and trading systems, new issues, spreads and other relationships observed in the markets among comparable securities; and proprietary pricing models such as yield measures calculated using factors such as cash flows, financial or collateral performance and other reference data (collectively referred to as “standard inputs”) |
| Corporate bonds & notes; convertible securities | Standard inputs and underlying equity of the issuer |
| Bonds & notes of governments & government agencies | Standard inputs and interest rate volatilities |
| Mortgage-backed; asset-backed obligations | Standard inputs and cash flows, prepayment information, default rates, delinquency and loss assumptions, collateral characteristics, credit enhancements and specific deal information |
| Municipal securities | Standard inputs and, for certain distressed securities, cash flows or liquidation values using a net present value calculation based on inputs that include, but are not limited to, financial statements and debt contracts |
When the fund���s investment adviser deems it appropriate to do so (such as when vendor prices are unavailable or deemed to be not representative), fixed-income securities will be valued in good faith at the mean quoted bid and ask prices that are reasonably and timely available (or bid prices, if ask prices are not available) or at prices for securities of comparable maturity, quality and type.
Securities with both fixed-income and equity characteristics, or equity securities traded principally among fixed-income dealers, are generally valued in the manner described for either equity or fixed-income securities, depending on which method is deemed most appropriate by the fund’s investment adviser. Forward currency contracts are valued at the mean of representative quoted bid and ask prices, generally based on prices supplied by one or more pricing vendors.
Securities and other assets for which representative market quotations are not readily available or are considered unreliable by the fund’s investment adviser are fair valued as determined in good faith under fair valuation guidelines adopted by authority of the fund’s board of trustees as further described. The investment adviser follows fair valuation guidelines, consistent with U.S. Securities and Exchange Commission rules and guidance, to consider relevant principles and factors when making fair value determinations. The investment adviser considers relevant indications of value that are reasonably and timely available to it in determining the fair value to be assigned to a particular security, such as the type and cost of the security; contractual or legal restrictions on resale of the security; relevant financial or
| 22 | The Income Fund of America |
business developments of the issuer; actively traded similar or related securities; conversion or exchange rights on the security; related corporate actions; significant events occurring after the close of trading in the security; and changes in overall market conditions. In addition, the closing prices of equity securities that trade in markets outside U.S. time zones may be adjusted to reflect significant events that occur after the close of local trading but before the net asset value of each share class of the fund is determined. Fair valuations and valuations of investments that are not actively trading involve judgment and may differ materially from valuations that would have been used had greater market activity occurred.
Processes and structure — The fund’s board of trustees has delegated authority to the fund’s investment adviser to make fair value determinations, subject to board oversight. The investment adviser has established a Joint Fair Valuation Committee (the “Fair Valuation Committee”) to administer, implement and oversee the fair valuation process, and to make fair value decisions. The Fair Valuation Committee regularly reviews its own fair value decisions, as well as decisions made under its standing instructions to the investment adviser’s valuation teams. The Fair Valuation Committee reviews changes in fair value measurements from period to period and may, as deemed appropriate, update the fair valuation guidelines to better reflect the results of back testing and address new or evolving issues. The Fair Valuation Committee reports any changes to the fair valuation guidelines to the board of trustees with supplemental information to support the changes. The fund’s board and audit committee also regularly review reports that describe fair value determinations and methods.
The fund’s investment adviser has also established a Fixed-Income Pricing Review Group to administer and oversee the fixed-income valuation process, including the use of fixed-income pricing vendors. This group regularly reviews pricing vendor information and market data. Pricing decisions, processes and controls over security valuation are also subject to additional internal reviews, including an annual control self-evaluation program facilitated by the investment adviser’s compliance group.
Classifications — The fund’s investment adviser classifies the fund’s assets and liabilities into three levels based on the inputs used to value the assets or liabilities. Level 1 values are based on quoted prices in active markets for identical securities. Level 2 values are based on significant observable market inputs, such as quoted prices for similar securities and quoted prices in inactive markets. Certain securities trading outside the U.S. may transfer between Level 1 and Level 2 due to valuation adjustments resulting from significant market movements following the close of local trading. Level 3 values are based on significant unobservable inputs that reflect the investment adviser’s determination of assumptions that market participants might reasonably use in valuing the securities. The valuation levels are not necessarily an indication of the risk or liquidity associated with the underlying investment. For example, U.S. government securities are reflected as Level 2 because the inputs used to determine fair value may not always be quoted prices in an active market. The following tables present the fund’s valuation levels as of July 31, 2014 (dollars in thousands):
| | | Investment securities |
| | | Level 1 | | Level 2* | | Level 3 | | Total |
| Assets: | | | | | | | | | | | | | | | | |
| Common stocks: | | | | | | | | | | | | | | | | |
| Health care | | $ | 7,549,822 | | | $ | 2,284,768 | | | $ | 7,333 | | | $ | 9,841,923 | |
| Industrials | | | 7,232,875 | | | | 1,831,778 | | | | 2 | | | | 9,064,655 | |
| Financials | | | 5,783,018 | | | | 3,135,995 | | | | — | | | | 8,919,013 | |
| Information technology | | | 6,579,749 | | | | 988,757 | | | | — | | | | 7,568,506 | |
| Consumer staples | | | 5,970,385 | | | | 1,290,437 | | | | — | | | | 7,260,822 | |
| Energy | | | 5,512,471 | | | | 826,294 | | | | 191 | | | | 6,338,956 | |
| Materials | | | 4,540,908 | | | | 394,776 | | | | 7,191 | | | | 4,942,875 | |
| Telecommunication services | | | 2,030,328 | | | | 2,889,750 | | | | — | | | | 4,920,078 | |
| Utilities | | | 2,227,253 | | | | 2,130,133 | | | | — | | | | 4,357,386 | |
| Consumer discretionary | | | 2,839,597 | | | | 1,042,313 | | | | — | | | | 3,881,910 | |
| Miscellaneous | | | 2,194,919 | | | | 907,247 | | | | — | | | | 3,102,166 | |
| Preferred securities | | | 126,170 | | | | 359,851 | | | | — | | | | 486,021 | |
| Rights & warrants | | | 2,325 | | | | — | | | | 40 | | | | 2,365 | |
| Convertible stocks | | | 98,318 | | | | 211,386 | | | | — | | | | 309,704 | |
| Convertible bonds | | | — | | | | 115,965 | | | | — | | | | 115,965 | |
| Bonds, notes & other debt instruments: | | | | | | | | | | | | | | | | |
| Corporate bonds & notes | | | — | | | | 13,379,509 | | | | 2,363 | | | | 13,381,872 | |
| U.S. Treasury bonds & notes | | | — | | | | 2,421,013 | | | | — | | | | 2,421,013 | |
| Other | | | — | | | | 2,368,332 | | | | — | | | | 2,368,332 | |
| Miscellaneous | | | — | | | | 8,291 | | | | — | | | | 8,291 | |
| Short-term securities | | | — | | | | 4,491,026 | | | | — | | | | 4,491,026 | |
| Total | | $ | 52,688,138 | | | $ | 41,077,621 | | | $ | 17,120 | | | $ | 93,782,879 | |
See the following page for footnotes.
| The Income Fund of America | 23 |
| | | Other investments† |
| | | Level 1 | | Level 2 | | Level 3 | | Total |
| Assets: | | | | | | | | | | | | | | | | |
| Unrealized appreciation on open forward currency contracts | | $ | — | | | $ | 3,266 | | | $ | — | | | $ | 3,266 | |
| * | Securities with a value of $13,303,172,000, which represented 14.18% of the net assets of the fund, transferred from Level 1 to Level 2 since the prior fiscal year-end, primarily due to significant market movements following the close of local trading. |
| † | Forward currency contracts are not included in the investment portfolio. |
4. Risk factors
Investing in the fund may involve certain risks including, but not limited to, those described below.
Market conditions — The prices of, and the income generated by, the common stocks and other securities held by the fund may decline –sometimes rapidly or unpredictably – due to various factors, including events or conditions affecting the general economy or particular industries; overall market changes; local, regional or global political, social or economic instability; governmental or governmental agency responses to economic conditions; and currency, interest rate and commodity price fluctuations.
Issuer risks — The values of, and the income generated by, securities held by the fund may also decline in response to various factors directly related to the issuers of such securities, including reduced demand for an issuer’s goods or services, poor management performance and strategic initiatives such as mergers, acquisitions or dispositions and the market response to any such initiative.
Investing in income-oriented stocks — Income provided by the fund may be reduced by changes in the dividend policies of, and the capital resources available for dividend payments at, the companies in which the fund invests.
Investing in debt instruments — The prices of, and the income generated by, bonds and other debt securities held by the fund may be affected by changing interest rates and by changes in the effective maturities and credit ratings of these securities.
Rising interest rates will generally cause the prices of bonds and other debt securities to fall. Falling interest rates may cause an issuer to redeem, call or refinance a debt security before its stated maturity, which may result in the fund having to reinvest the proceeds in lower yielding securities. Longer maturity debt securities generally have higher rates of interest and may be subject to greater price fluctuations than shorter maturity debt securities.
Bonds and other debt securities are also subject to credit risk, which is the possibility that the credit strength of an issuer will weaken and/or an issuer of a debt security will fail to make timely payments of principal or interest and the security will go into default. Lower quality debt securities generally have higher rates of interest and may be subject to greater price fluctuations than higher quality debt securities. Credit risk is gauged, in part, by the credit ratings of the debt securities in which the fund invests. However, ratings are only the opinions of the rating agencies issuing them and are not guarantees as to credit quality or an evaluation of market risk. The fund’s investment adviser relies on its own credit analysts to research issuers and issues in seeking to mitigate various credit and default risks.
Investing in lower rated bonds — Lower rated bonds and other lower rated debt securities generally have higher rates of interest and involve greater risk of default or price declines due to changes in the issuer’s creditworthiness than those of higher quality debt securities. The market prices of these securities may fluctuate more than the prices of higher quality debt securities and may decline significantly in periods of general economic difficulty. These risks may be increased with respect to investments in junk bonds.
Investing outside the U.S. — Securities of issuers domiciled outside the U.S., or with significant operations outside the U.S., may lose value because of adverse political, social, economic or market developments in the countries or regions in which the issuers operate. These securities may also lose value due to changes in foreign currency exchange rates against the U.S. dollar and/or currencies of other countries. Securities markets in certain countries may be more volatile and/or less liquid than those in the U.S. Investments outside the U.S. may also be subject to different accounting practices and different regulatory, legal and reporting standards, and may be more difficult to value, than those in the U.S. In addition, the value of investments outside the U.S. may be reduced by foreign taxes, including foreign withholding taxes on interest and dividends. Further, there may be increased risks of delayed settlement of securities purchased or sold by the fund. The risks of investing outside the U.S. may be heightened in connection with investments in emerging markets.
| 24 | The Income Fund of America |
Management — The investment adviser to the fund actively manages the fund’s investments. Consequently, the fund is subject to the risk that the methods and analyses employed by the investment adviser in this process may not produce the desired results. This could cause the fund to lose value or its investment results to lag relevant benchmarks or other funds with similar objectives.
5. Certain investment techniques
Loan transactions — The fund has entered into loan transactions in which the fund acquires a loan either through an agent, by assignment from another holder, or as a participation interest in another holder’s portion of a loan. The loan is often administered by a financial institution that acts as agent for the holders of the loan, and the fund may be required to receive approval from the agent and/or borrower prior to the sale of the investment. The loan’s interest rate and maturity date may change based on the terms of the loan, including potential early payments of principal.
Forward currency contracts — The fund has entered into forward currency contracts, which represent agreements to exchange currencies on specific future dates at predetermined rates. The fund’s investment adviser uses forward currency contracts to manage the fund’s exposure to changes in exchange rates. Upon entering into these contracts, risks may arise from the potential inability of counterparties to meet the terms of their contracts and from possible movements in exchange rates.
On a daily basis, the fund’s investment adviser values forward currency contracts and records unrealized appreciation or depreciation for open forward currency contracts in the fund’s statement of assets and liabilities. Realized gains or losses are recorded at the time the forward currency contract is closed or offset by another contract with the same broker for the same settlement date and currency.
Closed forward currency contracts that have not reached their settlement date are included in the respective receivables or payables for closed forward currency contracts in the fund’s statement of assets and liabilities. Net realized gains or losses from closed forward currency contracts and net unrealized appreciation or depreciation from open forward currency contracts are recorded in the fund’s statement of operations.
The following tables present the financial statement impacts resulting from the fund’s use of forward currency contracts as of July 31, 2014 (dollars in thousands):
| | | Assets | | | Liabilities | |
| Contract | | Location on statement of assets
and liabilities | | Value | | | Location on statement of assets
and liabilities | | Value | |
| Forward currency | | Unrealized appreciation on open forward currency contracts | | $ | 3,266 | | | Payables for closed forward currency contracts | | $ | 110 | |
| | | | | | | | | | | | | |
| | | Net realized loss | | | Net unrealized appreciation | |
| Contract | | Location on statement of
operations | | Value | | | Location on statement of
operations | | Value | |
| Forward currency | | Net realized loss on forward currency contracts | | $ | (15,000 | ) | | Net unrealized appreciation on forward currency contracts | | $ | 3,266 | |
Collateral — The fund participates in a collateral program due to its use of forward currency contracts. The program calls for the fund to either receive or pledge collateral based on the net gain or loss on unsettled forward currency contracts by counterparty. The purpose of the collateral is to cover potential losses that could occur in the event that either party cannot meet its contractual obligations.
6. Taxation and distributions
Federal income taxation — The fund complies with the requirements under Subchapter M of the Internal Revenue Code applicable to mutual funds and intends to distribute substantially all of its net taxable income and net capital gains each year. The fund is not subject to income taxes to the extent such distributions are made. Therefore, no federal income tax provision is required.
As of and during the period ended July 31, 2014, the fund did not have a liability for any unrecognized tax benefits. The fund recognizes interest and penalties, if any, related to unrecognized tax benefits as income tax expense in the statement of operations. During the period, the fund did not incur any interest or penalties.
| The Income Fund of America | 25 |
The fund is not subject to examination by U.S. federal tax authorities for tax years before 2010 and by state tax authorities for tax years before 2009.
Non-U.S. taxation — Dividend and interest income are recorded net of non-U.S. taxes paid. Gains realized by the fund on the sale of securities in certain countries are subject to non-U.S. taxes. The fund records a liability based on unrealized gains to provide for potential non-U.S. taxes payable upon the sale of these securities.
Distributions — Distributions paid to shareholders are based on net investment income and net realized gains determined on a tax basis, which may differ from net investment income and net realized gains for financial reporting purposes. These differences are due primarily to different treatment for items such as currency gains and losses; short-term capital gains and losses; capital losses related to sales of certain securities within 30 days of purchase; unrealized appreciation of certain investments in securities outside the U.S.; cost of investments sold; paydowns on fixed-income securities; and net capital losses. The fiscal year in which amounts are distributed may differ from the year in which the net investment income and net realized gains are recorded by the fund for financial reporting purposes.
During the year ended July 31, 2014, the fund reclassified $45,000 from undistributed net investment income to capital paid in on shares of beneficial interest and $7,376,000 from accumulated net realized loss to undistributed net investment income to align financial reporting with tax reporting.
Under the Regulated Investment Company Modernization Act of 2010 (the “Act”), net capital losses recognized after July 31, 2011, may be carried forward indefinitely, and their character is retained as short-term and/or long-term losses. Previously, net capital losses were carried forward for eight years and treated as short-term losses. As a transition rule, the Act requires that post-enactment net capital losses be used before pre-enactment net capital losses.
As of July 31, 2014, the tax-basis components of distributable earnings, unrealized appreciation (depreciation) and cost of investment securities were as follows (dollars in thousands):
| Undistributed ordinary income | | $ | 915,712 | |
| Capital loss carryforward expiring 2018* | | | (1,962,845 | ) |
| Post-October capital loss deferral† | | | (38,646 | ) |
| Gross unrealized appreciation on investment securities | | | 18,888,294 | |
| Gross unrealized depreciation on investment securities | | | (929,687 | ) |
| Net unrealized appreciation on investment securities | | | 17,958,607 | |
| Cost of investment securities | | | 75,824,272 | |
| * | Reflects the utilization of capital loss carryforward of $2,896,009,000. The capital loss carryforward will be used to offset any capital gains realized by the fund in future years through the expiration date. The fund will not make distributions from capital gains while a capital loss carryforward remains. |
| † | This deferral is considered incurred in the subsequent year. |
Tax-basis distributions paid to shareholders from ordinary income were as follows (dollars in thousands):
| | | Year ended July 31 |
| Share class | | 2014 | | 2013 | |
| Class A | | $ | 2,166,322 | | $ | 2,171,974 | |
| Class B | | | 17,038 | | | 27,748 | |
| Class C | | | 157,610 | | | 178,582 | |
| Class F-1 | | | 128,654 | | | 107,595 | |
| Class F-2 | | | 60,710 | | | 46,177 | |
| Class 529-A | | | 42,937 | | | 42,441 | |
| Class 529-B | | | 894 | | | 1,393 | |
| Class 529-C | | | 10,460 | | | 10,954 | |
| Class 529-E | | | 1,762 | | | 1,814 | |
| Class 529-F-1 | | | 1,617 | | | 1,496 | |
| Class R-1 | | | 3,039 | | | 3,417 | |
| Class R-2 | | | 15,075 | | | 17,045 | |
| Class R-3 | | | 37,748 | | | 41,523 | |
| Class R-4 | | | 35,012 | | | 33,835 | |
| Class R-5 | | | 18,810 | | | 18,939 | |
| Class R-6 | | | 71,586 | | | 51,936 | |
| Total | | $ | 2,769,274 | | $ | 2,756,869 | |
| 26 | The Income Fund of America |
7. Fees and transactions with related parties
CRMC, the fund’s investment adviser, is the parent company of American Funds Distributors,® Inc. (“AFD”), the principal underwriter of the fund’s shares, and American Funds Service Company® (“AFS”), the fund’s transfer agent. CRMC, AFD and AFS are considered related parties to the fund.
Investment advisory services — The fund has an investment advisory and service agreement with CRMC that provides for monthly fees accrued daily. These fees are based on a series of decreasing annual rates beginning with 0.250% on the first $500 million of daily net assets and decreasing to 0.123% on such assets in excess of $89 billion. The agreement also provides for monthly fees, accrued daily, of 2.25% of the fund’s monthly gross income. For the year ended July 31, 2014, the investment advisory services fee was $206,680,000, which was equivalent to an annualized rate of 0.232% of average daily net assets.
Class-specific fees and expenses — Expenses that are specific to individual share classes are accrued directly to the respective share class. The principal class-specific fees and expenses are further described below:
Distribution services — The fund has plans of distribution for all share classes, except Class F-2, R-5 and R-6 shares. Under the plans, the board of trustees approves certain categories of expenses that are used to finance activities primarily intended to sell fund shares and service existing accounts. The plans provide for payments, based on an annualized percentage of average daily net assets, ranging from 0.25% to 1.00% as noted in this section. In some cases, the board of trustees has limited the amounts that may be paid to less than the maximum allowed by the plans. All share classes with a plan may use up to 0.25% of average daily net assets to pay service fees, or to compensate AFD for paying service fees, to firms that have entered into agreements with AFD to provide certain shareholder services. The remaining amounts available to be paid under each plan are paid to dealers to compensate them for their sales activities.
For Class A and 529-A shares, distribution-related expenses include the reimbursement of dealer and wholesaler commissions paid by AFD for certain shares sold without a sales charge. These share classes reimburse AFD for amounts billed within the prior 15 months but only to the extent that the overall annual expense limit of 0.25% is not exceeded. As of July 31, 2014, there were no unreimbursed expenses subject to reimbursement for Class A or 529-A shares.
| | Share class | | Currently approved limits | | Plan limits | |
| | Class A | | | 0.25 | % | | | 0.25 | % | |
| | Class 529-A | | | 0.25 | | | | 0.50 | | |
| | Classes B and 529-B | | | 1.00 | | | | 1.00 | | |
| | Classes C, 529-C and R-1 | | | 1.00 | | | | 1.00 | | |
| | Class R-2 | | | 0.75 | | | | 1.00 | | |
| | Classes 529-E and R-3 | | | 0.50 | | | | 0.75 | | |
| | Classes F-1, 529-F-1 and R-4 | | | 0.25 | | | | 0.50 | | |
Transfer agent services — The fund has a shareholder services agreement with AFS under which the fund compensates AFS for providing transfer agent services to each of the fund’s share classes. These services include recordkeeping, shareholder communications and transaction processing. In addition, the fund reimburses AFS for amounts paid to third parties for performing transfer agent services on behalf of fund shareholders.
Administrative services — The fund has an administrative services agreement with CRMC under which the fund compensates CRMC for providing administrative services to Class A, C, F, 529 and R shares. These services include, but are not limited to, coordinating, monitoring, assisting and overseeing third parties that provide services to fund shareholders. Under the agreement, Class A shares pay an annual fee of 0.01% and Class C, F, 529 and R shares pay an annual fee of 0.05% of their respective average daily net assets.
529 plan services — Each 529 share class is subject to service fees to compensate the Virginia College Savings Plan (Virginia529) for its oversight and administration of the 529 college savings plan. During the period August 1, 2013, to March 31, 2014, the quarterly fee was based on a series of decreasing annual rates beginning with 0.10% on the first $30 billion of the net assets invested in Class 529 shares of the American Funds and decreasing to 0.06% on such assets between $120 billion and $150 billion. Effective April 1, 2014, the quarterly fee was amended to provide for reduced annual rates of 0.07%, 0.06% and 0.05% over $30 billion, $50 billion and $70 billion, respectively, of the net assets invested in Class 529 shares of the American Funds. The fee for any given calendar quarter is accrued and calculated on the basis of the average net assets of Class 529 shares of the American Funds for the last month of the prior calendar quarter. The fee is included in other expenses in the fund’s statement of operations. The Virginia College Savings Plan (Virginia529) is not considered a related party to the fund.
| The Income Fund of America | 27 |
For the year ended July 31, 2014, class-specific expenses under the agreements were as follows (dollars in thousands):
| | Share class | | Distribution
services | | Transfer agent
services | | Administrative
services | | 529 plan
services |
| | Class A | | | $163,059 | | | | $51,201 | | | | $6,801 | | | Not applicable |
| | Class B | | | 7,053 | | | | 564 | | | | Not applicable | | | Not applicable |
| | Class C | | | 65,062 | | | | 4,956 | | | | 3,257 | | | Not applicable |
| | Class F-1 | | | 10,240 | | | | 4,413 | | | | 2,049 | | | Not applicable |
| | Class F-2 | | | Not applicable | | | | 1,981 | | | | 915 | | | Not applicable |
| | Class 529-A | | | 3,107 | | | | 802 | | | | 695 | | | $1,314 |
| | Class 529-B | | | 392 | | | | 28 | | | | 20 | | | 37 |
| | Class 529-C | | | 4,448 | | | | 285 | | | | 224 | | | 423 |
| | Class 529-E | | | 309 | | | | 18 | | | | 31 | | | 59 |
| | Class 529-F-1 | | | — | | | | 28 | | | | 24 | | | 46 |
| | Class R-1 | | | 1,268 | | | | 122 | | | | 63 | | | Not applicable |
| | Class R-2 | | | 4,612 | | | | 2,085 | | | | 310 | | | Not applicable |
| | Class R-3 | | | 6,638 | | | | 2,085 | | | | 668 | | | Not applicable |
| | Class R-4 | | | 2,799 | | | | 1,145 | | | | 561 | | | Not applicable |
| | Class R-5 | | | Not applicable | | | | 280 | | | | 277 | | | Not applicable |
| | Class R-6 | | | Not applicable | | | | 9 | | | | 1,038 | | | Not applicable |
| | Total class-specific expenses | | | $268,987 | | | | $70,002 | | | | $16,933 | | | $1,879 |
Trustees’ deferred compensation — Trustees who are unaffiliated with CRMC may elect to defer the cash payment of part or all of their compensation. These deferred amounts, which remain as liabilities of the fund, are treated as if invested in shares of the fund or other American Funds. These amounts represent general, unsecured liabilities of the fund and vary according to the total returns of the selected funds. Trustees’ compensation of $1,126,000 in the fund’s statement of operations includes $377,000 in current fees (either paid in cash or deferred) and a net increase of $749,000 in the value of the deferred amounts.
Affiliated officers and trustees — Officers and certain trustees of the fund are or may be considered to be affiliated with CRMC, AFD and AFS. No affiliated officers or trustees received any compensation directly from the fund.
8. Capital share transactions
Capital share transactions in the fund were as follows (dollars and shares in thousands):
| | | Sales* | | | Reinvestments
of dividends | | | Repurchases* | | | Net increase
(decrease) | |
| Share class | | Amount | | | Shares | | | Amount | | | Shares | | | Amount | | | Shares | | | Amount | | | Shares | |
| | | | | | | | | | | | | | | | | | | | | | | | | |
| Year ended July 31, 2014 | | | | | | | | | | | | | | | | | | |
| | | | | | | | | | | | | | | | | | | |
| Class A | | $ | 6,420,156 | | | | 311,526 | | | $ | 2,090,820 | | | | 102,005 | | | $ | (7,163,661 | ) | | | (347,576 | ) | | $ | 1,347,315 | | | | 65,955 | |
| Class B | | | 15,848 | | | | 780 | | | | 16,702 | | | | 824 | | | | (312,935 | ) | | | (15,329 | ) | | | (280,385 | ) | | | (13,725 | ) |
| Class C | | | 1,051,634 | | | | 51,585 | | | | 150,122 | | | | 7,408 | | | | (1,565,367 | ) | | | (76,875 | ) | | | (363,611 | ) | | | (17,882 | ) |
| Class F-1 | | | 1,447,794 | | | | 70,525 | | | | 124,418 | | | | 6,078 | | | | (1,659,394 | ) | | | (78,512 | ) | | | (87,182 | ) | | | (1,909 | ) |
| Class F-2 | | | 1,663,283 | | | | 78,324 | | | | 53,497 | | | | 2,597 | | | | (314,086 | ) | | | (15,206 | ) | | | 1,402,694 | | | | 65,715 | |
| Class 529-A | | | 179,862 | | | | 8,743 | | | | 42,926 | | | | 2,097 | | | | (179,607 | ) | | | (8,721 | ) | | | 43,181 | | | | 2,119 | |
| Class 529-B | | | 1,516 | | | | 74 | | | | 894 | | | | 44 | | | | (17,388 | ) | | | (850 | ) | | | (14,978 | ) | | | (732 | ) |
| Class 529-C | | | 67,037 | | | | 3,269 | | | | 10,457 | | | | 513 | | | | (67,255 | ) | | | (3,280 | ) | | | 10,239 | | | �� | 502 | |
| Class 529-E | | | 8,763 | | | | 427 | | | | 1,762 | | | | 86 | | | | (9,933 | ) | | | (484 | ) | | | 592 | | | | 29 | |
| Class 529-F-1 | | | 12,490 | | | | 608 | | | | 1,616 | | | | 79 | | | | (10,431 | ) | | | (506 | ) | | | 3,675 | | | | 181 | |
| Class R-1 | | | 25,667 | | | | 1,253 | | | | 3,020 | | | | 148 | | | | (26,991 | ) | | | (1,319 | ) | | | 1,696 | | | | 82 | |
| Class R-2 | | | 126,996 | | | | 6,209 | | | | 15,050 | | | | 742 | | | | (171,159 | ) | | | (8,400 | ) | | | (29,113 | ) | | | (1,449 | ) |
| Class R-3 | | | 263,971 | | | | 12,837 | | | | 37,671 | | | | 1,845 | | | | (384,619 | ) | | | (18,800 | ) | | | (82,977 | ) | | | (4,118 | ) |
| Class R-4 | | | 309,321 | | | | 15,045 | | | | 34,994 | | | | 1,709 | | | | (295,671 | ) | | | (14,388 | ) | | | 48,644 | | | | 2,366 | |
| Class R-5 | | | 187,464 | | | | 8,951 | | | | 18,802 | | | | 918 | | | | (213,083 | ) | | | (10,161 | ) | | | (6,817 | ) | | | (292 | ) |
| Class R-6 | | | 809,454 | | | | 39,104 | | | | 71,525 | | | | 3,478 | | | | (124,285 | ) | | | (6,015 | ) | | | 756,694 | | | | 36,567 | |
|
Total net increase
(decrease) | | $ | 12,591,256 | | | | 609,260 | | | $ | 2,674,276 | | | | 130,571 | | | $ | (12,515,865 | ) | | | (606,422 | ) | | $ | 2,749,667 | | | | 133,409 | |
| 28 | The Income Fund of America |
| | | Sales* | | | Reinvestments
of dividends | | | Repurchases* | | | Net increase
(decrease) | |
| Share class | | Amount | | | Shares | | | Amount | | | Shares | | | Amount | | | Shares | | | Amount | | | Shares | |
| |
| Year ended July 31, 2013 | | | | | | | | | | | | | | | | | | |
| | | | | | | | | | | | | | | | | | | |
| Class A | | $ | 6,799,757 | | | | 364,100 | | | $ | 2,086,314 | | | | 112,144 | | | $ | (7,414,778 | ) | | | (398,937 | ) | | $ | 1,471,293 | | | | 77,307 | |
| Class B | | | 26,969 | | | | 1,464 | | | | 27,089 | | | | 1,471 | | | | (501,122 | ) | | | (27,222 | ) | | | (447,064 | ) | | | (24,287 | ) |
| Class C | | | 916,082 | | | | 49,436 | | | | 168,957 | | | | 9,181 | | | | (1,450,582 | ) | | | (78,597 | ) | | | (365,543 | ) | | | (19,980 | ) |
| Class F-1 | | | 1,181,426 | | | | 63,117 | | | | 104,438 | | | | 5,616 | | | | (610,314 | ) | | | (32,789 | ) | | | 675,550 | | | | 35,944 | |
| Class F-2 | | | 472,751 | | | | 25,296 | | | | 40,087 | | | | 2,153 | | | | (227,692 | ) | | | (12,190 | ) | | | 285,146 | | | | 15,259 | |
| Class 529-A | | | 199,233 | | | | 10,735 | | | | 42,425 | | | | 2,284 | | | | (173,700 | ) | | | (9,356 | ) | | | 67,958 | | | | 3,663 | |
| Class 529-B | | | 2,397 | | | | 130 | | | | 1,392 | | | | 75 | | | | (21,711 | ) | | | (1,176 | ) | | | (17,922 | ) | | | (971 | ) |
| Class 529-C | | | 68,835 | | | | 3,713 | | | | 10,950 | | | | 591 | | | | (71,129 | ) | | | (3,849 | ) | | | 8,656 | | | | 455 | |
| Class 529-E | | | 8,507 | | | | 460 | | | | 1,814 | | | | 98 | | | | (9,309 | ) | | | (505 | ) | | | 1,012 | | | | 53 | |
| Class 529-F-1 | | | 10,094 | | | | 542 | | | | 1,496 | | | | 80 | | | | (7,795 | ) | | | (421 | ) | | | 3,795 | | | | 201 | |
| Class R-1 | | | 23,012 | | | | 1,239 | | | | 3,404 | | | | 184 | | | | (40,798 | ) | | | (2,215 | ) | | | (14,382 | ) | | | (792 | ) |
| Class R-2 | | | 152,857 | | | | 8,296 | | | | 17,014 | | | | 923 | | | | (190,058 | ) | | | (10,314 | ) | | | (20,187 | ) | | | (1,095 | ) |
| Class R-3 | | | 292,660 | | | | 15,756 | | | | 41,436 | | | | 2,235 | | | | (348,587 | ) | | | (18,798 | ) | | | (14,491 | ) | | | (807 | ) |
| Class R-4 | | | 301,902 | | | | 16,195 | | | | 33,823 | | | | 1,820 | | | | (272,131 | ) | | | (14,655 | ) | | | 63,594 | | | | 3,360 | |
| Class R-5 | | | 146,132 | | | | 7,769 | | | | 18,918 | | | | 1,018 | | | | (151,577 | ) | | | (8,195 | ) | | | 13,473 | | | | 592 | |
| Class R-6 | | | 549,910 | | | | 29,473 | | | | 51,849 | | | | 2,780 | | | | (136,550 | ) | | | (7,264 | ) | | | 465,209 | | | | 24,989 | |
Total net increase
(decrease) | | $ | 11,152,524 | | | | 597,721 | | | $ | 2,651,406 | | | | 142,653 | | | $ | (11,627,833 | ) | | | (626,483 | ) | | $ | 2,176,097 | | | | 113,891 | |
*Includes exchanges between share classes of the fund.
9. Investment transactions
The fund made purchases and sales of investment securities, excluding short-term securities and U.S. government obligations, if any, of $31,851,035,000 and $29,654,828,000, respectively, during the year ended July 31, 2014.
| The Income Fund of America | 29 |
Financial highlights
| | | | | | Income (loss) from investment operations1 | | | | | | | | | | | | | | | | | | | |
| | | Net asset
value,
beginning
of year | | | Net
investment
income2 | | | Net gains
(losses) on
securities
(both
realized and
unrealized) | | | Total from
investment
operations | | | Dividends
(from net
investment
income) | | | Net asset
value, end
of year | | | Total
return3 | | | Net assets,
end of year
(in millions) | | | Ratio of
expenses to
average net
assets | | | Ratio of
net income
to average
net assets2 | |
| Class A: | | | | | | | | | | | | | | | | | | | | | | | | | | | | | | | | | | | | | | | | |
| Year ended 7/31/2014 | | $ | 19.64 | | | $ | .78 | | | $ | 1.69 | | | $ | 2.47 | | | $ | (.66 | ) | | $ | 21.45 | | | | 12.78 | % | | $ | 71,290 | | | | .57 | % | | | 3.76 | % |
| Year ended 7/31/2013 | | | 17.66 | | | | .67 | | | | 1.99 | | | | 2.66 | | | | (.68 | ) | | | 19.64 | | | | 15.33 | | | | 63,968 | | | | .58 | | | | 3.58 | |
| Year ended 7/31/2012 | | | 16.97 | | | | .66 | | | | .73 | | | | 1.39 | | | | (.70 | ) | | | 17.66 | | | | 8.45 | | | | 56,153 | | | | .59 | | | | 3.92 | |
| Year ended 7/31/2011 | | | 15.48 | | | | .71 | | | | 1.53 | | | | 2.24 | | | | (.75 | ) | | | 16.97 | | | | 14.68 | | | | 52,940 | | | | .58 | | | | 4.24 | |
| Year ended 7/31/2010 | | | 14.04 | | | | .73 | | | | 1.37 | | | | 2.10 | | | | (.66 | ) | | | 15.48 | | | | 15.09 | | | | 48,437 | | | | .61 | | | | 4.82 | |
| Class B: | | | | | | | | | | | | | | | | | | | | | | | | | | | | | | | | | | | | | | | | |
| Year ended 7/31/2014 | | | 19.50 | | | | .61 | | | | 1.69 | | | | 2.30 | | | | (.50 | ) | | | 21.30 | | | | 11.92 | | | | 601 | | | | 1.32 | | | | 2.99 | |
| Year ended 7/31/2013 | | | 17.53 | | | | .53 | | | | 1.97 | | | | 2.50 | | | | (.53 | ) | | | 19.50 | | | | 14.48 | | | | 818 | | | | 1.33 | | | | 2.86 | |
| Year ended 7/31/2012 | | | 16.85 | | | | .53 | | | | .71 | | | | 1.24 | | | | (.56 | ) | | | 17.53 | | | | 7.56 | | | | 1,161 | | | | 1.34 | | | | 3.19 | |
| Year ended 7/31/2011 | | | 15.37 | | | | .58 | | | | 1.52 | | | | 2.10 | | | | (.62 | ) | | | 16.85 | | | | 13.82 | | | | 1,760 | | | | 1.34 | | | | 3.48 | |
| Year ended 7/31/2010 | | | 13.94 | | | | .60 | | | | 1.37 | | | | 1.97 | | | | (.54 | ) | | | 15.37 | | | | 14.24 | | | | 2,421 | | | | 1.38 | | | | 4.01 | |
| Class C: | | | | | | | | | | | | | | | | | | | | | | | | | | | | | | | | | | | | | | | | |
| Year ended 7/31/2014 | | | 19.42 | | | | .60 | | | | 1.69 | | | | 2.29 | | | | (.50 | ) | | | 21.21 | | | | 11.91 | | | | 6,597 | | | | 1.37 | | | | 2.95 | |
| Year ended 7/31/2013 | | | 17.47 | | | | .51 | | | | 1.97 | | | | 2.48 | | | | (.53 | ) | | | 19.42 | | | | 14.41 | | | | 6,389 | | | | 1.38 | | | | 2.79 | |
| Year ended 7/31/2012 | | | 16.80 | | | | .52 | | | | .71 | | | | 1.23 | | | | (.56 | ) | | | 17.47 | | | | 7.55 | | | | 6,096 | | | | 1.38 | | | | 3.13 | |
| Year ended 7/31/2011 | | | 15.33 | | | | .57 | | | | 1.51 | | | | 2.08 | | | | (.61 | ) | | | 16.80 | | | | 13.77 | | | | 6,157 | | | | 1.39 | | | | 3.43 | |
| Year ended 7/31/2010 | | | 13.91 | | | | .60 | | | | 1.36 | | | | 1.96 | | | | (.54 | ) | | | 15.33 | | | | 14.17 | | | | 5,882 | | | | 1.43 | | | | 4.00 | |
| Class F-1: | | | | | | | | | | | | | | | | | | | | | | | | | | | | | | | | | | | | | | | | |
| Year ended 7/31/2014 | | | 19.60 | | | | .76 | | | | 1.68 | | | | 2.44 | | | | (.64 | ) | | | 21.40 | | | | 12.66 | | | | 3,841 | | | | .65 | | | | 3.71 | |
| Year ended 7/31/2013 | | | 17.62 | | | | .65 | | | | 2.00 | | | | 2.65 | | | | (.67 | ) | | | 19.60 | | | | 15.30 | | | | 3,554 | | | | .65 | | | | 3.50 | |
| Year ended 7/31/2012 | | | 16.94 | | | | .65 | | | | .72 | | | | 1.37 | | | | (.69 | ) | | | 17.62 | | | | 8.35 | | | | 2,563 | | | | .64 | | | | 3.87 | |
| Year ended 7/31/2011 | | | 15.46 | | | | .70 | | | | 1.52 | | | | 2.22 | | | | (.74 | ) | | | 16.94 | | | | 14.58 | | | | 2,025 | | | | .64 | | | | 4.19 | |
| Year ended 7/31/2010 | | | 14.02 | | | | .73 | | | | 1.37 | | | | 2.10 | | | | (.66 | ) | | | 15.46 | | | | 15.08 | | | | 1,815 | | | | .65 | | | | 4.78 | |
| Class F-2: | | | | | | | | | | | | | | | | | | | | | | | | | | | | | | | | | | | | | | | | |
| Year ended 7/31/2014 | | | 19.63 | | | | .80 | | | | 1.71 | | | | 2.51 | | | | (.70 | ) | | | 21.44 | | | | 12.97 | | | | 2,975 | | | | .40 | | | | 3.89 | |
| Year ended 7/31/2013 | | | 17.65 | | | | .70 | | | | 1.99 | | | | 2.69 | | | | (.71 | ) | | | 19.63 | | | | 15.53 | | | | 1,434 | | | | .41 | | | | 3.74 | |
| Year ended 7/31/2012 | | | 16.97 | | | | .69 | | | | .72 | | | | 1.41 | | | | (.73 | ) | | | 17.65 | | | | 8.59 | | | | 1,020 | | | | .40 | | | | 4.09 | |
| Year ended 7/31/2011 | | | 15.48 | | | | .74 | | | | 1.53 | | | | 2.27 | | | | (.78 | ) | | | 16.97 | | | | 14.90 | | | | 747 | | | | .40 | | | | 4.42 | |
| Year ended 7/31/2010 | | | 14.04 | | | | .77 | | | | 1.36 | | | | 2.13 | | | | (.69 | ) | | | 15.48 | | | | 15.31 | | | | 460 | | | | .42 | | | | 5.04 | |
| Class 529-A: | | | | | | | | | | | | | | | | | | | | | | | | | | | | | | | | | | | | | | | | |
| Year ended 7/31/2014 | | | 19.60 | | | | .75 | | | | 1.70 | | | | 2.45 | | | | (.64 | ) | | | 21.41 | | | | 12.69 | | | | 1,463 | | | | .67 | | | | 3.66 | |
| Year ended 7/31/2013 | | | 17.63 | | | | .65 | | | | 1.98 | | | | 2.63 | | | | (.66 | ) | | | 19.60 | | | | 15.19 | | | | 1,298 | | | | .68 | | | | 3.48 | |
| Year ended 7/31/2012 | | | 16.95 | | | | .64 | | | | .72 | | | | 1.36 | | | | (.68 | ) | | | 17.63 | | | | 8.30 | | | | 1,102 | | | | .68 | | | | 3.82 | |
| Year ended 7/31/2011 | | | 15.46 | | | | .69 | | | | 1.53 | | | | 2.22 | | | | (.73 | ) | | | 16.95 | | | | 14.62 | | | | 939 | | | | .67 | | | | 4.15 | |
| Year ended 7/31/2010 | | | 14.03 | | | | .73 | | | | 1.35 | | | | 2.08 | | | | (.65 | ) | | | 15.46 | | | | 14.95 | | | | 753 | | | | .69 | | | | 4.77 | |
| Class 529-B: | | | | | | | | | | | | | | | | | | | | | | | | | | | | | | | | | | | | | | | | |
| Year ended 7/31/2014 | | | 19.55 | | | | .58 | | | | 1.70 | | | | 2.28 | | | | (.47 | ) | | | 21.36 | | | | 11.79 | | | | 34 | | | | 1.45 | | | | 2.85 | |
| Year ended 7/31/2013 | | | 17.57 | | | | .50 | | | | 1.99 | | | | 2.49 | | | | (.51 | ) | | | 19.55 | | | | 14.35 | | | | 45 | | | | 1.46 | | | | 2.73 | |
| Year ended 7/31/2012 | | | 16.89 | | | | .51 | | | | .71 | | | | 1.22 | | | | (.54 | ) | | | 17.57 | | | | 7.41 | | | | 58 | | | | 1.47 | | | | 3.06 | |
| Year ended 7/31/2011 | | | 15.41 | | | | .56 | | | | 1.52 | | | | 2.08 | | | | (.60 | ) | | | 16.89 | | | | 13.66 | | | | 76 | | | | 1.46 | | | | 3.37 | |
| Year ended 7/31/2010 | | | 13.98 | | | | .59 | | | | 1.37 | | | | 1.96 | | | | (.53 | ) | | | 15.41 | | | | 14.10 | | | | 92 | | | | 1.49 | | | | 3.92 | |
| Class 529-C: | | | | | | | | | | | | | | | | | | | | | | | | | | | | | | | | | | | | | | | | |
| Year ended 7/31/2014 | | | 19.53 | | | | .59 | | | | 1.69 | | | | 2.28 | | | | (.48 | ) | | | 21.33 | | | | 11.82 | | | | 470 | | | | 1.44 | | | | 2.88 | |
| Year ended 7/31/2013 | | | 17.56 | | | | .50 | | | | 1.99 | | | | 2.49 | | | | (.52 | ) | | | 19.53 | | | | 14.36 | | | | 420 | | | | 1.45 | | | | 2.71 | |
| Year ended 7/31/2012 | | | 16.89 | | | | .51 | | | | .71 | | | | 1.22 | | | | (.55 | ) | | | 17.56 | | | | 7.43 | | | | 370 | | | | 1.47 | | | | 3.04 | |
| Year ended 7/31/2011 | | | 15.41 | | | | .56 | | | | 1.53 | | | | 2.09 | | | | (.61 | ) | | | 16.89 | | | | 13.71 | | | | 331 | | | | 1.46 | | | | 3.37 | |
| Year ended 7/31/2010 | | | 13.99 | | | | .60 | | | | 1.35 | | | | 1.95 | | | | (.53 | ) | | | 15.41 | | | | 14.04 | | | | 281 | | | | 1.48 | | | | 3.97 | |
| Class 529-E: | | | | | | | | | | | | | | | | | | | | | | | | | | | | | | | | | | | | | | | | |
| Year ended 7/31/2014 | | | 19.55 | | | | .70 | | | | 1.69 | | | | 2.39 | | | | (.59 | ) | | | 21.35 | | | | 12.39 | | | | 65 | | | | .91 | | | | 3.41 | |
| Year ended 7/31/2013 | | | 17.58 | | | | .60 | | | | 1.99 | | | | 2.59 | | | | (.62 | ) | | | 19.55 | | | | 14.95 | | | | 59 | | | | .92 | | | | 3.24 | |
| Year ended 7/31/2012 | | | 16.91 | | | | .60 | | | | .71 | | | | 1.31 | | | | (.64 | ) | | | 17.58 | | | | 7.99 | | | | 52 | | | | .93 | | | | 3.57 | |
| Year ended 7/31/2011 | | | 15.43 | | | | .65 | | | | 1.52 | | | | 2.17 | | | | (.69 | ) | | | 16.91 | | | | 14.27 | | | | 44 | | | | .94 | | | | 3.88 | |
| Year ended 7/31/2010 | | | 14.00 | | | | .68 | | | | 1.36 | | | | 2.04 | | | | (.61 | ) | | | 15.43 | | | | 14.66 | | | | 35 | | | | .97 | | | | 4.49 | |
| 30 | The Income Fund of America |
| | | | | | Income (loss) from investment operations1 | | | | | | | | | | | | | | | | | | | |
| | | Net asset
value,
beginning
of year | | | Net
investment
income2 | | | Net gains
(losses) on
securities
(both
realized and
unrealized) | | | Total from
investment
operations | | | Dividends
(from net
investment
income) | | | Net asset
value, end
of year | | | Total
return3 | | | Net assets,
end of year
(in millions) | | | Ratio of
expenses to
average net
assets | | | Ratio of
net income
to average
net assets2 | |
| Class 529-F-1: | | | | | | | | | | | | | | | | | | | | | | | | | | | | | | | | | | | | | | | | |
| Year ended 7/31/2014 | | $ | 19.60 | | | $ | .80 | | | $ | 1.70 | | | $ | 2.50 | | | $ | (.69 | ) | | $ | 21.41 | | | | 12.94 | % | | $ | 52 | | | | .44 | % | | | 3.89 | % |
| Year ended 7/31/2013 | | | 17.63 | | | | .69 | | | | 1.98 | | | | 2.67 | | | | (.70 | ) | | | 19.60 | | | | 15.44 | | | | 44 | | | | .45 | | | | 3.70 | |
| Year ended 7/31/2012 | | | 16.95 | | | | .68 | | | | .72 | | | | 1.40 | | | | (.72 | ) | | | 17.63 | | | | 8.53 | | | | 36 | | | | .46 | | | | 4.04 | |
| Year ended 7/31/2011 | | | 15.46 | | | | .73 | | | | 1.53 | | | | 2.26 | | | | (.77 | ) | | | 16.95 | | | | 14.87 | | | | 31 | | | | .45 | | | | 4.37 | |
| Year ended 7/31/2010 | | | 14.03 | | | | .76 | | | | 1.35 | | | | 2.11 | | | | (.68 | ) | | | 15.46 | | | | 15.19 | | | | 22 | | | | .47 | | | | 4.99 | |
| Class R-1: | | | | | | | | | | | | | | | | | | | | | | | | | | | | | | | | | | | | | | | | |
| Year ended 7/31/2014 | | | 19.53 | | | | .60 | | | | 1.69 | | | | 2.29 | | | | (.49 | ) | | | 21.33 | | | | 11.88 | | | | 133 | | | | 1.39 | | | | 2.93 | |
| Year ended 7/31/2013 | | | 17.56 | | | | .52 | | | | 1.98 | | | | 2.50 | | | | (.53 | ) | | | 19.53 | | | | 14.43 | | | | 120 | | | | 1.39 | | | | 2.78 | |
| Year ended 7/31/2012 | | | 16.89 | | | | .52 | | | | .71 | | | | 1.23 | | | | (.56 | ) | | | 17.56 | | | | 7.50 | | | | 122 | | | | 1.40 | | | | 3.11 | |
| Year ended 7/31/2011 | | | 15.41 | | | | .57 | | | | 1.52 | | | | 2.09 | | | | (.61 | ) | | | 16.89 | | | | 13.76 | | | | 109 | | | | 1.41 | | | | 3.42 | |
| Year ended 7/31/2010 | | | 13.99 | | | | .61 | | | | 1.35 | | | | 1.96 | | | | (.54 | ) | | | 15.41 | | | | 14.10 | | | | 91 | | | | 1.44 | | | | 4.03 | |
| Class R-2: | | | | | | | | | | | | | | | | | | | | | | | | | | | | | | | | | | | | | | | | |
| Year ended 7/31/2014 | | | 19.45 | | | | .60 | | | | 1.68 | | | | 2.28 | | | | (.50 | ) | | | 21.23 | | | | 11.85 | | | | 635 | | | | 1.37 | | | | 2.95 | |
| Year ended 7/31/2013 | | | 17.49 | | | | .52 | | | | 1.98 | | | | 2.50 | | | | (.54 | ) | | | 19.45 | | | | 14.47 | | | | 609 | | | | 1.36 | | | | 2.80 | |
| Year ended 7/31/2012 | | | 16.82 | | | | .52 | | | | .71 | | | | 1.23 | | | | (.56 | ) | | | 17.49 | | | | 7.52 | | | | 567 | | | | 1.40 | | | | 3.11 | |
| Year ended 7/31/2011 | | | 15.35 | | | | .57 | | | | 1.51 | | | | 2.08 | | | | (.61 | ) | | | 16.82 | | | | 13.75 | | | | 552 | | | | 1.41 | | | | 3.41 | |
| Year ended 7/31/2010 | | | 13.93 | | | | .60 | | | | 1.35 | | | | 1.95 | | | | (.53 | ) | | | 15.35 | | | | 14.10 | | | | 518 | | | | 1.47 | | | | 3.97 | |
| Class R-3: | | | | | | | | | | | | | | | | | | | | | | | | | | | | | | | | | | | | | | | | |
| Year ended 7/31/2014 | | | 19.57 | | | | .69 | | | | 1.69 | | | | 2.38 | | | | (.58 | ) | | | 21.37 | | | | 12.35 | | | | 1,357 | | | | .94 | | | | 3.38 | |
| Year ended 7/31/2013 | | | 17.60 | | | | .60 | | | | 1.98 | | | | 2.58 | | | | (.61 | ) | | | 19.57 | | | | 14.91 | | | | 1,323 | | | | .94 | | | | 3.22 | |
| Year ended 7/31/2012 | | | 16.92 | | | | .60 | | | | .72 | | | | 1.32 | | | | (.64 | ) | | | 17.60 | | | | 8.01 | | | | 1,204 | | | | .96 | | | | 3.55 | |
| Year ended 7/31/2011 | | | 15.44 | | | | .64 | | | | 1.53 | | | | 2.17 | | | | (.69 | ) | | | 16.92 | | | | 14.23 | | | | 1,118 | | | | .96 | | | | 3.86 | |
| Year ended 7/31/2010 | | | 14.01 | | | | .68 | | | | 1.35 | | | | 2.03 | | | | (.60 | ) | | | 15.44 | | | | 14.63 | | | | 1,056 | | | | .99 | | | | 4.45 | |
| Class R-4: | | | | | | | | | | | | | | | | | | | | | | | | | | | | | | | | | | | | | | | | |
| Year ended 7/31/2014 | | | 19.61 | | | | .76 | | | | 1.70 | | | | 2.46 | | | | (.65 | ) | | | 21.42 | | | | 12.71 | | | | 1,192 | | | | .64 | | | | 3.67 | |
| Year ended 7/31/2013 | | | 17.63 | | | | .66 | | | | 1.99 | | | | 2.65 | | | | (.67 | ) | | | 19.61 | | | | 15.29 | | | | 1,045 | | | | .64 | | | | 3.52 | |
| Year ended 7/31/2012 | | | 16.95 | | | | .65 | | | | .72 | | | | 1.37 | | | | (.69 | ) | | | 17.63 | | | | 8.33 | | | | 880 | | | | .65 | | | | 3.86 | |
| Year ended 7/31/2011 | | | 15.46 | | | | .70 | | | | 1.53 | | | | 2.23 | | | | (.74 | ) | | | 16.95 | | | | 14.62 | | | | 809 | | | | .66 | | | | 4.17 | |
| Year ended 7/31/2010 | | | 14.03 | | | | .72 | | | | 1.36 | | | | 2.08 | | | | (.65 | ) | | | 15.46 | | | | 14.95 | | | | 740 | | | | .68 | | | | 4.77 | |
| Class R-5: | | | | | | | | | | | | | | | | | | | | | | | | | | | | | | | | | | | | | | | | |
| Year ended 7/31/2014 | | | 19.64 | | | | .82 | | | | 1.70 | | | | 2.52 | | | | (.71 | ) | | | 21.45 | | | | 13.03 | | | | 567 | | | | .34 | | | | 3.98 | |
| Year ended 7/31/2013 | | | 17.66 | | | | .71 | | | | 1.99 | | | | 2.70 | | | | (.72 | ) | | | 19.64 | | | | 15.60 | | | | 525 | | | | .34 | | | | 3.83 | |
| Year ended 7/31/2012 | | | 16.97 | | | | .70 | | | | .73 | | | | 1.43 | | | | (.74 | ) | | | 17.66 | | | | 8.70 | | | | 462 | | | | .35 | | | | 4.17 | |
| Year ended 7/31/2011 | | | 15.48 | | | | .75 | | | | 1.53 | | | | 2.28 | | | | (.79 | ) | | | 16.97 | | | | 14.94 | | | | 478 | | | | .36 | | | | 4.46 | |
| Year ended 7/31/2010 | | | 14.04 | | | | .77 | | | | 1.37 | | | | 2.14 | | | | (.70 | ) | | | 15.48 | | | | 15.36 | | | | 447 | | | | .38 | | | | 5.07 | |
| Class R-6: | | | | | | | | | | | | | | | | | | | | | | | | | | | | | | | | | | | | | | | | |
| Year ended 7/31/2014 | | | 19.65 | | | | .83 | | | | 1.70 | | | | 2.53 | | | | (.72 | ) | | | 21.46 | | | | 13.08 | | | | 2,566 | | | | .29 | | | | 4.03 | |
| Year ended 7/31/2013 | | | 17.66 | | | | .72 | | | | 2.00 | | | | 2.72 | | | | (.73 | ) | | | 19.65 | | | | 15.72 | | | | 1,631 | | | | .29 | | | | 3.85 | |
| Year ended 7/31/2012 | | | 16.98 | | | | .71 | | | | .72 | | | | 1.43 | | | | (.75 | ) | | | 17.66 | | | | 8.69 | | | | 1,025 | | | | .30 | | | | 4.21 | |
| Year ended 7/31/2011 | | | 15.49 | | | | .76 | | | | 1.52 | | | | 2.28 | | | | (.79 | ) | | | 16.98 | | | | 14.99 | | | | 758 | | | | .31 | | | | 4.51 | |
| Year ended 7/31/2010 | | | 14.05 | | | | .79 | | | | 1.35 | | | | 2.14 | | | | (.70 | ) | | | 15.49 | | | | 15.40 | | | | 480 | | | | .33 | | | | 5.20 | |
| 1 | Based on average shares outstanding. |
| 2 | For the year ended July 31, 2014, this column reflects the impact of a corporate action event that resulted in a one-time increase to net investment income. If the corporate action event had not occurred, the Class A net investment income per share and ratio of net income to average net assets would have been lower by $.11 and .51 percentage points, respectively. The impact to the other share classes would have been similar. |
| 3 | Total returns exclude any applicable sales charges, including contingent deferred sales charges. |
| | | Year ended July 31 |
| | | 2014 | | 2013 | | 2012 | | 2011 | | 2010 |
| Portfolio turnover rate for all share classes | | | 39 | % | | | 47 | % | | | 41 | % | | | 38 | % | | | 35 | % |
See Notes to Financial Statements
| The Income Fund of America | 31 |
Report of Independent Registered Public Accounting Firm
To the Shareholders and Board of Trustees of The Income Fund of America:
We have audited the accompanying statement of assets and liabilities of The Income Fund of America (the “Fund”), including the summary investment portfolio, as of July 31, 2014, and the related statement of operations for the year then ended, the statements of changes in net assets for each of the two years in the period then ended, and the financial highlights for each of the periods presented. These financial statements and financial highlights are the responsibility of the Fund’s management. Our responsibility is to express an opinion on these financial statements and financial highlights based on our audits.
We conducted our audits in accordance with the standards of the Public Company Accounting Oversight Board (United States). Those standards require that we plan and perform the audit to obtain reasonable assurance about whether the financial statements and financial highlights are free of material misstatement. The Fund is not required to have, nor were we engaged to perform, an audit of its internal control over financial reporting. Our audits included consideration of internal control over financial reporting as a basis for designing audit procedures that are appropriate in the circumstances, but not for the purpose of expressing an opinion on the effectiveness of the Fund’s internal control over financial reporting. Accordingly, we express no such opinion. An audit also includes examining, on a test basis, evidence supporting the amounts and disclosures in the financial statements, assessing the accounting principles used and significant estimates made by management, as well as evaluating the overall financial statement presentation. Our procedures included confirmation of securities owned as of July 31, 2014, by correspondence with the custodian and brokers; where replies were not received from brokers, we performed other auditing procedures. We believe that our audits provide a reasonable basis for our opinion.
In our opinion, such financial statements and financial highlights referred to above present fairly, in all material respects, the financial position of The Income Fund of America as of July 31, 2014, the results of its operations for the year then ended, the changes in its net assets for each of the two years in the period then ended, and the financial highlights for each of the periods presented, in conformity with accounting principles generally accepted in the United States of America.
Deloitte & Touche LLP
Costa Mesa, California
September 10, 2014
| 32 | The Income Fund of America |
As a fund shareholder, you incur two types of costs: (1) transaction costs, such as initial sales charges on purchase payments and contingent deferred sales charges on redemptions (loads), and (2) ongoing costs, including management fees, distribution and service (12b-1) fees, and other expenses. This example is intended to help you understand your ongoing costs (in dollars) of investing in the fund so you can compare these costs with the ongoing costs of investing in other mutual funds. The example is based on an investment of $1,000 invested at the beginning of the period and held for the entire six-month period (February 1, 2014, through July 31, 2014).
Actual expenses:
The first line of each share class in the table on the following page provides information about actual account values and actual expenses. You may use the information in this line, together with the amount you invested, to estimate the expenses that you paid over the period. Simply divide your account value by $1,000 (for example, an $8,600 account value divided by $1,000 = 8.6), then multiply the result by the number in the first line under the heading entitled “Expenses paid during period” to estimate the expenses you paid on your account during this period.
Hypothetical example for comparison purposes:
The second line of each share class in the table on the following page provides information about hypothetical account values and hypothetical expenses based on the actual expense ratio for the share class and an assumed rate of return of 5.00% per year before expenses, which is not the actual return of the share class. The hypothetical account values and expenses may not be used to estimate the actual ending account balance or expenses you paid for the period. You may use this information to compare the ongoing costs of investing in the fund and other funds. To do so, compare this 5.00% hypothetical example with the 5.00% hypothetical examples that appear in the shareholder reports of the other funds.
Notes:
Retirement plan participants may be subject to certain fees charged by the plan sponsor, and Class F-1, F-2 and 529-F-1 shareholders may be subject to fees charged by financial intermediaries, typically ranging from 0.75% to 1.50% of assets annually depending on services offered. You can estimate the impact of these fees by adding the amount of the fees to the total estimated expenses you paid on your account during the period as calculated above. In addition, your ending account value would be lower by the amount of these fees.
Note that the expenses shown in the table on the following page are meant to highlight your ongoing costs only and do not reflect any transactional costs, such as sales charges (loads). Therefore, the second line of each share class in the table is useful in comparing ongoing costs only and will not help you determine the relative total costs of owning different funds. In addition, if these transactional costs were included, your costs would have been higher.
| The Income Fund of America | 33 |
| | | Beginning
account value
2/1/2014 | | | Ending
account value
7/31/2014 | | | Expenses paid
during period* | | | Annualized
expense ratio | |
| Class A – actual return | | $ | 1,000.00 | | | $ | 1,075.35 | | | $ | 2.98 | | | | .58 | % |
| Class A – assumed 5% return | | | 1,000.00 | | | | 1,021.92 | | | | 2.91 | | | | .58 | |
| Class B – actual return | | | 1,000.00 | | | | 1,071.18 | | | | 6.83 | | | | 1.33 | |
| Class B – assumed 5% return | | | 1,000.00 | | | | 1,018.20 | | | | 6.66 | | | | 1.33 | |
| Class C – actual return | | | 1,000.00 | | | | 1,070.91 | | | | 7.09 | | | | 1.38 | |
| Class C – assumed 5% return | | | 1,000.00 | | | | 1,017.95 | | | | 6.90 | | | | 1.38 | |
| Class F-1 – actual return | | | 1,000.00 | | | | 1,074.58 | | | | 3.39 | | | | .66 | |
| Class F-1 – assumed 5% return | | | 1,000.00 | | | | 1,021.52 | | | | 3.31 | | | | .66 | |
| Class F-2 – actual return | | | 1,000.00 | | | | 1,076.33 | | | | 2.06 | | | | .40 | |
| Class F-2 – assumed 5% return | | | 1,000.00 | | | | 1,022.81 | | | | 2.01 | | | | .40 | |
| Class 529-A – actual return | | | 1,000.00 | | | | 1,074.46 | | | | 3.50 | | | | .68 | |
| Class 529-A – assumed 5% return | | | 1,000.00 | | | | 1,021.42 | | | | 3.41 | | | | .68 | |
| Class 529-B – actual return | | | 1,000.00 | | | | 1,070.26 | | | | 7.49 | | | | 1.46 | |
| Class 529-B – assumed 5% return | | | 1,000.00 | | | | 1,017.55 | | | | 7.30 | | | | 1.46 | |
| Class 529-C – actual return | | | 1,000.00 | | | | 1,070.68 | | | | 7.44 | | | | 1.45 | |
| Class 529-C – assumed 5% return | | | 1,000.00 | | | | 1,017.60 | | | | 7.25 | | | | 1.45 | |
| Class 529-E – actual return | | | 1,000.00 | | | | 1,073.37 | | | | 4.73 | | | | .92 | |
| Class 529-E – assumed 5% return | | | 1,000.00 | | | | 1,020.23 | | | | 4.61 | | | | .92 | |
| Class 529-F-1 – actual return | | | 1,000.00 | | | | 1,075.66 | | | | 2.32 | | | | .45 | |
| Class 529-F-1 – assumed 5% return | | | 1,000.00 | | | | 1,022.56 | | | | 2.26 | | | | .45 | |
| Class R-1 – actual return | | | 1,000.00 | | | | 1,070.94 | | | | 7.19 | | | | 1.40 | |
| Class R-1 – assumed 5% return | | | 1,000.00 | | | | 1,017.85 | | | | 7.00 | | | | 1.40 | |
| Class R-2 – actual return | | | 1,000.00 | | | | 1,070.80 | | | | 7.19 | | | | 1.40 | |
| Class R-2 – assumed 5% return | | | 1,000.00 | | | | 1,017.85 | | | | 7.00 | | | | 1.40 | |
| Class R-3 – actual return | | | 1,000.00 | | | | 1,073.09 | | | | 4.93 | | | | .96 | |
| Class R-3 – assumed 5% return | | | 1,000.00 | | | | 1,020.03 | | | | 4.81 | | | | .96 | |
| Class R-4 – actual return | | | 1,000.00 | | | | 1,075.09 | | | | 3.40 | | | | .66 | |
| Class R-4 – assumed 5% return | | | 1,000.00 | | | | 1,021.52 | | | | 3.31 | | | | .66 | |
| Class R-5 – actual return | | | 1,000.00 | | | | 1,076.53 | | | | 1.85 | | | | .36 | |
| Class R-5 – assumed 5% return | | | 1,000.00 | | | | 1,023.01 | | | | 1.81 | | | | .36 | |
| Class R-6 – actual return | | | 1,000.00 | | | | 1,076.80 | | | | 1.54 | | | | .30 | |
| Class R-6 – assumed 5% return | | | 1,000.00 | | | | 1,023.31 | | | | 1.51 | | | | .30 | |
| * | The “expenses paid during period” are equal to the “annualized expense ratio,” multiplied by the average account value over the period, multiplied by the number of days in the period, and divided by 365 (to reflect the one-half year period). |
We are required to advise you of the federal tax status of certain distributions received by shareholders during the fiscal year. The fund hereby designates the following amounts for the fund’s fiscal year ended July 31, 2014:
| Qualified dividend income | | $ | 2,611,350,000 |
| Corporate dividends received deduction | | $ | 1,629,541,000 |
| U.S. government income that may be exempt from state taxation | | $ | 43,139,000 |
Individual shareholders should refer to their Form 1099 or other tax information, which will be mailed in January 2015, to determine the calendar year amounts to be included on their 2014 tax returns. Shareholders should consult their tax advisors.
| 34 | The Income Fund of America |
Board of trustees and other officers
“Independent” trustees1
| Name and age | | Year first elected
a trustee
of the fund2 | | Principal occupation(s) during past five years | | Number of
portfolios in fund
complex overseen
by trustee | | Other directorships3
held by trustee |
| William H. Baribault, 69 | | 2012 | | CEO and President, Richard Nixon Foundation; former Chairman of the Board and CEO, Oakwood Enterprises (private investment and consulting) | | 70 | | None |
| Vanessa C. L. Chang, 62 | | 2012 | | Director, EL & EL Investments (real estate) | | 7 | | Edison International; Transocean Ltd. |
| Linda Griego, 66 | | 2012 | | President and CEO, Griego Enterprises, Inc. (business management company) | | 4 | | AECOM Technology Corporation; CBS Corporation |
| Leonade D. Jones, 66 | | 1993 | | Retired; former Treasurer, The Washington Post Company (retired 1996) | | 10 | | None |
| William D. Jones, 59 | | 2008 | | Real estate developer/owner, President and CEO, CityLink Investment Corporation (acquires, develops and manages real estate ventures in selected urban communities) and City Scene Management Company (provides commercial asset and property management services) | | 8 | | Sempra Energy |
| James J. Postl, 68 | | 2008 | | Retired; former President and CEO, Pennzoil-Quaker State Company (automotive products and services) (retired 2002) | | 4 | | Pulte, Inc. |
| Margaret Spellings, 56 | | 2012 | | President, George W. Bush Foundation; former President and CEO, Margaret Spellings & Company (public policy and strategic consulting); former President, U.S. Chamber Foundation and Senior Advisor to the President and CEO, U.S. Chamber of Commerce; former U.S. Secretary of Education, U.S. Department of Education | | 70 | | None |
Isaac Stein, 67
Chairman of the Board
(Independent and Non-Executive) | | 2004 | | President, Waverley Associates (private investment fund); Chairman Emeritus of the Board of Trustees, Stanford University | | 4 | | Alexza Pharmaceuticals, Inc.; Maxygen, Inc. |
“Interested” trustee4,5
Name, age and
position with fund | | Year first
elected
a trustee
or officer
of the fund2 | | Principal occupation(s) during past five years and positions held with affiliated entities or the principal underwriter of the fund | | Number of
portfolios in fund
complex overseen
by trustee | | Other directorships3
held by trustee |
Hilda L. Applbaum, 53
Vice Chairman of the Board | | 1998 | | Senior Vice President – Capital World Investors, Capital Research and Management Company | | 1 | | None |
The fund’s statement of additional information includes further details about fund trustees and is available without charge upon request by calling American Funds Service Company at (800) 421-4225 or by visiting the American Funds website at americanfunds.com. The address for all trustees and officers of the fund is 333 South Hope Street, Los Angeles, CA 90071, Attention: Secretary.
See page 36 for footnotes.
| The Income Fund of America | 35 |
Other officers5
Name, age and
position with fund | | Year first
elected
an officer
of the fund2 | | Principal occupation(s) during past five years and positions held with affiliated entities
or the principal underwriter of the fund |
David C. Barclay, 57
President | | 1998 | | Senior Vice President — Capital Fixed Income Investors, Capital Research and Management Company; Director, Capital Research and Management Company |
Dina N. Perry, 68
Senior Vice President | | 1994 | | Senior Vice President — Capital World Investors, Capital Research and Management Company; Director, The Capital Group Companies, Inc.6 |
Paul F. Roye, 60
Senior Vice President | | 2007 | | Senior Vice President — Fund Business Management Group, Capital Research and Management Company; Chief Legal Officer, Capital Research and Management Company; Director, American Funds Service Company6 |
Andrew B. Suzman, 47
Senior Vice President | | 2004 | | Senior Vice President — Capital World Investors, Capital Research and Management Company; Senior Vice President — Capital World Investors, Capital Bank and Trust Company;6 Director, American Funds Distributors, Inc.;6 Director, Capital Strategy Research, Inc.;6 Director, The Capital Group Companies, Inc.6 |
Joanna F. Jonsson, 51
Vice President |
| 2006
|
| Director, Capital Research and Management Company;
Senior Vice President — Capital World Investors, Capital Research Company;6 Director, Capital International Limited6 |
Donald H. Rolfe, 42
Vice President | | 2012 | | Chief Compliance Officer, Capital Research Company;6 Chief Compliance Officer, Capital Research and Management Company; Vice President and Senior Counsel — Fund Business Management Group, Capital Research and Management Company |
John H. Smet, 58
Vice President | | 1994 | | Senior Vice President — Capital Fixed Income Investors, Capital Research and Management Company; Director, Capital Research and Management Company |
Steven T. Watson, 59
Vice President | | 2006 | | Director, Capital Research Company;6 Senior Vice President — Capital World Investors, Capital International, Inc.;6 Senior Vice President — Capital World Investors, Capital Bank and Trust Company6 |
Michael W. Stockton, 47
Secretary | | 2014 | | Vice President — Fund Business Management Group, Capital Research and Management Company |
Jeffrey P. Regal, 43
Treasurer | | 2011 | | Vice President — Investment Operations, Capital Research and Management Company |
Julie E. Lawton, 41
Assistant Secretary | | 2009 | | Assistant Vice President — Fund Business Management Group, Capital Research and Management Company |
Dori Laskin, 63
Assistant Treasurer | | 2011 | | Vice President — Investment Operations, Capital Research and Management Company |
Ari M. Vinocor, 39
Assistant Treasurer | | 2012 | | Vice President — Investment Operations, Capital Research and Management Company |
| 1 | The term “independent” trustee refers to a trustee who is not an “interested person” of the fund within the meaning of the Investment Company Act of 1940. |
| 2 | Trustees and officers of the fund serve until their resignation, removal or retirement. |
| 3 | This includes all directorships (other than those in the American Funds or other funds managed by Capital Research and Management Company or its affiliates) that are held by each trustee as a trustee or director of a public company or a registered investment company. |
| 4 | The term “interested” trustee refers to a trustee who is an “interested person” within the meaning of the Investment Company Act of 1940, on the basis of their affiliation with the fund’s investment adviser, Capital Research and Management Company, or affiliated entities (including the fund’s principal underwriter). |
| 5 | All of the directors/trustees and/or officers listed are officers and/or directors/trustees of one or more of the other funds for which Capital Research and Management Company serves as investment adviser. |
| 6 | Company affiliated with Capital Research and Management Company. |
| 36 | The Income Fund of America |
Office of the fund
One Market
Steuart Tower, Suite 2000
San Francisco, CA 94105-1409
Investment adviser
Capital Research and Management Company
333 South Hope Street
Los Angeles, CA 90071-1406
6455 Irvine Center Drive
Irvine, CA 92618-4518
Transfer agent for shareholder accounts
American Funds Service Company
(Write to the address near you.)
P.O. Box 6007
Indianapolis, IN 46206-6007
P.O. Box 2280
Norfolk, VA 23501-2280
Custodian of assets
JPMorgan Chase Bank
270 Park Avenue
New York, NY 10017-2070
Counsel
Bingham McCutchen LLP
355 South Grand Avenue, Suite 4400
Los Angeles, CA 90071-3106
Independent registered public accounting firm
Deloitte & Touche LLP
695 Town Center Drive
Suite 1200
Costa Mesa, CA 92626-7188
Principal underwriter
American Funds Distributors, Inc.
333 South Hope Street
Los Angeles, CA 90071-1406
Investors should carefully consider investment objectives, risks, charges and expenses. This and other important information is contained in the fund prospectus and summary prospectus, which can be obtained from your financial professional and should be read carefully before investing. You may also call American Funds Service Company (AFS) at (800) 421-4225 or visit the American Funds website at americanfunds.com.
“American Funds Proxy Voting Procedures and Principles” — which describes how we vote proxies relating to portfolio securities — is available on the American Funds website or upon request by calling AFS. The fund files its proxy voting record with the U.S. Securities and Exchange Commission (SEC) for the 12 months ended June 30 by August 31. The proxy voting record is available free of charge on the SEC website at sec.gov and on the American Funds website.
A complete July 31, 2014, portfolio of The Income Fund of America’s investments is available free of charge by calling AFS or visiting the SEC website (where it is part of Form N-CSR).
The Income Fund of America files a complete list of its portfolio holdings with the SEC for the first and third quarters of each fiscal year on Form N-Q. This filing is available free of charge on the SEC website. You may also review or, for a fee, copy this filing at the SEC’s Public Reference Room in Washington, D.C. Additional information regarding the operation of the Public Reference Room may be obtained by calling the SEC’s Office of Investor Education and Advocacy at (800) SEC-0330. Additionally, the list of portfolio holdings is available by calling AFS.
This report is for the information of shareholders of The Income Fund of America, but it also may be used as sales literature when preceded or accompanied by the current prospectus or summary prospectus, which gives details about charges, expenses, investment objectives and operating policies of the fund. If used as sales material after September 30, 2014, this report must be accompanied by an American Funds statistical update for the most recently completed calendar quarter.
The American Funds Advantage
Since 1931, American Funds, part of Capital Group, has helped investors pursue long-term investment success. Our consistent approach — in combination with The Capital SystemSM — has resulted in a superior long-term track record.
| | Aligned with investor success |
| | We base our decisions on a long-term perspective, which we believe aligns our goals with the interests of our clients. Our portfolio managers average 26 years of investment experience, including 21 years at our company, reflecting a career commitment to our long-term approach.1 |
| | |
| | The Capital SystemSM |
| | Our investment process, The Capital System, combines individual accountability with teamwork. Each fund is divided into portions that are managed independently by investment professionals with diverse backgrounds, ages and investment approaches. An extensive global research effort is the backbone of our system. |
| | |
| | Superior long-term track record |
| | Our equity funds have beaten their Lipper peer indexes in 90% of 10-year periods and 96% of 20-year periods. Our fixed-income funds have beaten their Lipper indexes in 56% of 10-year periods and 57% of 20-year periods.2 Our fund management fees have been among the lowest in the industry.3 |
| | 1 | Portfolio manager experience as of December 31, 2013. |
| | 2 | Based on Class A share results for rolling periods through December 31, 2013. Periods covered are the shorter of the fund’s lifetime or since the comparable Lipper index inception date (except SMALLCAP World Fund, for which the Lipper average was used). |
| | 3 | Based on management fees for the 20-year period ended December 31, 2013, versus comparable Lipper categories, excluding funds of funds. |

ITEM 2 – Code of Ethics
The Registrant has adopted a Code of Ethics that applies to its Principal Executive Officer and Principal Financial Officer. The Registrant undertakes to provide to any person without charge, upon request, a copy of the Code of Ethics. Such request can be made to American Funds Service Company at 800/421-9225 or to the Secretary of the Registrant, One Market, Steuart Tower, Suite 2000, San Francisco, California 94105.
ITEM 3 – Audit Committee Financial Expert
The Registrant’s board has determined that Vanessa C. L. Chang, a member of the Registrant’s audit committee, is an “audit committee financial expert” and "independent," as such terms are defined in this Item. This designation will not increase the designee’s duties, obligations or liability as compared to his or her duties, obligations and liability as a member of the audit committee and of the board, nor will it reduce the responsibility of the other audit committee members. There may be other individuals who, through education or experience, would qualify as "audit committee financial experts" if the board had designated them as such. Most importantly, the board believes each member of the audit committee contributes significantly to the effective oversight of the Registrant’s financial statements and condition.
ITEM 4 – Principal Accountant Fees and Services
| | Registrant: |
| | | a) Audit Fees: |
| | | | 2013 | $134,000 |
| | | | 2014 | $138,000 |
| | | | |
| | | b) Audit-Related Fees: |
| | | | 2013 | $25,000 |
| | | | 2014 | $28,000 |
| | | | The audit-related fees consist of assurance and related services relating to the examination of the Registrant’s investment adviser conducted in accordance with Statement on Standards for Attestation Engagements Number 16 issued by the American Institute of Certified Public Accountants. |
| | | | |
| | | c) Tax Fees: |
| | | | 2013 | $7,000 |
| | | | 2014 | $1,000 |
| | | | The tax fees consist of professional services relating to the preparation of the Registrant’s tax returns including returns relating to the Registrant’s investments in non-U.S. jurisdictions. |
| | | | |
| | | d) All Other Fees: |
| | | | 2013 | None |
| | | | 2014 | None |
| | | | |
| | Adviser and affiliates (includes only fees for non-audit services billed to the adviser and affiliates for engagements that relate directly to the operations and financial reporting of the Registrant and were subject to the pre-approval policies described below): |
| | | a) Audit Fees: |
| | | | Not Applicable |
| | | | |
| | | b) Audit-Related Fees: |
| | | | 2013 | $1,280,000 |
| | | | 2014 | $730,000 |
| | | | The audit-related fees consist of assurance and related services relating to the examination of the Registrant’s transfer agent, principal underwriter and investment adviser conducted in accordance with Statement on Standards for Attestation Engagements Number 16 issued by the American Institute of Certified Public Accountants. |
| | | | |
| | | c) Tax Fees: |
| | | | 2013 | $28,000 |
| | | | 2014 | $41,000 |
| | | | The tax fees consist of consulting services relating to the Registrant’s investments. |
| | | | |
| | | d) All Other Fees: |
| | | | 2013 | $2,000 |
| | | | 2014 | $3,000 |
| | | | The other fees consist of subscription services related to an accounting research tool. |
| | | | |
All audit and permissible non-audit services that the Registrant’s audit committee considers compatible with maintaining the independent registered public accounting firm’s independence are required to be pre-approved by the committee. The pre-approval requirement will extend to all non-audit services provided to the Registrant, the investment adviser, and any entity controlling, controlled by, or under common control with the investment adviser that provides ongoing services to the Registrant, if the engagement relates directly to the operations and financial reporting of the Registrant. The committee will not delegate its responsibility to pre-approve these services to the investment adviser. The committee may delegate to one or more committee members the authority to review and pre-approve audit and permissible non-audit services. Actions taken under any such delegation will be reported to the full committee at its next meeting. The pre-approval requirement is waived with respect to non-audit services if certain conditions are met. The pre-approval requirement was not waived for any of the non-audit services listed above provided to the Registrant, adviser and affiliates.
Aggregate non-audit fees paid to the Registrant’s auditors, including fees for all services billed to the Registrant, adviser and affiliates that provide ongoing services to the Registrant, were $1,718,000 for fiscal year 2013 and $1,181,000 for fiscal year 2014. The non-audit services represented by these amounts were brought to the attention of the committee and considered to be compatible with maintaining the auditors’ independence.
ITEM 5 – Audit Committee of Listed Registrants
Not applicable to this Registrant, insofar as the Registrant is not a listed issuer as defined in Rule 10A-3 under the Securities Exchange Act of 1934.
ITEM 6 – Schedule of Investments
The Income Fund of America®
Investment portfolio
July 31, 2014
Common stocks 74.81%
Health care 10.49% | Shares | Value
(000) |
| Merck & Co., Inc. | 49,692,840 | $2,819,572 |
| Bristol-Myers Squibb Co. | 32,912,500 | 1,666,031 |
| Pfizer Inc. | 56,230,000 | 1,613,801 |
| AstraZeneca PLC1 | 18,841,700 | 1,372,720 |
| AbbVie Inc. | 8,520,000 | 445,937 |
| Johnson & Johnson | 3,945,000 | 394,855 |
| Novartis AG1 | 3,762,000 | 328,383 |
| Novartis AG (ADR) | 500,000 | 43,470 |
| Eli Lilly and Co. | 6,000,000 | 366,360 |
| Roche Holding AG1 | 1,100,000 | 319,576 |
| Healthscope Ltd.1,2,3 | 101,831,569 | 213,868 |
| Baxter International Inc. | 2,675,000 | 199,796 |
| Sonic Healthcare Ltd.1 | 3,000,000 | 50,221 |
| Rotech Healthcare Inc.1,2,3 | 543,172 | 7,333 |
| | | 9,841,923 |
| Industrials 9.66% | | |
| General Electric Co. | 74,980,000 | 1,885,747 |
| Lockheed Martin Corp. | 7,567,400 | 1,263,529 |
| Waste Management, Inc.3 | 27,982,868 | 1,256,151 |
| BAE Systems PLC1 | 81,823,984 | 590,537 |
| Iron Mountain Inc.3 | 12,457,211 | 417,441 |
| Hubbell Inc., Class B | 3,430,000 | 401,104 |
| KONE Oyj, Class B1 | 9,136,000 | 383,994 |
| Masco Corp. | 15,796,751 | 328,572 |
| Norfolk Southern Corp. | 3,000,000 | 304,980 |
| Siemens AG1 | 2,370,000 | 293,201 |
| Ryanair Holdings PLC (ADR)2 | 4,615,000 | 244,549 |
| R.R. Donnelley & Sons Co.3 | 13,345,400 | 231,676 |
| PACCAR Inc | 3,382,500 | 210,628 |
| Delta Air Lines, Inc. | 4,840,000 | 181,306 |
| Boeing Co. | 1,500,000 | 180,720 |
| Abertis Infraestructuras, SA, Class A1 | 7,842,975 | 171,641 |
| United Technologies Corp. | 1,500,000 | 157,725 |
| Honeywell International Inc. | 1,575,000 | 144,632 |
| Randstad Holding NV1 | 2,801,000 | 138,501 |
| Schneider Electric SE1 | 1,407,606 | 118,415 |
| Geberit AG1 | 158,758 | 53,172 |
| CEVA Group PLC1,2,4 | 35,228 | 40,513 |
| Atlas Copco AB, Class B1 | 1,195,000 | 32,219 |
| Douglas Dynamics, Inc.3 | 1,444,000 | 24,115 |
| Vallourec SA1 | 217,491 | 9,585 |
| Atrium Corp.1,2,4 | 1,807 | 2 |
| | | 9,064,655 |
The Income Fund of America — Page 1 of 32
Common stocks
Financials 9.50% | Shares | Value
(000) |
| Wells Fargo & Co. | 21,692,000 | $1,104,123 |
| JPMorgan Chase & Co. | 15,130,200 | 872,559 |
| Banco Santander, SA1,2 | 76,499,601 | 768,815 |
| Banco Santander, SA, interim shares, non-registered shares1,2 | 1,561,216 | 15,690 |
| CME Group Inc., Class A | 10,140,400 | 749,781 |
| Suncorp Group Ltd.1 | 51,279,898 | 676,599 |
| HSBC Holdings PLC (GBP denominated)1 | 30,420,722 | 325,664 |
| HSBC Holdings PLC (HKD denominated)1 | 28,586,382 | 307,117 |
| Digital Realty Trust, Inc.3 | 8,346,000 | 537,399 |
| Weyerhaeuser Co.2 | 11,640,213 | 364,572 |
| Public Storage | 2,090,000 | 358,665 |
| Equity Residential | 4,225,000 | 273,146 |
| Prudential PLC1 | 11,775,000 | 271,142 |
| BlackRock, Inc. | 650,000 | 198,075 |
| McGraw Hill Financial, Inc. | 2,219,400 | 178,040 |
| Kimco Realty Corp. | 7,835,000 | 175,347 |
| AXA SA1 | 7,595,000 | 173,934 |
| British Land Co. PLC1 | 14,530,431 | 171,950 |
| Sun Hung Kai Properties Ltd.1 | 11,214,234 | 169,887 |
| HCP, Inc. | 4,014,800 | 166,735 |
| Cullen/Frost Bankers, Inc. | 1,700,000 | 132,549 |
| Health Care REIT, Inc. | 1,855,000 | 118,034 |
| Link Real Estate Investment Trust1 | 20,401,812 | 115,595 |
| Arthur J. Gallagher & Co. | 2,500,000 | 112,500 |
| Macerich Co. | 1,620,000 | 105,316 |
| Toronto-Dominion Bank | 1,600,000 | 83,672 |
| SEGRO PLC1 | 13,460,309 | 81,099 |
| Bank of Nova Scotia | 910,065 | 61,773 |
| Northwest Bancshares, Inc.3 | 4,850,000 | 60,140 |
| Allianz SE1 | 350,000 | 58,502 |
| New York Community Bancorp, Inc. | 3,065,000 | 48,672 |
| Redwood Trust, Inc. | 2,479,888 | 47,068 |
| City Holding Co. | 741,000 | 30,863 |
| American Tower Corp. | 42,271 | 3,990 |
| Prime AET&D Holdings No 1 Pty Ltd.1,2 | 22,756,141 | — |
| | | 8,919,013 |
| Information technology 8.07% | | |
| Microsoft Corp. | 60,846,100 | 2,626,118 |
| Cisco Systems, Inc. | 51,980,000 | 1,311,455 |
| Texas Instruments Inc. | 19,380,000 | 896,325 |
| Analog Devices, Inc. | 11,650,000 | 578,189 |
| Taiwan Semiconductor Manufacturing Co. Ltd.1 | 127,503,000 | 512,262 |
| Intel Corp. | 13,000,000 | 440,570 |
| KLA-Tencor Corp. | 3,250,730 | 232,395 |
| Quanta Computer Inc.1 | 82,811,955 | 232,229 |
| Maxim Integrated Products, Inc. | 7,796,000 | 228,501 |
| STMicroelectronics NV1 | 24,162,000 | 200,578 |
| Diebold, Inc.3 | 3,925,000 | 147,894 |
| Paychex, Inc. | 2,884,700 | 118,302 |
| Fidessa group PLC1 | 1,240,000 | 43,688 |
| | | 7,568,506 |
The Income Fund of America — Page 2 of 32
Common stocks
Consumer staples 7.74% | Shares | Value
(000) |
| PepsiCo, Inc. | 14,752,588 | $1,299,703 |
| Procter & Gamble Co. | 15,173,700 | 1,173,230 |
| Philip Morris International Inc. | 12,168,200 | 997,914 |
| Kimberly-Clark Corp. | 6,183,110 | 642,240 |
| Altria Group, Inc. | 15,102,000 | 613,141 |
| Nestlé SA1 | 6,440,000 | 478,080 |
| Imperial Tobacco Group PLC1 | 10,583,991 | 458,401 |
| Lorillard, Inc. | 6,140,000 | 371,347 |
| British American Tobacco PLC1 | 6,048,000 | 353,956 |
| Coca-Cola Co. | 8,995,000 | 353,414 |
| Kellogg Co. | 3,200,000 | 191,456 |
| General Mills, Inc. | 3,030,000 | 151,954 |
| Hershey Co. | 1,500,000 | 132,225 |
| Kraft Foods Group, Inc. | 816,667 | 43,761 |
| | | 7,260,822 |
| Energy 6.75% | | |
| ConocoPhillips | 13,565,162 | 1,119,126 |
| Royal Dutch Shell PLC, Class B (ADR) | 10,431,000 | 898,526 |
| Royal Dutch Shell PLC, Class B1 | 4,499,147 | 193,839 |
| Spectra Energy Corp | 25,390,500 | 1,038,979 |
| Chevron Corp. | 5,215,000 | 673,987 |
| BP PLC1 | 64,900,000 | 530,145 |
| Crescent Point Energy Corp. | 10,905,000 | 444,961 |
| Occidental Petroleum Corp. | 3,675,000 | 359,084 |
| Helmerich & Payne, Inc. | 2,500,000 | 265,650 |
| ONEOK, Inc. | 3,575,000 | 230,337 |
| Coal India Ltd.1 | 16,900,000 | 102,310 |
| Diamond Offshore Drilling, Inc. | 2,135,200 | 99,906 |
| Keyera Corp. | 1,332,700 | 99,762 |
| Transocean Ltd. | 2,200,000 | 88,748 |
| Kinder Morgan, Inc. | 2,013,395 | 72,442 |
| TOTAL SA (ADR) | 1,050,000 | 67,725 |
| Husky Energy Inc. | 1,750,000 | 53,238 |
| General Maritime Corp.1,2,4 | 5,506 | 191 |
| | | 6,338,956 |
| Materials 5.27% | | |
| E.I. du Pont de Nemours and Co. | 21,261,000 | 1,367,295 |
| Dow Chemical Co. | 18,772,234 | 958,698 |
| Potash Corp. of Saskatchewan Inc. | 18,250,000 | 647,693 |
| Nucor Corp. | 12,890,485 | 647,360 |
| MeadWestvaco Corp.3 | 11,281,000 | 471,546 |
| Air Products and Chemicals, Inc. | 2,425,000 | 319,979 |
| BASF SE1 | 2,000,000 | 207,861 |
| Fletcher Building Ltd.1 | 17,974,000 | 138,428 |
| Cliffs Natural Resources Inc.3 | 7,354,581 | 128,337 |
| Israel Chemicals Ltd.1 | 5,943,040 | 48,487 |
| NewPage Holdings Inc.1,5 | 73,460 | 7,191 |
| | | 4,942,875 |
The Income Fund of America — Page 3 of 32
Common stocks
Telecommunication services 5.24% | Shares | Value
(000) |
| Verizon Communications Inc. | 35,581,336 | $1,794,011 |
| Telstra Corp. Ltd.1 | 141,451,533 | 717,109 |
| Deutsche Telekom AG1 | 38,600,000 | 625,675 |
| Orange1 | 36,435,000 | 570,406 |
| HKT Trust and HKT Ltd., units1 | 345,019,135 | 407,462 |
| TalkTalk Telecom Group PLC1,3 | 57,242,000 | 302,965 |
| BT Group PLC1 | 26,030,000 | 169,745 |
| CenturyLink, Inc. | 4,290,000 | 168,340 |
| MegaFon OJSC (GDR)1,4 | 3,194,200 | 88,957 |
| MegaFon OJSC (GDR)1 | 266,800 | 7,431 |
| AT&T Inc. | 1,910,000 | 67,977 |
| | | 4,920,078 |
| Utilities 4.64% | | |
| National Grid PLC1 | 63,482,420 | 914,344 |
| Duke Energy Corp. | 8,912,057 | 642,827 |
| EDP - Energias de Portugal, SA1 | 113,440,000 | 530,617 |
| PG&E Corp. | 11,300,000 | 504,771 |
| DTE Energy Co. | 5,500,000 | 406,010 |
| Power Assets Holdings Ltd.1 | 44,716,000 | 399,547 |
| FirstEnergy Corp. | 8,867,983 | 276,770 |
| Dominion Resources, Inc. | 3,570,000 | 241,475 |
| Snam SPA1 | 30,547,000 | 180,007 |
| Exelon Corp. | 5,000,000 | 155,400 |
| NTPC Ltd.1 | 27,000,000 | 64,209 |
| Ratchaburi Electricity Generating Holding PCL1 | 24,568,000 | 41,409 |
| | | 4,357,386 |
| Consumer discretionary 4.14% | | |
| Home Depot, Inc. | 10,430,000 | 843,266 |
| Carnival Corp., units | 13,368,500 | 484,207 |
| Time Warner Cable Inc. | 2,442,690 | 354,434 |
| Time Warner Inc. | 3,780,000 | 313,816 |
| SJM Holdings Ltd.1 | 114,800,000 | 307,657 |
| SES SA, Class A (FDR)1 | 7,800,000 | 286,057 |
| CBS Outdoor Americas, Inc.3 | 7,800,000 | 259,662 |
| Marks and Spencer Group PLC1 | 30,000,000 | 216,827 |
| Genuine Parts Co. | 2,350,000 | 194,627 |
| VF Corp. | 2,840,000 | 174,007 |
| McDonald’s Corp. | 1,250,000 | 118,200 |
| ProSiebenSat.1 Media AG1 | 2,745,000 | 115,389 |
| Daimler AG1 | 880,000 | 72,906 |
| Wynn Resorts, Ltd. | 286,144 | 61,006 |
| Cooper-Standard Holdings Inc.2 | 586,012 | 36,333 |
| Nokian Renkaat Oyj1 | 674,000 | 23,306 |
| Wynn Macau, Ltd.1 | 4,747,600 | 20,171 |
| Adelphia Recovery Trust, Series ACC-12 | 19,531,478 | 39 |
| Revel AC, Inc.1,2,5 | 529,539 | — |
| | | 3,881,910 |
| Miscellaneous 3.31% | | |
| Other common stocks in initial period of acquisition | | 3,102,166 |
| Total common stocks (cost: $52,802,769,000) | | 70,198,290 |
The Income Fund of America — Page 4 of 32
Preferred securities 0.52%
Financials 0.52% | Shares | Value
(000) |
| Citigroup Inc., Series K, depositary shares | 3,458,483 | $93,180 |
| Citigroup Inc. 7.875% preferred | 2,637,610 | 71,512 |
| Vornado Realty Trust, Series I, 6.625% | 3,380,000 | 85,210 |
| U.S. Bancorp, Series G, noncumulative convertible preferred | 2,270,400 | 62,124 |
| PNC Financial Services Group, Inc., Series P, noncumulative depositary shares | 2,000,000 | 54,685 |
| HSBC Holdings PLC, Series 2, 8.00% | 1,825,000 | 49,535 |
| Wells Fargo & Co., Class A, Series Q, 5.85% depositary shares preferred noncumulative | 1,600,000 | 40,960 |
| Goldman Sachs Group, Inc., Series J, 5.50% depositary shares | 1,200,000 | 28,815 |
| Total preferred securities (cost: $463,126,000) | | 486,021 |
Rights & warrants 0.00%
Energy 0.00% | | |
| General Maritime Corp., warrants, expire 20171,2,4 | 8,514 | 40 |
| Miscellaneous 0.00% | | |
| Other rights & warrants in initial period of acquisition | | 2,325 |
| Total rights & warrants (cost: $2,171,000) | | 2,365 |
Convertible stocks 0.33%
Energy 0.16% | | |
| Chesapeake Energy Corporation 5.75% convertible preferred4 | 125,700 | 150,054 |
| Industrials 0.07% | | |
| CEVA Group PLC, Series A-1, 3.234% convertible preferred1 | 29,937 | 45,654 |
| CEVA Group PLC, Series A-2, 2.234% convertible preferred1,5 | 13,633 | 15,678 |
| Materials 0.05% | | |
| Cliffs Natural Resources Inc., Series A, 7.00% convertible preferred 20163 | 2,925,000 | 47,151 |
| Consumer staples 0.03% | | |
| Bunge Ltd. 4.875% convertible preferred | 272,700 | 29,097 |
| Miscellaneous 0.02% | | |
| Other convertible stocks in initial period of acquisition | | 22,070 |
| Total convertible stocks (cost: $305,530,000) | | 309,704 |
Convertible bonds 0.12%
Energy 0.07% | Principal amount
(000) | |
| American Energy Utica, LLC 3.50% convertible notes 20214,6,7 | $53,232 | 64,145 |
| Consumer discretionary 0.03% | | |
| MGM Resorts International 4.25% convertible notes 2015 | 19,845 | 29,507 |
The Income Fund of America — Page 5 of 32
Convertible bonds
Miscellaneous 0.02% | Principal amount
(000) | Value
(000) |
| Other convertible bonds in initial period of acquisition | | $22,313 |
| Total convertible bonds (cost: $90,268,000) | | 115,965 |
Bonds, notes & other debt instruments 19.37%
Corporate bonds & notes 14.26%
Financials 2.69% | | |
| ACE INA Holdings Inc. 2.60% 2015 | $7,445 | 7,631 |
| ACE INA Holdings Inc. 3.35% 2024 | 2,500 | 2,504 |
| Alexandria Real Estate Equities, Inc. 2.75% 2020 | 795 | 795 |
| Alexandria Real Estate Equities, Inc. 3.90% 2023 | 2,750 | 2,732 |
| Alexandria Real Estate Equities, Inc. 4.50% 2029 | 1,355 | 1,365 |
| American Campus Communities, Inc. 3.75% 2023 | 3,985 | 3,933 |
| American Campus Communities, Inc. 4.125% 2024 | 10,695 | 10,751 |
| American Express Co. 6.15% 2017 | 12,610 | 14,370 |
| American International Group, Inc. 2.30% 2019 | 9,785 | 9,741 |
| American International Group, Inc. 3.375% 2020 | 13,000 | 13,499 |
| American International Group, Inc. 4.50% 2044 | 3,000 | 2,972 |
| American Tower Corp. 7.00% 2017 | 6,200 | 7,176 |
| American Tower Corp. 3.40% 2019 | 6,400 | 6,642 |
| American Tower Corp. 7.25% 2019 | 15,025 | 18,057 |
| ANZ National (International) Ltd. 3.125% 20154 | 10,000 | 10,263 |
| AvalonBay Communities, Inc. 3.625% 2020 | 1,790 | 1,878 |
| AXA SA, Series B, junior subordinated 6.379% (undated)4,7 | 4,155 | 4,519 |
| Bank of America Corp., Series L, 3.625% 2016 | 7,060 | 7,362 |
| Bank of America Corp. 3.75% 2016 | 9,975 | 10,470 |
| Bank of America Corp. 1.25% 2017 | 8,500 | 8,506 |
| Bank of America Corp. 5.75% 2017 | 8,100 | 9,095 |
| Bank of America Corp., Series L, 2.65% 2019 | 8,500 | 8,555 |
| Bank of America Corp. 5.625% 2020 | 9,000 | 10,303 |
| Bank of America Corp. 5.00% 2021 | 3,500 | 3,873 |
| Bank of America Corp. 4.00% 2024 | 12,925 | 13,113 |
| Bank of America Corp., Series M, junior subordinated 8.125% noncumulative (undated)7 | 30,924 | 34,394 |
| Bank of New York Mellon Corp., Series G, 2.50% 2016 | 10,000 | 10,283 |
| Bank of Nova Scotia 2.55% 2017 | 9,000 | 9,308 |
| Barclays Bank PLC 2.50% 2019 | 10,910 | 11,024 |
| BB&T Corp. 1.00% 2017 | 8,500 | 8,437 |
| BBVA Bancomer SA 6.50% 20214 | 7,200 | 8,136 |
| Berkshire Hathaway Finance Corp. 4.30% 2043 | 3,600 | 3,554 |
| Berkshire Hathaway Inc. 2.20% 2016 | 11,500 | 11,843 |
| Berkshire Hathaway Inc. 2.90% 2020 | 6,000 | 6,135 |
| Berkshire Hathaway Inc. 4.40% 2042 | 2,000 | 2,020 |
| BNP Paribas 3.60% 2016 | 10,000 | 10,416 |
| BPCE SA group 4.00% 2024 | 6,000 | 6,091 |
| BPCE SA group 5.15% 20244 | 11,725 | 12,304 |
| Brandywine Operating Partnership, LP 5.40% 2014 | 6,000 | 6,067 |
| Brandywine Operating Partnership, LP 5.70% 2017 | 20 | 22 |
| Brandywine Operating Partnership, LP 3.95% 2023 | 1,729 | 1,730 |
| CIT Group Inc., Series C, 4.75% 20154 | 56,200 | 57,008 |
| CIT Group Inc. 5.00% 2017 | 43,300 | 45,627 |
| CIT Group Inc. 4.25% 2017 | 14,000 | 14,455 |
| CIT Group Inc. 5.25% 2018 | 2,500 | 2,644 |
| CIT Group Inc., Series C, 5.50% 20194 | 16,150 | 17,291 |
| CIT Group Inc. 3.875% 2019 | 39,200 | 39,102 |
The Income Fund of America — Page 6 of 32
Bonds, notes & other debt instruments
Corporate bonds & notes (continued)
Financials (continued) | Principal amount
(000) | Value
(000) |
| Citigroup Inc. 4.587% 2015 | $10,885 | $11,445 |
| Citigroup Inc. 3.953% 2016 | 7,115 | 7,494 |
| Citigroup Inc. 2.50% 2018 | 6,000 | 6,074 |
| Citigroup Inc. 8.50% 2019 | 4,894 | 6,199 |
| Citigroup Inc. 2.50% 2019 | 8,400 | 8,380 |
| Citigroup Inc. 3.75% 2024 | 11,000 | 10,965 |
| Citigroup Inc., Series A, junior subordinated 5.95% (undated)7 | 13,295 | 13,231 |
| CNA Financial Corp. 3.95% 2024 | 6,705 | 6,872 |
| Corporate Office Properties LP 5.25% 2024 | 9,150 | 9,782 |
| Corporate Office Properties Trust 3.60% 2023 | 320 | 307 |
| Crescent Resources 10.25% 20174 | 30,160 | 33,553 |
| DCT Industrial Trust Inc. 4.50% 2023 | 15,550 | 15,867 |
| Developers Diversified Realty Corp. 5.50% 2015 | 15,776 | 16,310 |
| Developers Diversified Realty Corp. 9.625% 2016 | 8,395 | 9,537 |
| Developers Diversified Realty Corp. 7.50% 2017 | 38,892 | 44,612 |
| Developers Diversified Realty Corp. 4.75% 2018 | 5,000 | 5,413 |
| Developers Diversified Realty Corp. 7.875% 2020 | 7,795 | 9,803 |
| Discover Financial Services 4.20% 2023 | 5,460 | 5,689 |
| ERP Operating LP 6.584% 2015 | 2,705 | 2,816 |
| ERP Operating LP 7.125% 2017 | 10,000 | 11,671 |
| Essex Portfolio L.P. 3.25% 2023 | 4,400 | 4,295 |
| Essex Portfolio L.P. 3.875% 20244 | 10,950 | 11,095 |
| Genworth Holdings, Inc. 4.90% 2023 | 1,565 | 1,660 |
| Goldman Sachs Group, Inc. 3.625% 2016 | 22,600 | 23,508 |
| Goldman Sachs Group, Inc. 2.625% 2019 | 27,331 | 27,479 |
| Goldman Sachs Group, Inc. 5.25% 2021 | 23,000 | 25,686 |
| Goldman Sachs Group, Inc. 5.75% 2022 | 20,000 | 22,980 |
| Goldman Sachs Group, Inc. 3.625% 2023 | 8,500 | 8,455 |
| Goldman Sachs Group, Inc. 3.85% 2024 | 17,910 | 17,868 |
| Goldman Sachs Group, Inc., Series L, 5.70% 20497 | 16,820 | 17,214 |
| HBOS PLC 6.75% 20184 | 17,300 | 19,809 |
| Hospitality Properties Trust 5.125% 2015 | 2,160 | 2,163 |
| Hospitality Properties Trust 6.30% 2016 | 19,827 | 21,143 |
| Hospitality Properties Trust 5.625% 2017 | 10,169 | 11,079 |
| Hospitality Properties Trust 6.70% 2018 | 12,625 | 14,168 |
| Hospitality Properties Trust 5.00% 2022 | 6,500 | 6,868 |
| Hospitality Properties Trust 4.50% 2023 | 11,060 | 11,246 |
| Host Hotels & Resorts LP 6.00% 2021 | 6,400 | 7,375 |
| HSBC Holdings PLC 4.25% 2024 | 17,070 | 17,416 |
| HSBK (Europe) BV 7.25% 20174 | 30,570 | 33,245 |
| Icahn Enterprises Finance Corp. 3.50% 2017 | 26,550 | 26,484 |
| Intercontinentalexchange, Inc. 2.50% 2018 | 12,000 | 12,227 |
| International Lease Finance Corp. 4.875% 2015 | 51,400 | 52,396 |
| International Lease Finance Corp. 8.625% 2015 | 3,000 | 3,199 |
| Intesa Sanpaolo SpA 5.017% 20244 | 28,110 | 27,847 |
| iStar Financial Inc., Series B, 9.00% 2017 | 37,360 | 42,497 |
| iStar Financial Inc. 4.00% 2017 | 25,500 | 25,245 |
| iStar Financial Inc. 4.875% 2018 | 11,575 | 11,517 |
| iStar Financial Inc. 5.00% 2019 | 14,275 | 14,132 |
| JPMorgan Chase & Co. 1.35% 2017 | 12,240 | 12,263 |
| JPMorgan Chase & Co. 3.25% 2022 | 5,000 | 4,979 |
| JPMorgan Chase & Co. 3.20% 2023 | 8,000 | 7,875 |
| JPMorgan Chase & Co., Series I, junior subordinated 7.90% (undated)7 | 74,825 | 82,775 |
| JPMorgan Chase & Co., Series-S, junior subordinated, perpetual, 6.75% (undated)7 | 36,535 | 39,184 |
The Income Fund of America — Page 7 of 32
Bonds, notes & other debt instruments
Corporate bonds & notes (continued)
Financials (continued) | Principal amount
(000) | Value
(000) |
| JPMorgan Chase & Co., Series-V, junior subordinated, perpetual, 5.00% (undated)7 | $24,000 | $23,779 |
| Kimco Realty Corp., Series C, 5.783% 2016 | 15,000 | 16,158 |
| Kimco Realty Corp. 5.70% 2017 | 17,250 | 19,126 |
| Kimco Realty Corp. 4.30% 2018 | 1,000 | 1,080 |
| Kimco Realty Corp. 6.875% 2019 | 10,844 | 12,999 |
| Leucadia National Corp. 5.50% 2023 | 13,255 | 13,985 |
| Liberty Mutual Group Inc. 4.25% 20234 | 4,400 | 4,530 |
| Liberty Mutual Group Inc., Series A, 7.80% 20874,7 | 19,415 | 23,104 |
| Lloyds Banking Group PLC 2.30% 2018 | 3,625 | 3,658 |
| MetLife Capital Trust IV, junior subordinated 7.875% 20674,7 | 14,430 | 18,326 |
| MetLife Capital Trust X, junior subordinated 9.25% 20684,7 | 500 | 720 |
| MetLife Global Funding I 2.50% 20154 | 10,000 | 10,220 |
| MetLife Global Funding I 2.30% 20194 | 17,880 | 17,970 |
| Metlife, Inc. 3.60% 2024 | 3,775 | 3,833 |
| Morgan Stanley 3.80% 2016 | 5,125 | 5,371 |
| Morgan Stanley 2.375% 2019 | 28,200 | 28,002 |
| Morgan Stanley, Series F, 3.875% 2024 | 7,500 | 7,570 |
| Morgan Stanley, Series H, 5.45% (undated)7 | 10,875 | 10,861 |
| Nationwide Mutual Insurance Co. 5.81% 20244,7 | 8,150 | 8,252 |
| New York Life Global Funding 2.10% 20194 | 11,000 | 11,034 |
| Nordea Bank AB 2.375% 20194 | 15,000 | 15,085 |
| Ocwen Financial Corp. 6.625% 20194 | 10,200 | 10,455 |
| Piedmont Operating Partnership LP 3.40% 2023 | 1,750 | 1,655 |
| PNC Financial Services Group, Inc. 2.854% 2022 | 8,710 | 8,469 |
| PNC Financial Services Group, Inc. 3.90% 2024 | 14,000 | 14,170 |
| PNC Financial Services Group, Inc., Series O, junior subordinated 6.75% (undated)7 | 10,250 | 11,482 |
| PNC Preferred Funding Trust I, junior subordinated 1.881% (undated)4,7 | 23,800 | 23,383 |
| Prologis, Inc. 3.35% 2021 | 2,750 | 2,774 |
| Prologis, Inc. 4.25% 2023 | 30,260 | 31,525 |
| Prudential Financial, Inc. 4.50% 2021 | 2,400 | 2,627 |
| Prudential Financial, Inc. 3.50% 2024 | 15,000 | 14,867 |
| Prudential Financial, Inc. 4.60% 2044 | 1,200 | 1,206 |
| Prudential Holdings, LLC, Series C, 8.695% 20234,8 | 9,811 | 12,406 |
| QBE Insurance Group Ltd. 2.40% 20184 | 16,910 | 16,846 |
| Rabobank Nederland 2.25% 2019 | 8,000 | 8,076 |
| Rabobank Nederland 4.625% 2023 | 17,280 | 18,101 |
| RBS Capital Trust II 6.425% noncumulative trust (undated)7 | 6,005 | 6,422 |
| Realogy Corp. 3.375% 20164 | 3,000 | 3,022 |
| Realogy Corp. 4.50% 20194 | 42,575 | 41,511 |
| Realogy Corp., LOC, 4.50% 20167,8,9 | 5,219 | 5,216 |
| Regions Financial Corp. 7.75% 2014 | 4,791 | 4,882 |
| Regions Financial Corp. 5.75% 2015 | 14,761 | 15,375 |
| Royal Bank of Scotland Group PLC, junior subordinated 6.99% (undated)4,7 | 12,735 | 14,677 |
| Ryman Hospitality Properties, Inc. 5.00% 2021 | 10,375 | 10,349 |
| Ryman Hospitality Properties, Inc., Term Loan B, 3.75% 20217,8,9 | 4,800 | 4,822 |
| Santander Issuances, SA Unipersonal 6.50% 20194,7 | 7,500 | 7,506 |
| Simon Property Group, LP 6.10% 2016 | 4,250 | 4,590 |
| Simon Property Group, LP 5.25% 2016 | 30,040 | 32,700 |
| Simon Property Group, LP 5.875% 2017 | 15,000 | 16,657 |
| SMFG Preferred Capital USD 3 Ltd., junior subordinated 9.50% (undated)4,7 | 116,330 | 145,994 |
| Société Générale, junior subordinated 5.922% (undated)4,7 | 45,073 | 48,284 |
| Standard Chartered Bank 6.40% 20174 | 25,000 | 28,223 |
| Synovus Financial Corp. 7.875% 2019 | 23,506 | 26,738 |
| Toronto-Dominion Bank 2.375% 2016 | 9,000 | 9,295 |
The Income Fund of America — Page 8 of 32
Bonds, notes & other debt instruments
Corporate bonds & notes (continued)
Financials (continued) | Principal amount
(000) | Value
(000) |
| UDR, Inc., Series A, 5.25% 2015 | $3,000 | $3,062 |
| UDR, Inc. 3.70% 2020 | 2,320 | 2,410 |
| Unum Group 7.125% 2016 | 6,740 | 7,601 |
| UnumProvident Finance Co. PLC 6.85% 20154 | 14,529 | 15,560 |
| US Bancorp., Series T, 1.65% 2017 | 10,000 | 10,118 |
| US Bancorp. 3.70% 2024 | 10,000 | 10,331 |
| Wells Fargo & Co. 3.676% 2016 | 10,000 | 10,524 |
| Wells Fargo & Co. 2.125% 2019 | 16,000 | 15,927 |
| Wells Fargo & Co. 4.60% 2021 | 45,000 | 49,804 |
| Wells Fargo & Co. 4.10% 2026 | 14,450 | 14,587 |
| Wells Fargo & Co., Series K, junior subordinated 7.98% (undated)7 | 86,566 | 98,599 |
| Westpac Banking Corp. 3.00% 2015 | 9,000 | 9,297 |
| Zions Bancorporation 6.00% 2015 | 1,357 | 1,428 |
| Zions Bancorporation 5.50% 2015 | 3,386 | 3,516 |
| | | 2,524,120 |
| Consumer discretionary 1.92% | | |
| Boyd Gaming Corp. 9.125% 2018 | 88,575 | 92,782 |
| Boyd Gaming Corp. 9.00% 2020 | 5,000 | 5,369 |
| Burger King Corp 0%/11.00% 20194,10 | 23,475 | 21,750 |
| Burlington Coat Factory Warehouse Corp. 10.00% 2019 | 6,700 | 7,366 |
| Cablevision Systems Corp. 8.00% 2020 | 20,000 | 22,625 |
| Caesars Entertainment Operating Co. 11.25% 2017 | 20,000 | 17,700 |
| Caesars Entertainment,Term Loan B, 7.00% 20207,8,9 | 4,975 | 4,994 |
| Carnival Corp. 3.95% 2020 | 16,715 | 17,513 |
| CBS Corp. 1.95% 2017 | 5,000 | 5,075 |
| CCO Holdings LLC and CCO Holdings Capital Corp. 7.00% 2019 | 8,000 | 8,360 |
| Cedar Fair, LP 5.375% 20244 | 11,950 | 11,965 |
| Cequel Communications Holdings I, LLC and Cequel Capital Corp. 6.375% 20204 | 35,425 | 36,665 |
| Charter Communications Operating, LLC and Charter Communications Operating Capital Corp. 7.25% 2017 | 19,600 | 20,482 |
| Cinemark USA, Inc. 5.125% 2022 | 9,500 | 9,619 |
| CityCenter Holdings, Term Loan B, 4.25% 20207,8,9 | 2,841 | 2,852 |
| Clear Channel Worldwide Holdings, Inc. 7.625% 2020 | 10,010 | 10,561 |
| Comcast Corp. 5.90% 2016 | 10,000 | 10,835 |
| Comcast Corp. 5.65% 2035 | 7,000 | 8,273 |
| Comcast Corp. 6.45% 2037 | 25,000 | 32,046 |
| Comcast Corp. 4.75% 2044 | 15,000 | 15,715 |
| Cooper-Standard Holdings Inc., Term Loan B, 4.00% 20217,8,9 | 8,250 | 8,240 |
| Cox Communications, Inc. 5.45% 2014 | 1,599 | 1,627 |
| Cox Communications, Inc. 5.875% 20164 | 25,000 | 27,514 |
| Cox Communications, Inc. 2.95% 20234 | 23,875 | 22,634 |
| Cumulus Media Inc., Term Loan B, 4.25% 20207,8,9 | 11,126 | 11,163 |
| DaimlerChrysler North America Holding Corp. 1.30% 20154 | 8,500 | 8,561 |
| DaimlerChrysler North America Holding Corp. 2.625% 20164 | 2,000 | 2,063 |
| DaimlerChrysler North America Holding Corp. 1.375% 20174 | 8,585 | 8,570 |
| DaimlerChrysler North America Holding Corp. 2.375% 20184 | 2,000 | 2,034 |
| DaimlerChrysler North America Holding Corp. 2.25% 20194 | 14,000 | 13,955 |
| DaimlerChrysler North America Holding Corp. 3.25% 20244 | 2,270 | 2,252 |
| DaimlerChrysler North America Holding Corp. 8.50% 2031 | 2,000 | 3,021 |
| Delta 2 (Formula One), Term Loan B, 4.75% 20217,8,9 | 5,675 | 5,634 |
| Delta 2 (Formula One), Term Loan B, 7.75% 20227,8,9 | 3,125 | 3,133 |
| DISH DBS Corp. 4.625% 2017 | 45,105 | 47,022 |
| DISH DBS Corp. 4.25% 2018 | 36,075 | 36,706 |
| DISH DBS Corp. 7.875% 2019 | 1,425 | 1,642 |
The Income Fund of America — Page 9 of 32
Bonds, notes & other debt instruments
Corporate bonds & notes (continued)
Consumer discretionary (continued) | Principal amount
(000) | Value
(000) |
| DISH DBS Corp. 5.125% 2020 | $10,900 | $11,145 |
| Dollar General Corp. 3.25% 2023 | 40,038 | 38,166 |
| Dynacast International LLC 9.25% 2019 | 5,575 | 6,133 |
| EchoStar DBS Corp. 7.75% 2015 | 7,350 | 7,718 |
| Federated Department Stores, Inc. 6.90% 2029 | 7,925 | 9,995 |
| Ford Motor Co. 4.75% 2043 | 2,650 | 2,669 |
| Ford Motor Credit Co. 2.50% 2016 | 7,000 | 7,156 |
| Ford Motor Credit Co. 1.70% 2016 | 8,500 | 8,595 |
| Ford Motor Credit Co. 8.00% 2016 | 1,500 | 1,732 |
| Ford Motor Credit Co. 2.375% 2018 | 10,905 | 11,082 |
| Ford Motor Credit Co. 4.375% 2023 | 12,850 | 13,632 |
| Gannett Co., Inc. 5.125% 20194 | 7,925 | 8,123 |
| Gannett Co., Inc. 6.375% 20234 | 4,065 | 4,299 |
| General Motors Financial Co. 3.25% 2018 | 24,375 | 24,405 |
| General Motors Financial Co. 6.75% 2018 | 1,720 | 1,948 |
| General Motors Financial Co. 3.50% 2019 | 6,320 | 6,304 |
| Group 1 Automotive, Inc. 5.00% 20224 | 2,940 | 2,911 |
| Hilton Hotels Corp. 5.625% 20214 | 9,400 | 9,864 |
| Hilton Worldwide, Term Loan B, 3.50% 20207,8,9 | 18,634 | 18,570 |
| Home Depot, Inc. 2.00% 2019 | 29,000 | 28,898 |
| Home Depot, Inc. 5.95% 2041 | 25,000 | 31,144 |
| Home Depot, Inc. 4.40% 2045 | 7,475 | 7,578 |
| J.C. Penney Co., Inc. 5.75% 2018 | 9,300 | 8,556 |
| La Quinta Properties, Inc., First Lien Term Loan B, 4.00% 20217,8,9 | 21,931 | 21,979 |
| Limited Brands, Inc. 5.25% 2014 | 1,585 | 1,601 |
| Limited Brands, Inc. 8.50% 2019 | 16,105 | 19,487 |
| Limited Brands, Inc. 7.00% 2020 | 21,271 | 24,143 |
| Limited Brands, Inc. 6.625% 2021 | 23,754 | 26,604 |
| Mediacom Broadband LLC and Mediacom Broadband Corp. 5.50% 20214 | 7,000 | 7,096 |
| Mediacom LLC and Mediacom Capital Corp. 9.125% 2019 | 13,750 | 14,426 |
| Mediacom LLC and Mediacom Capital Corp. 7.25% 2022 | 7,775 | 8,397 |
| MGM Resorts International 6.625% 2015 | 20,725 | 21,647 |
| MGM Resorts International 7.50% 2016 | 8,425 | 9,183 |
| MGM Resorts International 8.625% 2019 | 5,425 | 6,334 |
| MGM Resorts International 6.75% 2020 | 7,350 | 7,975 |
| MGM Resorts International 7.75% 2022 | 17,000 | 19,550 |
| Michaels Stores, Inc. 7.50% 20184,6,7 | 5,000 | 5,075 |
| Michaels Stores, Inc. 7.75% 2018 | 13,000 | 13,561 |
| Michaels Stores, Inc. 5.875% 20204 | 12,925 | 12,738 |
| Mohegan Tribal Gaming Authority 11.00% 20184,6,7 | 13,725 | 13,751 |
| Myriad International Holdings 6.00% 20204 | 40,000 | 44,300 |
| NBC Universal Enterprise, Inc. 0.919% 20184,7 | 8,625 | 8,726 |
| NBC Universal Enterprise, Inc. 5.25% (undated)4 | 37,105 | 38,821 |
| NBCUniversal Media, LLC 2.875% 2016 | 10,000 | 10,355 |
| NCL Corp. Ltd. 5.00% 2018 | 575 | 589 |
| Needle Merger Sub Corp. 8.125% 20194 | 16,220 | 16,220 |
| Neiman Marcus Group LTD Inc. 8.00% 20214 | 48,050 | 50,933 |
| Neiman Marcus Group LTD Inc. 8.75% 20214,6,7 | 16,760 | 17,975 |
| Neiman Marcus, Term Loan B, 4.25% 20207,8,9 | 37,362 | 37,239 |
| News America Inc. 5.30% 2014 | 20,000 | 20,359 |
| PETCO Animal Supplies, Inc. 9.25% 20184 | 21,600 | 22,950 |
| Pinnacle Entertainment, Inc. 6.375% 2021 | 7,475 | 7,737 |
| Playa Resorts Holding BV 8.00% 20204 | 15,795 | 16,743 |
| Playa Resorts Holding BV, Term Loan B, 4.00% 20197,8,9 | 5,456 | 5,461 |
The Income Fund of America — Page 10 of 32
Bonds, notes & other debt instruments
Corporate bonds & notes (continued)
Consumer discretionary (continued) | Principal amount
(000) | Value
(000) |
| President & Fellows of Harvard College 3.619% 2037 | $10,000 | $9,487 |
| RCI Banque 3.50% 20184 | 12,500 | 12,998 |
| Royal Caribbean Cruises Ltd. 11.875% 2015 | 21,425 | 23,621 |
| Sally Holdings LLC and Sally Capital Inc. 6.875% 2019 | 11,950 | 12,787 |
| Schaeffler Holding Finance BV 6.875% 20184,6,7 | 5,450 | 5,750 |
| Seminole Tribe of Florida 6.535% 20204,8 | 10,000 | 11,150 |
| Seneca Gaming Corp. 8.25% 20184 | 7,925 | 8,381 |
| Six Flags Entertainment Corp. 5.25% 20214 | 6,400 | 6,384 |
| Stackpole Intl. 7.75% 20214 | 28,265 | 28,406 |
| Thomson Reuters Corp. 1.30% 2017 | 1,510 | 1,507 |
| Thomson Reuters Corp. 4.30% 2023 | 1,285 | 1,343 |
| Thomson Reuters Corp. 5.65% 2043 | 1,425 | 1,581 |
| Time Inc. 5.75% 20224 | 7,000 | 6,948 |
| Time Inc., Term Loan B, 4.25% 20217,8,9 | 41,325 | 41,273 |
| Time Warner Cable Inc. 6.75% 2018 | 18,630 | 21,841 |
| Time Warner Cable Inc. 5.00% 2020 | 35,000 | 39,012 |
| Time Warner Cable Inc. 4.00% 2021 | 3,885 | 4,124 |
| Time Warner Inc. 5.875% 2016 | 8,000 | 8,854 |
| Time Warner Inc. 2.10% 2019 | 1,240 | 1,227 |
| Time Warner Inc. 4.75% 2021 | 15,000 | 16,582 |
| Time Warner Inc. 4.05% 2023 | 2,735 | 2,806 |
| Time Warner Inc. 3.55% 2024 | 3,000 | 2,954 |
| Time Warner Inc. 4.65% 2044 | 8,500 | 8,301 |
| Toyota Motor Credit Corp. 0.875% 2015 | 8,500 | 8,546 |
| Toyota Motor Credit Corp. 2.125% 2019 | 1,500 | 1,496 |
| Toys "R" Us Property Co. II, LLC 8.50% 2017 | 12,400 | 12,571 |
| Toys "R" Us-Delaware, Inc. 7.375% 20164 | 9,925 | 9,330 |
| Toys "R" Us-Delaware, Inc., Term Loan B2, 5.25% 20187,8,9 | 15,565 | 12,893 |
| Univision Communications Inc. 6.875% 20194 | 3,200 | 3,368 |
| Univision Communications Inc., Term Loan C3, 4.00% 20207,8,9 | 17,232 | 17,146 |
| Univision Communications Inc., Term Loan D, 4.00% 20207,8,9 | 3,980 | 3,960 |
| Viacom Inc. 5.85% 2043 | 1,750 | 1,975 |
| Videotron Ltd. 6.375% 2015 | 4,905 | 4,923 |
| Virgin Media Finance PLC 8.375% 20194 | 14,150 | 14,875 |
| Virgin Media Secured Finance PLC 5.375% 20214 | 17,600 | 17,864 |
| Volkswagen International Finance NV 2.875% 20164 | 4,000 | 4,141 |
| Volkswagen International Finance NV 2.375% 20174 | 14,500 | 14,920 |
| Walt Disney Co. 1.10% 2017 | 7,575 | 7,513 |
| Walt Disney Co. 1.85% 2019 | 1,800 | 1,781 |
| Warner Music Group 6.00% 20214 | 9,720 | 9,987 |
| Weather Company, Term Loan, 7.00% 20207,8,9 | 2,500 | 2,464 |
| | | 1,797,966 |
| Telecommunication services 1.86% | | |
| Altice Finco SA 6.50% 20224 | 12,000 | 12,360 |
| Altice Finco SA, First Lien, 7.75% 20224 | 21,775 | 22,319 |
| AT&T Inc. 2.40% 2016 | 9,000 | 9,278 |
| AT&T Inc. 4.80% 2044 | 1,500 | 1,527 |
| Clearwire Communications and Clearwire Finance, Inc. 14.75% 20164 | 6,125 | 7,871 |
| Deutsche Telekom International Finance BV 9.25% 2032 | 8,420 | 13,345 |
| Deutsche Telekom International Finance BV 4.875% 20424 | 350 | 367 |
| France Télécom 2.75% 2016 | 9,000 | 9,310 |
| France Télécom 4.125% 2021 | 15,000 | 15,956 |
| Frontier Communications Corp. 8.125% 2018 | 26,547 | 30,529 |
The Income Fund of America — Page 11 of 32
Bonds, notes & other debt instruments
Corporate bonds & notes (continued)
Telecommunication services (continued) | Principal amount
(000) | Value
(000) |
| Frontier Communications Corp. 9.25% 2021 | $20,625 | $24,105 |
| Frontier Communications Corp. 8.75% 2022 | 6,425 | 7,357 |
| Frontier Communications Corp. 7.125% 2023 | 20,825 | 21,658 |
| Frontier Communications Corp. 7.625% 2024 | 28,125 | 29,461 |
| Intelsat Jackson Holding Co. 7.25% 2020 | 7,750 | 8,196 |
| Intelsat Jackson Holding Co. 6.625% 2022 | 46,700 | 47,167 |
| Level 3 Communications, Inc. 11.875% 2019 | 3,000 | 3,307 |
| LightSquared, Term Loan B, 12.00% 20146,8,9,11 | 96,867 | 126,895 |
| MetroPCS Wireless, Inc. 6.25% 2021 | 52,075 | 54,614 |
| MetroPCS Wireless, Inc. 6.625% 2023 | 64,150 | 67,518 |
| NII Capital Corp. 10.00% 2016 | 52,550 | 14,451 |
| NII Capital Corp. 7.875% 20194 | 52,025 | 43,311 |
| NII Capital Corp. 11.375% 20194 | 61,175 | 51,846 |
| NII Capital Corp. 8.875% 2019 | 45,100 | 16,349 |
| NII Capital Corp. 7.625% 2021 | 202,660 | 54,718 |
| Numerical Group SA, First Lien, 4.875% 20194 | 43,100 | 43,369 |
| Numerical Group SA, First Lien, 6.00% 20224 | 44,100 | 44,155 |
| Numerical Group SA, First Lien, 6.25% 20244 | 4,700 | 4,729 |
| Orange SA 5.50% 2044 | 3,000 | 3,295 |
| Qwest Capital Funding, Inc. 7.625% 2021 | 3,900 | 4,344 |
| SBC Communications Inc. 5.10% 2014 | 19,886 | 19,992 |
| SoftBank Corp. 4.50% 20204 | 16,125 | 16,226 |
| Sprint Corp. 7.25% 20214 | 32,350 | 34,574 |
| Sprint Corp. 7.875% 20234 | 97,075 | 104,356 |
| Sprint Corp. 7.125% 20244 | 14,000 | 14,332 |
| Sprint Nextel Corp. 9.125% 2017 | 39,446 | 45,462 |
| Sprint Nextel Corp. 8.375% 2017 | 29,525 | 33,769 |
| Sprint Nextel Corp. 9.00% 20184 | 5,000 | 5,875 |
| Sprint Nextel Corp. 7.00% 2020 | 66,570 | 70,731 |
| Sprint Nextel Corp. 11.50% 2021 | 20,975 | 27,844 |
| Telecom Italia Capital SA 6.999% 2018 | 26,440 | 30,009 |
| Telecom Italia Capital SA 7.175% 2019 | 9,000 | 10,204 |
| Telecom Italia Capital SA 7.721% 2038 | 1,750 | 1,969 |
| Telefónica Emisiones, SAU 3.992% 2016 | 10,000 | 10,439 |
| Telefónica Emisiones, SAU 3.192% 2018 | 8,500 | 8,851 |
| Telefónica Emisiones, SAU 5.134% 2020 | 7,950 | 8,825 |
| T-Mobile US, Inc. 6.542% 2020 | 54,450 | 57,104 |
| Trilogy International Partners, LLC 10.25% 20164 | 47,050 | 48,226 |
| Verizon Communications Inc. 3.00% 2016 | 17,000 | 17,609 |
| Verizon Communications Inc. 0.63% 20177 | 13,000 | 13,031 |
| Verizon Communications Inc. 1.35% 2017 | 7,225 | 7,220 |
| Verizon Communications Inc. 3.45% 2021 | 5,025 | 5,135 |
| Verizon Communications Inc. 5.15% 2023 | 74,285 | 82,256 |
| Verizon Communications Inc. 5.05% 2034 | 4,975 | 5,290 |
| Verizon Communications Inc. 6.00% 2041 | 28,000 | 32,982 |
| Verizon Communications Inc. 6.55% 2043 | 109,071 | 137,253 |
| Wind Acquisition SA 4.75% 20204 | 45,000 | 44,100 |
| Wind Acquisition SA 7.375% 20214 | 60,825 | 63,562 |
| | | 1,750,933 |
The Income Fund of America — Page 12 of 32
Bonds, notes & other debt instruments
Corporate bonds & notes (continued)
Energy 1.73% | Principal amount
(000) | Value
(000) |
| Access Midstream Partners, L.P. 5.875% 2021 | $650 | $687 |
| Alpha Natural Resources, Inc. 9.75% 2018 | 27,790 | 24,386 |
| Alpha Natural Resources, Inc. 6.00% 2019 | 12,785 | 8,694 |
| Alpha Natural Resources, Inc. 7.50% 20204 | 29,500 | 27,287 |
| Alpha Natural Resources, Inc. 6.25% 2021 | 20,885 | 13,680 |
| American Energy (Marcellus), Term Loan B, 5.25% 20207,8,9 | 10,175 | 10,188 |
| American Energy (Marcellus), Term Loan A, 8.50% 20217,8,9 | 9,050 | 9,159 |
| American Energy (Permian Basin), 6.741% 20194,7 | 10,000 | 9,663 |
| American Energy (Permian Basin) 7.125% 20204 | 22,550 | 21,789 |
| American Energy (Permian Basin) 7.375% 20214 | 13,175 | 12,730 |
| Anadarko Petroleum Corp. 5.95% 2016 | 10,500 | 11,564 |
| Anadarko Petroleum Corp. 6.375% 2017 | 13,500 | 15,425 |
| Anadarko Petroleum Corp. 8.70% 2019 | 32,880 | 41,942 |
| Anadarko Petroleum Corp. 3.45% 2024 | 2,235 | 2,219 |
| Anadarko Petroleum Corp. 6.45% 2036 | 1,095 | 1,376 |
| Anadarko Petroleum Corp. 6.20% 2040 | 500 | 617 |
| Arch Coal, Inc. 8.00% 20194 | 2,550 | 2,467 |
| Arch Coal, Inc. 7.00% 2019 | 33,525 | 23,132 |
| Arch Coal, Inc. 9.875% 2019 | 3,500 | 2,695 |
| Arch Coal, Inc. 7.25% 2021 | 18,675 | 12,232 |
| BG Energy Capital PLC 2.50% 20154 | 7,000 | 7,148 |
| BG Energy Capital PLC 2.875% 20164 | 7,395 | 7,674 |
| Boardwalk Pipeline Partners 3.375% 2023 | 3,000 | 2,794 |
| Bonanza Creek Energy, Inc. 6.75% 2021 | 6,200 | 6,479 |
| Canadian Natural Resources Ltd. 5.70% 2017 | 7,350 | 8,192 |
| Canadian Natural Resources Ltd. 3.80% 2024 | 1,440 | 1,473 |
| Canadian Natural Resources Ltd. 6.50% 2037 | 1,000 | 1,258 |
| Cenovus Energy Inc. 3.00% 2022 | 5,970 | 5,841 |
| Cenovus Energy Inc. 3.80% 2023 | 17,050 | 17,569 |
| Cenovus Energy Inc. 6.75% 2039 | 2,500 | 3,214 |
| CNOOC Finance (2013) Ltd. 3.00% 2023 | 5,150 | 4,806 |
| CONSOL Energy Inc. 8.25% 2020 | 46,251 | 49,489 |
| CONSOL Energy Inc. 5.875% 20224 | 19,650 | 19,957 |
| Denbury Resources Inc. 4.625% 2023 | 22,250 | 20,915 |
| Devon Energy Corp. 2.25% 2018 | 5,850 | 5,884 |
| Devon Energy Corp. 4.75% 2042 | 7,625 | 7,839 |
| Diamond Offshore Drilling, Inc. 4.875% 2043 | 19,030 | 19,034 |
| Ecopetrol SA 5.875% 2045 | 5,035 | 5,287 |
| El Paso Pipeline Partners Operating Co., LLC 5.00% 2021 | 5,000 | 5,449 |
| El Paso Pipeline Partners Operating Co., LLC 4.70% 2042 | 41,015 | 38,180 |
| Enbridge Energy Partners, LP, Series B, 6.50% 2018 | 5,225 | 6,033 |
| Enbridge Energy Partners, LP 9.875% 2019 | 10,500 | 13,737 |
| Enbridge Energy Partners, LP, Series B, 7.50% 2038 | 6,000 | 8,132 |
| Enbridge Energy Partners, LP 5.50% 2040 | 16,200 | 17,652 |
| Enbridge Inc. 5.60% 2017 | 20,067 | 22,237 |
| Enbridge Inc. 4.00% 2023 | 27,650 | 28,706 |
| EnLink Midstream Partners, LP 2.70% 2019 | 1,660 | 1,674 |
| EnLink Midstream Partners, LP 4.40% 2024 | 1,290 | 1,350 |
| Enterprise Products Operating LLC 5.20% 2020 | 5,500 | 6,248 |
| Enterprise Products Operating LLC 3.35% 2023 | 5,000 | 4,975 |
| Enterprise Products Operating LLC 3.90% 2024 | 20,600 | 21,128 |
| Enterprise Products Operating LLC 4.85% 2044 | 2,200 | 2,277 |
| Exxon Mobil Corp. 0.921% 2017 | 8,500 | 8,494 |
| Exxon Mobil Corp. 1.819% 2019 | 11,950 | 11,977 |
The Income Fund of America — Page 13 of 32
Bonds, notes & other debt instruments
Corporate bonds & notes (continued)
Energy (continued) | Principal amount
(000) | Value
(000) |
| Exxon Mobil Corp. 3.176% 2024 | $6,300 | $6,427 |
| Halliburton Co. 2.00% 2018 | 14,000 | 14,160 |
| Kinder Morgan Energy Partners, LP 3.50% 2016 | 9,750 | 10,121 |
| Kinder Morgan Energy Partners, LP 2.65% 2019 | 1,890 | 1,903 |
| Kinder Morgan Energy Partners, LP 9.00% 2019 | 1,660 | 2,110 |
| Kinder Morgan Energy Partners, LP 5.00% 20214 | 11,150 | 11,359 |
| Kinder Morgan Energy Partners, LP 3.50% 2021 | 2,230 | 2,240 |
| Kinder Morgan Energy Partners, LP 4.15% 2022 | 12,145 | 12,484 |
| Kinder Morgan Energy Partners, LP 3.45% 2023 | 7,500 | 7,210 |
| Kinder Morgan Energy Partners, LP 3.50% 2023 | 4,850 | 4,634 |
| Kinder Morgan Energy Partners, LP 4.15% 2024 | 1,950 | 1,952 |
| Kinder Morgan Energy Partners, LP 6.95% 2038 | 750 | 911 |
| Kinder Morgan Energy Partners, LP 5.00% 2043 | 20,000 | 19,297 |
| Kinder Morgan Energy Partners, LP 5.50% 2044 | 7,206 | 7,458 |
| Laredo Petroleum, Inc. 9.50% 2019 | 34,200 | 36,679 |
| NGL Energy Partners LP 5.125% 20194 | 7,975 | 7,965 |
| NGPL PipeCo LLC 7.119% 20174 | 40,800 | 41,310 |
| NGPL PipeCo LLC 9.625% 20194 | 47,630 | 51,798 |
| Oasis Petroleum Inc. 6.875% 20224 | 8,000 | 8,700 |
| Odebrecht Drilling Norbe VIII/IX Ltd 6.35% 20214,8 | 1,628 | 1,729 |
| Odebrecht Offshore Drilling Finance Ltd. 6.75% 20224,8 | 4,691 | 4,937 |
| PDC Energy Inc. 7.75% 2022 | 28,200 | 31,443 |
| Peabody Energy Corp. 6.00% 2018 | 71,845 | 72,025 |
| Peabody Energy Corp. 6.25% 2021 | 34,150 | 32,528 |
| Pemex Project Funding Master Trust 4.875% 2015 | 2,400 | 2,458 |
| Petrobras Global Finance Co. 4.375% 2023 | 3,320 | 3,164 |
| Petrobras Global Finance Co. 6.25% 2024 | 675 | 712 |
| Petrobras Global Finance Co. 5.625% 2043 | 1,310 | 1,193 |
| Petrobras International Finance Co. 5.75% 2020 | 6,535 | 6,973 |
| Petrobras International Finance Co. 5.375% 2021 | 28,655 | 29,660 |
| Petrobras International Finance Co. 6.75% 2041 | 290 | 298 |
| Petróleos Mexicanos 3.50% 2018 | 14,280 | 14,887 |
| QGOG Atlantic/Alaskan Rigs Ltd. 5.25% 20194,8 | 18,052 | 19,068 |
| Ras Laffan Liquefied Natural Gas II 5.298% 20204,8 | 20,738 | 22,630 |
| Ras Laffan Liquefied Natural Gas III 5.838% 20274,8 | 10,325 | 11,512 |
| Ras Laffan Liquefied Natural Gas III 5.50% 20144 | 2,400 | 2,418 |
| Ras Laffan Liquefied Natural Gas III 6.75% 2019 | 4,000 | 4,835 |
| Ras Laffan Liquefied Natural Gas III 6.75% 20194 | 1,000 | 1,209 |
| Regency Energy Partners LP and Regency Energy Finance Corp. 6.50% 2021 | 14,550 | 15,605 |
| Regency Energy Partners LP and Regency Energy Finance Corp. 5.875% 2022 | 3,950 | 4,147 |
| Regency Energy Partners LP and Regency Energy Finance Corp. 5.00% 2022 | 35 | 35 |
| Regency Energy Partners LP and Regency Energy Finance Corp. 5.50% 2023 | 10,875 | 11,038 |
| Rice Energy Inc. 6.25% 20224 | 11,475 | 11,418 |
| Sabine Pass Liquefaction, LLC 5.625% 2021 | 24,650 | 25,636 |
| Sabine Pass Liquefaction, LLC 5.625% 2023 | 5,000 | 5,100 |
| Sabine Pass Liquefaction, LLC 5.75% 20244 | 20,075 | 20,401 |
| Samson Investment Co. 10.75% 20204 | 55,055 | 56,018 |
| Samson Investment Co., Term Loan B, 5.00% 20187,8,9 | 1,450 | 1,448 |
| Schlumberger Investment SA 3.65% 2023 | 9,585 | 9,963 |
| Shell International Finance BV 2.00% 2018 | 4,990 | 5,042 |
| Spectra Energy Partners, LP 2.95% 2016 | 3,750 | 3,883 |
| Spectra Energy Partners, LP 4.60% 2021 | 15,000 | 16,288 |
| Spectra Energy Partners, LP 4.75% 2024 | 3,250 | 3,494 |
| Statoil ASA 3.125% 2017 | 10,000 | 10,528 |
The Income Fund of America — Page 14 of 32
Bonds, notes & other debt instruments
Corporate bonds & notes (continued)
Energy (continued) | Principal amount
(000) | Value
(000) |
| Statoil ASA 4.25% 2041 | $3,000 | $3,035 |
| StatoilHydro ASA 1.80% 2016 | 10,000 | 10,209 |
| StatoilHydro ASA 2.65% 2024 | 4,000 | 3,845 |
| Teekay Corp. 8.50% 2020 | 21,405 | 24,562 |
| Total Capital International 2.125% 2018 | 6,500 | 6,585 |
| Total Capital International 2.10% 2019 | 15,400 | 15,362 |
| Total Capital International 3.70% 2024 | 5,000 | 5,154 |
| Total Capital SA 3.00% 2015 | 10,000 | 10,243 |
| TransCanada PipeLines Ltd. 7.625% 2039 | 10,750 | 15,558 |
| TransCanada PipeLines Ltd., junior subordinated 6.35% 20677 | 61,150 | 63,871 |
| Transocean Inc. 5.05% 2016 | 18,395 | 19,921 |
| Transocean Inc. 2.50% 2017 | 6,500 | 6,601 |
| Transocean Inc. 6.375% 2021 | 23,090 | 26,353 |
| Transocean Inc. 3.80% 2022 | 2,635 | 2,559 |
| Transportadora de Gas Peru SA 4.25% 20284,8 | 2,125 | 1,997 |
| Western Gas Partners LP 2.60% 2018 | 1,150 | 1,173 |
| Williams Partners LP 5.25% 2020 | 1,960 | 2,194 |
| Williams Partners LP 4.00% 2021 | 2,900 | 3,034 |
| Williams Partners LP 4.50% 2023 | 6,000 | 6,334 |
| Williams Partners LP 4.30% 2024 | 4,480 | 4,648 |
| Williams Partners LP 3.90% 2025 | 10,500 | 10,497 |
| Williams Partners LP 5.40% 2044 | 760 | 811 |
| Woodside Finance Ltd. 4.60% 20214 | 18,935 | 20,730 |
| | | 1,622,751 |
| Health care 1.52% | | |
| AbbVie Inc. 4.40% 2042 | 17,270 | 16,918 |
| Aetna Inc. 1.50% 2017 | 1,335 | 1,334 |
| Aetna Inc. 2.20% 2019 | 1,195 | 1,194 |
| Aetna Inc. 4.75% 2044 | 1,250 | 1,316 |
| Amgen Inc. 1.25% 2017 | 5,000 | 4,986 |
| Amgen Inc. 2.20% 2019 | 13,250 | 13,180 |
| Amgen Inc. 3.625% 2024 | 750 | 753 |
| Amgen Inc. 5.375% 2043 | 25,000 | 27,757 |
| Baxter International Inc. 1.85% 2018 | 3,180 | 3,185 |
| Baxter International Inc. 3.20% 2023 | 4,446 | 4,387 |
| Boston Scientific Corp. 6.40% 2016 | 21,735 | 23,834 |
| Boston Scientific Corp. 6.00% 2020 | 5,375 | 6,230 |
| Cardinal Health, Inc. 4.00% 2015 | 3,000 | 3,090 |
| Catalent Pharma Solutions Inc., Term Loan, 6.50% 20177,8,9 | 15,430 | 15,526 |
| Catholic Health Initiatives, Series 2012, 1.60% 2017 | 1,000 | 999 |
| Celgene Corp 3.625% 2024 | 19,490 | 19,516 |
| Celgene Corp 4.625% 2044 | 4,250 | 4,241 |
| Centene Corp. 5.75% 2017 | 23,240 | 25,041 |
| Centene Corp. 4.75% 2022 | 16,925 | 17,115 |
| Community Health Systems, Inc. 5.125% 2018 | 2,670 | 2,743 |
| Coventry Health Care, Inc. 6.30% 2014 | 8,370 | 8,384 |
| DENTSPLY International Inc. 2.75% 2016 | 5,620 | 5,803 |
| DJO Finance LLC 9.75% 2017 | 11,653 | 12,119 |
| DJO Finance LLC 8.75% 2018 | 22,175 | 23,616 |
| DJO Finance LLC 7.75% 2018 | 14,025 | 14,516 |
| DJO Finance LLC 9.875% 2018 | 7,285 | 7,722 |
| Endo Finance LLC & Endo Finco Inc. 7.00% 20194 | 2,450 | 2,588 |
| Endo Finance LLC & Endo Finco Inc. 7.00% 20204 | 6,350 | 6,723 |
The Income Fund of America — Page 15 of 32
Bonds, notes & other debt instruments
Corporate bonds & notes (continued)
Health care (continued) | Principal amount
(000) | Value
(000) |
| Endo Pharmaceuticals Holdings Inc. 5.75% 20224 | $4,575 | $4,564 |
| Express Scripts Inc. 2.75% 2014 | 1,000 | 1,007 |
| Express Scripts Inc. 3.125% 2016 | 13,564 | 14,100 |
| Express Scripts Inc. 7.25% 2019 | 8,985 | 10,926 |
| Forest Laboratories, Inc. 4.375% 20194 | 24,900 | 26,730 |
| Forest Laboratories, Inc. 5.00% 20214 | 32,740 | 35,736 |
| Gilead Sciences, Inc. 3.05% 2016 | 10,265 | 10,727 |
| Gilead Sciences, Inc. 3.70% 2024 | 9,355 | 9,603 |
| Gilead Sciences, Inc. 4.80% 2044 | 12,910 | 13,779 |
| Grifols Worldwide Operations Ltd. 5.25% 20224 | 5,000 | 5,031 |
| HCA Inc. 6.375% 2015 | 7,400 | 7,557 |
| HCA Inc. 3.75% 2019 | 53,950 | 53,680 |
| HCA Inc. 6.50% 2020 | 12,400 | 13,500 |
| Humana Inc. 4.625% 2042 | 30,000 | 29,610 |
| INC Research LLC 11.50% 20194 | 29,160 | 32,805 |
| inVentiv Health Inc, Term Loan B4, 7.75% 20187,8,9 | 19,305 | 19,353 |
| inVentiv Health Inc. 9.00% 20184 | 35,035 | 37,050 |
| inVentiv Health Inc. 11.00% 20184 | 53,835 | 48,855 |
| inVentiv Health Inc. 11.00% 20184 | 23,915 | 21,763 |
| Johnson & Johnson 4.50% 2043 | 5,250 | 5,670 |
| Kinetic Concepts, Inc. 10.50% 2018 | 69,942 | 77,636 |
| Kinetic Concepts, Inc. 12.50% 2019 | 24,950 | 28,039 |
| McKesson Corp. 0.95% 2015 | 1,135 | 1,139 |
| McKesson Corp. 3.25% 2016 | 7,525 | 7,798 |
| McKesson Corp. 1.40% 2018 | 745 | 733 |
| McKesson Corp. 2.284% 2019 | 5,875 | 5,862 |
| McKesson Corp. 4.75% 2021 | 3,475 | 3,866 |
| McKesson Corp. 3.796% 2024 | 14,505 | 14,749 |
| McKesson Corp. 4.883% 2044 | 625 | 651 |
| Medco Health Solutions, Inc. 2.75% 2015 | 6,305 | 6,446 |
| Medtronic, Inc. 4.625% 2044 | 1,200 | 1,244 |
| Merck & Co., Inc. 1.10% 2018 | 6,710 | 6,613 |
| Merck & Co., Inc. 2.80% 2023 | 545 | 529 |
| Multiplan Inc., Term Loan B, 4.00% 20217,8,9 | 63,612 | 63,406 |
| Novartis Capital Corp. 2.90% 2015 | 14,000 | 14,269 |
| Novartis Capital Corp. 3.40% 2024 | 22,105 | 22,346 |
| Novartis Capital Corp. 4.40% 2044 | 2,250 | 2,342 |
| Ortho-Clinical Diagnostics Inc. 6.625% 20224 | 9,940 | 9,356 |
| Ortho-Clinical Diagnostics Inc., Term Loan B, 4.75% 20217,8,9 | 29,575 | 29,606 |
| Pfizer Inc. 2.10% 2019 | 41,500 | 41,600 |
| Pfizer Inc. 3.40% 2024 | 22,000 | 22,167 |
| Pfizer Inc. 4.40% 2044 | 21,000 | 21,570 |
| PRA Holdings, Inc. 9.50% 20234 | 8,235 | 9,100 |
| Roche Holdings, Inc. 7.00% 20394 | 4,000 | 5,625 |
| Rotech Healthcare Inc., Term Loan A, 5.50% 20183,7,8,9 | 12,009 | 11,949 |
| Rotech Healthcare Inc., Term Loan B, 10.00% 20193,7,8,9 | 9,200 | 9,154 |
| Rotech Healthcare Inc., Term Loan, 13.00% 20203,6,7,8,9 | 18,566 | 18,474 |
| Select Medical Holdings Corp. 6.375% 2021 | 9,850 | 10,145 |
| Symbion Inc. 8.00% 2016 | 32,230 | 33,680 |
| Tenet Healthcare Corp., First Lien, 6.25% 2018 | 2,500 | 2,716 |
| Tenet Healthcare Corp., First Lien, 4.75% 2020 | 11,710 | 11,681 |
| Tenet Healthcare Corp., First Lien, 6.00% 2020 | 40,255 | 42,368 |
| Tenet Healthcare Corp., First Lien, 4.50% 2021 | 12,540 | 12,242 |
| Thermo Fisher Scientific Inc. 1.30% 2017 | 8,630 | 8,629 |
The Income Fund of America — Page 16 of 32
Bonds, notes & other debt instruments
Corporate bonds & notes (continued)
Health care (continued) | Principal amount
(000) | Value
(000) |
| Thermo Fisher Scientific Inc. 2.40% 2019 | $8,405 | $8,444 |
| Thermo Fisher Scientific Inc. 4.15% 2024 | 11,250 | 11,685 |
| UnitedHealth Group Inc. 6.00% 2017 | 12,430 | 14,045 |
| UnitedHealth Group Inc. 2.75% 2023 | 660 | 637 |
| UnitedHealth Group Inc. 2.875% 2023 | 1,500 | 1,459 |
| VPI Escrow Corp. 6.75% 20184 | 32,760 | 34,316 |
| VPI Escrow Corp. 6.375% 20204 | 41,555 | 43,061 |
| VPI Escrow Corp. 7.50% 20214 | 18,785 | 20,358 |
| VPI Escrow Corp. 5.625% 20214 | 4,525 | 4,491 |
| VWR Funding, Inc. 7.25% 2017 | 46,525 | 49,316 |
| WellPoint, Inc. 2.30% 2018 | 1,370 | 1,390 |
| | | 1,423,794 |
| Industrials 1.49% | | |
| AAF Holdings LLC 12.75% 20194,6,7,8 | 7,525 | 7,684 |
| ABB Finance (USA) Inc. 1.625% 2017 | 1,000 | 1,009 |
| ABB Finance (USA) Inc. 2.875% 2022 | 1,000 | 989 |
| ADS Waste Escrow 8.25% 2020 | 4,675 | 5,002 |
| ADT Corp. 4.125% 2019 | 19,225 | 19,033 |
| AerCap Holdings NV 2.75% 20174 | 19,325 | 19,108 |
| Allegiant Travel Co. 5.50% 2019 | 4,050 | 4,116 |
| Altegrity, Inc. 9.50% 20194 | 49,900 | 49,962 |
| American Airlines, Inc., Series 2013-2, Class A, 4.95% 20248 | 8,826 | 9,565 |
| Associated Materials, LLC and AMH New Finance, Inc. 9.125% 2017 | 79,655 | 79,555 |
| Atlas Copco AB 5.60% 20174 | 7,405 | 8,194 |
| BakerCorp International, Inc. 8.25% 2019 | 2,000 | 2,030 |
| BE Aerospace, Inc. 5.25% 2022 | 63,715 | 69,370 |
| Builders Firstsource 7.625% 20214 | 7,094 | 7,431 |
| Burlington Northern Santa Fe LLC 3.00% 2023 | 4,580 | 4,495 |
| Burlington Northern Santa Fe LLC 3.75% 2024 | 2,270 | 2,338 |
| Burlington Northern Santa Fe LLC 4.90% 2044 | 20,240 | 21,554 |
| Canadian National Railway Co. 1.45% 2016 | 5,010 | 5,063 |
| CEVA Group PLC 7.00% 20214 | 2,250 | 2,306 |
| CEVA Group PLC 9.00% 20214 | 1,050 | 1,076 |
| CEVA Group PLC, LOC, 6.50% 20217,8,9 | 4,870 | 4,776 |
| CEVA Group PLC, Term Loan B, 6.50% 20217,8,9 | 7,066 | 6,930 |
| CEVA Group PLC, Term Loan, 6.50% 20217,8,9 | 5,123 | 5,023 |
| CEVA Group PLC, Term Loan, 6.50% 20217,8,9 | 883 | 866 |
| CNH Capital LLC 3.25% 2017 | 6,500 | 6,532 |
| Continental Airlines, Inc., Series 1997-1, Class A, 7.461% 20168 | 229 | 238 |
| Continental Airlines, Inc., Series 2001-1, Class B, 7.373% 20178 | 2,194 | 2,347 |
| Continental Airlines, Inc., Series 1997-4B, Class B, 6.90% 20188 | 48 | 51 |
| Continental Airlines, Inc., Series 1998-1, Class B, 6.748% 20188 | 435 | 470 |
| Continental Airlines, Inc., Series 1998-1, Class A, 6.648% 20198 | 3,841 | 4,107 |
| Continental Airlines, Inc., Series 1997-4, Class A, 6.90% 20198 | 1,762 | 1,890 |
| Continental Airlines, Inc., Series 2000-2, Class B, 8.307% 20198 | 194 | 213 |
| Continental Airlines, Inc., Series 1999-1, Class B, 6.795% 20208 | 193 | 203 |
| Continental Airlines, Inc., Series 1999-1, Class A, 6.545% 20208 | 10,803 | 12,109 |
| Continental Airlines, Inc., Series 1999-2, Class A-1, 7.256% 20218 | 419 | 476 |
| Continental Airlines, Inc., Series 1999-2, Class B, 7.566% 20218 | 454 | 492 |
| Continental Airlines, Inc., Series 2007-1, Class B, 6.903% 20228 | 10,390 | 11,228 |
| Continental Airlines, Inc., Series 2000-1, Class A-1, 8.048% 20228 | 4,626 | 5,343 |
| Continental Airlines, Inc., Series 2000-1, Class B, 8.388% 20228 | 176 | 185 |
| Continental Airlines, Inc., Series 2000-2, Class A-1, 7.707% 20228 | 2,669 | 3,051 |
The Income Fund of America — Page 17 of 32
Bonds, notes & other debt instruments
Corporate bonds & notes (continued)
Industrials (continued) | Principal amount
(000) | Value
(000) |
| Continental Airlines, Inc., Series 2001-1, Class A-1, 6.703% 20228 | $3,548 | $3,930 |
| CSX Corp. 6.25% 2015 | 3,460 | 3,589 |
| CSX Corp. 3.40% 2024 | 14,405 | 14,407 |
| DAE Aviation Holdings, Inc. and Standard Aero Ltd., Term Loan B-1, 5.00% 20187,8,9 | 33,143 | 33,339 |
| DAE Aviation Holdings, Inc. and Standard Aero Ltd., Term Loan B-2, 5.00% 20187,8,9 | 14,697 | 14,785 |
| Delta Air Lines, Inc., Series 2002-1, Class G-1, MBIA insured, 6.718% 20248 | 4,869 | 5,746 |
| ERAC USA Finance Co. 5.25% 20204 | 5,000 | 5,662 |
| Esterline Technologies Corp. 7.00% 2020 | 18,065 | 19,284 |
| Euramax International, Inc. 9.50% 2016 | 31,755 | 31,279 |
| European Aeronautic Defence and Space Company 2.70% 20234 | 6,000 | 5,800 |
| Gardner Denver, Inc. Term Loan B, 4.25% 20207,8,9 | 38,094 | 37,966 |
| Gates Global LLC 6.00% 20224 | 9,575 | 9,383 |
| Gates Global LLC, Term Loan B, 4.25% 20217,8,9 | 11,100 | 11,043 |
| General Electric Capital Corp., Series A, 2.25% 2015 | 12,000 | 12,265 |
| General Electric Capital Corp. 2.95% 2016 | 4,650 | 4,836 |
| General Electric Capital Corp. 2.45% 2017 | 13,000 | 13,412 |
| General Electric Capital Corp., Series A, 6.00% 2019 | 9,000 | 10,586 |
| General Electric Capital Corp. 3.45% 2024 | 9,000 | 9,001 |
| General Electric Capital Corp., Series A, junior subordinated 7.125% (undated)7 | 112,300 | 131,594 |
| General Electric Capital Corp., Series B, junior subordinated 6.25% (undated)7 | 50,000 | 55,591 |
| General Electric Co. 0.85% 2015 | 10,000 | 10,047 |
| General Electric Co. 2.70% 2022 | 7,750 | 7,578 |
| General Electric Co. 4.125% 2042 | 11,000 | 10,939 |
| Hardwoods Acquisition Inc 7.50% 20214 | 11,250 | 11,475 |
| Hawker Beechcraft Acquisition Co., LLC, LOC, 0.009% 20151,7,8,9 | 2,488 | 2,363 |
| HD Supply, Inc. 11.50% 2020 | 31,980 | 37,337 |
| HDTFS Inc. 5.875% 2020 | 3,000 | 3,075 |
| Iron Mountain Inc. 6.00% 20233 | 950 | 995 |
| Iron Mountain Inc. 5.75% 20243 | 2,175 | 2,186 |
| Jeld-Wen Escrow Corp. 12.25% 20174 | 45,670 | 48,867 |
| LMI Aerospace Inc. 7.375% 20194 | 15,600 | 15,853 |
| Navios Maritime Acquisition Corp. and Navios Acquisition Finance (US) Inc. 8.125% 20214 | 19,500 | 19,841 |
| Navios Maritime Holdings Inc. 7.375% 20224 | 29,140 | 29,723 |
| Navios Maritime Holdings Inc. and Navios Maritime Finance II (US) Inc. 8.125% 2019 | 15,510 | 15,937 |
| Nielsen Finance LLC and Nielsen Finance Co. 4.50% 2020 | 22,500 | 22,387 |
| Nielsen Finance LLC and Nielsen Finance Co. 5.50% 20214 | 18,900 | 19,325 |
| Nielsen Finance LLC and Nielsen Finance Co. 5.00% 20224 | 24,500 | 24,255 |
| Norfolk Southern Corp. 5.75% 2016 | 6,710 | 7,181 |
| Norfolk Southern Corp. 5.75% 2018 | 2,000 | 2,270 |
| Nortek Inc. 10.00% 2018 | 22,255 | 23,702 |
| Nortek Inc. 8.50% 2021 | 33,565 | 36,586 |
| Northwest Airlines, Inc., Term Loan A, 1.99% 20187,8,9 | 13,918 | 13,431 |
| Ply Gem Industries, Inc. 6.50% 20224 | 17,050 | 16,006 |
| R.R. Donnelley & Sons Co. 7.25% 20183 | 7,234 | 8,229 |
| R.R. Donnelley & Sons Co. 7.875% 20213 | 3,050 | 3,462 |
| R.R. Donnelley & Sons Co. 7.00% 20223 | 16,735 | 18,325 |
| R.R. Donnelley & Sons Co. 6.50% 20233 | 11,125 | 11,487 |
| Safway Group Holding 7.00% 20184 | 5,500 | 5,789 |
| Silver II Borrower S.C.A./Silver II U.S. Holdings, LLC 7.75% 20204 | 17,375 | 18,287 |
| TRAC Intermodal 11.00% 2019 | 15,425 | 17,199 |
| TransDigm Inc. 5.50% 2020 | 22,000 | 21,890 |
| Union Pacific Corp. 3.646% 2024 | 1,610 | 1,665 |
| United Air Lines, Inc., Series 1996-A2, 7.87% 20191,8,11 | 2,421 | — |
| United Air Lines, Inc., Series 2007-1, Class B, 7.336% 20214,8 | 4,042 | 4,447 |
The Income Fund of America — Page 18 of 32
Bonds, notes & other debt instruments
Corporate bonds & notes (continued)
Industrials (continued) | Principal amount
(000) | Value
(000) |
| United Air Lines, Inc., Series 2007-1, Class A, 6.636% 20248 | $6,434 | $7,110 |
| United Technologies Corp. 4.50% 2042 | 5,965 | 6,198 |
| US Investigations Services, Inc. 13.00% 20204,6 | 49,578 | 42,542 |
| US Investigations Services, Inc. 14.00% 20204,6 | 3,585 | 3,077 |
| US Investigations Services, Inc. 15.00% 20214,6 | 9,970 | 6,394 |
| Volvo Treasury AB 5.95% 20154 | 8,835 | 9,140 |
| Watco Companies 6.375% 20234 | 10,670 | 10,883 |
| | | 1,397,391 |
| Information technology 0.87% | | |
| Alcatel-Lucent USA Inc. 4.625% 20174 | 38,200 | 38,678 |
| Alcatel-Lucent USA Inc. 8.875% 20204 | 20,225 | 22,551 |
| Alcatel-Lucent USA Inc. 6.75% 20204 | 16,600 | 17,056 |
| Avago Technologies Ltd., Term Loan B, 3.75% 20217,8,9 | 73,575 | 73,517 |
| Ceridian LLC / Comdata Inc. 8.125% 20174 | 7,200 | 7,200 |
| Compucom Systems Inc., 7.00% 20214 | 3,425 | 3,378 |
| First Data Corp. 7.375% 20194 | 18,225 | 19,227 |
| First Data Holdings, Inc. 14.50% 20194,6 | 15,001 | 16,271 |
| First Data Corp. 6.75% 20204 | 12,350 | 13,091 |
| First Data Corp. 8.25% 20214 | 25,825 | 27,762 |
| First Data Corp. 12.625% 2021 | 23,539 | 28,261 |
| First Data Corp. 11.75% 2021 | 33,186 | 38,911 |
| First Data Corp. 8.75% 20224,6,7 | 36,640 | 39,388 |
| Freescale Semiconductor, Inc. 5.00% 20214 | 56,240 | 56,240 |
| Freescale Semiconductor, Inc. 6.00% 20224 | 19,075 | 19,695 |
| Freescale Semiconductor, Inc., Term Loan B4, 4.25% 20207,8,9 | 7,960 | 7,994 |
| Hughes Satellite Systems Corp. 6.50% 2019 | 9,550 | 10,589 |
| International Business Machines Corp. 2.00% 2016 | 10,000 | 10,214 |
| International Business Machines Corp. 1.95% 2016 | 10,000 | 10,243 |
| Jabil Circuit, Inc. 8.25% 2018 | 20,925 | 24,744 |
| Jabil Circuit, Inc. 5.625% 2020 | 10,650 | 11,555 |
| Lawson Software, Inc. 9.375% 2019 | 25,800 | 28,283 |
| NXP BV and NXP Funding LLC 3.75% 20184 | 34,825 | 34,651 |
| Oracle Corp. 2.25% 2019 | 19,000 | 18,939 |
| Oracle Corp. 2.80% 2021 | 8,500 | 8,453 |
| Oracle Corp. 3.40% 2024 | 7,500 | 7,479 |
| Oracle Corp. 4.50% 2044 | 2,500 | 2,529 |
| Samsung Electronics America, Inc. 1.75% 20174 | 3,500 | 3,515 |
| Serena Software, Inc. Term Loan B 7.50% 20207,8,9 | 23,575 | 23,801 |
| SRA International, Inc. 11.00% 2019 | 59,195 | 63,043 |
| SRA International, Inc., Term Loan B, 6.50% 20187,8,9 | 67,768 | 68,106 |
| SunGard Data Systems Inc. 7.375% 2018 | 15,722 | 16,439 |
| SunGard Data Systems Inc. 7.625% 2020 | 29,540 | 31,386 |
| Xerox Corp. 6.40% 2016 | 768 | 835 |
| Xerox Corp. 6.75% 2017 | 360 | 406 |
| Xerox Corp. 2.95% 2017 | 7,940 | 8,262 |
| | | 812,692 |
The Income Fund of America — Page 19 of 32
Bonds, notes & other debt instruments
Corporate bonds & notes (continued)
Materials 0.85% | Principal amount
(000) | Value
(000) |
| Arbermarle Corp. 5.10% 2015 | $2,570 | $2,625 |
| ArcelorMittal 4.25% 20157 | 4,000 | 4,085 |
| ArcelorMittal 5.00% 20177 | 15,680 | 16,190 |
| ArcelorMittal 6.00% 20217 | 15,470 | 16,108 |
| ArcelorMittal 6.75% 20227 | 25,110 | 27,307 |
| ArcelorMittal 7.25% 20417 | 50,000 | 51,250 |
| Ball Corp. 5.75% 2021 | 4,615 | 4,834 |
| Ball Corp. 5.00% 2022 | 3,625 | 3,634 |
| Cliffs Natural Resources Inc. 4.875% 20213 | 4,945 | 4,848 |
| Dow Chemical Co. 5.25% 2041 | 4,000 | 4,347 |
| Ecolab Inc. 3.00% 2016 | 7,455 | 7,785 |
| Ecolab Inc. 4.35% 2021 | 1,000 | 1,088 |
| Ecolab Inc. 5.50% 2041 | 750 | 878 |
| First Quantum Minerals Ltd. 6.75% 20204 | 54,163 | 55,517 |
| First Quantum Minerals Ltd. 7.00% 20214 | 54,762 | 56,679 |
| First Quantum Minerals Ltd. 7.25% 20224 | 2,850 | 2,914 |
| FMG Resources 6.00% 20174 | 59,280 | 60,503 |
| FMG Resources 6.875% 20184 | 37,385 | 38,880 |
| FMG Resources 8.25% 20194 | 12,700 | 13,700 |
| Georgia Gulf Corp. 4.625% 2021 | 14,625 | 14,351 |
| Georgia Gulf Corp. 4.875% 2023 | 2,400 | 2,349 |
| Glencore Xstrata LLC 2.50% 20194 | 10,000 | 9,926 |
| Glencore Xstrata LLC 4.625% 20244 | 7,000 | 7,176 |
| Graphic Packaging International, Inc. 4.75% 2021 | 3,550 | 3,568 |
| Holcim Ltd. 6.00% 20194 | 1,607 | 1,856 |
| Holcim Ltd. 5.15% 20234 | 12,595 | 13,804 |
| International Paper Co. 7.30% 2039 | 5,615 | 7,497 |
| JMC Steel Group Inc. 8.25% 20184 | 46,658 | 46,366 |
| LSB Industries, Inc. 7.75% 2019 | 16,800 | 18,102 |
| Monsanto Co. 2.75% 2021 | 5,195 | 5,156 |
| Monsanto Co. 4.40% 2044 | 13,215 | 13,218 |
| Mosaic Co. 4.25% 2023 | 800 | 840 |
| Newcrest Finance Pty Ltd. 4.45% 20214 | 7,000 | 6,906 |
| OMNOVA Solutions Inc. 7.875% 2018 | 8,500 | 8,883 |
| PQ Corp. 8.75% 20184 | 7,700 | 8,258 |
| Rayonier Advanced Materials Inc. 5.50% 20244 | 17,132 | 16,918 |
| Reynolds Group Inc. 7.125% 2019 | 8,000 | 8,320 |
| Reynolds Group Inc. 7.875% 2019 | 1,555 | 1,662 |
| Reynolds Group Inc. 5.75% 2020 | 67,800 | 69,326 |
| Rio Tinto Finance (USA) Ltd. 1.375% 2016 | 3,000 | 3,031 |
| Rio Tinto Finance (USA) Ltd. 2.25% 2016 | 9,000 | 9,243 |
| Rio Tinto Finance (USA) Ltd. 1.625% 2017 | 8,500 | 8,574 |
| Rio Tinto Finance (USA) Ltd. 2.25% 2018 | 8,995 | 9,097 |
| Rio Tinto Finance (USA) Ltd. 9.00% 2019 | 3,000 | 3,903 |
| Ryerson Inc. 9.00% 2017 | 18,800 | 19,952 |
| Ryerson Inc. 11.25% 2018 | 13,975 | 15,512 |
| Smurfit Capital Funding PLC 7.50% 2025 | 7,125 | 8,158 |
| Solenis, Term Loan, 7.75% 20227,8,9 | 17,945 | 17,930 |
| Taminco Global Chemical Corp. 9.75% 20204 | 4,940 | 5,446 |
| U.S. Coatings Acquisition Inc. (Flash Dutch 2 BV) 7.375% 20214 | 7,310 | 7,803 |
| U.S. Coatings Acquisition Inc. (Flash Dutch 2 BV), Term Loan B, 4.00% 20207,8,9 | 12,103 | 12,057 |
| Walter Energy, Inc. 9.50% 20194 | 27,600 | 27,497 |
| Walter Energy, Inc. 9.875% 2020 | 4,150 | 2,179 |
The Income Fund of America — Page 20 of 32
Bonds, notes & other debt instruments
Corporate bonds & notes (continued)
Materials (continued) | Principal amount
(000) | Value
(000) |
| Xstrata Canada Financial Corp. 3.60% 20174 | $5,000 | $5,237 |
| Xstrata Canada Financial Corp. 4.95% 20214 | 6,000 | 6,479 |
| | | 799,752 |
| Utilities 0.68% | | |
| Abu Dhabi National Energy Co. PJSC (TAQA) 6.165% 2017 | 10,000 | 11,397 |
| Abu Dhabi National Energy Co. PJSC (TAQA) 6.165% 20174 | 2,000 | 2,279 |
| AES Corp. 7.75% 2015 | 10,000 | 10,700 |
| AES Corp. 8.00% 2017 | 487 | 560 |
| AES Corp. 8.00% 2020 | 7,000 | 8,295 |
| AES Corp. 7.375% 2021 | 10,125 | 11,593 |
| AES Panamá, SA 6.35% 20164 | 7,627 | 8,076 |
| American Electric Power Co. 2.95% 2022 | 12,065 | 11,786 |
| Calpine Corp. 5.375% 2023 | 18,000 | 17,618 |
| Calpine Corp. 7.875% 20234 | 3,000 | 3,278 |
| CenterPoint Energy Resources Corp. 4.50% 2021 | 13,130 | 14,431 |
| CEZ, a s 4.25% 20224 | 2,820 | 2,969 |
| CMS Energy Corp. 5.05% 2018 | 325 | 359 |
| CMS Energy Corp. 8.75% 2019 | 11,000 | 14,142 |
| CMS Energy Corp. 6.25% 2020 | 20,282 | 23,993 |
| CMS Energy Corp. 3.875% 2024 | 15,085 | 15,618 |
| CMS Energy Corp. 4.70% 2043 | 586 | 602 |
| CMS Energy Corp. 4.875% 2044 | 8,310 | 8,763 |
| Colbun SA 6.00% 20204 | 2,000 | 2,226 |
| Colbun SA 4.50% 20244 | 1,500 | 1,496 |
| Comision Federal de Electricidad 4.875% 20244 | 2,000 | 2,132 |
| Consumers Energy Co., First Mortgage Bonds, 6.125% 2019 | 2,500 | 2,931 |
| Consumers Energy Co., First Mortgage Bonds, 6.70% 2019 | 14,106 | 17,043 |
| Duke Energy Corp. 3.95% 2023 | 6,098 | 6,347 |
| Duke Energy Corp. 3.75% 2024 | 11,310 | 11,607 |
| Duke Energy Indiana, Inc. 4.90% 2043 | 17,000 | 18,866 |
| E.ON International Finance BV 5.80% 20184 | 17,000 | 19,285 |
| EDP Finance BV 5.25% 20214 | 22,500 | 23,485 |
| Electricité de France SA 1.15% 20174 | 3,500 | 3,500 |
| Electricité de France SA 6.95% 20394 | 8,000 | 10,604 |
| Electricité de France SA 4.875% 20444 | 1,850 | 1,982 |
| Electricité de France SA 5.25% (undated)4,7 | 25,505 | 25,980 |
| Empresa Nacional de Electricidad SA 4.25% 2024 | 900 | 904 |
| Enel Finance International SA 6.00% 20394 | 3,000 | 3,427 |
| Enel Società per Azioni 8.75% 20734,7 | 12,000 | 14,160 |
| Entergy Corp. 4.70% 2017 | 8,000 | 8,611 |
| Eskom Holdings Ltd. 5.75% 20214 | 6,820 | 7,026 |
| Eskom Holdings SOC Ltd. 6.75% 20234 | 5,000 | 5,407 |
| FirstEnergy Corp., Series B, 4.25% 2023 | 31,465 | 31,266 |
| Iberdrola Finance Ireland 5.00% 20194 | 1,060 | 1,185 |
| Israel Electric Corp. Ltd. 8.10% 20964 | 4,905 | 5,346 |
| MidAmerican Energy Co. 5.95% 2017 | 10,625 | 12,023 |
| MidAmerican Energy Co. 2.40% 2019 | 9,000 | 9,163 |
| MidAmerican Energy Holdings Co. 5.75% 2018 | 10,000 | 11,366 |
| MidAmerican Energy Holdings Co. 3.75% 2023 | 11,640 | 11,944 |
| Midwest Generation, LLC, Series B, 8.56% 20168,11 | 2,419 | 2,510 |
| National Grid PLC 6.30% 2016 | 4,000 | 4,414 |
| National Rural Utilities Cooperative Finance Corp. 1.00% 2015 | 8,250 | 8,280 |
| Nevada Power Co., General and Refunding Mortgage Notes, Series V, 7.125% 2019 | 5,000 | 6,070 |
The Income Fund of America — Page 21 of 32
Bonds, notes & other debt instruments
Corporate bonds & notes (continued)
Utilities (continued) | Principal amount
(000) | Value
(000) |
| Northern States Power Co., First Mortgage Bonds, 2.60% 2023 | $8,703 | $8,378 |
| Northern States Power Co. 4.125% 2044 | 11,000 | 11,031 |
| NRG Energy, Inc. 8.25% 2020 | 3,850 | 4,158 |
| NRG Energy, Inc. 6.625% 2023 | 7,700 | 7,969 |
| NV Energy, Inc 6.25% 2020 | 20,420 | 24,221 |
| Pacific Gas and Electric Co. 3.85% 2023 | 14,365 | 15,029 |
| Pacific Gas and Electric Co. 3.75% 2024 | 6,875 | 7,068 |
| Pacific Gas and Electric Co. 6.05% 2034 | 3,288 | 4,060 |
| PacifiCorp., First Mortgage Bonds, 5.65% 2018 | 5,500 | 6,290 |
| PacifiCorp., First Mortgage Bonds, 5.50% 2019 | 4,940 | 5,637 |
| PacifiCorp., First Mortgage Bonds, 7.70% 2031 | 153 | 222 |
| PacifiCorp., First Mortgage Bonds, 5.25% 2035 | 1,047 | 1,208 |
| PG&E Corp. 2.40% 2019 | 1,470 | 1,477 |
| Progress Energy, Inc. 7.75% 2031 | 3,182 | 4,474 |
| Public Service Co. of Colorado 3.20% 2020 | 237 | 243 |
| Puget Sound Energy, Inc., First Lien, 6.50% 2020 | 6,234 | 7,426 |
| Puget Sound Energy, Inc., First Lien, 6.00% 2021 | 3,945 | 4,622 |
| Puget Sound Energy, Inc., First Lien, 5.625% 2022 | 7,321 | 8,436 |
| Puget Sound Energy Inc. 6.724% 2036 | 1,314 | 1,793 |
| Tampa Electric Co. 2.60% 2022 | 2,675 | 2,584 |
| Tampa Electric Co. 4.35% 2044 | 11,515 | 11,770 |
| Teco Finance, Inc. 4.00% 2016 | 3,031 | 3,181 |
| Teco Finance, Inc. 5.15% 2020 | 5,731 | 6,427 |
| TXU, Term Loan, 3.737% 20147,8,9,11 | 3,000 | 2,317 |
| TXU, Term Loan, 4.646% 20177,8,9,11 | 26,204 | 19,981 |
| Veolia Environnement 6.00% 2018 | 625 | 708 |
| Veolia Environnement 6.75% 2038 | 500 | 607 |
| Virginia Electric and Power Co., Series B, 5.95% 2017 | 4,500 | 5,137 |
| Virginia Electric and Power Co. 3.45% 2024 | 3,220 | 3,273 |
| Xcel Energy Inc. 4.70% 2020 | 5,796 | 6,436 |
| | | 643,208 |
| Consumer staples 0.65% | | |
| Altria Group, Inc. 9.70% 2018 | 6,081 | 7,891 |
| Altria Group, Inc. 9.25% 2019 | 18,542 | 24,336 |
| Altria Group, Inc. 4.00% 2024 | 1,500 | 1,531 |
| Altria Group, Inc. 9.95% 2038 | 23,500 | 38,747 |
| Altria Group, Inc. 4.25% 2042 | 20,000 | 18,291 |
| Altria Group, Inc. 4.50% 2043 | 16,000 | 15,211 |
| Altria Group, Inc. 5.375% 2044 | 1,700 | 1,827 |
| Anheuser-Busch InBev NV 4.125% 2015 | 10,000 | 10,167 |
| Anheuser-Busch InBev NV 3.625% 2015 | 21,000 | 21,487 |
| Anheuser-Busch InBev NV 1.375% 2017 | 7,500 | 7,530 |
| Anheuser-Busch InBev NV 7.75% 2019 | 25,000 | 30,770 |
| Brasil Foods SA 5.875% 20224 | 3,250 | 3,502 |
| Brasil Foods SA 5.875% 2022 | 1,500 | 1,616 |
| British American Tobacco International Finance PLC 9.50% 20184 | 8,705 | 11,254 |
| C&S Group Enterprises LLC 5.375% 20224 | 24,700 | 24,391 |
| Coca-Cola Co. 1.50% 2015 | 10,590 | 10,722 |
| Coca-Cola Co. 1.80% 2016 | 10,000 | 10,224 |
| Coca-Cola Co. 3.20% 2023 | 8,980 | 9,139 |
| ConAgra Foods, Inc. 1.90% 2018 | 3,750 | 3,752 |
| ConAgra Foods, Inc. 3.20% 2023 | 6,900 | 6,728 |
| Constellation Brands, Inc. 8.375% 2014 | 2,175 | 2,210 |
The Income Fund of America — Page 22 of 32
Bonds, notes & other debt instruments
Corporate bonds & notes (continued)
Consumer staples (continued) | Principal amount
(000) | Value
(000) |
| Constellation Brands, Inc. 7.25% 2017 | $16,425 | $18,509 |
| Constellation Brands, Inc. 3.75% 2021 | 1,750 | 1,711 |
| Constellation Brands, Inc. 6.00% 2022 | 2,825 | 3,118 |
| Constellation Brands, Inc. 4.25% 2023 | 8,250 | 8,106 |
| CVS Caremark Corp. 2.25% 2018 | 2,750 | 2,775 |
| CVS Caremark Corp. 4.00% 2023 | 3,000 | 3,138 |
| Del Monte Corp. 7.625% 2019 | 4,240 | 4,378 |
| Imperial Tobacco Finance PLC 2.05% 20184 | 5,000 | 4,987 |
| Imperial Tobacco Finance PLC 3.50% 20234 | 12,500 | 12,240 |
| Ingles Markets, Inc. 5.75% 2023 | 14,450 | 14,522 |
| Kimberly-Clark Corp. 7.50% 2018 | 9,000 | 11,017 |
| Kraft Foods Inc. 2.25% 2017 | 3,500 | 3,583 |
| Kraft Foods Inc. 5.375% 2020 | 4,712 | 5,329 |
| Kraft Foods Inc. 5.00% 2042 | 33,700 | 36,032 |
| Kroger Co. 3.85% 2023 | 825 | 845 |
| Kroger Co. 4.00% 2024 | 2,110 | 2,178 |
| Kroger Co. 5.00% 2042 | 2,750 | 2,903 |
| Mondelez International, Inc. 4.00% 2024 | 10,500 | 10,922 |
| Pernod Ricard SA 2.95% 20174 | 20,000 | 20,706 |
| Pernod Ricard SA 4.45% 20224 | 8,500 | 9,020 |
| Philip Morris International Inc. 3.60% 2023 | 10,565 | 10,775 |
| Philip Morris International Inc. 4.875% 2043 | 5,500 | 5,863 |
| Procter & Gamble Co. 3.50% 2015 | 17,250 | 17,541 |
| Reynolds American Inc. 3.25% 2022 | 8,650 | 8,335 |
| Reynolds American Inc. 6.15% 2043 | 1,000 | 1,144 |
| Rite Aid Corp. 10.25% 2019 | 10,090 | 10,771 |
| Rite Aid Corp. 8.00% 2020 | 8,000 | 8,710 |
| SABMiller Holdings Inc. 2.20% 20184 | 1,100 | 1,107 |
| SABMiller Holdings Inc. 4.95% 20424 | 7,000 | 7,565 |
| Smithfield Foods, Inc. 7.75% 2017 | 2,000 | 2,270 |
| Smithfield Foods, Inc. 5.25% 20184 | 1,500 | 1,541 |
| Smithfield Foods, Inc. 5.875% 20214 | 3,250 | 3,421 |
| Smithfield Foods, Inc. 6.625% 2022 | 4,900 | 5,329 |
| Stater Bros. Holdings Inc., Term Loan B, 4.75% 20217,8,9 | 7,500 | 7,547 |
| Tyson Foods, Inc. 6.60% 20167 | 11,500 | 12,530 |
| Wal-Mart Stores, Inc. 2.875% 2015 | 10,000 | 10,174 |
| Wal-Mart Stores, Inc. 2.80% 2016 | 10,000 | 10,384 |
| Wal-Mart Stores, Inc. 2.55% 2023 | 3,250 | 3,113 |
| Wal-Mart Stores, Inc. 3.30% 2024 | 10,755 | 10,804 |
| Wal-Mart Stores, Inc. 4.00% 2043 | 2,750 | 2,646 |
| Wal-Mart Stores, Inc. 4.30% 2044 | 5,950 | 5,981 |
| WM. Wrigley Jr. Co 2.40% 20184 | 1,200 | 1,216 |
| WM. Wrigley Jr. Co 3.375% 20204 | 22,500 | 23,153 |
| | | 609,265 |
| Total corporate bonds & notes | | 13,381,872 |
The Income Fund of America — Page 23 of 32
Bonds, notes & other debt instruments
U.S. Treasury bonds & notes 2.58%
U.S. Treasury 2.15% | Principal amount
(000) | Value
(000) |
| U.S. Treasury 0.50% 2014 | $274,265 | $274,523 |
| U.S. Treasury 0.25% 2014 | 120,000 | 120,074 |
| U.S. Treasury 0.25% 2015 | 75,000 | 75,082 |
| U.S. Treasury 1.75% 2016 | 95,000 | 97,152 |
| U.S. Treasury 1.50% 201612 | 80,500 | 81,943 |
| U.S. Treasury 0.625% 2018 | 80,000 | 77,734 |
| U.S. Treasury 1.50% 2019 | 257,655 | 254,756 |
| U.S. Treasury 1.625% 2019 | 143,150 | 142,284 |
| U.S. Treasury 2.50% 2023 | 72,450 | 72,519 |
| U.S. Treasury 6.25% 2023 | 53,000 | 69,453 |
| U.S. Treasury 2.75% 2024 | 20,000 | 20,365 |
| U.S. Treasury 2.50% 2024 | 102,225 | 101,658 |
| U.S. Treasury 5.50% 2028 | 52,000 | 67,795 |
| U.S. Treasury 5.375% 2031 | 8,475 | 11,108 |
| U.S. Treasury 4.50% 2036 | 87,935 | 106,896 |
| U.S. Treasury 4.625% 2040 | 15,150 | 18,862 |
| U.S. Treasury 3.75% 2041 | 65,350 | 71,129 |
| U.S. Treasury 3.00% 2042 | 56,175 | 53,107 |
| U.S. Treasury 2.75% 2042 | 6,950 | 6,233 |
| U.S. Treasury 2.75% 2042 | 7,325 | 6,558 |
| U.S. Treasury 3.125% 2043 | 46,825 | 45,197 |
| U.S. Treasury 3.625% 2043 | 25,300 | 26,794 |
| U.S. Treasury 3.625% 2044 | 53,625 | 56,759 |
| U.S. Treasury 3.375% 2044 | 153,500 | 155,053 |
| | | 2,013,034 |
| U.S. Treasury inflation-protected securities 0.43% | | |
| U.S. Treasury Inflation-Protected Security 1.875% 201513 | 46,472 | 48,006 |
| U.S. Treasury Inflation-Protected Security 0.125% 201713 | 45,846 | 47,063 |
| U.S. Treasury Inflation-Protected Security 0.125% 201913 | 35,531 | 36,293 |
| U.S. Treasury Inflation-Protected Security 0.375% 202313 | 997 | 1,012 |
| U.S. Treasury Inflation-Protected Security 0.625% 202413 | 136,354 | 140,699 |
| U.S. Treasury Inflation-Protected Security 0.75% 204213 | 50,267 | 47,691 |
| U.S. Treasury Inflation-Protected Security 0.625% 204313 | 7,242 | 6,633 |
| U.S. Treasury Inflation-Protected Security 1.375% 204413 | 72,722 | 80,582 |
| | | 407,979 |
| Total U.S. Treasury bonds & notes | | 2,421,013 |
| Mortgage-backed obligations 1.84% | | |
| Aventura Mall Trust, Series A, 3.743% 20324,7,8 | 12,250 | 12,951 |
| Banc of America Commercial Mortgage Inc., Series 2005-5, Class A-4, 5.115% 20457,8 | 2,879 | 2,978 |
| Banc of America Commercial Mortgage Inc., Series 2007-3, Class A-4, 5.565% 20497,8 | 5,000 | 5,473 |
| Bank of Montreal 2.85% 20154,8 | 10,000 | 10,212 |
| Citigroup-Deutsche Bank Commercial Mortgage Trust, Series 2005-CD1, Class A-4, 5.226% 20447,8 | 5,250 | 5,438 |
| Citigroup-Deutsche Bank Commercial Mortgage Trust, Series 2006-CD3, Class A-5, 5.617% 20488 | 12,945 | 13,821 |
| Commonwealth Bank of Australia 0.75% 20174,8 | 7,000 | 7,012 |
| Countrywide Alternative Loan Trust, Series 2005-54CB, Class 2-A-5, 5.50% 20358 | 7,768 | 7,018 |
| Countrywide Alternative Loan Trust, Series 2007-HY4, Class 3-A-1, 2.762% 20477,8 | 4,706 | 3,895 |
| CS First Boston Mortgage Securities Corp., Series 2014-ICE, Class A, 1.05% 20274,7,8 | 2,720 | 2,727 |
| CS First Boston Mortgage Securities Corp., Series 2004-5, Class IV-A-1, 6.00% 20348 | 1,598 | 1,647 |
| CS First Boston Mortgage Securities Corp., Series 2006-C5, Class A-M, 5.343% 20398 | 8,000 | 8,640 |
| CS First Boston Mortgage Securities Corp., Series 2007-C5, Class A4, 5.695% 20407,8 | 13,000 | 14,283 |
| CS First Boston Mortgage Securities Corp., Series 2007-C2, Class A-M, 5.605% 20497,8 | 10,000 | 10,954 |
The Income Fund of America — Page 24 of 32
Bonds, notes & other debt instruments
Mortgage-backed obligations (continued) | Principal amount
(000) | Value
(000) |
| DBUBS Mortgage Trust, Series 2011-LC2A, Class A-2, 3.386% 20444,8 | $4,380 | $4,550 |
| DBUBS Mortgage Trust, Series 2011-LC1A, Class A1, 3.742% 20464,8 | 7,052 | 7,326 |
EQTY 2014-INNS Mortgage Trust Commercial Mortgage Pass-Through Certificates,
Series 2014-A, 1.004% 20314,7,8 | 6,685 | 6,701 |
EQTY 2014-INNS Mortgage Trust Commercial Mortgage Pass-Through Certificates,
Series 2014-B, 1.354% 20314,7,8 | 6,025 | 6,040 |
| Fannie Mae 5.50% 20188 | 47 | 50 |
| Fannie Mae 6.00% 20218 | 213 | 233 |
| Fannie Mae 5.50% 20248 | 269 | 297 |
| Fannie Mae 4.50% 20248 | 2,553 | 2,724 |
| Fannie Mae 4.50% 20258 | 1,613 | 1,721 |
| Fannie Mae, Series 2001-4, Class GA, 9.459% 20257,8 | 136 | 155 |
| Fannie Mae 4.50% 20258 | 2,551 | 2,721 |
| Fannie Mae 4.50% 20258 | 1,656 | 1,766 |
| Fannie Mae 4.50% 20258 | 1,489 | 1,588 |
| Fannie Mae, Series 2001-4, Class NA, 10.30% 20257,8 | 3 | 4 |
| Fannie Mae 6.00% 20268 | 4,236 | 4,747 |
| Fannie Mae 7.00% 20268 | 628 | 712 |
| Fannie Mae 2.50% 20278 | 647 | 652 |
| Fannie Mae 2.50% 20278 | 1,340 | 1,353 |
| Fannie Mae 2.50% 20278 | 1,076 | 1,086 |
| Fannie Mae 2.50% 20278 | 543 | 547 |
| Fannie Mae 2.50% 20278 | 547 | 552 |
| Fannie Mae 2.50% 20278 | 1,778 | 1,795 |
| Fannie Mae 2.50% 20278 | 1,177 | 1,189 |
| Fannie Mae 2.50% 20288 | 42,825 | 43,142 |
| Fannie Mae 2.50% 20288 | 14,448 | 14,586 |
| Fannie Mae 7.00% 20288 | 1,628 | 1,846 |
| Fannie Mae 7.00% 20288 | 277 | 314 |
| Fannie Mae 2.50% 20288 | 115 | 117 |
| Fannie Mae 6.00% 20288 | 4,535 | 5,092 |
| Fannie Mae 2.50% 20288 | 1,805 | 1,822 |
| Fannie Mae 2.50% 20288 | 1,326 | 1,338 |
| Fannie Mae 2.50% 20288 | 591 | 597 |
| Fannie Mae 2.50% 20288 | 1,503 | 1,517 |
| Fannie Mae 2.50% 20288 | 601 | 606 |
| Fannie Mae 2.50% 20288 | 1,973 | 1,992 |
| Fannie Mae 2.50% 20288 | 1,916 | 1,933 |
| Fannie Mae 2.50% 20288 | 960 | 969 |
| Fannie Mae 2.50% 20288 | 479 | 484 |
| Fannie Mae 2.50% 20288 | 1,860 | 1,873 |
| Fannie Mae 2.50% 20288 | 1,218 | 1,229 |
| Fannie Mae 2.50% 20288 | 656 | 662 |
| Fannie Mae 2.50% 20288 | 639 | 644 |
| Fannie Mae 2.50% 20288 | 526 | 531 |
| Fannie Mae 2.50% 20288 | 489 | 493 |
| Fannie Mae 2.50% 20288 | 484 | 489 |
| Fannie Mae 2.50% 20288 | 346 | 349 |
| Fannie Mae 2.50% 20288 | 66 | 66 |
| Fannie Mae 2.50% 20288 | 953 | 962 |
| Fannie Mae 2.50% 20288 | 942 | 950 |
| Fannie Mae 2.50% 20288 | 521 | 525 |
| Fannie Mae 2.50% 20288 | 489 | 493 |
| Fannie Mae 2.50% 20288 | 479 | 483 |
| Fannie Mae, Series 2001-20, Class E, 9.56% 20317,8 | 147 | 164 |
The Income Fund of America — Page 25 of 32
Bonds, notes & other debt instruments
Mortgage-backed obligations (continued) | Principal amount
(000) | Value
(000) |
| Fannie Mae 5.50% 20338 | $671 | $747 |
| Fannie Mae 4.50% 20348 | 19,406 | 20,951 |
| Fannie Mae 5.50% 20358 | 645 | 718 |
| Fannie Mae 6.00% 20368 | 1,954 | 2,204 |
| Fannie Mae 6.00% 20368 | 1,011 | 1,141 |
| Fannie Mae, Series 2006-43, Class PX, 6.00% 20368 | 1,880 | 2,104 |
| Fannie Mae 6.00% 20368 | 1,353 | 1,527 |
| Fannie Mae 5.50% 20368 | 4,492 | 4,990 |
| Fannie Mae 6.50% 20378 | 789 | 848 |
| Fannie Mae, Series 2007-24, Class P, 6.00% 20378 | 3,921 | 4,341 |
| Fannie Mae 6.00% 20378 | 217 | 242 |
| Fannie Mae 7.50% 20378 | 86 | 99 |
| Fannie Mae 8.00% 20378 | 106 | 122 |
| Fannie Mae, Series 2007-33, Class HE, 5.50% 20378 | 6,846 | 7,523 |
| Fannie Mae 7.00% 20378 | 527 | 594 |
| Fannie Mae 6.00% 20378 | 3,818 | 4,289 |
| Fannie Mae 6.50% 20378 | 1,084 | 1,219 |
| Fannie Mae 7.00% 20378 | 817 | 922 |
| Fannie Mae 7.50% 20378 | 329 | 378 |
| Fannie Mae 7.50% 20378 | 112 | 129 |
| Fannie Mae 6.50% 20378 | 317 | 355 |
| Fannie Mae 6.00% 20378 | 20,462 | 22,985 |
| Fannie Mae 6.00% 20378 | 3,147 | 3,535 |
| Fannie Mae 6.50% 20378 | 1,285 | 1,439 |
| Fannie Mae 6.00% 20388 | 3,866 | 4,343 |
| Fannie Mae 6.00% 20388 | 4,983 | 5,606 |
| Fannie Mae 5.50% 20388 | 1,043 | 1,156 |
| Fannie Mae 6.00% 20388 | 2,158 | 2,426 |
| Fannie Mae 6.00% 20398 | 2,629 | 2,952 |
| Fannie Mae 6.50% 20398 | 963 | 1,082 |
| Fannie Mae 4.50% 20398 | 31,863 | 34,664 |
| Fannie Mae 5.00% 20408 | 11,243 | 12,442 |
| Fannie Mae 4.00% 20408 | 9,073 | 9,548 |
| Fannie Mae 4.19% 20407,8 | 1,118 | 1,185 |
| Fannie Mae 4.00% 20408 | 9,591 | 10,096 |
| Fannie Mae 4.50% 20408 | 93 | 101 |
| Fannie Mae 4.00% 20408 | 15,234 | 16,063 |
| Fannie Mae 4.00% 20408 | 544 | 575 |
| Fannie Mae 4.50% 20408 | 104 | 112 |
| Fannie Mae 4.50% 20418 | 335 | 362 |
| Fannie Mae 5.00% 20418 | 506 | 562 |
| Fannie Mae 5.00% 20418 | 416 | 461 |
| Fannie Mae 5.00% 20418 | 627 | 694 |
| Fannie Mae 5.00% 20418 | 670 | 741 |
| Fannie Mae 4.00% 20418 | 9,441 | 9,958 |
| Fannie Mae 4.00% 20418 | 297 | 314 |
| Fannie Mae, Series 2001-50, Class BA, 7.00% 20418 | 506 | 566 |
| Fannie Mae 4.00% 20418 | 443 | 468 |
| Fannie Mae, Series 2002-W3, Class A-5, 7.50% 20418 | 278 | 324 |
| Fannie Mae 4.00% 20418 | 12,332 | 13,008 |
| Fannie Mae 4.00% 20418 | 910 | 961 |
| Fannie Mae 4.00% 20418 | 526 | 556 |
| Fannie Mae, Series 2001-T10, Class A-1, 7.00% 20418 | 419 | 485 |
| Fannie Mae 4.00% 20428 | 1,503 | 1,587 |
| Fannie Mae, Series 2002-W1, Class 2A, 6.566% 20427,8 | 775 | 902 |
The Income Fund of America — Page 26 of 32
Bonds, notes & other debt instruments
Mortgage-backed obligations (continued) | Principal amount
(000) | Value
(000) |
| Fannie Mae 4.00% 20428 | $10,782 | $11,373 |
| Fannie Mae 4.00% 20428 | 4,577 | 4,832 |
| Fannie Mae 3.50% 20428 | 35,555 | 36,252 |
| Fannie Mae 3.50% 20428 | 26,996 | 27,525 |
| Fannie Mae 3.50% 20428 | 10,124 | 10,349 |
| Fannie Mae 4.00% 20428 | 30,670 | 32,355 |
| Fannie Mae 4.00% 20438 | 11,112 | 11,745 |
| Fannie Mae 4.00% 20438 | 10,667 | 11,275 |
| Fannie Mae 3.00% 20438 | 17,836 | 17,492 |
| Fannie Mae 4.00% 20438 | 3,535 | 3,737 |
| Fannie Mae 4.00% 20438 | 942 | 991 |
| Fannie Mae 4.00% 20438 | 4,167 | 4,405 |
| Fannie Mae 4.00% 20438 | 3,905 | 4,128 |
| Fannie Mae 4.00% 20438 | 3,865 | 4,090 |
| Fannie Mae 4.00% 20438 | 3,148 | 3,331 |
| Fannie Mae 4.00% 20438 | 2,901 | 3,063 |
| Fannie Mae 3.50% 20448,14 | 49,967 | 50,894 |
| Fannie Mae 4.00% 20448,14 | 41,640 | 43,774 |
| Fannie Mae 4.50% 20448,14 | 63,035 | 67,865 |
| Fannie Mae 3.50% 20448,14 | 92,145 | 93,589 |
| Fannie Mae 4.00% 20448,14 | 24,110 | 25,275 |
| Fannie Mae 4.50% 20448,14 | 106,465 | 114,359 |
| Fannie Mae 6.50% 20478 | 375 | 418 |
| Fannie Mae 6.50% 20478 | 1,066 | 1,186 |
| Fannie Mae 6.50% 20478 | 793 | 883 |
| Fannie Mae 6.50% 20478 | 125 | 140 |
| Fannie Mae 6.50% 20478 | 418 | 465 |
| Fannie Mae 6.50% 20478 | 387 | 431 |
| Fannie Mae 7.00% 20478 | 649 | 732 |
| Fannie Mae 7.00% 20478 | 321 | 363 |
| Fannie Mae 7.00% 20478 | 294 | 332 |
| Fannie Mae 7.00% 20478 | 258 | 291 |
| Financial Asset Securitization, Inc., Series 1997-NAM1, Class B-1, 7.75% 20278 | 86 | 87 |
| Freddie Mac, Series 2890, Class KT, 4.50% 20198 | 24,288 | 25,781 |
| Freddie Mac, Series 2289, Class NB, 9.613% 20227,8 | 15 | 17 |
| Freddie Mac 5.00% 20238 | 1,089 | 1,175 |
| Freddie Mac 5.00% 20238 | 3,100 | 3,347 |
| Freddie Mac 5.00% 20238 | 3,031 | 3,272 |
| Freddie Mac 5.00% 20238 | 3,414 | 3,684 |
| Freddie Mac, Series 2013-DN1, Class M-1, 3.555% 20237,8 | 4,204 | 4,391 |
| Freddie Mac, Series 2013-DN2, Class M-1, 1.605% 20237,8 | 3,616 | 3,626 |
| Freddie Mac 6.00% 20268 | 645 | 724 |
| Freddie Mac 6.00% 20278 | 1,091 | 1,224 |
| Freddie Mac, Series 3061, Class PN, 5.50% 20358 | 1,161 | 1,291 |
| Freddie Mac 4.50% 20358 | 20,608 | 22,261 |
| Freddie Mac, Series 3257, Class PA, 5.50% 20368 | 7,279 | 8,078 |
| Freddie Mac, Series 3286, Class JN, 5.50% 20378 | 6,284 | 6,912 |
| Freddie Mac, Series 3271, Class OA, 6.00% 20378 | 6,635 | 7,271 |
| Freddie Mac, Series 3312, Class PA, 5.50% 20378 | 6,298 | 6,928 |
| Freddie Mac, Series 3318, Class JT, 5.50% 20378 | 3,510 | 3,861 |
| Freddie Mac 5.50% 20378 | 1,130 | 1,248 |
| Freddie Mac 5.50% 20388 | 2,732 | 3,016 |
| Freddie Mac 6.50% 20388 | 2,985 | 3,366 |
| Freddie Mac 5.50% 20398 | 1,378 | 1,521 |
| Freddie Mac 4.50% 20398 | 1,758 | 1,892 |
The Income Fund of America — Page 27 of 32
Bonds, notes & other debt instruments
Mortgage-backed obligations (continued) | Principal amount
(000) | Value
(000) |
| Freddie Mac 5.00% 20398 | $4,330 | $4,801 |
| Freddie Mac 5.00% 20398 | 2,430 | 2,699 |
| Freddie Mac 5.00% 20398 | 1,783 | 1,959 |
| Freddie Mac 4.50% 20408 | 43,649 | 46,952 |
| Freddie Mac 5.00% 20418 | 257 | 284 |
| Freddie Mac 4.00% 20418 | 2,498 | 2,624 |
| Freddie Mac 4.50% 20418 | 4,331 | 4,660 |
| Freddie Mac 4.50% 20418 | 4,207 | 4,524 |
| Freddie Mac 4.50% 20418 | 3,598 | 3,871 |
| Freddie Mac 4.50% 20428 | 4,342 | 4,669 |
| Freddie Mac 4.50% 20428 | 6,857 | 7,377 |
| Freddie Mac 4.00% 20438 | 3,292 | 3,467 |
| Freddie Mac 4.00% 20438 | 7,703 | 8,114 |
| Freddie Mac 4.00% 20438 | 6,941 | 7,316 |
| Freddie Mac 4.00% 20438 | 5,637 | 5,951 |
| Freddie Mac 4.00% 20438 | 4,456 | 4,698 |
| Freddie Mac 4.00% 20438 | 3,547 | 3,748 |
| GE Commercial Mortgage Corp., Series 2006-C1, Class A-4, 5.279% 20447,8 | 12,629 | 13,276 |
| GE Commercial Mortgage Corp., Series 2005-C4, Class A-3A, 5.312% 20457,8 | 9,046 | 9,075 |
| Government National Mortgage Assn. 10.00% 20218 | 311 | 360 |
| Government National Mortgage Assn. 10.00% 20258 | 286 | 324 |
| Government National Mortgage Assn. 4.50% 20418 | 2,132 | 2,325 |
| Government National Mortgage Assn. 4.00% 20438 | 61,137 | 64,869 |
| Greenwich Capital Commercial Funding Corp., Series 2006-GG7, Class A-4, 5.819% 20387,8 | 6,788 | 7,272 |
| Greenwich Capital Commercial Funding Corp., Series 2007-GG9, Class A-4, 5.444% 20398 | 10,000 | 10,853 |
| Greenwich Capital Commercial Funding Corp., Series 2007-GG11, Class A-M, 5.867% 20497,8 | 7,879 | 8,702 |
| GS Mortgage Securities Corp. II, Series 2011-GC3, Class A-2, 3.645% 20444,8 | 1,700 | 1,761 |
| GSR Mortgage Loan Trust, Series 2004-2F, Class VIIA-1, 4.50% 20198 | 1,323 | 1,330 |
| Hilton USA Trust, Series 2013-HLF-AFX, 2.662% 20304,8 | 6,555 | 6,602 |
| IndyMac INDX Mortgage Loan Trust, Series 2006-AR5, Class 2-A-1, 4.378% 20367,8 | 7,556 | 6,621 |
| J.P. Morgan Chase Commercial Mortgage Securities Corp., Series 2006-LDP7, Class A-4, 5.866% 20457,8 | 14,700 | 15,732 |
| J.P. Morgan Chase Commercial Mortgage Securities Corp., Series 2011-C3A, Class A-2, 3.673% 20464,8 | 17,072 | 17,776 |
| J.P. Morgan Chase Commercial Mortgage Securities Corp., Series 2011-C4, Class A-2, 3.341% 20464,8 | 7,500 | 7,772 |
| J.P. Morgan Chase Commercial Mortgage Securities Corp., Series 2007-CB19, Class A-4, 5.703% 20497,8 | 15,450 | 16,945 |
| J.P. Morgan Chase Commercial Mortgage Securities Corp., Series 2007-CB19, Class A-1-A, 5.703% 20497,8 | 14,066 | 15,527 |
| J.P. Morgan Chase Commercial Mortgage Securities Corp., Series 2007-C1, Class A-4, 5.716% 20518 | 5,000 | 5,473 |
| J.P. Morgan Chase Commercial Mortgage Securities Corp., Series 2007-LD12, Class A-M, 6.022% 20517,8 | 20,950 | 23,310 |
| J.P. Morgan Chase Commercial Mortgage Securities Trust, Series 2006-LDP6, Class A-4, 5.475% 20437,8 | 19,446 | 20,544 |
| J.P. Morgan Chase Commercial Mortgage Securities Trust, Series 2006-LDP9, Class A-M, 5.372% 20478 | 12,000 | 12,608 |
| L.A. Arena Funding, LLC, Series 1, Class A, 7.656% 20264,8 | 6,728 | 7,530 |
| LB-UBS Commercial Mortgage Trust, Series 2005-C7, Class A-4, 5.197% 20307,8 | 11,422 | 11,734 |
| LB-UBS Commercial Mortgage Trust, Series 2007-C2, Class A-3, 5.43% 20408 | 9,832 | 10,726 |
| LB-UBS Commercial Mortgage Trust, Series 2007-C2, Class A-M, 5.493% 20407,8 | 15,000 | 16,125 |
| LB-UBS Commercial Mortgage Trust, Series 2007-C6, Class A-M, 6.114% 20407,8 | 10,035 | 11,101 |
| Merrill Lynch Mortgage Trust, Series 2007-C1, Class A-4, 5.839% 20507,8 | 3,460 | 3,841 |
| ML-CFC Commercial Mortgage Trust, Series 2007-8, Class A-3, 5.883% 20497,8 | 11,290 | 12,460 |
| ML-CFC Commercial Mortgage Trust, Series 2006-4, Class A-3, 5.172% 20498 | 27,410 | 29,425 |
| Morgan Stanley Capital I Trust, Series 2014-CPT, Class A, 3.35% 20214,7,8 | 8,745 | 8,959 |
| Morgan Stanley Capital I Trust, Series 2011-C3, Class A-2, 3.224% 20498 | 5,624 | 5,849 |
| National Australia Bank 1.25% 20184,8 | 5,000 | 4,930 |
| National Credit Union Administration, Series 2011-M1, Class A2, 1.40% 20158 | 709 | 716 |
| Structured Adjustable Rate Mortgage Loan Trust, Series 2006-4, Class 6-A, 5.025% 20367,8 | 5,351 | 4,465 |
| Wachovia Bank Commercial Mortgage Trust, Series 2007-C30, Class A-5, 5.342% 20438 | 8,000 | 8,694 |
| Wachovia Bank Commercial Mortgage Trust, Series 2007-C31, Class A-M, 5.591% 20477,8 | 19,050 | 20,814 |
The Income Fund of America — Page 28 of 32
Bonds, notes & other debt instruments
Mortgage-backed obligations (continued) | Principal amount
(000) | Value
(000) |
| Wachovia Bank Commercial Mortgage Trust, Series 2007-C32, Class A-3, 5.745% 20497,8 | $8,500 | $9,275 |
| Wachovia Bank Commercial Mortgage Trust, Series 2007-C33, Class A-M, 5.941% 20517,8 | 8,500 | 9,451 |
| | | 1,725,307 |
| Federal agency bonds & notes 0.35% | | |
| CoBank, ACB 7.875% 20184 | 10,000 | 11,827 |
| CoBank, ACB 0.831% 20224,7 | 8,315 | 7,733 |
| Fannie Mae, Series 2012-M5, Class A2, multifamily 2.715% 20228 | 7,000 | 6,993 |
| Fannie Mae, Series 2012-M9, Class A2, multifamily 2.482% 20228 | 12,231 | 12,025 |
| Fannie Mae, Series 2012-M14, Class A2, multifamily 2.301% 20227,8 | 4,285 | 4,135 |
| Fannie Mae, Series 2012-M17, Class A2, multifamily 2.184% 20228 | 8,000 | 7,658 |
| Fannie Mae, Series 2014-M1, multifamily 3.387% 20237,8 | 450 | 465 |
| Fannie Mae, Series 2013-M14, Class A2, multifamily 3.329% 20237,8 | 9,141 | 9,446 |
| Fannie Mae, Series 2014-M2, Class A2, multifamily 3.513% 20237,8 | 17,665 | 18,514 |
| Fannie Mae, Series 2014-M3, Class A2, multifamily 3.477% 20247,8 | 16,925 | 17,689 |
| Fannie Mae 6.25% 2029 | 32,000 | 42,959 |
| Fannie Mae 7.125% 2030 | 1,500 | 2,193 |
| Federal Home Loan Bank 5.50% 2036 | 100 | 129 |
| Freddie Mac 2.50% 2016 | 22,500 | 23,283 |
| Freddie Mac 0.75% 2018 | 66,300 | 65,077 |
| Freddie Mac, Series K710, Class A2, multifamily 1.883% 20198 | 6,906 | 6,866 |
| Freddie Mac, Series K711, Class A2, multifamily 1.73% 20198 | 11,000 | 10,849 |
| Freddie Mac, Series K714, Class A2, multifamily 3.034% 20207,8 | 4,095 | 4,247 |
| Freddie Mac, Series K019, Class A2, multifamily 2.272% 20228 | 8,000 | 7,823 |
| Freddie Mac, Series K021, Class A2, multifamily 2.396% 20228 | 8,280 | 8,115 |
| Freddie Mac, Series K023, Class A2, multifamily 2.307% 20228 | 8,995 | 8,718 |
| Freddie Mac, Series K025, Class A2, multifamily 2.682% 20228 | 7,000 | 6,955 |
| Freddie Mac, Series K028, Class A2, multifamily 3.111% 20238 | 9,800 | 10,007 |
| Freddie Mac, Series K036, Class A1, multifamily 2.777% 20238 | 12,796 | 13,112 |
| Freddie Mac, Series K036, Class A2, multifamily 3.527% 20237,8 | 9,465 | 9,912 |
| Freddie Mac, Series K038, Class A2, multifamily 3.389% 20248 | 170 | 176 |
| Private Export Funding Corp. 3.55% 2024 | 545 | 572 |
| Tennessee Valley Authority, Series A, 3.875% 2021 | 850 | 929 |
| Tennessee Valley Authority 1.875% 2022 | 850 | 807 |
| Tennessee Valley Authority, Series B, 3.50% 2042 | 500 | 462 |
| Tennessee Valley Authority, Series 2008, Class A, 4.875% 2048 | 700 | 794 |
| United States Agency for International Development, Republic of Egypt 4.45% 2015 | 10,000 | 10,450 |
| | | 330,920 |
| Asset-backed obligations 0.14% | | |
| AEP Texas Central Transitioning Funding II LLC, Secured Transition Bonds, Series A, Class A-3, 5.09% 20178 | 2,677 | 2,731 |
| Aesop Funding LLC, Series 2014-2A, Class A, 2.50% 20214,8 | 10,500 | 10,512 |
| Ally Auto Receivables Trust, Series 2014-1, Class A3, 0.97% 20188 | 6,990 | 6,978 |
| CarMaxAuto Owner Trust, Series 2014-1, Class A-2, 0.47% 20178 | 5,365 | 5,367 |
| CarMaxAuto Owner Trust, Series 2014-1, Class A-3, 0.79% 20188 | 6,105 | 6,102 |
| Chesapeake Funding LLC, Series 2014-1-A, Class A, 0.576% 20264,7,8 | 5,000 | 5,002 |
| Conseco Finance Home Loan Trust, Series 1999-G, Class B-2, 10.96% 20298 | 13,630 | 1,955 |
| Countryplace Manufactured Housing Contract, Series 2005-1, Class A-3, AMBAC insured, 4.80% 20354,8 | 1,636 | 1,667 |
| Countryplace Manufactured Housing Contract, Series 2005-1, Class A-4, AMBAC insured, 5.20% 20354,7,8 | 1,145 | 1,195 |
| CWHEQ Revolving Home Equity Loan Trust, Series 2006-I, Class 2-A, FSA insured, 0.292% 20377,8 | 2,016 | 1,888 |
| CWHEQ Revolving Home Equity Loan Trust, Series 2007-B, Class A, FSA insured, 0.302% 20377,8 | 3,549 | 3,216 |
| Discover Card Execution Note Trust, Series 2014-A4, Class A4, 2.12% 20198 | 7,175 | 7,175 |
| Enterprise Fleet Financing LLC, Series 2014-1, Class A2, 0.87% 20194,8 | 2,820 | 2,818 |
| Ford Credit Auto Lease Trust, Series 2014-B, Class A3, 0.89% 20178 | 4,750 | 4,749 |
| Ford Credit Auto Owner Trust, Series 2014-B-A3, 0.90% 20188 | 13,990 | 13,985 |
The Income Fund of America — Page 29 of 32
Bonds, notes & other debt instruments
Asset-backed obligations (continued) | Principal amount
(000) | Value
(000) |
| Ford Credit Auto Owner Trust, Series 2014-1-A, 2.26% 20254,8 | $2,405 | $2,416 |
| Hertz Fleet Lease Funding LP, Series 2014-1-A, 0.553% 20284,7,8 | 3,000 | 3,001 |
| Hertz Vehicle Financing LLC, Rental Car Asset-backed Notes, Series 2013-1A, Class A-1, 1.12% 20174,8 | 8,500 | 8,517 |
| Home Equity Mortgage Trust, Series 2006-6, Class 2A-1, 0.355% 20377,8 | 13,771 | 3,278 |
| Honda Auto Receivables Owner Trust, Series 2014-1, Class A-3, 0.67% 20178 | 5,265 | 5,253 |
| Hyundai Auto Receivables Trust, Series 2014-A, Class A2, 0.46% 20178 | 2,760 | 2,761 |
| Hyundai Auto Receivables Trust, Series 2013-B, Class A4, 1.01% 20198 | 7,000 | 7,000 |
IndyMac Home Equity Mortgage Loan Asset-backed Trust, Series 2007-H1, Class A-1,
FSA insured, 0.315% 20377,8 | 2,005 | 1,801 |
| Mercedes-Benz Auto Receivables Trust, Series 2014-1, Class A3, 0.87% 20188 | 7,000 | 6,979 |
| RAMP Trust, Series 2003-RZ4, Class A-7, 4.79% 20337,8 | 641 | 677 |
| Santander Drive Auto Receivables Trust, Series 2014-3, Class A3, 0.81% 20188 | 6,000 | 5,995 |
| Toyota Auto Receivables Owner Trust, Series 2014-B, Class A3, 0.76% 20188 | 11,750 | 11,727 |
| | | 134,745 |
| Bonds & notes of governments & government agencies outside the U.S. 0.12% | | |
| Colombia (Republic of) Global 5.625% 2044 | 10,000 | 11,208 |
| Croatian Government 6.75% 2019 | 4,800 | 5,370 |
| Croatian Government 6.375% 2021 | 5,000 | 5,500 |
| Croatian Government 5.50% 20234 | 625 | 650 |
| France Government Agency-Guaranteed, Société Finance 2.875% 20144 | 10,000 | 10,034 |
| Hungarian Government 6.25% 2020 | 3,410 | 3,854 |
| Israeli Government 5.125% 2019 | 3,000 | 3,391 |
| Israeli Government 4.00% 2022 | 2,700 | 2,885 |
| Israeli Government 4.50% 2043 | 1,795 | 1,759 |
| Latvia (Republic of) 2.75% 2020 | 4,250 | 4,176 |
| Polish Government 6.375% 2019 | 3,860 | 4,574 |
| Polish Government 5.00% 2022 | 3,000 | 3,349 |
| Polish Government 4.00% 2024 | 3,000 | 3,124 |
| Portuguese Government 5.125% 20244 | 14,500 | 14,521 |
| Spanish Government 4.00% 20184 | 25,600 | 27,249 |
| Turkey (Republic of) 4.557% 20184 | 1,200 | 1,259 |
| Turkey (Republic of) 5.625% 2021 | 5,400 | 5,939 |
| United Mexican States Government Global 5.55% 2045 | 7,000 | 7,907 |
| | | 116,749 |
| Municipals 0.07% | | |
| State of California, Various Purpose G.O. Bonds, 6.20% 2019 | 24,675 | 29,127 |
| State of Florida, Hurricane Catastrophe Fund Fin. Corp., Rev. Bonds, Series 2013-A, 2.107% 2018 | 6,600 | 6,662 |
| State of Florida, Hurricane Catastrophe Fund Fin. Corp., Rev. Bonds, Series 2013-A, 2.995% 2020 | 8,500 | 8,562 |
| State of New Jersey, Econ. Dev. Auth., Energy Fac. Rev. Bonds (ACR Energy Partners, LLC Project), Series 2011-B, 12.00% 20304 | 1,875 | 1,382 |
State of New Jersey, Transportation Trust Fund Auth., Transportation System Rev. Ref. Bonds,
Series 2013-B, 1.758% 2018 | 8,500 | 8,353 |
| State of Washington, Energy Northwest, Columbia Generating Station Electric Rev. Bonds, Series 2012-E, 2.197% 2019 | 6,500 | 6,525 |
| | | 60,611 |
| Miscellaneous 0.01% | | |
| Other bonds & notes in initial period of acquisition | | 8,291 |
| Total bonds, notes & other debt instruments (cost: $17,531,247,000) | | 18,179,508 |
The Income Fund of America — Page 30 of 32
| Short-term securities 4.79% | Principal amount
(000) | Value
(000) |
| 3M Co. 0.10% due 9/22/20144 | $50,000 | $49,990 |
| Abbott Laboratories 0.10% due 10/14/20144 | 25,000 | 24,995 |
| Apple Inc. 0.08% due 8/6/20144 | 23,000 | 23,000 |
| Bank of New York Mellon Corp. 0.05% due 8/1/20144 | 16,600 | 16,600 |
| Chariot Funding, LLC 0.26%—0.28% due 12/9/2014—12/22/20144 | 41,200 | 66,157 |
| Chevron Corp. 0.08% due 8/20/2014—9/3/20144 | 13,600 | 62,394 |
| Coca-Cola Co. 0.12%—0.20% due 11/5/2014—1/14/20154 | 50,000 | 74,961 |
| Emerson Electric Co. 0.10% due 8/7/20144 | 9,700 | 9,700 |
| Fannie Mae 0.08%—0.15% due 8/1/2014—7/1/2015 | 34,000 | 409,456 |
| Federal Farm Credit Banks 0.10%—0.15% due 8/8/2014—7/2/2015 | 50,000 | 473,905 |
| Federal Home Loan Bank 0.05%—0.17% due 8/4/2014—7/10/2015 | 50,000 | 1,450,793 |
| Freddie Mac 0.05%—0.16% due 8/1/2014—6/10/2015 | 55,000 | 1,148,484 |
| General Electric Capital Corp. 0.12%—0.19% due 8/20/2014—1/14/2015 | 35,000 | 109,945 |
| IBM Corp. 0.09%—0.10% due 8/4/2014—9/10/20144 | 34,800 | 138,196 |
| Jupiter Securitization Co., LLC 0.25%—0.28% due 10/14/2014—3/3/20154 | 25,000 | 49,952 |
| Microsoft Corp. 0.09% due 8/27/20144 | 35,100 | 35,099 |
| National Rural Utilities Cooperative Finance Corp. 0.09% due 8/14/2014—8/18/2014 | 25,000 | 49,998 |
| Paccar Financial Corp. 0.11% due 9/11/2014 | 25,200 | 25,196 |
| Private Export Funding Corp. 0.20%—0.26% due 8/15/2014—2/13/20154 | 12,300 | 108,422 |
| Procter & Gamble Co. 0.09%—0.15% due 9/5/2014—1/7/20154 | 35,000 | 149,283 |
| Regents of the University of California 0.15% due 8/11/2014 | 14,500 | 14,500 |
| Total short-term securities (cost: $4,490,612,000) | | 4,491,026 |
| Total investment securities 99.94% (cost: $75,685,723,000) | | 93,782,879 |
| Other assets less liabilities 0.06% | | 55,183 |
| Net assets 100.00% | | $93,838,062 |
As permitted by U.S. Securities and Exchange Commission regulations, “Miscellaneous” securities include holdings in their first year of acquisition that have not previously been publicly disclosed.
| 1 | Valued under fair value procedures adopted by authority of the board of trustees. The total value of all such securities, including those in "Miscellaneous," was $17,800,699,000, which represented 18.97% of the net assets of the fund. This amount includes $17,040,369,000 related to certain securities trading outside the U.S. whose values were adjusted as a result of significant market movements following the close of local trading. |
| 2 | Security did not produce income during the last 12 months. |
| 3 | Represents an affiliated company as defined under the Investment Company Act of 1940. |
| 4 | Acquired in a transaction exempt from registration under Rule 144A or Section 4(2) of the Securities Act of 1933. May be resold in the U.S. in transactions exempt from registration, normally to qualified institutional buyers. The total value of all such securities" was $5,375,119,000, which represented 5.73% of the net assets of the fund. |
| 5 | Acquired through a private placement transaction exempt from registration under the Securities Act of 1933. May be subject to legal or contractual restrictions on resale. Further details on these holding(s) appear below. |
| 6 | Payment in kind; the issuer has the option of paying additional securities in lieu of cash. |
| 7 | Coupon rate may change periodically. |
| 8 | Principal payments may be made periodically. Therefore, the effective maturity date may be earlier than the stated maturity date. |
| 9 | Loan participations and assignments; may be subject to legal or contractual restrictions on resale. The total value of all such loans was $885,970,000, which represented .94% of the net assets of the fund. |
| 10 | Step bond; coupon rate will increase at a later date. |
| 11 | Scheduled interest and/or principal payment was not received. |
| 12 | A portion of this security was pledged as collateral. The total value of pledged collateral was $1,124,000, which represented less than .01% of the net assets of the fund. |
| 13 | Index-linked bond whose principal amount moves with a government price index. |
| 14 | A portion or all of this security purchased on a TBA basis. |
| Private placement securities | Acquisition
date(s) | Cost
(000) | Value
(000) | Percent
of net
assets |
| CEVA Group PLC, Series A-2, convertible preferred | 5/2/2013 | $13,171 | $15,678 | .01% |
| NewPage Holdings Inc. | 6/23/2011-9/9/2011 | 12,253 | 7,191 | .01 |
| Revel AC, Inc. | 2/14/2011-10/25/2012 | 56,224 | - | .00 |
| Total restricted securities | | $ 81,648 | $ 22,869 | .02% |
The Income Fund of America — Page 31 of 32
| Key to abbreviations |
| ADR = American Depositary Receipts |
| FDR = Fiduciary Depositary Receipts |
| GDR = Global Depositary Receipts |
| TBA = To be announced |
| Auth. = Authority |
| Dev. = Development |
| Econ. = Economic |
| Fac. = Facility |
| Fin. = Finance |
| G.O. = General Obligation |
| LOC = Letter of Credit |
| Ref. = Refunding |
| Rev. = Revenue |
Investments are not FDIC-insured, nor are they deposits of or guaranteed by a bank or any other entity, so they may lose value.
Investors should carefully consider investment objectives, risks, charges and expenses. This and other important information is contained in the fund prospectus and summary prospectus, which can be obtained from your financial professional and should be read carefully before investing. You may also call American Funds Service Company (AFS) at (800) 421-4225 or visit the American Funds website at americanfunds.com.
| MFGEFPX-012-0313O-S32842 | The Income Fund of America — Page 32 of 32 |
REPORT OF INDEPENDENT REGISTERED PUBLIC ACCOUNTING FIRM
To the Shareholders and Board of Trustees of
The Income Fund of America:
We have audited the accompanying statement of assets and liabilities of The Income Fund of America, including the summary schedule of investments, as of July 31, 2014, and the related statements of operations for the year then ended, the statements of changes in net assets for each of the two years in the period then ended (collectively, the “financial statements”), the financial highlights for each of the five years in the period then ended (the financial statements and financial highlights are included in Item 1 of this Form N-CSR), and the schedule of investments in securities as of July 31, 2014 (included in Item 6 of this Form N-CSR). These financial statements, financial highlights, and schedule of investments in securities are the responsibility of the Company’s management. Our responsibility is to express an opinion on these financial statements, financial highlights, and schedule of investments in securities based on our audits.
We conducted our audits in accordance with the standards of the Public Company Accounting Oversight Board (United States). Those standards require that we plan and perform the audit to obtain reasonable assurance about whether the financial statements, financial highlights, and schedule of investments in securities are free of material misstatement. An audit includes examining, on a test basis, evidence supporting the amounts and disclosures in the financial statements and schedule of investments in securities. Our procedures included confirmation of securities owned as of July 31, 2014, by correspondence with the custodian and brokers; where replies were not received from brokers, we performed other auditing procedures. An audit also includes assessing the accounting principles used and significant estimates made by management, as well as evaluating the overall financial statement presentation. We believe that our audits provide a reasonable basis for our opinion.
In our opinion, the financial statements, financial highlights, and schedule of investments in securities referred to above present fairly, in all material respects, the financial position of The Income Fund of America as of July 31, 2014, and the results of its operations for the year then ended, the changes in its net assets for each of the two years in the period then ended, and the financial highlights for each of the five years in the period then ended, in conformity with accounting principles generally accepted in the United States of America.
DELOITTE & TOUCHE LLP
Costa Mesa, California
September 10, 2014
ITEM 7 – Disclosure of Proxy Voting Policies and Procedures for Closed-End Management Investment Companies
Not applicable to this Registrant, insofar as the Registrant is not a closed-end management investment company.
ITEM 8 – Portfolio Managers of Closed-End Management Investment Companies
Not applicable to this Registrant, insofar as the Registrant is not a closed-end management investment company.
ITEM 9 – Purchases of Equity Securities by Closed-End Management Investment Company and Affiliated Purchasers
Not applicable to this Registrant, insofar as the Registrant is not a closed-end management investment company.
ITEM 10 – Submission of Matters to a Vote of Security Holders
There have been no material changes to the procedures by which shareholders may recommend nominees to the Registrant’s board of trustees since the Registrant last submitted a proxy statement to its shareholders. The procedures are as follows. The Registrant has a nominating and governance committee comprised solely of persons who are not considered ‘‘interested persons’’ of the Registrant within the meaning of the Investment Company Act of 1940, as amended. The committee periodically reviews such issues as the board’s composition, responsibilities, committees, compensation and other relevant issues, and recommends any appropriate changes to the full board of trustees. While the committee normally is able to identify from its own resources an ample number of qualified candidates, it will consider shareholder suggestions of persons to be considered as nominees to fill future vacancies on the board. Such suggestions must be sent in writing to the nominating and governance committee of the Registrant, c/o the Registrant’s Secretary, and must be accompanied by complete biographical and occupational data on the prospective nominee, along with a written consent of the prospective nominee for consideration of his or her name by the nominating and governance committee.
ITEM 11 – Controls and Procedures
| (a) | The Registrant’s Principal Executive Officer and Principal Financial Officer have concluded, based on their evaluation of the Registrant’s disclosure controls and procedures (as such term is defined in Rule 30a-3 under the Investment Company Act of 1940), that such controls and procedures are adequate and reasonably designed to achieve the purposes described in paragraph (c) of such rule. |
| | |
| (b) | There were no changes in the Registrant’s internal controls over financial reporting (as defined in Rule 30a-3(d) under the Investment Company Act of 1940) that occurred during the Registrant’s second fiscal quarter of the period covered by this report that has materially affected, or is reasonably likely to materially affect, the Registrant’s internal control over financial reporting. |
ITEM 12 – Exhibits
| (a)(1) | The Code of Ethics that is the subject of the disclosure required by Item 2 is attached as an exhibit hereto. |
| | |
| (a)(2) | The certifications required by Rule 30a-2 of the Investment Company Act of 1940 and Sections 302 and 906 of the Sarbanes-Oxley Act of 2002 are attached as exhibits hereto. |
SIGNATURES
Pursuant to the requirements of the Securities Exchange Act of 1934 and the Investment Company Act of 1940, the Registrant has duly caused this report to be signed on its behalf by the undersigned, thereunto duly authorized.
| | THE INCOME FUND OF AMERICA |
| | |
| | By /s/ Hilda L. Applbaum |
| | Hilda L. Applbaum, Vice Chairman and Principal Executive Officer |
| | |
| | Date: September 30, 2014 |
Pursuant to the requirements of the Securities Exchange Act of 1934 and the Investment Company Act of 1940, this report has been signed below by the following persons on behalf of the Registrant and in the capacities and on the dates indicated.
| By /s/ Hilda L. Applbaum |
Hilda L. Applbaum, Vice Chairman and Principal Executive Officer |
| |
| Date: September 30, 2014 |
| By /s/ Jeffrey P. Regal |
Jeffrey P. Regal, Treasurer and Principal Financial Officer |
| |
| Date: September 30, 2014 |