UNITED STATES
SECURITIES AND EXCHANGE COMMISSION
Washington, D.C. 20549
FORM N-CSR
Certified Shareholder Report of
Registered Management Investment Companies
Investment Company Act File Number: 811-01880
The Income Fund of America
(Exact Name of Registrant as Specified in Charter)
6455 Irvine Center Drive
Irvine, California 92618
(Address of Principal Executive Offices)
Registrant's telephone number, including area code: (213) 486-9200
Date of fiscal year end: July 31
Date of reporting period: July 31, 2015
Michael W. Stockton
The Income Fund of America
6455 Irvine Center Drive
Irvine, California 92618
(Name and Address of Agent for Service)
ITEM 1 – Reports to Stockholders

The changing
landscape of
income investing
 | The Income Fund of America® Annual report
for the year ended
July 31, 2015 |
The Income Fund of America seeks current income while secondarily striving for capital growth.
This fund is one of more than 40 offered by one of the nation’s largest mutual fund families, American Funds, from Capital Group. For more than 80 years, Capital has invested with a long-term focus based on thorough research and attention to risk.
Fund results shown in this report, unless otherwise indicated, are for Class A shares at net asset value. If a sales charge (maximum 5.75%) had been deducted, the results would have been lower. Results are for past periods and are not predictive of results for future periods. Current and future results may be lower or higher than those shown. Share prices and returns will vary, so investors may lose money. Investing for short periods makes losses more likely. Investments are not FDIC-insured, nor are they deposits of or guaranteed by a bank or any other entity, so they may lose value. For current information and month-end results, visit americanfunds.com.
Here are the average annual total returns on a $1,000 investment with all distributions reinvested for periods ended June 30, 2015 (the most recent calendar quarter-end):
| Class A shares | | 1 year | | 5 years | | 10 years |
| | | | | | | |
| Reflecting 5.75% maximum sales charge | | –4.76% | | 10.56% | | 6.10% |
For other share class results, visit americanfunds.com and americanfundsretirement.com.
The total annual fund operating expense ratio is 0.55% for Class A shares as of the prospectus dated October 1, 2015 (unaudited).
Investment results assume all distributions are reinvested and reflect applicable fees and expenses. When applicable, investment results reflect fee waivers, without which results would have been lower. Visit americanfunds.com for more information.
The fund’s 30-day yield for Class A shares as of August 31, 2015, calculated in accordance with the U.S. Securities and Exchange Commission (SEC) formula, was 3.05%. The fund’s 12-month distribution rate for Class A shares as of that date was 3.66%. Both reflect the 5.75% maximum sales charge. The SEC yield reflects the rate at which the fund is earning income on its current portfolio of securities while the distribution rate reflects the fund’s past dividends paid to shareholders. Accordingly, the fund’s SEC yield and distribution rate may differ.
The return of principal for bond funds and for funds with significant underlying bond holdings is not guaranteed. Fund shares are subject to the same interest rate, inflation and credit risks associated with the underlying bond holdings. High-yield bonds are subject to greater fluctuations in value and risk of loss of income and principal than investment-grade bonds. Bond ratings, which typically range from AAA/ Aaa (highest) to D (lowest), are assigned by credit rating agencies such as Standard & Poor’s, Moody’s and/or Fitch as an indication of an issuer’s creditworthiness. Investing outside the United States may be subject to additional risks, such as currency fluctuations, periods of illiquidity and price volatility. These risks may be heightened in connection with investments in developing countries. Refer to the fund prospectus and the Risk Factors section of this report for more information on these and other risks associated with investing in the fund.

Fellow investors:
For the 12 months ended July 31, 2015, The Income Fund of America gained 3.01% for those who reinvested quarterly dividends and capital gain distributions totaling approximately 79 cents a share. The fund’s return trailed the broader equity market, as measured by the unmanaged Standard & Poor’s 500 Composite Index, a market capitalization-weighted index based on the results of 500 widely held common stocks, which rose 11.20%. The fund outpaced the 2.82% return of the bond market, as represented by the unmanaged Barclays U.S. Aggregate Index, as well as the 2.12% gain of the Lipper Income Funds Index, a peer group measure.
As you can see in the table below, the fund has fared well against the Lipper and Barclays indexes for all the periods shown.
A world of uncertainty
Investors and the markets contended with a variety of geopolitical and macroeconomic issues during the fiscal year. Early in the period when U.S. Federal Reserve officials broached the possibility of increasing interest rates, a “taper tantrum” roiled markets around the world. More recently, a flare-up in Greece’s long-running debt crisis raised questions about the stability of the euro zone.
The period saw a steep decline in commodity prices, especially for oil, which sent some energy shares plummeting. Throughout the year there was concern over the global ramifications of China’s economic slowdown. Currency was also an issue, with a sharply appreciating U.S. dollar hindering returns for some of the nation’s exporters and companies with global sales.
While those events did create some skittishness in the markets, investors mostly stayed the course. The U.S. economy stumbled in the first quarter as Gross Domestic Product (GDP) rose only 0.6%, but has since shown signs of improvement. Unemployment has steadily declined, ending the period at 5.3%. Consumer confidence has picked
Results at a glance
For periods ended July 31, 2015, with all distributions reinvested
| | | Cumulative
total returns | | Average annual total returns |
| | | 1 year | | 5 years | | 10 years | | Lifetime1 |
| | | | | | | | | |
| The Income Fund of America (Class A shares) | | | 3.01 | % | | | 10.75 | % | | | 6.58 | % | | | 11.20 | % |
| Standard & Poor’s 500 Composite Index2 | | | 11.20 | | | | 16.23 | | | | 7.72 | | | | 11.00 | |
| Lipper Income Funds Index | | | 2.12 | | | | 6.83 | | | | 5.15 | | | | — | 3 |
| Barclays U.S. Aggregate Index2 | | | 2.82 | | | | 3.27 | | | | 4.61 | | | | 7.64 | 4 |
| Consumer Price Index (inflation)5 | | | 0.17 | | | | 1.83 | | | | 2.02 | | | | 4.04 | |
| | |
| 1 | Since December 1, 1973, when Capital Research and Management Company became the fund’s investment adviser. |
| 2 | The market indexes are unmanaged and, therefore, have no expenses. Investors cannot invest directly in an index. |
| 3 | The inception date for the index was December 31, 1988. |
| 4 | From December 1, 1973, through December 31, 1975, the Barclays U.S. Government/Credit Index was used because the Barclays U.S. Aggregate Index did not yet exist. |
| 5 | Computed from data supplied by the U.S. Department of Labor, Bureau of Labor Statistics. |
| | |
| The Income Fund of America | 1 |
up, with auto sales through June the highest since 2005, helped by lower gas prices and affordable loans.
A range of stocks support the fund
Companies spanning a variety of sectors and industries contributed to fund returns during the period. Indeed, eight of the fund’s 10 largest holdings advanced, with pharmaceutical firms providing some of the strongest support.
Among the top 10, Bristol-Myers Squibb surged 29.67%. Shares of the company rose as its oncology drugs continued to show great promise and the U.S. Food and Drug Administration (FDA) granted accelerated approval for its new cancer treatment. Pfizer, our third-largest position, jumped 25.64%. Merck, the fund’s largest holding, advanced a more modest 3.91%. Merck is among the companies working to bring to market new cancer therapies that use the body’s immune system to fight tumors. It also received approval for a new antibiotic during the period.
A number of the fund’s holdings in the financials sector lifted returns. JPMorgan Chase, Wells Fargo and CME all registered double-digit gains. The latter owns and operates large derivatives and futures exchanges in Chicago and New York City, as well as online trading platforms. Its shares soared 29.89%. But several banks abroad hampered results, including Spain’s Banco Santander, which dropped 31.33%.
The fund can invest up to 25% of its assets in stocks outside the U.S., and during the past fiscal year a number of our non-U.S. holdings contributed to absolute returns. In the telecommunications services sector, France’s Orange and Deutsche Telekom both rose. Broadly speaking, however, securities beyond our shores detracted from returns. As an example of how geopolitical issues can impact companies, Finnish tire maker Nokian Renkaat, which derives about a third of its sales from Russia, saw its stock price drop on weakened consumer demand in that country amid the Ukraine crisis.
Falling oil prices took a toll on the energy sector, as the price per barrel dropped from above $100 at the beginning of the fiscal year to about $50 at the end of the period. The fund’s two largest positions in the sector fell sharply as ConocoPhillips and Royal Dutch Shell lost 38.98% and 32.50%, respectively. They nonetheless maintained their dividend payments, and leadership has said they are committed to sustaining the payouts. To do so, both companies cut costs and their capital spending.
Lower prices at the gas pump did leave some consumers with more money to spend elsewhere. Home Depot, the fund’s second-largest position in the consumer discretionary sector, advanced 44.75%. Among consumer staples, PepsiCo rose 9.36% and tobacco conglomerate Altria registered an impressive 33.94% increase.
At fiscal year-end, the fund’s bond market exposure stood at 19.97% of net assets. This relatively low allocation was due, in part, to an anticipated interest
Striking a balance between return and volatility
The Income Fund of America takes a sensible approach to income. Looking back 10 years, the fund has provided higher returns than bonds and the average income fund, and lower volatility than stocks. In addition, as can be seen on page 1, the fund’s lifetime results surpass those of both the stock and bond indexes.
For the 10-year period ended July 31, 2015
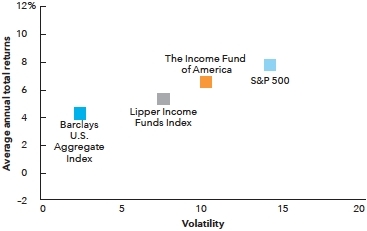
Sources: Stocks — S&P 500; Bonds — Barclays U.S. Aggregate Index; Income funds — Lipper Income Funds Index. Returns include reinvestment of all distributions. Volatility is calculated at net asset value by Lipper using annualized standard deviation (based on monthly returns), a measure of how returns over time have varied from the mean; a lower number signifies lower volatility.
| 2 | The Income Fund of America |
rate hike by the Federal Reserve. Overall, bonds contributed to the fund, and our high-yield exposure provided income.
Outlook
An interest rate hike is possible before the end of 2015, but Fed officials have indicated that any increases will likely be small and gradual. Still, any action could trigger some volatility, and certain areas of the market could be affected to a greater extent. Real estate investment trusts and utilities are more vulnerable in a rising rate environment; as such, the fund’s holdings in these areas are at near historic lows.
Shortly after the fund’s fiscal year ended, equity markets in China experienced a swift and steep decline. Many of the world’s markets followed suit, including those in the U.S. Periods of volatility can be unsettling, especially after three years of relative calm during which U.S. markets rose steadily without a correction.
Since its inception in December 1973, The Income Fund of America has weathered numerous challenging investment environments, and we remain optimistic that we will continue to identify companies that we believe will provide good returns for our shareholders. In fact, indiscriminate market selloffs can provide excellent opportunities for investing based on our company-specific research process.
Despite turbulence in the markets, we still expect the U.S. economy to grow, albeit perhaps in a muted manner, much as it has since emerging from this past recession. Likewise, Europe is showing signs of economic improvement as it continues its process of monetary easing. Inflation remains low and is unlikely to be a concern in the near term, which should allow global interest rates to remain relatively low by historic standards. This should be beneficial to business’ abilility to finance growth at reasonable costs and underpin equity valuations. The fund has been attracting inflows, and we have been able to quickly and enthusiastically put money to work — particularly in the equity markets. Our portfolio managers are not short of investment ideas. Thank you for your confidence in our investment philosophy.
Cordially,

Hilda L. Applbaum
Vice Chairman and Principal Executive Officer

David C. Barclay
President
September 10, 2015
For current information about the fund, visit americanfunds.com.
A lifetime of high current income
The Income Fund of America’s 12-month dividend yield vs. benchmarks
Year ended July 31 | | n The Income Fund of America
n Lipper Income Funds Average
n S&P 500 |
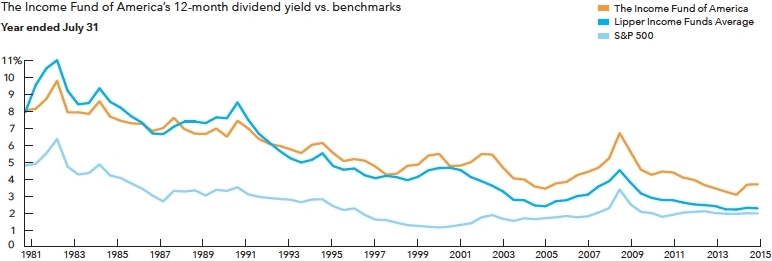
All numbers calculated by Lipper.
| The Income Fund of America | 3 |
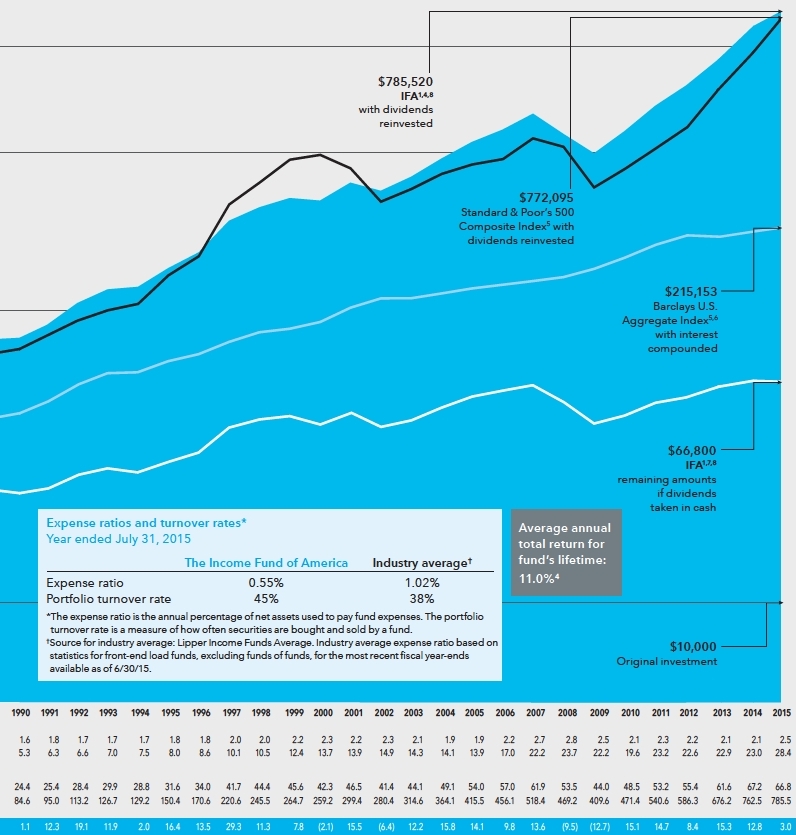
The value of a long-term perspective
Fund results shown are for Class A shares and reflect deduction of the maximum sales charge of 5.75% on the $10,000 investment.1 Thus, the net amount invested was $9,425.2 Results are for past periods and are not predictive of results for future periods. Current and future results may be lower or higher than those shown. Share prices and returns will vary, so investors may lose money. For current information and month-end results, visit americanfunds.com.
The results shown are before taxes on fund distributions and sale of fund shares.
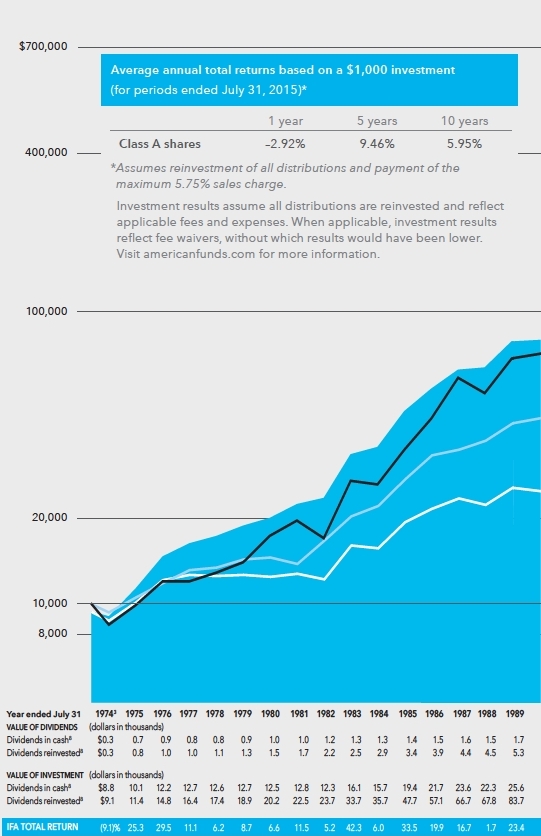
| 1 | As outlined in the prospectus, the sales charge is reduced for accounts (and aggregated investments) of $25,000 or more and is eliminated for purchases of $1 million or more. There is no sales charge on dividends or capital gain distributions that are reinvested in additional shares. |
| 2 | The maximum initial sales charge was 8.5% prior to July 1, 1988. |
| 3 | For the period December 1, 1973 (when Capital Research and Management Company became the fund’s investment adviser), through July 31, 1974. |
| 4 | Includes reinvested dividends of $429,899 and reinvested capital gain distributions of $131,223. |
| 5 | The indexes are unmanaged and, therefore, have no expenses. Investors cannot invest directly in an index. |
| 6 | From December 1, 1973, through December 31, 1975, the Barclays U.S. Government/Credit Index was used because the Barclays U.S. Aggregate Index did not yet exist. |
| 7 | Includes capital gain distributions of $24,067, but does not reflect income dividends of $72,482 taken in cash. |
| 8 | From April 1990 to September 1994, and from September 2003 to March 2009, the fund accrued dividends daily but paid quarterly. Dividends reflect quarterly dividends actually paid during the period, while year-end values are adjusted for cumulative dividends accrued but not yet paid. |
| 4 | The Income Fund of America |
How a $10,000 investment has grown
There have always been reasons not to invest. If you look beyond the negative headlines, however, you will find that despite occasional stumbles, financial markets have tended to reward investors over the long term. Active management — bolstered by experience and careful research — can add even more value. As the chart below shows, over its lifetime, The Income Fund of America (IFA) has delivered higher returns than both the broader stock and bond markets. Dividends, particularly when reinvested, have accounted for a large portion of the fund’s overall results.
| The Income Fund of America | 5 |
The changing landscape of income investing

| 6 | The Income Fund of America |
We believe that pharmaceutical research and development are experiencing a renaissance.
Hilda Applbaum
The central objective of The Income Fund of America is income. So it’s not surprising that a large component of the fund’s holdings have traditionally been drawn from industries with a long history of paying above-average dividends, such as utilities, consumer goods and financials.
Many of these industries still provide investors a measure of current income and, secondarily, capital appreciation. But the investment professionals that manage The Income Fund of America have also found significant opportunities in other areas of the market.
At one time technology companies disdained dividends, but many have “matured” and now reward shareholders with regular and growing dividends. In the industrials sector, the aerospace business is poised to expand as more people take to the skies and defense spending escalates. Some aerospace companies also have strong recurring revenue models that provide visibility into future cash flow and dividends for investors. The health care sector has a long history of paying dividends, but there is a sea change occurring in the pharmaceutical business — one that could help win the war against cancer and the battle against heart disease.
On the following pages, we examine how the fund’s research-driven approach helps us identify opportunity among companies with a strong dividend culture and potential for growth.
Unleashing the immune system
Not so long ago, the prognosis for anyone diagnosed with cancer was grim. In recent decades, however, an improved understanding of how to prevent, diagnose and treat various forms of the disease have improved the odds. The outlook for oncology should become even brighter over the next decade. For many people with cancer, radical new drugs could shift the paradigm from treatment to cure. One that appears to have enormous potential is immuno-oncology (IO), a therapy which harnesses a patient’s immune system to recognize and fight the disease.
“We are on the verge of a revolution in the way cancer is treated,” says investment analyst Jay Markowitz, who focuses on U.S. pharmaceutical and biotechnology companies. “We’re still in the initial phases, but I have seen enough to believe that a new way of fighting the disease — unleashing the immune system to destroy tumor cells — is upon us.”
Certainly, there are scientific challenges with IO that will need to be overcome. Treatments must strike the optimal balance, enabling the immune system to counter disease effectively without triggering a dangerous response that damages healthy cells. Ascertaining the optimal mix of therapies for different cancers will be challenging.
Companies leading the way in this field are Merck, Bristol-Myers Squibb, Pfizer, Roche and AstraZeneca. The first three were among the fund’s top 10 holdings as of July 31. Indeed, health care is one of the fund’s biggest sector concentrations. According to portfolio manager Hilda Applbaum, these companies are attractive not only because of a long history of paying dividends, but because they have quality leadership, robust product pipelines, solid balance sheets and healthy cash flow.
“We believe that pharmaceutical research and development are experiencing a renaissance,” Hilda says. “I think there are a number of companies that may be on the verge of delivering innovative and potentially disruptive technologies to treat unmet medical needs. We may now be in a development cycle that could prove to be very long-lived.”
Jay points to the rise in drug innovation as one of the most significant developments in health care. The 41 new drugs approved in 2014 represented the second-highest total since 1940. “This cycle is fueled by a better understanding of the genetics, molecular biology and physiology of health and sickness — coupled with new and improved ways to prevent and treat diseases,” he states.
“Product cycles tend to be long but do not last forever. I believe we are still in the early days, with promising cancer drugs just launching and better ways to manage cholesterol and reduce the risk of heart disease on the horizon. With heart disease and cancer the two leading causes of death in the developed world, the impact of these innovations is potentially profound.”
Research is crucial for investors in any industry, but biotechnology is among the most complex. Biologics have a long, risky and expensive development cycle, sometimes taking a decade or more from discovery to approval. Once approved though, some can command premium pricing. Barriers to entry in this particular arena are quite high; a successful biologic
| The Income Fund of America | 7 |
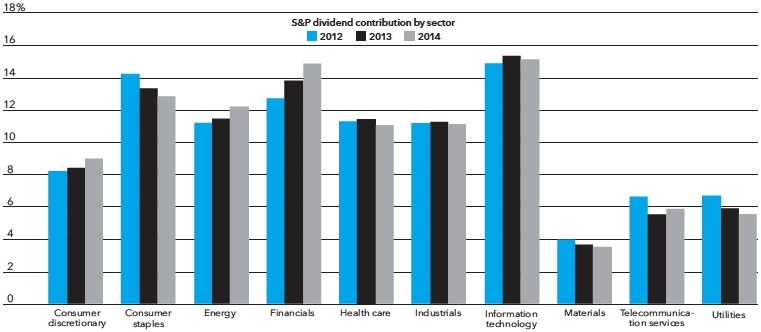
Technology companies get on board the dividend bandwagon
The dividend landscape shifts as information technology tops all dividend payers
For the past three years, the information technology companies in the Standard & Poor’s 500 Composite Index paid more in dividends than companies in any other sector. In 2014, the tech sector paid 14.9% of all dividends paid to investors, up from 10.3% in 2011 and about 5% in 2004.
represents a long-term and unusually secure source of recurring revenue for its manufacturer. In some cases, that cash flow is being used to reward investors with dividends.
“The key to success is not relying on a limited monopoly afforded by a patent on a drug, but through continuous innovation. It seems that more companies than ever fit that description,” adds Jay.
“Mature” technology companies pay dividends
The dividend landscape has shifted. Once largely the province of utilities and consumer product companies, dividends are now gaining favor in other market sectors. For the past three years, in fact, information technology — a group that once disdained dividends — has been the biggest contributor to dividends in Standard & Poor’s 500 Composite Index.
In 2014 S&P reported that the technology sector accounted for 14.9% of all dividends paid to investors, or about $57 billion of the $375.9 billion. That’s up from 10.3% in 2011 and about 3.6% at the height of the tech bubble in 2000. It supplanted the consumer staples sector, which had paid the most dividends for the previous three years.
“Most people don’t think about technology as a high yielding sector,” says Hilda. “When I started with this fund, we had no technology holdings because none of those companies paid dividends. Today, many of them are firmly committed to not only paying a dividend but growing that dividend in line with, or faster than, earnings. The sector represents one of our largest exposures.”
Among the fund’s holdings are Cisco Systems, which designs, manufactures and sells networking equipment; Analog Devices, a semiconductor company specializing in data conversion and signal processing technology; and Microsoft.
The transition of the technology sector highlights the importance of research. Explains Hilda, “Dividend investing is about looking ahead, selecting companies that may initiate a dividend or have the potential to grow their dividend and maintain it.”
One such example is Microsoft, the fund’s second-largest position at fiscal year-end. It also provides something of a timeline for the evolution of the tech sector’s stance on dividends. For 17 years the company spurned the idea of a dividend, but in something of a surprise move in January 2003, it initiated a dividend. At
| 8 | The Income Fund of America |

The New Geography of Investing®
Where a company does business can be more important than where it’s located. Here’s a look at The Income Fund of America’s portfolio through the revenue lens. The charts below show the countries and regions in which the fund’s equity investments are located, and where the revenue comes from.
The Income Fund of America vs. S&P 500 Index with income reinvested
Equity portion breakdown by domicile (%)

| | Region | | Fund | | | Index | |
| n | United States | | | 73 | % | | | 100 | % |
| n | Canada | | | 2 | | | | — | |
| n | Europe | | | 18 | | | | — | |
| n | Japan | | | — | | | | — | |
| n | Asia-Pacific ex. Japan | | | 5 | | | | — | |
| n | Emerging markets | | | 2 | | | | — | |
| | Total | | | 100 | % | | | 100 | % |
Equity portion breakdown by revenue (%)

| | Region | | Fund | | | Index | |
| n | United States | | | 49 | % | | | 62 | % |
| n | Canada | | | 3 | | | | 2 | |
| n | Europe | | | 18 | | | | 13 | |
| n | Japan | | | 3 | | | | 3 | |
| n | Asia-Pacific ex. Japan | | | 5 | | | | 1 | |
| n | Emerging markets | | | 22 | | | | 19 | |
| | Total | | | 100 | % | | | 100 | % |
Source: Capital Group (as of June 30, 2015).
the time, the announcement was seen as putting pressure on other technology companies to return cash to shareholders. It certainly prompted many of them to rethink their approach to dividends.
The sky’s truly the limit
Investment analyst Paul Benjamin says Microsoft is really two companies, one of which is doing very well and one that’s getting better. “Fortunately Microsoft earns 80% of its profits from its healthy enterprise business and just 20% from its consumer business, which has missed the boat in a number of high-growth areas but is getting better.”
The enterprise business is focused on cloud computing, and Microsoft’s Office 365 — a cloud-delivered, subscription-based productivity suite — is growing rapidly. The company reported in July that the consumer version of Office 365 had added 3 million subscribers in the second quarter, bringing the number of users to 15.2 million. Microsoft entered the cloud arena in 2010 with a service called Azure that, for a fee, offered customers access to basically unlimited supercomputing power from the company’s servers. It now competes with the likes of Amazon Web Services and Google Compute Engine.
Paul reports that the company’s new management team is top-notch. Satya Nadella became Microsoft’s chief executive officer in February, succeeding Steve Ballmer. “Satya is an outstanding CEO,” Paul says. “He’s taken on a lot of challenges and focused the company on the services that have the greatest potential. Also, Bill Gates, who founded Microsoft in 1975, is re-engaged with the company, both as a board member and an adviser to Satya.”
Investment analyst Mathews Cherian says the move to cloud computing and the burgeoning “Internet of things” are
| The Income Fund of America | 9 |
Electronics are being put into nearly everything around us — and these companies are beneficiaries of this evolution.
Mathews Cherian
significant tailwinds for several companies in the fund, including Intel and Analog Devices. “There are sensors in so many things now collecting data and converting it to digital information,” he explains. “Electronics are being put into nearly everything around us — and these companies are beneficiaries of this evolution.”
Hilda calls Microsoft an example of a mature technology company that can be a boon for income investors. “The so-called ‘new’ technology companies — those that consider themselves new technology — are terrified of paying a dividend because they think it signals a lack of growth. That mindset can tend to lead them to make poor capital allocation decisions.
“Conversely, what we’ve seen from ‘old’ tech — companies such as Microsoft, Texas Instruments and Intel — is a strong sense of capital discipline. They know that they have an obligation to pay a dividend to shareholders, and I believe it makes them better capital allocators,” Hilda adds.
Taking flight
Flying seems such a global phenomenon that in many societies it’s unusual to encounter someone who has never flown. But worldwide, most people haven’t been on a plane. By many accounts, only about 15% of the world’s population has traveled by air.
Over the next 20 years, that’s likely to change as millions of people living in developing market countries like India enter the middle class. Boeing, one of the world’s largest airplane manufacturers, predicts that so many people will be flying that 38,000 new airplanes, valued at $5.6 trillion, will be in the air by 2034.
Among the possible beneficiaries of this trend are Boeing, United Technologies (owner of engine maker Pratt & Whitney), Delta and Ryanair — all of which were in the fund’s portfolio at the close of the fiscal year. Another is General Electric, one of the fund’s top 10 holdings.
GE isn’t always associated with aerospace, but GE Aviation is a foremost provider of jet and turboprop engines, components
A prescription for innovation
In the world of pharmaceuticals, new drugs are known as NMEs, or new molecular entities. In 2014, the Center for Drug Evaluation and Research, a federal agency, approved 41 NMEs, the highest total in more than a decade.
In addition, more than half of those drugs were identified as first-in-class, meaning they use a new and unique mechanism of action for treating a medical condition. The approval rate, the agency reported, suggests that the new drugs represent “a field of highly innovative products.”
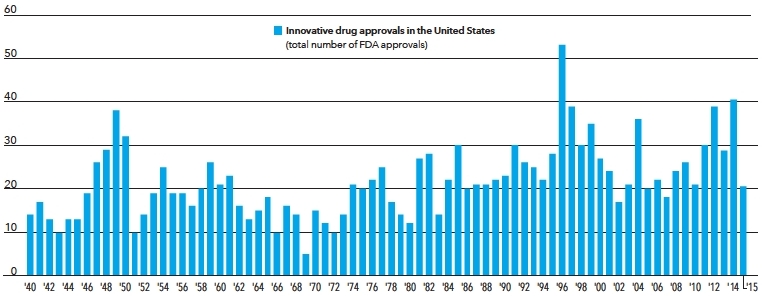
Source: U.S. Food and Drug Administration (FDA). Innovative drugs represent new molecular entities, which are novel new medicines or active ingredients that have never before been marketed in the United States in any form, as approved by the Center for Drug Evaluation and Research, a division of the FDA. The number of drugs approved for 2015 is as of August 18, 2015.
| 10 | The Income Fund of America |
and integrated systems for commercial, military, business and general aviation aircraft. It also has a global service network to support these offerings.
“General Electric is much more than just the aviation division, but what a great division it is,” says Hilda. “We met with GE Aviation at the Paris Air Show in June, and we left feeling very good about their business and prospects going forward.”
The company generated revenues of $23 billion in 2014, or about 20% of GE’s non-capital revenues.
While the air transport industry is subject to occasional shocks, demand is resilient; services are often seen as essential. Discretionary trips such as vacations or family events remain high priorities. Over the past 30 years, the industry has withstood recessions, volatile oil prices, near pandemics, wars and security threats. Traffic has nonetheless continued to expand on average at 5% annually.
According to investment analyst Justin Toner, “If you look back historically, air traffic has grown in excess of global gross domestic product, and I expect that to continue. There may be fits and starts, but as people become wealthier one of the first things they want to do is fly.”
In fact, the biggest challenge now facing plane makers is meeting the record $1.8 trillion orders they have booked for the coming decade. “In terms of commercial aerospace, the backlogs are just massive,” says Justin. “There’s probably no other industry in the world that has that much business in the books and knows how much work they have for the next seven to eight years.”
On the defensive
After facing cutbacks several years ago, defense spending is on the rise, which could boost U.S.-based Lockheed Martin, one of the fund’s 10 largest positions as of July 31, and United Kingdom-based BAE Systems, also a portfolio holding. Both are global aerospace and defense companies.
“We are beginning to hear about the need to retool certain parts of the military that have been exhausted by overseas conflict or affected by budget constraints,” says Hilda.
Indeed, Lockheed’s $400 billion contract with the Pentagon passed a milestone in July when the U.S. Marine Corps declared the F-35 Joint Strike Fighter (JSF) ready for combat. The Pentagon plans to buy more than 2,400 jets. BAE is also involved in the JSF program and may benefit from stabilizing defense budgets abroad.
In addition to a robust order book, Lockheed has demonstrated its commitment to rewarding shareholders by significantly increasing its dividend during the past two years.
“The growth in their dividend has been extraordinary,” Justin states. “It’s an indication of the strength that management sees in their cash flow — and a big reason we invest in the company.” n

| The Income Fund of America | 11 |
About your fund
Fund results shown are for Class A shares at net asset value. If a sales charge (maximum 5.75%) had been deducted, the results would have been lower. Results are for past periods and are not predictive of results for future periods. Current and future results may be lower or higher than those shown. Share prices and returns will vary, so investors may lose money. For current information and month-end results, visit americanfunds.com.
| Resilience during stock market declines | | The Income Fund of America (IFA) vs. the S&P 500 during market declines* |
| | | | | | | |
| Dates of decline | | S&P 500
cumulative total return | | IFA cumulative
total return | | IFA advantage
(percentage points) |
| | | | | | | |
| September 21, 1976, through March 6, 1978 | | | –13.5 | % | | | 1.9 | % | | | 15.4 | % |
| November 28, 1980, through August 12, 1982 | | | –20.2 | | | | 19.0 | | | | 39.2 | |
| August 25 through December 4, 1987 | | | –32.8 | | | | –13.6 | | | | 19.2 | |
| July 16 through October 11, 1990 | | | –19.2 | | | | –10.2 | | | | 9.0 | |
| July 17 through August 31, 1998 | | | –19.1 | | | | –9.5 | | | | 9.6 | |
| March 24, 2000, through October 9, 2002 | | | –47.4 | | | | 0.7 | | | | 48.1 | |
| October 9, 2007, through March 9, 2009 | | | –55.2 | | | | –43.5 | | | | 11.7 | |
| April 29 through October 3, 2011 | | | –18.6 | | | | –11.6 | | | | 7.0 | |
| | |
| * | Periods shown reflect S&P price declines of 15% or more (without dividends reinvested) based on 100% recovery between declines (except for a 78% recovery between 3/6/78 and 11/28/80 and a 77% recovery between 3/9/09 and 4/29/11). The index is unmanaged and, therefore, has no expenses. Investors cannot invest directly in an index. |
Withdrawing income: the dividend advantage
Most fund investors reinvest their dividends, but some use dividends to meet current expenses. As shown below, the fund’s income has allowed withdrawals to be made without invading principal.
| Higher dividends ... | | ... have helped to keep
principal intact, letting
compounding do its work. |
| | | |
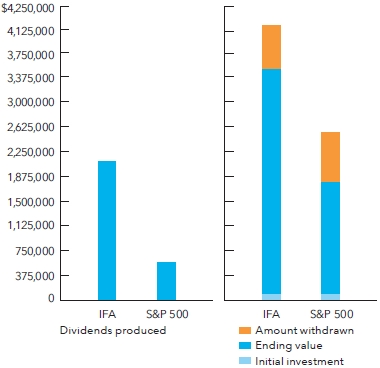 |
Charts show hypothetical $100,000 investments in the fund (at net asset value) and in the S&P 500 from January 1, 1974, to July 31, 2015. Example assumes an annual withdrawal equaling $5,000 the first year on December 31, 1974, and then increasing by 5% each year thereafter. Over the period, total withdrawals from each of the fund and the index come to $639,199.
Historical benefits of income
This chart shows one-year snapshots of the annual income produced by three hypothetical $10,000 investments made on July 31, 1974, in each of The Income Fund of America, the S&P 500 and three-month U.S. Treasury bills. Over the past 41 years, income from the fund has been substantially higher.
Year ended July 31
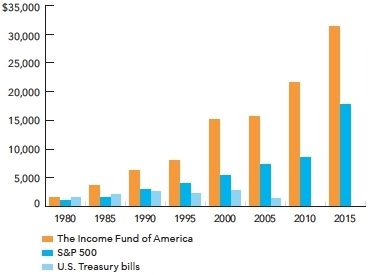
All results are calculated at net asset value with dividends and capital gains (where applicable) reinvested. Source for Treasury bills is the Federal Reserve. Income from three-month Treasury bills assumes reinvestment of both principal and interest at prevailing rates at the time of purchase. Securities backed by the U.S. Treasury or the full faith and credit of the U.S. government are guaranteed only as to the timely payment of interest and principal when held to maturity; the fund is not guaranteed.
Source: Thomson InvestmentView.
| 12 | The Income Fund of America |
The portfolio at a glance
July 31, 2015
Investment mix by security type
Percent of net assets
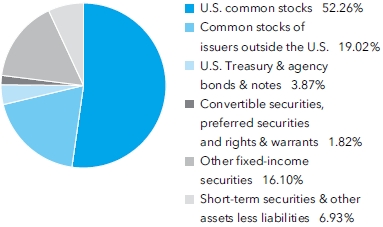
| Five largest sectors in common stock holdings |
| | | | |
| | | | Percent of net assets | |
| | | | | |
| Industrials | | | 10.47 | % |
| Health care | | | 9.85 | |
| Financials | | | 9.64 | |
| Information technology | | | 8.20 | |
| Consumer staples | | | 6.89 | |
| | |
| Ten largest common stock holdings | | | | |
| | |
| | | | Percent of net assets | |
| | | | | |
| Merck | | | 3.05 | % |
| Microsoft | | | 2.96 | |
| Pfizer | | | 2.28 | |
| General Electric | | | 2.07 | |
| Bristol-Myers Squibb | | | 1.64 | |
| Lockheed Martin | | | 1.56 | |
| Verizon Communications | | | 1.55 | |
| JPMorgan Chase | | | 1.37 | |
| Wells Fargo | | | 1.23 | |
| Procter & Gamble | | | 1.22 | |
| | |
| Country diversification by domicile | | | | |
| | |
| | | | Percent of net assets | |
| | | | | |
| United States | | | 70.54 | % |
| United Kingdom | | | 7.62 | |
| Euro zone* | | | 5.65 | |
| Australia | | | 2.08 | |
| Hong Kong | | | 1.83 | |
| Canada | | | 1.50 | |
| Switzerland | | | 1.13 | |
| Other countries | | | 2.72 | |
| Short-term securities & other assets less liabilities | | | 6.93 | |
| | |
| * | Countries using the euro as a common currency; those represented in the fund’s portfolio are Belgium, Finland, France, Germany, Ireland, Italy, Luxembourg, the Netherlands, Portugal, Slovenia and Spain. |
July 31, 2014
Investment mix by security type
Percent of net assets
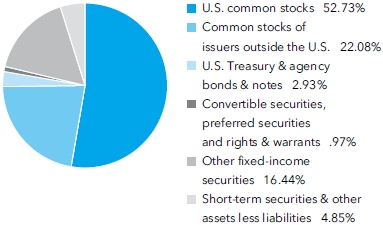
| Five largest sectors in common stock holdings | | | |
| | | | |
| | | | Percent of net assets | |
| | | | | |
| Health care | | | 10.49 | % |
| Industrials | | | 9.66 | |
| Financials | | | 9.50 | |
| Information technology | | | 8.07 | |
| Consumer staples | | | 7.74 | |
| | | | | |
| Ten largest common stock holdings | | | | |
| | | | | |
| | | | Percent of net assets | |
| | | | | |
| Merck | | | 3.00 | % |
| Microsoft | | | 2.80 | |
| General Electric | | | 2.01 | |
| Verizon | | | 1.91 | |
| Bristol-Myers Squibb | | | 1.78 | |
| Pfizer | | | 1.72 | |
| AstraZeneca | | | 1.46 | |
| DuPont | | | 1.46 | |
| Cisco Systems | | | 1.40 | |
| PepsiCo | | | 1.38 | |
| | | | | |
| Country diversification by domicile | | | | |
| | | | | |
| | | | Percent of net assets | |
| | | | | |
| United States | | | 69.81 | % |
| United Kingdom | | | 8.64 | |
| Euro zone† | | | 6.93 | |
| Canada | | | 2.20 | |
| Australia | | | 1.97 | |
| Switzerland | | | 1.75 | |
| Hong Kong | | | 1.69 | |
| Other countries | | | 2.16 | |
| Short-term securities & other assets less liabilities | | | 4.85 | |
| | |
| † | Countries using the euro as a common currency; those represented in the fund’s portfolio are Belgium, Finland, France, Germany, Ireland, Italy, Luxembourg, the Netherlands, Portugal and Spain. |
| | |
| The Income Fund of America | 13 |
Summary investment portfolio July 31, 2015
| Common stocks 71.28% | | Shares | | | Value
(000) | |
| Industrials 10.47% | | | | | | | | |
| General Electric Co. | | | 77,005,000 | | | $ | 2,009,830 | |
| Lockheed Martin Corp. | | | 7,317,400 | | | | 1,515,433 | |
| Waste Management, Inc. | | | 22,153,353 | | | | 1,132,701 | |
| BAE Systems PLC | | | 114,530,500 | | | | 858,869 | |
| Caterpillar Inc. | | | 10,229,000 | | | | 804,306 | |
| Other securities | | | | | | | 3,834,411 | |
| | | | | | | | 10,155,550 | |
| | | | | | | | | |
| Health care 9.85% | | | | | | | | |
| Merck & Co., Inc. | | | 50,113,640 | | | | 2,954,700 | |
| Pfizer Inc. | | | 61,380,000 | | | | 2,213,363 | |
| Bristol-Myers Squibb Co. | | | 24,252,500 | | | | 1,591,934 | |
| Eli Lilly and Co. | | | 8,959,400 | | | | 757,159 | |
| AstraZeneca PLC | | | 9,990,000 | | | | 673,958 | |
| Novartis AG | | | 3,762,000 | | | | 390,877 | |
| Novartis AG (ADR) | | | 500,000 | | | | 51,875 | |
| Other securities | | | | | | | 916,573 | |
| | | | | | | | 9,550,439 | |
| | | | | | | | | |
| Financials 9.64% | | | | | | | | |
| JPMorgan Chase & Co. | | | 19,330,200 | | | | 1,324,699 | |
| Wells Fargo & Co. | | | 20,547,000 | | | | 1,189,055 | |
| CME Group Inc., Class A | | | 10,140,400 | | | | 973,884 | |
| Banco Santander, SA1 | | | 103,815,826 | | | | 716,475 | |
| Crown Castle International Corp. | | | 7,450,000 | | | | 610,229 | |
| Suncorp Group Ltd. | | | 52,849,898 | | | | 551,259 | |
| Public Storage | | | 2,240,000 | | | | 459,603 | |
| Digital Realty Trust, Inc. | | | 7,115,000 | | | | 457,281 | |
| Other securities | | | | | | | 3,065,138 | |
| | | | | | | | 9,347,623 | |
| | | | | | | | | |
| Information technology 8.20% | | | | | | | | |
| Microsoft Corp. | | | 61,441,100 | | | | 2,869,299 | |
| Cisco Systems, Inc. | | | 33,845,000 | | | | 961,875 | |
| Intel Corp. | | | 32,464,512 | | | | 939,848 | |
| Analog Devices, Inc. | | | 13,916,091 | | | | 811,726 | |
| Texas Instruments Inc. | | | 14,730,000 | | | | 736,205 | |
| Taiwan Semiconductor Manufacturing Co., Ltd. | | | 127,503,000 | | | | 563,377 | |
| Taiwan Semiconductor Manufacturing Co., Ltd. (ADR) | | | 500 | | | | 11 | |
| Other securities | | | | | | | 1,071,326 | |
| | | | | | | | 7,953,667 | |
| | | | | | | | | |
| Consumer staples 6.89% | | | | | | | | |
| Procter & Gamble Co. | | | 15,373,700 | | | | 1,179,163 | |
| Philip Morris International Inc. | | | 13,168,200 | | | | 1,126,276 | |
| Coca-Cola Co. | | | 21,745,000 | | | | 893,285 | |
| Kimberly-Clark Corp. | | | 5,100,000 | | | | 586,347 | |
| Altria Group, Inc. | | | 8,459,000 | | | | 460,000 | |
| Other securities | | | | | | | 2,442,117 | |
| | | | | | | | 6,687,188 | |
| | | | | | | | | |
| Energy 4.99% | | | | | | | | |
| ConocoPhillips | | | 19,356,362 | | | | 974,399 | |
| Royal Dutch Shell PLC, Class B (ADR) | | | 11,431,000 | | | | 664,713 | |
| Royal Dutch Shell PLC, Class B | | | 6,003,647 | | | | 174,433 | |
| Chevron Corp. | | | 7,065,000 | | | | 625,111 | |
| Spectra Energy Corp | | | 19,655,500 | | | | 594,776 | |
| Coal India Ltd. | | | 85,000,000 | | | | 582,038 | |
| BP PLC | | | 76,550,000 | | | | 472,738 | |
| Other securities | | | | | | | 748,871 | |
| | | | | | | | 4,837,079 | |
| | | | | | | | | |
| 14 | The Income Fund of America |
| | | Shares | | | Value
(000) | |
| Consumer discretionary 4.85% | | | | | | | | |
| Target Corp. | | | 9,200,000 | | | $ | 753,020 | |
| Home Depot, Inc. | | | 5,595,000 | | | | 654,783 | |
| McDonald’s Corp. | | | 6,000,000 | | | | 599,160 | |
| General Motors Co. | | | 14,742,512 | | | | 464,536 | |
| Other securities | | | | | | | 2,236,274 | |
| | | | | | | | 4,707,773 | |
| | | | | | | | | |
| Materials 4.32% | | | | | | | | |
| E.I. du Pont de Nemours and Co. | | | 19,374,268 | | | | 1,080,309 | |
| Dow Chemical Co. | | | 18,504,900 | | | | 870,840 | |
| Other securities | | | | | | | 2,238,766 | |
| | | | | | | | 4,189,915 | |
| | | | | | | | | |
| Telecommunication services 3.98% | | | | | | | | |
| Verizon Communications Inc. | | | 32,239,039 | | | | 1,508,465 | |
| Telstra Corp. Ltd. | | | 141,451,533 | | | | 671,027 | |
| Other securities | | | | | | | 1,686,797 | |
| | | | | | | | 3,866,289 | |
| | | | | | | | | |
| Utilities 3.84% | | | | | | | | |
| PG&E Corp. | | | 11,300,000 | | | | 593,363 | |
| EDP - Energias de Portugal, SA | | | 134,952,000 | | | | 499,175 | |
| Duke Energy Corp. | | | 5,874,999 | | | | 436,042 | |
| Other securities | | | | | | | 2,193,643 | |
| | | | | | | | 3,722,223 | |
| | | | | | | | | |
| Miscellaneous 4.25% | | | | | | | | |
| Other common stocks in initial period of acquisition | | | | | | | 4,123,890 | |
| | | | | | | | | |
| Total common stocks (cost: $55,009,922,000) | | | | | | | 69,141,636 | |
| | | | | | | | | |
| Preferred securities 0.48% | | | | | | | | |
| Financials 0.48% | | | | | | | | |
| Wells Fargo & Co., Class A, Series Q, 5.85% depositary shares preferred noncumulative | | | 1,600,000 | | | | 41,200 | |
| Other securities | | | | | | | 421,371 | |
| | | | | | | | 462,571 | |
| | | | | | | | | |
| Total preferred securities (cost: $444,203,000) | | | | | | | 462,571 | |
| | | | | | | | | |
| Rights & warrants 0.00% | | | | | | | | |
| Energy 0.00% | | | | | | | | |
| Other securities | | | | | | | — | |
| | | | | | | | | |
| Total rights & warrants (cost: $2,171,000) | | | | | | | — | |
| | | | | | | | | |
| Convertible stocks 0.70% | | | | | | | | |
| Other 0.32% | | | | | | | | |
| Other securities | | | | | | | 305,416 | |
| | | | | | | | | |
| Miscellaneous 0.38% | | | | | | | | |
| Other convertible stocks in initial period of acquisition | | | | | | | 370,988 | |
| | | | | | | | | |
| Total convertible stocks (cost: $864,455,000) | | | | | | | 676,404 | |
| | | | | | | | | |
| Convertible bonds 0.64% | Principal amount
(000) | | | | | |
| Other 0.64% | | | | | | | | |
| Other securities | | | | | | | 624,891 | |
| | | | | | | | | |
| Total convertible bonds (cost: $675,672,000) | | | | | | | 624,891 | |
| | | | | | | | | |
| The Income Fund of America | 15 |
| Bonds, notes & other debt instruments 19.97% | Principal amount
(000) | | | Value
(000) | |
| Corporate bonds & notes 13.75% | | | | | | |
| Financials 2.58% | | | | | | | | |
| CME Group Inc. 5.30% 2043 | | $ | 1,092 | | | $ | 1,238 | |
| JPMorgan Chase & Co. 1.35%–3.90% 2017–2025 | | | 41,540 | | | | 41,624 | |
| JPMorgan Chase & Co., junior subordinated 5.30%-7.90% (undated) | | | 153,050 | | | | 159,428 | |
| Wells Fargo & Co. 2.60%–4.60% 2016–2024 | | | 66,625 | | | | 71,218 | |
| Wells Fargo & Co., Series K, junior subordinated 7.98% (undated) | | | 86,566 | | | | 93,924 | |
| Other securities | | | | | | | 2,131,121 | |
| | | | | | | | 2,498,553 | |
| | | | | | | | | |
| Health care 1.82% | | | | | | | | |
| Merck & Co., Inc. 1.10% 2018 | | | 6,710 | | | | 6,696 | |
| Pfizer Inc. 7.20% 2039 | | | 1,353 | | | | 1,864 | |
| Other securities | | | | | | | 1,761,292 | |
| | | | | | | | 1,769,852 | |
| | | | | | | | | |
| Telecommunication services 1.51% | | | | | | | | |
| Verizon Communications Inc. 2.63%–6.55% 2020–20482 | | | 270,351 | | | | 257,187 | |
| Other securities | | | | | | | 1,210,268 | |
| | | | | | | | 1,467,455 | |
| | | | | | | | | |
| Industrials 1.31% | | | | | | | | |
| General Electric Capital Corp. 2.20%–6.00% 2016–2020 | | | 34,370 | | | | 36,080 | |
| General Electric Capital Corp., junior subordinated 6.25%-7.13% (undated) | | | 162,300 | | | | 184,339 | |
| General Electric Co. 2.70%–4.13% 2022–2042 | | | 18,750 | | | | 18,545 | |
| Other securities | | | | | | | 1,035,077 | |
| | | | | | | | 1,274,041 | |
| | | | | | | | | |
| Consumer staples 0.61% | | | | | | | | |
| Coca-Cola Co. 1.80% 2016 | | | 10,000 | | | | 10,119 | |
| Philip Morris International Inc. 3.60%–4.88% 2023–2044 | | | 13,495 | | | | 13,755 | |
| Other securities | | | | | | | 564,377 | |
| | | | | | | | 588,251 | |
| | | | | | | | | |
| Other 5.92% | | | | | | | | |
| Other securities | | | | | | | 5,735,813 | |
| | | | | | | | | |
| Total corporate bonds & notes | | | | | | | 13,333,965 | |
| | | | | | | | | |
| U.S. Treasury bonds & notes 3.52% | | | | | | | | |
| U.S. Treasury 3.19% | | | | | | | | |
| U.S. Treasury 0.63%–6.25% 2015–2045 | | | 2,966,601 | | | | 3,091,496 | |
| | | | | | | | | |
| U.S. Treasury inflation-protected securities 0.33% | | | | | | | | |
| U.S. Treasury Inflation-Protected Securities 0.13%–1.38% 2024–20453 | | | 325,659 | | | | 325,240 | |
| | | | | | | | | |
| Total U.S. Treasury bonds & notes | | | | | | | 3,416,736 | |
| | | | | | | | | |
| Mortgage-backed obligations 1.87% | | | | | | | | |
| Fannie Mae 2.50%–9.77% 2018–20474,5,6 | | | 403,401 | | | | 434,039 | |
| Freddie Mac 1.44%–9.00% 2019–20454,5,6 | | | 306,308 | | | | 325,239 | |
| Other securities | | | | | | | 1,055,624 | |
| | | | | | | | 1,814,902 | |
| | | | | | | | | |
| Federal agency bonds & notes 0.35% | | | | | | | | |
| Fannie Mae 2.30%–7.13% 2022–20304,5 | | | 95,172 | | | | 110,392 | |
| Federal Home Loan Bank 5.50% 2036 | | | 100 | | | | 131 | |
| Freddie Mac 0.75%–3.53% 2016–20244,5 | | | 190,550 | | | | 193,829 | |
| Other securities | | | | | | | 30,863 | |
| | | | | | | | 335,215 | |
| | | | | | | | | |
| Other bonds & notes 0.48% | | | | | | | | |
| Other securities | | | | | | | 466,872 | |
| | | | | | | | | |
| Total bonds, notes & other debt instruments (cost: $19,282,716,000) | | | | | | | 19,367,690 | |
| | | | | | | | | |
| 16 | The Income Fund of America |
| Short-term securities 6.98% | Principal amount (000) | | | Value
(000) | |
| Chariot Funding, LLC 0.33%–0.40% due 12/1/2015–12/14/20152 | | $ | 124,000 | | | $ | 123,842 | |
| Coca-Cola Co. 0.14%–0.39% due 8/11/2015–1/11/20162 | | | 150,000 | | | | 149,845 | |
| Fannie Mae 0.09%–0.30% due 8/6/2015–3/1/2016 | | | 920,000 | | | | 919,509 | |
| Federal Home Loan Bank 0.06%–0.20% due 8/14/2015–1/27/2016 | | | 2,593,150 | | | | 2,592,615 | |
| Freddie Mac 0.10%–0.21% due 8/5/2015–1/6/2016 | | | 1,248,000 | | | | 1,247,672 | |
| General Electric Capital Corp. 0.23%–0.30% due 11/17/2015–12/7/2015 | | | 73,600 | | | | 73,541 | |
| Jupiter Securitization Co., LLC 0.28% due 10/8/20152 | | | 50,000 | | | | 49,977 | |
| Microsoft Corp. 0.09% due 8/12/2015–9/2/20152 | | | 75,000 | | | | 74,997 | |
| Pfizer Inc 0.12%–0.14% due 8/3/2015–10/1/20152 | | | 88,000 | | | | 87,994 | |
| U.S. Treasury Bills 0.13% due 10/1/2015 | | | 50,000 | | | | 49,997 | |
| Other securities | | | | | | | 1,393,921 | |
| | | | | | | | | |
| Total short-term securities (cost: $6,763,471,000) | | | | | | | 6,763,910 | |
| Total investment securities 100.05% (cost: $83,042,610,000) | | | | | | | 97,037,102 | |
| Other assets less liabilities (0.05)% | | | | | | | (45,091 | ) |
| | | | | | | | | |
| Net assets 100.00% | | | | | | $ | 96,992,011 | |
This summary investment portfolio is designed to streamline the report and help investors better focus on the fund’s principal holdings. See the inside back cover for details on how to obtain a complete schedule of portfolio holdings.
As permitted by U.S. Securities and Exchange Commission regulations, “Miscellaneous” securities include holdings in their first year of acquisition that have not previously been publicly disclosed.
“Other securities” includes all issues that are not disclosed separately in the summary investment portfolio. Some of these securities in “Other securities” (with an aggregate value of $19,158,000, an aggregate cost of $22,311,000, and which represented .02% of the net assets of the fund) were acquired from 5/2/2013 to 4/7/2015 through private placement transactions exempt from registration under the Securities Act of 1933, which may subject them to legal or contractual restrictions on resale.
Forward currency contracts
The fund has entered into forward currency contracts as shown in the following table. The average notional amount of open forward currency contracts was $461,060,000 over the prior 12-month period.
| | | | | | | Contract amount | | Unrealized appreciation | |
| | | Settlement
date | | Counterparty | | Receive
(000) | | Deliver
(000) | | at 7/31/2015
(000) | |
| Sales: | | | | | | | | | | | | |
| Australian dollars | | 9/1/2015 | | JPMorgan Chase | | $121,117 | | A$163,200 | | | $2,059 | |
| Australian dollars | | 9/17/2015 | | HSBC Bank | | $28,636 | | A$39,000 | | | 207 | |
| Euros | | 8/6/2015 | | UBS AG | | $176,785 | | €157,600 | | | 3,688 | |
| | | | | | | | | | | | $5,954 | |
| | |
| The Income Fund of America | 17 |
Investments in affiliates
A company is an affiliate of the fund under the Investment Company Act of 1940 if the fund’s holdings in that company represent 5% or more of the outstanding voting shares. The value of the fund’s affiliated-company holdings is either shown in the summary investment portfolio or included in the value of “Other securities” under the respective industry sectors. Further details on such holdings and related transactions during the year ended July 31, 2015, appear below.
| | | Beginning
shares or
principal
amount | | | Additions | | | Reductions | | | Ending
shares or
principal
amount | | | Dividend
or interest
income
(000) | | | Value of
affiliates at
7/31/2015
(000) | |
| Iron Mountain Inc. | | | 12,457,211 | | | | 1,187,569 | | | | — | | | | 13,644,780 | | | $ | 71,432 | | | $ | 410,026 | |
| Iron Mountain Inc. 5.75% 2024 | | $ | 2,175,000 | | | $ | 2,150,000 | | | | — | | | $ | 4,325,000 | | | | 216 | | | | 4,374 | |
| Iron Mountain Inc. 6.00% 2023 | | $ | 950,000 | | | | — | | | | — | | | $ | 950,000 | | | | 57 | | | | 992 | |
| R.R. Donnelley & Sons Co. | | | 13,345,400 | | | | — | | | | — | | | | 13,345,400 | | | | 13,879 | | | | 234,212 | |
| R.R. Donnelley & Sons Co. 7.00% 2022 | | $ | 16,735,000 | | | $ | 2,500,000 | | | $ | 1,735,000 | | | $ | 17,500,000 | | | | 1,225 | | | | 18,878 | |
| R.R. Donnelley & Sons Co. 6.50% 2023 | | $ | 11,125,000 | | | $ | 3,500,000 | | | $ | 3,045,000 | | | $ | 11,580,000 | | | | 717 | | | | 12,000 | |
| R.R. Donnelley & Sons Co. 7.25% 2018 | | $ | 7,234,000 | | | | — | | | | — | | | $ | 7,234,000 | | | | 521 | | | | 7,948 | |
| R.R. Donnelley & Sons Co. 7.875% 2021 | | $ | 3,050,000 | | | | — | | | | — | | | $ | 3,050,000 | | | | 187 | | | | 3,458 | |
| TalkTalk Telecom Group PLC | | | 57,242,000 | | | | 1,071,942 | | | | — | | | | 58,313,942 | | | | 12,217 | | | | 274,473 | |
| Outfront Media Inc. | | | 7,800,000 | | | | 1,264,824 | | | | — | | | | 9,064,824 | | | | 48,078 | | | | 227,799 | |
| Outfront Media Inc. 5.625% 20242 | | | — | | | $ | 7,650,000 | | | | — | | | $ | 7,650,000 | | | | 128 | | | | 7,832 | |
| Diebold, Inc. | | | 3,925,000 | | | | — | | | | — | | | | 3,925,000 | | | | 4,514 | | | | 133,646 | |
| Baytex Energy Corp.7 | | | 5,106,281 | | | | 6,954,675 | | | | — | | | | 12,060,956 | | | | 10,542 | | | | 103,839 | |
| Baytex Energy Corp. 5.125% 20212 | | | — | | | $ | 10,050,000 | | | | — | | | $ | 10,050,000 | | | | 167 | | | | 8,995 | |
| Baytex Energy Corp. 5.625% 20242 | | | — | | | $ | 3,450,000 | | | | — | | | $ | 3,450,000 | | | | 43 | | | | 2,984 | |
| NII Holdings, Inc., Class B1 | | | — | | | | 8,870,538 | | | | 877,869 | | | | 7,992,669 | | | | — | | | | 114,295 | |
| Redwood Trust, Inc. | | | 2,479,888 | | | | 2,599,829 | | | | — | | | | 5,079,717 | | | | 4,406 | | | | 78,736 | |
| Rotech Healthcare Inc., Term Loan, 13.00% 20204,5,8,9,10 | | $ | 18,566,454 | | | $ | 2,177,366 | | | | — | | | $ | 20,743,820 | | | | 2,575 | | | | 20,640 | |
| Rotech Healthcare Inc., Term Loan A, 5.50% 20184,5,8,10 | | $ | 12,009,250 | | | | — | | | $ | 121,000 | | | $ | 11,888,250 | | | | 668 | | | | 11,829 | |
| Rotech Healthcare Inc., Term Loan B, 10.00% 20194,5,8,10 | | $ | 9,200,000 | | | | — | | | | — | | | $ | 9,200,000 | | | | 935 | | | | 9,154 | |
| Rotech Healthcare Inc.1,10 | | | 543,172 | | | | — | | | | — | | | | 543,172 | | | | — | | | | 5,839 | |
| Douglas Dynamics, Inc. | | | 1,444,000 | | | | — | | | | — | | | | 1,444,000 | | | | 1,271 | | | | 29,631 | |
| Cliffs Natural Resources Inc., Series A, 7.00% convertible preferred 2016 | | | 2,925,000 | | | | — | | | | — | | | | 2,925,000 | | | | 5,119 | | | | 7,400 | |
| Cliffs Natural Resources Inc. 8.25% 20202 | | | — | | | $ | 7,475,000 | | | | — | | | $ | 7,475,000 | | | | 138 | | | | 6,821 | |
| Cliffs Natural Resources Inc. 4.875% 2021 | | $ | 4,945,000 | | | | — | | | | — | | | $ | 4,945,000 | | | | 257 | | | | 1,385 | |
| Cliffs Natural Resources Inc. | | | 7,354,581 | | | | — | | | | 7,354,581 | | | | — | | | | 2,206 | | | | — | |
| Digital Realty Trust, Inc.11 | | | 8,346,000 | | | | — | | | | 1,231,000 | | | | 7,115,000 | | | | 25,630 | | | | — | |
| Healthscope Ltd.11 | | | 101,831,569 | | | | 91,231,023 | | | | 164,426,389 | | | | 28,636,203 | | | | 2,234 | | | | — | |
| MeadWestvaco Corp.11 | | | 11,281,000 | | | | — | | | | 11,281,000 | | | | — | | | | 7,158 | | | | — | |
| Northwest Bancshares, Inc.11 | | | 4,850,000 | | | | — | | | | 4,850,000 | | | | — | | | | 1,310 | | | | — | |
| TerraForm Power, Inc., Class A11 | | | — | | | | 3,190,000 | | | | — | | | | 3,190,000 | | | | — | | | | — | |
| Waste Management, Inc.11 | | | 27,982,868 | | | | — | | | | 5,829,515 | | | | 22,153,353 | | | | 38,151 | | | | — | |
| | | | | | | | | | | | | | | | | | | $ | 255,981 | | | $ | 1,737,186 | |
| 18 | The Income Fund of America |
The following footnotes apply to either the individual securities noted or one or more of the securities aggregated and listed as a single line item.
| 1 | Security did not produce income during the last 12 months. |
| 2 | Acquired in a transaction exempt from registration under Rule 144A or Section 4(2) of the Securities Act of 1933. May be resold in the U.S. in transactions exempt from registration, normally to qualified institutional buyers. The total value of all such securities, including those in “Other securities,” was $6,581,712,000, which represented 6.79% of the net assets of the fund. |
| 3 | Index-linked bond whose principal amount moves with a government price index. |
| 4 | Principal payments may be made periodically. Therefore, the effective maturity date may be earlier than the stated maturity date. |
| 5 | Coupon rate may change periodically. |
| 6 | Purchased on a TBA basis. |
| 7 | This security was an unaffiliated issuer in its initial period of acquisition at 7/31/2014; it was not publicly disclosed. |
| 8 | Loan participations and assignments; may be subject to legal or contractual restrictions on resale. The total value of all such loans, including those in “Other securities,” was $512,779,000, which represented .53% of the net assets of the fund. |
| 9 | Payment in kind; the issuer has the option of paying additional securities in lieu of cash. |
| 10 | Valued under fair value procedures adopted by authority of the board of trustees. The total value of all such securities, including those in “Other securities,” was $226,581,000, which represented .23% of the net assets of the fund. |
| 11 | Unaffiliated issuer at 7/31/2015. |
Key to abbreviations and symbols
ADR = American Depositary Receipts
TBA = To be announced
A$ = Australian dollars
€ = Euros
See Notes to Financial Statements
| The Income Fund of America | 19 |
Financial statements
Statement of assets and liabilities
at July 31, 2015 | | | (dollars in thousands) | |
| | | | | |
| Assets: | | | | | | | | |
| Investment securities, at value: | | | | | | | | |
| Unaffiliated issuers (cost: $80,954,482) | | $ | 95,299,916 | | | | | |
| Affiliated issuers (cost: $2,088,128) | | | 1,737,186 | | | $ | 97,037,102 | |
| Cash denominated in currencies other than U.S. dollars (cost: $535) | | | | | | | 535 | |
| Cash | | | | | | | 16,848 | |
| Unrealized appreciation on open forward currency contracts | | | | | | | 5,954 | |
| Receivables for: | | | | | | | | |
| Sales of investments | | | 1,602,147 | | | | | |
| Sales of fund’s shares | | | 86,623 | | | | | |
| Dividends and interest | | | 414,668 | | | | | |
| Other | | | 569 | | | | 2,104,007 | |
| | | | | | | | 99,164,446 | |
| Liabilities: | | | | | | | | |
| Payables for: | | | | | | | | |
| Purchases of investments | | | 2,028,882 | | | | | |
| Repurchases of fund’s shares | | | 71,005 | | | | | |
| Investment advisory services | | | 16,406 | | | | | |
| Services provided by related parties | | | 33,108 | | | | | |
| Trustees’ deferred compensation | | | 5,106 | | | | | |
| Other | | | 17,928 | | | | 2,172,435 | |
| Net assets at July 31, 2015 | | | | | | $ | 96,992,011 | |
| |
| Net assets consist of: | | | | | | | | |
| Capital paid in on shares of beneficial interest | | | | | | $ | 80,856,718 | |
| Undistributed net investment income | | | | | | | 492,116 | |
| Undistributed net realized gain | | | | | | | 1,657,959 | |
| Net unrealized appreciation | | | | | | | 13,985,218 | |
| Net assets at July 31, 2015 | | | | | | $ | 96,992,011 | |
(dollars and shares in thousands, except per-share amounts)
Shares of beneficial interest issued and outstanding (no stated par value) —
unlimited shares authorized (4,556,969 total shares outstanding)
| | | | | | Shares | | | Net asset value | |
| | | Net assets | | | outstanding | | | per share | |
| Class A | | $ | 72,952,319 | | | | 3,423,709 | | | $ | | 21.31 | |
| Class B | | | 300,941 | | | | 14,214 | | | | | 21.17 | |
| Class C | | | 6,390,218 | | | | 303,474 | | | | | 21.06 | |
| Class F-1 | | | 4,159,935 | | | | 195,667 | | | | | 21.26 | |
| Class F-2 | | | 4,042,419 | | | | 189,819 | | | | | 21.30 | |
| Class 529-A | | | 1,488,451 | | | | 69,985 | | | | | 21.27 | |
| Class 529-B | | | 19,594 | | | | 923 | | | | | 21.23 | |
| Class 529-C | | | 465,922 | | | | 21,996 | | | | | 21.18 | |
| Class 529-E | | | 64,305 | | | | 3,032 | | | | | 21.21 | |
| Class 529-F-1 | | | 57,754 | | | | 2,716 | | | | | 21.27 | |
| Class R-1 | | | 138,742 | | | | 6,551 | | | | | 21.18 | |
| Class R-2 | | | 598,629 | | | | 28,387 | | | | | 21.09 | |
| Class R-2E | | | 93 | | | | 4 | | | | | 21.29 | |
| Class R-3 | | | 1,275,306 | | | | 60,071 | | | | | 21.23 | |
| Class R-4 | | | 1,203,242 | | | | 56,559 | | | | | 21.27 | |
| Class R-5 | | | 658,092 | | | | 30,883 | | | | | 21.31 | |
| Class R-6 | | | 3,176,049 | | | | 148,979 | | | | | 21.32 | |
See Notes to Financial Statements
| 20 | The Income Fund of America |
Statement of operations
for the year ended July 31, 2015 | | (dollars in thousands) | |
| | | | | | | |
| Investment income: | | | | | | | | |
| Income: | | | | | | | | |
| Dividends (net of non-U.S. taxes of $35,813; also includes $248,147 from affiliates) | | $ | 2,715,399 | | | | | |
| Interest (includes $7,834 from affiliates) | | | 914,584 | | | $ | 3,629,983 | |
| Fees and expenses*: | | | | | | | | |
| Investment advisory services | | | 211,829 | | | | | |
| Distribution services | | | 284,287 | | | | | |
| Transfer agent services | | | 71,041 | | | | | |
| Administrative services | | | 19,015 | | | | | |
| Reports to shareholders | | | 2,773 | | | | | |
| Registration statement and prospectus | | | 2,375 | | | | | |
| Trustees’ compensation | | | 494 | | | | | |
| Auditing and legal | | | 262 | | | | | |
| Custodian | | | 3,039 | | | | | |
| Other | | | 2,141 | | | | 597,256 | |
| Net investment income | | | | | | | 3,032,727 | |
| | | | | | | | | |
| Net realized gain and unrealized depreciation: | | | | | | | | |
| Net realized gain on: | | | | | | | | |
| Investments (net of non-U.S. taxes of $321; also includes $14,561 net loss from affiliates) | | | 3,743,668 | | | | | |
| Forward currency contracts | | | 96,423 | | | | | |
| Currency transactions | | | 12,310 | | | | 3,852,401 | |
| Net unrealized (depreciation) appreciation on: | | | | | | | | |
| Investments (net of non-U.S. taxes of $14,610) | | | (4,117,274 | ) | | | | |
| Forward currency contracts | | | 2,687 | | | | | |
| Currency translations | | | (612 | ) | | | (4,115,199 | ) |
| Net realized gain and unrealized depreciation | | | | | | | (262,798 | ) |
| | | | | | | | | |
| Net increase in net assets resulting from operations | | | | | | $ | 2,769,929 | |
| * | Additional information related to class-specific fees and expenses is included in the Notes to Financial Statements. |
Statements of changes in net assets
(dollars in thousands)
| | | Year ended July 31 | |
| | | 2015 | | | 2014 | |
| | | | | | | |
| Operations: | | | | | | | | |
| Net investment income | | $ | 3,032,727 | | | $ | 3,274,444 | |
| Net realized gain | | | 3,852,401 | | | | 2,867,529 | |
| Net unrealized (depreciation) appreciation | | | (4,115,199 | ) | | | 4,433,412 | |
| Net increase in net assets resulting from operations | | | 2,769,929 | | | | 10,575,385 | |
| | | | | | | | | |
| Dividends paid to shareholders from net investment income | | | (3,456,253 | ) | | | (2,769,274 | ) |
| | | | | | | | | |
| Net capital share transactions | | | 3,840,273 | | | | 2,749,667 | |
| | | | | | | | | |
| Total increase in net assets | | | 3,153,949 | | | | 10,555,778 | |
| | | | | | | | | |
| Net assets: | | | | | | | | |
| Beginning of year | | | 93,838,062 | | | | 83,282,284 | |
| End of year (including undistributed net investment income: $492,116 and $904,906, respectively) | | $ | 96,992,011 | | | $ | 93,838,062 | |
See Notes to Financial Statements
| The Income Fund of America | 21 |
Notes to financial statements
1. Organization
The Income Fund of America (the “fund”) is registered under the Investment Company Act of 1940 as an open-end, diversified management investment company. The fund seeks current income while secondarily striving for capital growth.
The fund has 17 share classes consisting of five retail share classes (Classes A, B and C, as well as two F share classes, F-1 and F-2), five 529 college savings plan share classes (Classes 529-A, 529-B, 529-C, 529-E and 529-F-1) and seven retirement plan share classes (Classes R-1, R-2, R-2E, R-3, R-4, R-5 and R-6). The 529 college savings plan share classes can be used to save for college education. The retirement plan share classes are generally offered only through eligible employer-sponsored retirement plans. The fund’s share classes are described further in the following table:
| Share class | | Initial sales charge | | Contingent deferred sales charge upon
redemption | | Conversion feature | |
| Classes A and 529-A | | Up to 5.75% | | None (except 1% for certain redemptions within one year of purchase without an initial sales charge) | | None | |
| Classes B and 529-B* | | None | | Declines from 5% to 0% for redemptions within six years of purchase | | Classes B and 529-B convert to Classes A and 529-A, respectively, after eight years | |
| Class C | | None | | 1% for redemptions within one year of purchase | | Class C converts to Class F-1 after 10 years | |
| Class 529-C | | None | | 1% for redemptions within one year of purchase | | None | |
| Class 529-E | | None | | None | | None | |
| Classes F-1, F-2 and 529-F-1 | | None | | None | | None | |
| Classes R-1, R-2, R-2E, R-3, R-4, R-5 and R-6 | | None | | None | | None | |
*Class B and 529-B shares of the fund are not available for purchase.
On August 29, 2014, the fund made an additional retirement plan share class (Class R-2E) available for sale pursuant to an amendment to its registration statement filed with the U.S. Securities and Exchange Commission. Refer to the fund’s prospectus for more details.
Holders of all share classes have equal pro rata rights to the assets, dividends and liquidation proceeds of the fund. Each share class has identical voting rights, except for the exclusive right to vote on matters affecting only its class. Share classes have different fees and expenses (“class-specific fees and expenses”), primarily due to different arrangements for distribution, transfer agent and administrative services. Differences in class-specific fees and expenses will result in differences in net investment income and, therefore, the payment of different per-share dividends by each share class.
2. Significant accounting policies
The fund is an investment company that applies the accounting and reporting guidance issued in Topic 946 by the U.S. Financial Accounting Standards Board. The fund’s financial statements have been prepared to comply with U.S. generally accepted accounting principles (“U.S. GAAP”). These principles require the fund’s investment adviser to make estimates and assumptions that affect reported amounts and disclosures. Actual results could differ from those estimates. Subsequent events, if any, have been evaluated through the date of issuance in the preparation of the financial statements. The fund follows the significant accounting policies described in this section, as well as the valuation policies described in the next section on valuation.
Security transactions and related investment income — Security transactions are recorded by the fund as of the date the trades are executed with brokers. Realized gains and losses from security transactions are determined based on the specific identified cost of the securities. In the event a security is purchased with a delayed payment date, the fund will segregate liquid assets sufficient to meet its payment obligations. Dividend income is recognized on the ex-dividend date and interest income is recognized on an accrual basis. Market discounts, premiums and original issue discounts on fixed-income securities are amortized daily over the expected life of the security.
| 22 | The Income Fund of America |
Class allocations — Income, fees and expenses (other than class-specific fees and expenses) and realized and unrealized gains and losses are allocated daily among the various share classes based on their relative net assets. Class-specific fees and expenses, such as distribution, transfer agent and administrative services, are charged directly to the respective share class.
Dividends and distributions to shareholders — Dividends and distributions to shareholders are recorded on the ex-dividend date.
Currency translation — Assets and liabilities, including investment securities, denominated in currencies other than U.S. dollars are translated into U.S. dollars at the exchange rates supplied by one or more pricing vendors on the valuation date. Purchases and sales of investment securities and income and expenses are translated into U.S. dollars at the exchange rates on the dates of such transactions. The effects of changes in exchange rates on investment securities are included with the net realized gain or loss and net unrealized appreciation or depreciation on investments in the fund’s statement of operations. The realized gain or loss and unrealized appreciation or depreciation resulting from all other transactions denominated in currencies other than U.S. dollars are disclosed separately.
3. Valuation
Capital Research and Management Company (“CRMC”), the fund’s investment adviser, values the fund’s investments at fair value as defined by U.S. GAAP. The net asset value of each share class of the fund is generally determined as of approximately 4:00 p.m. New York time each day the New York Stock Exchange is open.
Methods and inputs — The fund’s investment adviser uses the following methods and inputs to establish the fair value of the fund’s assets and liabilities. Use of particular methods and inputs may vary over time based on availability and relevance as market and economic conditions evolve.
Equity securities are generally valued at the official closing price of, or the last reported sale price on, the exchange or market on which such securities are traded, as of the close of business on the day the securities are being valued or, lacking any sales, at the last available bid price. Prices for each security are taken from the principal exchange or market on which the security trades.
Fixed-income securities, including short-term securities, are generally valued at prices obtained from one or more pricing vendors. Vendors value such securities based on one or more of the inputs described in the following table. The table provides examples of inputs that are commonly relevant for valuing particular classes of fixed-income securities in which the fund is authorized to invest. However, these classifications are not exclusive, and any of the inputs may be used to value any other class of fixed-income security.
| Fixed-income class | | Examples of standard inputs |
| All | | Benchmark yields, transactions, bids, offers, quotations from dealers and trading systems, new issues, spreads and other relationships observed in the markets among comparable securities; and proprietary pricing models such as yield measures calculated using factors such as cash flows, financial or collateral performance and other reference data (collectively referred to as “standard inputs”) |
| Corporate bonds & notes; convertible securities | | Standard inputs and underlying equity of the issuer |
| Bonds & notes of governments & government agencies | | Standard inputs and interest rate volatilities |
| Mortgage-backed; asset-backed obligations | | Standard inputs and cash flows, prepayment information, default rates, delinquency and loss assumptions, collateral characteristics, credit enhancements and specific deal information |
| Municipal securities | | Standard inputs and, for certain distressed securities, cash flows or liquidation values using a net present value calculation based on inputs that include, but are not limited to, financial statements and debt contracts |
When the fund’s investment adviser deems it appropriate to do so (such as when vendor prices are unavailable or deemed to be not representative), fixed-income securities will be valued in good faith at the mean quoted bid and ask prices that are reasonably and timely available (or bid prices, if ask prices are not available) or at prices for securities of comparable maturity, quality and type.
Securities with both fixed-income and equity characteristics, or equity securities traded principally among fixed-income dealers, are generally valued in the manner described for either equity or fixed-income securities, depending on which method is deemed most appropriate by the fund’s investment adviser. Forward currency contracts are valued at the mean of representative quoted bid and ask prices, generally based on prices supplied by one or more pricing vendors.
| The Income Fund of America | 23 |
Securities and other assets for which representative market quotations are not readily available or are considered unreliable by the fund’s investment adviser are fair valued as determined in good faith under fair valuation guidelines adopted by authority of the fund’s board of trustees as further described. The investment adviser follows fair valuation guidelines, consistent with U.S. Securities and Exchange Commission rules and guidance, to consider relevant principles and factors when making fair value determinations. The investment adviser considers relevant indications of value that are reasonably and timely available to it in determining the fair value to be assigned to a particular security, such as the type and cost of the security; contractual or legal restrictions on resale of the security; relevant financial or business developments of the issuer; actively traded similar or related securities; conversion or exchange rights on the security; related corporate actions; significant events occurring after the close of trading in the security; and changes in overall market conditions. In addition, the closing prices of equity securities that trade in markets outside U.S. time zones may be adjusted to reflect significant events that occur after the close of local trading but before the net asset value of each share class of the fund is determined. Fair valuations and valuations of investments that are not actively trading involve judgment and may differ materially from valuations that would have been used had greater market activity occurred.
Processes and structure — The fund’s board of trustees has delegated authority to the fund’s investment adviser to make fair value determinations, subject to board oversight. The investment adviser has established a Joint Fair Valuation Committee (the “Fair Valuation Committee”) to administer, implement and oversee the fair valuation process, and to make fair value decisions. The Fair Valuation Committee regularly reviews its own fair value decisions, as well as decisions made under its standing instructions to the investment adviser’s valuation teams. The Fair Valuation Committee reviews changes in fair value measurements from period to period and may, as deemed appropriate, update the fair valuation guidelines to better reflect the results of back testing and address new or evolving issues. The Fair Valuation Committee reports any changes to the fair valuation guidelines to the board of trustees with supplemental information to support the changes. The fund’s board and audit committee also regularly review reports that describe fair value determinations and methods.
The fund’s investment adviser has also established a Fixed-Income Pricing Review Group to administer and oversee the fixed-income valuation process, including the use of fixed-income pricing vendors. This group regularly reviews pricing vendor information and market data. Pricing decisions, processes and controls over security valuation are also subject to additional internal reviews, including an annual control self-evaluation program facilitated by the investment adviser’s compliance group.
Classifications — The fund’s investment adviser classifies the fund’s assets and liabilities into three levels based on the inputs used to value the assets or liabilities. Level 1 values are based on quoted prices in active markets for identical securities. Level 2 values are based on significant observable market inputs, such as quoted prices for similar securities and quoted prices in inactive markets. Certain securities trading outside the U.S. may transfer between Level 1 and Level 2 due to valuation adjustments resulting from significant market movements following the close of local trading. Level 3 values are based on significant unobservable inputs that reflect the investment adviser’s determination of assumptions that market participants might reasonably use in valuing the securities. The valuation levels are
| 24 | The Income Fund of America |
not necessarily an indication of the risk or liquidity associated with the underlying investment. For example, U.S. government securities are reflected as Level 2 because the inputs used to determine fair value may not always be quoted prices in an active market. The following tables present the fund’s valuation levels as of July 31, 2015 (dollars in thousands):
| | | Investment securities | |
| | | Level 1* | | | Level 2 | | | Level 3 | | | Total | |
| Assets: | | | | | | | | | | | | | | | | |
| Common stocks: | | | | | | | | | | | | | | | | |
| Industrials | | $ | 10,129,479 | | | $ | 26,069 | | | $ | 2 | | | $ | 10,155,550 | |
| Health care | | | 9,544,600 | | | | — | | | | 5,839 | | | | 9,550,439 | |
| Financials | | | 9,347,623 | | | | — | | | | — | | | | 9,347,623 | |
| Information technology | | | 7,953,667 | | | | — | | | | — | | | | 7,953,667 | |
| Consumer staples | | | 6,687,188 | | | | — | | | | — | | | | 6,687,188 | |
| Energy | | | 4,837,079 | | | | — | | | | — | | | | 4,837,079 | |
| Consumer discretionary | | | 4,707,726 | | | | — | | | | 47 | | | | 4,707,773 | |
| Materials | | | 4,189,915 | | | | — | | | | — | | | | 4,189,915 | |
| Telecommunication services | | | 3,866,289 | | | | — | | | | — | | | | 3,866,289 | |
| Utilities | | | 3,722,223 | | | | — | | | | — | | | | 3,722,223 | |
| Miscellaneous | | | 4,123,890 | | | | — | | | | — | | | | 4,123,890 | |
| Preferred securities | | | 462,571 | | | | — | | | | — | | | | 462,571 | |
| Convertible stocks | | | 636,378 | | | | 40,026 | | | | — | | | | 676,404 | |
| Convertible bonds | | | — | | | | 624,891 | | | | — | | | | 624,891 | |
| Bonds, notes & other debt instruments: | | | | | | | | | | | | | | | | |
| Corporate bonds & notes | | | — | | | | 13,206,290 | | | | 127,675 | | | | 13,333,965 | |
| U.S. Treasury bonds & notes | | | — | | | | 3,416,736 | | | | — | | | | 3,416,736 | |
| Mortgage-backed obligations | | | — | | | | 1,814,902 | | | | — | | | | 1,814,902 | |
| Federal agency bonds & notes | | | — | | | | 335,215 | | | | — | | | | 335,215 | |
| Other | | | — | | | | 466,872 | | | | — | | | | 466,872 | |
| Short-term securities | | | — | | | | 6,763,910 | | | | — | | | | 6,763,910 | |
| Total | | $ | 70,208,628 | | | $ | 26,694,911 | | | $ | 133,563 | | | $ | 97,037,102 | |
| | | Other investments† | |
| | | Level 1 | | | Level 2 | | | Level 3 | | | Total | |
| Assets: | | | | | | | | | | | | | | | | |
| Unrealized appreciation on open forward currency contracts | | $ | — | | | $ | 5,954 | | | $ | — | | | $ | 5,954 | |
| * | Securities with a value of $14,231,919,000, which represented 14.67% of the net assets of the fund, transferred from Level 2 to Level 1 since the prior fiscal year-end, primarily due to a lack of significant market movements following the close of local trading. |
| † | Forward currency contracts are not included in the investment portfolio. |
4. Risk factors
Investing in the fund may involve certain risks including, but not limited to, those described below.
Market conditions — The prices of, and the income generated by, the common stocks and other securities held by the fund may decline – sometimes rapidly or unpredictably – due to various factors, including events or conditions affecting the general economy or particular industries; overall market changes; local, regional or global political, social or economic instability; governmental or governmental agency responses to economic conditions; and currency exchange rate, interest rate and commodity price fluctuations.
Issuer risks — The prices of, and the income generated by, securities held by the fund may decline in response to various factors directly related to the issuers of such securities, including reduced demand for an issuer’s goods or services, poor management performance and strategic initiatives such as mergers, acquisitions or dispositions and the market response to any such initiatives.
Investing in income-oriented stocks — Income provided by the fund may be reduced by changes in the dividend policies of, and the capital resources available for dividend payments at, the companies in which the fund invests.
Investing in debt instruments — The prices of, and the income generated by, bonds and other debt securities held by the fund may be affected by changing interest rates and by changes in the effective maturities and credit ratings of these securities.
| The Income Fund of America | 25 |
Rising interest rates will generally cause the prices of bonds and other debt securities to fall. Falling interest rates may cause an issuer to redeem, call or refinance a debt security before its stated maturity, which may result in the fund having to reinvest the proceeds in lower yielding securities. Longer maturity debt securities generally have greater sensitivity to changes in interest rates and may be subject to greater price fluctuations than shorter maturity debt securities.
Bonds and other debt securities are also subject to credit risk, which is the possibility that the credit strength of an issuer will weaken and/or an issuer of a debt security will fail to make timely payments of principal or interest and the security will go into default. Lower quality debt securities generally have higher rates of interest and may be subject to greater price fluctuations than higher quality debt securities. Credit risk is gauged, in part, by the credit ratings of the debt securities in which the fund invests. However, ratings are only the opinions of the rating agencies issuing them and are not guarantees as to credit quality or an evaluation of market risk. The fund’s investment adviser relies on its own credit analysts to research issuers and issues in seeking to mitigate various credit and default risks.
Investing in lower rated debt instruments — Lower rated bonds and other lower rated debt securities generally have higher rates of interest and involve greater risk of default or price declines due to changes in the issuer’s creditworthiness than those of higher quality debt securities. The market prices of these securities may fluctuate more than the prices of higher quality debt securities and may decline significantly in periods of general economic difficulty. These risks may be increased with respect to investments in junk bonds.
Investing outside the U.S. — Securities of issuers domiciled outside the U.S., or with significant operations or revenues outside the U.S., may lose value because of adverse political, social, economic or market developments (including social instability, regional conflicts, terrorism and war) in the countries or regions in which the issuers operate or generate revenue. These securities may also lose value due to changes in foreign currency exchange rates against the U.S. dollar and/or currencies of other countries. Issuers of these securities may be more susceptible to actions of foreign governments, such as the imposition of price controls or punitive taxes, that could adversely impact revenues. Securities markets in certain countries may be more volatile and/or less liquid than those in the U.S. Investments outside the U.S. may also be subject to different accounting practices and different regulatory, legal and reporting standards and practices, and may be more difficult to value, than those in the U.S. In addition, the value of investments outside the U.S. may be reduced by foreign taxes, including foreign withholding taxes on interest and dividends. Further, there may be increased risks of delayed settlement of securities purchased or sold by the fund. The risks of investing outside the U.S. may be heightened in connection with investments in emerging markets.
Management — The investment adviser to the fund actively manages the fund’s investments. Consequently, the fund is subject to the risk that the methods and analyses employed by the investment adviser in this process may not produce the desired results. This could cause the fund to lose value or its investment results to lag relevant benchmarks or other funds with similar objectives.
5. Certain investment techniques
Mortgage dollar rolls — The fund has entered into mortgage dollar roll transactions in which the fund sells a mortgage-backed security to a counterparty and simultaneously enters into an agreement with the same counterparty to buy back a similar security on a specific future date at a predetermined price. Mortgage dollar rolls are accounted for as purchase and sale transactions, which may increase the fund’s portfolio turnover rate.
Loan transactions — The fund has entered into loan transactions in which the fund acquires a loan either through an agent, by assignment from another holder, or as a participation interest in another holder’s portion of a loan. The loan is often administered by a financial institution that acts as agent for the holders of the loan, and the fund may be required to receive approval from the agent and/or borrower prior to the sale of the investment. The loan’s interest rate and maturity date may change based on the terms of the loan, including potential early payments of principal.
Unfunded commitments — The fund has participated in transactions that involve unfunded commitments, which may obligate the fund to lend additional sums based upon the terms of the loan agreement. As of July 31, 2015, the fund’s maximum exposure of unfunded loan commitments was $82,604,000, which would represent .09% of the net assets of the fund should such commitments become due. Unrealized appreciation of $639,000 is included in net unrealized depreciation on investments in the statement of operations.
Forward currency contracts — The fund has entered into forward currency contracts, which represent agreements to exchange currencies on specific future dates at predetermined rates. The fund’s investment adviser uses forward currency contracts to manage the fund’s exposure to changes in exchange rates. Upon entering into these contracts, risks may arise from the potential inability of counterparties to meet the terms of their contracts and from possible movements in exchange rates.
| 26 | The Income Fund of America |
On a daily basis, the fund’s investment adviser values forward currency contracts and records unrealized appreciation or depreciation for open forward currency contracts in the fund’s statement of assets and liabilities. Realized gains or losses are recorded at the time the forward currency contract is closed or offset by another contract with the same broker for the same settlement date and currency.
Closed forward currency contracts that have not reached their settlement date are included in the respective receivables or payables for closed forward currency contracts in the fund’s statement of assets and liabilities. Net realized gains or losses from closed forward currency contracts and net unrealized appreciation or depreciation from open forward currency contracts are recorded in the fund’s statement of operations.
The following tables present the financial statement impacts resulting from the fund’s use of forward currency contracts as of, or for the year ended, July 31, 2015 (dollars in thousands):
| | | | | Assets | | Liabilities | |
| Contract | | Risk type | | Location on statement of
assets and liabilities | | Value | | Location on statement of
assets and liabilities | | Value | |
| Forward currency | | Currency | | Unrealized appreciation on open forward currency contracts | | $ | 5,954 | | Unrealized depreciation on open forward currency contracts | | $ | — | |
| | | | | Net realized gain | | Net unrealized appreciation | |
| Contract | | Risk type | | Location on statement of
operations | | Value | | Location on statement of
operations | | Value | |
| Forward currency | | Currency | | Net realized gain on forward currency contracts | | $ | 96,423 | | Net unrealized appreciation on forward currency contracts | | $ | 2,687 | |
Collateral — The fund participates in a collateral program due to its use of forward currency contracts. The program calls for the fund to either receive or pledge collateral based on the net gain or loss on unsettled forward currency contracts by counterparty. The purpose of the collateral is to cover potential losses that could occur in the event that either party cannot meet its contractual obligations.
Rights of offset — The fund has entered into enforceable master netting agreements with certain counterparties for forward currency contracts, where on any date amounts payable by each party to the other (in the same currency with respect to the same transaction) may be closed or offset by each party’s payment obligation. If an early termination date occurs under these agreements following an event of default or termination event, all obligations of each party to its counterparty are settled net through a single payment in a single currency (“close-out netting”). For financial reporting purposes, the fund does not offset financial assets and financial liabilities that are subject to these master netting arrangements in the statement of assets and liabilities.
The following table presents the fund’s forward currency contracts by counterparty that are subject to master netting agreements but that are not offset in the fund’s statement of assets and liabilities. The net amount column shows the impact of offsetting on the fund’s statement of assets and liabilities as of July 31, 2015 (dollars in thousands) if close-out netting was exercised:
| | | | | | Gross amounts not offset in the | | | | |
| | | Gross amounts | | statement of assets and liabilities and | | | | |
| | | recognized in the | | subject to a master netting agreement | | | | |
| Counterparty | | statement of assets
and liabilities | | Available
to offset | | Non-cash
collateral | * | | Cash
collateral | | Net
amount | |
| Assets: | | | | | | | | | | | | | | | | | | | | | | |
| HSBC Bank | | | $ | 207 | | | $ | — | | | $ | (207 | ) | | | $ | — | | | $ | — | |
| JPMorgan Chase | | | | 2,059 | | | | — | | | | (2,059 | ) | | | | — | | | | — | |
| UBS AG | | | | 3,688 | | | | — | | | | (3,688 | ) | | | | — | | | | — | |
| Total | | | $ | 5,954 | | | $ | — | | | $ | (5,954 | ) | | | $ | — | | | $ | — | |
*Non-cash collateral is shown on a settlement basis.
6. Taxation and distributions
Federal income taxation — The fund complies with the requirements under Subchapter M of the Internal Revenue Code applicable to mutual funds and intends to distribute substantially all of its net taxable income and net capital gains each year. The fund is not subject to income taxes to the extent such distributions are made. Therefore, no federal income tax provision is required.
| The Income Fund of America | 27 |
As of and during the period ended July 31, 2015, the fund did not have a liability for any unrecognized tax benefits. The fund recognizes interest and penalties, if any, related to unrecognized tax benefits as income tax expense in the statement of operations. During the period, the fund did not incur any interest or penalties.
The fund is not subject to examination by U.S. federal tax authorities for tax years before 2011 and by state tax authorities for tax years before 2010.
Non-U.S. taxation — Dividend and interest income are recorded net of non-U.S. taxes paid. Gains realized by the fund on the sale of securities in certain countries are subject to non-U.S. taxes. The fund records a liability based on unrealized gains to provide for potential non-U.S. taxes payable upon the sale of these securities.
Distributions — Distributions paid to shareholders are based on net investment income and net realized gains determined on a tax basis, which may differ from net investment income and net realized gains for financial reporting purposes. These differences are due primarily to different treatment for items such as currency gains and losses; short-term capital gains and losses; capital losses related to sales of certain securities within 30 days of purchase; cost of investments sold; paydowns on fixed-income securities; and net capital losses. The fiscal year in which amounts are distributed may differ from the year in which the net investment income and net realized gains are recorded by the fund for financial reporting purposes. The fund may also designate a portion of the amount paid to redeeming shareholders as a distribution for tax purposes.
During the year ended July 31, 2015, the fund reclassified $10,782,000 and $56,768,000 from undistributed net realized gain to undistributed net investment income and capital paid in on shares of beneficial interest, respectively, and $46,000 from undistributed net investment income to capital paid in on shares of beneficial interest to align financial reporting with tax reporting.
As of July 31, 2015, the tax-basis components of distributable earnings, unrealized appreciation (depreciation) and cost of investment securities were as follows (dollars in thousands):
| Undistributed ordinary income | | $ | 501,041 | |
| Undistributed long-term capital gains | | | 1,677,798 | |
| Gross unrealized appreciation on investment securities | | | 17,039,391 | |
| Gross unrealized depreciation on investment securities | | | (3,071,097 | ) |
| Net unrealized appreciation on investment securities | | | 13,968,294 | |
| Cost of investment securities | | | 83,068,808 | |
Tax-basis distributions paid to shareholders from ordinary income were as follows (dollars in thousands):
| | | Year ended July 31 | |
| Share class | | 2015 | | | 2014 | |
| Class A | | $ | 2,652,016 | | | $ | 2,166,322 | |
| Class B | | | 12,848 | | | | 17,038 | |
| Class C | | | 188,824 | | | | 157,610 | |
| Class F-1 | | | 140,923 | | | | 128,654 | |
| Class F-2 | | | 142,230 | | | | 60,710 | |
| Class 529-A | | | 53,022 | | | | 42,937 | |
| Class 529-B | | | 730 | | | | 894 | |
| Class 529-C | | | 13,212 | | | | 10,460 | |
| Class 529-E | | | 2,176 | | | | 1,762 | |
| Class 529-F-1 | | | 2,101 | | | | 1,617 | |
| Class R-1 | | | 3,933 | | | | 3,039 | |
| Class R-2 | | | 18,272 | | | | 15,075 | |
| Class R-2E* | | | 1 | | | | | |
| Class R-3 | | | 44,001 | | | | 37,748 | |
| Class R-4 | | | 43,909 | | | | 35,012 | |
| Class R-5 | | | 24,087 | | | | 18,810 | |
| Class R-6 | | | 113,968 | | | | 71,586 | |
| Total | | $ | 3,456,253 | | | $ | 2,769,274 | |
*Class R-2E shares were offered beginning August 29, 2014.
| 28 | The Income Fund of America |
7. Fees and transactions with related parties
CRMC, the fund’s investment adviser, is the parent company of American Funds Distributors,® Inc. (“AFD”), the principal underwriter of the fund’s shares, and American Funds Service Company® (“AFS”), the fund’s transfer agent. CRMC, AFD and AFS are considered related parties to the fund.
Investment advisory services — The fund has an investment advisory and service agreement with CRMC that provides for monthly fees accrued daily. These fees are based on a series of decreasing annual rates beginning with 0.250% on the first $500 million of daily net assets and decreasing to 0.123% on such assets in excess of $89 billion. The agreement also provides for monthly fees, accrued daily, of 2.25% of the fund’s monthly gross income. For the year ended July 31, 2015, the investment advisory services fee was $211,829,000, which was equivalent to an annualized rate of 0.218% of average daily net assets.
Class-specific fees and expenses — Expenses that are specific to individual share classes are accrued directly to the respective share class. The principal class-specific fees and expenses are further described below:
Distribution services — The fund has plans of distribution for all share classes, except Class F-2, R-5 and R-6 shares. Under the plans, the board of trustees approves certain categories of expenses that are used to finance activities primarily intended to sell fund shares and service existing accounts. The plans provide for payments, based on an annualized percentage of average daily net assets, ranging from 0.25% to 1.00% as noted in this section. In some cases, the board of trustees has limited the amounts that may be paid to less than the maximum allowed by the plans. All share classes with a plan may use up to 0.25% of average daily net assets to pay service fees, or to compensate AFD for paying service fees, to firms that have entered into agreements with AFD to provide certain shareholder services. The remaining amounts available to be paid under each plan are paid to dealers to compensate them for their sales activities.
For Class A and 529-A shares, distribution-related expenses include the reimbursement of dealer and wholesaler commissions paid by AFD for certain shares sold without a sales charge. These share classes reimburse AFD for amounts billed within the prior 15 months but only to the extent that the overall annual expense limit of 0.25% is not exceeded. As of July 31, 2015, there were no unreimbursed expenses subject to reimbursement for Class A or 529-A shares.
| Share class | | Currently approved limits | | Plan limits |
| Class A | | | 0.25 | % | | | 0.25 | % |
| Class 529-A | | | 0.25 | | | | 0.50 | |
| Classes B and 529-B | | | 1.00 | | | | 1.00 | |
| Classes C, 529-C and R-1 | | | 1.00 | | | | 1.00 | |
| Class R-2 | | | 0.75 | | | | 1.00 | |
| Class R-2E | | | 0.60 | | | | 0.85 | |
| Classes 529-E and R-3 | | | 0.50 | | | | 0.75 | |
| Classes F-1, 529-F-1 and R-4 | | | 0.25 | | | | 0.50 | |
Transfer agent services — The fund has a shareholder services agreement with AFS under which the fund compensates AFS for providing transfer agent services to each of the fund’s share classes. These services include recordkeeping, shareholder communications and transaction processing. In addition, the fund reimburses AFS for amounts paid to third parties for performing transfer agent services on behalf of fund shareholders.
Administrative services — The fund has an administrative services agreement with CRMC under which the fund compensates CRMC for providing administrative services to Class A, C, F, 529 and R shares. These services include, but are not limited to, coordinating, monitoring, assisting and overseeing third parties that provide services to fund shareholders. Under the agreement, Class A shares pay an annual fee of 0.01% and Class C, F, 529 and R shares pay an annual fee of 0.05% of their respective average daily net assets.
529 plan services — Each 529 share class is subject to service fees to compensate the Virginia College Savings Plan (“Virginia529”) for its oversight and administration of the 529 college savings plan. The quarterly fee is based on a series of decreasing annual rates beginning with 0.10% on the first $30 billion of the net assets invested in Class 529 shares of the American Funds and decreasing to 0.05% on such assets in excess of $70 billion. The fee for any given calendar quarter is accrued and calculated on the basis of the average net assets of Class 529 shares of the American Funds for the last month of the prior calendar quarter. The fee is included in other expenses in the fund’s statement of operations. Virginia529 is not considered a related party to the fund.
| The Income Fund of America | 29 |
For the year ended July 31, 2015, class-specific expenses under the agreements were as follows (dollars in thousands):
| | | | Distribution | | Transfer agent | | Administrative | | 529 plan |
| | Share class | | services | | services | | services | | services |
| | Class A | | | $179,323 | | | | $51,394 | | | | $7,328 | | | Not applicable |
| | Class B | | | 4,527 | | | | 343 | | | | Not applicable | | | Not applicable |
| | Class C | | | 65,887 | | | | 4,645 | | | | 3,299 | | | Not applicable |
| | Class F-1 | | | 9,944 | | | | 4,288 | | | | 1,990 | | | Not applicable |
| | Class F-2 | | | Not applicable | | | | 3,855 | | | | 1,865 | | | Not applicable |
| | Class 529-A | | | 3,423 | | | | 808 | | | | 752 | | | $1,334 |
| | Class 529-B | | | 269 | | | | 19 | | | | 14 | | | 24 |
| | Class 529-C | | | 4,736 | | | | 280 | | | | 238 | | | 423 |
| | Class 529-E | | | 329 | | | | 18 | | | | 33 | | | 58 |
| | Class 529-F-1 | | | — | | | | 30 | | | | 28 | | | 50 |
| | Class R-1 | | | 1,383 | | | | 125 | | | | 69 | | | Not applicable |
| | Class R-2 | | | 4,706 | | | | 1,921 | | | | 317 | | | Not applicable |
| | Class R-2E* | | | — | † | | | — | † | | | — | † | | Not applicable |
| | Class R-3 | | | 6,687 | | | | 1,878 | | | | 672 | | | Not applicable |
| | Class R-4 | | | 3,073 | | | | 1,137 | | | | 616 | | | Not applicable |
| | Class R-5 | | | Not applicable | | | | 288 | | | | 319 | | | Not applicable |
| | Class R-6 | | | Not applicable | | | | 12 | | | | 1,475 | | | Not applicable |
| | Total class-specific expenses | | | $284,287 | | | | $71,041 | | | | $19,015 | | | $1,889 |
| * | Class R-2E shares were offered beginning August 29, 2014. |
| † | Amount less than one thousand. |
Trustees’ deferred compensation — Trustees who are unaffiliated with CRMC may elect to defer the cash payment of part or all of their compensation. These deferred amounts, which remain as liabilities of the fund, are treated as if invested in shares of the fund or other American Funds. These amounts represent general, unsecured liabilities of the fund and vary according to the total returns of the selected funds. Trustees’ compensation of $494,000 in the fund’s statement of operations includes $348,000 in current fees (either paid in cash or deferred) and a net increase of $146,000 in the value of the deferred amounts.
Affiliated officers and trustees — Officers and certain trustees of the fund are or may be considered to be affiliated with CRMC, AFD and AFS. No affiliated officers or trustees received any compensation directly from the fund.
8. Capital share transactions
Capital share transactions in the fund were as follows (dollars and shares in thousands):
| | | | | | | | | Reinvestments of | | | | | | | | | Net increase | |
| | | Sales1 | | | dividends | | | Repurchases1 | | | (decrease) | |
| Share class | | Amount | | | Shares | | | Amount | | | Shares | | | Amount | | | Shares | | | Amount | | | Shares | |
| | | | | | | | | | | | | | | | | | | | | | | | | | |
| Year ended July 31, 2015 | | | | | | | | | | | | | | | | | | | | | | | | | |
| | | | | | | | | | | | | | | | | | | | | | | | | | |
| Class A | | $ | 6,799,575 | | | | 313,392 | | | $ | 2,564,923 | | | | 118,409 | | | $ | (7,191,840 | ) | | | (331,631 | ) | | $ | 2,172,658 | | | | 100,170 | |
| Class B | | | 6,142 | | | | 286 | | | | 12,632 | | | | 586 | | | | (319,960 | ) | | | (14,873 | ) | | | (301,186 | ) | | | (14,001 | ) |
| Class C | | | 1,134,135 | | | | 52,855 | | | | 180,877 | | | | 8,438 | | | | (1,476,126 | ) | | | (68,920 | ) | | | (161,114 | ) | | | (7,627 | ) |
| Class F-1 | | | 1,142,485 | | | | 52,837 | | | | 134,607 | | | | 6,228 | | | | (928,887 | ) | | | (42,846 | ) | | | 348,205 | | | | 16,219 | |
| Class F-2 | | | 1,557,560 | | | | 71,770 | | | | 131,617 | | | | 6,083 | | | | (580,458 | ) | | | (26,780 | ) | | | 1,108,719 | | | | 51,073 | |
| Class 529-A | | | 181,865 | | | | 8,403 | | | | 53,006 | | | | 2,452 | | | | (198,921 | ) | | | (9,201 | ) | | | 35,950 | | | | 1,654 | |
| Class 529-B | | | 915 | | | | 42 | | | | 729 | | | | 34 | | | | (16,095 | ) | | | (746 | ) | | | (14,451 | ) | | | (670 | ) |
| Class 529-C | | | 61,911 | | | | 2,870 | | | | 13,208 | | | | 612 | | | | (75,581 | ) | | | (3,512 | ) | | | (462 | ) | | | (30 | ) |
| Class 529-E | | | 8,791 | | | | 407 | | | | 2,176 | | | | 101 | | | | (10,867 | ) | | | (504 | ) | | | 100 | | | | 4 | |
| Class 529-F-1 | | | 13,159 | | | | 608 | | | | 2,099 | | | | 97 | | | | (9,349 | ) | | | (432 | ) | | | 5,909 | | | | 273 | |
| Class R-1 | | | 31,622 | | | | 1,464 | | | | 3,913 | | | | 181 | | | | (28,794 | ) | | | (1,338 | ) | | | 6,741 | | | | 307 | |
| Class R-2 | | | 126,784 | | | | 5,904 | | | | 18,246 | | | | 850 | | | | (177,349 | ) | | | (8,260 | ) | | | (32,319 | ) | | | (1,506 | ) |
| Class R-2E2 | | | 94 | | | | 4 | | | | 1 | | | | — | 3 | | | — | 3 | | | — | 3 | | | 95 | | | | 4 | |
| Class R-3 | | | 248,510 | | | | 11,496 | | | | 43,878 | | | | 2,032 | | | | (365,620 | ) | | | (16,941 | ) | | | (73,232 | ) | | | (3,413 | ) |
| Class R-4 | | | 306,349 | | | | 14,154 | | | | 43,888 | | | | 2,029 | | | | (330,284 | ) | | | (15,265 | ) | | | 19,953 | | | | 918 | |
| Class R-5 | | | 195,218 | | | | 8,999 | | | | 24,077 | | | | 1,112 | | | | (123,241 | ) | | | (5,683 | ) | | | 96,054 | | | | 4,428 | |
| Class R-6 | | | 1,252,456 | | | | 57,974 | | | | 113,878 | | | | 5,257 | | | | (737,681 | ) | | | (33,850 | ) | | | 628,653 | | | | 29,381 | |
| Total net increase (decrease) | | $ | 13,067,571 | | | | 603,465 | | | $ | 3,343,755 | | | | 154,501 | | | $ | (12,571,053 | ) | | | (580,782 | ) | | $ | 3,840,273 | | | | 177,184 | |
| 30 | The Income Fund of America |
| | | | | | | | | Reinvestments of | | | | | | | | | Net increase | |
| | | Sales1 | | | dividends | | | Repurchases1 | | | (decrease) | |
| Share class | | Amount | | | Shares | | | Amount | | | Shares | | | Amount | | | Shares | | | Amount | | | Shares | |
| | | | | | | | | | | | | | | | | | | | | | | | | |
| Year ended July 31, 2014 | | | | | | | | | | | | | | | | | | | | | | | | | | | | |
| | | | | | | | | | | | | | | | | | | | | | | | | | | | | |
| Class A | | $ | 6,420,156 | | | | 311,526 | | | $ | 2,090,820 | | | | 102,005 | | | $ | (7,163,661 | ) | | | (347,576 | ) | | $ | 1,347,315 | | | | 65,955 | |
| Class B | | | 15,848 | | | | 780 | | | | 16,702 | | | | 824 | | | | (312,935 | ) | | | (15,329 | ) | | | (280,385 | ) | | | (13,725 | ) |
| Class C | | | 1,051,634 | | | | 51,585 | | | | 150,122 | | | | 7,408 | | | | (1,565,367 | ) | | | (76,875 | ) | | | (363,611 | ) | | | (17,882 | ) |
| Class F-1 | | | 1,447,794 | | | | 70,525 | | | | 124,418 | | | | 6,078 | | | | (1,659,394 | ) | | | (78,512 | ) | | | (87,182 | ) | | | (1,909 | ) |
| Class F-2 | | | 1,663,283 | | | | 78,324 | | | | 53,497 | | | | 2,597 | | | | (314,086 | ) | | | (15,206 | ) | | | 1,402,694 | | | | 65,715 | |
| Class 529-A | | | 179,862 | | | | 8,743 | | | | 42,926 | | | | 2,097 | | | | (179,607 | ) | | | (8,721 | ) | | | 43,181 | | | | 2,119 | |
| Class 529-B | | | 1,516 | | | | 74 | | | | 894 | | | | 44 | | | | (17,388 | ) | | | (850 | ) | | | (14,978 | ) | | | (732 | ) |
| Class 529-C | | | 67,037 | | | | 3,269 | | | | 10,457 | | | | 513 | | | | (67,255 | ) | | | (3,280 | ) | | | 10,239 | | | | 502 | |
| Class 529-E | | | 8,763 | | | | 427 | | | | 1,762 | | | | 86 | | | | (9,933 | ) | | | (484 | ) | | | 592 | | | | 29 | |
| Class 529-F-1 | | | 12,490 | | | | 608 | | | | 1,616 | | | | 79 | | | | (10,431 | ) | | | (506 | ) | | | 3,675 | | | | 181 | |
| Class R-1 | | | 25,667 | | | | 1,253 | | | | 3,020 | | | | 148 | | | | (26,991 | ) | | | (1,319 | ) | | | 1,696 | | | | 82 | |
| Class R-2 | | | 126,996 | | | | 6,209 | | | | 15,050 | | | | 742 | | | | (171,159 | ) | | | (8,400 | ) | | | (29,113 | ) | | | (1,449 | ) |
| Class R-3 | | | 263,971 | | | | 12,837 | | | | 37,671 | | | | 1,845 | | | | (384,619 | ) | | | (18,800 | ) | | | (82,977 | ) | | | (4,118 | ) |
| Class R-4 | | | 309,321 | | | | 15,045 | | | | 34,994 | | | | 1,709 | | | | (295,671 | ) | | | (14,388 | ) | | | 48,644 | | | | 2,366 | |
| Class R-5 | | | 187,464 | | | | 8,951 | | | | 18,802 | | | | 918 | | | | (213,083 | ) | | | (10,161 | ) | | | (6,817 | ) | | | (292 | ) |
| Class R-6 | | | 809,454 | | | | 39,104 | | | | 71,525 | | | | 3,478 | | | | (124,285 | ) | | | (6,015 | ) | | | 756,694 | | | | 36,567 | |
| Total net increase (decrease) | | $ | 12,591,256 | | | | 609,260 | | | $ | 2,674,276 | | | | 130,571 | | | $ | (12,515,865 | ) | | | (606,422 | ) | | $ | 2,749,667 | | | | 133,409 | |
| 1 | Includes exchanges between share classes of the fund. |
| 2 | Class R-2E shares were offered beginning August 29, 2014. |
| 3 | Amount less than one thousand. |
9. Investment transactions
The fund made purchases and sales of investment securities, excluding short-term securities and U.S. government obligations, if any, of $38,135,639,000 and $37,068,096,000, respectively, during the year ended July 31, 2015.
| The Income Fund of America | 31 |
Financial highlights
| | | | | | Income from | | | | | | | | | | | | | | | | | | | |
| | | | | | investment operations1 | | | | | | | | | | | | | | | | | | | |
| | | | | | | | | Net (losses) | | | | | | | | | | | | | | | | | | | | | | |
| | | Net asset | | | | | | gains on | | | | | | Dividends | | | Net asset | | | | | | | | | Ratio of | | | Ratio of | |
| | | value, | | | Net | | | securities (both | | | Total from | | | (from net | | | value, | | | | | | Net assets, | | | expenses | | | net income | |
| | | beginning | | | investment | | | realized and | | | investment | | | investment | | | end | | | Total | | | end of period | | | to average | | | to average | |
| | | of period | | | income2 | | | unrealized) | | | operations | | | income) | | | of period | | | return3,4 | | | (in millions) | | | net assets2 | | | net assets2 | |
| Class A: | | | | | | | | | | | | | | | | | | | | | | | | | | | | | | | | | | | | | | | | |
| Year ended 7/31/2015 | | $ | 21.45 | | | $ | .69 | | | $ | (.04 | ) | | $ | .65 | | | $ | (.79 | ) | | $ | 21.31 | | | | 3.01 | % | | $ | 72,952 | | | | .55 | % | | | 3.19 | % |
| Year ended 7/31/2014 | | | 19.64 | | | | .78 | | | | 1.69 | | | | 2.47 | | | | (.66 | ) | | | 21.45 | | | | 12.78 | | | | 71,290 | | | | .57 | | | | 3.76 | |
| Year ended 7/31/2013 | | | 17.66 | | | | .67 | | | | 1.99 | | | | 2.66 | | | | (.68 | ) | | | 19.64 | | | | 15.33 | | | | 63,968 | | | | .58 | | | | 3.58 | |
| Year ended 7/31/2012 | | | 16.97 | | | | .66 | | | | .73 | | | | 1.39 | | | | (.70 | ) | | | 17.66 | | | | 8.45 | | | | 56,153 | | | | .59 | | | | 3.92 | |
| Year ended 7/31/2011 | | | 15.48 | | | | .71 | | | | 1.53 | | | | 2.24 | | | | (.75 | ) | | | 16.97 | | | | 14.68 | | | | 52,940 | | | | .58 | | | | 4.24 | |
| Class B: | | | | | | | | | | | | | | | | | | | | | | | | | | | | | | | | | | | | | | | | |
| Year ended 7/31/2015 | | | 21.30 | | | | .53 | | | | (.05 | ) | | | .48 | | | | (.61 | ) | | | 21.17 | | | | 2.23 | | | | 301 | | | | 1.30 | | | | 2.45 | |
| Year ended 7/31/2014 | | | 19.50 | | | | .61 | | | | 1.69 | | | | 2.30 | | | | (.50 | ) | | | 21.30 | | | | 11.92 | | | | 601 | | | | 1.32 | | | | 2.99 | |
| Year ended 7/31/2013 | | | 17.53 | | | | .53 | | | | 1.97 | | | | 2.50 | | | | (.53 | ) | | | 19.50 | | | | 14.48 | | | | 818 | | | | 1.33 | | | | 2.86 | |
| Year ended 7/31/2012 | | | 16.85 | | | | .53 | | | | .71 | | | | 1.24 | | | | (.56 | ) | | | 17.53 | | | | 7.56 | | | | 1,161 | | | | 1.34 | | | | 3.19 | |
| Year ended 7/31/2011 | | | 15.37 | | | | .58 | | | | 1.52 | | | | 2.10 | | | | (.62 | ) | | | 16.85 | | | | 13.82 | | | | 1,760 | | | | 1.34 | | | | 3.48 | |
| Class C: | | | | | | | | | | | | | | | | | | | | | | | | | | | | | | | | | | | | | | | | |
| Year ended 7/31/2015 | | | 21.21 | | | | .51 | | | | (.04 | ) | | | .47 | | | | (.62 | ) | | | 21.06 | | | | 2.19 | | | | 6,390 | | | | 1.35 | | | | 2.39 | |
| Year ended 7/31/2014 | | | 19.42 | | | | .60 | | | | 1.69 | | | | 2.29 | | | | (.50 | ) | | | 21.21 | | | | 11.91 | | | | 6,597 | | | | 1.37 | | | | 2.95 | |
| Year ended 7/31/2013 | | | 17.47 | | | | .51 | | | | 1.97 | | | | 2.48 | | | | (.53 | ) | | | 19.42 | | | | 14.41 | | | | 6,389 | | | | 1.38 | | | | 2.79 | |
| Year ended 7/31/2012 | | | 16.80 | | | | .52 | | | | .71 | | | | 1.23 | | | | (.56 | ) | | | 17.47 | | | | 7.55 | | | | 6,096 | | | | 1.38 | | | | 3.13 | |
| Year ended 7/31/2011 | | | 15.33 | | | | .57 | | | | 1.51 | | | | 2.08 | | | | (.61 | ) | | | 16.80 | | | | 13.77 | | | | 6,157 | | | | 1.39 | | | | 3.43 | |
| Class F-1: | | | | | | | | | | | | | | | | | | | | | | | | | | | | | | | | | | | | | | | | |
| Year ended 7/31/2015 | | | 21.40 | | | | .67 | | | | (.04 | ) | | | .63 | | | | (.77 | ) | | | 21.26 | | | | 2.94 | | | | 4,160 | | | | .64 | | | | 3.10 | |
| Year ended 7/31/2014 | | | 19.60 | | | | .76 | | | | 1.68 | | | | 2.44 | | | | (.64 | ) | | | 21.40 | | | | 12.66 | | | | 3,841 | | | | .65 | | | | 3.71 | |
| Year ended 7/31/2013 | | | 17.62 | | | | .65 | | | | 2.00 | | | | 2.65 | | | | (.67 | ) | | | 19.60 | | | | 15.30 | | | | 3,554 | | | | .65 | | | | 3.50 | |
| Year ended 7/31/2012 | | | 16.94 | | | | .65 | | | | .72 | | | | 1.37 | | | | (.69 | ) | | | 17.62 | | | | 8.35 | | | | 2,563 | | | | .64 | | | | 3.87 | |
| Year ended 7/31/2011 | | | 15.46 | | | | .70 | | | | 1.52 | | | | 2.22 | | | | (.74 | ) | | | 16.94 | | | | 14.58 | | | | 2,025 | | | | .64 | | | | 4.19 | |
| Class F-2: | | | | | | | | | | | | | | | | | | | | | | | | | | | | | | | | | | | | | | | | |
| Year ended 7/31/2015 | | | 21.44 | | | | .73 | | | | (.04 | ) | | | .69 | | | | (.83 | ) | | | 21.30 | | | | 3.20 | | | | 4,042 | | | | .38 | | | | 3.35 | |
| Year ended 7/31/2014 | | | 19.63 | | | | .80 | | | | 1.71 | | | | 2.51 | | | | (.70 | ) | | | 21.44 | | | | 12.97 | | | | 2,975 | | | | .40 | | | | 3.89 | |
| Year ended 7/31/2013 | | | 17.65 | | | | .70 | | | | 1.99 | | | | 2.69 | | | | (.71 | ) | | | 19.63 | | | | 15.53 | | | | 1,434 | | | | .41 | | | | 3.74 | |
| Year ended 7/31/2012 | | | 16.97 | | | | .69 | | | | .72 | | | | 1.41 | | | | (.73 | ) | | | 17.65 | | | | 8.59 | | | | 1,020 | | | | .40 | | | | 4.09 | |
| Year ended 7/31/2011 | | | 15.48 | | | | .74 | | | | 1.53 | | | | 2.27 | | | | (.78 | ) | | | 16.97 | | | | 14.90 | | | | 747 | | | | .40 | | | | 4.42 | |
| Class 529-A: | | | | | | | | | | | | | | | | | | | | | | | | | | | | | | | | | | | | | | | | |
| Year ended 7/31/2015 | | | 21.41 | | | | .67 | | | | (.04 | ) | | | .63 | | | | (.77 | ) | | | 21.27 | | | | 2.92 | | | | 1,489 | | | | .65 | | | | 3.09 | |
| Year ended 7/31/2014 | | | 19.60 | | | | .75 | | | | 1.70 | | | | 2.45 | | | | (.64 | ) | | | 21.41 | | | | 12.69 | | | | 1,463 | | | | .67 | | | | 3.66 | |
| Year ended 7/31/2013 | | | 17.63 | | | | .65 | | | | 1.98 | | | | 2.63 | | | | (.66 | ) | | | 19.60 | | | | 15.19 | | | | 1,298 | | | | .68 | | | | 3.48 | |
| Year ended 7/31/2012 | | | 16.95 | | | | .64 | | | | .72 | | | | 1.36 | | | | (.68 | ) | | | 17.63 | | | | 8.30 | | | | 1,102 | | | | .68 | | | | 3.82 | |
| Year ended 7/31/2011 | | | 15.46 | | | | .69 | | | | 1.53 | | | | 2.22 | | | | (.73 | ) | | | 16.95 | | | | 14.62 | | | | 939 | | | | .67 | | | | 4.15 | |
| Class 529-B: | | | | | | | | | | | | | | | | | | | | | | | | | | | | | | | | | | | | | | | | |
| Year ended 7/31/2015 | | | 21.36 | | | | .50 | | | | (.05 | ) | | | .45 | | | | (.58 | ) | | | 21.23 | | | | 2.10 | | | | 20 | | | | 1.43 | | | | 2.33 | |
| Year ended 7/31/2014 | | | 19.55 | | | | .58 | | | | 1.70 | | | | 2.28 | | | | (.47 | ) | | | 21.36 | | | | 11.79 | | | | 34 | | | | 1.45 | | | | 2.85 | |
| Year ended 7/31/2013 | | | 17.57 | | | | .50 | | | | 1.99 | | | | 2.49 | | | | (.51 | ) | | | 19.55 | | | | 14.35 | | | | 45 | | | | 1.46 | | | | 2.73 | |
| Year ended 7/31/2012 | | | 16.89 | | | | .51 | | | | .71 | | | | 1.22 | | | | (.54 | ) | | | 17.57 | | | | 7.41 | | | | 58 | | | | 1.47 | | | | 3.06 | |
| Year ended 7/31/2011 | | | 15.41 | | | | .56 | | | | 1.52 | | | | 2.08 | | | | (.60 | ) | | | 16.89 | | | | 13.66 | | | | 76 | | | | 1.46 | | | | 3.37 | |
| 32 | The Income Fund of America |
| | | | | | Income from | | | | | | | | | | | | | | | | | | | |
| | | | | | investment operations1 | | | | | | | | | | | | | | | | | | | |
| | | | | | | | | Net (losses) | | | | | | | | | | | | | | | | | | | | | | |
| | | Net asset | | | | | | gains on | | | | | | Dividends | | | Net asset | | | | | | | | | Ratio of | | | Ratio of | |
| | | value, | | | Net | | | securities (both | | | Total from | | | (from net | | | value, | | | | | | Net assets, | | | expenses | | | net income | |
| | | beginning | | | investment | | | realized and | | | investment | | | investment | | | end | | | Total | | | end of period | | | to average | | | to average | |
| | | of period | | | income2 | | | unrealized) | | | operations | | | income) | | | of period | | | return3,4 | | | (in millions) | | | net assets2 | | | net assets2 | |
| Class 529-C: | | | | | | | | | | | | | | | | | | | | | | | | | | | | | | | | | | | | | | | | |
| Year ended 7/31/2015 | | $ | 21.33 | | | $ | .50 | | | $ | (.05 | ) | | $ | .45 | | | $ | (.60 | ) | | $ | 21.18 | | | | 2.09 | % | | $ | 466 | | | | 1.42 | % | | | 2.32 | % |
| Year ended 7/31/2014 | | | 19.53 | | | | .59 | | | | 1.69 | | | | 2.28 | | | | (.48 | ) | | | 21.33 | | | | 11.82 | | | | 470 | | | | 1.44 | | | | 2.88 | |
| Year ended 7/31/2013 | | | 17.56 | | | | .50 | | | | 1.99 | | | | 2.49 | | | | (.52 | ) | | | 19.53 | | | | 14.36 | | | | 420 | | | | 1.45 | | | | 2.71 | |
| Year ended 7/31/2012 | | | 16.89 | | | | .51 | | | | .71 | | | | 1.22 | | | | (.55 | ) | | | 17.56 | | | | 7.43 | | | | 370 | | | | 1.47 | | | | 3.04 | |
| Year ended 7/31/2011 | | | 15.41 | | | | .56 | | | | 1.53 | | | | 2.09 | | | | (.61 | ) | | | 16.89 | | | | 13.71 | | | | 331 | | | | 1.46 | | | | 3.37 | |
| Class 529-E: | | | | | | | | | | | | | | | | | | | | | | | | | | | | | | | | | | | | | | | | |
| Year ended 7/31/2015 | | | 21.35 | | | | .62 | | | | (.04 | ) | | | .58 | | | | (.72 | ) | | | 21.21 | | | | 2.68 | | | | 64 | | | | .89 | | | | 2.85 | |
| Year ended 7/31/2014 | | | 19.55 | | | | .70 | | | | 1.69 | | | | 2.39 | | | | (.59 | ) | | | 21.35 | | | | 12.39 | | | | 65 | | | | .91 | | | | 3.41 | |
| Year ended 7/31/2013 | | | 17.58 | | | | .60 | | | | 1.99 | | | | 2.59 | | | | (.62 | ) | | | 19.55 | | | | 14.95 | | | | 59 | | | | .92 | | | | 3.24 | |
| Year ended 7/31/2012 | | | 16.91 | | | | .60 | | | | .71 | | | | 1.31 | | | | (.64 | ) | | | 17.58 | | | | 7.99 | | | | 52 | | | | .93 | | | | 3.57 | |
| Year ended 7/31/2011 | | | 15.43 | | | | .65 | | | | 1.52 | | | | 2.17 | | | | (.69 | ) | | | 16.91 | | | | 14.27 | | | | 44 | | | | .94 | | | | 3.88 | |
| Class 529-F-1: | | | | | | | | | | | | | | | | | | | | | | | | | | | | | | | | | | | | | | | | |
| Year ended 7/31/2015 | | | 21.41 | | | | .72 | | | | (.04 | ) | | | .68 | | | | (.82 | ) | | | 21.27 | | | | 3.16 | | | | 58 | | | | .42 | | | | 3.31 | |
| Year ended 7/31/2014 | | | 19.60 | | | | .80 | | | | 1.70 | | | | 2.50 | | | | (.69 | ) | | | 21.41 | | | | 12.94 | | | | 52 | | | | .44 | | | | 3.89 | |
| Year ended 7/31/2013 | | | 17.63 | | | | .69 | | | | 1.98 | | | | 2.67 | | | | (.70 | ) | | | 19.60 | | | | 15.44 | | | | 44 | | | | .45 | | | | 3.70 | |
| Year ended 7/31/2012 | | | 16.95 | | | | .68 | | | | .72 | | | | 1.40 | | | | (.72 | ) | | | 17.63 | | | | 8.53 | | | | 36 | | | | .46 | | | | 4.04 | |
| Year ended 7/31/2011 | | | 15.46 | | | | .73 | | | | 1.53 | | | | 2.26 | | | | (.77 | ) | | | 16.95 | | | | 14.87 | | | | 31 | | | | .45 | | | | 4.37 | |
| Class R-1: | | | | | | | | | | | | | | | | | | | | | | | | | | | | | | | | | | | | | | | | |
| Year ended 7/31/2015 | | | 21.33 | | | | .51 | | | | (.05 | ) | | | .46 | | | | (.61 | ) | | | 21.18 | | | | 2.16 | | | | 139 | | | | 1.36 | | | | 2.38 | |
| Year ended 7/31/2014 | | | 19.53 | | | | .60 | | | | 1.69 | | | | 2.29 | | | | (.49 | ) | | | 21.33 | | | | 11.88 | | | | 133 | | | | 1.39 | | | | 2.93 | |
| Year ended 7/31/2013 | | | 17.56 | | | | .52 | | | | 1.98 | | | | 2.50 | | | | (.53 | ) | | | 19.53 | | | | 14.43 | | | | 120 | | | | 1.39 | | | | 2.78 | |
| Year ended 7/31/2012 | | | 16.89 | | | | .52 | | | | .71 | | | | 1.23 | | | | (.56 | ) | | | 17.56 | | | | 7.50 | | | | 122 | | | | 1.40 | | | | 3.11 | |
| Year ended 7/31/2011 | | | 15.41 | | | | .57 | | | | 1.52 | | | | 2.09 | | | | (.61 | ) | | | 16.89 | | | | 13.76 | | | | 109 | | | | 1.41 | | | | 3.42 | |
| Class R-2: | | | | | | | | | | | | | | | | | | | | | | | | | | | | | | | | | | | | | | | | |
| Year ended 7/31/2015 | | | 21.23 | | | | .52 | | | | (.04 | ) | | | .48 | | | | (.62 | ) | | | 21.09 | | | | 2.24 | | | | 599 | | | | 1.32 | | | | 2.42 | |
| Year ended 7/31/2014 | | | 19.45 | | | | .60 | | | | 1.68 | | | | 2.28 | | | | (.50 | ) | | | 21.23 | | | | 11.85 | | | | 635 | | | | 1.37 | | | | 2.95 | |
| Year ended 7/31/2013 | | | 17.49 | | | | .52 | | | | 1.98 | | | | 2.50 | | | | (.54 | ) | | | 19.45 | | | | 14.47 | | | | 609 | | | | 1.36 | | | | 2.80 | |
| Year ended 7/31/2012 | | | 16.82 | | | | .52 | | | | .71 | | | | 1.23 | | | | (.56 | ) | | | 17.49 | | | | 7.52 | | | | 567 | | | | 1.40 | | | | 3.11 | |
| Year ended 7/31/2011 | | | 15.35 | | | | .57 | | | | 1.51 | | | | 2.08 | | | | (.61 | ) | | | 16.82 | | | | 13.75 | | | | 552 | | | | 1.41 | | | | 3.41 | |
| Class R-2E: | | | | | | | | | | | | | | | | | | | | | | | | | | | | | | | | | | | | | | | | |
Period from 8/29/2014 to
7/31/20155,6 | | | 21.98 | | | | .54 | | | | (.47 | ) | | | .07 | | | | (.76 | ) | | | 21.29 | | | | .28 | 7 | | | — | 8 | | | .96 | 7,9 | | | 2.73 | 7,9 |
| Class R-3: | | | | | | | | | | | | | | | | | | | | | | | | | | | | | | | | | | | | | | | | |
| Year ended 7/31/2015 | | | 21.37 | | | | .61 | | | | (.04 | ) | | | .57 | | | | (.71 | ) | | | 21.23 | | | | 2.65 | | | | 1,275 | | | | .92 | | | | 2.83 | |
| Year ended 7/31/2014 | | | 19.57 | | | | .69 | | | | 1.69 | | | | 2.38 | | | | (.58 | ) | | | 21.37 | | | | 12.35 | | | | 1,357 | | | | .94 | | | | 3.38 | |
| Year ended 7/31/2013 | | | 17.60 | | | | .60 | | | | 1.98 | | | | 2.58 | | | | (.61 | ) | | | 19.57 | | | | 14.91 | | | | 1,323 | | | | .94 | | | | 3.22 | |
| Year ended 7/31/2012 | | | 16.92 | | | | .60 | | | | .72 | | | | 1.32 | | | | (.64 | ) | | | 17.60 | | | | 8.01 | | | | 1,204 | | | | .96 | | | | 3.55 | |
| Year ended 7/31/2011 | | | 15.44 | | | | .64 | | | | 1.53 | | | | 2.17 | | | | (.69 | ) | | | 16.92 | | | | 14.23 | | | | 1,118 | | | | .96 | | | | 3.86 | |
See page 34 for footnotes.
| The Income Fund of America | 33 |
Financial highlights (continued)
| | | | | | Income from | | | | | | | | | | | | | | | | | | | |
| | | | | | investment operations1 | | | | | | | | | | | | | | | | | | | |
| | | | | | | | | Net (losses) | | | | | | | | | | | | | | | | | | | | | | |
| | | Net asset | | | | | | gains on | | | | | | Dividends | | | Net asset | | | | | | | | | Ratio of | | | Ratio of | |
| | | value, | | | Net | | | securities (both | | | Total from | | | (from net | | | value, | | | | | | Net assets, | | | expenses | | | net income | |
| | | beginning | | | investment | | | realized and | | | investment | | | investment | | | end | | | Total | | | end of period | | | to average | | | to average | |
| | | of period | | | income2 | | | unrealized) | | | operations | | | income) | | | of period | | | return3,4 | | | (in millions) | | | net assets2 | | | net assets2 | |
| Class R-4: | | | | | | | | | | | | | | | | | | | | | | | | | | | | | | | | | | | | | | | | |
| Year ended 7/31/2015 | | $ | 21.42 | | | $ | .68 | | | $ | (.06 | ) | | $ | .62 | | | $ | (.77 | ) | | $ | 21.27 | | | | 2.90 | % | | $ | 1,203 | | | | .62 | % | | | 3.12 | % |
| Year ended 7/31/2014 | | | 19.61 | | | | .76 | | | | 1.70 | | | | 2.46 | | | | (.65 | ) | | | 21.42 | | | | 12.71 | | | | 1,192 | | | | .64 | | | | 3.67 | |
| Year ended 7/31/2013 | | | 17.63 | | | | .66 | | | | 1.99 | | | | 2.65 | | | | (.67 | ) | | | 19.61 | | | | 15.29 | | | | 1,045 | | | | .64 | | | | 3.52 | |
| Year ended 7/31/2012 | | | 16.95 | | | | .65 | | | | .72 | | | | 1.37 | | | | (.69 | ) | | | 17.63 | | | | 8.33 | | | | 880 | | | | .65 | | | | 3.86 | |
| Year ended 7/31/2011 | | | 15.46 | | | | .70 | | | | 1.53 | | | | 2.23 | | | | (.74 | ) | | | 16.95 | | | | 14.62 | | | | 809 | | | | .66 | | | | 4.17 | |
| Class R-5: | | | | | | | | | | | | | | | | | | | | | | | | | | | | | | | | | | | | | | | | |
| Year ended 7/31/2015 | | | 21.45 | | | | .74 | | | | (.04 | ) | | | .70 | | | | (.84 | ) | | | 21.31 | | | | 3.25 | | | | 658 | | | | .32 | | | | 3.41 | |
| Year ended 7/31/2014 | | | 19.64 | | | | .82 | | | | 1.70 | | | | 2.52 | | | | (.71 | ) | | | 21.45 | | | | 13.03 | | | | 567 | | | | .34 | | | | 3.98 | |
| Year ended 7/31/2013 | | | 17.66 | | | | .71 | | | | 1.99 | | | | 2.70 | | | | (.72 | ) | | | 19.64 | | | | 15.60 | | | | 525 | | | | .34 | | | | 3.83 | |
| Year ended 7/31/2012 | | | 16.97 | | | | .70 | | | | .73 | | | | 1.43 | | | | (.74 | ) | | | 17.66 | | | | 8.70 | | | | 462 | | | | .35 | | | | 4.17 | |
| Year ended 7/31/2011 | | | 15.48 | | | | .75 | | | | 1.53 | | | | 2.28 | | | | (.79 | ) | | | 16.97 | | | | 14.94 | | | | 478 | | | | .36 | | | | 4.46 | |
| Class R-6: | | | | | | | | | | | | | | | | | | | | | | | | | | | | | | | | | | | | | | | | |
| Year ended 7/31/2015 | | | 21.46 | | | | .75 | | | | (.04 | ) | | | .71 | | | | (.85 | ) | | | 21.32 | | | | 3.30 | | | | 3,176 | | | | .28 | | | | 3.45 | |
| Year ended 7/31/2014 | | | 19.65 | | | | .83 | | | | 1.70 | | | | 2.53 | | | | (.72 | ) | | | 21.46 | | | | 13.08 | | | | 2,566 | | | | .29 | | | | 4.03 | |
| Year ended 7/31/2013 | | | 17.66 | | | | .72 | | | | 2.00 | | | | 2.72 | | | | (.73 | ) | | | 19.65 | | | | 15.72 | | | | 1,631 | | | | .29 | | | | 3.85 | |
| Year ended 7/31/2012 | | | 16.98 | | | | .71 | | | | .72 | | | | 1.43 | | | | (.75 | ) | | | 17.66 | | | | 8.69 | | | | 1,025 | | | | .30 | | | | 4.21 | |
| Year ended 7/31/2011 | | | 15.49 | | | | .76 | | | | 1.52 | | | | 2.28 | | | | (.79 | ) | | | 16.98 | | | | 14.99 | | | | 758 | | | | .31 | | | | 4.51 | |
| | | Year ended July 31 |
| Portfolio turnover rate for all share classes10 | | 2015 | | 2014 | | 2013 | | 2012 | | 2011 |
| Including mortgage dollar roll transactions | | | 45 | % | | | 39 | % | | | 47 | % | | | 41 | % | | | 38 | % |
| Excluding mortgage dollar roll transactions | | | 32 | % | | Not available |
| 1 | Based on average shares outstanding. |
| 2 | For the year ended July 31, 2014, this column reflects the impact of a corporate action event that resulted in a one-time increase to net investment income. If the corporate action event had not occurred, the Class A net investment income per share would have been lower by $.11; the Class A ratio of expenses to average net assets would have been lower by .01 percentage points; and the Class A ratio of net income to average net assets would have been lower by .51 percentage points. The impact to the other share classes would have been similar. |
| 3 | Total returns exclude any applicable sales charges, including contingent deferred sales charges. |
| 4 | Not annualized. |
| 5 | Based on operations for the period shown and, accordingly, is not representative of a full year. |
| 6 | Class R-2E shares were offered beginning August 29, 2014. |
| 7 | Although the fund has a plan of distribution for Class R-2E shares, fees for distribution services are not paid by the fund on accounts for which a broker-dealer (or other financial intermediary) has not been assigned, including amounts invested in the fund by CRMC and/or its affiliates. If fees for distribution services were charged on these assets, fund expenses would be higher and net income and total return would be lower. |
| 8 | Amount less than $1 million. |
| 9 | Annualized. |
| 10 | Refer to Note 5 for more information on mortgage dollar rolls. |
See Notes to Financial Statements
| 34 | The Income Fund of America |
Report of Independent Registered Public Accounting Firm
To the Shareholders and Board of Trustees of The Income Fund of America:
We have audited the accompanying statement of assets and liabilities of The Income Fund of America (the “Fund”), including the summary investment portfolio, as of July 31, 2015, and the related statement of operations for the year then ended, the statements of changes in net assets for each of the two years in the period then ended, and the financial highlights for each of the periods presented. These financial statements and financial highlights are the responsibility of the Fund’s management. Our responsibility is to express an opinion on these financial statements and financial highlights based on our audits.
We conducted our audits in accordance with the standards of the Public Company Accounting Oversight Board (United States). Those standards require that we plan and perform the audit to obtain reasonable assurance about whether the financial statements and financial highlights are free of material misstatement. The Fund is not required to have, nor were we engaged to perform, an audit of its internal control over financial reporting. Our audits included consideration of internal control over financial reporting as a basis for designing audit procedures that are appropriate in the circumstances, but not for the purpose of expressing an opinion on the effectiveness of the Fund’s internal control over financial reporting. Accordingly, we express no such opinion. An audit also includes examining, on a test basis, evidence supporting the amounts and disclosures in the financial statements, assessing the accounting principles used and significant estimates made by management, as well as evaluating the overall financial statement presentation. Our procedures included confirmation of securities owned as of July 31, 2015, by correspondence with the custodian and brokers; where replies were not received from brokers, we performed other auditing procedures. We believe that our audits provide a reasonable basis for our opinion.
In our opinion, such financial statements and financial highlights referred to above present fairly, in all material respects, the financial position of The Income Fund of America as of July 31, 2015, the results of its operations for the year then ended, the changes in its net assets for each of the two years in the period then ended, and the financial highlights for each of the periods presented, in conformity with accounting principles generally accepted in the United States of America.
Deloitte & Touche LLP
Costa Mesa, California
September 10, 2015
| The Income Fund of America | 35 |
As a fund shareholder, you incur two types of costs: (1) transaction costs, such as initial sales charges on purchase payments and contingent deferred sales charges on redemptions (loads), and (2) ongoing costs, including management fees, distribution and service (12b-1) fees, and other expenses. This example is intended to help you understand your ongoing costs (in dollars) of investing in the fund so you can compare these costs with the ongoing costs of investing in other mutual funds. The example is based on an investment of $1,000 invested at the beginning of the period and held for the entire six-month period (February 1, 2015, through July 31, 2015).
Actual expenses:
The first line of each share class in the table on the following page provides information about actual account values and actual expenses. You may use the information in this line, together with the amount you invested, to estimate the expenses that you paid over the period. Simply divide your account value by $1,000 (for example, an $8,600 account value divided by $1,000 = 8.6), then multiply the result by the number in the first line under the heading entitled “Expenses paid during period” to estimate the expenses you paid on your account during this period.
Hypothetical example for comparison purposes:
The second line of each share class in the table on the following page provides information about hypothetical account values and hypothetical expenses based on the actual expense ratio for the share class and an assumed rate of return of 5.00% per year before expenses, which is not the actual return of the share class. The hypothetical account values and expenses may not be used to estimate the actual ending account balance or expenses you paid for the period. You may use this information to compare the ongoing costs of investing in the fund and other funds. To do so, compare this 5.00% hypothetical example with the 5.00% hypothetical examples that appear in the shareholder reports of the other funds.
Notes:
Retirement plan participants may be subject to certain fees charged by the plan sponsor, and Class F-1, F-2 and 529-F-1 shareholders may be subject to fees charged by financial intermediaries, typically ranging from 0.75% to 1.50% of assets annually depending on services offered. You can estimate the impact of these fees by adding the amount of the fees to the total estimated expenses you paid on your account during the period as calculated above. In addition, your ending account value would be lower by the amount of these fees.
Note that the expenses shown in the table on the following page are meant to highlight your ongoing costs only and do not reflect any transactional costs, such as sales charges (loads). Therefore, the second line of each share class in the table is useful in comparing ongoing costs only and will not help you determine the relative total costs of owning different funds. In addition, if these transactional costs were included, your costs would have been higher.
| 36 | The Income Fund of America |
| | | Beginning | | | Ending | | | | | | | |
| | | account value | | | account value | | | Expenses paid | | | Annualized | |
| | | 2/1/2015 | | | 7/31/2015 | | | during period* | | | expense ratio | |
| Class A - actual return | | $ | 1,000.00 | | | $ | 1,010.18 | | | $ | 2.74 | | | | .55 | % |
| Class A - assumed 5% return | | | 1,000.00 | | | | 1,022.07 | | | | 2.76 | | | | .55 | |
| Class B - actual return | | | 1,000.00 | | | | 1,006.00 | | | | 6.42 | | | | 1.29 | |
| Class B - assumed 5% return | | | 1,000.00 | | | | 1,018.40 | | | | 6.46 | | | | 1.29 | |
| Class C - actual return | | | 1,000.00 | | | | 1,006.31 | | | | 6.67 | | | | 1.34 | |
| Class C - assumed 5% return | | | 1,000.00 | | | | 1,018.15 | | | | 6.71 | | | | 1.34 | |
| Class F-1 - actual return | | | 1,000.00 | | | | 1,009.40 | | | | 3.14 | | | | .63 | |
| Class F-1 - assumed 5% return | | | 1,000.00 | | | | 1,021.67 | | | | 3.16 | | | | .63 | |
| Class F-2 - actual return | | | 1,000.00 | | | | 1,011.03 | | | | 1.94 | | | | .39 | |
| Class F-2 - assumed 5% return | | | 1,000.00 | | | | 1,022.86 | | | | 1.96 | | | | .39 | |
| Class 529-A - actual return | | | 1,000.00 | | | | 1,009.75 | | | | 3.24 | | | | .65 | |
| Class 529-A - assumed 5% return | | | 1,000.00 | | | | 1,021.57 | | | | 3.26 | | | | .65 | |
| Class 529-B - actual return | | | 1,000.00 | | | | 1,005.37 | | | | 7.06 | | | | 1.42 | |
| Class 529-B - assumed 5% return | | | 1,000.00 | | | | 1,017.75 | | | | 7.10 | | | | 1.42 | |
| Class 529-C - actual return | | | 1,000.00 | | | | 1,005.41 | | | | 7.06 | | | | 1.42 | |
| Class 529-C - assumed 5% return | | | 1,000.00 | | | | 1,017.75 | | | | 7.10 | | | | 1.42 | |
| Class 529-E - actual return | | | 1,000.00 | | | | 1,008.51 | | | | 4.43 | | | | .89 | |
| Class 529-E - assumed 5% return | | | 1,000.00 | | | | 1,020.38 | | | | 4.46 | | | | .89 | |
| Class 529-F-1 - actual return | | | 1,000.00 | | | | 1,010.45 | | | | 2.09 | | | | .42 | |
| Class 529-F-1 - assumed 5% return | | | 1,000.00 | | | | 1,022.71 | | | | 2.11 | | | | .42 | |
| Class R-1 - actual return | | | 1,000.00 | | | | 1,005.69 | | | | 6.81 | | | | 1.37 | |
| Class R-1 - assumed 5% return | | | 1,000.00 | | | | 1,018.00 | | | | 6.85 | | | | 1.37 | |
| Class R-2 - actual return | | | 1,000.00 | | | | 1,006.44 | | | | 6.47 | | | | 1.30 | |
| Class R-2 - assumed 5% return | | | 1,000.00 | | | | 1,018.35 | | | | 6.51 | | | | 1.30 | |
| Class R-2E - actual return | | | 1,000.00 | | | | 1,007.98 | | | | 4.88 | | | | .98 | |
| Class R-2E - assumed 5% return | | | 1,000.00 | | | | 1,019.93 | | | | 4.91 | | | | .98 | |
| Class R-3 - actual return | | | 1,000.00 | | | | 1,007.92 | | | | 4.53 | | | | .91 | |
| Class R-3 - assumed 5% return | | | 1,000.00 | | | | 1,020.28 | | | | 4.56 | | | | .91 | |
| Class R-4 - actual return | | | 1,000.00 | | | | 1,009.39 | | | | 3.09 | | | | .62 | |
| Class R-4 - assumed 5% return | | | 1,000.00 | | | | 1,021.72 | | | | 3.11 | | | | .62 | |
| Class R-5 - actual return | | | 1,000.00 | | | | 1,010.90 | | | | 1.60 | | | | .32 | |
| Class R-5 - assumed 5% return | | | 1,000.00 | | | | 1,023.21 | | | | 1.61 | | | | .32 | |
| Class R-6 - actual return | | | 1,000.00 | | | | 1,011.57 | | | | 1.40 | | | | .28 | |
| Class R-6 - assumed 5% return | | | 1,000.00 | | | | 1,023.41 | | | | 1.40 | | | | .28 | |
| * | The “expenses paid during period” are equal to the “annualized expense ratio,” multiplied by the average account value over the period, multiplied by the number of days in the period, and divided by 365 (to reflect the one-half year period). |
| The Income Fund of America | 37 |
We are required to advise you of the federal tax status of certain distributions received by shareholders during the fiscal year. The fund hereby designates the following amounts for the fund’s fiscal year ended July 31, 2015:
| Long-term capital gains | | | $56,768,000 | |
| Qualified dividend income | | | $3,318,222,000 | |
| Corporate dividends received deduction | | | $1,912,330,000 | |
| U.S. government income that may be exempt from state taxation | | | $52,470,000 | |
Individual shareholders should refer to their Form 1099 or other tax information, which will be mailed in January 2016, to determine the calendar year amounts to be included on their 2015 tax returns. Shareholders should consult their tax advisors.
| 38 | The Income Fund of America |
Board of trustees and other officers
Independent trustees1
| Name and year of birth | | Year first
elected
a trustee
of the fund2 | | Principal occupation(s) during past five years | | Number of
portfolios in fund
complex overseen
by trustee | | Other directorships3
held by trustee |
| William H. Baribault, 1945 | | 2012 | | CEO and President, Richard Nixon Foundation; former Chairman of the Board and CEO, Oakwood Enterprises (private investment and consulting) | | 79 | | None |
| Vanessa C. L. Chang, 1952 | | 2012 | | Director, EL & EL Investments (real estate) | | 16 | | Edison International;
Transocean Ltd. |
| Linda Griego, 1947 | | 2012 | | President and CEO, Griego Enterprises, Inc. (business management company) | | 7 | | AECOM Technology Corporation; CBS Corporation |
| Leonade D. Jones, 1947 | | 1993 | | Retired; former Treasurer, The Washington Post Company (retired 1996) | | 10 | | None |
| William D. Jones, 1955 | | 2008 | | Real estate developer/owner, President and CEO, CityLink Investment Corporation (acquires, develops and manages real estate ventures in selected urban communities) and City Scene Management Company (provides commercial asset and property management services) | | 8 | | Sempra Energy |
| James J. Postl, 1946 | | 2008 | | Retired; former President and CEO, Pennzoil-Quaker State Company (automotive products and services) (retired 2002) | | 4 | | Pulte, Inc. |
| Margaret Spellings, 1957 | | 2012 | | President, George W. Bush Foundation; former President and CEO, Margaret Spellings & Company (public policy and strategic consulting); former President, U.S. Chamber Foundation and Senior Advisor to the President and CEO, U.S. Chamber of Commerce | | 79 | | None |
Isaac Stein, 1946
Chairman of the Board (Independent and Non-Executive) | | 2004 | | President, Waverley Associates (private investment fund); Chairman Emeritus of the Board of Trustees, Stanford University | | 4 | | Alexza Pharmaceuticals, Inc. |
Interested trustee4,5
Name, year of birth and
position with fund | | Year first
elected
a trustee
or officer
of the fund2 | | Principal occupation(s) during past five years
and positions held with affiliated entities or
the principal underwriter of the fund | | Number of
portfolios in fund
complex overseen
by trustee | | Other directorships3
held by trustee |
| Hilda L. Applbaum, 1961 Vice Chairman of the Board | | 1998 | | Partner — Capital World Investors, Capital Research and Management Company | | 1 | | None |
The fund’s statement of additional information includes further details about fund trustees and is available without charge upon request by calling American Funds Service Company at (800) 421-4225 or by visiting the American Funds website at americanfunds.com. The address for all trustees and officers of the fund is 333 South Hope Street, Los Angeles, CA 90071, Attention: Secretary.
See page 40 for footnotes.
| The Income Fund of America | 39 |
Other officers5
Name, year of birth and
position with fund | | Year first
elected
an officer
of the fund2 | | Principal occupation(s) during past five years and positions held with affiliated entities
or the principal underwriter of the fund |
David C. Barclay, 1956
President | | 1998 | | Partner — Capital Fixed Income Investors, Capital Research and Management Company;
Director, Capital Research and Management Company |
Dina N. Perry, 1945
Senior Vice President | | 1994 | | Partner — Capital World Investors, Capital Research and Management Company;
Director, The Capital Group Companies, Inc.6 |
Paul F. Roye, 1953
Senior Vice President | | 2007 | | Senior Vice President — Fund Business Management Group, Capital Research and Management Company;
Director, American Funds Service Company6 |
Andrew B. Suzman, 1967
Senior Vice President | | 2004 | | Partner — Capital World Investors, Capital Research and Management Company;
Director, American Funds Distributors, Inc.;6 Director, Capital Strategy Research, Inc.;6
Director, The Capital Group Companies, Inc.6 |
Joanna F. Jonsson, 1963
Vice President | | 2006 | | Partner — Capital World Investors, Capital Research and Management Company;
Director, Capital Research and Management Company |
Donald H. Rolfe, 1972
Vice President | | 2012 | | Chief Compliance Officer, Capital Research Company;6 Chief Compliance Officer, Capital Research and Management Company; Vice President and Senior Counsel — Fund Business Management Group, Capital Research and Management Company |
John H. Smet, 1956
Vice President | | 1994 | | Partner — Capital Fixed Income Investors, Capital Research and Management Company;
Director, Capital Research and Management Company |
Michael W. Stockton, 1967
Secretary | | 2014 | | Vice President — Fund Business Management Group, Capital Research and Management Company |
Jeffrey P. Regal, 1971
Treasurer | | 2011 | | Vice President — Investment Operations, Capital Research and Management Company |
Viviane T. Russo, 1981
Assistant Secretary | | 2014 | | Associate — Fund Business Management Group, Capital Research and Management Company |
Dori Laskin, 1951
Assistant Treasurer | | 2011 | | Vice President — Investment Operations, Capital Research and Management Company |
| 1 | The term independent trustee refers to a trustee who is not an “interested person” of the fund within the meaning of the Investment Company Act of 1940. |
| 2 | Trustees and officers of the fund serve until their resignation, removal or retirement. |
| 3 | This includes all directorships/trusteeships (other than those in the American Funds or other funds managed by Capital Research and Management Company or its affiliates) that are held by each trustee as a trustee or director of a public company or a registered investment company. |
| 4 | The term interested trustee refers to a trustee who is an “interested person” within the meaning of the Investment Company Act of 1940, on the basis of their affiliation with the fund’s investment adviser, Capital Research and Management Company, or affiliated entities (including the fund’s principal underwriter). |
| 5 | All of the directors/trustees and/or officers listed are officers and/or directors/trustees of one or more of the other funds for which Capital Research and Management Company serves as investment adviser. |
| 6 | Company affiliated with Capital Research and Management Company. |
| 40 | The Income Fund of America |
Office of the fund
6455 Irvine Center Drive
Irvine, CA 92618-4518
Investment adviser
Capital Research and Management Company
333 South Hope Street
Los Angeles, CA 90071-1406
6455 Irvine Center Drive
Irvine, CA 92618-4518
Transfer agent for shareholder accounts
American Funds Service Company
(Write to the address near you.)
P.O. Box 6007
Indianapolis, IN 46206-6007
P.O. Box 2280
Norfolk, VA 23501-2280
Custodian of assets
JPMorgan Chase Bank
270 Park Avenue
New York, NY 10017-2070
Counsel
Morgan, Lewis & Bockius LLP
355 South Grand Avenue, Suite 4400
Los Angeles, CA 90071-3106
Independent registered public accounting firm
Deloitte & Touche LLP
695 Town Center Drive
Suite 1200
Costa Mesa, CA 92626-7188
Principal underwriter
American Funds Distributors, Inc.
333 South Hope Street
Los Angeles, CA 90071-1406
Investors should carefully consider investment objectives, risks, charges and expenses. This and other important information is contained in the fund prospectus and summary prospectus, which can be obtained from your financial professional and should be read carefully before investing. You may also call American Funds Service Company (AFS) at (800) 421-4225 or visit the American Funds website at americanfunds.com.
“American Funds Proxy Voting Procedures and Principles” — which describes how we vote proxies relating to portfolio securities — is available on the American Funds website or upon request by calling AFS. The fund files its proxy voting record with the U.S. Securities and Exchange Commission (SEC) for the 12 months ended June 30 by August 31. The proxy voting record is available free of charge on the SEC website at sec.gov and on the American Funds website.
A complete July 31, 2015, portfolio of The Income Fund of America’s investments is available free of charge by calling AFS or visiting the SEC website (where it is part of Form N-CSR).
The Income Fund of America files a complete list of its portfolio holdings with the SEC for the first and third quarters of each fiscal year on Form N-Q. This filing is available free of charge on the SEC website. You may also review or, for a fee, copy this filing at the SEC’s Public Reference Room in Washington, D.C. Additional information regarding the operation of the Public Reference Room may be obtained by calling the SEC’s Office of Investor Education and Advocacy at (800) SEC-0330. Additionally, the list of portfolio holdings is available by calling AFS.
This report is for the information of shareholders of The Income Fund of America, but it also may be used as sales literature when preceded or accompanied by the current prospectus or summary prospectus, which gives details about charges, expenses, investment objectives and operating policies of the fund. If used as sales material after September 30, 2015, this report must be accompanied by an American Funds statistical update for the most recently completed calendar quarter.
The American Funds Advantage
Since 1931, American Funds, part of Capital Group, has helped investors pursue long-term investment success. Our consistent approach — in combination with The Capital SystemSM — has resulted in a superior long-term track record.
Aligned with investor success
We base our decisions on a long-term perspective, which we believe aligns our goals with the interests of our clients. Our portfolio managers average 27 years of investment experience, including 22 years at our company, reflecting a career commitment to our long-term approach.1
The Capital SystemSM
Our investment process, The Capital System, combines individual accountability with teamwork. Each fund is divided into portions that are managed independently by investment professionals with diverse backgrounds, ages and investment approaches. An extensive global research effort is the backbone of our system.
Superior long-term track record
Our equity funds have beaten their Lipper peer indexes in 91% of 10-year periods and 96% of 20-year periods. Our fixed-income funds have beaten their Lipper indexes in 54% of 10-year periods and 57% of 20-year periods.2 Our fund management fees have been among the lowest in the industry.3
| | 1 | Portfolio manager experience as of December 31, 2014. |
| | 2 | Based on Class A share results for rolling periods through December 31, 2014. Periods covered are the shorter of the fund’s lifetime or since the comparable Lipper index inception date (except SMALLCAP World Fund, for which the Lipper average was used). |
| | 3 | On average, our management fees were in the lowest quintile 70% of the time, based on the 20-year period ended December 31, 2014, versus comparable Lipper categories, excluding funds of funds. |

ITEM 2 – Code of Ethics
The Registrant has adopted a Code of Ethics that applies to its Principal Executive Officer and Principal Financial Officer. The Registrant undertakes to provide to any person without charge, upon request, a copy of the Code of Ethics. Such request can be made to American Funds Service Company at 800/421-9225 or to the Secretary of the Registrant, 6455 Irvine Center Drive, Irvine, California 92618.
ITEM 3 – Audit Committee Financial Expert
The Registrant’s board has determined that Vanessa C. L. Chang, a member of the Registrant’s audit committee, is an “audit committee financial expert” and "independent," as such terms are defined in this Item. This designation will not increase the designee’s duties, obligations or liability as compared to his or her duties, obligations and liability as a member of the audit committee and of the board, nor will it reduce the responsibility of the other audit committee members. There may be other individuals who, through education or experience, would qualify as "audit committee financial experts" if the board had designated them as such. Most importantly, the board believes each member of the audit committee contributes significantly to the effective oversight of the Registrant’s financial statements and condition.
ITEM 4 – Principal Accountant Fees and Services
| | Registrant: |
| | | a) Audit Fees: |
| | | | 2014 | $138,000 |
| | | | 2015 | $161,000 |
| | | | |
| | | b) Audit-Related Fees: |
| | | | 2014 | $28,000 |
| | | | 2015 | $22,000 |
| | | | The audit-related fees consist of assurance and related services relating to the examination of the Registrant’s investment adviser conducted in accordance with Statement on Standards for Attestation Engagements Number 16 issued by the American Institute of Certified Public Accountants. |
| | | | |
| | | c) Tax Fees: |
| | | | 2014 | $1,000 |
| | | | 2015 | $9,000 |
| | | The tax fees consist of professional services relating to the preparation of the Registrant’s tax returns including returns relating to the Registrant’s investments in non-U.S. jurisdictions. |
| | | | |
| | | d) All Other Fees: |
| | | | 2014 | None |
| | | | 2015 | None |
| | | | |
| | Adviser and affiliates (includes only fees for non-audit services billed to the adviser and affiliates for engagements that relate directly to the operations and financial reporting of the Registrant and were subject to the pre-approval policies described below): |
| | | a) Audit Fees: |
| | | | Not Applicable |
| | | | |
| | | b) Audit-Related Fees: |
| | | | 2014 | $730,000 |
| | | | 2015 | $1,435,000 |
| | | | The audit-related fees consist of assurance and related services relating to the examination of the Registrant’s transfer agent, principal underwriter and investment adviser conducted in accordance with Statement on Standards for Attestation Engagements Number 16 issued by the American Institute of Certified Public Accountants. |
| | | | |
| | | c) Tax Fees: |
| | | | 2014 | $41,000 |
| | | | 2015 | None |
| | | | The tax fees consist of consulting services relating to the Registrant’s investments. |
| | | | |
| | | d) All Other Fees: |
| | | | 2014 | $3,000 |
| | | | 2015 | $5,000 |
| | | | The other fees consist of subscription services related to an accounting research tool. |
| | | | |
All audit and permissible non-audit services that the Registrant’s audit committee considers compatible with maintaining the independent registered public accounting firm’s independence are required to be pre-approved by the committee. The pre-approval requirement will extend to all non-audit services provided to the Registrant, the investment adviser, and any entity controlling, controlled by, or under common control with the investment adviser that provides ongoing services to the Registrant, if the engagement relates directly to the operations and financial reporting of the Registrant. The committee will not delegate its responsibility to pre-approve these services to the investment adviser. The committee may delegate to one or more committee members the authority to review and pre-approve audit and permissible non-audit services. Actions taken under any such delegation will be reported to the full committee at its next meeting. The pre-approval requirement is waived with respect to non-audit services if certain conditions are met. The pre-approval requirement was not waived for any of the non-audit services listed above provided to the Registrant, adviser and affiliates.
Aggregate non-audit fees paid to the Registrant’s auditors, including fees for all services billed to the Registrant, adviser and affiliates that provide ongoing services to the Registrant, were $1,181,000 for fiscal year 2014 and $1,743,000 for fiscal year 2015. The non-audit services represented by these amounts were brought to the attention of the committee and considered to be compatible with maintaining the auditors’ independence.
ITEM 5 – Audit Committee of Listed Registrants
Not applicable to this Registrant, insofar as the Registrant is not a listed issuer as defined in Rule 10A-3 under the Securities Exchange Act of 1934.
ITEM 6 – Schedule of Investments
The Income Fund of America®
Investment portfolio
July 31, 2015
Common stocks 71.28%
Industrials 10.47% | Shares | Value
(000) |
| General Electric Co. | 77,005,000 | $2,009,830 |
| Lockheed Martin Corp. | 7,317,400 | 1,515,433 |
| Waste Management, Inc. | 22,153,353 | 1,132,701 |
| BAE Systems PLC | 114,530,500 | 858,869 |
| Caterpillar Inc. | 10,229,000 | 804,306 |
| KONE Oyj, Class B | 9,686,000 | 405,933 |
| Hubbell Inc., Class B | 3,430,000 | 358,126 |
| PACCAR Inc | 5,452,500 | 353,540 |
| Ryanair Holdings PLC (ADR)1 | 4,615,000 | 342,018 |
| Edenred SA | 11,360,000 | 283,395 |
| Norfolk Southern Corp. | 3,000,000 | 252,990 |
| R.R. Donnelley & Sons Co.2 | 13,345,400 | 234,212 |
| Boeing Co. | 1,500,000 | 216,255 |
| Macquarie Infrastructure Corp. | 2,490,000 | 211,476 |
| Masco Corp. | 7,000,000 | 184,730 |
| Honeywell International Inc. | 1,575,000 | 165,454 |
| Abertis Infraestructuras, SA, Class A | 9,267,930 | 151,711 |
| United Technologies Corp. | 1,500,000 | 150,465 |
| Delta Air Lines, Inc. | 3,355,000 | 148,761 |
| TransDigm Group Inc.1 | 630,000 | 142,569 |
| Randstad Holding NV | 850,000 | 58,195 |
| Geberit AG | 158,758 | 54,956 |
| Schneider Electric SE | 495,000 | 34,570 |
| Douglas Dynamics, Inc.2 | 1,444,000 | 29,631 |
| Atlas Copco AB, Class B | 1,195,000 | 29,353 |
| CEVA Group PLC1,3,4 | 35,229 | 26,069 |
| Atrium Corp.1,3,4 | 1,807 | 2 |
| | | 10,155,550 |
| Health care 9.85% | | |
| Merck & Co., Inc. | 50,113,640 | 2,954,700 |
| Pfizer Inc. | 61,380,000 | 2,213,363 |
| Bristol-Myers Squibb Co. | 24,252,500 | 1,591,934 |
| Eli Lilly and Co. | 8,959,400 | 757,159 |
| AstraZeneca PLC | 9,990,000 | 673,958 |
| Novartis AG | 3,762,000 | 390,877 |
| Novartis AG (ADR) | 500,000 | 51,875 |
| GlaxoSmithKline PLC | 19,555,000 | 426,312 |
| Roche Holding AG, non-registered shares, non-voting | 600,000 | 173,300 |
| AbbVie Inc. | 1,520,000 | 106,415 |
| Baxalta Inc. | 2,995,000 | 98,326 |
| Healthscope Ltd. | 28,636,203 | 57,353 |
| Sonic Healthcare Ltd. | 3,245,000 | 49,028 |
| Rotech Healthcare Inc.1,2,4 | 543,172 | 5,839 |
| | | 9,550,439 |
The Income Fund of America — Page 1 of 34
Common stocks
Financials 9.64% | Shares | Value
(000) |
| JPMorgan Chase & Co. | 19,330,200 | $1,324,699 |
| Wells Fargo & Co. | 20,547,000 | 1,189,055 |
| CME Group Inc., Class A | 10,140,400 | 973,884 |
| Banco Santander, SA1 | 103,815,826 | 716,475 |
| Crown Castle International Corp. | 7,450,000 | 610,229 |
| Suncorp Group Ltd. | 52,849,898 | 551,259 |
| Public Storage | 2,240,000 | 459,603 |
| Digital Realty Trust, Inc. | 7,115,000 | 457,281 |
| Iron Mountain Inc.2 | 13,644,780 | 410,026 |
| Lamar Advertising Co., Class A | 5,253,322 | 315,462 |
| Prudential PLC | 11,775,000 | 277,205 |
| Outfront Media Inc.2 | 9,064,824 | 227,799 |
| AXA SA | 7,835,000 | 206,515 |
| HSBC Holdings PLC (HKD denominated) | 13,126,382 | 118,018 |
| HSBC Holdings PLC (GBP denominated) | 9,260,749 | 83,836 |
| BlackRock, Inc. | 530,000 | 178,250 |
| Sun Hung Kai Properties Ltd. | 11,214,234 | 172,286 |
| Link Real Estate Investment Trust | 20,401,812 | 120,006 |
| Alexandria Real Estate Equities, Inc. | 1,232,625 | 114,277 |
| Camden Property Trust | 1,432,100 | 114,038 |
| Kimco Realty Corp. | 4,010,000 | 99,087 |
| Arthur J. Gallagher & Co. | 2,000,000 | 94,860 |
| Simon Property Group, Inc. | 450,000 | 84,249 |
| Redwood Trust, Inc.2 | 5,079,717 | 78,736 |
| Toronto-Dominion Bank (CAD denominated) | 1,614,579 | 65,146 |
| Equity Residential | 812,000 | 60,746 |
| New York Community Bancorp, Inc. | 3,065,000 | 58,327 |
| Allianz SE | 350,000 | 57,312 |
| Bank of Nova Scotia | 919,677 | 45,138 |
| Svenska Handelsbanken AB, Class A | 2,880,000 | 44,068 |
| City Holding Co. | 741,000 | 35,731 |
| American Tower Corp. | 42,271 | 4,020 |
| | | 9,347,623 |
| Information technology 8.20% | | |
| Microsoft Corp. | 61,441,100 | 2,869,299 |
| Cisco Systems, Inc. | 33,845,000 | 961,875 |
| Intel Corp. | 32,464,512 | 939,848 |
| Analog Devices, Inc. | 13,916,091 | 811,726 |
| Texas Instruments Inc. | 14,730,000 | 736,205 |
| Taiwan Semiconductor Manufacturing Co., Ltd. | 127,503,000 | 563,377 |
| Taiwan Semiconductor Manufacturing Co., Ltd. (ADR) | 500 | 11 |
| KLA-Tencor Corp. | 6,409,290 | 340,013 |
| Maxim Integrated Products, Inc. | 7,046,000 | 239,846 |
| Diebold, Inc.2 | 3,925,000 | 133,646 |
| Quanta Computer Inc. | 66,416,655 | 128,325 |
| Paychex, Inc. | 2,000,000 | 92,800 |
| STMicroelectronics NV | 11,549,289 | 90,221 |
| Fidessa group PLC | 1,240,000 | 46,475 |
| | | 7,953,667 |
| Consumer staples 6.89% | | |
| Procter & Gamble Co. | 15,373,700 | 1,179,163 |
| Philip Morris International Inc. | 13,168,200 | 1,126,276 |
| Coca-Cola Co. | 21,745,000 | 893,285 |
The Income Fund of America — Page 2 of 34
Common stocks
Consumer staples (continued) | Shares | Value
(000) |
| Kimberly-Clark Corp. | 5,100,000 | $586,347 |
| Altria Group, Inc. | 8,459,000 | 460,000 |
| PepsiCo, Inc. | 4,300,000 | 414,305 |
| British American Tobacco PLC | 6,199,000 | 367,962 |
| Kellogg Co. | 5,250,000 | 347,392 |
| Nestlé SA | 4,395,000 | 332,934 |
| Reynolds American Inc. | 3,621,134 | 310,657 |
| General Mills, Inc. | 4,170,000 | 242,736 |
| Campbell Soup Co. | 4,500,000 | 221,895 |
| Hershey Co. | 1,500,000 | 139,335 |
| Kraft Heinz Co. | 816,667 | 64,901 |
| | | 6,687,188 |
| Energy 4.99% | | |
| ConocoPhillips | 19,356,362 | 974,399 |
| Royal Dutch Shell PLC, Class B (ADR) | 11,431,000 | 664,713 |
| Royal Dutch Shell PLC, Class B | 6,003,647 | 174,433 |
| Chevron Corp. | 7,065,000 | 625,111 |
| Spectra Energy Corp | 19,655,500 | 594,776 |
| Coal India Ltd. | 85,000,000 | 582,038 |
| BP PLC | 76,550,000 | 472,738 |
| Helmerich & Payne, Inc. | 3,721,000 | 214,851 |
| Baytex Energy Corp.2 | 12,060,956 | 103,839 |
| Crescent Point Energy Corp. | 6,601,028 | 99,986 |
| Kinder Morgan, Inc. | 2,630,000 | 91,103 |
| Keyera Corp. | 2,665,400 | 87,593 |
| ONEOK, Inc. | 1,775,000 | 67,077 |
| TOTAL SA (ADR) | 1,062,956 | 52,393 |
| Husky Energy Inc. | 1,750,000 | 31,953 |
| Gener8 Maritime, Inc.1,3 | 5,506 | 76 |
| | | 4,837,079 |
| Consumer discretionary 4.85% | | |
| Target Corp. | 9,200,000 | 753,020 |
| Home Depot, Inc. | 5,595,000 | 654,783 |
| McDonald’s Corp. | 6,000,000 | 599,160 |
| General Motors Co. | 14,742,512 | 464,536 |
| Hasbro, Inc. | 4,656,346 | 366,641 |
| Marks and Spencer Group PLC | 40,000,000 | 339,815 |
| Wynn Macau, Ltd. | 154,424,000 | 319,115 |
| Time Warner Cable Inc. | 1,600,000 | 304,016 |
| Starwood Hotels & Resorts Worldwide, Inc. | 2,650,000 | 210,569 |
| Compass Group PLC | 9,411,761 | 150,653 |
| SES SA, Class A (FDR) | 4,870,000 | 150,640 |
| ProSiebenSat.1 Media SE | 2,745,000 | 140,334 |
| SJM Holdings Ltd. | 114,800,000 | 133,276 |
| Genuine Parts Co. | 689,282 | 61,312 |
| Cooper-Standard Holdings Inc.1 | 583,009 | 37,487 |
| TopBuild Corp.1 | 777,777 | 22,369 |
| Adelphia Recovery Trust, Series ACC-11,4 | 19,531,478 | 47 |
| | | 4,707,773 |
The Income Fund of America — Page 3 of 34
Common stocks
Materials 4.32% | Shares | Value
(000) |
| E.I. du Pont de Nemours and Co. | 19,374,268 | $1,080,309 |
| Dow Chemical Co. | 18,504,900 | 870,840 |
| Potash Corp. of Saskatchewan Inc. | 13,946,845 | 379,075 |
| Rio Tinto PLC | 9,018,000 | 350,173 |
| Air Products and Chemicals, Inc. | 2,425,000 | 345,587 |
| WestRock Co. | 4,432,218 | 279,496 |
| Nucor Corp. | 6,000,000 | 264,840 |
| BASF SE | 3,000,000 | 258,803 |
| Rexam PLC | 24,640,000 | 214,136 |
| The Chemours Co. | 7,570,581 | 82,671 |
| Fletcher Building Ltd. | 12,239,000 | 63,985 |
| | | 4,189,915 |
| Telecommunication services 3.98% | | |
| Verizon Communications Inc. | 32,239,039 | 1,508,465 |
| Telstra Corp. Ltd. | 141,451,533 | 671,027 |
| BT Group PLC | 45,572,915 | 330,544 |
| TalkTalk Telecom Group PLC2 | 58,313,942 | 274,473 |
| Deutsche Telekom AG | 13,740,000 | 248,230 |
| HKT Trust and HKT Ltd., units | 189,354,135 | 230,577 |
| Orange SA | 13,235,592 | 217,095 |
| AT&T Inc. | 3,750,000 | 130,275 |
| CenturyLink, Inc. | 4,290,000 | 122,694 |
| NII Holdings, Inc., Class B1,2 | 7,992,669 | 114,295 |
| Mobile TeleSystems OJSC (ADR) | 2,270,000 | 18,614 |
| | | 3,866,289 |
| Utilities 3.84% | | |
| PG&E Corp. | 11,300,000 | 593,363 |
| EDP - Energias de Portugal, SA | 134,952,000 | 499,175 |
| Duke Energy Corp. | 5,874,999 | 436,042 |
| DTE Energy Co. | 5,275,000 | 424,427 |
| Power Assets Holdings Ltd. | 43,556,000 | 410,429 |
| SSE PLC | 11,787,072 | 278,870 |
| Dominion Resources, Inc. | 3,570,000 | 255,969 |
| FirstEnergy Corp. | 6,987,983 | 237,312 |
| HK Electric Investments and HK Electric Investments Ltd., units | 230,870,000 | 160,519 |
| National Grid PLC | 10,800,000 | 143,882 |
| TerraForm Power, Inc., Class A | 3,190,000 | 96,210 |
| NextEra Energy, Inc. | 640,000 | 67,328 |
| Exelon Corp. | 2,000,000 | 64,180 |
| Ratchaburi Electricity Generating Holding PCL | 35,748,000 | 54,517 |
| | | 3,722,223 |
| Miscellaneous 4.25% | | |
| Other common stocks in initial period of acquisition | | 4,123,890 |
| Total common stocks (cost: $55,009,922,000) | | 69,141,636 |
Preferred securities 0.48%
Financials 0.48% | | |
| Citigroup Inc., Series K, depositary shares | 2,771,488 | 75,994 |
| Citigroup Inc. 7.875% preferred | 2,637,610 | 67,180 |
| Vornado Realty Trust, Series I, 6.625% | 3,380,000 | 86,021 |
The Income Fund of America — Page 4 of 34
Preferred securities
Financials (continued) | Shares | Value
(000) |
| U.S. Bancorp, Series G, noncumulative convertible preferred | 2,270,400 | $61,074 |
| PNC Financial Services Group, Inc., Series P, noncumulative depositary shares | 2,000,000 | 55,100 |
| Wells Fargo & Co., Class A, Series Q, 5.85% depositary shares preferred noncumulative | 1,600,000 | 41,200 |
| HSBC Holdings PLC, Series 2, 8.00% | 1,505,000 | 39,190 |
| Goldman Sachs Group, Inc., Series J, 5.50% depositary shares | 1,200,000 | 29,808 |
| Morgan Stanley, Series I, depositary shares | 272,400 | 7,004 |
| Total preferred securities (cost: $444,203,000) | | 462,571 |
Rights & warrants 0.00%
Energy 0.00% | | |
| Gener8 Maritime, Inc., warrants, expire 20171,3,4 | 8,514 | — |
| Total rights & warrants (cost: $2,171,000) | | — |
Convertible stocks 0.70%
Materials 0.10% | | |
| Alcoa Inc., Class B, Series 1, cummulative convertible preferred 2017 | 2,500,000 | 90,200 |
| Cliffs Natural Resources Inc., Series A, 7.00% convertible preferred 20162 | 2,925,000 | 7,400 |
| | | 97,600 |
| Energy 0.08% | | |
| Chesapeake Energy Corporation 5.75% convertible preferred3 | 125,700 | 72,277 |
| Financials 0.06% | | |
| American Tower Corp., Series A, convertible preferred | 600,000 | 62,130 |
| Industrials 0.04% | | |
| CEVA Group PLC, Series A-2, 2.289% convertible preferred4,5 | 13,633 | 10,089 |
| CEVA Group PLC, Series A-1, 3.289% convertible preferred4 | 29,937 | 29,937 |
| | | 40,026 |
| Consumer staples 0.04% | | |
| Bunge Ltd. 4.875% convertible preferred | 322,700 | 33,383 |
| Miscellaneous 0.38% | | |
| Other convertible stocks in initial period of acquisition | | 370,988 |
| Total convertible stocks (cost: $864,455,000) | | 676,404 |
Convertible bonds 0.64%
Financials 0.61% | Principal amount
(000) | |
| Barclays PLC, Equity Linked Notes (Weyerhaeuser Co.), 4.10% 2016 | $ 7,090 | 217,936 |
| Goldman Sachs, Equity Linked Notes (VF Corp), 4.30% 2016 | 2,161 | 158,284 |
| Goldman Sachs, Equity Linked Notes (Weyerhaeuser Co.), 4.10% 2016 | 6,562 | 198,867 |
| Lloyds Banking Group PLC, convertible notes, 7.50% 2049 | 21,200 | 22,154 |
| | | 597,241 |
The Income Fund of America — Page 5 of 34
Convertible bonds
Energy 0.03% | Principal amount
(000) | Value
(000) |
| American Energy (Permian Basin), convertible notes, 8.00% 20223,6 | $22,500 | $10,350 |
| American Energy Utica, LLC, convertible notes, 3.50% 20213,6 | 53,232 | 17,300 |
| | | 27,650 |
| Total convertible bonds (cost: $675,672,000) | | 624,891 |
Bonds, notes & other debt instruments 19.97%
Corporate bonds & notes 13.75%
Financials 2.58% | | |
| ACE INA Holdings Inc. 2.60% 2015 | 7,445 | 7,486 |
| ACE INA Holdings Inc. 3.15% 2025 | 9,885 | 9,627 |
| Alexandria Real Estate Equities, Inc. 2.75% 2020 | 795 | 788 |
| Alexandria Real Estate Equities, Inc. 3.90% 2023 | 1,600 | 1,599 |
| Alexandria Real Estate Equities, Inc. 4.50% 2029 | 1,355 | 1,361 |
| American Campus Communities, Inc. 3.75% 2023 | 3,985 | 3,929 |
| American Campus Communities, Inc. 4.125% 2024 | 19,700 | 19,861 |
| American Express Co. 6.15% 2017 | 12,610 | 13,779 |
| American Express Credit Co. 1.55% 2017 | 7,730 | 7,738 |
| American International Group, Inc. 2.30% 2019 | 9,785 | 9,808 |
| American International Group, Inc. 3.75% 2025 | 1,500 | 1,505 |
| American International Group, Inc. 3.875% 2035 | 5,000 | 4,570 |
| American Tower Corp. 3.40% 2019 | 6,400 | 6,543 |
| American Tower Corp. 7.25% 2019 | 15,025 | 17,365 |
| ANZ National (International) Ltd. 3.125% 20153 | 10,000 | 10,004 |
| AXA SA, Series B, junior subordinated 6.379% (undated)3 | 4,155 | 4,435 |
| Bank of America Corp. 3.75% 2016 | 9,975 | 10,214 |
| Bank of America Corp. 1.25% 2017 | 8,500 | 8,495 |
| Bank of America Corp. 5.75% 2017 | 8,100 | 8,802 |
| Bank of America Corp., Series L, 2.65% 2019 | 8,500 | 8,632 |
| Bank of America Corp. 5.625% 2020 | 9,000 | 10,146 |
| Bank of America Corp. 5.00% 2021 | 3,500 | 3,857 |
| Bank of America Corp. 3.875% 2025 | 56,375 | 57,106 |
| Bank of America Corp., Series L, 3.95% 2025 | 13,050 | 12,727 |
| Bank of America Corp., junior subordinated 6.50% noncumulative (undated) | 13,500 | 13,956 |
| Bank of America Corp., Series M, junior subordinated 8.125% noncumulative (undated) | 30,924 | 33,089 |
| Bank of New York Mellon Corp., Series G, 2.50% 2016 | 10,000 | 10,089 |
| Bank of Nova Scotia 2.55% 2017 | 9,000 | 9,183 |
| Barclays Bank PLC 3.65% 2025 | 16,785 | 16,130 |
| BB&T Corp. 1.00% 2017 | 8,500 | 8,458 |
| BB&T Corp. 2.45% 2020 | 19,000 | 19,121 |
| BBVA Bancomer SA 6.50% 20213 | 7,200 | 7,992 |
| Berkshire Hathaway Finance Corp. 4.30% 2043 | 1,800 | 1,772 |
| Berkshire Hathaway Inc. 2.20% 2016 | 11,500 | 11,669 |
| Berkshire Hathaway Inc. 2.90% 2020 | 6,000 | 6,205 |
| BNP Paribas 3.60% 2016 | 10,000 | 10,153 |
| BPCE SA group 4.00% 2024 | 3,525 | 3,647 |
| BPCE SA group 4.625% 20243 | 6,400 | 6,313 |
| BPCE SA group 5.15% 20243 | 11,725 | 12,071 |
| Brandywine Operating Partnership, LP 5.70% 2017 | 20 | 21 |
| Brandywine Operating Partnership, LP 3.95% 2023 | 1,729 | 1,705 |
| CIT Group Inc. 4.25% 2017 | 9,000 | 9,225 |
| CIT Group Inc. 5.00% 2017 | 11,000 | 11,413 |
| CIT Group Inc. 3.875% 2019 | 61,255 | 61,714 |
| CIT Group Inc., Series C, 5.50% 20193 | 13,650 | 14,469 |
The Income Fund of America — Page 6 of 34
Bonds, notes & other debt instruments
Corporate bonds & notes (continued)
Financials (continued) | Principal amount
(000) | Value
(000) |
| Citigroup Inc, Series O, 5.875% (undated) | $22,981 | $23,153 |
| Citigroup Inc., Series P, 5.95% (undated) | 25,090 | 24,494 |
| Citigroup Inc. 4.587% 2015 | 10,885 | 11,042 |
| Citigroup Inc. 3.953% 2016 | 7,115 | 7,296 |
| Citigroup Inc. 8.50% 2019 | 4,894 | 5,974 |
| Citigroup Inc. 2.40% 2020 | 10,820 | 10,764 |
| Citigroup Inc. 3.30% 2025 | 6,500 | 6,311 |
| Citigroup Inc. 4.65% 2045 | 2,719 | 2,746 |
| Citigroup Inc., Series A, junior subordinated 5.95% (undated) | 13,295 | 13,195 |
| CME Group Inc. 5.30% 2043 | 1,092 | 1,238 |
| CNA Financial Corp. 3.95% 2024 | 5,000 | 5,036 |
| Communications Sales & Leasing, Inc. 6.00% 20233 | 4,975 | 4,788 |
| Communications Sales & Leasing, Inc. 8.25% 20233 | 4,925 | 4,728 |
| Communications Sales & Leasing, Inc., Term Loan B, 5.00% 20227,8,9 | 7,750 | 7,566 |
| Corporate Office Properties LP 5.25% 2024 | 9,150 | 9,465 |
| Corporate Office Properties LP 5.00% 2025 | 4,145 | 4,172 |
| Corporate Office Properties Trust 3.60% 2023 | 320 | 297 |
| Credit Agricole SA 4.375% 20253 | 21,920 | 21,419 |
| Credit Suisse Group Funding (Guernsey) Ltd. 4.875% 20453 | 3,000 | 2,984 |
| Crescent Resources 10.25% 20173 | 36,046 | 37,983 |
| Crown Castle International Corp. 4.875% 2022 | 9,800 | 10,081 |
| DCT Industrial Trust Inc. 4.50% 2023 | 5,150 | 5,291 |
| DDR Corp. 3.625% 2025 | 5,000 | 4,801 |
| Developers Diversified Realty Corp. 9.625% 2016 | 2,525 | 2,651 |
| Developers Diversified Realty Corp. 7.50% 2017 | 38,892 | 42,452 |
| Developers Diversified Realty Corp. 4.75% 2018 | 5,000 | 5,315 |
| Developers Diversified Realty Corp. 7.875% 2020 | 6,505 | 7,940 |
| Discover Financial Services 4.20% 2023 | 5,460 | 5,575 |
| EPR Properties 4.50% 2025 | 7,755 | 7,599 |
| ERP Operating LP 7.125% 2017 | 10,000 | 11,162 |
| Essex Portfolio L.P. 3.625% 2022 | 9,550 | 9,672 |
| Essex Portfolio L.P. 3.25% 2023 | 4,400 | 4,272 |
| Essex Portfolio L.P. 3.875% 2024 | 12,650 | 12,723 |
| Essex Portfolio L.P. 3.50% 2025 | 5,620 | 5,454 |
| Felcor Lodging LP 6.00% 20253 | 2,725 | 2,820 |
| Goldman Sachs Group, Inc. 3.625% 2016 | 22,600 | 22,914 |
| Goldman Sachs Group, Inc. 1.086% 20177 | 43,381 | 43,474 |
| Goldman Sachs Group, Inc. 2.55% 2019 | 16,200 | 16,310 |
| Goldman Sachs Group, Inc. 2.60% 2020 | 7,900 | 7,903 |
| Goldman Sachs Group, Inc. 5.25% 2021 | 3,000 | 3,342 |
| Goldman Sachs Group, Inc. 5.75% 2022 | 20,000 | 22,926 |
| Goldman Sachs Group, Inc. 3.85% 2024 | 8,620 | 8,752 |
| Goldman Sachs Group, Inc. 3.50% 2025 | 7,965 | 7,812 |
| Goldman Sachs Group, Inc. 3.75% 2025 | 15,105 | 15,078 |
| Goldman Sachs Group, Inc. 5.15% 2045 | 900 | 898 |
| HBOS PLC 6.75% 20183 | 17,300 | 19,231 |
| Hospitality Properties Trust 6.30% 2016 | 8,650 | 8,788 |
| Hospitality Properties Trust 5.625% 2017 | 10,169 | 10,711 |
| Hospitality Properties Trust 6.70% 2018 | 12,625 | 13,647 |
| Hospitality Properties Trust 5.00% 2022 | 6,500 | 6,790 |
| Hospitality Properties Trust 4.50% 2023 | 11,060 | 11,085 |
| Hospitality Properties Trust 4.50% 2025 | 5,940 | 5,842 |
| HSBC Holdings PLC 4.25% 2024 | 9,000 | 9,186 |
| HSBK (Europe) BV 7.25% 20173 | 25,570 | 26,565 |
The Income Fund of America — Page 7 of 34
Bonds, notes & other debt instruments
Corporate bonds & notes (continued)
Financials (continued) | Principal amount
(000) | Value
(000) |
| Icahn Enterprises Finance Corp. 3.50% 2017 | $26,550 | $26,895 |
| Intercontinentalexchange, Inc. 2.50% 2018 | 12,000 | 12,228 |
| International Lease Finance Corp. 8.625% 2015 | 3,000 | 3,023 |
| Intesa Sanpaolo SpA 5.017% 20243 | 28,110 | 27,782 |
| Iron Mountain Inc. 6.00% 20232 | 950 | 992 |
| Iron Mountain Inc. 5.75% 20242 | 4,325 | 4,374 |
| iStar Financial Inc. 4.00% 2017 | 25,500 | 25,118 |
| iStar Financial Inc., Series B, 9.00% 2017 | 37,360 | 40,536 |
| iStar Financial Inc. 4.875% 2018 | 11,575 | 11,445 |
| iStar Financial Inc. 5.00% 2019 | 14,275 | 14,062 |
| JPMorgan Chase & Co. 1.35% 2017 | 12,240 | 12,245 |
| JPMorgan Chase & Co. 2.25% 2020 | 10,000 | 9,891 |
| JPMorgan Chase & Co. 3.25% 2022 | 5,000 | 5,012 |
| JPMorgan Chase & Co. 3.125% 2025 | 2,450 | 2,361 |
| JPMorgan Chase & Co. 3.90% 2025 | 11,850 | 12,115 |
| JPMorgan Chase & Co., Series Z, junior subordinated 5.30% (undated) | 41,690 | 41,644 |
| JPMorgan Chase & Co., Series S, junior subordinated 6.75% (undated) | 36,535 | 38,750 |
| JPMorgan Chase & Co., Series I, junior subordinated 7.90% (undated) | 74,825 | 79,034 |
| Keybank National Association 2.50% 2019 | 9,000 | 9,066 |
| Kimco Realty Corp., Series C, 5.783% 2016 | 15,000 | 15,409 |
| Kimco Realty Corp. 5.70% 2017 | 17,250 | 18,477 |
| Kimco Realty Corp. 6.875% 2019 | 10,000 | 11,706 |
| Leucadia National Corp. 5.50% 2023 | 13,255 | 13,740 |
| Liberty Mutual Group Inc. 4.25% 20233 | 4,400 | 4,549 |
| Liberty Mutual Group Inc., Series A, 7.80% 20873 | 19,415 | 23,055 |
| Lloyds Banking Group PLC 2.30% 2018 | 3,625 | 3,671 |
| Lloyds Banking Group PLC 4.50% 2024 | 19,000 | 19,241 |
| MetLife Capital Trust IV, junior subordinated 7.875% 20673 | 14,430 | 18,074 |
| MetLife Capital Trust X, junior subordinated 9.25% 20683 | 500 | 701 |
| MetLife Global Funding I 2.30% 20193 | 8,435 | 8,523 |
| MetLife Global Funding I 2.00% 20203 | 5,135 | 5,092 |
| MetLife, Inc. 4.05% 2045 | 9,025 | 8,528 |
| MetLife, Inc. 5.25% 2049 | 16,000 | 16,000 |
| Morgan Stanley 3.80% 2016 | 5,125 | 5,236 |
| Morgan Stanley, Series F, 3.875% 2024 | 7,500 | 7,634 |
| Morgan Stanley 4.00% 2025 | 21,914 | 22,428 |
| Morgan Stanley 4.35% 2026 | 10,200 | 10,218 |
| Morgan Stanley 4.30% 2045 | 3,375 | 3,227 |
| Nationwide Mutual Insurance Co. 2.576% 20243,7 | 8,150 | 8,166 |
| New York Life Global Funding 2.10% 20193 | 11,000 | 11,080 |
| New York Life Global Funding 1.95% 20203 | 1,820 | 1,801 |
| Ocwen Financial Corp. 7.125% 20193 | 4,000 | 3,800 |
| Outfront Media Inc. 5.625% 20242,3 | 7,650 | 7,832 |
| PNC Bank 2.40% 2019 | 7,825 | 7,891 |
| PNC Bank 3.25% 2025 | 2,500 | 2,468 |
| PNC Financial Services Group, Inc. 2.854% 2022 | 8,710 | 8,626 |
| PNC Financial Services Group, Inc. 3.90% 2024 | 10,250 | 10,373 |
| PNC Financial Services Group, Inc., Series O, junior subordinated 6.75% (undated) | 10,250 | 11,390 |
| PNC Preferred Funding Trust I, junior subordinated 1.936% (undated)3,7 | 23,800 | 22,134 |
| Prologis, Inc. 3.35% 2021 | 1,950 | 1,969 |
| Prologis, Inc. 4.25% 2023 | 30,260 | 31,369 |
| Prudential Financial, Inc. 3.50% 2024 | 12,000 | 11,962 |
| Prudential Financial, Inc. 4.60% 2044 | 2,500 | 2,478 |
| QBE Insurance Group Ltd. 2.40% 20183 | 16,910 | 17,043 |
The Income Fund of America — Page 8 of 34
Bonds, notes & other debt instruments
Corporate bonds & notes (continued)
Financials (continued) | Principal amount
(000) | Value
(000) |
| Rabobank Nederland 2.25% 2019 | $8,000 | $8,067 |
| Rabobank Nederland 4.625% 2023 | 9,280 | 9,625 |
| RBS Capital Trust II 6.425% noncumulative trust (undated) | 6,005 | 6,696 |
| Realogy Corp. 4.50% 20193 | 38,250 | 38,680 |
| Realogy Corp. 5.25% 20213 | 23,600 | 24,279 |
| Realogy Corp., LOC, 4.40% 20167,8,9 | 3,391 | 3,360 |
| Royal Bank of Scotland Group PLC, junior subordinated 6.99% (undated)3 | 12,735 | 15,075 |
| Ryman Hospitality Properties, Inc. 5.00% 2021 | 9,900 | 10,024 |
| Ryman Hospitality Properties, Inc. 5.00% 20233 | 3,325 | 3,325 |
| Scentre Group 2.375% 20213 | 4,575 | 4,441 |
| Scentre Group 3.25% 20253 | 6,790 | 6,539 |
| Scentre Group 3.50% 20253 | 17,280 | 16,971 |
| Select Income REIT 3.60% 2020 | 5,775 | 5,891 |
| Select Income REIT 4.15% 2022 | 3,300 | 3,272 |
| Select Income REIT 4.50% 2025 | 2,540 | 2,485 |
| SMFG Preferred Capital USD 3 Ltd., junior subordinated 9.50% (undated)3 | 116,330 | 139,120 |
| Société Générale, junior subordinated 5.922% (undated)3 | 45,073 | 46,194 |
| Synovus Financial Corp. 7.875% 2019 | 23,506 | 26,562 |
| Toronto-Dominion Bank 2.25% 2019 | 11,000 | 11,083 |
| Unum Group 7.125% 2016 | 6,740 | 7,162 |
| UnumProvident Finance Co. PLC 6.85% 20153 | 14,529 | 14,755 |
| US Bancorp., Series T, 1.65% 2017 | 10,000 | 10,108 |
| US Bancorp. 3.70% 2024 | 10,000 | 10,458 |
| WEA Finance LLC 1.75% 20173 | 12,360 | 12,377 |
| WEA Finance LLC 2.70% 20193 | 15,195 | 15,210 |
| WEA Finance LLC 3.75% 20243 | 7,600 | 7,621 |
| Wells Fargo & Co. 3.676% 2016 | 10,000 | 10,249 |
| Wells Fargo & Co. 2.60% 2020 | 10,000 | 10,056 |
| Wells Fargo & Co. 4.60% 2021 | 45,000 | 49,298 |
| Wells Fargo & Co. 3.30% 2024 | 1,625 | 1,615 |
| Wells Fargo & Co., Series K, junior subordinated 7.98% (undated) | 86,566 | 93,924 |
| Westpac Banking Corp. 3.00% 2015 | 9,000 | 9,082 |
| | | 2,498,553 |
| Consumer discretionary 2.01% | | |
| Amazon.com, Inc. 4.80% 2034 | 12,000 | 12,219 |
| Amazon.com, Inc. 4.95% 2044 | 9,000 | 9,076 |
| American Honda Finance Corp. 2.25% 2019 | 8,500 | 8,571 |
| Boyd Gaming Corp. 9.00% 2020 | 18,000 | 19,665 |
| Boyd Gaming Corp. 6.875% 2023 | 19,275 | 20,046 |
| Burger King Corp. 4.625% 20223 | 9,000 | 9,022 |
| Burger King Corp. 6.00% 20223 | 26,025 | 26,931 |
| Cablevision Systems Corp. 8.00% 2020 | 20,000 | 21,850 |
| Carnival Corp. 3.95% 2020 | 11,290 | 11,874 |
| CBS Corp. 1.95% 2017 | 5,000 | 5,032 |
| CBS Corp. 4.00% 2026 | 2,582 | 2,560 |
| CBS Outdoor Americas Inc. 5.25% 2022 | 25,000 | 25,219 |
| CBS Outdoor Americas Inc. 5.625% 2024 | 2,496 | 2,555 |
| CCO Holdings LLC and CCO Holdings Capital Corp. 7.00% 2019 | 3,429 | 3,566 |
| CCO Holdings LLC and CCO Holdings Capital Corp. 3.579% 20203 | 11,045 | 11,082 |
| CCO Holdings LLC and CCO Holdings Capital Corp. 6.50% 2021 | 7,000 | 7,332 |
| CCO Holdings LLC and CCO Holdings Capital Corp. 4.464% 20223 | 19,690 | 19,843 |
| CCO Holdings LLC and CCO Holdings Capital Corp. 4.908% 20253 | 17,510 | 17,550 |
| CCO Holdings LLC and CCO Holdings Capital Corp. 6.384% 20353 | 11,750 | 12,104 |
The Income Fund of America — Page 9 of 34
Bonds, notes & other debt instruments
Corporate bonds & notes (continued)
Consumer discretionary (continued) | Principal amount
(000) | Value
(000) |
| CCO Holdings LLC and CCO Holdings Capital Corp. 6.484% 20453 | $15,225 | $15,789 |
| Cedar Fair, LP 5.375% 2024 | 16,750 | 17,214 |
| Cengage Learning Acquisitions, Inc., Term Loan B, 7.00% 20207,8,9 | 8,959 | 9,012 |
| Cequel Communications Holdings I, LLC and Cequel Capital Corp. 6.375% 20203 | 52,950 | 53,546 |
| CityCenter Holdings, Term Loan B, 4.25% 20207,8,9 | 2,841 | 2,853 |
| Clear Channel Worldwide Holdings, Inc. 7.625% 2020 | 23,960 | 25,263 |
| Comcast Corp. 5.65% 2035 | 7,000 | 8,143 |
| Comcast Corp. 6.45% 2037 | 25,000 | 31,542 |
| Comcast Corp. 4.75% 2044 | 7,855 | 8,256 |
| Comcast Corp. 4.60% 2045 | 1,750 | 1,795 |
| Cox Communications, Inc. 5.875% 20163 | 25,000 | 26,387 |
| Cumulus Media Holdings Inc. 7.75% 2019 | 42,213 | 37,147 |
| Cumulus Media Inc., Term Loan B, 4.25% 20207,8,9 | 10,624 | 9,827 |
| DaimlerChrysler North America Holding Corp. 2.625% 20163 | 2,000 | 2,031 |
| DaimlerChrysler North America Holding Corp. 1.375% 20173 | 8,585 | 8,553 |
| DaimlerChrysler North America Holding Corp. 2.25% 20193 | 14,000 | 13,935 |
| DaimlerChrysler North America Holding Corp. 2.25% 20203 | 16,990 | 16,798 |
| DaimlerChrysler North America Holding Corp. 3.25% 20243 | 770 | 771 |
| DaimlerChrysler North America Holding Corp. 3.30% 20253 | 2,000 | 1,977 |
| DaimlerChrysler North America Holding Corp. 8.50% 2031 | 2,000 | 2,990 |
| Delta 2 (Formula One), Term Loan B, 7.75% 20227,8,9 | 12,125 | 12,136 |
| DISH DBS Corp. 4.625% 2017 | 23,825 | 24,510 |
| DISH DBS Corp. 4.25% 2018 | 36,875 | 37,612 |
| DISH DBS Corp. 7.875% 2019 | 1,425 | 1,598 |
| DISH DBS Corp. 5.125% 2020 | 10,000 | 10,150 |
| Family Tree Escrow LLC 5.25% 20203 | 4,025 | 4,267 |
| Family Tree Escrow LLC 5.75% 20233 | 8,050 | 8,533 |
| Federated Department Stores, Inc. 6.90% 2029 | 7,925 | 9,838 |
| Ford Motor Credit Co. 1.70% 2016 | 8,500 | 8,525 |
| Ford Motor Credit Co. 2.50% 2016 | 7,000 | 7,043 |
| Ford Motor Credit Co. 8.00% 2016 | 1,500 | 1,627 |
| Ford Motor Credit Co. 2.145% 2018 | 8,170 | 8,174 |
| Ford Motor Credit Co. 2.375% 2018 | 10,905 | 10,994 |
| Ford Motor Credit Co. 2.597% 2019 | 7,270 | 7,244 |
| Ford Motor Credit Co. 3.157% 2020 | 10,000 | 10,038 |
| Ford Motor Credit Co. 3.219% 2022 | 16,000 | 15,733 |
| Ford Motor Credit Co. 4.375% 2023 | 8,850 | 9,159 |
| Ford Motor Credit Co. 3.664% 2024 | 7,000 | 6,849 |
| Gannett Co., Inc. 5.125% 2019 | 7,925 | 8,282 |
| Gannett Co., Inc. 4.875% 20213 | 6,835 | 6,869 |
| Gannett Co., Inc. 6.375% 2023 | 4,065 | 4,319 |
| Gannett Co., Inc. 5.50% 20243 | 6,500 | 6,549 |
| General Motors Co. 4.00% 2025 | 9,345 | 8,973 |
| General Motors Co. 5.20% 2045 | 8,000 | 7,844 |
| General Motors Financial Co. 6.75% 2018 | 2,760 | 3,052 |
| General Motors Financial Co. 3.50% 2019 | 8,795 | 8,948 |
| General Motors Financial Co. 4.375% 2021 | 21,275 | 21,841 |
| General Motors Financial Co. 3.45% 2022 | 33,990 | 32,835 |
| Hilton Worldwide Finance LLC 5.625% 2021 | 9,565 | 10,007 |
| Hilton Worldwide, Term Loan B, 3.50% 20207,8,9 | 14,924 | 14,972 |
| Home Depot, Inc. 2.00% 2019 | 11,500 | 11,597 |
| Home Depot, Inc. 2.625% 2022 | 21,500 | 21,309 |
| Home Depot, Inc. 5.95% 2041 | 25,000 | 31,216 |
| Home Depot, Inc. 4.25% 2046 | 3,500 | 3,538 |
The Income Fund of America — Page 10 of 34
Bonds, notes & other debt instruments
Corporate bonds & notes (continued)
Consumer discretionary (continued) | Principal amount
(000) | Value
(000) |
| Hyundai Capital America 2.60% 20203 | $3,250 | $3,244 |
| Hyundai Capital Services Inc. 2.625% 20203 | 1,055 | 1,055 |
| iHeartCommunications, Inc. 10.625% 20233 | 19,310 | 18,151 |
| International Game Technology 6.25% 20223 | 19,000 | 18,834 |
| La Quinta Properties, Inc., First Lien Term Loan B, 4.00% 20217,8,9 | 18,348 | 18,411 |
| Limited Brands, Inc. 8.50% 2019 | 16,105 | 19,024 |
| Limited Brands, Inc. 7.00% 2020 | 21,271 | 24,355 |
| Limited Brands, Inc. 6.625% 2021 | 23,754 | 26,827 |
| Mediacom Broadband LLC and Mediacom Broadband Corp. 5.50% 2021 | 17,225 | 16,773 |
| Mediacom LLC and Mediacom Capital Corp. 7.25% 2022 | 7,775 | 8,076 |
| MGM Resorts International 7.50% 2016 | 8,425 | 8,804 |
| MGM Resorts International 8.625% 2019 | 5,425 | 6,144 |
| MGM Resorts International 6.75% 2020 | 7,350 | 7,901 |
| MGM Resorts International 7.75% 2022 | 17,000 | 18,934 |
| MGM Resorts International 6.00% 2023 | 15,000 | 15,300 |
| Michaels Stores, Inc. 5.875% 20203 | 14,125 | 14,902 |
| Mohegan Tribal Gaming Authority 11.00% 20183,6 | 11,950 | 12,040 |
| Myriad International Holdings 6.00% 20203 | 40,000 | 43,681 |
| NBC Universal Enterprise, Inc. 0.974% 20183,7 | 8,625 | 8,639 |
| NBC Universal Enterprise, Inc. 5.25% (undated)3 | 37,105 | 39,563 |
| NBCUniversal Media, LLC 2.875% 2016 | 10,000 | 10,144 |
| NCL Corp. Ltd. 5.00% 2018 | 575 | 587 |
| NCL Corp. Ltd. 5.25% 20193 | 17,000 | 17,680 |
| Needle Merger Sub Corp. 8.125% 20193 | 33,920 | 32,224 |
| Neiman Marcus Group LTD Inc. 8.00% 20213 | 49,600 | 52,824 |
| Neiman Marcus Group LTD Inc. 8.75% 20213,6 | 14,555 | 15,683 |
| Neiman Marcus, Term Loan B, 4.25% 20207,8,9 | 36,894 | 36,810 |
| PETCO Animal Supplies, Inc. 9.25% 20183 | 21,600 | 22,572 |
| PETsMART, Inc. 7.125% 20233 | 12,150 | 12,879 |
| Pinnacle Entertainment, Inc. 6.375% 2021 | 17,275 | 18,722 |
| Playa Resorts Holding BV 8.00% 20203 | 24,490 | 25,531 |
| Playa Resorts Holding BV, Term Loan B, 4.00% 20197,8,9 | 5,401 | 5,408 |
| President & Fellows of Harvard College 3.619% 2037 | 10,000 | 9,754 |
| RCI Banque 3.50% 20183 | 12,500 | 12,983 |
| Sally Holdings LLC and Sally Capital Inc. 6.875% 2019 | 11,950 | 12,559 |
| Schaeffler Holding Finance BV 7.625% 20183,6 | 5,450 | 5,654 |
| Schaeffler Holding Finance BV 6.25% 20193,6 | 11,500 | 12,190 |
| Seminole Tribe of Florida 6.535% 20203,8 | 8,830 | 9,448 |
| Six Flags Entertainment Corp. 5.25% 20213 | 7,087 | 7,335 |
| Sotheby’s Holdings, Inc. 5.25% 20223 | 4,475 | 4,397 |
| Stackpole Intl. 7.75% 20213 | 37,765 | 36,349 |
| Standard Pacific Corp. 8.375% 2021 | 2,475 | 2,927 |
| Starbucks Corp. 2.70% 2022 | 2,140 | 2,147 |
| Starbucks Corp. 4.30% 2045 | 3,120 | 3,167 |
| Station Casinos LLC 7.50% 2021 | 2,500 | 2,681 |
| Thomson Reuters Corp. 1.30% 2017 | 1,510 | 1,508 |
| Thomson Reuters Corp. 1.65% 2017 | 6,765 | 6,777 |
| Thomson Reuters Corp. 4.30% 2023 | 1,285 | 1,342 |
| Thomson Reuters Corp. 5.65% 2043 | 1,425 | 1,550 |
| Time Warner Cable Inc. 6.75% 2018 | 18,630 | 20,730 |
| Time Warner Cable Inc. 5.00% 2020 | 35,000 | 37,590 |
| Time Warner Inc. 4.75% 2021 | 15,000 | 16,257 |
| Time Warner Inc. 3.60% 2025 | 21,900 | 21,310 |
| Toyota Motor Credit Corp. 1.45% 2018 | 2,000 | 2,002 |
The Income Fund of America — Page 11 of 34
Bonds, notes & other debt instruments
Corporate bonds & notes (continued)
Consumer discretionary (continued) | Principal amount
(000) | Value
(000) |
| Toyota Motor Credit Corp. 2.125% 2019 | $1,500 | $1,507 |
| Toyota Motor Credit Corp. 2.15% 2020 | 15,000 | 14,988 |
| Univision Communications Inc. 5.125% 20233 | 1,250 | 1,259 |
| Univision Communications Inc., Term Loan C3, 4.00% 20207,8,9 | 17,053 | 17,064 |
| Viacom Inc. 3.875% 2024 | 1,098 | 1,066 |
| Viacom Inc. 4.85% 2034 | 370 | 343 |
| Viacom Inc. 5.85% 2043 | 1,750 | 1,737 |
| Viacom Inc. 5.25% 2044 | 1,000 | 932 |
| Virgin Media Secured Finance PLC 5.375% 20213,8 | 15,840 | 16,355 |
| Volkswagen Group of America Finance, LLC 1.60% 20173 | 6,000 | 6,008 |
| Volkswagen Group of America Finance, LLC 2.45% 20193 | 1,385 | 1,392 |
| Volkswagen International Finance NV 2.875% 20163 | 2,000 | 2,029 |
| Volkswagen International Finance NV 2.375% 20173 | 14,500 | 14,760 |
| Warner Music Group 6.00% 20213 | 15,146 | 15,600 |
| Warner Music Group 5.625% 20223 | 9,087 | 9,201 |
| Warner Music Group 6.75% 20223 | 13,750 | 13,337 |
| Weather Company, Term Loan, 7.00% 20207,8,9 | 2,500 | 2,348 |
| WPP Finance 2010 3.75% 2024 | 2,000 | 1,986 |
| Wynn Las Vegas, LLC and Wynn Capital Corp. 5.375% 2022 | 11,725 | 11,872 |
| Wynn Macau, Ltd. 5.25% 20213 | 45,050 | 42,910 |
| ZF Friedrichshafen AG 4.00% 20203 | 9,740 | 9,862 |
| ZF Friedrichshafen AG 4.50% 20223 | 6,880 | 6,803 |
| ZF Friedrichshafen AG 4.75% 20253 | 3,980 | 3,905 |
| | | 1,945,750 |
| Health care 1.82% | | |
| AbbVie Inc. 2.90% 2022 | 7,200 | 7,004 |
| AbbVie Inc. 3.20% 2022 | 2,675 | 2,662 |
| AbbVie Inc. 3.60% 2025 | 15,500 | 15,321 |
| AbbVie Inc. 4.50% 2035 | 15,695 | 15,364 |
| AbbVie Inc. 4.40% 2042 | 7,985 | 7,560 |
| AbbVie Inc. 4.70% 2045 | 22,730 | 22,341 |
| Actavis Funding SCS 2.35% 2018 | 11,135 | 11,176 |
| Actavis Funding SCS 3.00% 2020 | 16,590 | 16,594 |
| Actavis Funding SCS 3.45% 2022 | 20,180 | 19,904 |
| Actavis Funding SCS 3.80% 2025 | 33,710 | 32,970 |
| Actavis Funding SCS 4.55% 2035 | 18,570 | 17,550 |
| Actavis Funding SCS 4.75% 2045 | 7,840 | 7,444 |
| Amgen Inc. 2.125% 2020 | 1,800 | 1,773 |
| Amgen Inc. 2.70% 2022 | 5,990 | 5,834 |
| Amgen Inc. 3.125% 2025 | 4,700 | 4,484 |
| Amgen Inc. 4.40% 2045 | 1,400 | 1,313 |
| Baxalta Inc. 2.875% 20203 | 14,410 | 14,424 |
| Baxalta Inc. 4.00% 20253 | 10,140 | 10,074 |
| Baxalta Inc. 5.25% 20453 | 1,080 | 1,099 |
| Baxter International Inc. 1.85% 2018 | 3,180 | 3,170 |
| Bayer AG 2.375% 20193 | 11,390 | 11,484 |
| Bayer AG 3.375% 20243 | 7,190 | 7,197 |
| Becton, Dickinson and Co. 2.675% 2019 | 8,600 | 8,673 |
| Becton, Dickinson and Co. 3.734% 2024 | 1,305 | 1,301 |
| Becton, Dickinson and Co. 4.685% 2044 | 3,800 | 3,799 |
| Boston Scientific Corp. 2.85% 2020 | 7,875 | 7,855 |
| Boston Scientific Corp. 6.00% 2020 | 5,375 | 6,057 |
| Boston Scientific Corp. 3.375% 2022 | 14,300 | 14,072 |
The Income Fund of America — Page 12 of 34
Bonds, notes & other debt instruments
Corporate bonds & notes (continued)
Health care (continued) | Principal amount
(000) | Value
(000) |
| Boston Scientific Corp. 3.85% 2025 | $11,200 | $10,873 |
| Catholic Health Initiatives, Series 2012, 1.60% 2017 | 1,000 | 997 |
| Celgene Corp. 3.625% 2024 | 13,610 | 13,421 |
| Celgene Corp. 4.625% 2044 | 6,050 | 5,838 |
| Centene Corp. 5.75% 2017 | 10,060 | 10,608 |
| Centene Corp. 4.75% 2022 | 27,700 | 27,977 |
| ConvaTec Finance International SA 8.25% 20193,6 | 21,280 | 21,094 |
| DaVita HealthCare Partners Inc. 5.00% 2025 | 12,450 | 12,341 |
| DENTSPLY International Inc. 2.75% 2016 | 5,620 | 5,704 |
| DJO Finance LLC 10.75% 20203 | 13,253 | 13,568 |
| DJO Finco Inc. 8.125% 20213 | 38,580 | 39,737 |
| EMD Finance LLC 1.70% 20183 | 18,900 | 18,928 |
| EMD Finance LLC 2.40% 20203 | 22,050 | 22,016 |
| EMD Finance LLC 2.95% 20223 | 18,600 | 18,276 |
| EMD Finance LLC 3.25% 20253 | 29,900 | 28,982 |
| Endo Finance LLC & Endo Finco Inc. 7.25% 20203 | 6,350 | 6,691 |
| Endo Finance LLC & Endo Finco Inc. 6.00% 20233 | 14,605 | 15,262 |
| Endo Pharmaceuticals Holdings Inc. 5.75% 20223 | 4,575 | 4,712 |
| Express Scripts Inc. 3.125% 2016 | 13,564 | 13,773 |
| Express Scripts Inc. 7.25% 2019 | 8,985 | 10,514 |
| Gilead Sciences, Inc. 3.05% 2016 | 10,265 | 10,522 |
| Gilead Sciences, Inc. 4.80% 2044 | 1,615 | 1,673 |
| Gilead Sciences, Inc. 4.50% 2045 | 3,400 | 3,394 |
| HCA Inc. 3.75% 2019 | 26,082 | 26,522 |
| HCA Inc. 6.50% 2020 | 16,050 | 17,986 |
| HCA Inc. 4.75% 2023 | 1,035 | 1,065 |
| HCA Inc. 5.00% 2024 | 2,080 | 2,171 |
| Humana Inc. 3.85% 2024 | 4,400 | 4,432 |
| Humana Inc. 4.95% 2044 | 31,100 | 31,800 |
| inVentiv Health Inc, Term Loan B4, 7.75% 20187,8,9 | 16,305 | 16,339 |
| inVentiv Health Inc. 9.00% 20183 | 36,955 | 38,687 |
| inVentiv Health Inc. 11.00% 20183 | 22,533 | 21,519 |
| inVentiv Health Inc. 11.00% 20183 | 13,010 | 12,555 |
| inVentiv Health Inc. 12.00% 20183,6 | 49,568 | 52,294 |
| Jaguar Holding Co. 9.375% 20173,6 | 2,515 | 2,575 |
| Kindred Healthcare, Inc. 8.00% 20203 | 15,625 | 16,953 |
| Kindred Healthcare, Inc. 8.75% 20233 | 8,865 | 9,807 |
| Kinetic Concepts, Inc. 10.50% 2018 | 83,442 | 88,866 |
| Kinetic Concepts, Inc. 12.50% 2019 | 28,850 | 31,014 |
| Laboratory Corporation of America Holdings 3.20% 2022 | 5,335 | 5,287 |
| Laboratory Corporation of America Holdings 3.60% 2025 | 4,440 | 4,294 |
| Laboratory Corporation of America Holdings 4.70% 2045 | 1,375 | 1,287 |
| Mallinckrodt PLC 4.875% 20203 | 7,320 | 7,561 |
| McKesson Corp. 0.95% 2015 | 1,135 | 1,135 |
| McKesson Corp. 3.25% 2016 | 7,525 | 7,626 |
| McKesson Corp. 1.40% 2018 | 745 | 737 |
| McKesson Corp. 2.284% 2019 | 5,875 | 5,901 |
| McKesson Corp. 4.75% 2021 | 3,475 | 3,832 |
| McKesson Corp. 3.796% 2024 | 12,005 | 12,233 |
| Medco Health Solutions, Inc. 2.75% 2015 | 6,305 | 6,318 |
| Medtronic, Inc. 2.50% 20203 | 16,775 | 16,865 |
| Medtronic, Inc. 3.50% 20253 | 4,700 | 4,703 |
| Medtronic, Inc. 4.375% 20353 | 8,675 | 8,723 |
| Medtronic, Inc. 4.625% 20453 | 11,035 | 11,229 |
The Income Fund of America — Page 13 of 34
Bonds, notes & other debt instruments
Corporate bonds & notes (continued)
Health care (continued) | Principal amount
(000) | Value
(000) |
| Merck & Co., Inc. 1.10% 2018 | $6,710 | $6,696 |
| Multiplan Inc., Term Loan B, 3.75% 20217,8,9 | 25,098 | 24,972 |
| Ortho-Clinical Diagnostics Inc. 6.625% 20223 | 13,940 | 12,912 |
| Ortho-Clinical Diagnostics Inc., Term Loan B, 4.75% 20217,8,9 | 19,986 | 19,888 |
| Pfizer Inc. 7.20% 2039 | 1,353 | 1,864 |
| PRA Holdings, Inc. 9.50% 20233 | 5,376 | 5,981 |
| Quintiles Transnational Corp. 4.875% 20233 | 28,175 | 28,650 |
| Roche Holdings, Inc. 2.25% 20193 | 8,500 | 8,594 |
| Roche Holdings, Inc. 2.875% 20213 | 18,650 | 18,818 |
| Roche Holdings, Inc. 3.35% 20243 | 7,300 | 7,411 |
| Rotech Healthcare Inc., Term Loan A, 5.50% 20182,4,7,8,9 | 11,888 | 11,829 |
| Rotech Healthcare Inc., Term Loan B, 10.00% 20192,4,7,8,9 | 9,200 | 9,154 |
| Rotech Healthcare Inc., Term Loan, 13.00% 20202,4,6,7,8,9 | 20,744 | 20,640 |
| Select Medical Holdings Corp. 6.375% 2021 | 9,850 | 10,022 |
| Tenet Healthcare Corp., First Lien, 6.25% 2018 | 2,500 | 2,737 |
| Tenet Healthcare Corp., First Lien, 4.75% 2020 | 14,815 | 15,324 |
| Tenet Healthcare Corp., First Lien, 6.00% 2020 | 41,855 | 45,622 |
| Tenet Healthcare Corp. 4.375% 2021 | 5,800 | 5,859 |
| Tenet Healthcare Corp., First Lien, 4.50% 2021 | 15,440 | 15,575 |
| Tenet Healthcare Corp. 6.75% 20233 | 19,390 | 20,311 |
| Thermo Fisher Scientific Inc. 1.30% 2017 | 8,630 | 8,613 |
| Thermo Fisher Scientific Inc. 2.40% 2019 | 8,405 | 8,429 |
| Thermo Fisher Scientific Inc. 3.30% 2022 | 1,115 | 1,106 |
| Thermo Fisher Scientific Inc. 4.15% 2024 | 11,250 | 11,596 |
| Thermo Fisher Scientific Inc. 5.30% 2044 | 365 | 394 |
| UnitedHealth Group Inc. 1.40% 2017 | 6,500 | 6,477 |
| UnitedHealth Group Inc. 6.00% 2017 | 12,430 | 13,470 |
| UnitedHealth Group Inc. 2.70% 2020 | 5,310 | 5,377 |
| UnitedHealth Group Inc. 3.35% 2022 | 7,030 | 7,178 |
| UnitedHealth Group Inc. 3.75% 2025 | 17,710 | 18,095 |
| UnitedHealth Group Inc. 4.625% 2035 | 1,080 | 1,127 |
| UnitedHealth Group Inc. 4.75% 2045 | 1,800 | 1,894 |
| VPI Escrow Corp. 6.75% 20183 | 36,760 | 38,690 |
| VPI Escrow Corp. 6.375% 20203 | 48,255 | 50,969 |
| VPI Escrow Corp. 7.50% 20213 | 17,770 | 19,325 |
| VRX Escrow Corp. 5.375% 20203 | 31,200 | 32,136 |
| VRX Escrow Corp. 5.875% 20233 | 14,545 | 15,162 |
| VRX Escrow Corp. 6.125% 20253 | 38,095 | 39,905 |
| VWR Funding, Inc. 7.25% 2017 | 54,080 | 55,838 |
| WellPoint, Inc. 2.30% 2018 | 1,370 | 1,373 |
| WellPoint, Inc. 2.25% 2019 | 12,500 | 12,404 |
| Zimmer Holdings, Inc. 2.00% 2018 | 4,640 | 4,638 |
| Zimmer Holdings, Inc. 2.70% 2020 | 13,770 | 13,740 |
| Zimmer Holdings, Inc. 3.15% 2022 | 24,360 | 23,812 |
| Zimmer Holdings, Inc. 3.55% 2025 | 18,090 | 17,529 |
| | | 1,769,852 |
| Energy 1.76% | | |
| Alpha Natural Resources, Inc. 7.50% 20203,4 | 35,950 | 2,696 |
| Alpha Natural Resources, Inc. 7.50% 20203,4 | 24,559 | 1,842 |
| American Energy - Woodford LLC 12.00% 20203,6 | 11,147 | 7,037 |
| American Energy (Marcellus), Term Loan B, 5.25% 20207,8,9 | 25,050 | 17,785 |
| American Energy (Marcellus), Term Loan A, 8.50% 20214,7,8,9 | 23,825 | 9,768 |
| American Energy (Permian Basin), 6.78% 20193,7 | 10,000 | 6,075 |
The Income Fund of America — Page 14 of 34
Bonds, notes & other debt instruments
Corporate bonds & notes (continued)
Energy (continued) | Principal amount
(000) | Value
(000) |
| American Energy (Permian Basin) 7.125% 20203 | $24,550 | $14,975 |
| American Energy (Permian Basin) 7.375% 20213 | 15,350 | 9,095 |
| Anadarko Petroleum Corp. 5.95% 2016 | 10,500 | 11,019 |
| Anadarko Petroleum Corp. 6.375% 2017 | 13,500 | 14,760 |
| Anadarko Petroleum Corp. 8.70% 2019 | 32,255 | 38,814 |
| Anadarko Petroleum Corp. 6.45% 2036 | 1,095 | 1,237 |
| Anadarko Petroleum Corp. 6.20% 2040 | 500 | 552 |
| APT Pipelines Ltd. 4.20% 20253 | 15,140 | 14,889 |
| Baytex Energy Corp. 5.125% 20212,3 | 10,050 | 8,995 |
| Baytex Energy Corp. 5.625% 20242,3 | 3,450 | 2,984 |
| BG Energy Capital PLC 2.50% 20153 | 7,000 | 7,040 |
| BG Energy Capital PLC 2.875% 20163 | 7,395 | 7,529 |
| Blue Racer Midstream LLC / Blue Racer Finance Corp. 6.125% 20223 | 9,810 | 10,031 |
| Boardwalk Pipeline Partners 3.375% 2023 | 3,000 | 2,701 |
| Boardwalk Pipelines, LP 4.95% 2024 | 6,705 | 6,527 |
| Bonanza Creek Energy, Inc. 6.75% 2021 | 9,650 | 8,395 |
| Bonanza Creek Energy, Inc. 5.75% 2023 | 5,600 | 4,564 |
| Canadian Natural Resources Ltd. 5.70% 2017 | 7,350 | 7,836 |
| Canadian Natural Resources Ltd. 3.80% 2024 | 1,440 | 1,413 |
| Canadian Natural Resources Ltd. 6.50% 2037 | 1,000 | 1,102 |
| Cenovus Energy Inc. 3.00% 2022 | 5,970 | 5,649 |
| Cenovus Energy Inc. 3.80% 2023 | 19,005 | 18,663 |
| Chesapeake Energy Corp. 4.875% 2022 | 12,450 | 10,022 |
| Chevron Corp. 1.961% 2020 | 6,310 | 6,276 |
| Chevron Corp. 2.411% 2022 | 3,790 | 3,713 |
| CNOOC Finance (2013) Ltd. 3.00% 2023 | 5,150 | 4,888 |
| Columbia Pipeline Partners LP 4.50% 20253 | 3,715 | 3,708 |
| Columbia Pipeline Partners LP 5.80% 20453 | 895 | 886 |
| CONSOL Energy Inc. 5.875% 2022 | 16,600 | 12,979 |
| Denbury Resources Inc. 4.625% 2023 | 31,375 | 22,747 |
| Devon Energy Corp. 2.25% 2018 | 3,600 | 3,611 |
| Devon Energy Corp. 5.00% 2045 | 12,815 | 12,478 |
| Diamond Offshore Drilling, Inc. 4.875% 2043 | 23,515 | 18,291 |
| Ecopetrol SA 5.375% 2026 | 10,935 | 10,623 |
| Ecopetrol SA 5.875% 2045 | 2,115 | 1,856 |
| El Paso Pipeline Partners Operating Co., LLC 5.00% 2021 | 5,000 | 5,239 |
| El Paso Pipeline Partners Operating Co., LLC 4.70% 2042 | 41,015 | 33,881 |
| Enbridge Energy Partners, LP, Series B, 6.50% 2018 | 5,225 | 5,743 |
| Enbridge Energy Partners, LP 9.875% 2019 | 10,500 | 12,929 |
| Enbridge Energy Partners, LP, Series B, 7.50% 2038 | 6,000 | 6,875 |
| Enbridge Energy Partners, LP 5.50% 2040 | 1,200 | 1,144 |
| Enbridge Inc. 5.60% 2017 | 20,067 | 21,258 |
| Enbridge Inc. 4.00% 2023 | 27,650 | 26,636 |
| Enbridge Inc. 3.50% 2024 | 3,015 | 2,791 |
| Energy Transfer Partners, L.P. 5.50% 2027 | 2,650 | 2,610 |
| Energy Transfer Partners, LP 4.15% 2020 | 5,000 | 5,136 |
| Energy Transfer Partners, LP 4.75% 2026 | 11,850 | 11,622 |
| Energy Transfer Partners, LP 6.125% 2045 | 1,950 | 1,973 |
| EnLink Midstream Partners, LP 2.70% 2019 | 1,660 | 1,646 |
| EnLink Midstream Partners, LP 4.40% 2024 | 7,310 | 7,174 |
| EnLink Midstream Partners, LP 4.15% 2025 | 11,760 | 11,136 |
| EnLink Midstream Partners, LP 5.05% 2045 | 9,810 | 8,643 |
| Ensco PLC 5.20% 2025 | 11,300 | 10,771 |
| Ensco PLC 5.75% 2044 | 11,915 | 10,351 |
The Income Fund of America — Page 15 of 34
Bonds, notes & other debt instruments
Corporate bonds & notes (continued)
Energy (continued) | Principal amount
(000) | Value
(000) |
| Enterprise Products Operating LLC 5.20% 2020 | $5,500 | $6,119 |
| Enterprise Products Operating LLC 3.90% 2024 | 7,000 | 7,021 |
| Enterprise Products Operating LLC 3.70% 2026 | 615 | 598 |
| Enterprise Products Operating LLC 4.85% 2044 | 2,805 | 2,642 |
| Enterprise Products Operating LLC 4.90% 2046 | 1,040 | 984 |
| EP Energy Corp. 9.375% 2020 | 2,300 | 2,392 |
| EP Energy Corp. 6.375% 20233 | 13,850 | 13,106 |
| Exxon Mobil Corp. 1.305% 2018 | 9,560 | 9,563 |
| Exxon Mobil Corp. 1.819% 2019 | 1,280 | 1,289 |
| Exxon Mobil Corp. 1.912% 2020 | 5,610 | 5,584 |
| Exxon Mobil Corp. 2.397% 2022 | 21,035 | 20,742 |
| Exxon Mobil Corp. 2.709% 2025 | 15,440 | 15,016 |
| Exxon Mobil Corp. 3.567% 2045 | 1,410 | 1,315 |
| Genesis Energy, LP 6.75% 2022 | 6,250 | 6,250 |
| Jupiter Resources Inc. 8.50% 20223 | 31,425 | 21,526 |
| Kinder Morgan Energy Partners, LP 3.50% 2016 | 9,750 | 9,873 |
| Kinder Morgan Energy Partners, LP 2.65% 2019 | 1,890 | 1,863 |
| Kinder Morgan Energy Partners, LP 9.00% 2019 | 1,660 | 1,980 |
| Kinder Morgan Energy Partners, LP 4.15% 2022 | 12,145 | 11,951 |
| Kinder Morgan Energy Partners, LP 3.45% 2023 | 7,500 | 6,937 |
| Kinder Morgan Energy Partners, LP 3.50% 2023 | 4,850 | 4,466 |
| Kinder Morgan Energy Partners, LP 4.25% 2024 | 8,265 | 7,868 |
| Kinder Morgan Energy Partners, LP 6.95% 2038 | 460 | 489 |
| Kinder Morgan Energy Partners, LP 5.00% 2043 | 20,000 | 17,139 |
| Kinder Morgan Energy Partners, LP 5.40% 2044 | 9,660 | 8,700 |
| Kinder Morgan Energy Partners, LP 5.50% 2044 | 7,206 | 6,611 |
| Kinder Morgan, Inc. 3.05% 2019 | 8,070 | 8,013 |
| Kinder Morgan, Inc. 4.30% 2025 | 8,035 | 7,659 |
| Kinder Morgan, Inc. 5.55% 2045 | 6,160 | 5,628 |
| Laredo Petroleum, Inc. 5.625% 2022 | 2,000 | 1,935 |
| Matador Resources Co. 6.875% 20233 | 2,025 | 2,066 |
| NGL Energy Partners LP 5.125% 2019 | 8,390 | 8,191 |
| NGL Energy Partners LP 6.875% 2021 | 6,110 | 6,400 |
| NGPL PipeCo LLC 7.119% 20173 | 47,470 | 47,707 |
| NGPL PipeCo LLC 9.625% 20193 | 47,630 | 47,868 |
| NGPL PipeCo LLC, Term Loan B, 6.75% 20177,8,9 | 1,916 | 1,825 |
| Noble Corp PLC 4.00% 2018 | 7,555 | 7,548 |
| Noble Corp PLC 5.95% 2025 | 23,605 | 21,532 |
| Noble Corp PLC 6.95% 2045 | 25,605 | 21,770 |
| Oasis Petroleum Inc. 6.875% 2022 | 12,175 | 11,262 |
| Odebrecht Drilling Norbe VIII/IX Ltd 6.35% 20213,8 | 1,525 | 1,106 |
| Odebrecht Offshore Drilling Finance Ltd. 6.75% 20223,8 | 4,472 | 2,895 |
| PDC Energy Inc. 7.75% 2022 | 46,625 | 48,315 |
| Peabody Energy Corp. 6.00% 2018 | 123,645 | 44,821 |
| Peabody Energy Corp. 6.50% 2020 | 4,500 | 1,350 |
| Peabody Energy Corp. 6.25% 2021 | 32,150 | 9,243 |
| Petrobras Global Finance Co. 6.25% 2024 | 3,710 | 3,481 |
| Petrobras Global Finance Co. 6.85% 2115 | 2,775 | 2,250 |
| Petrobras International Finance Co. 5.75% 2020 | 6,535 | 6,318 |
| Petrobras International Finance Co. 5.375% 2021 | 28,655 | 26,748 |
| Petróleos Mexicanos 3.50% 2018 | 14,280 | 14,691 |
| Petróleos Mexicanos 3.50% 2023 | 11,000 | 10,462 |
| Petróleos Mexicanos 4.50% 20263 | 8,775 | 8,626 |
| Petróleos Mexicanos 5.625% 20463 | 7,290 | 6,897 |
The Income Fund of America — Page 16 of 34
Bonds, notes & other debt instruments
Corporate bonds & notes (continued)
Energy (continued) | Principal amount
(000) | Value
(000) |
| Phillips 66 Partners LP 3.605% 2025 | $1,640 | $1,523 |
| Phillips 66 Partners LP 4.68% 2045 | 245 | 219 |
| QGOG Atlantic/Alaskan Rigs Ltd. 5.25% 20193,8 | 13,450 | 11,163 |
| Range Resources Corp. 4.875% 20253 | 25,375 | 24,392 |
| Ras Laffan Liquefied Natural Gas II 5.298% 20203,8 | 17,854 | 19,327 |
| Ras Laffan Liquefied Natural Gas III 5.838% 20273,8 | 10,325 | 11,905 |
| Ras Laffan Liquefied Natural Gas III 6.75% 2019 | 4,000 | 4,748 |
| Ras Laffan Liquefied Natural Gas III 6.75% 20193 | 1,000 | 1,187 |
| Regency Energy Partners LP and Regency Energy Finance Corp. 6.50% 2021 | 14,855 | 15,598 |
| Regency Energy Partners LP and Regency Energy Finance Corp. 5.00% 2022 | 35 | 35 |
| Regency Energy Partners LP and Regency Energy Finance Corp. 5.50% 2023 | 10,875 | 10,957 |
| Rice Energy Inc. 6.25% 2022 | 32,300 | 30,685 |
| Rice Energy Inc. 7.25% 20233 | 6,775 | 6,690 |
| Sabine Pass Liquefaction, LLC 5.625% 2021 | 30,175 | 30,929 |
| Sabine Pass Liquefaction, LLC 6.25% 2022 | 15,000 | 15,525 |
| Sabine Pass Liquefaction, LLC 5.625% 2023 | 5,500 | 5,527 |
| Sabine Pass Liquefaction, LLC 5.75% 2024 | 6,675 | 6,671 |
| Sabine Pass Liquefaction, LLC 5.625% 20253 | 15,625 | 15,449 |
| Samson Investment Co. 9.75% 2020 | 9,820 | 11 |
| Samson Investment Co., Term Loan B, 5.00% 20187,8,9 | 1,450 | 420 |
| SandRidge Energy, Inc. 7.50% 2023 | 13,600 | 4,012 |
| Seven Generations Energy Ltd. 6.75% 20233 | 14,066 | 13,820 |
| Shell International Finance BV 2.00% 2018 | 4,990 | 5,045 |
| Shell International Finance BV 2.125% 2020 | 8,145 | 8,132 |
| Shell International Finance BV 3.25% 2025 | 16,130 | 15,987 |
| Shell International Finance BV 4.125% 2035 | 5,000 | 4,988 |
| SM Energy Co. 5.625% 2025 | 14,800 | 14,023 |
| Southwestern Energy Co. 4.95% 2025 | 15,600 | 15,330 |
| Spectra Energy Partners, LP 4.75% 2024 | 3,250 | 3,431 |
| Statoil ASA 3.125% 2017 | 10,000 | 10,369 |
| Statoil ASA 2.75% 2021 | 3,085 | 3,095 |
| Statoil ASA 3.25% 2024 | 850 | 849 |
| Statoil ASA 4.25% 2041 | 3,000 | 2,965 |
| StatoilHydro ASA 1.80% 2016 | 10,000 | 10,117 |
| Targa Resources Corp. 4.125% 20193 | 5,750 | 5,779 |
| TC PipeLines, LP 4.375% 2025 | 11,815 | 11,644 |
| Teekay Corp. 8.50% 2020 | 21,405 | 23,599 |
| Tesoro Logistics LP 5.50% 20193 | 7,785 | 8,096 |
| Tesoro Logistics LP 6.25% 20223 | 7,900 | 8,295 |
| Total Capital International 2.125% 2018 | 6,500 | 6,591 |
| Total Capital International 2.10% 2019 | 8,500 | 8,571 |
| TransCanada PipeLines Ltd. 7.625% 2039 | 10,750 | 14,407 |
| TransCanada PipeLines Ltd., junior subordinated 6.35% 2067 | 61,150 | 56,946 |
| TransCanada PipeLines Ltd., junior subordinated 5.625% 2075 | 3,385 | 3,401 |
| Transocean Inc. 5.55% 2016 | 18,395 | 18,648 |
| Transocean Inc. 6.875% 2021 | 20,000 | 16,975 |
| Transportadora de Gas Peru SA 4.25% 20283,8 | 1,925 | 1,896 |
| Western Gas Partners LP 2.60% 2018 | 1,150 | 1,151 |
| Western Gas Partners LP 3.95% 2025 | 3,045 | 2,922 |
| Williams Partners LP 5.25% 2020 | 1,960 | 2,129 |
| Williams Partners LP 4.00% 2021 | 2,900 | 2,910 |
| Williams Partners LP 4.50% 2023 | 6,000 | 5,954 |
| Williams Partners LP 4.30% 2024 | 7,670 | 7,458 |
| Williams Partners LP 3.90% 2025 | 14,300 | 13,388 |
The Income Fund of America — Page 17 of 34
Bonds, notes & other debt instruments
Corporate bonds & notes (continued)
Energy (continued) | Principal amount
(000) | Value
(000) |
| Williams Partners LP 4.00% 2025 | $14,725 | $13,721 |
| Williams Partners LP 5.40% 2044 | 760 | 691 |
| Williams Partners LP 4.90% 2045 | 3,260 | 2,786 |
| Williams Partners LP 5.10% 2045 | 6,965 | 6,092 |
| Woodside Finance Ltd. 4.60% 20213 | 18,935 | 20,124 |
| | | 1,711,538 |
| Telecommunication services 1.51% | | |
| Altice Financing SA 6.625% 20233 | 68,625 | 70,855 |
| Altice Finco SA 6.50% 20223 | 12,500 | 13,031 |
| Altice Finco SA 7.625% 20253 | 1,475 | 1,505 |
| Altice Finco SA, First Lien, 7.75% 20223 | 12,550 | 12,628 |
| Altice SA 7.625% 20253 | 16,350 | 16,064 |
| AT&T Inc. 2.40% 2016 | 9,000 | 9,119 |
| AT&T Inc. 3.40% 2025 | 48,167 | 46,167 |
| AT&T Inc. 4.50% 2035 | 15,850 | 14,710 |
| AT&T Inc. 4.30% 2042 | 3,235 | 2,815 |
| AT&T Inc. 4.75% 2046 | 3,234 | 2,994 |
| Clearwire Communications and Clearwire Finance, Inc. 14.75% 20163 | 6,125 | 7,059 |
| Deutsche Telekom International Finance BV 9.25% 2032 | 8,420 | 12,873 |
| France Télécom 2.75% 2016 | 9,000 | 9,152 |
| France Télécom 4.125% 2021 | 15,000 | 15,967 |
| Frontier Communications Corp. 8.125% 2018 | 26,547 | 28,638 |
| Frontier Communications Corp. 9.25% 2021 | 11,400 | 11,899 |
| Frontier Communications Corp. 8.75% 2022 | 1,000 | 997 |
| Frontier Communications Corp. 7.125% 2023 | 6,225 | 5,649 |
| Frontier Communications Corp. 7.625% 2024 | 20,000 | 18,300 |
| Intelsat Jackson Holding Co. 7.25% 2020 | 23,004 | 22,918 |
| Intelsat Jackson Holding Co. 6.625% 2022 | 63,300 | 58,078 |
| Intelsat Luxembourg Holding Co. 6.75% 2018 | 2,500 | 2,347 |
| LightSquared, Term Loan, 9.00% 20154,6,7,8,9 | 23,723 | 24,362 |
| LightSquared, Term Loan, 9.00% 20154,6,7,8,9 | 8,968 | 8,968 |
| MetroPCS Wireless, Inc. 6.25% 2021 | 42,375 | 44,494 |
| MetroPCS Wireless, Inc. 6.625% 2023 | 59,550 | 63,570 |
| Numericable Group SA 4.875% 20193 | 72,250 | 73,514 |
| Numericable Group SA 6.00% 20223 | 21,575 | 21,985 |
| Orange SA 5.50% 2044 | 3,000 | 3,197 |
| Qwest Capital Funding, Inc. 7.625% 2021 | 3,900 | 4,240 |
| SoftBank Corp. 4.50% 20203 | 48,375 | 48,677 |
| Sprint Capital Corp. 6.90% 2019 | 5,025 | 4,937 |
| Sprint Nextel Corp. 8.375% 2017 | 10,000 | 10,600 |
| Sprint Nextel Corp. 9.125% 2017 | 29,696 | 31,515 |
| Sprint Nextel Corp. 9.00% 20183 | 5,000 | 5,612 |
| Sprint Nextel Corp. 7.00% 2020 | 69,300 | 66,788 |
| Sprint Nextel Corp. 7.25% 2021 | 36,155 | 34,664 |
| Sprint Nextel Corp. 11.50% 2021 | 21,305 | 24,288 |
| Sprint Nextel Corp. 7.875% 2023 | 77,850 | 74,752 |
| Sprint Nextel Corp. 7.125% 2024 | 14,000 | 12,845 |
| Telefónica Emisiones, SAU 3.992% 2016 | 10,000 | 10,149 |
| Telefónica Emisiones, SAU 3.192% 2018 | 8,500 | 8,740 |
| Telefónica Emisiones, SAU 5.134% 2020 | 7,950 | 8,788 |
| T-Mobile US, Inc. 6.542% 2020 | 47,900 | 50,578 |
| T-Mobile US, Inc. 6.731% 2022 | 3,695 | 3,926 |
| Trilogy International Partners, LLC 10.25% 20163 | 47,050 | 46,285 |
The Income Fund of America — Page 18 of 34
Bonds, notes & other debt instruments
Corporate bonds & notes (continued)
Telecommunication services (continued) | Principal amount
(000) | Value
(000) |
| Verizon Communications Inc. 2.625% 2020 | $4,125 | $4,129 |
| Verizon Communications Inc. 3.00% 2021 | 2,516 | 2,501 |
| Verizon Communications Inc. 5.15% 2023 | 25,658 | 28,317 |
| Verizon Communications Inc. 4.272% 20363 | 92,860 | 84,674 |
| Verizon Communications Inc. 6.00% 2041 | 28,000 | 31,433 |
| Verizon Communications Inc. 6.55% 2043 | 4,402 | 5,219 |
| Verizon Communications Inc. 4.522% 20483 | 112,790 | 100,914 |
| Wind Acquisition SA 4.75% 20203 | 72,510 | 74,323 |
| Wind Acquisition SA 7.375% 20213 | 60,900 | 64,706 |
| | | 1,467,455 |
| Industrials 1.31% | | |
| AAF Holdings LLC 12.75% 20193,6 | 7,807 | 7,738 |
| ABB Finance (USA) Inc. 1.625% 2017 | 1,000 | 1,006 |
| ABB Finance (USA) Inc. 2.875% 2022 | 1,000 | 988 |
| ADS Waste Escrow 8.25% 2020 | 4,675 | 4,909 |
| ADT Corp. 4.125% 2019 | 20,450 | 20,885 |
| Altegrity, Inc. 9.50% 20193 | 49,900 | 47,904 |
| American Airlines, Inc., Series 2013-2, Class A, 4.95% 20248 | 8,114 | 8,687 |
| Associated Materials, LLC and AMH New Finance, Inc. 9.125% 2017 | 79,655 | 68,304 |
| Atlas Copco AB 5.60% 20173 | 5,500 | 5,892 |
| B/E Aerospace, Inc., Term Loan B, 4.00% 20217,8,9 | 14,997 | 15,151 |
| Builders Firstsource 7.625% 20213 | 13,745 | 14,364 |
| Burlington Northern Santa Fe LLC 3.00% 2023 | 4,580 | 4,491 |
| Canadian National Railway Co. 1.45% 2016 | 5,010 | 5,043 |
| Canadian Pacific Railway Ltd. 4.80% 2045 | 1,570 | 1,593 |
| Cenveo, Inc. 6.00% 20193 | 1,030 | 927 |
| CEVA Group PLC 7.00% 20213 | 2,250 | 2,149 |
| CEVA Group PLC 9.00% 20213 | 1,050 | 1,007 |
| CEVA Group PLC, LOC, 6.50% 20217,8,9 | 4,870 | 4,497 |
| CEVA Group PLC, Term Loan B, 6.50% 20217,8,9 | 6,995 | 6,459 |
| CEVA Group PLC, Term Loan, 6.50% 20217,8,9 | 5,072 | 4,683 |
| CEVA Group PLC, Term Loan, 6.50% 20217,8,9 | 874 | 807 |
| Continental Airlines, Inc., Series 2001-1, Class B, 7.373% 20178 | 2,194 | 2,238 |
| Continental Airlines, Inc., Series 1998-1, Class B, 6.748% 20188 | 435 | 459 |
| Continental Airlines, Inc., Series 1997-4B, Class B, 6.90% 20188 | 32 | 33 |
| Continental Airlines, Inc., Series 1998-1, Class A, 6.648% 20198 | 2,312 | 2,397 |
| Continental Airlines, Inc., Series 1997-4, Class A, 6.90% 20198 | 1,115 | 1,166 |
| Continental Airlines, Inc., Series 2000-2, Class B, 8.307% 20198 | 137 | 147 |
| Continental Airlines, Inc., Series 1999-1, Class A, 6.545% 20208 | 10,039 | 10,986 |
| Continental Airlines, Inc., Series 1999-1, Class B, 6.795% 20208 | 107 | 111 |
| Continental Airlines, Inc., Series 1999-2, Class A-1, 7.256% 20218 | 362 | 399 |
| Continental Airlines, Inc., Series 1999-2, Class B, 7.566% 20218 | 342 | 351 |
| Continental Airlines, Inc., Series 2001-1, Class A-1, 6.703% 20228 | 3,515 | 3,761 |
| Continental Airlines, Inc., Series 2007-1, Class B, 6.903% 20228 | 10,142 | 10,605 |
| Continental Airlines, Inc., Series 2000-2, Class A-1, 7.707% 20228 | 2,192 | 2,428 |
| Continental Airlines, Inc., Series 2000-1, Class A-1, 8.048% 20228 | 3,275 | 3,716 |
| Continental Airlines, Inc., Series 2000-1, Class B, 8.388% 20228 | 36 | 38 |
| DAE Aviation Holdings, Inc. 10.00% 20233 | 40,090 | 40,591 |
| Delta Air Lines, Inc., Series 2002-1, Class G-1, MBIA insured, 6.718% 20248 | 4,641 | 5,291 |
| ERAC USA Finance Co. 5.25% 20203 | 5,000 | 5,561 |
| Esterline Technologies Corp. 7.00% 2020 | 18,065 | 18,697 |
| Euramax International, Inc. 9.50% 2016 | 34,155 | 34,198 |
| Euramax International, Inc. 12.00% 20203 | 21,100 | 21,100 |
The Income Fund of America — Page 19 of 34
Bonds, notes & other debt instruments
Corporate bonds & notes (continued)
Industrials (continued) | Principal amount
(000) | Value
(000) |
| European Aeronautic Defence and Space Company 2.70% 20233 | $3,000 | $2,898 |
| Gardner Denver, Inc., Term Loan B, 4.25% 20207,8,9 | 22,942 | 22,189 |
| Gates Global LLC 6.00% 20223 | 12,575 | 11,223 |
| Gates Global LLC, Term Loan B, 4.25% 20217,8,9 | 7,642 | 7,623 |
| General Electric Capital Corp. 2.95% 2016 | 4,650 | 4,731 |
| General Electric Capital Corp. 2.45% 2017 | 13,000 | 13,267 |
| General Electric Capital Corp., Series A, 6.00% 2019 | 9,000 | 10,345 |
| General Electric Capital Corp. 2.20% 2020 | 7,720 | 7,737 |
| General Electric Capital Corp., Series B, junior subordinated 6.25% (undated) | 50,000 | 54,352 |
| General Electric Capital Corp., Series A, junior subordinated 7.125% (undated) | 112,300 | 129,987 |
| General Electric Co. 2.70% 2022 | 7,750 | 7,666 |
| General Electric Co. 4.125% 2042 | 11,000 | 10,879 |
| Hardwoods Acquisition Inc 7.50% 20213 | 11,540 | 11,021 |
| Hawker Beechcraft Acquisition Co., LLC, LOC, 0.05% 20154,7,8,9,10 | 1,488 | 1,414 |
| HD Supply, Inc. 7.50% 2020 | 2,500 | 2,688 |
| HD Supply, Inc. 11.50% 2020 | 34,494 | 40,250 |
| HD Supply, Inc. 5.25% 20213 | 12,725 | 13,154 |
| HDTFS Inc. 5.875% 2020 | 5,400 | 5,521 |
| Jeld-Wen Escrow Corp., Term Loan B, 5.25% 20217,8,9 | 24,129 | 24,242 |
| KLX Inc. 5.875% 20223 | 24,345 | 24,588 |
| LMI Aerospace Inc. 7.375% 2019 | 15,600 | 15,171 |
| Navios Maritime Acquisition Corp. and Navios Acquisition Finance (US) Inc. 8.125% 20213 | 24,500 | 24,224 |
| Navios Maritime Holdings Inc. 7.375% 20223 | 25,840 | 22,125 |
| Navios Maritime Holdings Inc. and Navios Maritime Finance II (US) Inc. 8.125% 2019 | 10,510 | 8,342 |
| Nielsen Finance LLC and Nielsen Finance Co. 4.50% 2020 | 22,500 | 23,034 |
| Nielsen Finance LLC and Nielsen Finance Co. 5.50% 20213 | 30,600 | 31,480 |
| Nielsen Finance LLC and Nielsen Finance Co. 5.00% 20223 | 25,700 | 25,443 |
| Norfolk Southern Corp. 5.75% 2016 | 6,710 | 6,853 |
| Nortek Inc. 8.50% 2021 | 33,565 | 36,082 |
| Ply Gem Industries, Inc. 6.50% 2022 | 24,000 | 23,820 |
| Ply Gem Industries, Inc. 6.50% 2022 | 11,075 | 10,784 |
| PrimeSource Building Products Inc 9.00% 20233 | 1,645 | 1,620 |
| R.R. Donnelley & Sons Co. 7.25% 20182 | 7,234 | 7,948 |
| R.R. Donnelley & Sons Co. 7.00% 20222 | 17,500 | 18,878 |
| R.R. Donnelley & Sons Co. 6.50% 20232 | 11,580 | 12,000 |
| R.R. Donnelley & Sons Co. 7.875% 20212 | 3,050 | 3,458 |
| Siemens AG 2.90% 20223 | 12,000 | 11,950 |
| Siemens AG 3.25% 20253 | 7,230 | 7,151 |
| Siemens AG 4.40% 20453 | 2,000 | 1,993 |
| Silver II Borrower S.C.A./Silver II U.S. Holdings, LLC 7.75% 20203 | 32,235 | 29,576 |
| TRAC Intermodal 11.00% 2019 | 16,950 | 18,412 |
| TransDigm Inc. 5.50% 2020 | 22,000 | 22,079 |
| TransDigm Inc. 6.50% 2024 | 4,000 | 4,040 |
| TransDigm Inc. 6.50% 20253 | 6,650 | 6,683 |
| United Air Lines, Inc., Series 1996-A2, 7.87% 20194,8,10 | 2,421 | — |
| United Air Lines, Inc., Series 2007-1, Class B, 7.336% 20213,8 | 3,725 | 3,883 |
| United Air Lines, Inc., Series 2007-1, Class A, 6.636% 20248 | 6,059 | 6,486 |
| US Investigations Services, Inc. 13.00% 20203,4,6,10 | 49,578 | 26,772 |
| US Investigations Services, Inc. 14.00% 20203,4,6,10 | 3,585 | 1,936 |
| US Investigations Services, Inc. 15.00% 20213,4,6,10 | 9,970 | 897 |
| US Investigations Services, Inc., Term Loan DD, 12.00% 20154,6,8,9 | 11,935 | 11,935 |
The Income Fund of America — Page 20 of 34
Bonds, notes & other debt instruments
Corporate bonds & notes (continued)
Industrials (continued) | Principal amount
(000) | Value
(000) |
| Virgin Australia Holdings Ltd. 8.50% 20193 | $38,875 | $40,624 |
| Watco Companies 6.375% 20233 | 10,670 | 10,830 |
| | | 1,274,041 |
| Materials 0.76% | | |
| ArcelorMittal 5.25% 2017 | 6,180 | 6,404 |
| ArcelorMittal 5.125% 2020 | 5,425 | 5,452 |
| ArcelorMittal 6.25% 2021 | 19,077 | 19,339 |
| ArcelorMittal 7.00% 2022 | 25,110 | 25,863 |
| ArcelorMittal 6.125% 2025 | 6,500 | 6,208 |
| ArcelorMittal 7.50% 2041 | 59,605 | 57,072 |
| Chemours Co. 6.625% 20233 | 25,945 | 22,896 |
| Chemours Co. 7.00% 20253 | 8,235 | 7,244 |
| Cliffs Natural Resources Inc. 8.25% 20202,3 | 7,475 | 6,821 |
| Cliffs Natural Resources Inc. 4.875% 20212 | 4,945 | 1,385 |
| CRH America, Inc. 3.875% 20253 | 2,000 | 2,001 |
| CRH America, Inc. 5.125% 20453 | 2,000 | 2,034 |
| Dow Chemical Co. 5.25% 2041 | 4,000 | 4,104 |
| Eastman Chemical Co. 2.70% 2020 | 12,000 | 12,016 |
| Ecolab Inc. 3.00% 2016 | 7,455 | 7,618 |
| First Quantum Minerals Ltd. 6.75% 20203 | 70,288 | 54,473 |
| First Quantum Minerals Ltd. 7.00% 20213 | 76,912 | 59,030 |
| First Quantum Minerals Ltd. 7.25% 20223 | 6,275 | 4,706 |
| FMG Resources 9.75% 20223 | 93,975 | 86,457 |
| Georgia Gulf Corp. 4.625% 2021 | 20,475 | 19,912 |
| Georgia-Pacific Corp. 2.539% 20193 | 12,000 | 12,060 |
| Glencore Xstrata LLC 4.625% 20243 | 7,000 | 6,753 |
| Graphic Packaging International, Inc. 4.75% 2021 | 4,510 | 4,627 |
| Holcim Ltd. 6.00% 20193 | 1,607 | 1,823 |
| Holcim Ltd. 5.15% 20233 | 12,595 | 13,815 |
| International Paper Co. 7.30% 2039 | 5,615 | 6,912 |
| JMC Steel Group Inc. 8.25% 20183 | 65,508 | 58,466 |
| LSB Industries, Inc. 7.75% 2019 | 9,800 | 10,364 |
| Monsanto Co. 4.40% 2044 | 13,090 | 11,734 |
| Owens-Illinois, Inc. 5.00% 20223 | 3,360 | 3,373 |
| Owens-Illinois, Inc. 5.375% 20253 | 2,515 | 2,506 |
| Paperworks Industries Inc. 9.50% 20193 | 2,095 | 2,129 |
| Rayonier Advanced Materials Inc. 5.50% 20243 | 17,132 | 14,605 |
| Reynolds Group Inc. 5.75% 2020 | 80,055 | 83,057 |
| Reynolds Group Inc. 6.875% 2021 | 5,000 | 5,251 |
| Rio Tinto Finance (USA) Ltd. 1.625% 2017 | 8,500 | 8,478 |
| Ryerson Inc. 9.00% 2017 | 24,771 | 24,523 |
| Ryerson Inc. 11.25% 2018 | 20,433 | 20,229 |
| Smurfit Capital Funding PLC 7.50% 2025 | 2,425 | 3,025 |
| Tembec Industries Inc. 9.00% 20193 | 7,520 | 6,129 |
| U.S. Coatings Acquisition Inc. (Flash Dutch 2 BV) 7.375% 20213 | 5,060 | 5,402 |
| Walter Energy, Inc. 9.50% 20193,10 | 35,950 | 18,245 |
| | | 734,541 |
| Utilities 0.75% | | |
| Abu Dhabi National Energy Co. PJSC (TAQA) 6.165% 20173 | 2,000 | 2,185 |
| AES Corp. 8.00% 2020 | 7,000 | 8,181 |
| AES Corp. 7.375% 2021 | 10,125 | 11,163 |
| AES Corp. 4.875% 2023 | 2,000 | 1,911 |
The Income Fund of America — Page 21 of 34
Bonds, notes & other debt instruments
Corporate bonds & notes (continued)
Utilities (continued) | Principal amount
(000) | Value
(000) |
| AES Corp. 5.50% 2024 | $7,500 | $7,350 |
| American Electric Power Co. 2.95% 2022 | 12,065 | 11,804 |
| Berkshire Hathaway Energy Co. 2.40% 2020 | 11,410 | 11,428 |
| Berkshire Hathaway Energy Co. 4.50% 2045 | 759 | 764 |
| Calpine Corp. 5.375% 2023 | 16,555 | 16,265 |
| Calpine Corp. 7.875% 20233 | 5,621 | 6,060 |
| Calpine Corp. 5.50% 2024 | 3,270 | 3,188 |
| CenterPoint Energy Resources Corp. 4.50% 2021 | 13,130 | 14,158 |
| CEZ, a s 4.25% 20223 | 1,820 | 1,914 |
| CMS Energy Corp. 8.75% 2019 | 11,501 | 14,179 |
| CMS Energy Corp. 6.25% 2020 | 30,502 | 35,166 |
| CMS Energy Corp. 5.05% 2022 | 1,322 | 1,459 |
| CMS Energy Corp. 3.875% 2024 | 10,236 | 10,428 |
| CMS Energy Corp. 4.70% 2043 | 2,290 | 2,343 |
| CMS Energy Corp. 4.875% 2044 | 1,875 | 1,960 |
| Colbun SA 6.00% 20203 | 2,000 | 2,215 |
| Colbun SA 4.50% 20243 | 1,500 | 1,516 |
| Comision Federal de Electricidad 4.875% 20243 | 2,000 | 2,088 |
| Consumers Energy Co., First Mortgage Bonds, 6.70% 2019 | 14,147 | 16,687 |
| Consumers Energy Co. 5.65% 2020 | 366 | 422 |
| Consumers Energy Co., First Mortgage Bonds, 3.125% 2024 | 2,865 | 2,879 |
| Dominion Gas Holdings LLC 2.50% 2019 | 4,865 | 4,906 |
| Duke Energy Corp. 3.75% 2024 | 10,793 | 11,053 |
| Duke Energy Indiana, Inc. 4.90% 2043 | 14,785 | 16,271 |
| Duke Energy Progress Inc. 4.15% 2044 | 3,935 | 3,927 |
| Dynegy Finance Inc. 6.75% 20193 | 16,275 | 16,885 |
| Dynegy Finance Inc. 7.375% 20223 | 25,660 | 26,674 |
| Dynegy Finance Inc. 7.625% 20243 | 8,215 | 8,523 |
| E.ON International Finance BV 5.80% 20183 | 15,000 | 16,409 |
| EDP Finance BV 4.125% 20203 | 6,000 | 6,122 |
| EDP Finance BV 5.25% 20213 | 22,500 | 23,965 |
| Electricité de France SA 1.15% 20173 | 2,000 | 2,002 |
| Electricité de France SA 6.95% 20393 | 8,000 | 10,549 |
| Electricité de France SA 4.875% 20443 | 3,850 | 4,113 |
| Electricité de France SA 5.25% (undated)3 | 29,005 | 29,839 |
| Empresa Nacional de Electricidad SA 4.25% 2024 | 900 | 918 |
| Enel Finance International SA 6.00% 20393 | 3,000 | 3,473 |
| Enel Società per Azioni 8.75% 20733 | 12,000 | 14,106 |
| Entergy Corp. 4.70% 2017 | 8,000 | 8,308 |
| Entergy Corp. 4.00% 2022 | 1,625 | 1,660 |
| Eskom Holdings Ltd. 5.75% 20213 | 6,820 | 6,660 |
| Eskom Holdings SOC Ltd. 6.75% 20233 | 5,000 | 5,038 |
| Exelon Corp. 2.85% 2020 | 215 | 216 |
| Exelon Corp. 3.95% 2025 | 5,000 | 5,084 |
| Exelon Corp. 5.10% 2045 | 111 | 115 |
| FirstEnergy Corp., Series B, 4.25% 2023 | 31,465 | 32,028 |
| Iberdrola Finance Ireland 5.00% 20193 | 1,060 | 1,167 |
| Israel Electric Corp. Ltd. 8.10% 20963 | 4,905 | 5,494 |
| MidAmerican Energy Co. 5.95% 2017 | 10,625 | 11,537 |
| MidAmerican Energy Co. 2.40% 2019 | 9,000 | 9,145 |
| MidAmerican Energy Holdings Co. 5.75% 2018 | 10,000 | 11,052 |
| Midwest Generation, LLC, Series B, 8.56% 20164,8,10 | 696 | 696 |
| Nevada Power Co., General and Refunding Mortgage Notes, Series V, 7.125% 2019 | 4,867 | 5,701 |
| Niagara Mohawk Power Corp. 3.508% 20243 | 4,150 | 4,196 |
The Income Fund of America — Page 22 of 34
Bonds, notes & other debt instruments
Corporate bonds & notes (continued)
Utilities (continued) | Principal amount
(000) | Value
(000) |
| Niagara Mohawk Power Corp. 4.278% 20343 | $3,000 | $3,060 |
| Northeast Utilities 3.15% 2025 | 5,000 | 4,891 |
| Northern States Power Co., First Mortgage Bonds, 7.125% 2025 | 4 | 5 |
| Northern States Power Co. 3.40% 2042 | 54 | 48 |
| Northern States Power Co. 4.125% 2044 | 11,000 | 11,056 |
| NRG Energy, Inc. 6.25% 2022 | 5,515 | 5,556 |
| NV Energy, Inc 6.25% 2020 | 20,000 | 23,248 |
| Ohio Power Co., Series G, 6.60% 2033 | 1,590 | 2,013 |
| Ohio Power Co., Series H, 6.60% 2033 | 353 | 447 |
| Pacific Gas and Electric Co. 3.50% 2020 | 1,697 | 1,782 |
| Pacific Gas and Electric Co. 3.25% 2023 | 3,945 | 3,950 |
| Pacific Gas and Electric Co. 3.85% 2023 | 14,371 | 14,974 |
| Pacific Gas and Electric Co. 3.40% 2024 | 6,160 | 6,182 |
| Pacific Gas and Electric Co. 3.75% 2024 | 5,851 | 6,027 |
| Pacific Gas and Electric Co. 3.50% 2025 | 484 | 487 |
| Pacific Gas and Electric Co. 3.75% 2042 | 200 | 182 |
| Pacific Gas and Electric Co. 4.30% 2045 | 5,212 | 5,167 |
| PacifiCorp., First Mortgage Bonds, 5.65% 2018 | 5,500 | 6,131 |
| PacifiCorp., First Mortgage Bonds, 2.95% 2023 | 1,041 | 1,032 |
| PacifiCorp., First Mortgage Bonds, 7.70% 2031 | 2,905 | 4,066 |
| PG&E Corp. 2.40% 2019 | 2,500 | 2,512 |
| Progress Energy, Inc. 7.05% 2019 | 250 | 290 |
| Progress Energy, Inc. 7.00% 2031 | 2,500 | 3,223 |
| Progress Energy, Inc. 7.75% 2031 | 2,653 | 3,627 |
| Public Service Co. of Colorado 5.125% 2019 | 1,486 | 1,667 |
| Public Service Co. of Colorado 3.20% 2020 | 2,144 | 2,232 |
| Public Service Co. of Colorado 2.90% 2025 | 5,000 | 4,897 |
| Public Service Electric and Gas Co. 2.00% 2019 | 6,065 | 6,079 |
| Puget Sound Energy Inc. 6.724% 2036 | 1,999 | 2,674 |
| Puget Sound Energy, Inc., First Lien, 6.50% 2020 | 6,111 | 7,202 |
| Puget Sound Energy, Inc., First Lien, 6.00% 2021 | 3,945 | 4,554 |
| Puget Sound Energy, Inc., First Lien, 5.625% 2022 | 7,428 | 8,347 |
| Puget Sound Energy, Inc., First Lien, 3.65% 20253 | 2,500 | 2,453 |
| Southern California Edison Co. 1.845% 20228 | 8,325 | 8,332 |
| Tampa Electric Co. 2.60% 2022 | 2,925 | 2,837 |
| Tampa Electric Co. 4.35% 2044 | 8,330 | 8,515 |
| Teco Finance, Inc. 4.00% 2016 | 3,031 | 3,089 |
| Teco Finance, Inc. 5.15% 2020 | 5,731 | 6,416 |
| TXU, Term Loan, 3.737% 20147,8,9,10 | 3,000 | 1,543 |
| TXU, Term Loan, 4.65% 20177,8,9,10 | 26,204 | 13,469 |
| Veolia Environnement 6.75% 2038 | 500 | 617 |
| Virginia Electric and Power Co., Series B, 5.95% 2017 | 4,500 | 4,922 |
| Virginia Electric and Power Co. 3.45% 2024 | 560 | 573 |
| Virginia Electric and Power Co. 3.10% 2025 | 2,625 | 2,596 |
| Virginia Electric and Power Co. 8.875% 2038 | 3,000 | 4,758 |
| Wisconsin Energy Corp. 3.55% 2025 | 2,000 | 2,009 |
| Xcel Energy Inc. 4.70% 2020 | 5,374 | 5,873 |
| Xcel Energy Inc. 3.30% 2025 | 5,000 | 4,940 |
| Xcel Energy Inc. 6.50% 2036 | 5,131 | 6,541 |
| Xcel Energy Inc. 4.80% 2041 | 447 | 474 |
| | | 723,110 |
The Income Fund of America — Page 23 of 34
Bonds, notes & other debt instruments
Corporate bonds & notes (continued)
Information technology 0.64% | Principal amount
(000) | Value
(000) |
| Alcatel-Lucent USA Inc. 4.625% 20173 | $17,585 | $18,201 |
| Alcatel-Lucent USA Inc. 6.75% 20203 | 20,815 | 22,454 |
| Alcatel-Lucent USA Inc. 8.875% 20203 | 37,410 | 40,964 |
| Compucom Systems Inc., 7.00% 20213,4 | 3,425 | 2,620 |
| First Data Corp. 7.375% 20193 | 7,294 | 7,627 |
| First Data Corp. 6.75% 20203 | 12,350 | 13,091 |
| First Data Corp. 8.25% 20213 | 13,700 | 14,539 |
| First Data Corp. 11.75% 2021 | 38,911 | 44,261 |
| First Data Corp. 12.625% 2021 | 32,289 | 37,455 |
| First Data Corp. 8.75% 20223,6 | 36,640 | 38,930 |
| Freescale Semiconductor, Inc. 5.00% 20213 | 51,300 | 52,358 |
| Freescale Semiconductor, Inc. 6.00% 20223 | 18,275 | 19,143 |
| Freescale Semiconductor, Inc., Term Loan B4, 4.25% 20207,8,9 | 4,405 | 4,423 |
| Harris Corp. 2.70% 2020 | 1,315 | 1,296 |
| Harris Corp. 3.832% 2025 | 740 | 728 |
| Harris Corp. 4.854% 2035 | 7,685 | 7,424 |
| Harris Corp. 5.054% 2045 | 5,735 | 5,496 |
| Informatica Corp. 7.125% 20233 | 4,950 | 4,876 |
| Jabil Circuit, Inc. 8.25% 2018 | 20,925 | 23,671 |
| Jabil Circuit, Inc. 5.625% 2020 | 10,650 | 11,369 |
| KLA-Tencor Corp. 2.375% 2017 | 7,000 | 7,064 |
| KLA-Tencor Corp. 4.65% 2024 | 5,000 | 4,964 |
| NXP BV and NXP Funding LLC 4.125% 20203 | 21,000 | 21,131 |
| Oracle Corp. 2.50% 2022 | 19,000 | 18,504 |
| Serena Software, Inc., Term Loan B, 7.50% 20207,8,9 | 22,032 | 22,133 |
| SRA International, Inc. 11.00% 2019 | 59,195 | 62,303 |
| SRA International, Inc., Term Loan B, 6.50% 20187,8,9 | 66,184 | 66,494 |
| SunGard Data Systems Inc. 7.375% 2018 | 15,722 | 16,264 |
| SunGard Data Systems Inc. 7.625% 2020 | 29,540 | 31,091 |
| | | 620,874 |
| Consumer staples 0.61% | | |
| Altria Group, Inc. 9.25% 2019 | 18,542 | 23,188 |
| Altria Group, Inc. 2.625% 2020 | 10,420 | 10,443 |
| Altria Group, Inc. 4.00% 2024 | 1,500 | 1,549 |
| Altria Group, Inc. 9.95% 2038 | 23,500 | 38,664 |
| Altria Group, Inc. 4.25% 2042 | 20,000 | 18,368 |
| Altria Group, Inc. 4.50% 2043 | 4,000 | 3,826 |
| Altria Group, Inc. 5.375% 2044 | 1,095 | 1,184 |
| Anheuser-Busch InBev NV 7.75% 2019 | 25,000 | 29,590 |
| British American Tobacco International Finance PLC 9.50% 20183 | 8,705 | 10,747 |
| British American Tobacco International Finance PLC 2.75% 20203 | 3,500 | 3,553 |
| British American Tobacco International Finance PLC 3.95% 20253 | 21,000 | 21,501 |
| Coca-Cola Co. 1.80% 2016 | 10,000 | 10,119 |
| ConAgra Foods, Inc. 3.20% 2023 | 1,992 | 1,895 |
| Constellation Brands, Inc. 7.25% 2017 | 15,400 | 16,738 |
| Constellation Brands, Inc. 3.875% 2019 | 6,000 | 6,150 |
| Constellation Brands, Inc. 6.00% 2022 | 2,825 | 3,129 |
| Constellation Brands, Inc. 4.25% 2023 | 6,000 | 6,015 |
| CVS Caremark Corp. 2.25% 2019 | 6,015 | 6,028 |
| CVS Caremark Corp. 2.80% 2020 | 14,000 | 14,143 |
| CVS Caremark Corp. 3.50% 2022 | 6,000 | 6,145 |
| CVS Caremark Corp. 3.875% 2025 | 7,400 | 7,552 |
| CVS Caremark Corp. 4.875% 2035 | 7,780 | 8,090 |
The Income Fund of America — Page 24 of 34
Bonds, notes & other debt instruments
Corporate bonds & notes (continued)
Consumer staples (continued) | Principal amount
(000) | Value
(000) |
| CVS Caremark Corp. 5.125% 2045 | $12,935 | $13,803 |
| H.J Heinz Co. 4.875% 20253 | 11,214 | 12,041 |
| H.J. Heinz Co. 2.80% 20203 | 12,885 | 12,956 |
| Imperial Tobacco Finance PLC 3.50% 20233 | 10,000 | 9,765 |
| Ingles Markets, Inc. 5.75% 2023 | 10,750 | 11,019 |
| Kimberly-Clark Corp. 7.50% 2018 | 9,000 | 10,658 |
| Kraft Foods Inc. 5.375% 2020 | 4,712 | 5,279 |
| Kraft Foods Inc. 5.00% 2042 | 31,800 | 32,637 |
| Pernod Ricard SA 2.95% 20173 | 20,000 | 20,392 |
| Pernod Ricard SA 4.45% 20223 | 9,500 | 10,077 |
| Philip Morris International Inc. 3.60% 2023 | 7,245 | 7,473 |
| Philip Morris International Inc. 4.875% 2043 | 2,500 | 2,661 |
| Philip Morris International Inc. 4.25% 2044 | 3,750 | 3,621 |
| Reynolds American Inc. 2.30% 2018 | 1,990 | 2,009 |
| Reynolds American Inc. 3.25% 2020 | 5,510 | 5,604 |
| Reynolds American Inc. 3.25% 2022 | 6,150 | 5,991 |
| Reynolds American Inc. 4.00% 2022 | 890 | 916 |
| Reynolds American Inc. 4.45% 2025 | 22,110 | 22,780 |
| Reynolds American Inc. 5.70% 2035 | 3,760 | 3,996 |
| Reynolds American Inc. 6.15% 2043 | 1,820 | 2,019 |
| Reynolds American Inc. 5.85% 2045 | 32,410 | 35,081 |
| SABMiller Holdings Inc. 4.95% 20423 | 7,000 | 7,378 |
| The JM Smucker Co. 2.50% 20203 | 1,825 | 1,824 |
| The JM Smucker Co. 3.00% 20223 | 2,850 | 2,803 |
| The JM Smucker Co. 3.50% 20253 | 5,795 | 5,730 |
| The JM Smucker Co. 4.375% 20453 | 3,000 | 2,823 |
| Tyson Foods, Inc. 6.60% 2016 | 11,500 | 11,920 |
| Tyson Foods, Inc. 3.95% 2024 | 6,000 | 6,082 |
| Tyson Foods, Inc. 5.15% 2044 | 5,460 | 5,709 |
| Walgreens Boots Alliance, Inc. 3.30% 2021 | 13,000 | 12,954 |
| Walgreens Boots Alliance, Inc. 3.80% 2024 | 4,975 | 4,892 |
| Wal-Mart Stores, Inc. 2.80% 2016 | 10,000 | 10,161 |
| Wal-Mart Stores, Inc. 3.30% 2024 | 10,755 | 10,961 |
| WM. Wrigley Jr. Co 2.40% 20183 | 1,200 | 1,217 |
| WM. Wrigley Jr. Co 2.90% 20193 | 1,200 | 1,226 |
| WM. Wrigley Jr. Co 3.375% 20203 | 22,500 | 23,176 |
| | | 588,251 |
| Total corporate bonds & notes | | 13,333,965 |
U.S. Treasury bonds & notes 3.52%
U.S. Treasury 3.19% | | |
| U.S. Treasury 1.375% 2015 | 50,000 | 50,205 |
| U.S. Treasury 1.50% 2016 | 125,500 | 126,860 |
| U.S. Treasury 1.75% 2016 | 115,000 | 116,393 |
| U.S. Treasury 0.875% 2017 | 40,000 | 40,184 |
| U.S. Treasury 0.625% 2018 | 120,000 | 119,062 |
| U.S. Treasury 0.75% 2018 | 100,000 | 99,625 |
| U.S. Treasury 1.625% 2019 | 107,500 | 108,394 |
| U.S. Treasury 1.75% 2019 | 41,000 | 41,623 |
| U.S. Treasury 3.625% 2019 | 82,000 | 89,393 |
| U.S. Treasury 1.25% 2020 | 404,250 | 400,632 |
| U.S. Treasury 1.375% 2020 | 31,000 | 30,849 |
| U.S. Treasury 1.50% 2020 | 222,550 | 222,445 |
The Income Fund of America — Page 25 of 34
Bonds, notes & other debt instruments
U.S. Treasury bonds & notes (continued)
U.S. Treasury (continued) | Principal amount
(000) | Value
(000) |
| U.S. Treasury 1.625% 2020 | $33,250 | $33,393 |
| U.S. Treasury 6.25% 2023 | 69,000 | 90,749 |
| U.S. Treasury 2.25% 2024 | 73,925 | 74,386 |
| U.S. Treasury 2.50% 2024 | 28,450 | 29,277 |
| U.S. Treasury 2.00% 2025 | 39,575 | 38,935 |
| U.S. Treasury 2.125% 2025 | 113,675 | 113,028 |
| U.S. Treasury 5.50% 2028 | 52,000 | 70,541 |
| U.S. Treasury 5.375% 2031 | 8,475 | 11,680 |
| U.S. Treasury 4.50% 2036 | 87,936 | 114,192 |
| U.S. Treasury 4.625% 2040 | 15,150 | 19,986 |
| U.S. Treasury 4.375% 2041 | 20,800 | 26,626 |
| U.S. Treasury 4.75% 2041 | 30,900 | 41,638 |
| U.S. Treasury 2.75% 2042 | 16,275 | 15,751 |
| U.S. Treasury 2.75% 2042 | 6,950 | 6,732 |
| U.S. Treasury 3.00% 2042 | 56,175 | 57,206 |
| U.S. Treasury 3.125% 2043 | 33,675 | 35,033 |
| U.S. Treasury 3.00% 2044 | 161,350 | 163,922 |
| U.S. Treasury 3.125% 2044 | 131,950 | 137,310 |
| U.S. Treasury 3.375% 2044 | 148,415 | 161,854 |
| U.S. Treasury 3.625% 2044 | 31,750 | 36,245 |
| U.S. Treasury 2.50% 2045 | 70,750 | 64,753 |
| U.S. Treasury 3.00% 2045 | 297,375 | 302,594 |
| | | 3,091,496 |
| U.S. Treasury inflation-protected securities 0.33% | | |
| U.S. Treasury Inflation-Protected Security 0.125% 202411 | 21,567 | 20,977 |
| U.S. Treasury Inflation-Protected Security 0.625% 202411 | 62,327 | 62,087 |
| U.S. Treasury Inflation-Protected Security 0.25% 202511 | 60,386 | 58,960 |
| U.S. Treasury Inflation-Protected Security 0.375% 202511 | 4,477 | 4,433 |
| U.S. Treasury Inflation-Protected Security 0.75% 204211 | 31,845 | 28,245 |
| U.S. Treasury Inflation-Protected Security 1.375% 204411 | 120,962 | 128,377 |
| U.S. Treasury Inflation-Protected Security 0.75% 204511 | 24,095 | 22,161 |
| | | 325,240 |
| Total U.S. Treasury bonds & notes | | 3,416,736 |
| Mortgage-backed obligations 1.87% | | |
| Aventura Mall Trust, Series A, 3.743% 20323,7,8 | 12,250 | 13,015 |
| Banc of America Commercial Mortgage Inc., Series 2005-5, Class A-4, 5.115% 20457,8 | 434 | 435 |
| Banc of America Commercial Mortgage Inc., Series 2007-3, Class A-4, 5.575% 20497,8 | 4,816 | 5,060 |
| Bank of America Merrill Lynch Large Loan Inc., Series 2015-200P, Class A, 3.218% 20333,7,8 | 5,575 | 5,595 |
| Bellemeade Re Ltd., Series 2015-1-A, Class M-1, 2.689% 20253,4,7,8 | 10,000 | 10,000 |
| Citigroup-Deutsche Bank Commercial Mortgage Trust, Series 2005-CD1, Class A-4, 5.202% 20447,8 | 702 | 701 |
| Citigroup-Deutsche Bank Commercial Mortgage Trust, Series 2006-CD3, Class A-5, 5.617% 20488 | 9,563 | 9,823 |
| COMM Mortgage Trust Series 2014-277P, Class A, 3.611% 20493,7,8 | 17,000 | 17,581 |
| Commonwealth Bank of Australia 0.75% 20163,8 | 7,000 | 7,002 |
| Connecticut Avenue Securities, Series 2015-C01, Class 1-M-1, 1.69% 20257,8 | 3,451 | 3,455 |
| Core Industrial Trust, Series 2015-CALW, Class A, 3.04% 20343,8 | 16,900 | 17,066 |
| Countrywide Alternative Loan Trust, Series 2005-54CB, Class 2-A-5, 5.50% 20358 | 6,639 | 6,153 |
| Countrywide Alternative Loan Trust, Series 2007-HY4, Class 3-A-1, 2.917% 20477,8 | 4,110 | 3,402 |
| CS First Boston Mortgage Securities Corp., Series 2004-5, Class IV-A-1, 6.00% 20348 | 1,328 | 1,368 |
| CS First Boston Mortgage Securities Corp., Series 2006-C5, Class A-M, 5.343% 20398 | 8,000 | 8,365 |
| CS First Boston Mortgage Securities Corp., Series 2007-C5, Class A4, 5.695% 20407,8 | 13,000 | 13,784 |
| CS First Boston Mortgage Securities Corp., Series 2007-C2, Class A-M, 5.605% 20497,8 | 10,000 | 10,478 |
The Income Fund of America — Page 26 of 34
Bonds, notes & other debt instruments
Mortgage-backed obligations (continued) | Principal amount
(000) | Value
(000) |
| DBUBS Mortgage Trust, Series 2011-LC2A, Class A-2, 3.386% 20443,8 | $3,540 | $3,598 |
| DBUBS Mortgage Trust, Series 2011-LC1A, Class A1, 3.742% 20463,8 | 6,436 | 6,480 |
EQTY 2014-INNS Mortgage Trust Commercial Mortgage Pass-Through Certificates,
Series 2014-A, 1.037% 20313,7,8 | 5,114 | 5,091 |
| Fannie Mae 5.50% 20188 | 26 | 27 |
| Fannie Mae 6.00% 20218 | 142 | 155 |
| Fannie Mae 4.50% 20248 | 2,018 | 2,170 |
| Fannie Mae 5.50% 20248 | 199 | 219 |
| Fannie Mae 4.50% 20258 | 1,944 | 2,090 |
| Fannie Mae 4.50% 20258 | 1,155 | 1,239 |
| Fannie Mae 4.50% 20258 | 1,077 | 1,124 |
| Fannie Mae 4.50% 20258 | 984 | 1,027 |
| Fannie Mae 6.00% 20268 | 3,317 | 3,762 |
| Fannie Mae 7.00% 20268 | 545 | 629 |
| Fannie Mae 2.50% 20278 | 1,485 | 1,523 |
| Fannie Mae 2.50% 20278 | 1,118 | 1,136 |
| Fannie Mae 2.50% 20278 | 1,031 | 1,057 |
| Fannie Mae 2.50% 20278 | 901 | 923 |
| Fannie Mae 2.50% 20278 | 574 | 588 |
| Fannie Mae 2.50% 20278 | 504 | 516 |
| Fannie Mae 2.50% 20278 | 488 | 500 |
| Fannie Mae 2.50% 20288 | 37,129 | 38,064 |
| Fannie Mae 2.50% 20288 | 12,384 | 12,695 |
| Fannie Mae 2.50% 20288 | 1,716 | 1,759 |
| Fannie Mae 2.50% 20288 | 1,662 | 1,704 |
| Fannie Mae 2.50% 20288 | 1,599 | 1,629 |
| Fannie Mae 2.50% 20288 | 1,464 | 1,489 |
| Fannie Mae 2.50% 20288 | 1,314 | 1,347 |
| Fannie Mae 2.50% 20288 | 1,170 | 1,199 |
| Fannie Mae 2.50% 20288 | 1,113 | 1,141 |
| Fannie Mae 2.50% 20288 | 871 | 893 |
| Fannie Mae 2.50% 20288 | 844 | 860 |
| Fannie Mae 2.50% 20288 | 836 | 857 |
| Fannie Mae 2.50% 20288 | 601 | 616 |
| Fannie Mae 2.50% 20288 | 562 | 576 |
| Fannie Mae 2.50% 20288 | 551 | 562 |
| Fannie Mae 2.50% 20288 | 509 | 522 |
| Fannie Mae 2.50% 20288 | 479 | 489 |
| Fannie Mae 2.50% 20288 | 459 | 470 |
| Fannie Mae 2.50% 20288 | 449 | 457 |
| Fannie Mae 2.50% 20288 | 438 | 449 |
| Fannie Mae 2.50% 20288 | 437 | 448 |
| Fannie Mae 2.50% 20288 | 433 | 444 |
| Fannie Mae 2.50% 20288 | 429 | 439 |
| Fannie Mae 2.50% 20288 | 306 | 313 |
| Fannie Mae 2.50% 20288 | 101 | 103 |
| Fannie Mae 2.50% 20288 | 59 | 60 |
| Fannie Mae 6.00% 20288 | 3,482 | 3,953 |
| Fannie Mae 7.00% 20288 | 1,257 | 1,460 |
| Fannie Mae 7.00% 20288 | 262 | 304 |
| Fannie Mae 5.50% 20338 | 523 | 590 |
| Fannie Mae 3.00% 20358 | 3,742 | 3,851 |
| Fannie Mae 3.50% 20358 | 3,604 | 3,793 |
| Fannie Mae 5.50% 20358 | 492 | 557 |
| Fannie Mae 5.50% 20368 | 3,386 | 3,820 |
The Income Fund of America — Page 27 of 34
Bonds, notes & other debt instruments
Mortgage-backed obligations (continued) | Principal amount
(000) | Value
(000) |
| Fannie Mae 6.00% 20368 | $1,400 | $1,594 |
| Fannie Mae 6.00% 20368 | 956 | 1,088 |
| Fannie Mae 6.00% 20368 | 564 | 640 |
| Fannie Mae 6.00% 20378 | 15,096 | 17,223 |
| Fannie Mae 6.00% 20378 | 2,602 | 2,970 |
| Fannie Mae 6.00% 20378 | 2,583 | 2,966 |
| Fannie Mae 6.00% 20378 | 146 | 166 |
| Fannie Mae 6.50% 20378 | 924 | 1,061 |
| Fannie Mae 6.50% 20378 | 758 | 871 |
| Fannie Mae 6.50% 20378 | 639 | 761 |
| Fannie Mae 6.50% 20378 | 175 | 201 |
| Fannie Mae 7.00% 20378 | 587 | 653 |
| Fannie Mae 7.00% 20378 | 321 | 356 |
| Fannie Mae 7.50% 20378 | 282 | 319 |
| Fannie Mae 7.50% 20378 | 112 | 125 |
| Fannie Mae 7.50% 20378 | 86 | 96 |
| Fannie Mae 5.50% 20388 | 750 | 841 |
| Fannie Mae 6.00% 20388 | 3,521 | 4,007 |
| Fannie Mae 6.00% 20388 | 2,427 | 2,762 |
| Fannie Mae 6.00% 20388 | 1,577 | 1,795 |
| Fannie Mae 4.50% 20398 | 25,449 | 27,955 |
| Fannie Mae 6.00% 20398 | 2,276 | 2,582 |
| Fannie Mae 6.50% 20398 | 697 | 801 |
| Fannie Mae 4.00% 20408 | 12,590 | 13,445 |
| Fannie Mae 4.00% 20408 | 7,839 | 8,385 |
| Fannie Mae 4.00% 20408 | 7,719 | 8,263 |
| Fannie Mae 4.00% 20408 | 473 | 508 |
| Fannie Mae 4.50% 20408 | 81 | 88 |
| Fannie Mae 4.50% 20408 | 78 | 85 |
| Fannie Mae 5.00% 20408 | 9,005 | 9,981 |
| Fannie Mae 4.00% 20418 | 10,713 | 11,489 |
| Fannie Mae 4.00% 20418 | 8,189 | 8,782 |
| Fannie Mae 4.00% 20418 | 787 | 845 |
| Fannie Mae 4.00% 20418 | 475 | 510 |
| Fannie Mae 4.00% 20418 | 399 | 428 |
| Fannie Mae 4.00% 20418 | 255 | 275 |
| Fannie Mae 4.50% 20418 | 280 | 304 |
| Fannie Mae 5.00% 20418 | 513 | 571 |
| Fannie Mae 5.00% 20418 | 506 | 565 |
| Fannie Mae 5.00% 20418 | 422 | 473 |
| Fannie Mae 5.00% 20418 | 350 | 392 |
| Fannie Mae 3.50% 20428 | 18,709 | 19,481 |
| Fannie Mae 4.00% 20428 | 26,645 | 28,569 |
| Fannie Mae 4.00% 20428 | 9,410 | 10,092 |
| Fannie Mae 4.00% 20428 | 3,927 | 4,214 |
| Fannie Mae 4.00% 20428 | 1,317 | 1,413 |
| Fannie Mae 4.00% 20438 | 10,098 | 10,866 |
| Fannie Mae 4.00% 20438 | 9,548 | 10,275 |
| Fannie Mae 4.00% 20438 | 3,695 | 3,976 |
| Fannie Mae 4.00% 20438 | 3,653 | 3,942 |
| Fannie Mae 4.00% 20438 | 3,501 | 3,770 |
| Fannie Mae 4.00% 20438 | 3,257 | 3,507 |
| Fannie Mae 4.00% 20438 | 2,924 | 3,156 |
| Fannie Mae 4.00% 20438 | 2,661 | 2,854 |
| Fannie Mae 3.00% 20458,12 | 2,655 | 2,674 |
The Income Fund of America — Page 28 of 34
Bonds, notes & other debt instruments
Mortgage-backed obligations (continued) | Principal amount
(000) | Value
(000) |
| Fannie Mae 4.50% 20458,12 | $61,110 | $66,218 |
| Fannie Mae 6.50% 20478 | 472 | 534 |
| Fannie Mae 6.50% 20478 | 459 | 519 |
| Fannie Mae 6.50% 20478 | 372 | 420 |
| Fannie Mae 6.50% 20478 | 334 | 378 |
| Fannie Mae 6.50% 20478 | 222 | 251 |
| Fannie Mae 6.50% 20478 | 124 | 140 |
| Fannie Mae 7.00% 20478 | 524 | 601 |
| Fannie Mae 7.00% 20478 | 291 | 333 |
| Fannie Mae 7.00% 20478 | 193 | 222 |
| Fannie Mae 7.00% 20478 | 101 | 116 |
| Fannie Mae, Series 2001-4, Class GA, 9.413% 20257,8 | 90 | 102 |
| Fannie Mae, Series 2001-4, Class NA, 9.768% 20257,8 | 2 | 2 |
| Fannie Mae, Series 2001-20, Class E, 9.567% 20317,8 | 108 | 119 |
| Fannie Mae, Series 2007-33, Class HE, 5.50% 20378 | 5,436 | 6,047 |
| Fannie Mae, Series 2007-24, Class P, 6.00% 20378 | 3,057 | 3,414 |
| Fannie Mae, Series 2001-50, Class BA, 7.00% 20418 | 431 | 484 |
| Fannie Mae, Series 2001-T10, Class A-1, 7.00% 20418 | 376 | 448 |
| Fannie Mae, Series 2002-W3, Class A-5, 7.50% 20418 | 248 | 291 |
| Fannie Mae, Series 2002-W1, Class 2A, 6.418% 20427,8 | 678 | 791 |
| Financial Asset Securitization, Inc., Series 1997-NAM1, Class B-1, 7.75% 20278 | 8 | 8 |
| Freddie Mac 5.00% 20238 | 2,299 | 2,494 |
| Freddie Mac 5.00% 20238 | 2,290 | 2,482 |
| Freddie Mac 5.00% 20238 | 2,227 | 2,417 |
| Freddie Mac 5.00% 20238 | 792 | 860 |
| Freddie Mac 6.00% 20268 | 512 | 582 |
| Freddie Mac 6.00% 20278 | 847 | 962 |
| Freddie Mac 3.50% 20348 | 17,163 | 18,069 |
| Freddie Mac 3.00% 20358 | 15,624 | 16,046 |
| Freddie Mac 3.50% 20358 | 32,416 | 34,093 |
| Freddie Mac 3.50% 20358 | 26,641 | 28,018 |
| Freddie Mac 3.50% 20358 | 4,166 | 4,380 |
| Freddie Mac 4.50% 20358 | 15,864 | 17,283 |
| Freddie Mac 5.50% 20378 | 694 | 775 |
| Freddie Mac 5.50% 20388 | 1,930 | 2,156 |
| Freddie Mac 6.50% 20388 | 2,145 | 2,504 |
| Freddie Mac 4.50% 20398 | 1,387 | 1,511 |
| Freddie Mac 5.00% 20398 | 3,413 | 3,815 |
| Freddie Mac 5.00% 20398 | 2,080 | 2,317 |
| Freddie Mac 5.00% 20398 | 1,449 | 1,601 |
| Freddie Mac 5.50% 20398 | 970 | 1,083 |
| Freddie Mac 4.50% 20408 | 33,329 | 36,369 |
| Freddie Mac 4.00% 20418 | 2,286 | 2,437 |
| Freddie Mac 4.50% 20418 | 3,300 | 3,592 |
| Freddie Mac 4.50% 20418 | 2,748 | 2,991 |
| Freddie Mac 4.50% 20418 | 2,283 | 2,475 |
| Freddie Mac 5.00% 20418 | 205 | 227 |
| Freddie Mac 4.50% 20428 | 5,285 | 5,758 |
| Freddie Mac 4.50% 20428 | 3,254 | 3,542 |
| Freddie Mac 4.00% 20438 | 7,032 | 7,526 |
| Freddie Mac 4.00% 20438 | 6,484 | 6,940 |
| Freddie Mac 4.00% 20438 | 5,199 | 5,589 |
| Freddie Mac 4.00% 20438 | 3,929 | 4,207 |
| Freddie Mac 4.00% 20438 | 3,307 | 3,562 |
| Freddie Mac 4.00% 20438 | 2,990 | 3,200 |
The Income Fund of America — Page 29 of 34
Bonds, notes & other debt instruments
Mortgage-backed obligations (continued) | Principal amount
(000) | Value
(000) |
| Freddie Mac 3.50% 20458,12 | $30,000 | $31,100 |
| Freddie Mac, Series 2890, Class KT, 4.50% 20198 | 15,257 | 16,004 |
| Freddie Mac, Series 2289, Class NB, 9.00% 20227,8 | 9 | 10 |
| Freddie Mac, Series 2013-DN2, Class M-1, 1.641% 20237,8 | 2,668 | 2,668 |
| Freddie Mac, Series 2013-DN1, Class M-1, 3.591% 20237,8 | 3,162 | 3,239 |
| Freddie Mac, Series 2014-HQ2, Class M-1, 1.641% 20247,8 | 5,349 | 5,367 |
| Freddie Mac, Series 2014-HQ3, Class M-1, 1.841% 20247,8 | 3,176 | 3,183 |
| Freddie Mac, Series 2014-HQ2, Class M-2, 2.391% 20247,8 | 5,815 | 5,814 |
| Freddie Mac, Series 2014-DN4, Class M-2, 2.591% 20247,8 | 6,155 | 6,211 |
| Freddie Mac, Series 2015-DN1, Class M-1, 1.441% 20257,8 | 1,575 | 1,576 |
| Freddie Mac, Series 2015-HQ2, Class M-2, 2.141% 20257,8 | 3,600 | 3,564 |
| Freddie Mac, Series 3257, Class PA, 5.50% 20368 | 5,674 | 6,492 |
| Freddie Mac, Series 3286, Class JN, 5.50% 20378 | 4,767 | 5,308 |
| Freddie Mac, Series 3318, Class JT, 5.50% 20378 | 2,561 | 2,840 |
| GE Commercial Mortgage Corp., Series 2006-C1, Class A-4, 5.275% 20447,8 | 11,871 | 11,940 |
| Government National Mortgage Assn. 10.00% 20218 | 229 | 257 |
| Government National Mortgage Assn. 10.00% 20258 | 197 | 218 |
| Government National Mortgage Assn. 4.50% 20418 | 1,706 | 1,845 |
| Government National Mortgage Assn. 3.50% 20458,12 | 117,000 | 121,968 |
| Government National Mortgage Assn. 3.50% 20458 | 45,500 | 47,553 |
| Government National Mortgage Assn. 3.50% 20458 | 30,000 | 31,354 |
| Government National Mortgage Assn. 4.00% 20458,12 | 317,896 | 337,249 |
| Government National Mortgage Assn. 4.00% 20458,12 | 34,000 | 36,120 |
| Greenwich Capital Commercial Funding Corp., Series 2006-GG7, Class A-4, 5.819% 20387,8 | 6,647 | 6,778 |
| Greenwich Capital Commercial Funding Corp., Series 2007-GG9, Class A-4, 5.444% 20398 | 8,563 | 8,992 |
| Greenwich Capital Commercial Funding Corp., Series 2007-GG11, Class A-M, 5.867% 20497,8 | 7,879 | 8,407 |
| GS Mortgage Securities Corp. II, Series 2011-GC3, Class A-2, 3.645% 20443,8 | 1,113 | 1,120 |
| GSR Mortgage Loan Trust, Series 2004-2F, Class VIIA-1, 4.50% 20198 | 685 | 685 |
| Hilton USA Trust, Series 2013-HLF-AFX, 2.662% 20303,8 | 6,555 | 6,549 |
| IndyMac INDX Mortgage Loan Trust, Series 2006-AR5, Class 2-A-1, 4.18% 20367,8 | 6,422 | 5,439 |
| J.P. Morgan Chase Commercial Mortgage Securities Corp., Series 2006-LDP7, Class A-4, 5.905% 20457,8 | 13,389 | 13,665 |
| J.P. Morgan Chase Commercial Mortgage Securities Corp., Series 2011-C4, Class A-2, 3.341% 20463,8 | 5,188 | 5,260 |
| J.P. Morgan Chase Commercial Mortgage Securities Corp., Series 2011-C3A, Class A-2, 3.673% 20463,8 | 5,944 | 6,036 |
| J.P. Morgan Chase Commercial Mortgage Securities Corp., Series 2007-CB19, Class A-4, 5.695% 20497,8 | 15,360 | 16,261 |
| J.P. Morgan Chase Commercial Mortgage Securities Corp., Series 2007-CB19, Class A-1-A, 5.695% 20497,8 | 13,940 | 14,801 |
| J.P. Morgan Chase Commercial Mortgage Securities Corp., Series 2007-C1, Class A-4, 5.716% 20518 | 4,950 | 5,258 |
| J.P. Morgan Chase Commercial Mortgage Securities Corp., Series 2007-LD12, Class A-M, 6.01% 20517,8 | 20,950 | 22,472 |
| J.P. Morgan Chase Commercial Mortgage Securities Trust, Series 2006-LDP6, Class A-4, 5.475% 20437,8 | 14,600 | 14,764 |
| J.P. Morgan Chase Commercial Mortgage Securities Trust, Series 2006-LDP9, Class A-M, 5.372% 20478 | 17,000 | 17,439 |
| L.A. Arena Funding, LLC, Series 1, Class A, 7.656% 20263,8 | 5,672 | 6,294 |
| LB-UBS Commercial Mortgage Trust, Series 2007-C2, Class A-1-A, 5.387% 20408 | 9,084 | 9,593 |
| LB-UBS Commercial Mortgage Trust, Series 2007-C2, Class A-3, 5.43% 20408 | 9,777 | 10,259 |
| LB-UBS Commercial Mortgage Trust, Series 2007-C2, Class A-M, 5.493% 20407,8 | 18,000 | 18,937 |
| LB-UBS Commercial Mortgage Trust, Series 2007-C6, Class A-M, 6.114% 20407,8 | 10,035 | 10,729 |
| Merrill Lynch Mortgage Trust, Series 2007-C1, Class A-4, 5.835% 20507,8 | 3,460 | 3,643 |
| ML-CFC Commercial Mortgage Trust, Series 2006-4, Class A-3, 5.172% 20498 | 23,716 | 24,568 |
| ML-CFC Commercial Mortgage Trust, Series 2007-8, Class A-3, 5.881% 20497,8 | 11,290 | 12,070 |
| Morgan Stanley Capital I Trust, Series 2014-CPT, Class A, 3.35% 20213,8 | 8,745 | 9,075 |
| Morgan Stanley Capital I Trust, Series 2011-C3, Class A-2, 3.224% 20498 | 4,660 | 4,749 |
| National Australia Bank 1.25% 20183,8 | 5,000 | 4,979 |
| Structured Adjustable Rate Mortgage Loan Trust, Series 2006-4, Class 6-A, 4.735% 20367,8 | 4,049 | 3,222 |
| Wachovia Bank Commercial Mortgage Trust, Series 2007-C30, Class A-5, 5.342% 20438 | 8,000 | 8,372 |
| Wachovia Bank Commercial Mortgage Trust, Series 2007-C31, Class A-M, 5.591% 20477,8 | 19,050 | 20,151 |
The Income Fund of America — Page 30 of 34
Bonds, notes & other debt instruments
Mortgage-backed obligations (continued) | Principal amount
(000) | Value
(000) |
| Wachovia Bank Commercial Mortgage Trust, Series 2007-C32, Class A-3, 5.715% 20497,8 | $8,500 | $8,974 |
| Wachovia Bank Commercial Mortgage Trust, Series 2007-C33, Class A-M, 5.95% 20517,8 | 8,500 | 9,119 |
| | | 1,814,902 |
| Federal agency bonds & notes 0.35% | | |
| CoBank, ACB 7.875% 20183 | 10,000 | 11,527 |
| CoBank, ACB 0.886% 20223,7 | 3,700 | 3,459 |
| Fannie Mae 6.25% 2029 | 32,000 | 44,154 |
| Fannie Mae 7.125% 2030 | 1,500 | 2,231 |
| Fannie Mae, Series 2012-M14, Class A2, multifamily 2.301% 20227,8 | 4,285 | 4,274 |
| Fannie Mae, Series 2012-M9, Class A2, multifamily 2.482% 20228 | 12,231 | 12,391 |
| Fannie Mae, Series 2012-M5, Class A2, multifamily 2.715% 20228 | 7,000 | 7,195 |
| Fannie Mae, Series 2014-M1, multifamily 3.32% 20237,8 | 450 | 471 |
| Fannie Mae, Series 2013-M14, Class A2, multifamily 3.329% 20237,8 | 9,141 | 9,597 |
| Fannie Mae, Series 2014-M2, Class A2, multifamily 3.513% 20237,8 | 10,100 | 10,739 |
| Fannie Mae, Series 2014-M9, multifamily 3.103% 20247,8 | 7,990 | 8,234 |
| Fannie Mae, Series 2014-M3, Class A2, multifamily 3.476% 20247,8 | 10,475 | 11,106 |
| Federal Home Loan Bank 5.50% 2036 | 100 | 131 |
| Freddie Mac 2.50% 2016 | 22,500 | 22,892 |
| Freddie Mac 0.75% 2018 | 66,300 | 65,971 |
| Freddie Mac, Series K019, Class A2, multifamily 2.272% 20228 | 8,000 | 8,017 |
| Freddie Mac, Series K021, Class A2, multifamily 2.396% 20228 | 8,280 | 8,323 |
| Freddie Mac, Series K025, Class A2, multifamily 2.682% 20228 | 7,000 | 7,128 |
| Freddie Mac, Series K718, Class A2, multifamily 2.791% 20228 | 7,715 | 7,960 |
| Freddie Mac, Series K036, Class A1, multifamily 2.777% 20238 | 12,245 | 12,717 |
| Freddie Mac, Series K028, Class A2, multifamily 3.111% 20238 | 9,800 | 10,234 |
| Freddie Mac, Series K035, Class A2, multifamily 3.458% 20237,8 | 3,000 | 3,187 |
| Freddie Mac, Series K036, Class A2, multifamily 3.527% 20237,8 | 9,465 | 10,116 |
| Freddie Mac, Series K043, Class A2, multifamily 3.062% 20248 | 26,000 | 26,607 |
| Freddie Mac, Series K041, Class A2, multifamily 3.171% 20248 | 1,300 | 1,348 |
| Freddie Mac, Series K040, Class A2, multifamily 3.241% 20248 | 8,945 | 9,329 |
| Private Export Funding Corp. 3.55% 2024 | 1,660 | 1,764 |
| Tennessee Valley Authority, Series A, 3.875% 2021 | 850 | 939 |
| Tennessee Valley Authority 1.875% 2022 | 850 | 821 |
| Tennessee Valley Authority, Series B, 3.50% 2042 | 500 | 486 |
| Tennessee Valley Authority, Series 2008, Class A, 4.875% 2048 | 700 | 814 |
| United States Agency for International Development, Jordan (Kingdom of) 3.00% 2025 | 1,000 | 1,009 |
| United States Agency for International Development, Republic of Egypt 4.45% 2015 | 10,000 | 10,044 |
| | | 335,215 |
| Asset-backed obligations 0.34% | | |
| Aesop Funding LLC, Series 2014-2A, Class A, 2.50% 20213,8 | 10,500 | 10,542 |
| Aesop Funding LLC, Series 2015-1, Class A, 2.50% 20213,8 | 10,000 | 10,005 |
| Aesop Funding LLC, Series 2015-2-A, Class A, 2.63% 20213,8 | 5,680 | 5,704 |
| American Express Credit Account Master Trust, Series 2014-4, Class A, 1.43% 20208 | 7,155 | 7,182 |
| AmeriCredit Automobile Receivables Trust, Series 2015-2, Class C, 2.40% 20218 | 6,000 | 6,016 |
| AmeriCredit Automobile Receivables Trust, Series 2015-1, Class A-3, 1.26% 20198 | 6,130 | 6,127 |
| AmeriCredit Automobile Receivables Trust, Series 2014-4, Class A-3, 1.27% 20198 | 4,810 | 4,812 |
| Bank of the West Auto Trust, Series 2014-1, Class A-3, 1.09% 20193,8 | 2,930 | 2,933 |
| Capital One Multi-asset Execution Trust, Series 2014-A5, Class A, 1.48% 20208 | 8,000 | 8,042 |
| CarMaxAuto Owner Trust, Series 2014-1, Class A-2, 0.47% 20178 | 987 | 987 |
| CarMaxAuto Owner Trust, Series 2014-1, Class A-3, 0.79% 20188 | 6,105 | 6,096 |
| CarMaxAuto Owner Trust, Series 2014-4, Class A-3, 1.25% 20198 | 6,600 | 6,592 |
| Chesapeake Funding LLC, Series 2014-1-A, Class A, 0.608% 20263,7,8 | 4,448 | 4,445 |
| Citibank Credit Card Issuance Trust, Series 2008-A-2, Class A2, 1.335% 20207,8 | 14,000 | 14,301 |
The Income Fund of America — Page 31 of 34
Bonds, notes & other debt instruments
Asset-backed obligations (continued) | Principal amount
(000) | Value
(000) |
| Conseco Finance Home Loan Trust, Series 1999-G, Class B-2, 10.96% 20298 | $13,630 | $1,433 |
| Countryplace Manufactured Housing Contract, Series 2005-1, Class A-3, AMBAC insured, 4.80% 20353,8 | 904 | 913 |
| Countryplace Manufactured Housing Contract, Series 2005-1, Class A-4, AMBAC insured, 5.20% 20353,7,8 | 1,145 | 1,188 |
| CWHEQ Revolving Home Equity Loan Trust, Series 2006-I, Class 2-A, FSA insured, 0.327% 20377,8 | 1,760 | 1,626 |
| CWHEQ Revolving Home Equity Loan Trust, Series 2007-B, Class A, FSA insured, 0.337% 20377,8 | 3,068 | 2,798 |
| Discover Card Execution Note Trust, Series 2015-A2, Class A, 1.90% 20228 | 10,000 | 9,941 |
| Discover Card Execution Note Trust, Series 2014-A4, Class A4, 2.12% 20218 | 7,175 | 7,262 |
| Drive Auto Receivables Trust, Series 2015-B-A, Class C, 2.76% 20213,8 | 7,970 | 7,978 |
| Drive Auto Receivables Trust, Series 2015-AA, Class C, 3.06% 20213,8 | 8,900 | 8,928 |
| Enterprise Fleet Financing LLC, Series 2014-1, Class A2, 0.87% 20193,8 | 2,009 | 2,006 |
| Fifth Third Auto Trust, Series 2014-3, Class A3, 0.96% 20198 | 4,000 | 3,995 |
| Ford Credit Auto Owner Trust, Series 2014-B-A3, 0.90% 20188 | 5,800 | 5,799 |
| Ford Credit Auto Owner Trust, Series 2014-1-A, 2.26% 20253,8 | 2,405 | 2,431 |
| Ford Credit Auto Owner Trust, Series 2015-1 Class A, 2.12% 20263,8 | 6,300 | 6,298 |
| Ford Credit Auto Owner Trust, Series 2014-2-A, 2.31% 20263,8 | 10,110 | 10,225 |
| Ford Credit Auto Owner Trust, Series 2015-2, Class A, 2.44% 20273,8 | 17,160 | 17,323 |
| Ford Credit Floorplan Master Owner Trust, Series 2015-2, Class A-1, 1.98% 20228 | 7,780 | 7,779 |
| Hertz Fleet Lease Funding LP, Series 2014-1-A, 0.589% 20283,7,8 | 2,602 | 2,604 |
| Hertz Vehicle Financing LLC, Rental Car Asset-backed Notes, Series 2015-1, Class A, 2.73% 20214,5,8 | 7,518 | 7,459 |
| Hertz Vehicle Financing LLC, Rental Car Asset-backed Notes, Series 2015-1, Class A, 3.52% 20214,5,8 | 1,622 | 1,610 |
| Hertz Vehicle Financing LLC, Rental Car Asset-backed Notes, Series 2013-1A, Class A-1, 1.12% 20173,8 | 8,500 | 8,493 |
| Home Equity Mortgage Trust, Series 2006-6, Class 2A-1, 0.391% 20377,8 | 13,332 | 1,725 |
| Honda Auto Receivables Owner Trust, Series 2015-1, Class A-2, 0.70% 20178 | 4,705 | 4,706 |
| Honda Auto Receivables Owner Trust, Series 2014-3, Class A-3, 0.88% 20178 | 7,560 | 7,567 |
| Honda Auto Receivables Owner Trust, Series 2014-4, Class A-3, 0.99% 20188 | 6,120 | 6,117 |
| Hyundai Auto Receivables Trust, Series 2014-A, Class A2, 0.46% 20178 | 470 | 470 |
IndyMac Home Equity Mortgage Loan Asset-backed Trust, Series 2007-H1, Class A-1,
FSA insured, 0.351% 20377,8 | 1,769 | 1,590 |
| Mercedes-Benz Auto Receivables Trust, Series 2014-1, Class A3, 0.87% 20188 | 7,000 | 7,001 |
| RAMP Trust, Series 2003-RZ4, Class A-7, 4.79% 20337,8 | 310 | 327 |
| Santander Drive Auto Receivables Trust, Series 2014-3, Class A3, 0.81% 20188 | 6,000 | 6,000 |
| Santander Drive Auto Receivables Trust, Series 2014-4, Class A3, 1.08% 20188 | 6,685 | 6,693 |
| Santander Drive Auto Receivables Trust, Series 2013-3, Class B, 1.19% 20188 | 5,000 | 5,006 |
| Santander Drive Auto Receivables Trust, Series 2012-6, Class C, 1.94% 20188 | 12,759 | 12,813 |
| Santander Drive Auto Receivables Trust, Series 2014-5, Class A-3, 1.15% 20198 | 2,300 | 2,301 |
| Santander Drive Auto Receivables Trust, Series 2014-4, Class B, 1.82% 20198 | 6,000 | 6,032 |
| Santander Drive Auto Receivables Trust, Series 2014-2, Class C, 2.33% 20198 | 5,000 | 5,055 |
| Santander Drive Auto Receivables Trust, Series 2015-2, Class C, 2.44% 20218 | 16,550 | 16,569 |
| Santander Drive Auto Receivables Trust, Series 2015-1, Class C, 2.57% 20218 | 5,340 | 5,373 |
| Toyota Auto Receivables Owner Trust, Series 2014-B, Class A3, 0.76% 20188 | 11,750 | 11,748 |
| Volkswagen Auto Loan Enhanced Trust, Series 2014-2, Class A-3 0.95% 20198 | 9,000 | 8,973 |
| World Omni Auto Receivables Trust, Series 2014-B, Class A-3, 1.14% 20208 | 4,625 | 4,626 |
| | | 332,565 |
| Bonds & notes of governments & government agencies outside the U.S. 0.09% | | |
| Colombia (Republic of) Global 5.625% 2044 | 5,700 | 5,814 |
| Croatian Government 6.75% 2019 | 3,200 | 3,536 |
| Croatian Government 6.375% 2021 | 5,000 | 5,406 |
| Hungarian Government 6.25% 2020 | 3,410 | 3,862 |
| Polish Government 6.375% 2019 | 6,060 | 7,037 |
| Polish Government 5.00% 2022 | 3,000 | 3,359 |
| Slovenia (Republic of) 5.50% 2022 | 9,000 | 10,137 |
| Spanish Government 4.00% 20183 | 31,765 | 33,676 |
The Income Fund of America — Page 32 of 34
Bonds, notes & other debt instruments
Bonds & notes of governments & government agencies outside the U.S. (continued) | Principal amount
(000) | Value
(000) |
| United Mexican States Government Global 3.60% 2025 | $6,000 | $5,970 |
| United Mexican States Government Global 5.55% 2045 | 3,500 | 3,793 |
| | | 82,590 |
| Municipals 0.05% | | |
| State of California, Various Purpose G.O. Bonds, 5.00% 2043 | 7,500 | 8,457 |
| State of California, Various Purpose G.O. Bonds, 6.20% 2019 | 24,675 | 28,325 |
State of New Jersey, Transportation Trust Fund Auth., Transportation System Rev. Ref. Bonds,
Series 2013-B, 1.758% 2018 | 8,500 | 8,360 |
State of Washington, Energy Northwest, Columbia Generating Station Electric Rev. Bonds,
Series 2012-E, 2.197% 2019 | 6,500 | 6,575 |
| | | 51,717 |
| Total bonds, notes & other debt instruments (cost: $19,282,716,000) | | 19,367,690 |
| Short-term securities 6.98% | | |
| 3M Co. 0.10% due 8/25/20153 | 48,700 | 48,696 |
| Abbott Laboratories 0.12%–0.15% due 8/27/2015–10/13/20153 | 57,800 | 57,794 |
| Army and Air Force Exchange Service 0.10% due 8/31/20153 | 11,300 | 11,299 |
| Caterpillar Financial Services Corp. 0.12% due 8/28/2015–9/11/2015 | 80,400 | 80,390 |
| Chariot Funding, LLC 0.33%–0.40% due 12/1/2015–12/14/20153 | 124,000 | 123,842 |
| Chevron Corp. 0.09%–0.12% due 8/20/2015–9/21/20153 | 169,800 | 169,777 |
| Ciesco LLC 0.30% due 9/9/2015 | 50,000 | 49,992 |
| Coca-Cola Co. 0.14%–0.39% due 8/11/2015–1/11/20163 | 150,000 | 149,845 |
| Emerson Electric Co. 0.12% due 8/24/2015–9/16/20153 | 114,400 | 114,389 |
| ExxonMobil Corp. 0.12%–0.15% due 9/22/2015–10/22/2015 | 52,400 | 52,380 |
| Fannie Mae 0.09%–0.30% due 8/6/2015–3/1/2016 | 920,000 | 919,509 |
| Federal Farm Credit Banks 0.13%–0.30% due 8/12/2015–5/17/2016 | 113,100 | 112,979 |
| Federal Home Loan Bank 0.06%–0.20% due 8/14/2015–1/27/2016 | 2,593,150 | 2,592,615 |
| Freddie Mac 0.10%–0.21% due 8/5/2015–1/6/2016 | 1,248,000 | 1,247,672 |
| General Electric Capital Corp. 0.23%–0.30% due 11/17/2015–12/7/2015 | 73,600 | 73,541 |
| Google Inc. 0.10% due 9/2/20153 | 71,072 | 71,068 |
| IBM Corp. 0.09%–0.10% due 8/20/2015–8/24/20153 | 83,900 | 83,897 |
| John Deere Capital Corp. 0.13% due 8/11/20153 | 25,500 | 25,499 |
| Jupiter Securitization Co., LLC 0.28% due 10/8/20153 | 50,000 | 49,977 |
| Kimberly-Clark Corp. 0.10% due 8/6/2015–9/3/20153 | 60,800 | 60,796 |
| Microsoft Corp. 0.09% due 8/12/2015–9/2/20153 | 75,000 | 74,997 |
| National Rural Utilities Cooperative Finance Corp. 0.10% due 8/13/2015–8/25/2015 | 90,000 | 89,993 |
| Paccar Financial Corp. 0.10% due 8/20/2015–8/26/2015 | 62,000 | 61,994 |
| Pfizer Inc 0.12%–0.14% due 8/3/2015–10/1/20153 | 88,000 | 87,994 |
| Precision Castparts Corp. 0.15% due 8/3/20153 | 45,000 | 45,000 |
| Private Export Funding Corp. 0.15% due 9/22/20153 | 13,000 | 12,996 |
| U.S. Treasury Bills 0.13% due 10/1/2015 | 50,000 | 49,997 |
| United Technologies Corp. 0.12% due 8/3/2015–8/4/20153 | 95,900 | 95,899 |
| Walt Disney Co. 0.10%–0.13% due 8/14/2015–10/2/20153 | 149,100 | 149,083 |
| Total short-term securities (cost: $6,763,471,000) | | 6,763,910 |
| Total investment securities 100.05% (cost: $83,042,610,000) | | 97,037,102 |
| Other assets less liabilities (0.05)% | | (45,091) |
| Net assets 100.00% | | $96,992,011 |
As permitted by U.S. Securities and Exchange Commission regulations, “Miscellaneous” securities include holdings in their first year of acquisition that have not previously been publicly disclosed.
The Income Fund of America — Page 33 of 34
Forward currency contracts
The fund has entered into forward currency contracts as shown in the following table. The average notional amount of open forward currency contracts was $461,060,000 over the prior 12-month period.
| | Settlement
date | Counterparty | Contract amount | Unrealized
appreciation
at 7/31/2015
(000) |
Receive
(000) | Deliver
(000) |
| Sales: | | | | | |
| Australian dollars | 9/1/2015 | JPMorgan Chase | $121,117 | A$163,200 | $2,059 |
| Australian dollars | 9/17/2015 | HSBC Bank | $28,636 | A$39,000 | 207 |
| Euros | 8/6/2015 | UBS AG | $176,785 | €157,600 | 3,688 |
| | | | | | $5,954 |
| 1 | Security did not produce income during the last 12 months. |
| 2 | Represents an affiliated company as defined under the Investment Company Act of 1940. |
| 3 | Acquired in a transaction exempt from registration under Rule 144A or Section 4(2) of the Securities Act of 1933. May be resold in the U.S. in transactions exempt from registration, normally to qualified institutional buyers. The total value of all such securities was $6,581,712,000, which represented 6.79% of the net assets of the fund. |
| 4 | Valued under fair value procedures adopted by authority of the board of trustees. The total value of all such securities was $226,581,000, which represented .23% of the net assets of the fund. |
| 5 | Acquired through a private placement transaction exempt from registration under the Securities Act of 1933. May be subject to legal or contractual restrictions on resale. Further details on these holdings appear below. |
| 6 | Payment in kind; the issuer has the option of paying additional securities in lieu of cash. |
| 7 | Coupon rate may change periodically. |
| 8 | Principal payments may be made periodically. Therefore, the effective maturity date may be earlier than the stated maturity date. |
| 9 | Loan participations and assignments; may be subject to legal or contractual restrictions on resale. The total value of all such loans was $512,779,000, which represented .53% of the net assets of the fund. |
| 10 | Scheduled interest and/or principal payment was not received. |
| 11 | Index-linked bond whose principal amount moves with a government price index. |
| 12 | Purchased on a TBA basis. |
| Private placement securities | Acquisition
date | Cost
(000) | Value
(000) | Percent
of net
assets |
| CEVA Group PLC, Series A-2, 2.289% convertible preferred | 5/2/2013 | $13,171 | $10,089 | .01% |
| Hertz Vehicle Financing LLC, Rental Car Asset-backed Notes, Series 2015-1, Class A, 2.73% 2021 | 4/7/2015 | 7,518 | 7,459 | .01 |
| Hertz Vehicle Financing LLC, Rental Car Asset-backed Notes, Series 2015-1, Class A, 3.52% 2021 | 4/7/2015 | 1,622 | 1,610 | .00 |
| Total private placement securities | | $22,311 | $19,158 | .02% |
| Key to abbreviations and symbols | | |
| ADR = American Depositary Receipts | Ref. = Refunding | € = Euros |
| Auth. = Authority | Rev. = Revenue | GBP = British pounds |
| FDR = Fiduciary Depositary Receipts | TBA = To be announced | HKD = Hong Kong dollars |
| G.O. = General Obligation | A$ = Australian dollars | |
| LOC = Letter of credit | CAD = Canadian dollars | |
Investments are not FDIC-insured, nor are they deposits of or guaranteed by a bank or any other entity, so they may lose value.
Investors should carefully consider investment objectives, risks, charges and expenses. This and other important information is contained in the fund prospectus and summary prospectus, which can be obtained from your financial professional and should be read carefully before investing. You may also call American Funds Service Company (AFS) at (800) 421-4225 or visit the American Funds website at americanfunds.com.
| MFGEFPX-006-0915O-S49154 | The Income Fund of America — Page 34 of 34 |
REPORT OF INDEPENDENT REGISTERED PUBLIC ACCOUNTING FIRM
To the Shareholders and Board of Trustees of
The Income Fund of America:
We have audited the accompanying statement of assets and liabilities of The Income Fund of America (the “Fund”), including the summary schedule of investments, as of July 31, 2015, and the related statements of operations for the year then ended, the statements of changes in net assets for each of the two years in the period then ended (collectively, the “financial statements”), the financial highlights for each of the five years in the period then ended (the financial statements and financial highlights are included in Item 1 of this Form N-CSR), and the schedule of investments in securities as of July 31, 2015 (included in Item 6 of this Form N-CSR). These financial statements, financial highlights, and schedule of investments in securities are the responsibility of the Fund’s management. Our responsibility is to express an opinion on these financial statements, financial highlights, and schedule of investments in securities based on our audits.
We conducted our audits in accordance with the standards of the Public Company Accounting Oversight Board (United States). Those standards require that we plan and perform the audit to obtain reasonable assurance about whether the financial statements, financial highlights, and schedule of investments in securities are free of material misstatement. An audit includes examining, on a test basis, evidence supporting the amounts and disclosures in the financial statements and schedule of investments in securities. Our procedures included confirmation of securities owned as of July 31, 2015, by correspondence with the custodian and brokers; where replies were not received from brokers, we performed other auditing procedures. An audit also includes assessing the accounting principles used and significant estimates made by management, as well as evaluating the overall financial statement presentation. We believe that our audits provide a reasonable basis for our opinion.
In our opinion, the financial statements, financial highlights, and schedule of investments in securities referred to above present fairly, in all material respects, the financial position of The Income Fund of America as of July 31, 2015, and the results of its operations for the year then ended, the changes in its net assets for each of the two years in the period then ended, and the financial highlights for each of the five years in the period then ended, in conformity with accounting principles generally accepted in the United States of America.
DELOITTE & TOUCHE LLP
Costa Mesa, California
September 10, 2015
ITEM 7 – Disclosure of Proxy Voting Policies and Procedures for Closed-End Management Investment Companies
Not applicable to this Registrant, insofar as the Registrant is not a closed-end management investment company.
ITEM 8 – Portfolio Managers of Closed-End Management Investment Companies
Not applicable to this Registrant, insofar as the Registrant is not a closed-end management investment company.
ITEM 9 – Purchases of Equity Securities by Closed-End Management Investment Company and Affiliated Purchasers
Not applicable to this Registrant, insofar as the Registrant is not a closed-end management investment company.
ITEM 10 – Submission of Matters to a Vote of Security Holders
There have been no material changes to the procedures by which shareholders may recommend nominees to the Registrant’s board of trustees since the Registrant last submitted a proxy statement to its shareholders. The procedures are as follows. The Registrant has a nominating and governance committee comprised solely of persons who are not considered ‘‘interested persons’’ of the Registrant within the meaning of the Investment Company Act of 1940, as amended. The committee periodically reviews such issues as the board’s composition, responsibilities, committees, compensation and other relevant issues, and recommends any appropriate changes to the full board of trustees. While the committee normally is able to identify from its own resources an ample number of qualified candidates, it will consider shareholder suggestions of persons to be considered as nominees to fill future vacancies on the board. Such suggestions must be sent in writing to the nominating and governance committee of the Registrant, c/o the Registrant’s Secretary, and must be accompanied by complete biographical and occupational data on the prospective nominee, along with a written consent of the prospective nominee for consideration of his or her name by the nominating and governance committee.
ITEM 11 – Controls and Procedures
| (a) | The Registrant’s Principal Executive Officer and Principal Financial Officer have concluded, based on their evaluation of the Registrant’s disclosure controls and procedures (as such term is defined in Rule 30a-3 under the Investment Company Act of 1940), that such controls and procedures are adequate and reasonably designed to achieve the purposes described in paragraph (c) of such rule. |
| | |
| (b) | There were no changes in the Registrant’s internal controls over financial reporting (as defined in Rule 30a-3(d) under the Investment Company Act of 1940) that occurred during the Registrant’s second fiscal quarter of the period covered by this report that has materially affected, or is reasonably likely to materially affect, the Registrant’s internal control over financial reporting. |
ITEM 12 – Exhibits
| (a)(1) | The Code of Ethics that is the subject of the disclosure required by Item 2 is attached as an exhibit hereto. |
| | |
| (a)(2) | The certifications required by Rule 30a-2 of the Investment Company Act of 1940 and Sections 302 and 906 of the Sarbanes-Oxley Act of 2002 are attached as exhibits hereto. |
SIGNATURES
Pursuant to the requirements of the Securities Exchange Act of 1934 and the Investment Company Act of 1940, the Registrant has duly caused this report to be signed on its behalf by the undersigned, thereunto duly authorized.
| | THE INCOME FUND OF AMERICA |
| | |
| | By /s/ Hilda L. Applbaum |
| | Hilda L. Applbaum, Vice Chairman and Principal Executive Officer |
| | |
| | Date: September 30, 2015 |
Pursuant to the requirements of the Securities Exchange Act of 1934 and the Investment Company Act of 1940, this report has been signed below by the following persons on behalf of the Registrant and in the capacities and on the dates indicated.
| By /s/ Hilda L. Applbaum |
Hilda L. Applbaum, Vice Chairman and Principal Executive Officer |
| |
| Date: September 30, 2015 |
| By /s/ Jeffrey P. Regal |
Jeffrey P. Regal, Treasurer and Principal Financial Officer |
| |
| Date: September 30, 2015 |