UNITED STATES
SECURITIES AND EXCHANGE COMMISSION
Washington, D.C. 20549
FORM N-CSR
Certified Shareholder Report of
Registered Management Investment Companies
Investment Company Act File Number: 811-01880
The Income Fund of America
(Exact Name of Registrant as Specified in Charter)
6455 Irvine Center Drive
Irvine, California 92618
(Address of Principal Executive Offices)
Registrant's telephone number, including area code: (213) 486-9200
Date of fiscal year end: July 31
Date of reporting period: July 31, 2018
Michael W. Stockton
The Income Fund of America
333 South Hope Street
Los Angeles, California 90071
(Name and Address of Agent for Service)
ITEM 1 – Reports to Stockholders
| The Income Fund of America® |  |
| |
Annual report
for the year ended
July 31, 2018 |

Seeking high current
income through a
flexible mix of stocks
and bonds
The Income Fund of America seeks current income while secondarily striving for capital growth.
This fund is one of more than 40 offered by Capital Group, one of the nation’s largest mutual fund families. For more than 85 years, Capital Group has invested with a long-term focus based on thorough research and attention to risk.
Fund results shown in this report, unless otherwise indicated, are for Class A shares at net asset value. If a sales charge (maximum 5.75%) had been deducted, the results would have been lower. Results are for past periods and are not predictive of results for future periods. Current and future results may be lower or higher than those shown. Share prices and returns will vary, so investors may lose money. Investing for short periods makes losses more likely. For current information and month-end results, visit americanfunds.com.
Here are the average annual total returns on a $1,000 investment with all distributions reinvested for periods ended June 30, 2018 (the most recent calendar quarter-end):
| Class A shares | 1 year | 5 years | 10 years |
| | | | |
| Reflecting 5.75% maximum sales charge | -0.30% | 6.51% | 6.62% |
For other share class results, visit americanfunds.com and americanfundsretirement.com.
The total annual fund operating expense ratio is 0.55% for Class A shares as of the prospectus dated October 1, 2018 (unaudited).
Investment results assume all distributions are reinvested and reflect applicable fees and expenses. When applicable, investment results reflect fee waivers, without which results would have been lower. Visit americanfunds.com for more information.
The fund’s 30-day yield for Class A shares as of August 31, 2018, calculated in accordance with the U.S. Securities and Exchange Commission (SEC) formula, was 2.78%. The fund’s 12-month distribution rate for Class A shares as of that date was 2.62%. Both reflect the 5.75% maximum sales charge. The SEC yield reflects the rate at which the fund is earning income on its current portfolio of securities while the distribution rate reflects the fund’s past dividends paid to shareholders. Accordingly, the fund’s SEC yield and distribution rate may differ.
The return of principal for bond funds and for funds with significant underlying bond holdings is not guaranteed. Fund shares are subject to the same interest rate, inflation and credit risks associated with the underlying bond holdings. High-yield bonds are subject to greater fluctuations in value and risk of loss of income and principal than investment-grade bonds. Bond ratings, which typically range from AAA/Aaa (highest) to D (lowest), are assigned by credit rating agencies such as Standard & Poor’s, Moody’s and/or Fitch as an indication of an issuer’s creditworthiness. Investing outside the United States may be subject to additional risks, such as currency fluctuations, periods of illiquidity and price volatility. These risks may be heightened in connection with investments in developing countries. Refer to the fund prospectus and the Risk Factors section of this report for more information on these and other risks associated with investing in the fund.
Investments are not FDIC-insured, nor are they deposits of or guaranteed by a bank or any other entity, so they may lose value.
Fellow investors:
For its recently concluded fiscal year, the Income Fund of America advanced 6.98%. The fund paid dividends totaling 66 cents a share. It also paid capital gains totaling 50 cents a share.
The fund outpaced its peer group, as measured by the Lipper Income Funds Index, which rose 4.29%. The fund’s return also exceeded that of the bond market, as measured by the unmanaged Bloomberg Barclays U.S. Aggregate Index, which declined 0.80%.
The Income Fund of America, which invests in both stocks and bonds, lagged the broader equity market. The unmanaged Standard & Poor’s 500 Composite Index recorded a 16.24% total return. The S&P 500 is a market-capitalization weighted index based on the results of approximately 500 widely held common stocks.
As you can see in the table below, the fund has fared well against the Lipper and Bloomberg Barclays indexes for all the periods shown.
A strong start, followed by rising volatility
The fiscal year began on an upbeat note, as the U.S., Europe, Japan and China enjoyed a period of synchronized economic growth, driving solid gains across most major equity markets. Stock market returns were bolstered by rising corporate earnings, the passage of sweeping tax cuts in the U.S. and accommodative monetary policy across most major markets. By February, however, equity markets came under pressure as investors became increasingly concerned about deteriorating trade relations, political turmoil, rising U.S. interest rates and signs of slowing economic growth in Europe and Japan. In the closing weeks of the period, tariffs on $34 billion of U.S. imports from China took effect.
Despite the increased volatility, U.S. equity markets ended the fiscal year in solidly positive territory as robust economic
Results at a glance
For periods ended July 31, 2018, (with all distributions reinvested)
| | | Cumulative
total returns | | Average annual total returns |
| | | 1 year | | 5 years | | 10 years | | Lifetime (12/1/73)1 |
| | | | | | | | | |
| The Income Fund of America (Class A shares) | | | 6.98 | % | | | 7.66 | % | | | 7.62 | % | | | 10.95 | % |
| Standard & Poor’s 500 Composite Index | | | 16.24 | | | | 13.12 | | | | 10.67 | | | | 11.10 | |
| Bloomberg Barclays U.S. Aggregate Index2 | | | –0.80 | | | | 2.25 | | | | 3.73 | | | | 7.22 | |
| 65%/35% S&P 500 Index/Bloomberg Barclays U.S. Aggregate Index3 | | | 10.10 | | | | 9.33 | | | | 8.47 | | | | 10.01 | |
| Lipper Income Funds Index4 | | | 4.29 | | | | 5.08 | | | | 5.45 | | | | — | |
The market indexes are unmanaged and, therefore, have no expenses. Investors cannot invest directly in an index.
| 1 | Date Capital Research and Management Company became the fund’s investment adviser. |
| 2 | Source: Bloomberg Index Services Ltd. From December 1, 1973, through December 31, 1975, the Bloomberg Barclays U.S. Government/Credit Index was used because the Bloomberg Barclays U.S. Aggregate Index did not yet exist. |
| 3 | The 65%/35% S&P 500 Index/Bloomberg Barclays U.S. Aggregate Index blends the S&P 500 Index with the Bloomberg Barclays U.S. Aggregate Index by weighting their total returns at 65% and 35%, respectively. Results assume the blend is rebalanced monthly. |
| 4 | Source: Thomson Reuters Lipper. The inception date for the index was December 31, 1988; therefore, no lifetime return is shown. Lipper indexes track the largest mutual funds (no more than 30), represented by one share class per fund, in the corresponding category. |
| The Income Fund of America | 1 |
growth and the lower tax rates boosted earnings growth for U.S. companies. The U.S. economy grew 4.2% in the second quarter – its strongest pace in nearly four years – powered by strong exports and a rebound in consumer spending.
Inflation showed signs of stabilizing toward the end of the period; the core personal consumption expenditure index rose 1.9% for the third straight month in June. The Federal Reserve hiked the federal funds target rate in June by 25 basis points, to between 1.75% and 2.0%. The Fed also signaled two more rate increases later in the year, for a total of four in 2018. The faster pace of rate hikes likely reflects a brighter near-term outlook for U.S. growth.
Much of the market leadership was among growth-oriented technology and consumer discretionary companies. Higher dividend-paying stocks, the focus of this fund, tended to trail the broader market. This affected the fund’s return on a relative basis.
Positive contributions from a wide range of stocks
Rather than pursuing overarching macroeconomic or market themes, the fund’s managers build the portfolio stock by stock, based on the merits of each individual company. Companies across a variety of sectors and industries contributed to the fund’s positive result. This approach is reflected in the fund’s 10 largest holdings, which range from a software maker to a chemical manufacturer to banks.
Each of the portfolio’s 10 largest holdings notched gains, contributing to the fund’s overall positive result. Among the most noteworthy of these were top holding Microsoft (up 45.91%), semiconductor maker Intel (up 35.61%) and financial markets operator CME Group (up 29.77%).
A boost from technology shares
Microsoft was the fund’s largest position at the end of the period, representing about 2.7% of portfolio’s holdings. Shares rose partly on the strength of revenue growth from its Azure cloud-computing service and sales of Microsoft’s Office 365 — a cloud delivered, subscription-based productivity suite. Intel, one of the world’s leading semiconductor makers and the fund’s third-largest investment, surged partly due to strong growth from its non-PC businesses, primarily data centers, as well as better than expected earnings and revenue. Holdings of Taiwan Semiconductor Manufacturing Co. gained 13.54% during the period.
While these investments and other positions in information technology contributed to the fund’s overall positive result, a lighter concentration in the sector relative to the broader market proved to be a slight drag on returns. The fund had relatively light exposure to technology companies because many don’t pay a dividend or they pay one that’s too low to help the fund achieve its income objective.
Fund benefits from rising oil prices
Oil prices rallied during the fiscal year, with crude bolstered by geopolitical tensions in the Middle East and the U.S. government’s decision to re-impose sanctions on oil producer Iran. Oil and natural gas exploration company Occidental Petroleum soared 35.52% on stronger earnings. Profitability was helped by higher oil prices, lower expenses and increased operational efficiency. Among other notable holdings in the energy sector, Chevron, the fund’s sixth-largest position, recorded a 15.64% gain and No. 8 holding Royal Dutch Shell rose 22.85% as the company beat first-quarter earnings forecasts.
Mixed results from financials, health care
Holdings in financials and the health care sector produced mixed results. Among financials, the aforementioned CME Group, operator of the world’s largest futures exchange, surged as it
Striking a balance between return and volatility
The Income Fund of America takes a sensible approach to income. Looking back 10 years, the fund has provided higher returns than bonds and income funds, and lower volatility than stocks. In addition, as can be seen on page 1, the fund’s lifetime results surpass those of both the stock and bond indexes.

Sources: Stocks — S&P 500; Bonds — Bloomberg Barclays U.S. Aggregate Index; Income funds — Lipper Income Funds Index. Returns include reinvestment of all distributions. Volatility is calculated at net asset value by Lipper using annualized standard deviation (based on monthly returns), a measure of how returns over time have varied from the mean; a lower number signifies lower volatility.
| 2 | The Income Fund of America |
benefited from rising derivatives volumes against increased capital market volatility. At the end of March, the futures trading giant reached a deal to acquire U.K.-based trading group NEX, a provider of currency and fixed income platforms, for $5.5 billion. Also among the fund’s top 10 holdings in the financials sector, J.P. Morgan Chase (25.22%) and Wells Fargo (6.21%) both finished higher. The sector has benefited from the prospect of rising interest rates, which could improve banks’ net interest margins, and a less restrictive regulatory environment under the Trump administration.
However, investments in BNP Paribas (–16.17%) and Société Générale (–24.14%), banks domiciled in France, and insurer AXA (–14.55%) all posted double-digit declines. With respect to the health care sector, Merck, a leading pharmaceutical company and the fund’s second biggest position, rose modestly as positive results from clinical trials of its cancer drug Keytruda and new regulatory approvals bolstered sentiment on the company’s growth outlook. The European Union granted regulatory approval for Merck’s ovarian cancer treatment Lynparza. Meanwhile, the Food and Drug Administration approved Lynparza as a treatment for metastatic breast cancer. Nevertheless, Merck’s advance trailed that of the broader stock market. Among the fund’s other notable health care holdings, AstraZeneca advanced 29.46%, while Abbvie recorded a 31.93% gain.
Consumer staples weigh on results
Investments in the consumer staples sector held back the fund’s overall result. Shares of tobacco companies suffered in general from concerns about weak momentum in next generation tobacco products together with slowing sales of conventional cigarettes. British American Tobacco slid 11.50% as revenues fell short of analyst expectations. Tobacco companies Altria (-9.68%) and Philip Morris International (-26.06%) also declined.
Also among consumer staples, consumer goods maker Procter & Gamble slid 10.94%.
Investments abroad deliver mixed results
The Income Fund of America can invest up to 30% of its assets in stocks outside the U.S. During the past fiscal year, a number of our non-U.S. holdings contributed to absolute returns, particularly among non-U.S. pharmaceutical companies. AstraZeneca, for example, is based in the United Kingdom, as is GlaxoSmithKline, which also advanced during the period. However, signs of slower growth in some overseas markets and a strengthening U.S. dollar proved to be headwinds for some non-U.S. holdings. Canadian energy transportation company Enbridge, for example, declined, as did French banks BNP Paribas, Societe Generale and British American Tobacco.
The importance of bonds
Bonds continue to play an important role in the fund, providing income and mitigating volatility. Bonds made up about 23% of the portfolio at period-end. The fund’s fixed income allocation was composed of high-yield and investment-grade corporate bonds, as well as U.S. Treasuries. High-yield bonds advanced and were a significant source of income. However, with credit spreads tightening, we have grown more cautious about high yield bonds and have taken steps to reduce the fund’s exposure to credit. Amid rising rates and a strengthening economy, returns for holdings of U.S. Treasuries and investment grade corporate bonds were more mixed.
Outlook
Looking forward, we expect the U. S. economy to continue growing at a healthy rate, bolstered in the near term by the new tax-cuts. We have yet to see any meaningful excesses in the economy that might signal a recession.
That said, after more than nine years of economic expansions, we see some
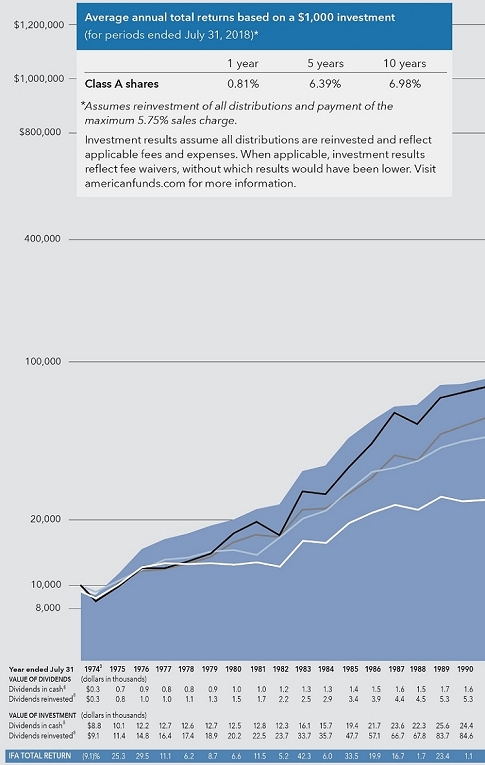
A track record of high current income
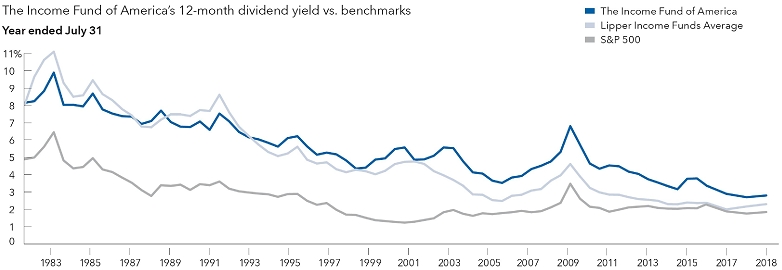
All numbers calculated by Lipper.
| The Income Fund of America | 3 |
About your fund
Fund results shown are for Class A shares at net asset value. If a sales charge (maximum 5.75%) had been deducted, the results would have been lower. Results are for past periods and are not predictive of results for future periods. Current and future results may be lower or higher than those shown. Share prices and returns will vary, so investors may lose money. For current information and month-end results, visit americanfunds.com.
| Resilience during stock market declines | | The Income Fund of America (IFA) vs. the S&P 500 during market declines* |
| | | |
| Dates of decline | | S&P 500
cumulative total return | | IFA cumulative
total return | | IFA advantage
(percentage points) |
| September 21, 1976, through March 6, 1978 | | | –13.5 | % | | | 1.9 | % | | | 15.4 | % |
| November 28, 1980, through August 12, 1982 | | | –20.2 | | | | 19.0 | | | | 39.2 | |
| August 25 through December 4, 1987 | | | –32.8 | | | | –13.6 | | | | 19.2 | |
| July 16 through October 11, 1990 | | | –19.2 | | | | –10.2 | | | | 9.0 | |
| July 17 through August 31, 1998 | | | –19.2 | | | | –9.5 | | | | 9.7 | |
| March 24, 2000, through October 9, 2002 | | | –47.4 | | | | 0.7 | | | | 48.1 | |
| October 9, 2007, through March 9, 2009 | | | –55.3 | | | | –43.5 | | | | 11.8 | |
| April 29 through October 3, 2011 | | | –18.6 | | | | –11.6 | | | | 7.0 | |
| * | Periods shown reflect S&P 500 price declines of 15% or more (without dividends reinvested) based on 100% recovery between declines (except for a 78% recovery between 3/6/78 and 11/28/80 and a 77% recovery between 3/9/09 and 4/29/11). The index is unmanaged and, therefore, has no expenses. Investors cannot invest directly in an index. |
Withdrawing income: the dividend advantage
Most fund investors reinvest their dividends, but some use dividends to meet current expenses. As shown below, the fund’s income has allowed withdrawals to be made without invading principal.
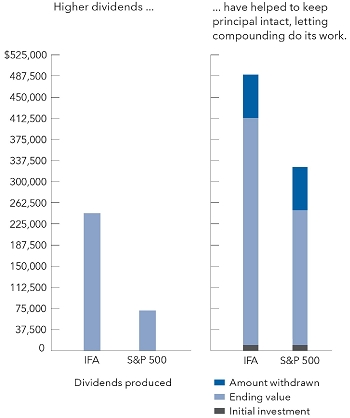
Charts show hypothetical $10,000 investments in the fund at net asset value) and in the S&P 500 from January 1, 1974, to July 31, 2018. Example assumes an annual withdrawal equaling $500 the first year on December 31, 1974, and then increasing by 5% each year thereafter. Over the period, total withdrawals from each of the fund and the index come to $75,572.
Historical benefits of income
This chart shows one-year snapshots of the annual income produced by three hypothetical $10,000 investments made on July 31, 1974, in each of The Income Fund of America, the S&P 500 and three-month U.S. Treasury bills. Over the past 44 years, income from the fund has been substantially higher.
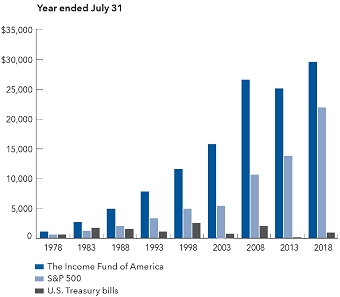
All results are calculated at net asset value with dividends and capital gains (where applicable) reinvested. Source for Treasury bills is the Federal Reserve. Income from three-month Treasury bills assumes reinvestment of both principal and interest at prevailing rates at the time of purchase. Securities backed by the U.S. Treasury or the full faith and credit of the U.S. government are guaranteed only as to the timely payment of interest and principal when held to maturity; the fund is not guaranteed.
For both charts, source for The Income Fund of America & the S&P 500: Thomson InvestmentView.
| 4 | The Income Fund of America |
reasons for caution. Valuations in many areas of the U.S. stock market are elevated, growth has slowed in some overseas markets and the Federal Reserve remains on a course of tightening monetary policy. Global trade disputes and geopolitical tensions have led to spikes in market volatility. Amid these challenges, we have adopted a more conservative approach to the market, raising the fund’s cash holdings to help provide ballast during volatile periods and to leave ourselves with the flexibility to invest selectively in periods when volatility rises.
Indeed, despite the challenges posed by this investment environment, we are continuing to find opportunities to invest in select companies that we believe have the potential to reward long-term investors. We thank you for your commitment to The Income Fund of America and look forward to reporting to you again in six months.
Cordially,

Hilda L. Applbaum
President

Andrew B. Suzman
President
September 10, 2018
For current information about the fund, visit americanfunds.com.
The New Geography of Investing®
Where a company does business can be more important than where it’s located. Here’s a look at The Income Fund of America’s portfolio through the revenue lens. The charts below show the countries and regions in which the fund’s equity investments are located and where the revenue comes from.
The Income Fund of America vs. the S&P 500 with income reinvested
Equity portion breakdown by domicile (%)
| | Region | | Fund | | | Index | |
| g | United States | | 70 | % | | 100 | % |
| g | Canada | | 2 | | | — | |
| g | Europe | | 21 | | | — | |
| g | Japan | | — | | | — | |
| g | Asia-Pacific ex. Japan | | 3 | | | — | |
| g | Emerging markets | | 4 | | | — | |
| | Total | | 100 | % | | 100 | % |
Equity portion breakdown by revenue (%)
| | Region | | Fund | | | Index | |
| g | United States | | 51 | % | | 62 | % |
| g | Canada | | 2 | | | 2 | |
| g | Europe | | 15 | | | 12 | |
| g | Japan | | 3 | | | 3 | |
| g | Asia-Pacific ex. Japan | | 4 | | | 1 | |
| g | Emerging markets | | 25 | | | 20 | |
| | Total | | 100 | % | | 100 | % |
Source: Capital Group (as of July 31, 2018).
| The Income Fund of America | 5 |
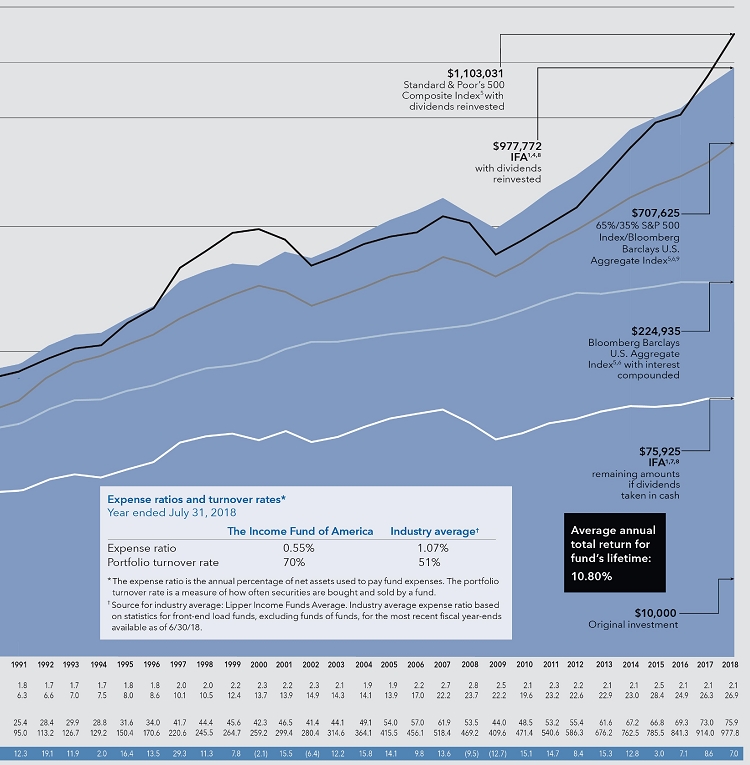
The value of a long-term perspective
Fund results shown are for Class A shares and reflect deduction of the maximum sales charge of 5.75% on the $10,000 investment.¹ Thus, the net amount invested was $9,425.2 Results are for past periods and are not predictive of results for future periods. Current and future results may be lower or higher than those shown. Share prices and returns will vary, so investors may lose money. For current information and month-end results, visit americanfunds.com.
The results shown are before taxes on fund distributions and sale of fund shares.
| 1 | As outlined in the prospectus, the sales charge is reduced for accounts (and aggregated investments) of $25,000 or more and is eliminated for purchases of $1 million or more. There is no sales charge on dividends or capital gain distributions that are reinvested in additional shares. |
| 2 | The maximum initial sales charge was 8.5% prior to July 1, 1988. |
| 3 | For the period December 1, 1973 (when Capital Research and Management Company became the fund’s investment adviser), through July 31, 1974. |
| 4 | Includes reinvested dividends of $507,982 and reinvested capital gain distributions of $165,139. |
| 5 | The indexes are unmanaged and include reinvested distributions, but do not reflect the effect of sales charges, commissions or expenses. Investors cannot invest directly in an index. |
| 6 | From December 1, 1973, through December 31, 1975, the Bloomberg Barclays U.S. Government/Credit Index was used because the Bloomberg Barclays U.S. Aggregate Index did not exist. |
| 7 | Includes capital gain distributions of $26,826 but does not reflect income dividends of $78,839 taken in cash. |
| 8 | From April 1990 to September 1994 and from September 2003 to March 2009, the fund accrued dividends daily but paid quarterly. Dividends reflect quarterly dividends actually paid during the period, while year-end values are adjusted for cumulative dividends accrued but not yet paid. |
| 9 | The 65%/35% S&P 500 Index/Bloomberg Barclays U.S. Aggregate Index blends the S&P 500 Index with the Bloomberg Barclays U.S. Aggregate Index by weighting their total returns at 65% and 35%, respectively. Results assume the blend is rebalanced monthly. |
| 6 | The Income Fund of America |
How a $10,000 investment has grown
There have always been reasons not to invest. If you look beyond the negative headlines, however, you will find that despite occasional stumbles, financial markets have tended to reward investors over the long term. Investment management — bolstered by experience and careful research — can add even more value. As the chart below shows, over its lifetime, The Income Fund of America (IFA) has fared well against both the broader stock and bond markets. Dividends, particularly when reinvested, have accounted for a large portion of the fund’s overall results.
| The Income Fund of America | 7 |
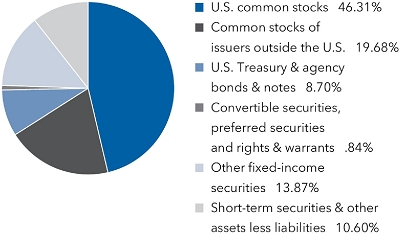
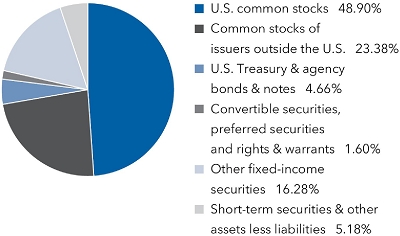
The portfolio at a glance
July 31, 2018
| Investment mix by security type | Percent of net assets |
Five largest sectors in common stock holdings
| | Percent of net assets |
| Financials | | | 8.66 | % |
| Energy | | | 6.87 | |
| Information technology | | | 6.85 | |
| Health care | | | 6.61 | |
| Industrials | | | 6.40 | |
Ten largest common stock holdings
| | | Percent of net assets |
| Microsoft | | | 2.67 | % |
| Merck | | | 2.07 | |
| Intel | | | 1.82 | |
| DowDuPont | | | 1.60 | |
| Verizon Communications | | | 1.49 | |
| Chevron | | | 1.48 | |
| CME Group | | | 1.47 | |
| Royal Dutch Shell | | | 1.45 | |
| JPMorgan Chase | | | 1.42 | |
| Coca-Cola | | | 1.42 | |
Country diversification by domicile
| | | Percent of net assets |
| United States | | | 66.51 | % |
| United Kingdom | | | 9.28 | |
| Eurozone* | | | 5.33 | |
| Canada | | | 1.73 | |
| Taiwan | | | 1.17 | |
| Other countries | | | 5.38 | |
| Short-term securities & other assets less liabilities | | | 10.60 | |
| * | Countries using the euro as a common currency; those represented in the fund’s portfolio are Belgium, Finland, France, Germany, Ireland, Italy, Luxembourg, the Netherlands, Portugal and Spain. |
July 31, 2017
| Investment mix by security type | Percent of net assets |
Five largest sectors in common stock holdings
| | | Percent of net assets |
| Industrials | | | 10.97 | % |
| Information technology | | | 8.55 | |
| Financials | | | 8.17 | |
| Consumer staples | | | 7.80 | |
| Energy | | | 6.42 | |
Ten largest common stock holdings
| | | Percent of net assets |
| Microsoft | | | 3.32 | % |
| Lockheed Martin | | | 1.99 | |
| McDonald’s | | | 1.88 | |
| Intel | | | 1.87 | |
| Merck | | | 1.84 | |
| General Electric | | | 1.61 | |
| JPMorgan Chase | | | 1.60 | |
| Wells Fargo | | | 1.52 | |
| Enbridge | | | 1.46 | |
| Coca-Cola | | | 1.42 | |
Country diversification by domicile
| | | Percent of net assets |
| United States | | | 68.05 | % |
| United Kingdom | | | 9.39 | |
| Eurozone† | | | 7.42 | |
| Canada | | | 2.54 | |
| Taiwan | | | 1.37 | |
| Hong Kong | | | 1.29 | |
| Australia | | | 1.09 | |
| Other countries | | | 3.67 | |
| Short-term securities & other assets less liabilities | | | 5.18 | |
| † | Countries using the euro as a common currency; those represented in the fund’s portfolio are Belgium, Finland, France, Germany, Ireland, Italy, Luxembourg, the Netherlands, Portugal, and Spain. |
| 8 | The Income Fund of America |
Summary investment portfolio July 31, 2018
| Common stocks 65.99% | | Shares | | | Value
(000) | |
| Financials 8.66% | | | | | | | | |
| CME Group Inc., Class A | | | 10,140,400 | | | $ | 1,613,541 | |
| JPMorgan Chase & Co. | | | 13,574,539 | | | | 1,560,393 | |
| Wells Fargo & Co. | | | 27,158,053 | | | | 1,555,885 | |
| HSBC Holdings PLC (GBP denominated) | | | 78,123,069 | | | | 749,058 | |
| Blackstone Group LP | | | 13,170,000 | | | | 459,896 | |
| Other securities | | | | | | | 3,573,883 | |
| | | | | | | | 9,512,656 | |
| | | | | | | | | |
| Energy 6.87% | | | | | | | | |
| Chevron Corp. | | | 12,904,500 | | | | 1,629,451 | |
| Royal Dutch Shell PLC, Class B (ADR) | | | 11,771,000 | | | | 836,212 | |
| Royal Dutch Shell PLC, Class B | | | 21,474,147 | | | | 752,986 | |
| Royal Dutch Shell PLC, Class A (GBP denominated) | | | 28,526 | | | | 979 | |
| Royal Dutch Shell PLC, Class A (ADR) | | | 1,215 | | | | 83 | |
| Occidental Petroleum Corp. | | | 13,738,000 | | | | 1,153,030 | |
| Enbridge Inc. | | | 23,589,090 | | | | 835,762 | |
| Enbridge Inc. (CAD denominated) | | | 1,599,629 | | | | 56,811 | |
| BP PLC | | | 104,119,900 | | | | 783,486 | |
| ConocoPhillips | | | 7,150,000 | | | | 516,015 | |
| Other securities | | | | | | | 978,833 | |
| | | | | | | | 7,543,648 | |
| | | | | | | | | |
| Information technology 6.85% | | | | | | | | |
| Microsoft Corp. | | | 27,664,154 | | | | 2,934,613 | |
| Intel Corp. | | | 41,503,100 | | | | 1,996,299 | |
| Taiwan Semiconductor Manufacturing Co., Ltd. | | | 132,903,000 | | | | 1,067,947 | |
| Taiwan Semiconductor Manufacturing Co., Ltd. (ADR) | | | 1,996,470 | | | | 82,275 | |
| Other securities | | | | | | | 1,446,976 | |
| | | | | | | | 7,528,110 | |
| | | | | | | | | |
| Health care 6.61% | | | | | | | | |
| Merck & Co., Inc. | | | 34,490,159 | | | | 2,271,867 | |
| AstraZeneca PLC | | | 18,921,277 | | | | 1,456,580 | |
| Pfizer Inc. | | | 31,724,300 | | | | 1,266,751 | |
| GlaxoSmithKline PLC | | | 52,391,000 | | | | 1,087,600 | |
| Other securities | | | | | | | 1,182,422 | |
| | | | | | | | 7,265,220 | |
| | | | | | | | | |
| Industrials 6.40% | | | | | | | | |
| Lockheed Martin Corp. | | | 4,405,400 | | | | 1,436,601 | |
| BAE Systems PLC | | | 140,126,776 | | | | 1,201,388 | |
| Emerson Electric Co. | | | 8,800,000 | | | | 636,064 | |
| Boeing Co. | | | 1,755,479 | | | | 625,477 | |
| Caterpillar Inc. | | | 3,784,800 | | | | 544,254 | |
| Edenred SA1 | | | 12,231,900 | | | | 481,595 | |
| Other securities | | | | | | | 2,100,191 | |
| | | | | | | | 7,025,570 | |
| | | | | | | | | |
| Materials 5.56% | | | | | | | | |
| DowDuPont Inc. | | | 25,585,269 | | | | 1,759,499 | |
| WestRock Co.1 | | | 14,266,832 | | | | 827,191 | |
| LyondellBasell Industries NV | | | 7,135,000 | | | | 790,487 | |
| BASF SE | | | 5,150,000 | | | | 494,780 | |
| Other securities | | | | | | | 2,239,146 | |
| | | | | | | | 6,111,103 | |
| | | | | | | | | |
| Consumer staples 5.52% | | | | | | | | |
| Coca-Cola Co. | | | 33,420,000 | | | | 1,558,374 | |
| Philip Morris International Inc. | | | 9,588,700 | | | | 827,505 | |
| Procter & Gamble Co. | | | 8,200,000 | | | | 663,216 | |
| Kellogg Co. | | | 8,059,000 | | | | 572,431 | |
| Altria Group, Inc. | | | 9,689,097 | | | | 568,556 | |
| Other securities | | | | | | | 1,869,564 | |
| | | | | | | | 6,059,646 | |
| The Income Fund of America | 9 |
| Common stocks (continued) | | Shares | | | Value
(000) | |
| Consumer discretionary 5.35% | | | | | | | | |
| McDonald’s Corp. | | | 7,631,600 | | | $ | 1,202,282 | |
| General Motors Co. | | | 25,455,641 | | | | 965,023 | |
| Las Vegas Sands Corp. | | | 12,382,495 | | | | 890,301 | |
| Target Corp. | | | 9,450,000 | | | | 762,426 | |
| Other securities | | | | | | | 2,053,596 | |
| | | | | | | | 5,873,628 | |
| | | | | | | | | |
| Real estate 4.96% | | | | | | | | |
| Crown Castle International Corp. REIT | | | 10,237,000 | | | | 1,134,567 | |
| Digital Realty Trust, Inc. REIT | | | 7,975,000 | | | | 968,324 | |
| Public Storage REIT | | | 3,929,500 | | | | 855,963 | |
| Iron Mountain Inc. REIT1 | | | 15,215,400 | | | | 534,213 | |
| Simon Property Group, Inc. REIT | | | 2,957,000 | | | | 521,053 | |
| Other securities | | | | | | | 1,430,725 | |
| | | | | | | | 5,444,845 | |
| | | | | | | | | |
| Telecommunication services 2.27% | | | | | | | | |
| Verizon Communications Inc. | | | 31,694,390 | | | | 1,636,698 | |
| Other securities | | | | | | | 861,301 | |
| | | | | | | | 2,497,999 | |
| | | | | | | | | |
| Utilities 2.18% | | | | | | | | |
| DTE Energy Co. | | | 7,055,000 | | | | 765,750 | |
| Other securities | | | | | | | 1,632,093 | |
| | | | | | | | 2,397,843 | |
| | | | | | | | | |
| Miscellaneous 4.76% | | | | | | | | |
| Other common stocks in initial period of acquisition | | | | | | | 5,224,166 | |
| | | | | | | | | |
| Total common stocks (cost: $53,044,631,000) | | | | | | | 72,484,434 | |
| | | | | | | | | |
| Preferred securities 0.22% | | | | | | | | |
| Financials 0.22% | | | | | | | | |
| Wells Fargo & Co., Class A, Series Q, 5.85% depositary shares preferred noncumulative | | | 1,263,198 | | | | 32,831 | |
| Other securities | | | | | | | 208,973 | |
| | | | | | | | 241,804 | |
| | | | | | | | | |
| Total preferred securities (cost: $226,473,000) | | | | | | | 241,804 | |
| | | | | | | | | |
| Rights & warrants 0.00% | | | | | | | | |
| Industrials 0.00% | | | | | | | | |
| Other securities | | | | | | | — | 2 |
| | | | | | | | | |
| Miscellaneous 0.00% | | | | | | | | |
| Other rights & warrants in initial period of acquisition | | | | | | | 1,690 | |
| | | | | | | | | |
| Total rights & warrants (cost: $263,000) | | | | | | | 1,690 | |
| | | | | | | | | |
| Convertible stocks 0.23% | | | | | | | | |
| Real estate 0.04% | | | | | | | | |
| Crown Castle International Corp. REIT, Series A, 6.875% convertible preferred 2020 | | | 44,500 | | | | 47,482 | |
| | | | | | | | | |
| Other 0.19% | | | | | | | | |
| Other securities | | | | | | | 202,824 | |
| | | | | | | | | |
| Total convertible stocks (cost: $238,456,000) | | | | | | | 250,306 | |
| | | | | | | | | |
| Convertible bonds 0.39% | | Principal amount
(000) | | | | | |
| Other 0.19% | | | | | | | | |
| Other securities | | | | | | | 207,131 | |
| 10 | The Income Fund of America |
| | | Principal amount
(000) | | | Value
(000) | |
| Miscellaneous 0.20% | | | | | | | | |
| Other convertible bonds in initial period of acquisition | | | | | | $ | 223,126 | |
| | | | | | | | | |
| Total convertible bonds (cost: $414,806,000) | | | | | | | 430,257 | |
| | | | | | | | | |
| Bonds, notes & other debt instruments 22.57% | | | | | | | | |
| Corporate bonds & notes 11.23% | | | | | | | | |
| Financials 2.07% | | | | | | | | |
| CME Group Inc. 3.75%–4.15% 2028–2048 | | $ | 15,175 | | | | 15,464 | |
| General Motors Financial Co. 3.45%–4.15% 2022–2026 | | | 46,120 | | | | 45,475 | |
| JPMorgan Chase & Co. 2.25%–6.75% 2020–20493 | | | 242,656 | | | | 244,736 | |
| Wells Fargo & Co. 2.10%–6.11% 2020–20493 | | | 180,465 | | | | 179,672 | |
| Other securities | | | | | | | 1,791,806 | |
| | | | | | | | 2,277,153 | |
| | | | | | | | | |
| Energy 1.72% | | | | | | | | |
| Chevron Corp. 1.56%–2.50% 2019–2022 | | | 10,045 | | | | 9,919 | |
| Royal Dutch Shell PLC 1.75%–3.75% 2021–2046 | | | 20,580 | | | | 19,732 | |
| Other securities | | | | | | | 1,854,702 | |
| | | | | | | | 1,884,353 | |
| | | | | | | | | |
| Health care 1.64% | | | | | | | | |
| AstraZeneca PLC 2.375% 2022 | | | 5,250 | | | | 5,053 | |
| GlaxoSmithKline PLC 3.38%–3.63% 2023–2025 | | | 25,165 | | | | 25,173 | |
| Other securities | | | | | | | 1,767,661 | |
| | | | | | | | 1,797,887 | |
| | | | | | | | | |
| Consumer discretionary 1.36% | | | | | | | | |
| General Motors Co. 4.35%–6.75% 2025–2046 | | | 32,555 | | | | 35,072 | |
| General Motors Financial Co. 2.35%–3.70% 2019–2024 | | | 73,745 | | | | 72,538 | |
| McDonald’s Corp. 2.63%–4.88% 2022–2047 | | | 13,370 | | | | 13,352 | |
| Other securities | | | | | | | 1,376,571 | |
| | | | | | | | 1,497,533 | |
| | | | | | | | | |
| Materials 0.76% | | | | | | | | |
| Dow Chemical Co. 4.13%–5.25% 2021–2044 | | | 11,150 | | | | 11,482 | |
| Other securities | | | | | | | 820,237 | |
| | | | | | | | 831,719 | |
| | | | | | | | | |
| Telecommunication services 0.75% | | | | | | | | |
| Verizon Communications Inc. 4.13%–4.86% 2033–2048 | | | 142,620 | | | | 134,385 | |
| Other securities | | | | | | | 694,846 | |
| | | | | | | | 829,231 | |
| | | | | | | | | |
| Industrials 0.72% | | | | | | | | |
| Lockheed Martin Corp. 1.85%–4.70% 2018–2046 | | | 11,600 | | | | 11,948 | |
| Other securities | | | | | | | 773,555 | |
| | | | | | | | 785,503 | |
| | | | | | | | | |
| Information technology 0.52% | | | | | | | | |
| Microsoft Corp. 1.55%–4.25% 2021–2047 | | | 27,490 | | | | 27,528 | |
| Other securities | | | | | | | 543,483 | |
| | | | | | | | 571,011 | |
| | | | | | | | | |
| Other corporate bonds & notes 1.69% | | | | | | | | |
| Other securities | | | | | | | 1,860,951 | |
| | | | | | | | | |
| Total corporate bonds & notes | | | | | | | 12,335,341 | |
| | | | | | | | | |
| U.S. Treasury bonds & notes 8.09% | | | | | | | | |
| U.S. Treasury 7.64% | | | | | | | | |
| U.S. Treasury 2.375% 2020 | | | 522,300 | | | | 520,253 | |
| U.S. Treasury 2.625% 2020 | | | 1,950,000 | | | | 1,948,323 | |
| U.S. Treasury 2.625% 2021 | | | 1,012,750 | | | | 1,008,719 | |
| U.S. Treasury 1.25%–6.25% 2019–20484 | | | 4,975,955 | | | | 4,920,222 | |
| | | | | | | | 8,397,517 | |
| The Income Fund of America | 11 |
| Bonds, notes & other debt instruments (continued) | | Principal amount
(000) | | | Value
(000) | |
| U.S. Treasury bonds & notes (continued) | | | | | | | | |
| U.S. Treasury inflation-protected securities 0.45% | | | | | | | | |
| U.S. Treasury Inflation-Protected Securities 0.38%–1.38% 2024–20485 | | $ | 523,045 | | | $ | 491,377 | |
| | | | | | | | | |
| Total U.S. Treasury bonds & notes | | | | | | | 8,888,894 | |
| | | | | | | | | |
| Mortgage-backed obligations 2.33% | | | | | | | | |
| Fannie Mae 2.30%–9.57% 2021–20486,7,8 | | | 1,602,506 | | | | 1,615,116 | |
| Other securities | | | | | | | 940,008 | |
| | | | | | | | 2,555,124 | |
| | | | | | | | | |
| Federal agency bonds & notes 0.61% | | | | | | | | |
| Fannie Mae 2.75%–6.25% 2021–2029 | | | 122,000 | | | | 130,419 | |
| Federal Home Loan Bank 1.50%–2.38% 2019–2020 | | | 270,000 | | | | 267,990 | |
| Other securities | | | | | | | 273,278 | |
| | | | | | | | 671,687 | |
| | | | | | | | | |
| Municipals 0.07% | | | | | | | | |
| Other 0.07% | | | | | | | | |
| Other securities | | | | | | | 76,406 | |
| | | | | | | | 76,406 | |
| | | | | | | | | |
| Other bonds & notes 0.22% | | | | | | | | |
| Other securities | | | | | | | 236,205 | |
| | | | | | | | | |
| Miscellaneous 0.02% | | | | | | | | |
| Other bonds & notes in initial period of acquisition | | | | | | | 25,416 | |
| | | | | | | | | |
| Total bonds, notes & other debt instruments (cost: $24,892,327,000) | | | | | | | 24,789,073 | |
| | | | | | | | | |
| Short-term securities 10.98% | | | | | | | | |
| Chevron Corp. 1.99% due 8/2/20189 | | | 50,000 | | | | 49,995 | |
| Fannie Mae 1.85% due 8/6/2018 | | | 100,000 | | | | 99,974 | |
| Federal Home Loan Bank 1.83%–2.00% due 8/1/2018–11/5/2018 | | | 3,099,100 | | | | 3,091,810 | |
| Intel Corp. 1.91% due 8/14/20189 | | | 25,000 | | | | 24,981 | |
| Pfizer Inc. 1.88%–1.97% due 8/1/2018–8/20/20189 | | | 157,000 | | | | 156,908 | |
| U.S. Treasury Bills 1.25%–2.34% due 8/2/2018–7/18/2019 | | | 7,695,650 | | | | 7,583,663 | |
| Other securities | | | | | | | 1,056,193 | |
| | | | | | | | | |
| Total short-term securities (cost: $12,066,917,000) | | | | | | | 12,063,524 | |
| Total investment securities 100.38% (cost: $90,883,873,000) | | | | | | | 110,261,088 | |
| Other assets less liabilities (0.38)% | | | | | | | (414,240 | ) |
| | | | | | | | | |
| Net assets 100.00% | | | | | | $ | 109,846,848 | |
| 12 | The Income Fund of America |
This summary investment portfolio is designed to streamline the report and help investors better focus on the fund’s principal holdings. See the inside back cover for details on how to obtain a complete schedule of portfolio holdings.
As permitted by U.S. Securities and Exchange Commission regulations, “Miscellaneous” securities include holdings in their first year of acquisition that have not previously been publicly disclosed.
“Other securities” includes all issues that are not disclosed separately in the summary investment portfolio.
Forward currency contracts
| Contract amount | | | | | | Unrealized
depreciation | |
Purchases
(000) | | Sales
(000) | | Counterparty | | Settlement date | | at 7/31/2018
(000) | |
| USD63,769 | | AUD87,000 | | Goldman Sachs | | 8/23/2018 | | | $(877 | ) |
| The Income Fund of America | 13 |
Investments in affiliates
A company is an affiliate of the fund under the Investment Company Act of 1940 if the fund’s holdings in that company represent 5% or more of the outstanding voting shares. The value of the fund’s affiliated-company holdings is either shown in the summary investment portfolio or included in the value of “Other securities” under the respective industry sectors. Further details on such holdings and related transactions during the year ended July 31, 2018, appear below.
| | | Beginning
shares or
principal
amount | | | Additions | | | Reductions | | | Ending
shares or
principal
amount | | | Net
realized
gain (loss)
(000) | | | Net
unrealized
appreciation
(depreciation)
(000) | | | Dividend
or interest
income
(000) | | | Value of
affiliates at
7/31/2018
(000) | |
| | | | | | | | | | | | | | | | | | | | | | | | | |
| Common stocks 2.94% | | | | | | | | | | | | | | | | | | | | | | | | | | | | | | | | |
| Financials 0.00% | | | | | | | | | | | | | | | | | | | | | | | | | | | | | | | | |
| Umpqua Holdings Corp.10 | | | 11,487,800 | | | | — | | | | 1,862,800 | | | | 9,625,000 | | | $ | 5,276 | | | $ | 27,389 | | | $ | 7,986 | | | $ | — | |
| | | | | | | | | | | | | | | | | | | | | | | | | | | | | | | | | |
| Energy 0.04% | | | | | | | | | | | | | | | | | | | | | | | | | | | | | | | | |
| Ascent Resources - Utica, LLC, Class A11,12,13,14 | | | 110,214,618 | | | | — | | | | — | | | | 110,214,618 | | | | — | | | | 10,581 | | | | — | | | | 35,269 | |
| White Star Petroleum Corp., Class A11,12,13,14 | | | 6,511,401 | | | | — | | | | — | | | | 6,511,401 | | | | — | | | | (1,107 | ) | | | — | | | | 4,428 | |
| | | | | | | | | | | | | | | | | | | | | | | | | | | | | | | | 39,697 | |
| | | | | | | | | | | | | | | | | | | | | | | | | | | | | | | | | |
| Information technology 0.00% | | | | | | | | | | | | | | | | | | | | | | | | | | | |
| Corporate Risk Holdings I, Inc.11,12,13 | | | 2,205,215 | | | | 2,205,215 | | | | 2,205,215 | | | | 2,205,215 | | | | 60,787 | | | | (9,835 | ) | | | — | | | | 1,544 | |
| Corporate Risk Holdings Corp.11,12,13,14 | | | 11,149 | | | | — | | | | — | | | | 11,149 | | | | — | | | | — | | | | — | | | | — | 2 |
| | | | | | | | | | | | | | | | | | | | | | | | | | | | | | | | 1,544 | |
| | | | | | | | | | | | | | | | | | | | | | | | | | | | | | | | | |
| Health care 0.00% | | | | | | | | | | | | | | | | | | | | | | | | | | | | | | | | |
| Rotech Healthcare Inc.11,12,13,14 | | | 543,172 | | | | — | | | | — | | | | 543,172 | | | | — | | | | (739 | ) | | | — | | | | 1,086 | |
| | | | | | | | | | | | | | | | | | | | | | | | | | | | | | | | | |
| Industrials 0.90% | | | | | | | | | | | | | | | | | | | | | | | | | | | | | | | | |
| Edenred SA | | | 12,231,900 | | | | — | | | | — | | | | 12,231,900 | | | | — | | | | 160,469 | | | | 12,419 | | | | 481,595 | |
| Hubbell Inc. | | | 3,430,000 | | | | — | | | | — | | | | 3,430,000 | | | | — | | | | 15,298 | | | | 10,324 | | | | 422,747 | |
| Douglas Dynamics, Inc. | | | 1,444,000 | | | | — | | | | 144,000 | | | | 1,300,000 | | | | 3,653 | | | | 20,068 | | | | 1,348 | | | | 63,830 | |
| R.R. Donnelley & Sons Co. | | | 4,019,407 | | | | 300,000 | | | | — | | | | 4,319,407 | | | | — | | | | (27,253 | ) | | | 2,419 | | | | 25,484 | |
| CEVA Group PLC10,11,13,14 | | | 35,229 | | | | — | | | | 35,229 | | | | — | | | | — | | | | 22,851 | | | | — | | | | — | |
| CEVA Logistics AG9,10,11,13 | | | — | | | | 846,991 | | | | — | | | | 846,991 | | | | — | | | | (50,481 | ) | | | — | | | | — | |
| | | | | | | | | | | | | | | | | | | | | | | | | | | | | | | | 993,656 | |
| | | | | | | | | | | | | | | | | | | | | | | | | | | | | | | | | |
| Materials 1.10% | | | | | | | | | | | | | | | | | | | | | | | | | | | | | | | | |
| WestRock Co. | | | 13,184,832 | | | | 1,082,000 | | | | — | | | | 14,266,832 | | | | — | | | | (516 | ) | | | 23,033 | | | | 827,191 | |
| Boral Ltd. | | | 72,364,400 | | | | 3,837,175 | | | | — | | | | 76,201,575 | | | | — | | | | (48,273 | ) | | | 14,055 | | | | 376,483 | |
| | | | | | | | | | | | | | | | | | | | | | | | | | | | | | | | 1,203,674 | |
| | | | | | | | | | | | | | | | | | | | | | | | | | | | | | | | | |
| Consumer discretionary 0.33% | | | | | | | | | | | | | | | | | | | | | | | | | | | |
| Nokian Renkaat Oyj | | | 7,975,161 | | | | 1,222,463 | | | | 750,000 | | | | 8,447,624 | | | | 3,577 | | | | 22,169 | | | | 13,925 | | | | 366,384 | |
| ProSiebenSat.1 Media SE10 | | | 12,985,000 | | | | — | | | | 10,869,490 | | | | 2,115,510 | | | | (146,780 | ) | | | (1,488 | ) | | | 19,477 | | | | — | |
| | | | | | | | | | | | | | | | | | | | | | | | | | | | | | | | 366,384 | |
| | | | | | | | | | | | | | | | | | | | | | | | | | | | | | | | | |
| Real estate 0.57% | | | | | | | | | | | | | | | | | | | | | | | | | | | | | | | | |
| Iron Mountain Inc. REIT | | | 14,195,180 | | | | 2,540,220 | | | | 1,520,000 | | | | 15,215,400 | | | | 10,160 | | | | (18,777 | ) | | | 31,681 | | | | 534,213 | |
| Redwood Trust, Inc. REIT | | | 5,444,717 | | | | — | | | | — | | | | 5,444,717 | | | | — | | | | (2,505 | ) | | | 6,207 | | | | 91,526 | |
| OUTFRONT Media Inc. REIT10 | | | 9,064,824 | | | | — | | | | 6,498,054 | | | | 2,566,770 | | | | (84,334 | ) | | | 60,556 | | | | 12,175 | | | | — | |
| | | | | | | | | | | | | | | | | | | | | | | | | | | | | | | | 625,739 | |
| | | | | | | | | | | | | | | | | | | | | | | | | | | | | | | | | |
| Telecommunication services 0.00% | | | | | | | | | | | | | | | | | | | | | | | | | | | |
| TalkTalk Telecom Group PLC10 | | | 58,421,891 | | | | — | | | | 12,922,418 | | | | 45,499,473 | | | | (9,286 | ) | | | (35,480 | ) | | | 2,847 | | | | — | |
| NII Holdings, Inc.10,13 | | | 5,194,089 | | | | — | | | | 5,194,089 | | | | — | | | | (79,569 | ) | | | 81,440 | | | | — | | | | — | |
| | | | | | | | | | | | | | | | | | | | | | | | | | | | | | | | — | |
| Total common stocks | | | | | | | | | | | | | | | | | | | | | | | | | | 3,231,780 | |
| 14 | The Income Fund of America |
| | | Beginning
shares or
principal
amount | | | Additions | | | Reductions | | | Ending
shares or
principal
amount | | | Net
realized
gain (loss)
(000) | | | Net
unrealized
appreciation
(depreciation)
(000) | | | Dividend
or interest
income
(000) | | | Value of
affiliates at
7/31/2018
(000) | |
| | | | | | | | | | | | | | | | | | | | | | | | | |
| Convertible stocks 0.00% | | | | | | | | | | | | | | | | | | | | | | | | | | | | | | | | |
| Industrials 0.00% | | | | | | | | | | | | | | | | | | | | | | | | | | | | | | | | |
| CEVA Group PLC, Series A-1, (3-month USD-LIBOR + 3.00%) 5.353% convertible preferred7,10,11,13,14 | | | 29,937 | | | | — | | | | 29,937 | | | | — | | | $ | — | | | $ | 17,065 | | | $ | — | | | $ | — | |
| CEVA Group PLC, Series A-2, (3-month USD-LIBOR + 2.00%) 4.353% convertible preferred7,10,11,13,14 | | | 13,633 | | | | — | | | | 13,633 | | | | — | | | | (4,529 | ) | | | 8,673 | | | | — | | | | — | |
| | | | | | | | | | | | | | | | | | | | | | | | | | | | | | | | — | |
| | | | | | | | | | | | | | | | | | | | | | | | | | | | | | | | | |
| Bonds, notes & other debt instruments 0.10% | | | | | | | | | | | | | | | | | | | | | | | | | |
| Energy 0.00% | | | | | | | | | | | | | | | | | | | | | | | | | | | | | | | | |
| Ascent Resources - Utica, LLC 10.00% 20229 | | $ | 1,900,000 | | | | — | | | $ | 1,090,000 | | | $ | 810,000 | | | | 76 | | | | 55 | | | | 105 | | | | 899 | |
| | | | | | | | | | | | | | | | | | | | | | | | | | | | | | | | | |
| Health care 0.04% | | | | | | | | | | | | | | | | | | | | | | | | | | | | | | | | |
| Rotech Healthcare Inc., Term Loan B, (3-month USD-LIBOR + 3.75%) 6.087% 20236,7,11,12,15 | | | — | | | $ | 14,650,000 | | | $ | 91,562 | | | $ | 14,558,438 | | | | — | | | | — | | | | 163 | | | | 14,558 | |
| Rotech Healthcare Inc., Term Loan, (3-month USD-LIBOR + 11.00%) 13.337% 20236,7,11,12,15,16 | | | — | | | $ | 29,096,192 | | | | — | | | $ | 29,096,192 | | | | — | | | | (2,013 | ) | | | 954 | | | | 26,561 | |
| Rotech Healthcare Inc., Term Loan A, (3-month USD-LIBOR + 4.25%) 5.943% 20186,7,11,15 | | $ | 11,646,250 | | | | — | | | $ | 11,646,250 | | | | — | | | | — | | | | 58 | | | | 465 | | | | — | |
| Rotech Healthcare Inc., Term Loan B, (3-month USD-LIBOR + 8.75%) 10.443% 20196,7,11,15 | | $ | 9,200,000 | | | | — | | | $ | 9,200,000 | | | | — | | | | — | | | | 46 | | | | 664 | | | | — | |
| Rotech Healthcare Inc., Term Loan, (3-month USD-LIBOR + 11.00%) 13.00% 2020 (84.62% PIK)6,7,11,15,16 | | $ | 25,856,141 | | | $ | 2,291,975 | | | $ | 28,148,116 | | | | — | | | | — | | | | (56 | ) | | | 2,559 | | | | — | |
| | | | | | | | | | | | | | | | | | | | | | | | | | | | | | | | 41,119 | |
| | | | | | | | | | | | | | | | | | | | | | | | | | | | | | | | | |
| Consumer discretionary 0.00% | | | | | | | | | | | | | | | | | | | | | | | | | | | | | |
| CBS Outdoor Americas Inc. 5.25% 202210 | | $ | 26,000,000 | | | | — | | | $ | 1,000,000 | | | $ | 25,000,000 | | | | 39 | | | | (750 | ) | | | 1,339 | | | | — | |
| | | | | | | | | | | | | | | | | | | | | | | | | | | | | | | | | |
| Industrials 0.04% | | | | | | | | | | | | | | | | | | | | | | | | | | | | | | | | |
| Corporate Risk Holdings LLC 9.50% 20199,10 | | $ | 45,000,000 | | | | — | | | $ | 45,000,000 | | | | — | | | | 2,138 | | | | (3,038 | ) | | | 4,048 | | | | — | |
Corporate Risk Holdings LLC 13.50% 2020
(100% PIK)9,10,11,16 | | $ | 16,194,418 | | | $ | 1,801,589 | | | $ | 17,996,007 | | | | — | | | | 495 | | | | (973 | ) | | | 1,833 | | | | — | |
| R.R. Donnelley & Sons Co. 7.625% 2020 | | $ | 957,000 | | | $ | 5,750,000 | | | | — | | | $ | 6,707,000 | | | | — | | | | (90 | ) | | | 124 | | | | 6,908 | |
| R.R. Donnelley & Sons Co. 7.875% 2021 | | $ | 23,445,000 | | | $ | 3,500,000 | | | $ | 5,500,000 | | | $ | 21,445,000 | | | | (18 | ) | | | (1,144 | ) | | | 1,343 | | | | 21,981 | |
| R.R. Donnelley & Sons Co. 6.50% 2023 | | $ | 17,780,000 | | | | — | | | $ | 3,000,000 | | | $ | 14,780,000 | | | | (34 | ) | | | (130 | ) | | | 1,153 | | | | 14,817 | |
| CEVA Group PLC 7.00% 20219,10 | | $ | 2,250,000 | | | | — | | | $ | 2,250,000 | | | | — | | | | 39 | | | | 84 | | | | 128 | | | | — | |
| CEVA Group PLC 9.00% 20219,10 | | $ | 1,050,000 | | | | — | | | $ | 1,050,000 | | | | — | | | | 24 | | | | 134 | | | | 77 | | | | — | |
| CEVA Group PLC, Apollo Global Securities LLC LOC, (3-month USD-LIBOR + 5.50%) 4.292% 20216,7,10,15 | | $ | 2,526,478 | | | | — | | | $ | 505,296 | | | $ | 2,021,182 | | | | 3 | | | | 142 | | | | 152 | | | | — | |
| CEVA Group PLC, Term Loan B, (3-month USD-LIBOR + 5.50%) 7.577% 20216,7,10,15 | | $ | 3,555,443 | | | | — | | | $ | 36,748 | | | $ | 3,518,695 | | | | — | 2 | | | 204 | | | | 269 | | | | — | |
| CEVA Logistics Canada, ULC, Term Loan, (3-month USD-LIBOR + 5.50%) 7.577% 20216,7,10,15 | | $ | 444,430 | | | | — | | | $ | 4,593 | | | $ | 439,837 | | | | — | 2 | | | 25 | | | | 34 | | | | — | |
| CEVA Logistics Holdings BV, Term Loan, (3-month USD-LIBOR + 5.50%) 7.577% 20216,7,10,15 | | $ | 2,577,696 | | | | — | | | $ | 1,717,086 | | | $ | 860,610 | | | | 8 | | | | 138 | | | | 171 | | | | — | |
| | | | | | | | | | | | | | | | | | | | | | | | | | | | | | | | 43,706 | |
| The Income Fund of America | 15 |
Investments in affiliates (continued)
| | | Beginning
shares or
principal
amount | | | Additions | | | Reductions | | | Ending
shares or
principal
amount | | | Net
realized
gain (loss)
(000) | | | Net
unrealized
appreciation
(depreciation)
(000) | | | Dividend
or interest
income
(000) | | | Value of
affiliates at
7/31/2018
(000) | |
| | | | | | | | | | | | | | | | | | | | | | | | | |
| Real estate 0.02% | | | | | | | | | | | | | | | | | | | | | | | | | | | | | | | | |
| Iron Mountain Inc. 6.00% 2023 | | $ | 950,000 | | | | — | | | $ | 950,000 | | | | — | | | $ | 37 | | | $ | (59 | ) | | $ | 32 | | | $ | — | |
| Iron Mountain Inc. 5.75% 2024 | | $ | 4,325,000 | | | $ | 1,000,000 | | | | — | | | $ | 5,325,000 | | | | — | | | | (185 | ) | | | 268 | | | | 5,292 | |
| Iron Mountain Inc. 4.875% 20279 | | | — | | | $ | 15,905,000 | | | | — | | | $ | 15,905,000 | | | | — | | | | (871 | ) | | | 510 | | | | 14,653 | |
| Iron Mountain Inc. 5.25% 20289 | | | — | | | $ | 7,490,000 | | | $ | 5,000,000 | | | $ | 2,490,000 | | | | (109 | ) | | | (79 | ) | | | 84 | | | | 2,316 | |
| Iron Mountain Inc. 6.00% 20209 | | $ | 30,925,000 | | | | — | | | $ | 30,925,000 | | | | — | | | | 976 | | | | (1,160 | ) | | | 240 | | | | — | |
| | | | | | | | | | | | | | | | | | | | | | | | | | | | | | | | 22,261 | |
| Total bonds, notes & other debt instruments | | | | | | | | | | | | | | | | | | | | | | | | | | | | | | | 107,985 | |
| Total 3.04% | | | | | | | | | | | | | | | | | | $ | (237,371 | ) | | $ | 240,443 | | | $ | 174,611 | | | $ | 3,339,765 | |
The following footnotes apply to either the individual securities noted or one or more of the securities aggregated and listed as a single line item.
| 1 | Represents an affiliated company as defined under the Investment Company Act of 1940. |
| 2 | Amount less than one thousand. |
| 3 | Step bond; coupon rate may change at a later date. |
| 4 | All or a portion of this security was pledged as collateral. The total value of pledged collateral was $689,000, which represented less than .01% of the net assets of the fund. |
| 5 | Index-linked bond whose principal amount moves with a government price index. |
| 6 | Principal payments may be made periodically. Therefore, the effective maturity date may be earlier than the stated maturity date. |
| 7 | Coupon rate may change periodically. |
| 8 | Purchased on a TBA basis. |
| 9 | Acquired in a transaction exempt from registration under Rule 144A or Section 4(2) of the Securities Act of 1933. May be resold in the U.S. in transactions exempt from registration, normally to qualified institutional buyers. The total value of all such securities, including those in “Other securities,” was $5,187,162,000, which represented 4.72% of the net assets of the fund. |
| 10 | Unaffiliated issuer at 7/31/2018. |
| 11 | Valued under fair value procedures adopted by authority of the board of trustees. The total value of all such securities, including those in “Miscellaneous” and “Other securities,” was $151,669,000, which represented .14% of the net assets of the fund. |
| 12 | Value determined using significant unobservable inputs. |
| 13 | Security did not produce income during the last 12 months. |
| 14 | Acquired through a private placement transaction exempt from registration under the Securities Act of 1933. May be subject to legal or contractual restrictions on resale. Further details on these holdings appear below. |
| 15 | Loan participations and assignments; may be subject to legal or contractual restrictions on resale. The total value of all such loans was $375,635,000, which represented .34% of the net assets of the fund. |
| 16 | Payment in kind; the issuer has the option of paying additional securities in lieu of cash. Most recent payment was 100% cash unless otherwise noted. |
| Private placement securities | | Acquisition
date(s) | | | Cost
(000) | | | | Value
(000) | | | Percent
of net
assets | |
| Ascent Resources - Utica, LLC, Class A | | 4/25/2016-11/15/2016 | | $ | 56,848 | | | $ | 35,269 | | | | .03 | % |
| White Star Petroleum Corp., Class A | | 6/30/2016 | | | 4,354 | | | | 4,428 | | | | .00 | |
| Rotech Healthcare Inc. | | 11/26/2014 | | | 19,660 | | | | 1,086 | | | | .00 | |
| Corporate Risk Holdings Corp. | | 9/1/2015 | | | — | | | | — | | | | .00 | |
| Other private placement securities | | 3/6/2017-7/20/2018 | | | 117,234 | | | | 117,833 | | | | .11 | |
| Total private placement securities | | | | $ | 198,096 | | | $ | 158,616 | | | | .14 | % |
Key to abbreviations and symbol
ADR = American Depositary Receipts
AUD = Australian dollars
CAD = Canadian dollars
GBP = British pounds
LIBOR = London Interbank Offered Rate
LOC = Letter of Credit
TBA = To-be-announced
USD/$ = U.S. dollars
See Notes to Financial Statements
| 16 | The Income Fund of America |
Financial statements
Statement of assets and liabilities
at July 31, 2018 | (dollars in thousands) |
| Assets: | | | | | | |
| Investment securities, at value: | | | | | | | | |
| Unaffiliated issuers (cost: $88,383,155) | | $ | 106,921,323 | | | | | |
| Affiliated issuers (cost: $2,500,718) | | | 3,339,765 | | | $ | 110,261,088 | |
| Cash | | | | | | | 60,526 | |
| Cash denominated in currencies other than U.S. dollars (cost: $29,017) | | | | | | | 28,956 | |
| Receivables for: | | | | | | | | |
| Sales of investments | | | 1,376,628 | | | | | |
| Sales of fund’s shares | | | 63,688 | | | | | |
| Dividends and interest | | | 305,010 | | | | 1,745,326 | |
| | | | | | | | 112,095,896 | |
| Liabilities: | | | | | | | | |
| Unrealized depreciation on open forward currency contracts | | | | | | | 877 | |
| Payables for: | | | | | | | | |
| Purchases of investments | | | 2,114,303 | | | | | |
| Repurchases of fund’s shares | | | 76,309 | | | | | |
| Investment advisory services | | | 18,483 | | | | | |
| Services provided by related parties | | | 27,163 | | | | | |
| Trustees’ deferred compensation | | | 4,359 | | | | | |
| Other | | | 7,554 | | | | 2,248,171 | |
| Net assets at July 31, 2018 | | | | | | $ | 109,846,848 | |
| | | | | | | | | |
| Net assets consist of: | | | | | | | | |
| Capital paid in on shares of beneficial interest | | | | | | $ | 84,629,280 | |
| Undistributed net investment income | | | | | | | 1,236,103 | |
| Undistributed net realized gain | | | | | | | 4,605,466 | |
| Net unrealized appreciation | | | | | | | 19,375,999 | |
| Net assets at July 31, 2018 | | | | | | $ | 109,846,848 | |
(dollars and shares in thousands, except per-share amounts)
Shares of beneficial interest issued and outstanding (no stated par value) —
unlimited shares authorized (4,721,925 total shares outstanding)
| | | Net assets | | | Shares
outstanding | | | Net asset value
per share | |
| Class A | | $ | 75,283,875 | | | | 3,233,293 | | | $ | 23.28 | |
| Class C | | | 4,916,719 | | | | 213,961 | | | | 22.98 | |
| Class T | | | 10 | | | | — | * | | | 23.29 | |
| Class F-1 | | | 4,243,010 | | | | 182,702 | | | | 23.22 | |
| Class F-2 | | | 8,674,775 | | | | 372,831 | | | | 23.27 | |
| Class F-3 | | | 2,746,519 | | | | 117,994 | | | | 23.28 | |
| Class 529-A | | | 1,733,264 | | | | 74,604 | | | | 23.23 | |
| Class 529-C | | | 321,803 | | | | 13,899 | | | | 23.15 | |
| Class 529-E | | | 68,561 | | | | 2,960 | | | | 23.16 | |
| Class 529-T | | | 11 | | | | 1 | | | | 23.29 | |
| Class 529-F-1 | | | 81,100 | | | | 3,491 | | | | 23.23 | |
| Class R-1 | | | 116,117 | | | | 5,021 | | | | 23.13 | |
| Class R-2 | | | 488,271 | | | | 21,221 | | | | 23.01 | |
| Class R-2E | | | 28,032 | | | | 1,207 | | | | 23.22 | |
| Class R-3 | | | 1,057,395 | | | | 45,602 | | | | 23.19 | |
| Class R-4 | | | 1,154,303 | | | | 49,669 | | | | 23.24 | |
| Class R-5E | | | 6,357 | | | | 273 | | | | 23.26 | |
| Class R-5 | | | 448,514 | | | | 19,262 | | | | 23.28 | |
| Class R-6 | | | 8,478,212 | | | | 363,934 | | | | 23.30 | |
| * | Amount less than one thousand. |
See Notes to Financial Statements
| The Income Fund of America | 17 |
Statement of operations
for the year ended July 31, 2018 | (dollars in thousands) |
| Investment income: | | | | | | | | |
| Income: | | | | | | | | |
| Dividends (net of non-U.S. taxes of $71,829; also includes $157,895 from affiliates) | | $ | 2,886,833 | | | | | |
| Interest (includes $16,716 from affiliates) | | | 1,164,163 | | | $ | 4,050,996 | |
| Fees and expenses*: | | | | | | | | |
| Investment advisory services | | | 236,241 | | | | | |
| Distribution services | | | 272,456 | | | | | |
| Transfer agent services | | | 73,098 | | | | | |
| Administrative services | | | 24,202 | | | | | |
| Reports to shareholders | | | 2,628 | | | | | |
| Registration statement and prospectus | | | 1,584 | | | | | |
| Trustees’ compensation | | | 844 | | | | | |
| Auditing and legal | | | 318 | | | | | |
| Custodian | | | 3,710 | | | | | |
| Other | | | 1,688 | | | | 616,769 | |
| Net investment income | | | | | | | 3,434,227 | |
| | | | | | | | | |
| Net realized gain and unrealized depreciation: | | | | | | | | |
| Net realized gain (loss) on: | | | | | | | | |
| Investments: | | | | | | | | |
| Unaffiliated issuers | | | 5,604,579 | | | | | |
| Affiliated issuers | | | (237,371 | ) | | | | |
| Forward currency contracts | | | (37,627 | ) | | | | |
| Currency transactions | | | (6,848 | ) | | | 5,322,733 | |
| Net unrealized (depreciation) appreciation on: | | | | | | | | |
| Investments: | | | | | | | | |
| Unaffiliated issuers | | | (1,660,943 | ) | | | | |
| Affiliated issuers | | | 240,443 | | | | | |
| Forward currency contracts | | | 14,201 | | | | | |
| Currency translations | | | (2,019 | ) | | | (1,408,318 | ) |
| Net realized gain and unrealized depreciation | | | | | | | 3,914,415 | |
| | | | | | | | | |
| Net increase in net assets resulting from operations | | | | | | $ | 7,348,642 | |
| * | Additional information related to class-specific fees and expenses is included in the Notes to Financial Statements. |
See Notes to Financial Statements
| 18 | The Income Fund of America |
| Statements of changes in net assets | |
| | (dollars in thousands) |
| | | Year ended July 31 | |
| | | 2018 | | | 2017 | |
| Operations: | | | | | | | | |
| Net investment income | | $ | 3,434,227 | | | $ | 3,445,839 | |
| Net realized gain | | | 5,322,733 | | | | 2,091,644 | |
| Net unrealized (depreciation) appreciation | | | (1,408,318 | ) | | | 3,060,795 | |
| Net increase in net assets resulting from operations | | | 7,348,642 | | | | 8,598,278 | |
| | | | | | | | | |
| Dividends and distributions paid to shareholders: | | | | | | | | |
| Dividends from net investment income | | | (3,078,521 | ) | | | (3,100,383 | ) |
| Distributions from net realized gain on investments | | | (2,332,222 | ) | | | — | |
| Total dividends and distributions paid to shareholders | | | (5,410,743 | ) | | | (3,100,383 | ) |
| | | | | | | | | |
| Net capital share transactions | | | 406,082 | | | | 394,949 | |
| | | | | | | | | |
| Total increase in net assets | | | 2,343,981 | | | | 5,892,844 | |
| | | | | | | | | |
| Net assets: | | | | | | | | |
| Beginning of year | | | 107,502,867 | | | | 101,610,023 | |
| End of year (including undistributed net investment income: $1,236,103 and $883,019, respectively) | | $ | 109,846,848 | | | $ | 107,502,867 | |
See Notes to Financial Statements
| The Income Fund of America | 19 |
Notes to financial statements
1. Organization
The Income Fund of America (the “fund”) is registered under the Investment Company Act of 1940 as an open-end, diversified management investment company. The fund seeks current income while secondarily striving for capital growth.
The fund has 19 share classes consisting of six retail share classes (Classes A, C, T, F-1, F-2 and F-3), five 529 college savings plan share classes (Classes 529-A, 529-C, 529-E, 529-T and 529-F-1) and eight retirement plan share classes (Classes R-1, R-2, R-2E, R-3, R-4, R-5E, R-5 and R-6). The 529 college savings plan share classes can be used to save for college education. The retirement plan share classes are generally offered only through eligible employer-sponsored retirement plans. The fund’s share classes are described further in the following table:
| Share class | | Initial sales charge | | Contingent deferred sales
charge upon redemption | | Conversion feature | |
| Classes A and 529-A | | Up to 5.75% | | None (except 1% for certain redemptions within 18 months of purchase without an initial sales charge) | | None | |
| Class C | | None | | 1% for redemptions within one year of purchase | | Class C converts to Class F-1 after 10 years | |
| Class 529-C | | None | | 1% for redemptions within one year of purchase | | Class 529-C converts to Class 529-A after 10 years* | |
| Class 529-E | | None | | None | | None | |
| Classes T and 529-T† | | Up to 2.50% | | None | | None | |
| Classes F-1, F-2, F-3 and 529-F-1 | | None | | None | | None | |
| Classes R-1, R-2, R-2E, R-3, R-4, R-5E, R-5 and R-6 | | None | | None | | None | |
| * | Effective December 1, 2017. |
| † | Class T and 529-T shares are not available for purchase. |
Holders of all share classes have equal pro rata rights to the assets, dividends and liquidation proceeds of the fund. Each share class has identical voting rights, except for the exclusive right to vote on matters affecting only its class. Share classes have different fees and expenses (“class-specific fees and expenses”), primarily due to different arrangements for distribution, transfer agent and administrative services. Differences in class-specific fees and expenses will result in differences in net investment income and, therefore, the payment of different per-share dividends by each share class.
2. Significant accounting policies
The fund is an investment company that applies the accounting and reporting guidance issued in Topic 946 by the U.S. Financial Accounting Standards Board. The fund’s financial statements have been prepared to comply with U.S. generally accepted accounting principles (“U.S. GAAP”). These principles require the fund’s investment adviser to make estimates and assumptions that affect reported amounts and disclosures. Actual results could differ from those estimates. Subsequent events, if any, have been evaluated through the date of issuance in the preparation of the financial statements. The fund follows the significant accounting policies described in this section, as well as the valuation policies described in the next section on valuation.
Cash — Cash may include amounts held in an interest bearing deposit facility.
Security transactions and related investment income — Security transactions are recorded by the fund as of the date the trades are executed with brokers. Realized gains and losses from security transactions are determined based on the specific identified cost of the securities. In the event a security is purchased with a delayed payment date, the fund will segregate liquid assets sufficient to meet its payment obligations. Dividend income is recognized on the ex-dividend date and interest income is recognized on an accrual basis. Market discounts, premiums and original issue discounts on fixed-income securities are amortized daily over the expected life of the security.
Class allocations — Income, fees and expenses (other than class-specific fees and expenses) and realized and unrealized gains and losses are allocated daily among the various share classes based on their relative net assets. Class-specific fees and expenses, such as distribution, transfer agent and administrative services, are charged directly to the respective share class.
Dividends and distributions to shareholders — Dividends and distributions to shareholders are recorded on the ex-dividend date.
| 20 | The Income Fund of America |
Currency translation — Assets and liabilities, including investment securities, denominated in currencies other than U.S. dollars are translated into U.S. dollars at the exchange rates supplied by one or more pricing vendors on the valuation date. Purchases and sales of investment securities and income and expenses are translated into U.S. dollars at the exchange rates on the dates of such transactions. The effects of changes in exchange rates on investment securities are included with the net realized gain or loss and net unrealized appreciation or depreciation on investments in the fund’s statement of operations. The realized gain or loss and unrealized appreciation or depreciation resulting from all other transactions denominated in currencies other than U.S. dollars are disclosed separately.
3. Valuation
Capital Research and Management Company (“CRMC”), the fund’s investment adviser, values the fund’s investments at fair value as defined by U.S. GAAP. The net asset value of each share class of the fund is generally determined as of approximately 4:00 p.m. New York time each day the New York Stock Exchange is open.
Methods and inputs — The fund’s investment adviser uses the following methods and inputs to establish the fair value of the fund’s assets and liabilities. Use of particular methods and inputs may vary over time based on availability and relevance as market and economic conditions evolve.
Equity securities are generally valued at the official closing price of, or the last reported sale price on, the exchange or market on which such securities are traded, as of the close of business on the day the securities are being valued or, lacking any sales, at the last available bid price. Prices for each security are taken from the principal exchange or market on which the security trades.
Fixed-income securities, including short-term securities, are generally valued at prices obtained from one or more pricing vendors. Vendors value such securities based on one or more of the inputs described in the following table. The table provides examples of inputs that are commonly relevant for valuing particular classes of fixed-income securities in which the fund is authorized to invest. However, these classifications are not exclusive, and any of the inputs may be used to value any other class of fixed-income security.
| Fixed-income class | | Examples of standard inputs |
| All | | Benchmark yields, transactions, bids, offers, quotations from dealers and trading systems, new issues, spreads and other relationships observed in the markets among comparable securities; and proprietary pricing models such as yield measures calculated using factors such as cash flows, financial or collateral performance and other reference data (collectively referred to as “standard inputs”) |
| Corporate bonds & notes; convertible securities | | Standard inputs and underlying equity of the issuer |
| Bonds & notes of governments & government agencies | | Standard inputs and interest rate volatilities |
| Mortgage-backed; asset-backed obligations | | Standard inputs and cash flows, prepayment information, default rates, delinquency and loss assumptions, collateral characteristics, credit enhancements and specific deal information |
| Municipal securities | | Standard inputs and, for certain distressed securities, cash flows or liquidation values using a net present value calculation based on inputs that include, but are not limited to, financial statements and debt contracts |
When the fund’s investment adviser deems it appropriate to do so (such as when vendor prices are unavailable or deemed to be not representative), fixed-income securities will be valued in good faith at the mean quoted bid and ask prices that are reasonably and timely available (or bid prices, if ask prices are not available) or at prices for securities of comparable maturity, quality and type.
Securities with both fixed-income and equity characteristics, or equity securities traded principally among fixed-income dealers, are generally valued in the manner described for either equity or fixed-income securities, depending on which method is deemed most appropriate by the fund’s investment adviser. Forward currency contracts are valued at the mean of representative quoted bid and ask prices, generally based on prices supplied by one or more pricing vendors.
Securities and other assets for which representative market quotations are not readily available or are considered unreliable by the fund’s investment adviser are fair valued as determined in good faith under fair valuation guidelines adopted by authority of the fund’s board of trustees as further described. The investment adviser follows fair valuation guidelines, consistent with U.S. Securities and Exchange Commission rules and guidance, to consider relevant principles and factors when making fair value determinations. The investment adviser considers relevant indications of value that are reasonably and timely available to it in determining the fair value to be assigned to a particular security, such as the type and cost of the security; contractual or legal restrictions on resale of the security; relevant financial or
| The Income Fund of America | 21 |
business developments of the issuer; actively traded similar or related securities; conversion or exchange rights on the security; related corporate actions; significant events occurring after the close of trading in the security; and changes in overall market conditions. In addition, the closing prices of equity securities that trade in markets outside U.S. time zones may be adjusted to reflect significant events that occur after the close of local trading but before the net asset value of each share class of the fund is determined. Fair valuations and valuations of investments that are not actively trading involve judgment and may differ materially from valuations that would have been used had greater market activity occurred.
Processes and structure — The fund’s board of trustees has delegated authority to the fund’s investment adviser to make fair value determinations, subject to board oversight. The investment adviser has established a Joint Fair Valuation Committee (the “Fair Valuation Committee”) to administer, implement and oversee the fair valuation process, and to make fair value decisions. The Fair Valuation Committee regularly reviews its own fair value decisions, as well as decisions made under its standing instructions to the investment adviser’s valuation teams. The Fair Valuation Committee reviews changes in fair value measurements from period to period and may, as deemed appropriate, update the fair valuation guidelines to better reflect the results of back testing and address new or evolving issues. The Fair Valuation Committee reports any changes to the fair valuation guidelines to the board of trustees. The fund’s board and audit committee also regularly review reports that describe fair value determinations and methods.
The fund’s investment adviser has also established a Fixed-Income Pricing Review Group to administer and oversee the fixed-income valuation process, including the use of fixed-income pricing vendors. This group regularly reviews pricing vendor information and market data. Pricing decisions, processes and controls over security valuation are also subject to additional internal reviews, including an annual control self-evaluation program facilitated by the investment adviser’s compliance group.
Classifications — The fund’s investment adviser classifies the fund’s assets and liabilities into three levels based on the inputs used to value the assets or liabilities. Level 1 values are based on quoted prices in active markets for identical securities. Level 2 values are based on significant observable market inputs, such as quoted prices for similar securities and quoted prices in inactive markets. Certain securities trading outside the U.S. may transfer between Level 1 and Level 2 due to valuation adjustments resulting from significant market movements following the close of local trading. Level 3 values are based on significant unobservable inputs that reflect the investment adviser’s determination of assumptions that market participants might reasonably use in valuing the securities. The valuation levels are not necessarily an indication of the risk or liquidity associated with the underlying investment. For example, U.S. government securities are reflected as Level 2 because the inputs used to determine fair value may not always be quoted prices in an active market. The following tables present the fund’s valuation levels as of July 31, 2018 (dollars in thousands):
| | | Investment securities | |
| | | Level 1* | | | Level 2 | | | Level 3 | | | Total | |
| Assets: | | | | | | | | | | | | | | | | |
| Common stocks: | | | | | | | | | | | | | | | | |
| Financials | | $ | 9,512,656 | | | $ | — | | | $ | — | | | $ | 9,512,656 | |
| Energy | | | 7,503,951 | | | | — | | | | 39,697 | | | | 7,543,648 | |
| Information technology | | | 7,526,566 | | | | — | | | | 1,544 | | | | 7,528,110 | |
| Health care | | | 7,264,134 | | | | — | | | | 1,086 | | | | 7,265,220 | |
| Industrials | | | 7,008,342 | | | | 17,228 | | | | — | | | | 7,025,570 | |
| Materials | | | 6,111,103 | | | | — | | | | — | | | | 6,111,103 | |
| Consumer staples | | | 6,059,646 | | | | — | | | | — | | | | 6,059,646 | |
| Consumer discretionary | | | 5,866,784 | | | | 6,839 | | | | 5 | | | | 5,873,628 | |
| Real estate | | | 5,444,845 | | | | — | | | | — | | | | 5,444,845 | |
| Telecommunication services | | | 2,497,999 | | | | — | | | | — | | | | 2,497,999 | |
| Utilities | | | 2,397,843 | | | | — | | | | — | | | | 2,397,843 | |
| Miscellaneous | | | 5,211,571 | | | | 12,595 | | | | — | | | | 5,224,166 | |
| Preferred securities | | | 241,804 | | | | — | | | | — | | | | 241,804 | |
| Rights & warrants | | | — | | | | — | | | | 1,690 | | | | 1,690 | |
| Convertible stocks | | | 222,182 | | | | — | | | | 28,124 | | | | 250,306 | |
| Convertible bonds | | | — | | | | 430,257 | | | | — | | | | 430,257 | |
| Bonds, notes & other debt instruments: | | | | | | | | | | | | | | | | |
| Corporate bonds & notes | | | — | | | | 12,294,222 | | | | 41,119 | | | | 12,335,341 | |
| U.S. Treasury bonds & notes | | | — | | | | 8,888,894 | | | | — | | | | 8,888,894 | |
| Mortgage-backed obligations | | | — | | | | 2,555,124 | | | | — | | | | 2,555,124 | |
| Federal agency bonds & notes | | | — | | | | 671,687 | | | | — | | | | 671,687 | |
| Municipals | | | — | | | | 76,406 | | | | — | | | | 76,406 | |
| Other bonds & notes | | | — | | | | 236,205 | | | | — | | | | 236,205 | |
| Miscellaneous | | | — | | | | 25,416 | | | | — | | | | 25,416 | |
| Short-term securities | | | — | | | | 12,063,524 | | | | — | | | | 12,063,524 | |
| Total | | $ | 72,869,426 | | | $ | 37,278,397 | | | $ | 113,265 | | | $ | 110,261,088 | |
| 22 | The Income Fund of America |
| | | Other investments† | |
| | | Level 1 | | | Level 2 | | | Level 3 | | | Total | |
| Liabilities: | | | | | | | | | | | | | | | | |
| Unrealized depreciation on open forward currency contracts | | $ | — | | | $ | (877 | ) | | $ | — | | | $ | (877 | ) |
| * | Securities with a value of $15,897,901,000, which represented 14.47% of the net assets of the fund, transferred from Level 2 to Level 1 since the prior fiscal year-end, primarily due to a lack of significant market movements following the close of local trading. |
| † | Forward currency contracts are not included in the investment portfolio. |
4. Risk factors
Investing in the fund may involve certain risks including, but not limited to, those described below.
Market conditions — The prices of, and the income generated by, the common stocks and other securities held by the fund may decline — sometimes rapidly or unpredictably — due to various factors, including events or conditions affecting the general economy or particular industries; overall market changes; local, regional or global political, social or economic instability; governmental or governmental agency responses to economic conditions; and currency exchange rate, interest rate and commodity price fluctuations.
Issuer risks — The prices of, and the income generated by, securities held by the fund may decline in response to various factors directly related to the issuers of such securities, including reduced demand for an issuer’s goods or services, poor management performance and strategic initiatives such as mergers, acquisitions or dispositions and the market response to any such initiatives.
Investing in income-oriented stocks — Income provided by the fund may be reduced by changes in the dividend policies of, and the capital resources available for dividend payments at, the companies in which the fund invests.
Investing in debt instruments — The prices of, and the income generated by, bonds and other debt securities held by the fund may be affected by changing interest rates and by changes in the effective maturities and credit ratings of these securities.
Rising interest rates will generally cause the prices of bonds and other debt securities to fall. Falling interest rates may cause an issuer to redeem, call or refinance a debt security before its stated maturity, which may result in the fund having to reinvest the proceeds in lower yielding securities. Longer maturity debt securities generally have greater sensitivity to changes in interest rates and may be subject to greater price fluctuations than shorter maturity debt securities.
Bonds and other debt securities are also subject to credit risk, which is the possibility that the credit strength of an issuer will weaken and/or an issuer of a debt security will fail to make timely payments of principal or interest and the security will go into default. Lower quality debt securities generally have higher rates of interest and may be subject to greater price fluctuations than higher quality debt securities. Credit risk is gauged, in part, by the credit ratings of the debt securities in which the fund invests. However, ratings are only the opinions of the rating agencies issuing them and are not guarantees as to credit quality or an evaluation of market risk. The fund’s investment adviser relies on its own credit analysts to research issuers and issues in seeking to mitigate various credit and default risks.
Investing in lower rated debt instruments — Lower rated bonds and other lower rated debt securities generally have higher rates of interest and involve greater risk of default or price declines due to changes in the issuer’s creditworthiness than those of higher quality debt securities. The market prices of these securities may fluctuate more than the prices of higher quality debt securities and may decline significantly in periods of general economic difficulty. These risks may be increased with respect to investments in junk bonds.
Investing outside the U.S. — Securities of issuers domiciled outside the U.S., or with significant operations or revenues outside the U.S., may lose value because of adverse political, social, economic or market developments (including social instability, regional conflicts, terrorism and war) in the countries or regions in which the issuers operate or generate revenue. These securities may also lose value due to changes in foreign currency exchange rates against the U.S. dollar and/or currencies of other countries. Issuers of these securities may be more susceptible to actions of foreign governments, such as the imposition of price controls or punitive taxes, that could adversely impact the value of these securities. Securities markets in certain countries may be more volatile and/or less liquid than those in the U.S. Investments outside the U.S. may also be subject to different accounting practices and different regulatory, legal and reporting standards and practices, and may be more difficult to value, than those in the U.S. In addition, the value of investments outside the U.S. may be reduced by foreign taxes, including foreign withholding taxes on interest and dividends. Further, there may be increased risks of delayed settlement of securities purchased or sold by the fund. The risks of investing outside the U.S. may be heightened in connection with investments in emerging markets.
| The Income Fund of America | 23 |
Management — The investment adviser to the fund actively manages the fund’s investments. Consequently, the fund is subject to the risk that the methods and analyses employed by the investment adviser in this process may not produce the desired results. This could cause the fund to lose value or its investment results to lag relevant benchmarks or other funds with similar objectives.
5. Certain investment techniques
Index-linked bonds — The fund has invested in index-linked bonds, which are fixed-income securities whose principal value is periodically adjusted to a government price index. Over the life of an index-linked bond, interest is paid on the adjusted principal value. Increases or decreases in the principal value of index-linked bonds are recorded as interest income in the fund’s statement of operations.
Mortgage dollar rolls — The fund has entered into mortgage dollar roll transactions in which the fund sells a mortgage-backed security to a counterparty and simultaneously enters into an agreement with the same counterparty to buy back a similar security on a specific future date at a predetermined price. Mortgage dollar rolls are accounted for as purchase and sale transactions. Portfolio turnover rates excluding and including mortgage dollar rolls are presented at the end of the fund’s financial highlights table.
Loan transactions — The fund has entered into loan transactions in which the fund acquires a loan either through an agent, by assignment from another holder, or as a participation interest in another holder’s portion of a loan. The loan is often administered by a financial institution that acts as agent for the holders of the loan, and the fund may be required to receive approval from the agent and/or borrower prior to the sale of the investment. The loan’s interest rate and maturity date may change based on the terms of the loan, including potential early payments of principal.
Forward currency contracts — The fund has entered into forward currency contracts, which represent agreements to exchange currencies on specific future dates at predetermined rates. The fund’s investment adviser uses forward currency contracts to manage the fund’s exposure to changes in exchange rates. Upon entering into these contracts, risks may arise from the potential inability of counterparties to meet the terms of their contracts and from possible movements in exchange rates.
On a daily basis, the fund’s investment adviser values forward currency contracts and records unrealized appreciation or depreciation for open forward currency contracts in the fund’s statement of assets and liabilities. Realized gains or losses are recorded at the time the forward currency contract is closed or offset by another contract with the same broker for the same settlement date and currency.
Closed forward currency contracts that have not reached their settlement date are included in the respective receivables or payables for closed forward currency contracts in the fund’s statement of assets and liabilities. Net realized gains or losses from closed forward currency contracts and net unrealized appreciation or depreciation from open forward currency contracts are recorded in the fund’s statement of operations. The average month-end notional amount of open forward currency contracts while held was $289,745,000.
The following tables present the financial statement impacts resulting from the fund’s use of forward currency contracts as of, or for the year ended, July 31, 2018 (dollars in thousands):
| | | | | Assets | | | Liabilities | |
| Contracts | | Risk type | | Location on statement of
assets and liabilities | | Value | | | Location on statement of
assets and liabilities | | Value | |
| Forward currency | | Currency | | Unrealized appreciation on open forward currency contracts | | $ | — | | | Unrealized depreciation on open forward currency contracts | | $ | 877 | |
| | | | | Net realized loss | | | Net unrealized appreciation | |
| Contracts | | Risk type | | Location on statement of
operations | | Value | | | Location on statement of
operations | | Value | |
| Forward currency | | Currency | | Net realized loss on forward currency contracts | | $ | (37,627 | ) | | Net unrealized appreciation on forward currency contracts | | $ | 14,201 | |
Collateral — The fund participates in a collateral program that calls for the fund to either receive or pledge highly liquid assets, such as cash or U.S. government securities, as collateral due to its use of forward currency contracts and future delivery contracts. For forward currency contracts, the program calls for the fund to either receive or pledge collateral based on the net gain or loss on unsettled forward currency contracts by counterparty. For future delivery contracts, the program calls for the fund to either receive or pledge collateral based on the net gain or loss on unsettled contracts by certain counterparties. The purpose of the collateral is to cover potential losses that could occur in the event that either party cannot meet its contractual obligation. Non-cash collateral pledged by the fund, if any, is
| 24 | The Income Fund of America |
disclosed in the fund’s investment portfolio, and cash collateral pledged by the fund, if any, is held in a segregated account with the fund’s custodian, which is reflected as pledged cash in the fund’s statement of assets and liabilities.
Rights of offset — The fund has entered into enforceable master netting agreements with certain counterparties for forward currency contracts, where on any date amounts payable by each party to the other (in the same currency with respect to the same transaction) may be closed or offset by each party’s payment obligation. If an early termination date occurs under these agreements following an event of default or termination event, all obligations of each party to its counterparty are settled net through a single payment in a single currency (“close-out netting”). For financial reporting purposes, the fund does not offset financial assets and financial liabilities that are subject to these master netting arrangements in the statement of assets and liabilities.
The following table presents the fund’s forward currency contracts by counterparty that are subject to master netting agreements but that are not offset in the fund’s statement of assets and liabilities. The net amount column shows the impact of offsetting on the fund’s statement of assets and liabilities as of July 31, 2018, if close-out netting was exercised (dollars in thousands):
| | | | | | Gross amounts not offset in the | | | | |
| | | Gross amounts | | | statement of assets and liabilities and | | | | |
| | | recognized in the | | | subject to a master netting agreement | | | | |
| | | statement of assets | | | Available | | | Non-cash | | | Cash | | | Net | |
| Counterparty | | and liabilities | | | to offset | | | collateral* | | | collateral | | | amount | |
| Liabilities: | | | | | | | | | | | | | | | | | | | | |
| Goldman Sachs | | $ | 877 | | | $ | — | | | $ | (519 | ) | | $ | — | | | $ | 358 | |
| * | Non-cash collateral is shown on a settlement basis. |
6. Taxation and distributions
Federal income taxation — The fund complies with the requirements under Subchapter M of the Internal Revenue Code applicable to mutual funds and intends to distribute substantially all of its net taxable income and net capital gains each year. The fund is not subject to income taxes to the extent such distributions are made. Therefore, no federal income tax provision is required.
As of and during the period ended July 31, 2018, the fund did not have a liability for any unrecognized tax benefits. The fund recognizes interest and penalties, if any, related to unrecognized tax benefits as income tax expense in the statement of operations. During the period, the fund did not incur any significant interest or penalties.
The fund’s tax returns are not subject to examination by federal, state and, if applicable, non-U.S. tax authorities after the expiration of each jurisdiction’s statute of limitations, which is generally three years after the date of filing but can be extended in certain jurisdictions.
Non-U.S. taxation — Dividend and interest income are recorded net of non-U.S. taxes paid. The fund may file withholding tax reclaims in certain jurisdictions to recover a portion of amounts previously withheld. As a result of rulings from European courts, the fund filed for additional reclaims related to prior years. These reclaims are recorded when the amount is known and there are no significant uncertainties on collectability. Gains realized by the fund on the sale of securities in certain countries, if any, may be subject to non-U.S. taxes. If applicable, the fund records an estimated deferred tax liability based on unrealized gains to provide for potential non-U.S. taxes payable upon the sale of these securities.
Distributions — Distributions paid to shareholders are based on net investment income and net realized gains determined on a tax basis, which may differ from net investment income and net realized gains for financial reporting purposes. These differences are due primarily to different treatment for items such as currency gains and losses; short-term capital gains and losses; cost of investments sold and income on certain investments. The fiscal year in which amounts are distributed may differ from the year in which the net investment income and net realized gains are recorded by the fund for financial reporting purposes. The fund may also designate a portion of the amount paid to redeeming shareholders as a distribution for tax purposes.
During the year ended July 31, 2018, the fund reclassified $2,549,000 from undistributed net investment income to undistributed net realized gain, $73,000 from undistributed net investment income to capital paid in on shares of beneficial interest and $243,356,000 from undistributed net realized gain to capital paid in on shares of beneficial interest to align financial reporting with tax reporting.
| The Income Fund of America | 25 |
As of July 31, 2018, the tax basis components of distributable earnings, unrealized appreciation (depreciation) and cost of investments were as follows (dollars in thousands):
| Undistributed ordinary income | | $ | 1,217,010 | |
| Undistributed long-term capital gains | | | 4,118,559 | |
| Post-October capital loss deferral* | | | (359,851 | ) |
| Gross unrealized appreciation on investments | | | 21,716,763 | |
| Gross unrealized depreciation on investments | | | (1,462,967 | ) |
| Net unrealized appreciation on investments | | | 20,253,796 | |
| Cost of investments | | | 90,006,415 | |
| * | This deferral is considered incurred in the subsequent year. |
Distributions paid were characterized for tax purposes as follows (dollars in thousands):
| | | Year ended July 31, 2018 | | | Year ended July 31, 2017 | |
| Share class | | Ordinary
income | | | Long-term
capital gains | | | Total
dividends and
distributions
paid | | | Ordinary
income | | | Long-term
capital gains | | | Total
dividends
paid | |
| Class A | | $ | 2,156,875 | | | $ | 1,628,666 | | | $ | 3,785,541 | | | $ | 2,274,922 | | | $ | | — | | | $ | 2,274,922 | |
| Class B1 | | | | | | | | | | | | | | | 761 | | | | | — | | | | 761 | |
| Class C | | | 108,090 | | | | 114,785 | | | | 222,875 | | | | 132,477 | | | | | — | | | | 132,477 | |
| Class T2 | | | — | 3 | | | — | 3 | | | — | 3 | | | — | 3 | | | | — | | | | — | 3 |
| Class F-1 | | | 125,422 | | | | 98,429 | | | | 223,851 | | | | 135,696 | | | | | — | | | | 135,696 | |
| Class F-2 | | | 234,083 | | | | 163,657 | | | | 397,740 | | | | 204,304 | | | | | — | | | | 204,304 | |
| Class F-34 | | | 73,151 | | | | 48,964 | | | | 122,115 | | | | 12,908 | | | | | — | | | | 12,908 | |
| Class 529-A | | | 47,047 | | | | 36,923 | | | | 83,970 | | | | 45,788 | | | | | — | | | | 45,788 | |
| Class 529-B1 | | | | | | | | | | | | | | | 47 | | | | | — | | | | 47 | |
| Class 529-C | | | 7,056 | | | | 7,401 | | | | 14,457 | | | | 10,120 | | | | | — | | | | 10,120 | |
| Class 529-E | | | 1,749 | | | | 1,494 | | | | 3,243 | | | | 1,835 | | | | | — | | | | 1,835 | |
| Class 529-T2 | | | — | 3 | | | — | 3 | | | — | 3 | | | — | 3 | | | | — | | | | — | 3 |
| Class 529-F-1 | | | 2,297 | | | | 1,609 | | | | 3,906 | | | | 2,061 | | | | | — | | | | 2,061 | |
| Class R-1 | | | 2,448 | | | | 2,641 | | | | 5,089 | | | | 2,864 | | | | | — | | | | 2,864 | |
| Class R-2 | | | 10,628 | | | | 11,337 | | | | 21,965 | | | | 12,579 | | | | | — | | | | 12,579 | |
| Class R-2E | | | 577 | | | | 519 | | | | 1,096 | | | | 325 | | | | | — | | | | 325 | |
| Class R-3 | | | 27,649 | | | | 24,346 | | | | 51,995 | | | | 32,043 | | | | | — | | | | 32,043 | |
| Class R-4 | | | 35,460 | | | | 28,433 | | | | 63,893 | | | | 37,080 | | | | | — | | | | 37,080 | |
| Class R-5E | | | 83 | | | | 38 | | | | 121 | | | | 13 | | | | | — | | | | 13 | |
| Class R-5 | | | 13,490 | | | | 9,277 | | | | 22,767 | | | | 16,766 | | | | | — | | | | 16,766 | |
| Class R-6 | | | 232,416 | | | | 153,703 | | | | 386,119 | | | | 177,794 | | | | | — | | | | 177,794 | |
| Total | | $ | 3,078,521 | | | $ | 2,332,222 | | | $ | 5,410,743 | | | $ | 3,100,383 | | | $ | | — | | | $ | 3,100,383 | |
| 1 | Class B and 529-B shares were fully liquidated on May 5, 2017. |
| 2 | Class T and 529-T shares began investment operations on April 7, 2017. |
| 3 | Amount less than one thousand. |
| 4 | Class F-3 shares began investment operations on January 27, 2017. |
7. Fees and transactions with related parties
CRMC, the fund’s investment adviser, is the parent company of American Funds Distributors,® Inc. (“AFD”), the principal underwriter of the fund’s shares, and American Funds Service Company® (“AFS”), the fund’s transfer agent. CRMC, AFD and AFS are considered related parties to the fund.
Investment advisory services — The fund has an investment advisory and service agreement with CRMC that provides for monthly fees accrued daily. These fees are based on a series of decreasing annual rates beginning with 0.250% on the first $500 million of average daily net assets and decreasing to 0.121% on such assets in excess of $115 billion. The agreement also provides for monthly fees, accrued daily, of 2.25% of the fund’s monthly gross income. For the year ended July 31, 2018, the investment advisory services fee was $236,241,000, which was equivalent to an annualized rate of 0.216% of average daily net assets.
| 26 | The Income Fund of America |
Class-specific fees and expenses — Expenses that are specific to individual share classes are accrued directly to the respective share class. The principal class-specific fees and expenses are further described below:
Distribution services — The fund has plans of distribution for all share classes, except Class F-2, F-3, R-5E, R-5 and R-6 shares. Under the plans, the board of trustees approves certain categories of expenses that are used to finance activities primarily intended to sell fund shares and service existing accounts. The plans provide for payments, based on an annualized percentage of average daily net assets, ranging from 0.25% to 1.00% as noted in this section. In some cases, the board of trustees has limited the amounts that may be paid to less than the maximum allowed by the plans. All share classes with a plan may use up to 0.25% of average daily net assets to pay service fees, or to compensate AFD for paying service fees, to firms that have entered into agreements with AFD to provide certain shareholder services. The remaining amounts available to be paid under each plan are paid to dealers to compensate them for their sales activities.
| Share class | | Currently approved limits | | Plan limits |
| Class A | | | 0.25 | % | | | 0.25 | % |
| Class 529-A | | | 0.25 | | | | 0.50 | |
| Classes C, 529-C and R-1 | | | 1.00 | | | | 1.00 | |
| Class R-2 | | | 0.75 | | | | 1.00 | |
| Class R-2E | | | 0.60 | | | | 0.85 | |
| Classes 529-E and R-3 | | | 0.50 | | | | 0.75 | |
| Classes T, F-1, 529-T, 529-F-1 and R-4 | | | 0.25 | | | | 0.50 | |
For Class A and 529-A shares, distribution-related expenses include the reimbursement of dealer and wholesaler commissions paid by AFD for certain shares sold without a sales charge. These share classes reimburse AFD for amounts billed within the prior 15 months but only to the extent that the overall annual expense limits are not exceeded. As of July 31, 2018, there were no unreimbursed expenses subject to reimbursement for Class A or 529-A shares.
Transfer agent services — The fund has a shareholder services agreement with AFS under which the fund compensates AFS for providing transfer agent services to each of the fund’s share classes. These services include recordkeeping, shareholder communications and transaction processing. In addition, the fund reimburses AFS for amounts paid to third parties for performing transfer agent services on behalf of fund shareholders.
Administrative services — The fund has an administrative services agreement with CRMC under which the fund compensates CRMC for providing administrative services to Class A, C, T, F, 529 and R shares. Administrative services are provided by CRMC to help assist third parties providing non-distribution services to fund shareholders. These services include providing in depth information on the fund and market developments that impact fund investments. Administrative services also include, but are not limited to, coordinating, monitoring and overseeing third parties that provide services to fund shareholders. The agreement between the fund and the investment adviser provides the fund the ability to charge an administrative services fee of 0.05% of average daily net assets for all share classes. Currently Class A shares pay an annual fee of 0.01% of average daily net assets (which could be increased as noted above) and Class C, T, F, 529 and R shares pay an annual fee of 0.05% of their respective average daily net assets.
529 plan services — Each 529 share class is subject to service fees to compensate the Virginia College Savings Plan (“Virginia529”) for its oversight and administration of the CollegeAmerica 529 college savings plan. The fee is based on the combined net assets invested in Class 529 and ABLE shares of the American Funds. Class ABLE shares are offered on other American Funds by Virginia529 through ABLEAmerica, a tax-advantaged savings program for individuals with disabilities. The quarterly fee is based on a series of decreasing annual rates beginning with 0.10% on the first $20 billion of the combined net assets invested in the American Funds and decreasing to 0.03% on such assets in excess of $100 billion. The fee for any given calendar quarter is accrued and calculated on the basis of the average net assets of Class 529 and ABLE shares of the American Funds for the last month of the prior calendar quarter. The fee is included in other expenses in the fund’s statement of operations. Virginia529 is not considered a related party to the fund.
| The Income Fund of America | 27 |
For the year ended July 31, 2018, class-specific expenses under the agreements were as follows (dollars in thousands):
| Share class | | Distribution
services | | Transfer agent
services | | Administrative
services | | 529 plan
services | |
| Class A | | $186,678 | | $49,731 | | $7,608 | | Not applicable | |
| Class C | | 52,424 | | 3,471 | | 2,623 | | Not applicable | |
| Class T | | — | | — | * | — | * | Not applicable | |
| Class F-1 | | 11,324 | | 5,275 | | 2,267 | | Not applicable | |
| Class F-2 | | Not applicable | | 8,053 | | 3,907 | | Not applicable | |
| Class F-3 | | Not applicable | | 113 | | 1,178 | | Not applicable | |
| Class 529-A | | 3,896 | | 955 | | 845 | | $1,122 | |
| Class 529-C | | 3,792 | | 235 | | 191 | | 254 | |
| Class 529-E | | 344 | | 18 | | 35 | | 46 | |
| Class 529-T | | — | | — | * | — | * | — | * |
| Class 529-F-1 | | — | | 43 | | 38 | | 51 | |
| Class R-1 | | 1,214 | | 121 | | 61 | | Not applicable | |
| Class R-2 | | 3,841 | | 1,796 | | 258 | | Not applicable | |
| Class R-2E | | 149 | | 51 | | 12 | | Not applicable | |
| Class R-3 | | 5,606 | | 1,686 | | 562 | | Not applicable | |
| Class R-4 | | 3,188 | | 1,292 | | 638 | | Not applicable | |
| Class R-5E | | Not applicable | | 4 | | 1 | | Not applicable | |
| Class R-5 | | Not applicable | | 226 | | 222 | | Not applicable | |
| Class R-6 | | Not applicable | | 28 | | 3,756 | | Not applicable | |
| Total class-specific expenses | | $272,456 | | $73,098 | | $24,202 | | $1,473 | |
| * | Amount less than one thousand. |
Trustees’ deferred compensation — Trustees who are unaffiliated with CRMC may elect to defer the cash payment of part or all of their compensation. These deferred amounts, which remain as liabilities of the fund, are treated as if invested in shares of the fund or other American Funds. These amounts represent general, unsecured liabilities of the fund and vary according to the total returns of the selected funds. Trustees’ compensation of $844,000 in the fund’s statement of operations reflects $452,000 in current fees (either paid in cash or deferred) and a net increase of $392,000 in the value of the deferred amounts.
Affiliated officers and trustees — Officers and certain trustees of the fund are or may be considered to be affiliated with CRMC, AFD and AFS. No affiliated officers or trustees received any compensation directly from the fund.
Security transactions with related funds — The fund may purchase from, or sell securities to, other funds managed by CRMC (or funds managed by certain affiliates of CRMC) under procedures adopted by the fund’s board of trustees. The funds involved in such transactions are considered related by virtue of having a common investment adviser (or affiliated investment advisers), common trustees and/or common officers. When such transactions occur, each transaction is executed at the current market price of the security and no brokerage commissions or fees are paid in accordance with Rule 17a-7 of the 1940 Act.
Interfund lending — Pursuant to an exemptive order issued by the SEC, the fund, along with other CRMC-managed funds (or funds managed by certain affiliates of CRMC), may participate in an interfund lending program. The program provides an alternate credit facility that permits the funds to lend or borrow cash for temporary purposes directly to or from one another, subject to the conditions of the exemptive order. The fund did not lend or borrow cash through the interfund lending program at any time during the year ended July 31, 2018.
| 28 | The Income Fund of America |
8. Capital share transactions
Capital share transactions in the fund were as follows (dollars and shares in thousands):
| | | Sales1 | | Reinvestments of
dividends and distributions | | Repurchases1 | | Net (decrease)
increase | |
| Share class | | Amount | | | Shares | | | Amount | | | Shares | | | Amount | | | Shares | | | Amount | | | Shares | |
| | | | | | | | | | | | | | | | | | | | | | | | | | | | | | |
| Year ended July 31, 2018 | | | | | | | | | | | | | | | | | | | | | | | | | | | | | |
| | | | | | | | | | | | | | | | | | | | | | | | | | | | | | | | | |
| Class A | | $ | 3,944,538 | | | | 170,097 | | | $ | 3,697,733 | | | | 159,750 | | | $ | (9,869,190 | ) | | | (425,730 | ) | | $ | (2,226,919 | ) | | | (95,883 | ) |
| Class C | | | 437,444 | | | | 19,097 | | | | 217,737 | | | | 9,515 | | | | (1,401,677 | ) | | | (61,232 | ) | | | (746,496 | ) | | | (32,620 | ) |
| Class T | | | — | | | | — | | | | — | | | | — | | | | — | | | | — | | | | — | | | | — | |
| Class F-1 | | | 659,708 | | | | 28,483 | | | | 215,688 | | | | 9,342 | | | | (1,319,981 | ) | | | (57,189 | ) | | | (444,585 | ) | | | (19,364 | ) |
| Class F-2 | | | 2,819,705 | | | | 121,906 | | | | 377,953 | | | | 16,345 | | | | (1,740,606 | ) | | | (75,201 | ) | | | 1,457,052 | | | | 63,050 | |
| Class F-3 | | | 1,291,558 | | | | 55,765 | | | | 118,800 | | | | 5,136 | | | | (463,912 | ) | | | (20,009 | ) | | | 946,446 | | | | 40,892 | |
| Class 529-A | | | 293,575 | | | | 12,556 | | | | 83,949 | | | | 3,634 | | | | (275,813 | ) | | | (11,914 | ) | | | 101,711 | | | | 4,276 | |
| Class 529-C | | | 42,980 | | | | 1,866 | | | | 14,452 | | | | 627 | | | | (210,830 | ) | | | (9,023 | ) | | | (153,398 | ) | | | (6,530 | ) |
| Class 529-E | | | 7,257 | | | | 314 | | | | 3,241 | | | | 141 | | | | (13,026 | ) | | | (565 | ) | | | (2,528 | ) | | | (110 | ) |
| Class 529-T | | | — | | | | — | | | | 1 | | | | 1 | | | | — | | | | — | | | | 1 | | | | 1 | |
| Class 529-F-1 | | | 20,719 | | | | 895 | | | | 3,906 | | | | 169 | | | | (15,957 | ) | | | (691 | ) | | | 8,668 | | | | 373 | |
| Class R-1 | | | 14,112 | | | | 616 | | | | 5,083 | | | | 221 | | | | (29,553 | ) | | | (1,285 | ) | | | (10,358 | ) | | | (448 | ) |
| Class R-2 | | | 102,737 | | | | 4,470 | | | | 21,942 | | | | 958 | | | | (178,170 | ) | | | (7,768 | ) | | | (53,491 | ) | | | (2,340 | ) |
| Class R-2E | | | 10,025 | | | | 435 | | | | 1,096 | | | | 47 | | | | (5,399 | ) | | | (234 | ) | | | 5,722 | | | | 248 | |
| Class R-3 | | | 181,266 | | | | 7,850 | | | | 51,881 | | | | 2,249 | | | | (379,359 | ) | | | (16,435 | ) | | | (146,212 | ) | | | (6,336 | ) |
| Class R-4 | | | 189,752 | | | | 8,204 | | | | 63,885 | | | | 2,764 | | | | (486,249 | ) | | | (21,090 | ) | | | (232,612 | ) | | | (10,122 | ) |
| Class R-5E | | | 8,076 | | | | 352 | | | | 121 | | | | 5 | | | | (2,813 | ) | | | (122 | ) | | | 5,384 | | | | 235 | |
| Class R-5 | | | 88,281 | | | | 3,801 | | | | 22,662 | | | | 979 | | | | (99,010 | ) | | | (4,270 | ) | | | 11,933 | | | | 510 | |
| Class R-6 | | | 1,921,096 | | | | 82,963 | | | | 385,991 | | | | 16,677 | | | | (421,323 | ) | | | (18,141 | ) | | | 1,885,764 | | | | 81,499 | |
| Total net increase (decrease) | | $ | 12,032,829 | | | | 519,670 | | | $ | 5,286,121 | | | | 228,560 | | | $ | (16,912,868 | ) | | | (730,899 | ) | | $ | 406,082 | | | | 17,331 | |
| | | | | | | | | | | | | | | | | | | | | | | | | | | | | | | | | |
| Year ended July 31, 2017 | | | | | | | | | | | | | | | | | | | | | | | | | | | | | |
| | | | | | | | | | | | | | | | | | | | | | | | | | | | | | | | | |
| Class A | | $ | 5,881,486 | | | | 267,632 | | | $ | 2,203,615 | | | | 100,407 | | | $ | (11,318,300 | ) | | | (514,813 | ) | | $ | (3,233,199 | ) | | | (146,774 | ) |
| Class B2 | | | 497 | | | | 23 | | | | 751 | | | | 35 | | | | (114,403 | ) | | | (5,268 | ) | | | (113,155 | ) | | | (5,210 | ) |
| Class C | | | 736,768 | | | | 33,965 | | | | 127,963 | | | | 5,905 | | | | (1,788,999 | ) | | | (82,331 | ) | | | (924,268 | ) | | | (42,461 | ) |
| Class T3 | | | 10 | | | | — | 4 | | | — | | | | — | | | | — | | | | — | | | | 10 | | | | — | 4 |
| Class F-1 | | | 1,077,400 | | | | 49,135 | | | | 129,704 | | | | 5,921 | | | | (1,260,853 | ) | | | (57,168 | ) | | | (53,749 | ) | | | (2,112 | ) |
| Class F-2 | | | 4,441,332 | | | | 202,365 | | | | 192,330 | | | | 8,753 | | | | (2,996,579 | ) | | | (135,371 | ) | | | 1,637,083 | | | | 75,747 | |
| Class F-35 | | | 1,811,312 | | | | 80,631 | | | | 12,318 | | | | 542 | | | | (92,211 | ) | | | (4,071 | ) | | | 1,731,419 | | | | 77,102 | |
| Class 529-A | | | 178,773 | | | | 8,152 | | | | 45,773 | | | | 2,089 | | | | (226,711 | ) | | | (10,321 | ) | | | (2,165 | ) | | | (80 | ) |
| Class 529-B2 | | | 103 | | | | 4 | | | | 47 | | | | 2 | | | | (8,131 | ) | | | (373 | ) | | | (7,981 | ) | | | (367 | ) |
| Class 529-C | | | 53,563 | | | | 2,454 | | | | 10,117 | | | | 463 | | | | (86,315 | ) | | | (3,950 | ) | | | (22,635 | ) | | | (1,033 | ) |
| Class 529-E | | | 8,659 | | | | 396 | | | | 1,835 | | | | 84 | | | | (9,919 | ) | | | (453 | ) | | | 575 | | | | 27 | |
| Class 529-T3 | | | 10 | | | | — | 4 | | | — | 4 | | | — | 4 | | | — | | | | — | | | | 10 | | | | — | 4 |
| Class 529-F-1 | | | 18,418 | | | | 837 | | | | 2,059 | | | | 94 | | | | (13,408 | ) | | | (611 | ) | | | 7,069 | | | | 320 | |
| Class R-1 | | | 18,994 | | | | 870 | | | | 2,862 | | | | 131 | | | | (37,028 | ) | | | (1,695 | ) | | | (15,172 | ) | | | (694 | ) |
| Class R-2 | | | 119,096 | | | | 5,471 | | | | 12,554 | | | | 578 | | | | (204,605 | ) | | | (9,386 | ) | | | (72,955 | ) | | | (3,337 | ) |
| Class R-2E | | | 15,942 | | | | 722 | | | | 325 | | | | 15 | | | | (2,480 | ) | | | (113 | ) | | | 13,787 | | | | 624 | |
| Class R-3 | | | 252,983 | | | | 11,540 | | | | 31,954 | | | | 1,462 | | | | (381,026 | ) | | | (17,346 | ) | | | (96,089 | ) | | | (4,344 | ) |
| Class R-4 | | | 443,211 | | | | 20,013 | | | | 37,060 | | | | 1,689 | | | | (370,093 | ) | | | (16,774 | ) | | | 110,178 | | | | 4,928 | |
| Class R-5E | | | 846 | | | | 38 | | | | 12 | | | | — | 4 | | | (21 | ) | | | (1 | ) | | | 837 | | | | 37 | |
| Class R-5 | | | 138,397 | | | | 6,310 | | | | 16,721 | | | | 763 | | | | (269,858 | ) | | | (12,093 | ) | | | (114,740 | ) | | | (5,020 | ) |
| Class R-6 | | | 1,763,760 | | | | 80,003 | | | | 177,698 | | | | 8,074 | | | | (391,369 | ) | | | (17,781 | ) | | | 1,550,089 | | | | 70,296 | |
| Total net increase (decrease) | | $ | 16,961,560 | | | | 770,561 | | | $ | 3,005,698 | | | | 137,007 | | | $ | (19,572,309 | ) | | | (889,919 | ) | | $ | 394,949 | | | | 17,649 | |
| 1 | Includes exchanges between share classes of the fund. |
| 2 | Class B and 529-B shares were fully liquidated on May 5, 2017. |
| 3 | Class T and 529-T shares began investment operations on April 7, 2017. |
| 4 | Amount less than one thousand. |
| 5 | Class F-3 shares began investment operations on January 27, 2017. |
| The Income Fund of America | 29 |
9. Investment transactions
The fund made purchases and sales of investment securities, excluding short-term securities and U.S. government obligations, if any, of $44,664,433,000 and $56,688,049,000, respectively, during the year ended July 31, 2018.
| 30 | The Income Fund of America |
Financial highlights
| | | | | Income from
investment operations1 | | Dividends and distributions | | | | | | | | | | |
| Period ended | | Net asset
value,
beginning
of period | | | Net
investment
income2 | | | Net gains
(losses) on
securities
(both
realized and
unrealized) | | | Total from
investment
operations | | | Dividends
(from net
investment
income) | | | Distributions
(from capital
gains) | | | Total
dividends
and
distributions | | | Net asset
value,
end
of period | | | Total
return3 | | | Net assets,
end of period
(in millions) | | | Ratio of
expenses to
average
net assets2 | | | Ratio of
net income
to average
net assets2 | |
| Class A: | | | | | | | | | | | | | | | | | | | | | | | | | | | | | | | | | | | | | | | | | | | | | | | | |
| 7/31/2018 | | $ | 22.87 | | | $ | .73 | | | $ | .84 | | | $ | 1.57 | | | $ | (.66 | ) | | $ | (.50 | ) | | $ | (1.16 | ) | | $ | 23.28 | | | | 6.98 | % | | $ | 75,284 | | | | .55 | % | | | 3.16 | % |
| 7/31/2017 | | | 21.70 | | | | .74 | | | | 1.10 | | | | 1.84 | | | | (.67 | ) | | | — | | | | (.67 | ) | | | 22.87 | | | | 8.65 | | | | 76,148 | | | | .56 | | | | 3.37 | |
| 7/31/2016 | | | 21.31 | | | | .66 | | | | .76 | | | | 1.42 | | | | (.66 | ) | | | (.37 | ) | | | (1.03 | ) | | | 21.70 | | | | 7.10 | | | | 75,437 | | | | .56 | | | | 3.22 | |
| 7/31/2015 | | | 21.45 | | | | .69 | | | | (.04 | ) | | | .65 | | | | (.79 | ) | | | — | | | | (.79 | ) | | | 21.31 | | | | 3.01 | | | | 72,952 | | | | .55 | | | | 3.19 | |
| 7/31/2014 | | | 19.64 | | | | .78 | | | | 1.69 | | | | 2.47 | | | | (.66 | ) | | | — | | | | (.66 | ) | | | 21.45 | | | | 12.78 | | | | 71,290 | | | | .57 | | | | 3.76 | |
| Class C: | | | | | | | | | | | | | | | | | | | | | | | | | | | | | | | | | | | | | | | | | | | | | | | | |
| 7/31/2018 | | | 22.59 | | | | .54 | | | | .82 | | | | 1.36 | | | | (.47 | ) | | | (.50 | ) | | | (.97 | ) | | | 22.98 | | | | 6.11 | | | | 4,917 | | | | 1.34 | | | | 2.36 | |
| 7/31/2017 | | | 21.44 | | | | .56 | | | | 1.09 | | | | 1.65 | | | | (.50 | ) | | | — | | | | (.50 | ) | | | 22.59 | | | | 7.79 | | | | 5,569 | | | | 1.35 | | | | 2.56 | |
| 7/31/2016 | | | 21.06 | | | | .49 | | | | .76 | | | | 1.25 | | | | (.50 | ) | | | (.37 | ) | | | (.87 | ) | | | 21.44 | | | | 6.27 | | | | 6,196 | | | | 1.36 | | | | 2.41 | |
| 7/31/2015 | | | 21.21 | | | | .51 | | | | (.04 | ) | | | .47 | | | | (.62 | ) | | | — | | | | (.62 | ) | | | 21.06 | | | | 2.19 | | | | 6,390 | | | | 1.35 | | | | 2.39 | |
| 7/31/2014 | | | 19.42 | | | | .60 | | | | 1.69 | | | | 2.29 | | | | (.50 | ) | | | — | | | | (.50 | ) | | | 21.21 | | | | 11.91 | | | | 6,597 | | | | 1.37 | | | | 2.95 | |
| Class T: | | | | | | | | | | | | | | | | | | | | | | | | | | | | | | | | | | | | | | | | | | | | | | | | |
| 7/31/2018 | | | 22.88 | | | | .78 | | | | .84 | | | | 1.62 | | | | (.71 | ) | | | (.50 | ) | | | (1.21 | ) | | | 23.29 | | | | 7.19 | 4 | | | — | 5 | | | .34 | 4 | | | 3.36 | 4 |
| 7/31/20176,7 | | | 22.27 | | | | .29 | | | | .50 | | | | .79 | | | | (.18 | ) | | | — | | | | (.18 | ) | | | 22.88 | | | | 3.54 | 4,8 | | | — | 5 | | | .11 | 4,8 | | | 1.26 | 4,8 |
| Class F-1: | | | | | | | | | | | | | | | | | | | | | | | | | | | | | | | | | | | | | | | | | | | | | | | | |
| 7/31/2018 | | | 22.82 | | | | .71 | | | | .83 | | | | 1.54 | | | | (.64 | ) | | | (.50 | ) | | | (1.14 | ) | | | 23.22 | | | | 6.84 | | | | 4,243 | | | | .64 | | | | 3.07 | |
| 7/31/2017 | | | 21.65 | | | | .72 | | | | 1.10 | | | | 1.82 | | | | (.65 | ) | | | — | | | | (.65 | ) | | | 22.82 | | | | 8.57 | | | | 4,610 | | | | .65 | | | | 3.28 | |
| 7/31/2016 | | | 21.26 | | | | .64 | | | | .76 | | | | 1.40 | | | | (.64 | ) | | | (.37 | ) | | | (1.01 | ) | | | 21.65 | | | | 7.02 | | | | 4,421 | | | | .65 | | | | 3.12 | |
| 7/31/2015 | | | 21.40 | | | | .67 | | | | (.04 | ) | | | .63 | | | | (.77 | ) | | | — | | | | (.77 | ) | | | 21.26 | | | | 2.94 | | | | 4,160 | | | | .64 | | | | 3.10 | |
| 7/31/2014 | | | 19.60 | | | | .76 | | | | 1.68 | | | | 2.44 | | | | (.64 | ) | | | — | | | | (.64 | ) | | | 21.40 | | | | 12.66 | | | | 3,841 | | | | .65 | | | | 3.71 | |
| Class F-2: | | | | | | | | | | | | | | | | | | | | | | | | | | | | | | | | | | | | | | | | | | | | | | | | |
| 7/31/2018 | | | 22.86 | | | | .77 | | | | .84 | | | | 1.61 | | | | (.70 | ) | | | (.50 | ) | | | (1.20 | ) | | | 23.27 | | | | 7.16 | | | | 8,675 | | | | .38 | | | | 3.33 | |
| 7/31/2017 | | | 21.69 | | | | .78 | | | | 1.10 | | | | 1.88 | | | | (.71 | ) | | | — | | | | (.71 | ) | | | 22.86 | | | | 8.84 | | | | 7,081 | | | | .39 | | | | 3.54 | |
| 7/31/2016 | | | 21.30 | | | | .70 | | | | .75 | | | | 1.45 | | | | (.69 | ) | | | (.37 | ) | | | (1.06 | ) | | | 21.69 | | | | 7.28 | | | | 5,076 | | | | .39 | | | | 3.38 | |
| 7/31/2015 | | | 21.44 | | | | .73 | | | | (.04 | ) | | | .69 | | | | (.83 | ) | | | — | | | | (.83 | ) | | | 21.30 | | | | 3.20 | | | | 4,042 | | | | .38 | | | | 3.35 | |
| 7/31/2014 | | | 19.63 | | | | .80 | | | | 1.71 | | | | 2.51 | | | | (.70 | ) | | | — | | | | (.70 | ) | | | 21.44 | | | | 12.97 | | | | 2,975 | | | | .40 | | | | 3.89 | |
| Class F-3: | | | | | | | | | | | | | | | | | | | | | | | | | | | | | | | | | | | | | | | | | | | | | | | | |
| 7/31/2018 | | | 22.87 | | | | .79 | | | | .84 | | | | 1.63 | | | | (.72 | ) | | | (.50 | ) | | | (1.22 | ) | | | 23.28 | | | | 7.27 | | | | 2,747 | | | | .28 | | | | 3.43 | |
| 7/31/20176,9 | | | 22.07 | | | | .49 | | | | .67 | | | | 1.16 | | | | (.36 | ) | | | — | | | | (.36 | ) | | | 22.87 | | | | 5.30 | 8 | | | 1,763 | | | | .30 | 10 | | | 4.33 | 10 |
| Class 529-A: | | | | | | | | | | | | | | | | | | | | | | | | | | | | | | | | | | | | | | | | | | | | | | | | |
| 7/31/2018 | | | 22.83 | | | | .71 | | | | .83 | | | | 1.54 | | | | (.64 | ) | | | (.50 | ) | | | (1.14 | ) | | | 23.23 | | | | 6.87 | | | | 1,733 | | | | .63 | | | | 3.08 | |
| 7/31/2017 | | | 21.66 | | | | .72 | | | | 1.10 | | | | 1.82 | | | | (.65 | ) | | | — | | | | (.65 | ) | | | 22.83 | | | | 8.58 | | | | 1,606 | | | | .64 | | | | 3.30 | |
| 7/31/2016 | | | 21.27 | | | | .64 | | | | .76 | | | | 1.40 | | | | (.64 | ) | | | (.37 | ) | | | (1.01 | ) | | | 21.66 | | | | 7.00 | | | | 1,525 | | | | .66 | | | | 3.11 | |
| 7/31/2015 | | | 21.41 | | | | .67 | | | | (.04 | ) | | | .63 | | | | (.77 | ) | | | — | | | | (.77 | ) | | | 21.27 | | | | 2.92 | | | | 1,489 | | | | .65 | | | | 3.09 | |
| 7/31/2014 | | | 19.60 | | | | .75 | | | | 1.70 | | | | 2.45 | | | | (.64 | ) | | | — | | | | (.64 | ) | | | 21.41 | | | | 12.69 | | | | 1,463 | | | | .67 | | | | 3.66 | |
See end of table for footnotes.
| The Income Fund of America | 31 |
Financial highlights (continued)
| | | | | Income from
investment operations1 | | Dividends and distributions | | | | | | | | | | |
| Period ended | | Net asset
value,
beginning
of period | | | Net
investment
income2 | | | Net gains
(losses) on
securities
(both
realized and
unrealized) | | | Total from
investment
operations | | | Dividends
(from net
investment
income) | | | Distributions
(from capital
gains) | | | Total
dividends
and
distributions | | | Net asset
value,
end
of period | | | Total
return3 | | | Net assets,
end of period
(in millions) | | | Ratio of
expenses to
average
net assets2 | | | Ratio of
net income
to average
net assets2 | |
| Class 529-C: | | | | | | | | | | | | | | | | | | | | | | | | |
| 7/31/2018 | | $ | 22.73 | | | $ | .53 | | | $ | .83 | | | $ | 1.36 | | | $ | (.44 | ) | | $ | (.50 | ) | | $ | (.94 | ) | | $ | 23.15 | | | | 6.06 | % | | $ | 322 | | | | 1.39 | % | | | 2.30 | % |
| 7/31/2017 | | | 21.57 | | | | .55 | | | | 1.09 | | | | 1.64 | | | | (.48 | ) | | | — | | | | (.48 | ) | | | 22.73 | | | | 7.74 | | | | 464 | | | | 1.41 | | | | 2.52 | |
| 7/31/2016 | | | 21.18 | | | | .48 | | | | .76 | | | | 1.24 | | | | (.48 | ) | | | (.37 | ) | | | (.85 | ) | | | 21.57 | | | | 6.20 | | | | 463 | | | | 1.43 | | | | 2.34 | |
| 7/31/2015 | | | 21.33 | | | | .50 | | | | (.05 | ) | | | .45 | | | | (.60 | ) | | | — | | | | (.60 | ) | | | 21.18 | | | | 2.09 | | | | 466 | | | | 1.42 | | | | 2.32 | |
| 7/31/2014 | | | 19.53 | | | | .59 | | | | 1.69 | | | | 2.28 | | | | (.48 | ) | | | — | | | | (.48 | ) | | | 21.33 | | | | 11.82 | | | | 470 | | | | 1.44 | | | | 2.88 | |
| Class 529-E: | | | | | | | | | | | | | | | | | | | | | | | | | | | | | | | | | | | | | | | | | | | | | | | | |
| 7/31/2018 | | | 22.76 | | | | .66 | | | | .83 | | | | 1.49 | | | | (.59 | ) | | | (.50 | ) | | | (1.09 | ) | | | 23.16 | | | | 6.63 | | | | 69 | | | | .86 | | | | 2.84 | |
| 7/31/2017 | | | 21.60 | | | | .67 | | | | 1.09 | | | | 1.76 | | | | (.60 | ) | | | — | | | | (.60 | ) | | | 22.76 | | | | 8.30 | | | | 70 | | | | .87 | | | | 3.06 | |
| 7/31/2016 | | | 21.21 | | | | .59 | | | | .76 | | | | 1.35 | | | | (.59 | ) | | | (.37 | ) | | | (.96 | ) | | | 21.60 | | | | 6.76 | | | | 66 | | | | .89 | | | | 2.88 | |
| 7/31/2015 | | | 21.35 | | | | .62 | | | | (.04 | ) | | | .58 | | | | (.72 | ) | | | — | | | | (.72 | ) | | | 21.21 | | | | 2.68 | | | | 64 | | | | .89 | | | | 2.85 | |
| 7/31/2014 | | | 19.55 | | | | .70 | | | | 1.69 | | | | 2.39 | | | | (.59 | ) | | | — | | | | (.59 | ) | | | 21.35 | | | | 12.39 | | | | 65 | | | | .91 | | | | 3.41 | |
| Class 529-T: | | | | | | | | | | | | | | | | | | | | | | | | | | | | | | | | | | | | | | | | | | | | | | | | |
| 7/31/2018 | | | 22.88 | | | | .76 | | | | .84 | | | | 1.60 | | | | (.69 | ) | | | (.50 | ) | | | (1.19 | ) | | | 23.29 | | | | 7.12 | 4 | | | — | 5 | | | .41 | 4 | | | 3.30 | 4 |
| 7/31/20176,7 | | | 22.27 | | | | .28 | | | | .50 | | | | .78 | | | | (.17 | ) | | | — | | | | (.17 | ) | | | 22.88 | | | | 3.52 | 4,8 | | | — | 5 | | | .13 | 4,8 | | | 1.24 | 4,8 |
| Class 529-F-1: | | | | | | | | | | | | | | | | | | | | | | | | | | | | | | | | | | | | | | | | | | | | | | | | |
| 7/31/2018 | | | 22.83 | | | | .77 | | | | .82 | | | | 1.59 | | | | (.69 | ) | | | (.50 | ) | | | (1.19 | ) | | | 23.23 | | | | 7.10 | | | | 81 | | | | .40 | | | | 3.32 | |
| 7/31/2017 | | | 21.66 | | | | .78 | | | | 1.09 | | | | 1.87 | | | | (.70 | ) | | | — | | | | (.70 | ) | | | 22.83 | | | | 8.83 | | | | 71 | | | | .41 | | | | 3.53 | |
| 7/31/2016 | | | 21.27 | | | | .69 | | | | .76 | | | | 1.45 | | | | (.69 | ) | | | (.37 | ) | | | (1.06 | ) | | | 21.66 | | | | 7.25 | | | | 61 | | | | .43 | | | | 3.34 | |
| 7/31/2015 | | | 21.41 | | | | .72 | | | | (.04 | ) | | | .68 | | | | (.82 | ) | | | — | | | | (.82 | ) | | | 21.27 | | | | 3.16 | | | | 58 | | | | .42 | | | | 3.31 | |
| 7/31/2014 | | | 19.60 | | | | .80 | | | | 1.70 | | | | 2.50 | | | | (.69 | ) | | | — | | | | (.69 | ) | | | 21.41 | | | | 12.94 | | | | 52 | | | | .44 | | | | 3.89 | |
| Class R-1: | | | | | | | | | | | | | | | | | | | | | | | | | | | | | | | | | | | | | | | | | | | | | | | | |
| 7/31/2018 | | | 22.73 | | | | .54 | | | | .83 | | | | 1.37 | | | | (.47 | ) | | | (.50 | ) | | | (.97 | ) | | | 23.13 | | | | 6.09 | | | | 116 | | | | 1.37 | | | | 2.33 | |
| 7/31/2017 | | | 21.57 | | | | .55 | | | | 1.10 | | | | 1.65 | | | | (.49 | ) | | | — | | | | (.49 | ) | | | 22.73 | | | | 7.76 | | | | 124 | | | | 1.39 | | | | 2.53 | |
| 7/31/2016 | | | 21.18 | | | | .49 | | | | .76 | | | | 1.25 | | | | (.49 | ) | | | (.37 | ) | | | (.86 | ) | | | 21.57 | | | | 6.25 | | | | 133 | | | | 1.37 | | | | 2.40 | |
| 7/31/2015 | | | 21.33 | | | | .51 | | | | (.05 | ) | | | .46 | | | | (.61 | ) | | | — | | | | (.61 | ) | | | 21.18 | | | | 2.16 | | | | 139 | | | | 1.36 | | | | 2.38 | |
| 7/31/2014 | | | 19.53 | | | | .60 | | | | 1.69 | | | | 2.29 | | | | (.49 | ) | | | — | | | | (.49 | ) | | | 21.33 | | | | 11.88 | | | | 133 | | | | 1.39 | | | | 2.93 | |
| Class R-2: | | | | | | | | | | | | | | | | | | | | | | | | | | | | | | | | | | | | | | | | | | | | | | | | |
| 7/31/2018 | | | 22.62 | | | | .54 | | | | .82 | | | | 1.36 | | | | (.47 | ) | | | (.50 | ) | | | (.97 | ) | | | 23.01 | | | | 6.09 | | | | 488 | | | | 1.37 | | | | 2.34 | |
| 7/31/2017 | | | 21.47 | | | | .55 | | | | 1.09 | | | | 1.64 | | | | (.49 | ) | | | — | | | | (.49 | ) | | | 22.62 | | | | 7.77 | | | | 533 | | | | 1.40 | | | | 2.52 | |
| 7/31/2016 | | | 21.09 | | | | .49 | | | | .75 | | | | 1.24 | | | | (.49 | ) | | | (.37 | ) | | | (.86 | ) | | | 21.47 | | | | 6.25 | | | | 577 | | | | 1.36 | | | | 2.41 | |
| 7/31/2015 | | | 21.23 | | | | .52 | | | | (.04 | ) | | | .48 | | | | (.62 | ) | | | — | | | | (.62 | ) | | | 21.09 | | | | 2.24 | | | | 599 | | | | 1.32 | | | | 2.42 | |
| 7/31/2014 | | | 19.45 | | | | .60 | | | | 1.68 | | | | 2.28 | | | | (.50 | ) | | | — | | | | (.50 | ) | | | 21.23 | | | | 11.85 | | | | 635 | | | | 1.37 | | | | 2.95 | |
| Class R-2E: | | | | | | | | | | | | | | | | | | | | | | | | | | | | | | | | | | | | | | | | | | | | | | | | |
| 7/31/2018 | | | 22.82 | | | | .61 | | | | .83 | | | | 1.44 | | | | (.54 | ) | | | (.50 | ) | | | (1.04 | ) | | | 23.22 | | | | 6.40 | | | | 28 | | | | 1.08 | | | | 2.63 | |
| 7/31/2017 | | | 21.66 | | | | .65 | | | | 1.08 | | | | 1.73 | | | | (.57 | ) | | | — | | | | (.57 | ) | | | 22.82 | | | | 8.11 | | | | 22 | | | | 1.09 | | | | 2.95 | |
| 7/31/2016 | | | 21.29 | | | | .58 | | | | .75 | | | | 1.33 | | | | (.59 | ) | | | (.37 | ) | | | (.96 | ) | | | 21.66 | | | | 6.64 | | | | 7 | | | | 1.03 | | | | 2.86 | |
| 7/31/20156,11 | | | 21.98 | | | | .54 | | | | (.47 | ) | | | .07 | | | | (.76 | ) | | | — | | | | (.76 | ) | | | 21.29 | | | | .28 | 4,8 | | | — | 5 | | | .96 | 4,10 | | | 2.73 | 4,10 |
| 32 | The Income Fund of America |
| | | | | Income from
investment operations1 | | | Dividends and distributions | | | | | | | | | | | | | | | |
| Period ended | | Net asset
value,
beginning
of period | | | Net
investment
income2 | | | Net gains
(losses) on
securities
(both
realized and
unrealized) | | | Total from
investment
operations | | | Dividends
(from net
investment
income) | | | Distributions
(from capital
gains) | | | Total
dividends
and
distributions | | | Net asset
value,
end
of period | | | Total
return3 | | | Net assets,
end of period
(in millions) | | | Ratio of
expenses to
average
net assets2 | | | Ratio of
net income
to average
net assets2 | |
| Class R-3: | | | | | | | | | | | | | | | | | | | | | | | | | | | | | | | | | | | | | | | | | | | | | | | | |
| 7/31/2018 | | $ | 22.78 | | | $ | .64 | | | $ | .84 | | | $ | 1.48 | | | $ | (.57 | ) | | $ | (.50 | ) | | $ | (1.07 | ) | | $ | 23.19 | | | | 6.60 | % | | $ | 1,057 | | | | .92 | % | | | 2.78 | % |
| 7/31/2017 | | | 21.62 | | | | .65 | | | | 1.10 | | | | 1.75 | | | | (.59 | ) | | | — | | | | (.59 | ) | | | 22.78 | | | | 8.23 | | | | 1,183 | | | | .95 | | | | 2.97 | |
| 7/31/2016 | | | 21.23 | | | | .59 | | | | .75 | | | | 1.34 | | | | (.58 | ) | | | (.37 | ) | | | (.95 | ) | | | 21.62 | | | | 6.71 | | | | 1,217 | | | | .92 | | | | 2.85 | |
| 7/31/2015 | | | 21.37 | | | | .61 | | | | (.04 | ) | | | .57 | | | | (.71 | ) | | | — | | | | (.71 | ) | | | 21.23 | | | | 2.65 | | | | 1,275 | | | | .92 | | | | 2.83 | |
| 7/31/2014 | | | 19.57 | | | | .69 | | | | 1.69 | | | | 2.38 | | | | (.58 | ) | | | — | | | | (.58 | ) | | | 21.37 | | | | 12.35 | | | | 1,357 | | | | .94 | | | | 3.38 | |
| Class R-4: | | | | | | | | | | | | | | | | | | | | | | | | | | | | | | | | | | | | | | | | | | | | | | | | |
| 7/31/2018 | | | 22.83 | | | | .71 | | | | .84 | | | | 1.55 | | | | (.64 | ) | | | (.50 | ) | | | (1.14 | ) | | | 23.24 | | | | 6.90 | | | | 1,154 | | | | .63 | | | | 3.07 | |
| 7/31/2017 | | | 21.67 | | | | .73 | | | | 1.09 | | | | 1.82 | | | | (.66 | ) | | | — | | | | (.66 | ) | | | 22.83 | | | | 8.54 | | | | 1,365 | | | | .64 | | | | 3.31 | |
| 7/31/2016 | | | 21.27 | | | | .65 | | | | .76 | | | | 1.41 | | | | (.64 | ) | | | (.37 | ) | | | (1.01 | ) | | | 21.67 | | | | 7.07 | | | | 1,189 | | | | .62 | | | | 3.15 | |
| 7/31/2015 | | | 21.42 | | | | .68 | | | | (.06 | ) | | | .62 | | | | (.77 | ) | | | — | | | | (.77 | ) | | | 21.27 | | | | 2.90 | | | | 1,203 | | | | .62 | | | | 3.12 | |
| 7/31/2014 | | | 19.61 | | | | .76 | | | | 1.70 | | | | 2.46 | | | | (.65 | ) | | | — | | | | (.65 | ) | | | 21.42 | | | | 12.71 | | | | 1,192 | | | | .64 | | | | 3.67 | |
| Class R-5E: | | | | | | | | | | | | | | | | | | | | | | | | | | | | | | | | | | | | | | | | | | | | | | | | |
| 7/31/2018 | | | 22.85 | | | | .78 | | | | .82 | | | | 1.60 | | | | (.69 | ) | | | (.50 | ) | | | (1.19 | ) | | | 23.26 | | | | 7.14 | | | | 6 | | | | .41 | | | | 3.38 | |
| 7/31/2017 | | | 21.69 | | | | .90 | | | | .95 | | | | 1.85 | | | | (.69 | ) | | | — | | | | (.69 | ) | | | 22.85 | | | | 8.72 | | | | 1 | | | | .44 | | | | 4.04 | |
| 7/31/20166,12 | | | 21.03 | | | | .47 | | | | 1.07 | | | | 1.54 | | | | (.51 | ) | | | (.37 | ) | | | (.88 | ) | | | 21.69 | | | | 7.70 | 8 | | | — | 5 | | | .48 | 10 | | | 3.30 | 10 |
| Class R-5: | | | | | | | | | | | | | | | | | | | | | | | | | | | | | | | | | | | | | | | | | | | | | | | | |
| 7/31/2018 | | | 22.87 | | | | .78 | | | | .84 | | | | 1.62 | | | | (.71 | ) | | | (.50 | ) | | | (1.21 | ) | | | 23.28 | | | | 7.21 | | | | 449 | | | | .33 | | | | 3.38 | |
| 7/31/2017 | | | 21.70 | | | | .78 | | | | 1.11 | | | | 1.89 | | | | (.72 | ) | | | — | | | | (.72 | ) | | | 22.87 | | | | 8.89 | | | | 429 | | | | .34 | | | | 3.53 | |
| 7/31/2016 | | | 21.31 | | | | .71 | | | | .76 | | | | 1.47 | | | | (.71 | ) | | | (.37 | ) | | | (1.08 | ) | | | 21.70 | | | | 7.34 | | | | 516 | | | | .33 | | | | 3.46 | |
| 7/31/2015 | | | 21.45 | | | | .74 | | | | (.04 | ) | | | .70 | | | | (.84 | ) | | | — | | | | (.84 | ) | | | 21.31 | | | | 3.25 | | | | 658 | | | | .32 | | | | 3.41 | |
| 7/31/2014 | | | 19.64 | | | | .82 | | | | 1.70 | | | | 2.52 | | | | (.71 | ) | | | — | | | | (.71 | ) | | | 21.45 | | | | 13.03 | | | | 567 | | | | .34 | | | | 3.98 | |
| Class R-6: | | | | | | | | | | | | | | | | | | | | | | | | | | | | | | | | | | | | | | | | | | | | | | | | |
| 7/31/2018 | | | 22.88 | | | | .80 | | | | .84 | | | | 1.64 | | | | (.72 | ) | | | (.50 | ) | | | (1.22 | ) | | | 23.30 | | | | 7.31 | | | | 8,478 | | | | .28 | | | | 3.44 | |
| 7/31/2017 | | | 21.71 | | | | .81 | | | | 1.09 | | | | 1.90 | | | | (.73 | ) | | | — | | | | (.73 | ) | | | 22.88 | | | | 8.95 | | | | 6,464 | | | | .28 | | | | 3.68 | |
| 7/31/2016 | | | 21.32 | | | | .72 | | | | .76 | | | | 1.48 | | | | (.72 | ) | | | (.37 | ) | | | (1.09 | ) | | | 21.71 | | | | 7.39 | | | | 4,606 | | | | .28 | | | | 3.49 | |
| 7/31/2015 | | | 21.46 | | | | .75 | | | | (.04 | ) | | | .71 | | | | (.85 | ) | | | — | | | | (.85 | ) | | | 21.32 | | | | 3.30 | | | | 3,176 | | | | .28 | | | | 3.45 | |
| 7/31/2014 | | | 19.65 | | | | .83 | | | | 1.70 | | | | 2.53 | | | | (.72 | ) | | | — | | | | (.72 | ) | | | 21.46 | | | | 13.08 | | | | 2,566 | | | | .29 | | | | 4.03 | |
| | | Year ended July 31 | |
| Portfolio turnover rate for all share classes13 | | 2018 | | 2017 | | 2016 | | 2015 | | 2014 | |
| | | | | | | | | | | | |
| Excluding mortgage dollar roll transactions | | 53% | | 34% | | 39% | | 32% | | Not available | |
| Including mortgage dollar roll transactions | | 70% | | 42% | | 52% | | 45% | | 39% | |
| 1 | Based on average shares outstanding. |
| 2 | For the year ended July 31, 2014, this column reflects the impact of a corporate action event that resulted in a one-time increase to net investment income. If the corporate action event had not occurred, the Class A net investment income per share would have been lower by $.11; the Class A ratio of expenses to average net assets would have been lower by .01 percentage points; and the Class A ratio of net income to average net assets would have been lower by .51 percentage points. The impact to the other share classes would have been similar. |
| 3 | Total returns exclude any applicable sales charges, including contingent deferred sales charges. |
| 4 | All or a significant portion of assets in this class consisted of seed capital invested by CRMC and/or its affiliates. Fees for distribution services are not charged or accrued on these seed capital assets. If such fees were paid by the fund on seed capital assets, fund expenses would have been higher and net income and total return would have been lower. |
| 5 | Amount less than $1 million. |
| 6 | Based on operations for a period that is less than a full year. |
| 7 | Class T and 529-T shares began investment operations on April 7, 2017. |
| 8 | Not annualized. |
| 9 | Class F-3 shares began investment operations on January 27, 2017. |
| 10 | Annualized. |
| 11 | Class R-2E shares began investment operations on August 29, 2014. |
| 12 | Class R-5E shares began investment operations on November 20, 2015. |
| 13 | Refer to Note 5 for more information on mortgage dollar rolls. |
See Notes to Financial Statements
| The Income Fund of America | 33 |
Report of Independent Registered Public Accounting Firm
To the Shareholders and Board of Trustees of The Income Fund of America:
Opinion on the Financial Statements and Financial Highlights
We have audited the accompanying statement of assets and liabilities of The Income Fund of America (the “Fund”), including the summary investment portfolio, as of July 31, 2018, the related statement of operations for the year then ended, the statements of changes in net assets for each of the two years in the period then ended, the financial highlights for each of the five years in the period then ended, and the related notes. In our opinion, the financial statements and financial highlights present fairly, in all material respects, the financial position of the Fund as of July 31, 2018, and the results of its operations for the year then ended, the changes in its net assets for each of the two years in the period then ended, and the financial highlights for each of the five years in the period then ended, in conformity with accounting principles generally accepted in the United States of America.
Basis for Opinion
These financial statements and financial highlights are the responsibility of the Fund’s management. Our responsibility is to express an opinion on the Fund’s financial statements and financial highlights based on our audits. We are a public accounting firm registered with the Public Company Accounting Oversight Board (United States) (PCAOB) and are required to be independent with respect to the Fund in accordance with the U.S. federal securities laws and the applicable rules and regulations of the Securities and Exchange Commission and the PCAOB.
We conducted our audits in accordance with the standards of the PCAOB. Those standards require that we plan and perform the audit to obtain reasonable assurance about whether the financial statements and financial highlights are free of material misstatement, whether due to error or fraud. The Fund is not required to have, nor were we engaged to perform, an audit of its internal control over financial reporting. As part of our audits we are required to obtain an understanding of internal control over financial reporting but not for the purpose of expressing an opinion on the effectiveness of the Fund’s internal control over financial reporting. Accordingly, we express no such opinion.
Our audits included performing procedures to assess the risks of material misstatement of the financial statements and financial highlights, whether due to error or fraud, and performing procedures that respond to those risks. Such procedures included examining, on a test basis, evidence regarding the amounts and disclosures in the financial statements and financial highlights. Our audits also included evaluating the accounting principles used and significant estimates made by management, as well as evaluating the overall presentation of the financial statements and financial highlights. Our procedures included confirmation of securities owned as of July 31, 2018, by correspondence with the custodian and brokers; when replies were not received from brokers, we performed other auditing procedures. We believe that our audits provide a reasonable basis for our opinion.
Deloitte & Touche LLP
Costa Mesa, California
September 10, 2018
We have served as the auditor of one or more American Funds investment companies since 1956.
| 34 | The Income Fund of America |
As a fund shareholder, you incur two types of costs: (1) transaction costs, such as initial sales charges on purchase payments and contingent deferred sales charges on redemptions (loads), and (2) ongoing costs, including management fees, distribution and service (12b-1) fees, and other expenses. This example is intended to help you understand your ongoing costs (in dollars) of investing in the fund so you can compare these costs with the ongoing costs of investing in other mutual funds. The example is based on an investment of $1,000 invested at the beginning of the period and held for the entire six-month period (February 1, 2018, through July 31, 2018).
Actual expenses:
The first line of each share class in the table on the following page provides information about actual account values and actual expenses. You may use the information in this line, together with the amount you invested, to estimate the expenses that you paid over the period. Simply divide your account value by $1,000 (for example, an $8,600 account value divided by $1,000 = 8.6), then multiply the result by the number in the first line under the heading titled “Expenses paid during period” to estimate the expenses you paid on your account during this period.
Hypothetical example for comparison purposes:
The second line of each share class in the table on the following page provides information about hypothetical account values and hypothetical expenses based on the actual expense ratio for the share class and an assumed rate of return of 5.00% per year before expenses, which is not the actual return of the share class. The hypothetical account values and expenses may not be used to estimate the actual ending account balance or expenses you paid for the period. You may use this information to compare the ongoing costs of investing in the fund and other funds. To do so, compare this 5.00% hypothetical example with the 5.00% hypothetical examples that appear in the shareholder reports of the other funds.
Notes:
Retirement plan participants may be subject to certain fees charged by the plan sponsor, and Class F-1, F-2, F-3 and 529-F-1 shareholders may be subject to fees charged by financial intermediaries, typically ranging from 0.75% to 1.50% of assets annually depending on services offered. You can estimate the impact of these fees by adding the amount of the fees to the total estimated expenses you paid on your account during the period as calculated above. In addition, your ending account value would be lower by the amount of these fees.
Note that the expenses shown in the table on the following page are meant to highlight your ongoing costs only and do not reflect any transactional costs, such as sales charges (loads). Therefore, the second line of each share class in the table is useful in comparing ongoing costs only and will not help you determine the relative total costs of owning different funds. In addition, if these transactional costs were included, your costs would have been higher.
| The Income Fund of America | 35 |
| | | Beginning
account value
2/1/2018 | | | Ending
account value
7/31/2018 | | | Expenses paid
during period* | | | Annualized
expense ratio | |
| Class A – actual return | | $ | 1,000.00 | | | $ | 980.69 | | | $ | 2.70 | | | | .55 | % |
| Class A – assumed 5% return | | | 1,000.00 | | | | 1,022.07 | | | | 2.76 | | | | .55 | |
| Class C – actual return | | | 1,000.00 | | | | 976.93 | | | | 6.62 | | | | 1.35 | |
| Class C – assumed 5% return | | | 1,000.00 | | | | 1,018.10 | | | | 6.76 | | | | 1.35 | |
| Class T – actual return | | | 1,000.00 | | | | 981.67 | | | | 1.72 | | | | .35 | |
| Class T – assumed 5% return | | | 1,000.00 | | | | 1,023.06 | | | | 1.76 | | | | .35 | |
| Class F-1 – actual return | | | 1,000.00 | | | | 980.19 | | | | 3.19 | | | | .65 | |
| Class F-1 – assumed 5% return | | | 1,000.00 | | | | 1,021.57 | | | | 3.26 | | | | .65 | |
| Class F-2 – actual return | | | 1,000.00 | | | | 981.48 | | | | 1.87 | | | | .38 | |
| Class F-2 – assumed 5% return | | | 1,000.00 | | | | 1,022.91 | | | | 1.91 | | | | .38 | |
| Class F-3 – actual return | | | 1,000.00 | | | | 981.97 | | | | 1.43 | | | | .29 | |
| Class F-3 – assumed 5% return | | | 1,000.00 | | | | 1,023.36 | | | | 1.45 | | | | .29 | |
| Class 529-A – actual return | | | 1,000.00 | | | | 980.24 | | | | 3.14 | | | | .64 | |
| Class 529-A – assumed 5% return | | | 1,000.00 | | | | 1,021.62 | | | | 3.21 | | | | .64 | |
| Class 529-C – actual return | | | 1,000.00 | | | | 976.33 | | | | 6.86 | | | | 1.40 | |
| Class 529-C – assumed 5% return | | | 1,000.00 | | | | 1,017.85 | | | | 7.00 | | | | 1.40 | |
| Class 529-E – actual return | | | 1,000.00 | | | | 979.02 | | | | 4.27 | | | | .87 | |
| Class 529-E – assumed 5% return | | | 1,000.00 | | | | 1,020.48 | | | | 4.36 | | | | .87 | |
| Class 529-T – actual return | | | 1,000.00 | | | | 981.37 | | | | 2.06 | | | | .42 | |
| Class 529-T – assumed 5% return | | | 1,000.00 | | | | 1,022.71 | | | | 2.11 | | | | .42 | |
| Class 529-F-1 – actual return | | | 1,000.00 | | | | 981.37 | | | | 1.97 | | | | .40 | |
| Class 529-F-1 – assumed 5% return | | | 1,000.00 | | | | 1,022.81 | | | | 2.01 | | | | .40 | |
| Class R-1 – actual return | | | 1,000.00 | | | | 976.87 | | | | 6.76 | | | | 1.38 | |
| Class R-1 – assumed 5% return | | | 1,000.00 | | | | 1,017.95 | | | | 6.90 | | | | 1.38 | |
| Class R-2 – actual return | | | 1,000.00 | | | | 976.91 | | | | 6.72 | | | | 1.37 | |
| Class R-2 – assumed 5% return | | | 1,000.00 | | | | 1,018.00 | | | | 6.85 | | | | 1.37 | |
| Class R-2E – actual return | | | 1,000.00 | | | | 978.10 | | | | 5.35 | | | | 1.09 | |
| Class R-2E – assumed 5% return | | | 1,000.00 | | | | 1,019.39 | | | | 5.46 | | | | 1.09 | |
| Class R-3 – actual return | | | 1,000.00 | | | | 978.76 | | | | 4.56 | | | | .93 | |
| Class R-3 – assumed 5% return | | | 1,000.00 | | | | 1,020.18 | | | | 4.66 | | | | .93 | |
| Class R-4 – actual return | | | 1,000.00 | | | | 980.24 | | | | 3.09 | | | | .63 | |
| Class R-4 – assumed 5% return | | | 1,000.00 | | | | 1,021.67 | | | | 3.16 | | | | .63 | |
| Class R-5E – actual return | | | 1,000.00 | | | | 981.36 | | | | 2.06 | | | | .42 | |
| Class R-5E – assumed 5% return | | | 1,000.00 | | | | 1,022.71 | | | | 2.11 | | | | .42 | |
| Class R-5 – actual return | | | 1,000.00 | | | | 981.37 | | | | 1.62 | | | | .33 | |
| Class R-5 – assumed 5% return | | | 1,000.00 | | | | 1,023.16 | | | | 1.66 | | | | .33 | |
| Class R-6 – actual return | | | 1,000.00 | | | | 982.03 | | | | 1.38 | | | | .28 | |
| Class R-6 – assumed 5% return | | | 1,000.00 | | | | 1,023.41 | | | | 1.40 | | | | .28 | |
| * | The “expenses paid during period” are equal to the “annualized expense ratio,” multiplied by the average account value over the period, multiplied by the number of days in the period, and divided by 365 (to reflect the one-half year period). |
| 36 | The Income Fund of America |
We are required to advise you of the federal tax status of certain distributions received by shareholders during the fiscal year. The fund hereby designates the following amounts for the fund’s fiscal year ended July 31, 2018:
| Long-term capital gains | | $ | 2,575,578,000 | |
| Qualified dividend income | | $ | 2,626,489,000 | |
| Corporate dividends received deduction | | $ | 1,589,813,000 | |
| U.S. government income that may be exempt from state taxation | | $ | 269,525,000 | |
Individual shareholders should refer to their Form 1099 or other tax information, which will be mailed in January 2019, to determine the calendar year amounts to be included on their 2018 tax returns. Shareholders should consult their tax advisors.
| The Income Fund of America | 37 |
This page was intentionally left blank.
| 38 | The Income Fund of America |
This page was intentionally left blank.
| The Income Fund of America | 39 |
This page was intentionally left blank.
| 40 | The Income Fund of America |
This page was intentionally left blank.
| The Income Fund of America | 41 |
This page was intentionally left blank.
| 42 | The Income Fund of America |
Board of trustees and other officers
Independent trustees1
| Name and year of birth | | Year first
elected
a trustee
of the fund2 | | Principal occupation(s) during past five years | | Number of
portfolios in fund
complex overseen
by trustee3 | | Other directorships4
held by trustee |
| William H. Baribault, 1945 | | 2012 | | CEO and President, Richard Nixon Foundation; Chairman of the Board and CEO, Oakwood Enterprises (private investment and consulting) | | 81 | | General Finance Corporation |
| Vanessa C. L. Chang, 1952 | | 2012 | | Former Director, EL & EL Investments (real estate) | | 17 | | Edison International; Sykes Enterprises; Transocean Ltd. |
| Linda Griego, 1947 | | 2012 | | President and CEO, Griego Enterprises, Inc. (business management company) | | 7 | | AECOM Technology Corporation;
CBS Corporation |
| Leonade D. Jones, 1947 | | 1993 | | Retired; former Treasurer, The Washington Post Company (retired 1996) | | 10 | | None |
| William D. Jones, 1955 | | 2008 | | Real estate developer/owner, President and CEO, CityLink Investment Corporation (acquires, develops and manages real estate ventures in urban communities) and City Scene Management Company (provides commercial asset management services) | | 8 | | Sempra Energy |
| James J. Postl, 1946 | | 2008 | | Retired; former President and CEO, Pennzoil-Quaker State Company (automotive products and services) (retired 2002) | | 4 | | None |
| Margaret Spellings, 1957 | | 2012 | | President, The University of North Carolina; former President, George W. Bush Foundation; former President and CEO, Margaret Spellings & Company (public policy and strategic consulting); former President, U.S. Chamber Foundation and Senior Advisor to the President and CEO, U.S. Chamber of Commerce | | 83 | | None |
Isaac Stein, 1946
Chairman of the Board
(Independent and Non-Executive) | | 2004 | | Private investor; former President, Waverley Associates (private investment fund); Chairman Emeritus of the Board of Trustees, Stanford University | | 4 | | None |
| | | | | | | | | |
| Interested trustee5,6 | | | | | | |
| | | | | | | |
Name, year of birth
and position with fund | | Year first
elected
a trustee
or officer
of the fund2 | | Principal occupation(s) during past five years
and positions held with affiliated entities or
the principal underwriter of the fund | |
Number of
portfolios in fund
complex overseen
by trustee3 | | Other directorships4
held by trustee |
Hilda L. Applbaum, 1961
President and Trustee | | 1998 | | Partner — Capital World Investors, Capital Research and Management Company | | 1 | | None |
The fund’s statement of additional information includes further details about fund trustees and is available without charge upon request by calling American Funds Service Company at (800) 421-4225 or by visiting the American Funds website at americanfunds.com. The address for all trustees and officers of the fund is 333 South Hope Street, Los Angeles, CA 90071, Attention: Secretary.
See page 44 for footnotes.
| The Income Fund of America | 43 |
Other officers6
Name, year of birth
and position with fund | | Year first
elected
an officer
of the fund2 | | Principal occupation(s) during past five years and positions held with affiliated entities
or the principal underwriter of the fund |
Andrew B. Suzman, 1967
President | | 2004 | | Partner — Capital World Investors, Capital Research and Management Company;
Director, The Capital Group Companies, Inc.7 |
Dina N. Perry, 1945
Senior Vice President | | 1994 | | Partner — Capital World Investors, Capital Research and Management Company;
Director, The Capital Group Companies, Inc.7 |
Paul F. Roye, 1953
Senior Vice President | | 2007 | | Director, Capital Research and Management Company;
Senior Vice President and Senior Counsel — Fund Business Management Group,
Capital Research and Management Company |
Paul Flynn, 1966
Vice President | | 2017 | | Partner — Capital World Investors, Capital International Sàrl7 |
Joanna F. Jonsson, 1963
Vice President | | 2006 | | Partner — Capital World Investors, Capital Research and Management Company;
Director, Capital Research and Management Company;
Partner — Capital World Investors, Capital Bank and Trust Company7 |
Donald H. Rolfe, 1972
Executive Vice President | | 2012 | | Senior Vice President and Senior Counsel — Fund Business Management Group,
Capital Research and Management Company |
Anirudh Samsi, 1971
Vice President | | 2016 | | Partner — Capital World Investors, Capital Research and Management Company |
John H. Smet, 1956
Vice President | | 1994 | | Partner — Capital Fixed Income Investors, Capital Research and Management Company;
Director, Capital Research and Management Company |
Michael W. Stockton, 1967
Secretary | | 2014 | | Vice President — Fund Business Management Group, Capital Research and Management Company |
Hong T. Le, 1978
Treasurer | | 2016 | | Assistant Vice President — Investment Operations, Capital Research and Management Company;
Assistant Vice President, Capital Bank and Trust Company7 |
Courtney R. Taylor, 1975
Assistant Secretary | | 2018 | | Assistant Vice President — Fund Business Management Group, Capital Research and
Management Company; Secretary, Capital Guardian Trust Company7 |
Brian C. Janssen, 1972
Assistant Treasurer | | 2016 | | Vice President — Investment Operations, Capital Research and Management Company |
Dori Laskin, 1951
Assistant Treasurer | | 2011 | | Vice President — Investment Operations, Capital Research and Management Company |
| 1 | The term independent trustee refers to a trustee who is not an “interested person” of the fund within the meaning of the Investment Company Act of 1940. |
| 2 | Trustees and officers of the fund serve until their resignation, removal or retirement. |
| 3 | Funds managed by Capital Research and Management Company or its affiliates. |
| 4 | This includes all directorships/trusteeships (other than those in the American Funds or other funds managed by Capital Research and Management Company or its affiliates) that are held by each trustee as a trustee or director of a public company or a registered investment company. |
| 5 | The term interested trustee refers to a trustee who is an “interested person” within the meaning of the Investment Company Act of 1940, on the basis of their affiliation with the fund’s investment adviser, Capital Research and Management Company, or affiliated entities (including the fund’s principal underwriter). |
| 6 | All of the trustees and/or officers listed are officers and/or directors/trustees of one or more of the other funds for which Capital Research and Management Company serves as investment adviser. |
| 7 | Company affiliated with Capital Research and Management Company. |
| 44 | The Income Fund of America |
Office of the fund
6455 Irvine Center Drive
Irvine, CA 92618-4518
Investment adviser
Capital Research and Management Company
333 South Hope Street
Los Angeles, CA 90071-1406
6455 Irvine Center Drive
Irvine, CA 92618
Transfer agent for shareholder accounts
American Funds Service Company
(Write to the address near you.)
P.O. Box 6007
Indianapolis, IN 46206-6007
P.O. Box 2280
Norfolk, VA 23501-2280
Custodian of assets
JPMorgan Chase Bank
270 Park Avenue
New York, NY 10017-2070
Counsel
Morgan, Lewis & Bockius LLP
355 South Grand Avenue, 22nd Floor
Los Angeles, CA 90071-3132
Independent registered public accounting firm
Deloitte & Touche LLP
695 Town Center Drive
Suite 1200
Costa Mesa, CA 92626-7188
Principal underwriter
American Funds Distributors, Inc.
333 South Hope Street
Los Angeles, CA 90071-1406
Investors should carefully consider investment objectives, risks, charges and expenses. This and other important information is contained in the fund prospectus and summary prospectus, which can be obtained from your financial professional and should be read carefully before investing. You may also call American Funds Service Company (AFS) at (800) 421-4225 or visit the American Funds website at americanfunds.com. Fund shares offered through American Funds Distributors, Inc. Securities offered through American Funds Distributors, Inc.
“American Funds Proxy Voting Procedures and Principles” — which describes how we vote proxies relating to portfolio securities — is available on the American Funds website or upon request by calling AFS. The fund files its proxy voting record with the U.S. Securities and Exchange Commission (SEC) for the 12 months ended June 30 by August 31. The proxy voting record is available free of charge on the SEC website at sec.gov and on the American Funds website.
A complete July 31, 2018, portfolio of The Income Fund of America’s investments is available free of charge by calling AFS or visiting the SEC website (where it is part of Form N-CSR).
The Income Fund of America files a complete list of its portfolio holdings with the SEC for the first and third quarters of each fiscal year on Form N-Q. This filing is available free of charge on the SEC website. You may also review or, for a fee, copy this filing at the SEC’s Public Reference Room in Washington, D.C. Additional information regarding the operation of the Public Reference Room may be obtained by calling the SEC’s Office of Investor Education and Advocacy at (800) SEC-0330. Additionally, the list of portfolio holdings is available by calling AFS.
This report is for the information of shareholders of The Income Fund of America, but it also may be used as sales literature when preceded or accompanied by the current prospectus or summary prospectus, which gives details about charges, expenses, investment objectives and operating policies of the fund. If used as sales material after September 30, 2018, this report must be accompanied by an American Funds statistical update for the most recently completed calendar quarter.
Bloomberg® is a trademark of Bloomberg Finance L.P. (collectively with its affiliates, “Bloomberg”). Barclays® is a trademark of Barclays Bank Plc (collectively with its affiliates, “Barclays”), used under license. Neither Bloomberg nor Barclays approves or endorses this material, guarantees the accuracy or completeness of any information herein and, to the maximum extent allowed by law, neither shall have any liability or responsibility for injury or damages arising in connection therewith.
The Standard & Poor’s 500 Composite Index is a product of S&P Dow Jones Indices LLC and/or its affiliates and has been licensed for use by Capital Group. Copyright © 2018 S&P Dow Jones Indices LLC, a division of S&P Global, and/or its affiliates. All rights reserved. Redistribution or reproduction in whole or in part are prohibited without written permission of S&P Dow Jones Indices LLC.
The Capital Advantage®
Since 1931, American Funds, part of Capital Group, has helped investors pursue long-term investment success. Our consistent approach — in combination with The Capital SystemSM — has resulted in a superior long-term track record.
| | Aligned with investor success |
| | We base our decisions on a long-term perspective, which we believe aligns our goals with the interests of our clients. Our portfolio managers average 27 years of investment experience, including 22 years at our company, reflecting a career commitment to our long-term approach.1 |
| | |
| | The Capital System |
| | The Capital System combines individual accountability with teamwork. Funds using The Capital System are divided into portions that are managed independently by investment professionals with diverse backgrounds, ages and investment approaches. An extensive global research effort is the backbone of our system. |
| | |
| | American Funds’ superior long-term track record |
| | Equity funds have beaten their Lipper peer indexes in 92% of 10-year periods and 99% of 20-year periods. Fixed income funds have beaten their Lipper indexes in 77% of 10-year periods and 80% of 20-year periods.2 Fund management fees have been among the lowest in the industry.3 |
| | 1 | Portfolio manager experience as of December 31, 2017. |
| | 2 | Based on Class F-2 share results for rolling periods through December 31, 2017. Periods covered are the shorter of the fund’s lifetime or since the comparable Lipper index inception date (except Capital Income Builder and SMALLCAP World Fund, for which the Lipper average was used). Expenses differ for each share class, so results will vary. Class F-2 shares were first offered on August 1, 2008. Class F-2 share results prior to the date of first sale are hypothetical based on Class A share results without a sales charge, adjusted for typical estimated expenses. Results for certain funds with an inception date after August 1, 2008, also include hypothetical returns because those funds’ Class F-2 shares sold after the funds’ date of first offering. Please see americanfunds.com for more information on specific expense adjustments and the actual dates of first sale. |
| | 3 | On average, our management fees were in the lowest quintile 71% of the time, based on the 20-year period ended December 31, 2017, versus comparable Lipper categories, excluding funds of funds. |

ITEM 2 – Code of Ethics
The Registrant has adopted a Code of Ethics that applies to its Principal Executive Officer and Principal Financial Officer. The Registrant undertakes to provide to any person without charge, upon request, a copy of the Code of Ethics. Such request can be made by calling 800/421-4225 or to the Secretary of the Registrant, 6455 Irvine Center Drive, Irvine, California 92618.
ITEM 3 – Audit Committee Financial Expert
The Registrant’s board has determined that Vanessa C. L. Chang, a member of the Registrant’s audit committee, is an “audit committee financial expert” and "independent," as such terms are defined in this Item. This designation will not increase the designee’s duties, obligations or liability as compared to his or her duties, obligations and liability as a member of the audit committee and of the board, nor will it reduce the responsibility of the other audit committee members. There may be other individuals who, through education or experience, would qualify as "audit committee financial experts" if the board had designated them as such. Most importantly, the board believes each member of the audit committee contributes significantly to the effective oversight of the Registrant’s financial statements and condition.
| ITEM 4 – Principal Accountant Fees and Services | IFA |
| | | |
| Registrant: | |
| a) Audit Fees: |
| | | |
| | 2017 | $184,000 |
| | 2018 | $174,000 |
| | |
| b) Audit-Related Fees: |
| | 2017 | $30,000 |
| | 2018 | $29,000 |
| | |
| c) Tax Fees: |
| | 2017 | $11,000 |
| | 2018 | $10,000 |
| | The tax fees consist of professional services relating to the preparation of the Registrant’s tax returns. |
| | |
| d) All Other Fees: |
| | 2017 | None |
| | 2018 | None |
| | |
| | Adviser and affiliates (includes only fees for non-audit services billed to the adviser and affiliates for engagements that relate directly to the operations and financial reporting of the Registrant and were subject to the pre-approval policies described below): |
| a) Audit Fees: |
| | Not Applicable |
| | |
| b) Audit-Related Fees: |
| | 2017 | $1,205,000 |
| | 2018 | $758,000 |
| | The audit-related fees consist of assurance and related services relating to the examination of the Registrant’s transfer agent, principal underwriter and investment adviser conducted in accordance with Statement on Standards for Attestation Engagements Number 16 issued by the American Institute of Certified Public Accountants. |
| | |
| c) Tax Fees: |
| | 2017 | None |
| | 2018 | None |
| | The tax fees consist of consulting services relating to the Registrant’s investments. |
| | | |
| | | |
| d) All Other Fees: |
| | 2017 | None |
| | 2018 | None |
| | The other fees consist of subscription services related to an accounting research tool. |
| | |
| | | |
| | All audit and permissible non-audit services that the Registrant’s audit committee considers compatible with maintaining the independent registered public accounting firm’s independence are required to be pre-approved by the committee. The pre-approval requirement will extend to all non-audit services provided to the Registrant, the investment adviser, and any entity controlling, controlled by, or under common control with the investment adviser that provides ongoing services to the Registrant, if the engagement relates directly to the operations and financial reporting of the Registrant. The committee will not delegate its responsibility to pre-approve these services to the investment adviser. The committee may delegate to one or more committee members the authority to review and pre-approve audit and permissible non-audit services. Actions taken under any such delegation will be reported to the full committee at its next meeting. The pre-approval requirement is waived with respect to non-audit services if certain conditions are met. The pre-approval requirement was not waived for any of the non-audit services listed above provided to the Registrant, adviser and affiliates. |
| | | |
| | Aggregate non-audit fees paid to the Registrant’s auditors, including fees for all services billed to the Registrant, adviser and affiliates that provide ongoing services to the Registrant, were $1,388,000 for fiscal year 2017 and $928,000 for fiscal year 2018. The non-audit services represented by these amounts were brought to the attention of the committee and considered to be compatible with maintaining the auditors’ independence. |
ITEM 5 – Audit Committee of Listed Registrants
Not applicable to this Registrant, insofar as the Registrant is not a listed issuer as defined in Rule 10A-3 under the Securities Exchange Act of 1934.
ITEM 6 – Schedule of Investments
The Income Fund of America®
Investment portfolio
July 31, 2018
Common stocks 65.99%
Financials 8.66% | Shares | Value
(000) |
| CME Group Inc., Class A | 10,140,400 | $1,613,541 |
| JPMorgan Chase & Co. | 13,574,539 | 1,560,393 |
| Wells Fargo & Co. | 27,158,053 | 1,555,885 |
| HSBC Holdings PLC (GBP denominated) | 78,123,069 | 749,058 |
| Blackstone Group LP | 13,170,000 | 459,896 |
| ABN AMRO Group NV, depository receipts | 14,876,000 | 412,268 |
| B3 SA - Brasil, Bolsa, Balcao | 63,238,000 | 400,829 |
| T. Rowe Price Group, Inc. | 3,000,000 | 357,240 |
| Apollo Global Management, LLC, Class A | 9,074,700 | 322,152 |
| BNP Paribas SA | 4,742,000 | 308,693 |
| Umpqua Holdings Corp. | 9,625,000 | 205,013 |
| Danske Bank AS | 6,955,000 | 202,182 |
| PacWest Bancorp | 3,669,000 | 184,257 |
| Société Générale | 3,930,000 | 175,136 |
| AXA SA | 6,685,000 | 168,850 |
| Banco Santander, SA | 29,000,000 | 163,435 |
| Aviva PLC | 24,555,000 | 161,148 |
| Toronto-Dominion Bank (CAD denominated) | 2,089,000 | 123,925 |
| SunTrust Banks, Inc. | 1,585,903 | 114,296 |
| Svenska Handelsbanken AB, Class A | 5,236,729 | 64,708 |
| Absa Group Ltd. | 4,900,000 | 63,965 |
| BlackRock, Inc. | 100,000 | 50,276 |
| The Bank of N.T. Butterfield & Son Ltd. | 800,000 | 39,568 |
| Aozora Bank, Ltd. | 780,600 | 29,146 |
| Itaú Unibanco Holding SA, preferred nominative | 2,235,000 | 26,796 |
| | | 9,512,656 |
| Energy 6.87% | | |
| Chevron Corp. | 12,904,500 | 1,629,451 |
| Royal Dutch Shell PLC, Class B (ADR) | 11,771,000 | 836,212 |
| Royal Dutch Shell PLC, Class B | 21,474,147 | 752,986 |
| Royal Dutch Shell PLC, Class A (GBP denominated) | 28,526 | 979 |
| Royal Dutch Shell PLC, Class A (ADR) | 1,215 | 83 |
| Occidental Petroleum Corp. | 13,738,000 | 1,153,030 |
| Enbridge Inc. | 23,589,090 | 835,762 |
| Enbridge Inc. (CAD denominated) | 1,599,629 | 56,811 |
| BP PLC | 104,119,900 | 783,486 |
| ConocoPhillips | 7,150,000 | 516,015 |
| Helmerich & Payne, Inc. | 5,000,000 | 306,750 |
| Schlumberger Ltd. | 3,982,000 | 268,865 |
| Baker Hughes, a GE Co., Class A | 4,500,000 | 155,610 |
| Keyera Corp. | 5,190,000 | 150,252 |
| Ascent Resources - Utica, LLC, Class A1,2,3,4,5 | 110,214,618 | 35,269 |
| Phillips 66 | 240,000 | 29,602 |
| Southwestern Energy Co.4 | 4,817,331 | 24,761 |
The Income Fund of America — Page 1 of 37
Common stocks
Energy (continued) | Shares | Value
(000) |
| White Star Petroleum Corp., Class A1,2,3,4,5 | 6,511,401 | $4,428 |
| Peyto Exploration & Development Corp. | 400,000 | 3,296 |
| | | 7,543,648 |
| Information technology 6.85% | | |
| Microsoft Corp. | 27,664,154 | 2,934,613 |
| Intel Corp. | 41,503,100 | 1,996,299 |
| Taiwan Semiconductor Manufacturing Co., Ltd. | 132,903,000 | 1,067,947 |
| Taiwan Semiconductor Manufacturing Co., Ltd. (ADR) | 1,996,470 | 82,275 |
| QUALCOMM Inc. | 6,568,200 | 420,956 |
| Paychex, Inc. | 4,770,000 | 329,225 |
| Texas Instruments Inc. | 2,900,000 | 322,828 |
| International Business Machines Corp. | 1,500,000 | 217,395 |
| Vanguard International Semiconductor Corp. | 50,830,886 | 129,510 |
| Versum Materials, Inc. | 661,943 | 25,518 |
| Corporate Risk Holdings I, Inc.1,2,3,4 | 2,205,215 | 1,544 |
| Corporate Risk Holdings Corp.2,3,4,5 | 11,149 | —6 |
| | | 7,528,110 |
| Health care 6.61% | | |
| Merck & Co., Inc. | 34,490,159 | 2,271,867 |
| AstraZeneca PLC | 18,921,277 | 1,456,580 |
| Pfizer Inc. | 31,724,300 | 1,266,751 |
| GlaxoSmithKline PLC | 52,391,000 | 1,087,600 |
| Bristol-Myers Squibb Co. | 7,520,500 | 441,829 |
| Gilead Sciences, Inc. | 4,750,000 | 369,693 |
| Novartis AG | 2,316,000 | 194,702 |
| Sanofi | 1,460,000 | 126,968 |
| AbbVie Inc. | 522,000 | 48,144 |
| Rotech Healthcare Inc.1,2,3,4,5 | 543,172 | 1,086 |
| | | 7,265,220 |
| Industrials 6.40% | | |
| Lockheed Martin Corp. | 4,405,400 | 1,436,601 |
| BAE Systems PLC | 140,126,776 | 1,201,388 |
| Emerson Electric Co. | 8,800,000 | 636,064 |
| Boeing Co. | 1,755,479 | 625,477 |
| Caterpillar Inc. | 3,784,800 | 544,254 |
| Edenred SA1 | 12,231,900 | 481,595 |
| Hubbell Inc.1 | 3,430,000 | 422,747 |
| International Consolidated Airlines Group, SA (CDI) | 39,520,000 | 368,291 |
| Norfolk Southern Corp. | 1,600,000 | 270,400 |
| Siemens AG | 1,518,000 | 214,358 |
| ACS, Actividades de Construcción y Servicios, SA | 3,887,371 | 170,555 |
| General Electric Co. | 10,355,000 | 141,139 |
| Sandvik AB | 7,408,000 | 135,515 |
| KONE OYJ, Class B | 2,340,000 | 128,030 |
| PACCAR Inc. | 1,314,040 | 86,359 |
| Douglas Dynamics, Inc.1 | 1,300,000 | 63,830 |
| Waste Management, Inc. | 531,128 | 47,801 |
| R.R. Donnelley & Sons Co.1 | 4,319,407 | 25,484 |
| CEVA Logistics AG2,4,7 | 846,991 | 17,117 |
The Income Fund of America — Page 2 of 37
Common stocks
Industrials (continued) | Shares | Value
(000) |
| LSC Communications, Inc. | 562,826 | $8,454 |
| Ply Gem Parent, LLC, Class B2,4 | 838 | 111 |
| | | 7,025,570 |
| Materials 5.56% | | |
| DowDuPont Inc. | 25,585,269 | 1,759,499 |
| WestRock Co.1 | 14,266,832 | 827,191 |
| LyondellBasell Industries NV | 7,135,000 | 790,487 |
| BASF SE | 5,150,000 | 494,780 |
| BHP Billiton PLC | 19,000,000 | 437,570 |
| Rio Tinto PLC | 7,890,000 | 434,590 |
| Boral Ltd.1 | 76,201,575 | 376,483 |
| CF Industries Holdings, Inc. | 8,232,700 | 365,696 |
| Air Products and Chemicals, Inc. | 2,011,486 | 330,226 |
| Vale SA, ordinary nominative (ADR) | 7,993,363 | 117,183 |
| Vale SA, ordinary nominative | 5,418,360 | 79,168 |
| Akzo Nobel NV | 1,062,000 | 98,230 |
| | | 6,111,103 |
| Consumer staples 5.52% | | |
| Coca-Cola Co. | 33,420,000 | 1,558,374 |
| Philip Morris International Inc. | 9,588,700 | 827,505 |
| Procter & Gamble Co. | 8,200,000 | 663,216 |
| Kellogg Co. | 8,059,000 | 572,431 |
| Altria Group, Inc. | 9,689,097 | 568,556 |
| British American Tobacco PLC | 7,327,000 | 404,012 |
| British American Tobacco PLC (ADR) | 97,000 | 5,314 |
| Unilever PLC | 6,500,000 | 371,550 |
| Nestlé SA | 4,237,617 | 345,378 |
| Hershey Co. | 3,000,000 | 294,630 |
| Costco Wholesale Corp. | 1,000,000 | 218,710 |
| General Mills, Inc. | 4,400,000 | 202,664 |
| Kraft Heinz Co. | 453,209 | 27,306 |
| | | 6,059,646 |
| Consumer discretionary 5.35% | | |
| McDonald’s Corp. | 7,631,600 | 1,202,282 |
| General Motors Co. | 25,455,641 | 965,023 |
| Las Vegas Sands Corp. | 12,382,495 | 890,301 |
| Target Corp. | 9,450,000 | 762,426 |
| Sands China Ltd. | 82,673,800 | 425,532 |
| Nokian Renkaat Oyj1 | 8,447,624 | 366,384 |
| Home Depot, Inc. | 1,724,500 | 340,623 |
| Carnival Corp., units | 4,720,000 | 279,613 |
| Hasbro, Inc. | 2,782,000 | 277,115 |
| Axel Springer SE | 2,292,000 | 171,262 |
| Compass Group PLC | 5,993,692 | 128,980 |
| ProSiebenSat.1 Media SE | 2,115,510 | 57,243 |
| Cumulus Media Inc., Class B2,4 | 223,977 | 3,752 |
| Cumulus Media Inc., Class A2,4 | 184,316 | 3,087 |
| Adelphia Recovery Trust, Series ACC-12,3,4 | 9,913,675 | 5 |
| | | 5,873,628 |
The Income Fund of America — Page 3 of 37
Common stocks
Real estate 4.96% | Shares | Value
(000) |
| Crown Castle International Corp. REIT | 10,237,000 | $1,134,567 |
| Digital Realty Trust, Inc. REIT | 7,975,000 | 968,324 |
| Public Storage REIT | 3,929,500 | 855,963 |
| Iron Mountain Inc. REIT1 | 15,215,400 | 534,213 |
| Simon Property Group, Inc. REIT | 2,957,000 | 521,053 |
| Prologis, Inc. REIT | 5,105,000 | 334,990 |
| Gaming and Leisure Properties, Inc. REIT | 7,268,000 | 263,974 |
| Link Real Estate Investment Trust REIT | 19,651,812 | 194,789 |
| Lamar Advertising Co. REIT, Class A | 2,353,322 | 173,275 |
| American Tower Corp. REIT | 1,007,173 | 149,303 |
| Vornado Realty Trust REIT, Shares of Beneficial Interest | 1,795,000 | 129,096 |
| Redwood Trust, Inc. REIT1 | 5,444,717 | 91,526 |
| OUTFRONT Media Inc. REIT | 2,566,770 | 54,544 |
| Fibra Uno Administración, SA de CV REIT | 27,239,800 | 39,228 |
| | | 5,444,845 |
| Telecommunication services 2.27% | | |
| Verizon Communications Inc. | 31,694,390 | 1,636,698 |
| Advanced Info Service PCL, foreign registered | 42,375,000 | 257,281 |
| Spark New Zealand Ltd. | 69,670,000 | 183,775 |
| AT&T Inc. | 5,700,000 | 182,229 |
| BT Group PLC | 28,248,000 | 86,575 |
| TalkTalk Telecom Group PLC | 45,499,473 | 68,499 |
| HKBN Ltd. | 41,972,000 | 65,025 |
| Mobile TeleSystems PJSC (ADR) | 2,043,000 | 17,917 |
| | | 2,497,999 |
| Utilities 2.18% | | |
| DTE Energy Co. | 7,055,000 | 765,750 |
| Dominion Energy, Inc. | 6,050,000 | 433,845 |
| Duke Energy Corp. | 3,999,999 | 326,480 |
| Power Assets Holdings Ltd. | 37,828,910 | 267,726 |
| Brookfield Infrastructure Partners LP | 4,545,000 | 185,839 |
| EDP - Energias de Portugal, SA | 45,396,105 | 185,210 |
| Guangdong Investment Ltd. | 71,500,000 | 123,159 |
| Enel SPA | 19,244,600 | 107,343 |
| Vistra Energy Corp.4 | 110,235 | 2,491 |
| | | 2,397,843 |
| Miscellaneous 4.76% | | |
| Other common stocks in initial period of acquisition | | 5,224,166 |
| Total common stocks (cost: $53,044,631,000) | | 72,484,434 |
Preferred securities 0.22%
Financials 0.22% | | |
| Citigroup Inc. 8.709% preferred | 2,368,637 | 63,764 |
| Citigroup Inc., Series K, depositary shares | 2,145,767 | 59,609 |
| PNC Financial Services Group, Inc., Series P, noncumulative depositary shares | 2,000,000 | 54,760 |
| Wells Fargo & Co., Class A, Series Q, 5.85% depositary shares preferred noncumulative | 1,263,198 | 32,831 |
| Goldman Sachs Group, Inc., Series J, 5.50% depositary shares | 1,200,000 | 30,840 |
| Total preferred securities (cost: $226,473,000) | | 241,804 |
The Income Fund of America — Page 4 of 37
Rights & warrants 0.00%
Industrials 0.00% | Shares | Value
(000) |
| Associated Materials, LLC, warrants, expire 20232,3,4 | 328,867 | $—6 |
| Miscellaneous 0.00% | | |
| Other rights & warrants in initial period of acquisition | | 1,690 |
| Total rights & warrants (cost: $263,000) | | 1,690 |
Convertible stocks 0.23%
Utilities 0.13% | | |
| Dominion Energy, Inc., Series A units, 6.75% convertible preferred 2019 | 1,740,948 | 83,896 |
| DTE Energy Co., units, 6.50% convertible preferred 2019 | 1,055,000 | 55,673 |
| | | 139,569 |
| Real estate 0.04% | | |
| Crown Castle International Corp. REIT, Series A, 6.875% convertible preferred 2020 | 44,500 | 47,482 |
| Consumer staples 0.03% | | |
| Bunge Ltd. 4.875% convertible preferred | 322,700 | 35,131 |
| Industrials 0.03% | | |
| Associated Materials, LLC, 14.00% convertible preferred 20202,3 | 23,150 | 28,124 |
| | | 28,124 |
| Total convertible stocks (cost: $238,456,000) | | 250,306 |
Convertible bonds 0.39%
Financials 0.19% | Principal amount
(000) | |
| Goldman Sachs, Equity Linked Notes (Sysco Corp.), 4.75% 2019 | $ 3,220 | 203,715 |
| Consumer discretionary 0.00% | | |
| DISH DBS Corp., convertible notes, 3.375% 2026 | 3,750 | 3,416 |
| Miscellaneous 0.20% | | |
| Other convertible bonds in initial period of acquisition | | 223,126 |
| Total convertible bonds (cost: $414,806,000) | | 430,257 |
Bonds, notes & other debt instruments 22.57%
Corporate bonds & notes 11.23%
Financials 2.07% | | |
| ACE INA Holdings Inc. 2.30% 2020 | 4,485 | 4,407 |
| ACE INA Holdings Inc. 2.875% 2022 | 9,345 | 9,170 |
| ACE INA Holdings Inc. 3.35% 2026 | 2,440 | 2,376 |
| ACE INA Holdings Inc. 4.35% 2045 | 510 | 524 |
| Ally Financial Inc. 4.25% 2021 | 24,000 | 24,120 |
| Ally Financial Inc. 5.125% 2024 | 27,700 | 28,358 |
| Ally Financial Inc. 8.00% 2031 | 7,000 | 8,470 |
The Income Fund of America — Page 5 of 37
Bonds, notes & other debt instruments
Corporate bonds & notes (continued)
Financials (continued) | Principal amount
(000) | Value
(000) |
| Ally Financial Inc. 8.00% 2031 | $4,164 | $5,038 |
| American Express Co. 3.375% 2021 | 6,000 | 6,009 |
| American Express Co. 3.00% 2024 | 13,000 | 12,444 |
| American International Group, Inc. 3.90% 2026 | 4,550 | 4,458 |
| American International Group, Inc. 4.20% 2028 | 10,565 | 10,563 |
| American International Group, Inc. 4.80% 2045 | 2,100 | 2,107 |
| American International Group, Inc. 4.75% 2048 | 2,020 | 2,022 |
| Australia & New Zealand Banking Group Ltd. 2.625% 2022 | 10,500 | 10,151 |
| AXA Equitable Holdings, Inc. 3.90% 20237 | 4,650 | 4,623 |
| AXA SA 5.00% 20487 | 4,400 | 4,227 |
| Bank of America Corp. 5.00% 2021 | 3,500 | 3,662 |
| Bank of America Corp. 2.738% 2022 (3-month USD-LIBOR + 0.37% on 1/23/2021)8 | 12,500 | 12,287 |
| Bank of America Corp. 3.499% 2022 (3-month USD-LIBOR + 0.63% on 5/17/2021)8 | 10,000 | 9,993 |
| Bank of America Corp. 2.816% 2023 (3-month USD-LIBOR + 0.93% on 7/21/2022)8 | 10,500 | 10,158 |
| Bank of America Corp. 3.124% 2023 (3-month USD-LIBOR + 1.16% on 1/20/2022)8 | 10,500 | 10,316 |
| Bank of America Corp. 3.55% 2024 (3-month USD-LIBOR + 0.78% on 3/5/2023)8 | 69,563 | 68,794 |
| Bank of America Corp. 3.864% 2024 (3-month USD-LIBOR +0.94% on 7/23/2023)8 | 10,644 | 10,649 |
| Bank of America Corp. 3.366% 2026 (3-month USD-LIBOR + 0.81% on 1/23/2025)8 | 10,000 | 9,664 |
| Bank of America Corp. 3.593% 2028 (3-month USD-LIBOR + 1.37% on 7/21/2027)8 | 20,137 | 19,207 |
| Bank of Nova Scotia 2.50% 2021 | 10,500 | 10,305 |
| BB&T Corp. 2.45% 2020 | 19,000 | 18,831 |
| BB&T Corp. 3.70% 2025 | 11,500 | 11,460 |
| Berkshire Hathaway Inc. 3.125% 2026 | 3,700 | 3,594 |
| Berkshire Hathaway Inc. 4.50% 2043 | 1,800 | 1,900 |
| BNP Paribas 3.50% 20237 | 24,900 | 24,384 |
| BNP Paribas 3.375% 20257 | 18,500 | 17,595 |
| Capital One Financial Corp. 3.45% 2021 | 23,000 | 22,958 |
| Capital One Financial Corp. 4.25% 2025 | 15,500 | 15,602 |
| CIT Group Inc. 3.875% 20199 | 29,440 | 29,536 |
| CIT Group Inc. 4.125% 2021 | 4,375 | 4,380 |
| Citigroup Inc. 2.35% 2021 | 13,000 | 12,595 |
| Citigroup Inc. 2.70% 2021 | 10,500 | 10,297 |
| Citigroup Inc. 2.90% 2021 | 33,830 | 33,168 |
| Citigroup Inc. 3.40% 2021 | 11,770 | 11,764 |
| Citigroup Inc. 2.876% 2023 (3-month USD-LIBOR + 0.95% on 7/24/2022)8 | 11,120 | 10,761 |
| Citigroup Inc. 3.142% 2023 (3-month USD-LIBOR + 0.722% on 1/4/2022)8 | 6,975 | 6,839 |
| Citigroup Inc. 4.044% 2024 (3-month USD-LIBOR + 1.023% on 6/1/2023)8 | 6,630 | 6,672 |
| Citigroup Inc. 3.20% 2026 | 15,096 | 14,152 |
| Citigroup Inc. 4.075% 2029 (3-month USD-LIBOR + 1.192% on 4/23/2028)8 | 8,032 | 7,900 |
| Citigroup Inc. 4.65% 2048 | 8,225 | 8,393 |
| Citigroup Inc., Series A, junior subordinated 5.95% (undated) (3-month USD-LIBOR + 4.068% on 1/30/2023)8 | 13,295 | 13,644 |
| CME Group Inc. 3.75% 2028 | 6,875 | 6,943 |
| CME Group Inc. 4.15% 2048 | 8,300 | 8,521 |
| CNA Financial Corp. 3.95% 2024 | 5,000 | 4,986 |
| Compass Diversified Holdings 8.00% 20267 | 19,675 | 19,281 |
| Cooperatieve Rabobank U.A. 2.75% 2023 | 10,500 | 10,139 |
| Crédit Agricole SA 3.375% 20227 | 7,975 | 7,845 |
| Crédit Agricole SA 3.75% 20237 | 12,500 | 12,329 |
| Credit Suisse Group AG 2.75% 2020 | 18,000 | 17,820 |
| Credit Suisse Group AG 3.45% 2021 | 8,750 | 8,733 |
| Credit Suisse Group AG 2.997% 2023 (3-month USD-LIBOR + 1.20% on 12/14/2022)7,8 | 4,750 | 4,555 |
| Credit Suisse Group AG 3.80% 2023 | 14,925 | 14,811 |
| Credit Suisse Group AG 3.869% 2029 (3-month USD-LIBOR + 1.41% on 1/12/2028)7,8 | 11,005 | 10,533 |
| Danske Bank AS 2.00% 20217 | 8,680 | 8,267 |
The Income Fund of America — Page 6 of 37
Bonds, notes & other debt instruments
Corporate bonds & notes (continued)
Financials (continued) | Principal amount
(000) | Value
(000) |
| Danske Bank AS 2.70% 20227 | $11,565 | $11,217 |
| Danske Bank AS 3.875% 20237 | 10,354 | 10,252 |
| Deutsche Bank AG 2.70% 2020 | 20,000 | 19,552 |
| Deutsche Bank AG 3.95% 2023 | 5,000 | 4,862 |
| Discover Financial Services 3.35% 2023 | 3,675 | 3,578 |
| Ford Motor Credit Co. 3.81% 2024 | 5,533 | 5,365 |
| General Motors Financial Co. 3.45% 2022 | 35,885 | 35,340 |
| General Motors Financial Co. 4.15% 2023 | 8,235 | 8,233 |
| General Motors Financial Co. 4.00% 2026 | 2,000 | 1,902 |
| Goldman Sachs Group, Inc. 2.55% 2019 | 7,865 | 7,828 |
| Goldman Sachs Group, Inc. 2.60% 2020 | 7,900 | 7,823 |
| Goldman Sachs Group, Inc. 2.625% 2021 | 12,000 | 11,770 |
| Goldman Sachs Group, Inc. 5.25% 2021 | 3,000 | 3,144 |
| Goldman Sachs Group, Inc. 5.75% 2022 | 20,000 | 21,374 |
| Goldman Sachs Group, Inc. 2.905% 2023 (3-month USD-LIBOR + 0.99% on 7/24/2022)8 | 35,630 | 34,486 |
| Goldman Sachs Group, Inc. 3.20% 2023 | 28,292 | 27,715 |
| Goldman Sachs Group, Inc. 3.919% 202310 | 1,466 | 1,524 |
| Goldman Sachs Group, Inc. 3.691% 2028 (3-month USD-LIBOR + 1.51% on 6/5/2027)8 | 8,000 | 7,637 |
| Goldman Sachs Group, Inc. 4.223% 2029 (3-month USD-LIBOR + 1.301% on 5/1/2028)8 | 22,764 | 22,561 |
| Groupe BPCE SA 2.75% 20237 | 5,175 | 4,967 |
| Groupe BPCE SA 5.70% 20237 | 21,170 | 22,189 |
| Groupe BPCE SA 5.15% 20247 | 12,085 | 12,350 |
| HSBC Holdings PLC 3.262% 2023 (3-month USD-LIBOR + 1.055% on 3/13/2022)8 | 10,500 | 10,334 |
| HSBC Holdings PLC 3.95% 2024 (3-month USD-LIBOR + 0.987% on 5/18/2023)8 | 8,775 | 8,765 |
| HSBC Holdings PLC 4.25% 2024 | 9,000 | 9,000 |
| HSBC Holdings PLC 4.583% 2029 (3-month USD-LIBOR + 1.535% on 6/19/2028)8 | 13,590 | 13,798 |
| HUB International Ltd., 7.00% 20267 | 12,910 | 12,991 |
| Icahn Enterprises Finance Corp. 6.25% 2022 | 19,625 | 20,054 |
| Intercontinentalexchange, Inc. 2.50% 2018 | 12,000 | 12,004 |
| Intesa Sanpaolo SpA 3.125% 20227 | 11,300 | 10,541 |
| Intesa Sanpaolo SpA 3.375% 20237 | 6,500 | 6,065 |
| Intesa Sanpaolo SpA 5.017% 20247 | 62,010 | 57,319 |
| Intesa Sanpaolo SpA 5.71% 20267 | 19,750 | 18,372 |
| Jefferies Financial Group Inc. 5.50% 2023 | 13,255 | 13,722 |
| JPMorgan Chase & Co. 2.25% 2020 | 10,000 | 9,887 |
| JPMorgan Chase & Co. 2.55% 2020 | 11,150 | 10,980 |
| JPMorgan Chase & Co. 2.40% 2021 | 14,000 | 13,659 |
| JPMorgan Chase & Co. 3.559% 2024 (3-month USD-LIBOR + 0.73% on 4/23/2023)8 | 13,825 | 13,692 |
| JPMorgan Chase & Co. 3.797% 2024 (3-month USD-LIBOR + 0.89% on 7/23/2023)8 | 21,670 | 21,667 |
| JPMorgan Chase & Co. 3.54% 2028 (3-month USD-LIBOR + 1.38% on 5/1/2027)8 | 7,000 | 6,691 |
| JPMorgan Chase & Co. 4.005% 2029 (3-month USD-LIBOR + 1.12% on 4/23/2028)8 | 27,860 | 27,430 |
JPMorgan Chase & Co., Series Z, junior subordinated 5.30% (undated)
(3-month USD-LIBOR + 3.80% on 5/1/2020)8 | 36,425 | 37,153 |
JPMorgan Chase & Co., Series I, junior subordinated 5.809% (undated)
(3-month USD-LIBOR + 3.47% on 10/30/2018)8 | 74,825 | 75,248 |
JPMorgan Chase & Co., Series S, junior subordinated, perpetual, 6.75% (undated)
(3-month USD-LIBOR + 3.78% on 2/1/2024)8 | 25,901 | 28,329 |
| Keybank National Association 3.375% 20237 | 5,000 | 4,964 |
| Liberty Mutual Group Inc. 4.25% 20237 | 4,400 | 4,463 |
| Lloyds Banking Group PLC 3.00% 2022 | 6,000 | 5,872 |
| Lloyds Banking Group PLC 2.907% 2023 (3-month USD-LIBOR + 0.81% on 11/7/2022)8 | 15,500 | 14,830 |
| Lloyds Banking Group PLC 4.582% 2025 | 7,000 | 6,934 |
| Lloyds Banking Group PLC 4.375% 2028 | 3,950 | 3,907 |
| MetLife, Inc. 4.60% 2046 | 2,475 | 2,539 |
The Income Fund of America — Page 7 of 37
Bonds, notes & other debt instruments
Corporate bonds & notes (continued)
Financials (continued) | Principal amount
(000) | Value
(000) |
| Metropolitan Life Global Funding I 2.30% 20197 | $1,350 | $1,347 |
| Metropolitan Life Global Funding I 2.00% 20207 | 5,135 | 5,040 |
| Metropolitan Life Global Funding I 2.50% 20207 | 4,000 | 3,932 |
| Metropolitan Life Global Funding I 2.40% 20217 | 8,050 | 7,885 |
| Metropolitan Life Global Funding I 3.45% 20267 | 2,330 | 2,268 |
| Metropolitan Life Global Funding I 3.00% 20277 | 3,000 | 2,798 |
| Mitsubishi UFJ Financial Group, Inc. 2.19% 2021 | 11,000 | 10,540 |
| Mitsubishi UFJ Financial Group, Inc. 2.665% 2022 | 10,500 | 10,117 |
| Mitsubishi UFJ Financial Group, Inc. 2.998% 2022 | 6,875 | 6,735 |
| Mizuho Financial Group, Ltd. 3.549% 2023 | 21,500 | 21,286 |
| Morgan Stanley 2.50% 2021 | 11,250 | 10,990 |
| Morgan Stanley 2.75% 2022 | 8,850 | 8,588 |
| Morgan Stanley 3.125% 2023 | 44,800 | 43,766 |
| Morgan Stanley 3.737% 2024 (3-month USD-LIBOR + 0.847% on 4/24/2023)8 | 28,620 | 28,463 |
| Morgan Stanley 3.875% 2026 | 11,000 | 10,852 |
| Morgan Stanley 3.625% 2027 | 5,650 | 5,449 |
| National Australia Bank Ltd. 2.50% 2022 | 10,500 | 10,087 |
| National Australia Bank Ltd. 2.875% 2023 | 7,925 | 7,692 |
| Nationwide Building Society 4.363% 2024 (3-month USD-LIBOR + 1.392% on 8/1/2023)7,8 | 10,350 | 10,387 |
| Nationwide Mutual Insurance Co. (3-month USD-LIBOR + 2.29%) 4.631% 20247,10 | 8,150 | 8,150 |
| Navient Corp. 4.875% 2019 | 34,210 | 34,552 |
| Navient Corp. 6.50% 2022 | 10,790 | 11,019 |
| Navient Corp. 5.50% 2023 | 27,480 | 26,965 |
| Navient Corp. 6.125% 2024 | 10,350 | 10,246 |
| New York Life Global Funding 1.95% 20207 | 1,820 | 1,789 |
| New York Life Global Funding 1.70% 20217 | 17,500 | 16,627 |
| New York Life Global Funding 2.30% 20227 | 2,000 | 1,920 |
| New York Life Global Funding 3.00% 20287 | 2,500 | 2,345 |
| PNC Bank 3.50% 2023 | 10,354 | 10,377 |
| PNC Financial Services Group, Inc. 2.854% 20228 | 8,395 | 8,161 |
| PNC Financial Services Group, Inc. 3.90% 2024 | 3,000 | 2,999 |
PNC Financial Services Group, Inc., Series O, junior subordinated 6.75% (undated)
(3-month USD-LIBOR + 3.678% on 8/1/2021)8 | 10,250 | 11,070 |
| PRICOA Global Funding I 2.45% 20227 | 2,490 | 2,381 |
| Principal Financial Group, Inc. 4.111% 20287 | 3,500 | 3,434 |
| Prudential Financial, Inc. 3.50% 2024 | 9,000 | 8,972 |
| Prudential Financial, Inc. 3.878% 2028 | 4,500 | 4,490 |
| Prudential Financial, Inc. 5.625% 2043 (3-month USD-LIBOR + 3.92% on 6/15/2023)8 | 1,850 | 1,927 |
| Prudential Financial, Inc. 3.905% 2047 | 2,975 | 2,767 |
| Rabobank Nederland 2.50% 2021 | 6,525 | 6,402 |
| Rabobank Nederland 2.75% 2022 | 2,825 | 2,762 |
| Rabobank Nederland 4.625% 2023 | 8,000 | 8,137 |
| Rabobank Nederland 4.375% 2025 | 9,000 | 8,931 |
| Royal Bank of Scotland PLC 4.519% 20248 | 8,300 | 8,327 |
| Santander Holdings USA, Inc. 3.70% 2022 | 10,500 | 10,418 |
| Santander Holdings USA, Inc. 3.40% 2023 | 12,500 | 12,193 |
| Skandinaviska Enskilda Banken AB 2.625% 2021 | 10,500 | 10,296 |
| Solenis International, L.P., Term Loan, (3-month USD-LIBOR + 8.50%) 10.679% 20249,10,11 | 5,005 | 4,950 |
| Starwood Property Trust, Inc. 5.00% 2021 | 10,070 | 10,221 |
| Sumitomo Mitsui Banking Corp. 3.102% 2023 | 17,365 | 16,925 |
| Svenska Handelsbanken AB 1.875% 2021 | 7,270 | 6,941 |
| Synchrony Bank 3.65% 2021 | 3,375 | 3,340 |
| The Edelman Financial Center LLC, Term Loan, (3-month USD-LIBOR + 6.75%) 9.092% 20269,10,11 | 25,500 | 25,750 |
| Travelers Companies, Inc. 4.00% 2047 | 2,260 | 2,189 |
The Income Fund of America — Page 8 of 37
Bonds, notes & other debt instruments
Corporate bonds & notes (continued)
Financials (continued) | Principal amount
(000) | Value
(000) |
| Travelers Companies, Inc. 4.05% 2048 | $400 | $391 |
| UBS Group AG 4.125% 20257 | 4,425 | 4,431 |
| UniCredit SPA 3.75% 20227 | 20,625 | 19,828 |
| UniCredit SPA 4.625% 20277 | 5,000 | 4,689 |
| UniCredit SPA 5.861% 20327,8 | 20,825 | 18,856 |
| US Bancorp 2.85% 2023 | 12,500 | 12,213 |
| US Bancorp 3.40% 2023 | 7,700 | 7,668 |
| US Bancorp 3.70% 2024 | 10,000 | 10,043 |
| US Bancorp 2.375% 2026 | 6,000 | 5,455 |
| US Bancorp 3.15% 2027 | 5,787 | 5,543 |
| Wells Fargo & Co. 2.55% 2020 | 4,350 | 4,280 |
| Wells Fargo & Co. 2.10% 2021 | 10,800 | 10,403 |
| Wells Fargo & Co. 2.50% 2021 | 15,000 | 14,681 |
| Wells Fargo & Co. 4.60% 2021 | 25,000 | 25,757 |
| Wells Fargo & Co. 2.625% 2022 | 10,500 | 10,142 |
| Wells Fargo & Co. 3.069% 2023 | 10,500 | 10,246 |
| Wells Fargo & Co. 3.55% 2025 | 4,289 | 4,189 |
| Wells Fargo & Co. 3.00% 2026 | 13,179 | 12,320 |
| Wells Fargo & Co. 3.584% 2028 (3-month USD-LIBOR + 1.31% on 5/15/2027)8 | 281 | 270 |
Wells Fargo & Co., Series K, junior subordinated 6.111% (undated)
(3-month USD-LIBOR + 3.77% on 9/13/2018)8 | 86,566 | 87,384 |
| | | 2,277,153 |
| Energy 1.72% | | |
| American Energy (Permian Basin) (3-month USD-LIBOR + 6.50%) 8.854% 20197,10 | 4,925 | 4,408 |
| American Energy (Permian Basin), 7.125% 20207 | 28,195 | 17,622 |
| American Energy (Permian Basin), 7.375% 20217 | 23,020 | 14,387 |
| Anadarko Petroleum Corp. 5.55% 2026 | 8,325 | 9,008 |
| Anadarko Petroleum Corp. 6.45% 2036 | 1,095 | 1,287 |
| Anadarko Petroleum Corp. 6.60% 2046 | 5,960 | 7,372 |
| Ascent Resources Marcellus Holdings, Inc., Term Loan B, (3-month USD-LIBOR + 6.50%) 8.60% 20239,10,11 | 5,100 | 5,123 |
| Ascent Resources - Utica, LLC 10.00% 20221,7 | 810 | 899 |
| Berry Petroleum Corporation 7.00% 20267 | 2,985 | 3,119 |
| Blackstone CQP Holdco LP, 6.00% 20215,7 | 20,000 | 20,000 |
| Blackstone CQP Holdco LP, 6.50% 20215,7 | 97,225 | 97,833 |
| Boardwalk Pipeline Partners, LP 4.95% 2024 | 2,345 | 2,397 |
| Bruin E&P Partners, LLC 8.875% 20237 | 1,555 | 1,570 |
| Calfrac Well Services Ltd. 8.50% 20267 | 1,900 | 1,838 |
| California Resources Corp., Term Loan B, (3-month USD-LIBOR + 4.75%) 6.831% 20229,10,11 | 9,000 | 9,146 |
| Canadian Natural Resources Ltd. 2.95% 2023 | 18,375 | 17,759 |
| Canadian Natural Resources Ltd. 3.85% 2027 | 6,185 | 6,041 |
| Carrizo Oil & Gas Inc. 6.25% 2023 | 3,081 | 3,150 |
| Cenovus Energy Inc. 3.00% 2022 | 5,970 | 5,702 |
| Cenovus Energy Inc. 3.80% 2023 | 16,165 | 15,744 |
| Cenovus Energy Inc. 4.25% 2027 | 15,600 | 15,180 |
| Cenovus Energy Inc. 5.40% 2047 | 12,055 | 12,200 |
| Cheniere Energy, Inc. 5.875% 2025 | 10,600 | 11,196 |
| Chesapeake Energy Corp. (3-month USD-LIBOR + 3.25%) 5.589% 201910 | 12,200 | 12,246 |
| Chesapeake Energy Corp. 4.875% 2022 | 20,375 | 19,866 |
| Chesapeake Energy Corp. 8.00% 20227 | 5,282 | 5,592 |
| Chesapeake Energy Corp. 8.00% 2025 | 19,825 | 20,370 |
| Chesapeake Energy Corp. 8.00% 2027 | 20,585 | 21,100 |
| Chesapeake Energy Corp., Term Loan, (3-month USD-LIBOR + 7.50%) 9.577% 20219,10,11 | 7,000 | 7,339 |
| Chevron Corp. 1.561% 2019 | 6,255 | 6,201 |
The Income Fund of America — Page 9 of 37
Bonds, notes & other debt instruments
Corporate bonds & notes (continued)
Energy (continued) | Principal amount
(000) | Value
(000) |
| Chevron Corp. 2.498% 2022 | $3,790 | $3,718 |
| Comstock Resources, Inc. 9.75% 20267 | 22,175 | 21,510 |
| Concho Resources Inc. 4.30% 2028 | 9,915 | 9,951 |
| Concho Resources Inc. 4.85% 2048 | 2,841 | 2,892 |
| CONSOL Energy Inc. 5.875% 2022 | 75,825 | 76,167 |
| Convey Park Energy LLC 7.50% 20257 | 9,205 | 9,389 |
| DCP Midstream Operating LP 4.95% 2022 | 18,690 | 18,970 |
| Denbury Resources Inc. 9.00% 20217 | 5,860 | 6,263 |
| Devon Energy Corp. 5.00% 2045 | 1,000 | 1,038 |
| Diamond Offshore Drilling, Inc. 7.875% 2025 | 10,100 | 10,555 |
| Diamond Offshore Drilling, Inc. 4.875% 2043 | 52,151 | 37,809 |
| El Paso Pipeline Partners Operating Co., LLC 5.00% 2021 | 5,000 | 5,195 |
| El Paso Pipeline Partners Operating Co., LLC 4.70% 2042 | 33,265 | 31,083 |
| Enbridge Energy Partners, LP 9.875% 2019 | 10,500 | 10,895 |
| Enbridge Energy Partners, LP 4.375% 2020 | 7,995 | 8,121 |
| Enbridge Energy Partners, LP 5.875% 2025 | 8,075 | 8,855 |
| Enbridge Energy Partners, LP 5.50% 2040 | 1,200 | 1,273 |
| Enbridge Energy Partners, LP 7.375% 2045 | 21,118 | 27,440 |
| Enbridge Energy Partners, LP, Series B, 7.50% 2038 | 6,000 | 7,606 |
| Enbridge Inc. 4.00% 2023 | 10,830 | 10,946 |
| Enbridge Inc. 3.70% 2027 | 12,538 | 12,152 |
| Energy Transfer Partners, LP 4.15% 2020 | 5,000 | 5,056 |
| Energy Transfer Partners, LP 7.50% 2020 | 9,250 | 9,898 |
| Energy Transfer Partners, LP 5.875% 2024 | 11,800 | 12,301 |
| Energy Transfer Partners, LP 4.75% 2026 | 8,000 | 8,102 |
| Energy Transfer Partners, LP 4.00% 2027 | 5,586 | 5,342 |
| Energy Transfer Partners, LP 4.20% 2027 | 7,622 | 7,405 |
| Energy Transfer Partners, LP 5.50% 2027 | 17,145 | 17,616 |
| Energy Transfer Partners, LP 4.95% 2028 | 9,879 | 10,093 |
| Energy Transfer Partners, LP 6.125% 2045 | 9,510 | 9,911 |
| Energy Transfer Partners, LP 5.30% 2047 | 14,335 | 13,688 |
| Energy Transfer Partners, LP 5.40% 2047 | 16,309 | 15,735 |
| Energy Transfer Partners, LP 6.00% 2048 | 6,105 | 6,406 |
| EnLink Midstream Partners, LP 2.70% 2019 | 1,660 | 1,654 |
| EnLink Midstream Partners, LP 4.15% 2025 | 9,405 | 8,818 |
| EnLink Midstream Partners, LP 4.85% 2026 | 2,744 | 2,643 |
| EnLink Midstream Partners, LP 5.05% 2045 | 840 | 700 |
| Ensco PLC, 5.20% 2025 | 2,495 | 2,136 |
| Ensco PLC 7.75% 2026 | 17,525 | 17,065 |
| Ensco PLC, 5.75% 2044 | 31,670 | 23,159 |
| EOG Resources, Inc. 4.15% 2026 | 3,830 | 3,931 |
| EP Energy Corp. 8.00% 20247 | 780 | 792 |
| EP Energy Corp. 7.75% 20267 | 1,900 | 1,943 |
| EQT Corp. 3.00% 2022 | 3,175 | 3,057 |
| EQT Corp. 3.90% 2027 | 16,650 | 15,757 |
| Extraction Oil & Gas, Inc. 7.375% 20247 | 2,360 | 2,490 |
| Extraction Oil & Gas, Inc. 5.625% 20267 | 13,650 | 13,258 |
| Genesis Energy, LP 6.75% 2022 | 13,675 | 14,017 |
| Genesis Energy, LP 6.50% 2025 | 10,650 | 10,357 |
| Halliburton Co. 3.80% 2025 | 1,915 | 1,907 |
| Halliburton Co. 5.00% 2045 | 1,860 | 2,015 |
| Hi-Crush Partners LP 9.50% 20267 | 1,080 | 1,069 |
| Indigo Natural Resources LLC 6.875% 20267 | 4,825 | 4,692 |
| Jagged Peak Energy LLC 5.875% 20267 | 665 | 655 |
The Income Fund of America — Page 10 of 37
Bonds, notes & other debt instruments
Corporate bonds & notes (continued)
Energy (continued) | Principal amount
(000) | Value
(000) |
| Jonah Energy LLC 7.25% 20257 | $20,255 | $16,862 |
| Jones Energy, Inc. 9.25% 20237 | 1,560 | 1,583 |
| Kcad Holdings I Ltd. 9.625% 20237 | 1,900 | 1,912 |
| Kinder Morgan Energy Partners, LP 2.65% 2019 | 1,890 | 1,888 |
| Kinder Morgan Energy Partners, LP 9.00% 2019 | 1,660 | 1,711 |
| Kinder Morgan Energy Partners, LP 4.15% 2022 | 12,145 | 12,326 |
| Kinder Morgan Energy Partners, LP 6.95% 2038 | 460 | 544 |
| Kinder Morgan Energy Partners, LP 5.00% 2043 | 20,000 | 19,335 |
| Kinder Morgan Energy Partners, LP 5.40% 2044 | 3,030 | 3,081 |
| Kinder Morgan Energy Partners, LP 5.50% 2044 | 6,456 | 6,627 |
| Kinder Morgan, Inc. 3.05% 2019 | 3,530 | 3,530 |
| Kinder Morgan, Inc. 3.15% 2023 | 2,730 | 2,653 |
| Kinder Morgan, Inc. 4.30% 2028 | 25,073 | 24,905 |
| Kinder Morgan, Inc. 5.55% 2045 | 3,097 | 3,262 |
| Kinder Morgan, Inc. 5.05% 2046 | 4,990 | 4,899 |
| Kinder Morgan, Inc. 5.20% 2048 | 7,558 | 7,674 |
| Magnolia Oil & Gas Operating LLC 6.00% 20267 | 3,040 | 3,066 |
| Marathon Oil Corp. 4.40% 2027 | 6,700 | 6,749 |
| McDermott International, Term Loan B, (3-month USD-LIBOR + 5.00%) 7.068% 20259,10,11 | 1,247 | 1,256 |
| Murphy Oil Corp. 6.875% 2024 | 1,560 | 1,642 |
| Murphy Oil Corp. 5.75% 2025 | 7,080 | 7,116 |
| Nabors Industries Ltd. 5.75% 20257 | 4,550 | 4,323 |
| Neptune Energy Group Holdings Limited 6.625% 20257 | 755 | 737 |
| NGL Energy Partners LP 6.875% 2021 | 31,581 | 32,173 |
| NGL Energy Partners LP 6.125% 2025 | 29,175 | 27,862 |
| NGPL PipeCo LLC 4.375% 20227 | 445 | 448 |
| NGPL PipeCo LLC 4.875% 20277 | 900 | 902 |
| NGPL PipeCo LLC 7.768% 20377 | 885 | 1,093 |
| Noble Corp. PLC 7.95% 20258 | 23,590 | 22,410 |
| Noble Corp. PLC 8.95% 20458 | 16,690 | 15,438 |
| Noble Energy, Inc. 4.95% 2047 | 4,925 | 5,013 |
| Oasis Petroleum Inc. 6.25% 20267 | 2,920 | 2,938 |
| Odebrecht Drilling Norbe 6.72% 20227,9 | 980 | 936 |
| Odebrecht Drilling Norbe 7.72% 2026 (87.05% PIK)7,9,12 | 3,161 | 940 |
| Odebrecht Drilling Norbe 0% 20497,10 | 491 | 9 |
| PDC Energy Inc. 5.75% 2026 | 1,780 | 1,767 |
| Peabody Energy Corp. 6.00% 20227 | 6,075 | 6,280 |
| Peabody Energy Corp. 6.375% 20257 | 2,175 | 2,325 |
| Petrobras Global Finance Co. 6.85% 2115 | 2,775 | 2,511 |
| Petróleos Mexicanos 6.875% 2026 | 11,285 | 11,821 |
| Petróleos Mexicanos 6.50% 2027 | 38,415 | 39,078 |
| Petróleos Mexicanos 5.35% 20287 | 2,500 | 2,342 |
| Petróleos Mexicanos 6.75% 2047 | 8,540 | 7,900 |
| Petróleos Mexicanos 6.35% 20487 | 17,471 | 15,637 |
| Phillips 66 3.90% 2028 | 7,190 | 7,104 |
| Pioneer Natural Resources Co. 3.45% 2021 | 7,015 | 7,029 |
| QEP Resources, Inc. 5.625% 2026 | 3,660 | 3,536 |
| Range Resources Corp. 5.00% 2022 | 2,000 | 1,970 |
| Range Resources Corp. 4.875% 2025 | 4,100 | 3,818 |
| Ras Laffan Liquefied Natural Gas II 5.298% 20207,9 | 4,973 | 5,094 |
| Ras Laffan Liquefied Natural Gas III 6.75% 2019 | 4,000 | 4,153 |
| Ras Laffan Liquefied Natural Gas III 6.75% 20197 | 1,000 | 1,038 |
| Royal Dutch Shell PLC 1.75% 2021 | 15,580 | 14,977 |
| Royal Dutch Shell PLC 3.75% 2046 | 5,000 | 4,755 |
The Income Fund of America — Page 11 of 37
Bonds, notes & other debt instruments
Corporate bonds & notes (continued)
Energy (continued) | Principal amount
(000) | Value
(000) |
| Sabine Pass Liquefaction, LLC 5.625% 20238 | $9,500 | $10,146 |
| Sabine Pass Liquefaction, LLC 5.75% 2024 | 10,000 | 10,769 |
| Sabine Pass Liquefaction, LLC 5.625% 2025 | 9,305 | 9,933 |
| Sabine Pass Liquefaction, LLC 5.875% 2026 | 2,100 | 2,288 |
| Sanchez Energy Corp. 7.25% 20237 | 6,000 | 5,933 |
| Schlumberger BV 3.625% 20227 | 1,780 | 1,780 |
| Schlumberger BV 4.00% 20257 | 16,041 | 16,086 |
| Seven Generations Energy Ltd. 5.375% 20257 | 700 | 674 |
| SM Energy Co. 6.125% 2022 | 5,760 | 5,933 |
| SM Energy Co. 5.625% 2025 | 4,325 | 4,239 |
| SM Energy Co. 6.75% 2026 | 500 | 511 |
| Southwestern Energy Co. 4.10% 2022 | 48,940 | 46,738 |
| Southwestern Energy Co. 6.70% 20258 | 19,950 | 19,726 |
| Southwestern Energy Co. 7.50% 2026 | 3,405 | 3,550 |
| Spectra Energy Partners, LP 4.75% 2024 | 3,250 | 3,350 |
| Spectra Energy Partners, LP 4.50% 2045 | 1,280 | 1,213 |
| Statoil ASA 2.75% 2021 | 3,085 | 3,044 |
| Statoil ASA 3.25% 2024 | 850 | 838 |
| Statoil ASA 4.25% 2041 | 3,000 | 3,025 |
| Summit Midstream Partners LP 5.75% 2025 | 4,950 | 4,802 |
| Sunoco LP 4.875% 20237 | 5,635 | 5,552 |
| Sunoco LP 5.50% 20267 | 1,665 | 1,588 |
| Tapstone Energy Inc. 9.75% 20227 | 2,510 | 2,228 |
| Targa Resources Partners LP 4.125% 2019 | 24,555 | 24,616 |
| Targa Resources Partners LP 6.75% 2024 | 8,255 | 8,730 |
| TC PipeLines, LP 4.375% 2025 | 1,898 | 1,870 |
| Teekay Corp. 8.50% 2020 | 67,791 | 70,757 |
| Teekay Offshore Partners L.P. 8.50% 20237 | 13,350 | 13,584 |
| TransCanada Corp. 7.625% 2039 | 10,750 | 14,571 |
| TransCanada PipeLines Ltd. 4.25% 2028 | 8,465 | 8,564 |
| TransCanada PipeLines Ltd. 4.75% 2038 | 9,600 | 9,868 |
| Transocean Guardian LTD, 5.875% 20247,9 | 3,855 | 3,903 |
| Transocean Inc. 8.375% 20218 | 10,675 | 11,476 |
| Transocean Inc. 9.00% 20237 | 13,552 | 14,670 |
| Transocean Inc. 6.125% 20257,9 | 1,425 | 1,455 |
| Transocean Inc. 7.50% 20267 | 1,050 | 1,076 |
| Ultra Petroleum Corp. 6.875% 20227 | 28,560 | 19,135 |
| Ultra Petroleum Corp. 7.125% 20257 | 7,100 | 4,278 |
| Vine Oil & Gas LP 8.75% 20237 | 13,885 | 12,878 |
| Vine Oil & Gas LP, Term Loan, (3-month USD-LIBOR + 6.875%) 8.952% 20219,10,11 | 1,600 | 1,609 |
| Weatherford International PLC 4.50% 2022 | 30,555 | 28,416 |
| Weatherford International PLC 8.25% 2023 | 21,075 | 20,970 |
| Weatherford International PLC 9.875% 2024 | 8,325 | 8,492 |
| Weatherford International PLC 9.875% 20257 | 14,225 | 14,438 |
| Weatherford International PLC 6.50% 2036 | 14,525 | 11,329 |
| Weatherford International PLC 6.75% 2040 | 40,050 | 31,840 |
| Western Gas Partners LP 2.60% 2018 | 1,150 | 1,150 |
| Western Gas Partners LP 5.30% 2048 | 5,000 | 4,809 |
| Whiting Petroleum Corp. 5.75% 2021 | 610 | 624 |
| Whiting Petroleum Corp. 6.625% 2026 | 3,150 | 3,266 |
| Williams Companies, Inc. 4.55% 2024 | 4,850 | 4,899 |
| Woodside Finance Ltd. 4.60% 20217 | 18,935 | 19,273 |
The Income Fund of America — Page 12 of 37
Bonds, notes & other debt instruments
Corporate bonds & notes (continued)
Energy (continued) | Principal amount
(000) | Value
(000) |
| WPX Energy Inc. 6.00% 2022 | $3,631 | $3,785 |
| WPX Energy Inc. 5.75% 2026 | 1,895 | 1,907 |
| | | 1,884,353 |
| Health care 1.64% | | |
| Abbott Laboratories 2.80% 2020 | 9,100 | 9,036 |
| Abbott Laboratories 2.90% 2021 | 31,060 | 30,657 |
| Abbott Laboratories 3.40% 2023 | 8,886 | 8,808 |
| Abbott Laboratories 3.75% 2026 | 8,585 | 8,539 |
| Abbott Laboratories 4.90% 2046 | 2,725 | 3,011 |
| AbbVie Inc. 2.30% 2021 | 14,335 | 13,953 |
| AbbVie Inc. 2.90% 2022 | 5,000 | 4,875 |
| AbbVie Inc. 3.20% 2022 | 2,186 | 2,153 |
| AbbVie Inc. 3.60% 2025 | 4,838 | 4,721 |
| AbbVie Inc. 4.30% 2036 | 1,003 | 960 |
| AbbVie Inc. 4.45% 2046 | 8,863 | 8,464 |
| Allergan Funding SCS 4.85% 2044 | 1,000 | 995 |
| Allergan PLC 3.00% 2020 | 14,890 | 14,834 |
| Allergan PLC 3.45% 2022 | 21,443 | 21,222 |
| Allergan PLC 3.80% 2025 | 29,640 | 29,134 |
| Allergan PLC 4.55% 2035 | 7,009 | 6,863 |
| Allergan PLC 4.75% 2045 | 13,403 | 13,299 |
| Allergan, Inc. 5.00% 20217 | 3,809 | 3,940 |
| Amgen Inc. 1.85% 2021 | 5,745 | 5,502 |
| Amgen Inc. 4.40% 2045 | 2,000 | 1,977 |
| Anthem, Inc. 4.101% 2028 | 4,000 | 3,951 |
| AstraZeneca PLC 2.375% 2022 | 5,250 | 5,053 |
| Auris Luxembourg III SARL, Term Loan, (3-month USD-LIBOR + 3.75%) 6.085% 20259,10,11 | 1,890 | 1,906 |
| Baxalta Inc. 4.00% 2025 | 17,855 | 17,507 |
| Baxalta Inc. 5.25% 2045 | 300 | 310 |
| Bayer AG 2.375% 20197 | 4,810 | 4,775 |
| Bayer US Finance II LLC 3.875% 20237 | 16,860 | 16,945 |
| Bayer US Finance II LLC 4.25% 20257 | 26,206 | 26,533 |
| Bayer US Finance II LLC 4.375% 20287 | 8,550 | 8,678 |
| Bayer US Finance II LLC 4.40% 20447 | 13,090 | 12,635 |
| Bayer US Finance II LLC 4.875% 20487 | 2,414 | 2,503 |
| Becton, Dickinson and Co. 2.675% 2019 | 3,136 | 3,117 |
| Becton, Dickinson and Co. 2.894% 2022 | 14,400 | 13,989 |
| Becton, Dickinson and Co. 3.363% 2024 | 12,310 | 11,894 |
| Becton, Dickinson and Co. 3.70% 2027 | 8,425 | 8,103 |
| Boston Scientific Corp. 2.85% 2020 | 7,875 | 7,809 |
| Boston Scientific Corp. 6.00% 2020 | 5,375 | 5,583 |
| Boston Scientific Corp. 3.375% 2022 | 4,300 | 4,255 |
| Boston Scientific Corp. 3.85% 2025 | 5,000 | 4,961 |
| Catalent, Inc. 4.875% 20267 | 805 | 791 |
| Centene Corp. 5.625% 2021 | 5,100 | 5,227 |
| Centene Corp. 4.75% 2022 | 36,858 | 37,457 |
| Centene Corp. 6.125% 2024 | 4,550 | 4,800 |
| Centene Corp. 4.75% 2025 | 21,320 | 21,347 |
| Centene Corp. 5.375% 20267 | 21,580 | 22,146 |
| Charles River Laboratories International, Inc. 5.50% 20267 | 1,740 | 1,766 |
| Community Health Systems Inc. 6.25% 2023 | 4,025 | 3,763 |
| Concordia Healthcare Corp. 9.50% 20227,13 | 33,543 | 2,096 |
| Concordia Healthcare Corp. 7.00% 20237,13 | 28,169 | 1,761 |
The Income Fund of America — Page 13 of 37
Bonds, notes & other debt instruments
Corporate bonds & notes (continued)
Health care (continued) | Principal amount
(000) | Value
(000) |
| Concordia Healthcare Corp., Term Loan B, (3-month USD-LIBOR + 4.25%) 6.327% 20219,10,11 | $8,413 | $7,622 |
| CVS Health Corp. 3.35% 2021 | 16,630 | 16,625 |
| CVS Health Corp. 3.70% 2023 | 20,835 | 20,726 |
| CVS Health Corp. 4.10% 2025 | 25,885 | 25,867 |
| CVS Health Corp. 4.30% 2028 | 24,793 | 24,748 |
| CVS Health Corp. 4.78% 2038 | 2,490 | 2,514 |
| CVS Health Corp. 5.05% 2048 | 10,075 | 10,480 |
| DaVita HealthCare Partners Inc. 5.125% 2024 | 1,775 | 1,731 |
| DaVita HealthCare Partners Inc. 5.00% 2025 | 15,175 | 14,340 |
| DJO Finance LLC 10.75% 2020 | 1,545 | 1,537 |
| DJO Finance LLC 8.125% 20217 | 2,340 | 2,416 |
| Eagle Holding Co II LLC 7.625% 20227,12 | 3,350 | 3,391 |
| EMD Finance LLC 2.95% 20227 | 7,100 | 6,944 |
| Endo International PLC 5.75% 20227 | 26,156 | 24,129 |
| Endo International PLC 6.00% 20237 | 5,670 | 4,848 |
| Endo International PLC 6.00% 20257,8 | 15,550 | 12,557 |
| Envision Healthcare Corp. 5.125% 20227 | 6,760 | 6,887 |
| Gentiva Health Services Inc., Term Loan, (3-month USD-LIBOR + 7.00%) 9.375% 20269,10,11 | 500 | 511 |
| GlaxoSmithKline PLC 3.375% 2023 | 10,500 | 10,468 |
| GlaxoSmithKline PLC 3.625% 2025 | 14,665 | 14,705 |
| HCA Inc. 4.75% 2023 | 580 | 589 |
| HCA Inc. 5.875% 2023 | 8,325 | 8,731 |
| HCA Inc. 5.00% 2024 | 2,080 | 2,116 |
| HCA Inc. 5.375% 2025 | 8,350 | 8,475 |
| HCA Inc. 5.25% 2026 | 3,400 | 3,460 |
| Healthsouth Corp. 5.75% 2024 | 5,425 | 5,524 |
| Healthsouth Corp. 5.75% 2025 | 15,197 | 15,349 |
| Hologic, Inc. 4.375% 20257 | 4,195 | 4,068 |
| Hologic, Inc. 4.625% 20287 | 3,115 | 2,936 |
| Humana Inc. 4.95% 2044 | 12,345 | 13,027 |
| IMS Health Holdings, Inc. 5.00% 20267 | 14,410 | 14,416 |
| inVentiv Health, Inc. 7.50% 20247 | 4,095 | 4,320 |
| Jaguar Holding Co. 6.375% 20237 | 10,265 | 10,364 |
| Kinetic Concepts, Inc. 7.875% 20217 | 4,825 | 4,943 |
| Kinetic Concepts, Inc. 12.50% 20217 | 19,005 | 20,905 |
| Laboratory Corporation of America Holdings 3.60% 2027 | 6,100 | 5,824 |
| Laboratory Corporation of America Holdings 4.70% 2045 | 885 | 880 |
| Mallinckrodt PLC 4.875% 20207 | 34,125 | 33,869 |
| Mallinckrodt PLC 5.75% 20227 | 2,060 | 1,885 |
| Mallinckrodt PLC 5.625% 20237 | 780 | 676 |
| McKesson Corp. 2.284% 2019 | 4,870 | 4,860 |
| Medtronic, Inc. 4.375% 2035 | 5,903 | 6,188 |
| Medtronic, Inc. 4.625% 2045 | 11,610 | 12,624 |
| Molina Healthcare, Inc. 5.375% 2022 | 50,935 | 52,208 |
| Molina Healthcare, Inc. 4.875% 20257 | 23,629 | 23,186 |
| Multiplan, Inc. 7.125% 20247 | 4,650 | 4,824 |
| Mylan Laboratories Inc. 3.15% 2021 | 4,403 | 4,358 |
| Novartis Capital Corp. 2.40% 2022 | 10,500 | 10,198 |
| NVA Holdings Inc 6.875% 20267 | 6,350 | 6,350 |
| Owens & Minor, Inc. 3.875% 2021 | 19,600 | 18,742 |
| Owens & Minor, Inc., Term Loan B, (3-month USD-LIBOR + 4.50%) 6.869% 20259,10,11 | 7,480 | 7,340 |
| PAREXEL International Corp. 6.375% 20257 | 12,305 | 12,028 |
| Prestige Brands International Inc. 6.375% 20247 | 7,155 | 7,182 |
| Quintiles Transnational Corp. 4.875% 20237 | 26,495 | 27,025 |
The Income Fund of America — Page 14 of 37
Bonds, notes & other debt instruments
Corporate bonds & notes (continued)
Health care (continued) | Principal amount
(000) | Value
(000) |
| Roche Holdings, Inc. 2.875% 20217 | $15,000 | $14,849 |
| Roche Holdings, Inc. 3.35% 20247 | 5,000 | 4,969 |
| Rotech Healthcare Inc., Term Loan B, (3-month USD-LIBOR + 3.75%) 6.087% 20231,2,3,9,10,11 | 14,558 | 14,558 |
| Rotech Healthcare Inc., Term Loan, (3-month USD-LIBOR + 11.00%) 13.337% 20231,2,3,9,10,11,12 | 29,096 | 26,561 |
| Shire PLC 2.40% 2021 | 33,449 | 32,230 |
| Shire PLC 2.875% 2023 | 23,205 | 21,946 |
| Shire PLC 3.20% 2026 | 17,440 | 16,152 |
| Team Health Holdings, Inc. 6.375% 20257 | 20,905 | 18,344 |
| Teleflex Inc. 4.625% 2027 | 3,580 | 3,423 |
| Tenet Healthcare Corp. 4.75% 2020 | 12,325 | 12,541 |
| Tenet Healthcare Corp., 6.00% 2020 | 48,910 | 50,989 |
| Tenet Healthcare Corp. 4.375% 2021 | 13,400 | 13,417 |
| Tenet Healthcare Corp. 4.50% 2021 | 25,430 | 25,621 |
| Tenet Healthcare Corp. 8.125% 2022 | 1,864 | 1,992 |
| Tenet Healthcare Corp. 6.75% 2023 | 4,000 | 4,076 |
| Tenet Healthcare Corp. 4.625% 2024 | 25,116 | 24,394 |
| Teva Pharmaceutical Finance Company BV 2.20% 2021 | 23,120 | 21,571 |
| Teva Pharmaceutical Finance Company BV 2.80% 2023 | 87,626 | 79,285 |
| Teva Pharmaceutical Finance Company BV 6.00% 2024 | 15,335 | 15,886 |
| Teva Pharmaceutical Finance Company BV 3.15% 2026 | 33,117 | 28,163 |
| Teva Pharmaceutical Finance Company BV 6.75% 2028 | 74,510 | 79,657 |
| Teva Pharmaceutical Finance Company BV 4.10% 2046 | 66,410 | 49,841 |
| Thermo Fisher Scientific Inc. 4.15% 2024 | 4,000 | 4,075 |
| UnitedHealth Group Inc. 3.75% 2025 | 5,710 | 5,735 |
| Valeant Pharmaceuticals International, Inc. 7.50% 20217 | 15,650 | 15,994 |
| Valeant Pharmaceuticals International, Inc. 5.875% 20237 | 17,867 | 17,228 |
| Valeant Pharmaceuticals International, Inc. 6.125% 20257 | 95,097 | 89,510 |
| Valeant Pharmaceuticals International, Inc. 9.00% 20257 | 26,195 | 27,865 |
| Valeant Pharmaceuticals International, Inc. 9.25% 20267 | 18,895 | 20,147 |
| Valeant Pharmaceuticals International, Inc. 8.50% 20277 | 2,265 | 2,332 |
| Valeant Pharmaceuticals International, Inc., Term Loan B, (3-month USD-LIBOR + 3.00%) 5.092% 20259,10,11 | 4,900 | 4,911 |
| WellPoint, Inc. 2.25% 2019 | 4,000 | 3,977 |
| Zimmer Holdings, Inc. 3.15% 2022 | 18,860 | 18,528 |
| | | 1,797,887 |
| Consumer discretionary 1.36% | | |
| Amazon.com, Inc. 2.40% 2023 | 4,165 | 4,017 |
| Amazon.com, Inc. 2.80% 2024 | 11,025 | 10,692 |
| Amazon.com, Inc. 3.15% 2027 | 890 | 858 |
| Amazon.com, Inc. 3.875% 2037 | 1,400 | 1,391 |
| Amazon.com, Inc. 4.05% 2047 | 4,000 | 3,977 |
| American Axle & Manufacturing Holdings, Inc. 6.50% 2027 | 13,250 | 12,935 |
| American Honda Finance Corp. 1.65% 2021 | 8,850 | 8,476 |
| American Honda Finance Corp. 2.60% 2022 | 2,000 | 1,936 |
| American Honda Finance Corp. 3.50% 2028 | 2,000 | 1,953 |
| Bayerische Motoren Werke AG 2.15% 20207 | 2,000 | 1,965 |
| Bayerische Motoren Werke AG 2.00% 20217 | 2,000 | 1,931 |
| Bayerische Motoren Werke AG 2.25% 20237 | 1,000 | 931 |
| Bayerische Motoren Werke AG 3.45% 20237 | 16,510 | 16,320 |
| Cablevision Systems Corp. 8.00% 2020 | 20,000 | 21,031 |
| Cablevision Systems Corp. 6.75% 2021 | 31,217 | 32,622 |
| Caesars Resort Collection LLC, Term Loan, (3-month USD-LIBOR + 2.75%) 4.827% 20249,10,11 | 7,462 | 7,498 |
| Carnival Corp. 3.95% 2020 | 11,290 | 11,490 |
| CBS Outdoor Americas Inc. 5.25% 2022 | 25,000 | 25,281 |
The Income Fund of America — Page 15 of 37
Bonds, notes & other debt instruments
Corporate bonds & notes (continued)
Consumer discretionary (continued) | Principal amount
(000) | Value
(000) |
| CCO Holdings LLC and CCO Holdings Capital Corp. 3.579% 2020 | $4,980 | $4,990 |
| CCO Holdings LLC and CCO Holdings Capital Corp. 5.125% 20237 | 6,650 | 6,650 |
| CCO Holdings LLC and CCO Holdings Capital Corp. 5.875% 20247 | 3,000 | 3,060 |
| CCO Holdings LLC and CCO Holdings Capital Corp. 4.908% 2025 | 2,300 | 2,346 |
| CCO Holdings LLC and CCO Holdings Capital Corp. 5.75% 20267 | 37,300 | 37,181 |
| CCO Holdings LLC and CCO Holdings Capital Corp. 5.125% 20277 | 11,250 | 10,772 |
| CCO Holdings LLC and CCO Holdings Capital Corp. 3.75% 2028 | 5,700 | 5,259 |
| CCO Holdings LLC and CCO Holdings Capital Corp. 4.20% 2028 | 6,870 | 6,595 |
| CCO Holdings LLC and CCO Holdings Capital Corp. 5.00% 20287 | 30,050 | 28,285 |
| CCO Holdings LLC and CCO Holdings Capital Corp. 6.484% 2045 | 4,475 | 4,886 |
| CCO Holdings LLC and CCO Holdings Capital Corp. 5.375% 2047 | 9,845 | 9,509 |
| CCO Holdings LLC and CCO Holdings Capital Corp. 5.75% 2048 | 3,825 | 3,861 |
| Cengage Learning Acquisitions, Inc., Term Loan B, (3-month USD-LIBOR + 4.25%) 6.329% 20239,10,11 | 5,539 | 5,258 |
| Churchill Downs Inc. 4.75% 20287 | 3,150 | 2,969 |
| Cirsa Gaming Corporation SA 7.875% 20237 | 9,750 | 9,802 |
| Clear Channel Worldwide Holdings, Inc. 7.625% 2020 | 91,770 | 92,316 |
| Comcast Corp. 6.45% 2037 | 25,000 | 30,336 |
| Comcast Corp. 4.75% 2044 | 9,855 | 10,019 |
| Comcast Corp. 4.00% 2048 | 1,280 | 1,169 |
| CRC Escrow Issuer LLC 5.25% 20257 | 3,460 | 3,339 |
| Cumulus Media New Holdings Inc., Term Loan, (3-month USD-LIBOR + 4.50%) 6.58% 20229,10,11 | 19,662 | 19,466 |
| DaimlerChrysler North America Holding Corp. 2.25% 20197 | 14,000 | 13,874 |
| DaimlerChrysler North America Holding Corp. 2.25% 20207 | 8,660 | 8,526 |
| DaimlerChrysler North America Holding Corp. 2.00% 20217 | 9,725 | 9,304 |
| DaimlerChrysler North America Holding Corp. 3.30% 20257 | 2,000 | 1,924 |
| DaimlerChrysler North America Holding Corp. 8.50% 2031 | 2,000 | 2,828 |
| Delphi Automotive PLC 5.00% 20257 | 70 | 67 |
| Delta 2 (Formula One), Term Loan B, (3-month USD-LIBOR + 2.50%) 4.577% 20249,10,11 | 6,987 | 6,962 |
| Fertitta Entertainment, Inc. 8.75% 20257 | 1,950 | 2,028 |
| Ford Motor Co. 4.346% 2026 | 2,000 | 1,927 |
| Ford Motor Credit Co. 2.343% 2020 | 24,820 | 24,185 |
| Ford Motor Credit Co. 3.157% 2020 | 10,000 | 9,928 |
| Ford Motor Credit Co. 3.20% 2021 | 9,220 | 9,102 |
| Ford Motor Credit Co. 3.096% 2023 | 17,714 | 16,841 |
| Ford Motor Credit Co. 4.375% 2023 | 13,136 | 13,177 |
| Ford Motor Credit Co. 3.664% 2024 | 7,000 | 6,680 |
| Ford Motor Credit Co. 4.134% 2025 | 5,000 | 4,834 |
| Ford Motor Credit Co. 3.815% 2027 | 6,968 | 6,388 |
| General Motors Co. 4.35% 2025 | 6,065 | 5,997 |
| General Motors Co. 6.60% 2036 | 13,260 | 14,381 |
| General Motors Co. 6.75% 2046 | 13,230 | 14,694 |
| General Motors Financial Co. 2.35% 2019 | 18,500 | 18,411 |
| General Motors Financial Co. 3.70% 2020 | 10,725 | 10,797 |
| General Motors Financial Co. 3.20% 2021 | 10,250 | 10,112 |
| General Motors Financial Co. 3.55% 2021 | 1,400 | 1,397 |
| General Motors Financial Co. 3.45% 2022 | 3,000 | 2,959 |
| General Motors Financial Co. 3.25% 2023 | 12,500 | 12,093 |
| General Motors Financial Co. 3.70% 2023 | 9,200 | 9,020 |
| General Motors Financial Co. 3.50% 2024 | 8,170 | 7,749 |
| Goodyear Tire & Rubber Co. 4.875% 2027 | 2,600 | 2,382 |
| Hanesbrands Inc. 4.625% 20247 | 4,725 | 4,619 |
| Hanesbrands Inc. 4.875% 20267 | 19,785 | 19,216 |
| Home Depot, Inc. 5.95% 2041 | 12,500 | 15,791 |
| Hyundai Capital America 3.45% 20217 | 21,325 | 21,125 |
The Income Fund of America — Page 16 of 37
Bonds, notes & other debt instruments
Corporate bonds & notes (continued)
Consumer discretionary (continued) | Principal amount
(000) | Value
(000) |
| Hyundai Capital America 3.75% 20217 | $5,000 | $4,981 |
| Hyundai Capital America 3.10% 20227 | 9,720 | 9,457 |
| Hyundai Capital America 3.25% 20227 | 10,307 | 10,010 |
| iHeartCommunications, Inc. 9.00% 201913 | 3,000 | 2,355 |
| iHeartCommunications, Inc., Term Loan D, (3-month USD-LIBOR + 6.75%) 8.844% 20199,10,11,13 | 4,100 | 3,189 |
| Lennar Corp. 8.375% 2021 | 4,100 | 4,510 |
| Levi Strauss & Co. 5.00% 2025 | 5,700 | 5,743 |
| Liberty Global PLC 5.50% 20287 | 10,900 | 10,028 |
| Limited Brands, Inc. 7.00% 2020 | 15,000 | 15,787 |
| Limited Brands, Inc. 6.625% 2021 | 15,000 | 15,862 |
| Limited Brands, Inc. 5.25% 2028 | 4,545 | 4,014 |
| Limited Brands, Inc. 6.875% 2035 | 3,460 | 3,002 |
| Live Nation Entertainment, Inc. 5.625% 20267 | 1,000 | 1,000 |
| McDonald’s Corp. 2.625% 2022 | 5,790 | 5,663 |
| McDonald’s Corp. 3.35% 2023 | 875 | 873 |
| McDonald’s Corp. 3.50% 2027 | 1,250 | 1,232 |
| McDonald’s Corp. 3.80% 2028 | 740 | 737 |
| McDonald’s Corp. 4.875% 2045 | 1,515 | 1,622 |
| McDonald’s Corp. 4.45% 2047 | 3,200 | 3,225 |
| MDC Partners Inc. 6.50% 20247 | 7,055 | 6,261 |
| Meredith Corp. 6.875% 20267 | 18,045 | 18,225 |
| Meredith Corp., Term Loan B, (3-month USD-LIBOR + 3.00%) 5.077% 20259,10,11 | 4,963 | 4,986 |
| Meritage Homes Corp. 5.125% 2027 | 10,675 | 9,821 |
| Merlin Entertainment 5.75% 20267 | 2,800 | 2,863 |
| MGM Resorts International 7.75% 2022 | 13,050 | 14,322 |
| Michaels Stores, Inc. 5.875% 20207 | 3,425 | 3,455 |
| Mohegan Tribal Gaming Auth., Term Loan B, (3-month USD-LIBOR + 4.50%) 6.077% 20239,10,11 | 2,030 | 1,922 |
| Myriad International Holdings 6.00% 20207 | 45,655 | 47,906 |
| Myriad International Holdings 6.00% 2020 | 25,705 | 26,973 |
| Myriad International Holdings 5.50% 2025 | 6,140 | 6,450 |
| NBC Universal Enterprise, Inc. 5.25% 20497 | 29,525 | 29,894 |
| Neiman Marcus Group LTD Inc. 8.00% 20217 | 9,895 | 6,283 |
| Neiman Marcus Group LTD Inc. 8.75% 20217,12 | 11,824 | 7,538 |
| Neiman Marcus Group LTD Inc., Term Loan B, (3-month USD-LIBOR + 3.25%) 5.564% 20209,10,11 | 16,297 | 14,419 |
| Newell Rubbermaid Inc. 2.60% 2019 | 1,211 | 1,206 |
| Newell Rubbermaid Inc. 3.15% 2021 | 4,490 | 4,432 |
| Newell Rubbermaid Inc. 3.85% 2023 | 4,890 | 4,801 |
| Nissan Motor Co., Ltd. 2.60% 20227 | 9,910 | 9,476 |
| NMG Finco PLC 5.75% 20227 | 4,850 | 4,809 |
| Petsmart, Inc. 7.125% 20237 | 62,890 | 42,765 |
| Petsmart, Inc. 5.875% 20257 | 77,810 | 62,053 |
| Petsmart, Inc. 8.875% 20257 | 63,595 | 44,119 |
| Petsmart, Inc., Term Loan B-2, (3-month USD-LIBOR + 3.00%) 5.341% 20229,10,11 | 23,639 | 19,704 |
| Rodan & Fields, LLC TL-B, (3-month USD-LIBOR + 4.00%) 6.072% 20252,9,10,11 | 1,725 | 1,742 |
| Sally Holdings LLC and Sally Capital Inc. 5.50% 2023 | 165 | 161 |
| Sally Holdings LLC and Sally Capital Inc. 5.625% 2025 | 28,315 | 26,616 |
| Schaeffler Verwaltungs 4.125% 20217,12 | 2,800 | 2,772 |
| Schaeffler Verwaltungs 4.75% 20267,12 | 4,950 | 4,668 |
| Scientific Games Corp. 10.00% 2022 | 4,500 | 4,821 |
| Scientific Games Corp., Term Loan B5, (3-month USD-LIBOR + 2.75%) 4.921% 20249,10,11 | 1,706 | 1,709 |
| Sirius XM Radio Inc. 3.875% 20227 | 16,600 | 16,206 |
| Sirius XM Radio Inc. 4.625% 20237 | 2,625 | 2,592 |
| Six Flags Entertainment Corp. 4.875% 20247 | 7,900 | 7,752 |
| Sotheby’s 4.875% 20257 | 10,375 | 9,982 |
The Income Fund of America — Page 17 of 37
Bonds, notes & other debt instruments
Corporate bonds & notes (continued)
Consumer discretionary (continued) | Principal amount
(000) | Value
(000) |
| Starbucks Corp. 3.10% 2023 | $13,893 | $13,687 |
| Starbucks Corp. 3.75% 2047 | 1,500 | 1,327 |
| Stars Group Holdings BV, 7.00% 20267 | 3,385 | 3,495 |
| Stars Group Holdings BV, Term Loan, (3-month USD-LIBOR + 3.50%) 5.831% 20259,10,11 | 2,450 | 2,477 |
| Thomson Reuters Corp. 4.30% 2023 | 1,905 | 1,945 |
| Thomson Reuters Corp. 5.65% 2043 | 1,425 | 1,517 |
| Time Warner Cable Inc. 5.00% 2020 | 35,000 | 35,716 |
| Toyota Motor Credit Corp. 1.70% 2019 | 2,000 | 1,991 |
| Toyota Motor Credit Corp. 2.15% 2020 | 3,000 | 2,962 |
| Toyota Motor Credit Corp. 2.15% 2022 | 2,000 | 1,912 |
| Toyota Motor Credit Corp. 2.60% 2022 | 7,140 | 6,993 |
| Toyota Motor Credit Corp. 2.70% 2023 | 3,180 | 3,092 |
| Toyota Motor Credit Corp. 3.20% 2027 | 1,330 | 1,286 |
| Toyota Motor Credit Corp. 3.05% 2028 | 5,992 | 5,688 |
| Univision Communications Inc. 5.125% 20237 | 3,161 | 3,027 |
| Univision Communications Inc. 5.125% 20257 | 3,983 | 3,704 |
| Warner Music Group 5.625% 20227 | 4,719 | 4,819 |
| Warner Music Group 5.00% 20237 | 2,600 | 2,580 |
| Warner Music Group 5.50% 20267 | 1,925 | 1,911 |
| Wyndham Worldwide Corp. 5.375% 20267 | 3,900 | 3,915 |
| Wynn Las Vegas, LLC and Wynn Capital Corp. 4.25% 20237 | 16,313 | 15,803 |
| Wynn Las Vegas, LLC and Wynn Capital Corp. 5.50% 20257 | 15,900 | 15,741 |
| Wynn Las Vegas, LLC and Wynn Capital Corp. 5.25% 20277 | 13,025 | 12,261 |
| | | 1,497,533 |
| Utilities 0.86% | | |
| Abu Dhabi National Energy Co. PJSC (TAQA) 3.625% 20237 | 2,000 | 1,988 |
| Abu Dhabi National Energy Co. PJSC (TAQA) 4.375% 20257 | 16,000 | 16,128 |
| Abu Dhabi National Energy Co. PJSC (TAQA) 4.875% 20307 | 2,865 | 2,923 |
| AEP Transmission Company LLC 3.75% 2047 | 3,660 | 3,383 |
| AES Corp. 4.875% 2023 | 2,000 | 2,018 |
| AES Corp. 5.50% 2025 | 28,889 | 29,539 |
| AES Corp. 6.00% 2026 | 14,410 | 15,131 |
| AES Corp. 5.125% 2027 | 955 | 967 |
| American Electric Power Co., Inc. 2.95% 2022 | 14,022 | 13,656 |
| American Electric Power Co., Inc. 3.20% 2027 | 19,761 | 18,465 |
| AmeriGas Partners, LP 5.50% 2025 | 4,850 | 4,717 |
| Berkshire Hathaway Energy Co. 2.40% 2020 | 3,110 | 3,083 |
| Berkshire Hathaway Energy Co. 2.80% 2023 | 5,350 | 5,202 |
| Calpine Corp. 6.00% 20227 | 3,425 | 3,498 |
| Calpine Corp. 5.375% 2023 | 7,860 | 7,526 |
| Calpine Corp. 5.875% 20247 | 2,925 | 2,947 |
| Calpine Corp. 5.25% 20267 | 25,595 | 24,283 |
| Centerpoint Energy, Inc. 2.50% 2022 | 5,031 | 4,839 |
| CMS Energy Corp. 6.25% 2020 | 13,523 | 14,090 |
| CMS Energy Corp. 3.00% 2026 | 19,075 | 17,754 |
| CMS Energy Corp. 3.45% 2027 | 7,995 | 7,641 |
| Colbun SA 4.50% 20247 | 1,500 | 1,516 |
| Colbun SA 3.95% 20277 | 1,554 | 1,475 |
| Comision Federal de Electricidad 4.875% 20247 | 2,000 | 2,053 |
| Comision Federal de Electricidad 4.75% 20277 | 370 | 368 |
| Commonwealth Edison Company 4.00% 2048 | 9,119 | 9,066 |
| Consolidated Edison Co. of New York 4.50% 2058 | 8,390 | 8,586 |
| Consumers Energy Co. 6.70% 2019 | 13,400 | 13,934 |
The Income Fund of America — Page 18 of 37
Bonds, notes & other debt instruments
Corporate bonds & notes (continued)
Utilities (continued) | Principal amount
(000) | Value
(000) |
| Consumers Energy Co. 3.375% 2023 | $360 | $358 |
| Consumers Energy Co. 3.125% 2024 | 2,520 | 2,434 |
| Consumers Energy Co. 4.05% 2048 | 6,855 | 6,943 |
| Duke Energy Corp. 3.95% 2023 | 1,807 | 1,826 |
| Duke Energy Corp. 2.65% 2026 | 75 | 68 |
| Duke Energy Florida, LLC 4.20% 2048 | 960 | 982 |
| Duke Energy Indiana, Inc. 4.90% 2043 | 14,785 | 16,300 |
| Duke Energy Progress Inc. 4.15% 2044 | 3,935 | 3,952 |
| Dynegy Finance Inc. 7.375% 2022 | 9,425 | 9,849 |
| Dynegy Finance Inc. 7.625% 2024 | 2,100 | 2,261 |
| Edison International 2.40% 2022 | 900 | 854 |
| EDP Finance BV 4.125% 20207 | 3,402 | 3,431 |
| EDP Finance BV 5.25% 20217 | 22,500 | 23,233 |
| EDP Finance BV 3.625% 20247 | 23,375 | 22,421 |
| Electricité de France SA 3.625% 20257 | 780 | 761 |
| Electricité de France SA 6.95% 20397 | 8,000 | 10,100 |
| Electricité de France SA 4.875% 20447 | 1,886 | 1,916 |
| Electricité de France SA 4.95% 20457 | 114 | 116 |
Electricité de France SA 5.25% (undated)
(USD Semi Annual 30/360 (vs. 3M LIBOR) 10Y + 3.709% on 1/29/2023)7,8 | 3,500 | 3,483 |
| Emera Inc. 6.75% 2076 (3-month USD-LIBOR + 5.44% on 6/15/2026)8 | 36,024 | 38,185 |
| Emera US Finance LP 2.15% 2019 | 3,975 | 3,946 |
| Emera US Finance LP 2.70% 2021 | 2,505 | 2,444 |
| Emera US Finance LP 4.75% 2046 | 8,333 | 8,327 |
| Empresa Nacional de Electricidad SA 4.25% 2024 | 900 | 901 |
| Enel Chile SA 4.875% 2028 | 955 | 978 |
| Enel Finance International SA 2.875% 20227 | 4,900 | 4,731 |
| Enel Finance International SA 2.75% 20237 | 18,850 | 17,788 |
| Enel Finance International SA 3.625% 20277 | 10,750 | 10,009 |
| Enel Finance International SA 3.50% 20287 | 12,200 | 11,148 |
| Enel Finance International SA 6.00% 20397 | 3,000 | 3,388 |
| Enel Società per Azioni 8.75% 20737,8 | 12,000 | 13,305 |
| Entergy Corp. 4.00% 2022 | 2,220 | 2,244 |
| Entergy Corp. 2.95% 2026 | 5,000 | 4,594 |
| Entergy Louisiana, LLC 3.30% 2022 | 1,470 | 1,445 |
| Eversource Energy 2.80% 2023 | 1,868 | 1,802 |
| Exelon Corp. 3.497% 20228 | 21,138 | 20,938 |
| Exelon Corp. 3.95% 2025 | 1,479 | 1,475 |
| Exelon Corp. 3.40% 2026 | 6,035 | 5,781 |
| FirstEnergy Corp. 3.90% 2027 | 32,340 | 31,588 |
| FirstEnergy Corp. 3.50% 20287 | 4,000 | 3,808 |
| FirstEnergy Corp. 4.85% 2047 | 12,765 | 13,172 |
| FirstEnergy Corp., Series B, 4.25% 2023 | 42,305 | 42,982 |
| Great Plains Energy Inc. 4.20% 2048 | 325 | 319 |
| Iberdrola Finance Ireland 5.00% 20197 | 1,060 | 1,080 |
| Israel Electric Corp. Ltd. 8.10% 20967 | 4,905 | 6,548 |
| MidAmerican Energy Holdings Co. 2.40% 2019 | 9,000 | 8,987 |
| Mississippi Power Co. 4.25% 2042 | 14,000 | 12,929 |
| National Grid Plc 3.15% 20277 | 1,105 | 1,043 |
| National Rural Utilities Cooperative Finance Corp. 2.95% 2024 | 6,000 | 5,790 |
| National Rural Utilities Cooperative Finance Corp. 3.05% 2027 | 12,000 | 11,376 |
| New York State Electric & Gas Corp. 3.25% 20267 | 3,000 | 2,884 |
| Niagara Mohawk Power Corp. 3.508% 20247 | 3,150 | 3,132 |
| Niagara Mohawk Power Corp. 4.278% 20347 | 2,000 | 2,042 |
The Income Fund of America — Page 19 of 37
Bonds, notes & other debt instruments
Corporate bonds & notes (continued)
Utilities (continued) | Principal amount
(000) | Value
(000) |
| NiSource Finance Corp. 2.65% 2022 | $1,775 | $1,704 |
| Northern States Power Co. 5.25% 2035 | 2,588 | 2,917 |
| Northern States Power Co. 4.125% 2044 | 11,000 | 11,067 |
| NRG Energy, Inc. 6.25% 2022 | 26,525 | 27,420 |
| NRG Energy, Inc. 7.25% 2026 | 2,000 | 2,140 |
| NV Energy, Inc 6.25% 2020 | 920 | 979 |
| Pacific Gas and Electric Co. 2.45% 2022 | 3,441 | 3,255 |
| Pacific Gas and Electric Co. 3.25% 2023 | 2,695 | 2,627 |
| Pacific Gas and Electric Co. 3.85% 2023 | 10,825 | 10,647 |
| Pacific Gas and Electric Co. 3.40% 2024 | 8,403 | 8,012 |
| Pacific Gas and Electric Co. 3.75% 2024 | 3,478 | 3,399 |
| Pacific Gas and Electric Co. 3.50% 2025 | 11,144 | 10,569 |
| Pacific Gas and Electric Co. 2.95% 2026 | 2,524 | 2,283 |
| Pacific Gas and Electric Co. 3.30% 2027 | 2,700 | 2,477 |
| Pacific Gas and Electric Co. 3.30% 2027 | 421 | 387 |
| Pacific Gas and Electric Co. 5.80% 2037 | 1,022 | 1,094 |
| Pacific Gas and Electric Co. 6.35% 2038 | 1,495 | 1,645 |
| PacifiCorp., First Mortgage Bonds, 4.125% 2049 | 14,900 | 14,923 |
| Pennsylvania Electric Co. 3.25% 20287 | 4,000 | 3,721 |
| Progress Energy, Inc. 7.00% 2031 | 8,221 | 10,419 |
| Progress Energy, Inc. 7.75% 2031 | 6,100 | 8,105 |
| Public Service Co. of Colorado 5.125% 2019 | 900 | 917 |
| Public Service Co. of Colorado 4.10% 2048 | 927 | 940 |
| Public Service Enterprise Group Inc. 2.00% 2021 | 5,775 | 5,511 |
| Public Service Enterprise Group Inc. 2.65% 2022 | 11,965 | 11,511 |
| Puget Energy, Inc. 6.50% 2020 | 11,317 | 12,054 |
| Puget Energy, Inc. 6.00% 2021 | 3,945 | 4,199 |
| Puget Energy, Inc. 5.625% 2022 | 12,652 | 13,418 |
| SCANA Corp. 6.25% 2020 | 4,746 | 4,886 |
| SCANA Corp. 4.75% 2021 | 14,327 | 14,462 |
| SCANA Corp. 4.125% 2022 | 6,359 | 6,288 |
| South Carolina Electric & Gas Co. 5.30% 2033 | 4,292 | 4,566 |
| South Carolina Electric & Gas Co. 5.45% 2041 | 11,608 | 12,550 |
| South Carolina Electric & Gas Co. 4.35% 2042 | 668 | 649 |
| South Carolina Electric & Gas Co. 4.10% 2046 | 4,700 | 4,307 |
| Southern California Edison Co., 1.845% 20229 | 4,757 | 4,632 |
| State Grid Overseas Investment Ltd. 3.50% 20277 | 2,000 | 1,912 |
| Talen Energy Corp. 4.60% 2021 | 3,255 | 2,799 |
| Talen Energy Corp. 9.50% 20227 | 16,235 | 15,667 |
| Talen Energy Corp. 10.50% 20267 | 3,815 | 3,310 |
| Tampa Electric Co. 2.60% 2022 | 3,598 | 3,465 |
| Tampa Electric Co. 4.35% 2044 | 8,330 | 8,270 |
| Teco Finance, Inc. 5.15% 2020 | 14,443 | 14,814 |
| Veolia Environnement 6.75% 2038 | 500 | 605 |
| Virginia Electric and Power Co. 3.45% 2024 | 560 | 554 |
| Virginia Electric and Power Co. 3.10% 2025 | 2,625 | 2,520 |
| Xcel Energy Inc. 4.00% 2028 | 15,059 | 15,176 |
| | | 948,945 |
| Materials 0.76% | | |
| AK Steel Holding Corp. 7.625% 2021 | 3,900 | 3,988 |
| AK Steel Holding Corp. 7.50% 2023 | 3,045 | 3,159 |
| AK Steel Holding Corp. 6.375% 2025 | 1,500 | 1,391 |
| AK Steel Holding Corp. 7.00% 2027 | 1,300 | 1,238 |
The Income Fund of America — Page 20 of 37
Bonds, notes & other debt instruments
Corporate bonds & notes (continued)
Materials (continued) | Principal amount
(000) | Value
(000) |
| Alcoa Inc. 6.125% 20287 | $2,070 | $2,137 |
| Ardagh Group SA 7.125% 202312 | 3,250 | 3,303 |
| Ardagh Packaging Finance 4.25% 20227 | 900 | 887 |
| Ardagh Packaging Finance 4.625% 20237 | 3,920 | 3,881 |
| Ardagh Packaging Finance 6.00% 20257 | 7,980 | 7,810 |
| Axalta Coating Systems LLC 4.875% 20247 | 7,250 | 7,196 |
| Ball Corp. 4.375% 2020 | 15,225 | 15,434 |
| Berry Plastics Corp. 5.50% 2022 | 2,400 | 2,439 |
| BWAY Parent Co. Inc., 5.50% 20247 | 3,100 | 3,034 |
| BWAY Parent Co. Inc., 7.25% 20257 | 6,070 | 5,930 |
| BWAY Parent Co. Inc., Term Loan, (3-month USD-LIBOR + 3.25%) 5.581% 20249,10,11 | 2,233 | 2,230 |
| Carlyle Group LP 8.75% 20237,12 | 3,375 | 3,396 |
| CF Industries, Inc. 3.45% 2023 | 2,190 | 2,105 |
| CF Industries, Inc. 4.95% 2043 | 19,035 | 16,156 |
| CF Industries, Inc. 5.375% 2044 | 4,935 | 4,398 |
| Chemours Co. 6.625% 2023 | 20,130 | 21,111 |
| Chevron Phillips Chemical Company LLC 3.30% 20237 | 4,095 | 4,048 |
| Cleveland-Cliffs Inc. 4.80% 2020 | 3,000 | 2,985 |
| Cleveland-Cliffs Inc. 4.875% 2021 | 7,695 | 7,676 |
| Cleveland-Cliffs Inc. 4.875% 20247 | 11,850 | 11,613 |
| Cleveland-Cliffs Inc. 5.75% 2025 | 87,210 | 84,921 |
| Commercial Metals Co. 5.375% 2027 | 3,850 | 3,590 |
| Consolidated Energy Finance SA 6.50% 20267 | 7,300 | 7,209 |
| Constellium NV 5.875% 20267 | 3,700 | 3,654 |
| CRH America, Inc. 3.875% 20257 | 2,000 | 1,968 |
| CRH America, Inc. 5.125% 20457 | 1,000 | 1,017 |
| CVR Partners, LP 9.25% 20237 | 12,550 | 13,397 |
| Dow Chemical Co. 4.125% 2021 | 5,950 | 6,063 |
| Dow Chemical Co. 5.25% 2041 | 4,000 | 4,229 |
| Dow Chemical Co. 4.625% 2044 | 1,200 | 1,190 |
| Eastman Chemical Co. 2.70% 2020 | 12,000 | 11,929 |
| First Quantum Minerals Ltd. 7.00% 20217 | 58,042 | 58,731 |
| First Quantum Minerals Ltd. 7.25% 20227 | 10,475 | 10,580 |
| First Quantum Minerals Ltd. 6.50% 20247 | 4,425 | 4,326 |
| First Quantum Minerals Ltd. 7.50% 20257 | 52,050 | 52,571 |
| First Quantum Minerals Ltd. 6.875% 20267 | 22,800 | 22,344 |
| Freeport-McMoRan Inc. 3.55% 2022 | 47,250 | 45,892 |
| FXI Holdings, Inc. 7.875% 20247 | 3,900 | 3,812 |
| Georgia-Pacific Corp. 2.539% 20197 | 12,000 | 11,915 |
| H.I.G. Capital, LLC 6.75% 20247 | 20,140 | 19,762 |
| Hexion Inc. 10.375% 20227 | 3,765 | 3,723 |
| Holcim Ltd. 6.00% 20197 | 1,607 | 1,665 |
| Holcim Ltd. 5.15% 20237 | 12,595 | 13,150 |
| Huntsman International LLC 4.875% 2020 | 18,750 | 19,102 |
| INEOS Group Holdings SA 5.625% 20247 | 6,800 | 6,749 |
| International Paper Co. 7.30% 2039 | 5,615 | 7,186 |
| LSB Industries, Inc. 9.625% 20237 | 7,360 | 7,516 |
| LYB International Finance BV 3.50% 2027 | 1,500 | 1,423 |
| LYB International Finance BV 4.875% 2044 | 400 | 405 |
| LyondellBasell Industries NV 6.00% 2021 | 2,500 | 2,665 |
| Mosaic Co. 3.25% 2022 | 1,500 | 1,462 |
| Mosaic Co. 4.05% 2027 | 500 | 482 |
| Nova Chemicals Corp. 5.25% 20277 | 20,635 | 19,366 |
| Novelis Corp. 6.25% 20247 | 6,625 | 6,658 |
The Income Fund of America — Page 21 of 37
Bonds, notes & other debt instruments
Corporate bonds & notes (continued)
Materials (continued) | Principal amount
(000) | Value
(000) |
| Novelis Corp. 5.875% 20267 | $12,500 | $12,016 |
| Olin Corp. 5.00% 2030 | 1,950 | 1,850 |
| Owens-Illinois, Inc. 5.875% 20237 | 9,000 | 9,169 |
| Plastipak Holdings, Inc., Term Loan, (3-month USD-LIBOR + 2.50%) 4.59% 20249,10,11 | 1,315 | 1,315 |
| Platform Specialty Products Corp. 6.50% 20227 | 11,975 | 12,319 |
| Platform Specialty Products Corp. 5.875% 20257 | 13,830 | 13,912 |
| Praxair, Inc. 3.00% 2021 | 2,500 | 2,491 |
| Rayonier Advanced Materials Inc. 5.50% 20247 | 13,933 | 13,145 |
| Reynolds Group Inc. 5.75% 20209 | 21,059 | 21,123 |
| Reynolds Group Inc. 7.00% 20247 | 4,200 | 4,260 |
| Ryerson Inc. 11.00% 20227 | 44,173 | 48,811 |
| Scotts Miracle-Gro Co. 5.25% 2026 | 4,845 | 4,639 |
| Sherwin-Williams Co. 2.75% 2022 | 7,640 | 7,421 |
| Sherwin-Williams Co. 3.125% 2024 | 1,500 | 1,446 |
| Sherwin-Williams Co. 3.45% 2027 | 9,210 | 8,787 |
| Sherwin-Williams Co. 4.50% 2047 | 2,115 | 2,089 |
| SPCM SA 4.875% 20257 | 11,485 | 11,026 |
| Standard Industries Inc. 6.00% 20257 | 4,600 | 4,681 |
| Summit Materials, Inc. 8.50% 2022 | 875 | 945 |
| Summit Materials, Inc. 6.125% 2023 | 9,325 | 9,512 |
| Teck Resources Ltd. 5.20% 2042 | 500 | 464 |
| Trinseo SA 5.375% 20257 | 1,960 | 1,940 |
| Tronox Ltd. 5.75% 20257 | 2,550 | 2,464 |
| Tronox Ltd. 6.50% 20267 | 2,615 | 2,609 |
| United States Steel Corp. 7.375% 2020 | 6,725 | 7,145 |
| Vale SA 6.25% 2026 | 2,205 | 2,430 |
| Venator Materials Corp. 5.75% 20257 | 8,665 | 8,059 |
| Warrior Met Coal, Inc. 8.00% 20247 | 9,775 | 10,129 |
| Westlake Chemical Corp. 4.375% 2047 | 1,695 | 1,581 |
| Zekelman Industries Inc. 9.875% 20237 | 5,246 | 5,744 |
| | | 831,719 |
| Telecommunication services 0.75% | | |
| Altice Finco SA 8.125% 20247 | 1,950 | 1,994 |
| Altice France SA 8.125% 20277 | 2,725 | 2,786 |
| Altice NV 6.625% 20237 | 10,000 | 10,138 |
| Altice SA 7.625% 20257 | 4,100 | 3,854 |
| AT&T Inc. 4.30% 20307 | 3,513 | 3,357 |
| British Telecommunications PLC 9.125% 2030 (9.625% on 12/15/2030)8 | 8,831 | 12,717 |
| CenturyLink, Inc. 6.75% 2023 | 33,275 | 34,190 |
| CenturyLink, Inc., Series T, 5.80% 2022 | 5,200 | 5,220 |
| Colorado Buyer Inc., Term Loan, (3-month USD-LIBOR + 7.25%) 9.61% 20259,10,11 | 525 | 522 |
| Deutsche Telekom International Finance BV 1.95% 20217 | 8,700 | 8,308 |
| Deutsche Telekom International Finance BV 2.82% 20227 | 10,500 | 10,205 |
| Deutsche Telekom International Finance BV 3.60% 20277 | 5,000 | 4,770 |
| Deutsche Telekom International Finance BV 4.375% 20287 | 285 | 287 |
| Deutsche Telekom International Finance BV 9.25% 2032 | 13,620 | 19,670 |
| Deutsche Telekom International Finance BV 4.875% 20427 | 2,000 | 2,019 |
| France Télécom 4.125% 2021 | 15,000 | 15,320 |
| France Télécom 9.00% 20318 | 5,721 | 7,995 |
| Frontier Communications Corp. 7.125% 2019 | 2,450 | 2,475 |
| Frontier Communications Corp. 10.50% 2022 | 38,585 | 35,209 |
| Frontier Communications Corp. 11.00% 2025 | 78,220 | 63,749 |
| Frontier Communications Corp. 8.50% 20267 | 10,800 | 10,409 |
The Income Fund of America — Page 22 of 37
Bonds, notes & other debt instruments
Corporate bonds & notes (continued)
Telecommunication services (continued) | Principal amount
(000) | Value
(000) |
| Inmarsat PLC 4.875% 20227 | $30,865 | $30,711 |
| Inmarsat PLC 6.50% 20247 | 10,025 | 10,100 |
| Intelsat Jackson Holding Co. 7.25% 2020 | 15,710 | 15,847 |
| Intelsat Jackson Holding Co. 7.50% 2021 | 80,710 | 81,315 |
| Intelsat Jackson Holding Co. 5.50% 2023 | 11,975 | 11,062 |
| Intelsat Jackson Holding Co. 6.625% 20249,11 | 7,700 | 8,043 |
| Intelsat Jackson Holding Co. 8.00% 20247 | 12,125 | 12,777 |
| Ligado Networks, Term Loan, (3-month USD-LIBOR + 8.75%) 11.069% 20209,10,11,12 | 54,901 | 44,881 |
| Neptune Finco Corp. (Altice NV) 6.625% 20257 | 4,600 | 4,761 |
| Numericable Group SA 7.375% 20267 | 10,200 | 10,168 |
| Orange SA 5.50% 2044 | 3,000 | 3,359 |
| Qwest Capital Funding, Inc. 7.625% 2021 | 3,900 | 4,005 |
| SoftBank Group Corp. 3.36% 20237,9 | 17,428 | 17,385 |
| Sprint Corp. 7.00% 2020 | 2,000 | 2,095 |
| Sprint Corp. 7.25% 2021 | 3,225 | 3,398 |
| Sprint Corp. 11.50% 2021 | 5,880 | 6,953 |
| Sprint Corp. 7.875% 2023 | 9,250 | 9,886 |
| Sprint Corp. 7.125% 2024 | 1,700 | 1,751 |
| Sprint Corp. 6.875% 2028 | 19,615 | 18,929 |
| T-Mobile US, Inc. 6.50% 2026 | 4,125 | 4,336 |
| Trilogy International Partners, LLC 8.875% 20227 | 29,300 | 29,666 |
| Verizon Communications Inc. 4.50% 2033 | 10,000 | 9,909 |
| Verizon Communications Inc. 4.125% 2046 | 44,341 | 40,045 |
| Verizon Communications Inc. 4.862% 2046 | 9,379 | 9,391 |
| Verizon Communications Inc. 4.522% 2048 | 78,900 | 75,040 |
| Vodafone Group PLC 4.125% 2025 | 15,500 | 15,528 |
| Vodafone Group PLC 4.375% 2028 | 8,050 | 8,079 |
| Vodafone Group PLC 5.25% 2048 | 4,275 | 4,445 |
| Wind Tre SpA 5.00% 20267 | 35,150 | 31,733 |
| Zayo Group Holdings, Inc. 6.375% 2025 | 4,300 | 4,467 |
| Zayo Group Holdings, Inc. 5.75% 20277 | 3,675 | 3,647 |
| Ziggo Bond Finance BV 5.50% 20277 | 42,225 | 40,325 |
| | | 829,231 |
| Industrials 0.72% | | |
| ABB Finance (USA) Inc. 2.875% 2022 | 1,000 | 983 |
| ACCO Brands Corp. 5.25% 20247 | 7,200 | 7,164 |
| ADT Corp. 3.50% 2022 | 13,100 | 12,494 |
| Airbus Group SE 2.70% 20237 | 885 | 856 |
| Allison Transmission Holdings, Inc. 5.00% 20247 | 19,005 | 18,720 |
| American Airlines, Inc. 5.50% 20197 | 2,350 | 2,397 |
| American Airlines, Inc., Series 2013-2, Class A, 4.95% 20249 | 6,231 | 6,413 |
| ARAMARK Corp. 5.125% 2024 | 9,225 | 9,329 |
| ARAMARK Corp. 5.00% 20287 | 1,490 | 1,441 |
| Ashtead Group PLC 4.125% 20257 | 4,170 | 3,988 |
| Associated Materials, LLC 9.00% 20247 | 45,825 | 48,460 |
| Avis Budget Group, Inc. 5.50% 2023 | 14,820 | 14,690 |
| Beacon Roofing Supply, Inc. 4.875% 20257 | 5,635 | 5,277 |
| Bohai Financial Investment Holding Co., Ltd. 5.25% 20227 | 2,750 | 2,760 |
| Bohai Financial Investment Holding Co., Ltd. 5.50% 20247 | 8,250 | 8,168 |
| Brand Energy 8.50% 20257 | 10,155 | 10,396 |
| Brookfield WEC Holdings Inc., Term Loan, (3-month USD-LIBOR + 3.75%) 6.089% 20259,10,11 | 5,350 | 5,393 |
| Brookfield WEC Holdings Inc., Term Loan, (3-month USD-LIBOR + 6.75%) 9.089% 20269,10,11 | 1,605 | 1,636 |
| Builders FirstSource, Inc. 5.625% 20247 | 11,290 | 11,107 |
The Income Fund of America — Page 23 of 37
Bonds, notes & other debt instruments
Corporate bonds & notes (continued)
Industrials (continued) | Principal amount
(000) | Value
(000) |
| BWX Technologies, Inc. 5.375% 20267 | $1,275 | $1,297 |
| Canadian National Railway Co. 3.65% 2048 | 7,460 | 7,049 |
| CD&R Waterworks Merger Sub, LLC 6.125% 20257 | 4,850 | 4,680 |
| CEVA Group PLC, Apollo Global Securities LLC LOC, (3-month USD-LIBOR + 5.50%) 4.292% 20219,10,11 | 2,021 | 2,025 |
| CEVA Group PLC, Term Loan B, (3-month USD-LIBOR + 5.50%) 7.577% 20219,10,11 | 3,519 | 3,525 |
| CEVA Logistics Canada, ULC, Term Loan, (3-month USD-LIBOR + 5.50%) 7.577% 20219,10,11 | 440 | 441 |
| CEVA Logistics Holdings BV, Term Loan, (3-month USD-LIBOR + 5.50%) 7.577% 20219,10,11 | 861 | 862 |
| Continental Airlines, Inc., Series 1999-2, Class B, 7.566% 20219 | 1 | 1 |
| Continental Airlines, Inc., Series 2007-1, Class B, 6.903% 20229 | 3,063 | 3,173 |
| Continental Airlines, Inc., Series 2000-1, Class B, 8.388% 20229 | —6 | —6 |
| CSX Corp. 3.80% 2028 | 12,835 | 12,693 |
| DAE Aviation Holdings, Inc. 10.00% 20237 | 27,920 | 30,084 |
| Deck Chassis Acquisition Inc. 10.00% 20237 | 11,175 | 11,901 |
| Delta Air Lines, Inc., Series 2002-1, Class G-1, MBIA insured, 6.718% 20249 | 3,956 | 4,226 |
| ERAC USA Finance Co. 5.25% 20207 | 5,000 | 5,184 |
| Euramax International, Inc. 12.00% 20207 | 22,200 | 23,310 |
| Fortive Corp. 2.35% 2021 | 2,825 | 2,734 |
| General Dynamics Corp. 3.375% 2023 | 3,990 | 3,999 |
| General Dynamics Corp. 3.50% 2025 | 9,400 | 9,432 |
| General Dynamics Corp. 3.75% 2028 | 8,290 | 8,428 |
| General Electric Capital Corp., Series A, 6.00% 2019 | 2,577 | 2,657 |
| General Electric Co. 2.70% 2022 | 7,750 | 7,511 |
| General Electric Co. 4.125% 2042 | 11,000 | 10,214 |
| General Electric Co. 5.00% (undated) (3-month USD-LIBOR + 3.33% on 1/21/2021)8 | 95,170 | 93,614 |
| Hardwoods Acquisition Inc 7.50% 20217 | 13,649 | 12,557 |
| Harris Corp. 2.70% 2020 | 1,315 | 1,304 |
| Harris Corp. 3.832% 2025 | 740 | 727 |
| Hertz Global Holdings Inc. 7.625% 20227 | 26,085 | 25,629 |
| JELD-WEN Holding, Inc. 4.875% 20277 | 4,975 | 4,645 |
| KAR Auction Services, Inc. 5.125% 20257 | 6,615 | 6,466 |
| KLX Inc. 5.875% 20227 | 2,140 | 2,223 |
| Kratos Defense & Security Solutions, Inc. 6.50% 20257 | 3,840 | 3,970 |
| Lockheed Martin Corp. 1.85% 2018 | 2,535 | 2,531 |
| Lockheed Martin Corp. 2.50% 2020 | 3,250 | 3,209 |
| Lockheed Martin Corp. 3.10% 2023 | 695 | 686 |
| Lockheed Martin Corp. 4.50% 2036 | 560 | 590 |
| Lockheed Martin Corp. 4.70% 2046 | 4,560 | 4,932 |
| LSC Communications, Inc. 8.75% 20237 | 17,550 | 17,243 |
| Multi-Color Corp. 4.875% 20257 | 6,605 | 6,159 |
| Navistar International Corp. 6.625% 20257 | 1,720 | 1,806 |
| Navistar International Corp., Term Loan, (3-month USD-LIBOR + 4.75%) 5.60% 20249,10,11 | 1,975 | 1,988 |
| Nielsen Finance LLC and Nielsen Finance Co. 5.00% 20227 | 4,850 | 4,726 |
| Northrop Grumman Corp., 2.55% 2022 | 6,825 | 6,588 |
| Northrop Grumman Corp., 2.93% 2025 | 9,570 | 9,140 |
| Northrop Grumman Corp., 3.25% 2028 | 15,195 | 14,419 |
| Pisces Parent, LLC 8.00% 20267 | 11,260 | 11,654 |
| Pisces Parent, LLC, Term Loan B, (3-month USD-LIBOR + 3.75%) 6.087% 20259,10,11 | 4,535 | 4,548 |
| PrimeSource Building Products Inc 9.00% 20237 | 2,810 | 2,929 |
| R.R. Donnelley & Sons Co. 7.625% 20201 | 6,707 | 6,908 |
| R.R. Donnelley & Sons Co. 7.875% 20211 | 21,445 | 21,981 |
| R.R. Donnelley & Sons Co. 6.50% 20231 | 14,780 | 14,817 |
| Rexnord Corp. 4.875% 20257 | 7,845 | 7,570 |
| Rockwell Collins, Inc. 2.80% 2022 | 6,320 | 6,151 |
| Rockwell Collins, Inc. 3.20% 2024 | 6,370 | 6,163 |
The Income Fund of America — Page 24 of 37
Bonds, notes & other debt instruments
Corporate bonds & notes (continued)
Industrials (continued) | Principal amount
(000) | Value
(000) |
| Roper Technologies, Inc. 2.80% 2021 | $1,725 | $1,687 |
| Siemens AG 1.70% 20217 | 11,000 | 10,490 |
| Siemens AG 2.70% 20227 | 12,975 | 12,683 |
| Siemens AG 2.35% 20267 | 3,960 | 3,586 |
| Staples Inc. 8.50% 20257 | 7,515 | 7,083 |
| TransDigm Inc. 5.50% 2020 | 12,000 | 12,030 |
| Union Pacific Corp. 3.75% 2025 | 4,720 | 4,757 |
| Union Pacific Corp. 3.95% 2028 | 10,175 | 10,332 |
| Union Pacific Corp. 4.50% 2048 | 1,495 | 1,567 |
| United Air Lines, Inc., Series 2007-1, Class B, 7.336% 20217,9 | 2,633 | 2,713 |
| United Air Lines, Inc., Series 2007-1, Class A, 6.636% 20249 | 4,637 | 4,886 |
| United Rentals, Inc. 4.625% 2025 | 6,950 | 6,724 |
| United Rentals, Inc. 4.875% 2028 | 3,500 | 3,278 |
| United Technologies Corp. 2.30% 2022 | 10,117 | 9,732 |
| United Technologies Corp. 3.125% 2027 | 16,000 | 15,020 |
| Virgin Australia Holdings Ltd. 8.50% 20197 | 41,650 | 42,223 |
| Virgin Australia Holdings Ltd. 7.875% 20217 | 1,750 | 1,741 |
| | | 785,503 |
| Information technology 0.52% | | |
| Almonde Inc., Term Loan, (3-month USD-LIBOR + 7.25%) 9.557% 20259,10,11 | 25,375 | 24,561 |
| Apple Inc. 2.75% 2025 | 13,000 | 12,491 |
| Apple Inc. 2.90% 2027 | 3,000 | 2,845 |
| Apple Inc. 3.00% 2027 | 3,000 | 2,865 |
| Apple Inc. 3.20% 2027 | 8,500 | 8,266 |
| Apple Inc. 3.35% 2027 | 4,855 | 4,777 |
| Applied Systems, Inc., Term Loan, (3-month USD-LIBOR + 7.00%) 9.334% 20259,10,11 | 3,985 | 4,122 |
| Blackboard Inc., Term Loan B4, (3-month USD-LIBOR + 5.00%) 7.333% 20219,10,11 | 5,500 | 5,220 |
| Broadcom Ltd. 3.00% 2022 | 38,500 | 37,413 |
| Broadcom Ltd. 2.65% 2023 | 10,500 | 9,870 |
| Broadcom Ltd. 3.625% 2024 | 39,875 | 38,458 |
| Broadcom Ltd. 3.875% 2027 | 41,270 | 38,726 |
| Camelot Finance SA 7.875% 20247 | 11,760 | 11,701 |
| CCC Information Services Inc., Term Loan, (3-month USD-LIBOR + 6.75%) 8.827% 20259,10,11 | 950 | 960 |
| Dell Inc. 2.65% 2020 | 1,300 | 1,268 |
| Dell Inc. 7.125% 20247 | 3,225 | 3,468 |
| EchoStar Corp. 6.625% 2026 | 3,300 | 3,152 |
| Ellucian, Inc. 9.00% 20237 | 775 | 809 |
| First Data Corp. 5.375% 20237 | 10,950 | 11,128 |
| First Data Corp. 7.00% 20237 | 71,824 | 75,325 |
| First Data Corp. 5.00% 20247 | 8,325 | 8,429 |
| First Data Corp. 5.75% 20247 | 7,650 | 7,851 |
| Genesys Telecommunications Laboratories, Inc. 10.00% 20247 | 10,800 | 12,015 |
Genesys Telecommunications Laboratories, Inc., Term Loan B3,
(3-month USD-LIBOR + 3.50%) 5.834% 20239,10,11 | 2,725 | 2,742 |
| Gogo Inc. 12.50% 20227 | 81,830 | 86,944 |
| Infor (US), Inc. 6.50% 2022 | 9,770 | 9,941 |
| Infor Software 7.125% 20217,12 | 13,325 | 13,508 |
| Internet Brands, Inc., Term Loan, (3-month USD-LIBOR + 3.75%) 5.829% 20249,10,11 | 3,194 | 3,205 |
| Internet Brands, Inc., Term Loan, (3-month USD-LIBOR + 7.50%) 9.579% 20259,10,11 | 5,185 | 5,269 |
| Kronos Inc., Term Loan B, (3-month USD-LIBOR + 3.00%) 5.358% 20239,10,11 | 1,629 | 1,636 |
| Kronos Inc., Term Loan B, (3-month USD-LIBOR + 8.25%) 10.608% 20249,10,11 | 24,260 | 25,067 |
| McAfee, LLC, Term Loan, (3-month USD-LIBOR + 4.50%) 6.572% 20249,10,11 | 12,545 | 12,651 |
| McAfee, LLC, Term Loan, (3-month USD-LIBOR + 8.50%) 10.572% 20259,10,11 | 175 | 179 |
The Income Fund of America — Page 25 of 37
Bonds, notes & other debt instruments
Corporate bonds & notes (continued)
Information technology (continued) | Principal amount
(000) | Value
(000) |
| Microsoft Corp. 1.55% 2021 | $4,500 | $4,323 |
| Microsoft Corp. 2.65% 2022 | 6,000 | 5,903 |
| Microsoft Corp. 2.875% 2024 | 6,865 | 6,732 |
| Microsoft Corp. 3.30% 2027 | 2,375 | 2,353 |
| Microsoft Corp. 4.20% 2035 | 6,000 | 6,346 |
| Microsoft Corp. 4.25% 2047 | 1,750 | 1,871 |
| Solera Holdings, Inc. 10.50% 20247 | 3,700 | 4,110 |
| Tempo Acquisition LLC 6.75% 20257 | 6,050 | 5,864 |
| Unisys Corp. 10.75% 20227 | 22,115 | 24,879 |
| Veritas Holdings Limited 7.50% 20237 | 7,420 | 7,030 |
| Veritas Holdings Limited 10.50% 20247 | 2,950 | 2,493 |
| Vertafore Inc., Term Loan, (3-month USD-LIBOR + 7.25%) 9.331% 20269,10,11 | 2,025 | 2,049 |
| Visa Inc. 3.15% 2025 | 8,000 | 7,784 |
| VMware, Inc. 2.95% 2022 | 2,500 | 2,412 |
| | | 571,011 |
| Consumer staples 0.52% | | |
| Altria Group, Inc. 9.25% 2019 | 16,584 | 17,617 |
| Altria Group, Inc. 9.95% 2038 | 23,500 | 36,875 |
| Altria Group, Inc. 4.25% 2042 | 20,000 | 18,975 |
| Altria Group, Inc. 4.50% 2043 | 4,000 | 3,921 |
| Altria Group, Inc. 5.375% 2044 | 2,000 | 2,198 |
| Anheuser-Busch InBev NV 3.50% 2024 | 6,525 | 6,510 |
| Anheuser-Busch InBev NV 3.65% 2026 | 9,460 | 9,305 |
| Anheuser-Busch InBev NV 4.00% 2028 | 10,525 | 10,547 |
| Anheuser-Busch InBev NV 4.95% 2042 | 9,095 | 9,580 |
| Anheuser-Busch InBev NV 4.90% 2046 | 3,215 | 3,360 |
| Anheuser-Busch InBev NV 4.60% 2048 | 3,215 | 3,245 |
| Avon Products, Inc. 7.875% 20227 | 13,155 | 13,089 |
| B&G Foods, Inc. 4.625% 2021 | 2,100 | 2,087 |
| B&G Foods, Inc. 5.25% 2025 | 16,243 | 15,634 |
| British American Tobacco International Finance PLC 3.95% 20257 | 8,000 | 7,874 |
| British American Tobacco PLC 2.297% 20207 | 15,000 | 14,718 |
| British American Tobacco PLC 2.764% 20227 | 15,690 | 15,164 |
| British American Tobacco PLC 3.222% 20247 | 35,000 | 33,477 |
| British American Tobacco PLC 3.557% 20277 | 15,520 | 14,631 |
| British American Tobacco PLC 4.39% 20377 | 9,000 | 8,630 |
| British American Tobacco PLC 4.54% 20477 | 10,440 | 9,939 |
| Constellation Brands, Inc. 2.65% 2022 | 19,835 | 18,992 |
| Constellation Brands, Inc. 2.70% 2022 | 1,740 | 1,684 |
| Constellation Brands, Inc. 3.20% 2023 | 11,299 | 11,053 |
| Constellation Brands, Inc. 3.60% 2028 | 1,850 | 1,755 |
| Constellation Brands, Inc. 4.10% 2048 | 4,825 | 4,442 |
| Costco Wholesale Corp. 2.30% 2022 | 3,500 | 3,394 |
| Costco Wholesale Corp. 2.75% 2024 | 2,000 | 1,930 |
| Costco Wholesale Corp. 3.00% 2027 | 7,500 | 7,214 |
| Cott Beverages Inc. 5.50% 20257 | 6,825 | 6,586 |
| Energizer Gamma Acquisition Inc. 6.375% 20267 | 5,385 | 5,548 |
| First Quality Enterprises, Inc. 5.00% 20257 | 5,875 | 5,434 |
| Herbalife Ltd., Term Loan, (3-month USD-LIBOR + 5.50%) 7.577% 20239,10,11 | 2,638 | 2,651 |
| Imperial Tobacco Finance PLC 3.50% 20237 | 10,000 | 9,771 |
| Maple Escrow 4.057% 20237 | 20,795 | 20,962 |
| Maple Escrow 4.417% 20257 | 7,708 | 7,849 |
| Maple Escrow 4.597% 20287 | 9,750 | 9,948 |
The Income Fund of America — Page 26 of 37
Bonds, notes & other debt instruments
Corporate bonds & notes (continued)
Consumer staples (continued) | Principal amount
(000) | Value
(000) |
| Maple Escrow 4.985% 20387 | $8,972 | $9,223 |
| Maple Escrow 5.085% 20487 | 8,000 | 8,329 |
| Molson Coors Brewing Co. 1.45% 2019 | 1,645 | 1,624 |
| Molson Coors Brewing Co. 1.90% 2019 | 210 | 209 |
| Molson Coors Brewing Co. 2.25% 2020 | 680 | 670 |
| Molson Coors Brewing Co. 2.10% 2021 | 8,880 | 8,535 |
| Molson Coors Brewing Co. 3.00% 2026 | 2,770 | 2,542 |
| Molson Coors Brewing Co. 4.20% 2046 | 4,200 | 3,844 |
| Pernod Ricard SA 4.45% 20227 | 12,625 | 12,958 |
| Philip Morris International Inc. 2.375% 2022 | 5,035 | 4,834 |
| Philip Morris International Inc. 2.50% 2022 | 16,500 | 15,868 |
| Philip Morris International Inc. 2.625% 2022 | 8,405 | 8,186 |
| Philip Morris International Inc. 4.25% 2044 | 2,000 | 1,951 |
| Pilgrim’s Pride Corp. 5.75% 20257 | 2,565 | 2,459 |
| Pinnacle Foods Inc. 5.875% 2024 | 4,675 | 4,938 |
| Post Holdings, Inc. 5.00% 20267 | 4,650 | 4,387 |
| Post Holdings, Inc. 5.625% 20287 | 5,485 | 5,245 |
| Prestige Brands International Inc. 5.375% 20217 | 555 | 558 |
| Reckitt Benckiser Group PLC 2.375% 20227 | 1,435 | 1,374 |
| Reckitt Benckiser Treasury Services PLC 2.75% 20247 | 3,935 | 3,732 |
| Reynolds American Inc. 3.25% 2020 | 5,510 | 5,510 |
| Reynolds American Inc. 3.25% 2022 | 6,150 | 6,025 |
| Reynolds American Inc. 4.00% 2022 | 890 | 898 |
| Reynolds American Inc. 4.45% 2025 | 5,610 | 5,709 |
| Reynolds American Inc. 5.70% 2035 | 3,130 | 3,426 |
| Reynolds American Inc. 5.85% 2045 | 16,200 | 18,279 |
| Spectrum Brands Inc. 6.125% 2024 | 4,650 | 4,743 |
| Wal-Mart Stores, Inc. 3.125% 2021 | 8,500 | 8,523 |
| Wal-Mart Stores, Inc. 2.35% 2022 | 4,000 | 3,864 |
| Wal-Mart Stores, Inc. 3.40% 2023 | 3,170 | 3,188 |
| Wal-Mart Stores, Inc. 3.70% 2028 | 3,979 | 4,017 |
| Wal-Mart Stores, Inc. 4.05% 2048 | 2,225 | 2,270 |
| WM. Wrigley Jr. Co. 2.90% 20197 | 1,285 | 1,284 |
| WM. Wrigley Jr. Co. 3.375% 20207 | 22,500 | 22,533 |
| | | 568,324 |
| Real estate 0.31% | | |
| Alexandria Real Estate Equities, Inc. 2.75% 2020 | 795 | 789 |
| Alexandria Real Estate Equities, Inc. 3.90% 2023 | 1,600 | 1,603 |
| Alexandria Real Estate Equities, Inc. 4.30% 2026 | 2,200 | 2,196 |
| Alexandria Real Estate Equities, Inc. 3.95% 2028 | 1,695 | 1,631 |
| Alexandria Real Estate Equities, Inc. 4.50% 2029 | 1,355 | 1,353 |
| American Campus Communities, Inc. 3.35% 2020 | 3,380 | 3,368 |
| American Campus Communities, Inc. 3.75% 2023 | 3,985 | 3,955 |
| American Campus Communities, Inc. 4.125% 2024 | 28,615 | 28,486 |
| American Campus Communities, Inc. 3.625% 2027 | 765 | 718 |
| American Tower Corp. 3.40% 2019 | 6,400 | 6,424 |
| American Tower Corp. 3.55% 2027 | 2,525 | 2,362 |
| Brandywine Operating Partnership, LP 3.95% 2023 | 1,639 | 1,631 |
| Corporate Office Properties LP 5.25% 2024 | 9,150 | 9,471 |
| Corporate Office Properties LP 5.00% 2025 | 2,165 | 2,215 |
| DCT Industrial Trust Inc. 4.50% 2023 | 5,570 | 5,748 |
| EPR Properties 4.50% 2025 | 3,630 | 3,581 |
| EPR Properties 4.75% 2026 | 11,740 | 11,490 |
The Income Fund of America — Page 27 of 37
Bonds, notes & other debt instruments
Corporate bonds & notes (continued)
Real estate (continued) | Principal amount
(000) | Value
(000) |
| EPR Properties 4.50% 2027 | $10,725 | $10,227 |
| Equinix, Inc. 5.75% 2025 | 525 | 544 |
| Equinix, Inc. 5.875% 2026 | 1,275 | 1,321 |
| Equinix, Inc. 5.375% 2027 | 16,405 | 16,569 |
| Essex Portfolio LP 3.625% 2022 | 9,550 | 9,502 |
| Essex Portfolio LP 3.25% 2023 | 4,400 | 4,280 |
| Essex Portfolio LP 3.875% 2024 | 5,900 | 5,857 |
| Hospitality Properties Trust 4.25% 2021 | 20,500 | 20,707 |
| Hospitality Properties Trust 5.00% 2022 | 3,500 | 3,605 |
| Hospitality Properties Trust 4.50% 2023 | 7,835 | 7,875 |
| Hospitality Properties Trust 4.50% 2025 | 7,900 | 7,717 |
| Hospitality Properties Trust 3.95% 2028 | 4,225 | 3,845 |
| Host Hotels & Resorts LP 4.50% 2026 | 5,675 | 5,664 |
| Howard Hughes Corp. 5.375% 20257 | 23,325 | 22,888 |
| Iron Mountain Inc. 5.75% 20241 | 5,325 | 5,292 |
| Iron Mountain Inc. 4.875% 20271,7 | 15,905 | 14,653 |
| Iron Mountain Inc. 5.25% 20281,7 | 2,490 | 2,316 |
| Kimco Realty Corp. 3.40% 2022 | 3,030 | 2,985 |
| Medical Properties Trust, Inc. 5.00% 2027 | 7,000 | 6,790 |
| Prologis, Inc. 4.25% 2023 | 25,000 | 25,736 |
| Public Storage 3.094% 2027 | 1,235 | 1,163 |
| Realogy Corp. 4.50% 20197 | 18,600 | 18,693 |
| Realogy Corp. 5.25% 20217 | 3,550 | 3,563 |
| Realogy Corp. 4.875% 20237 | 3,875 | 3,627 |
| SBA Communications Corp. 4.00% 2022 | 7,500 | 7,296 |
| Scentre Group 2.375% 20217 | 4,575 | 4,411 |
| Scentre Group 3.25% 20257 | 3,140 | 2,964 |
| Scentre Group 3.50% 20257 | 5,455 | 5,271 |
| Scentre Group 3.75% 20277 | 3,000 | 2,883 |
| Select Income REIT 3.60% 2020 | 5,775 | 5,746 |
| Select Income REIT 4.15% 2022 | 1,035 | 1,028 |
| WEA Finance LLC 2.70% 20197 | 5,620 | 5,598 |
| WEA Finance LLC 3.25% 20207 | 10,195 | 10,156 |
| Westfield Corp. Ltd. 3.15% 20227 | 6,020 | 5,889 |
| | | 343,682 |
| Total corporate bonds & notes | | 12,335,341 |
U.S. Treasury bonds & notes 8.09%
U.S. Treasury 7.64% | | |
| U.S. Treasury 1.25% 2019 | 105,000 | 103,920 |
| U.S. Treasury 1.375% 2019 | 300,000 | 298,464 |
| U.S. Treasury 1.50% 2019 | 70,000 | 69,135 |
| U.S. Treasury 1.75% 2019 | 56,000 | 55,532 |
| U.S. Treasury 1.25% 2020 | 180,000 | 176,557 |
| U.S. Treasury 1.375% 2020 | 55,000 | 53,403 |
| U.S. Treasury 1.375% 2020 | 43,000 | 42,152 |
| U.S. Treasury 1.50% 2020 | 22,000 | 21,546 |
| U.S. Treasury 1.625% 2020 | 20,000 | 19,694 |
| U.S. Treasury 2.00% 2020 | 154,000 | 152,750 |
| U.S. Treasury 2.25% 2020 | 104,400 | 103,815 |
| U.S. Treasury 2.375% 2020 | 522,300 | 520,253 |
| U.S. Treasury 2.50% 2020 | 25,000 | 24,923 |
| U.S. Treasury 2.625% 2020 | 1,950,000 | 1,948,323 |
The Income Fund of America — Page 28 of 37
Bonds, notes & other debt instruments
U.S. Treasury bonds & notes (continued)
U.S. Treasury (continued) | Principal amount
(000) | Value
(000) |
| U.S. Treasury 1.375% 2021 | $129,000 | $124,765 |
| U.S. Treasury 2.00% 2021 | 16,000 | 15,634 |
| U.S. Treasury 2.125% 2021 | 355,124 | 349,861 |
| U.S. Treasury 2.125% 2021 | 60,000 | 58,865 |
| U.S. Treasury 2.25% 2021 | 1,000 | 988 |
| U.S. Treasury 2.375% 2021 | 17,000 | 16,830 |
| U.S. Treasury 2.625% 2021 | 1,012,750 | 1,008,719 |
| U.S. Treasury 2.625% 2021 | 250,000 | 249,015 |
| U.S. Treasury 2.625% 2021 | 11,000 | 10,958 |
| U.S. Treasury 1.625% 2022 | 1,000 | 954 |
| U.S. Treasury 1.875% 202214 | 27,000 | 26,044 |
| U.S. Treasury 2.125% 2022 | 73,000 | 70,864 |
| U.S. Treasury 2.375% 2023 | 25,000 | 24,519 |
| U.S. Treasury 2.50% 2023 | 90,000 | 88,678 |
| U.S. Treasury 2.625% 202314 | 75,000 | 74,247 |
| U.S. Treasury 2.75% 2023 | 101,430 | 101,010 |
| U.S. Treasury 2.75% 2023 | 100,812 | 100,364 |
| U.S. Treasury 2.75% 2023 | 50,000 | 49,799 |
| U.S. Treasury 6.25% 2023 | 14,000 | 16,232 |
| U.S. Treasury 2.00% 2024 | 128,008 | 121,928 |
| U.S. Treasury 2.00% 2024 | 40,000 | 38,130 |
| U.S. Treasury 2.00% 2025 | 184,000 | 173,197 |
| U.S. Treasury 2.50% 2025 | 21,000 | 20,488 |
| U.S. Treasury 2.625% 2025 | 116,187 | 114,123 |
| U.S. Treasury 2.75% 2025 | 185,412 | 183,594 |
| U.S. Treasury 2.75% 2025 | 84,624 | 83,712 |
| U.S. Treasury 2.875% 202514 | 304,325 | 303,421 |
| U.S. Treasury 2.875% 2025 | 219,925 | 219,278 |
| U.S. Treasury 2.875% 2025 | 86,301 | 86,068 |
| U.S. Treasury 1.625% 2026 | 30,000 | 27,344 |
| U.S. Treasury 2.25% 2027 | 10,000 | 9,471 |
| U.S. Treasury 2.25% 2027 | 100 | 94 |
| U.S. Treasury 2.375% 2027 | 1,000 | 955 |
| U.S. Treasury 2.75% 2028 | 18,162 | 17,839 |
| U.S. Treasury 2.875% 202814 | 440,451 | 437,218 |
| U.S. Treasury 5.50% 2028 | 23,750 | 28,947 |
| U.S. Treasury 4.50% 2036 | 36,285 | 43,720 |
| U.S. Treasury 4.50% 2038 | 100 | 122 |
| U.S. Treasury 3.125% 2043 | 100 | 101 |
| U.S. Treasury 3.75% 2043 | 1,500 | 1,676 |
| U.S. Treasury 2.875% 2045 | 77,075 | 74,138 |
| U.S. Treasury 3.00% 2045 | 15,053 | 14,828 |
| U.S. Treasury 2.25% 2046 | 120 | 101 |
| U.S. Treasury 2.875% 2046 | 98,775 | 94,892 |
| U.S. Treasury 2.75% 2047 | 10,000 | 9,360 |
| U.S. Treasury 3.00% 2047 | 617 | 608 |
| U.S. Treasury 3.00% 2048 | 68,908 | 67,825 |
| U.S. Treasury 3.125% 2048 | 243,411 | 245,526 |
| | | 8,397,517 |
| U.S. Treasury inflation-protected securities 0.45% | | |
| U.S. Treasury Inflation-Protected Security 0.625% 202415 | 64,686 | 64,059 |
| U.S. Treasury Inflation-Protected Security 0.375% 202715 | 85,914 | 82,591 |
| U.S. Treasury Inflation-Protected Security 0.375% 202715 | 12,340 | 11,871 |
The Income Fund of America — Page 29 of 37
Bonds, notes & other debt instruments
U.S. Treasury bonds & notes (continued)
U.S. Treasury inflation-protected securities (continued) | Principal amount
(000) | Value
(000) |
| U.S. Treasury Inflation-Protected Security 0.50% 202815 | $102,064 | $83,801 |
| U.S. Treasury Inflation-Protected Security 0.75% 202815 | 50,107 | 49,704 |
| U.S. Treasury Inflation-Protected Security 1.375% 204415 | 30,033 | 33,077 |
| U.S. Treasury Inflation-Protected Security 1.00% 204615 | 62,564 | 63,557 |
| U.S. Treasury Inflation-Protected Security 0.875% 204715 | 49,526 | 48,820 |
| U.S. Treasury Inflation-Protected Security 1.00% 204815 | 65,811 | 53,897 |
| | | 491,377 |
| Total U.S. Treasury bonds & notes | | 8,888,894 |
| Mortgage-backed obligations 2.33% | | |
| Arroyo Mortgage Trust, Series 2018-1, Class A1, 3.763% 20487,9,10 | 15,340 | 15,314 |
| Countrywide Alternative Loan Trust, Series 2005-54CB, Class 2A5, 5.50% 20359 | 3,402 | 3,047 |
| Countrywide Alternative Loan Trust, Series 2007-HY4, Class 3A1, 3.693% 20479,10 | 2,370 | 1,991 |
| CS First Boston Mortgage Securities Corp., Series 2004-5, Class IVA1, 6.00% 20349 | 758 | 773 |
| Fannie Mae 6.00% 20219 | 48 | 49 |
| Fannie Mae 4.50% 20249 | 849 | 878 |
| Fannie Mae 5.50% 20249 | 73 | 76 |
| Fannie Mae 4.50% 20259 | 792 | 819 |
| Fannie Mae 4.50% 20259 | 475 | 492 |
| Fannie Mae 4.50% 20259 | 450 | 460 |
| Fannie Mae 4.50% 20259 | 415 | 429 |
| Fannie Mae 6.00% 20269 | 735 | 797 |
| Fannie Mae 3.00% 20329 | 14,536 | 14,417 |
| Fannie Mae 3.50% 20339,16 | 106,400 | 107,342 |
| Fannie Mae 3.50% 20339,16 | 39,600 | 39,909 |
| Fannie Mae 5.50% 20339 | 265 | 287 |
| Fannie Mae 5.50% 20359 | 236 | 255 |
| Fannie Mae 3.00% 20369 | 40,189 | 39,482 |
| Fannie Mae 3.00% 20369 | 34,519 | 33,911 |
| Fannie Mae 3.00% 20369 | 1,970 | 1,936 |
| Fannie Mae 5.50% 20369 | 1,514 | 1,637 |
| Fannie Mae 6.00% 20369 | 420 | 459 |
| Fannie Mae 6.00% 20369 | 376 | 408 |
| Fannie Mae 6.00% 20369 | 170 | 185 |
| Fannie Mae 3.00% 20379 | 36,200 | 35,485 |
| Fannie Mae 3.00% 20379 | 22,148 | 21,710 |
| Fannie Mae 3.00% 20379 | 21,949 | 21,515 |
| Fannie Mae 6.00% 20379 | 2,485 | 2,714 |
| Fannie Mae 6.00% 20379 | 880 | 958 |
| Fannie Mae 6.00% 20379 | 756 | 826 |
| Fannie Mae 6.50% 20379 | 371 | 407 |
| Fannie Mae 6.50% 20379 | 101 | 113 |
| Fannie Mae 6.00% 20389 | 1,495 | 1,636 |
| Fannie Mae 6.00% 20389 | 819 | 895 |
| Fannie Mae 4.50% 20399 | 14,205 | 14,888 |
| Fannie Mae 6.00% 20399 | 733 | 795 |
| Fannie Mae 6.50% 20399 | 291 | 322 |
| Fannie Mae 4.00% 20409 | 7,337 | 7,511 |
| Fannie Mae 4.00% 20409 | 4,175 | 4,274 |
| Fannie Mae 4.00% 20409 | 295 | 303 |
| Fannie Mae 4.50% 20409 | 41 | 42 |
| Fannie Mae 4.50% 20409 | 26 | 27 |
| Fannie Mae 5.00% 20409 | 3,996 | 4,277 |
The Income Fund of America — Page 30 of 37
Bonds, notes & other debt instruments
Mortgage-backed obligations (continued) | Principal amount
(000) | Value
(000) |
| Fannie Mae 4.00% 20419 | $6,442 | $6,603 |
| Fannie Mae 4.00% 20419 | 5,024 | 5,150 |
| Fannie Mae 4.00% 20419 | 500 | 513 |
| Fannie Mae 4.00% 20419 | 298 | 305 |
| Fannie Mae 4.00% 20419 | 264 | 271 |
| Fannie Mae 4.00% 20419 | 134 | 137 |
| Fannie Mae 4.50% 20419 | 125 | 131 |
| Fannie Mae 5.00% 20419 | 265 | 284 |
| Fannie Mae 5.00% 20419 | 264 | 283 |
| Fannie Mae 5.00% 20419 | 206 | 221 |
| Fannie Mae 5.00% 20419 | 178 | 190 |
| Fannie Mae 3.50% 20429 | 11,958 | 11,946 |
| Fannie Mae 4.00% 20429 | 5,538 | 5,676 |
| Fannie Mae 4.00% 20429 | 2,337 | 2,396 |
| Fannie Mae 4.00% 20429 | 793 | 813 |
| Fannie Mae 4.00% 20439 | 2,684 | 2,764 |
| Fannie Mae 4.00% 20439 | 2,001 | 2,061 |
| Fannie Mae 4.00% 20439 | 1,776 | 1,820 |
| Fannie Mae 4.00% 20449 | 31,733 | 32,338 |
| Fannie Mae 3.50% 20459 | 13,374 | 13,327 |
| Fannie Mae 4.00% 20459 | 41,899 | 42,921 |
| Fannie Mae 4.00% 20459 | 6,944 | 7,105 |
| Fannie Mae 3.00% 20469 | 67,633 | 65,309 |
| Fannie Mae 3.50% 20469 | 26,583 | 26,432 |
| Fannie Mae 3.50% 20469 | 25,466 | 25,353 |
| Fannie Mae 3.50% 20469 | 10,431 | 10,372 |
| Fannie Mae 3.50% 20479 | 9,031 | 8,971 |
| Fannie Mae 3.50% 20479 | 1,354 | 1,345 |
| Fannie Mae 4.00% 20479 | 98,239 | 99,976 |
| Fannie Mae 4.00% 20479 | 24,025 | 24,529 |
| Fannie Mae 4.00% 20479 | 15,538 | 15,804 |
| Fannie Mae 6.50% 20479 | 246 | 262 |
| Fannie Mae 7.00% 20479 | 281 | 305 |
| Fannie Mae 7.00% 20479 | 211 | 230 |
| Fannie Mae 7.00% 20479 | 142 | 155 |
| Fannie Mae 7.00% 20479 | 66 | 72 |
| Fannie Mae 3.50% 20489 | 105,033 | 104,273 |
| Fannie Mae 3.50% 20489 | 66,202 | 65,714 |
| Fannie Mae 3.50% 20489,16 | 34,280 | 33,977 |
| Fannie Mae 3.50% 20489 | 4,935 | 4,898 |
| Fannie Mae 4.00% 20489,16 | 240,275 | 243,777 |
| Fannie Mae 4.00% 20489,16 | 36,475 | 36,961 |
| Fannie Mae 4.00% 20489 | 33,507 | 34,078 |
| Fannie Mae 4.00% 20489 | 27,700 | 28,173 |
| Fannie Mae 4.50% 20489,16 | 92,837 | 96,037 |
| Fannie Mae 4.50% 20489 | 80,492 | 83,567 |
| Fannie Mae 4.50% 20489,16 | 22,289 | 23,091 |
| Fannie Mae 4.50% 20489,16 | 2,874 | 2,982 |
| Fannie Mae, Series 2001-4, Class NA, 9.167% 20259,10 | —6 | —6 |
| Fannie Mae, Series 2001-4, Class GA, 9.221% 20259,10 | 20 | 21 |
| Fannie Mae, Series 2001-20, Class E, 9.565% 20319,10 | 20 | 21 |
| Fannie Mae, Series 2007-33, Class HE, 5.50% 20379 | 2,624 | 2,826 |
| Fannie Mae, Series 2007-24, Class P, 6.00% 20379 | 1,273 | 1,347 |
| Fannie Mae, Series 2001-T10, Class A1, 7.00% 20419 | 254 | 286 |
| Fannie Mae, Series 2001-50, Class BA, 7.00% 20419 | 244 | 269 |
The Income Fund of America — Page 31 of 37
Bonds, notes & other debt instruments
Mortgage-backed obligations (continued) | Principal amount
(000) | Value
(000) |
| Fannie Mae, Series 2002-W3, Class A5, 7.50% 20419 | $160 | $182 |
| Fannie Mae, Series 2002-W1, Class 2A, 5.843% 20429,10 | 443 | 478 |
| Fannie Mae, Series 2012-M14, Class A2, Multi Family, 2.301% 20229,10 | 4,285 | 4,143 |
| Fannie Mae, Series 2012-M9, Class A2, Multi Family, 2.482% 20229 | 10,817 | 10,582 |
| Fannie Mae, Series 2012-M5, Class A2, Multi Family, 2.715% 20229 | 6,912 | 6,815 |
| Fannie Mae, Series 2013-M14, Class A2, Multi Family, 3.329% 20239,10 | 8,367 | 8,415 |
| Fannie Mae, Series 2014-M2, Class A2, Multi Family, 3.513% 20239,10 | 9,215 | 9,298 |
| Fannie Mae, Series 2014-M9, Class A2, Multi Family, 3.103% 20249,10 | 7,990 | 7,921 |
| Fannie Mae, Series 2014-M3, Class A2, Multi Family, 3.464% 20249,10 | 10,000 | 10,119 |
| Fannie Mae, Series 2017-M3, Class A2, Multi Family, 2.486% 20269,10 | 16,665 | 15,569 |
| Freddie Mac 4.50% 20359 | 7,157 | 7,457 |
| Freddie Mac 3.00% 20369 | 1,678 | 1,647 |
| Freddie Mac 3.00% 20369 | 1,010 | 991 |
| Freddie Mac 6.50% 20389 | 754 | 836 |
| Freddie Mac 4.50% 20399 | 686 | 719 |
| Freddie Mac 5.00% 20399 | 1,160 | 1,239 |
| Freddie Mac 5.00% 20399 | 641 | 683 |
| Freddie Mac 4.50% 20409 | 16,000 | 16,777 |
| Freddie Mac 4.00% 20419 | 1,272 | 1,303 |
| Freddie Mac 4.50% 20419 | 1,404 | 1,469 |
| Freddie Mac 4.50% 20419 | 1,318 | 1,380 |
| Freddie Mac 4.50% 20419 | 1,295 | 1,354 |
| Freddie Mac 5.00% 20419 | 92 | 98 |
| Freddie Mac 4.50% 20429 | 2,433 | 2,552 |
| Freddie Mac 4.50% 20429 | 1,477 | 1,547 |
| Freddie Mac 4.00% 20439 | 4,385 | 4,491 |
| Freddie Mac 4.00% 20439 | 4,094 | 4,194 |
| Freddie Mac 4.00% 20439 | 2,196 | 2,259 |
| Freddie Mac 4.00% 20439 | 1,546 | 1,584 |
| Freddie Mac 4.00% 20459 | 25,150 | 25,761 |
| Freddie Mac 4.00% 20469 | 19,474 | 19,842 |
| Freddie Mac 4.00% 20469 | 14,775 | 15,067 |
| Freddie Mac 4.00% 20469 | 13,313 | 13,576 |
| Freddie Mac 4.50% 20469 | 11,674 | 12,117 |
| Freddie Mac 4.50% 20469 | 3,186 | 3,307 |
| Freddie Mac 3.50% 20479 | 38,234 | 37,913 |
| Freddie Mac 3.50% 20479 | 24,318 | 24,109 |
| Freddie Mac 3.50% 20479 | 22,102 | 21,928 |
| Freddie Mac 3.50% 20479 | 10,535 | 10,450 |
| Freddie Mac 3.50% 20479 | 1,803 | 1,787 |
| Freddie Mac 4.00% 20479 | 34,926 | 35,541 |
| Freddie Mac 3.50% 20489,16 | 81,000 | 80,236 |
| Freddie Mac 4.00% 20489 | 5,464 | 5,552 |
| Freddie Mac 4.50% 20489,16 | 3,788 | 3,923 |
| Freddie Mac 4.50% 20489,16 | 1,712 | 1,775 |
| Freddie Mac, Series 2890, Class KT, 4.50% 20199 | 722 | 722 |
| Freddie Mac, Series 2289, Class NB, 9.00% 20229,10 | 3 | 3 |
| Freddie Mac, Series 2013-DN1, Class M1, (1-month USD-LIBOR + 3.40%) 5.464% 20239,10 | 136 | 137 |
| Freddie Mac, Series 2014-HQ2, Class M2, (1-month USD-LIBOR + 2.20%) 4.264% 20249,10 | 4,572 | 4,710 |
| Freddie Mac, Series 2015-HQ2, Class M2, (1-month USD-LIBOR + 1.95%) 4.014% 20259,10 | 2,892 | 2,969 |
| Freddie Mac, Series 3257, Class PA, 5.50% 20369 | 2,740 | 2,984 |
| Freddie Mac, Series 3286, Class JN, 5.50% 20379 | 2,167 | 2,261 |
| Freddie Mac, Series 3318, Class JT, 5.50% 20379 | 1,186 | 1,237 |
| Freddie Mac, Series K019, Class A2, Multi Family, 2.272% 20229 | 8,000 | 7,788 |
| Freddie Mac, Series K021, Class A2, Multi Family, 2.396% 20229 | 8,280 | 8,071 |
The Income Fund of America — Page 32 of 37
Bonds, notes & other debt instruments
Mortgage-backed obligations (continued) | Principal amount
(000) | Value
(000) |
| Freddie Mac, Series K036, Class A1, Multi Family, 2.777% 20239 | $8,070 | $8,000 |
| Freddie Mac, Series K036, Class A2, Multi Family, 3.527% 20239 | 9,150 | 9,299 |
| Freddie Mac, Series K043, Class A2, Multi Family, 3.062% 20249 | 10,000 | 9,902 |
| Freddie Mac, Series K066, Class A2, Multi Family, 3.117% 20279 | 6,340 | 6,186 |
| Freddie Mac, Series K067, Class A2, Multi Family, 3.194% 20279 | 7,695 | 7,549 |
| Freddie Mac, Series K069, Class A2, Multi Family, 3.187% 20279,10 | 5,700 | 5,577 |
| Freddie Mac, Series K070, Class A2, Multi Family, 3.303% 20279,10 | 7,165 | 7,074 |
| Freddie Mac, Series K072, Class A2, Multi Family, 3.444% 20279 | 6,925 | 6,907 |
| Freddie Mac, Series K073, Class A2, Multi Family, 3.35% 20289 | 7,857 | 7,771 |
| Freddie Mac, Series K075, Class A2, Multi Family, 3.65% 20289,10 | 15,120 | 15,304 |
| Freddie Mac, Series K077, Class A2, Multi Family, 3.90% 20289 | 16,280 | 16,720 |
| Freddie Mac, Series K076, Class A2, Multi Family, 3.90% 20289 | 8,965 | 9,239 |
| Freddie Mac, Series K726, Class A2, Multi Family, 2.905% 20499 | 10,265 | 10,116 |
| Freddie Mac Seasoned Credit Risk Transfer Trust, Series 2017-2, Class HA, 2.25% 20569 | 15,856 | 15,326 |
| Freddie Mac Seasoned Credit Risk Transfer Trust, Series 2017-3, Class HA, 2.25% 20569 | 15,450 | 15,171 |
| Freddie Mac Seasoned Credit Risk Transfer Trust, Series 2017-1, Class HA, 2.50% 20569,10 | 14,943 | 14,522 |
| Freddie Mac Seasoned Credit Risk Transfer Trust, Series 2017-2, Class MA, 3.00% 20569 | 14,910 | 14,476 |
| Freddie Mac Seasoned Credit Risk Transfer Trust, Series 2017-1, Class MA, 3.00% 20569 | 1,753 | 1,707 |
| Freddie Mac Seasoned Credit Risk Transfer Trust, Series 2017-4, Class HT, 2.50% 20579,10 | 3,820 | 3,675 |
| Freddie Mac Seasoned Credit Risk Transfer Trust, Series 2017-4, Class MT, 3.50% 20579 | 2,955 | 2,909 |
| Freddie Mac Seasoned Credit Risk Transfer Trust, Series 2017-4, Class M45T, 4.50% 20579 | 9,183 | 9,565 |
| Government National Mortgage Assn. 4.50% 20419 | 836 | 872 |
| Government National Mortgage Assn. 3.50% 20489,16 | 54,000 | 54,089 |
| Government National Mortgage Assn. 4.00% 20489,16 | 107,500 | 109,747 |
| Government National Mortgage Assn. 4.00% 20489 | 33,823 | 34,623 |
| Government National Mortgage Assn. 4.00% 20489 | 19,650 | 20,167 |
| Government National Mortgage Assn. 4.00% 20489 | 5,160 | 5,310 |
| Government National Mortgage Assn. 4.50% 20489,16 | 25,134 | 26,063 |
| Government National Mortgage Assn. 4.50% 20489,16 | 19,866 | 20,630 |
| GSR Mortgage Loan Trust, Series 2004-2F, Class VIIA1, 4.50% 20199 | 22 | 22 |
| IndyMac INDX Mortgage Loan Trust, Series 2006-AR5, Class 2A1, 3.628% 20369,10 | 3,878 | 3,518 |
| J.P. Morgan Chase Commercial Mortgage Securities Trust, Series 2006-LDP9, Class AM, 5.372% 20479 | 5,589 | 5,612 |
| L.A. Arena Funding, LLC, Series 1, Class A, 7.656% 20267,9 | 2,634 | 2,688 |
| LB-UBS Commercial Mortgage Trust, Series 2007-C6, Class AM, 6.114% 20409,10 | 537 | 537 |
| Morgan Stanley Capital I Trust, Series 2014-CPT, Class A, 3.35% 20297,9 | 8,745 | 8,767 |
| Sequoia Mortgage Trust, Series 2018-CH1, Class A1, 4.00% 20487,9 | 8,499 | 8,542 |
| Structured Adjustable Rate Mortgage Loan Trust, Series 2006-4, Class 6A, 3.766% 20369,10 | 2,424 | 2,174 |
| Towd Point Mortgage Trust, Series 2017-1, Class A1, 2.75% 20567,9,10 | 18,146 | 17,844 |
| Wachovia Bank Commercial Mortgage Trust, Series 2007-C33, Class AM, 6.009% 20519,10 | 4,219 | 4,337 |
| | | 2,555,124 |
| Federal agency bonds & notes 0.61% | | |
| Fannie Mae 2.75% 2021 | 90,000 | 89,774 |
| Fannie Mae 6.25% 2029 | 32,000 | 40,645 |
| Federal Home Loan Bank 1.50% 2019 | 50,000 | 49,388 |
| Federal Home Loan Bank 2.125% 2020 | 95,000 | 94,232 |
| Federal Home Loan Bank 2.375% 2020 | 125,000 | 124,370 |
| Freddie Mac 1.875% 2020 | 75,000 | 73,472 |
| Freddie Mac 2.50% 2020 | 200,000 | 199,806 |
| | | 671,687 |
The Income Fund of America — Page 33 of 37
Bonds, notes & other debt instruments
Asset-backed obligations 0.13% | Principal amount
(000) | Value
(000) |
| Aesop Funding LLC, Series 2014-2A, Class A, 2.50% 20217,9 | $8,000 | $7,931 |
| AmeriCredit Automobile Receivables Trust, Series 2015-2, Class C, 2.40% 20219 | 6,000 | 5,987 |
Angel Oak Capital Advisors, LLC, Series 2013-9A, Class A1R, CLO, (3-month USD-LIBOR + 1.01%)
3.358% 20257,9,10 | 1,194 | 1,194 |
| Countryplace Manufactured Housing Contract, Series 2005-1, Class A4, AMBAC insured, 5.20% 20357,9,10 | 878 | 906 |
CWHEQ Revolving Home Equity Loan Trust, Series 2006-I, Class 2A, FSA insured,
(1-month USD-LIBOR + 0.14%) 2.212% 20379,10 | 903 | 860 |
CWHEQ Revolving Home Equity Loan Trust, Series 2007-B, Class A, FSA insured,
(1-month USD-LIBOR + 0.15%) 2.222% 20379,10 | 1,591 | 1,534 |
| Drive Auto Receivables Trust, Series 2015-BA, Class C, 2.76% 20217,9 | 279 | 279 |
| Drive Auto Receivables Trust, Series 2015-AA, Class C, 3.06% 20217,9 | 1,808 | 1,810 |
| Drive Auto Receivables Trust, Series 2015-DA, Class C, 3.38% 20217,9 | 2,598 | 2,602 |
| Ford Credit Auto Owner Trust, Series 2017-1, Class A, 2.62% 20287,9 | 19,975 | 19,488 |
| Ford Credit Auto Owner Trust, Series 2017-2, Class A, 2.36% 20297,9 | 9,065 | 8,697 |
| Ford Credit Auto Owner Trust, Series 2018-2, Class A, 3.47% 20307,9 | 10,105 | 10,112 |
| Ford Credit Auto Owner Trust, Series 2018-1, Class A, 3.19% 20317,9 | 25,910 | 25,399 |
| Global SC Finance II SRL, Series 2017-1A, Class A, 3.85% 20377,9 | 4,622 | 4,576 |
| GM Financial Consumer Automobile Receivables Trust, Series 2018-1, Class B, 2.57% 20239 | 865 | 849 |
| GM Financial Consumer Automobile Receivables Trust, Series 2018-1, Class C, 2.77% 20239 | 605 | 592 |
| Hertz Vehicle Financing LLC, Rental Car Asset-Backed Notes, Series 2018-1A, Class A, 3.29% 20247,9 | 7,940 | 7,705 |
IndyMac Home Equity Mortgage Loan Asset-Backed Trust, Series 2007-H1, Class A1, FSA insured,
(1-month USD-LIBOR + 0.16%) 2.224% 20379,10 | 916 | 880 |
| Santander Drive Auto Receivables Trust, Series 2015-2, Class C, 2.44% 20219 | 8,319 | 8,313 |
| Santander Drive Auto Receivables Trust, Series 2015-1, Class C, 2.57% 20219 | 1,813 | 1,813 |
| Santander Drive Auto Receivables Trust, Series 2016-2, Class C, 2.66% 20219 | 2,430 | 2,422 |
| Social Professional Loan Program LLC, Series 2015-D, Class A2, 2.72% 20367,9 | 4,145 | 4,082 |
| Symphony CLO Ltd., Seriess 2013-12A, Class AR, CLO, (3-month USD-LIBOR + 1.03%) 3.369% 20257,9,10 | 4,883 | 4,884 |
| TAL Advantage V LLC, Series 2013-2A, Class A, 3.55% 20387,9 | 9,093 | 9,009 |
| TAL Advantage V LLC, Series 2014-1A, Class A, 3.51% 20397,9 | 2,150 | 2,130 |
| TAL Advantage V LLC, Series 2017-1A, Class A, 4.50% 20427,9 | 4,700 | 4,766 |
| Triton Container Finance LLC, Series 2017-1A, Class A, 3.52% 20427,9 | 4,670 | 4,567 |
| Voya CLO Ltd., Series 2014-3A, Class A1R, CLO, (3-month USD-LIBOR + 0.72%) 3.055% 20267,9,10 | 1,235 | 1,235 |
| World Omni Auto Receivables Trust, Series 2014-B, Class A3, 1.14% 20209 | 26 | 26 |
| | | 144,648 |
| Bonds & notes of governments & government agencies outside the U.S. 0.09% | | |
| CPPIB Capital Inc. 1.25% 20197 | 3,900 | 3,837 |
| CPPIB Capital Inc. 2.375% 20217 | 8,000 | 7,894 |
| Portuguese Republic 5.125% 2024 | 39,415 | 41,237 |
| Qatar (State of) 3.875% 20237 | 10,470 | 10,525 |
| Qatar (State of) 4.50% 20287 | 3,390 | 3,464 |
| Qatar (State of) 5.103% 20487 | 2,000 | 2,047 |
| Saudi Arabia (Kingdom of) 2.875% 20237 | 5,000 | 4,813 |
| Saudi Arabia (Kingdom of) 4.00% 20257 | 17,720 | 17,740 |
| | | 91,557 |
Municipals 0.07%
Illinois 0.05% | | |
| G.O. Bonds, Pension Funding Series 2003, 5.10% 20339 | 52,665 | 51,207 |
| California 0.02% | | |
| Various Purpose G.O. Bonds, Series 2010, 6.20% 2019 | 24,675 | 25,199 |
| | | 76,406 |
The Income Fund of America — Page 34 of 37
Bonds, notes & other debt instruments
Miscellaneous 0.02% | Principal amount
(000) | Value
(000) |
| Other bonds & notes in initial period of acquisition | | $25,416 |
| Total bonds, notes & other debt instruments (cost: $24,892,327,000) | | 24,789,073 |
| Short-term securities 10.98% | | |
| Apple Inc. 2.01%–2.14% due 8/7/2018–10/16/20187 | $ 285,000 | 284,254 |
| CAFCO, LLC 2.00%–2.27% due 8/15/2018–8/27/20187 | 150,000 | 149,831 |
| Chevron Corp. 1.99% due 8/2/20187 | 50,000 | 49,995 |
| CRC Funding, LLC 2.25% due 8/23/20187 | 50,000 | 49,936 |
| ExxonMobil Corp. 1.88%–2.02% due 8/8/2018–8/28/2018 | 230,700 | 230,498 |
| Fannie Mae 1.85% due 8/6/2018 | 100,000 | 99,974 |
| Federal Home Loan Bank 1.83%–2.00% due 8/1/2018–11/5/2018 | 3,099,100 | 3,091,810 |
| Freddie Mac 1.91%–1.92% due 9/24/2018–10/4/2018 | 100,000 | 99,679 |
| IBM Corp. 1.99% due 8/29/20187 | 100,000 | 99,840 |
| Intel Corp. 1.91% due 8/14/20187 | 25,000 | 24,981 |
| John Deere Capital Corp. 1.99% due 8/15/20187 | 16,200 | 16,187 |
| Jupiter Securitization Co., LLC 2.28% due 8/3/20187 | 50,000 | 49,992 |
| Paccar Financial Corp. 1.96% due 8/2/2018 | 26,000 | 25,997 |
| PepsiCo Inc. 1.91% due 8/8/20187 | 50,000 | 49,979 |
| Pfizer Inc. 1.88%–1.97% due 8/1/2018–8/20/20187 | 157,000 | 156,908 |
| U.S. Treasury Bills 1.25%–2.34% due 8/2/2018–7/18/2019 | 7,695,650 | 7,583,663 |
| Total short-term securities (cost: $12,066,917,000) | | 12,063,524 |
| Total investment securities 100.38% (cost: $90,883,873,000) | | 110,261,088 |
| Other assets less liabilities (0.38)% | | (414,240) |
| Net assets 100.00% | | $109,846,848 |
As permitted by U.S. Securities and Exchange Commission regulations, "Miscellaneous" securities include holdings in their first year of acquisition that have not previously been publicly disclosed.
The Income Fund of America — Page 35 of 37
Forward currency contracts
| Contract amount | Counterparty | Settlement
date | Unrealized
depreciation
at 7/31/2018
(000) |
Purchases
(000) | Sales
(000) |
| USD63,769 | AUD87,000 | Goldman Sachs | 8/23/2018 | $(877) |
The following footnotes apply to either the individual securities noted or one or more of the securities aggregated and listed as a single line item.
| 1 | Represents an affiliated company as defined under the Investment Company Act of 1940. |
| 2 | Valued under fair value procedures adopted by authority of the board of trustees. The total value of all such securities, including those in “Miscellaneous,“ was $151,669,000, which represented .14% of the net assets of the fund. |
| 3 | Value determined using significant unobservable inputs. |
| 4 | Security did not produce income during the last 12 months. |
| 5 | Acquired through a private placement transaction exempt from registration under the Securities Act of 1933. May be subject to legal or contractual restrictions on resale. Further details on these holdings appear below. |
| 6 | Amount less than one thousand. |
| 7 | Acquired in a transaction exempt from registration under Rule 144A or Section 4(2) of the Securities Act of 1933. May be resold in the U.S. in transactions exempt from registration, normally to qualified institutional buyers. The total value of all such securities was $5,187,162,000, which represented 4.72% of the net assets of the fund. |
| 8 | Step bond; coupon rate may change at a later date. |
| 9 | Principal payments may be made periodically. Therefore, the effective maturity date may be earlier than the stated maturity date. |
| 10 | Coupon rate may change periodically. |
| 11 | Loan participations and assignments; may be subject to legal or contractual restrictions on resale. The total value of all such loans was $375,635,000, which represented .34% of the net assets of the fund. |
| 12 | Payment in kind; the issuer has the option of paying additional securities in lieu of cash. Most recent payment was 100% cash unless otherwise noted. |
| 13 | Scheduled interest and/or principal payment was not received. |
| 14 | All or a portion of this security was pledged as collateral. The total value of pledged collateral was $689,000, which represented less than .01% of the net assets of the fund. |
| 15 | Index-linked bond whose principal amount moves with a government price index. |
| 16 | Purchased on a TBA basis. |
| Private placement securities | Acquisition
date(s) | Cost
(000) | Value
(000) | Percent
of net
assets |
| Blackstone CQP Holdco LP, 6.50% 2021 | 3/6/2017-7/20/2018 | $97,234 | $97,833 | .09% |
| Blackstone CQP Holdco LP, 6.00% 2021 | 8/9/2017 | 20,000 | 20,000 | .02 |
| Ascent Resources - Utica, LLC, Class A | 4/25/2016-11/15/2016 | 56,848 | 35,269 | .03 |
| White Star Petroleum Corp., Class A | 6/30/2016 | 4,354 | 4,428 | .00 |
| Rotech Healthcare Inc. | 11/26/2017 | 19,660 | 1,086 | .00 |
| Corporate Risk Holdings Corp. | 9/1/2015 | — | — | .00 |
| Total private placement securities | | $198,096 | $158,616 | .14% |
| Key to abbreviations and symbol |
| ADR = American Depositary Receipts |
| AUD = Australian dollars |
| Auth. = Authority |
| CAD = Canadian dollars |
| CDI = CREST Depository Interest |
| CLO = Collateralized Loan Obligations |
| G.O. = General Obligation |
| GBP = British pounds |
| LIBOR = London Interbank Offered Rate |
| LOC = Letter of Credit |
| TBA = To-be-announced |
| USD/$ = U.S. dollars |
The Income Fund of America — Page 36 of 37
Additional financial disclosures are included in the fund’s current shareholder report and should be read in conjunction with this report.
Investments are not FDIC-insured, nor are they deposits of or guaranteed by a bank or any other entity, so they may lose value.
Investors should carefully consider investment objectives, risks, charges and expenses. This and other important information is contained in the fund prospectus and summary prospectus, which can be obtained from your financial professional and should be read carefully before investing. You may also call American Funds Service Company (AFS) at (800) 421-4225 or visit the American Funds website at americanfunds.com. Fund shares offered through American Funds Distributors, Inc.
All Capital Group trademarks mentioned are owned by The Capital Group Companies, Inc., an affiliated company or fund. All other company and product names mentioned are the property of their respective companies.
©2018 Capital Group. All rights reserved.
333 S. Hope Street, Los Angeles, CA 90071 USA
| MFGEFPX-006-0918O-S66023 | The Income Fund of America — Page 37 of 37 |
REPORT OF INDEPENDENT REGISTERED PUBLIC ACCOUNTING FIRM ON INVESTMENT PORTFOLIO
To the Shareholders and Board of Trustees of The Income Fund of America:
Opinion on the Investment Portfolio
We have audited the accompanying investment portfolio of The Income Fund of America (the “Fund”), as of July 31, 2018, and the related notes (“investment portfolio”) (included in Item 6 of this Form N-CSR). In our opinion, the investment portfolio presents fairly, in all material respects, the investments in securities of the Fund as of July 31, 2018, in conformity with accounting principles generally accepted in the United States of America.
Basis for Opinion
The investment portfolio is the responsibility of the Fund’s management. Our responsibility is to express an opinion on the investment portfolio based on our audit. We are a public accounting firm registered with the Public Company Accounting Oversight Board (United States) (PCAOB) and are required to be independent with respect to the Fund in accordance with the U.S. federal securities laws and the applicable rules and regulations of the Securities and Exchange Commission and the PCAOB.
We conducted our audit in accordance with the standards of the PCAOB. Those standards require that we plan and perform the audit to obtain reasonable assurance about whether the investment portfolio is free of material misstatement, whether due to error or fraud. The Fund is not required to have, nor were we engaged to perform, an audit of its internal control over financial reporting. As part of our audit we are required to obtain an understanding of internal control over financial reporting but not for the purpose of expressing an opinion on the effectiveness of the Fund's internal control over financial reporting. Accordingly, we express no such opinion.
Our audit included performing procedures to assess the risks of material misstatement of the investment portfolio, whether due to error or fraud, and performing procedures that respond to those risks. Such procedures included examining, on a test basis, evidence regarding the amounts and disclosures in the investment portfolio. Our audit also included evaluating the accounting principles used and significant estimates made by management, as well as evaluating the overall presentation of the investment portfolio. We believe that our audit provides a reasonable basis for our opinion.

Costa Mesa, California
September 10, 2018
We have served as the auditor of one or more American Funds investment companies since 1956.
ITEM 7 – Disclosure of Proxy Voting Policies and Procedures for Closed-End Management Investment Companies
Not applicable to this Registrant, insofar as the Registrant is not a closed-end management investment company.
ITEM 8 – Portfolio Managers of Closed-End Management Investment Companies
Not applicable to this Registrant, insofar as the Registrant is not a closed-end management investment company.
ITEM 9 – Purchases of Equity Securities by Closed-End Management Investment Company and Affiliated Purchasers
Not applicable to this Registrant, insofar as the Registrant is not a closed-end management investment company.
ITEM 10 – Submission of Matters to a Vote of Security Holders
There have been no material changes to the procedures by which shareholders may recommend nominees to the Registrant’s board of trustees since the Registrant last submitted a proxy statement to its shareholders. The procedures are as follows. The Registrant has a nominating and governance committee comprised solely of persons who are not considered ‘‘interested persons’’ of the Registrant within the meaning of the Investment Company Act of 1940, as amended. The committee periodically reviews such issues as the board’s composition, responsibilities, committees, compensation and other relevant issues, and recommends any appropriate changes to the full board of trustees. While the committee normally is able to identify from its own resources an ample number of qualified candidates, it will consider shareholder suggestions of persons to be considered as nominees to fill future vacancies on the board. Such suggestions must be sent in writing to the nominating and governance committee of the Registrant, c/o the Registrant’s Secretary, and must be accompanied by complete biographical and occupational data on the prospective nominee, along with a written consent of the prospective nominee for consideration of his or her name by the nominating and governance committee.
ITEM 11 – Controls and Procedures
| (a) | The Registrant’s Principal Executive Officer and Principal Financial Officer have concluded, based on their evaluation of the Registrant’s disclosure controls and procedures (as such term is defined in Rule 30a-3 under the Investment Company Act of 1940), that such controls and procedures are adequate and reasonably designed to achieve the purposes described in paragraph (c) of such rule. |
| | |
| (b) | Effective May 28, 2018, the The Income Fund of America’s investment adviser implemented a new fixed income order management, trading, and compliance system. In connection with introducing this new system, additional automated and manual controls were implemented and some existing controls were modified. None of these changes were in response to any identified deficiency or weakness in the The Income Fund of America’s internal control over financial reporting. |
ITEM 12 – Exhibits
| (a)(1) | The Code of Ethics that is the subject of the disclosure required by Item 2 is attached as an exhibit hereto. |
| | |
| (a)(2) | The certifications required by Rule 30a-2 of the Investment Company Act of 1940 and Sections 302 and 906 of the Sarbanes-Oxley Act of 2002 are attached as exhibits hereto. |
SIGNATURES
Pursuant to the requirements of the Securities Exchange Act of 1934 and the Investment Company Act of 1940, the Registrant has duly caused this report to be signed on its behalf by the undersigned, thereunto duly authorized.
| | THE INCOME FUND OF AMERICA |
| | |
| | By /s/ Donald H. Rolfe |
| | Donald H. Rolfe, Executive Vice President and Principal Executive Officer |
| | |
| | Date: September 28, 2018 |
Pursuant to the requirements of the Securities Exchange Act of 1934 and the Investment Company Act of 1940, this report has been signed below by the following persons on behalf of the Registrant and in the capacities and on the dates indicated.
| By /s/ Donald H. Rolfe |
Donald H. Rolfe, Executive Vice President and Principal Executive Officer |
| |
| Date: September 28, 2018 |
| By /s/ Hong T. Le |
Hong T. Le, Treasurer and Principal Financial Officer |
| |
| Date: September 28, 2018 |