Exhibit (c)(2)
January 4 Special Committee Discussion Materials PRELIMINARY & CONFIDENTIAL
PRELIMINARY & CONFIDENTIAL Table of Contents 1. Executive Summary 2. DBO Introduction 3. Situation Review 4. Valuation Considerations 5. Fee Proposal and Process Recommendations 6. Appendix A: Supporting Materials 7. Appendix B: Additional Information on DBO I I I I II V I V A B 2
PRELIMINARY & CONFIDENTIAL Executive Summary 3 International Speedway CorporationISC is a unique company with a highly valuable franchise and asset base, as well as attractivecustomer attributesStrong Management / Board that has driven outperformance relative to peersIconic motorsports facilities with national fan reachAncillary development initiatives supported by 13,000 acres of land assetsSecond highest-rated regular season sport on televisionStable recurring revenue baseAlmost 70% of LTM revenue was contractedNASCAR broadcast rights secured through 2024 with contracted escalatorStrong planned return of capital to shareholders despite CapEx requirementsUnparalleled sponsor brand loyalty among NASCAR fan baseUnaided sponsor awareness dwarfs other major team sports (99% awareness accuracy)Percentage of fans “consciously purchasing” and “switching” to NASCAR sponsor products is highest of all sportsStrong growth in social media and number of corporate sponsors despite decrease in television viewership / race attendance
PRELIMINARY & CONFIDENTIAL Executive Summary (cont’d.) 4 DBO PartnersFounding Partners each have over 30 years of transaction experience directly relevant to ISC’sSpecial Committee. Collectively they have executed:Hundreds of going-private transactionsDozens of transactions involving Special or Independent Board CommitteesAdvising Boards and their committees on valuation issues is a core competencyCompletely devoid of existing and potential conflicts including lending, wealth management,asset management, corporate advisory, proprietary trading, etc.Special Committee Process and Next StepsWork with Special Committee and legal counsel to determine optimal process going forwardConduct appropriate due diligence involving all relevant partiesAchieve best possible offer for ISC independent shareholders and aid in identifying whether Special Committee should endorse the offer or opt for no transaction
PRELIMINARY & CONFIDENTIAL Table of Contents 1. Executive Summary 2. DBO Introduction 3. Situation Review 4. Valuation Considerations 5. Fee Proposal and Process Recommendations 6. Appendix A: Supporting Materials 7. Appendix B: Additional Information on DBO I II III IV V A B 5
PRELIMINARY & CONFIDENTIAL The DBO Team Gordon Dean 32 years of experience27 years of Investment Banking at Morgan Stanley, Vice Chairman of Investment Banking Group 31 years of experience25 years of Investment Banking at Morgan Stanley, Head of Global Financial Sponsors Group Mark Bradley Nick Osborne 32 years of experience19 years of Investment Banking at Morgan Stanley, Head of Global Technology Mergers and Acquisitions Founding Partner Gordon Dean ran Morgan Stanley’s West Coast Investment Banking Group and has extensive experience in advising public company Boards, including going-private transactions and M&A assignments involving Special Committees Founding Partner Mark Bradley ran Morgan Stanley’s Global Financial Sponsor Group and has unparalleled experience in going-private transactions, all of which involved Special Committees Founding Partner Nick Osborne ran Morgan Stanley’s Global Technology M&A Group including numerous Special Committee assignments; team has completed over $300billion of successful M&A transactions including recent experience as advisor on Dell/DVMT All three Founding Partners will be 100% involved in the execution of this assignment Formerly a securities lawyerExecuted sell-sides of MontrealCanadiens and Colorado RockiesHelped recruit buying group for SF GiantsWorked with Paul Tagliabue on Board Committee which negotiated media and stadium contracts for Big East BasketballCross industry experience including hotels, restaurants, and cinemas Select Relevant Experience Strong experience advising Special Committees, including minority squeeze outs, going-private, and unsolicited transactionsRole in hundreds of fairness (and inadequacy) opinions as member of Morgan Stanley Fairness Committee (including depositions on behalf of clients)Guest lecturer with Delaware Supreme Court Chief Justice Leo Strine at UCLA School of LawCross industry experience including race tracks, lodging, and entertainment 10 – 15 going-private transactions peryear for over 20 yearsExecuted 7 of the 10 largest and most complicated going-private transactionsIn 2018, advised Dell on $24Bn merger with 80% owned publicly traded VMWare which involved significant Special Committee interaction 6
PRELIMINARY & CONFIDENTIAL DBO OverviewHigh level of experience, combined with high level of focus 7 DBO Partners is a boutique investment banking firm founded by senior Morgan Stanley leadersUnlike “bulge bracket” firms, our Partners execute every assignmentAll three Founding Partners, with directly relevant transaction experience, will lead this transaction and be at every meetingNo conflicts; absolutely critical in Special Committee assignmentsWe specialize in large, complex transactions for elite clients$24Bn Dell/DVMT combination$6Bn sale of URS to AECOM$25Bn LBO of Dell Technologies$750MM strategic investment by Intel into ClouderaOur business is based on referrals and repeat business, the interest of ISC shareholders will come before our own, and we are happy to provide referencesIn preparation for today’s meeting, we have reviewed all available information including: company filings, research reports, investor presentations, news articles, books about the industry, legal precedents, competitor filings, etc.
PRELIMINARY & CONFIDENTIAL & Others Select Contested M&A and Special Committee ExperienceExecuted by this team McAfee.com Absolutely no conflicts ofany kindClarity regarding available alternatives is criticalRobust due diligence up front leading to practical and balanced advice to Special Committee regarding alternativesStrong advocacy on behalf of Special Committee and independent shareholders based on highly credible data and analyticsAbility for Special Committee to say “no” even if other alternatives are limited Key Lessons Learned inMinority Squeeze-Outs 8
PRELIMINARY & CONFIDENTIAL Table of Contents 1. Executive Summary 2. DBO Introduction 3. Situation Review 4. Valuation Considerations 5. Fee Proposal and Process Recommendations 6. Appendix A: Supporting Materials 7. Appendix B: Additional Information on DBO I II III IV V A B 9
PRELIMINARY & CONFIDENTIAL 10 Outcomes of Precedent Minority Squeeze-Out Transactions Note: Analysis of last 10 years of comparable precedent squeeze outs (n=27)Sources: CaplQ and Company filings for precedent squeeze-out transactions (See Appendix A for details)(1) The number of offers and counters is from a subset of transactions involving strategic buyers that had >50% ownership (n=17) Special Committees Drive Shareholder Value 4% / 0%Transactions where initial offer is accepted outright / rejected and bidder walks 21% / 48%Median initial / final offer relative to unaffected stock price 21%Median increase in offer price from first to final offer -16% / 4%Median initial / final offer relative to stock’s LTM intraday high 6.6 Offers (1)Median number of offers and counters over the course of the negotiations 3.5 MonthsMedian number of months to complete a minority squeeze- out transaction
PRELIMINARY & CONFIDENTIAL Overview of NASCAR Offer 11 NASCAR offer was carefully constructed, but leaves room for Special Committee to drive valueNASCAR has offered to acquire for cash all of ISC’s outstanding shares not owned by Family StockholdersThe offer price of $42 per share was represented as a 14% premium to the 30 day VWAPRepresents a 2% premium to the trailing 90 day average share price and a 1% discount to the LTM average share priceWhile the offer price requires additional analysis, the offer terms have been structured to address a number of important legal considerationsRequires approval by a Special Committee of independent directorsRequires approval of a majority voting power representing the shares not owned by the Family StockholdersImportantly, Family Stockholders have stated that they have no interest in selling any shares of ISC nor do they “expect” to vote in favor of “any alternative sale, merger or other extraordinary corporate transaction...”NASCAR rationale: “We believe the industry would benefit from structural change in order to best position the sport on a going forward basis. This will require significant time, effort, and investment. We believe that this transformation will be best undertaken as a private company”The offer comes in the context of reports that NASCAR:Has explored selling a minority stake to investorsAnnounced the potential bundling of corporate sponsorships of the tracks, leagues, teams, and media- rights partners which could improve NASCAR’s (and ISC’s) commercial model
PRELIMINARY & CONFIDENTIAL Task of the Special Committee 12 While every transaction is unique, the duties of a Special Committee representing the interests of minority shareholders subject to a buyout offer, and the manner in which those duties should be prosecuted, include:Choosing truly independent legal and financial advisorsAppropriate diligence: including access to all information necessary to make informed decisionsAbility to forcefully and diligently negotiate to achieve the highest price and best terms practicable for stockholders (assisted by the Special Committee’s financial advisor)Unequivocal power to reject the proposed transaction (relying, in part, on the valuation analysis of theSpecial Committee’s financial advisor)These and other practices provide comfort to minority shareholders that the Committee has acted with due care and loyalty to ensure that the ultimate transaction was fair to all shareholdersIt is not the duty of the Special Committee to pursue “futile” or impractical alternatives, given the clear positions of controlling shareholdersThe Special Committee needs to consider what alternatives are achievable and whether NASCAR’sfinal offer achieves the highest price practicableDBO is committed to delivering the best possible outcome for the Special Committee and independent shareholders
PRELIMINARY & CONFIDENTIAL Key Considerations for ISC Special Committee Members 13 What is the standalone value of ISC based on the Company’s internal plan?What are the scenarios that can lead to greater or lesser value for ISC shareholders in thefuture?Do street forecasts and analyst target prices accurately reflect the outlook for the business?What alternatives are available to ISC (including consideration of the impact of any NASCAR rights) and how do those alternatives compare to NASCAR’s offer? Is now a good time to consider a sale?Given the “do not expect” language in the offer letter, what are NASCAR and Family Stockholders prepared to consider?Does NASCAR’s current offer reflect its best offer? Is it a fair offer?What information and tactics can be used to achieve the best possible offer fromNASCAR?Evaluating NASCAR’s rationale and potential synergies
PRELIMINARY & CONFIDENTIAL 14 ISC is a Unique Company with a Valuable Collection of AssetsPredictable income streams with attractive growth opportunities Source: Company filings(1) Other Motorsports Related revenue assumed to be 6% of Total Motorsports Related revenue based on FY2017 results ISC has identified multiple opportunities to monetize the value of real estate through ancillary development13 irreplaceable motorsports facilities with national reachHollywood Casino at Kansas Speedway and ONE DAYTONAAdditional opportunities across 13,000 acres of owned / operated property Long-Term Facility Optimization Opportunities Motorsports StadiumsDaytona Rising & ISM Ancillary Development13,000 Acres Year-Round DestinationsONE DAYTONA & Hollywood Value-Enhancing Projects Stable Recurring Revenue Base (1) ISC contracted revenue from long-term media rights and corporate partnerships make up ~69% of total LTM revenueBroadcast rights secured through 2024 with ~4% revenue CAGRMulti-year sponsorships secured as part of facilities projects (e.g., Daytona Rising & ISM) as well as race and category sponsorships (e.g., Coca-Cola) Food, Other Income Beverage, & 3% Merchandise5%Admissions17%Other Motorsports Related6% Corporate Partnerships17% TV & Ancillary Media 52% Broadcast fees have a ~4% CAGR over the 10-year termRecurring revenue
PRELIMINARY & CONFIDENTIAL 15 ISC Has Outperformed Peers $MMDVD TRK ISC Broadcasting Revenue Admissions Revenue Event Related Revenue (1) Total Revenue – $100 $200 $300 $400 $500 $600 2011 2012 2013 2014 2015 2016 2017 CAGR 2.3% 2.0% 2.4% – $50 $100 $150 $200 $250 $300 2011 2012 2013 2014 2015 2016 2017 CAGR (11.3%) (6.5%) (2.8%) – $50 $100 $150 $200 $250 $300 $350 2011 2012 2013 2014 2015 2016 2017Sources: ISCA, TRK, and DVD 10-K filings(1) Event related includes revenue from corporate partnership and other motorsport events (i.e., non NASCAR) CAGR (3.5%) (3.9%) 2.4% – $200 $400 $600 $800 $1,000 $1,200 $1,400 2011 2012 2013 2014 2015 2016 2017 CAGR 1.1% (1.8%) (1.7%) Strong Management Team / Board driving outperformance over extended period of time
PRELIMINARY & CONFIDENTIAL Combination Could Drive Value for NASCAR and ISC Unified strategic approach could enable structural change and sponsorship bundlingNASCAR and ISC Management have stated that a more unified strategic approach between the companies is important to future growthThe prospective merger would enable, inter alia, NASCAR to more efficiently implement a new sponsorship model that moves away from title sponsorship and individual race sponsorships to bundled sponsorshipsInitially implemented this year in joint NASCAR/ISC deal with Coca-ColaEasier to negotiate agreements as one entity versus three (or more) partiesIntegrated sponsorship model across NASCAR, track owners, and media partners with a multi-tiered offering, similar to the NCAA, IOC, and Premier League, will grow recurring revenue streams NASCAR 16 Track Owners Media Partners Team Owners Precedent Tiered / Category Sponsorship Models
PRELIMINARY & CONFIDENTIAL Table of Contents 1. Executive Summary 2. DBO Introduction 3. Situation Review 4. Valuation Considerations 5. Fee Proposal and Process Recommendations 6. Appendix A: Supporting Materials 7. Appendix B: Additional Information on DBO I II III IV V A B 17
PRELIMINARY & CONFIDENTIAL Valuation Considerations 18 As discussed, ISC is a very unique company combining significant and unreplicable real estate, a partnership with one of the best brands in sports entertainment, and ancillary diversification opportunities such as gaming and lodgingThere are factors that may have historically constrained ISC’s stock price, including:Control by France FamilyLimited equity research coverageDearth of direct comparablesGiven the parameters of NASCAR’s offer (Family Stockholders will not sell their shares and do not expect to consider other corporate transactions) the valuation exercise potentially becomes comparing their ultimate offer to the expected value of the Company on a standalone basisWe have considered valuation benchmarks for ISC and the offer on a preliminary basis, and we expect to provide more thorough valuation analysis based on due diligence to advise the Special CommitteeHistorical EBITDA and P/E multiplesForward trading analysisPrecedent minority squeeze-out transactions
PRELIMINARY & CONFIDENTIAL Financial Model Overview 19 Observations and questionsKey to assessing the offer and the standalone value of ISC is evaluating the Company’sinternal outlook for the business versus buy-side / sell-side analyst expectationsOver the last five years ISC has outgrown its public competitors, with large and predictable broadcast revenues and sponsorships offsetting declining admissionsThe street expects revenue growth to increase from 1.9% (‘12-‘17) to 2.5% (‘17-‘24), with continuing broadcast and sponsorship revenue growth, as well as stabilizing admissions and other revenuesEBITDA margins are modeled to decline modestly, but require diligence to reconcile historical reporting with analyst estimatesFree cash flow is expected to grow from modest EBITDA improvement, cash flow from affiliated investments, and moderating CapEx allowing continued return of capital to shareholdersKey questions to understand include:What are appropriate expectations for new broadcast agreements post 2024?Will growing digital revenues offset admissions declines or change broadcast agreement opportunities?Are there additional development opportunities to generate new revenue streams?What returns will recent capital investments generate?What additional opportunities exist for high ROIC investments?Opportunities associated with NASCAR’s proposed restructuring?How are dividends and capital returns valued by investors?
PRELIMINARY & CONFIDENTIAL ISC Financial SummaryLimited research analyst coverage for ISC, projections per Wells Fargo Source: Company filings and Wells Fargo research (10/29/2018) A key element of the process will be understanding ISC’s internal forecast relative to street expectations FYE 11/30, $MM Historical Projections FY2014A FY2015A FY2016A FY2017A FY2018E FY2019E FY2020E FY2021E FY2022E Admissions $129.7 $130.2 $123.5 $121.5 $110.4 $111.5 $111.5 $111.5 $111.5 Motorsports Related 433.7 451.8 477.2 491.7 512.9 538.0 553.8 570.3 587.3 Food, Beverage, & Merchandise 72.9 47.3 42.0 41.3 36.5 37.2 37.2 37.2 37.2 Other Income 15.6 16.1 18.3 17.0 19.9 22.9 27.4 28.2 29.1 Total Revenue $651.9 $645.4 $661.0 $671.4 $679.7 $709.6 $730.0 $747.3 $765.2 % Growth 6.4% (1.0%) 2.4% 1.6% 1.2% 4.4% 2.9% 2.4% 2.4% EBITDA (Non-GAAP) $216.4 $229.8 $238.8 $241.5 $235.7 $243.2 $251.8 $257.4 $263.2 % Growth 0% 6% 4% 1% (2%) 3% 4% 2% 2% % Margin 33% 36% 36% 36% 35% 34% 34% 34% 34% Net Income (Non-GAAP) $65.9 $67.3 $69.0 $72.1 $85.3 $91.6 $95.0 $96.1 $97.4 % Growth (2%) 2% 3% 4% 18% 7% 4% 1% 1% % Margin 10% 10% 10% 11% 13% 13% 13% 13% 13% Free Cash Flow ($0.4) $29.0 $130.9 $71.6 $69.7 $153.3 $162.5 $165.4 $174.9 20
PRELIMINARY & CONFIDENTIAL $50 $44 $46 $44 $41 $42 $35 $35 $35 $52 $56 $46 $48 $46 $44 $44 $50 $44 $41 $54Median: $52 Median: $55 Median: $45 TRK: $33 TRK: $32 TRK: $35 TRK: $34 Median: $47 Median: $45 Median: $42 Median: $43 VWAP: $42 VWAP: $37 VWAP: $37 $30 $35 $40 $45 $50 $55 $60 Offer:$42.00 Current:$43.07 Earnings (10/4)to Offer (11/9)30 DayLTM NTM EBITDA (LTM)(7.7x-8.0x)NTM EBITDA (L5Y)(7.5x-7.9x)NTM P/E (LTM) (20.9x-21.8x) NTM P/E (L5Y)(21.8x-22.7x) '19 EBITDA(6.3x)'20 EBITDA(6.1x)'19 P/E (15.2x) '20 P/E (14.5x) First Offer (30D Avg.)(19.5%-23.8%)Final Offer (30D Avg.)(44.5%-51.2%)Final Offer (LTM High)(0.6%-4.8%) Valuation Considerations Precedent minority squeeze-out transactions imply a higher price than current offer Note: Ranges for premiums / multiples represent 40th and 60th percentiles Sources: CapIQ as of 1/2/2019; Company financials; Broker research 21 Methodologies Historical Trading Ranges Historical Multiple Ranges Speedway Motorsports Squeeze-Out Precedent Premiums
PRELIMINARY & CONFIDENTIAL ISC Share Price PerformanceCurrent offer below LTM average trading price Note: VWAP per CapIQ calculation; LTM low and high represent intraday trading prices Source: CapIQ as of 1/2/2019 22 $45.30 $42.00 $35.30 $39.06 $35 $38 $41 $44 $47 $50 Jan-18 Feb-18 Mar-18 Apr-18 May-18 Jun-18 Jul-18 Aug-18 Sep-18 Oct-18 Nov-18 Dec-18 Jan-19 NASCAR PurchasePrice Offer: $42.00 ISCA Share Price ($USD) 11/9/2018:NASCAR made public bid at $42.00 10/4/2018:Announced Q3'18 Earnings ($42.26 share price day prior) Current:$43.07 1/25/2018:Announced FY17 Earnings 4/3/2018:Announced Q1'18 Earnings Share Price Prem. / Disc. to NASCAR Purchase Offer Share Price Prem. / Disc. Day Prior to Announcement $39.50 6.3% Prior 30 Day VWAP $37.27 12.7% Prior 60 Day VWAP $39.88 5.3% Prior 90 Day VWAP $41.16 2.0% Prior 180 Day VWAP $42.46 (1.1%) LTM VWAP $42.26 (0.6%) LTM Low $35.12 19.6% LTM High $49.95 (15.9%)
PRELIMINARY & CONFIDENTIAL 23 ISC Historic Trading Performance Current offer ~ equivalent to last five years average EBITDA and P/E multiple Share Price (1) AV / NTM EBITDA Forward P/E 7.5x 8.0x 8.5x 10.0x9.5x9.0x 7.0x6.5x6.0xJan-14 Jul-14 Jan-15 Jul-15 Jan-16 Jul-16 Jan-17 Jul-17 Jan-18 Jul-18 Jan-19 Current: 8.1x 60%: 7.9xMedian: 7.7x 40%: 7.5x $30$25 $35 $40 $50$45 Jan-14 Jul-14 Jan-15 Jul-15 Jan-16 Jul-16 Jan-17 Jul-17 Jan-18 Jul-18 Jan-19 Current: $43.07 60%: $35.95Median: $34.90 40%: $33.90 20.0x 22.0x 24.0x 32.0x30.0x28.0x26.0x 18.0xJan-14 Jul-14 Jan-15 Jul-15 Jan-16 Jul-16 Jan-17Note: Current multiple based on consensus projections; Summary statistics for five years prior to initial NASCAR offer date Source: CapIQ as of 1/2/2019(1) Closing share price for each trading day Jul-17 Jan-18 Jul-18 Jan-19 60%: 22.7xMedian: 22.2x 40%: 21.8xCurrent: 21.0x
PRELIMINARY & CONFIDENTIAL Table of Contents 1. Executive Summary 2. DBO Introduction 3. Situation Review 4. Valuation Considerations 5. Fee Proposal and Process Recommendations 6. Appendix A: Supporting Materials 7. Appendix B: Additional Information on DBO I II III IV V A B 24
PRELIMINARY & CONFIDENTIAL Fee Proposal Retainer: Opinion Fee: Advisory Fee: $250K upon signing, $50K per month commencing six months after signing $2.5MM payable upon termination or signing of definitive agreements with respect to a Transaction, plus, in the event the Special Committee recommends a Transaction to the Board of Directors and definitive agreements with respect to such Transaction are signed by the Company, 2.5% of the total equity value greater than $42 per share Any Retainer or Opinion Fee previously paid will be credited against the Advisory Fee $1MM upon the rendering of a financial opinion or inadequacy letter We have examined M&A squeeze-out transactions and are proposing a fee that is lower than the average implied by the precedents. If the Special Committee determines that no transaction is in the best interest of shareholders, DBO will receive a modest fee. 25
PRELIMINARY & CONFIDENTIAL Special Committee Process & Next StepsFounding Partners lead throughout every step of the process 26 Summary Illustrative Considerations Step 1 Work with legal advisor to determinethe optimal process Review of Special Committee charterConfirm Family Stockholders will not sell shares of ISC or vote in favor ofany alternative sale, merger, or other extraordinary corporate transactionDefine extraordinary corporate transaction Step 2 Determine appropriate diligence process and conduct due diligence to determine standalone value of ISC based on Company’s internal plan Internal plan analysis to include growth initiatives, capital expenditures, opportunities, and risksInterviews with NASCAR and ISC management teams to ascertain strategic benefits of joining operationsDiscussions with Special Committee membersStrategic and financial alternatives analysis (as required by process): operating / investment alternatives; structural alternatives; competing transaction / market check If required, conduct analysis ofstrategic alternatives Step 3 Analyze minority shareholder constituency and develop optimal communications strategy, in collaboration with legal advisor Who are the majority of the minority, and what relationship do members have to the France Family, if any?How should the Special Committee handle direct contact from minority constituents? Step 4 Report back to Special Committee to discuss analysis and determine next steps Based on analysis of offer, ISC standalone valuation, and alternatives, how should the Special Committee, along with its financial and legal advisors, engage NASCAR in response to the offer?Iterative follow-up diligence and analysis based on Special Committeediscussions and review of key assumptions Step 5 With Special Committee approval, negotiation of offer terms Negotiations require careful handling with respect to long-standing partnership between NASCAR and ISC Management
PRELIMINARY & CONFIDENTIAL Table of Contents 1. Executive Summary 2. DBO Introduction 3. Situation Review 4. Valuation Considerations 5. Fee Proposal and Process Recommendations 6. Appendix A: Supporting Materials 7. Appendix B: Additional Information on DBO I II III IV V A B 27
PRELIMINARY & CONFIDENTIAL Comparable Companies Operating and trading statistics % of Equity Agg. AV / Re ve nue (3) AV / EBITDA (3) P ric e / Ea rnings (4) Re ve nue Growth Y oY EBITDA Ma rgin EP S Growth Y oY De bt/ Sourc e s: Ca pita l IQ, Compa ny filings, a nd Wa ll Stre e t Re se a rc hShare prices and consensus estimates as of 1/2/2019Market capitalization plus net debt (includes non- controlling interests and preferred equity if applicable)Revenue & EBITDA multiples less than 0.0x and greater than 50.0x considered NMP/Emultiples less than 0.0x and greater than 50.0x considered NMNote: Speedway Motorsports projections per Wells Fargo research (8/16/2018) Compa ny Na me P ric e ( 1) 5 2 W High V a lue V a lue ( 2 ) 2 0 19 E 2020E 2 0 19 E 2020E 2 0 19 E 2020E 2 0 19 E 2020E 2 0 19 E 2020E 2 0 19 E 2020E EBITDA IS C (Curre nt) $ 4 3 . 0 7 86% $ 1, 9 0 0 1, 8 8 0 2 . 7 x 2 . 6 x 8 . 1x 7 . 5 x 2 0 . 2 x 19 . 8 x 3 . 8 % 3 . 7 % 3 3 . 0 % 3 4 . 5 % 10 . 9 % 2 . 2 % 1. 1x IS C (P re - NAS CAR Offe r) $ 3 9 . 5 0 79% $ 1, 7 4 2 1, 7 2 3 2 . 5 x 2 . 4 x 7 . 1x 6 . 8 x 18 . 8 x 18 . 7 x 3 . 7 % 3 . 7 % 3 4 . 6 % 3 4 . 7 % 9 . 5 % 0 . 5 % 1. 1x Motorsports Speedway Motorsports $15.81 75% $646 $766 1.6x 1.6x 6.3x 6.1x 15.2x 14.5x 2.2% 2.2% 25.9% 26.0% 1.0% 4.8% 1.5x Dover Motorsports $2.00 87% $73 $74 NA NA NA NA NA NA NA NA NA NA NA NA 0.1x Me a n 8 1% 1. 6 x 1. 6 x 6 . 3 x 6 . 1x 15 . 2 x 14 . 5 x 2 . 2 % 2 . 2 % 2 5 . 9 % 2 6 . 0 % 1. 0 % 4 . 8 % 0 . 8 x Me dia n 8 1% 1. 6 x 1. 6 x 6 . 3 x 6 . 1x 15 . 2 x 14 . 5 x 2 . 2 % 2 . 2 % 2 5 . 9 % 2 6 . 0 % 1. 0 % 4 . 8 % 0 . 8 x Ente rta inme nt Fa c ility P rovide rs Six Flags Entertainment $56.03 76% $4,797 $7,305 4.7x 4.5x 12.2x 11.3x 19.3x 17.2x 5.5% 5.2% 38.4% 39.4% 12.0% 12.2% 3.8x Churchill Downs $242.44 77% $3,297 $4,051 3.2x 3.1x 10.5x 10.0x 17.8x 16.6x 25.4% 4.2% 30.5% 30.8% 4.4% 7.1% 2.6x Eldorado Resorts $37.95 75% $2,941 $5,728 2.0x 2.0x 7.8x 7.2x 10.0x 13.4x 36.1% 0.3% 26.1% 28.1% 108.3% (25.5%) 6.6x Cedar Fair $47.23 67% $2,670 $4,141 3.0x 2.9x 8.5x 8.2x 13.9x 13.2x 3.7% 3.5% 35.1% 35.1% 11.0% 5.5% 3.6x Penn National Gaming $19.45 53% $2,348 $6,649 1.3x 1.2x 4.3x 4.1x 12.9x 9.5x 46.9% 1.8% 29.3% 30.4% 45.2% 35.1% 5.1x SeaWorld Entertainment $22.93 71% $1,993 $3,380 2.4x 2.3x 8.1x 7.6x 19.6x 15.8x 3.0% 2.5% 29.6% 30.8% 41.0% 23.9% 3.9x Tokyotokeiba $24.81 55% $708 $735 3.3x 3.0x 7.3x 5.8x NA NA 8.8% 8.7% 44.9% 52.0% NA NA 1.9x Me a n 68% 2 . 8 x 2 . 7 x 8 . 4 x 7 . 7 x 15 . 6 x 14 . 3 x 18 . 5 % 3 . 8 % 3 3 . 4 % 3 5 . 2 % 3 7 . 0 % 9 . 7 % 3 . 9 x Me dia n 7 1% 3 . 0 x 2 . 9 x 8 . 1x 7 . 6 x 15 . 9 x 14 . 6 x 8 . 8 % 3 . 5 % 3 0 . 5 % 3 0 . 8 % 2 6 . 5 % 9 . 7 % 3 . 8 x Movie Cine ma s, The a te rs & Othe r Cineworld Group $3.22 42% $4,412 $8,062 1.7x 1.6x 7.6x 7.2x 10.4x 9.2x 18.6% 3.2% 22.4% 22.7% 18.8% 13.1% 8.2x Cinemark $36.89 84% $4,284 $5,967 1.8x 1.7x 7.5x 7.3x 15.4x 14.7x 3.8% 4.2% 24.3% 24.0% 12.7% 4.8% 2.6x AMC $12.89 60% $1,334 $6,441 1.1x 1.1x 6.9x 6.7x 28.3x 28.6x 3.3% 2.6% 16.5% 16.6% NM (1.1%) 5.7x Marcus Corporation $39.58 89% $1,156 $1,446 2.1x 2.0x 9.6x 9.0x 19.8x 18.4x 0.7% 5.1% 21.4% 21.8% 6.7% 7.5% 2.1x Reading International $14.59 83% $336 $494 1.5x 1.4x 8.2x 7.3x NA NA 8.1% 6.6% 18.2% 19.2% NA NA 3.5x Me a n 72% 1. 6 x 1. 6 x 8 . 0 x 7 . 5 x 18 . 5 x 17 . 7 x 6 . 9 % 4 . 3 % 2 0 . 6 % 2 0 . 8 % 12 . 7 % 6 . 1% 4 . 4 x Me dia n 83% 1. 7 x 1. 6 x 7 . 6 x 7 . 3 x 17 . 6 x 16 . 5 x 3 . 8 % 4 . 2 % 2 1. 4 % 2 1. 8 % 12 . 7 % 6 . 1% 3 . 5 x 28
PRELIMINARY & CONFIDENTIAL Comparable Company Growth Regression Source: CapIQ as of 1/2/2019Note: Excludes Dover Motorsports (no broker estimates), Tokyotokeiba, Reading International 29 ISC (Pre-NASCAR Offer) Speedway Motorsports Six Flags Entertainment Churchill Downs Eldorado Resorts Cedar Fair Penn National Gaming SeaWorld Entertainment Cinemark AMC Marcus Corporation ISC (Current) Cineworld Group y = 89.991x + 4.7479R² = 0.4749 3.0x 4.0x 5.0x 6.0x 7.0x 8.0x 9.0x 10.0x 11.0x 12.0x - 1.0% 2.0% 3.0% 4.0% 5.0% 6.0% 2020 EBITDA Multiple 2020 Rev. Growth Unaffected ISC (Pre- NASCAR Offer) EBITDA Multiple ± 1/2 standard deviation
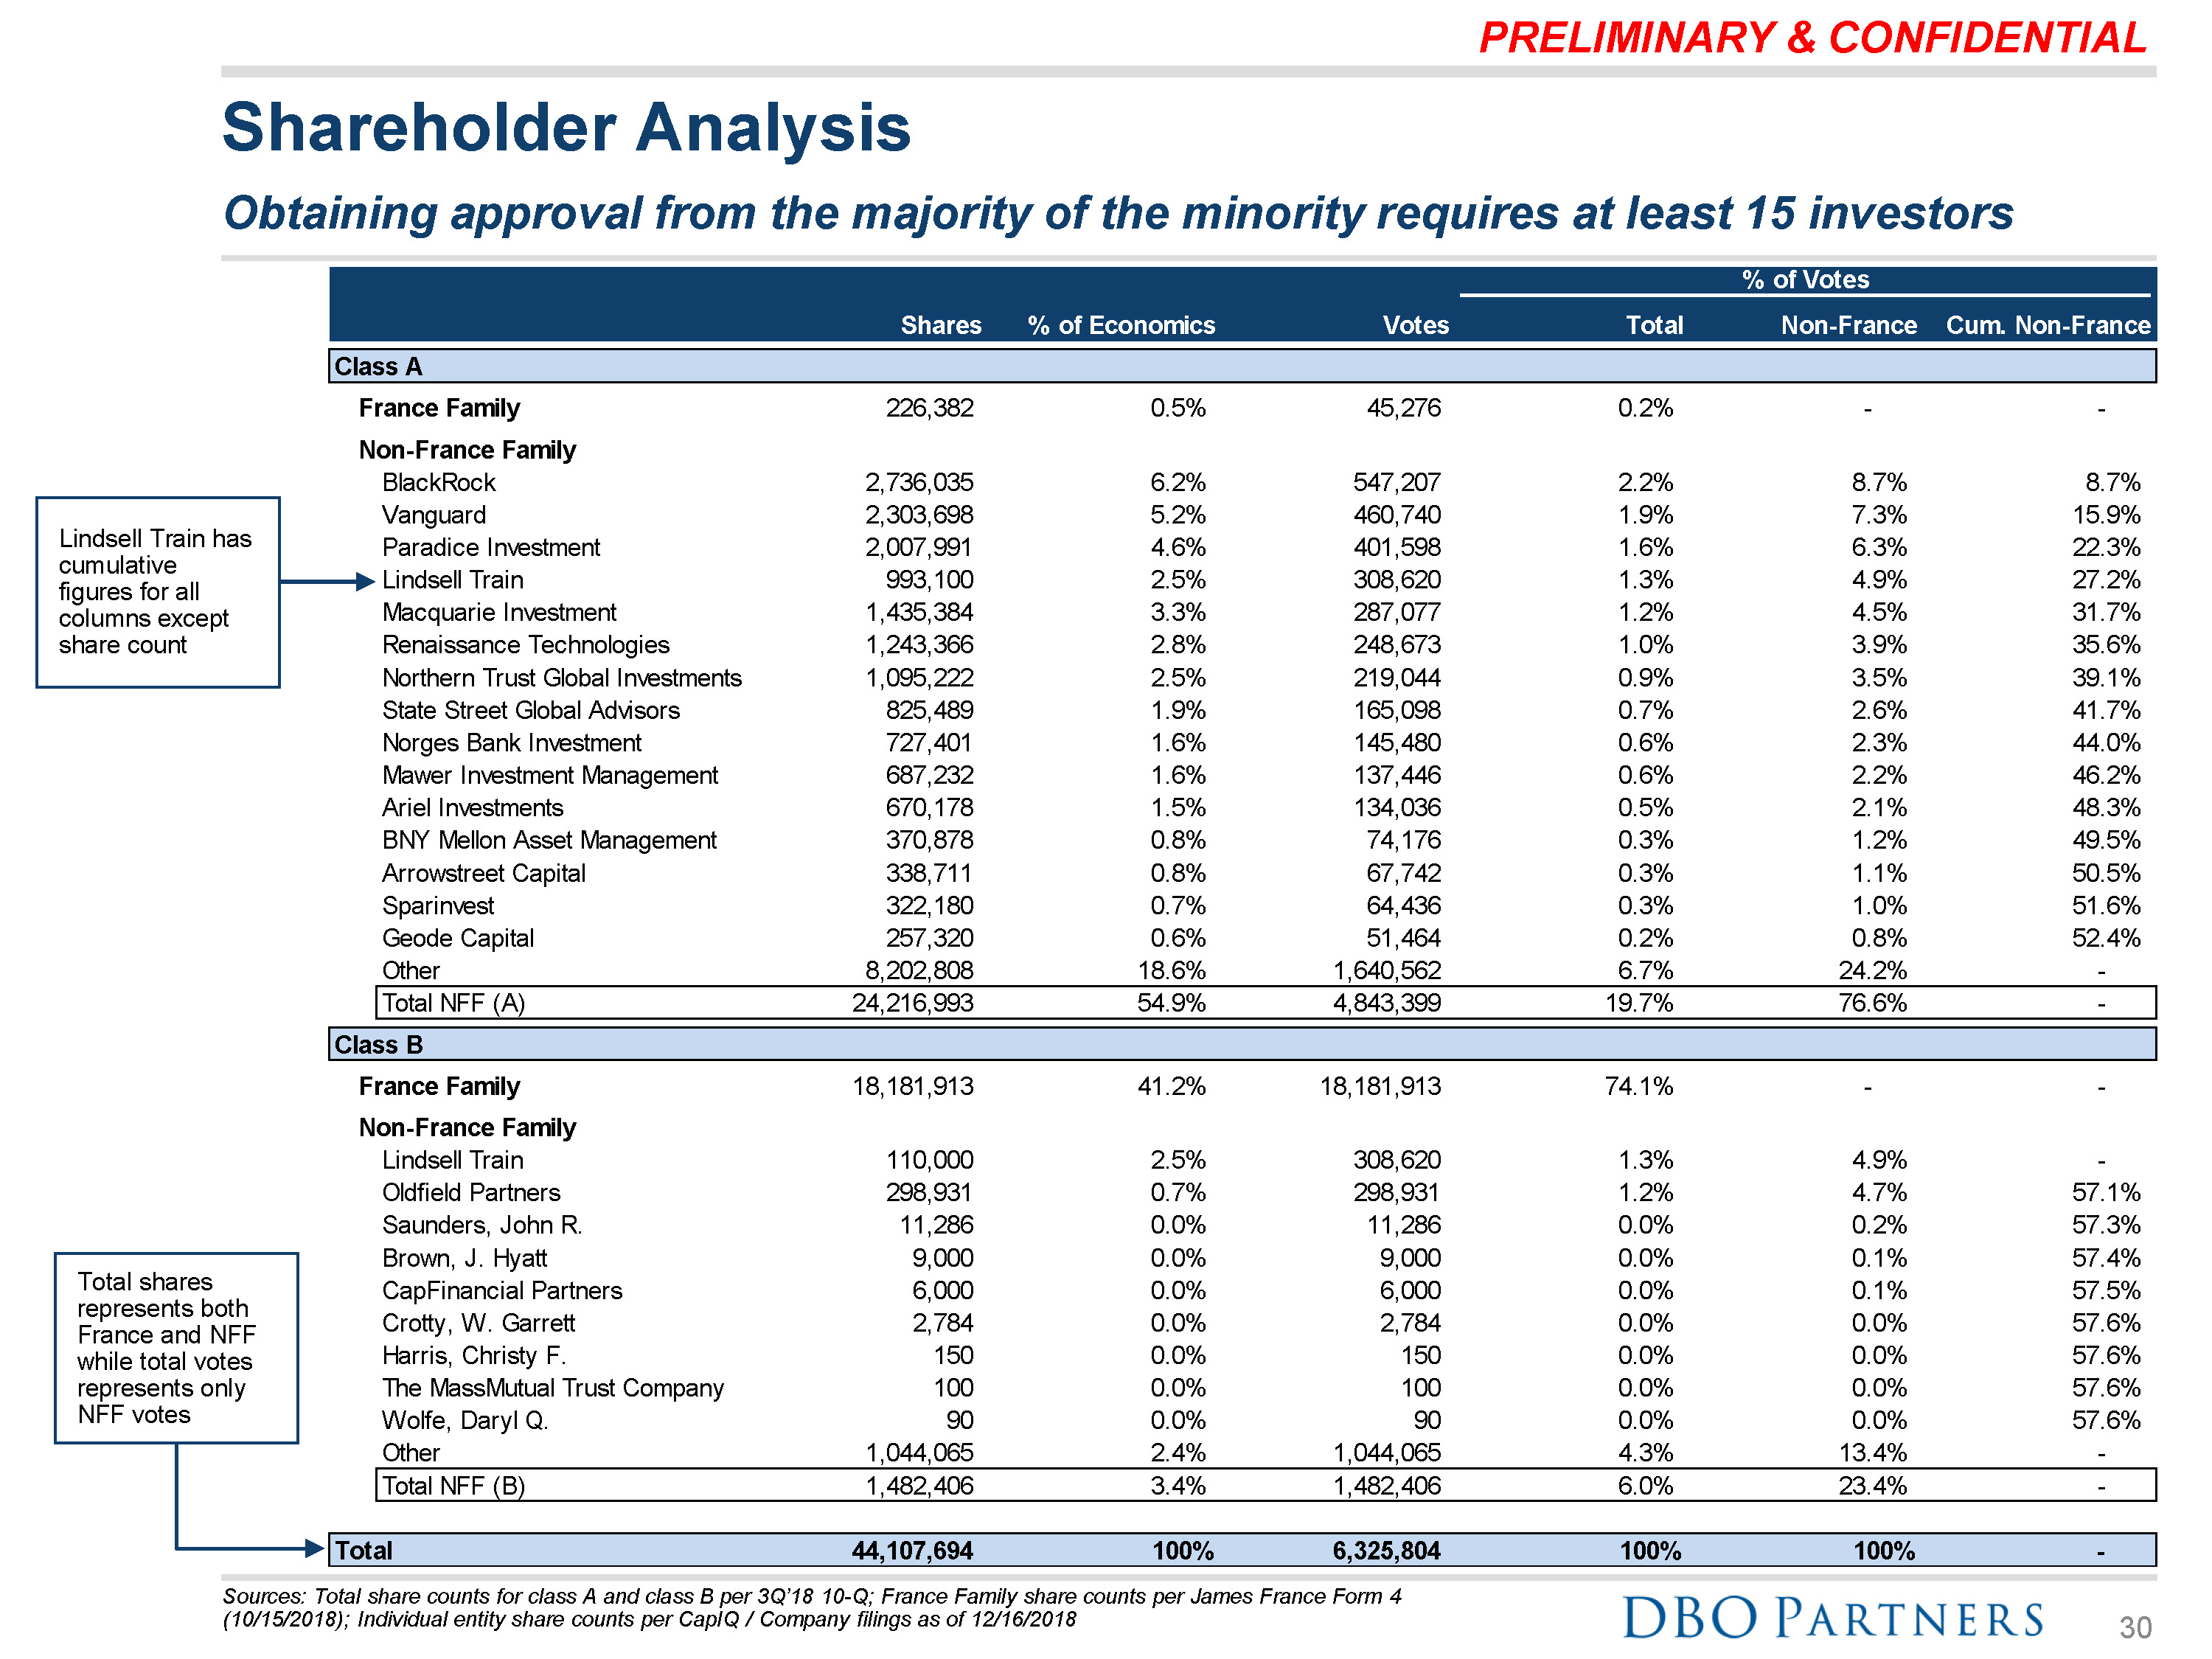
PRELIMINARY & CONFIDENTIAL Shareholder Analysis Obtaining approval from the majority of the minority requires at least 15 investors Sources: Total share counts for class A and class B per 3Q’18 10-Q; France Family share counts per James France Form 4 (10/15/2018); Individual entity share counts per CapIQ / Company filings as of 12/16/2018 30 Shares % of Economics Votes Total % of VotesNon-France Cum. Non-France Class A Total 44,107,694 100% 6,325,804 100% 100% - France FamilyNon-France Family 226,382 0.5% 45,276 0.2% - - BlackRock 2,736,035 6.2% 547,207 2.2% 8.7% 8.7% Vanguard 2,303,698 5.2% 460,740 1.9% 7.3% 15.9% Paradice Investment 2,007,991 4.6% 401,598 1.6% 6.3% 22.3% Lindsell Train 993,100 2.5% 308,620 1.3% 4.9% 27.2% Macquarie Investment 1,435,384 3.3% 287,077 1.2% 4.5% 31.7% Renaissance Technologies 1,243,366 2.8% 248,673 1.0% 3.9% 35.6% Northern Trust Global Investments 1,095,222 2.5% 219,044 0.9% 3.5% 39.1% State Street Global Advisors 825,489 1.9% 165,098 0.7% 2.6% 41.7% Norges Bank Investment 727,401 1.6% 145,480 0.6% 2.3% 44.0% Mawer Investment Management 687,232 1.6% 137,446 0.6% 2.2% 46.2% Ariel Investments 670,178 1.5% 134,036 0.5% 2.1% 48.3% BNY Mellon Asset Management 370,878 0.8% 74,176 0.3% 1.2% 49.5% Arrowstreet Capital 338,711 0.8% 67,742 0.3% 1.1% 50.5% Sparinvest 322,180 0.7% 64,436 0.3% 1.0% 51.6% Geode Capital 257,320 0.6% 51,464 0.2% 0.8% 52.4% Other 8,202,808 18.6% 1,640,562 6.7% 24.2% - Total NFF (A) 24,216,993 54.9% 4,843,399 19.7% 76.6% - Class B France Family 18,181,913 41.2% 18,181,913 74.1% - - Non-France FamilyLindsell Train 110,000 2.5% 308,620 1.3% 4.9% - Oldfield Partners 298,931 0.7% 298,931 1.2% 4.7% 57.1% Saunders, John R. 11,286 0.0% 11,286 0.0% 0.2% 57.3% Brown, J. Hyatt 9,000 0.0% 9,000 0.0% 0.1% 57.4% CapFinancial Partners 6,000 0.0% 6,000 0.0% 0.1% 57.5% Crotty, W. Garrett 2,784 0.0% 2,784 0.0% 0.0% 57.6% Harris, Christy F. 150 0.0% 150 0.0% 0.0% 57.6% The MassMutual Trust Company 100 0.0% 100 0.0% 0.0% 57.6% Wolfe, Daryl Q. 90 0.0% 90 0.0% 0.0% 57.6% Other 1,044,065 2.4% 1,044,065 4.3% 13.4% - Total NFF (B) 1,482,406 3.4% 1,482,406 6.0% 23.4% - Lindsell Train has cumulative figures for all columns except share count Total shares represents both France and NFF while total votes represents only NFF votes
PRELIMINARY & CONFIDENTIAL $MM (except per share) AmericaLtd. Communications L.P. Services Date Target Buyer %Acq. Trans. Value Implied Offers Equity Val. Agg. Val. First Final %Incr. Months From First Offer Premium to: Final Offer Premium to: First OfferUnaffected 30 Day Avg LTM High Unaffected 30 Day Avg LTM High to Announce Target Industry 1/4/2010 Alcon Novartis AG 23% $11,798 $51,230 $48,215 $153.00 $168.00 10% (7%) (6%) (8%) 2% 4% 1% 12 Health Care 4/20/2009 The Pepsi Bottling Group PepsiCo 67% 5,283 7,865 14,411 $29.50 $36.50 24% 17% 29% (16%) 45% 60% 4% 3.6 Beverages 12/13/2012 Clearwire Corp. Sprint 50% 3,747 7,517 11,966 $2.60 $2.97 14% 23% 24% (12%) 40% 42% 0% 0.9 Telecom Services 6/2/2010 Gerdau Ameristeel Corp. Gerdau Steel North 34% 1,607 4,768 6,604 $11.00 $11.00 - 48% 47% 14% 48% 47% 14% 1.0 Steel 9/4/2009 Odyssey Re Holdings Corp. Fairfax Financial Holdings 27% 1,041 3,799 – $58.00 $65.00 12% 16% 20% 6% 30% 35% 19% 1 Insurance 4/20/2009 PepsiAmericas PepsiCo 57% 2,009 3,548 6,002 $23.27 $28.50 22% 17% 29% (14%) 43% 58% 6% 4 Beverages 11/28/2012 Danfoss Power Solutions Danfoss A/S 24% 691 2,833 3,025 $49.00 $58.50 19% 24% 24% (13%) 49% 48% 4% 3 Agriculture 2/29/2016 Federal-Mogul Icahn Enterprises Holdings 18% 304 1,690 4,557 $7.00 $9.25 32% 41% 63% (50%) 86% 116% (34%) 6 Auto Components 6/29/2009 First Advantage Corp. First American Corp. 20% 308 1,522 1,531 $14.04 $19.47 39% 15% 8% (25%) 59% 50% 4% 3 Application HostingServices 6/11/2013 Dole Food Company David Murdock 60% 737 1,220 1,493 $12.00 $13.50 13% 22% 14% (21%) 37% 29% (11%) 3 Agricultural Products 11/1/2010 CNA Surety Corp. Continental Casualty Co. 38% 456 1,194 – $22.00 $26.55 21% 15% 18% 11% 39% 43% 34% 6 Insurance 12/22/2009 Danfoss Power Solutions Danfoss A/S 24% 165 678 1,199 $10.10 $14.00 39% 20% 10% (0%) 66% 52% 38% 4 Agriculture 3/7/2016 National Interstate Corp. American Financial Group 49% 313 642 – $30.00 $32.50 8% 33% 28% (2%) 44% 38% 7% 5 Insurance 11/15/2010 Mediacom Rocco Commisso 60% 361 597 3,920 $6.00 $8.75 46% 13% 3% (18%) 64% 50% 20% 6 Cable and Satellite 2/5/2014 National Interstate Corp. American Financial Group 48% 286 592 – $28.00 $30.00 7% 26% 22% (23%) 35% 31% (17%) 1 Insurance 9/23/2009 Ligado Networks Harbinger Capital Partners 51% 278 544 1,496 $4.00 $5.00 25% 21% 24% (20%) 52% 55% - 1 Telecom Services 6/13/2011 M&F Worldwide Corp. MacAndrews & Forbes 57% 277 483 2,511 $24.00 $25.00 4% 42% 15% (22%) 47% 20% (19%) 3 Commercial andProfessional Services 3/7/2017 Handy & Harman Steel Partners Holdings 37% 171 459 705 $29.00 $35.00 21% - 12% (3%) - 35% 17% 4 Steel 3/25/2009 Hearst Television Hearst Broadcasting 18% 76 422 1,217 $4.00 $4.50 13% 91% 126% (84%) 115% 154% (82%) 1 Broadcasting 11/3/2009 Landry's Tim Fertitta 45% 179 398 1,460 $13.00 $24.50 88% 24% 20% 1% 133% 126% 90% 8 Full ServiceRestaurants 3/23/2009 Cox Radio Cox Media Group 22% 82 382 765 $3.80 $4.80 26% 15% (10%) (71%) 45% 14% (63%) 1 Broadcasting 8/1/2016 Affinity Gaming Z Capital Management 59% 217 369 668 $15.00 $17.35 16% - - - - - - 1 Casinos and Gaming 11/15/2012 Bluegreen Vacations Corp. BFC Financial 46% 146 318 829 $2.18 $4.64 113% (3%) 7% (54%) 107% 128% (2%) 1 Hotels And Motels 4/3/2015 Affinity Gaming Z Capital Management 61% 185 306 515 $9.75 $15.00 54% - - - - - - 10 Casinos and Gaming 12/12/2016 Alliance Healthcare Fujian Thaihot Investment 49%Services Co. 72 147 801 $9.60 $13.25 38% 20% 27% (1%) 66% 75% 37% Health Care4 Equipment and 7/9/2009 XO Holdings ACF Industries Holding 47% 69 146 871 $0.55 $0.80 45% 90% 76% (30%) 176% 156% 1% 4 CommunicationServices 7/22/2010 BlueLinx Holdings Cerberus CapitalManagement 45% 58 131 559 $3.40 $4.00 18% 35% 24% (46%) 59% 46% (37%) 3 Building ProductDistribution Precedent Minority Squeeze-Out TransactionsLast 10 years 40th Percentile 18% 20% 19% (20%) 46% 45% 1% 3.1 Gray Indicates Cancelled Transactions Average 28% 27% 26% (20%) 62% 60% 1% 3.7 Median 21% 21% 22% (16%) 48% 48% 4% 3.5 60th Percentile 24% 24% 24% (12%) 58% 51% 5% 3.6 Sources: CapIQ as of 1/2/2019 and Company Filings 31
PRELIMINARY & CONFIDENTIAL Table of Contents 1. Executive Summary 2. DBO Introduction 3. Situation Review 4. Valuation Considerations 5. Fee Proposal and Process Recommendations 6. Appendix A: Supporting Materials 7. Appendix B: Additional Information on DBO I II III IV V A B 32
PRELIMINARY & CONFIDENTIAL DBO FormulaHighly ExperiencedBankersClient-FocusedConflict-Free AdviceConfidentialityInnovation The DBO Partners’ Model 33
PRELIMINARY & CONFIDENTIAL Gordon DeanFounding Partner Gordon Dean began his professional career as a securities lawyer in Washington, DC. He joined Morgan Stanley in 1986 where he rose to become a Managing Director and Vice Chairman of Investment Banking. He ran the San Francisco Investment Banking operations and was co-head of the firm's Western Region.Mr. Dean has completed over 125 transactions, totaling over $100 billion of financing and mergers and acquisitions for many of the Firm's clients including Albertson's, BankAmerica Corporation, Boeing, Charles Schwab, Clorox, Coinstar, Consolidated Rail, Del Monte, KKR, Levi Strauss, McKesson, Molson Coors, PACCAR, Safeway, TPG, Transamerica, Univar, URS, and Wells Fargo.He has served on the Board of Regents of Georgetown University as well as the Board of Directors of Engineering Change, KnowledgeBeat, and the San Francisco Golf Club. Mr. Dean also served on the Board of the San Francisco Opera and was Chairman of the San Francisco Zoological Society. 34
PRELIMINARY & CONFIDENTIAL Mark BradleyFounding Partner Mark Bradley is a Founding Partner of Dean Bradley Osborne. He started his career with Morgan Stanley in 1985 after graduating from The University of California at Berkeley with a BS in Business Administration. He worked for two years as an analyst in the Firm's Mergers & Acquisitions department. From 1987 to 1989 he attended Stanford Business School where he earned his Masters in Business Administration. He returned to Morgan Stanley in 1989 as an associate in the Corporate Finance department. Mark was the Global Head of MorganStanley’s Financial Sponsors coverage group for eleven years before becoming Chairman of the Group in 2011.As Head of the Financial Sponsors Group, Mark was responsible for managing all of Morgan Stanley’s relationships with private equity firms globally. He has been involved in many of the largest and most complex LBOs. In addition, he has had the privilege of advising many private equity firms on financing and strategic opportunities at the GP level. Notable transactions where Mark was involved include the $45Bn LBO of TXU, $20Bn merger of Seagate and Veritas and thesubsequent $2Bn LBO of Seagate’s disk drive business, $12Bn LBO of NXP,$11Bn LBO of SunGard and the $8Bn LBO of Avaya. At the GP level, Mark was involved in the $5Bn IPO of KPE, the subsequent merger of KKR and KPE and relisting of KKR on the NYSE, IPO of Blackstone, and the sale of a minority stake in TPG to CDB. 35
PRELIMINARY & CONFIDENTIAL Nick OsborneFounding Partner 36 Nicholas Osborne’s banking career spans 31 years. Prior to co-founding DBO Partners, he was a Managing Director and Head of Global Technology Mergers & Acquisitions at Morgan Stanley. In this role he was responsible for managing relationships and advising on M&A transactions for leading global technology companies including Advanced Micro Devices, Applied Materials, Arcsight, Atmel, CNET, eBay, Electronic Arts, Ingram Micro, Intuit, Oracle, Omniture, Qlogic, Rightnow, Sandisk, Semtech, and Zappos. He has completed transactions valued in excess of $100 billion and has extensive experience representing both buyers and sellers, structuring and negotiating significant JV’s, and advising on activist and hostile situations.Prior to joining Morgan Stanley’s Technology M&A Group in 1996, Mr. Osborne was a Vice President in the Financial Sponsor Group at Morgan Stanley and an Associate in the High Yield Finance Group at First Boston in New York City. In these roles he worked with leading private equity firms and their portfolio companies as well as large public companies structuring and executing leveraged buyouts, initial public offerings and highly leveraged financings. Prior to attending business school, he completed the management program and was a corporate finance officer focused on large multinational clients at JP Morgan in New York City.Mr. Osborne is a graduate of Williams College with a BA in Economics and of theTuck School of Business Administration at Dartmouth College with an MBA.