UNITED STATES
SECURITIES AND EXCHANGE COMMISSION
Washington, D.C. 20549
FORM N-CSR
CERTIFIED SHAREHOLDER REPORT OF REGISTERED
MANAGEMENT INVESTMENT COMPANIES
Investment Company Act file number: 811-00242
(Exact name of Registrant as specified in charter)
|
| 399 Boylston Street, Boston, Massachusetts 02116 |
(Address of principal executive offices) (Zip code)
Coleen Downs Dinneen, Esq.
NGAM Distribution, L.P.
399 Boylston Street
|
| Boston, Massachusetts 02116 |
(Name and address of agent for service)
Registrant’s telephone number, including area code: (617) 449-2810
Date of fiscal year end: December 31
Date of reporting period: June 30, 2012
Item 1. Reports to Stockholders.
The Registrant’s semi-annual report transmitted to shareholders pursuant to Rule 30e-1 under the Investment Company Act of 1940 is as follows:
SEMIANNUAL REPORT
June 30, 2012

ASG Diversifying Strategies Fund
ASG Global Alternatives Fund
ASG Managed Futures Strategy Fund
Loomis Sayles Absolute Strategies Fund
Loomis Sayles Multi-Asset Real Return Fund
TABLE OF CONTENTS
Management Discussion and Investment Results page 1
Consolidated Portfolio of Investments page 33
Consolidated Financial Statements page 71
ASG DIVERSIFYING STRATEGIES FUND
Management Discussion
Managers:
Andrew W. Lo
Jeremiah H. Chafkin
Philippe P. Lüdi
AlphaSimplex Group, LLC
(Adviser)
Robert S. Rickard
Reich & Tang Asset Management, LLC
(Subadviser)
Objective:
Pursues an absolute return strategy that seeks to provide capital appreciation while maintaining a low or negative correlation over time with the returns of major equity indices.
Strategy:
Seeks to generate positive absolute returns over time rather than track the performance of any particular index by using multiple quantitative investment models and strategies.
Inception Date:
August 3, 2009
Symbols:
| | |
| Class A | | DSFAX |
| Class C | | DSFCX |
| Class Y | | DSFYX |
Market Conditions
Investors began 2012 optimistic for a better year in financial markets. The European Central Bank’s allocation of additional short-term loans to eurozone banks, combined with global “easy money” policies boosted investor sentiment. This optimism, in conjunction with hopes that increased liquidity would alleviate financial pressures in Europe, helped equities stage an impressive rally during the first quarter.
Hopes faded, however, as the second quarter advanced. Political uncertainty in Europe and continued deterioration of global economic data quelled prospects for a global recovery. Increased volatility in financial markets led to increased demand for safe-haven assets. The U.S. Dollar Index rallied sharply and prices increased for sovereign bonds of safe-haven countries, whereas equity and commodity markets, in particular energy and base metals, suffered large declines. As the first half of the year came to a close, news out of the European Summit led to renewed optimism among investors.
Performance Results
For the six months ended June 30, 2012, Class A shares of ASG Diversifying Strategies Fund returned -5.33% at net asset value. The fund lagged its benchmark, the 3-month London Interbank Offered Rate (LIBOR), which returned 0.28%. The fund follows an absolute return strategy and does not seek to track any index. Therefore, we believe its most appropriate benchmark is the 3-month LIBOR.
Explanation of Fund Performance
The fund seeks to achieve absolute returns using a mix of proprietary, quantitative strategies, while maintaining a low or negative correlation over time with major equity indexes. The fund typically uses derivative instruments such as futures and forward contracts on global stock indexes, fixed-income securities, currencies, interest rates, and commodities to gain liquid, broad market exposures. The fund aims to achieve its equity correlation control objective by selling futures on global stock indexes when the trailing 12-month equity correlation of fund holdings
1 |
would otherwise be too high. When the fund takes on a “long” exposure to a market, it profits as prices rise; when it takes on a “short” exposure, it profits as prices fall.
The fund’s negative return during the first half of the year was primarily attributable to currency losses in February and March (when anxiety about slowing Asian economies caused Asian-Pacific currencies to weaken relative to the dollar) and commodity losses in May (based on the sharp sell-off in energy and agricultural commodities). Fixed-income futures, including sovereign debt and short-term interest rate futures, contributed positively to performance. However, the losses in commodities and foreign currencies more than offset those gains. The contribution from equities was also negative, but only marginally so. Among equities, gains during January were more than offset by negative returns later in the first quarter, particularly during March, as stark divergence in global equity markets, triggered by concerns about a slowdown of economic activity in China and positive developments in the U.S., proved challenging for our equity relative-value signals. The equity correlation control mechanism contributed marginally positively overall. Fixed-income gains, mainly driven by episodes of flight to quality in April and May, were only partly offset by a yield spike in March and a return of risk appetite in June. Short-term interest rates remained low, so the contribution from money market positions was small.
The biggest positive contributors were Australian, British, and U.S. government bonds. Conversely, the biggest detractors from performance were the Japanese yen, the Australian and New Zealand dollars, along with the Japanese Topix Index.
The fund’s realized annualized volatility was 7.9%, consistent with its risk objectives and well within its targeted range. In order to help investors achieve diversification benefits in their overall portfolios, ASG Diversifying Strategies Fund seeks a low trailing 12-month correlation with global equity markets. The correlation of daily returns was -10% with the S&P 500® Index during the first half of the year and 0% for the trailing 12-month period.
Outlook
The outlook for global markets is cautiously positive following the latest European Summit. Investors are unsure whether the necessary fiscal and political reforms in the eurozone are feasible and can be implemented quickly enough to prevent further escalation of the crisis. Additional monetary easing by central banks globally and the extension of the U.S. Federal Reserve’s “Operation Twist” will likely buoy markets. However, the impending U.S. presidential election and the increased partisanship it brings to an already divided Congress will likely prevent Washington from addressing unemployment levels or the budget deficit, reducing the chance of a faster economic recovery. This, combined with the controversy of the reforms being attempted in Europe, may cause investors to remain somewhat cautious.
What You Should Know
Investments in the fund are subject to a number of risks. Please see the “Principal Risks” section of the fund’s prospectus. The purchase of fund shares should be seen as a long-term investment.
| 2
ASG DIVERSIFYING STRATEGIES FUND
Investment Results through June 30, 2012
The charts comparing the fund’s performance to an index provide a general sense of how it performed. The fund’s total return for the period shown below appears with and without sales charges and includes fund expenses and fees. An index measures the performance of a theoretical portfolio. Unlike a fund, an index is unmanaged and does not have expenses that affect the results. It is not possible to invest directly in an index. Investors would incur transaction costs and other expenses if they purchased the securities necessary to match the index.
Growth of $10,000 Investment in Class A Shares5
August 3, 2009 (inception) through June 30, 2012
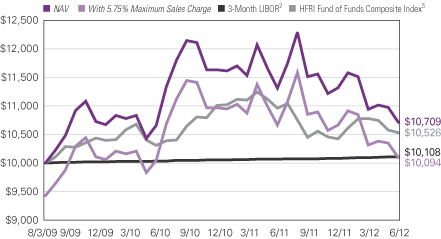
Performance data quoted represents past performance and is no guarantee of future results. Total return and value will vary and you may have a gain or loss when shares are sold. Current performance may be lower or higher than quoted. For most recent month-end performance, visit ngam.natixis.com. Performance for other share classes will be greater or less than shown based on differences in fees and sales charges.
Expense Ratios
| | | | |
| Gross Expense Ratio (before fee waivers and/or expense reimbursements)* |
| Class A: 1.80% | | Class C: 2.55% | | Class Y: 1.55% |
|
| Net Expense Ratio (after fee waivers and/or expense reimbursements)* |
| Class A: 1.72% | | Class C: 2.47% | | Class Y: 1.47% |
| * | As stated in the most recent prospectus. Waivers/reimbursements are contractual and are set to expire on 4/30/13. Contracts are reevaluated on an annual basis. |
3 |
Average Annual Total Returns — June 30, 20125
| | | | | | | | | | | | |
| | | | |
| | | 6 Months | | | 1 Year | | | Since Inception | |
| | | | |
| Class A (Inception 8/3/09) | | | | | | | | | | | | |
| NAV | | | -5.33 | % | | | -5.33 | % | | | 2.39 | % |
| With 5.75% Maximum Sales Charge | | | -10.74 | | | | -10.77 | | | | 0.32 | |
| | | | |
| Class C (Inception 8/3/09) | | | | | | | | | | | | |
| NAV | | | -5.70 | | | | -6.04 | | | | 1.60 | |
| With CDSC1 | | | -6.64 | | | | -6.95 | | | | 1.60 | |
| | | | |
| Class Y (Inception 8/3/09) | | | | | | | | | | | | |
| NAV | | | -5.22 | | | | -5.04 | | | | 2.60 | |
| | | | |
| Comparative Performance | | | | | | | | | | | | |
| 3-Month LIBOR2 | | | 0.28 | | | | 0.39 | | | | 0.37 | |
| HFRI Fund of Funds Composite Index3 | | | 0.99 | | | | -4.49 | | | | 1.70 | |
| Morningstar Multialternative Fund Avg.4 | | | 0.84 | | | | -2.41 | | | | 3.30 | |
Performance data quoted represents past performance and is no guarantee of future results. Total return and value will vary and you may have a gain or loss when shares are sold. Current performance may be lower or higher than quoted. For most recent month-end performance, visit ngam.natixis.com. Performance for periods less than one year is cumulative, not annualized. Returns reflect changes in share price and reinvestment of dividends and capital gains, if any. Class Y shares are not available for purchase by all investors.
The table and graph do not reflect taxes shareholders might owe on any fund distributions or when they redeem their shares.
Note: Portfolio summary tables previously included on this page can be found on the fund’s fact sheet available at ngam.natixis.com.
NOTES TO CHARTS
| 1 | Performance for Class C shares assumes a 1% contingent deferred sales charge (“CDSC”) applied when you sell shares within one year of purchase. |
| 2 | 3-Month LIBOR, or the London Interbank Offered Rate, represents the average rate a leading bank, for a given currency (in this case U.S. dollars), can obtain unsecured funding, and is representative of short-term interest rates. |
| 3 | HFRI Fund of Funds Composite Index is an unmanaged, equally-weighted hedge fund index including over 800 domestic and offshore funds of funds. Funds included within the index have either at least $50 million in assets under management or have been actively trading for at least twelve (12) months. Performance information is submitted by the funds of funds to the index provider, which does not audit the information submitted. The index is rebalanced monthly. Performance data is net of all fees charged by the hedge funds. Index returns are calculated three times each month and are subject to periodic recalculation by Hedge Fund Research, Inc. The funds do not expect to update the index returns provided if subsequent recalculations cause such returns to change. In addition, because of these recalculations, the HFRI Index returns reported by the funds may differ from the index returns for the same period published by others. |
| 4 | Morningstar Fund Averages are the average performance without sales charges of funds with similar investment objectives, as calculated by Morningstar, Inc. |
| 5 | Fund performance has been increased by fee waivers and/or expense reimbursements, if any, without which performance would have been lower. |
| 4
ASG GLOBAL ALTERNATIVES FUND
Management Discussion
Managers:
Andrew W. Lo
Jeremiah H. Chafkin
Peter A. Lee
AlphaSimplex Group, LLC
(Adviser)
Robert S. Rickard
Reich & Tang Asset Management, LLC
(Subadviser)
Objective:
Pursues an absolute return strategy that seeks capital appreciation consistent with the return and risk characteristics of a diversified portfolio of hedge funds while maintaining less volatility than major equity indices.
Strategy:
Seeks to achieve long and short exposure to global equity, bond, currency, and commodity markets through a wide range of derivative instruments and direct investments.
Inception Date:
September 30, 2008
Symbols:
| | |
| Class A | | GAFAX |
| Class C | | GAFCX |
| Class Y | | GAFYX |
Market Conditions
Investors began 2012 optimistic for a better year in financial markets. The European Central Bank’s allocation of additional short-term loans to eurozone banks, combined with global “easy money” policies boosted investor sentiment. This optimism, in conjunction with hopes that increased liquidity would alleviate financial pressures in Europe, helped equities stage an impressive rally during the first quarter. Hopes faded, however, as the second quarter advanced. Political uncertainty in Europe and continued deterioration of global economic data quelled prospects for a global recovery. Increased volatility in financial markets led to increased demand for safe-haven assets. The U.S. Dollar Index rallied sharply and prices increased for sovereign bonds of safe-haven countries, whereas equity and commodity markets, in particular energy and base metals, suffered large declines. As the first half of the year came to a close, news out of the European Summit led to renewed optimism among investors.
Performance Results
For the six months ended June 30, 2012, Class A shares of ASG Global Alternatives Fund returned -2.83% at net asset value. Although the fund follows an absolute return strategy and does not seek to track an index, its benchmark is the HFRI Fund of Funds Composite Index, which returned 0.99% for the same period. It is important to note that there are important differences between the fund and the benchmark, which is non-investable.
Explanation of Fund Performance
The fund’s strategy is to take on the exposures that best reflect the liquid, broad market exposures of the hedge fund industry as estimated by a proprietary, statistical process. When the fund takes on a “long” exposure to an underlying security, the long exposure profits as the price of the underlying security rises but suffers losses when its price falls; conversely, when the fund takes on a “short” exposure, the short exposure suffers losses as the price of the underlying security rises but profits as its price falls. In taking on these exposures, the fund
5 |
typically makes extensive use of futures and forward contracts on global stock indexes, fixed-income securities, short-term interest rates, currencies and commodities. As market events unfold, these various market exposures result in a profit or loss for the fund.
During the reporting period, exposures to bonds, equities, and short-term interest rates contributed positively to fund performance, whereas commodities and foreign currencies detracted from returns. After beginning the year with gains in January and February, the fund incurred losses in March and May, whereas April and June were marginally positive. A stronger U.S. dollar against the Japanese yen resulted in negative performance in foreign currencies in February. Commodities contributed positively in January and February, but price declines in energy commodities and base metals in March and May more than offset earlier gains. Meanwhile, among equities, gains in the first quarter were nearly offset by negative returns during the market reversal in May. Fixed-income gains, mainly driven by episodes of flight to quality in April and May, were only partly offset by a yield spike in March and a return of risk appetite in June.
The biggest positive contributors during the first six months of 2012 were German and U.S. 10-year government bonds, along with natural gas. Conversely, the biggest detractors from performance were the Japanese yen, heating oil and nickel. The contribution from the fund’s money market positions was small.
As investors embraced risky assets during the start of the year and market volatility was generally subdued, the fund increased its risk taking in equities, foreign currencies, and commodities. When risk appetite waned later in the spring, the fund generally reduced its positions to compensate for increased market volatility. The fund’s realized volatility was 7.3%, which is in line with our risk management expectations.
Outlook
The outlook for global markets is cautiously positive following the latest European Summit. Investors are unsure whether the necessary fiscal and political reforms in the eurozone are feasible and can be implemented quickly enough to prevent further escalation of the crisis. Additional monetary easing by central banks globally and the extension of the U.S. Federal Reserve’s “Operation Twist” will likely buoy markets. However, the impending U.S. presidential election and the increased partisanship it brings to an already divided Congress will likely prevent Washington from addressing unemployment levels or the budget deficit, reducing the chance of a faster economic recovery. This, combined with the controversy of the reforms being attempted in Europe, may cause investors to remain somewhat cautious.
What You Should Know
Investments in the fund are subject to a number of risks. Please see the “Principal Risks” section of the fund’s prospectus. The purchase of fund shares should be seen as a long-term investment.
| 6
ASG GLOBAL ALTERNATIVES FUND
Investment Results through June 30, 2012
The charts comparing the fund’s performance to an index provide a general sense of how it performed. The fund’s total return for the period shown below appears with and without sales charges and includes fund expenses and fees. An index measures the performance of a theoretical portfolio. Unlike a fund, an index is unmanaged and does not have expenses that affect the results. It is not possible to invest directly in an index. Investors would incur transaction costs and other expenses if they purchased the securities necessary to match the index.
Growth of $10,000 Investment in Class A Shares4
September 30, 2008 (inception) through June 30, 2012
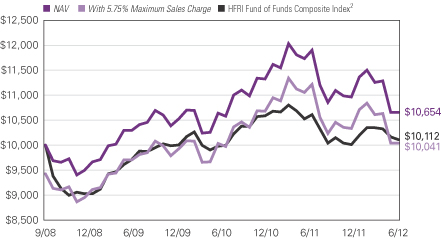
Performance data quoted represents past performance and is no guarantee of future results. Total return and value will vary and you may have a gain or loss when shares are sold. Current performance may be lower or higher than quoted. For most recent month-end performance, visit ngam.natixis.com. Performance for other share classes will be greater or less than shown based on differences in fees and sales charges.
Expense Ratios
| | | | |
| Gross Expense Ratio (before fee waivers and/or expense reimbursements)* |
| Class A: 1.61% | | Class C: 2.36% | | Class Y: 1.37% |
|
| Net Expense Ratio (after fee waivers and/or expense reimbursements)* |
| Class A: 1.61% | | Class C: 2.36% | | Class Y: 1.36% |
| * | As stated in the most recent prospectus. Waivers/reimbursements are contractual and are set to expire on 4/30/13. Contracts are reevaluated on an annual basis. |
7 |
Average Annual Total Returns — June 30, 20124
| | | | | | | | | | | | |
| | | | |
| | | 6 Months | | | 1 Year | | | Since Inception | |
| | | | |
| Class A (Inception 9/30/08) | | | | | | | | | | | | |
| NAV | | | -2.83 | % | | | -9.20 | % | | | 1.70 | % |
| With 5.75% Maximum Sales Charge | | | -8.45 | | | | -14.42 | | | | 0.10 | |
| | | | |
| Class C (Inception 9/30/08) | | | | | | | | | | | | |
| NAV | | | -3.18 | | | | -9.82 | | | | 0.95 | |
| With CDSC1 | | | -4.15 | | | | -10.73 | | | | 0.95 | |
| | | | |
| Class Y (Inception 9/30/08) | | | | | | | | | | | | |
| NAV | | | -2.71 | | | | -8.96 | | | | 1.96 | |
| | | | |
| Comparative Performance | | | | | | | | | | | | |
| HFRI Fund of Funds Composite Index2 | | | 0.99 | | | | -4.49 | | | | 0.24 | |
| Morningstar Multialternative Fund Avg.3 | | | 0.84 | | | | -2.41 | | | | 1.45 | |
Performance data quoted represents past performance and is no guarantee of future results. Total return and value will vary and you may have a gain or loss when shares are sold. Current performance may be lower or higher than quoted. For most recent month-end performance, visit ngam.natixis.com. Performance for periods less than one year is cumulative, not annualized. Returns reflect changes in share price and reinvestment of dividends and capital gains, if any. Class Y shares are not available for purchase by all investors.
The table and graph do not reflect taxes shareholders might owe on any fund distributions or when they redeem their shares.
Note: Portfolio summary tables previously included on this page can be found on the fund’s fact sheet available at ngam.natixis.com.
NOTES TO CHARTS
| 1 | Performance for Class C shares assumes a 1% contingent deferred sales charge (“CDSC”) applied when you sell shares within one year of purchase. |
| 2 | HFRI Fund of Funds Composite Index is an unmanaged, equally-weighted hedge fund index including over 800 domestic and offshore funds of funds. Funds included within the index have either at least $50 million in assets under management or have been actively trading for at least twelve (12) months. Performance information is submitted by the funds of funds to the index provider, which does not audit the information submitted. The index is rebalanced monthly. Performance data is net of all fees charged by the hedge funds. Index returns are calculated three times each month and are subject to periodic recalculation by Hedge Fund Research, Inc. The funds do not expect to update the index returns provided if subsequent recalculations cause such returns to change. In addition, because of these recalculations, the HFRI Index returns reported by the funds may differ from the index returns for the same period published by others. |
| 3 | Morningstar Fund Averages are the average performance without sales charges of funds with similar investment objectives, as calculated by Morningstar, Inc. |
| 4 | Fund performance has been increased by fee waivers and/or expense reimbursements, if any, without which performance would have been lower. |
| 8
ASG MANAGED FUTURES STRATEGY FUND
Management Discussion
Managers:
Andrew W. Lo
Jeremiah H. Chafkin
AlphaSimplex Group, LLC
(Adviser)
Robert S. Rickard
Reich & Tang Asset Management, LLC
(Subadviser)
Objective:
Pursues an absolute return strategy that seeks to provide capital appreciation.
Strategy:
Seeks to generate positive absolute returns over time by using a variety of derivative instruments, including futures and forward contracts, to capture the exposures suggested by its absolute return strategy while also seeking to add value through volatility management.
Inception Date:
July 30, 2010
Symbols:
| | |
| Class A | | AMFAX |
| Class C | | ASFCX |
| Class Y | | ASFYX |
Market Conditions
Investors began 2012 optimistic for a better year in financial markets. The European Central Bank’s allocation of additional short-term loans to eurozone banks, combined with global “easy money” policies, boosted investor sentiment. This optimism, in conjunction with hopes that increased liquidity would alleviate financial pressures in Europe, helped equities stage an impressive rally during the first quarter. Hopes faded, however, as the second quarter advanced. Political uncertainty in Europe and continued deterioration of global economic data quelled prospects for a global recovery. Increased volatility in financial markets led to increased demand for safe-haven assets. The U.S. Dollar Index rallied sharply, and prices increased for sovereign bonds of safe-haven countries, whereas equity and commodity markets, in particular energy and base metals, suffered large declines. As the first half of the year came to a close, news out of the European Summit led to renewed optimism among investors.
Performance Results
For the six months ended June 30, 2012, Class A shares of ASG Managed Futures Strategy Fund returned -9.69% at net asset value. Although the fund does not seek to track an index, its returns are expected to be similar to those of the FTSE StableRisk Trend Composite Index, which returned -22.56% for the same period. It is important to note that there are material differences between the fund and the benchmark.
Explanation of Fund Performance
The fund uses a set of proprietary quantitative signals to identify trends in global stock, fixed-income, currency and commodity markets. When the fund takes on a “long” exposure to a market, it profits as prices rise. Conversely, when it takes on a “short” exposure, it profits as prices fall. In taking on these exposures, the fund typically uses derivative instruments such as futures and forward contracts.
9 |
The difference in performance between the fund and the benchmark was principally due to the fund’s diverse set of trend strategies and its risk management mechanism, which reduces target portfolio risk in the event of a drawdown. In general, the lower volatility helps mitigate the impact of continued losses, but at the cost of muting potential gains.
Strategies that followed fixed-income asset trends profited from the continued decline in bond yields. However, currency, equity and commodity returns from trend-following were negative, as long-term trends reversed across multiple asset classes. These long-term trend reversals led to the relative underperformance of our longer-term trend strategies and the relative outperformance of our shorter-term trend strategies. In particular, the fund’s long-term trend signals caused it to maintain significant long positions in equities and commodities during the first half of May, leading to relative underperformance when compared to funds that took short positions more rapidly in response to the downturn in those markets. This, combined with losses from currency trends during the first quarter, led to a majority of the losses experienced by the fund. Additionally, trend strategies designed to adapt to current market environments successfully navigated the volatile market conditions and outperformed even in the period’s challenging market climate, but strategies that had outperformed in the recent historical past underperformed in the first half of the year.
Specific assets that contributed positively included positions in Australian 10-year bond futures, Australian 3-year note futures, coffee futures, NASDAQ futures and EURIBOR futures. Conversely, positions that detracted from performance included the Japanese yen, the Australian dollar, the New Zealand dollar, the Swedish krona and the British pound.
We continued to scale portfolio positions to keep total portfolio risk at or below its target. As market volatility increased, positions were reduced, and as market volatility decreased, positions were increased. The fund’s realized annualized volatility during the period was 10.3%. The correlation of daily returns was 9% with the S&P 500® Index and 32% with the JP Morgan Global Bond Index. The money market position contributed only marginally to performance.
Outlook
The outlook for global markets is cautiously positive following the latest European Summit. Investors are unsure whether the necessary fiscal and political reforms in the eurozone are feasible and can be implemented quickly enough to prevent further escalation of the crisis. Additional monetary easing by central banks globally and the extension of the U.S. Federal Reserve’s “Operation Twist” will likely buoy markets. However, the impending U.S. presidential election and the increased partisanship it brings to an already divided Congress will likely prevent Washington from addressing unemployment levels or the budget deficit, reducing the chance of a faster economic recovery. This, combined with the controversy of the reforms being attempted in Europe, may cause investors to remain somewhat cautious.
What You Should Know
Investments in the fund are subject to a number of risks. Please see the “Principal Risks” section of the fund’s prospectus. The purchase of fund shares should be seen as a long-term investment.
| 10
ASG MANAGED FUTURES STRATEGY FUND
Investment Results through June 30, 2012
The charts comparing the fund’s performance to an index provide a general sense of how it performed. The fund’s total return for the period shown below appears with and without sales charges and includes fund expenses and fees. An index measures the performance of a theoretical portfolio. Unlike a fund, an index is unmanaged and does not have expenses that affect the results. It is not possible to invest directly in an index. Investors would incur transaction costs and other expenses if they purchased the securities necessary to match the index.
Growth of $10,000 Investment in Class A Shares4
July 30, 2010 (inception) through June 30, 2012
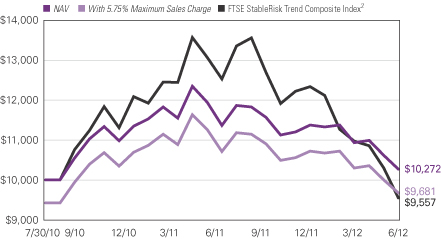
Performance data quoted represents past performance and is no guarantee of future results. Total return and value will vary and you may have a gain or loss when shares are sold. Current performance may be lower or higher than quoted. For most recent month-end performance, visit ngam.natixis.com. Performance for other share classes will be greater or less than shown based on differences in fees and sales charges.
Expense Ratios
| | | | |
Gross Expense Ratio (before fee waivers and/or expense reimbursements)* |
| Class A: 1.78% | | Class C: 2.56% | | Class Y: 1.56% |
|
| Net Expense Ratio (after fee waivers and/or expense reimbursements)* |
| Class A: 1.71% | | Class C: 2.46% | | Class Y: 1.46% |
| * | As stated in the most recent prospectus. Waivers/reimbursements are contractual and are set to expire on 4/30/13. Contracts are reevaluated on an annual basis. |
11 |
Average Annual Total Returns — June 30, 20124
| | | | | | | | | | | | |
| | | | |
| | | 6 Months | | | 1 Year | | | Since Inception | |
| | | | |
| Class A (Inception 7/30/10) | | | | | | | | | | | | |
| NAV | | | -9.69 | % | | | -9.63 | % | | | 1.40 | % |
| With 5.75% Maximum Sales Charge | | | -14.88 | | | | -14.84 | | | | -1.68 | |
| | | | |
| Class C (Inception 7/30/10) | | | | | | | | | | | | |
| NAV | | | -10.07 | | | | -10.37 | | | | 0.59 | |
| With CDSC1 | | | -10.97 | | | | -11.23 | | | | 0.59 | |
| | | | |
Class Y (Inception 7/30/10) | | | | | | | | | | | | |
| NAV | | | -9.60 | | | | -9.42 | | | | 1.60 | |
| | | | |
| Comparative Performance | | | | | | | | | | | | |
| FTSE StableRisk Trend Composite Index2 | | | -22.56 | | | | -23.70 | | | | -2.34 | |
| Morningstar Managed Futures Fund Avg.3 | | | -3.72 | | | | -8.49 | | | | -0.91 | |
Performance data quoted represents past performance and is no guarantee of future results. Total return and value will vary and you may have a gain or loss when shares are sold. Current performance may be lower or higher than quoted. For most recent month-end performance, visit ngam.natixis.com. Performance for periods less than one year is cumulative, not annualized. Returns reflect changes in share price and reinvestment of dividends and capital gains, if any. Class Y shares are not available for purchase by all investors.
The table and graph do not reflect taxes shareholders might owe on any fund distributions or when they redeem their shares.
Note: Portfolio summary tables previously included on this page can be found on the fund’s fact sheet available at ngam.natixis.com.
NOTES TO CHARTS
| 1 | Performance for Class C shares assumes a 1% contingent deferred sales charge (“CDSC”) applied when you sell shares within one year of purchase. |
| 2 | FTSE StableRisk Trend Composite Index is an unmanaged index based on a transparent trend-following strategy designed to provide long and/or short exposure to various asset classes at a targeted level of volatility. |
| 3 | Morningstar Fund Averages are the average performance without sales charges of funds with similar investment objectives, as calculated by Morningstar, Inc. |
| 4 | Fund performance has been increased by fee waivers and/or expense reimbursements, if any, without which performance would have been lower. |
| 12
LOOMIS SAYLES ABSOLUTE STRATEGIES FUND
Management Discussion
Managers:
Matthew J. Eagan, CFA
Kevin Kearns
Todd P. Vandam, CFA
Loomis, Sayles & Company, L.P.
Objective:
Seeks to provide an attractive absolute total return, complemented by prudent management designed to manage risks and protect investor capital while maintaining relatively low volatility.
Strategy:
Seeks to generate positive total returns by utilizing a flexible investment approach that allocates investments across a global range of investment opportunities related to credit, currencies and interest rates while employing risk management strategies to mitigate downside risk.
Inception Date:
December 15, 2010
Symbols:
| | |
| Class A | | LABAX |
| Class C | | LABCX |
| Class Y | | LASYX |
Market Conditions
Markets and riskier assets rallied at the beginning of 2012 as the European Central Bank (ECB) added liquidity via its long-term refinancing operation (LTRO). However, investor optimism faded in the second half of the period, when Greek bailout issues reemerged and the need to support Spain’s banking sector became clear. Negative economic data out of China placed additional downward pressure on global growth expectations.
The U.S. economy showed signs of improvement during the first half of the period. However, the economic data in the second half was mixed, with strong company earnings coupled with weak employment numbers. Late in the period, markets rebounded when the Federal Reserve Board announced an expansion of its Operation Twist program (which involves buying long-term securities and selling short-term securities) and a commitment to take further action to improve the unemployment number.
Performance Results
For the six months ended June 30, 2012, Class A shares of Loomis Sayles Absolute Strategies Fund returned 6.31% at net asset value. The fund outperformed its benchmark, the 3-month London Interbank Offered Rate (LIBOR), which returned 0.28% for the period. The fund follows an absolute return strategy and is not managed to an index.
Explanation of Fund Performance
Overall, the fund’s positions in investment-grade, high-yield, and securitized credit issues proved beneficial to performance, particularly when investor risk appetite surged during the first half of the period. High-yield and investment-grade corporate credits posted strong returns as investors continued to reach for yield in an environment of low interest rates. Investment-grade corporate bonds in the industrial, electrical and insurance sectors were strong performers. Within high-yield, the technology and consumer cyclical sectors added to fund gains. The fund’s convertible
13 |
bond holdings, specifically in consumer cyclical and technology, contributed to return, as these positions mirrored the equity market rally early in the period. Securitized assets also contributed positively to returns. The fund’s non-U.S.-dollar positions, particularly in the Mexican peso, euro and Australian dollar, benefited return.
During the period, the fund utilized a broad range of derivative instruments both for hedging and for investment purposes. We believe derivatives can be useful tools for expressing macroeconomic views, reducing overall market exposure and managing fund volatility. When contemplating the use of derivatives, we consider the expected relative risks and returns of such investments and their related costs.
Credit default swaps (CDS) and credit default swaps on indexes (CDX) helped us manage credit risk and reduced global and industry-specific credit exposure. Specifically, the fund used emerging market CDX to help protect against extreme market declines, and these positions contributed positively to the fund’s return. In addition, the fund held U.S. Treasury futures to manage interest rate risk. During the period, we sold these futures to reduce duration (price sensitivity to interest rate changes), which aided overall performance. The fund uses equity futures to hedge positions in convertible bonds and dividend-paying equities. Short positions in S&P 500® and Eurostoxx 50 futures aided performance, as these equity markets declined on negative news in Europe. Forward foreign currency contracts helped us manage the fund’s overall exposure to various currencies and generally contributed to overall performance.
Outlook
The developed world is struggling with strong deflationary headwinds, caused by significant slack in the economy and de-leveraging in the private sector. Government policy tools are somewhat limited by burdensome debt levels and large fiscal deficits, but aggressive monetary policy has so far been the most effective tool to reflate the global economy. Riskier assets have tended to perform well when strong monetary policies are announced and implemented. However, the risk rally has tended to fade as the monetary boost waned, and underlying deflationary conditions persist. This cycle is likely to continue until economic activity begins to normalize, which we do not expect to occur in the near term.
In this environment, we believe the global economy will grow slowly, with support from monetary authorities and lower commodity prices offsetting the headwinds from debt de-leveraging and low capacity utilization. However, we believe that market volatility will persist. In the developed world, the U.S. economy will probably continue its moderate growth path whereas Japan is likely to remain stagnant and Europe in recession. We believe that emerging markets will continue to be the world’s primary engine of economic growth, but even these economies are experiencing moderated growth. Given our macroeconomic views, we plan to position the fund in a relatively defensive manner unless we see strong policy actions from monetary authorities to reflate the economy.
Please note that the above commentary may contain references to contributions to Fund performance from derivative instruments that differ from related amounts presented in the Fund’s Financial Statements. These differences, if any, result from the methodologies applied in determining performance contributions for these instruments.
| 14
What You Should Know
Investments in the fund are subject to a number of risks. Please see the “Principal Risks” section of the fund’s prospectus. The purchase of fund shares should be seen as a long-term investment.
15 |
LOOMIS SAYLES ABSOLUTE STRATEGIES FUND
Investment Results through June 30, 2012
The charts comparing the fund’s performance to an index provide a general sense of how it performed. The fund’s total return for the period shown below appears with and without sales charges and includes fund expenses and fees. An index measures the performance of a theoretical portfolio. Unlike a fund, an index is unmanaged and does not have expenses that affect the results. It is not possible to invest directly in an index. Investors would incur transaction costs and other expenses if they purchased the securities necessary to match the index.
Growth of $10,000 Investment in Class A Shares6
December 15, 2010 (inception) through June 30, 2012
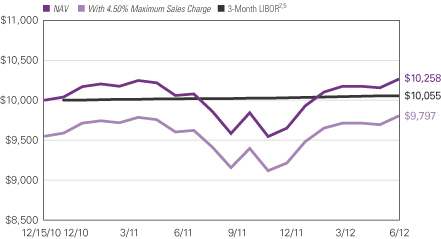
Performance data quoted represents past performance and is no guarantee of future results. Total return and value will vary and you may have a gain or loss when shares are sold. Current performance may be lower or higher than quoted. For most recent month-end performance, visit ngam.natixis.com. Performance for other share classes will be greater or less than shown based on differences in fees and sales charges.
Expense Ratios
| | | | |
| Gross Expense Ratio (before fee waivers and/or expense reimbursements)* |
| Class A: 1.17% | | Class C: 1.91% | | Class Y: 0.92% |
|
| Net Expense Ratio (after fee waivers and/or expense reimbursements)* |
| Class A: 1.17% | | Class C: 1.91% | | Class Y: 0.92% |
| * | As stated in the most recent prospectus. Waivers/reimbursements are contractual and are set to expire on 4/30/13. Contracts are reevaluated on an annual basis. |
| 16
Average Annual Total Returns — June 30, 20126
| | | | | | | | | | | | |
| | | | |
| | | 6 Months | | | 1 Year | | | Since Inception | |
| | | | |
| Class A (Inception 12/15/10) | | | | | | | | | | | | |
| NAV | | | 6.31 | % | | | 2.00 | % | | | 1.67 | % |
| With 4.50% Maximum Sales Charge | | | 1.53 | | | | -2.60 | | | | -1.32 | |
| | | | |
| Class C (Inception 12/15/10) | | | | | | | | | | | | |
| NAV | | | 5.85 | | | | 1.16 | | | | 0.77 | |
| With CDSC1 | | | 4.85 | | | | 0.18 | | | | 0.77 | |
| | | | |
| Class Y (Inception 12/15/10) | | | | | | | | | | | | |
| NAV | | | 6.49 | | | | 2.21 | | | | 1.87 | |
| | | | |
| Comparative Performance5 | | | | | | | | | | | | |
| 3-Month LIBOR2 | | | 0.28 | | | | 0.39 | | | | 0.16 | |
| 3-Month LIBOR + 300 basis points3 | | | 1.79 | | | | 3.43 | | | | 1.67 | |
| Morningstar Nontraditional Bond Fund Avg.4 | | | 4.98 | | | | 4.60 | | | | 5.58 | |
| | | | | | | | | | | | | |
Performance data quoted represents past performance and is no guarantee of future results. Total return and value will vary and you may have a gain or loss when shares are sold. Current performance may be lower or higher than quoted. For most recent month-end performance, visit ngam.natixis.com. Performance for periods less than one year is cumulative, not annualized. Returns reflect changes in share price and reinvestment of dividends and capital gains, if any. Class Y shares are not available for purchase by all investors.
The table and graph do not reflect taxes shareholders might owe on any fund distributions or when they redeem their shares.
Note: Portfolio summary tables previously included on this page can be found on the fund’s fact sheet available at ngam.natixis.com.
NOTES TO CHARTS
| 1 | Performance for Class C shares assumes a 1% contingent deferred sales charge (“CDSC”) applied when you sell shares within one year of purchase. |
| 2 | 3-Month LIBOR, or the London Interbank Offered Rate, represents the average rate a leading bank, for a given currency (in this case U.S. dollars), can obtain unsecured funding, and is representative of short-term interest rates. |
| 3 | 3-Month LIBOR +300 basis points is created by adding 3.00% to the annual percentage change of the 3-Month LIBOR. |
| 4 | Morningstar Fund Averages are the average performance without sales charges of funds with similar investment objectives, as calculated by Morningstar, Inc. |
| 5 | The since-inception comparative performance figures shown are calculated from 12/31/10. |
| 6 | Fund performance has been increased by fee waivers and/or expense reimbursements, if any, without which performance would have been lower. |
17 |
LOOMIS SAYLES MULTI-ASSET REAL RETURN FUND
Management Discussion
Managers:
Kevin Kearns
Maura Murphy, CFA
Laura Sarlo, CFA
Loomis, Sayles & Company, L.P.
Objective:
Seeks to maximize real returns consistent with prudent investment management.
Strategy:
Seeks to pursue its investment goal primarily through exposure to investments in fixed-income securities, equity securities, currencies and commodity-linked instruments.
Inception Date:
September 30, 2010
Symbols:
| | |
| Class A: | | MARAX |
| Class C: | | MARCX |
| Class Y: | | MARYX |
Market Conditions
Risk assets benefited from global “reflation” (government-generated liquidity) efforts early in the period, and equity markets began the year with a sizable rally. Global inflation expectations rose at the start of the year but stalled in mid-March amid renewed anxiety over the European sovereign debt crisis and disappointing U.S. macroeconomic data. In China, inflation and economic growth expectations were revised lower during the second quarter, further fueling global deflation fears. Uneasy investors saw value in into U.S. Treasuries during the second half of the period, driving yields on 10- and 30-year U.S. Treasuries lower. (When bond yields fall, bond prices rise.) The flight to quality was a global phenomenon, and yields on 10-year German bunds and United Kingdom gilts also fell significantly. Riskier assets suffered in this environment.
Performance Results
For the six months ended June 30, 2012, Class A shares of Loomis Sayles Multi-Asset Real Return Fund returned 2.89% at net asset value. The fund underperformed its benchmark, the Barclays U.S. TIPS (Treasury Inflation-Protected Securities) Index, which returned 4.04% for the period. The fund follows an absolute strategy and is not managed to an index.
Explanation of Fund Performance
The fund generated the bulk of its return during the first quarter, when riskier assets rallied. Investment-grade and high-yield corporate bonds were strong contributors despite persistent late-period volatility. Within the allocation, industrials holdings, particularly communications, energy, basic industry, consumer cyclical and noncyclical names, helped performance.
We used a broad range of derivatives for hedging and investment purposes. We believe derivatives can be useful tools for expressing macroeconomic views, reducing overall market exposure and managing fund volatility. When contemplating the use of derivatives, we consider the expected relative risks and returns of such investments and their related costs.
| 18
Credit default swaps (CDS) and credit default swaps on indexes (CDX) helped manage credit risk and reduced global and industry-specific credit exposure and contributed modestly during the period. Positioning within sovereign CDS also aided performance. Short exposure in Turkey and Brazil benefited performance, as global growth expectations were revised lower. A short position within emerging market CDS in the latter half of the period was also positive.
U.S. Treasury yields moved significantly during the first half of the year, and efforts to manage interest rate risk with U.S. Treasury futures hurt performance. Commodity futures were used to gain exposure to commodities, notably precious metals, energy and agriculture holdings. Deflation concerns during the second quarter weighed on commodity markets, and the fund’s long commodity futures positions detracted as a result. We increased the fund’s hedge to commodity positions throughout the second quarter in an effort to manage risk. Equity future hedges weighed on returns when equities rallied early in the period, and the fund’s long equity positions pressured returns when risk fell out of favor in the second quarter. Overall, equity exposure had a muted effect on performance.
Outlook
The process of recognizing true asset values and writing off bad debt is ongoing in Europe, and our outlook for the euro remains bearish. Previous banking crises have shown that it can take around ten years to return to pre-crisis trend growth, and we are in year four of this crisis.
With ongoing challenges in Europe, disappointing U.S. economic growth and decelerating growth in China, market volatility and macroeconomic uncertainty have increased. We anticipate continued policy intervention through year-end and think markets will fluctuate between reflation hopes and deflation fears as policy actions surprise or disappoint. We plan to position the portfolio somewhat neutrally and use options to add upside and downside hedges.
We have a bias toward higher-quality credit, given what we view as strong corporate fundamentals. This position also provides modest duration exposure (price sensitivity to interest rate changes). Though deflationary risks persist, we recognize policy makers’ reflationary intentions and have used options to position the fund seeking to capture potential upside in riskier assets, including equities, currencies and interest rates. In our view, U.S. economic growth should remain above 1.5%, and consequently, we are comfortable taking long positions in higher-quality high yield. We plan to focus long positions in more U.S.-centric companies and continue to favor dividend-paying equities in Europe and the United States.
We expect to continue to monitor breakevens (the difference between yields on nominal government securities and inflation-protected securities of the same maturity) globally, as they tend to correlate strongly with equity performance. Commodity and commodity-currency performance can also serve as signs of global reflation and economic outlook.
Please note that the above commentary may contain references to contributions to Fund performance from derivative instruments that differ from related amounts presented in the Fund’s Financial Statements. These differences, if any, result from the methodologies applied in determining performance contributions for these instruments.
19 |
What You Should Know
Investments in the fund are subject to a number of risks. Please see the “Principal Risks” section of the fund’s prospectus. The purchase of fund shares should be seen as a long-term investment.
| 20
LOOMIS SAYLES MULTI-ASSET REAL RETURN FUND
Investment Results through June 30, 2012
The charts comparing the fund’s performance to an index provide a general sense of how it performed. The fund’s total return for the period shown below appears with and without sales charges and includes fund expenses and fees. An index measures the performance of a theoretical portfolio. Unlike a fund, an index is unmanaged and does not have expenses that affect the results. It is not possible to invest directly in an index. Investors would incur transaction costs and other expenses if they purchased the securities necessary to match the index.
Growth of $10,000 Investment in Class A Shares5
September 30, 2010 (inception) through June 30, 2012
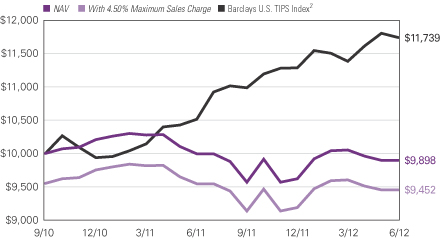
Performance data quoted represents past performance and is no guarantee of future results. Total return and value will vary and you may have a gain or loss when shares are sold. Current performance may be lower or higher than quoted. For most recent month-end performance, visit ngam.natixis.com.
Performance for other share classes will be greater or less than shown based on differences in fees and sales charges.
Expense Ratios
| | | | |
| Gross Expense Ratio (before fee waivers and/or expense reimbursements)* |
| Class A: 2.01% | | Class C: 2.62% | | Class Y: 1.69% |
|
| Net Expense Ratio (after fee waivers and/or expense reimbursements)* |
| Class A: 1.43% | | Class C: 2.18% | | Class Y: 1.18% |
| * | As stated in the most recent prospectus. Waivers/reimbursements are contractual and are set to expire on 4/30/13. Contracts are reevaluated on an annual basis. |
21 |
Average Annual Total Returns — June 30, 20125
| | | | | | | | | | | | |
| | | | |
| | | 6 Months | | | 1 Year | | | Since Inception | |
| | | | |
| Class A (Inception 9/30/10) | | | | | | | | | | | | |
| NAV | | | 2.89 | % | | | -0.94 | % | | | -0.58 | % |
| With 4.50% Maximum Sales Charge | | | -1.74 | | | | -5.43 | | | | -3.15 | |
| | | | |
| Class C (Inception 9/30/10) | | | | | | | | | | | | |
| NAV | | | 2.58 | | | | -1.65 | | | | -1.28 | |
| With CDSC1 | | | 1.58 | | | | -2.62 | | | | -1.28 | |
| | | | |
| Class Y (Inception 9/30/10) | | | | | | | | | | | | |
| NAV | | | 3.00 | | | | -0.68 | | | | -0.36 | |
| | | | |
| Comparative Performance | | | | | | | | | | | | |
| Barclays U.S. TIPS Index2 | | | 4.04 | | | | 11.66 | | | | 11.76 | |
| CPI + 300 basis points3 | | | 3.21 | | | | 4.74 | | | | 5.97 | |
| Morningstar Conservative Allocation Fund Avg.4 | | | 4.51 | | | | 2.34 | | | | 5.55 | |
Performance data quoted represents past performance and is no guarantee of future results. Total return and value will vary and you may have a gain or loss when shares are sold. Current performance may be lower or higher than quoted. For most recent month-end performance, visit ngam.natixis.com. Performance for periods less than one year is cumulative, not annualized. Returns reflect changes in share price and reinvestment of dividends and capital gains, if any. Class Y shares are not available for purchase by all investors.
The table and graph do not reflect taxes shareholders might owe on any fund distributions or when they redeem their shares.
Note: Portfolio summary tables previously included on this page can be found on the fund’s fact sheet available at ngam.natixis.com.
NOTES TO CHARTS
| 1 | Performance for Class C shares performance assumes a 1% CDSC applied when you sell shares within one year of purchase. |
| 2 | Barclays U.S. Treasury Inflation Protected Securities (TIPS) Index is an unmanaged index that tracks inflation protected securities issued by the U.S. Treasury. |
| 3 | CPI +300 basis points is created by adding 3.00% to the annual percentage change in the Consumer Price Index (CPI). The Consumer Price Index is an unmanaged index that represents the rate of inflation of U.S. consumer prices as determined by the U.S. Bureau of Labor Statistics. |
| 4 | Morningstar Fund Averages are the average performance without sales charges of funds with similar investment objectives, as calculated by Morningstar, Inc. |
| 5 | Fund performance has been increased by fee waivers and/or expense reimbursements, if any, without which performance would have been lower. |
| 22
ADDITIONAL INFORMATION
The views expressed in this report reflect those of the portfolio managers as of the dates indicated. The managers’ views are subject to change at any time without notice based on changes in market or other conditions. References to specific securities or industries should not be regarded as investment advice. Because the funds are actively managed, there is no assurance that they will continue to invest in the securities or industries mentioned.
Before investing, consider each fund’s investment objectives, risks, charges and expenses. Visit ngam.natixis.com or call 800-225-5478 for a prospectus and/or a summary prospectus, both of which contain this and other information. Read it carefully.
PROXY VOTING INFORMATION
A description of the funds’ proxy voting policies and procedures is available without charge, upon request, by calling Natixis Funds at 800-225-5478; on the funds’ website at ngam.natixis.com; and on the Securities and Exchange Commission’s (SEC) website at www.sec.gov. Information regarding how the funds voted proxies during the 12-month period ended June 30, 2012 is available on the funds’ website and the SEC’s website.
QUARTERLY PORTFOLIO SCHEDULES
The funds file a complete schedule of portfolio holdings with the SEC for the first and third quarters of each fiscal year on Form N-Q. The funds’ Forms N-Q are available on the SEC’s website at www.sec.gov and may be reviewed and copied at the SEC’s Public Reference Room in Washington, DC. Information on the operation of the Public Reference Room may be obtained by calling 800-SEC-0330.
23 |
UNDERSTANDING FUND EXPENSES
As a mutual fund shareholder, you incur different types of costs: transaction costs, including sales charges (loads) on purchases, contingent deferred sales charges on redemptions, and ongoing costs, including management fees, distribution and/or service fees (12b-1 fees), and other fund expenses. Certain exemptions may apply. These costs are described in more detail in the funds’ prospectus. The following examples are intended to help you understand the ongoing costs of investing in the funds and help you compare these with the ongoing costs of investing in other mutual funds.
The first line in the table for each class shows the actual account values and actual fund expenses you would have paid on a $1,000 investment in the fund from January 1, 2012 through June 30, 2012. To estimate the expenses you paid over the period, simply divide your account value by $1,000 (for example, $8,600 account value divided by $1,000 = $8.60) and multiply the result by the number in the Expenses Paid During Period column as shown for your Class.
The second line for the table of each class provides information about hypothetical account values and hypothetical expenses based on the fund’s actual expense ratios and an assumed rate of return of 5% per year before expenses, which is not the fund’s actual return. The hypothetical account values and expenses may not be used to estimate the actual ending account balance or expenses you paid on your investment for the period. You may use this information to compare the ongoing costs of investing in the funds and other funds. To do so, compare this 5% hypothetical example with the 5% hypothetical examples that appear in the shareholder reports of the other funds.
Please note that the expenses shown reflect ongoing costs only, and do not include any transaction costs, such as sales charges. Therefore, the second line in the table of each fund is useful in comparing ongoing costs only, and will not help you determine the relative costs of owning different funds. If transaction costs were included, total costs would be higher.
| 24
| | | | | | | | | | | | |
| ASG DIVERSIFYING STRATEGIES FUND | | BEGINNING
ACCOUNT VALUE
1/1/2012 | | | ENDING
ACCOUNT VALUE
6/30/2012 | | | EXPENSES PAID
DURING PERIOD*
1/1/2012 – 6/30/2012 | |
Class A | | | | | | | | | | | | |
Actual | | | $1,000.00 | | | | $946.70 | | | | $8.37 | |
Hypothetical (5% return before expenses) | | | $1,000.00 | | | | $1,016.26 | | | | $8.67 | |
Class C | | | | | | | | | | | | |
Actual | | | $1,000.00 | | | | $943.00 | | | | $11.98 | |
Hypothetical (5% return before expenses) | | | $1,000.00 | | | | $1,012.53 | | | | $12.41 | |
Class Y | | | | | | | | | | | | |
Actual | | | $1,000.00 | | | | $947.80 | | | | $7.17 | |
Hypothetical (5% return before expenses) | | | $1,000.00 | | | | $1,017.50 | | | | $7.42 | |
| * | Expenses are equal to the Fund’s annualized expense ratio (after waiver/reimbursement), including expenses of the Subsidiary (see Note 1 of Notes to Financial Statements) and interest expense: 1.73%, 2.48% and 1.48% for Class A, C and Y, respectively, multiplied by the average account value over the period, multiplied by the number of days in the most recent fiscal half-year, divided by 366 (to reflect the half-year period). |
| | | | | | | | | | | | |
| ASG GLOBAL ALTERNATIVES FUND | | BEGINNING
ACCOUNT VALUE
1/1/2012 | | | ENDING
ACCOUNT VALUE
6/30/2012 | | | EXPENSES PAID
DURING PERIOD*
1/1/2012 – 6/30/2012 | |
Class A | | | | | | | | | | | | |
Actual | | | $1,000.00 | | | | $971.70 | | | | $7.89 | |
Hypothetical (5% return before expenses) | | | $1,000.00 | | | | $1,016.86 | | | | $8.07 | |
Class C | | | | | | | | | | | | |
Actual | | | $1,000.00 | | | | $968.20 | | | | $11.55 | |
Hypothetical (5% return before expenses) | | | $1,000.00 | | | | $1,013.13 | | | | $11.81 | |
Class Y | | | | | | | | | | | | |
Actual | | | $1,000.00 | | | | $972.90 | | | | $6.67 | |
Hypothetical (5% return before expenses) | | | $1,000.00 | | | | $1,018.10 | | | | $6.82 | |
| * | Expenses are equal to the Fund’s annualized expense ratio, including expenses of the Subsidiary (see Note 1 of Notes to Financial Statements) and interest expense: 1.61%, 2.36% and 1.36% for Class A, C and Y, respectively, multiplied by the average account value over the period, multiplied by the number of days in the most recent fiscal half-year, divided by 366 (to reflect the half-year period). |
25 |
| | | | | | | | | | | | |
ASG MANAGED FUTURES
STRATEGY FUND | | BEGINNING
ACCOUNT VALUE
1/1/2012 | | | ENDING
ACCOUNT VALUE
6/30/2012 | | | EXPENSES PAID
DURING PERIOD*
1/1/2012 – 6/30/2012 | |
Class A | | | | | | | | | | | | |
Actual | | | $1,000.00 | | | | $903.10 | | | | $8.19 | |
Hypothetical (5% return before expenses) | | | $1,000.00 | | | | $1,016.26 | | | | $8.67 | |
Class C | | | | | | | | | | | | |
Actual | | | $1,000.00 | | | | $899.30 | | | | $11.71 | |
Hypothetical (5% return before expenses) | | | $1,000.00 | | | | $1,012.53 | | | | $12.41 | |
Class Y | | | | | | | | | | | | |
Actual | | | $1,000.00 | | | | $904.00 | | | | $7.01 | |
Hypothetical (5% return before expenses) | | | $1,000.00 | | | | $1,017.50 | | | | $7.42 | |
| * | Expenses are equal to the Fund’s annualized expense ratio (after waiver/reimbursement), including expenses of the Subsidiary (see Note 1 of Notes to Financial Statements) and interest expense: 1.73%, 2.48% and 1.48% for Class A, C and Y, respectively, multiplied by the average account value over the period, multiplied by the number of days in the most recent fiscal half-year, divided by 366 (to reflect the half-year period). |
| | | | | | | | | | | | |
LOOMIS SAYLES ABSOLUTE
STRATEGIES FUND | | BEGINNING
ACCOUNT VALUE
1/1/2012 | | | ENDING
ACCOUNT VALUE
6/30/2012 | | | EXPENSES PAID
DURING PERIOD*
1/1/2012 – 6/30/2012 | |
Class A | | | | | | | | | | | | |
Actual | | | $1,000.00 | | | | $1,063.10 | | | | $5.85 | |
Hypothetical (5% return before expenses) | | | $1,000.00 | | | | $1,019.19 | | | | $5.72 | |
Class C | | | | | | | | | | | | |
Actual | | | $1,000.00 | | | | $1,058.50 | | | | $9.67 | |
Hypothetical (5% return before expenses) | | | $1,000.00 | | | | $1,015.47 | | | | $9.47 | |
Class Y | | | | | | | | | | | | |
Actual | | | $1,000.00 | | | | $1,064.90 | | | | $4.57 | |
Hypothetical (5% return before expenses) | | | $1,000.00 | | | | $1,020.44 | | | | $4.47 | |
| * | Expenses are equal to the Fund’s annualized expense ratio: 1.14%, 1.89% and 0.89% for Class A, C and Y, respectively, multiplied by the average account value over the period, multiplied by the number of days in the most recent fiscal half-year, divided by 366 (to reflect the half-year period). |
| 26
| | | | | | | | | | | | |
LOOMIS SAYLES MULTI-ASSET REAL
RETURN FUND | | BEGINNING
ACCOUNT VALUE
1/1/2012 | | | ENDING
ACCOUNT VALUE
6/30/2012 | | | EXPENSES PAID
DURING PERIOD*
1/1/2012 – 6/30/2012 | |
Class A | | | | | | | | | | | | |
Actual | | | $1,000.00 | | | | $1,028.90 | | | | $6.81 | |
Hypothetical (5% return before expenses) | | | $1,000.00 | | | | $1,018.15 | | | | $6.77 | |
Class C | | | | | | | | | | | | |
Actual | | | $1,000.00 | | | | $1,025.80 | | | | $10.58 | |
Hypothetical (5% return before expenses) | | | $1,000.00 | | | | $1,014.42 | | | | $10.52 | |
Class Y | | | | | | | | | | | | |
Actual | | | $1,000.00 | | | | $1,030.00 | | | | $5.55 | |
Hypothetical (5% return before expenses) | | | $1,000.00 | | | | $1,019.39 | | | | $5.52 | |
| * | Expenses are equal to the Fund’s annualized expense ratio (after waiver/reimbursement), including expenses of the Subsidiary (see Note 1 of Notes to Financial Statements): 1.35%, 2.10% and 1.10% for Class A, C and Y, respectively, multiplied by the average account value over the period, multiplied by the number of days in the most recent fiscal half-year, divided by 366 (to reflect the half-year period). |
27 |
BOARD APPROVAL OF THE EXISTING ADVISORY AND SUB-ADVISORY AGREEMENTS
The Board of Trustees, including the Independent Trustees, considers matters bearing on each Fund’s advisory and sub-advisory agreements (collectively, the “Agreements”) at most of its meetings throughout the year. Each year, usually in the spring, the Contract Review and Governance Committee of the Board meets to review the Agreements to determine whether to recommend that the full Board approve the continuation of the Agreements, typically for an additional one-year period. After the Committee has made its recommendation, the full Board, including the Independent Trustees, determines whether to approve the continuation of the Agreements.
In connection with these meetings, the Trustees receive materials that the Funds’ investment advisers and sub-advisers (collectively, the “Advisers”) believe to be reasonably necessary for the Trustees to evaluate the Agreements. These materials generally include, among other items, (i) information on the investment performance of the Funds and the performance of peer groups and categories of funds and the Funds’ performance benchmarks, (ii) information on the Funds’ advisory and sub-advisory fees, if any, and other expenses, including information comparing the Funds’ expenses to the fees charged to institutional accounts with similar strategies managed by the Advisers and to those of peer groups of funds and information about any applicable expense caps and fee “breakpoints,” (iii) sales and redemption data in respect of the Funds, (iv) information about the profitability of the Agreements to the Advisers and (v) information obtained through the completion by the Advisers of a questionnaire distributed on behalf of the Trustees. The Board of Trustees, including the Independent Trustees, also consider other matters such as (i) each Adviser’s financial results and/or financial condition, (ii) each Fund’s investment objectives and strategies and the size, education and experience of the Advisers’ respective investment staffs and their use of technology, external research and trading cost measurement tools, (iii) arrangements in respect of the distribution of the Funds’ shares and the related costs, (iv) the procedures employed to determine the value of the Funds’ assets, (v) the allocation of the Funds’ brokerage, if any, including, if applicable, allocations to brokers affiliated with the Advisers and the use of “soft” commission dollars to pay Fund expenses and to pay for research and other similar services, (vi) the resources devoted to, and the record of compliance with, the Funds’ investment policies and restrictions, policies on personal securities transactions and other compliance policies, (vii) information about amounts invested by the Funds’ portfolio managers in the Funds or in similar accounts that they manage and (viii) the general economic outlook with particular emphasis on the mutual fund industry. Throughout the process, the Trustees are afforded the opportunity to ask questions of and request additional materials from the Advisers.
In addition to the materials requested by the Trustees in connection with their annual consideration of the continuation of the Agreements, the Trustees receive materials in advance of each regular quarterly meeting of the Board of Trustees that provide detailed information about the Funds’ investment performance and the fees charged to the Funds for advisory and other services. This information generally includes, among other things, an internal performance rating for each Fund based on agreed-upon criteria, graphs
| 28
showing each Fund’s performance and fee differentials against each Fund’s peer group/category, performance ratings provided by a third-party, total return information for various periods, and third-party performance rankings for various periods comparing a Fund against similarly categorized funds. The portfolio management team for each Fund or other representatives of the Advisers make periodic presentations to the Contract Review and Governance Committee and/or the full Board of Trustees, and Funds identified as presenting possible performance concerns may be subject to more frequent board presentations and reviews. In addition, each quarter the Trustees are provided with detailed statistical information about each Fund’s portfolio. The Trustees also receive periodic updates between meetings.
The Board of Trustees most recently approved the continuation of the Agreements at their meeting held in June 2012. The Agreements were continued for a one-year period for the Funds. In considering whether to approve the continuation of the Agreements, the Board of Trustees, including the Independent Trustees, did not identify any single factor as determinative. Individual Trustees may have evaluated the information presented differently from one another, giving different weights to various factors. Matters considered by the Trustees, including the Independent Trustees, in connection with their approval of the Agreements included, but were not limited to, the factors listed below.
The nature, extent and quality of the services provided to the Funds under the Agreements. The Trustees considered the nature, extent and quality of the services provided by the Advisers and their affiliates to the Funds and the resources dedicated to the Funds by the Advisers and their affiliates.
The Trustees considered not only the advisory services provided by the Advisers to the Funds, but also the administrative services provided by NGAM Advisors, L.P. (“NGAM Advisors”) and its affiliates to the Funds.
For each Fund, the Trustees also considered the benefits to shareholders of investing in a mutual fund that is part of a family of funds that offers shareholders the right to exchange shares of one type of fund for shares of another type of fund, and provides a variety of fund and shareholder services.
After reviewing these and related factors, the Trustees concluded, within the context of their overall conclusions regarding each of the Agreements, that the nature, extent and quality of services provided supported the renewal of the Agreements.
Investment performance of the Funds and the Advisers. As noted above, the Trustees received information about the performance of the Funds over various time periods, including information that compared the performance of the Funds to the performance of similarly categorized funds and the Funds’ respective performance benchmarks. In addition, the Trustees also reviewed data prepared by an independent third party that analyzed the performance of the Funds using a variety of performance metrics, including metrics that also measured the performance of the Funds on a risk adjusted basis. The Board noted that, given the recent commencement of operations of each Fund, the Funds have a limited operating history upon which to evaluate their performance.
29 |
With respect to each Fund, the Board concluded that the Fund’s performance or other relevant factors supported the renewal of the Agreement(s) relating to that Fund. In the case of each Fund that had performance that lagged that of a relevant peer group median and/or category median for certain (although not necessarily all) periods, the Board concluded that other factors relevant to performance supported renewal of the Agreements. These factors included one or more of the following: (1) that the underperformance was attributable, to a significant extent, to investment decisions (such as security selection or sector allocation) by the Advisers that were reasonable and consistent with the Fund’s investment objective and policies; (2) that the Fund had a limited operating history; (3) that the Fund’s more recent performance, although lagging in certain periods, was competitive when compared to relevant performance benchmarks or peer groups; (4) that the Fund’s more recent performance, although lagging in certain periods, had shown improvement relative to its category; and (5) that although the Fund’s performance lagged that of its relevant peer group for certain periods, performance was stronger when compared to the Fund’s relevant performance benchmark. The Trustees also considered each Adviser’s performance and reputation generally, the performance of the fund family generally (as noted by certain financial publications), and the historical responsiveness of the Advisers to Trustee concerns about performance and the willingness of the Advisers to take steps intended to improve performance.
After reviewing these and related factors, the Trustees concluded, within the context of their overall conclusions regarding each of the Agreements, that the performance of the Funds and the Advisers supported the renewal of the Agreements.
The costs of the services to be provided and profits to be realized by the Advisers and their affiliates from their respective relationships with the Funds. The Trustees considered the fees charged to the Funds for advisory and sub-advisory services as well as the total expense levels of the Funds. This information included comparisons (provided both by management and also by an independent third party) of the Funds’ advisory fees and total expense levels to those of their peer groups and information about the advisory fees charged by the Advisers to comparable accounts (such as institutional separate accounts), as well as information about differences in such fees and the reasons for any such differences. In considering the fees charged to comparable accounts, the Trustees considered, among other things, management’s representations about the differences between managing mutual funds as compared to other types of accounts, including the additional resources required to effectively manage and the greater regulatory costs associated with the management of mutual fund assets. In evaluating each Fund’s advisory and sub-advisory fees, the Trustees also took into account the demands, complexity and quality of the investment management of such Fund and the need for the Advisers to offer competitive compensation. The Trustees considered that over the past several years, management had made recommendations regarding reductions in advisory fee rates, implementation of advisory fee breakpoints and the institution of advisory fee waivers and expense caps for various funds in the fund family. The Trustees noted that management had instituted an expense cap for each Fund, and they considered the amounts waived or reimbursed, if any, by the adviser under these caps. The Trustees noted that certain of the Funds had advisory fee rates that were above the median of a peer group of funds. In this regard, the Trustees considered the factors that management
| 30
believed justified such relatively higher fees. These factors varied from Fund to Fund, but included one or more of the following: (1) that the Fund’s advisory fee rate was only slightly above its peer group median; (2) that although the Fund’s advisory fee rate was above its peer group median, it is subject to an expense cap, which resulted in the reduction of the advisory fee; (3) that management had proposed that advisory fee breakpoints be implemented for the Fund; (4) that the Fund’s net expense ratio was near, at, or below the median of a peer group of funds; (5) that the Fund’s investment discipline was capacity restrained and (6) that the relative difference in advisory fees in comparison to a median of a peer group of funds may be due, at least in part, to the Fund’s peer group consisting of funds with a broad range of advisory fees and of several peer group funds having significant assets.
The Trustees also considered the compensation directly or indirectly received by the Advisers and their affiliates from their relationships with the Funds. The Trustees reviewed information provided by management as to the profitability of the Advisers’ and their affiliates’ relationships with the Funds, and information about the allocation of expenses used to calculate profitability. They also reviewed information provided by management about the effect of distribution costs and changes in asset levels on Adviser profitability, including information regarding resources spent on distribution activities. When reviewing profitability, the Trustees also considered information about court cases in which adviser compensation or profitability were issues, the performance of the relevant Funds, the expense levels of the Funds, and whether the Advisers had implemented breakpoints and/or expense caps with respect to such Funds.
After reviewing these and related factors, the Trustees concluded, within the context of their overall conclusions regarding each of the Agreements, that the advisory fees charged to each of the Funds were fair and reasonable, and that the costs of these services generally and the related profitability of the Advisers and their affiliates in respect of their relationships with the Funds supported the renewal of the Agreements.
Economies of Scale. The Trustees considered the existence of any economies of scale in the provision of services by the Advisers and whether those economies are shared with the Funds through breakpoints in their investment advisory fees or other means, such as expense waivers or caps. The Trustees noted that each of the Funds was subject to an expense cap. The Trustees also discussed with management the factors considered with respect to the implementation of breakpoints in investment advisory fees or expense waivers or caps for certain funds. Management explained that a number of factors are taken into account in considering the possible implementation of breakpoints or an expense cap for a fund, including, among other things, factors such as a fund’s assets, the projected growth of a fund, projected profitability and a fund’s fees and performance. With respect to economies of scale, the Trustees also noted that management had proposed the implementation of breakpoints for the ASG Global Alternatives Fund. In considering these issues, the Trustees also took note of the costs of the services provided (both on an absolute and a relative basis) and the profitability to the Advisers and their affiliates of their relationships with the Funds, as discussed above.
After reviewing these and related factors, the Trustees concluded, within the context of their overall conclusions regarding each of the Agreements, that the extent to which economies of scale were shared with the Funds supported the renewal of the Agreements.
31 |
The Trustees also considered other factors, which included but were not limited to the following:
| · | | The effect of recent market and economic events on the performance, asset levels and expense ratios of each Fund. |
| · | | Whether each Fund has operated in accordance with its investment objectives and the Fund’s record of compliance with its investment restrictions, and the compliance programs of the Funds and the Advisers. They also considered the compliance-related resources the Advisers and their affiliates were providing to the Funds. |
| · | | The nature, quality, cost and extent of administrative and shareholder services performed by the Advisers and their affiliates, both under the Agreements and under separate agreements covering administrative services. |
| · | | So-called “fallout benefits” to the Advisers, such as the engagement of affiliates of the Advisers to provide distribution, administrative and brokerage services to the Funds, the benefits of research made available to the Advisers by reason of brokerage commissions (if any) generated by the Funds’ securities transactions and the benefits to NGAM Advisors of being able to offer “alternative” products in the Natixis family of funds. The Trustees also considered the fact that NGAM Advisors’ parent company benefits from the retention of affiliated Advisers. The Trustees considered the possible conflicts of interest associated with these fallout and other benefits, and the reporting, disclosure and other processes in place to disclose and monitor such possible conflicts of interest. |
| · | | The Trustees’ review and discussion of the Funds’ advisory arrangements in prior years, and management’s record of responding to Trustee concerns raised during the year and in prior years. |
Based on their evaluation of all factors that they deemed to be material, including those factors described above, and assisted by the advice of independent counsel, the Trustees, including the Independent Trustees, concluded that each of the existing Agreements should be continued through June 30, 2013.
| 32
Consolidated Portfolio of Investments – as of June 30, 2012 (Unaudited)
ASG Diversifying Strategies Fund
| | | | | | | | |
Principal
Amount | | | Description | | Value (†) | |
| | Short-Term Investments — 95.1% of Net Assets | | | | |
| | | | Certificates of Deposit — 60.1% | |
| $ | 6,300,000 | | | Royal Bank of Canada, 0.100%, 7/02/2012 | | $ | 6,300,000 | |
| | 10,000,000 | | | BNP Paribas, 0.120%, 7/02/2012 | | | 10,000,000 | |
| | 10,000,000 | | | Deutsche Bank AG, 0.400%, 7/02/2012 | | | 10,000,140 | |
| | 6,000,000 | | | Standard Chartered Bank (NY), 0.220%, 7/09/2012 | | | 6,000,036 | |
| | 9,000,000 | | | Standard Chartered Bank (NY), 0.540%, 7/13/2012 | | | 9,001,188 | |
| | 6,000,000 | | | Toronto Dominion Bank, 0.250%, 7/17/2012(b) | | | 6,000,420 | |
| | 7,000,000 | | | Canadian Imperial Bank of Commerce (NY), 0.335%, 7/25/2012(b)(c) | | | 7,000,021 | |
| | 12,000,000 | | | Mizuho Corporate Bank, 0.340%, 8/02/2012 | | | 12,001,128 | |
| | 5,000,000 | | | Toronto Dominion Bank, 0.200%, 8/06/2012(b) | | | 5,000,050 | |
| | 10,000,000 | | | National Australia Bank, 0.343%, 8/16/2012(c) | | | 9,999,630 | |
| | 12,000,000 | | | ANZ Banking, 0.210%, 8/17/2012 | | | 12,001,632 | |
| | 6,000,000 | | | Canadian Imperial Bank of Commerce (NY), 0.390%, 8/24/2012(c) | | | 6,000,078 | |
| | 6,000,000 | | | Nordea Bank Finland (NY), 0.280%, 8/29/2012 | | | 6,000,612 | |
| | 13,000,000 | | | Svenska Handelsbanken (NY), 0.520%, 9/04/2012(b) | | | 13,005,304 | |
| | 10,000,000 | | | Bank of Montreal (IL), 0.190%, 9/18/2012 | | | 10,000,450 | |
| | 10,000,000 | | | Wells Fargo, 0.170%, 9/19/2012 | | | 9,995,730 | |
| | 10,000,000 | | | Bank of Nova Scotia (TX), 0.320%, 9/21/2012(b) | | | 10,002,330 | |
| | 10,000,000 | | | Societe Generale S.A., 0.345%, 9/28/2012(c) | | | 9,982,730 | |
| | 3,000,000 | | | Bank of Nova Scotia (TX), 0.335%, 12/21/2012(c) | | | 2,999,631 | |
| | 10,000,000 | | | Sumitomo Mitsui Trust (NY), 0.485%, 12/31/2012(c) | | | 9,998,210 | |
| | 5,000,000 | | | Westpac Banking Corp. (NY), 0.466%, 2/04/2013(c) | | | 4,999,165 | |
| | | | | | | | |
| | | | | | | 176,288,485 | |
| | | | | | | | |
| | | | Financial Company Commercial Paper — 23.2% | |
| | 12,000,000 | | | ING (US) Funding LLC, 0.190%, 7/05/2012(d) | | | 11,999,747 | |
| | 7,000,000 | | | Nordea North America, Inc., 0.160%, 7/06/2012(d) | | | 6,999,825 | |
| | 12,000,000 | | | General Electric Capital Corp., 0.170%, 7/16/2012(d) | | | 11,999,316 | |
| | 10,000,000 | | | Overseas Chinese Banking Corp., 0.220%, 8/03/2012(d) | | | 9,998,210 | |
| | 14,000,000 | | | Nestle Capital Corporation, 0.180%, 8/28/2012(d) | | | 13,996,962 | |
| | 13,000,000 | | | United Overseas Funding Corp., 0.200%, 9/10/2012(d) | | | 12,992,460 | |
| | | | | | | | |
| | | | | | | 67,986,520 | |
| | | | | | | | |
| | | | Commercial Paper — 11.8% | |
| | 8,800,000 | | | Louis Dreyfus Corp., (Credit Support: Barclays Bank), 0.380%, 7/02/2012(d) | | | 8,799,907 | |
| | 12,000,000 | | | Cofco Capital Corp., (Credit Support: Rabobank), 0.410%, 7/10/2012(d) | | | 11,998,770 | |
| | 14,000,000 | | | Private Export Funding Corp., 0.180%, 7/30/2012(d) | | | 13,997,704 | |
| | | | | | | | |
| | | | | | | 34,796,381 | |
| | | | | | | | |
| | | | Total Short-Term Investments
(Identified Cost $279,085,307) | | | 279,071,386 | |
| | | | | | | | |
| | | | | | | | |
| | | | Total Investments — 95.1%
(Identified Cost $279,085,307)(a) | | | 279,071,386 | |
| | | | Other assets less liabilities — 4.9% | | | 14,470,978 | |
| | | | | | | | |
| | | | Net Assets — 100.0% | | $ | 293,542,364 | |
| | | | | | | | |
See accompanying notes to financial statements.
33 |
Consolidated Portfolio of Investments – as of June 30, 2012 (Unaudited)
ASG Diversifying Strategies Fund – (continued)
| | | | | | | | |
| | (†) | | | See Note 2 of Notes to Financial Statements. | |
| | (a) | | | Federal Tax Information: | |
| | | | At June 30, 2012, the net unrealized depreciation on short-term investments based on a cost of $279,085,307 for federal income tax purposes was as follows: | | | | |
| | | | Aggregate gross unrealized appreciation for all investments in which there is an excess of value over tax cost | | $ | 14,190 | |
| | | | Aggregate gross unrealized depreciation for all investments in which there is an excess of tax cost over value | | | (28,111 | ) |
| | | | | | | | |
| | | | Net unrealized depreciation | | $ | (13,921 | ) |
| | | | | | | | |
| | | | | | | | |
| | | | Only short-term obligations purchased with an original or remaining maturity of more than sixty days are valued at other than amortized cost. | |
| | | | | | | | |
| | (b) | | | All or a portion of this security has been designated to cover the Fund’s obligations under open forward foreign currency and futures contracts. | |
| | (c) | | | Variable rate security. Rate as of June 30, 2012 is disclosed. | |
| | (d) | | | Interest rate represents discount rate at time of purchase; not a coupon rate. | |
At June 30, 2012, the Fund had the following open forward foreign currency contracts:
| | | | | | | | | | | | | | | | | | |
Contract
to
Buy/Sell1 | | Delivery
Date | | | Currency | | Units | | | Notional
Value | | | Unrealized
Appreciation
(Depreciation) | |
| Sell | | | 9/19/2012 | | | Australian Dollar | | | 6,800,000 | | | $ | 6,910,052 | | | $ | (201,369 | ) |
| Buy | | | 9/19/2012 | | | British Pound | | | 29,437,500 | | | | 46,094,092 | | | | 333,586 | |
| Sell | | | 9/19/2012 | | | British Pound | | | 31,500,000 | | | | 49,323,614 | | | | (499,338 | ) |
| Buy | | | 9/19/2012 | | | Canadian Dollar | | | 4,000,000 | | | | 3,922,122 | | | | 28,696 | |
| Buy | | | 9/19/2012 | | | Canadian Dollar | | | 1,100,000 | | | | 1,078,583 | | | | (1,114 | ) |
| Sell | | | 9/19/2012 | | | Canadian Dollar | | | 5,100,000 | | | | 5,000,705 | | | | (36,410 | ) |
| Buy | | | 9/19/2012 | | | Euro | | | 6,750,000 | | | | 8,548,476 | | | | 124,243 | |
| Sell | | | 9/19/2012 | | | Euro | | | 2,375,000 | | | | 3,007,797 | | | | (23,213 | ) |
| Buy | | | 9/19/2012 | | | Japanese Yen | | | 1,750,000,000 | | | | 21,916,196 | | | | (222,279 | ) |
| Sell | | | 9/19/2012 | | | Japanese Yen | | | 2,012,500,000 | | | | 25,203,626 | | | | 180,360 | |
| Sell | | | 9/19/2012 | | | New Zealand Dollar | | | 17,000,000 | | | | 13,536,903 | | | | (210,568 | ) |
| Buy | | | 9/19/2012 | | | Norwegian Krone | | | 48,000,000 | | | | 8,046,110 | | | | 130,770 | |
| Buy | | | 9/19/2012 | | | Norwegian Krone | | | 20,000,000 | | | | 3,352,546 | | | | (10,558 | ) |
| Sell | | | 9/19/2012 | | | Norwegian Krone | | | 36,000,000 | | | | 6,034,583 | | | | (56,587 | ) |
| Buy | | | 9/19/2012 | | | Singapore Dollar | | | 2,375,000 | | | | 1,875,051 | | | | 4,887 | |
| Sell | | | 9/19/2012 | | | Singapore Dollar | | | 8,000,000 | | | | 6,315,960 | | | | (57,347 | ) |
| Sell | | | 9/19/2012 | | | Swedish Krona | | | 96,000,000 | | | | 13,839,159 | | | | (431,343 | ) |
| Buy | | | 9/19/2012 | | | Swiss Franc | | | 875,000 | | | | 923,715 | | | | 10,825 | |
| Buy | | | 9/19/2012 | | | Turkish Lira | | | 900,000 | | | | 489,574 | | | | 8,317 | |
| Buy | | | 9/19/2012 | | | Turkish Lira | | | 4,500,000 | | | | 2,447,872 | | | | (892 | ) |
| Sell | | | 9/19/2012 | | | Turkish Lira | | | 300,000 | | | | 163,191 | | | | (2,587 | ) |
| | | | | | | | | | | | | | | | | | |
| Total | | | | | | | | | | | | | | | | $ | (931,921 | ) |
| | | | | | | | | | | | | | | | | | |
1 Counterparty is UBS AG.
See accompanying notes to financial statements.
| 34
Consolidated Portfolio of Investments – as of June 30, 2012 (Unaudited)
ASG Diversifying Strategies Fund – (continued)
At June 30, 2012, open futures contracts purchased were as follows:
| | | | | | | | | | | | | | | | |
| Financial Futures | | Expiration
Date | | | Contracts | | | Notional
Value | | | Unrealized
Appreciation
(Depreciation) | |
| ASX SPI 200 | | | 9/20/2012 | | | | 84 | | | $ | 8,719,909 | | | $ | (54,834 | ) |
| CAC 40 | | | 7/20/2012 | | | | 23 | | | | 929,079 | | | | 35,219 | |
| E-mini Dow | | | 9/21/2012 | | | | 111 | | | | 7,108,440 | | | | 104,600 | |
| E-mini NASDAQ 100 | | | 9/21/2012 | | | | 164 | | | | 8,559,980 | | | | 13,336 | |
| Euribor | | | 9/17/2012 | | | | 1,089 | | | | 342,792,270 | | | | 130,837 | |
| Euro Schatz | | | 9/06/2012 | | | | 1,494 | | | | 208,908,013 | | | | (533,351 | ) |
| EURO STOXX 50® | | | 9/21/2012 | | | | 39 | | | | 1,112,943 | | | | 65,641 | |
| Eurodollar | | | 9/17/2012 | | | | 1,036 | | | | 257,756,800 | | | | 126,437 | |
| FTSE JSE Top 40 | | | 9/20/2012 | | | | 626 | | | | 22,624,965 | | | | (316,398 | ) |
| German Euro BOBL | | | 9/06/2012 | | | | 334 | | | | 53,210,774 | | | | (600,264 | ) |
| German Euro Bund | | | 9/06/2012 | | | | 659 | | | | 117,505,524 | | | | (2,246,894 | ) |
| Hang Seng | | | 7/30/2012 | | | | 46 | | | | 5,766,047 | | | | 132,226 | |
| Mini-Russell 2000 | | | 9/21/2012 | | | | 10 | | | | 795,400 | | | | 27,610 | |
| MSCI Taiwan | | | 7/30/2012 | | | | 744 | | | | 18,852,960 | | | | 551,890 | |
| OMXS30 | | | 7/20/2012 | | | | 296 | | | | 4,402,056 | | | | 53,311 | |
| S&P/TSX 60 | | | 9/20/2012 | | | | 56 | | | | 7,275,985 | | | | 105,196 | |
| SGX CNX Nifty | | | 7/26/2012 | | | | 186 | | | | 1,969,554 | | | | 112 | |
| Sterling | | | 9/19/2012 | | | | 853 | | | | 165,688,331 | | | | 295,944 | |
| UK Long Gilt | | | 9/26/2012 | | | | 91 | | | | 16,975,527 | | | | 29,287 | |
| 2 Year U.S. Treasury Note | | | 9/28/2012 | | | | 1,520 | | | | 334,685,000 | | | | (142,500 | ) |
| 3 Year Australia Government Bond | | | 9/17/2012 | | | | 377 | | | | 42,595,432 | | | | (171,422 | ) |
| 5 Year U.S. Treasury Note | | | 9/28/2012 | | | | 664 | | | | 82,315,250 | | | | 160,813 | |
| 10 Year Japan Government Bond | | | 9/10/2012 | | | | 25 | | | | 44,939,639 | | | | (61,425 | ) |
| 10 Year U.S. Treasury Note | | | 9/19/2012 | | | | 643 | | | | 85,760,125 | | | | 196,625 | |
| 30 Year U.S. Treasury Bond | | | 9/19/2012 | | | | 113 | | | | 16,720,469 | | | | 107,312 | |
| | | | | | | | | | | | | | | | |
| Total | | | | | | | | | | | | | | $ | (1,990,692 | ) |
| | | | | | | | | | | | | | | | |
| | | | | | | | | | | | | | | | |
| Commodity Futures2 | | Expiration
Date | | | Contracts | | | Notional
Value | | | Unrealized
Appreciation
(Depreciation) | |
| Cocoa | | | 9/13/2012 | | | | 1 | | | $ | 22,910 | | | $ | 1,130 | |
| Corn | | | 12/14/2012 | | | | 5 | | | | 158,687 | | | | 20,000 | |
| Gold | | | 8/29/2012 | | | | 2 | | | | 320,840 | | | | 10,700 | |
| KC Wheat | | | 9/14/2012 | | | | 1 | | | | 37,800 | | | | 38 | |
| Soybean | | | 11/14/2012 | | | | 56 | | | | 3,997,700 | | | | 452,412 | |
| Soybean Meal | | | 12/14/2012 | | | | 66 | | | | 2,726,460 | | | | 107,330 | |
| Soybean Oil | | | 12/14/2012 | | | | 1 | | | | 31,848 | | | | 510 | |
| Wheat | | | 9/14/2012 | | | | 4 | | | | 151,450 | | | | 1,000 | |
| Zinc | | | 9/19/2012 | | | | 10 | | | | 469,875 | | | | (125 | ) |
| | | | | | | | | | | | | | | | |
| Total | | | | | | | | | | | | | | $ | 592,995 | |
| | | | | | | | | | | | | | | | |
See accompanying notes to financial statements.
35 |
Consolidated Portfolio of Investments – as of June 30, 2012 (Unaudited)
ASG Diversifying Strategies Fund – (continued)
At June 30, 2012, open futures contracts sold were as follows:
| | | | | | | | | | | | | | | | |
| Financial Futures | | Expiration
Date | | | Contracts | | | Notional
Value | | | Unrealized
Appreciation
(Depreciation) | |
| AEX | | | 7/20/2012 | | | | 9 | | | $ | 699,884 | | | $ | (18,679 | ) |
| DAX | | | 9/21/2012 | | | | 1 | | | | 202,844 | | | | (7,387 | ) |
| FTSE 100 | | | 9/21/2012 | | | | 22 | | | | 1,902,968 | | | | (31,182 | ) |
| FTSE MIB | | | 9/21/2012 | | | | 17 | | | | 1,537,784 | | | | (50,126 | ) |
| IBEX 35 | | | 7/20/2012 | | | | 30 | | | | 2,652,195 | | | | (97,165 | ) |
| MSCI Singapore | | | 7/30/2012 | | | | 123 | | | | 6,449,307 | | | | (198,082 | ) |
| Nikkei 225 | | | 9/14/2012 | | | | 17 | | | | 1,916,182 | | | | (40,408 | ) |
| TOPIX | | | 9/14/2012 | | | | 207 | | | | 19,914,055 | | | | (619,941 | ) |
| 10 Year Australia Government Bond | | | 9/17/2012 | | | | 80 | | | | 10,272,477 | | | | 67,648 | |
| 10 Year Canada Government Bond | | | 9/19/2012 | | | | 646 | | | | 87,848,640 | | | | (313,692 | ) |
| | | | | | | | | | | | | | | | |
| Total | | | | | | | | | | | | | | $ | (1,309,014 | ) |
| | | | | | | | | | | | | | | | |
| | | | | | | | | | | | | | | | |
| Commodity Futures2 | | Expiration
Date | | | Contracts | | | Notional
Value | | | Unrealized
Appreciation
(Depreciation) | |
| Aluminum HG | | | 9/19/2012 | | | | 114 | | | $ | 5,442,075 | | | $ | 193,800 | |
| Brent Crude Oil | | | 7/16/2012 | | | | 3 | | | | 293,400 | | | | (15,330 | ) |
| Coffee | | | 9/18/2012 | | | | 82 | | | | 5,249,025 | | | | (408,975 | ) |
| Copper High Grade | | | 9/26/2012 | | | | 32 | | | | 2,797,200 | | | | (86,000 | ) |
| Copper LME | | | 9/19/2012 | | | | 10 | | | | 1,922,375 | | | | (70,688 | ) |
| Cotton | | | 12/06/2012 | | | | 38 | | | | 1,355,270 | | | | (38,950 | ) |
| Gas Oil | | | 8/10/2012 | | | | 1 | | | | 84,325 | | | | (1,725 | ) |
| Gasoline | | | 7/31/2012 | | | | 2 | | | | 221,071 | | | | (12,978 | ) |
| Heating Oil | | | 7/31/2012 | | | | 6 | | | | 682,895 | | | | (19,076 | ) |
| Light Sweet Crude Oil | | | 7/20/2012 | | | | 2 | | | | 169,920 | | | | (12,300 | ) |
| Live Cattle | | | 8/31/2012 | | | | 7 | | | | 337,260 | | | | (1,820 | ) |
| Natural Gas | | | 7/27/2012 | | | | 49 | | | | 1,383,760 | | | | (138,670 | ) |
| Nickel | | | 9/19/2012 | | | | 41 | | | | 4,115,334 | | | | 8,364 | |
| Silver | | | 9/26/2012 | | | | 2 | | | | 276,120 | | | | (6,970 | ) |
| Sugar | | | 9/28/2012 | | | | 82 | | | | 1,929,558 | | | | (137,760 | ) |
| Zinc | | | 9/19/2012 | | | | 48 | | | | 2,255,400 | | | | (101,580 | ) |
| | | | | | | | | | | | | | | | |
| Total | | | | | | | | | | | | | | $ | (850,658 | ) |
| | | | | | | | | | | | | | | | |
2 Commodity futures are held by ASG Diversifying Strategies Cayman Fund Ltd., a wholly-owned subsidiary. See Note 1 of Notes to Financial Statements.
Investment Summary at June 30, 2012 (Unaudited)
| | | | |
Certificates of Deposit | | | 60.1 | % |
Financial Company Commercial Paper | | | 23.2 | |
Commercial Paper | | | 11.8 | |
| | | | |
Total Investments | | | 95.1 | |
Other assets less liabilities (including open forward foreign currency and futures contracts) | | | 4.9 | |
| | | | |
Net Assets | | | 100.0 | % |
| | | | |
See accompanying notes to financial statements.
| 36
Consolidated Portfolio of Investments – as of June 30, 2012 (Unaudited)
ASG Global Alternatives Fund
| | | | | | | | |
Principal
Amount | | | Description | | Value (†) | |
| | Short-Term Investments — 93.2% of Net Assets | | | | |
| | | | Certificates of Deposit — 65.8% | | | | |
| $ | 9,800,000 | | | National Bank of Canada, 0.030%, 7/02/2012 | | $ | 9,800,000 | |
| | 60,000,000 | | | Royal Bank of Canada, 0.100%, 7/02/2012 | | | 60,000,000 | |
| | 60,000,000 | | | BNP Paribas, 0.120%, 7/02/2012 | | | 60,000,000 | |
| | 40,000,000 | | | Deutsche Bank AG, 0.400%, 7/02/2012 | | | 40,000,560 | |
| | 23,000,000 | | | Standard Chartered Bank (NY), 0.220%, 7/09/2012 | | | 23,000,138 | |
| | 50,000,000 | | | Standard Chartered Bank (NY), 0.540%, 7/13/2012(b) | | | 50,006,600 | |
| | 35,000,000 | | | Toronto Dominion Bank, 0.250%, 7/17/2012(b) | | | 35,002,450 | |
| | 23,000,000 | | | Canadian Imperial Bank of Commerce (NY), 0.335%, 7/25/2012(b)(c) | | | 23,000,069 | |
| | 30,000,000 | | | Barclays Bank PLC, 0.170%, 7/27/2012 | | | 30,000,000 | |
| | 30,000,000 | | | Mizuho Corporate Bank, 0.340%, 8/02/2012 | | | 30,002,820 | |
| | 40,000,000 | | | National Australia Bank, 0.350%, 8/02/2012(b) | | | 40,008,320 | |
| | 27,000,000 | | | Toronto Dominion Bank, 0.200%, 8/06/2012(b) | | | 27,000,270 | |
| | 30,000,000 | | | Mizuho Corporate Bank, 0.340%, 8/06/2012 | | | 30,003,150 | |
| | 25,000,000 | | | National Australia Bank, 0.343%, 8/16/2012(c) | | | 24,999,075 | |
| | 23,000,000 | | | Canadian Imperial Bank of Commerce (NY), 0.244%, 8/21/2012(c) | | | 22,999,356 | |
| | 17,000,000 | | | Canadian Imperial Bank of Commerce (NY), 0.390%, 8/24/2012(b)(c) | | | 17,000,221 | |
| | 22,000,000 | | | Nordea Bank Finland (NY), 0.280%, 8/29/2012 | | | 22,002,244 | |
| | 46,000,000 | | | Svenska Handelsbanken (NY), 0.520%, 9/04/2012 | | | 46,018,768 | |
| | 60,000,000 | | | Bank of Montreal (IL), 0.190%, 9/18/2012 | | | 60,002,700 | |
| | 30,000,000 | | | Wells Fargo, 0.170%, 9/19/2012 | | | 29,987,190 | |
| | 35,000,000 | | | Bank of Nova Scotia (TX), 0.320%, 9/21/2012 | | | 35,008,155 | |
| | 60,000,000 | | | Societe Generale S.A., 0.345%, 9/28/2012(c) | | | 59,896,380 | |
| | 20,000,000 | | | Bank of Nova Scotia (TX), 0.335%, 12/21/2012(c) | | | 19,997,540 | |
| | 59,100,000 | | | Sumitomo Mitsui Trust (NY), 0.485%, 12/31/2012(c) | | | 59,089,421 | |
| | 61,500,000 | | | Westpac Banking Corp. (NY), 0.466%, 2/04/2013(c) | | | 61,489,729 | |
| | | | | | | | |
| | | | | | | 916,315,156 | |
| | | | | | | | |
| | | | Financial Company Commercial Paper — 19.2% | | | | |
| | 63,000,000 | | | ING (US) Funding LLC, 0.190%, 7/05/2012(d) | | | 62,998,670 | |
| | 30,000,000 | | | Nordea North America, Inc., 0.160%, 7/06/2012(d) | | | 29,999,250 | |
| | 64,000,000 | | | General Electric Capital Corp., 0.170%, 7/16/2012(d) | | | 63,996,352 | |
| | 50,000,000 | | | Overseas Chinese Banking Corp. Ltd., 0.250%, 8/27/2012(d) | | | 49,982,900 | |
| | 20,900,000 | | | Nestle Capital Corporation, 0.180%, 8/28/2012(d) | | | 20,895,465 | |
| | 40,000,000 | | | United Overseas Funding Corp., 0.200%, 9/10/2012(d) | | | 39,984,222 | |
| | | | | | | | |
| | | | | | | 267,856,859 | |
| | | | | | | | |
| | | | Commercial Paper — 8.2% | | | | |
| | 50,000,000 | | | Cofco Capital Corp., (Credit Support: Rabobank), 0.410%, 7/10/2012(d) | | | 49,994,875 | |
| | 27,500,000 | | | Vermont Economic Development Authority, (Credit Support: JPMorgan Chase), 0.180%, 7/17/2012 | | | 27,500,000 | |
| | 36,000,000 | | | Private Export Funding Corp., 0.180%, 7/30/2012(d) | | | 35,994,096 | |
| | | | | | | | |
| | | | | | | 113,488,971 | |
| | | | | | | | |
| | | | Total Short-Term Investments
(Identified Cost $1,297,746,906) | | | 1,297,660,986 | |
| | | | | | | | |
| | | | | | | | |
| | | | Total Investments — 93.2%
(Identified Cost $1,297,746,906)(a) | | | 1,297,660,986 | |
| | | | Other assets less liabilities — 6.8% | | | 94,638,908 | |
| | | | | | | | |
| | | | Net Assets — 100.0% | | $ | 1,392,299,894 | |
| | | | | | | | |
See accompanying notes to financial statements.
37 |
Consolidated Portfolio of Investments – as of June 30, 2012 (Unaudited)
ASG Global Alternatives Fund – (continued)
| | | | | | | | |
| | (†) | | | See Note 2 of Notes to Financial Statements. | | | | |
| | (a) | | | Federal Tax Information: | | | | |
| | | | At June 30, 2012, the net unrealized depreciation on short-term investments based on a cost of $1,297,746,906 for federal income tax purposes was as follows: | | | | |
| | | | Aggregate gross unrealized appreciation for all investments in which there is an excess of value over tax cost | | $ | 59,170 | |
| | | | Aggregate gross unrealized depreciation for all investments in which there is an excess of tax cost over value | | | (145,090 | ) |
| | | | | | | | |
| | | | Net unrealized depreciation | | $ | (85,920 | ) |
| | | | | | | | |
| | | | | | | | |
| | | | Only short-term obligations purchased with an original or remaining maturity of more than sixty days are valued at other than amortized cost. | | | | |
| | | | | | | | |
| | (b) | | | All or a portion of this security has been designated to cover the Fund’s obligations under open forward foreign currency and futures contracts. | | | | |
| | (c) | | | Variable rate security. Rate as of June 30, 2012 is disclosed. | | | | |
| | (d) | | | Interest rate represents discount rate at time of purchase; not a coupon rate. | | | | |
At June 30, 2012, the Fund had the following open forward foreign currency contracts:
| | | | | | | | | | | | | | | | | | |
Contract
to
Buy/Sell1 | | Delivery
Date | | | Currency | | Units | | | Notional
Value | | | Unrealized
Appreciation
(Depreciation) | |
| Buy | | | 9/19/2012 | | | Australian Dollar | | | 42,300,000 | | | $ | 42,984,591 | | | $ | 1,252,637 | |
| Buy | | | 9/19/2012 | | | British Pound | | | 25,312,500 | | | | 39,635,047 | | | | 304,369 | |
| Buy | | | 9/19/2012 | | | British Pound | | | 7,250,000 | | | | 11,352,260 | | | | (19,684 | ) |
| Sell | | | 9/19/2012 | | | British Pound | | | 5,500,000 | | | | 8,612,060 | | | | (25,641 | ) |
| Buy | | | 9/19/2012 | | | Canadian Dollar | | | 65,100,000 | | | | 63,832,528 | | | | 388,341 | |
| Sell | | | 9/19/2012 | | | Canadian Dollar | | | 9,800,000 | | | | 9,609,198 | | | | (87,350 | ) |
| Buy | | | 9/19/2012 | | | Euro | | | 5,250,000 | | | | 6,648,815 | | | | (1,686 | ) |
| Sell | | | 9/19/2012 | | | Euro | | | 5,750,000 | | | | 7,282,035 | | | | 27,250 | |
| Sell | | | 9/19/2012 | | | Euro | | | 20,250,000 | | | | 25,645,428 | | | | (197,921 | ) |
| Buy | | | 9/19/2012 | | | Japanese Yen | | | 6,675,000,000 | | | | 83,594,635 | | | | (377,949 | ) |
| Sell | | | 9/19/2012 | | | Japanese Yen | | | 2,925,000,000 | | | | 36,631,357 | | | | 217,980 | |
| Sell | | | 9/19/2012 | | | Japanese Yen | | | 1,400,000,000 | | | | 17,532,957 | | | | (78,274 | ) |
| Buy | | | 9/19/2012 | | | Swedish Krona | | | 278,000,000 | | | | 40,075,897 | | | | 959,719 | |
| Sell | | | 9/19/2012 | | | Swedish Krona | | | 62,000,000 | | | | 8,937,790 | | | | (101,928 | ) |
| Buy | | | 9/19/2012 | | | Swiss Franc | | | 20,125,000 | | | | 21,245,456 | | | | 178,189 | |
| Buy | | | 9/19/2012 | | | Swiss Franc | | | 7,875,000 | | | | 8,313,439 | | | | (14,195 | ) |
| Sell | | | 9/19/2012 | | | Swiss Franc | | | 2,000,000 | | | | 2,111,350 | | | | 8,395 | |
| Sell | | | 9/19/2012 | | | Swiss Franc | | | 4,375,000 | | | | 4,618,577 | | | | (29,073 | ) |
| | | | | | | | | | | | | | | | | | |
| Total | | | | | | | | | | | | | | | | $ | 2,403,179 | |
| | | | | | | | | | | | | | | | | | |
1 Counterparty is UBS AG.
See accompanying notes to financial statements.
| 38
Consolidated Portfolio of Investments – as of June 30, 2012 (Unaudited)
ASG Global Alternatives Fund – (continued)
At June 30, 2012, open futures contracts purchased were as follows:
| | | | | | | | | | | | | | | | |
| Financial Futures | | Expiration
Date | | | Contracts | | | Notional
Value | | | Unrealized
Appreciation
(Depreciation) | |
| DAX | | | 9/21/2012 | | | | 329 | | | $ | 66,735,578 | | | $ | 1,900,258 | |
| E-mini S&P 500® | | | 9/21/2012 | | | | 1,722 | | | | 116,794,650 | | | | 2,739,375 | |
| Eurodollar | | | 9/17/2012 | | | | 8,153 | | | | 2,028,466,400 | | | | 840,538 | |
| FTSE 100 | | | 9/21/2012 | | | | 539 | | | | 46,622,705 | | | | 514,849 | |
| German Euro Bund | | | 9/06/2012 | | | | 1,175 | | | | 209,512,884 | | | | (3,733,590 | ) |
| Hang Seng | | | 7/30/2012 | | | | 484 | | | | 60,668,836 | | | | 1,278,566 | |
| TOPIX | | | 9/14/2012 | | | | 603 | | | | 58,010,509 | | | | 3,097,079 | |
| UK Long Gilt | | | 9/26/2012 | | | | 355 | | | | 66,223,211 | | | | 56,851 | |
| 10 Year Japan Government Bond | | | 9/10/2012 | | | | 82 | | | | 147,402,014 | | | | 193,657 | |
| 10 Year U.S. Treasury Note | | | 9/19/2012 | | | | 1,651 | | | | 220,202,125 | | | | 630,070 | |
| | | | | | | | | | | | | | | | |
| Total | | | | | | | | | | | | | | $ | 7,517,653 | |
| | | | | | | | | | | | | | | | |
| | | | | | | | | | | | | | | | |
| Commodity Futures2 | | Expiration
Date | | | Contracts | | | Notional
Value | | | Unrealized
Appreciation
(Depreciation) | |
| Aluminum HG | | | 9/19/2012 | | | | 693 | | | $ | 33,082,087 | | | $ | (630,761 | ) |
| Brent Crude Oil | | | 7/16/2012 | | | | 633 | | | | 61,907,400 | | | | 1,513,310 | |
| Copper LME | | | 9/19/2012 | | | | 32 | | | | 6,151,600 | | | | 216,224 | |
| Gas Oil | | | 8/10/2012 | | | | 526 | | | | 44,354,950 | | | | 957,100 | |
| Gold | | | 8/29/2012 | | | | 158 | | | | 25,346,360 | | | | 845,300 | |
| Heating Oil | | | 7/31/2012 | | | | 356 | | | | 40,518,425 | | | | 1,407,852 | |
| Light Sweet Crude Oil | | | 7/20/2012 | | | | 127 | | | | 10,789,920 | | | | 591,710 | |
| Nickel | | | 9/19/2012 | | | | 85 | | | | 8,531,790 | | | | (17,340 | ) |
| Zinc | | | 9/19/2012 | | | | 181 | | | | 8,504,738 | | | | 88,087 | |
| | | | | | | | | | | | | | | | |
| Total | | | | | | | | | | | | | | $ | 4,971,482 | |
| | | | | | | | | | | | | | | | |
At June 30, 2012, open futures contracts sold were as follows:
| | | | | | | | | | | | | | |
| Commodity Futures2 | | Expiration
Date | | | Contracts | | Notional
Value | | | Unrealized
Appreciation
(Depreciation) | |
| Copper LME | | | 9/19/2012 | | | 120 | | $ | 23,068,500 | | | $ | (828,046 | ) |
| Natural Gas | | | 7/27/2012 | | | 148 | | | 4,179,520 | | | | (418,840 | ) |
| | | | | | | | | | | | | | |
| Total | | | | | | | | | | | | $ | (1,246,886 | ) |
| | | | | | | | | | | | | | |
2 Commodity futures are held by ASG Global Alternatives Cayman Fund Ltd., a wholly-owned subsidiary. See Note 1 of Notes to Financial Statements.
See accompanying notes to financial statements.
39 |
Consolidated Portfolio of Investments – as of June 30, 2012 (Unaudited)
ASG Global Alternatives Fund – (continued)
Investment Summary at June 30, 2012 (Unaudited)
| | | | |
Certificates of Deposit | | | 65.8 | % |
Financial Company Commercial Paper | | | 19.2 | |
Commercial Paper | | | 8.2 | |
| | | | |
Total Investments | | | 93.2 | |
Other assets less liabilities (including open forward foreign currency and futures contracts) | | | 6.8 | |
| | | | |
Net Assets | | | 100.0 | % |
| | | | |
See accompanying notes to financial statements.
| 40
Consolidated Portfolio of Investments – as of June 30, 2012 (Unaudited)
ASG Managed Futures Strategy Fund
| | | | | | | | |
Principal
Amount | | | Description | | Value (†) | |
| | | | | | | | |
| | Short-Term Investments — 90.7% of Net Assets | | | | |
| | | | Certificates of Deposit — 64.2% | |
| $ | 21,900,000 | | | National Bank of Canada, 0.030%, 7/02/2012 | | $ | 21,900,000 | |
| | 33,000,000 | | | Royal Bank of Canada, 0.100%, 7/02/2012 | | | 33,000,000 | |
| | 33,000,000 | | | BNP Paribas, 0.120%, 7/02/2012 | | | 33,000,000 | |
| | 30,000,000 | | | Deutsche Bank AG, 0.400%, 7/02/2012 | | | 30,000,420 | |
| | 25,000,000 | | | Standard Chartered Bank (NY), 0.220%, 7/09/2012 | | | 25,000,150 | |
| | 15,000,000 | | | Toronto Dominion Bank, 0.250%, 7/17/2012(b) | | | 15,001,050 | |
| | 8,000,000 | | | Canadian Imperial Bank of Commerce (NY), 0.335%, 7/25/2012(b)(c) | | | 8,000,024 | |
| | 29,000,000 | | | Mizuho Corporate Bank, 0.340%, 8/02/2012 | | | 29,002,726 | |
| | 12,000,000 | | | Toronto Dominion Bank, 0.200%, 8/06/2012 | | | 12,000,120 | |
| | 20,000,000 | | | National Australia Bank, 0.343%, 8/16/2012(b)(c) | | | 19,999,260 | |
| | 28,000,000 | | | ANZ Banking, 0.210%, 8/17/2012 | | | 28,003,808 | |
| | 15,000,000 | | | Canadian Imperial Bank of Commerce (NY), 0.244%, 8/21/2012(b)(c) | | | 14,999,580 | |
| | 8,000,000 | | | Canadian Imperial Bank of Commerce (NY), 0.390%, 8/24/2012(b)(c) | | | 8,000,104 | |
| | 13,000,000 | | | Nordea Bank Finland (NY), 0.280%, 8/29/2012 | | | 13,001,326 | |
| | 20,000,000 | | | Svenska Handelsbanken (NY), 0.520%, 9/04/2012 | | | 20,008,160 | |
| | 15,000,000 | | | Bank of Nova Scotia (TX), 0.190%, 9/06/2012 | | | 14,999,145 | |
| | 33,000,000 | | | Bank of Montreal (IL), 0.190%, 9/18/2012 | | | 33,001,485 | |
| | 30,000,000 | | | Wells Fargo, 0.170%, 9/19/2012 | | | 29,987,190 | |
| | 15,000,000 | | | Bank of Nova Scotia (TX), 0.320%, 9/21/2012(b) | | | 15,003,495 | |
| | 30,000,000 | | | Societe Generale S.A., 0.345%, 9/28/2012(c) | | | 29,948,190 | |
| | 4,000,000 | | | Bank of Nova Scotia (TX), 0.335%, 12/21/2012(c) | | | 3,999,508 | |
| | 30,000,000 | | | Sumitomo Mitsui Trust (NY), 0.485%, 12/31/2012(c) | | | 29,994,630 | |
| | 25,000,000 | | | Westpac Banking Corp. (NY), 0.466%, 2/04/2013(c) | | | 24,995,825 | |
| | | | | | | | |
| | | | | | | 492,846,196 | |
| | | | | | | | |
| | | | Financial Company Commercial Paper — 18.8% | |
| | 25,000,000 | | | ING (US) Funding LLC, 0.190%, 7/05/2012(d) | | | 24,999,472 | |
| | 12,000,000 | | | Nordea North America, Inc., 0.160%, 7/06/2012(d) | | | 11,999,700 | |
| | 29,000,000 | | | General Electric Capital Corp., 0.170%, 7/16/2012(d) | | | 28,998,347 | |
| | 22,750,000 | | | Overseas Chinese Banking Corp., 0.220%, 8/03/2012(d) | | | 22,745,928 | |
| | 5,500,000 | | | Nestle Capital Corporation, 0.180%, 8/28/2012(d) | | | 5,498,806 | |
| | 20,000,000 | | | Nestle Capital Corporation, 0.180%, 8/29/2012(d) | | | 19,995,600 | |
| | 30,000,000 | | | United Overseas Funding Corp., 0.200%, 9/10/2012(d) | | | 29,982,600 | |
| | | | | | | | |
| | | | | | | 144,220,453 | |
| | | | | | | | |
| | | | Commercial Paper — 7.7% | | | | |
| | 16,120,000 | | | Cofco Capital Corp., (Credit Support: Rabobank), 0.410%, 7/10/2012(d) | | | 16,118,348 | |
| | 15,000,000 | | | Vermont Economic Development Authority, (Credit Support: JPMorgan Chase), 0.180%, 7/17/2012 | | | 15,000,000 | |
| | 15,100,000 | | | Cofco Captial Corp., (Credit Support: Rabobank), 0.380%, 7/17/2012(d) | | | 15,097,450 | |
| | 12,550,000 | | | Tennessee State School Bond Authority, 0.160%, 8/02/2012 | | | 12,550,000 | |
| | | | | | | | |
| | | | | | | 58,765,798 | |
| | | | | | | | |
| | | | Total Short-Term Investments
(Identified Cost $695,891,344) | | | 695,832,447 | |
| | | | | | | | |
| | | | | | | | |
| | | | Total Investments — 90.7%
(Identified Cost $695,891,344)(a) | | | 695,832,447 | |
| | | | Other assets less liabilities — 9.3% | | | 71,308,571 | |
| | | | | | | | |
| | | | Net Assets — 100.0% | | $ | 767,141,018 | |
| | | | | | | | |
See accompanying notes to financial statements.
41 |
Consolidated Portfolio of Investments – as of June 30, 2012 (Unaudited)
ASG Managed Futures Strategy Fund – (continued)
| | | | | | | | |
| | (†) | | | See Note 2 of Notes to Financial Statements. | | | | |
| | (a) | | | Federal Tax Information: | | | | |
| | | | At June 30, 2012, the net unrealized depreciation on short-term investments based on a cost of $695,891,344 for federal income tax purposes was as follows: | | | | |
| | | | Aggregate gross unrealized appreciation for all investments in which there is an excess of value over tax cost | | $ | 24,905 | |
| | | | Aggregate gross unrealized depreciation for all investments in which there is an excess of tax cost over value | | | (83,802 | ) |
| | | | | | | | |
| | | | Net unrealized depreciation | | $ | (58,897 | ) |
| | | | | | | | |
| | | | | | | | |
| | | | Only short-term obligations purchased with an original or remaining maturity of more than sixty days are valued at other than amortized cost. | | | | |
| | | | | | | | |
| | (b) | | | All or a portion of this security has been designated to cover the Fund’s obligations under open forward foreign currency or futures contracts. | | | | |
| | (c) | | | Variable rate security. Rate as of June 30, 2012 is disclosed. | | | | |
| | (d) | | | Interest rate represents discount rate at time of purchase; not a coupon rate. | | | | |
At June 30, 2012, the Fund had the following open forward foreign currency contracts:
| | | | | | | | | | | | | | | | | | |
Contract
to
Buy/Sell1 | | Delivery
Date | | | Currency | | Units | | | Notional
Value | | | Unrealized
Appreciation
(Depreciation) | |
| Buy | | | 9/19/2012 | | | Australian Dollar | | | 27,900,000 | | | $ | 28,351,538 | | | $ | 138,384 | |
| Sell | | | 9/19/2012 | | | Australian Dollar | | | 28,200,000 | | | | 28,656,394 | | | | (814,549 | ) |
| Buy | | | 9/19/2012 | | | British Pound | | | 21,750,000 | | | | 34,056,781 | | | | 246,471 | |
| Sell | | | 9/19/2012 | | | British Pound | | | 29,687,500 | | | | 46,485,549 | | | | (304,802 | ) |
| Sell | | | 9/19/2012 | | | Canadian Dollar | | | 38,200,000 | | | | 37,456,261 | | | | (264,348 | ) |
| Buy | | | 9/19/2012 | | | Euro | | | 18,125,000 | | | | 22,954,241 | | | | 89,898 | |
| Sell | | | 9/19/2012 | | | Euro | | | 34,000,000 | | | | 43,058,991 | | | | (332,312 | ) |
| Buy | | | 9/19/2012 | | | Japanese Yen | | | 2,950,000,000 | | | | 36,944,445 | | | | (403,173 | ) |
| Buy | | | 9/19/2012 | | | New Zealand Dollar | | | 26,200,000 | | | | 20,862,757 | | | | 400,359 | |
| Sell | | | 9/19/2012 | | | New Zealand Dollar | | | 5,000,000 | | | | 3,981,442 | | | | (142,247 | ) |
| Buy | | | 9/19/2012 | | | Norwegian Krone | | | 46,000,000 | | | | 7,710,856 | | | | 19,609 | |
| Buy | | | 9/19/2012 | | | Norwegian Krone | | | 2,000,000 | | | | 335,255 | | | | (1,056 | ) |
| Sell | | | 9/19/2012 | | | Norwegian Krone | | | 54,000,000 | | | | 9,051,874 | | | | (142,753 | ) |
| Buy | | | 9/19/2012 | | | Singapore Dollar | | | 13,375,000 | | | | 10,559,496 | | | | 3,697 | |
| Sell | | | 9/19/2012 | | | Singapore Dollar | | | 27,250,000 | | | | 21,513,740 | | | | (199,475 | ) |
| Buy | | | 9/19/2012 | | | Swedish Krona | | | 218,000,000 | | | | 31,426,423 | | | | 623,519 | |
| Sell | | | 9/19/2012 | | | Swedish Krona | | | 204,000,000 | | | | 29,408,212 | | | | (916,604 | ) |
| Buy | | | 9/19/2012 | | | Swiss Franc | | | 35,125,000 | | | | 37,080,579 | | | | 193,307 | |
| Sell | | | 9/19/2012 | | | Swiss Franc | | | 48,500,000 | | | | 51,200,230 | | | | (390,415 | ) |
| Buy | | | 9/19/2012 | | | Turkish Lira | | | 15,300,000 | | | | 8,322,765 | | | | 126,409 | |
| Buy | | | 9/19/2012 | | | Turkish Lira | | | 26,400,000 | | | | 14,360,849 | | | | (44,725 | ) |
| Sell | | | 9/19/2012 | | | Turkish Lira | | | 10,500,000 | | | | 5,711,701 | | | | (90,545 | ) |
| | | | | | | | | | | | | | | | | | |
| Total | | | | | | | | | | | | | | | | $ | (2,205,351 | ) |
| | | | | | | | | | | | | | | | | | |
1 Counterparty is UBS AG.
See accompanying notes to financial statements.
| 42
Consolidated Portfolio of Investments – as of June 30, 2012 (Unaudited)
ASG Managed Futures Strategy Fund – (continued)
At June 30, 2012, open futures contracts purchased were as follows:
| | | | | | | | | | | | | | | | |
| Financial Futures | | Expiration
Date | | | Contracts | | | Notional
Value | | | Unrealized
Appreciation
(Depreciation) | |
| AEX | | | 7/20/2012 | | | | 21 | | | $ | 1,633,063 | | | $ | 56,074 | |
| E-mini Dow | | | 9/21/2012 | | | | 273 | | | | 17,482,920 | | | | 275,765 | |
| E-mini NASDAQ 100 | | | 9/21/2012 | | | | 344 | | | | 17,955,080 | | | | 195,038 | |
| E-mini S&P 500® | | | 9/21/2012 | | | | 175 | | | | 11,869,375 | | | | 270,200 | |
| Euribor | | | 9/17/2012 | | | | 6,318 | | | | 1,988,761,766 | | | | 1,139,867 | |
| Euro Schatz | | | 9/06/2012 | | | | 4,181 | | | | 584,634,809 | | | | (1,466,998 | ) |
| Eurodollar | | | 9/17/2012 | | | | 5,339 | | | | 1,328,343,200 | | | | 72,925 | |
| FTSE 100 | | | 9/21/2012 | | | | 193 | | | | 16,694,215 | | | | 32,185 | |
| FTSE JSE Top 40 | | | 9/20/2012 | | | | 594 | | | | 21,468,418 | | | | (783,299 | ) |
| FTSE MIB | | | 9/21/2012 | | | | 7 | | | | 633,205 | | | | 30,385 | |
| German Euro BOBL | | | 9/06/2012 | | | | 933 | | | | 148,639,677 | | | | (1,657,361 | ) |
| German Euro Bund | | | 9/06/2012 | | | | 509 | | | | 90,759,198 | | | | (2,505,701 | ) |
| Hang Seng | | | 7/30/2012 | | | | 11 | | | | 1,378,837 | | | | 31,619 | |
| IBEX 35 | | | 7/20/2012 | | | | 27 | | | | 2,386,976 | | | | 156,458 | |
| Mini-Russell 2000 | | | 9/21/2012 | | | | 19 | | | | 1,511,260 | | | | 52,630 | |
| MSCI Singapore | | | 7/30/2012 | | | | 27 | | | | 1,415,702 | | | | 43,481 | |
| Nikkei 225 | | | 9/14/2012 | | | | 15 | | | | 1,690,749 | | | | 26,271 | |
| OMXS30 | | | 7/20/2012 | | | | 478 | | | | 7,108,725 | | | | 288,495 | |
| SGX CNX Nifty | | | 7/26/2012 | | | | 1,005 | | | | 10,641,945 | | | | 283,868 | |
| Sterling | | | 9/19/2012 | | | | 5,179 | | | | 1,005,978,743 | | | | 129,168 | |
| TOPIX | | | 9/14/2012 | | | | 13 | | | | 1,250,641 | | | | 37,406 | |
| UK Long Gilt | | | 9/26/2012 | | | | 601 | | | | 112,113,098 | | | | 88,503 | |
| 2 Year U.S. Treasury Note | | | 9/28/2012 | | | | 4,065 | | | | 895,062,187 | | | | (346,156 | ) |
| 3 Year Australia Government Bond | | | 9/17/2012 | | | | 1,608 | | | | 181,680,251 | | | | (731,156 | ) |
| 5 Year U.S. Treasury Note | | | 9/28/2012 | | | | 2,677 | | | | 331,864,344 | | | | 478,359 | |
| 10 Year Australia Government Bond | | | 9/17/2012 | | | | 610 | | | | 78,327,636 | | | | (232,292 | ) |
| 10 Year Canada Government Bond | | | 9/19/2012 | | | | 1,175 | | | | 159,786,612 | | | | 1,387,320 | |
| 10 Year Japan Government Bond | | | 9/10/2012 | | | | 373 | | | | 670,499,406 | | | | 1,311,065 | |
| 10 Year U.S. Treasury Note | | | 9/19/2012 | | | | 1,363 | | | | 181,790,125 | | | | 679,172 | |
| 30 Year U.S. Treasury Bond | | | 9/19/2012 | | | | 528 | | | | 78,127,500 | | | | 65,234 | |
| | | | | | | | | | | | | | | | |
| Total | | | | | | | | | | | | | | $ | (591,475 | ) |
| | | | | | | | | | | | | | | | |
| | | | | | | | | | | | | | | | |
| Commodity Futures2 | | Expiration
Date | | | Contracts | | | Notional
Value | | | Unrealized
Appreciation
(Depreciation) | |
| Corn | | | 12/14/2012 | | | | 20 | | | $ | 634,750 | | | $ | 123,250 | |
| Gas Oil | | | 8/10/2012 | | | | 43 | | | | 3,625,975 | | | | 86,000 | |
| Gold | | | 8/29/2012 | | | | 4 | | | | 641,680 | | | | 21,400 | |
| Light Sweet Crude Oil | | | 7/20/2012 | | | | 45 | | | | 3,823,200 | | | | 91,800 | |
| Soybean | | | 11/14/2012 | | | | 209 | | | | 14,919,988 | | | | 1,066,650 | |
| Soybean Meal | | | 12/14/2012 | | | | 375 | | | | 15,491,250 | | | | 250,970 | |
| Soybean Oil | | | 12/14/2012 | | | | 23 | | | | 732,504 | | | | 48,024 | |
| Wheat | | | 9/14/2012 | | | | 2 | | | | 75,725 | | | | 7,650 | |
| Zinc | | | 9/19/2012 | | | | 4 | | | | 187,950 | | | | (50 | ) |
| | | | | | | | | | | | | | | | |
| Total | | | | | | | | | | | | | | $ | 1,695,694 | |
| | | | | | | | | | | | | | | | |
See accompanying notes to financial statements.
43 |
Consolidated Portfolio of Investments – as of June 30, 2012 (Unaudited)
ASG Managed Futures Strategy Fund – (continued)
At June 30, 2012, open futures contracts sold were as follows:
| | | | | | | | | | | | | | | | |
| Financial Futures | | Expiration
Date | | | Contracts | | | Notional
Value | | | Unrealized
Appreciation
(Depreciation) | |
| ASX SPI 200 | | | 9/20/2012 | | | | 136 | | | $ | 14,117,948 | | | $ | 125,276 | |
| CAC 40 | | | 7/20/2012 | | | | 51 | | | | 2,060,131 | | | | (105,524 | ) |
| DAX | | | 9/21/2012 | | | | 27 | | | | 5,476,780 | | | | (73,430 | ) |
| EURO STOXX 50® | | | 9/21/2012 | | | | 25 | | | | 713,425 | | | | (41,129 | ) |
| MSCI Taiwan | | | 7/30/2012 | | | | 512 | | | | 12,974,080 | | | | (378,880 | ) |
| S&P/TSX 60 | | | 9/20/2012 | | | | 9 | | | | 1,169,355 | | | | (23,691 | ) |
| | | | | | | | | | | | | | | | |
| Total | | | | | | | | | | | | | | $ | (497,378 | ) |
| | | | | | | | | | | | | | | | |
| | | | | | | | | | | | | | | | |
| Commodity Futures2 | | Expiration
Date | | | Contracts | | | Notional
Value | | | Unrealized
Appreciation
(Depreciation) | |
| Aluminum HG | | | 9/19/2012 | | | | 366 | | | $ | 17,471,925 | | | $ | 372,989 | |
| Cocoa | | | 9/13/2012 | | | | 79 | | | | 1,809,890 | | | | (89,270 | ) |
| Coffee | | | 9/18/2012 | | | | 187 | | | | 11,970,338 | | | | (872,813 | ) |
| Copper High Grade | | | 9/26/2012 | | | | 68 | | | | 5,944,050 | | | | (130,387 | ) |
| Copper LME | | | 9/19/2012 | | | | 31 | | | | 5,959,362 | | | | (219,131 | ) |
| Cotton | | | 12/06/2012 | | | | 160 | | | | 5,706,400 | | | | (164,000 | ) |
| Gasoline | | | 7/31/2012 | | | | 2 | | | | 221,071 | | | | (9,811 | ) |
| KC Wheat | | | 9/14/2012 | | | | 78 | | | | 2,948,400 | | | | (218,313 | ) |
| Live Cattle | | | 8/31/2012 | | | | 137 | | | | 6,600,660 | | | | (45,580 | ) |
| Natural Gas | | | 7/27/2012 | | | | 175 | | | | 4,942,000 | | | | (495,250 | ) |
| Nickel | | | 9/19/2012 | | | | 78 | | | | 7,829,172 | | | | 15,912 | |
| Silver | | | 9/26/2012 | | | | 15 | | | | 2,070,900 | | | | 84,300 | |
| Sugar | | | 9/28/2012 | | | | 94 | | | | 2,211,933 | | | | (157,920 | ) |
| | | | | | | | | | | | | | | | |
| Total | | | | | | | | | | | | | | $ | (1,929,274 | ) |
| | | | | | | | | | | | | | | | |
2 Commodity futures are held by ASG Managed Futures Strategy Cayman Fund Ltd., a wholly-owned subsidiary. See Note 1 of Notes to Financial Statements.
Investment Summary at June 30, 2012 (Unaudited)
| | | | |
Certificates of Deposit | | | 64.2 | % |
Financial Company Commercial Paper | | | 18.8 | |
Commercial Paper | | | 7.7 | |
| | | | |
Total Investments | | | 90.7 | |
Other assets less liabilities (including open forward foreign currency and futures contracts) | | | 9.3 | |
| | | | |
Net Assets | | | 100.0 | % |
| | | | |
See accompanying notes to financial statements.
| 44
Portfolio of Investments – as of June 30, 2012 (Unaudited)
Loomis Sayles Absolute Strategies Fund – (continued)
| | | | | | | | |
Principal
Amount (‡) | | | Description | | Value (†) | |
| | | | | | | | |
| | Bonds and Notes — 72.8% of Net Assets | | | | |
| | Non-Convertible Bonds — 70.1% | | | | |
| | | | ABS Car Loan — 0.2% | |
| $ | 730,000 | | | DSC Floorplan Master Owner Trust, Series 2011-1, Class A, 3.910%, 3/15/2016, 144A | | $ | 749,143 | |
| | 425,000 | | | DSC Floorplan Master Owner Trust, Series 2011-1, Class B, 8.110%, 3/15/2016, 144A | | | 430,531 | |
| | | | | | | | |
| | | | | | | 1,179,674 | |
| | | | | | | | |
| | | | ABS Home Equity — 2.6% | |
| | 848,939 | | | Banc of America Funding Corp., Series 2004-C, Class 4A1, 0.574%, 12/20/2034(b) | | | 588,230 | |
| | 880,459 | | | CitiMortgage Alternative Loan Trust, Series 2006-A3, Class 1A7, 6.000%, 7/25/2036 | | | 642,205 | |
| | 1,600,231 | | | CitiMortgage Alternative Loan Trust, Series 2007-A6, Class 1A3, 6.000%, 6/25/2037 | | | 1,152,499 | |
| | 1,093,532 | | | Countrywide Alternative Loan Trust, Series 2006-J4, Class 1A3, 6.250%, 7/25/2036 | | | 681,461 | |
| | 309,263 | | | Countrywide Home Loan Mortgage Pass Through Trust, Series 2004-HYB4, Class 2A1,
2.738%, 9/20/2034(b) | | | 258,637 | |
| | 604,747 | | | Countrywide Home Loan Mortgage Pass Through Trust, Series 2005-11, Class 4A1, 0.515%, 4/25/2035(b) | | | 370,771 | |
| | 1,054,980 | | | Credit Suisse Mortgage Capital Certificates, Series 2006-8, Class 4A1, 6.500%, 10/25/2021 | | | 811,028 | |
| | 2,574,378 | | | Fremont Home Loan Trust, Series 2006-D, Class 2A3, 0.395%, 11/25/2036(b) | | | 781,159 | |
| | 1,256,336 | | | GMAC Mortgage Corp. Loan Trust, Series 2005-AR4, Class 3A1, 3.318%, 7/19/2035(b) | | | 1,082,459 | |
| | 376,263 | | | GSR Mortgage Loan Trust, Series 2004-14, Class 3A1, 2.848%, 12/25/2034(b) | | | 283,665 | |
| | 1,249,296 | | | GSR Mortgage Loan Trust, Series 2005-AR4, Class 4A1, 3.134%, 7/25/2035(b) | | | 1,067,152 | |
| | 357,675 | | | Indymac Index Mortgage Loan Trust, Series 2005-16IP, Class A1, 0.565%, 7/25/2045(b) | | | 235,207 | |
| | 1,104,372 | | | MASTR Adjustable Rate Mortgages Trust, Series 2006-2, Class 1A1, 2.865%, 4/25/2036(b) | | | 831,592 | |
| | 2,391,499 | | | MASTR Asset Securitization Trust, Series 2007-1, Class 1A4, 6.500%, 11/25/2037 | | | 2,057,263 | |
| | 595,409 | | | MLCC Mortgage Investors, Inc., Series 2006-2, Class 2A, 2.351%, 5/25/2036(b) | | | 537,297 | |
| | 323,727 | | | WaMu Mortgage Pass Through Certificates, Series 2006-AR17, Class 1A1A, 0.957%, 12/25/2046(b) | | | 231,918 | |
| | 885,484 | | | Wells Fargo Mortgage Backed Securities Trust, Series 2005-11, Class 2A3, 5.500%, 11/25/2035 | | | 894,471 | |
| | | | | | | | |
| | | | | | | 12,507,014 | |
| | | | | | | | |
| | | | ABS Other — 0.9% | |
| | 2,958,141 | | | Diamond Resorts Owner Trust, Series 2011-1, Class A, 4.000%, 3/20/2023, 144A | | | 2,988,102 | |
| | 1,302,086 | | | Sierra Receivables Funding Co.,, Series 2012-1A, Class A, 2.840%, 11/20/2028, 144A | | | 1,309,907 | |
| | | | | | | | |
| | | | | | | 4,298,009 | |
| | | | | | | | |
See accompanying notes to financial statements.
45 |
Portfolio of Investments – as of June 30, 2012 (Unaudited)
Loomis Sayles Absolute Strategies Fund – (continued)
| | | | | | | | |
Principal
Amount (‡) | | | Description | | Value (†) | |
| | | | | | | | |
| | | | Aerospace & Defense — 0.5% | | | | |
| $ | 2,250,000 | | | Meccanica Holdings USA, Inc., 6.250%, 1/15/2040, 144A | | $ | 1,700,352 | |
| | 800,000 | | | Meccanica Holdings USA, Inc., 7.375%, 7/15/2039, 144A | | | 648,610 | |
| | | | | | | | |
| | | | | | | 2,348,962 | |
| | | | | | | | |
| | | | Airlines — 1.9% | | | | |
| | 157,339 | | | Continental Airlines Pass Through Trust, Series 1999-1, Class B, 6.795%, 2/02/2020 | | | 155,766 | |
| | 5,160,000 | | | Doric Nimrod Air Finance Alpha Ltd., Pass Through Trust, Series 2012-1, Class A, 5.125%, 11/30/2024, 144A | | | 5,240,625 | |
| | 1,615,000 | | | US Airways Pass Through Trust, Series 2012-1A, Class A, 5.900%, 4/01/2026 | | | 1,653,356 | |
| | 1,948,193 | | | US Airways Pass Through Trust, Series 2011-1A, Class A, 7.125%, 4/22/2025 | | | 2,065,084 | |
| | | | | | | | |
| | | | | | | 9,114,831 | |
| | | | | | | | |
| | | | Automotive — 0.6% | | | | |
| | 3,000,000 | | | Ford Credit Canada Ltd., 4.875%, 3/17/2014, (CAD) | | | 3,024,045 | |
| | | | | | | | |
| | | | Banking — 4.9% | | | | |
| | 2,552,675 | | | Banco Votorantim S.A., 6.250%, 5/16/2016, 144A, (BRL) | | | 1,329,530 | |
| | 4,800,000 | | | Capital One Capital VI, 8.875%, 5/15/2040 | | | 4,878,000 | |
| | 5,145,000 | | | Cooperatieve Centrale Raiffeisen-Boerenleenbank BA/Utrect, 3.375%, 1/19/2017(c) | | | 5,295,167 | |
| | 4,735,000 | | | Lloyds TSB Bank PLC, EMTN, 6.500%, 3/24/2020, (EUR) | | | 5,216,996 | |
| | 2,200,000 | | | Merrill Lynch & Co., Inc., 6.875%, 11/15/2018 | | | 2,464,022 | |
| | 2,000,000 | | | Royal Bank of Scotland PLC (The), EMTN, 4.350%, 1/23/2017, (EUR) | | | 2,166,904 | |
| | 1,950,000 | | | Royal Bank of Scotland PLC (The), EMTN, 6.934%, 4/09/2018, (EUR) | | | 2,278,592 | |
| | | | | | | | |
| | | | | | | 23,629,211 | |
| | | | | | | | |
| | | | Building Materials — 0.5% | | | | |
| | 2,400,000 | | | Odebrecht Finance Ltd., 7.125%, 6/26/2042, 144A | | | 2,388,000 | |
| | | | | | | | |
| | | | Chemicals — 1.4% | | | | |
| | 2,980,000 | | | Hercules, Inc., 6.500%, 6/30/2029 | | | 2,443,600 | |
| | 950,000 | | | Ineos Group Holdings Ltd., 7.875%, 2/15/2016, 144A, (EUR) | | | 1,042,930 | |
| | 3,300,000 | | | Sinopec Group Overseas Development 2012 Ltd., 3.900%, 5/17/2022, 144A | | | 3,440,035 | |
| | | | | | | | |
| | | | | | | 6,926,565 | |
| | | | | | | | |
| | | | Collateralized Mortgage Obligations — 4.5% | | | | |
| | 1,912,986 | | | American Home Mortgage Investment Trust, Series 2005-2, Class 4A1, 2.237%, 9/25/2045(b) | | | 1,533,446 | |
| | 1,308,253 | | | American Home Mortgage Investment Trust, Series 2005-4, Class 1A1, 0.535%, 11/25/2045(b) | | | 824,966 | |
| | 643,640 | | | Banc of America Funding Corp., Series 2004-B, Class 4A2, 2.685%, 11/20/2034(b) | | | 491,640 | |
| | 739,890 | | | Banc of America Funding Corp., Series 2005-B, Class 3A1, 0.474%, 4/20/2035(b) | | | 568,533 | |
| | 1,576,884 | | | Bear Stearns Adjustable Rate Mortgage Trust, Series 2006-1, Class A1, 2.520%, 2/25/2036 | | | 1,352,024 | |
| | 705,465 | | | Bella Vista Mortgage Trust, Series 2005-1, Class 2A, 0.515%, 2/22/2035(b) | | | 443,384 | |
| | 1,073,295 | | | Countrywide Alternative Loan Trust, Series 2005-14, Class 2A1, 0.455%, 5/25/2035(b) | | | 619,291 | |
| | 2,077,200 | | | Countrywide Home Loan Mortgage Pass Through Trust, Series 2005-11, Class 3A3, 2.904%, 4/25/2035(b) | | | 978,569 | |
See accompanying notes to financial statements.
| 46
Portfolio of Investments – as of June 30, 2012 (Unaudited)
Loomis Sayles Absolute Strategies Fund – (continued)
| | | | | | | | |
Principal
Amount (‡) | | | Description | | Value (†) | |
| | | | | | | | |
| | | | Collateralized Mortgage Obligations — continued | | | | |
| $ | 2,877,693 | | | GSAA Home Equity Trust, Series 2006-20, Class 1A1, 0.315%, 12/25/2046(b) | | $ | 1,065,609 | |
| | 228,123 | | | Harborview Mortgage Loan Trust, Series 2004-11, Class 3A1A, 0.593%, 1/19/2035(b) | | | 143,330 | |
| | 175,093 | | | Harborview Mortgage Loan Trust, Series 2005-14, Class 2A1A, 3.057%, 12/19/2035(b) | | | 141,371 | |
| | 2,182,849 | | | Harborview Mortgage Loan Trust, Series 2005-14, Class 3A1A, 2.976%, 12/19/2035(b) | | | 1,530,788 | |
| | 2,743,572 | | | Impac Secured Assets CMN Owner Trust, Series 2007-2, Class 1A1A, 0.355%, 5/25/2037(b) | | | 1,420,622 | |
| | 1,411,392 | | | Indymac Index Mortgage Loan Trust, Series 2004-AR12, Class A1, 1.025%, 12/25/2034(b) | | | 858,266 | |
| | 1,130,145 | | | JPMorgan Alternative Loan Trust, Series 2006-A7, Class 1A1, 0.405%, 12/25/2036(b) | | | 546,086 | |
| | 1,107,310 | | | Lehman XS Trust, Series 2006-4N, Class A2A, 0.465%, 4/25/2046(b) | | | 535,188 | |
| | 2,380,820 | | | Lehman XS Trust, Series 2007-10H, Class 1A11, 0.365%, 7/25/2037(b)(d) | | | 1,115,652 | |
| | 760,580 | | | MASTR Adjustable Rate Mortgages Trust, Series 2007-1, Class I2A1, 0.405%, 1/25/2047(b) | | | 385,538 | |
| | 1,135,846 | | | MASTR Adjustable Rate Mortgages Trust, Series 2007-HF1, Class A1, 0.485%, 5/25/2037(b) | | | 537,255 | |
| | 1,764,706 | | | Morgan Stanley Mortgage Loan Trust, Series 2005-7, Class 4A2, 5.500%, 11/25/2035 | | | 1,592,545 | |
| | 2,800,000 | | | Morgan Stanley Mortgage Loan Trust, Series 2005-7, Class 7A5, 5.500%, 11/25/2035 | | | 2,630,995 | |
| | 387,231 | | | Provident Funding Mortgage Loan Trust, Series 2005-2, Class 2A1A, 2.939%, 10/25/2035(b) | | | 372,128 | |
| | 2,303,488 | | | Residential Accredit Loans, Inc., Series 2005-QA12, Class NB4, 4.097%, 12/25/2035(b) | | | 1,412,496 | |
| | 583,530 | | | WaMu Mortgage Pass Through Certificates, Series 2006-AR11, Class 2A, 2.640%, 9/25/2046(b) | | | 442,667 | |
| | | | | | | | |
| | | | | | | 21,542,389 | |
| | | | | | | | |
| | | | Commercial Mortgage-Backed Securities — 8.2% | | | | |
| | 1,329,067 | | | American Home Mortgage Investment Trust, Series 2005-2, Class 4A2, 2.237%, 9/25/2045(b) | | | 1,093,952 | |
| | 950,000 | | | Bear Stearns Commercial Mortgage Securities, Series 2003-PWR2, Class E, 5.811%, 5/11/2039, 144A(b) | | | 952,339 | |
| | 4,565,000 | | | CFCRE Commercial Mortgage Trust, Series 2011-C1, Class D, 5.550%, 4/15/2044, 144A(b) | | | 3,910,876 | |
| | 2,376,607 | | | CW Capital Cobalt Ltd., Series 2006-C1, Class AM, 5.254%, 8/15/2048 | | | 2,336,675 | |
| | 5,109,000 | | | DBUBS Mortgage Trust, Series 2011-LC1A, Class E,
5.557%, 11/10/2046, 144A(b) | | | 4,445,806 | |
| | 2,659,667 | | | GMAC Mortgage Corp. Loan Trust, Series 2005-AR3, Class 2A1, 3.156%, 6/19/2035(b) | | | 2,484,927 | |
| | 4,340,000 | | | GS Mortgage Securities Corp. II, Series 2007-GG10, Class AM, 5.790%, 8/10/2045(b) | | | 3,884,591 | |
| | 1,110,000 | | | JPMorgan Chase Commercial Mortgage Securities Corp., Series 2007-LDPX, Class AM, 5.464%, 1/15/2049 | | | 1,081,507 | |
See accompanying notes to financial statements.
47 |
Portfolio of Investments – as of June 30, 2012 (Unaudited)
Loomis Sayles Absolute Strategies Fund – (continued)
| | | | | | | | |
Principal
Amount (‡) | | | Description | | Value (†) | |
| | | | | | | | |
| | | | Commercial Mortgage-Backed Securities — 8.2% | | | | |
| $ | 4,060,000 | | | JPMorgan Chase Commercial Mortgage Securities Corp., Series 2010-C1, Class D,
6.313%, 6/15/2043, 144A(b) | | $ | 4,011,999 | |
| | 1,575,000 | | | Merrill Lynch/Countrywide Commercial Mortgage Trust, Series 2007-9, Class AM, 5.856%, 9/12/2049 | | | 1,444,299 | |
| | 1,300,000 | | | Morgan Stanley Capital I, Series 2011-C1, Class D, 5.254%, 9/15/2047, 144A(b) | | | 1,180,088 | |
| | 1,300,000 | | | Morgan Stanley Capital I, Series 2011-C1, Class E, 5.254%, 9/15/2047, 144A(b) | | | 1,059,281 | |
| | 2,125,000 | | | Morgan Stanley Capital I, Series 2011-C2, Class E, 5.318%, 6/15/2044, 144A(b) | | | 1,723,237 | |
| | 3,700,000 | | | Morgan Stanley Re-REMIC Trust, Series 2009-GG10, Class A4B, 5.790%, 8/12/2045, 144A(b)(c) | | | 3,842,206 | |
| | 1,000,000 | | | Morgan Stanley Re-REMIC Trust, Series 2010-GG10, Class A4B, 5.790%, 8/15/2045, 144A(b) | | | 1,038,434 | |
| | 5,400,000 | | | WF-RBS Commercial Mortgage Trust, Series 2011-C2, Class D, 5.465%, 2/15/2044, 144A(b) | | | 4,826,099 | |
| | | | | | | | |
| | | | | | | 39,316,316 | |
| | | | | | | | |
| | | | Consumer Products — 1.3% | | | | |
| | 4,625,000 | | | Procter & Gamble Co. (The), 0.386%, 2/06/2014(b)(c) | | | 4,628,686 | |
| | 1,555,000 | | | Visant Corp., 10.000%, 10/01/2017 | | | 1,543,338 | |
| | | | | | | | |
| | | | | | | 6,172,024 | |
| | | | | | | | |
| | | | Distributors — 0.4% | | | | |
| | 1,625,000 | | | China Resources Gas Group Ltd., 4.500%, 4/05/2022, 144A | | | 1,663,201 | |
| | | | | | | | |
| | | | Diversified Manufacturing — 2.5% | | | | |
| | 3,000,000 | | | Mcron Finance Sub LLC/Mcron Finance Corp., 8.375%, 5/15/2019, 144A | | | 2,970,000 | |
| | 5,905,000 | | | Textron Financial Corp., (fixed rate to 2/15/2017, variable rate thereafter), 6.000%, 2/15/2067, 144A | | | 4,605,900 | |
| | 4,500,000 | | | Votorantim Cimentos S.A., 7.250%, 4/05/2041, 144A | | | 4,500,000 | |
| | | | | | | | |
| | | | | | | 12,075,900 | |
| | | | | | | | |
| | | | Electric — 3.5% | | | | |
| | 1,200,000 | | | Centrais Eletricas Brasileiras S.A., 5.750%, 10/27/2021, 144A | | | 1,311,600 | |
| | 4,205,000 | | | Cia de Eletricidade do Estado da Bahia, 11.750%, 4/27/2016, 144A, (BRL) | | | 2,250,622 | |
| | 1,320,000 | | | EDP Finance BV, 6.000%, 2/02/2018, 144A | | | 1,148,293 | |
| | 4,700,000,000 | | | Empresas Publicas de Medellin E.S.P., 8.375%, 2/01/2021, 144A, (COP) | | | 2,852,726 | |
| | 1,800,000 | | | Enel Finance International NV, 6.000%, 10/07/2039, 144A | | | 1,413,104 | |
| | 800,000 | | | Enel Finance International NV, 6.800%, 9/15/2037, 144A | | | 692,121 | |
| | 4,455,000 | | | Energy Future Intermediate Holding Co. LLC/EFIH Finance, Inc., 11.750%, 3/01/2022, 144A | | | 4,555,238 | |
| | 2,565,000 | | | Ipalco Enterprises, Inc., 5.000%, 5/01/2018 | | | 2,597,063 | |
| | | | | | | | |
| | | | | | | 16,820,767 | |
| | | | | | | | |
| | | | Food & Beverage — 1.0% | | | | |
| | 4,600,000 | | | BRF - Brazil Foods S.A., 5.875%, 6/06/2022, 144A | | | 4,738,000 | |
| | | | | | | | |
| | | | Gaming — 1.1% | | | | |
| | 2,400,000 | | | Mandalay Resort Group, 7.625%, 7/15/2013 | | | 2,460,000 | |
| | 500,000 | | | MGM Resorts International, 6.875%, 4/01/2016 | | | 502,500 | |
| | 250,000 | | | MGM Resorts International, 7.500%, 6/01/2016 | | | 258,750 | |
See accompanying notes to financial statements.
| 48
Portfolio of Investments – as of June 30, 2012 (Unaudited)
Loomis Sayles Absolute Strategies Fund – (continued)
| | | | | | | | |
Principal
Amount (‡) | | | Description | | Value (†) | |
| | | | | | | | |
| | | | Gaming — continued | | | | |
| $ | 2,000,000 | | | MGM Resorts International, 7.625%, 1/15/2017 | | $ | 2,065,000 | |
| | | | | | | | |
| | | | | | | 5,286,250 | |
| | | | | | | | |
| | | | Government Owned - No Guarantee — 2.2% | | | | |
| | 4,320,000 | | | Petrobras International Finance Co., 5.375%, 1/27/2021 | | | 4,655,971 | |
| | 400,000 | | | Petrobras International Finance Co., 6.750%, 1/27/2041 | | | 469,194 | |
| | 700,000(††) | | | Petroleos Mexicanos, 7.650%, 11/24/2021, 144A, (MXN) | | | 5,605,373 | |
| | | | | | | | |
| | | | | | | 10,730,538 | |
| | | | | | | | |
| | | | Government Sponsored — 0.7% | | | | |
| | 2,275,000 | | | Eksportfinans ASA, 2.000%, 9/15/2015 | | | 2,036,002 | |
| | 1,410,000 | | | Eksportfinans ASA, EMTN, 2.250%, 2/11/2021, (CHF) | | | 1,143,866 | |
| | 55,000 | | | Eksportfinans ASA, 2.375%, 5/25/2016 | | | 48,888 | |
| | | | | | | | |
| | | | | | | 3,228,756 | |
| | | | | | | | |
| | | | Healthcare — 0.1% | | | | |
| | 450,000 | | | Owens & Minor, Inc., 6.350%, 4/15/2016(e) | | | 491,304 | |
| | | | | | | | |
| | | | Independent Energy — 2.7% | | | | |
| | 2,335,000 | | | Connacher Oil and Gas Ltd., 8.500%, 8/01/2019, 144A | | | 1,984,750 | |
| | 1,990,000 | | | Halcon Resource Corp., 9.750%, 7/15/2020, 144A | | | 1,963,056 | |
| | 2,560,000 | | | OGX Petroleo e Gas Participacoes S.A., 8.375%, 4/01/2022, 144A | | | 2,208,000 | |
| | 2,800,000 | | | OGX Petroleo e Gas Participacoes S.A., 8.500%, 6/01/2018, 144A | | | 2,492,000 | |
| | 1,300,000 | | | SandRidge Energy, Inc., 8.125%, 10/15/2022, 144A | | | 1,313,000 | |
| | 2,850,000 | | | Talisman Energy, Inc., 5.500%, 5/15/2042 | | | 2,927,440 | |
| | | | | | | | |
| | | | | | | 12,888,246 | |
| | | | | | | | |
| | | | Industrial Other — 1.7% | | | | |
| | 4,700,000 | | | Hutchison Whampoa International 11 Ltd., 4.625%, 1/13/2022, 144A | | | 4,926,878 | |
| | 3,250,000 | | | Steelcase, Inc., 6.375%, 2/15/2021 | | | 3,445,244 | |
| | | | | | | | |
| | | | | | | 8,372,122 | |
| | | | | | | | |
| | | | Life Insurance — 0.8% | | | | |
| | 3,300,000 | | | Metlife Capital Trust IV, 7.875%, 12/15/2067, 144A | | | 3,663,000 | |
| | | | | | | | |
| | | | Media Cable — 0.3% | | | | |
| | 1,500,000 | | | Shaw Communications, Inc., 6.750%, 11/09/2039, (CAD) | | | 1,552,554 | |
| | | | | | | | |
| | | | Media Non-Cable — 0.5% | | | | |
| | 230,000 | | | Clear Channel Worldwide Holdings, Inc., Series A, 7.625%, 3/15/2020, 144A | | | 220,225 | |
| | 910,000 | | | Clear Channel Worldwide Holdings, Inc., 7.625%, 3/15/2020, 144A | | | 889,525 | |
| | 1,145,000 | | | Intelsat Jackson Holdings S.A., 7.250%, 10/15/2020, 144A | | | 1,202,250 | |
| | | | | | | | |
| | | | | | | 2,312,000 | |
| | | | | | | | |
| | | | Metals & Mining — 1.7% | |
| | 4,875,000 | | | ArcelorMittal, 5.500%, 3/01/2021 | | | 4,614,270 | |
| | 2,400,000 | | | BHP Billiton Finance USA Ltd., 0.737%, 2/18/2014(b) | | | 2,408,268 | |
| | 1,360,000 | | | Vedanta Resources PLC, 8.250%, 6/07/2021, 144A | | | 1,268,200 | |
| | | | | | | | |
| | | | | | | 8,290,738 | |
| | | | | | | | |
| | | | Non-Captive Consumer — 0.5% | |
| | 2,225,000 | | | SLM Corp., MTN, 7.250%, 1/25/2022 | | | 2,352,937 | |
| | | | | | | | |
See accompanying notes to financial statements.
49 |
Portfolio of Investments – as of June 30, 2012 (Unaudited)
Loomis Sayles Absolute Strategies Fund – (continued)
| | | | | | | | |
Principal
Amount (‡) | | | Description | | Value (†) | |
| | | | | | | | |
| | | | Non-Captive Diversified — 2.7% | |
| $ | 2,340,000 | | | Air Lease Corp., 5.625%, 4/01/2017, 144A | | $ | 2,304,900 | |
| | 4,700,000 | | | General Electric Capital Corp., Series A, (fixed rate to 6/15/2022, variable rate thereafter), 7.125%, 12/15/2049 | | | 4,965,362 | |
| | 600,000 | | | GMAC International Finance BV, 7.500%, 4/21/2015, (EUR) | | | 791,570 | |
| | 2,375,000 | | | International Lease Finance Corp., 4.875%, 4/01/2015 | | | 2,386,754 | |
| | 2,210,000 | | | International Lease Finance Corp., 6.750%, 9/01/2016, 144A | | | 2,375,750 | |
| | | | | | | | |
| | | | | | | 12,824,336 | |
| | | | | | | | |
| | | | Oil Field Services — 1.7% | |
| | 2,970,000 | | | Global Geophysical Services, Inc., 10.500%, 5/01/2017 | | | 2,828,925 | |
| | 2,325,000 | | | Nabors Industries, Inc., 9.250%, 1/15/2019 | | | 3,018,589 | |
| | 2,500,000 | | | Schahin II Finance Co. SPV Ltd., 5.875%, 9/25/2023, 144A | | | 2,506,250 | |
| | | | | | | | |
| | | | | | | 8,353,764 | |
| | | | | | | | |
| | | | Paper — 1.0% | |
| | 2,400,000 | | | Celulosa Arauco y Constitucion S.A., 4.750%, 1/11/2022, 144A | | | 2,453,477 | |
| | 2,350,000 | | | Rock-Tenn Co., 4.450%, 3/01/2019, 144A | | | 2,413,899 | |
| | | | | | | | |
| | | | | | | 4,867,376 | |
| | | | | | | | |
| | | | Pharmaceuticals — 1.1% | |
| | 4,765,000 | | | Amgen, Inc., 5.375%, 5/15/2043(c) | | | 5,154,510 | |
| | | | | | | | |
| | | | Pipelines — 1.0% | |
| | 4,430,000 | | | Energy Transfer Partners LP, 6.500%, 2/01/2042 | | | 4,747,365 | |
| | | | | | | | |
| | | | Technology — 0.5% | |
| | 2,400,000 | | | BMC Software, Inc., 4.250%, 2/15/2022 | | | 2,401,783 | |
| | | | | | | | |
| | | | Treasuries — 8.1% | | | | |
| | 25,200,000 | | | Canadian Government, 1.750%, 3/01/2013, (CAD)(c) | | | 24,877,977 | |
| | 1,260,000(††) | | | Mexican Fixed Rate Bonds, Series M, 6.000%, 6/18/2015, (MXN) | | | 9,773,106 | |
| | 200,000(††) | | | Mexican Fixed Rate Bonds, Series MI-10, 8.000%, 12/19/2013, (MXN) | | | 1,570,614 | |
| | 325,500(††) | | | Mexican Fixed Rate Bonds, Series M-10, 8.500%, 12/13/2018, (MXN) | | | 2,898,335 | |
| | | | | | | | |
| | | | | | | 39,120,032 | |
| | | | | | | | |
| | | | Wireless — 1.9% | | | | |
| | 4,975,000 | | | Clearwire Communications LLC/Clearwire Finance, Inc., 12.000%, 12/01/2015, 144A | | | 4,527,250 | |
| | 4,700,000 | | | Telemar Norte Leste S.A., 5.500%, 10/23/2020, 144A | | | 4,794,000 | |
| | | | | | | | |
| | | | | | | 9,321,250 | |
| | | | | | | | |
| | | | Wirelines — 4.9% | | | | |
| | 1,275,000 | | | eAccess Ltd., 8.375%, 4/01/2018, 144A, (EUR) | | | 1,393,671 | |
| | 1,170,000 | | | Level 3 Financing, Inc., 8.625%, 7/15/2020 | | | 1,228,500 | |
| | 12,200,000 | | | Oi S.A., 9.750%, 9/15/2016, 144A, (BRL) | | | 6,362,709 | |
| | 7,534,000 | | | Qwest Corp., 7.200%, 11/10/2026 | | | 7,609,340 | |
| | 1,100,000 | | | Telecom Italia Capital S.A., 6.000%, 9/30/2034 | | | 844,250 | |
| | 850,000 | | | Telecom Italia Capital S.A., 7.200%, 7/18/2036 | | | 720,375 | |
| | 1,250,000 | | | Telecom Italia Capital S.A., 7.721%, 6/04/2038 | | | 1,093,750 | |
| | 250,000 | | | Telefonica Emisiones SAU, 5.134%, 4/27/2020 | | | 215,346 | |
| | 525,000 | | | Telefonica Emisiones SAU, 5.462%, 2/16/2021 | | | 457,166 | |
See accompanying notes to financial statements.
| 50
Portfolio of Investments – as of June 30, 2012 (Unaudited)
Loomis Sayles Absolute Strategies Fund – (continued)
| | | | | | | | |
Principal
Amount (‡) | | | Description | | Value (†) | |
| | | | | | | | |
| | | | Wirelines — continued | | | | |
| | 1,500,000 | | | Telefonica Emisiones SAU, EMTN, 5.597%, 3/12/2020, (GBP) | | $ | 2,023,257 | |
| | 2,000,000 | | | Telefonica Emisiones SAU, 7.045%, 6/20/2036 | | | 1,748,574 | |
| | | | | | | | |
| | | | | | | 23,696,938 | |
| | | | | | | | |
| | | | Total Non-Convertible Bonds
(Identified Cost $342,593,209) | | | 337,400,707 | |
| | | | | | | | |
| | | | | | | | |
| | Convertible Bonds — 2.7% | | | | |
| | | | Automotive — 0.7% | | | | |
| | 1,610,000 | | | Ford Motor Co., 4.250%, 11/15/2016 | | | 2,237,900 | |
| | 755,000 | | | TRW Automotive, Inc., 3.500%, 12/01/2015 | | | 1,098,525 | |
| | | | | | | | |
| | | | | | | 3,336,425 | |
| | | | | | | | |
| | | | Diversified Manufacturing — 0.2% | | | | |
| | 645,000 | | | EMC Corp., Series B, 1.750%, 12/01/2013 | | | 1,049,737 | |
| | | | | | | | |
| | | | Independent Energy — 0.1% | | | | |
| | 425,000 | | | Chesapeake Energy Corp., 2.750%, 11/15/2035 | | | 388,344 | |
| | | | | | | | |
| | | | Metals & Mining — 0.4% | | | | |
| | 2,515,000 | | | Peabody Energy Corp., 4.750%, 12/15/2066 | | | 2,040,294 | |
| | | | | | | | |
| | | | Pharmaceuticals — 0.4% | | | | |
| | 1,255,000 | | | Vertex Pharmaceuticals, Inc., 3.350%, 10/01/2015 | | | 1,639,344 | |
| | | | | | | | |
| | | | Technology — 0.9% | | | | |
| | 1,120,000 | | | Ciena Corp., 3.750%, 10/15/2018, 144A | | | 1,246,000 | |
| | 1,045,000 | | | Intel Corp., 3.250%, 8/01/2039 | | | 1,406,831 | |
| | 815,000 | | | Micron Technology, Inc., Series B, 1.875%, 8/01/2031, 144A | | | 728,406 | |
| | 905,000 | | | SanDisk Corp., 1.500%, 8/15/2017 | | | 931,019 | |
| | | | | | | | |
| | | | | | | 4,312,256 | |
| | | | | | | | |
| | | | Total Convertible Bonds
(Identified Cost $14,469,573) | | | 12,766,400 | |
| | | | | | | | |
| | | | Total Bonds and Notes
(Identified Cost $357,062,782) | | | 350,167,107 | |
| | | | | | | | |
| | | | | | | | |
| | Senior Loans — 7.8% | | | | |
| | | | Building Materials — 0.4% | | | | |
| | 925,900 | | | CPG International, Inc., New Term Loan B, 6.000%, 2/18/2017(b) | | | 886,549 | |
| | 1,217,597 | | | Nortek, Inc., Term Loan, 5.252%, 4/26/2017(f) | | | 1,214,554 | |
| | | | | | | | |
| | | | | | | 2,101,103 | |
| | | | | | | | |
| | | | Chemicals — 0.8% | | | | |
| | 957,600 | | | Ascend Performance Materials LLC, Term Loan B, 6.750%, 4/10/2018(b) | | | 929,667 | |
| | 1,180,000 | | | Kronos Worldwide, Inc., Term Loan B, 5.750%, 6/13/2018(b) | | | 1,177,050 | |
| | 1,197,000 | | | Taminco Global Chemical Corporation, Term Loan B1, 5.250%, 2/15/2019(b) | | | 1,191,015 | |
| | 502,452 | | | Univar, Inc., Term Loan B, 5.000%, 6/30/2017(b) | | | 492,458 | |
| | | | | | | | |
| | | | | | | 3,790,190 | |
| | | | | | | | |
See accompanying notes to financial statements.
51 |
Portfolio of Investments – as of June 30, 2012 (Unaudited)
Loomis Sayles Absolute Strategies Fund – (continued)
| | | | | | | | |
Principal
Amount (‡) | | | Description | | Value (†) | |
| | | | | | | | |
| | | | Consumer Cyclical Services — 0.2% | | | | |
| $ | 92,239 | | | Instant Web, Inc., Delayed Draw Term Loan, 3.620%, 8/07/2014(b) | | $ | 72,177 | |
| | 879,359 | | | Instant Web, Inc., Term Loan B, 3.620%, 8/07/2014(b) | | | 688,098 | |
| | | | | | | | |
| | | | | | | 760,275 | |
| | | | | | | | |
| | | | Consumer Products — 0.5% | | | | |
| | 1,220,000 | | | NBTY, Inc., Term Loan B1, 4.250%, 10/02/2017(b) | | | 1,217,218 | |
| | 1,500,000 | | | Visant Holding Corp., Term Loan B, 5.250%, 12/22/2016(b) | | | 1,451,250 | |
| | | | | | | | |
| | | | | | | 2,668,468 | |
| | | | | | | | |
| | | | Diversified Manufacturing — 0.2% | | | | |
| | 1,123,229 | | | Edwards (Cayman Islands II) Limited, Extended 1st Lien Term Loan,
5.500%, 5/31/2016(b) | | | 1,114,805 | |
| | | | | | | | |
| | | | Electric — 0.0% | |
| | 153,481 | | | AES Corporation, New Term Loan, 4.250%, 6/01/2018(b) | | | 153,314 | |
| | | | | | | | |
| | | | Financial Other — 0.3% | |
| | 1,291,406 | | | SS&C Technologies, Inc., Term Loan B-1, 5.000%, 6/07/2019(b) | | | 1,285,491 | |
| | 133,594 | | | SS&C Technologies, Inc., Term Loan B-2, 5.000%, 6/07/2019(b) | | | 132,982 | |
| | | | | | | | |
| | | | | | | 1,418,473 | |
| | | | | | | | |
| | | | Food & Beverage — 0.1% | |
| | 318,203 | | | DS Waters Enterprises, L.P., 1st Lien Term Loan, 10.500%, 8/29/2017(b) | | | 318,998 | |
| | | | | | | | |
| | | | Health Insurance — 0.1% | |
| | 479,433 | | | Multiplan, Inc., New Term Loan B, 4.750%, 8/26/2017(b) | | | 472,391 | |
| | | | | | | | |
| | | | Healthcare — 0.5% | |
| | 806,000 | | | Bausch & Lomb, Inc., Term Loan B, 5.250%, 5/17/2019(b) | | | 800,761 | |
| | 507,437 | | | Kindred Healthcare, Inc., Term Loan, 5.250%, 6/01/2018(b) | | | 480,797 | |
| | 885,000 | | | Thomas Reuter (Healthcare), Inc., Term Loan B, 6.750%, 6/06/2019(b) | | | 882,788 | |
| | 313,417 | | | TriZetto Group, Inc.(The), Term Loan B, 4.750%, 5/02/2018(b) | | | 305,738 | |
| | | | | | | | |
| | | | | | | 2,470,084 | |
| | | | | | | | |
| | | | Industrial Other — 0.4% | |
| | 1,027,000 | | | Generac Power Systems, Inc., New Term Loan B, 6.250%, 5/22/2018(b) | | | 1,021,865 | |
| | 779,048 | | | ON Assignment, Inc., Term Loan B, 5.000%, 5/15/2019(b) | | | 771,257 | |
| | | | | | | | |
| | | | | | | 1,793,122 | |
| | | | | | | | |
| | | | Media Cable — 0.2% | |
| | 1,187,025 | | | Cequel Communications LLC, Term Loan B, 4.000%, 2/14/2019(b) | | | 1,161,207 | |
| | | | | | | | |
| | | | Media Non-Cable — 0.3% | |
| | 2,370,000 | | | RBS International Direct Marketing, LLC, Term Loan B, 8.250%, 3/23/2017(b) | | | 1,422,000 | |
| | | | | | | | |
| | | | Metals & Mining — 0.5% | |
| | 2,464,000 | | | Arch Coal, Inc., Term Loan B, 5.750%, 5/16/2018(b) | | | 2,416,765 | |
| | | | | | | | |
| | | | Non-Captive Consumer — 0.1% | |
| | 243,000 | | | Chesapeake Energy Corporation, Unsecured Term Loan,
8.500%, 12/01/2017(b) | | | 240,847 | |
| | | | | | | | |
| | | | Packaging — 0.1% | |
| | 585,000 | | | TricorBraun, Inc., New Term Loan B, 5.500%, 5/03/2018(b) | | | 581,344 | |
| | | | | | | | |
See accompanying notes to financial statements.
| 52
Portfolio of Investments – as of June 30, 2012 (Unaudited)
Loomis Sayles Absolute Strategies Fund – (continued)
| | | | | | | | |
Principal
Amount (‡) | | | Description | | Value (†) | |
| | | | | | | | |
| | | | Pharmaceuticals — 0.7% | |
| $ | 1,053,141 | | | Grifols, Inc., New Term Loan B, 4.500%, 6/01/2017(b) | | $ | 1,041,673 | |
| | 1,220,879 | | | Quintiles Transnational Corp., New Term Loan B, 5.000%, 6/08/2018(b) | | | 1,205,606 | |
| | 1,040,000 | | | Valeant Pharmaceuticals International, Series A Tranche B, 4.750%, 2/13/2019(b) | | | 1,025,055 | |
| | | | | | | | |
| | | | 3,272,334 | |
| | | | | | | | |
| | | | Pipelines — 0.4% | |
| | 825,000 | | | Energy Transfer Equity, L.P., New Term Loan B, 3.750%, 3/24/2017(b) | | | 808,649 | |
| | 1,230,000 | | | NGPL PipeCo LLC, Term Loan B, 6.750%, 9/15/2017(b) | | | 1,204,379 | |
| | | | | | | | |
| | | | 2,013,028 | |
| | | | | | | | |
| | | | Property & Casualty Insurance — 0.2% | |
| | 410,000 | | | AmWINS Group, Inc., New 2nd Lien Term Loan, 9.250%, 12/06/2019(b) | | | 402,312 | |
| | 517,703 | | | Applied Systems, Inc., Incremental Term Loan A, 5.500%, 12/08/2016(b) | | | 513,173 | |
| | | | | | | | |
| | | | 915,485 | |
| | | | | | | | |
| | | | Restaurants — 0.1% | |
| | 262,000 | | | P.F. Chang’s China Bistro, Inc., Term Loan B, 7/02/2019(g) | | | 262,165 | |
| | | | | | | | |
| | | | Retailers — 0.4% | |
| | 695,000 | | | Ascena Retail Group, Inc., Term Loan B, 4.750%, 6/14/2018(b) | | | 694,131 | |
| | 1,210,000 | | | Harbor Freight Tools USA, Inc., Term Loan B, 5.500%, 11/14/2017(b) | | | 1,203,950 | |
| | | | | | | | |
| | | | 1,898,081 | |
| | | | | | | | |
| | | | Technology — 0.7% | |
| | 1,225,596 | | | Blackboard, Inc., Term Loan B, 7.500%, 10/04/2018(b) | | | 1,185,764 | |
| | 1,198,945 | | | Eagle Parent, Inc., New Term Loan, 5.000%, 5/16/2018(b) | | | 1,181,260 | |
| | 442,775 | | | Kronos, Inc., Tranche C Term Loan, 6.250%, 12/28/2017(b) | | | 442,314 | |
| | 448,875 | | | Nxp B.V., Incremental Term Loan B, 5.250%, 3/19/2019(b) | | | 446,070 | |
| | | | | | | | |
| | | | 3,255,408 | |
| | | | | | | | |
| | | | Wireless — 0.2% | |
| | 1,233,748 | | | MetroPCS Wireless, Inc., Incremental Term Loan B3, 4.000%, 3/16/2018(b) | | | 1,203,484 | |
| | | | | | | | |
| | | | Wirelines — 0.4% | |
| | 725,000 | | | Level 3 Financing, Inc., Term Loan B3, 5.750%, 8/31/2018(g) | | | 724,319 | |
| | 1,013,000 | | | Zayo Bandwidth LLC, Term Loan B, 7/02/2019(g) | | | 1,015,350 | |
| | | | | | | | |
| | | | 1,739,669 | |
| | | | | | | | |
| | | | Total Senior Loans
(Identified Cost $38,430,012) | | | 37,443,040 | |
| | | | | | | | |
| | | | | | | | |
| Shares | | | | | | |
| | Common Stocks — 4.6% | | | | |
| | | | Chemicals — 0.2% | |
| | 35,700 | | | Dow Chemical Co. (The) | | | 1,124,550 | |
| | | | | | | | |
| | | | Diversified Financial Services — 0.2% | |
| | 27,800 | | | JPMorgan Chase & Co. | | | 993,294 | |
| | | | | | | | |
| | | | Diversified Telecommunication Services — 1.7% | | | | |
| | 112,480 | | | AT&T, Inc. | | | 4,011,037 | |
| | 46,900 | | | Deutsche Telekom AG, Sponsored ADR | | | 512,711 | |
See accompanying notes to financial statements.
53 |
Portfolio of Investments – as of June 30, 2012 (Unaudited)
Loomis Sayles Absolute Strategies Fund – (continued)
| | | | | | | | |
Shares | | | Description | | Value (†) | |
| | | | | | | | |
| | | | Diversified Telecommunication Services — continued | | | | |
| | 111,203 | | | Telefonica S.A., Sponsored ADR | | $ | 1,456,759 | |
| | 52,213 | | | Verizon Communications, Inc. | | | 2,320,345 | |
| | | | | | | | |
| | | | | | | 8,300,852 | |
| | | | | | | | |
| | | | Metals & Mining — 0.2% | | | | |
| | 10,935 | | | Barrick Gold Corp. | | | 410,828 | |
| | 8,416 | | | Goldcorp, Inc. | | | 316,273 | |
| | 6,635 | | | Newmont Mining Corp. | | | 321,864 | |
| | | | | | | | |
| | | | | | | 1,048,965 | |
| | | | | | | | |
| | | | Oil, Gas & Consumable Fuels — 1.2% | | | | |
| | 11,400 | | | Chevron Corp. | | | 1,202,700 | |
| | 17,200 | | | ExxonMobil Corp. | | | 1,471,804 | |
| | 21,700 | | | Royal Dutch Shell PLC, ADR | | | 1,463,231 | |
| | 33,125 | | | Total S.A., Sponsored ADR | | | 1,488,969 | |
| | | | | | | | |
| | | | | | | 5,626,704 | |
| | | | | | | | |
| | | | Paper & Forest Products — 0.1% | | | | |
| | 14,100 | | | International Paper Co. | | | 407,631 | |
| | | | | | | | |
| | | | Pharmaceuticals — 0.2% | | | | |
| | 15,000 | | | Bristol-Myers Squibb Co. | | | 539,250 | |
| | 10,500 | | | GlaxoSmithKline PLC, Sponsored ADR | | | 478,485 | |
| | | | | | | | |
| | | | | | | 1,017,735 | |
| | | | | | | | |
| | | | Tobacco — 0.6% | | | | |
| | 57,114 | | | Altria Group, Inc. | | | 1,973,289 | |
| | 7,500 | | | Philip Morris International, Inc. | | | 654,450 | |
| | | | | | | | |
| | | | | | | 2,627,739 | |
| | | | | | | | |
| | | | Wireless Telecommunication Services — 0.2% | | | | |
| | 37,300 | | | Vodafone Group PLC, Sponsored ADR | | | 1,051,114 | |
| | | | | | | | |
| | | | Total Common Stocks
(Identified Cost $21,505,551) | | | 22,198,584 | |
| | | | | | | | |
| | | | | | | | |
| | Preferred Stocks — 2.1% | | | | |
| | Convertible Preferred Stocks — 1.1% | | | | |
| | | | Automotive — 0.5% | | | | |
| | 72,200 | | | General Motors Co., Series B, 4.750% | | | 2,397,040 | |
| | | | | | | | |
| | | | Banking — 0.5% | | | | |
| | 2,240 | | | Wells Fargo & Co., Series L, Class A, 7.500% | | | 2,520,000 | |
| | | | | | | | |
| | | | REITs - Shopping Centers — 0.1% | | | | |
| | 8,000 | | | Health Care REIT, Inc., Series I, 6.500% | | | 432,000 | |
| | | | | | | | |
| | | | Total Convertible Preferred Stocks
(Identified Cost $6,386,592) | | | 5,349,040 | |
| | | | | | | | |
See accompanying notes to financial statements.
| 54
Portfolio of Investments – as of June 30, 2012 (Unaudited)
Loomis Sayles Absolute Strategies Fund – (continued)
| | | | | | | | |
Shares | | | Description | | Value (†) | |
| | | | | | | | |
| | Non-Convertible Preferred Stocks — 1.0% | | | | |
| | | | Non-Captive Diversified — 1.0% | | | | |
| | 2,590 | | | Ally Financial, Inc., Series G, 7.000%, 144A | | $ | 2,307,447 | |
| | 102,000 | | | Montpelier Re Holdings Ltd., 8.875% | | | 2,764,200 | |
| | | | | | | | |
| | | | | | | 5,071,647 | |
| | | | | | | | |
| | | | Total Non-Convertible Preferred Stocks
(Identified Cost $4,809,600) | | | 5,071,647 | |
| | | | | | | | |
| | | | Total Preferred Stocks
(Identified Cost $11,196,192) | | | 10,420,687 | |
| | | | | | | | |
| | | | | | | | |
| | Purchased Options — 0.1% | | | | |
| | | | Options on Securities — 0.1% | | | | |
| | 600,000 | | | Industrial Select Sector SPDR® Fund Put, expiring September 22, 2012 at 33 (Identified Cost $1,171,650) | | | 393,000 | |
| | | | | | | | |
| | | | | | | | |
Principal
Amount (‡) | | | | | | |
| | Short-Term Investments — 10.4% | | | | |
| $ | 34,993,465 | | | Tri-Party Repurchase Agreement with Fixed Income Clearing Corporation, dated 6/29/2012 at 0.000% to be repurchased at $34,993,465 on 7/02/2012 collateralized by $35,660,000 Federal National Mortgage Association 0.375% due 12/28/2012 valued at $35,695,660 including accrued interest (Note 2 of Notes to Financial Statements) | | | 34,993,465 | |
| | 15,000,000 | | | U.S. Treasury Bill, 0.148%, 9/20/2012(h)(i) | | | 14,997,585 | |
| | | | | | | | |
| | | | Total Short-Term Investments
(Identified Cost $49,988,487) | | | 49,991,050 | |
| | | | | | | | |
| | | | | | | | |
| | | | Total Investments — 97.8%
(Identified Cost $479,354,674)(a) | | | 470,613,468 | |
| | | | Other assets less liabilities — 2.2% | | | 10,417,730 | |
| | | | | | | | |
| | | | Net Assets — 100.0% | | $ | 481,031,198 | |
| | | | | | | | |
| | (‡) | | | Principal Amount stated in U.S. dollars unless otherwise noted. | | | | |
| | (†) | | | See Note 2 of Notes to Financial Statements. | | | | |
| | (††) | | | Amount shown represents units. One unit represents a principal amount of 100. | | | | |
| | (a) | | | Federal Tax Information (Amounts exclude certain adjustments made at the end of the Fund’s fiscal year for tax purposes. Such adjustments are primarily due to wash sales. Amortization of premium on debt securities is excluded for tax purposes.): | | | | |
| | | | At June 30, 2012, the net unrealized depreciation on investments based on a cost of $480,375,098 for federal income tax purposes was as follows: | | | | |
| | | | Aggregate gross unrealized appreciation for all investments in which there is an excess of value over tax cost | | $ | 9,056,487 | |
| | | | Aggregate gross unrealized depreciation for all investments in which there is an excess of tax cost over value | | | (18,818,117 | ) |
| | | | | | | | |
| | | | Net unrealized depreciation | | $ | (9,761,630 | ) |
| | | | | | | | |
See accompanying notes to financial statements.
55 |
Portfolio of Investments – as of June 30, 2012 (Unaudited)
Loomis Sayles Absolute Strategies Fund – (continued)
| | | | | | |
| | | | | | |
| | | | | | |
| | (b) | | | Variable rate security. Rate as of June 30, 2012 is disclosed. | | |
| | (c) | | | All or a portion of this security has been designated to cover the Fund’s obligations under open forward foreign currency contracts, futures contracts or swap agreements. | | |
| | (d) | | | The issuer is making partial payment with respect to interest and/or principal. Income is not being accrued. | | |
| | (e) | | | Illiquid security. At June 30, 2012, the value of this security amounted to $491,304 or 0.1% of net assets. | | |
| | (f) | | | Variable rate security. Rate shown represents the weighted average rate of underlying contracts at June 30, 2012. | | |
| | (g) | | | Position is unsettled. Contract rate was not determined at June 30, 2012 and does not take effect until settlement date. | | |
| | (h) | | | Interest rate represents discount rate at time of purchase; not a coupon rate. | | |
| | (i) | | | A portion of this security has been pledged as collateral for open forward foreign currency contracts and swap agreements and as initial margin for open futures contracts. | | |
| | | | | | |
| | 144A | | | All or a portion of these securities are exempt from registration under Rule 144A of the Securities Act of 1933. These securities may be resold in transactions exempt from registration, normally to qualified institutional buyers. At June 30, 2012, the value of Rule 144A holdings amounted to $142,108,951 or 29.5% of net assets. | | |
| | ADR | | | An American Depositary Receipt is a certificate issued by a custodian bank representing the right to receive securities of the foreign issuer described. The values of ADRs may be significantly influenced by trading on exchanges not located in the United States. | | |
| | | | | | |
| | ABS | | | Asset-Backed Securities | | |
| | EMTN | | | Euro Medium Term Note | | |
| | MTN | | | Medium Term Note | | |
| | REITs | | | Real Estate Investment Trusts | | |
| | REMIC | | | Real Estate Mortgage Investment Conduit | | |
| | SPDR | | | Standard & Poor’s Depositary Receipt | | |
| | | | | | |
| | BRL | | | Brazilian Real | | |
| | CAD | | | Canadian Dollar | | |
| | CHF | | | Swiss Franc | | |
| | COP | | | Colombian Peso | | |
| | EUR | | | Euro | | |
| | GBP | | | British Pound | | |
| | MXN | | | Mexican Peso | | |
See accompanying notes to financial statements.
| 56
Portfolio of Investments – as of June 30, 2012 (Unaudited)
Loomis Sayles Absolute Strategies Fund – (continued)
At June 30, 2012, the Fund had the following open credit default swap agreements:
| | | | | | | | | | | | | | | | | | | | | | | | | | | | |
| Counterparty | | Reference
Obligation | | (Pay)/
Receive
Fixed Rate | | Expiration
Date | | | Notional
Value(‡) | | | Unamortized
Up Front
Premium
Paid/
(Received) | | | Market
Value | | | Unrealized
Appreciation
(Depreciation) | | | Fees
Receivable/
(Payable) | |
Buy Protection | |
| Bank of America, N.A | | Republic of Turkey | | (1.00%) | | | 6/20/2017 | | | $ | 4,800,000 | | | $ | 323,726 | | | $ | 304,496 | | | $ | (19,230 | ) | | $ | (1,467 | ) |
| Bank of America, N.A. | | Bank of Scotland PLC | | (1.00%) | | | 6/20/2017 | | | | 4,475,000 | * | | | 221,532 | | | | 169,620 | | | | (51,912 | ) | | | (1,730 | ) |
| Bank of America, N.A. | | Belgium Kingdom | | (1.00%) | | | 6/20/2017 | | | | 9,400,000 | | | | 746,607 | | | | 573,613 | | | | (172,994 | ) | | | (2,872 | ) |
| Bank of America, N.A. | | Carnival Corp. | | (1.00%) | | | 6/20/2017 | | | | 4,700,000 | | | | 114,360 | | | | 32,844 | | | | (81,516 | ) | | | (1,436 | ) |
| Bank of America, N.A. | | CDX 18 HY 500 | | (5.00%) | | | 6/20/2017 | | | | 4,752,000 | | | | 127,022 | | | | 168,403 | | | | 41,381 | | | | (7,260 | ) |
| Bank of America, N.A. | | CDX 18 HY 500 | | (5.00%) | | | 6/20/2017 | | | | 4,653,000 | | | | 310,766 | | | | 164,894 | | | | (145,872 | ) | | | (7,109 | ) |
| Bank of America, N.A. | | CDX 18 HY 500 | | (5.00%) | | | 6/20/2017 | | | | 4,752,000 | | | | 327,874 | | | | 168,403 | | | | (159,471 | ) | | | (7,260 | ) |
| Bank of America, N.A. | | CDX 18 HY 500 | | (5.00%) | | | 6/20/2017 | | | | 4,653,000 | | | | 284,757 | | | | 164,894 | | | | (119,863 | ) | | | (7,109 | ) |
| Bank of America, N.A. | | CDX 18 IG 100 | | (1.00%) | | | 6/20/2017 | | | | 5,300,000 | | | | 6,216 | | | | 31,813 | | | | 25,597 | | | | (1,619 | ) |
| Bank of America, N.A. | | CDX 18 IG 100 | | (1.00%) | | | 6/20/2017 | | | | 4,700,000 | | | | 50,524 | | | | 28,212 | | | | (22,312 | ) | | | (1,436 | ) |
| Bank of America, N.A. | | CDX 18 IG 100 | | (1.00%) | | | 6/20/2017 | | | | 4,700,000 | | | | 45,692 | | | | 28,212 | | | | (17,480 | ) | | | (1,436 | ) |
| Bank of America, N.A. | | ITRX EUR Xover Series 17 500 | | (5.00%) | | | 6/20/2017 | | | | 3,800,000 | * | | | 375,272 | | | | 292,441 | | | | (82,831 | ) | | | (7,347 | ) |
| Bank of America, N.A. | | ITRX EUR Xover Series 17 500 | | (5.00%) | | | 6/20/2017 | | | | 3,800,000 | * | | | 380,175 | | | | 292,441 | | | | (87,734 | ) | | | (7,347 | ) |
| Bank of America, N.A. | | NRG Energy, Inc. | | (5.00%) | | | 6/20/2017 | | | | 2,725,000 | | | | 189,484 | | | | 76,459 | | | | (113,025 | ) | | | (4,163 | ) |
| Bank of America, N.A. | | Republic of South Africa | | (1.00%) | | | 6/20/2017 | | | | 9,400,000 | | | | 419,488 | | | | 261,936 | | | | (157,552 | ) | | | (2,872 | ) |
| Bank of America, N.A. | | Republic of Turkey | | (1.00%) | | | 3/20/2017 | | | | 4,800,000 | | | | 306,305 | | | | 279,079 | | | | (27,226 | ) | | | (1,467 | ) |
| Bank of America, N.A. | | Republic of Turkey | | (1.00%) | | | 3/20/2017 | | | | 4,800,000 | | | | 259,704 | | | | 279,079 | | | | 19,375 | | | | (1,467 | ) |
| Bank of America, N.A. | | Sprint Nextel Corp. | | (5.00%) | | | 3/20/2015 | | | | 2,400,000 | | | | 115,466 | | | | (9,216 | ) | | | (124,682 | ) | | | (3,667 | ) |
| Bank of America, N.A. | | Textron Financial Corp. | | (1.00%) | | | 3/20/2017 | | | | 975,000 | | | | (28,270 | ) | | | (21,643 | ) | | | 6,627 | | | | (298 | ) |
| Bank of America, N.A. | | Textron Financial Corp. | | (1.00%) | | | 6/20/2017 | | | | 1,250,000 | | | | (36,727 | ) | | | (26,440 | ) | | | 10,287 | | | | (382 | ) |
| Bank of America, N.A. | | Westvaco Corp. | | (1.00%) | | | 9/20/2016 | | | | 6,300,000 | | | | 197,999 | | | | 28,698 | | | | (169,301 | ) | | | (1,925 | ) |
| Citibank, N.A. | | Bundesrepublik Deutschland | | (0.25%) | | | 9/20/2017 | | | | 4,700,000 | | | | 182,296 | | | | 180,810 | | | | (1,486 | ) | | | (359 | ) |
| Citibank, N.A. | | Government of France | | (0.25%) | | | 9/20/2017 | | | | 4,700,000 | | | | 396,420 | | | | 374,817 | | | | (21,603 | ) | | | (359 | ) |
| Citibank, N.A. | | NRG Energy, Inc. | | (5.00%) | | | 6/20/2017 | | | | 1,975,000 | | | | 137,333 | | | | 55,416 | | | | (81,917 | ) | | | (3,017 | ) |
| Credit Suisse International | | Darden Restaurants, Inc. | | (1.00%) | | | 6/20/2017 | | | | 2,400,000 | | | | 30,592 | | | | 16,630 | | | | (13,962 | ) | | | (733 | ) |
| Credit Suisse International | | Dillards, Inc. | | (5.00%) | | | 9/20/2017 | | | | 2,950,000 | | | | (275,111 | ) | | | (299,182 | ) | | | (24,071 | ) | | | (5,326 | ) |
| Credit Suisse International | | Dillards, Inc. | | (5.00%) | | | 9/20/2017 | | | | 1,750,000 | | | | (171,653 | ) | | | (171,653 | ) | | | — | | | | (3,646 | ) |
| Credit Suisse International | | Macy’s Retail Holdings, Inc. | | (1.00%) | | | 3/20/2017 | | | $ | 4,800,000 | | | | 21,699 | | | | 82,145 | | | | 60,446 | | | | (1,467 | ) |
| Credit Suisse International | | Seagate Technology HDD Holdings | | (5.00%) | | | 6/20/2017 | | | | 2,350,000 | | | | (220,119 | ) | | | (230,017 | ) | | | (9,898 | ) | | | (3,590 | ) |
| Credit Suisse International | | Sprint Nextel Corp. | | (5.00%) | | | 6/20/2015 | | | | 2,400,000 | | | | 88,502 | | | | 6,493 | | | | (82,009 | ) | | | (3,667 | ) |
| JP Morgan Chase Bank, N.A. | | Macy’s Retail Holdings, Inc. | | (1.00%) | | | 3/20/2017 | | | | 9,500,000 | | | | (7,565 | ) | | | 162,578 | | | | 170,143 | | | | (2,903 | ) |
See accompanying notes to financial statements.
57 |
Portfolio of Investments – as of June 30, 2012 (Unaudited)
Loomis Sayles Absolute Strategies Fund – (continued)
| | | | | | | | | | | | | | | | | | | | | | | | | | | | |
| Counterparty | | Reference
Obligation | | (Pay)/
Receive
Fixed Rate | | Expiration
Date | | | Notional
Value(‡) | | | Unamortized
Up Front
Premium
Paid/
(Received) | | | Market
Value | | | Unrealized
Appreciation
(Depreciation) | | | Fees
Receivable/
(Payable) | |
Buy Protection — continued | |
| Morgan Stanley Capital Services Inc. | | CDX 18 IG 100 | | (1.00%) | | | 6/20/2017 | | | $ | 4,300,000 | | | $ | 8,092 | | | $ | 25,810 | | | $ | 17,718 | | | $ | (1,314 | ) |
| Morgan Stanley Capital Services Inc. | | New York Times Co. | | (1.00%) | | | 6/20/2017 | | | | 4,800,000 | | | | 397,219 | | | | 400,462 | | | | 3,243 | | | | (1,467 | ) |
| Morgan Stanley Capital Services Inc. | | Textron Financial Corp. | | (1.00%) | | | 3/20/2017 | | | | 2,000,000 | | | | (55,109 | ) | | | (44,396 | ) | | | 10,713 | | | | (611 | ) |
| Morgan Stanley Capital Services Inc. | | Textron Financial Corp. | | (1.00%) | | | 3/20/2017 | | | | 1,300,000 | | | | (35,907 | ) | | | (28,857 | ) | | | 7,050 | | | | (397 | ) |
| | | | | | | | | | | | | | | | | | | | | | | | | | | | |
| Total | | | | | | | | | | | | | | | | | | $ | 3,819,294 | | | $ | (1,415,367 | ) | | $ | (100,525 | ) |
| | | | | | | | | | | | | | | | | | | | | | | | | | | | |
| | | | | | | | | | | | | | | | | | | | | | | | | | | | | | | | |
| Counterparty | | Reference
Obligation | | (Pay)/
Receive
Fixed Rate | | Expiration
Date | | | Implied
Credit
Spread^ | | | Notional
Value(‡) | | | Unamortized
Up Front
Premium
Paid/(Received) | | | Market
Value | | | Unrealized
Appreciation
(Depreciation) | | | Fees
Receivable/
(Payable) | |
| Sell Protection | | | | | | | | | | | | | | | | | | | | | | | | | |
| Bank of America, N.A. | | Chesapeake Energy Corp. | | 5.00% | | | 6/20/2017 | | | | 6.95 | % | | $ | 2,250,000 | | | $ | (108,296 | ) | | $ | (162,097 | ) | | $ | (53,801 | ) | | $ | 3,437 | |
| Bank of America, N.A. | | Chesapeake Energy Corp. | | 5.00% | | | 6/20/2017 | | | | 6.95 | % | | | 650,000 | | | | (46,090 | ) | | | (46,829 | ) | | | (739 | ) | | | 993 | |
| Citibank, N.A. | | MGM Resorts International | | 5.00% | | | 9/20/2016 | | | | 6.51 | % | | | 3,200,000 | | | | (436,822 | ) | | | (174,904 | ) | | | 261,918 | | | | 4,889 | |
| Credit Suisse International | | Chesapeake Energy Corp. | | 5.00% | | | 6/20/2017 | | | | 6.95 | % | | | 850,000 | | | | (41,597 | ) | | | (61,237 | ) | | | (19,640 | ) | | | 1,299 | |
| Credit Suisse International | | Chesapeake Energy Corp. | | 5.00% | | | 6/20/2017 | | | | 6.95 | % | | | 1,750,000 | | | | (119,841 | ) | | | (126,076 | ) | | | (6,235 | ) | | | 2,674 | |
| Credit Suisse International | | EDP Finance BV | | 5.00% | | | 6/20/2017 | | | | 8.31 | % | | | 1,900,000 | * | | | (355,842 | ) | | | (407,301 | ) | | | (51,459 | ) | | | 3,673 | |
| Credit Suisse International | | Freescale Semiconductor | | 5.00% | | | 9/20/2017 | | | | 8.39 | % | | | 2,400,000 | | | | (336,275 | ) | | | (331,490 | ) | | | 4,785 | | | | 3,667 | |
| Deutsche Bank AG | | Alcatel-Lucent | | 5.00% | | | 9/20/2016 | | | | 12.75 | % | | | 4,400,000 | * | | | (467,144 | ) | | | (1,265,483 | ) | | | (798,339 | ) | | | 8,507 | |
| Morgan Stanley Capital Services Inc. | | Alcatel-Lucent | | 5.00% | | | 9/20/2016 | | | | 12.75 | % | | | 3,800,000 | * | | | (1,245 | ) | | | (1,092,918 | ) | | | (1,091,673 | ) | | | 7,347 | |
| UBS AG | | Alcatel-Lucent | | 5.00% | | | 6/20/2016 | | | | 12.65 | % | | | 2,700,000 | * | | | 69,324 | | | | (742,298 | ) | | | (811,622 | ) | | | 5,220 | |
| | | | | | | | | | | | | | | | | | | | | | | | | | | | | | | | |
| Total | | | | | | | | | | | | | | | | | | | | | | $ | (4,410,633 | ) | | $ | (2,566,805 | ) | | $ | 41,706 | |
| | | | | | | | | | | | | | | | | | | | | | | | | | | | | | | | |
See accompanying notes to financial statements.
| 58
Portfolio of Investments – as of June 30, 2012 (Unaudited)
Loomis Sayles Absolute Strategies Fund – (continued)
(‡) Notional value stated in U.S. dollars unless otherwise noted.
* Notional value denominated in euros.
^ Implied credit spreads, represented in absolute terms, serve as an indicator of the current status of the payment/performance risk and represent the likelihood or risk of default for the credit derivative. The implied credit spread of a particular reference entity reflects the cost of buying/selling protection and may include upfront payments required to be made to enter into the agreement. Wider credit spreads represent a deterioration of the reference entity’s credit soundness and a greater likelihood or risk of default or other credit event occurring as defined under the terms of the agreement.
At June 30, 2012, the Fund had the following open forward foreign currency contracts:
| | | | | | | | | | | | | | | | | | |
Contract
to
Buy/Sell | | Delivery
Date | | | Currency | | Units | | | Notional
Value | | | Unrealized
Appreciation
(Depreciation) | |
| Buy1 | | | 11/05/2012 | | | Brazilian Real | | | 7,250,000 | | | $ | 3,535,320 | | | $ | (117,993 | ) |
| Sell1 | | | 11/05/2012 | | | Brazilian Real | | | 7,250,000 | | | | 3,535,320 | | | | (76,351 | ) |
| Buy1 | | | 8/02/2012 | | | British Pound | | | 3,785,000 | | | | 5,927,442 | | | | (184,689 | ) |
| Sell1 | | | 8/02/2012 | | | British Pound | | | 3,785,000 | | | | 5,927,442 | | | | 219,701 | |
| Sell1 | | | 9/04/2012 | | | British Pound | | | 1,495,000 | | | | 2,341,007 | | | | (20,171 | ) |
| Buy1 | | | 7/23/2012 | | | Canadian Dollar | | | 4,800,000 | | | | 4,712,604 | | | | 3,490 | |
| Sell1 | | | 7/23/2012 | | | Canadian Dollar | | | 20,385,000 | | | | 20,013,840 | | | | (22,666 | ) |
| Buy1 | | | 7/05/2012 | | | Columbian Peso | | | 8,650,000,000 | | | | 4,851,442 | | | | 64,502 | |
| Sell1 | | | 7/05/2012 | | | Columbian Peso | | | 8,650,000,000 | | | | 4,851,442 | | | | (168,172 | ) |
| Sell1 | | | 7/27/2012 | | | Columbian Peso | | | 5,245,000,000 | | | | 2,928,164 | | | | (15,731 | ) |
| Sell1 | | | 8/03/2012 | | | Columbian Peso | | | 8,550,000,000 | | | | 4,766,285 | | | | (63,314 | ) |
| Sell1 | | | 8/06/2012 | | | Columbian Peso | | | 8,650,000,000 | | | | 4,819,009 | | | | (61,033 | ) |
| Buy1 | | | 7/02/2012 | | | Euro | | | 7,600,000 | | | | 9,617,794 | | | | 170,234 | |
| Buy2 | | | 7/03/2012 | | | Euro | | | 900,000 | | | | 1,138,949 | | | | 14,016 | |
| Buy1 | | | 7/31/2012 | | | Euro | | | 725,000 | | | | 917,690 | | | | (10,020 | ) |
| Sell1 | | | 7/02/2012 | | | Euro | | | 7,600,000 | | | | 9,617,794 | | | | (198,202 | ) |
| Sell2 | | | 7/03/2012 | | | Euro | | | 900,000 | | | | 1,138,949 | | | | (10,862 | ) |
| Sell1 | | | 7/05/2012 | | | Euro | | | 7,600,000 | | | | 9,617,946 | | | | (197,974 | ) |
| Sell1 | | | 7/09/2012 | | | Euro | | | 3,970,000 | | | | 5,024,270 | | | | (73,799 | ) |
| Sell1 | | | 7/17/2012 | | | Euro | | | 1,135,000 | | | | 1,436,500 | | | | (9,510 | ) |
| Sell1 | | | 7/18/2012 | | | Euro | | | 3,645,000 | | | | 4,613,291 | | | | (19,523 | ) |
| Sell1 | | | 7/26/2012 | | | Euro | | | 620,000 | | | | 784,752 | | | | (6,799 | ) |
| Sell1 | | | 7/31/2012 | | | Euro | | | 725,000 | | | | 917,690 | | | | 34,380 | |
| Sell1 | | | 8/02/2012 | | | Euro | | | 7,600,000 | | | | 9,620,074 | | | | (170,234 | ) |
| Sell1 | | | 9/07/2012 | | | Euro | | | 900,000 | | | | 1,139,652 | | | | (14,058 | ) |
| Buy2 | | | 7/06/2012 | | | Mexican Peso | | | 220,500,000 | | | | 16,524,752 | | | | 1,177,844 | |
| Sell2 | | | 7/06/2012 | | | Mexican Peso | | | 220,500,000 | | | | 16,524,752 | | | | (859,234 | ) |
| Sell1 | | | 7/06/2012 | | | Mexican Peso | | | 67,000,000 | | | | 5,021,126 | | | | (298,926 | ) |
| Sell1 | | | 8/09/2012 | | | Swiss Franc | | | 990,000 | | | | 1,043,942 | | | | 42,179 | |
| | | | | | | | | | | | | | | | | | |
| Total | | | | | | | | | | | | | | | | $ | (872,915 | ) |
| | | | | | | | | | | | | | | | | | |
1 Counterparty is Credit Suisse AG.
2 Counterparty is Bank of America, N.A.
See accompanying notes to financial statements.
59 |
Portfolio of Investments – as of June 30, 2012 (Unaudited)
Loomis Sayles Absolute Strategies Fund – (continued)
At June 30, 2012, open futures contracts sold were as follows:
| | | | | | | | | | | | | | | | |
| Financial Futures | | Expiration
Date | | | Contracts | | | Notional
Value | | | Unrealized
Appreciation
(Depreciation) | |
| E-mini S&P 500® | | | 9/21/2012 | | | | 240 | | | $ | 16,276,800 | | | $ | (674,378 | ) |
| EURO STOXX 50® | | | 9/21/2012 | | | | 44 | | | | 1,255,628 | | | | (69,129 | ) |
| 10 Year U.S. Treasury Note | | | 9/19/2012 | | | | 139 | | | | 18,539,125 | | | | 77,933 | |
| 30 Year U.S. Treasury Bond | | | 9/19/2012 | | | | 69 | | | | 10,209,844 | | | | 198,249 | |
| | | | | | | | | | | | | | | | |
| Total | | | | | | | | | | | | | | $ | (467,325 | ) |
| | | | | | | | | | | | | | | | |
Industry Summary at June 30, 2012 (Unaudited)
| | | | |
Commercial Mortgage-Backed Securities | | | 8.2 | % |
Treasuries | | | 8.1 | |
Banking | | | 5.4 | |
Wirelines | | | 5.3 | |
Collateralized Mortgage Obligations | | | 4.5 | |
Non-Captive Diversified | | | 3.7 | |
Electric | | | 3.5 | |
Diversified Manufacturing | | | 2.9 | |
Metals & Mining | | | 2.8 | |
Independent Energy | | | 2.8 | |
ABS Home Equity | | | 2.6 | |
Chemicals | | | 2.4 | |
Pharmaceuticals | | | 2.4 | |
Government Owned-No Guarantee | | | 2.2 | |
Wireless | | | 2.1 | |
Industrial Other | | | 2.1 | |
Technology | | | 2.1 | |
Other Investments, less than 2% each | | | 24.3 | |
Short-Term Investments | | | 10.4 | |
| | | | |
Total Investments | | | 97.8 | |
Other assets less liabilities (including open swap agreements, forward foreign currency contracts and futures contracts) | | | 2.2 | |
| | | | |
Net Assets | | | 100.0 | % |
| | | | |
See accompanying notes to financial statements.
| 60
Portfolio of Investments – as of June 30, 2012 (Unaudited)
Loomis Sayles Absolute Strategies Fund – (continued)
Currency Exposure Summary at June 30, 2012 (Unaudited)
| | | | |
United States Dollar | | | 81.6 | % |
Canadian Dollar | | | 6.1 | |
Mexican Peso | | | 4.0 | |
Euro | | | 2.7 | |
Brazilian Real | | | 2.1 | |
Other, less than 2% each | | | 1.3 | |
| | | | |
Total Investments | | | 97.8 | |
Other assets less liabilities (including open swap agreements, forward foreign currency contracts and futures contracts) | | | 2.2 | |
| | | | |
Net Assets | | | 100.0 | % |
| | | | |
See accompanying notes to financial statements.
61 |
Consolidated Portfolio of Investments – as of June 30, 2012 (Unaudited)
Loomis Sayles Multi-Asset Real Return Fund
| | | | | | | | |
Principal
Amount (‡) | | | Description | | Value (†) | |
| | | | | | | | |
| | Bonds and Notes — 44.6% of Net Assets | | | | |
| | Non-Convertible Bonds — 43.4% | | | | |
| | | | Airlines — 1.1% | |
| $ | 267,000 | | | United Air Lines, Inc., 9.875%, 8/01/2013, 144A | | $ | 275,344 | |
| | | | | | | | |
| | | | Banking — 5.8% | |
| | 500,000 | | | ABN Amro North American Holding Preferred Capital Repackage Trust I, (fixed rate to 11/8/2012, variable rate thereafter),
6.523%, 12/29/2049, 144A | | | 441,875 | |
| | 100,000 | | | Barclays Bank PLC, 6.050%, 12/04/2017, 144A | | �� | 101,044 | |
| | 500,000 | | | BNP Paribas S.A., (fixed rate to 6/29/2015, variable rate thereafter), 5.186%, 6/29/2049, 144A | | | 430,000 | |
| | 500,000 | | | Morgan Stanley, Series F, GMTN, 6.000%, 4/28/2015 | | | 516,853 | |
| | | | | | | | |
| | | | | | | 1,489,772 | |
| | | | | | | | |
| | | | Building Materials — 1.8% | |
| | 435,000 | | | USG Corp., 7.875%, 3/30/2020, 144A | | | 450,225 | |
| | | | | | | | |
| | | | Chemicals — 2.0% | |
| | 225,000 | | | Kinove German Bondco GmbH, 10.000%, 6/15/2018, 144A, (EUR) | | | 288,297 | |
| | 210,000 | | | Methanex Corp.,
5.250%, 3/01/2022 | | | 217,877 | |
| | | | | | | | |
| | | | | | | 506,174 | |
| | | | | | | | |
| | | | Collateralized Mortgage Obligations — 0.7% | |
| | 427,240 | | | Washington Mutual Alternative Mortgage Pass-Through Certificates, Series 2006-AR6, Class 2A, 1.107%, 8/25/2046(b) | | | 190,695 | |
| | | | | | | | |
| | | | Construction Machinery — 1.2% | |
| | 300,000 | | | UR Financing Escrow Corp., 7.625%, 4/15/2022, 144A | | | 314,250 | |
| | | | | | | | |
| | | | Gaming — 1.9% | |
| | 475,000 | | | Caesars Operating Escrow LLC/Caesars Escrow Corp., 8.500%, 2/15/2020, 144A | | | 478,562 | |
| | | | | | | | |
| | | | Independent Energy — 2.9% | |
| | 90,000 | | | Newfield Exploration Co., 5.625%, 7/01/2024 | | | 92,025 | |
| | 550,000 | | | SandRidge Energy, Inc., 8.125%, 10/15/2022, 144A | | | 555,500 | |
| | 110,000 | | | SM Energy Co., 6.500%, 1/01/2023, 144A | | | 110,825 | |
| | | | | | | | |
| | | | | | | 758,350 | |
| | | | | | | | |
| | | | Media Cable — 0.7% | |
| | 200,000 | | | Nara Cable Funding Ltd., 8.875%, 12/01/2018, 144A | | | 172,000 | |
| | | | | | | | |
| | | | Media Non-Cable — 1.0% | |
| | 15,000 | | | Intelsat Luxembourg S.A., 11.250%, 2/04/2017 | | | 15,450 | |
| | 245,000 | | | R.R. Donnelley & Sons Co., 8.250%, 3/15/2019 | | | 240,100 | |
| | | | | | | | |
| | | | | | | 255,550 | |
| | | | | | | | |
| | | | Non-Captive Diversified — 3.9% | |
| | 1,000,000 | | | International Lease Finance Corp., 4.875%, 4/01/2015 | | | 1,004,949 | |
| | | | | | | | |
| | | | Oil Field Services — 0.8% | |
| | 200,000 | | | Pioneer Drilling Co., 9.875%, 3/15/2018, 144A | | | 210,000 | |
| | | | | | | | |
See accompanying notes to financial statements.
| 62
Consolidated Portfolio of Investments – as of June 30, 2012 (Unaudited)
Loomis Sayles Multi-Asset Real Return Fund – (continued)
| | | | | | | | |
Principal
Amount (‡) | | | Description | | Value (†) | |
| | | | | | | | |
| | | | Packaging — 1.3% | |
| | 270,000 | | | Ardagh Packaging Finance PLC, 9.250%, 10/15/2020, 144A, (EUR) | | $ | 343,393 | |
| | | | | | | | |
| | | | Pipelines — 1.2% | |
| | 105,000 | | | Holly Energy Partners LP/Holly Energy Finance Corp., 6.500%, 3/01/2020, 144A | | | 105,787 | |
| | 200,000 | | | Listrindo Capital BV, 6.950%, 2/21/2019, 144A | | | 204,632 | |
| | | | | | | | |
| | | | | | | 310,419 | |
| | | | | | | | |
| | | | Refining — 1.2% | |
| | 295,000 | | | Calumet Specialty Products Partners LP/Calumet Finance Corp., 9.375%, 5/01/2019 | | | 295,738 | |
| | | | | | | | |
| | | | Retailers — 0.9% | |
| | 250,000 | | | Edcon Proprietary Ltd., 9.500%, 3/01/2018, 144A | | | 230,000 | |
| | | | | | | | |
| | | | Technology — 1.6% | |
| | 400,000 | | | First Data Corp., 9.875%, 9/24/2015 | | | 405,000 | |
| | | | | | | | |
| | | | Treasuries — 2.4% | |
| | 600,000 | | | U.S. Treasury Bond, 3.000%, 5/15/2042 | | | 628,406 | |
| | | | | | | | |
| | | | Wireless — 6.8% | |
| | 500,000 | | | Nextel Communications, Inc., 7.375%, 8/01/2015 | | | 500,625 | |
| | 600,000 | | | VimpelCom Holdings BV, 7.504%, 3/01/2022, 144A | | | 563,664 | |
| | 800,000 | | | Wind Acquisition Finance S.A., 7.250%, 2/15/2018, 144A | | | 696,000 | |
| | | | | | | | |
| | | | | | | 1,760,289 | |
| | | | | | | | |
| | | | Wirelines — 4.2% | |
| | 400,000 | | | Embarq Corp., 7.995%, 6/01/2036 | | | 417,838 | |
| | 235,000 | | | Frontier Communications Corp., 9.000%, 8/15/2031 | | | 224,425 | |
| | 471,000 | | | Telefonica Emisiones SAU, 6.421%, 6/20/2016 | | | 451,973 | |
| | | | | | | | |
| | | | | | | 1,094,236 | |
| | | | | | | | |
| | | | Total Non-Convertible Bonds
(Identified Cost $11,104,153) | | | 11,173,352 | |
| | | | | | | | |
| | | | | | | | |
| | Convertible Bonds — 1.2% | | | | |
| | | | Metals & Mining — 1.2% | |
| | 360,000 | | | Alpha Appalachia Holdings, Inc., 3.250%, 8/01/2015
(Identified Cost $329,730) | | | 310,500 | |
| | | | | | | | |
| | | | Total Bonds and Notes
(Identified Cost $11,433,883) | | | 11,483,852 | |
| | | | | | | | |
| | | | | | | | |
| | Senior Loans — 1.0% | | | | |
| | | | Non-Captive Consumer — 1.0% | |
| | 257,000 | | | Chesapeake Energy Corporation, Unsecured Term Loan, 8.500%, 12/01/2017(b) (Identified Cost $249,433) | | | 254,723 | |
| | | | | | | | |
| | | | | | | | |
See accompanying notes to financial statements.
63 |
Consolidated Portfolio of Investments – as of June 30, 2012 (Unaudited)
Loomis Sayles Multi-Asset Real Return Fund – (continued)
| | | | | | | | |
Shares
| | | Description | | Value (†) | |
| | | | | | | | |
| | Common Stocks — 10.6% | | | | |
| | | | Airlines — 1.0% | |
| | 24,200 | | | JetBlue Airways Corp.(c) | | $ | 128,260 | |
| | 5,300 | | | United Continental Holdings, Inc.(c) | | | 128,949 | |
| | | | | | | | |
| | | | | | | 257,209 | |
| | | | | | | | |
| | | | Chemicals — 2.1% | |
| | 700 | | | CF Industries Holdings, Inc. | | | 135,618 | |
| | 1,700 | | | Monsanto Co. | | | 140,726 | |
| | 2,400 | | | Mosaic Co. (The) | | | 131,424 | |
| | 3,100 | | | Potash Corp. of Saskatchewan, Inc. | | | 135,439 | |
| | | | | | | | |
| | | | | | | 543,207 | |
| | | | | | | | |
| | | | Computers & Peripherals — 0.6% | |
| | 6,300 | | | EMC Corp.(c) | | | 161,469 | |
| | | | | | | | |
| | | | Diversified Financial Services — 0.6% | |
| | 19,900 | | | Bank of America Corp. | | | 162,782 | |
| | | | | | | | |
| | | | Diversified Telecommunication Services — 1.8% | |
| | 4,700 | | | AT&T, Inc. | | | 167,602 | |
| | 4,000 | | | CenturyLink, Inc. | | | 157,960 | |
| | 10,000 | | | France Telecom, S.A., Sponsored ADR | | | 131,100 | |
| | | | | | | | |
| | | | | | | 456,662 | |
| | | | | | | | |
| | | | Household Products — 0.7% | |
| | 2,300 | | | Clorox Co. (The) | | | 166,658 | |
| | | | | | | | |
| | | | Leisure Equipment & Products — 0.6% | |
| | 4,700 | | | Hasbro, Inc. | | | 159,189 | |
| | | | | | | | |
| | | | Multi Utilities — 0.6% | |
| | 2,600 | | | Consolidated Edison, Inc. | | | 161,694 | |
| | | | | | | | |
| | | | Oil, Gas & Consumable Fuels — 1.2% | |
| | 3,600 | | | ExxonMobil Corp. | | | 308,052 | |
| | | | | | | | |
| | | | Specialty Retail — 0.6% | |
| | 3,000 | | | Home Depot, Inc. (The) | | | 158,970 | |
| | | | | | | | |
| | | | Tobacco — 0.8% | |
| | 2,400 | | | Philip Morris International, Inc. | | | 209,424 | |
| | | | | | | | |
| | | | Total Common Stocks
(Identified Cost $2,631,364) | | | 2,745,316 | |
| | | | | | | | |
| | | | | | | | |
| | Preferred Stocks — 1.7% | | | | |
| | | | Non-Captive Diversified — 1.7% | |
| | 16,500 | | | Montpelier Re Holdings Ltd., 8.875%
(Identified Cost $412,500) | | | 447,150 | |
| | | | | | | | |
| | | | | | | | |
| | Exchange Traded Funds — 9.1% | | | | |
| | 10,000 | | | iShares Dow Jones US Real Estate Index Fund | | | 639,700 | |
| | 4,500 | | | iShares MSCI Mexico Investable Market Index Fund | | | 276,525 | |
See accompanying notes to financial statements.
| 64
Consolidated Portfolio of Investments – as of June 30, 2012 (Unaudited)
Loomis Sayles Multi-Asset Real Return Fund – (continued)
| | | | | | | | |
Shares
| | | Description | | Value (†) | |
| | Exchange Traded Funds — continued | | | | |
| | 9,500 | | | SPDR® EURO STOXX 50® ETF | | $ | 268,090 | |
| | 21,100 | | | SPDR® S&P® Dividend ETF | | | 1,174,215 | |
| | | | | | | | |
| | | | Total Exchange Traded Funds
(Identified Cost $2,294,495) | | | 2,358,530 | |
| | | | | | | | |
| | | | | | | | |
| | | | | | | | |
Shares/Par
Value (††) | | | | | | |
| | Purchased Options — 1.2% | | | | |
| | | | Options on Securities — 0.9% | |
| | 20,000 | | | iShares Barclays 20+ Year Treasury Bond Fund Put, expiring September 22, 2012 at 128 | | | 123,000 | |
| | 10,000 | | | iShares Silver Trust Call, expiring July 21, 2012 at 27(f) | | | 6,150 | |
| | 5,000 | | | iShares Silver Trust Call, expiring July 21, 2012 at 28(f) | | | 1,450 | |
| | 15,000 | | | SPDR® S&P 500® ETF Trust Put, expiring September 22, 2012 at 132 | | | 46,800 | |
| | 10,000 | | | SPDR® S&P 500® ETF Trust Call, expiring August 18, 2012 at 133 | | | 54,500 | |
| | 5,000 | | | United States Oil Fund L.P Call, expiring July 21, 2012 at 32(f) | | | 4,475 | |
| | | | | | | | |
| | | | | | | 236,375 | |
| | | | | | | | |
| | | | Over-the-Counter Options on Currency — 0.3% | |
| | 1,250,000 | | | EUR Put, expiring December 10, 2012 at 1.2484(d) | | | 29,074 | |
| | 620,000 | | | JPY Put, expiring December 05, 2012 at 78.4000(d) | | | 21,238 | |
| | 310,000 | | | JPY Put, expiring November 21, 2012 at 78.9500(d) | | | 8,968 | |
| | 310,000 | | | JPY Put, expiring November 21, 2012 at 79.7000(e) | | | 7,418 | |
| | | | | | | | |
| | | | | | | 66,698 | |
| | | | | | | | |
| | | | Total Purchased Options
(Identified Cost $314,632) | | | 303,073 | |
| | | | | | | | |
| | | | | | | | |
Principal
Amount (‡) | | | | | | |
| | Short-Term Investments — 27.1% | | | | |
| $ | 480,000 | | | Repurchase Agreement with State Street Bank and Trust Company, dated 6/29/2012 at 0.000% to be repurchased at $480,000 on 7/02/2012 collateralized by $460,000 U.S. Treasury Note, 2.625% due 12/31/2014 valued at $491,625 including accrued interest (Note 2 of Notes to Financial Statements)(f) | | | 480,000 | |
| | 799,741 | | | Tri-Party Repurchase Agreement with Fixed Income Clearing Corporation, dated 6/29/2012 at 0.000% to be repurchased at $799,741 on 7/02/2012 collateralized by $815,000 Federal National Mortgage Association, 0.375% due 12/28/2012 valued at $815,815 including accrued interest (Note 2 of Notes to Financial Statements) | | | 799,741 | |
| | 5,700,000 | | | U.S. Treasury Bills, 0.100-0.148%, 9/20/2012(f)(g)(h)(i)(j) | | | 5,699,082 | |
| | | | | | | | |
| | | | Total Short-Term Investments
(Identified Cost $6,977,849) | | | 6,978,823 | |
| | | | | | | | |
| | | | | | | | |
| | | | Total Investments — 95.3%
(Identified Cost $24,314,156)(a) | | | 24,571,467 | |
| | | | Other assets less liabilities — 4.7% | | | 1,199,597 | |
| | | | | | | | |
| | | | Net Assets — 100.0% | | $ | 25,771,064 | |
| | | | | | | | |
See accompanying notes to financial statements.
65 |
Consolidated Portfolio of Investments – as of June 30, 2012 (Unaudited)
Loomis Sayles Multi-Asset Real Return Fund – (continued)
| | | | | | | | |
Shares/
Par
Value (††) | | | Description | | Value (†) | |
| | | | | | | | |
| | Written Options — (0.2%) | | | | |
| | | | Options on Securities — (0.1)% | | | | |
| | 20,000 | | | iShares Barclays 20+ Year Treasury Bond Fund Put, expiring September 22, 2012 at 115 | | $ | (16,000 | ) |
| | 15,000 | | | iShares Silver Trust Call, expiring July 21, 2012 at 31(f) | | | (600 | ) |
| | 15,000 | | | SPDR® S&P 500® ETF Trust Call, expiring September 22, 2012 at 125 | | | (24,600 | ) |
| | 5,000 | | | United States Oil Fund L.P Call, expiring July 21, 2012 at 35(f) | | | (675 | ) |
| | | | | | | | |
| | | | | | | (41,875 | ) |
| | | | | | | | |
| | | | Over-the-Counter Options on Currency — (0.1)% | | | | |
| | 1,250,000 | | | EUR Put, expiring December 10, 2012 at 1.1500(d) | | | (9,190 | ) |
| | 310,000 | | | JPY Put, expiring November 21, 2012 at 84(d) | | | (2,226 | ) |
| | 310,000 | | | JPY Put, expiring November 21, 2012 at 84(e) | | | (2,225 | ) |
| | 620,000 | | | JPY Put, expiring December 05, 2012 at 84(d) | | | (5,060 | ) |
| | | | | | | | |
| | | | | | | (18,701 | ) |
| | | | | | | | |
| | | | Total Written Options
(Premiums Received $95,045) | | $ | (60,576 | ) |
| | | | | | | | |
| | (‡) | | | Principal Amount stated in U.S. dollars unless otherwise noted. | | | | |
| | (†) | | | See Note 2 of Notes to Financial Statements. | | | | |
| | (††) | | | Options on securities are expressed as shares. Options on currency are expressed at par value. | | | | |
| | (a) | | | Federal Tax Information (Amounts exclude certain adjustments made at the end of the Fund’s fiscal year for tax purposes. Such adjustments are primarily due to wash sales. Amortization of premium on debt securities is excluded for tax purposes.): | | | | |
| | | | At June 30, 2012, the net unrealized appreciation on investments based on a cost of $24,317,801 for federal income tax purposes was as follows: | | | | |
| | | | Aggregate gross unrealized appreciation for all investments in which there is an excess of value over tax cost | | $ | 502,639 | |
| | | | Aggregate gross unrealized depreciation for all investments in which there is an excess of tax cost over value | | | (248,973 | ) |
| | | | | | | | |
| | | | Net unrealized appreciation | | $ | 253,666 | |
| | | | | | | | |
| | (b) | | | Variable rate security. Rate as of June 30, 2012 is disclosed. | | | | |
| | (c) | | | Non-income producing security. | | | | |
| | (d) | | | Counterparty is Credit Suisse AG. | | | | |
| | (e) | | | Counterparty is UBS AG. | | | | |
| | (f) | | | All or a portion of this security is held by Loomis Sayles Multi-Asset Real Return Cayman Fund, Ltd., a wholly-owned subsidiary. See Note 1 of Notes to Financial Statements. | | | | |
| | (g) | | | A portion of this security has been pledged as initial margin for open futures contracts. | | | | |
| | (h) | | | A portion of this security has been designated to cover the Fund’s obligations under open forward foreign currency contracts, futures contracts and swap agreements. | | | | |
| | (i) | | | Interest rate represents discount rate at time of purchase; not a coupon rate. | | | | |
| | (j) | | | The Fund’s investment in U.S. Treasury Bills is comprised of various lots with differing discount rates. These separate investments, which have the same maturity date, have been aggregated for the purpose of presentation in the Portfolio of Investments. | | | | |
See accompanying notes to financial statements.
| 66
Consolidated Portfolio of Investments – as of June 30, 2012 (Unaudited)
Loomis Sayles Multi-Asset Real Return Fund – (continued)
| | | | | | |
| | 144A | | | All or a portion of these securities are exempt from registration under Rule 144A of the Securities Act of 1933. These securities may be resold in transactions exempt from registration, normally to qualified institutional buyers. At June 30, 2012, the value of Rule 144A holdings amounted to $5,971,398 or 23.2% of net assets. | | |
| | ADR | | | An American Depositary Receipt is a certificate issued by a custodian bank representing the right to receive securities of the foreign issuer described. The values of ADRs may be significantly influenced by trading on exchanges not located in the United States. | | |
| | | | | | |
| | ETF | | | Exchange Traded Fund | | |
| | GMTN | | | Global Medium Term Note | | |
| | SPDR | | | Standard & Poor’s Depositary Receipt | | |
| | | | | | |
| | EUR | | | Euro | | |
| | JPY | | | Japanese Yen | | |
At June 30, 2012, the Fund had the following open credit default swap agreements:
| | | | | | | | | | | | | | | | | | | | | | | | | | | | |
| Counterparty | | Reference
Obligation | | (Pay)/
Receive
Fixed Rate | | Expiration
Date | | | Notional
Value(‡) | | | Unamortized
Up Front
Premium
Paid/
(Received) | | | Market
Value | | | Unrealized
Appreciation
(Depreciation) | | | Fees
Receivable/
(Payable) | |
Buy Protection | | | | | | | | | | | | | | | | | | | | | | |
| Credit Suisse International | | CDX 18 HY 500 | | (5.00%) | | | 06/20/2017 | | | $ | 990,000 | | | $ | 50,050 | | | $ | 35,084 | | | $ | (14,966 | ) | | $ | (1,788 | ) |
| Deutsche Bank AG | | Belgium Kingdom | | (1.00%) | | | 06/20/2017 | | | | 1,000,000 | | | | 74,972 | | | | 61,023 | | | | (13,949 | ) | | | (306 | ) |
| JP Morgan Chase Bank, N.A. | | International
Paper Co. | | (1.00%) | | | 06/20/2017 | | | | 1,000,000 | | | | 13,680 | | | | 25,985 | | | | 12,305 | | | | (306 | ) |
| Morgan Stanley Capital Services Inc. | | State Bank of India | | (1.00%) | | | 12/20/2016 | | | | 250,000 | | | | 23,527 | | | | 24,150 | | | | 623 | | | | (76 | ) |
| Morgan Stanley Capital Services Inc. | | France Telecom | | (1.00%) | | | 06/20/2017 | | | | 500,000 | * | | | 15,817 | | | | 14,018 | | | | (1,799 | ) | | | (193 | ) |
| UBS AG | | Japan Government | | (1.00%) | | | 06/20/2017 | | | | 1,000,000 | | | | (1,768 | ) | | | (4,913 | ) | | | (3,145 | ) | | | (306 | ) |
| | | | | | | | | | | | | | | | | | | | | | | | | | | | |
| Total | | | | | | | | | | | | | | | | | | $ | 155,347 | | | $ | (20,931 | ) | | $ | (2,975 | ) |
| | | | | | | | | | | | | | | | | | | | | | | | | | | | |
(‡) Notional value stated in U.S. dollars unless otherwise noted.
* Notional value denominated in euros.
At June 30, 2012, the Fund had the following open forward foreign currency contracts:
| | | | | | | | | | | | | | | | | | |
Contract
to
Buy/Sell | | Delivery
Date | | | Currency | | Units | | | Notional
Value | | | Unrealized
Appreciation
(Depreciation) | |
| Buy1 | | | 7/09/2012 | | | Australian Dollar | | | 765,000 | | | $ | 782,532 | | | $ | 26,239 | |
| Buy1 | | | 7/25/2012 | | | Australian Dollar | | | 510,000 | | | | 520,898 | | | | 8,389 | |
| Sell1 | | | 7/09/2012 | | | Australian Dollar | | | 765,000 | | | | 782,532 | | | | (7,096 | ) |
| Sell1 | | | 7/25/2012 | | | Australian Dollar | | | 510,000 | | | | 520,898 | | | | (7,670 | ) |
| Buy1 | | | 7/20/2012 | | | Canadian Dollar | | | 265,000 | | | | 260,192 | | | | (89 | ) |
See accompanying notes to financial statements.
67 |
Consolidated Portfolio of Investments – as of June 30, 2012 (Unaudited)
Loomis Sayles Multi-Asset Real Return Fund – (continued)
| | | | | | | | | | | | | | | | | | |
Contract
to
Buy/Sell | | Delivery
Date | | | Currency | | Units | | | Notional
Value | | | Unrealized
Appreciation
(Depreciation) | |
| Sell1 | | | 7/20/2012 | | | Canadian Dollar | | | 265,000 | | | $ | 260,192 | | | $ | (1,356 | ) |
| Buy2 | | | 7/25/2012 | | | Chinese Renminbi | | | 24,300,000 | | | | 3,819,738 | | | | 13,182 | |
| Sell2 | | | 7/25/2012 | | | Chinese Renminbi | | | 12,150,000 | | | | 1,909,869 | | | | 24,383 | |
| Sell2 | | | 7/25/2012 | | | Chinese Renminbi | | | 12,150,000 | | | | 1,909,869 | | | | (5,778 | ) |
| Sell3 | | | 7/18/2012 | | | Euro | | | 260,000 | | | | 329,069 | | | | (1,287 | ) |
| Sell4 | | | 7/25/2012 | | | Euro | | | 250,000 | | | | 316,430 | | | | (21 | ) |
| Buy1 | | | 7/31/2012 | | | Mexican Peso | | | 10,550,000 | | | | 788,710 | | | | 10,478 | |
| Buy1 | | | 7/06/2012 | | | New Russian Ruble | | | 20,300,000 | | | | 626,473 | | | | 14,013 | |
| Buy1 | | | 7/23/2012 | | | New Russian Ruble | | | 17,100,000 | | | | 526,121 | | | | 11,370 | |
| Sell1 | | | 7/06/2012 | | | New Russian Ruble | | | 20,300,000 | | | | 626,473 | | | | (8,325 | ) |
| Sell1 | | | 7/23/2012 | | | New Russian Ruble | | | 17,100,000 | | | | 526,121 | | | | (12,607 | ) |
| Buy1 | | | 7/23/2012 | | | South African Rand | | | 2,135,000 | | | | 260,380 | | | | 2,062 | |
| Sell1 | | | 7/23/2012 | | | South African Rand | | | 2,135,000 | | | | 260,380 | | | | (3,475 | ) |
| | | | | | | | | | | | | | | | | | |
| Total | | | | | | | | | | | | | | | | $ | 62,412 | |
| | | | | | | | | | | | | | | | | | |
At June 30, 2012, the Fund had the following open forward cross currency contracts:
| | | | | | | | | | | | | | | | | | |
| Settlement Date | | Deliver/Units of Currency | | | Receive1/Units of
Currency | | | | | | Unrealized
Appreciation
(Depreciation) | |
07/16/2012 | | Canadian Dollar | | | 636,243 | | | | Malaysian Ringgit | | | | 1,970,000 | | | $ | (4,928 | ) |
07/16/2012 | | Malaysian Ringgit | | | 1,970,000 | | | | Canadian Dollar | | | | 635,689 | | | | 4,384 | |
| | | | | | | | | | | | | | | | | | |
Total | | | | | | | | | | | | | | | | $ | (544 | ) |
| | | | | | | | | | | | | | | | | | |
1 Counterparty is Credit Suisse AG.
2 Counterparty is UBS AG.
3 Counterparty is Morgan Stanley Capital Services Inc.
4 Counterparty is Bank of America, N.A.
At June 30, 2012, open futures contracts purchased were as follows:
| | | | | | | | | | | | | | |
| Financial Futures | | Expiration
Date | | Contracts | | | Notional
Value | | | Unrealized
Appreciation
(Depreciation) | |
ASX SPI 200 | | 9/20/2012 | | | 6 | | | $ | 622,851 | | | $ | (11,068 | ) |
EURO STOXX 50® | | 9/21/2012 | | | 9 | | | | 256,833 | | | | 5,108 | |
| | | | | | | | | | | | | | |
Total | | | | | | | | | | | | $ | (5,960 | ) |
| | | | | | | | | | | | | | |
| | | | | | | | | | | | | | |
| Commodity Futures5 | | Expiration
Date | | Contracts | | | Notional
Value | | | Unrealized
Appreciation
(Depreciation) | |
Lead | | 8/15/2012 | | | 6 | | | $ | 278,250 | | | $ | (12,788 | ) |
Nickel | | 7/18/2012 | | | 8 | | | | 801,744 | | | | (23,906 | ) |
Zinc | | 8/15/2012 | | | 6 | | | | 282,300 | | | | 12,938 | |
| | | | | | | | | | | | | | |
Total | | | | | | | | | | | | $ | (23,756 | ) |
| | | | | | | | | | | | | | |
See accompanying notes to financial statements.
| 68
Consolidated Portfolio of Investments – as of June 30, 2012 (Unaudited)
Loomis Sayles Multi-Asset Real Return Fund – (continued)
At June 30, 2012, open futures contracts sold were as follows:
| | | | | | | | | | | | | | |
| Financial Futures | | Expiration
Date | | Contracts | | | Notional
Value | | | Unrealized
Appreciation
(Depreciation) | |
E-mini S&P 500® | | 9/21/2012 | | | 50 | | | $ | 3,391,000 | | | $ | (76,258 | ) |
SGX CNX Nifty | | 7/26/2012 | | | 65 | | | | 688,285 | | | | (21,060 | ) |
10 Year U.S. Treasury Note | | 9/19/2012 | | | 1 | | | | 133,375 | | | | (205 | ) |
| | | | | | | | | | | | | | |
Total | | | | | | | | | | | | $ | (97,523 | ) |
| | | | | | | | | | | | | | |
| | | | | | | | | | | | | | |
| Commodity Futures5 | | Expiration
Date | | Contracts | | | Notional
Value | | | Unrealized
Appreciation
(Depreciation) | |
Lead | | 8/15/2012 | | | 6 | | | $ | 278,250 | | | $ | (13,746 | ) |
Nickel | | 7/18/2012 | | | 8 | | | | 801,744 | | | | 9,706 | |
Zinc | | 8/15/2012 | | | 6 | | | | 282,300 | | | | 1,762 | |
| | | | | | | | | | | | | | |
Total | | | | | | | | | | | | $ | (2,278 | ) |
| | | | | | | | | | | | | | |
5 Commodity futures are held by Loomis Sayles Multi-Asset Real Return Cayman Fund Ltd., a wholly-owned subsidiary. See Note 1 of Notes to Financial Statements.
Industry Summary at June 30, 2012 (Unaudited)
| | | | |
Exchange Traded Funds | | | 9.1 | % |
Wireless | | | 6.8 | |
Banking | | | 5.8 | |
Non-Captive Diversified | | | 5.6 | |
Wirelines | | | 4.2 | |
Chemicals | | | 4.1 | |
Independent Energy | | | 2.9 | |
Treasuries | | | 2.4 | |
Airlines | | | 2.1 | |
Other Investments, less than 2% each | | | 25.2 | |
Short-Term Investments | | | 27.1 | |
| | | | |
Total Investments | | | 95.3 | |
Other assets less liabilities (including open written options, swap agreements, forward foreign currency contracts and futures contracts) | | | 4.7 | |
| | | | |
Net Assets | | | 100.0 | % |
| | | | |
See accompanying notes to financial statements.
69 |
This Page Intentionally Left Blank
| 70
Consolidated* Statements of Assets and Liabilities
June 30, 2012 (Unaudited)
| | | | | | | | | | | | |
| | | ASG
Diversifying
Strategies Fund | | | ASG Global
Alternatives
Fund | | | ASG Managed
Futures Strategy
Fund | |
ASSETS | | | | | | | | | | | | |
Investments at cost | | $ | 279,085,307 | | | $ | 1,297,746,906 | | | $ | 695,891,344 | |
Net unrealized depreciation | | | (13,921 | ) | | | (85,920 | ) | | | (58,897 | ) |
| | | | | | | | | | | | |
Investments at value | | | 279,071,386 | | | | 1,297,660,986 | | | | 695,832,447 | |
Cash | | | 5,850,987 | | | | 29,829,794 | | | | 17,511,277 | |
Due from brokers (including variation margin on futures contracts) (Note 2) | | | 24,767,564 | | | | 68,647,720 | | | | 55,130,570 | |
Receivable for Fund shares sold | | | 864,617 | | | | 2,629,691 | | | | 5,527,207 | |
Interest receivable | | | 93,105 | | | | 480,780 | | | | 185,980 | |
Unrealized appreciation on forward foreign currency contracts (Note 2) | | | 821,684 | | | | 3,336,880 | | | | 1,841,653 | |
Unrealized appreciation on futures contracts (Note 2) | | | 2,999,328 | | | | 16,870,826 | | | | 9,425,709 | |
| | | | | | | | | | | | |
TOTAL ASSETS | | | 314,468,671 | | | | 1,419,456,677 | | | | 785,454,843 | |
| | | | | | | | | | | | |
LIABILITIES | | | | | | | | | | | | |
Payable for securities purchased | | | — | | | | 9,100,464 | | | | — | |
Payable for Fund shares redeemed | | | 12,187,285 | | | | 9,837,178 | | | | 2,602,632 | |
Unrealized depreciation on forward foreign currency contracts (Note 2) | | | 1,753,605 | | | | 933,701 | | | | 4,047,004 | |
Unrealized depreciation on futures contracts (Note 2) | | | 6,556,697 | | | | 5,628,577 | | | | 10,748,142 | |
Management fees payable (Note 6) | | | 295,553 | | | | 1,379,664 | | | | 749,660 | |
Deferred Trustees’ fees (Note 6) | | | 28,818 | | | | 45,706 | | | | 21,787 | |
Administrative fees payable (Note 6) | | | 23,172 | | | | 64,776 | | | | 41,532 | |
Payable to distributor (Note 6d) | | | 3,433 | | | | 21,170 | | | | 35,940 | |
Other accounts payable and accrued expenses | | | 77,744 | | | | 145,547 | | | | 67,128 | |
| | | | | | | | | | | | |
TOTAL LIABILITIES | | | 20,926,307 | | | | 27,156,783 | | | | 18,313,825 | |
| | | | | | | | | | | | |
NET ASSETS | | $ | 293,542,364 | | | $ | 1,392,299,894 | | | $ | 767,141,018 | |
| | | | | | | | | | | | |
NET ASSETS CONSIST OF: | | | | | | | | | | | | |
Paid-in capital | | $ | 358,488,938 | | | $ | 1,481,570,250 | | | $ | 884,437,329 | |
Distributions in excess of net investment income/Accumulated net investment (loss) | | | (2,780,674 | ) | | | (8,887,733 | ) | | | (5,269,651 | ) |
Accumulated net realized loss on investments, futures contracts and foreign currency transactions | | | (57,662,320 | ) | | | (93,953,456 | ) | | | (108,438,213 | ) |
Net unrealized appreciation (depreciation) on investments, futures contracts and foreign currency translations | | | (4,503,580 | ) | | | 13,570,833 | | | | (3,588,447 | ) |
| | | | | | | | | | | | |
NET ASSETS | | $ | 293,542,364 | | | $ | 1,392,299,894 | | | $ | 767,141,018 | |
| | | | | | | | | | | | |
| * | Consolidated, where applicable. See Notes 1 and 2 of the Notes to Financial Statements. |
See accompanying notes to financial statements.
71 |
| | | | | | | | | | | | |
| | | ASG
Diversifying
Strategies Fund | | | ASG Global
Alternatives
Fund | | | ASG Managed
Futures Strategy
Fund | |
COMPUTATION OF NET ASSET VALUE AND OFFERING PRICE: | | | | | | | | | | | | |
Class A shares: | | | | | | | | | | | | |
Net assets | | $ | 108,098,409 | | | $ | 177,271,045 | | | $ | 186,642,539 | |
| | | | | | | | | | | | |
Shares of beneficial interest | | | 11,713,294 | | | | 17,777,143 | | | | 20,118,645 | |
| | | | | | | | | | | | |
Net asset value and redemption price per share | | $ | 9.23 | | | $ | 9.97 | | | $ | 9.28 | |
| | | | | | | | | | | | |
Offering price per share (100/94.25 of net asset value) (Note 1) | | $ | 9.79 | | | $ | 10.58 | | | $ | 9.85 | |
| | | | | | | | | | | | |
Class C shares: (redemption price per share is equal to net asset value less any applicable contingent deferred sales charge) (Note 1) | | | | | | | | | | | | |
Net assets | | $ | 19,584,813 | | | $ | 88,153,090 | | | $ | 25,014,377 | |
| | | | | | | | | | | | |
Shares of beneficial interest | | | 2,151,831 | | | | 9,061,391 | | | | 2,731,432 | |
| | | | | | | | | | | | |
Net asset value and offering price per share | | $ | 9.10 | | | $ | 9.73 | | | $ | 9.16 | |
| | | | | | | | | | | | |
Class Y shares: | | | | | | | | | | | | |
Net assets | | $ | 165,859,142 | | | $ | 1,126,875,759 | | | $ | 555,484,102 | |
| | | | | | | | | | | | |
Shares of beneficial interest | | | 17,908,876 | | | | 112,050,625 | | | | 59,824,309 | |
| | | | | | | | | | | | |
Net asset value, offering and redemption price per share | | $ | 9.26 | | | $ | 10.06 | | | $ | 9.29 | |
| | | | | | | | | | | | |
See accompanying notes to financial statements.
| 72
Consolidated* Statements of Assets and Liabilities (continued)
June 30, 2012 (Unaudited)
| | | | | | | | |
| | | Loomis Sayles
Absolute
Strategies Fund | | | Loomis Sayles
Multi-Asset Real
Return Fund | |
ASSETS | | | | | | | | |
Investments at cost | | $ | 479,354,674 | | | $ | 24,314,156 | |
Net unrealized appreciation (depreciation) | | | (8,741,206 | ) | | | 257,311 | |
| | | | | | | | |
Investments at value | | | 470,613,468 | | | | 24,571,467 | |
Cash | | | 171,290 | | | | 250,103 | |
Foreign currency at value (identified cost $6,639,324 and $789,389) | | | 6,881,899 | | | | 799,629 | |
Receivable for Fund shares sold | | | 2,178,727 | | | | — | |
Receivable from investment adviser (Note 6) | | | — | | | | 891 | |
Receivable for securities sold | | | 11,772,757 | | | | 33,138 | |
Securities received as collateral for open forward foreign currency contracts, option contracts or swap agreements (Notes 2 and 4) | | | 4,263,838 | | | | 260,905 | |
Dividends and interest receivable | | | 4,345,950 | | | | 210,746 | |
Unrealized appreciation on swap agreements (Note 2) | | | 639,283 | | | | 12,928 | |
Unrealized appreciation on forward foreign currency contracts (Note 2) | | | 1,726,346 | | | | 114,500 | |
Tax reclaims receivable | | | 4,212 | | | | 4,143 | |
Upfront premiums receivable on swap agreements, at value | | | 455,736 | | | | — | |
Receivable for closed swap agreements | | | — | | | | 58,114 | |
Upfront premiums paid on swap agreements (Note 2) | | | 6,134,446 | | | | 178,046 | |
Fees receivable on swap agreements (Note 2) | | | 41,706 | | | | — | |
| | | | | | | | |
TOTAL ASSETS | | | 509,229,658 | | | | 26,494,610 | |
| | | | | | | | |
LIABILITIES | | | | | | | | |
Options written, at value (premiums received $0 and $95,045) (Note 2) | | | — | | | | 60,576 | |
Payable for securities purchased | | | 12,215,996 | | | | 31,278 | |
Unrealized depreciation on swap agreements (Note 2) | | | 4,621,455 | | | | 33,859 | |
Payable for Fund shares redeemed | | | 950,388 | | | | 20,442 | |
Unrealized depreciation on forward foreign currency contracts (Note 2) | | | 2,599,261 | | | | 52,632 | |
Upfront premiums received on swap agreements (Note 2) | | | 2,743,613 | | | | 1,768 | |
Due to brokers (Note 2) | | | 4,263,838 | | | | 260,905 | |
Payable for variation margin on futures contracts (Note 2) | | | 314,617 | | | | 129,256 | |
Management fees payable (Note 6) | | | 272,115 | | | | — | |
Deferred Trustees’ fees (Note 6) | | | 14,184 | | | | 13,426 | |
Administrative fees payable (Note 6) | | | 17,897 | | | | 13,024 | |
Upfront premiums payable on swap agreements, at value | | | — | | | | 48,262 | |
Fees payable on swap agreements (Note 2) | | | 100,525 | | | | 2,975 | |
Payable to distributor (Note 6d) | | | 1,509 | | | | 30 | |
Other accounts payable and accrued expenses | | | 83,062 | | | | 55,113 | |
| | | | | | | | |
TOTAL LIABILITIES | | | 28,198,460 | | | | 723,546 | |
| | | | | | | | |
NET ASSETS | | $ | 481,031,198 | | | $ | 25,771,064 | |
| | | | | | | | |
| * | Consolidated, where applicable. See Notes 1 and 2 of the Notes to Financial Statements. |
See accompanying notes to financial statements.
73 |
| | | | | | | | |
| | | Loomis Sayles
Absolute
Strategies Fund | | | Loomis Sayles
Multi-Asset Real
Return Fund | |
NET ASSETS CONSIST OF: | | | | | | | | |
Paid-in capital | | $ | 508,140,775 | | | $ | 30,216,886 | |
Undistributed net investment income | | | 3,990,107 | | | | 138,630 | |
Accumulated net realized loss on investments, futures contracts, options written, swap agreements and foreign currency transactions | | | (17,206,415 | ) | | | (4,794,121 | ) |
Net unrealized appreciation (depreciation) on investments, futures contracts, options written, swap agreements and foreign currency translations | | | (13,893,269 | ) | | | 209,669 | |
| | | | | | | | |
NET ASSETS | | $ | 481,031,198 | | | $ | 25,771,064 | |
| | | | | | | | |
COMPUTATION OF NET ASSET VALUE AND OFFERING PRICE: | |
Class A shares: | | | | | | | | |
Net assets | | $ | 75,123,406 | | | $ | 1,611,729 | |
| | | | | | | | |
Shares of beneficial interest | | | 7,660,149 | | | | 167,542 | |
| | | | | | | | |
Net asset value and redemption price per share | | $ | 9.81 | | | $ | 9.62 | |
| | | | | | | | |
Offering price per share (100/95.50 of net asset value) (Note 1) | | $ | 10.27 | | | $ | 10.07 | |
| | | | | | | | |
Class C shares: (redemption price per share is equal to net asset value less any applicable contingent deferred sales charge) (Note 1) | | | | | | | | |
Net assets | | $ | 68,422,521 | | | $ | 48,280 | |
| | | | | | | | |
Shares of beneficial interest | | | 7,000,265 | | | | 5,056 | |
| | | | | | | | |
Net asset value and offering price per share | | $ | 9.77 | | | $ | 9.55 | |
| | | | | | | | |
Class Y shares: | | | | | | | | |
Net assets | | $ | 337,485,271 | | | $ | 24,111,055 | |
| | | | | | | | |
Shares of beneficial interest | | | 34,446,189 | | | | 2,506,819 | |
| | | | | | | | |
Net asset value, offering and redemption price per share | | $ | 9.80 | | | $ | 9.62 | |
| | | | | | | | |
See accompanying notes to financial statements.
| 74
Consolidated* Statements of Operations
For the Six Months Ended June 30, 2012 (unaudited)
| | | | | | | | | | | | |
| | | ASG
Diversifying
Strategies Fund | | | ASG Global
Alternatives
Fund | | | ASG Managed
Futures Strategy
Fund | |
INVESTMENT INCOME | | | | | | | | | | | | |
Interest | | $ | 512,096 | | | $ | 2,237,259 | | | $ | 1,002,532 | |
| | | | | | | | | | | | |
Expenses | | | | | | | | | | | | |
Management fees (Note 6) | | | 2,327,228 | | | | 8,722,190 | | | | 4,915,581 | |
Service and distribution fees (Note 6) | | | 271,510 | | | | 777,426 | | | | 445,659 | |
Administrative fees (Note 6) | | | 116,413 | | | | 379,693 | | | | 217,747 | |
Trustees’ and directors’ fees and expenses
(Note 6) | | | 18,500 | | | | 28,631 | | | | 23,255 | |
Transfer agent fees and expenses (Note 6) | | | 220,357 | | | | 847,560 | | | | 642,427 | |
Audit and tax services fees | | | 33,007 | | | | 32,991 | | | | 30,130 | |
Custodian fees and expenses | | | 48,146 | | | | 37,687 | | | | 42,418 | |
Interest expense (Note 9) | | | 57,096 | | | | 72,077 | | | | 106,178 | |
Legal fees | | | 3,160 | | | | 11,962 | | | | 5,940 | |
Registration fees | | | 52,812 | | | | 63,356 | | | | 115,574 | |
Shareholder reporting expenses | | | 20,937 | | | | 53,262 | | | | 8,783 | |
Miscellaneous expenses | | | 8,800 | | | | 21,983 | | | | 12,062 | |
| | | | | | | | | | | | |
Total expenses | | | 3,177,966 | | | | 11,048,818 | | | | 6,565,754 | |
| | | | | | | | | | | | |
Fee/expense recovery (Note 6) | | | — | | | | 39,776 | | | | — | |
Less waiver and/or expense reimbursement
(Note 6) | | | (149,776 | ) | | | — | | | | (311,844 | ) |
| | | | | | | | | | | | |
Net expenses | | | 3,028,190 | | | | 11,088,594 | | | | 6,253,910 | |
| | | | | | | | | | | | |
Net investment loss | | | (2,516,094 | ) | | | (8,851,335 | ) | | | (5,251,378 | ) |
| | | | | | | | | | | | |
NET REALIZED AND UNREALIZED GAIN (LOSS) ON INVESTMENTS, FUTURES CONTRACTS AND FOREIGN CURRENCY TRANSACTIONS | | | | | | | | | | | | |
Net realized gain (loss) on: | | | | | | | | | | | | |
Investments | | | 3,889 | | | | 9,511 | | | | 3,279 | |
Futures contracts | | | 9,431,111 | | | | (25,459,668 | ) | | | (3,955,304 | ) |
Foreign currency transactions | | | (18,425,531 | ) | | | (18,976,278 | ) | | | (57,475,481 | ) |
Net change in unrealized appreciation (depreciation) on: | | | | | | | | | |
Investments | | | (12,898 | ) | | | (88,827 | ) | | | (54,196 | ) |
Futures contracts | | | (6,236,903 | ) | | | 9,045,574 | | | | (13,842,211 | ) |
Foreign currency translations | | | (1,895,759 | ) | | | (856,197 | ) | | | (2,132,552 | ) |
| | | | | | | | | | | | |
Net realized and unrealized loss on investments, futures contracts and foreign currency transactions | | | (17,136,091 | ) | | | (36,325,885 | ) | | | (77,456,465 | ) |
| | | | | | | | | | | | |
NET DECREASE IN NET ASSETS RESULTING FROM OPERATIONS | | $ | (19,652,185 | ) | | $ | (45,177,220 | ) | | $ | (82,707,843 | ) |
| | | | | | | | | | | | |
| * | Consolidated, where applicable. See Notes 1 and 2 of the Notes to Financial Statements. |
See accompanying notes to financial statements.
75 |
| | | | | | | | |
| | | Loomis Sayles
Absolute
Strategies Fund | | | Loomis Sayles
Multi-Asset Real
Return Fund | |
INVESTMENT INCOME | | | | | | | | |
Interest | | $ | 10,978,549 | | | $ | 514,500 | |
Dividends | | | 854,713 | | | | 74,761 | |
Less net foreign taxes withheld | | | (26,165 | ) | | | (1,500 | ) |
| | | | | | | | |
| | | 11,807,097 | | | | 587,761 | |
| | | | | | | | |
Expenses | | | | | | | | |
Management fees (Note 6) | | | 1,665,412 | | | | 115,267 | |
Service and distribution fees (Note 6) | | | 490,039 | | | | 3,042 | |
Administrative fees (Note 6) | | | 108,388 | | | | 44,095 | |
Trustees’ and directors’ fees and expenses (Note 6) | | | 11,412 | | | | 15,363 | |
Transfer agent fees and expenses (Note 6) | | | 130,860 | | | | 948 | |
Audit and tax services fees | | | 24,564 | | | | 34,877 | |
Custodian fees and expenses | | | 72,720 | | | | 25,635 | |
Legal fees | | | 3,601 | | | | 582 | |
Registration fees | | | 58,032 | | | | 23,446 | |
Shareholder reporting expenses | | | 20,916 | | | | 2,410 | |
Miscellaneous expenses | | | 17,653 | | | | 5,369 | |
| | | | | | | | |
Total expenses | | | 2,603,597 | | | | 271,034 | |
Less waiver and/or expense reimbursement (Note 6) | | | — | | | | (98,935 | ) |
| | | | | | | | |
Net expenses | | | 2,603,597 | | | | 172,099 | �� |
| | | | | | | | |
Net investment income | | | 9,203,500 | | | | 415,662 | |
| | | | | | | | |
NET REALIZED AND UNREALIZED GAIN (LOSS) ON INVESTMENTS, FUTURES CONTRACTS, OPTIONS WRITTEN, SWAP AGREEMENTS AND FOREIGN CURRENCY TRANSACTIONS | | | | | | | | |
Net realized gain (loss) on: | | | | | | | | |
Investments | | | (6,281,038 | ) | | | 679,942 | |
Futures contracts | | | (139,651 | ) | | | (640,119 | ) |
Options written | | | 1,441,713 | | | | 116,243 | |
Swap agreements | | | 885,011 | | | | (31,925 | ) |
Foreign currency transactions | | | 357,043 | | | | 30,652 | |
Net change in unrealized appreciation (depreciation) on: | | | | | | | | |
Investments | | | 25,462,854 | | | | 466,131 | |
Futures contracts | | | (439,012 | ) | | | (74,963 | ) |
Options written | | | (292,448 | ) | | | (19,167 | ) |
Swap agreements | | | 49,744 | | | | (41,741 | ) |
Foreign currency translations | | | (852,754 | ) | | | 19,078 | |
| | | | | | | | |
Net realized and unrealized gain on investments, futures contracts, options written, swap agreements and foreign currency transactions | | | 20,191,462 | | | | 504,131 | |
| | | | | | | | |
NET INCREASE IN NET ASSETS RESULTING FROM OPERATIONS | | $ | 29,394,962 | | | $ | 919,793 | |
| | | | | | | | |
See accompanying notes to financial statements.
| 76
Consolidated* Statements of Changes in Net Assets
| | | | | | | | | | | | | | | | |
| | | ASG Diversifying
Strategies Fund | | | ASG Global
Alternatives Fund | |
| | | Six Months
Ended
June 30, 2012
(Unaudited) | | | Year Ended
December 31,
2011 | | | Six Months
Ended
June 30, 2012
(Unaudited) | | | Year Ended
December 31,
2011 | |
FROM OPERATIONS: | | | | | | | | | | | | | | | | |
Net investment income (loss) | | $ | (2,516,094 | ) | | $ | (4,660,028 | ) | | $ | (8,851,335 | ) | | $ | (12,981,117 | ) |
Net realized gain (loss) on investments, futures contracts, options written, swap agreements and foreign currency transactions | | | (8,990,531 | ) | | | (11,519,487 | ) | | | (44,426,435 | ) | | | (32,725,022 | ) |
Net change in unrealized appreciation (depreciation) on investments, futures contracts, options written, swap agreements and foreign currency translations | | | (8,145,560 | ) | | | 2,174,482 | | | | 8,100,550 | | | | (3,717,136 | ) |
| | | | | | | | | | | | | | | | |
Net increase (decrease) in net assets resulting from operations | | | (19,652,185 | ) | | | (14,005,033 | ) | | | (45,177,220 | ) | | | (49,423,275 | ) |
| | | | | | | | | | | | | | | | |
FROM DISTRIBUTIONS TO SHAREHOLDERS: | | | | | | | | | | | | | | | | |
Net investment income | | | | | | | | | | | | | | | | |
Class A | | | — | | | | (5,486,684 | ) | | | — | | | | — | |
Class C | | | — | | | | (873,499 | ) | | | — | | | | — | |
Class Y | | | — | | | | (10,578,441 | ) | | | — | | | | — | |
Net realized capital gains | | | | | | | | | | | | | | | | |
Class A | | | — | | | | — | | | | — | | | | (1,381,664 | ) |
Class C | | | — | | | | — | | | | — | | | | (473,432 | ) |
Class Y | | | — | | | | — | | | | — | | | | (2,791,215 | ) |
| | | | | | | | | | | | | | | | |
Total distributions | | | — | | | | (16,938,624 | ) | | | — | | | | (4,646,311 | ) |
| | | | | | | | | | | | | | | | |
NET INCREASE (DECREASE) IN NET ASSETS FROM CAPITAL SHARE TRANSACTIONS (NOTE 11) | | | (91,290,034 | ) | | | 180,241,158 | | | | (7,328,026 | ) | | | 884,494,560 | |
| | | | | | | | | | | | | | | | |
Net increase (decrease) in net assets | | | (110,942,219 | ) | | | 149,297,501 | | | | (52,505,246 | ) | | | 830,424,974 | |
NET ASSETS | | | | | | | | | | | | | | | | |
Beginning of the period | | | 404,484,583 | | | | 255,187,082 | | | | 1,444,805,140 | | | | 614,380,166 | |
| | | | | | | | | | | | | | | | |
End of the period | | $ | 293,542,364 | | | $ | 404,484,583 | | | $ | 1,392,299,894 | | | $ | 1,444,805,140 | |
| | | | | | | | | | | | | | | | |
UNDISTRIBUTED (DISTRIBUTIONS IN EXCESS OF) NET INVESTMENT INCOME/ACCUMULATED NET INVESTMENT (LOSS) | | $ | (2,780,674 | ) | | $ | (264,580 | ) | | $ | (8,887,733 | ) | | $ | (36,398 | ) |
| | | | | | | | | | | | | | | | |
| * | Consolidated, where applicable. See Notes 1 and 2 of the Notes to Financial Statements. |
See accompanying notes to financial statements.
77 |
| | | | | | | | | | | | | | | | | | | | | | |
ASG Managed Futures
Strategy Fund | | | Loomis Sayles Absolute
Strategies Fund | | | Loomis Sayles Multi-Asset
Real Return Fund | |
Six Months
Ended
June 30, 2012
(Unaudited) | | | Year Ended
December 31,
2011 | | | Six Months
Ended
June 30, 2012
(Unaudited) | | | Year Ended
December 31,
2011 | | | Six Months
Ended
June 30, 2012
(Unaudited) | | | Year Ended
December 31,
2011 | |
| | | | | | | | | | | | | | | | | | | | | | |
| $ | (5,251,378 | ) | | $ | (6,103,391 | ) | | $ | 9,203,500 | | | $ | 16,353,952 | | | $ | 415,662 | | | $ | 1,134,293 | |
| | | | | |
| | (61,427,506 | ) | | | (14,338,687 | ) | | | (3,736,922 | ) | | | (12,063,670 | ) | | | 154,793 | | | | (5,649,181 | ) |
| | | | | |
| | (16,028,959 | ) | | | 12,028,047 | | | | 23,928,384 | | | | (37,944,612 | ) | | | 349,338 | | | | (358,554 | ) |
| | | | | | | | | | | | | | | | | | | | | | |
| | | | | |
| | (82,707,843 | ) | | | (8,414,031 | ) | | | 29,394,962 | | | | (33,654,330 | ) | | | 919,793 | | | | (4,873,442 | ) |
| | | | | | | | | | | | | | | | | | | | | | |
| | | | | |
| | | | | | | | | | | | | | | | | | | | | | |
| | | | | | | | | | | | | | | | | | | | | | |
| | (1,185,702 | ) | | | (8,685,193 | ) | | | (965,025 | ) | | | (5,468,723 | ) | | | — | | | | (35,796 | ) |
| | (154,596 | ) | | | (653,347 | ) | | | (613,202 | ) | | | (2,160,343 | ) | | | — | | | | (1,313 | ) |
| | (3,146,402 | ) | | | (12,265,887 | ) | | | (4,470,786 | ) | | | (9,427,065 | ) | | | — | | | | (645,390 | ) |
| | | | | | | | | | | | | | | | | | | | | | |
| | — | | | | — | | | | — | | | | (3,236 | ) | | | — | | | | (7,538 | ) |
| | — | | | | — | | | | — | | | | (1,305 | ) | | | — | | | | (358 | ) |
| | — | | | | — | | | | — | | | | (3,755 | ) | | | — | | | | (108,932 | ) |
| | | | | | | | | | | | | | | | | | | | | | |
| | (4,486,700 | ) | | | (21,604,427 | ) | | | (6,049,013 | ) | | | (17,064,427 | ) | | | — | | | | (799,327 | ) |
| | | | | | | | | | | | | | | | | | | | | | |
| | | | | |
| | 107,232,774 | | | | 718,450,937 | | | | (23,710,023 | ) | | | 502,327,855 | | | | (5,668,611 | ) | | | 7,513,031 | |
| | | | | | | | | | | | | | | | | | | | | | |
| | 20,038,231 | | | | 688,432,479 | | | | (364,074 | ) | | | 451,609,098 | | | | (4,748,818 | ) | | | 1,840,262 | |
| | | | | | | | | | | | | | | | | | | | | | |
| | 747,102,787 | | | | 58,670,308 | | | | 481,395,272 | | | | 29,786,174 | | | | 30,519,882 | | | | 28,679,620 | |
| | | | | | | | | | | | | | | | | | | | | | |
| $ | 767,141,018 | | | $ | 747,102,787 | | | $ | 481,031,198 | | | $ | 481,395,272 | | | $ | 25,771,064 | | | $ | 30,519,882 | |
| | | | | | | | | | | | | | | | | | | | | | |
| | | | | |
| $ | (5,269,651 | ) | | $ | 4,468,427 | | | $ | 3,990,107 | | | $ | 835,620 | | | $ | 138,630 | | | $ | (277,032 | ) |
| | | | | | | | | | | | | | | | | | | | | | |
See accompanying notes to financial statements.
| 78
Financial Highlights
For a share outstanding throughout each period.
| | | | | | | | | | | | | | | | | | | | | | | | | | | | |
| | | | | | Income (Loss) from Investment
Operations: | | | Less Distributions: | |
| | |
Net asset
value,
beginning
of the
period | | | Net
investment
income
(loss) (a) | | | Net realized
and
unrealized
gain (loss) | | | Total from
investment
operations | | | Dividends
from net
investment
income (b) | | | Distributions
from net
realized
capital gains | | | Total
distributions | |
ASG DIVERSIFYING STRATEGIES FUND | | | | | | | | | | | | | | | | | | | | | |
Class A | | | | | | | | | | | | | | | | | | | | | | | | | | | | |
6/30/2012(h) | | $ | 9.75 | | | $ | (0.07 | ) | | $ | (0.45 | ) | | $ | (0.52 | ) | | $ | — | | | $ | — | | | $ | — | |
12/31/2011 | | | 10.45 | | | | (0.15 | ) | | | (0.14 | ) | | | (0.29 | ) | | | (0.41 | ) | | | — | | | | (0.41 | ) |
12/31/2010 | | | 10.19 | | | | (0.16 | ) | | | 1.02 | (i) | | | 0.86 | | | | (0.15 | ) | | | (0.45 | ) | | | (0.60 | ) |
12/31/2009(j) | | | 10.00 | | | | (0.07 | ) | | | 0.80 | | | | 0.73 | | | | (0.10 | ) | | | (0.44 | ) | | | (0.54 | ) |
Class C | | | | | | | | | | | | | | | | | | | | | | | | | | | | |
6/30/2012(h) | | | 9.65 | | | | (0.10 | ) | | | (0.45 | ) | | | (0.55 | ) | | | — | | | | — | | | | — | |
12/31/2011 | | | 10.34 | | | | (0.23 | ) | | | (0.12 | ) | | | (0.35 | ) | | | (0.34 | ) | | | — | | | | (0.34 | ) |
12/31/2010 | | | 10.16 | | | | (0.24 | ) | | | 1.01 | (i) | | | 0.77 | | | | (0.14 | ) | | | (0.45 | ) | | | (0.59 | ) |
12/31/2009(j) | | | 10.00 | | | | (0.10 | ) | | | 0.79 | | | | 0.69 | | | | (0.09 | ) | | | (0.44 | ) | | | (0.53 | ) |
Class Y | | | | | | | | | | | | | | | | | | | | | | | | | | | | |
6/30/2012(h) | | | 9.77 | | | | (0.06 | ) | | | (0.45 | ) | | | (0.51 | ) | | | — | | | | — | | | | — | |
12/31/2011 | | | 10.46 | | | | (0.13 | ) | | | (0.13 | ) | | | (0.26 | ) | | | (0.43 | ) | | | — | | | | (0.43 | ) |
12/31/2010 | | | 10.19 | | | | (0.13 | ) | | | 1.01 | (i) | | | 0.88 | | | | (0.16 | ) | | | (0.45 | ) | | | (0.61 | ) |
12/31/2009(j) | | | 10.00 | | | | (0.05 | ) | | | 0.78 | | | | 0.73 | | | | (0.10 | ) | | | (0.44 | ) | | | (0.54 | ) |
ASG GLOBAL ALTERNATIVES FUND | | | | | | | | | | | | | | | | | | | | | |
Class A | | | | | | | | | | | | | | | | | | | | | | | | | | | | |
6/30/2012(h) | | $ | 10.26 | | | $ | (0.07 | ) | | $ | (0.22 | ) | | $ | (0.29 | ) | | $ | — | | | $ | — | | | $ | — | |
12/31/2011 | | | 10.67 | | | | (0.14 | ) | | | (0.21 | ) | | | (0.35 | ) | | | — | | | | (0.06 | ) | | | (0.06 | ) |
12/31/2010 | | | 10.39 | | | | (0.14 | ) | | | 0.86 | | | | 0.72 | | | | (0.00 | ) | | | (0.44 | ) | | | (0.44 | ) |
12/31/2009 | | | 9.69 | | | | (0.14 | ) | | | 1.01 | | | | 0.87 | | | | (0.12 | ) | | | (0.05 | ) | | | (0.17 | ) |
12/31/2008(l) | | | 10.00 | | | | 0.03 | | | | (0.30 | ) | | | (0.27 | ) | | | (0.04 | ) | | | — | | | | (0.04 | ) |
Class C | | | | | | | | | | | | | | | | | | | | | | | | | | | | |
6/30/2012(h) | | | 10.05 | | | | (0.10 | ) | | | (0.22 | ) | | | (0.32 | ) | | | — | | | | — | | | | — | |
12/31/2011 | | | 10.53 | | | | (0.22 | ) | | | (0.20 | ) | | | (0.42 | ) | | | — | | | | (0.06 | ) | | | (0.06 | ) |
12/31/2010 | | | 10.33 | | | | (0.21 | ) | | | 0.85 | | | | 0.64 | | | | (0.00 | ) | | | (0.44 | ) | | | (0.44 | ) |
12/31/2009 | | | 9.70 | | | | (0.22 | ) | | | 1.01 | | | | 0.79 | | | | (0.11 | ) | | | (0.05 | ) | | | (0.16 | ) |
12/31/2008(l) | | | 10.00 | | | | 0.02 | | | | (0.31 | ) | | | (0.29 | ) | | | (0.01 | ) | | | — | | | | (0.01 | ) |
Class Y* | | | | | | | | | | | | | | | | | | | | | | | | | | | | |
6/30/2012(h) | | | 10.34 | | | | (0.06 | ) | | | (0.22 | ) | | | (0.28 | ) | | | — | | | | — | | | | — | |
12/31/2011 | | | 10.72 | | | | (0.12 | ) | | | (0.20 | ) | | | (0.32 | ) | | | — | | | | (0.06 | ) | | | (0.06 | ) |
12/31/2010 | | | 10.41 | | | | (0.11 | ) | | | 0.86 | | | | 0.75 | | | | (0.00 | ) | | | (0.44 | ) | | | (0.44 | ) |
12/31/2009 | | | 9.70 | | | | (0.09 | ) | | | 0.98 | | | | 0.89 | | | | (0.13 | ) | | | (0.05 | ) | | | (0.18 | ) |
12/31/2008(l) | | | 10.00 | | | | 0.04 | | | | (0.30 | ) | | | (0.26 | ) | | | (0.04 | ) | | | — | | | | (0.04 | ) |
| * | Prior to December 1, 2008, the Fund offered Institutional Class shares. On December 1, 2008, Institutional Class shares were redesignated as Class Y shares. |
| (a) | Per share net investment income (loss) has been calculated using the average shares outstanding during the period. |
| (b) | Amount rounds to less than $0.01 per share, if applicable. |
| (c) | A sales charge for Class A shares and a contingent deferred sales charge for Class C shares are not reflected in total return calculations. Periods less than one year, if applicable, are not annualized. |
| (d) | Had certain expenses not been waived/reimbursed during the period, if applicable, total returns would have been lower. |
| (e) | The investment adviser agreed to waive its fees and/or reimburse a portion of the Fund’s expenses during the period. Without this waiver/reimbursement, if applicable, expenses would have been higher. |
See accompanying notes to financial statements.
79 |
| | | | | | | | | | | | | | | | | | | | | | | | | | | | | | | | | | |
| | | | | | | | | | Ratios to Average Net Assets: | | | | |
Net asset
value,
end of
the period | | | Total
return
(%) (c)(d) | | | Net assets,
end of
the period
(000’s) | | | Net
expenses,
excluding
interest
expense
(%) (e)(f) | | | Gross
expenses,
excluding
interest
expense
(%) (f) | | | Net
expenses
including
interest
expense
(%) (e)(f) | | | Gross
expenses
including
interest
expense
(%) (f) | | | Net
investment
income
(loss)
(%) (f) | | | Portfolio
turnover
rate(%) (g) | |
| | | | | | | | | | | | | | | | | | | | | | | | | | | | | | | | | | |
| | | | | | | | | | | | | | | | | | | | | | | | | | | | | | | | | | |
| $ | 9.23 | | | | (5.33 | ) | | $ | 108,098 | | | | 1.70 | | | | 1.78 | | | | 1.73 | | | | 1.81 | | | | (1.46 | ) | | | — | |
| | 9.75 | | | | (2.75 | ) | | | 134,758 | | | | 1.70 | | | | 1.78 | | | | 1.72 | | | | 1.80 | | | | (1.46 | ) | | | — | |
| | 10.45 | | | | 8.46 | | | | 61,411 | | | | 1.70 | | | | 2.02 | | | | 1.74 | | | | 2.05 | | | | (1.45 | ) | | | — | |
| | 10.19 | | | | 7.26 | | | | 2,887 | | | | 1.70 | | | | 4.87 | | | | 1.71 | | | | 4.88 | | | | (1.48 | ) | | | — | |
| | | | | | | | | | | | | | | | | | | | | | | | | | | | | | | | | | |
| | 9.10 | | | | (5.70 | ) | | | 19,585 | | | | 2.45 | | | | 2.53 | | | | 2.48 | | | | 2.56 | | | | (2.21 | ) | | | — | |
| | 9.65 | | | | (3.43 | ) | | | 26,032 | | | | 2.45 | | | | 2.53 | | | | 2.47 | | | | 2.55 | | | | (2.21 | ) | | | — | |
| | 10.34 | | | | 7.58 | | | | 20,742 | | | | 2.45 | | | | 2.68 | | | | 2.49 | | | | 2.72 | | | | (2.20 | ) | | | — | |
| | 10.16 | | | | 6.90 | | | | 131 | | | | 2.45 | | | | 5.75 | | | | 2.47 | | | | 5.76 | | | | (2.23 | ) | | | — | |
| | | | | | | | | | | | | | | | | | | | | | | | | | | | | | | | | | |
| | 9.26 | | | | (5.22 | ) | | | 165,859 | | | | 1.45 | | | | 1.53 | | | | 1.48 | | | | 1.56 | | | | (1.21 | ) | | | — | |
| | 9.77 | | | | (2.48 | ) | | | 243,695 | | | | 1.45 | | | | 1.53 | | | | 1.47 | | | | 1.55 | | | | (1.21 | ) | | | — | |
| | 10.46 | | | | 8.63 | | | | 173,034 | | | | 1.45 | | | | 1.91 | | | | 1.49 | | | | 1.94 | | | | (1.21 | ) | | | — | |
| | 10.19 | | | | 7.29 | | | | 19,549 | | | | 1.45 | | | | 5.09 | | | | 1.47 | | | | 5.11 | | | | (1.22 | ) | | | — | |
| | | | | | | | | | | | | | | | | | | | | | | | | | | | | | | | | | |
| | | | | | | | | | | | | | | | | | | | | | | | | | | | | | | | | | |
| $ | 9.97 | | | | (2.83 | ) | | $ | 177,271 | | | | 1.60 | (k) | | | 1.60 | (k) | | | 1.61 | (k) | | | 1.61 | (k) | | | (1.31 | ) | | | — | |
| | 10.26 | | | | (3.29 | ) | | | 280,353 | | | | 1.60 | | | | 1.60 | | | | 1.61 | | | | 1.61 | | | | (1.34 | ) | | | — | |
| | 10.67 | | | | 6.94 | | | | 204,313 | | | | 1.60 | | | | 1.66 | | | | 1.61 | | | | 1.67 | | | | (1.28 | ) | | | — | |
| | 10.39 | | | | 8.95 | | | | 82,160 | | | | 1.60 | | | | 1.92 | | | | 1.61 | | | | 1.92 | | | | (1.33 | ) | | | — | |
| | 9.69 | | | | (2.73 | ) | | | 6 | | | | 1.60 | | | | 61.52 | | | | 1.62 | | | | 61.54 | | | | 1.36 | | | | — | |
| | | | | | | | | | | | | | | | | | | | | | | | | | | | | | | | | | |
| | 9.73 | | | | (3.18 | ) | | | 88,153 | | | | 2.35 | (k) | | | 2.35 | (k) | | | 2.36 | (k) | | | 2.36 | (k) | | | (2.06 | ) | | | — | |
| | 10.05 | | | | (4.00 | ) | | | 92,540 | | | | 2.35 | | | | 2.35 | | | | 2.36 | | | | 2.36 | | | | (2.09 | ) | | | — | |
| | 10.53 | | | | 6.21 | | | | 66,832 | | | | 2.35 | | | | 2.42 | | | | 2.36 | | | | 2.42 | | | | (2.03 | ) | | | — | |
| | 10.33 | | | | 8.09 | | | | 22,367 | | | | 2.35 | | | | 2.64 | | | | 2.36 | | | | 2.65 | | | | (2.08 | ) | | | — | |
| | 9.70 | | | | (2.88 | ) | | | 1 | | | | 2.35 | | | | 62.35 | | | | 2.39 | | | | 62.38 | | | | 0.62 | | | | — | |
| | | | | | | | | | | | | | | | | | | | | | | | | | | | | | | | | | |
| | 10.06 | | | | (2.71 | ) | | | 1,126,876 | | | | 1.35 | (k) | | | 1.35 | (k) | | | 1.36 | (k) | | | 1.36 | (k) | | | (1.06 | ) | | | — | |
| | 10.34 | | | | (3.00 | ) | | | 1,071,912 | | | | 1.35 | | | | 1.36 | | | | 1.36 | | | | 1.37 | | | | (1.09 | ) | | | — | |
| | 10.72 | | | | 7.22 | | | | 343,236 | | | | 1.35 | | | | 1.41 | | | | 1.36 | | | | 1.42 | | | | (1.03 | ) | | | — | |
| | 10.41 | | | | 9.10 | | | | 112,591 | | | | 1.35 | | | | 1.98 | | | | 1.36 | | | | 2.00 | | | | (0.90 | ) | | | — | |
| | 9.70 | | | | (2.60 | ) | | | 24,523 | | | | 1.35 | | | | 4.43 | | | | 1.39 | | | | 4.46 | | | | 1.59 | | | | — | |
| (f) | Computed on an annualized basis for periods less than one year, if applicable. |
| (g) | Due to the short-term nature of the portfolio of investments there is no portfolio turnover calculation. |
| (h) | For the six months ended June 30, 2012 (Unaudited). |
| (i) | The amount shown for a share outstanding does not correspond with the aggregate realized and unrealized gain (loss) on investments for the period due to the timing of sales and redemptions of fund shares in relation to fluctuating market values of investments of the Fund. |
| (j) | From commencement of operations on August 3, 2009 through December 31, 2009. |
| (k) | Includes fee/expense recovery of 0.01%, 0.01% and less than 0.01% for Class A, C and Y, respectively. |
| (l) | From commencement of operations on September 30, 2008 through December 31, 2008. |
See accompanying notes to financial statements.
| 80
Financial Highlights (continued)
For a share outstanding throughout each period.
| | | | | | | | | | | | | | | | | | | | | | | | | | | | |
| | | | | | Income (Loss) from Investment
Operations: | | | Less Distributions: | |
| | |
Net asset
value,
beginning
of the period | | | Net
investment
loss (a) | | | Net realized
and
unrealized
gain (loss) | | | Total from
investment
operations | | | Dividends
from net
investment
income | | | Distributions
from net
realized
capital gains | | | Total
distributions | |
ASG MANAGED FUTURES STRATEGY FUND | | | | | | | | | | | | | | | | | |
Class A | | | | | | | | | | | | | | | | | | | | | | | | | | | | |
6/30/2012(g) | | $ | 10.34 | | | $ | (0.07 | ) | | $ | (0.93 | ) | | $ | (1.00 | ) | | $ | (0.06 | ) | | $ | — | | | $ | (0.06 | ) |
12/31/2011 | | | 10.61 | | | | (0.16 | ) | | | 0.19 | (h) | | | 0.03 | | | | (0.30 | ) | | | — | | | | (0.30 | ) |
12/31/2010(i) | | | 10.00 | | | | (0.07 | ) | | | 1.41 | | | | 1.34 | | | | (0.33 | ) | | | (0.40 | ) | | | (0.73 | ) |
Class C | | | | | | | | | | | | | | | | | | | | | | | | | | | | |
6/30/2012(g) | | | 10.25 | | | | (0.11 | ) | | | (0.92 | ) | | | (1.03 | ) | | | (0.06 | ) | | | — | | | | (0.06 | ) |
12/31/2011 | | | 10.58 | | | | (0.24 | ) | | | 0.19 | (h) | | | (0.05 | ) | | | (0.28 | ) | | | — | | | | (0.28 | ) |
12/31/2010(i) | | | 10.00 | | | | (0.10 | ) | | | 1.40 | | | | 1.30 | | | | (0.32 | ) | | | (0.40 | ) | | | (0.72 | ) |
Class Y | | | | | | | | | | | | | | | | | | | | | | | | | | | | |
6/30/2012(g) | | | 10.34 | | | | (0.06 | ) | | | (0.93 | ) | | | (0.99 | ) | | | (0.06 | ) | | | — | | | | (0.06 | ) |
12/31/2011 | | | 10.60 | | | | (0.13 | ) | | | 0.19 | (h) | | | 0.06 | | | | (0.32 | ) | | | — | | | | (0.32 | ) |
12/31/2010(i) | | | 10.00 | | | | (0.06 | ) | | | 1.40 | | | | 1.34 | | | | (0.34 | ) | | | (0.40 | ) | | | (0.74 | ) |
| (a) | Per share net investment loss has been calculated using the average shares outstanding during the period. |
| (b) | A sales charge for Class A shares and a contingent deferred sales charge for Class C shares are not reflected in total return calculations. Periods less than one year, if applicable, are not annualized. |
| (c) | Had certain expenses not been waived/reimbursed during the period, if applicable, total returns would have been lower. |
| (d) | The investment adviser agreed to waive its fees and/or reimburse a portion of the Fund’s expenses during the period. Without this waiver/reimbursement, if applicable, expenses would have been higher. |
| (e) | Computed on an annualized basis for periods less than one year, if applicable. |
| (f) | Due to the short-term nature of the portfolio of investments there is no portfolio turnover calculation. |
| (g) | For the six months ended June 30, 2012 (Unaudited). |
| (h) | The amount shown for a share outstanding does not correspond with the aggregate realized and unrealized gain (loss) on investments for the period due to the timing of sales and redemptions of fund shares in relation to fluctuating market values of investments of the Fund. |
| (i) | From commencement of operations on July 30, 2010 through December 31, 2010. |
See accompanying notes to financial statements.
81 |
| | | | | | | | | | | | | | | | | | | | | | | | | | | | | | | | | | |
| | | | | | | | | |
Ratios to Average Net Assets: | | | | |
Net asset
value,
end of
the period | | | Total
return
(%) (b)(c) | | | Net
assets,
end of
the period
(000’s) | | | Net
expenses,
excluding
interest
expense
(%) (d)(e) | | | Gross
expenses,
excluding
interest
expense
(%) (e) | | | Net
expenses
including
interest
expense
(%) (d)(e) | | | Gross
expenses
including
interest
expense
(%) (e) | | | Net
investment
loss
(%) (e) | | | Portfolio
turnover
rate(%) (f) | |
| | | | | | | | | | | | | | | | | | | | | | | | | | | | | | | | | | |
| | | | | | | | | | | | | | | | | | | | | | | | | | | | | | | | | | |
| $ | 9.28 | | | | (9.69 | ) | | $ | 186,643 | | | | 1.70 | | | | 1.78 | | | | 1.73 | | | | 1.80 | | | | (1.47 | ) | | | — | |
| | 10.34 | | | | 0.25 | | | | 312,098 | | | | 1.70 | | | | 1.76 | | | | 1.71 | | | | 1.78 | | | | (1.47 | ) | | | — | |
| | 10.61 | | | | 13.44 | | | | 6,511 | | | | 1.70 | | | | 2.75 | | | | 1.73 | | | | 2.78 | | | | (1.43 | ) | | | — | |
| | | | | | | | | | | | | | | | | | | | | | | | | | | | | | | | | | |
| | 9.16 | | | | (10.07 | ) | | | 25,014 | | | | 2.45 | | | | 2.53 | | | | 2.48 | | | | 2.56 | | | | (2.22 | ) | | | — | |
| | 10.25 | | | | (0.51 | ) | | | 24,838 | | | | 2.45 | | | | 2.54 | | | | 2.46 | | | | 2.56 | | | | (2.22 | ) | | | — | |
| | 10.58 | | | | 13.04 | | | | 2,357 | | | | 2.45 | | | | 3.29 | | | | 2.47 | | | | 3.31 | | | | (2.17 | ) | | | — | |
| | | | | | | | | | | | | | | | | | | | | | | | | | | | | | | | | | |
| | 9.29 | | | | (9.60 | ) | | | 555,484 | | | | 1.45 | | | | 1.53 | | | | 1.48 | | | | 1.56 | | | | (1.22 | ) | | | — | |
| | 10.34 | | | | 0.57 | | | | 410,166 | | | | 1.45 | | | | 1.56 | | | | 1.46 | | | | 1.57 | | | | (1.22 | ) | | | — | |
| | 10.60 | | | | 13.39 | | | | 49,803 | | | | 1.45 | | | | 2.65 | | | | 1.48 | | | | 2.68 | | | | (1.20 | ) | | | — | |
See accompanying notes to financial statements.
| 82
Financial Highlights (continued)
For a share outstanding throughout each period.
| | | | | | | | | | | | | | | | | | | | | | | | | | | | |
| | | | | | Income (Loss) from Investment
Operations: | | | Less Distributions: | |
| | | Net asset
value,
beginning
of the
period | | | Net
investment
income (a)(b) | | | Net
realized and
unrealized
gain (loss) | | | Total from
investment
operations | | | Dividends
from net
investment
income (b) | | | Distributions
from net
realized
capital
gains (b) | | | Total
distributions (b) | |
Loomis Sayles Absolute Strategies Fund | | | | | | | | | | | | | | | | | |
Class A | | | | | | | | | | | | | | | | | | | | | | | | | | | | |
6/30/2012(g) | | $ | 9.34 | | | $ | 0.18 | | | $ | 0.41 | | | $ | 0.59 | | | $ | (0.12 | ) | | $ | — | | | $ | (0.12 | ) |
12/31/2011 | | | 10.06 | | | | 0.34 | | | | (0.75 | ) | | | (0.41 | ) | | | (0.31 | ) | | | (0.00 | ) | | | (0.31 | ) |
12/31/2010(i) | | | 10.00 | | | | 0.00 | | | | 0.06 | | | | 0.06 | | | | (0.00 | ) | | | — | | | | (0.00 | ) |
Class C | | | | | | | | | | | | | | | | | | | | | | | | | | | | |
6/30/2012(g) | | | 9.31 | | | | 0.15 | | | | 0.39 | | | | 0.54 | | | | (0.08 | ) | | | — | | | | (0.08 | ) |
12/31/2011 | | | 10.05 | | | | 0.28 | | | | (0.77 | ) | | | (0.49 | ) | | | (0.25 | ) | | | (0.00 | ) | | | (0.25 | ) |
12/31/2010(i) | | | 10.00 | | | | 0.00 | | | | 0.05 | | | | 0.05 | | | | (0.00 | ) | | | — | | | | (0.00 | ) |
Class Y | | | | | | | | | | | | | | | | | | | | | | | | | | | | |
6/30/2012(g) | | | 9.33 | | | | 0.20 | | | | 0.40 | | | | 0.60 | | | | (0.13 | ) | | | — | | | | (0.13 | ) |
12/31/2011 | | | 10.05 | | | | 0.37 | | | | (0.75 | ) | | | (0.38 | ) | | | (0.34 | ) | | | (0.00 | ) | | | (0.34 | ) |
12/31/2010(i) | | | 10.00 | | | | 0.00 | | | | 0.05 | | | | 0.05 | | | | (0.00 | ) | | | — | | | | (0.00 | ) |
Loomis Sayles Multi-Asset Real Return Fund | | | | | | | | | | | | | | | | | |
Class A | | | | | | | | | | | | | | | | | | | | | | | | | | | | |
6/30/2012(g) | | $ | 9.34 | | | $ | 0.12 | | | $ | 0.16 | | | $ | 0.28 | | | $ | — | | | $ | — | | | $ | — | |
12/31/2011 | | | 10.13 | | | | 0.20 | | | | (0.78 | ) | | | (0.58 | ) | | | (0.18 | ) | | | (0.03 | ) | | | (0.21 | ) |
12/31/2010(j) | | | 10.00 | | | | 0.07 | | | | 0.14 | | | | 0.21 | | | | (0.08 | ) | | | — | | | | (0.08 | ) |
Class C | | | | | | | | | | | | | | | | | | | | | | | | | | | | |
6/30/2012(g) | | | 9.31 | | | | 0.08 | | | | 0.16 | | | | 0.24 | | | | — | | | | — | | | | — | |
12/31/2011 | | | 10.11 | | | | 0.13 | | | | (0.78 | ) | | | (0.65 | ) | | | (0.12 | ) | | | (0.03 | ) | | | (0.15 | ) |
12/31/2010(j) | | | 10.00 | | | | 0.05 | | | | 0.14 | | | | 0.19 | | | | (0.08 | ) | | | — | | | | (0.08 | ) |
Class Y | | | | | | | | | | | | | | | | | | | | | | | | | | | | |
6/30/2012(g) | | | 9.33 | | | | 0.13 | | | | 0.16 | | | | 0.29 | | | | — | | | | — | | | | — | |
12/31/2011 | | | 10.13 | | | | 0.23 | | | | (0.78 | ) | | | (0.55 | ) | | | (0.22 | ) | | | (0.03 | ) | | | (0.25 | ) |
12/31/2010(j) | | | 10.00 | | | | 0.06 | | | | 0.15 | | | | 0.21 | | | | (0.08 | ) | | | — | | | | (0.08 | ) |
| (a) | Per share net investment income has been calculated using the average shares outstanding during the period. |
| (b) | Amount rounds to less than $0.01 per share, if applicable. |
| (c) | A sales charge for Class A shares and a contingent deferred sales charge for Class C shares are not reflected in total return calculations. Periods less than one year, if applicable, are not annualized. |
| (d) | Had certain expenses not been waived/reimbursed during the period, if applicable, total returns would have been lower. |
| (e) | The investment adviser agreed to waive its fees and/or reimburse a portion of the Fund’s expenses during the period. Without this waiver/reimbursement, if applicable, expenses would have been higher. |
| (f) | Computed on an annualized basis for periods less than one year, if applicable. |
| (g) | For the six months ended June 30, 2012 (Unaudited). |
| (h) | Includes fee/expense recovery of less than 0.01%. |
| (i) | From commencement of operations on December 15, 2010 through December 31, 2010. |
| (j) | From commencement of operations on September 30, 2010 through December 31, 2010. |
See accompanying notes to financial statements.
83 |
| | | | | | | | | | | | | | | | | | | | | | | | | | |
| | | | | | | | | | Ratios to Average Net Assets: | | | | |
Net asset
value,
end of
the period | | | Total
return
(%) (c)(d) | | | Net assets,
end of
the period
(000’s) | | | Net
expenses
(%) (e)(f) | | | Gross
expenses
(%) (f) | | | Net investment
income
(%) (f) | | | Portfolio
turnover
rate (%) | |
| | | | | | | | | | | | | | | | | | | | | | | | | | |
| | | | | | | | | | | | | | | | | | | | | | | | | | |
| $ | 9.81 | | | | 6.31 | | | $ | 75,123 | | | | 1.14 | | | | 1.14 | | | | 3.75 | | | | 77 | |
| | 9.34 | | | | (3.90 | ) | | | 130,662 | | | | 1.15 | (h) | | | 1.15 | (h) | | | 3.50 | | | | 141 | |
| | 10.06 | | | | 0.41 | | | | 2,465 | | | | 1.30 | | | | 6.98 | | | | 0.86 | | | | 39 | |
| | | | | | | | | | | | | | | | | | | | | | | | | | |
| | 9.77 | | | | 5.85 | | | | 68,423 | | | | 1.89 | | | | 1.89 | | | | 3.06 | | | | 77 | |
| | 9.31 | | | | (4.69 | ) | | | 77,398 | | | | 1.89 | (h) | | | 1.89 | (h) | | | 2.82 | | | | 141 | |
| | 10.05 | | | | 0.31 | | | | 563 | | | | 2.05 | | | | 8.68 | | | | 0.24 | | | | 39 | |
| | | | | | | | | | | | | | | | | | | | | | | | | | |
| | 9.80 | | | | 6.49 | | | | 337,485 | | | | 0.89 | | | | 0.89 | | | | 4.10 | | | | 77 | |
| | 9.33 | | | | (3.78 | ) | | | 273,335 | | | | 0.90 | (h) | | | 0.90 | (h) | | | 3.81 | | | | 141 | |
| | 10.05 | | | | 0.41 | | | | 26,758 | | | | 1.05 | | | | 5.37 | | | | 0.06 | | | | 39 | |
| | | | | | | | | | | | | | | | | | | | | | | | | | |
| | | | | | | | | | | | | | | | | | | | | | | | | | |
| $ | 9.62 | | | | 2.89 | | | $ | 1,612 | | | | 1.35 | | | | 1.99 | | | | 2.50 | | | | 307 | |
| | 9.34 | | | | (5.76 | ) | | | 1,871 | | | | 1.35 | | | | 2.04 | | | | 2.02 | | | | 732 | |
| | 10.13 | | | | 2.10 | | | | 1,139 | | | | 1.35 | | | | 2.91 | | | | 2.82 | | | | 139 | |
| | | | | | | | | | | | | | | | | | | | | | | | | | |
| | 9.55 | | | | 2.58 | | | | 48 | | | | 2.10 | | | | 2.74 | | | | 1.72 | | | | 307 | |
| | 9.31 | | | | (6.44 | ) | | | 99 | | | | 2.10 | | | | 2.65 | | | | 1.30 | | | | 732 | |
| | 10.11 | | | | 1.88 | | | | 12 | | | | 2.10 | | | | 3.90 | | | | 1.86 | | | | 139 | |
| | | | | | | | | | | | | | | | | | | | | | | | | | |
| | 9.62 | | | | 3.00 | | | | 24,111 | | | | 1.10 | | | | 1.74 | | | | 2.72 | | | | 307 | |
| | 9.33 | | | | (5.52 | ) | | | 28,550 | | | | 1.10 | | | | 1.72 | | | | 2.29 | | | | 732 | |
| | 10.13 | | | | 2.12 | | | | 27,528 | | | | 1.10 | | | | 2.98 | | | | 2.25 | | | | 139 | |
See accompanying notes to financial statements.
| 84
Notes to Financial Statements
June 30, 2012 (Unaudited)
1. Organization. Natixis Funds Trust II (the “Trust”) is organized as a Massachusetts business trust. The Trust is registered under the Investment Company Act of 1940, as amended (the “1940 Act”), as an open-end management investment company. The Declaration of Trust permits the Board of Trustees to authorize the issuance of an unlimited number of shares of the Trust in multiple series. The financial statements for certain funds of the Trust are presented in separate reports. The following funds (individually, a “Fund” and collectively, the “Funds”) are included in this report:
ASG Diversifying Strategies Fund (the “Diversifying Strategies Fund”)
ASG Global Alternatives Fund (the “Global Alternatives Fund”)
ASG Managed Futures Strategy Fund (the “Managed Futures Strategy Fund”)
Loomis Sayles Absolute Strategies Fund
Loomis Sayles Multi-Asset Real Return Fund (the “Multi-Asset Real Return Fund”)
Each Fund is a diversified investment company, except for Loomis Sayles Absolute Strategies Fund and Multi-Asset Real Return Fund, which are non-diversified investment companies.
Each Fund offers Class A, Class C and Class Y shares. Class A shares are sold with a maximum front-end sales charge of 5.75%, with the exception of Loomis Sayles Absolute Strategies Fund and Multi-Asset Real Return Fund which are sold with a maximum front-end sales charge of 4.50%. Class C shares do not pay a front-end sales charge, do not convert to any other class of shares, pay higher Rule 12b-1 fees than Class A shares and may be subject to a contingent deferred sales charge (“CDSC”) of 1.00% if those shares are redeemed within one year of acquisition, except for reinvested distributions. Class Y shares do not pay a front-end sales charge, a CDSC or Rule 12b-1 fees. Class Y shares are generally intended for institutional investors with a minimum initial investment of $100,000, though some categories of investors are exempted from the minimum investment amount as outlined in the Funds’ prospectus.
Most expenses of the Trust can be directly attributed to a Fund. Expenses which cannot be directly attributed to a Fund are generally apportioned based on the relative net assets of each of the funds in the Trust. Expenses of a Fund are borne pro rata by the holders of each class of shares, except that each class bears expenses unique to that class (including the Rule 12b-1 service and distribution fees). In addition, each class votes as a class only with respect to its own Rule 12b-1 Plan. Shares of each class would receive their pro rata share of the net assets of a Fund if the Fund were liquidated. The Trustees approve separate distributions from net investment income on each class of shares.
Each Fund, except Loomis Sayles Absolute Strategies Fund, invests in commodity-related instruments through investments in wholly-owned subsidiaries organized under the laws of the Cayman Islands. ASG Diversifying Strategies Cayman Fund Ltd., ASG Global Alternatives Cayman Fund Ltd., ASG Managed Futures Strategy Cayman Fund Ltd. and Loomis Sayles Multi-Asset Real Return Cayman Fund Ltd. are wholly-owned
85 |
Notes to Financial Statements (continued)
June 30, 2012 (Unaudited)
subsidiaries (individually, a “Subsidiary” and collectively, the “Subsidiaries”) of Diversifying Strategies Fund, Global Alternatives Fund, Managed Futures Strategy Fund and Multi-Asset Real Return Fund, respectively. Subscription agreements were entered into between the Funds and their respective Subsidiaries with the intent that each Fund will remain the sole shareholder and primary beneficiary of its respective Subsidiary. The Subsidiaries are governed by a separate Board of Directors that is independent of the Funds’ Board of Trustees.
As of June 30, 2012, the value of each Fund’s investment in its respective Subsidiary was as follows:
| | | | | | | | |
Fund | | Investment in Subsidiary | | | Percentage of Net Assets | |
Diversifying Strategies Fund | | $ | 8,450,231 | | | | 2.9 | % |
Global Alternatives Fund | | | 54,853,333 | | | | 3.9 | % |
Managed Futures Strategy Fund | | | 26,461,055 | | | | 3.4 | % |
Multi-Asset Real Return Fund | | | 3,874,309 | | | | 15.0 | % |
2. Significant Accounting Policies. The following is a summary of significant accounting policies consistently followed by each Fund in the preparation of its financial statements. The Funds’ financial statements are prepared in accordance with accounting principles generally accepted in the United States of America which require the use of management estimates that affect the reported amounts and disclosures in the financial statements. Actual results could differ from those estimates. Management has evaluated the events and transactions subsequent to period-end through the date the financial statements were issued and has determined that there were no material events that would require disclosure in the Funds’ financial statements.
a. Consolidation. The accompanying financial statements of each Fund, except Loomis Sayles Absolute Strategies Fund, present the consolidated accounts of the Funds and their respective Subsidiaries. All interfund accounts and transactions have been eliminated in consolidation.
b. Valuation. Equity securities, including shares of closed-end investment companies and exchange-traded funds, for which market quotations are readily available are valued at market value, as reported by independent pricing services recommended by the investment adviser and approved by the Board of Trustees. Such independent pricing services generally use the security’s last sale price on the exchange or market where the security is primarily traded or, if there is no reported sale during the day, the closing bid price. Securities traded on the NASDAQ Global Select Market, NASDAQ Global Market and NASDAQ Capital Market are valued at the NASDAQ Official Closing Price (“NOCP”), or if lacking a NOCP, at the most recent bid quotation on the applicable NASDAQ Market. Debt securities (other than short-term obligations purchased with an original or remaining maturity of sixty days or less) and unlisted equity securities are
| 86
Notes to Financial Statements (continued)
June 30, 2012 (Unaudited)
generally valued on the basis of evaluated bids furnished to the Funds by an independent pricing service recommended by the investment adviser or subadviser and approved by the Board of Trustees, which service determines valuations for normal, institutional-size trading units of such securities using market information, transactions for comparable securities and various relationships between securities which are generally recognized by institutional traders. Senior loans are priced at bid prices supplied by an independent pricing service, if available. Broker-dealer bid quotations may also be used to value debt and equity securities and senior loans where an independent pricing service is unable to price a security or where an independent pricing service does not provide a reliable price for the security. Forward foreign currency contracts are valued utilizing interpolated prices determined from information provided by an independent pricing service. Futures contracts are valued at their most recent settlement price. Credit default swap agreements are valued based on mid prices supplied by an independent pricing service, if available, or quotations obtained from broker-dealers. Commodity index total return swaps are priced based on the closing price of the reference asset that is supplied by an independent pricing service, if available, or quotations from a broker-dealer. Domestic exchange-traded single equity option contracts are valued at the mean of the National Best Bid and Offer quotations. Other exchange-traded options are valued at the average of the closing bid and ask quotations. Options on futures contracts are valued using the current settlement price. Currency options are priced at the mid price (between the ask price and the bid price) supplied by an independent pricing service, if available. Over-the-counter options contracts (including currency options not priced through an independent pricing service) are valued based on quotations obtained from broker-dealers. These quotations will be either the bid for a long transaction or the ask for a short transaction. Investments in other open-end investment companies are valued at their net asset value each day. Short-term obligations purchased with an original or remaining maturity of sixty days or less are valued at amortized cost, which approximates market value. Securities for which market quotations are not readily available are valued at fair value as determined in good faith by the Funds’ investment adviser or subadviser using consistently applied procedures under the general supervision of the Board of Trustees.
The Funds may hold securities traded in foreign markets. Foreign securities are valued at the market price in the foreign market. However, if events occurring after the close of the foreign market (but before the close of regular trading on the New York Stock Exchange) are believed to materially affect the value of those securities, such securities are fair valued pursuant to procedures approved by the Board of Trustees. When fair valuing securities, the Funds may, among other things, use modeling tools or other processes that may take into account factors such as securities market activity and/or significant events that occur after the close of the foreign market and before the Funds calculate their net asset values.
87 |
Notes to Financial Statements (continued)
June 30, 2012 (Unaudited)
c. Investment Transactions and Related Investment Income. Investment transactions are accounted for on a trade date plus one basis for daily net asset value calculation. However, for financial reporting purposes, investment transactions are reported on trade date. Dividend income is recorded on ex-dividend date, or in the case of certain foreign securities, as soon as a Fund is notified, and interest income is recorded on an accrual basis. Interest income is increased by the accretion of discount and decreased by the amortization of premium. Periodic principal adjustments for inflation-protected securities are recorded to interest income. Investment income is recorded net of foreign taxes withheld when applicable. In determining net gain or loss on securities sold, the cost of securities has been determined on an identified cost basis. Investment income, non-class specific expenses and realized and unrealized gains and losses are allocated on a pro rata basis to each class based on the relative net assets of each class to the total net assets of the Fund.
d. Foreign Currency Translation. The books and records of the Funds are maintained in U.S. dollars. The values of securities, currencies and other assets and liabilities denominated in currencies other than U.S. dollars are translated into U.S. dollars based upon foreign exchange rates prevailing at the end of the period. Purchases and sales of investment securities, income and expenses are translated on the respective dates of such transactions.
Since the values of investment securities are presented at the foreign exchange rates prevailing at the end of the period, it is not practical to isolate that portion of the results of operations arising from changes in exchange rates from fluctuations which arise due to changes in market prices of investment securities. Such changes are included with the net realized and unrealized gain or loss on investments.
Net realized foreign exchange gains or losses arise from sales of foreign currency, currency gains or losses realized between the trade and settlement dates on securities transactions and the difference between the amounts of dividends, interest and foreign withholding taxes recorded on the Funds’ books and the U.S. dollar equivalent of the amounts actually received or paid. Net unrealized foreign exchange gains and losses arise from changes in the value of assets and liabilities, other than investment securities, at the end of the fiscal period, resulting from changes in exchange rates.
Each Fund may use foreign currency exchange contracts to facilitate transactions in foreign-denominated investments. Losses may arise from changes in the value of the foreign currency or if the counterparties do not perform under the contracts’ terms.
e. Forward Foreign Currency Contracts. The Funds may enter into forward foreign currency contracts, including forward foreign cross currency contracts, to acquire exposure to foreign currencies or to hedge the Funds’ investments against currency fluctuation. A contract can also be used to offset a previous contract. These contracts involve market risk in excess of the unrealized gain or loss reflected in the Funds’
| 88
Notes to Financial Statements (continued)
June 30, 2012 (Unaudited)
Consolidated Statements of Assets and Liabilities. The U.S. dollar value of the currencies a Fund has committed to buy or sell represents the aggregate exposure to each currency a Fund has acquired or hedged through currency contracts outstanding at period end. Gains or losses are recorded for financial statement purposes as unrealized until settlement date. Risks may arise upon entering into these contracts from the potential inability of counterparties to meet the terms of their contracts and from unanticipated movements in the value of a foreign currency relative to the U.S. dollar. Certain contracts may require the movement of cash and/or securities as collateral for the Funds’ or counterparty’s net obligations under the contracts.
f. Futures Contracts. The Funds and the Subsidiaries may enter into futures contracts. Futures contracts are agreements between two parties to buy and sell a particular commodity, instrument or index for a specified price on a specified future date.
When a Fund or a Subsidiary enters into a futures contract, it is required to deposit with (or for the benefit of) its broker an amount of cash or short-term high-quality securities as “initial margin.” As the value of the contract changes, the value of the futures contract position increases or declines. Subsequent payments, known as “variation margin,” are made or received by a Fund or a Subsidiary, depending on the price fluctuations in the fair value of the contract and the value of cash or securities on deposit with the broker. The aggregate principal amounts of the contracts are not recorded in the financial statements. Fluctuations in the value of the contracts are recorded in the Consolidated Statements of Assets and Liabilities as an asset (liability) and in the Consolidated Statements of Operations as unrealized appreciation (depreciation) until the contracts are closed, when they are recorded as realized gains (losses). Realized gain or loss on a futures position is equal to the difference between the value of the contract at the time it was opened and the value at the time it was closed, minus brokerage commissions. When a Fund or a Subsidiary enters into a futures contract certain risks may arise, such as illiquidity in the futures market, which may limit a Fund’s or a Subsidiary’s ability to close out a futures contract prior to settlement date, and unanticipated movements in the value of securities, commodities or interest rates.
Futures contracts are exchange-traded. Exchange-traded futures are standardized contracts and are settled through a clearing house with fulfillment supported by the credit of the exchange. Therefore, counterparty credit risks to the Funds and the Subsidiaries are reduced.
g. Option Contracts. The Funds and the Subsidiaries may enter into option contracts. When a Fund purchases an option, it pays a premium and the option is subsequently marked to market to reflect current value. Premiums paid for purchasing options which expire are treated as realized losses. Premiums paid for purchasing options which are exercised are added to the cost or deducted from the proceeds on the underlying instrument to determine the realized gain or loss. If the Funds enter into a closing sale transaction, the difference between the premium paid and the proceeds of the closing sale transaction is treated as a realized gain or loss. The risk associated with purchasing options is limited to the premium paid.
89 |
Notes to Financial Statements (continued)
June 30, 2012 (Unaudited)
When a Fund writes an option, an amount equal to the net premium received (the premium less commission) is recorded as a liability and is subsequently adjusted to the current value. Net premiums received for written options which expire are treated as realized gains. Net premiums received for written options which are exercised are deducted from the cost or added to the proceeds on the underlying instrument to determine the realized gain or loss. If the Fund enters into a closing purchase transaction, the difference between the net premium received and any amount paid on effecting a closing purchase transaction, including commissions, is treated as a realized gain or, if the net premium received is less than the amount paid, as a realized loss. The Fund, as writer of a written option, bears the risk of an unfavorable change in the market value of the instrument underlying the written option.
Exchange-traded options are standardized contracts and are settled through a clearing house with fulfillment supported by the credit of the exchange. Therefore, counterparty credit risks to the Funds are reduced. Over-the-counter options are subject to the risk that the counterparty is unable or unwilling to meet its obligations under the option.
h. Swap Agreements. The Funds and the Subsidiaries may enter into credit default and total return swaps. A credit default swap is an agreement between two parties (the “protection buyer” and “protection seller”) to exchange the credit risk of an issuer (“reference obligation”) for a specified time period. The reference obligation may be one or more debt securities or an index of such securities. The Funds may be either the protection buyer or the protection seller. As a protection buyer, the Funds have the ability to hedge the downside risk of an issuer or group of issuers. As a protection seller, the Funds have the ability to gain exposure to an issuer or group of issuers whose bonds are unavailable or in short supply in the cash bond market, as well as realize additional income in the form of fees paid by the protection buyer. The protection buyer is obligated to pay the protection seller a stream of payments (“fees”) over the term of the contract, provided that no credit event, such as a default or a downgrade in credit rating, occurs on the reference obligation. The Funds may also pay or receive upfront premiums. If a credit event occurs, the protection seller must pay the protection buyer the difference between the agreed upon notional value and market value of the reference obligation. Market value in this case is determined by a facilitated auction whereby a minimum number of allowable broker bids, together with a specified valuation method, are used to calculate the value. The maximum potential amount of undiscounted future payments that a Fund as the protection seller could be required to make under a credit default swap agreement would be an amount equal to the notional amount of the agreement.
Implied credit spreads, represented in absolute terms, are disclosed in the Portfolio of Investments for those agreements for which the Fund is the protection seller. Implied credit spreads serve as an indicator of the current status of the payment/performance risk and represent the likelihood or risk of default for the credit derivative. The implied
| 90
Notes to Financial Statements (continued)
June 30, 2012 (Unaudited)
credit spread of a particular reference entity reflects the cost of buying/selling protection and may include upfront payments required to be made to enter into the agreement. Wider credit spreads represent a deterioration of the reference entity’s credit soundness and a greater likelihood or risk of default or other credit event occurring as defined under the terms of the agreement.
A total return swap is an agreement between two parties to exchange, for a specified period and based on the notional amount, the total return of an underlying asset for, typically, fixed or floating interest payments. When a fund pays interest in exchange for the total return of an underlying asset and the value of the underlying asset decreases, the fund may be required to pay the change in value to the counterparty in addition to the interest payment; conversely, when a fund receives interest in exchange for the total return of an underlying asset and the value of the underlying asset decreases, the fund may receive the change in value in addition to the interest payment. Total return swaps can also be structured without an interest payment, so that one party pays the other party if the value of the underlying asset increases and receives payments from the other party if the value of the underlying asset decreases.
The notional amounts of swap agreements are not recorded in the consolidated financial statements. Swap agreements are marked to market daily, and fluctuations in value are recorded in the Consolidated Statements of Operations as change in unrealized appreciation (depreciation) on swap agreements. Fees are accrued in accordance with the terms of the agreement and are recorded in the Consolidated Statements of Operations as realized gain or loss when received or paid. Upfront premiums paid or received by the Funds are recorded on the Consolidated Statements of Assets and Liabilities as an asset or liability, respectively, and are amortized or accreted over the term of the agreement and recorded as realized gain or loss. Payments made or received by the Funds as a result of a credit event or termination of the agreement are recorded as realized gain or loss.
Swap agreements are privately negotiated and traded between counterparties and, as such, are subject to the risk that a party to the agreement will not be able to meet its obligations. The Funds cover their net obligations under outstanding swap agreements by segregating or earmarking liquid assets or cash.
i. Due to/from Brokers. Transactions and positions in certain options, futures, forward foreign currency contracts and swap agreements are maintained and cleared by registered U.S. broker/dealers pursuant to customer agreements between the Funds or the Subsidiaries and the various broker/dealers. Due from brokers’ balances in the Consolidated Statements of Assets and Liabilities for Diversifying Strategies Fund, Global Alternatives Fund and Managed Futures Fund represent cash, foreign currency and any initial and/or variation margin applicable to open futures contracts and cash
91 |
Notes to Financial Statements (continued)
June 30, 2012 (Unaudited)
pledged as collateral for forward foreign currency contracts. Due to brokers’ balances in the Consolidated Statements of Assets and Liabilities represent securities received as collateral for forward foreign currency contracts and swap agreements for Loomis Sayles Absolute Strategies Fund and for forward foreign currency contracts and over-the-counter option contracts for Multi-Asset Real Return Fund. In certain circumstances the Funds’ or the Subsidiaries’ use of cash, securities and/or foreign currency held at brokers is restricted by regulation or broker mandated limits.
j. Federal and Foreign Income Taxes. The Trust treats each Fund as a separate entity for federal income tax purposes. Each Fund intends to meet the requirements of the Internal Revenue Code of 1986, as amended, applicable to regulated investment companies, and to distribute to its shareholders substantially all of its net investment income and any net realized capital gains at least annually. Management has performed an analysis of each Fund’s tax positions for the open tax years as of June 30, 2012 and has concluded that no provisions for income tax are required. The Funds’ federal tax returns for the prior three fiscal years, where applicable, remain subject to examination by the Internal Revenue Service. Management is not aware of any events that are reasonably possible to occur in the next six months that would result in the amounts of any unrecognized tax benefits significantly increasing or decreasing for the Funds. However, management’s conclusions regarding tax positions taken may be subject to review and adjustment at a later date based on factors including, but not limited to, new tax laws and accounting regulations and interpretations thereof.
Each Subsidiary is classified as a controlled foreign corporation under the Internal Revenue Code. As a U.S. shareholder of a controlled foreign corporation, each Fund will include in its taxable income its share of its Subsidiary’s current earnings and profits (including net realized gains). Any deficit generated by a Subsidiary will be disregarded for purposes of computing the Funds’ taxable income in the current period and also disregarded for all future periods.
A Fund may be subject to foreign taxes on income and gains on investments that are accrued based upon the Fund’s understanding of the tax rules and regulations that exist in the countries in which the Fund invests. Foreign governments may also impose taxes or other payments on investments with respect to foreign securities. Such taxes are accrued as applicable.
k. Dividends and Distributions to Shareholders. Dividends and distributions are recorded on ex-dividend date. The timing and characterization of certain income and capital gain distributions are determined annually in accordance with federal tax regulations, which may differ from accounting principles generally accepted in the United States of America. Permanent differences are primarily due to differing treatments for book and tax purposes of items such as paydown gains and losses, net operating losses, partnership basis adjustments, non-deductible expenses, dividend redesignations, contingent payment debt instruments, foreign currency transactions,
| 92
Notes to Financial Statements (continued)
June 30, 2012 (Unaudited)
Subsidiary income, distributions in excess of current earnings and premium amortization. Permanent book and tax basis differences relating to shareholder distributions, net investment income and net realized gains will result in reclassifications to capital accounts. Temporary differences between book and tax distributable earnings are primarily due to deferred Trustees’ fees, commissions on open futures contracts, wash sales, contingent payment debt instruments, unrealized gain/loss on open swap agreements, futures and forward contracts mark to market, partnership passive losses, premium amortization and Subsidiary and partnership basis adjustments. Distributions from net investment income and short-term capital gains are considered to be distributed from ordinary income for tax purposes.
The tax characterization of distributions is determined on an annual basis. The tax character of distributions paid to shareholders during the year ended December 31, 2011 was as follows:
| | | | | | | | | | | | |
| | | 2011 Distributions Paid From: | |
Fund | | Ordinary Income | | | Long-Term Capital Gains | | | Total | |
Diversifying Strategies Fund | | $ | 16,938,624 | | | $ | — | | | $ | 16,938,624 | |
Global Alternatives Fund | | | 1,778,959 | | | | 2,867,352 | | | | 4,646,311 | |
Managed Futures Strategy Fund | | | 21,604,427 | | | | — | | | | 21,604,427 | |
Loomis Sayles Absolute Strategies Fund | | | 17,061,729 | | | | 2,698 | | | | 17,064,427 | |
Multi-Asset Real Return Fund | | | 770,217 | | | | 29,110 | | | | 799,327 | |
Differences between these amounts and those reported in the Consolidated Statements of Changes in Net Assets are primarily attributable to different book and tax treatment for short-term capital gains.
As of December 31, 2011, the capital loss carryforwards and late year ordinary loss deferrals were as follows:
| | | | | | | | | | | | | | | | | | | | |
| | | Diversifying
Strategies
Fund | | | Global
Alternatives Fund | | | Managed
Futures
Strategy
Fund | | | Loomis Sayles
Absolute
Strategies
Fund | | | Multi-Asset
Real Return
Fund | |
Capital loss carryforward: | | | | | | | | | | | | | | | | | | | | |
Short-term: | | | | | | | | | | | | | | | | | | | | |
No expiration date | | $ | (28,581,031 | ) | | $ | (27,842,043 | ) | | $ | (20,422,668 | ) | | $ | (8,718,642 | ) | | $ | (4,196,341 | ) |
Long-term: | | | | | | | | | | | | | | | | | | | | |
No expiration date | | | (2,127,278 | ) | | | — | | | | (2,784,731 | ) | | | (3,652,873 | ) | | | — | |
| | | | | | | | | | | | | | | | | | | | |
Total capital loss carryforward | | $ | (30,708,309 | ) | | $ | (27,842,043 | ) | | $ | (23,207,399 | ) | | $ | (12,371,515 | ) | | $ | (4,196,341 | ) |
| | | | | | | | | | | | | | | | | | | | |
Late year ordinary loss deferral | | $ | (241,342 | ) | | $ | — | | | $ | — | | | $ | — | | | $ | (215,468 | ) |
| | | | | | | | | | | | | | | | | | | | |
93 |
Notes to Financial Statements (continued)
June 30, 2012 (Unaudited)
l. Repurchase Agreements. It is each Fund’s policy that the market value of the collateral for repurchase agreements be at least equal to 102% of the repurchase price, including interest. Certain repurchase agreements are tri-party arrangements whereby the collateral is held in a segregated account for the benefit of the Fund and on behalf of the counterparty. Repurchase agreements could involve certain risks in the event of default or insolvency of the counterparty including possible delays or restrictions upon a Fund’s ability to dispose of the underlying securities.
m. Securities Lending. Loomis Sayles Absolute Strategies Fund and Multi-Asset Real Return Fund have entered into an agreement with State Street Bank and Trust Company (“State Street Bank”), as agent of the Funds, to lend securities to certain designated borrowers. The loans are collateralized with cash or securities in an amount equal to at least 105% or 102% of the market value (including accrued interest) of the loaned international or domestic securities, respectively, when the loan is initiated. Thereafter, the value of the collateral must remain at least 102% of the market value (including accrued interest) of loaned securities for U.S. equities and U.S. corporate debt; at least 105% of the market value (including accrued interest) of loaned securities for non-U.S. equities; and at least 100% of the market value (including accrued interest) of loaned securities for U.S. Government securities, sovereign debt issued by non-U.S. Governments and non-U.S. corporate debt. In the event that the market value of the collateral falls below the required percentages described above, the borrower will deliver additional collateral on the next business day. As with other extensions of credit, the Funds may bear the risk of loss with respect to the investment of the collateral. The Funds invest cash collateral in short-term investments, a portion of the income from which is remitted to the borrowers and the remainder allocated between the Funds and State Street Bank as lending agent.
For the six months ended June 30, 2012, neither of the Funds had loaned securities under this agreement.
n. Indemnifications. Under the Trust’s organizational documents, its officers and Trustees are indemnified against certain liabilities arising out of the performance of their duties to the Funds. Additionally, in the normal course of business, the Funds enter into contracts with service providers that contain general indemnification clauses. The Funds’ maximum exposure under these arrangements is unknown as this would involve future claims that may be made against the Funds that have not yet occurred. However, based on experience, the Funds expect the risk of loss to be remote.
o. New Accounting Pronouncement. In December 2011, Accounting Standards Update (“ASU”) No. 2011-11, “Disclosures about Offsetting Assets and Liabilities”, was issued and is effective for interim and annual periods beginning after January 1, 2013. The ASU enhances disclosure requirements with respect to an entity’s rights of setoff and related arrangements associated with its financial and derivative instruments. Management is currently evaluating the impact the adoption of ASU 2011-11 may have on the Funds’ financial statement disclosures.
| 94
Notes to Financial Statements (continued)
June 30, 2012 (Unaudited)
3. Fair Value Measurements. In accordance with accounting standards related to fair value measurements and disclosures, the Funds have categorized the inputs utilized in determining the value of each Fund’s assets or liabilities. These inputs are summarized in the three broad levels listed below:
| | • | | Level 1 – quoted prices in active markets for identical assets or liabilities; |
| | • | | Level 2 – prices determined using other significant inputs that are observable either directly, or indirectly through corroboration with observable market data (which could include quoted prices for similar assets or liabilities, interest rates, credit risk, etc.); and |
| | • | | Level 3 – prices determined using significant unobservable inputs when quoted prices or observable inputs are unavailable such as when there is little or no market activity for an asset or liability (unobservable inputs reflect each Fund’s own assumptions in determining the fair value of assets or liabilities and would be based on the best information available). |
The inputs or methodology used for valuing securities are not necessarily an indication of the risk associated with investing in those securities.
The following is a summary of the inputs used to value the Funds’ investments as of June 30, 2012, at value:
Diversifying Strategies Fund
Asset Valuation Inputs
| | | | | | | | | | | | | | | | |
Description | | Level 1 | | | Level 2 | | | Level 3 | | | Total | |
Short-Term Investments(a) | | $ | — | | | $ | 279,071,386 | | | $ | — | | | $ | 279,071,386 | |
Forward Foreign Currency Contracts (unrealized appreciation) | | | — | | | | 821,684 | | | | — | | | | 821,684 | |
Futures Contracts (unrealized appreciation) | | | 2,999,328 | | | | — | | | | — | | | | 2,999,328 | |
| | | | | | | | | | | | | | | | |
Total | | $ | 2,999,328 | | | $ | 279,893,070 | | | $ | — | | | $ | 282,892,398 | |
| | | | | | | | | | | | | | | | |
|
| Liability Valuation Inputs | |
Description | | Level 1 | | | Level 2 | | | Level 3 | | | Total | |
Forward Foreign Currency Contracts (unrealized depreciation) | | $ | — | | | $ | (1,753,605 | ) | | $ | — | | | $ | (1,753,605 | ) |
Futures Contracts (unrealized depreciation) | | | (6,556,697 | ) | | | — | | | | — | | | | (6,556,697 | ) |
| | | | | | | | | | | | | | | | |
Total | | $ | (6,556,697 | ) | | $ | (1,753,605 | ) | | $ | — | | | $ | (8,310,302 | ) |
| | | | | | | | | | | | | | | | |
| (a) | Details of the major categories of the Fund’s investments are reflected within the Consolidated Portfolio of Investments. |
For the six months ended June 30, 2012, there were no transfers between Levels 1, 2 and 3.
95 |
Notes to Financial Statements (continued)
June 30, 2012 (Unaudited)
Global Alternatives Fund
Asset Valuation Inputs
| | | | | | | | | | | | | | | | |
Description | | Level 1 | | | Level 2 | | | Level 3 | | | Total | |
Short-Term Investments(a) | | $ | — | | | $ | 1,297,660,986 | | | $ | — | | | $ | 1,297,660,986 | |
Forward Foreign Currency Contracts (unrealized appreciation) | | | — | | | | 3,336,880 | | | | — | | | | 3,336,880 | |
Futures Contracts (unrealized appreciation) | | | 16,870,826 | | | | — | | | | — | | | | 16,870,826 | |
| | | | | | | | | | | | | | | | |
Total | | $ | 16,870,826 | | | $ | 1,300,997,866 | | | $ | — | | | $ | 1,317,868,692 | |
| | | | | | | | | | | | | | | | |
Liability Valuation Inputs
| | | | | | | | | | | | | | | | |
Description | | Level 1 | | | Level 2 | | | Level 3 | | | Total | |
Forward Foreign Currency Contracts (unrealized depreciation) | | $ | — | | | $ | (933,701 | ) | | $ | — | | | $ | (933,701 | ) |
Futures Contracts (unrealized depreciation) | | | (5,628,577 | ) | | | — | | | | — | | | | (5,628,577 | ) |
| | | | | | | | | | | | | | | | |
Total | | $ | (5,628,577 | ) | | $ | (933,701 | ) | | $ | — | | | $ | (6,562,278 | ) |
| | | | | | | | | | | | | | | | |
| (a) | Details of the major categories of the Fund’s investments are reflected within the Consolidated Portfolio of Investments. |
For the six months ended June 30, 2012, there were no transfers between Levels 1, 2 and 3.
Managed Futures Strategy Fund
Asset Valuation Inputs
| | | | | | | | | | | | | | | | |
Description | | Level 1 | | | Level 2 | | | Level 3 | | | Total | |
Short-Term Investments(a) | | $ | — | | | $ | 695,832,447 | | | $ | — | | | $ | 695,832,447 | |
Forward Foreign Currency Contracts (unrealized appreciation) | | | — | | | | 1,841,653 | | | | — | | | | 1,841,653 | |
Futures Contracts (unrealized appreciation) | | | 9,425,709 | | | | — | | | | — | | | | 9,425,709 | |
| | | | | | | | | | | | | | | | |
Total | | $ | 9,425,709 | | | $ | 697,674,100 | | | $ | — | | | $ | 707,099,809 | |
| | | | | | | | | | | | | | | | |
| 96
Notes to Financial Statements (continued)
June 30, 2012 (Unaudited)
Managed Futures Strategy Fund (continued)
Liability Valuation Inputs
| | | | | | | | | | | | | | | | |
Description | | Level 1 | | | Level 2 | | | Level 3 | | | Total | |
Forward Foreign Currency Contracts (unrealized depreciation) | | $ | — | | | $ | (4,047,004 | ) | | $ | — | | | $ | (4,047,004 | ) |
Futures Contracts (unrealized depreciation) | | | (10,748,142 | ) | | | — | | | | — | | | | (10,748,142 | ) |
| | | | | | | | | | | | | | | | |
Total | | $ | (10,748,142 | ) | | $ | (4,047,004 | ) | | $ | — | | | $ | (14,795,146 | ) |
| | | | | | | | | | | | | | | | |
| (a) | Details of the major categories of the Fund’s investments are reflected within the Consolidated Portfolio of Investments. |
For the six months ended June 30, 2012, there were no transfers between Levels 1, 2 and 3.
Loomis Sayles Absolute Strategies Fund
Asset Valuation Inputs
| | | | | | | | | | | | | | | | |
Description | | Level 1 | | | Level 2 | | | Level 3 | | | Total | |
Bonds and Notes | | | | | | | | | | | | | | | | |
Non-Convertible Bonds | | | | | | | | | | | | | | | | |
Airlines | | $ | — | | | $ | 3,874,206 | | | $ | 5,240,625 | (b) | | $ | 9,114,831 | |
All Other Non-Convertible Bonds(a) | | | — | | | | 328,285,876 | | | | — | | | | 328,285,876 | |
| | | | | | | | | | | | | | | | |
Total Non-Convertible Bonds | | | — | | | | 332,160,082 | | | | 5,240,625 | | | | 337,400,707 | |
| | | | | | | | | | | | | | | | |
Convertible Bonds(a) | | | — | | | | 12,766,400 | | | | — | | | | 12,766,400 | |
| | | | | | | | | | | | | | | | |
Total Bonds and Notes | | | — | | | | 344,926,482 | | | | 5,240,625 | | | | 350,167,107 | |
| | | | | | | | | | | | | | | | |
Senior Loans(a) | | | — | | | | 37,443,040 | | | | — | | | | 37,443,040 | |
Common Stocks(a) | | | 22,198,584 | | | | — | | | | — | | | | 22,198,584 | |
Preferred Stocks | | | | | | | | | | | | | | | | |
Convertible Preferred Stocks(a) | | | 5,349,040 | | | | — | | | | — | | | | 5,349,040 | |
Non-Convertible Preferred Stocks(a) | | | 2,764,200 | | | | 2,307,447 | | | | — | | | | 5,071,647 | |
| | | | | | | | | | | | | | | | |
Total Preferred Stocks | | | 8,113,240 | | | | 2,307,447 | | | | — | | | | 10,420,687 | |
| | | | | | | | | | | | | | | | |
Purchased Options(a) | | | 393,000 | | | | — | | | | — | | | | 393,000 | |
Short-Term Investments | | | — | | | | 49,991,050 | | | | — | | | | 49,991,050 | |
| | | | | | | | | | | | | | | | |
Total Investments | | | 30,704,824 | | | | 434,668,019 | | | | 5,240,625 | | | | 470,613,468 | |
| | | | | | | | | | | | | | | | |
Credit Default Swap Agreements (unrealized appreciation) | | | — | | | | 639,283 | | | | — | | | | 639,283 | |
Forward Foreign Currency Contracts (unrealized appreciation) | | | — | | | | 1,726,346 | | | | — | | | | 1,726,346 | |
Futures Contracts (unrealized appreciation) | | | 276,182 | | | | — | | | | — | | | | 276,182 | |
| | | | | | | | | | | | | | | | |
Total | | $ | 30,981,006 | | | $ | 437,033,648 | | | $ | 5,240,625 | | | $ | 473,255,279 | |
| | | | | | | | | | | | | | | | |
97 |
Notes to Financial Statements (continued)
June 30, 2012 (Unaudited)
Loomis Sayles Absolute Strategies Fund (continued)
Liability Valuation Inputs
| | | | | | | | | | | | | | | | |
Description | | Level 1 | | | Level 2 | | | Level 3 | | | Total | |
Credit Default Swap Agreements (unrealized depreciation) | | $ | — | | | $ | (4,621,455 | ) | | $ | — | | | $ | (4,621,455 | ) |
Forward Foreign Currency Contracts (unrealized depreciation) | | | — | | | | (2,599,261 | ) | | | — | | | | (2,599,261 | ) |
Futures Contracts (unrealized depreciation) | | | (743,507 | ) | | | — | | | | — | | | | (743,507 | ) |
| | | | | | | | | | | | | | | | |
Total | | $ | (743,507 | ) | | $ | (7,220,716 | ) | | $ | — | | | $ | (7,964,223 | ) |
| | | | | | | | | | | | | | | | |
| (a) | Details of the major categories of the Fund’s investments are reflected within the Portfolio of Investments. |
| (b) | Valued using broker-dealer bid quotations. |
The Fund’s pricing policies and procedures are recommended by the investment adviser and approved by the Board of Trustees. Debt securities are generally valued on the basis of evaluated bids furnished to the Fund by an independent pricing service. Broker-dealer bid quotations may be used if an independent pricing service either is unable to price a security or does not provide a reliable price for a security. Broker-dealer bid quotations for which the Fund does not have knowledge of the inputs used by the broker-dealer are categorized in Level 3. All security prices, including those obtained from an independent pricing service and broker-dealer bid quotations, are reviewed on a daily basis by the investment adviser, subject to oversight by Fund management and the Board of Trustees. If the investment adviser, in good faith, believes that the price provided by an independent pricing service is unreliable, broker-dealer bid quotations may be used until the price provided by the independent pricing service is considered to be reliable. Reliability of all security prices, including those obtained from an independent pricing service and broker-dealer bid quotations, is tested in a variety of ways, including comparison to recent transaction prices and daily fluctuations, amongst other validation procedures in place.
For the six months ended June 30, 2012, there were no transfers between Levels 1, 2 and 3.
| 98
Notes to Financial Statements (continued)
June 30, 2012 (Unaudited)
Multi-Asset Real Return Fund
Asset Valuation Inputs
| | | | | | | | | | | | | | | | |
Description | | Level 1 | | | Level 2 | | | Level 3 | | | Total | |
Bonds and Notes(a) | | $ | — | | | $ | 11,483,852 | | | $ | — | | | $ | 11,483,852 | |
Senior Loans(a) | | | — | | | | 254,723 | | | | — | | | | 254,723 | |
Common Stocks(a) | | | 2,745,316 | | | | — | | | | — | | | | 2,745,316 | |
Preferred Stocks(a) | | | 447,150 | | | | — | | | | — | | | | 447,150 | |
Exchange Traded Funds | | | 2,358,530 | | | | — | | | | — | | | | 2,358,530 | |
Purchased Options(a) | | | 236,375 | | | | 66,698 | | | | — | | | | 303,073 | |
Short-Term Investments | | | — | | | | 6,978,823 | | | | — | | | | 6,978,823 | |
| | | | | | | | | | | | | | | | |
Total Investments | | | 5,787,371 | | | | 18,784,096 | | | | — | | | | 24,571,467 | |
| | | | | | | | | | | | | | | | |
Credit Default Swap Agreements (unrealized appreciation) | | | — | | | | 12,928 | | | | — | | | | 12,928 | |
Forward Foreign Currency Contracts (unrealized appreciation) | | | — | | | | 114,500 | | | | — | | | | 114,500 | |
Futures Contracts (unrealized appreciation) | | | 29,514 | | | | — | | | | — | | | | 29,514 | |
| | | | | | | | | | | | | | | | |
Total | | $ | 5,816,885 | | | $ | 18,911,524 | | | $ | — | | | $ | 24,728,409 | |
| | | | | | | | | | | | | | | | |
Liability Valuation Inputs
| | | | | | | | | | | | | | | | |
Description | | Level 1 | | | Level 2 | | | Level 3 | | | Total | |
Written Options(a) | | $ | (41,875 | ) | | $ | (18,701 | ) | | $ | — | | | $ | (60,576 | ) |
Credit Default Swap Agreements (unrealized depreciation) | | | — | | | | (33,859 | ) | | | — | | | | (33,859 | ) |
Forward Foreign Currency Contracts (unrealized depreciation) | | | — | | | | (52,632 | ) | | | — | | | | (52,632 | ) |
Futures Contracts (unrealized depreciation) | | | (159,031 | ) | | | — | | | | — | | | | (159,031 | ) |
| | | | | | | | | | | | | | | | |
Total | | $ | (200,906 | ) | | $ | (105,192 | ) | | $ | — | | | $ | (306,098 | ) |
| | | | | | | | | | | | | | | | |
| (a) | Details of the major categories of the Fund’s investments are reflected within the Consolidated Portfolio of Investments. |
For the six months ended June 30, 2012, there were no transfers between Levels 1, 2 and 3.
99 |
Notes to Financial Statements (continued)
June 30, 2012 (Unaudited)
The following is a reconciliation of Level 3 investments for which significant unobservable inputs were used to determine fair value as of June 30, 2012:
Loomis Sayles Absolute Strategies Fund
Asset Valuation Inputs
| | | | | | | | | | | | | | | | | | | | |
Investments in Securities | | Balance as of
December 31,
2011 | | | Accrued
Discounts
(Premiums) | | | Realized
Gain
(Loss) | | | Change in
Unrealized
Appreciation
(Depreciation) | | | Purchases | |
Bonds and Notes | | | | | | | | | | | | | | | | | | | | |
Non-Convertible Bonds | | | | | | | | | | | | | | | | | | | | |
Airlines | | $ | — | | | $ | — | | | $ | — | | | $ | 80,625 | | | $ | 5,160,000 | |
Treasuries | | | 11,102,109 | | | | 7,469 | | | | (2,476,846 | ) | | | 2,641,210 | | | | — | |
| | | | | | | | | | | | | | | | | | | | |
Total | | $ | 11,102,109 | | | $ | 7,469 | | | $ | (2,476,846 | ) | | $ | 2,721,835 | | | $ | 5,160,000 | |
| | | | | | | | | | | | | | | | | | | | |
| | | | | | | | | | | | | | | | | | | | |
Investments in Securities | | Sales | | | Transfers
into Level 3 | | | Transfers
out of
Level 3 | | | Balance as of
June 30, 2012 | | | Change in
Unrealized
Appreciation
(Depreciation)
from
Investments
Still Held at
June 30,
2012 | |
Bonds and Notes | | | | | | | | | | | | | | | | | | | | |
Non-Convertible Bonds | | | | | | | | | | | | | | | | | | | | |
Airlines | | $ | — | | | $ | — | | | $ | — | | | $ | 5,240,625 | | | $ | 80,625 | |
Treasuries | | | (11,273,942 | ) | | | — | | | | — | | | | — | | | | — | |
| | | | | | | | | | | | | | | | | | | | |
Total | | $ | (11,273,942 | ) | | $ | — | | | $ | — | | | $ | 5,240,625 | | | $ | 80,625 | |
| | | | | | | | | | | | | | | | | | | | |
Multi-Asset Real Return Fund
Asset Valuation Inputs
| | | | | | | | | | | | | | | | | | | | |
Investments in Securities | | Balance as of
December 31,
2011 | | | Accrued
Discounts
(Premiums) | | | Realized
Gain (Loss) | | | Change in
Unrealized
Appreciation
(Depreciation) | | | Purchases | |
Purchased Options | | $ | 29,702 | | | $ | — | | | $ | (23,665 | ) | | $ | 4,063 | | | $ | — | |
| | | | | | | | | | | | | | | | | | | | |
| 100
Notes to Financial Statements (continued)
June 30, 2012 (Unaudited)
Multi-Asset Real Return Fund (continued)
| | | | | | | | | | | | | | | | | | | | |
Investments in Securities | | Sales | | | Transfers
into Level 3 | | | Transfers
out of
Level 3 | | | Balance as of
June 30,
2012 | | | Change in
Unrealized
Appreciation
(Depreciation)
from
Investments
Still Held at
June 30,
2012 | |
Purchased Options | | $ | (10,100 | ) | | $ | — | | | $ | — | | | $ | — | | | $ | — | |
| | | | | | | | | | | | | | | | | | | | |
Liability Valuation Inputs
| | | | | | | | | | | | | | | | | | | | |
Investments in Securities | | Balance as of
December 31,
2011 | | | Accrued
Discounts
(Premiums) | | | Realized
Gain (Loss) | | | Change in
Unrealized
Appreciation
(Depreciation) | | | Options
Closed | |
Written Options | | $ | (6,044 | ) | | $ | — | | | $ | 5,515 | | | $ | (121 | ) | | $ | 650 | |
| | | | | | | | | | | | | | | | | | | | |
| | | | | | | | | | | | | | | | | | | | |
Investments in Securities | | Options
Written | | | Transfers
into Level 3 | | | Transfers
out of
Level 3 | | | Balance as of
June 30,
2012 | | | Change in
Unrealized
Appreciation
(Depreciation)
from
Investments
Still Held at
June 30,
2012 | |
Written Options | | $ | — | | | $ | — | | | $ | — | | | $ | — | | | $ | — | |
| | | | | | | | | | | | | | | | | | | | |
4. Derivatives. Derivative instruments are defined as financial instruments whose value and performance are based on the value and performance of another security or financial instrument. Derivative instruments that certain Funds used during the period include forward foreign currency contracts, futures contracts, option contracts and swap agreements (including credit default and total return swaps).
Diversifying Strategies Fund seeks to generate positive absolute returns over time rather than track the performance of any particular index. The Fund uses multiple quantitative investment models and strategies, each of which has an absolute return objective and may involve a broad range of market exposures. These market exposures, which are expected to change over time, may include exposures to the returns of equity and fixed income securities, currencies and commodities. Under normal market conditions, the Fund will make extensive use of a variety of derivative instruments, in particular futures
101 |
Notes to Financial Statements (continued)
June 30, 2012 (Unaudited)
and forward contracts, to capture the exposures suggested by its absolute return strategies while also adding value through volatility management and correlation management. During the six months ended June 30, 2012, the Fund used long contracts on short-term interest rates and long and short contracts on U.S. and foreign equity market indices, U.S. and foreign government bonds, foreign currencies and commodities (through investments in the Subsidiary), to capture the exposures suggested by the quantitative investment models. The Fund also used short contracts on U.S. and foreign equity market indices to hedge correlation to the global equity markets.
Global Alternatives Fund seeks to achieve long and short exposure to global equity, bond, currency and commodity markets through a wide range of derivative instruments and direct investments. These investments are intended to provide the Fund with risk and return characteristics similar to those of a diversified portfolio of hedge funds. The Fund uses quantitative models to estimate the market exposures that drive the aggregate returns of a diverse set of hedge funds, and seeks to use a variety of derivative instruments to capture such exposures in the aggregate. Under normal market conditions, the Fund will make extensive use of derivative instruments, in particular futures and forward contracts on global equity and fixed income securities, securities indices, currencies, commodities and other instruments. During the six months ended June 30, 2012, the Fund used long contracts on U.S. and foreign equity market indices, U.S. and foreign government bonds, and short-term interest rates, and long and short contracts on commodities (through investments in the Subsidiary) and foreign currencies in accordance with these objectives.
Managed Futures Strategy Fund seeks to generate positive absolute returns over time. The Fund uses a proprietary quantitative model to identify price trends in equity, fixed income, currency and commodity instruments, and may have both short and long exposures within an asset class based on an analysis of trends in a particular asset class. Under normal market conditions, the Fund will make extensive use of derivative instruments, in particular futures and forward contracts, to capture the exposures suggested by its absolute return strategy while also adding value through volatility management. These market exposures, which are expected to change over time, may include exposures to the returns of U.S. and non-U.S. equity and fixed income securities indices, currencies and commodities. During the six months ended June 30, 2012, the Fund used long and short contracts on U.S. and foreign equity market indices, U.S. and foreign government bonds, foreign currencies, commodities (through investments in the Subsidiary), and short-term interest rates in accordance with these objectives.
Loomis Sayles Absolute Strategies Fund seeks to achieve positive total returns over a full market cycle. The Fund pursues its objective by utilizing a flexible investment approach that allocates investments across a global range of investment opportunities related to credit, currencies and interest rates, while employing risk management techniques to mitigate downside risk. At times, the Fund expects to gain its investment
| 102
Notes to Financial Statements (continued)
June 30, 2012 (Unaudited)
exposure substantially through the use of derivatives, including forward foreign currency contracts, futures contracts, option contracts and swap agreements. During the six months ended June 30, 2012, the Fund used forward foreign currency and option contracts and credit default swap agreements (as a protection seller) to gain investment exposures in accordance with its objective.
Multi-Asset Real Return Fund seeks to maximize real returns through exposure to investments in fixed-income securities, equity securities, currencies, and commodity linked instruments (through investments in the Subsidiary). The Fund expects that its exposure to these asset classes will often be obtained substantially through the use of derivative instruments, including forward foreign currency, futures and option contracts and swap agreements. During the six months ended June 30, 2012, the Fund used forward foreign currency, futures and options contracts, credit default swap agreements (as a protection seller) and total return swap agreements to gain investment exposures in accordance with its objective.
Certain Funds are subject to the risk that changes in interest rates will affect the value of the Funds’ investments in fixed income securities. A Fund will be subject to increased interest rate risk to the extent that it invests in fixed-income securities with longer maturities or durations, as compared to investing in fixed-income securities with shorter maturities or durations. Loomis Sayles Absolute Strategies Fund and Multi-Asset Real Return Fund may use futures contracts to hedge against changes in interest rates and to manage their duration without having to buy or sell portfolio securities. During the six months ended June 30, 2012, Loomis Sayles Absolute Strategies Fund and Multi-Asset Real Return Fund engaged in futures contracts for hedging purposes and to manage duration.
The Funds are subject to the risk that changes in foreign currency exchange rates will have an unfavorable effect on the value of Fund assets denominated in foreign currencies. The Funds may enter into forward foreign currency exchange contracts and option contracts for hedging purposes to protect the value of the Funds’ holdings of foreign securities. During the six months ended June 30, 2012, Loomis Sayles Absolute Strategies Fund and Multi-Asset Real Return Fund engaged in forward foreign currency and option transactions for hedging purposes.
The Funds are subject to the risk that companies in which the Funds invest will fail financially or otherwise be unwilling or unable to meet their obligations to the Funds. Loomis Sayles Absolute Strategies Fund and Multi-Asset Real Return Fund may use credit default swaps, as a protection buyer, to hedge their credit exposure to issuers of bonds they hold without having to sell the bonds. During the six months ended June 30, 2012, Loomis Sayles Absolute Strategies Fund and Multi-Asset Real Return Fund engaged in credit default swap transactions as a protection buyer to hedge their credit exposure.
Certain Funds are subject to the risk of unpredictable declines in the value of individual equity securities and periods of below-average performance in individual securities or
103 |
Notes to Financial Statements (continued)
June 30, 2012 (Unaudited)
in the equity market as a whole. Loomis Sayles Absolute Strategies Fund and Multi-Asset Real Return Fund may use futures contracts, purchased put options and written call options to hedge against a decline in value of an equity security that it owns. The Funds may also write put options to offset the cost of options used for hedging purposes. During the six months ended June 30, 2012, Loomis Sayles Absolute Strategies Fund and Multi-Asset Real Return Fund engaged in futures and option transactions for hedging purposes.
Each Fund is party to agreements with counterparties that govern transactions in forward foreign currency contracts, over-the-counter options and swap agreements. These agreements contain credit-risk-related contingent features that allow the counterparties to terminate open contracts early if the net asset value of a Fund declines beyond a certain threshold. If such features were to be triggered, the counterparties could request immediate settlement of open contracts at current fair value. As of June 30, 2012, the fair value of derivative positions (including open trades) subject to credit-risk-related contingent features that are in a net liability position by counterparty, and the value of collateral pledged to counterparties for such contracts is as follows:
| | | | | | | | | | |
Fund | | Counterparty | | Derivatives | | | Collateral Pledged | |
Diversifying Strategies Fund | | UBS AG | | $ | (931,921 | ) | | $ | 2,869,137 | |
Managed Futures Strategy Fund | | UBS AG | | | (2,205,351 | ) | | | 5,259,680 | |
Loomis Sayles Absolute Strategies Fund | | Credit Suisse AG | | | (1,194,679 | ) | | | 892,856 | |
| | Credit Suisse International | | | (1,074,924 | ) | | | — | |
| | Deutsche Bank AG | | | (1,265,483 | ) | | | 1,285,793 | |
| | Morgan Stanley Capital Services Inc. | | | (739,899 | ) | | | 690,889 | |
| | UBS AG | | | (742,298 | ) | | | 745,880 | |
Multi-Asset Real Return Fund | | Credit Suisse International | | | (14,966 | ) | | | — | |
Forward foreign currency contracts, over-the-counter options and swap agreements are subject to the risk that the counterparty will be unwilling or unable to meet its obligations under the contracts. The Funds have mitigated this risk by entering into master netting agreements with counterparties that allow the Fund and the counterparty to offset amounts owed by each related to derivative contracts to one net amount payable by either the Fund or the counterparty. The maximum amount of loss that the Funds would incur if counterparties failed to meet their obligations, and the amount of loss that the Funds would incur after taking into account master netting arrangements are as follows as of June 30, 2012:
| | | | | | | | |
Fund | | Maximum Amount
of Loss - Gross | | | Maximum Amount of Loss - Net | |
Diversifying Strategies Fund | | $ | 821,684 | | | $ | — | |
Global Alternatives Fund | | | 3,336,880 | | | | 2,403,179 | |
Managed Futures Strategy Fund | | | 1,841,653 | | | | — | |
Loomis Sayles Absolute Strategies Fund | | | 6,377,044 | | | | 3,999,793 | |
Multi-Asset Real Return Fund | | | 381,352 | | | | 305,106 | |
| 104
Notes to Financial Statements (continued)
June 30, 2012 (Unaudited)
These amounts do not take into account the value of collateral received by the Funds as follows:
| | | | |
Fund | | Collateral Received | |
Loomis Sayles Absolute Strategies Fund | | $ | 4,263,838 | |
Multi-Asset Real Return Fund | | | 260,905 | |
The Funds generally receive U.S. government and agency securities as collateral. Collateral is valued in accordance with the Funds’ valuation policies and is recorded on the Consolidated Statements of Assets and Liabilities.
Counterparty risk is managed based on policies and procedures established by each Fund’s adviser. Such policies and procedures may include, but are not limited to, minimum counterparty credit rating requirements, monitoring of counterparty credit default swap spreads and posting of collateral. Collateral is posted based on the requirements established under International Swap and Derivative Association (“ISDA”) agreements negotiated between each Fund and the derivative counterparties. In lieu of receiving cash collateral, Diversifying Strategies Fund, Global Alternatives Fund and Managed Futures Strategy Fund may use unrealized gains on forward foreign currency contracts to meet counterparty margin requirements for open positions. This risk of loss to a Fund from counterparty default should be limited to the extent a Fund is undercollateralized; however, final settlement of a Fund’s claim against any collateral received may be subject to bankruptcy court proceedings.
The following is a summary of derivative instruments for Diversifying Strategies Fund as of June 30, 2012:
| | | | | | | | | | | | | | | | |
Consolidated Statements of Assets and
Liabilities Caption | | Interest
Rate
Contracts | | | Foreign Exchange
Contracts | | | Equity Contracts | | | Commodity
Contracts | |
Assets | | | | | | | | | | | | | | | | |
Unrealized appreciation on forward foreign currency contracts | | $ | — | | | $ | 821,684 | | | $ | — | | | $ | — | |
Unrealized appreciation on futures contracts | | | 1,114,904 | | | | — | | | | 1,089,140 | | | | 795,284 | |
Liabilities | | | | | | | | | | | | | | | | |
Unrealized depreciation on forward foreign currency contracts | | | — | | | | (1,753,605 | ) | | | — | | | | — | |
Unrealized depreciation on futures contracts | | | (4,069,548 | ) | | | — | | | | (1,434,202 | ) | | | (1,052,947 | ) |
105 |
Notes to Financial Statements (continued)
June 30, 2012 (Unaudited)
Transactions in derivative instruments for Diversifying Strategies Fund during the six months ended June 30, 2012 were as follows:
| | | | | | | | | | | | | | | | |
Consolidated Statements of
Operations Caption | | Interest
Rate
Contracts | | | Foreign
Exchange
Contracts | | | Equity Contracts | | | Commodity
Contracts | |
Net Realized Gain (Loss) on: | | | | | | | | | | | | | | | | |
Foreign currency transactions* | | $ | — | | | $ | (18,590,559 | ) | | $ | — | | | $ | — | |
Futures contracts | | | 16,318,590 | | | | — | | | | (1,478,905 | ) | | | (5,408,574 | ) |
Net Change in Unrealized Appreciation (Depreciation) on: | | | | | | | | | | | | | | | | |
Foreign currency translations* | | | — | | | | (1,894,582 | ) | | | — | | | | — | |
Futures contracts | | | (7,455,274 | ) | | | — | | | | 378,969 | | | | 839,402 | |
| * | Represents realized loss and change in unrealized appreciation (depreciation), respectively, for forward foreign currency contracts during the period. |
The following is a summary of derivative instruments for Global Alternatives Fund as of June 30, 2012:
| | | | | | | | | | | | | | | | |
Consolidated Statements of Assets
and Liabilities Caption | | Interest
Rate
Contracts | | | Foreign Exchange
Contracts | | | Equity
Contracts | | | Commodity
Contracts | |
Assets | | | | | | | | | | | | | | | | |
Unrealized appreciation on forward foreign currency contracts | | $ | — | | | $ | 3,336,880 | | | $ | — | | | $ | — | |
Unrealized appreciation on futures contracts | | | 1,721,116 | | | | — | | | | 9,530,127 | | | | 5,619,583 | |
Liabilities | | | | | | | | | | | | | | | | |
Unrealized depreciation on forward foreign currency contracts | | | — | | | | (933,701 | ) | | | — | | | | — | |
Unrealized depreciation on futures contracts | | | (3,733,590 | ) | | | — | | | | — | | | | (1,894,987 | ) |
| 106
Notes to Financial Statements (continued)
June 30, 2012 (Unaudited)
Transactions in derivative instruments for Global Alternatives Fund during the six months ended June 30, 2012 were as follows:
| | | | | | | | | | | | | | | | |
Consolidated Statements of
Operations Caption | | Interest
Rate
Contracts | | | Foreign
Exchange
Contracts | | | Equity Contracts | | | Commodity
Contracts | |
Net Realized Gain (Loss) on: | | | | | | | | | | | | | | | | |
Foreign currency transactions* | | $ | — | | | $ | (18,960,731) | | | $ | — | | | $ | — | |
Futures contracts | | | 22,720,199 | | | | — | | | | (3,495,134) | | | | (44,684,733) | |
Net Change in Unrealized Appreciation (Depreciation) on: | | | | | | | | | | | | | | | | |
Foreign currency translations* | | | — | | | | (867,295) | | | | — | | | | — | |
Futures contracts | | | (4,652,250) | | | | — | | | | 6,267,272 | | | | 7,430,552 | |
| * | Represents realized loss and change in unrealized appreciation (depreciation), respectively, for forward foreign currency contracts during the period. |
The following is a summary of derivative instruments for Managed Futures Strategy Fund as of June 30, 2012:
| | | | | | | | | | | | | | | | |
Consolidated Statements of
Assets and Liabilities Caption | | Interest
Rate
Contracts | | | Foreign Exchange
Contracts | | | Equity
Contracts | | | Commodity
Contracts | |
Assets | | | | | | | | | | | | | | | | |
Unrealized appreciation on forward foreign currency contracts | | $ | — | | | $ | 1,841,653 | | | $ | — | | | $ | — | |
Unrealized appreciation on futures contracts | | | 5,351,613 | | | | — | | | | 1,905,151 | | | | 2,168,945 | |
Liabilities | | | | | | | | | | | | | | | | |
Unrealized depreciation on forward foreign currency contracts | | | — | | | | (4,047,004 | ) | | | — | | | | — | |
Unrealized depreciation on futures contracts | | | (6,939,664 | ) | | | — | | | | (1,405,953 | ) | | | (2,402,525 | ) |
107 |
Notes to Financial Statements (continued)
June 30, 2012 (Unaudited)
Transactions in derivative instruments for Managed Futures Strategy Fund during the six months ended June 30, 2012 were as follows:
| | | | | | | | | | | | | | | | |
Consolidated Statements of
Operations Caption | | Interest
Rate
Contracts | | | Foreign
Exchange
Contracts | | | Equity Contracts | | | Commodity
Contracts | |
Net Realized Gain (Loss) on: | | | | | | | | | | | | | | | | |
Foreign currency transactions* | | $ | — | | | $ | (57,717,314 | ) | | $ | — | | | $ | — | |
Futures contracts | | | 32,721,367 | | | | — | | | | (12,209,362 | ) | | | (24,467,309 | ) |
Net Change in Unrealized Appreciation (Depreciation) on: | | | | | | | | | | | | | | | | |
Foreign currency translations* | | | — | | | | (2,132,122 | ) | | | — | | | | — | |
Futures contracts | | | (14,616,603 | ) | | | — | | | | (507,771 | ) | | | 1,282,163 | |
| * | Represents realized loss and change in unrealized appreciation (depreciation), respectively, for forward foreign currency contracts during the period. |
The following is a summary of derivative instruments for Loomis Sayles Absolute Strategies Fund as of June 30, 2012:
| | | | | | | | | | | | | | | | |
Statements of Assets and
Liabilities Caption | | Interest
Rate
Contracts | | | Foreign Exchange
Contracts | | | Credit Contracts | | | Equity
Contracts | |
Assets | | | | | | | | | | | | | | | | |
Investments at value* | | $ | — | | | $ | — | | | $ | — | | | $ | 393,000 | |
Unrealized appreciation on forward foreign currency contracts | | | — | | | | 1,726,346 | | | | — | | | | — | |
Unrealized appreciation on futures contracts** | | | 276,182 | | | | — | | | | — | | | | — | |
Unrealized appreciation on swap agreements | | | — | | | | — | | | | 639,283 | | | | — | |
Liabilities | | | | | | | | | | | | | | | | |
Unrealized depreciation on forward foreign currency contracts | | | — | | | | (2,599,261 | ) | | | — | | | | — | |
Unrealized depreciation on futures contracts** | | | — | | | | — | | | | — | | | | (743,507 | ) |
Unrealized depreciation on swap agreements | | | — | | | | — | | | | (4,621,455 | ) | | | — | |
| * | Represents purchased options, at value. |
| ** | Represents cumulative unrealized appreciation (depreciation) on futures contracts. Only the current day’s variation margin on futures contracts is reported within the Statements of Assets and Liabilities as receivable or payable for variation margin, as applicable. |
| 108
Notes to Financial Statements (continued)
June 30, 2012 (Unaudited)
Transactions in derivative instruments for Loomis Sayles Absolute Strategies Fund during the six months ended June 30, 2012 were as follows:
| | | | | | | | | | | | | | | | |
Statements of Operations Caption | | Interest
Rate
Contracts | | | Foreign
Exchange
Contracts | | | Credit Contracts | | | Equity Contracts | |
Net Realized Gain (Loss) on: | | | | | | | | | | | | | | | | |
Investments* | | $ | — | | | $ | (884,052 | ) | | $ | — | | | $ | (320,020 | ) |
Foreign currency transactions** | | | — | | | | 436,150 | | | | — | | | | — | |
Futures contracts | | | 535,507 | | | | — | | | | — | | | | (675,158 | ) |
Options written | | | — | | | | 670,072 | | | | — | | | | 771,641 | |
Swap agreements | | | — | | | | — | | | | 885,011 | | | | — | |
Net Change in Unrealized Appreciation (Depreciation) on: | | | | | | | | | | | | | | | | |
Investments* | | | — | | | | 386,334 | | | | — | | | | (778,650 | ) |
Foreign currency translations** | | | — | | | | (1,217,667 | ) | | | — | | | | — | |
Futures contracts | | | 298,330 | | | | — | | | | — | | | | (737,342 | ) |
Options written | | | — | | | | (292,448 | ) | | | — | | | | — | |
Swap agreements | | | — | | | | — | | | | 49,744 | | | | — | |
| * | Represents realized loss and change in unrealized appreciation (depreciation), respectively, for purchased options during the period. |
| ** | Represents realized gain and change in unrealized appreciation (depreciation), respectively, for forward foreign currency contracts during the period. |
The following is a summary of derivative instruments for Multi-Asset Real Return Fund as of June 30, 2012:
| | | | | | | | | | | | | | | | | | | | |
Consolidated Statements
of Assets and Liabilities Caption | | Interest
Rate
Contracts | | | Foreign
Exchange
Contracts | | | Credit
Contracts | | | Equity
Contracts | | | Commodity
Contracts | |
Assets | | | | | | | | | | | | | | | | | | | | |
Investments at value* | | $ | 123,000 | | | $ | 66,698 | | | $ | — | | | $ | 101,300 | | | $ | 12,075 | |
Unrealized appreciation on forward foreign currency contracts | | | — | | | | 114,500 | | | | — | | | | — | | | | — | |
Unrealized appreciation on futures contracts** | | | — | | | | — | | | | — | | | | 5,108 | | | | 24,406 | |
Unrealized appreciation on swap agreements | | | — | | | | — | | | | 12,928 | | | | — | | | | — | |
109 |
Notes to Financial Statements (continued)
June 30, 2012 (Unaudited)
| | | | | | | | | | | | | | | | | | | | |
Consolidated Statements
of Assets and Liabilities Caption | | Interest
Rate
Contracts | | | Foreign
Exchange
Contracts | | | Credit
Contracts | | | Equity
Contracts | | | Commodity
Contracts | |
Liabilities | | | | | | | | | | | | | | | | | | | | |
Options written, at value | | | (16,000 | ) | | | (18,701 | ) | | | — | | | | (24,600 | ) | | | (1,275 | ) |
Unrealized depreciation on forward foreign currency contracts | | | — | | | | (52,632 | ) | | | — | | | | — | | | | — | |
Unrealized depreciation on futures contracts** | | | (205 | ) | | | — | | | | — | | | | (108,386 | ) | | | (50,440 | ) |
Unrealized depreciation on swap agreements | | | — | | | | — | | | | (33,859 | ) | | | — | | | | — | |
| * | Represents purchased options, at value. |
| ** | Represents cumulative unrealized appreciation (depreciation) on futures contracts. Only the current day’s variation margin on futures contracts is reported within the Consolidated Statements of Assets and Liabilities as receivable or payable for variation margin, as applicable. |
Transactions in derivative instruments for Multi-Asset Real Return Fund during the six months ended June 30, 2012 were as follows:
| | | | | | | | | | | | | | | | | | | | |
Consolidated Statements
of Operations Caption | | Interest
Rate
Contracts | | | Foreign
Exchange
Contracts | | | Credit
Contracts | | | Equity
Contracts | | | Commodity
Contracts | |
Net Realized Gain (Loss) on: | | | | | | | | | | | | | | | | | | | | |
Investments* | | $ | — | | | $ | (91,458 | ) | | $ | — | | | $ | — | | | $ | (24,229 | ) |
Foreign currency transactions** | | | — | | | | 48,005 | | | | — | | | | — | | | | — | |
Futures contracts | | | (155,033 | ) | | | — | | | | — | | | | (289,402 | ) | | | (195,684 | ) |
Options written | | | — | | | | 106,803 | | | | — | | | | — | | | | 9,440 | |
Swap agreements | | | — | | | | — | | | | (11,624 | ) | | | — | | | | (20,301 | ) |
Net Change in Unrealized Appreciation (Depreciation) on: | | | | | | | | | | | | | | | | | | | | |
Investments* | | | 6,776 | | | | 20,717 | | | | — | | | | 12,232 | | | | (14,881 | ) |
Foreign currency translations** | | | — | | | | 9,969 | | | | — | | | | — | | | | — | |
Futures contracts | | | 1,484 | | | | — | | | | — | | | | (41,263 | ) | | | (35,184 | ) |
Options written | | | 8,668 | | | | (41,194 | ) | | | — | | | | 8,538 | | | | 4,821 | |
Swap agreements | | | — | | | | — | | | | (41,741 | ) | | | — | | | | — | |
| * | Represents realized loss and change in unrealized appreciation (depreciation), respectively, for purchased options during the period. |
| ** | Represents realized gain and change in unrealized appreciation (depreciation), respectively, for forward foreign currency contracts during the period. |
| 110
Notes to Financial Statements (continued)
June 30, 2012 (Unaudited)
As the Funds value their derivatives at fair value and recognize changes in fair value through the Consolidated Statements of Operations, they do not qualify for hedge accounting under authoritative guidance for derivative instruments. The Funds’ investments in derivatives may represent an economic hedge; however, they are considered to be non-hedge transactions for the purpose of these disclosures.
The volume of forward foreign currency contract, futures contract and swap agreement activity, as a percentage of net assets, based on gross month-end notional amounts outstanding during the period, including long and short positions at absolute value, was as follows for the six months ended June 30, 2012:
| | | | | | | | |
Diversifying Strategies Fund | | Forwards | | | Futures | |
Average Notional Amount Outstanding | | | 579.01 | % | | | 604.74 | % |
Highest Notional Amount Outstanding | | | 1,037.27 | % | | | 1,002.46 | % |
Lowest Notional Amount Outstanding | | | 77.68 | % | | | 474.73 | % |
Notional Amount Outstanding as of June 30, 2012 | | | 77.68 | % | | | 690.80 | % |
| | | | | | | | |
Global Alternatives Fund | | Forwards | | | Futures | |
Average Notional Amount Outstanding | | | 65.49 | % | | | 202.88 | % |
Highest Notional Amount Outstanding | | | 118.02 | % | | | 351.39 | % |
Lowest Notional Amount Outstanding | | | 31.51 | % | | | 109.77 | % |
Notional Amount Outstanding as of June 30, 2012 | | | 31.51 | % | | | 236.09 | % |
| | |
Managed Futures Strategy Fund | | Forwards | | | Futures | |
Average Notional Amount Outstanding | | | 312.46 | % | | | 885.56 | % |
Highest Notional Amount Outstanding | | | 755.91 | % | | | 1,063.46 | % |
Lowest Notional Amount Outstanding | | | 69.02 | % | | | 696.51 | % |
Notional Amount Outstanding as of June 30, 2012 | | | 69.02 | % | | | 1,056.37 | % |
| | | | | | | | | | | | |
Loomis Sayles Absolute Strategies Fund | | Forwards | | | Futures | | | Swaps | |
Average Notional Amount Outstanding | | | 32.81 | % | | | 5.50 | % | | | 29.22 | % |
Highest Notional Amount Outstanding | | | 48.60 | % | | | 10.50 | % | | | 42.40 | % |
Lowest Notional Amount Outstanding | | | 19.93 | % | | | 3.22 | % | | | 14.77 | % |
Notional Amount Outstanding as of June 30, 2012 | | | 33.87 | % | | | 9.62 | % | | | 35.54 | % |
| | | |
Multi-Asset Real Return Fund | | Forwards | | | Futures | | | Swaps | |
Average Notional Amount Outstanding | | | 88.04 | % | | | 41.22 | % | | | 33.06 | % |
Highest Notional Amount Outstanding | | | 138.24 | % | | | 57.27 | % | | | 64.26 | % |
Lowest Notional Amount Outstanding | | | 67.97 | % | | | 30.33 | % | | | 18.39 | % |
Notional Amount Outstanding as of June 30, 2012 | | | 67.97 | % | | | 30.33 | % | | | 18.39 | % |
Notional amounts outstanding at the end of the prior period are included in the average notional amount outstanding.
111 |
Notes to Financial Statements (continued)
June 30, 2012 (Unaudited)
Unrealized gain and/or loss on open forwards, futures and swaps is recorded in the Consolidated Statements of Assets and Liabilities. The aggregate notional values of forward, futures and swap contracts are not recorded in the Consolidated Statements of Assets and Liabilities, and therefore are not included in the Funds’ net assets.
The volume of option contract activity, as a percentage of net assets, based on the month-end market values of instruments underlying purchased and written options, at absolute value, was as follows for the six months ended June 30, 2012:
| | | | | | | | | | | | | | | | |
Loomis Sayles Absolute
Strategies Fund* | | Call Options
Purchased | | | Put Options Purchased | | | Call Options Written | | | Put Options Written | |
Average Market Value of Underlying Instruments | | | 4.02 | % | | | 5.66 | % | | | 3.45 | % | | | 3.45 | % |
Highest Market Value of Underlying Instruments | | | 5.78 | % | | | 10.20 | % | | | 4.96 | % | | | 5.37 | % |
Lowest Market Value of Underlying Instruments | | | 0.00 | % | | | 4.39 | % | | | 0.00 | % | | | 0.00 | % |
Market Value of Underlying Instruments as of June 30, 2012 | | | 0.00 | % | | | 4.45 | % | | | 0.00 | % | | | 0.00 | % |
| | | | | | | | | | | | | | | | |
Multi-Asset Real Return Fund* | | Call Options
Purchased | | | Put Options Purchased | | | Call Options Written | | | Put Options Written | |
Average Market Value of Underlying Instruments | | | 16.23 | % | | | 4.65 | % | | | 12.70 | % | | | 3.85 | % |
Highest Market Value of Underlying Instruments | | | 20.55 | % | | | 17.65 | % | | | 14.28 | % | | | 17.65 | % |
Lowest Market Value of Underlying Instruments | | | 6.16 | % | | | 0.00 | % | | | 6.83 | % | | | 0.00 | % |
Market Value of Underlying Instruments as of June 30, 2012 | | | 19.87 | % | | | 17.65 | % | | | 14.28 | % | | | 17.65 | % |
| * | Market value of underlying instruments is determined as follows: for securities by multiplying option shares by the price of the option’s underlying security; for currencies by multiplying par value by the strike price and dividing by the foreign currency exchange rate; and for futures by multiplying the number of contracts by the contract multiplier by the price of the underlying futures contract. |
| 112
Notes to Financial Statements (continued)
June 30, 2012 (Unaudited)
The following is a summary of Loomis Sayles Absolute Strategies Fund’s written option activity (excluding foreign currency options):
| | | | | | | | |
| | | Number of
Contracts | | | Premiums | |
Outstanding at December 31, 2011 | | | — | | | $ | — | |
Options written | | | 7,875 | | | | 1,004,468 | |
Options terminated in closing purchase transactions | | | (7,875 | ) | | | (1,004,468 | ) |
Options exercised | | | — | | | | — | |
Options expired | | | — | | | | — | |
| | | | | | | | |
Outstanding at June 30, 2012 | | | — | | | $ | — | |
| | | | | | | | |
The following is a summary of Loomis Sayles Absolute Strategies Fund’s foreign currency written option activity:
| | | | | | |
| | | | | Premiums | |
Outstanding at December 31, 2011 | | | | $ | 748,930 | |
Options written | | | | | — | |
Options terminated in closing purchase transactions | | | | | (748,930 | ) |
Options exercised | | | | | — | |
Options expired | | | | | — | |
| | | | | | |
Outstanding at June 30, 2012 | | | | $ | — | |
| | | | | | |
The following is a summary of Multi-Asset Real Return Fund’s written option activity (excluding foreign currency options):
| | | | | | | | |
| | | Number of
Contracts | | | Premiums | |
Outstanding at December 31, 2011 | | | — | | | $ | — | |
Options written | | | 563 | | | | 73,342 | |
Options terminated in closing purchase transactions | | | — | | | | — | |
Options exercised | | | — | | | | — | |
Options expired | | | (13 | ) | | | (9,440 | ) |
| | | | | | | | |
Outstanding at June 30, 2012 | | | 550 | | | $ | 63,902 | |
| | | | | | | | |
The following is a summary of Multi-Asset Real Return Fund’s foreign currency written option activity:
| | | | | | |
| | | | | Premiums | |
Outstanding at December 31, 2011 | | | | $ | 191,546 | |
Options written | | | | | 31,143 | |
Options terminated in closing purchase transactions | | | | | (191,546 | ) |
Options exercised | | | | | — | |
Options expired | | | | | — | |
| | | | | | |
Outstanding at June 30, 2012 | | | | $ | 31,143 | |
| | | | | | |
113 |
Notes to Financial Statements (continued)
June 30, 2012 (Unaudited)
5. Purchases and Sales of Securities. For the six months ended June 30, 2012, purchases and proceeds from sales or maturities of short-term obligations were as follows:
| | | | | | | | |
Fund | | Purchases | | | Sales/
Maturities | |
Diversifying Strategies Fund | | $ | 3,859,659,322 | | | $ | 3,954,309,110 | |
Global Alternatives Fund | | | 16,561,873,380 | | | | 16,622,694,790 | |
Managed Futures Strategy Fund | | | 8,923,002,437 | | | | 8,882,489,254 | |
For the six months ended June 30, 2012, purchases and sales of securities (excluding short-term investments and including paydowns) were as follows:
| | | | | | | | | | | | | | | | |
| | | U.S. Government/
Agency Securities | | | Other Securities | |
Fund | | Purchases | | | Sales | | | Purchases | | | Sales | |
Loomis Sayles Absolute Strategies Fund | | $ | — | | | $ | — | | | $ | 313,353,146 | | | $ | 316,722,659 | |
Multi-Asset Real Return Fund | | | 2,346,250 | | | | 1,683,053 | | | | 54,118,616 | | | | 57,886,476 | |
6. Management Fees and Other Transactions with Affiliates.
a. Management Fees. AlphaSimplex Group, LLC (“AlphaSimplex”), which is a subsidiary of Natixis Global Asset Management, L.P. (“Natixis US”) serves as investment adviser to Diversifying Strategies Fund, Global Alternatives Fund and Managed Futures Strategy Fund. Loomis, Sayles & Company, L.P. (“Loomis Sayles”) is the investment adviser to Loomis Sayles Absolute Strategies Fund and Multi-Asset Real Return Fund. Loomis Sayles’ general partner is indirectly owned by Natixis US, which is part of Natixis Global Asset Management, an international asset management group based in Paris, France. Under the terms of the management agreements, each Fund pays a management fee at the following annual rates, calculated daily and payable monthly, based on each Fund’s average daily net assets, less the net asset value of each Subsidiary, where applicable:
| | | | |
Fund | | Percentage of Average Daily
Net Assets | |
Diversifying Strategies Fund | | | 1.25 | % |
Global Alternatives Fund | | | 1.15 | % |
Managed Futures Strategy Fund | | | 1.25 | % |
Loomis Sayles Absolute Strategies Fund | | | 0.70 | % |
Multi-Asset Real Return Fund | | | 0.75 | % |
| 114
Notes to Financial Statements (continued)
June 30, 2012 (Unaudited)
AlphaSimplex also serves as investment adviser to ASG Diversifying Strategies Cayman Fund Ltd., ASG Global Alternatives Cayman Fund Ltd. and ASG Managed Futures Strategy Cayman Fund Ltd., which pay AlphaSimplex a management fee at the annual rate of 1.25%, 1.15% and 1.25%, respectively, of its average daily net assets.
Loomis Sayles also serves as investment adviser to the Loomis Sayles Multi-Asset Real Return Cayman Fund Ltd., which pays Loomis Sayles a management fee at the annual rate of 0.75% of its average daily net assets.
Effective July 1, 2012, Global Alternatives Fund will pay a management fee at an annual rate of 1.15% for the first two billion of the Fund’s average daily net assets (including the net asset value of the Subsidiary), and 1.10% thereafter, calculated daily and payable monthly, less the management fees paid by the Subsidiary.
AlphaSimplex has entered into a subadvisory agreement with Reich & Tang Asset Management, LLC (“Reich & Tang”) on behalf of Diversifying Strategies Fund, Global Alternatives Fund and Managed Futures Strategy Fund. Payments to AlphaSimplex are reduced by the amount of payments to Reich & Tang.
AlphaSimplex and Loomis Sayles have given binding undertakings to the Funds to waive management fees and/or reimburse certain expenses, including expenses of each Subsidiary, if applicable, to limit the Funds’ operating expenses, exclusive of acquired fund fees and expenses, brokerage expenses, interest expense, taxes and extraordinary expenses. These undertakings are in effect until April 30, 2013 and are reevaluated on an annual basis. Management fees payable, as reflected on the Consolidated Statements of Assets and Liabilities, is net of waivers and/or expense reimbursements, if any, pursuant to these undertakings. Waivers/reimbursements that exceed management fees payable are reflected on the Consolidated Statements of Assets and Liabilities as receivable from investment adviser.
For the six months ended June 30, 2012, the expense limits as a percentage of average daily net assets under the expense limitation agreements were as follows:
| | | | | | | | | | | | |
| | | Expense Limit as a Percentage of
Average Daily Net Assets | |
Fund | | Class A | | | Class C | | | Class Y | |
Diversifying Strategies Fund | | | 1.70 | % | | | 2.45 | % | | | 1.45 | % |
Global Alternatives Fund | | | 1.60 | % | | | 2.35 | % | | | 1.35 | % |
Managed Futures Strategy Fund | | | 1.70 | % | | | 2.45 | % | | | 1.45 | % |
Loomis Sayles Absolute Strategies Fund | | | 1.30 | % | | | 2.05 | % | | | 1.05 | % |
Multi-Asset Real Return Fund | | | 1.35 | % | | | 2.10 | % | | | 1.10 | % |
AlphaSimplex and Loomis Sayles shall be permitted to recover expenses they have borne under the expense limitation agreements (whether through waiver of its management fees or otherwise) on a class by class basis in later periods to the extent the expenses of a class fall below a class’ expense limits, provided, however, that a
115 |
Notes to Financial Statements (continued)
June 30, 2012 (Unaudited)
class is not obligated to pay such waived/reimbursed fees or expenses more than one year after the end of the fiscal year in which the fees or expenses were waived/reimbursed.
For the six months ended June 30, 2012, the management fees and waivers of management fees for each Fund were as follows:
| | | | | | | | | | | | | | | | | | | | |
Fund | | Gross
Management
Fees | | | Waivers of
Management
Fees1 | | | Net
Management
Fees | | | Percentage of
Average
Daily Net Assets | |
| | | | | Gross | | | Net | |
Diversifying Strategies Fund | | $ | 2,327,228 | | | $ | 149,776 | | | $ | 2,177,452 | | | | 1.25 | % | | | 1.17 | % |
Global Alternatives Fund | | | 8,722,190 | | | | — | | | | 8,722,190 | | | | 1.15 | % | | | 1.15 | % |
Managed Futures Strategy Fund | | | 4,915,581 | | | | 311,844 | | | | 4,603,737 | | | | 1.25 | % | | | 1.17 | % |
Loomis Sayles Absolute Strategies Fund | | | 1,665,412 | | | | — | | | | 1,665,412 | | | | 0.70 | % | | | 0.70 | % |
Multi-Asset Real Return Fund | | | 115,267 | | | | 98,935 | | | | 16,332 | | | | 0.75 | % | | | 0.11 | % |
| 1 | Management fee waivers are subject to possible recovery until December 31, 2013. |
For the six months ended June 30, 2012, expense reimbursements related to the prior fiscal year were recovered as follows:
| | | | | | | | | | | | | | | | |
| | | Recovered Expenses | |
Fund | | Class A | | | Class C | | | Class Y | | | Total | |
Global Alternatives Fund | | $ | 11,835 | | | $ | 2,605 | | | $ | 25,336 | | | $ | 39,776 | |
b. Service and Distribution Fees. NGAM Distribution, L.P. (“NGAM Distribution”), which is a wholly-owned subsidiary of Natixis US, has entered into a distribution agreement with the Trust. Pursuant to this agreement, NGAM Distribution serves as principal underwriter of the Funds of the Trust.
Pursuant to Rule 12b-1 under the 1940 Act, the Trust has adopted a Service Plan relating to each Fund’s Class A shares (the “Class A Plans”) and a Distribution and Service Plan relating to each Fund’s Class C shares (the “Class C Plans”).
Under the Class A Plans, each Fund pays NGAM Distribution a monthly service fee at an annual rate not to exceed 0.25% of the average daily net assets attributable to the Funds’ Class A shares, as reimbursement for expenses incurred by NGAM Distribution in providing personal services to investors in Class A shares and/or the maintenance of shareholder accounts.
| 116
Notes to Financial Statements (continued)
June 30, 2012 (Unaudited)
Under the Class C Plans, each Fund pays NGAM Distribution a monthly service fee at an annual rate not to exceed 0.25% of the average daily net assets attributable to the Funds’ Class C shares, as compensation for services provided by NGAM Distribution in providing personal services to investors in Class C shares and/or the maintenance of shareholder accounts.
Also under the Class C Plans, each Fund pays NGAM Distribution a monthly distribution fee at the annual rate of 0.75% of the average daily net assets attributable to the Funds’ Class C shares, as compensation for services provided by NGAM Distribution in connection with the marketing or sale of Class C shares.
For the six months ended June 30, 2012, the Funds paid the following service and distribution fees:
| | | | | | | | | | | | |
| | | Service Fees | | | Distribution Fees | |
Fund | | Class A | | | Class C | | | Class C | |
Diversifying Strategies Fund | | $ | 157,279 | | | $ | 28,558 | | | $ | 85,673 | |
Global Alternatives Fund | | | 305,050 | | | | 118,094 | | | | 354,282 | |
Managed Futures Strategy Fund | | | 322,136 | | | | 30,881 | | | | 92,642 | |
Loomis Sayles Absolute Strategies Fund | | | 121,650 | | | | 92,097 | | | | 276,292 | |
Multi-Asset Real Return Fund | | | 2,611 | | | | 108 | | | | 323 | |
c. Administrative Fees. NGAM Advisors, L.P. (“NGAM Advisors”), provides certain administrative services for the Funds and contracts with State Street Bank to serve as sub-administrator. NGAM Advisors is a wholly-owned subsidiary of Natixis US. Pursuant to an agreement among Natixis Funds Trust I, Natixis Funds Trust II, Natixis Funds Trust IV, Gateway Trust (“Natixis Funds Trusts”), Loomis Sayles Funds I, Loomis Sayles Funds II (“Loomis Sayles Funds Trusts”), Hansberger International Series and NGAM Advisors, each Fund pays NGAM Advisors monthly its pro rata portion of fees equal to an annual rate of 0.0575% of the first $15 billion of the average daily net assets of the Natixis Funds Trusts, Loomis Sayles Funds Trusts and Hansberger International Series, 0.0500% of the next $15 billion, 0.0400% of the next $30 billion and 0.0350% of such assets in excess of $60 billion, subject to an annual aggregate minimum fee for the Natixis Funds Trusts, Loomis Sayles Funds Trusts and Hansberger International Series of $10 million, which is reevaluated on an annual basis.
NGAM Advisors also provides certain administrative services to each Subsidiary for which each Subsidiary pays NGAM Advisors fees equal to an annual rate of 0.05% of the average daily net assets of each Subsidiary. Payments by the Funds are reduced by the amount of payments to NGAM Advisors by the Subsidiary. In addition, NGAM Advisors and each Subsidiary contract with State Street Bank to serve as sub-administrator.
117 |
Notes to Financial Statements (continued)
June 30, 2012 (Unaudited)
For the six months ended June 30, 2012, each Fund paid the following administrative fees to NGAM Advisors (exclusive of sub-administrative fees paid to State Street Bank by the Subsidiaries):
| | | | |
Fund | | Administrative
Fees | |
Diversifying Strategies Fund | | $ | 84,854 | |
Global Alternatives Fund | | | 345,499 | |
Managed Futures Strategy Fund | | | 179,153 | |
Loomis Sayles Absolute Strategies Fund | | | 108,388 | |
Multi-Asset Real Return Fund | | | 7,001 | |
d. Sub-Transfer Agent Fees. NGAM Distribution has entered into agreements with financial intermediaries to provide certain recordkeeping, processing, shareholder communications and other services to customers of the intermediaries and has agreed to compensate the intermediaries for providing those services. Certain services would be provided by the Funds if the shares of those customers were registered directly with the Funds’ transfer agent. Accordingly, the Funds have agreed to reimburse NGAM Distribution for a portion of the intermediary fees attributable to shares of the Funds held by the intermediaries (which generally is a percentage of the value of shares held) not to exceed what the Funds would have paid their transfer agent had each customer’s shares been registered directly with the transfer agent instead of being held through the intermediaries.
For the six months ended June 30, 2012, the Funds paid the following sub-transfer agent fees, which are reflected in transfer agent fees and expenses in the Consolidated Statements of Operations:
| | | | |
Fund | | Sub-Transfer
Agent Fees | |
Diversifying Strategies Fund | | $ | 168,144 | |
Global Alternatives Fund | | | 733,772 | |
Managed Futures Strategy Fund | | | 473,906 | |
Loomis Sayles Absolute Strategies Fund | | | 116,552 | |
Multi-Asset Real Return Fund | | | 577 | |
As of June 30, 2012, the Funds owe NGAM Distribution the following reimbursements for sub-transfer agent fees:
| | | | |
Fund | | Reimbursements of Sub-Transfer Agent Fees | |
Diversifying Strategies Fund | | $ | 3,433 | |
Global Alternatives Fund | | | 21,170 | |
Managed Futures Strategy Fund | | | 35,940 | |
Loomis Sayles Absolute Strategies Fund | | | 1,509 | |
Multi-Asset Real Return Fund | | | 30 | |
| 118
Notes to Financial Statements (continued)
June 30, 2012 (Unaudited)
e. Commissions. Commissions (including CDSCs) on Fund shares retained by NGAM Distribution during the six months ended June 30, 2012 were as follows:
| | | | |
Fund | | Commissions | |
Diversifying Strategies Fund | | $ | 30,793 | |
Global Alternatives Fund | | | 74,952 | |
Managed Futures Strategy Fund | | | 132,258 | |
Loomis Sayles Absolute Strategies Fund | | | 60,950 | |
f. Trustees Fees and Expenses. The Trust does not pay any compensation directly to its officers or Trustees who are directors, officers or employees of NGAM Advisors, NGAM Distribution, Natixis US or their affiliates. The Chairperson of the Board receives a retainer fee at the annual rate of $265,000. The Chairperson does not receive any meeting attendance fees for Board of Trustees meetings or committee meetings that she attends. Each Independent Trustee (other than the Chairperson) receives, in the aggregate, a retainer fee at the annual rate of $95,000. Each Independent Trustee also receives a meeting attendance fee of $10,000 for each meeting of the Board of Trustees that he or she attends in person and $5,000 for each meeting of the Board of Trustees that he or she attends telephonically. In addition, each committee chairman receives an additional retainer fee at the annual rate of $15,000. Each Contract Review and Governance Committee member is compensated $6,000 for each Committee meeting that he or she attends in person and $3,000 for each meeting that he or she attends telephonically. Each Audit Committee member is compensated $7,500 for each Committee meeting that he or she attends in person and $3,750 for each meeting that he or she attends telephonically. These fees are allocated among the funds in the Natixis Funds Trusts, Loomis Sayles Funds Trusts and Hansberger International Series based on a formula that takes into account, among other factors, the relative net assets of each fund. Trustees are reimbursed for travel expenses in connection with attendance at meetings.
A deferred compensation plan (the “Plan”) is available to the Trustees on a voluntary basis. Deferred amounts remain in the Funds until distributed in accordance with the provisions of the Plan. The value of a participating Trustee’s deferral account is based on theoretical investments of deferred amounts, on the normal payment dates, in certain funds of the Natixis Funds Trusts, Loomis Sayles Funds Trusts and Hansberger International Series as designated by the participating Trustees. Changes in the value of participants’ deferral accounts are allocated pro rata among the funds in the Natixis Funds Trusts, Loomis Sayles Funds Trusts, and Hansberger International Series, and are normally reflected as Trustees’ fees and expenses in the Consolidated Statements of Operations. The portions of the accrued obligations allocated to the Funds under the Plan are reflected as Deferred Trustees’ fees in the Consolidated Statements of Assets and Liabilities.
119 |
Notes to Financial Statements (continued)
June 30, 2012 (Unaudited)
g. Affiliated Ownership. As of June 30, 2012, Loomis Sayles and Natixis US held shares of the Funds representing the following percentages of net assets:
| | | | | | | | | | | | |
Fund | | Loomis Sayles | | | Natixis US | | | Percentage
of Affiliated
Ownership | |
Multi-Asset Real Return Fund | | | 38.51 | % | | | 38.51 | % | | | 77.02 | % |
7. Line of Credit. Each Fund, together with certain other funds of Natixis Funds Trusts, Loomis Sayles Funds Trusts and Hansberger International Series, participates in a $200,000,000 committed unsecured line of credit provided by State Street Bank, with an individual limit of $125,000,000 for each fund that participates in the line of credit. Interest is charged to each participating fund based on its borrowings at a rate per annum equal to the greater of the Federal Funds rate or overnight LIBOR, plus 1.25%. In addition, a commitment fee of 0.10% per annum, payable at the end of each calendar quarter, is accrued and apportioned among the participating funds based on their average daily unused portion of the line of credit. Prior to April 19, 2012, the commitment fee was 0.125% per annum.
For the six months ended June 30, 2012, none of the Funds had borrowings under these agreements.
8. Concentration of Risk. Each Fund’s investments in foreign securities are subject to foreign currency fluctuations, higher volatility than U.S. securities, varying degrees of regulation and limited liquidity. Greater political, economic, credit and information risks are also associated with foreign securities.
The Loomis Sayles Absolute Strategies Fund and Multi-Asset Real Return Fund are non-diversified, which means that they are not limited under the 1940 Act to a percentage of assets that they may invest in any one issuer. Because the Funds may invest in the securities of a limited number of issuers, an investment in the Funds may involve a higher degree of risk than would be present in a diversified portfolio.
The Funds’ (excluding Loomis Sayles Absolute Strategies Fund) investments in commodity-related instruments may subject the Funds to greater volatility than investments in other securities. The value of these investments may be affected by changes in overall market movements, commodity index volatility, changes in interest rates, or factors affecting a particular industry or commodity.
9. Interest Expense. Diversifying Strategies Fund, Global Alternatives Fund and Managed Futures Strategy Fund incur interest expense on net cash and foreign currency debit balances, if any, for accounts held at brokers. Interest expense incurred for the six months ended June 30, 2012 is reflected on the Consolidated Statements of Operations.
| 120
Notes to Financial Statements (continued)
June 30, 2012 (Unaudited)
10. Concentration of Ownership. From time to time, the Funds may have a concentration of one or more shareholders holding a significant percentage of shares outstanding. Investment activities of these shareholders could have material impacts on the Funds. As of June 30, 2012, the Funds had shareholders that owned more than 5% of the Funds’ total outstanding shares. The number of shareholders owning more than 5% of total outstanding shares of the Funds, based on accounts that represent more than 5% of an individual class of shares, and the aggregate percentage of net assets represented by such holdings, including affiliated accounts, was as follows:
| | | | | | | | | | | | | | | | |
Fund | | Number of 5% Non- Affiliated Shareholders | | | Percentage of
Non- Affiliated Ownership | | | Percentage of
Affiliated Ownership (Note 6) | | | Total Percentage of
Ownership | |
Loomis Sayles Absolute Strategies Fund | | | 1 | | | | 19.62 | % | | | — | | | | 19.62 | % |
Multi-Asset Real Return Fund | | | — | | | | — | | | | 77.02 | % | | | 77.02 | % |
11. Capital Shares. Each Fund may issue an unlimited number of shares of beneficial interest, without par value. Transactions in capital shares were as follows:
| | | | | | | | | | | | | | | | |
| |
| Six Months Ended
June 30, 2012 |
| |
| Year Ended
December 31, 2011 |
|
Diversifying Strategies Fund | | | Shares | | | | Amount | | | | Shares | | | | Amount | |
| Class A | | | | | | | | | | | | | | | | |
Issued from the sale of shares | | | 2,729,948 | | | $ | 26,404,406 | | | | 12,268,438 | | | $ | 128,467,458 | |
Issued in connection with the reinvestment of distributions | | | — | | | | — | | | | 490,004 | | | | 4,778,350 | |
Redeemed | | | (4,839,008 | ) | | | (46,376,628 | ) | | | (4,814,646 | ) | | | (50,046,266 | ) |
| | | | | | | | | | | | | | | | |
Net change | | | (2,109,060 | ) | | $ | (19,972,222 | ) | | | 7,943,796 | | | $ | 83,199,542 | |
| | | | | | | | | | | | | | | | |
| Class C | | | | | | | | | | | | | | | | |
Issued from the sale of shares | | | 208,218 | | | $ | 1,993,936 | | | | 1,482,681 | | | $ | 15,364,159 | |
Issued in connection with the reinvestment of distributions | | | — | | | | — | | | | 53,185 | | | | 513,125 | |
Redeemed | | | (753,908 | ) | | | (7,180,750 | ) | | | (843,625 | ) | | | (8,626,269 | ) |
| | | | | | | | | | | | | | | | |
Net change | | | (545,690 | ) | | $ | (5,186,814 | ) | | | 692,241 | | | $ | 7,251,015 | |
| | | | | | | | | | | | | | | | |
| Class Y | | | | | | | | | | | | | | | | |
Issued from the sale of shares | | | 6,275,128 | | | $ | 60,995,301 | | | | 24,283,289 | | | $ | 256,558,955 | |
Issued in connection with the reinvestment of distributions | | | — | | | | — | | | | 726,635 | | | | 7,100,828 | |
Redeemed | | | (13,306,589 | ) | | | (127,126,299 | ) | | | (16,608,106 | ) | | | (173,869,182 | ) |
| | | | | | | | | | | | | | | | |
Net change | | | (7,031,461 | ) | | $ | (66,130,998 | ) | | | 8,401,818 | | | $ | 89,790,601 | |
| | | | | | | | | | | | | | | | |
Increase (decrease) from capital share transactions | | | (9,686,211 | ) | | $ | (91,290,034 | ) | | | 17,037,855 | | | $ | 180,241,158 | |
| | | | | | | | | | | | | | | | |
121 |
Notes to Financial Statements (continued)
June 30, 2012 (Unaudited)
11. Capital Shares (continued).
| | | | | | | | | | | | | | | | |
| |
| Six Months Ended
June 30, 2012 |
| |
| Year Ended
December 31, 2011 |
|
Global Alternatives Fund | | | Shares | | | | Amount | | | | Shares | | | | Amount | |
| Class A | | | | | | | | | | | | | | | | |
Issued from the sale of shares | | | 4,477,130 | | | $ | 47,018,493 | | | | 18,930,522 | | | $ | 202,480,734 | |
Issued in connection with the reinvestment of distributions | | | — | | | | — | | | | 113,753 | | | | 1,233,164 | |
Redeemed | | | (14,013,391 | ) | | | (146,290,602 | ) | | | (10,876,025 | ) | | | (114,726,957 | ) |
| | | | | | | | | | | | | | | | |
Net change | | | (9,536,261 | ) | | $ | (99,272,109 | ) | | | 8,168,250 | | | $ | 88,986,941 | |
| | | | | | | | | | | | | | | | |
| Class C | | | | | | | | | | | | | | | | |
Issued from the sale of shares | | | 1,100,871 | | | $ | 11,316,353 | | | | 4,655,200 | | | $ | 49,166,732 | |
Issued in connection with the reinvestment of distributions | | | — | | | | — | | | | 23,940 | | | | 255,455 | |
Redeemed | | | (1,246,374 | ) | | | (12,525,856 | ) | | | (1,819,331 | ) | | | (18,798,077 | ) |
| | | | | | | | | | | | | | | | |
Net change | | | (145,503 | ) | | $ | (1,209,503 | ) | | | 2,859,809 | | | $ | 30,624,110 | |
| | | | | | | | | | | | | | | | |
| Class Y | | | | | | | | | | | | | | | | |
Issued from the sale of shares | | | 35,546,212 | | | $ | 376,118,474 | | | | 94,621,473 | | | $ | 1,007,278,821 | |
Issued in connection with the reinvestment of distributions | | | — | | | | — | | | | 172,490 | | | | 1,880,156 | |
Redeemed | | | (27,169,764 | ) | | | (282,964,888 | ) | | | (23,131,849 | ) | | | (244,275,468 | ) |
| | | | | | | | | | | | | | | | |
Net change | | | 8,376,448 | | | $ | 93,153,586 | | | | 71,662,114 | | | $ | 764,883,509 | |
| | | | | | | | | | | | | | | | |
Increase (decrease) from capital share transactions | | | (1,305,316 | ) | | $ | (7,328,026 | ) | | | 82,690,173 | | | $ | 884,494,560 | |
| | | | | | | | | | | | | | | | |
| | | | | | | | | | | | | | | | |
| |
| Six Months Ended
June 30, 2012 |
| |
| Year Ended
December 31, 2011 |
|
Managed Futures Strategy Fund | | | Shares | | | | Amount | | | | Shares | | | | Amount | |
| Class A | | | | | | | | | | | | | | | | |
Issued from the sale of shares | | | 12,243,612 | | | $ | 122,407,406 | | | | 51,347,993 | | | $ | 551,929,224 | |
Issued in connection with the reinvestment of distributions | | | 101,309 | | | | 976,532 | | | | 775,375 | | | | 8,017,306 | |
Redeemed | | | (22,402,467 | ) | | | (221,820,709 | ) | | | (22,561,002 | ) | | | (242,938,414 | ) |
| | | | | | | | | | | | | | | | |
Net change | | | (10,057,546 | ) | | $ | (98,436,771 | ) | | | 29,562,366 | | | $ | 317,008,116 | |
| | | | | | | | | | | | | | | | |
| Class C | | | | | | | | | | | | | | | | |
Issued from the sale of shares | | | 1,107,354 | | | $ | 10,918,449 | | | | 2,371,607 | | | $ | 25,453,453 | |
Issued in connection with the reinvestment of distributions | | | 6,597 | | | | 62,822 | | | | 23,560 | | | | 241,481 | |
Redeemed | | | (805,980 | ) | | | (7,959,307 | ) | | | (194,536 | ) | | | (2,061,142 | ) |
| | | | | | | | | | | | | | | | |
Net change | | | 307,971 | | | $ | 3,021,964 | | | | 2,200,631 | | | $ | 23,633,792 | |
| | | | | | | | | | | | | | | | |
| Class Y | | | | | | | | | | | | | | | | |
Issued from the sale of shares | | | 37,671,859 | | | $ | 373,666,622 | | | | 42,110,388 | | | $ | 454,569,292 | |
Issued in connection with the reinvestment of distributions | | | 222,215 | | | | 2,144,371 | | | | 672,465 | | | | 6,953,289 | |
Redeemed | | | (17,740,691 | ) | | | (173,163,412 | ) | | | (7,808,584 | ) | | | (83,713,552 | ) |
| | | | | | | | | | | | | | | | |
Net change | | | 20,153,383 | | | $ | 202,647,581 | | | | 34,974,269 | | | $ | 377,809,029 | |
| | | | | | | | | | | | | | | | |
Increase (decrease) from capital share transactions | | | 10,403,808 | | | $ | 107,232,774 | | | | 66,737,266 | | | $ | 718,450,937 | |
| | | | | | | | | | | | | | | | |
| 122
Notes to Financial Statements (continued)
June 30, 2012 (Unaudited)
11. Capital Shares (continued).
| | | | | | | | | | | | | | | | |
| |
| Six Months Ended
June 30, 2012 |
| |
| Year Ended
December 31, 2011 |
|
Loomis Sayles Absolute Strategies Fund | | | Shares | | | | Amount | | | | Shares | | | | Amount | |
| Class A | | | | | | | | | | | | | | | | |
Issued from the sale of shares | | | 1,825,082 | | | $ | 17,822,747 | | | | 30,602,206 | | | $ | 309,644,774 | |
Issued in connection with the reinvestment of distributions | | | 91,476 | | | | 894,718 | | | | 518,886 | | | | 5,000,664 | |
Redeemed | | | (8,245,384 | ) | | | (80,418,939 | ) | | | (17,377,149 | ) | | | (168,594,903 | ) |
| | | | | | | | | | | | | | | | |
Net change | | | (6,328,826 | ) | | $ | (61,701,474 | ) | | | 13,743,943 | | | $ | 146,050,535 | |
| | | | | | | | | | | | | | | | |
| Class C | | | | | | | | | | | | | | | | |
Issued from the sale of shares | | | 427,540 | | | $ | 4,153,800 | | | | 10,712,134 | | | $ | 108,281,778 | |
Issued in connection with the reinvestment of distributions | | | 42,788 | | | | 417,048 | | | | 152,413 | | | | 1,454,718 | |
Redeemed | | | (1,782,824 | ) | | | (17,297,148 | ) | | | (2,607,812 | ) | | | (24,979,006 | ) |
| | | | | | | | | | | | | | | | |
Net change | | | (1,312,496 | ) | | $ | (12,726,300 | ) | | | 8,256,735 | | | $ | 84,757,490 | |
| | | | | | | | | | | | | | | | |
| Class Y | | | | | | | | | | | | | | | | |
Issued from the sale of shares | | | 12,147,398 | | | $ | 118,594,982 | | | | 42,674,035 | | | $ | 427,908,877 | |
Issued in connection with the reinvestment of distributions | | | 281,424 | | | | 2,749,318 | | | | 592,079 | | | | 5,679,301 | |
Redeemed | | | (7,267,623 | ) | | | (70,626,549 | ) | | | (16,642,330 | ) | | | (162,068,348 | ) |
| | | | | | | | | | | | | | | | |
Net change | | | 5,161,199 | | | $ | 50,717,751 | | | | 26,623,784 | | | $ | 271,519,830 | |
| | | | | | | | | | | | | | | | |
Increase (decrease) from capital share transactions | | | (2,480,123 | ) | | $ | (23,710,023 | ) | | | 48,624,462 | | | $ | 502,327,855 | |
| | | | | | | | | | | | | | | | |
| | | | | | | | | | | | | | | | |
| |
| Six Months Ended
June 30, 2012 |
| |
| Year Ended
December 31, 2011 |
|
Multi-Asset Real Return Fund | | | Shares | | | | Amount | | | | Shares | | | | Amount | |
| Class A | | | | | | | | | | | | | | | | |
Issued from the sale of shares | | | 58,450 | | | $ | 563,810 | | | | 299,653 | | | $ | 3,033,094 | |
Issued in connection with the reinvestment of distributions | | | — | | | | — | | | | 4,381 | | | | 41,489 | |
Redeemed | | | (91,131 | ) | | | (881,695 | ) | | | (216,274 | ) | | | (2,117,308 | ) |
| | | | | | | | | | | | | | | | |
Net change | | | (32,681 | ) | | $ | (317,885 | ) | | | 87,760 | | | $ | 957,275 | |
| | | | | | | | | | | | | | | | |
| Class C | | | | | | | | | | | | | | | | |
Issued from the sale of shares | | | 2,924 | | | $ | 27,924 | | | | 12,897 | | | $ | 131,319 | |
Issued in connection with the reinvestment of distributions | | | — | | | | — | | | | 130 | | | | 1,229 | |
Redeemed | | | (8,538 | ) | | | (81,760 | ) | | | (3,577 | ) | | | (34,371 | ) |
| | | | | | | | | | | | | | | | |
Net change | | | (5,614 | ) | | $ | (53,836 | ) | | | 9,450 | | | $ | 98,177 | |
| | | | | | | | | | | | | | | | |
| Class Y | | | | | | | | | | | | | | | | |
Issued from the sale of shares | | | 112,275 | | | $ | 1,092,302 | | | | 4,900,179 | | | $ | 49,608,192 | |
Issued in connection with the reinvestment of distributions | | | — | | | | — | | | | 79,507 | | | | 750,530 | |
Redeemed | | | (664,999 | ) | | | (6,389,192 | ) | | | (4,638,918 | ) | | | (43,901,143 | ) |
| | | | | | | | | | | | | | | | |
Net change | | | (552,724 | ) | | $ | (5,296,890 | ) | | | 340,768 | | | $ | 6,457,579 | |
| | | | | | | | | | | | | | | | |
Increase (decrease) from capital share transactions | | | (591,019 | ) | | $ | (5,668,611 | ) | | | 437,978 | | | $ | 7,513,031 | |
| | | | | | | | | | | | | | | | |
123 |
SEMIANNUAL REPORT
June 30, 2012

CGM Advisor Targeted Equity Fund
Harris Associates Large Cap Value Fund
Natixis Diversified Income Fund
Natixis U.S. Multi-Cap Equity Fund
Vaughan Nelson Small Cap Value Fund
Vaughan Nelson Value Opportunity Fund
TABLE OF CONTENTS
Management Discussion and Performance page 1
Portfolio of Investments page37
Financial Statements page79
CGM ADVISOR TARGETED EQUITY FUND
Management Discussion
Manager:
G. Kenneth Heebner, CFA
Capital Growth Management Limited Partnership
Objective:
Seeks long-term growth of capital through investments in equity securities of companies whose earnings are expected to grow at a faster rate than the overall U.S. economy
Strategy:
Generally invests in a focused portfolio of common stocks of large-cap companies
Fund Inception:
November 27, 1968
Symbols:
| | |
| Class A | | NEFGX |
| Class B | | NEBGX |
| Class C | | NEGCX |
| Class Y | | NEGYX |
Market Conditions
Although the year began with a broad market recovery, global economic conditions remained volatile for much of the period. Europe was caught in a recession and a political crisis. The United States fared somewhat better, both economically and politically, but certainly couldn’t be considered thriving. China continues to suffer what its government is describing as a sharp economic slowdown. All the while, policy makers have had little success in restoring public confidence that a recovery is around the corner.
Performance Results
For the six months ended June 30, 2012, Class A shares of CGM Advisor Targeted Equity Fund returned 5.02% at net asset value. The fund lagged its benchmark, the S&P 500® Index, which returned 9.49%, and the 9.23% average return of funds in its peer group, the Morningstar Large Growth category.
Explanation of Fund Performance
During the first six months of 2012, the fund was fully invested in expectation of further U.S. economic growth. However, the pace of growth was more modest than expected as the need for households to pay down their debts cut into consumer spending, job creation slowed and the unemployment rate remained high. Meanwhile, economic activity in China and Europe decelerated significantly. Concerns about the turmoil in Europe and waning economic growth in China, as well as fear that a breakup of the eurozone would have a negative impact on the U.S. economy, further moderate the outlook for U.S. stocks.
Against this backdrop, the fund ended the period in positive territory, although exposure to cyclical issues dampened performance somewhat. Stocks whose profitability, and therefore share price, track the growth of the wider economy struggled amidst ongoing concerns over global economic growth.
Key contributors to fund performance for the period included Apple, United Continental and CBS Broadcasting. Apple, the personal computer and
1 |
consumer electronics giant and a new addition to the portfolio, has benefited from the dramatic success of its iPhone and iPad. These innovative products have translated into substantial earnings growth and significant gains in the share of their respective markets. United Continental, a leading airline company, benefited from industry consolidation. Fewer carriers and disciplined supply growth have resulted in strong pricing for the company. In addition, greater-than-expected earnings have driven its stock price higher. CBS, a major television network with extensive operations in radio and TV broadcasting, benefited from growth in advertising expenditures as well as strong ratings performance in the network TV business. Additionally, the company has made deals to add social commerce, fan-designed merchandise and online private sales to its monetization strategies for its television-show inventory. CBS was sold at a gain. The fund continues to hold both Apple and United Continental.
Global challenges weighed on several of the fund’s economically sensitive stocks during the period. The fund experienced a loss in Occidental Petroleum, a leading oil and gas producer, as oil prices fell in the face of reduced global growth expectations. The fund also lost ground with International Paper, the global leader in the paper and packaging industry. The company’s outlook is closely tied to the outlook for the overall economy, and slower-than-expected growth in the U.S. economy brought its share price down. Shares of Google, the dominant Internet search engine company, also fell during the period in light of concerns about the cost of future growth, and detracted from fund performance. We sold all three issues.
Outlook
Going forward, we continue to have confidence in the growth prospects for the U.S. economy and have focused the portfolio on opportunities in this area. As always, we will seek out stocks of companies that we believe have significant potential for price appreciation.
What You Should Know
Investments in the fund are subject to a number of risks. Please see the “Principal Risks” section of the fund’s prospectus. The purchase of fund shares should be seen as a long-term investment.
| 2
CGM ADVISOR TARGETED EQUITY FUND
Investment Results through June 30, 2012
The charts comparing the fund’s performance to an index provide a general sense of how it performed. The fund’s total return for the period shown below appears with and without sales charges and includes fund expenses and fees. An index measures the performance of a theoretical portfolio. Unlike a fund, the index is unmanaged and does not have expenses that affect the results. It is not possible to invest directly in an index. Investors would incur transaction costs and other expenses if they purchased the securities necessary to match the index.
Growth of $10,000 Investment in Class A Shares
June 30, 2002 through June 30, 2012
Performance data quoted represents past performance and is no guarantee of future results. Total return and value will vary and you may have a gain or loss when shares are sold. Current performance may be lower or higher than quoted. For most recent month-end performance, visit ngam.natixis.com. Performance for other share classes will be greater or less than shown based on differences in fees and sales charges.
Expense Ratios
| | | | | | |
| Gross Expense Ratio* |
| Class A: 1.13% | | Class B: 1.88% | | Class C: 1.88% | | Class Y: 0.87% |
|
| Net Expense Ratio* |
| Class A: 1.13% | | Class B: 1.88% | | Class C: 1.88% | | Class Y: 0.87% |
| * | As stated in the most recent prospectus. |
3 |
Average Annual Total Returns — June 30, 2012
| | | | | | | | | | | | | | | | |
| | | | | |
| | | 6 Months | | | 1 Year | | | 5 Years | | | 10 Years | |
| | | | | |
| Class A (Inception 11/27/68) | | | | | | | | | | | | | | | | |
| NAV | | | 5.02 | % | | | -7.88 | % | | | -0.70 | % | | | 4.82 | % |
| With 5.75% Maximum Sales Charge | | | -1.01 | | | | -13.14 | | | | -1.87 | | | | 4.20 | |
| | | | | |
| Class B (Inception 2/28/97) | | | | | | | | | | | | | | | | |
| NAV | | | 4.64 | | | | -8.52 | | | | -1.44 | | | | 4.03 | |
| With CDSC1 | | | -0.36 | | | | -13.10 | | | | -1.80 | | | | 4.03 | |
| | | | | |
| Class C (Inception 9/1/98) | | | | | | | | | | | | | | | | |
| NAV | | | 4.54 | | | | -8.57 | | | | -1.44 | | | | 4.02 | |
| With CDSC1 | | | 3.54 | | | | -9.48 | | | | -1.44 | | | | 4.02 | |
| | | | | |
| Class Y (Inception 6/30/99) | | | | | | | | | | | | | | | | |
| NAV | | | 5.11 | | | | -7.67 | | | | -0.45 | | | | 5.15 | |
| | | | | |
| Comparative Performance | | | | | | | | | | | | | | | | |
| S&P 500® Index2 | | | 9.49 | | | | 5.45 | | | | 0.22 | | | | 5.33 | |
| Morningstar Large Growth Fund Avg3 | | | 9.23 | | | | 0.81 | | | | 0.96 | | | | 5.19 | |
Performance data quoted represents past performance and is no guarantee of future results. Total return and value will vary and you may have a gain or loss when shares are sold. Current performance may be lower or higher than quoted. For most recent month-end performance, visit ngam.natixis.com. Performance for periods less than one year is cumulative, not annualized. Returns reflect changes in share price and reinvestment of dividends and capital gains, if any. Class Y shares are not available for purchase by all investors.
The table and graph do not reflect taxes shareholders might owe on any fund distributions or when they redeem their shares.
Note: Portfolio summary tables previously included on this page can be found on the fund’s Fact Sheet at ngam.natixis.com.
NOTES TO CHARTS
| 1 | Performance for Class B shares assumes a maximum 5.00% contingent deferred sales charge (“CDSC”) applied when you sell shares, which declines annually between years 1-6 according to the following schedule: 5, 4, 3, 3, 2, 1, 0%. Class C share performance assumes a 1.00% CDSC applied when you sell shares within one year of purchase. |
| 2 | S&P 500® Index is a widely recognized measure of U.S. stock market performance. It is an unmanaged index of 500 common stocks chosen for market size, liquidity, and industry group representation, among other factors. |
| 3 | Morningstar Large Growth Fund Average is the average performance without sales charges of funds with similar investment objectives, as calculated by Morningstar, Inc. |
| 4
HARRIS ASSOCIATES LARGE CAP VALUE FUND
Management Discussion
Managers:
Edward S. Loeb, CFA
Michael J. Mangan, CFA
Diane L. Mustain, CFA
Harris Associates L.P.
Objective:
Seeks opportunities for long-term capital growth and income
Strategy:
Invests primarily in common stock of large- and mid-cap companies in any industry
Fund Inception:
May 6, 1931
Symbols:
| | |
| Class A | | NEFOX |
| Class B | | NEGBX |
| Class C | | NECOX |
| Class Y | | NEOYX |
Market Conditions
For the third consecutive year, equity markets entered the summer months suffering from macroeconomic and political worries despite business and consumer fundamentals that have demonstrated real, sustained improvement. The eurozone crisis provided the proximate catalyst for the stock market’s volatility, with the S&P 500® Index rising or falling more than 1% every three days as the daily rumors and headlines drove investor expectations.
Performance Results
For the six months ended June 30, 2012, Class A shares of Harris Associates Large Cap Value Fund returned 8.08% at net asset value. The fund underperformed its benchmark, the Russell 1000® Value Index, which returned 8.68%, but outperformed the 7.70% average return of funds in its peer group, Morningstar’s Large Blend category.
Explanation of Fund Performance
As value investors, our emphasis is on individual stock selection, with country and sector weights determined by our stock-selection process rather than the weights in any specific benchmark. Sector-wise, the fund benefited from stock selection in information technology relative to the Russell 1000® Value Index, as well as from its significant underweights in consumer staples, where it had no exposure, and utilities. Both sectors were underperformers for the period. Stock selection in industrials and consumer discretionary, and a lack of exposure to the top-performing telecom sector, were the largest relative detractors. The leading contributors to fund returns for the six months were Comcast, Wells Fargo and Marriott International. Comcast’s latest results showed good growth in its broadband and business services divisions. Video subscribers were down slightly, but its cable margins improved more than expected and free cash flow growth accelerated. Wells Fargo continues to execute well in a tough environment, growing both its market share and franchise value. The bank reported a 17% profit increase in its latest quarter,
5 |
driven in large part by cost cutting and strength in mortgage banking. In March, Wells Fargo raised its dividend from 48 cents per share to 88 cents. Marriott International reported solid earnings growth in its latest quarter, as corporate and group bookings increased for its high-end hotels in North America and Asia. The company has raised its earnings guidance for 2012, though it also lowered the per-room revenue outlook for its international operations.
The largest detractors from fund returns for the six months were Ultra Petroleum, Delphi Automotive and Autoliv. Ultra Petroleum, which was sold from the fund during the period, continued to be adversely affected by declining natural gas prices. In May, the company reported that first-quarter revenue fell short of expectations, and management said it would further reduce its planned capital spending in response to weak gas prices. Delphi Automotive reported an 18% jump in profit in the first quarter of 2012 and raised guidance for the full year, based on improving conditions in the North American auto market. However, the stock fell later in the period after the expiration of certain conditions that affected pre-initial public offering shareholders and subsequent insider sales. Autoliv reported a larger-than-expected earnings drop in its latest quarterly filings, and the stock took another hit in June after company executives admitted that they conspired to fix prices of auto safety equipment.
Outlook
As long-term investors, we find stocks attractive compared to bonds and also in their own right. At midyear, the S&P 500® traded at approximately 13 times earnings (below the historical average, which is near 15), profit margins are strong and balance sheets are healthy in our view. Earnings are likely to feel some pressure in coming quarters, given a strengthening dollar and slower growth in China, but falling energy prices and a rebounding housing market are encouraging in the near term. In our opinion, European policy makers are likely to find a path to address the current liquidity and debt squeeze. But significant economic, political and cultural challenges must be addressed for the eurozone and its currency to survive in the long run.
What You Should Know
Investments in the fund are subject to a number of risks. Please see the “Principal Risks” section of the fund’s prospectus. The purchase of fund shares should be seen as a long-term investment.
| 6
HARRIS ASSOCIATES LARGE CAP VALUE FUND
Investment Results through June 30, 2012
The charts comparing the fund’s performance to an index provide a general sense of how it performed. The fund’s total return for the period shown below appears with and without sales charges and includes fund expenses and fees. An index measures the performance of a theoretical portfolio. Unlike a fund, the index is unmanaged and does not have expenses that affect the results. It is not possible to invest directly in an index. Investors would incur transaction costs and other expenses if they purchased the securities necessary to match the index.
Growth of $10,000 Investment in Class A Shares4
June 30, 2002 through June 30, 2012
Performance data quoted represents past performance and is no guarantee of future results. Total return and value will vary and you may have a gain or loss when shares are sold. Current performance may be lower or higher than quoted. For most recent month-end performance, visit ngam.natixis.com. Performance for other share classes will be greater or less than shown based on differences in fees and sales charges.
Expense Ratios
| | | | | | |
| Gross Expense Ratio (before fee waivers and/or expense reimbursements)* |
| Class A: 1.30% | | Class B: 2.05% | | Class C: 2.05% | | Class Y: 1.05% |
|
| Net Expense Ratio (after fee waivers and/or expense reimbursements)* |
| Class A: 1.30% | | Class B: 2.05% | | Class C: 2.05% | | Class Y: 1.05% |
| * | As stated in the most recent prospectus. Waivers/reimbursements are contractual and are set to expire on 4/30/13. Contracts are reevaluated on an annual basis. |
7 |
Average Annual Total Returns — June 30, 20124
| | | | | | | | | | | | | | | | |
| | | | | |
| | | 6 Months | | | 1 Year | | | 5 Years | | | 10 Years | |
| | | | | |
| Class A (Inception 5/6/31) | | | | | | | | | | | | | | | | |
| NAV | | | 8.08 | % | | | 0.95 | % | | | -1.15 | % | | | 3.86 | % |
| With 5.75% Maximum Sales Charge | | | 1.84 | | | | -4.85 | | | | -2.31 | | | | 3.25 | |
| | | | | |
| Class B (Inception 9/13/93) | | | | | | | | | | | | | | | | |
| NAV | | | 7.76 | | | | 0.22 | | | | -1.88 | | | | 3.09 | |
| With CDSC1 | | | 2.76 | | | | -4.78 | | | | -2.27 | | | | 3.09 | |
| | | | | |
| Class C (Inception 5/1/95) | | | | | | | | | | | | | | | | |
| NAV | | | 7.70 | | | | 0.22 | | | | -1.89 | | | | 3.08 | |
| With CDSC1 | | | 6.70 | | | | -0.78 | | | | -1.89 | | | | 3.08 | |
| | | | | |
| Class Y (Inception 11/18/98) | | | | | | | | | | | | | | | | |
| NAV | | | 8.24 | | | | 1.18 | | | | -0.85 | | | | 4.22 | |
| | | | | |
| Comparative Performance | | | | | | | | | | | | | | | | |
| Russell 1000® Value Index2 | | | 8.68 | | | | 3.01 | | | | -2.19 | | | | 5.28 | |
| Morningstar Large Blend Fund Avg.3 | | | 7.70 | | | | 0.94 | | | | -0.94 | | | | 4.68 | |
Performance data quoted represents past performance and is no guarantee of future results. Total return and value will vary and you may have a gain or loss when shares are sold. Current performance may be lower or higher than quoted. For most recent month-end performance, visit ngam.natixis.com. Performance for periods less than one year is cumulative, not annualized. Returns reflect changes in share price and reinvestment of dividends and capital gains, if any. Class Y shares are not available for purchase by all investors.
The table and graph do not reflect taxes shareholders might owe on any fund distributions or when they redeem their shares.
Note: Portfolio summary tables previously included on this page can be found on the fund’s Fact Sheet at ngam.natixis.com.
NOTES TO CHARTS
| 1 | Performance for Class B shares assumes a maximum 5.00% contingent deferred sales charge (“CDSC”) applied when you sell shares, which declines annually between years 1-6 according to the following schedule: 5, 4, 3, 3, 2, 1, 0%. Class C share performance assumes a 1.00% CDSC applied when you sell shares within one year of purchase. |
| 2 | Russell 1000® Value Index is an unmanaged index that measures the performance of the large-cap value segment of the U.S. equity universe. It includes those Russell 1000® companies with lower price-to-book ratios and lower expected growth values. |
| 3 | Morningstar Large Blend Fund Average is the average performance without sales charges of funds with similar investment objectives, as calculated by Morningstar, Inc. |
| 4 | Fund performance has been increased by fee waivers and/or expense reimbursements, if any, without which performance would have been lower. |
| 8
NATIXIS DIVERSIFIED INCOME FUND
Management Discussion
Subadvisors:
AEW Capital Management, L.P.
Loomis, Sayles & Company, L.P.
Objective:
Seeks current income with a secondary objective of capital appreciation
Strategy:
Focuses on fixed-income and equity securities through a diversified portfolio of complementary income-producing investment disciplines from specialized money managers
Inception Date:
November 17, 2005
Symbols:
| | |
| Class A | | IIDPX |
| Class C | | CIDPX |
Market Conditions
The U.S. financial markets got off to a strong start in 2012, buoyed by improving economic data at home and hopes that Europe would rein in its lingering debt problems. U.S. labor markets reported strong gains in the first three months of the period, consumer confidence strengthened and the long-troubled housing market began to show signs of life. However, Europe’s inability to craft a convincing plan to deal with its financial problems weighed on the markets as the period wore on. Parts of Europe slid back into recession and China’s economy slowed more than expected, hurting demand in both the developed and emerging world. Second quarter job growth was disappointingly low, and consumers became wary of their prospects once again. Against this backdrop, income-oriented markets performed almost as well as equity markets, led by strong returns from real estate investment trusts (REITs), investment-grade and high-yield bonds. Long-term U.S. Treasuries were strong performers in the second half of the period as investors grew more risk averse on disappointing economic data.
Performance Results
For the six months ended June 30, 2012, Class A shares of Natixis Diversified Income Fund returned 8.11% at net asset value. The portfolio outperformed its primary benchmark, the Barclays U.S. Aggregate Bond Index, which returned 2.37%. The portfolio’s secondary benchmark returned 6.61% for the period. This benchmark is a blended, unmanaged index composed of 40% Barclays U.S. Aggregate Bond Index, 25% MSCI US REIT Index, 20% Dow Jones Select Dividend Index and 15% Barclays U.S. TIPS Index. The fund’s Morningstar peer group, the Conservative Allocation category, had an average return of 4.51% for the six-month period.
Explanation of Fund Performance
Natixis Diversified Income Fund allows investors to participate in four income-oriented market segments,
9 |
each featuring a different income-oriented investment discipline. They are:
| · | | Active Dividend Equity Segment, an indexed portfolio of dividend-paying common stocks, based on the Dow Jones Select Dividend Index, and tracked by Active Investment Advisors (AIA), a division of NGAM Advisors, L.P. |
| · | | AEW Diversified REIT Segment, composed of REITs. This segment is managed by AEW Capital Management, L.P. (“AEW”), a specialist in this income-producing equity field. |
| · | | Loomis Sayles Inflation Protected Securities Segment, a portfolio of Treasury Inflation Protected Securities (TIPS). The segment is managed by Loomis, Sayles and Company, L.P. (“Loomis Sayles”). |
| · | | Loomis Sayles Multi-Sector Bond Segment, a portfolio composed of domestic and foreign bonds also managed by Loomis Sayles. |
Active Dividend Equity Segment
This segment is designed to replicate the Dow Jones Select Dividend Index by holding substantially all of the securities in the index in the same proportions. The index is composed of 100 of the highest dividend-paying equity securities (other than REITs) in the Dow Jones U.S. Total Market Index – a broad based index designed to represent the total market for U.S. equity securities.
The Dow Jones Select Dividend Index returned 6.54% for the six-month period ended June 30, 2012. Telecommunications, materials and consumer staples were the best performing sectors while energy, consumer discretionary and utilities lagged the most. The largest sectors at both the beginning and the end of the period were utilities, industrials and consumer staples.
There were no deletions from the index during the period. However, MeadWestvaco spun off its consumer and office products business to form a new entity and Sara Lee spun off its international coffee and tea business.
AEW Diversified REIT Segment
For the six months ended June 30, 2012, the U.S. REIT sector posted positive performance, rising 14.88% as measured by the MSCI US REIT Index. The fund’s REIT segment benefitted from solid security selection, particularly among its holdings in the office, storage and health care sectors, which were offset by negative stock selection in the triple net lease, industrial and regional mall sectors. Strongest contributors included regional mall REIT Simon Property Group, industrial company ProLogis and healthcare REIT Ventas. Individual detractors from performance included First Potomac Realty, Entertainment Properties Trust and Sun Communities. Sun Communities was sold during the period.
Within North America, the U.S. economic recovery appears to be slowing, though bright spots exist that should help keep the economy out of another recession. Renewed efforts to preserve the eurozone should help to ease sovereign debt issues in Europe, while falling gasoline prices and a slowly improving housing market should aid consumption growth in the United States. Nevertheless, the global macro environment promises to be more important than usual to market sentiment and valuations and will likely lead to continued
| 10
volatility for some time. To a degree, REITs benefit from this uncertainty, and even slow economic growth, combined with low interest rates, should support a gradual improvement in underlying commercial property fundamentals, including REIT prices.
Loomis Sayles Inflation Protected Securities Segment
Troubles in the eurozone remained the primary focus for investors during the first half of the year, as policy and leadership changes in the region influenced the capital markets on a global scale. Although U.S. Treasury yields rose during the first quarter, they declined sharply soon after, falling to record lows on Europe’s woes and renewed global economic concerns. In addition, the yield curve (a curve that shows the relationship among bond yields across the maturity spectrum) shifted lower during the period. Real yields on the TIPS curve fell below zero on maturities stretching out as far as 10 years, offering less room for further decline in rates going forward.
Overall, U.S. Treasuries, including TIPS, rallied during the period, with investors seeking less risky assets during periods of heightened volatility. The segment posted solid performance for the period, primarily due to its TIPS exposure. In addition, the segment maintained a slightly longer-than-average duration (price sensitivity to interest rate changes), which boosted performance in a declining yield environment. However, a small allocation to agency securities, which lagged TIPS, slightly weighed on performance.
Given the uncertainty facing investors, it is likely that TIPS and other quality assets will continue to benefit from periods of risk-aversion.
Loomis Sayles Multi-Sector Bond Segment
The bulk of the segment’s strong performance came during the early months of the year, as many investors favored non-Treasury investments. For the segment, issue selection within investment-grade and high-yield corporate sectors was strong, with industrial issues making the most significant contributions, followed by financials and utility issues. Additionally, an allocation to convertible bonds boosted performance, as these equity-sensitive holdings followed the equity markets higher. For similar reasons, a small allocation to preferred securities also contributed to return. The portfolio’s exposure to non-U.S.-dollar-denominated holdings aided performance, led by the euro, Mexican peso, Philippine peso, Singapore dollar and Australian dollar. Selected British pound and Canadian dollar issues detracted from performance.
An allocation to the government-related sector was a modest performance detractor. Common stock holdings also dragged on performance, primarily due to negative results from specific holdings within the communication and consumer cyclical sectors.
What You Should Know
Investments in the fund are subject to a number of risks. Please see the “Principal Risks” section of the fund’s prospectus. The purchase of fund shares should be seen as a long-term investment.
11 |
NATIXIS DIVERSIFIED INCOME FUND
Investment Results through June 30, 2012
The charts comparing the fund’s performance to an index provide a general sense of how it performed. The fund’s total return for the period shown below appears with and without sales charges and includes fund expenses and fees. An index measures the performance of a theoretical portfolio. Unlike a fund, an index is unmanaged and does not have expenses that affect the results. It is not possible to invest directly in an index. Investors would incur transaction costs and other expenses if they purchased the securities necessary to match the index.
Growth of $10,000 Investment in Class A Shares6
November 17, 2005 (inception) through June 30, 2012
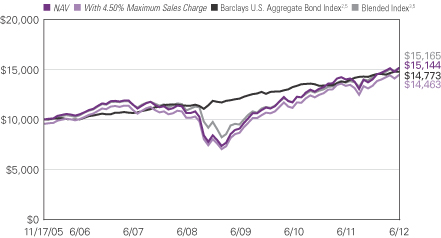
Performance data quoted represents past performance and is no guarantee of future results. Total return and value will vary and you may have a gain or loss when shares are sold. Current performance may be lower or higher than quoted. For most recent month-end performance, visit ngam.natixis.com. Performance for other share classes will be greater or less than shown based on differences in fees and sales charges.
Expense Ratios
| | |
| Gross Expense Ratio (before fee waivers and/or expense reimbursements)* |
| Class A: 1.13% | | Class C: 1.88% |
|
| Net Expense Ratio (after fee waivers and/or expense reimbursements)* |
| Class A: 1.13% | | Class C: 1.88% |
| * | As stated in the most recent prospectus. Waivers/reimbursements are contractual and are set to expire on 4/30/13. Contracts are reevaluated on an annual basis. |
| 12
Average Annual Total Returns — June 30, 20126
| | | | | | | | | | | | | | | | |
| | | | | |
| | | 6 Months | | | 1 Year | | | 5 Year | | | Since Inception5 | |
| | | | | |
| Class A (Inception 11/17/05) | | | | | | | | | | | | | | | | |
| NAV | | | 8.11 | % | | | 8.19 | % | | | 5.72 | % | | | 6.47 | % |
| With 4.50% Maximum Sales Charge | | | 3.21 | | | | 3.29 | | | | 4.75 | | | | 5.74 | |
| | | | | |
| Class C (Inception 11/17/05) | | | | | | | | | | | | | | | | |
| NAV | | | 7.77 | | | | 7.35 | | | | 4.92 | | | | 5.68 | |
| With CDSC1 | | | 6.77 | | | | 6.35 | | | | 4.92 | | | | 5.68 | |
| | | | | |
| Comparative Performance | | | | | | | | | | | | | | | | |
| Barclays U.S. Aggregate Bond Index2 | | | 2.37 | | | | 7.47 | | | | 6.79 | | | | 6.11 | |
| Blended Index3 | | | 6.61 | | | | 10.68 | | | | 5.76 | | | | 6.53 | |
| Morningstar Conservative Allocation Fund Avg.4 | | | 4.51 | | | | 2.34 | | | | 3.02 | | | | 4.22 | |
Performance data quoted represents past performance and is no guarantee of future results. Total return and value will vary and you may have a gain or loss when shares are sold. Current performance may be lower or higher than quoted. For most recent month-end performance, visit ngam.natixis.com. Performance for periods less than one year is cumulative, not annualized. Returns reflect changes in share price and reinvestment of dividends and capital gains, if any.
The table and graph do not reflect taxes shareholders might owe on any fund distributions or when they redeem their shares.
Note: Portfolio summary tables previously included on this page can be found on the fund’s Fact Sheet at ngam.natixis.com.
NOTES TO CHARTS
| 1 | Class C share performance assumes a 1.00% contingent deferred sales charge (“CDSC”) applied when you sell shares within one year of purchase. |
| 2 | Barclays U.S. Aggregate Bond Index is an unmanaged index that covers the U.S.-dollar denominated, investment grade, fixed-rate, taxable bond market of SEC-registered securities. The index includes bonds from the Treasury, government-related, corporate, mortgage-backed securities, asset-backed securities, and collateralized mortgage-backed securities sectors. |
| 3 | Blended Index is an unmanaged, blended index composed of the following weights: 40% Barclays U.S. Aggregate Bond Index, 25% MSCI US REIT Index, 20% Dow Jones Select Dividend Index, and 15% Barclays U.S. TIPS Index. The four indices composing the Blended Index measure, respectively, the performance of investment-grade fixed-income securities, equity REIT securities, dividend-yielding equity securities, and Treasury inflation-protected securities. The weightings of the indices that compose the Blended Index are rebalanced on a monthly basis to maintain the allocations as described above. These rebalancings will not necessarily correspond to the rebalancings of the fund’s investment portfolio, and the relative weightings of the asset classes in the fund will generally differ to some extent from the weightings in the Blended Index. |
| 4 | Morningstar Conservative Allocation Fund Average is the average performance without sales charges of funds with similar current investment objectives, as calculated by Morningstar, Inc. |
| 5 | The since-inception comparative performance figures shown were calculated from 11/30/05. |
| 6 | Fund performance has been increased by fee waivers and/or expense reimbursements, if any, without which performance would have been lower. |
13 |
NATIXIS U.S. MULTI-CAP EQUITY FUND
Management Discussion
Subadvisors:
Harris Associates L.P.
Loomis, Sayles & Company, L.P.
Objective:
Seeks long-term growth of capital
Strategy:
Features growth and value investments through a diversified portfolio of complementary equity investment disciplines provided by specialized money managers
Inception Date:
July 7, 1994
Symbols:
| | |
| Class A | | NEFSX |
| Class B | | NESBX |
| Class C | | NECCX |
| Class Y | | NESYX |
Market Conditions
The U.S. equity markets got off to a strong start in 2012, buoyed by improving economic data at home and hopes that Europe would find a way to rein in its lingering debt problems. U.S. labor markets reported strong gains in the first three months of the period, consumer confidence strengthened and the long-troubled housing market began to show signs of life.
However, Europe’s inability to craft a convincing plan to deal with its financial problems weighed on the markets as the period wore on. Parts of Europe slid back into recession and China’s economy slowed more than expected, hurting demand in both the developed and emerging world. In the United States, second quarter job growth was disappointingly low, and consumers became wary of their prospects once again. Against this backdrop, and despite relatively solid corporate profit growth, the U.S. equity markets retreated in the second quarter. They managed to regain some of their losses late in the period, as investors responded favorably to an announced plan by eurozone policymakers to relieve short-term pressure on troubled economies and a longer-term plan that would strengthen the region’s financial union. Large-cap stocks outperformed small-cap and mid-cap stocks and growth stocks outpaced value stocks by a small margin.
Performance Results
For the six months ended June 30, 2012, Class A shares of Natixis U.S. Multi-Cap Equity Fund returned 8.83% at net asset value. For the same period, the S&P 500® Index returned 9.49%, the S&P MidCap 400® Index returned 7.90% and the Wilshire 4500 Index returned 8.77%. The portfolio underperformed the 9.23% average return of funds in Morningstar’s Large Growth category.
Explanation of Fund Performance
Each of the portfolio’s segments uses a distinct investment style, providing shareholders with exposure to a variety of different stocks and strategies:
| · | | Harris Associates L.P. segment invests primarily in common stocks of large- and mid-cap |
| 14
| | companies that they believe are trading at a substantial discount to their “true business value.” |
| · | | Loomis, Sayles & Company, L.P. (Loomis Sayles) manages three segments. One invests in mid-cap growth stocks, one invests in large-cap growth stocks, and one focuses on small/mid-cap core stocks. |
Harris Associates Segment
Sector-wise, financials and information technology contributed most to the segment’s return, and consumer discretionary was also a significant contributor. Holdings in the energy sector were the main detractor.
The leading contributors to returns were Comcast, Wells Fargo and Marriott International. Comcast’s latest results showed good growth in broadband and business services, and its cable margins improved. Wells Fargo reported a 17% profit increase, driven by cost cutting and strength in mortgage banking. Marriott reported an increase in corporate and group bookings in North America and Asia. The largest detractors from returns were Ultra Petroleum, Delphi Automotive and Autoliv. Ultra Petroleum, which was sold from the fund during the period, continued to be hurt by declining natural gas prices. Delphi Automotive fell after certain pre-initial public offering deadlines expired and insiders made large sales. Autoliv reported an earnings drop and admitted that it conspired to fix prices of auto safety equipment.
Loomis Sayles Mid Cap Growth Segment
Strong stock selection in the healthcare and consumer discretionary sectors drove performance for the segment during the six-month period. Consumer staples and producer durables also made strong contributions to results.
Within the healthcare sector, the leading performers included Alexion, a commercial-stage biotech company, and Inhibitex, a clinical-stage biotech company. Alexion’s lead drug was recently approved for a second condition, and increased patient awareness worldwide has driven growth. Inhibitex was acquired by Bristol-Myers Squibb at a significant premium during the period. Leading performers in the consumer discretionary and consumer staples sectors were companies that combined solid same-store sales with new store openings and have virtually no exposure to slowing international markets. Examples include Ulta, a beauty products retailer, and PetSmart, a pet food and supplies retailer.
Energy was the segment’s weakest sector, followed by financials, technology and materials. Holdings in these economically sensitive sectors performed well in the first quarter but declined in the second quarter, as the global economy slowed. Declining oil prices drove down shares of Approach Resources, an independent energy company that is sensitive to changes in oil prices. While the fund did not own many financials stocks, the ones it did own generated flat returns, including two real estate investment trusts, AvalonBay Communities and Essex Property Trust. Both develop and manage apartment buildings and multi-family communities. AvalonBay was added to the portfolio in mid-2011; the position was sold early in the period to fund less-defensive positions.
15 |
Loomis Sayles Small/Mid Cap Core Segment
Positive stock selection drove solid results for the segment during the six-month period. Contribution to performance was broad based, with all sectors except energy delivering positive returns. Positions in Wyndham Worldwide Corporation, Catalyst Health Solutions and Discover Financial Services were among the top contributors to results. Wyndham Worldwide, which franchises several hotel brands, reported strong earnings growth driven by solid trends in its vacation ownership business. Catalyst Health Solutions, a provider of pharmacy benefit management services, agreed to be acquired by SXC Health Solutions at a 24% premium to prior trading levels. Discover Financial Services, which issues the Discover credit card and other financial products, increased its earnings estimates based on improved loan growth, higher transaction volumes and better credit metrics.
Lagging stocks for the six-month period included Kirby, Atmel and Clayton Williams Energy. Shares of Kirby, a marine transportation company, declined following a downward revision in its annual earnings guidance. The market’s shift away from more economically sensitive companies also hurt the stock. Atmel, which designs and develops integrated circuits, declined on falling earnings expectations for the year and growing competition in the touch sensor market. Shares of Clayton Williams Energy, a Texas-based oil and natural gas exploration company, fell due to a decline in key commodity prices.
Loomis Sayles Growth Segment
Against a volatile market backdrop, the segment generated a positive return for the six-month period. Overall, stock selection in the technology sector detracted from performance, while an underweight allocation to the energy sector and overweight to the financials sector aided returns. Stock selection in the consumer discretionary and financial services sectors also contributed positively.
The largest individual contributors to performance included Internet retailer Amazon.com and credit card provider Visa. Both stocks came under pressure at times during 2010 and 2011. Amazon’s margins were compressed as the company invested in fulfillment centers and its digital media offerings, while Visa faced concerns about pending legislation. However, Amazon’s investments began to pay off in 2012, helping the company gain market share and increase profitability. Visa shares rose after government regulations proved less onerous than originally thought.
The largest detractors from performance included Internet search company Google and online jeweler Blue Nile. Google shares declined after the company reported lower-than-expected earnings. In our view, this shortfall is likely a short-term issue. The company remains poised to take advantage of significant long-term growth opportunities in the global advertising market and its expanding mobile platform. Blue Nile stock declined in response to the company’s strategic shift to non-engagement jewelry. While this change will likely require increased investment and take time to implement, we believe that the company’s core competitive advantages remain in place in our view.
What You Should Know
Investments in the fund are subject to a number of risks. Please see the “Principal Risks” section of the fund’s prospectus. The purchase of fund shares should be seen as a long-term investment.
| 16
NATIXIS U.S. MULTI-CAP EQUITY FUND
Investment Results through June 30, 2012
The charts comparing the fund’s performance to an index provide a general sense of how it performed. The fund’s total return for the period shown below appears with and without sales charges and includes fund expenses and fees. An index measures the performance of a theoretical portfolio. Unlike a fund, the index is unmanaged and does not have expenses that affect the results. It is not possible to invest directly in an index. Investors would incur transaction costs and other expenses if they purchased the securities necessary to match the index.
Growth of $10,000 Investment in Class A Shares6
June 30, 2002 through June 30, 2012
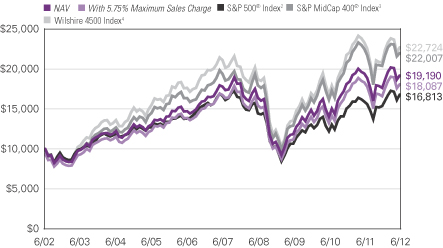
Performance data quoted represents past performance and is no guarantee of future results. Total return and value will vary and you may have a gain or loss when shares are sold. Current performance may be lower or higher than quoted. For most recent month-end performance, visit ngam.natixis.com. Performance for other share classes will be greater or less than shown based on differences in fees and sales charges.
Expense Ratios
| | | | | | |
| Gross Expense Ratio (before fee waivers and/or expense reimbursements)* |
| Class A: 1.39% | | Class B: 2.14% | | Class C: 2.14% | | Class Y: 1.14% |
|
| Net Expense Ratio (after fee waivers and/or expense reimbursements)* |
| Class A: 1.35% | | Class B: 2.10% | | Class C: 2.10% | | Class Y: 1.10% |
| * | As stated in the most recent prospectus. Waivers/reimbursements are contractual and are set to expire on 4/30/13. Contracts are reevaluated on an annual basis. |
17 |
Average Annual Total Returns — June 30, 20126
| | | | | | | | | | | | | | | | |
| | | | | |
| | | 6 Months | | | 1 Year | | | 5 Years | | | 10 Years | |
| | | | | |
| Class A (Inception 7/7/94) | | | | | | | | | | | | | | | | |
| NAV | | | 8.83 | % | | | -1.38 | % | | | 1.51 | % | | | 6.74 | % |
| With 5.75% Maximum Sales Charge | | | 2.56 | | | | -7.06 | | | | 0.31 | | | | 6.11 | |
| | | | | |
| Class B (Inception 7/7/94) | | | | | | | | | | | | | | | | |
| NAV | | | 8.48 | | | | -2.11 | | | | 0.76 | | | | 5.95 | |
| With CDSC1 | | | 3.48 | | | | -6.79 | | | | 0.38 | | | | 5.95 | |
| | | | | |
| Class C (Inception 7/7/94) | | | | | | | | | | | | | | | | |
| NAV | | | 8.47 | | | | -2.10 | | | | 0.75 | | | | 5.94 | |
| With CDSC1 | | | 7.47 | | | | -3.04 | | | | 0.75 | | | | 5.94 | |
| | | | | |
| Class Y (Inception 11/15/94) | | | | | | | | | | | | | | | | |
| NAV | | | 9.01 | | | | -1.10 | | | | 1.76 | | | | 7.16 | |
| | | | | |
| Comparative Performance | | | | | | | | | | | | | | | | |
| S&P 500® Index2 | | | 9.49 | | | | 5.45 | | | | 0.22 | | | | 5.33 | |
| S&P MidCap 400® Index3 | | | 7.90 | | | | -2.33 | | | | 2.55 | | | | 8.21 | |
| Wilshire 4500 Index4 | | | 8.77 | | | | -2.53 | | | | 1.47 | | | | 8.55 | |
| Morningstar Large Growth Fund Avg.5 | | | 9.23 | | | | 0.81 | | | | 0.96 | | | | 5.19 | |
Performance data quoted represents past performance and is no guarantee of future results. Total return and value will vary and you may have a gain or loss when shares are sold. Current performance may be lower or higher than quoted. For most recent month-end performance, visit ngam.natixis.com. Performance for periods less than one year is cumulative, not annualized. Returns reflect changes in share price and reinvestment of dividends and capital gains, if any. Class Y shares are not available for purchase by all investors.
The table and graph do not reflect taxes shareholders might owe on any fund distributions or when they redeem their shares.
Note: Portfolio summary tables previously included on this page can found on the fund’s Fact Sheet at ngam.natixis.com.
NOTES TO CHARTS
| 1 | Performance for Class B shares assumes a maximum 5.00% contingent deferred sales charge (“CDSC”) applied when you sell shares, which declines annually between years 1-6 according to the following schedule: 5, 4, 3, 3, 2, 1, 0%. Class C share performance assumes a 1.00% CDSC applied when you sell shares within one year of purchase. |
| 2 | S&P 500® Index is a widely recognized measure of U.S. stock market performance. It is an unmanaged index of 500 common stocks chosen for market size, liquidity, and industry group representation, among other factors. |
| 3 | S&P MidCap 400® Index is an unmanaged index that measures the performance of the mid-cap segment of the U.S. equities market. |
| 4 | Wilshire 4500 Index is an unmanaged index that measures the performance of U.S. small- and mid-cap stocks. |
| 5 | Morningstar Large Growth Fund Average is the average performance without sales charges of funds with similar investment objectives, as calculated by Morningstar, Inc. |
| 6 | Fund performance has been increased by fee waivers and/or expense reimbursements, if any, without which performance would have been lower. |
| 18
VAUGHAN NELSON SMALL CAP VALUE FUND
Management Discussion
Managers:
Chris D. Wallis, CFA
Scott J. Weber, CFA
Vaughan Nelson Investment Management, L.P.
Objective:
Seeks capital appreciation
Strategy:
Invests in small-cap companies with a focus on absolute return, using a bottom-up value-oriented investment process
Fund Inception
December 31, 1996
Symbols:
| | |
| Class A | | NEFJX |
| Class B | | NEJBX |
Class C Class Y | | NEJCX
NEJYX |
Effective July 31, 2009, the fund was closed to new investors.
Market Conditions
Markets extended last fall’s rally through the first quarter of 2012, as key domestic economic data edged higher. But these same indicators began to lag in the second quarter, shaking the market’s underpinnings. Fear that Europe’s spreading debt crises might slow the U.S. economy and China’s apparent slowdown unsettled investors. Risk aversion replaced the ebullient mood of previous months, leaving markets in a downtrend that ended in June as Europe’s central banks initiated measures aimed at dealing with the continent’s woes.
Performance Results
For the six months ended June 30, 2012, Class A shares of Vaughan Nelson Small Cap Value Fund returned 6.34% at net asset value. The fund lagged both its benchmark, the Russell 2000® Value Index, which returned 8.23% and the 6.73% average return of the funds in its peer group, the Morningstar Small Blend category.
Explanation of Fund Performance
All sectors contributed to the fund’s positive return, save energy, where shares weakened as oil and gas prices fell, and information technology. The fund’s marked underweight in the strong real estate investment trust sector (REITs) explains much of the fund’s underperformance relative to its benchmark. We took profits among utilities early in the year, as valuations appeared full. The resulting underweight compared to the index hurt modestly in relative terms when utility stocks later rose as investors grew defensive.
Corrections Corporation, which owns and operates prisons on a for-profit basis, was a strong performer. The company is boosting returns by acquiring existing facilities along with developing its own. In addition, Corrections Corp.’s shares rose on speculation that the company may convert to a REIT, potentially enhancing shareholder value. In healthcare, West Pharmaceutical Services enjoyed strong order flow for its range of disposable medical devices, such as syringes and vials. Even though Scott’s Miracle Gro was a laggard during
19 |
the period, we realized healthy gains when we sold this long-time holding. Industrial contributors included Lennox International and A.O. Smith, both producers of heating, air-conditioning and other systems and equipment. Their results improved as the housing sector appeared to bottom out. In May, fund holding Thomas and Betts, a manufacturer of electrical and electronic products and equipment, was acquired at favorable terms. Valmont Industries, makers of fabricated metal products, also rose. KAR Auction Services benefited as increasing new car sales and vigorous leasing activity led to more used vehicles ending up at auctions. The company is also enhancing growth through its growing Internet sales channel.
In technology, RF Micro Devices, whose components are in cell phones and other devices, fell. Diminishing demand from China and reduced purchases from a major customer pressured the shares. Teradyne, maker of test equipment for semiconductors and other electronic products, declined as the economy faltered. We still hold both positions in the expectation of renewed capital spending in technology. Energy stocks were one of the weakest sectors, as slumping global demand drove down prices. The fund was underweight in energy, but failed to reap any benefit from this positioning as its losses exceeded those of the index. Nevertheless, we think the long-term secular growth trend for oil and other commodities, fed largely by China, has ended for now, leading to more cyclical trading patterns for these stocks. We sold offshore driller Unit Corp. and used proceeds to expand holdings of Oasis Petroleum, which has attractive acreage in the Bakken field in North Dakota. Oil States International, an oilfield service provider, also fell.
Outlook
We do not believe that the current pace of economic growth is enough to expand employment or increase tax revenues. Thus, consumers and the public sector will have trouble paying down debt. Currently, central banks hold the key to any future expansion. A recent European summit moved matters forward by separating sovereign debt problems from those facing banks. There is also movement toward structural reforms in Greece, Spain and Italy. Addressing the U.S. federal government’s debt issues will be more difficult politically. We believe monetary authorities will remain accommodative in order to support markets and economies.
We continue to find interesting situations across industries. Rather than become defensive amid the current volatility, we prefer to seek out more cyclical stocks and invest during periods of weakness. For example, the fund’s modest exposure to energy could increase if prices contract further and valuations become more reasonable. Our overall goal is to find companies, preferably domestic, with strong earnings potential that appears sustainable in varied economic conditions.
What You Should Know
Investments in the fund are subject to a number of risks. Please see the “Principal Risks” section of the fund’s prospectus. The purchase of fund shares should be seen as a long-term investment.
| 20
VAUGHAN NELSON SMALL CAP VALUE FUND
Investment Results through June 30, 2012
The charts comparing the fund’s performance to an index provide a general sense of how it performed. The fund’s total return for the period shown below appears with and without sales charges and includes fund expenses and fees. An index measures the performance of a theoretical portfolio. Unlike a fund, the index is unmanaged and does not have expenses that affect the results. It is not possible to invest directly in an index. Investors would incur transaction costs and other expenses if they purchased the securities necessary to match the index.
Growth of $10,000 Investment in Class A Shares4
June 30, 2002 through June 30, 2012
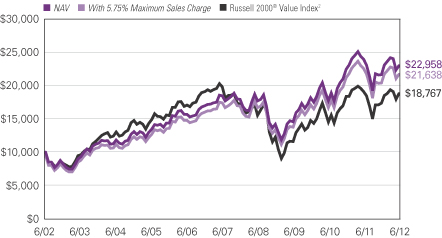
Performance data quoted represents past performance and is no guarantee of future results. Total return and value will vary and you may have a gain or loss when shares are sold. Current performance may be lower or higher than quoted. For most recent month-end performance, visit ngam.natixis.com. Performance for other share classes will be greater or less than shown based on differences in fees and sales charges.
Expense Ratios
| | | | | | |
| Gross Expense Ratio (before fee waivers and/or expense reimbursements)* |
| Class A: 1.62% | | Class B: 2.37% | | Class C: 2.37% | | Class Y: 1.37% |
|
| Net Expense Ratio (after fee waivers and/or expense reimbursements)* |
| Class A: 1.62% | | Class B: 2.37% | | Class C: 2.37% | | Class Y: 1.37% |
| * | As stated in the most recent prospectus. Waivers/reimbursements are contractual and are set to expire on 4/30/13. Contracts are reevaluated on an annual basis. |
21 |
Average Annual Total Returns — June 30, 20124
| | | | | | | | | | | | | | | | | | | | |
| | | | | | |
| | | 6 Months | | | 1 Year | | | 5 Years | | | 10 Years | | | Since Inception | |
| | | | | | |
| Class A (Inception 12/31/96) | | | | | | | | | | | | | | | | | | | | |
| NAV | | | 6.34 | % | | | -3.88 | % | | | 4.47 | % | | | 8.67 | % | | | — | |
| With 5.75% Maximum Sales Charge | | | 0.24 | | | | -9.41 | | | | 3.24 | | | | 8.03 | | | | — | |
| | | | | | |
| Class B (Inception 12/31/96) | | | | | | | | | | | | | | | | | | | | |
| NAV | | | 5.96 | | | | -4.61 | | | | 3.69 | | | | 7.86 | | | | — | |
| With CDSC1 | | | 0.96 | | | | -8.47 | | | | 3.43 | | | | 7.86 | | | | — | |
| | | | | | |
| Class C (Inception 12/31/96) | | | | | | | | | | | | | | | | | | | | |
| NAV | | | 5.89 | | | | -4.62 | | | | 3.68 | | | | 7.85 | | | | — | |
| With CDSC1 | | | 4.89 | | | | -5.39 | | | | 3.68 | | | | 7.85 | | | | — | |
| | | | | | |
| Class Y (Inception 8/31/06) | | | | | | | | | | | | | | | | | | | | |
| NAV | | | 6.48 | | | | -3.63 | | | | 4.76 | | | | — | | | | 7.37 | % |
| | | | | | |
| Comparative Performance | | | | | | | | | | | | | | | | | | | | |
| Russell 2000® Value Index2 | | | 8.23 | | | | -1.44 | | | | -1.05 | | | | 6.50 | | | | 8.26 | |
| Morningstar Small Blend Fund Avg.3 | | | 6.73 | | | | -3.71 | | | | -0.40 | | | | 6.61 | | | | 3.07 | |
Performance data quoted represents past performance and is no guarantee of future results. Total return and value will vary and you may have a gain or loss when shares are sold. Current performance may be lower or higher than quoted. For most recent month-end performance, visit ngam.natixis.com. Performance for periods less than one year is cumulative, not annualized. Returns reflect changes in share price and reinvestment of dividends and capital gains, if any. Class Y shares are not available for purchase by all investors.
The table and graph do not reflect taxes shareholders might owe on any fund distributions or when they redeem their shares.
Note: Portfolio summary tables previously included on this page can be found on the fund’s Fact Sheet at ngam.natixis.com.
NOTES TO CHARTS
| 1 | Performance for Class B shares assumes a maximum 5.00% contingent deferred sales charge (“CDSC”) applied when you sell shares, which declines annually between years 1-6 according to the following schedule: 5, 4, 3, 3, 2, 1, 0%. Class C share performance assumes a 1.00% CDSC applied when you sell shares within one year of purchase. |
| 2 | Russell 2000® Value Index is an unmanaged index that measures the performance of the small-cap value segment of the U.S. equity universe. It includes those Russell 2000® companies with lower price-to-book ratios and lower forecasted growth values. |
| 3 | Morningstar Small Blend Fund Average is the average performance without sales charges of funds with similar investment objectives, as calculated by Morningstar, Inc. |
| 4 | Fund performance has been increased by fee waivers and/or expense reimbursements, if any, without which performance would have been lower. |
| 22
VAUGHAN NELSON VALUE OPPORTUNITY FUND
Management Discussion
Managers:
Dennis G. Alff, CFA
Chris D. Wallis, CFA
Scott J. Weber, CFA
Vaughan Nelson Investment
Management, L.P.
Objective:
Seeks long-term capital appreciation
Strategy:
Invests in medium capitalization companies with a focus on absolute return, using a bottom-up, value-oriented investment process
Fund Inception:
October 31, 2008
Symbols:
| | |
| Class A | | VNVAX |
Class C Class Y | | VNVCX
VNVYX |
Market Conditions
Encouraging economic data helped extend last fall’s equity rally into the first quarter of 2012. Trends in jobs and housing in particular reversed the downward trends that prevailed last year, signaling a possible rebound for the U.S. economy. But external and domestic pressures brought a reversal in the spring. Europe’s economic crises, China’s slowing growth and weakening data at home all made investors more risk-averse in the second quarter of the year. Late in June, Europe’s central bankers moved to disentangle sovereign debt problems from those of banks, an important initial step toward aiding Europe’s stressed economies.
Performance Results
For the six months ended June 30, 2012, Class A shares of Vaughan Nelson Value Opportunity Fund returned 6.45% at net asset value. The fund trailed its benchmark, the Russell MidCap® Value Index, which returned 7.78%, but exceeded the 6.25% return of the funds in its peer group, Morningstar’s Mid-Cap Blend category.
Explanation of Fund Performance
With the exception of energy, all sectors delivered positive returns for the period. However, the fund’s performance lagged the index due largely to disappointing results in financial services. The fund held only a small stake in the real estate investment trust (REIT) sector, a strong-performing area that is weighted heavily in the index. Some insurers and banks also held back returns. Technology and consumer discretionary delivered the best sector returns relative to the index. One of the period’s best individual contributors was HCA, a for-profit operator of acute care hospitals in Florida, Texas and elsewhere. Admissions have been strong, and the company is finding attractive acquisitions and costs have come down thanks to debt refinancing at lower rates.
Fiserv, a provider of transaction and account processing, electronic payments and a range of other functions for financial services companies, rose during the period.
23 |
Fiserv enjoys a strong, contractual revenue stream, a characteristic we look for in making investment choices. BMC Software, which provides large-scale enterprise management software, rose when an activist shareholder proposed selling the company. BMC took defensive measures against the proposal, but the activity drew attention to the firm’s potential value.
Results were positive among consumer discretionary issues. Discovery Communications and CBS, both of which own attractive content, added to returns. Discovery has gained market share by extending its distribution internationally as well as more broadly to additional providers. CBS has been developing appealing content as well. Both companies also benefited from recovering advertising rates. Jarden continued to do well as sales increased for its various consumer brands, which include Coleman, Sunbeam, Rawlings and others. Rovi declined amid ongoing changes. Some of its more mature businesses are shrinking, short-cutting growth prospects. We continue to hold the shares based on the attractive potential of its digital entertainment guides and interactive programming for cable and satellite providers. Global Payments, a payments processor suffered a systems breach, jeopardizing customer data. We think the company will overcome this mishap and continue its expansion into international markets, perhaps acquiring competitors along the way.
Outlook
We do not believe that the current pace of economic growth is enough to expand employment or increase tax revenues. Thus, consumers and the public sector will have trouble paying down debt. Currently, central banks hold the key to any future expansion. Europe is moving forward by separating sovereign debt problems from those facing banks. There is also movement toward structural reform in Greece, Spain and Italy. Addressing the U.S. federal government’s debt issues will be more difficult politically. We believe monetary authorities will remain accommodative in order to support markets and economies. We continue to find interesting situations across industries, including semiconductors and other areas of technology. Rather than become defensive amid the current volatility, we prefer to seek out more cyclical stocks and invest during periods of weakness. For example, the fund’s modest exposure to energy could increase if prices continue to contract and valuations become more reasonable. Overall, our goal is to find companies, preferably domestic, with strong earnings potential that appears sustainable in varied economic conditions.
What You Should Know
Investments in the fund are subject to a number of risks. Please see the “Principal Risks” section of the fund’s prospectus. The purchase of fund shares should be seen as a long-term investment.
| 24
VAUGHAN NELSON VALUE OPPORTUNITY FUND
Investment Results through June 30, 2012
The charts comparing the fund’s performance to an index provide a general sense of how it performed. The fund’s total return for the period shown below appears with and without sales charges and includes fund expenses and fees. An index measures the performance of a theoretical portfolio. Unlike a fund, the index is unmanaged and does not have expenses that affect the results. It is not possible to invest directly in an index. Investors would incur transaction costs and other expenses if they purchased the securities necessary to match the index.
Growth of $10,000 Investment in Class A Shares4
October 31, 2008 (inception) through June 30, 2012
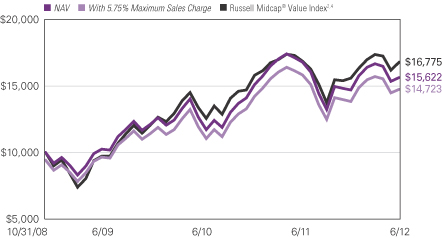
Performance data quoted represents past performance and is no guarantee of future results. Total return and value will vary and you may have a gain or loss when shares are sold. Current performance may be lower or higher than quoted. For most recent month-end performance, visit ngam.natixis.com. Performance for other share classes will be greater or less than shown based on differences in fees and sales charges.
Expense Ratios
| | | | |
| Gross Expense Ratio (before fee waivers and/or expense reimbursements)* |
| Class A: 1.56% | | Class C: 2.31% | | Class Y: 1.31% |
|
| Net Expense Ratio (after fee waivers and/or expense reimbursements)* |
| Class A: 1.56% | | Class C: 2.31% | | Class Y: 1.31% |
| * | As stated in the most recent prospectus. Waivers/reimbursements are contractual and are set to expire on 4/30/13. Contracts are reevaluated on an annual basis. |
25 |
Average Annual Total Returns — June 30, 20124
| | | | | | | | | | | | |
| | | | |
| | | 6 Months | | | 1 Year | | | Since Inception | |
| | | | |
| Class A (Inception 10/31/08) | | | | | | | | | | | | |
| NAV | | | 6.45 | % | | | -6.91 | % | | | 12.95 | % |
| With 5.75% Maximum Sales Charge | | | 0.36 | | | | -12.25 | | | | 11.14 | |
| | | | |
| Class C (Inception 10/31/08) | | | | | | | | | | | | |
| NAV | | | 6.05 | | | | -7.62 | | | | 12.11 | |
| With CDSC1 | | | 5.05 | | | | -8.51 | | | | 12.11 | |
| | | | |
| Class Y (Inception 10/31/08) | | | | | | | | | | | | |
| NAV | | | 6.64 | | | | -6.66 | | | | 13.24 | |
| | | | |
| Comparative Performance | | | | | | | | | | | | |
| Russell Midcap® Value Index2 | | | 7.78 | | | | -0.37 | | | | 15.15 | |
| Morningstar Mid-Cap Blend Fund Avg.3 | | | 6.25 | | | | -5.10 | | | | 13.75 | |
Performance data quoted represents past performance and is no guarantee of future results. Total return and value will vary and you may have a gain or loss when shares are sold. Current performance may be lower or higher than quoted. For most recent month-end performance, visit ngam.natixis.com. Performance for periods less than one year is cumulative, not annualized. Returns reflect changes in share price and reinvestment of dividends and capital gains, if any. Class Y shares are not available for purchase by all investors.
The table and graph do not reflect taxes shareholders might owe on any fund distributions or when they redeem their shares.
Note: Portfolio summary tables previously included on this page can be found on the fund’s Fact Sheet at ngam.natixis.com.
NOTES TO CHARTS
| 1 | Performance for Class C shares assumes a 1.00% contingent deferred sales charge (“CDSC”) applied when you sell shares within one year of purchase. |
| 2 | Russell Midcap® Value Index is an unmanaged index that measures the performance of the mid-cap value segment of the U.S. equity universe. It includes those Russell Midcap® Index companies with lower price-to-book ratios and lower forecasted growth values. |
| 3 | Morningstar Mid-Cap Blend Fund Average is the average performance without sales charges of funds with similar investment objectives, as calculated by Morningstar, Inc. |
| 4 | Fund performance has been increased by fee waivers and/or expense reimbursements, if any, without which performance would have been lower. |
| 26
ADDITIONAL INFORMATION
The views expressed in this report reflect those of the portfolio managers as of the dates indicated. The managers’ views are subject to change at any time without notice based on changes in market or other conditions. References to specific securities or industries should not be regarded as investment advice. Because the funds are actively managed, there is no assurance that they will continue to invest in the securities or industries mentioned.
Before investing, consider the fund’s investment objectives, risks, charges and other expenses. Visit ngam.natixis.com or call 800-225-5478 for a prospectus and/or a summary prospectus, both of which contain this and other information. Read it carefully.
PROXY VOTING INFORMATION
A description of the funds’ proxy voting policies and procedures is available without charge, upon request, by calling Natixis Funds at 800-225-5478; on the funds’ website at ngam.natixis.com; and on the Securities and Exchange Commission’s (SEC) website at www.sec.gov. Information regarding how the funds voted proxies relating to portfolio securities during the 12-month period ended June 30, 2012 is available from the funds’ website and the SEC’s website.
QUARTERLY PORTFOLIO SCHEDULES
The funds file a complete schedule of portfolio holdings with the SEC for the first and third quarters of each fiscal year on Form N-Q. The funds’ Forms N-Q are available on the SEC’s website at www.sec.gov and may be reviewed and copied at the SEC’s Public Reference Room in Washington, DC. Information on the operation of the Public
Reference Room may be obtained by calling 800-SEC-0330.
27 |
UNDERSTANDING FUND EXPENSES
As a mutual fund shareholder, you incur different costs: transaction costs, including sales charges (loads) on purchases and contingent deferred sales charges on redemptions, and ongoing costs, including management fees, distribution and/or service fees (12b-1 fees), and other fund expenses. Certain exemptions may apply. These costs are described in more detail in the funds’ prospectus. The following examples are intended to help you understand the ongoing costs of investing in the funds and help you compare these with the ongoing costs of investing in other mutual funds.
The first line in the table of each class of fund shares shows the actual account values and actual fund expenses you would have paid on a $1,000 investment in the fund from January 1, 2012 through June 30, 2012. To estimate the expenses you paid over the period, simply divide your account value by $1,000 (for example $8,600 account value divided by $1,000 = 8.60) and multiply the result by the number in the Expenses Paid During Period column as shown for your class.
The second line in the table for each class of fund shares provides information about hypothetical account values and hypothetical expenses based on the fund’s actual expense ratios and an assumed rate of return of 5% per year before expenses, which is not the fund’s actual return. The hypothetical account values and expenses may not be used to estimate the actual ending account balance or expenses you paid on your investment for the period. You may use this information to compare the ongoing costs of investing in the fund and other funds. To do so, compare this 5% hypothetical example with the 5% hypothetical examples that appear in the shareholder reports of the other funds.
Please note that the expenses shown reflect ongoing costs only, and do not include any transaction costs, such as sales charges. Therefore, the second line in the table of each fund is useful in comparing ongoing costs only, and will not help you determine the relative costs of owning different funds. If transaction costs were included, total costs would be higher.
| 28
| | | | | | | | | | | | |
| CGM ADVISOR TARGETED EQUITY FUND | | BEGINNING
ACCOUNT VALUE
1/1/2012 | | | ENDING
ACCOUNT VALUE
6/30/2012 | | | EXPENSES PAID
DURING PERIOD*
1/1/2012 – 6/30/2012 | |
Class A | | | | | | | | | | | | |
Actual | | | $1,000.00 | | | | $1,050.20 | | | | $5.96 | |
Hypothetical (5% return before expenses) | | | $1,000.00 | | | | $1,019.05 | | | | $5.87 | |
Class B | | | | | | | | | | | | |
Actual | | | $1,000.00 | | | | $1,046.40 | | | | $9.77 | |
Hypothetical (5% return before expenses) | | | $1,000.00 | | | | $1,015.32 | | | | $9.62 | |
Class C | | | | | | | | | | | | |
Actual | | | $1,000.00 | | | | $1,045.40 | | | | $9.76 | |
Hypothetical (5% return before expenses) | | | $1,000.00 | | | | $1,015.32 | | | | $9.62 | |
Class Y | | | | | | | | | | | | |
Actual | | | $1,000.00 | | | | $1,051.10 | | | | $4.69 | |
Hypothetical (5% return before expenses) | | | $1,000.00 | | | | $1,020.29 | | | | $4.62 | |
| * | Expenses are equal to the Fund's annualized expense ratio: 1.17%, 1.92%, 1.92% and 0.92% for Class A, B, C and Y, respectively, multiplied by the average account value over the period, multiplied by the number of days in the most recent fiscal half-year, divided by 366 (to reflect the half-year period). |
| | | | | | | | | | | | |
HARRIS ASSOCIATES LARGE CAP VALUE
FUND | | BEGINNING
ACCOUNT VALUE
1/1/2012 | | | ENDING
ACCOUNT VALUE
6/30/2012 | | | EXPENSES PAID
DURING PERIOD*
1/1/2012 – 6/30/2012 | |
Class A | | | | | | | | | | | | |
Actual | | | $1,000.00 | | | | $1,080.80 | | | | $6.73 | |
Hypothetical (5% return before expenses) | | | $1,000.00 | | | | $1,018.40 | | | | $6.52 | |
Class B | | | | | | | | | | | | |
Actual | | | $1,000.00 | | | | $1,077.60 | | | | $10.59 | |
Hypothetical (5% return before expenses) | | | $1,000.00 | | | | $1,014.67 | | | | $10.27 | |
Class C | | | | | | | | | | | | |
Actual | | | $1,000.00 | | | | $1,077.00 | | | | $10.59 | |
Hypothetical (5% return before expenses) | | | $1,000.00 | | | | $1,014.67 | | | | $10.27 | |
Class Y | | | | | | | | | | | | |
Actual | | | $1,000.00 | | | | $1,082.40 | | | | $5.44 | |
Hypothetical (5% return before expenses) | | | $1,000.00 | | | | $1,019.64 | | | | $5.27 | |
| * | Expenses are equal to the Fund's annualized expense ratio (after waiver/reimbursement): 1.30%, 2.05%, 2.05% and 1.05% for Class A, B, C and Y, respectively, multiplied by the average account value over the period, multiplied by the number of days in the most recent fiscal half-year, divided by 366 (to reflect the half-year period). |
29 |
| | | | | | | | | | | | |
| NATIXIS DIVERSIFIED INCOME FUND | | BEGINNING
ACCOUNT VALUE
1/1/2012 | | | ENDING
ACCOUNT VALUE
6/30/2012 | | | EXPENSES PAID
DURING PERIOD*
1/1/2012 – 6/30/2012 | |
Class A | | | | | | | | | | | | |
Actual | | | $1,000.00 | | | | $1,081.10 | | | | $5.69 | |
Hypothetical (5% return before expenses) | | | $1,000.00 | | | | $1,019.39 | | | | $5.52 | |
Class C | | | | | | | | | | | | |
Actual | | | $1,000.00 | | | | $1,077.70 | | | | $9.56 | |
Hypothetical (5% return before expenses) | | | $1,000.00 | | | | $1,015.66 | | | | $9.27 | |
| * | Expenses are equal to the Fund's annualized expense ratio: 1.10% and 1.85% for Class A and C, respectively, multiplied by the average account value over the period, multiplied by the number of days in the most recent fiscal half-year, divided by 366 (to reflect the half-year period). |
| | | | | | | | | | | | |
| NATIXIS U.S. MULTI-CAP EQUITY FUND | | BEGINNING
ACCOUNT VALUE
1/1/2012 | | | ENDING
ACCOUNT VALUE
6/30/2012 | | | EXPENSES PAID
DURING PERIOD*
1/1/2012 – 6/30/2012 | |
Class A | | | | | | | | | | | | |
Actual | | | $1,000.00 | | | | $1,088.30 | | | | $6.75 | |
Hypothetical (5% return before expenses) | | | $1,000.00 | | | | $1,018.40 | | | | $6.52 | |
Class B | | | | | | | | | | | | |
Actual | | | $1,000.00 | | | | $1,084.80 | | | | $10.63 | |
Hypothetical (5% return before expenses) | | | $1,000.00 | | | | $1,014.67 | | | | $10.27 | |
Class C | | | | | | | | | | | | |
Actual | | | $1,000.00 | | | | $1,084.70 | | | | $10.63 | |
Hypothetical (5% return before expenses) | | | $1,000.00 | | | | $1,014.67 | | | | $10.27 | |
Class Y | | | | | | | | | | | | |
Actual | | | $1,000.00 | | | | $1,090.10 | | | | $5.46 | |
Hypothetical (5% return before expenses) | | | $1,000.00 | | | | $1,019.64 | | | | $5.27 | |
| * | Expenses are equal to the Fund's annualized expense ratio (after waiver/reimbursement): 1.30%, 2.05%, 2.05% and 1.05% for Class A, B, C and Y, respectively, multiplied by the average account value over the period, multiplied by the number of days in the most recent fiscal half-year, divided by 366 (to reflect the half-year period). |
| 30
| | | | | | | | | | | | |
VAUGHAN NELSON SMALL CAP VALUE
FUND | | BEGINNING
ACCOUNT VALUE
1/1/2012 | | | ENDING
ACCOUNT VALUE
6/30/2012 | | | EXPENSES PAID
DURING PERIOD*
1/1/2012 – 6/30/2012 | |
Class A | | | | | | | | | | | | |
Actual | | | $1,000.00 | | | | $1,063.40 | | | | $7.13 | |
Hypothetical (5% return before expenses) | | | $1,000.00 | | | | $1,017.95 | | | | $6.97 | |
Class B | | | | | | | | | | | | |
Actual | | | $1,000.00 | | | | $1,059.60 | | | | $10.96 | |
Hypothetical (5% return before expenses) | | | $1,000.00 | | | | $1,014.22 | | | | $10.72 | |
Class C | | | | | | | | | | | | |
Actual | | | $1,000.00 | | | | $1,058.90 | | | | $10.95 | |
Hypothetical (5% return before expenses) | | | $1,000.00 | | | | $1,014.22 | | | | $10.72 | |
Class Y | | | | | | | | | | | | |
Actual | | | $1,000.00 | | | | $1,064.80 | | | | $5.85 | |
Hypothetical (5% return before expenses) | | | $1,000.00 | | | | $1,019.19 | | | | $5.72 | |
| * | Expenses are equal to the Fund's annualized expense ratio: 1.39%, 2.14%, 2.14% and 1.14% for Class A, B, C and Y, respectively, multiplied by the average account value over the period, multiplied by the number of days in the most recent fiscal half-year, divided by 366 (to reflect the half-year period). |
| | | | | | | | | | | | |
VAUGHAN NELSON VALUE OPPORTUNITY
FUND | | BEGINNING
ACCOUNT VALUE
1/1/2012 | | | ENDING
ACCOUNT VALUE
6/30/2012 | | | EXPENSES PAID
DURING PERIOD*
1/1/2012 – 6/30/2012 | |
Class A | | | | | | | | | | | | |
Actual | | | $1,000.00 | | | | $1,064.50 | | | | $6.78 | |
Hypothetical (5% return before expenses) | | | $1,000.00 | | | | $1,018.30 | | | | $6.62 | |
Class C | | | | | | | | | | | | |
Actual | | | $1,000.00 | | | | $1,060.50 | | | | $10.60 | |
Hypothetical (5% return before expenses) | | | $1,000.00 | | | | $1,014.57 | | | | $10.37 | |
Class Y | | | | | | | | | | | | |
Actual | | | $1,000.00 | | | | $1,066.40 | | | | $5.50 | |
Hypothetical (5% return before expenses) | | | $1,000.00 | | | | $1,019.54 | | | | $5.37 | |
| * | Expenses are equal to the Fund's annualized expense ratio: 1.32%, 2.07% and 1.07% for Class A, C and Y, respectively, multiplied by the average account value over the period, multiplied by the number of days in the most recent fiscal half-year, divided by 366 (to reflect the half-year period). |
31 |
BOARD APPROVAL OF THE EXISTING ADVISORY AND SUB-ADVISORY AGREEMENTS
The Board of Trustees, including the Independent Trustees, considers matters bearing on each Fund’s advisory and sub-advisory agreements (collectively, the “Agreements”) at most of its meetings throughout the year. Each year, usually in the spring, the Contract Review and Governance Committee of the Board meets to review the Agreements to determine whether to recommend that the full Board approve the continuation of the Agreements, typically for an additional one-year period. After the Committee has made its recommendation, the full Board, including the Independent Trustees, determines whether to approve the continuation of the Agreements.
In connection with these meetings, the Trustees receive materials that the Funds’ investment advisers and sub-advisers (collectively, the “Advisers”) believe to be reasonably necessary for the Trustees to evaluate the Agreements. These materials generally include, among other items, (i) information on the investment performance of the Funds and the performance of peer groups and categories of funds and the Funds’ performance benchmarks, (ii) information on the Funds’ advisory and sub-advisory fees, if any, and other expenses, including information comparing the Funds’ expenses to the fees charged to institutional accounts with similar strategies managed by the Advisers and to those of peer groups of funds and information about any applicable expense caps and fee “breakpoints,” (iii) sales and redemption data in respect of the Funds, (iv) information about the profitability of the Agreements to the Advisers and (v) information obtained through the completion by the Advisers of a questionnaire distributed on behalf of the Trustees. The Board of Trustees, including the Independent Trustees, also consider other matters such as (i) each Adviser’s financial results and/or financial condition, (ii) each Fund’s investment objective and strategies and the size, education and experience of the Advisers’ respective investment staffs and their use of technology, external research and trading cost measurement tools, (iii) arrangements in respect of the distribution of the Funds’ shares and the related costs, (iv) the procedures employed to determine the value of the Funds’ assets, (v) the allocation of the Funds’ brokerage, if any, including, if applicable, allocations to brokers affiliated with the Advisers and the use of “soft” commission dollars to pay Fund expenses and to pay for research and other similar services, (vi) the resources devoted to, and the record of compliance with, the Funds’ investment policies and restrictions, policies on personal securities transactions and other compliance policies, (vii) information about amounts invested by the Funds’ portfolio managers in the Funds or in similar accounts that they manage and (viii) the general economic outlook with particular emphasis on the mutual fund industry. Throughout the process, the Trustees are afforded the opportunity to ask questions of and request additional materials from the Advisers.
In addition to the materials requested by the Trustees in connection with their annual consideration of the continuation of the Agreements, the Trustees receive materials in advance of each regular quarterly meeting of the Board of Trustees that provide detailed information about the Funds’ investment performance and the fees charged to the Funds for advisory and other services. This information generally includes, among other things, an internal performance rating for each Fund (and segment, in the case of Funds managed by multiple subadvisers) based on agreed-upon criteria, graphs showing each
| 32
Fund’s performance and fee differentials against each Fund’s peer group/category, performance ratings provided by a third-party, total return information for various periods, and third-party performance rankings for various periods comparing a Fund against similarly categorized funds. The portfolio management team for each Fund or other representatives of the Advisers make periodic presentations to the Contract Review and Governance Committee and/or the full Board of Trustees, and Funds identified as presenting possible performance concerns may be subject to more frequent board presentations and reviews. In addition, each quarter the Trustees are provided with detailed statistical information about each Fund’s portfolio. The Trustees also receive periodic updates between meetings.
The Board of Trustees most recently approved the continuation of the Agreements at their meeting held in June 2012. The Agreements were continued for a one-year period for the Funds. In considering whether to approve the continuation of the Agreements, the Board of Trustees, including the Independent Trustees, did not identify any single factor as determinative. Individual Trustees may have evaluated the information presented differently from one another, giving different weights to various factors. Matters considered by the Trustees, including the Independent Trustees, in connection with their approval of the Agreements included, but were not limited to, the factors listed below.
The nature, extent and quality of the services provided to the Funds under the Agreements. The Trustees considered the nature, extent and quality of the services provided by the Advisers and their affiliates to the Funds and the resources dedicated to the Funds by the Advisers and their affiliates.
The Trustees considered not only the advisory services provided by the Advisers to the Funds, but also the monitoring and oversight services provided by NGAM Advisors, L.P. (“NGAM Advisors”) with respect to sub-advised Funds. They also considered the administrative services provided by NGAM Advisors and its affiliates to the Funds.
For each Fund, the Trustees also considered the benefits to shareholders of investing in a mutual fund that is part of a family of funds that offers shareholders the right to exchange shares of one type of fund for shares of another type of fund, and provides a variety of fund and shareholder services.
After reviewing these and related factors, the Trustees concluded, within the context of their overall conclusions regarding each of the Agreements, that the nature, extent and quality of services provided supported the renewal of the Agreements.
Investment performance of the Funds and the Advisers. As noted above, the Trustees received information about the performance of the Funds over various time periods, including information which compared the performance of the Funds to the performance of peer groups and categories of funds and the Funds’ respective performance benchmarks. In addition, the Trustees also reviewed data prepared by an independent third party which analyzed the performance of the Funds using a variety of performance metrics, including metrics which also measured the performance of the Funds on a risk adjusted basis.
With respect to each Fund, the Board concluded that the Fund’s performance or other relevant factors supported the renewal of the Agreement(s) relating to that Fund. In the
33 |
case of each Fund that had performance that lagged that of a relevant peer group and/or category for certain (although not necessarily all) periods, the Board concluded that other factors relevant to performance supported renewal of the Agreements. These factors included one or more of the following: (1) that the underperformance was attributable, to a significant extent, to investment decisions (such as security selection or sector allocation) by the Advisers that were reasonable and consistent with the Fund’s investment objective and policies; (2) that the Fund’s performance, although lagging in certain periods, was stronger over the long term; (3) that the Fund’s more recent performance, although lagging in certain periods, was competitive when compared to relevant performance benchmarks or peer groups; (4) that the Fund’s more recent performance, although lagging in certain periods, had recently shown improvement relative to its peer group and (5) that although the Fund’s performance lagged that of its relevant peer group for certain periods, performance was stronger when compared to the Fund’s relevant performance benchmark.
The Trustees also considered each Adviser’s performance and reputation generally, the performance of the fund family generally (as noted by certain financial publications), and the historical responsiveness of the Advisers to Trustee concerns about performance and the willingness of the Advisers to take steps intended to improve performance.
After reviewing these and related factors, the Trustees concluded, within the context of their overall conclusions regarding each of the Agreements, that the performance of the Funds and the Advisers supported the renewal of the Agreements.
The costs of the services to be provided and profits to be realized by the Advisers and their affiliates from their respective relationships with the Funds. The Trustees considered the fees charged to the Funds for advisory and sub-advisory services as well as the total expense levels of the Funds. This information included comparisons (provided both by management and also by an independent third party) of the Funds’ advisory fees and total expense levels to those of their peer groups and information about the advisory fees charged by the Advisers to comparable accounts (such as institutional separate accounts), as well as information about differences in such fees and the reasons for any such differences. In considering the fees charged to comparable accounts, the Trustees considered, among other things, management’s representations about the differences between managing mutual funds as compared to other types of accounts, including the additional resources required to effectively manage and the greater regulatory costs associated with the management of mutual fund assets. In evaluating each Fund’s advisory and sub-advisory fees, the Trustees also took into account the demands, complexity and quality of the investment management of such Fund and the need for the Advisers to offer competitive compensation. The Trustees considered that over the past several years, management had made recommendations regarding reductions in advisory fee rates, implementation of advisory fee breakpoints and the institution of advisory fee waivers and expense caps for various funds in the fund family. They noted that, as of December 31, 2011, five of the six Natixis Equity Funds in this report have expense caps in place, and they considered the amounts waived or reimbursed, if any, by the Advisers under these caps, other than those Funds for which current expenses are below the cap. The Trustees noted that several Funds had total advisory fee rates that were above the median of a peer group of funds. The Trustees considered the factors which management
| 34
believed justified such relatively higher fees. These factors varied from Fund to Fund, but included one or more of the following: (1) that the Fund’s advisory fee rate was only slightly above its peer group median; (2) that although the Fund’s advisory fee rate was above its peer group median, it is subject to an expense cap which resulted in the reduction of the advisory fee and (3) that the Fund’s investment discipline was capacity restrained. The Trustees also noted that although the Natixis U.S. Multi-Cap Equity Fund’s advisory fees were above the median of a peer group of funds, that difference is due at least in part to the fact that the Fund employs a more complex multiple manager structure, whereas its peer group consists of mostly large cap growth strategies. Furthermore, the Trustees noted that the reductions in the Fund’s advisory fee and expense cap, which became effective as of June 1, 2011, were not fully reflected in the data comparing the Fund to a peer group of funds.
The Trustees also considered the compensation directly or indirectly received by the Advisers and their affiliates from their relationships with the Funds. The Trustees reviewed information provided by management as to the profitability of the Advisers’ and their affiliates’ relationships with the Funds, and information about the allocation of expenses used to calculate profitability. They also reviewed information provided by management about the effect of distribution costs and changes in asset levels on Adviser profitability, including information regarding resources spent on distribution activities. When reviewing profitability, the Trustees also considered information about court cases in which adviser compensation or profitability were issues, the performance of the relevant Funds, the expense levels of the Funds, and whether the Advisers had implemented breakpoints and/or expense caps with respect to such Funds.
After reviewing these and related factors, the Trustees concluded, within the context of their overall conclusions regarding each of the Agreements, that the advisory fees charged to each of the Funds were fair and reasonable, and that the costs of these services generally and the related profitability of the Advisers and their affiliates in respect of their relationships with the Funds supported the renewal of the Agreements.
Economies of Scale. The Trustees considered the existence of any economies of scale in the provision of services by the Advisers and whether those economies are shared with the Funds through breakpoints in their investment advisory fees or other means, such as expense waivers or caps. The Trustees also discussed with management the factors considered with respect to the implementation of breakpoints in investment advisory fees or expense waivers or caps for certain funds. Management explained that a number of factors are taken into account in considering the possible implementation of breakpoints or an expense cap for a fund, including, among other things, factors such as a fund’s assets, the projected growth of a fund, projected profitability and a fund’s fees and performance. With respect to economies of scale, the Trustees noted that three Funds had breakpoints in their advisory fees and that five of the Funds were subject to an expense cap. In considering these issues, the Trustees also took note of the costs of the services provided (both on an absolute and a relative basis) and the profitability to the Advisers and their affiliates of their relationships with the Funds, as discussed above.
After reviewing these and related factors, the Trustees concluded, within the context of their overall conclusions regarding each of the Agreements, that the extent to which economies of scale were shared with the Funds supported the renewal of the Agreements.
35 |
The Trustees also considered other factors, which included but were not limited to the following:
| · | | The effect of recent market and economic events on the performance, asset levels and expense ratios of each Fund. |
| · | | Whether each Fund has operated in accordance with its investment objective and the Fund’s record of compliance with its investment restrictions, and the compliance programs of the Funds and the Advisers. They also considered the compliance-related resources the Advisers and their affiliates were providing to the Funds. |
| · | | The nature, quality, cost and extent of administrative and shareholder services performed by the Advisers and their affiliates, both under the Agreements and under separate agreements covering administrative services. |
| · | | So-called “fallout benefits” to the Advisers, such as the engagement of affiliates of the Advisers to provide distribution, administrative and brokerage services to the Funds, and the benefits of research made available to the Advisers by reason of brokerage commissions (if any) generated by the Funds’ securities transactions. The Trustees also considered the fact that NGAM Advisors’ parent company benefits from the retention of affiliated Advisers. The Trustees considered the possible conflicts of interest associated with these fallout and other benefits, and the reporting, disclosure and other processes in place to disclose and monitor such possible conflicts of interest. |
| · | | Plans for maintaining continuity of portfolio management where that was thought to be a potential issue. |
| · | | The Trustees’ review and discussion of the Funds’ advisory arrangements in prior years, and management’s record of responding to Trustee concerns raised during the year and in prior years. |
Based on their evaluation of all factors that they deemed to be material, including those factors described above, and assisted by the advice of independent counsel, the Trustees, including the Independent Trustees, concluded that each of the existing Agreements should be continued through June 30, 2013.
| 36
Portfolio of Investments – as of June 30, 2012 (Unaudited)
CGM Advisor Targeted Equity Fund
| | | | | | | | |
Shares | | | Description | | Value (†) | |
| | | | | | | | |
| | Common Stocks — 96.2% of Net Assets | |
| | | | Aerospace & Defense — 5.3% | | | | |
| | 410,000 | | | Boeing Co. (The) | | $ | 30,463,000 | |
| | | | | | | | |
| | | | Airlines — 12.6% | | | | |
| | 3,240,000 | | | Delta Air Lines, Inc.(b) | | | 35,478,000 | |
| | 1,500,000 | | | United Continental Holdings, Inc.(b) | | | 36,495,000 | |
| | | | | | | | |
| | | | | | | 71,973,000 | |
| | | | | | | | |
| | | | Capital Markets — 5.9% | | | | |
| | 2,330,000 | | | Morgan Stanley | | | 33,994,700 | |
| | | | | | | | |
| | | | Computers & Peripherals — 5.2% | | | | |
| | 51,000 | | | Apple, Inc.(b) | | | 29,784,000 | |
| | | | | | | | |
| | | | Diversified Financial Services — 12.7% | | | | |
| | 1,325,000 | | | Citigroup, Inc. | | | 36,318,250 | |
| | 1,010,000 | | | JPMorgan Chase & Co. | | | 36,087,300 | |
| | | | | | | | |
| | | | | | | 72,405,550 | |
| | | | | | | | |
| | | | Food & Staples Retailing — 2.2% | | | | |
| | 180,000 | | | Wal-Mart Stores, Inc. | | | 12,549,600 | |
| | | | | | | | |
| | | | Insurance — 10.8% | | | | |
| | 900,000 | | | MetLife, Inc. | | | 27,765,000 | |
| | 700,000 | | | Prudential Financial, Inc. | | | 33,901,000 | |
| | | | | | | | |
| | | | | | | 61,666,000 | |
| | | | | | | | |
| | | | IT Services — 8.3% | | | | |
| | 40,000 | | | MasterCard, Inc., Class A | | | 17,204,400 | |
| | 247,000 | | | Visa, Inc., Class A | | | 30,536,610 | |
| | | | | | | | |
| | | | | | | 47,741,010 | |
| | | | | | | | |
| | | | Media — 5.3% | | | | |
| | 1,350,000 | | | News Corp., Class A | | | 30,091,500 | |
| | | | | | | | |
| | | | Multiline Retail — 11.7% | | | | |
| | 1,190,000 | | | Macy’s, Inc. | | | 40,876,500 | |
| | 450,000 | | | Target Corp. | | | 26,185,500 | |
| | | | | | | | |
| | | | | | | 67,062,000 | |
| | | | | | | | |
| | | | Oil, Gas & Consumable Fuels — 4.8% | | | | |
| | 260,000 | | | Chevron Corp. | | | 27,430,000 | |
| | | | | | | | |
| | | | Semiconductors & Semiconductor Equipment — 5.8% | | | | |
| | 640,000 | | | ASML Holding NV | | | 32,908,800 | |
| | | | | | | | |
| | | | Tobacco — 5.6% | | | | |
| | 370,000 | | | Philip Morris International, Inc. | | | 32,286,200 | |
| | | | | | | | |
| | | | Total Common Stocks
(Identified Cost $536,987,555) | | | 550,355,360 | |
| | | | | | | | |
See accompanying notes to financial statements.
37 |
Portfolio of Investments – as of June 30, 2012 (Unaudited)
CGM Advisor Targeted Equity Fund – (continued)
| | | | | | | | |
Principal
Amount | | | Description | | Value (†) | |
| | | | | | | | |
| | Short-Term Investments — 1.2% | |
| $ | 6,000,000 | | | American Express Credit Corp., Commercial Paper, 0.010%, 7/02/2012 | | $ | 6,000,000 | |
| | 498,814 | | | Tri-Party Repurchase Agreement with Fixed Income Clearing Corporation, dated 6/29/2012 at 0.000% to be repurchased at $498,814 on 07/02/2012 collateralized by $455,000 U.S. Treasury Note, 3.250% due 6/30/2016 valued at $509,600 including accrued interest (Note 2 of Notes to Financial Statements) | | | 498,814 | |
| | | | | | | | |
| | | | Total Short-Term Investments
(Identified Cost $6,498,814) | | | 6,498,814 | |
| | | | | | | | |
| | | | | | | | |
| | | | Total Investments — 97.4%
(Identified Cost $543,486,369)(a) | | | 556,854,174 | |
| | | | Other assets less liabilities — 2.6% | | | 15,076,155 | |
| | | | | | | | |
| | | | Net Assets — 100.0% | | $ | 571,930,329 | |
| | | | | | | | |
| | | | | | | | |
| | (†) | | | See Note 2 of Notes to Financial Statements. | | | | |
| | (a) | | | Federal Tax Information (Amounts exclude certain adjustments made at the end of the Fund’s fiscal year for tax purposes. Such adjustments are primarily due to wash sales.): At June 30, 2012, the net unrealized appreciation on investments based on a cost of $543,486,369 for federal income tax purposes was as follows: | |
| | | | Aggregate gross unrealized appreciation for all investments in which there is an excess of value over tax cost | | $ | 41,976,654 | |
| | | | Aggregate gross unrealized depreciation for all investments in which there is an excess of tax cost over value | | | (28,608,849 | ) |
| | | | | | | | |
| | | | Net unrealized appreciation | | $ | 13,367,805 | |
| | | | | | | | |
| | | | | | | | |
| | (b) | | | Non-income producing security. | | | | |
Industry Summary at June 30, 2012 (Unaudited)
| | | | |
Diversified Financial Services | | | 12.7 | % |
Airlines | | | 12.6 | |
Multiline Retail | | | 11.7 | |
Insurance | | | 10.8 | |
IT Services | | | 8.3 | |
Capital Markets | | | 5.9 | |
Semiconductors & Semiconductor Equipment | | | 5.8 | |
Tobacco | | | 5.6 | |
Aerospace & Defense | | | 5.3 | |
Media | | | 5.3 | |
Computers & Peripherals | | | 5.2 | |
Oil, Gas & Consumable Fuels | | | 4.8 | |
Food & Staples Retailing | | | 2.2 | |
Short-Term Investments | | | 1.2 | |
| | | | |
Total Investments | | | 97.4 | |
Other assets less liabilities | | | 2.6 | |
| | | | |
Net Assets | | | 100.0 | % |
| | | | |
See accompanying notes to financial statements.
| 38
Portfolio of Investments – as of June 30, 2012 (Unaudited)
Harris Associates Large Cap Value Fund
| | | | | | | | |
Shares | | | Description | | Value (†) | |
| | | | | | | | |
| | Common Stocks — 96.9% of Net Assets | | | | |
| | | | Aerospace & Defense — 3.4% | | | | |
| | 59,900 | | | Boeing Co. (The) | | $ | 4,450,570 | |
| | | | | | | | |
| | | | Air Freight & Logistics — 3.7% | | | | |
| | 53,200 | | | FedEx Corp. | | | 4,873,652 | |
| | | | | | | | |
| | | | Auto Components — 4.9% | | | | |
| | 45,800 | | | Autoliv, Inc. | | | 2,503,428 | |
| | 95,100 | | | Delphi Automotive PLC(b) | | | 2,425,050 | |
| | 43,600 | | | TRW Automotive Holdings Corp.(b) | | | 1,602,736 | |
| | | | | | | | |
| | | | | | | 6,531,214 | |
| | | | | | | | |
| | | | Automobiles — 2.0% | | | | |
| | 33,600 | | | Toyota Motor Corp., Sponsored ADR | | | 2,704,128 | |
| | | | | | | | |
| | | | Capital Markets — 5.6% | | | | |
| | 36,900 | | | Franklin Resources, Inc. | | | 4,095,531 | |
| | 33,700 | | | Goldman Sachs Group, Inc. (The) | | | 3,230,482 | |
| | | | | | | | |
| | | | | | | 7,326,013 | |
| | | | | | | | |
| | | | Commercial Banks — 5.3% | | | | |
| | 209,500 | | | Wells Fargo & Co. | | | 7,005,680 | |
| | | | | | | | |
| | | | Consumer Finance — 1.7% | | | | |
| | 40,000 | | | Capital One Financial Corp. | | | 2,186,400 | |
| | | | | | | | |
| | | | Diversified Financial Services — 7.0% | | | | |
| | 16,300 | | | CME Group, Inc., Class A | | | 4,370,193 | |
| | 135,500 | | | JPMorgan Chase & Co. | | | 4,841,415 | |
| | | | | | | | |
| | | | | | | 9,211,608 | |
| | | | | | | | |
| | | | Electrical Equipment — 1.5% | | | | |
| | 29,400 | | | Rockwell Automation, Inc. | | | 1,942,164 | |
| | | | | | | | |
| | | | Energy Equipment & Services — 2.0% | | | | |
| | 40,400 | | | National Oilwell Varco, Inc. | | | 2,603,376 | |
| | | | | | | | |
| | | | Health Care Equipment & Supplies — 1.5% | | | | |
| | 50,600 | | | Medtronic, Inc. | | | 1,959,738 | |
| | | | | | | | |
| | | | Hotels, Restaurants & Leisure — 9.4% | | | | |
| | 138,900 | | | Carnival Corp. | | | 4,760,103 | |
| | 115,100 | | | Marriott International, Inc., Class A | | | 4,511,920 | |
| | 19,200 | | | McDonald’s Corp. | | | 1,699,776 | |
| | 27,000 | | | Starwood Hotels & Resorts Worldwide, Inc. | | | 1,432,080 | |
| | | | | | | | |
| | | | | | | 12,403,879 | |
| | | | | | | | |
| | | | Independent Power Producers & Energy Traders — 0.6% | | | | |
| | 46,900 | | | Calpine Corp.(b) | | | 774,319 | |
| | | | | | | | |
| | | | IT Services — 7.0% | | | | |
| | 12,500 | | | MasterCard, Inc., Class A | | | 5,376,375 | |
| | 31,500 | | | Visa, Inc., Class A | | | 3,894,345 | |
| | | | | | | | |
| | | | | | | 9,270,720 | |
| | | | | | | | |
See accompanying notes to financial statements.
39 |
Portfolio of Investments – as of June 30, 2012 (Unaudited)
Harris Associates Large Cap Value Fund – (continued)
| | | | | | | | |
Shares | | | Description | | Value (†) | |
| | | | | | | | |
| | | | Machinery — 7.3% | | | | |
| | 22,700 | | | Caterpillar, Inc. | | $ | 1,927,457 | |
| | 21,700 | | | Cummins, Inc. | | | 2,102,947 | |
| | 75,700 | | | Illinois Tool Works, Inc. | | | 4,003,773 | |
| | 20,100 | | | Parker Hannifin Corp. | | | 1,545,288 | |
| | | | | | | | |
| | | | | | | 9,579,465 | |
| | | | | | | | |
| | | | Media — 7.8% | | | | |
| | 131,800 | | | Comcast Corp., Special Class A | | | 4,138,520 | |
| | 43,400 | | | Omnicom Group, Inc. | | | 2,109,240 | |
| | 70,500 | | | Time Warner, Inc. | | | 2,714,250 | |
| | 28,000 | | | Walt Disney Co. (The) | | | 1,358,000 | |
| | | | | | | | |
| | | | | | | 10,320,010 | |
| | | | | | | | |
| | | | Metals & Mining — 0.1% | | | | |
| | 2,000 | | | Freeport-McMoRan Copper & Gold, Inc. | | | 68,140 | |
| | | | | | | | |
| | | | Oil, Gas & Consumable Fuels — 5.2% | | | | |
| | 41,700 | | | Apache Corp. | | | 3,665,013 | |
| | 37,000 | | | ExxonMobil Corp. | | | 3,166,090 | |
| | | | | | | | |
| | | | | | | 6,831,103 | |
| | | | | | | | |
| | | | Semiconductors & Semiconductor Equipment — 13.9% | | | | |
| | 371,400 | | | Applied Materials, Inc. | | | 4,256,244 | |
| | 331,800 | | | Intel Corp. | | | 8,842,470 | |
| | 42,700 | | | Lam Research Corp.(b) | | | 1,611,498 | |
| | 127,100 | | | Texas Instruments, Inc. | | | 3,646,499 | |
| | | | | | | | |
| | | | | | | 18,356,711 | |
| | | | | | | | |
| | | | Software — 3.3% | | | | |
| | 148,200 | | | Oracle Corp. | | | 4,401,540 | |
| | | | | | | | |
| | | | Specialty Retail — 2.8% | | | | |
| | 53,200 | | | CarMax, Inc.(b) | | | 1,380,008 | |
| | 42,800 | | | Tiffany & Co. | | | 2,266,260 | |
| | | | | | | | |
| | | | | | | 3,646,268 | |
| | | | | | | | |
| | | | Textiles, Apparel & Luxury Goods — 0.9% | | | | |
| | 13,100 | | | NIKE, Inc., Class B | | | 1,149,918 | |
| | | | | | | | |
| | | | Total Common Stocks
(Identified Cost $113,673,030) | | | 127,596,616 | |
| | | | | | | | |
See accompanying notes to financial statements.
| 40
Portfolio of Investments – as of June 30, 2012 (Unaudited)
Harris Associates Large Cap Value Fund – (continued)
| | | | | | | | |
Principal
Amount | | | Description | | Value (†) | |
| | | | | | | | |
| | Short-Term Investments — 3.0% | | | | |
| $ | 3,982,993 | | | Tri-Party Repurchase Agreement with Fixed Income Clearing Corporation, dated 6/29/2012 at 0.000% to be repurchased at $3,982,993 on 7/02/2012 collateralized by $4,060,000 Federal Home Loan Bank, 0.370% due 5/01/2013 valued at $4,065,075 including accrued interest (Note 2 of Notes to Financial Statements)
(Identified Cost $3,982,993) | | $ | 3,982,993 | |
| | | | | | | | |
| | | | | | | | |
| | | | Total Investments — 99.9%
(Identified Cost $117,656,023)(a) | | | 131,579,609 | |
| | | | Other assets less liabilities — 0.1% | | | 175,685 | |
| | | | | | | | |
| | | | Net Assets — 100.0% | | $ | 131,755,294 | |
| | | | | | | | |
| | | | | | | | |
| | (†) | | | See Note 2 of Notes to Financial Statements. | | | | |
| | (a) | | | Federal Tax Information (Amounts exclude certain adjustments made at the end of the Fund’s fiscal year for tax purposes. Such adjustments are primarily due to wash sales.): | |
| | | | At June 30, 2012, the net unrealized appreciation on investments based on a cost of $117,656,023 for federal income tax purposes was as follows: | |
| | | | Aggregate gross unrealized appreciation for all investments in which there is an excess of value over tax cost | | $ | 18,206,014 | |
| | | | Aggregate gross unrealized depreciation for all investments in which there is an excess of tax cost over value | | | (4,282,428 | ) |
| | | | | | | | |
| | | | Net unrealized appreciation | | $ | 13,923,586 | |
| | | | | | | | |
| | | | | | | | |
| | (b) | | | Non-income producing security. | | | | |
| | | | | | | | |
| | ADR | | | An American Depositary Receipt is a certificate issued by a custodian bank representing the right to receive securities of the foreign issuer described. The values of ADRs may be significantly influenced by trading on exchanges not located in the United States. | |
See accompanying notes to financial statements.
41 |
Portfolio of Investments – as of June 30, 2012 (Unaudited)
Harris Associates Large Cap Value Fund – (continued)
Industry Summary at June 30, 2012 (Unaudited)
| | | | |
Semiconductors & Semiconductor Equipment | | | 13.9 | % |
Hotels, Restaurants & Leisure | | | 9.4 | |
Media | | | 7.8 | |
Machinery | | | 7.3 | |
IT Services | | | 7.0 | |
Diversified Financial Services | | | 7.0 | |
Capital Markets | | | 5.6 | |
Commercial Banks | | | 5.3 | |
Oil, Gas & Consumable Fuels | | | 5.2 | |
Auto Components | | | 4.9 | |
Air Freight & Logistics | | | 3.7 | |
Aerospace & Defense | | | 3.4 | |
Software | | | 3.3 | |
Specialty Retail | | | 2.8 | |
Automobiles | | | 2.0 | |
Energy Equipment & Services | | | 2.0 | |
Other Investments, less than 2% each | | | 6.3 | |
Short-Term Investments | | | 3.0 | |
| | | | |
Total Investments | | | 99.9 | |
Other assets less liabilities | | | 0.1 | |
| | | | |
Net Assets | | | 100.0 | % |
| | | | |
See accompanying notes to financial statements.
| 42
Portfolio of Investments – as of June 30, 2012 (Unaudited)
Natixis Diversified Income Fund
| | | | | | | | |
Shares | | | Description | | Value (†) | |
| | | | | | | | |
| | Common Stocks — 45.6% of Net Assets | |
| | | | Aerospace & Defense — 1.3% | | | | |
| | 3,847 | | | General Dynamics Corp. | | $ | 253,748 | |
| | 3,699 | | | Honeywell International, Inc. | | | 206,552 | |
| | 6,928 | | | Lockheed Martin Corp. | | | 603,291 | |
| | 4,757 | | | Northrop Grumman Corp. | | | 303,449 | |
| | | | | | | | |
| | | | | | | 1,367,040 | |
| | | | | | | | |
| | | | Automobiles — 0.1% | | | | |
| | 10,180 | | | Ford Motor Co. | | | 97,626 | |
| | | | | | | | |
| | | | Beverages — 0.3% | | | | |
| | 3,698 | | | Coca-Cola Co. (The) | | | 289,147 | |
| | | | | | | | |
| | | | Building Products — 0.1% | | | | |
| | 4,284 | | | Masco Corp. | | | 59,419 | |
| | | | | | | | |
| | | | Chemicals — 1.0% | | | | |
| | 3,565 | | | Eastman Chemical Co. | | | 179,569 | |
| | 3,033 | | | International Flavors & Fragrances, Inc. | | | 166,208 | |
| | 5,728 | | | Olin Corp. | | | 119,658 | |
| | 3,657 | | | PPG Industries, Inc. | | | 388,081 | |
| | 4,828 | | | RPM International, Inc. | | | 131,322 | |
| | 3,076 | | | Sensient Technologies Corp. | | | 112,981 | |
| | | | | | | | |
| | | | | | | 1,097,819 | |
| | | | | | | | |
| | | | Commercial Banks — 0.9% | | | | |
| | 5,643 | | | Bank of Hawaii Corp. | | | 259,296 | |
| | 3,624 | | | BB&T Corp. | | | 111,800 | |
| | 5,858 | | | F.N.B. Corp. | | | 63,676 | |
| | 4,799 | | | First Niagara Financial Group, Inc. | | | 36,712 | |
| | 5,963 | | | FirstMerit Corp. | | | 98,509 | |
| | 5,509 | | | Trustmark Corp. | | | 134,860 | |
| | 5,804 | | | United Bankshares, Inc. | | | 150,208 | |
| | 8,191 | | | Valley National Bancorp | | | 86,825 | |
| | | | | | | | |
| | | | | | | 941,886 | |
| | | | | | | | |
| | | | Commercial Services & Supplies — 1.0% | | | | |
| | 4,816 | | | Avery Dennison Corp. | | | 131,669 | |
| | 6,109 | | | Deluxe Corp. | | | 152,358 | |
| | 10,381 | | | Pitney Bowes, Inc. | | | 155,404 | |
| | 9,661 | | | R.R. Donnelley & Sons Co. | | | 113,710 | |
| | 4,271 | | | Republic Services, Inc. | | | 113,011 | |
| | 16,400 | | | Retail Properties of America, Inc., Class A | | | 159,408 | |
| | 5,838 | | | Waste Management, Inc. | | | 194,989 | |
| | | | | | | | |
| | | | | | | 1,020,549 | |
| | | | | | | | |
| | | | Containers & Packaging — 0.1% | | | | |
| | 4,793 | | | Sonoco Products Co. | | | 144,509 | |
| | | | | | | | |
| | | | Distributors — 0.2% | | | | |
| | 4,056 | | | Genuine Parts Co. | | | 244,374 | |
| | | | | | | | |
See accompanying notes to financial statements.
43 |
Portfolio of Investments – as of June 30, 2012 (Unaudited)
Natixis Diversified Income Fund – (continued)
| | | | | | | | |
Shares | | | Description | | Value (†) | |
| | | | | | | | |
| | | | Diversified Telecommunication Services — 0.8% | | | | |
| | 7,822 | | | AT&T, Inc. | | $ | 278,933 | |
| | 10,772 | | | CenturyLink, Inc. | | | 425,386 | |
| | 7,493 | | | Telefonica S.A., Sponsored ADR | | | 98,158 | |
| | | | | | | | |
| | | | | | | 802,477 | |
| | | | | | | | |
| | | | Electric Utilities — 2.8% | | | | |
| | 6,281 | | | American Electric Power Co., Inc. | | | 250,612 | |
| | 4,614 | | | Cleco Corp. | | | 193,004 | |
| | 4,363 | | | Edison International | | | 201,571 | |
| | 6,231 | | | Entergy Corp. | | | 423,023 | |
| | 6,406 | | | Exelon Corp. | | | 240,994 | |
| | 6,565 | | | FirstEnergy Corp. | | | 322,932 | |
| | 5,149 | | | NextEra Energy, Inc. | | | 354,303 | |
| | 5,089 | | | Northeast Utilities | | | 197,504 | |
| | 6,118 | | | Pinnacle West Capital Corp. | | | 316,545 | |
| | 6,324 | | | PPL Corp. | | | 175,870 | |
| | 6,125 | | | UNS Energy Corp. | | | 235,261 | |
| | | | | | | | |
| | | | | | | 2,911,619 | |
| | | | | | | | |
| | | | Electrical Equipment — 0.4% | | | | |
| | 4,197 | | | Emerson Electric Co. | | | 195,496 | |
| | 3,163 | | | Hubbell, Inc., Class B | | | 246,524 | |
| | | | | | | | |
| | | | | | | 442,020 | |
| | | | | | | | |
| | | | Food & Staples Retailing — 0.1% | | | | |
| | 4,692 | | | Sysco Corp. | | | 139,869 | |
| | | | | | | | |
| | | | Food Products — 0.6% | | | | |
| | 3,223 | | | DE Master Blenders 1753 NV(b) | | | 36,341 | |
| | 3,958 | | | General Mills, Inc. | | | 152,542 | |
| | 4,824 | | | H.J. Heinz Co. | | | 262,329 | |
| | 645 | | | Hillshire Brands Co. | | | 18,687 | |
| | 4,189 | | | Kraft Foods, Inc., Class A | | | 161,779 | |
| | | | | | | | |
| | | | | | | 631,678 | |
| | | | | | | | |
| | | | Gas Utilities — 0.7% | | | | |
| | 5,960 | | | AGL Resources, Inc. | | | 230,950 | |
| | 4,087 | | | New Jersey Resources Corp. | | | 178,234 | |
| | 7,326 | | | Oneok, Inc. | | | 309,963 | |
| | | | | | | | |
| | | | | | | 719,147 | |
| | | | | | | | |
| | | | Hotels, Restaurants & Leisure — 0.9% | | | | |
| | 5,241 | | | Darden Restaurants, Inc. | | | 265,352 | |
| | 3,828 | | | McDonald’s Corp. | | | 338,893 | |
| | 7,200 | | | Starwood Hotels & Resorts Worldwide, Inc. | | | 381,888 | |
| | | | | | | | |
| | | | | | | 986,133 | |
| | | | | | | | |
| | | | Household Durables — 0.6% | | | | |
| | 5,638 | | | Garmin Ltd. | | | 215,879 | |
| | 10,525 | | | KB Home | | | 103,145 | |
| | 6,499 | | | Leggett & Platt, Inc. | | | 137,324 | |
See accompanying notes to financial statements.
| 44
Portfolio of Investments – as of June 30, 2012 (Unaudited)
Natixis Diversified Income Fund – (continued)
| | | | | | | | |
Shares | | | Description | | Value (†) | |
| | | | | | | | |
| | | | Household Durables — continued | | | | |
| | 2,810 | | | Tupperware Brands Corp. | | $ | 153,875 | |
| | | | | | | | |
| | | | | | | 610,223 | |
| | | | | | | | |
| | | | Household Products — 0.8% | | | | |
| | 4,898 | | | Clorox Co. (The) | | | 354,909 | |
| | 5,315 | | | Kimberly-Clark Corp. | | | 445,238 | |
| | | | | | | | |
| | | | | | | 800,147 | |
| | | | | | | | |
| | | | Industrial Conglomerates — 0.1% | | | | |
| | 4,802 | | | General Electric Co. | | | 100,074 | |
| | | | | | | | |
| | | | Insurance — 0.9% | | | | |
| | 4,125 | | | Allstate Corp. (The) | | | 144,746 | |
| | 5,464 | | | Arthur J. Gallagher & Co. | | | 191,623 | |
| | 7,248 | | | Cincinnati Financial Corp. | | | 275,931 | |
| | 7,187 | | | Mercury General Corp. | | | 299,482 | |
| | | | | | | | |
| | | | | | | 911,782 | |
| | | | | | | | |
| | | | Leisure Equipment & Products — 0.1% | | | | |
| | 4,249 | | | Mattel, Inc. | | | 137,838 | |
| | | | | | | | |
| | | | Machinery — 0.2% | | | | |
| | 3,729 | | | Briggs & Stratton Corp. | | | 65,220 | |
| | 4,041 | | | Eaton Corp. | | | 160,145 | |
| | | | | | | | |
| | | | | | | 225,365 | |
| | | | | | | | |
| | | | Media — 0.2% | | | | |
| | 5,460 | | | Cinemark Holdings, Inc. | | | 124,761 | |
| | 3,116 | | | McGraw-Hill Cos., Inc. (The) | | | 140,220 | |
| | | | | | | | |
| | | | | | | 264,981 | |
| | | | | | | | |
| | | | Metals & Mining — 0.1% | | | | |
| | 4,396 | | | Commercial Metals Co. | | | 55,565 | |
| | | | | | | | |
| | | | Multi Utilities — 3.3% | | | | |
| | 5,361 | | | Alliant Energy Corp. | | | 244,301 | |
| | 5,790 | | | Avista Corp. | | | 154,593 | |
| | 5,976 | | | Black Hills Corp. | | | 192,248 | |
| | 5,339 | | | CenterPoint Energy, Inc. | | | 110,357 | |
| | 5,340 | | | CMS Energy Corp. | | | 125,490 | |
| | 5,157 | | | Dominion Resources, Inc. | | | 278,478 | |
| | 6,052 | | | DTE Energy Co. | | | 359,065 | |
| | 7,157 | | | Integrys Energy Group, Inc. | | | 407,018 | |
| | 5,496 | | | NiSource, Inc. | | | 136,026 | |
| | 3,796 | | | OGE Energy Corp. | | | 196,595 | |
| | 6,304 | | | PG&E Corp. | | | 285,382 | |
| | 5,758 | | | Public Service Enterprise Group, Inc. | | | 187,135 | |
| | 5,995 | | | SCANA Corp. | | | 286,801 | |
| | 4,892 | | | Sempra Energy | | | 336,961 | |
| | 6,218 | | | TECO Energy, Inc. | | | 112,297 | |
| | | | | | | | |
| | | | | | | 3,412,747 | |
| | | | | | | | |
See accompanying notes to financial statements.
45 |
Portfolio of Investments – as of June 30, 2012 (Unaudited)
Natixis Diversified Income Fund – (continued)
| | | | | | | | |
Shares | | | Description | | Value (†) | |
| | | | | | | | |
| | | | Oil, Gas & Consumable Fuels — 0.4% | | | | |
| | 4,200 | | | Chevron Corp. | | $ | 443,100 | |
| | | | | | | | |
| | | | Paper & Forest Products — 0.1% | | | | |
| | 4,584 | | | MeadWestvaco Corp. | | | 131,790 | |
| | | | | | | | |
| | | | Personal Products — 0.1% | | | | |
| | 7,120 | | | Avon Products, Inc. | | | 115,415 | |
| | | | | | | | |
| | | | Pharmaceuticals — 0.8% | | | | |
| | 5,251 | | | Bristol-Myers Squibb Co. | | | 188,773 | |
| | 6,615 | | | Eli Lilly & Co. | | | 283,850 | |
| | 6,272 | | | Merck & Co., Inc. | | | 261,856 | |
| | 5,203 | | | Pfizer, Inc. | | | 119,669 | |
| | | | | | | | |
| | | | | | | 854,148 | |
| | | | | | | | |
| | | | Real Estate Management & Development — 0.5% | | | | |
| | 12,800 | | | Brookfield Office Properties, Inc. | | | 222,976 | |
| | 18,000 | | | Forest City Enterprises, Inc., Class A(b) | | | 262,800 | |
| | | | | | | | |
| | | | | | | 485,776 | |
| | | | | | | | |
| | | | REITs — Apartments — 4.0% | | | | |
| | 6,000 | | | American Campus Communities, Inc. | | | 269,880 | |
| | 8,700 | | | AvalonBay Communities, Inc. | | | 1,230,876 | |
| | 9,200 | | | Camden Property Trust | | | 622,564 | |
| | 30,100 | | | Equity Residential | | | 1,877,036 | |
| | 1,000 | | | Essex Property Trust, Inc. | | | 153,920 | |
| | | | | | | | |
| | | | | | | 4,154,276 | |
| | | | | | | | |
| | | | REITs — Diversified — 2.8% | | | | |
| | 11,500 | | | American Assets Trust, Inc. | | | 278,875 | |
| | 3,900 | | | CoreSite Realty Corp. | | | 100,698 | |
| | 18,000 | | | DuPont Fabros Technology, Inc. | | | 514,080 | |
| | 11,200 | | | Entertainment Properties Trust | | | 460,432 | |
| | 13,500 | | | Liberty Property Trust | | | 497,340 | |
| | 3,200 | | | Select Income REIT(b) | | | 76,032 | |
| | 11,900 | | | Vornado Realty Trust | | | 999,362 | |
| | | | | | | | |
| | | | | | | 2,926,819 | |
| | | | | | | | |
| | | | REITs — Healthcare — 2.9% | | | | |
| | 24,400 | | | HCP, Inc. | | | 1,077,260 | |
| | 3,600 | | | Health Care REIT, Inc. | | | 209,880 | |
| | 20,000 | | | Omega Healthcare Investors, Inc. | | | 450,000 | |
| | 20,000 | | | Ventas, Inc. | | | 1,262,400 | |
| | | | | | | | |
| | | | | | | 2,999,540 | |
| | | | | | | | |
| | | | REITs — Hotels — 1.2% | | | | |
| | 50,700 | | | Host Hotels & Resorts, Inc. | | | 802,074 | |
| | 8,800 | | | Pebblebrook Hotel Trust | | | 205,128 | |
| | 13,900 | | | RLJ Lodging Trust | | | 252,007 | |
| | | | | | | | |
| | | | | | | 1,259,209 | |
| | | | | | | | |
See accompanying notes to financial statements.
| 46
Portfolio of Investments – as of June 30, 2012 (Unaudited)
Natixis Diversified Income Fund – (continued)
| | | | | | | | |
Shares | | | Description | | Value (†) | |
| | | | | | | | |
| | | | REITs — Manufactured Homes — 0.3% | | | | |
| | 5,200 | | | Equity Lifestyle Properties, Inc. | | $ | 358,644 | |
| | | | | | | | |
| | | | REITs — Office Property — 3.0% | | | | |
| | 6,600 | | | Alexandria Real Estate Equities, Inc. | | | 479,952 | |
| | 22,600 | | | BioMed Realty Trust, Inc. | | | 422,168 | |
| | 11,500 | | | Boston Properties, Inc. | | | 1,246,255 | |
| | 16,500 | | | Kilroy Realty Corp. | | | 798,765 | |
| | 9,400 | | | Piedmont Office Realty Trust, Inc., Class A | | | 161,774 | |
| | | | | | | | |
| | | | | | | 3,108,914 | |
| | | | | | | | |
| | | | REITs — Regional Malls — 4.1% | | | | |
| | 17,000 | | | Macerich Co. (The) | | | 1,003,850 | |
| | 21,100 | | | Simon Property Group, Inc. | | | 3,284,426 | |
| | | | | | | | |
| | | | | | | 4,288,276 | |
| | | | | | | | |
| | | | REITs — Shopping Centers — 2.2% | | | | |
| | 37,700 | | | DDR Corp. | | | 551,928 | |
| | 6,300 | | | Federal Realty Investment Trust | | | 655,767 | |
| | 28,197 | | | Kite Realty Group Trust | | | 140,703 | |
| | 13,600 | | | Ramco-Gershenson Properties Trust | | | 170,952 | |
| | 12,600 | | | Regency Centers Corp. | | | 599,382 | |
| | 18,500 | | | Retail Opportunity Investments Corp. | | | 223,110 | |
| | | | | | | | |
| | | | | | | 2,341,842 | |
| | | | | | | | |
| | | | REITs — Single Tenant — 0.2% | | | | |
| | 8,000 | | | National Retail Properties, Inc. | | | 226,320 | |
| | | | | | | | |
| | | | REITs — Storage — 2.0% | | | | |
| | 15,500 | | | CubeSmart | | | 180,885 | |
| | 15,700 | | | Extra Space Storage, Inc. | | | 480,420 | |
| | 9,800 | | | Public Storage | | | 1,415,218 | |
| | | | | | | | |
| | | | | | | 2,076,523 | |
| | | | | | | | |
| | | | REITs — Warehouse/Industrials — 1.3% | | | | |
| | 22,700 | | | First Potomac Realty Trust | | | 267,179 | |
| | 33,900 | | | ProLogis, Inc. | | | 1,126,497 | |
| | | | | | | | |
| | | | | | | 1,393,676 | |
| | | | | | | | |
| | | | Specialty Retail — 0.2% | | | | |
| | 3,271 | | | Home Depot, Inc. (The) | | | 173,330 | |
| | | | | | | | |
| | | | Thrifts & Mortgage Finance — 0.3% | | | | |
| | 8,669 | | | Astoria Financial Corp. | | | 84,956 | |
| | 7,179 | | | Hudson City Bancorp, Inc. | | | 45,730 | |
| | 11,275 | | | New York Community Bancorp, Inc. | | | 141,276 | |
| | 6,742 | | | People’s United Financial, Inc. | | | 78,275 | |
| | | | | | | | |
| | | | | | | 350,237 | |
| | | | | | | | |
| | | | Tobacco — 1.3% | | | | |
| | 7,545 | | | Altria Group, Inc. | | | 260,680 | |
| | 6,318 | | | Lorillard, Inc. | | | 833,660 | |
| | 5,985 | | | Universal Corp. | | | 277,285 | |
| | | | | | | | |
| | | | | | | 1,371,625 | |
| | | | | | | | |
See accompanying notes to financial statements.
47 |
Portfolio of Investments – as of June 30, 2012 (Unaudited)
Natixis Diversified Income Fund – (continued)
| | | | | | | | |
Shares | | | Description | | Value (†) | |
| | | | | | | | |
| | | | Trading Companies & Distributors — 0.3% | | | | |
| | 4,715 | | | Watsco, Inc. | | $ | 347,967 | |
| | | | | | | | |
| | | | Total Common Stocks
(Identified Cost $43,412,753) | | | 47,821,461 | |
| | | | | | | | |
| | | | | | | | |
Principal
Amount (‡) | | | | | | |
| | Bonds and Notes — 44.6% | |
| | Non-Convertible Bonds — 42.3% | |
| | | | ABS Home Equity — 0.4% | | | | |
| $ | 5,421 | | | Bear Stearns Adjustable Rate Mortgage Trust, Series 2004-10, Class 11A1,
2.916%, 1/25/2035(c) | | | 4,497 | |
| | 40,385 | | | Citicorp Mortgage Securities, Inc., Series 2006-5, Class 1A2,
6.000%, 10/25/2036 | | | 40,635 | |
| | 25,000 | | | Countrywide Asset-Backed Certificates, Series 2004-13, Class AF5B,
5.103%, 5/25/2035 | | | 20,238 | |
| | 22,012 | | | Countrywide Home Loan Mortgage Pass Through Trust, Series 2004-HYB4, Class 2A1, 2.738%, 9/20/2034(c) | | | 18,408 | |
| | 45,470 | | | Countrywide Home Loan Mortgage Pass Through Trust, Series 2005-11, Class 4A1, 0.515%, 4/25/2035(c) | | | 27,878 | |
| | 98,995 | | | GMAC Mortgage Corp. Loan Trust, Series 2005-AR4, Class 3A1,
3.318%, 7/19/2035(c) | | | 85,294 | |
| | 14,200 | | | GSR Mortgage Loan Trust, Series 2004-14, Class 3A1, 2.848%, 12/25/2034(c) | | | 10,705 | |
| | 14,060 | | | Indymac Index Mortgage Loan Trust, Series 2005-16IP, Class A1, 0.565%, 7/25/2045(c) | | | 9,246 | |
| | 25,000 | | | JP Morgan Mortgage Acquisition Corp., Series 2005-OPT1, Class M2, 0.715%, 6/25/2035(c) | | | 13,748 | |
| | 69,656 | | | JP Morgan Mortgage Trust, Series 2007-A1, Class 5A1, 2.868%, 7/25/2035(c) | | | 65,553 | |
| | 24,993 | | | Morgan Stanley Mortgage Loan Trust, Series 2005-6AR, Class 1A2, 0.515%, 11/25/2035(c) | | | 21,549 | |
| | 73,306 | | | New York Mortgage Trust, Series 2006-1, Class 2A2, 2.947%, 5/25/2036(c) | | | 59,583 | |
| | 13,075 | | | WaMu Mortgage Pass Through Certificates, Series 2006-AR17, Class 1A1A, 0.957%, 12/25/2046(c) | | | 9,367 | |
| | 28,118 | | | WaMu Mortgage Pass Through Certificates, Series 2007-OA3, Class 2A1A, 0.907%, 4/25/2047(c) | | | 19,823 | |
| | | | | | | | |
| | | | | | | 406,524 | |
| | | | | | | | |
| | | | Aerospace & Defense — 0.2% | | | | |
| | 200,000 | | | Meccanica Holdings USA, Inc., 6.250%, 1/15/2040, 144A | | | 151,143 | |
| | 100,000 | | | Meccanica Holdings USA, Inc., 7.375%, 7/15/2039, 144A | | | 81,076 | |
| | | | | | | | |
| | | | | | | 232,219 | |
| | | | | | | | |
| | | | Airlines — 1.3% | | | | |
| | 40,231 | | | Continental Airlines Pass Through Trust, Series 2000-1, Class A-1, 8.048%, 5/01/2022 | | | 44,254 | |
| | 13,680 | | | Continental Airlines Pass Through Trust, Series 2007-1, Class A, 5.983%, 10/19/2023 | | | 14,843 | |
| | 822,096 | | | UAL Pass Through Trust, Series 2007-1, Class A, 6.636%, 1/02/2024 | | | 859,091 | |
See accompanying notes to financial statements.
| 48
Portfolio of Investments – as of June 30, 2012 (Unaudited)
Natixis Diversified Income Fund – (continued)
| | | | | | | | |
Principal
Amount (‡) | | | Description | | Value (†) | |
| | | | | | | | |
| | | | Airlines — continued | | | | |
| $ | 130,000 | | | US Airways Pass Through Trust, Series 2012-1A, Class A, 5.900%, 4/01/2026 | | $ | 133,087 | |
| | 115,000 | | | US Airways Pass Through Trust, Series 2012-1B, Class B, 8.000%, 4/01/2021 | | | 117,875 | |
| | 205,000 | | | US Airways Pass Through Trust, Series 2012-1C, Class C, 9.125%, 10/01/2015 | | | 205,512 | |
| | | | | | | | |
| | | | | | | 1,374,662 | |
| | | | | | | | |
| | | | Automotive — 0.1% | | | | |
| | 25,000 | | | Goodyear Tire & Rubber Co. (The), 7.000%, 5/15/2022 | | | 24,969 | |
| | 40,000 | | | Goodyear Tire & Rubber Co. (The), 7.000%, 3/15/2028 | | | 37,900 | |
| | | | | | | | |
| | | | | | | 62,869 | |
| | | | | | | | |
| | | | Banking — 3.0% | | | | |
| | 500,000 | | | Bank of Montreal, 1.950%, 1/30/2018 | | | 514,449 | |
| | 500,000 | | | Bank of Nova Scotia, 1.950%, 1/30/2017 | | | 514,649 | |
| | 105,000 | | | Citigroup, Inc., 5.875%, 2/22/2033 | | | 101,558 | |
| | 25,000 | | | Citigroup, Inc., 6.000%, 10/31/2033 | | | 25,036 | |
| | 20,000 | | | Citigroup, Inc., 6.125%, 8/25/2036 | | | 19,672 | |
| | 185,000 | | | Cooperatieve Centrale Raiffeisen-Boerenleenbank BA/Utrect, 3.375%, 1/19/2017 | | | 190,400 | |
| | 300,000 | | | HBOS PLC, GMTN, 6.750%, 5/21/2018, 144A | | | 283,036 | |
| | 400,000 | | | Merrill Lynch & Co., Inc., 6.110%, 1/29/2037 | | | 376,905 | |
| | 100,000 | | | Merrill Lynch & Co., Inc., Series C, MTN, 6.050%, 6/01/2034 | | | 95,256 | |
| | 210,000 | | | Morgan Stanley, 5.500%, 7/24/2020 | | | 205,457 | |
| | 100,000 | | | Morgan Stanley, 5.750%, 1/25/2021 | | | 98,604 | |
| | 175,000 | | | Morgan Stanley, 8.000%, 5/09/2017, (AUD) | | | 186,373 | |
| | 100,000 | | | Morgan Stanley, GMTN, 7.625%, 3/03/2016, (AUD) | | | 106,300 | |
| | 25,000 | | | National Australia Bank Ltd., 6.500%, 11/05/2015, (AUD) | | | 27,110 | |
| | 150,000 | | | Royal Bank of Scotland PLC (The), EMTN, 6.934%, 4/09/2018, (EUR) | | | 175,276 | |
| | 200,000 | | | Societe Generale S.A., MTN, 5.200%, 4/15/2021, 144A | | | 191,133 | |
| | | | | | | | |
| | | | | | | 3,111,214 | |
| | | | | | | | |
| | | | Brokerage — 0.1% | | | | |
| | 5,000 | | | Jefferies Group, Inc., 6.250%, 1/15/2036 | | | 4,500 | |
| | 15,000 | | | Jefferies Group, Inc., 6.450%, 6/08/2027 | | | 14,250 | |
| | 95,000 | | | Jefferies Group, Inc., 6.875%, 4/15/2021 | | | 95,533 | |
| | | | | | | | |
| | | | | | | 114,283 | |
| | | | | | | | |
| | | | Building Materials — 0.7% | | | | |
| | 170,000 | | | Masco Corp., 5.850%, 3/15/2017 | | | 178,201 | |
| | 40,000 | | | Masco Corp., 6.500%, 8/15/2032 | | | 38,450 | |
| | 15,000 | | | Masco Corp., 7.750%, 8/01/2029 | | | 15,716 | |
| | 525,000 | | | USG Corp., 6.300%, 11/15/2016 | | | 502,687 | |
| | 10,000 | | | USG Corp., 9.750%, 1/15/2018 | | | 10,500 | |
| | | | | | | | |
| | | | | | | 745,554 | |
| | | | | | | | |
| | | | Chemicals — 0.2% | | | | |
| | 200,000 | | | Hercules, Inc., 6.500%, 6/30/2029 | | | 164,000 | |
| | 25,000 | | | Methanex Corp., 5.250%, 3/01/2022 | | | 25,938 | |
| | 55,000 | | | Methanex Corp., Senior Note, 6.000%, 8/15/2015 | | | 58,296 | |
| | | | | | | | |
| | | | | | | 248,234 | |
| | | | | | | | |
See accompanying notes to financial statements.
49 |
Portfolio of Investments – as of June 30, 2012 (Unaudited)
Natixis Diversified Income Fund – (continued)
| | | | | | | | |
Principal
Amount (‡) | | | Description | | Value (†) | |
| | | | | | | | |
| | | | Collateralized Mortgage Obligations — 0.1% | | | | |
| $ | 20,373 | | | American Home Mortgage Investment Trust, Series 2004-3, Class 3A, 2.569%, 10/25/2034(c) | | $ | 14,613 | |
| | 15,351 | | | Banc of America Mortgage Securities, Inc., Series 2005-A, Class 2A1, 3.002%, 2/25/2035(c) | | | 13,210 | |
| | 10,981 | | | Bear Stearns Adjustable Rate Mortgage Trust, Series 2004-3, Class 2A, 2.836%, 7/25/2034(c) | | | 9,446 | |
| | 58,506 | | | MASTR Adjustable Rate Mortgages Trust, Series 2007-1, Class I2A1, 0.405%, 1/25/2047(c) | | | 29,657 | |
| | 75,000 | | | Morgan Stanley Mortgage Loan Trust, Series 2005-7, Class 7A5, 5.500%, 11/25/2035 | | | 70,473 | |
| | | | | | | | |
| | | | | | | 137,399 | |
| | | | | | | | |
| | | | Commercial Mortgage-Backed Securities — 1.1% | | | | |
| | 265,000 | | | Credit Suisse Mortgage Capital Certificates, Series 2007-C5, Class A4, 5.695%, 9/15/2040 | | | 284,214 | |
| | 75,000 | | | CW Capital Cobalt Ltd., Series 2006-C1, Class AM, 5.254%, 8/15/2048 | | | 73,740 | |
| | 200,000 | | | DBUBS Mortgage Trust, Series 2011-LC1A, Class E, 5.557%, 11/10/2046, 144A(c) | | | 174,038 | |
| | 185,000 | | | GS Mortgage Securities Corp. II, Series 2007-GG10, Class AM, 5.790%, 8/10/2045(c) | | | 165,587 | |
| | 125,000 | | | Merrill Lynch/Countrywide Commercial Mortgage Trust, Series 2007-9, Class AM, 5.856%, 9/12/2049 | | | 114,627 | |
| | 100,000 | | | Morgan Stanley Re-REMIC Trust, Series 2009-GG10, Class A4B, 5.790%, 8/12/2045, 144A(c) | | | 103,843 | |
| | 130,000 | | | Wachovia Bank Commercial Mortgage Trust, Series 2006-C28, Class AM, 5.603%, 10/15/2048 | | | 130,257 | |
| | 125,000 | | | WF-RBS Commercial Mortgage Trust, Series 2011-C2, Class D, 5.465%, 2/15/2044, 144A(c) | | | 111,715 | |
| | | | | | | | |
| | | | | | | 1,158,021 | |
| | | | | | | | |
| | | | Diversified Manufacturing — 0.2% | | | | |
| | 200,000 | | | Votorantim Cimentos S.A., 7.250%, 4/05/2041, 144A | | | 200,000 | |
| | | | | | | | |
| | | | Electric — 0.6% | | | | |
| | 100,000 | | | EDP Finance BV, 4.900%, 10/01/2019, 144A | | | 79,652 | |
| | 115,000,000 | | | Emgesa S.A. E.S.P., 8.750%, 1/25/2021, 144A, (COP) | | | 71,323 | |
| | 88,000,000 | | | Empresas Publicas de Medellin E.S.P., 8.375%, 2/01/2021, 144A, (COP) | | | 53,413 | |
| | 100,000 | | | Enel Finance International NV, 5.125%, 10/07/2019, 144A | | | 95,526 | |
| | 300,000 | | | Enel Finance International NV, 6.000%, 10/07/2039, 144A | | | 235,517 | |
| | 20,000 | | | NGC Corp. Capital Trust I, Series B, 8.316%, 6/01/2027(d)(e) | | | 3,200 | |
| | 35,000 | | | Texas Competitive Electric Holdings Co. LLC/TCEH Finance, Inc., 11.500%, 10/01/2020, 144A | | | 23,888 | |
| | 135,000 | | | TXU Corp., Series Q, 6.500%, 11/15/2024 | | | 64,462 | |
| | | | | | | | |
| | | | | | | 626,981 | |
| | | | | | | | |
| | | | Financial Other — 0.1% | | | | |
| | 110,000 | | | Aviation Capital Group Corp., 6.750%, 4/06/2021, 144A | | | 110,344 | |
| | | | | | | | |
| | | | Food & Beverage — 0.1% | | | | |
| | 50,000 | | | Viterra, Inc., 6.406%, 2/16/2021, 144A, (CAD) | | | 53,066 | |
| | | | | | | | |
See accompanying notes to financial statements.
| 50
Portfolio of Investments – as of June 30, 2012 (Unaudited)
Natixis Diversified Income Fund – (continued)
| | | | | | | | |
Principal
Amount (‡) | | | Description | | Value (†) | |
| | | | | | | | |
| | | | Gaming — 0.2% | | | | |
| $ | 150,000 | | | MGM Resorts International, 7.500%, 6/01/2016 | | $ | 155,250 | |
| | 40,000 | | | MGM Resorts International, 8.625%, 2/01/2019, 144A | | | 42,800 | |
| | | | | | | | |
| | | | | | | 198,050 | |
| | | | | | | | |
| | | | Government Guaranteed — 1.3% | | | | |
| | 1,245,000 | | | Canada Housing Trust No. 1, 3.600%, 6/15/2013, (CAD) | | | 1,252,191 | |
| | 165,000 | | | Queensland Treasury Corp., 7.125%, 9/18/2017, 144A, (NZD) | | | 150,919 | |
| | | | | | | | |
| | | | | | | 1,403,110 | |
| | | | | | | | |
| | | | Government Owned — No Guarantee — 0.5% | | | | |
| | 320,000 | | | DP World Ltd., 6.850%, 7/02/2037, 144A | | | 314,400 | |
| | 250,000 | | | Kommunalbanken AS, 2.375%, 1/19/2016 | | | 260,750 | |
| | | | | | | | |
| | | | | | | 575,150 | |
| | | | | | | | |
| | | | Government Sponsored — 0.3% | | | | |
| | 265,000 | | | Eksportfinans ASA, 2.000%, 9/15/2015 | | | 237,161 | |
| | 30,000 | | | Eksportfinans ASA, 2.375%, 5/25/2016 | | | 26,666 | |
| | | | | | | | |
| | | | | | | 263,827 | |
| | | | | | | | |
| | | | Healthcare — 1.2% | | | | |
| | 25,000 | | | HCA, Inc., 7.050%, 12/01/2027 | | | 22,500 | |
| | 5,000 | | | HCA, Inc., 7.500%, 12/15/2023 | | | 4,806 | |
| | 460,000 | | | HCA, Inc., 7.500%, 11/06/2033 | | | 431,250 | |
| | 310,000 | | | HCA, Inc., 7.690%, 6/15/2025 | | | 298,375 | |
| | 20,000 | | | HCA, Inc., 8.360%, 4/15/2024 | | | 20,300 | |
| | 135,000 | | | HCA, Inc., MTN, 7.580%, 9/15/2025 | | | 128,925 | |
| | 30,000 | | | HCA, Inc., MTN, 7.750%, 7/15/2036 | | | 28,200 | |
| | 345,000 | | | Owens & Minor, Inc., 6.350%, 4/15/2016(e) | | | 376,667 | |
| | | | | | | | |
| | | | | | | 1,311,023 | |
| | | | | | | | |
| | | | Home Construction — 0.6% | | | | |
| | 10,000 | | | Beazer Homes USA, Inc., 9.125%, 5/15/2019 | | | 8,725 | |
| | 80,000 | | | Desarrolladora Homex SAB de CV, 9.750%, 3/25/2020, 144A | | | 84,000 | |
| | 29,000 | | | KB Home, 6.250%, 6/15/2015 | | | 28,710 | |
| | 105,000 | | | KB Home, 7.250%, 6/15/2018 | | | 104,475 | |
| | 80,000 | | | Pulte Group, Inc., 6.000%, 2/15/2035 | | | 64,000 | |
| | 470,000 | | | Pulte Group, Inc., 6.375%, 5/15/2033 | | | 387,750 | |
| | | | | | | | |
| | | | | | | 677,660 | |
| | | | | | | | |
| | | | Independent Energy — 0.7% | | | | |
| | 30,000 | | | Chesapeake Energy Corp., 6.875%, 11/15/2020 | | | 29,550 | |
| | 105,000 | | | Connacher Oil and Gas Ltd., 8.500%, 8/01/2019, 144A | | | 89,250 | |
| | 200,000 | | | OGX Petroleo e Gas Participacoes S.A., 8.375%, 4/01/2022, 144A | | | 172,500 | |
| | 142,000 | | | Pioneer Natural Resources Co., 7.200%, 1/15/2028 | | | 174,462 | |
| | 75,000 | | | SandRidge Energy, Inc., 8.000%, 6/01/2018, 144A | | | 75,937 | |
| | 45,000 | | | SandRidge Energy, Inc., 8.125%, 10/15/2022, 144A | | | 45,450 | |
| | 105,000 | | | Southwestern Energy Co., 4.100%, 3/15/2022, 144A | | | 106,422 | |
| | | | | | | | |
| | | | | | | 693,571 | |
| | | | | | | | |
See accompanying notes to financial statements.
51 |
Portfolio of Investments – as of June 30, 2012 (Unaudited)
Natixis Diversified Income Fund – (continued)
| | | | | | | | |
Principal
Amount (‡) | | | Description | | Value (†) | |
| | | | | | | | |
| | | | Life Insurance — 0.4% | | | | |
| $ | 85,000 | | | American International Group, Inc., 4.875%, 6/01/2022 | | $ | 86,974 | |
| | 300,000 | | | American International Group, Inc., (fixed rate to 5/15/2038, variable rate thereafter), 8.175%, 5/15/2068 | | | 325,500 | |
| | | | | | | | |
| | | | | | | 412,474 | |
| | | | | | | | |
| | | | Local Authorities — 1.9% | | | | |
| | 140,000 | | | New South Wales Treasury Corp., 6.000%, 2/01/2018, (AUD) | | | 160,002 | |
| | 235,000 | | | Province of Ontario, Canada, 2.950%, 2/05/2015 | | | 247,929 | |
| | 780,000 | | | Province of Ontario, Canada, 4.200%, 3/08/2018, (CAD) | | | 852,829 | |
| | 535,000 | | | Province of Ontario, Canada, 4.750%, 1/19/2016 | | | 603,333 | |
| | 140,000 | | | Province of Quebec, Canada, Series QC, 6.750%, 11/09/2015, (NZD) | | | 122,829 | |
| | | | | | | | |
| | | | | | | 1,986,922 | |
| | | | | | | | |
| | | | Lodging — 0.1% | | | | |
| | 35,000 | | | Royal Caribbean Cruises Ltd., 7.500%, 10/15/2027 | | | 35,350 | |
| | 25,000 | | | Wyndham Worldwide Corp., 5.750%, 2/01/2018 | | | 27,797 | |
| | 1,000 | | | Wyndham Worldwide Corp., 6.000%, 12/01/2016 | | | 1,112 | |
| | 50,000 | | | Wyndham Worldwide Corp., 7.375%, 3/01/2020 | | | 59,432 | |
| | | | | | | | |
| | | | | | | 123,691 | |
| | | | | | | | |
| | | | Media Cable — 0.0% | | | | |
| | 20,000 | | | CCO Holdings LLC/CCO Holdings Capital Corp., 7.375%, 6/01/2020 | | | 21,975 | |
| | | | | | | | |
| | | | Media Non-Cable — 0.1% | | | | |
| | 110,000 | | | R.R. Donnelley & Sons Co., 7.250%, 5/15/2018 | | | 104,775 | |
| | 35,000 | | | R.R. Donnelley & Sons Co., 8.250%, 3/15/2019 | | | 34,300 | |
| | | | | | | | |
| | | | | | | 139,075 | |
| | | | | | | | |
| | | | Metals & Mining — 0.7% | | | | |
| | 15,000 | | | ArcelorMittal, 5.500%, 3/01/2021 | | | 14,198 | |
| | 125,000 | | | ArcelorMittal, 6.125%, 6/01/2018 | | | 126,744 | |
| | 10,000 | | | ArcelorMittal, 6.250%, 2/25/2022 | | | 9,794 | |
| | 225,000 | | | ArcelorMittal, 6.750%, 3/01/2041 | | | 210,013 | |
| | 100,000 | | | ArcelorMittal, 7.000%, 10/15/2039 | | | 97,065 | |
| | 80,000 | | | Arch Coal, Inc., 7.250%, 6/15/2021 | | | 67,000 | |
| | 10,000 | | | United States Steel Corp., 6.650%, 6/01/2037 | | | 7,800 | |
| | 145,000 | | | Xstrata Finance Canada Ltd., 4.950%, 11/15/2021, 144A | | | 149,820 | |
| | | | | | | | |
| | | | | | | 682,434 | |
| | | | | | | | |
| | | | Mortgage Related — 1.7% | | | | |
| | 1,684,731 | | | FNMA, 3.500%, 4/01/2042 | | | 1,776,820 | |
| | | | | | | | |
| | | | Non-Captive Consumer — 1.0% | | | | |
| | 55,000 | | | Residential Capital LLC, 9.625%, 5/15/2015(d) | | | 53,075 | |
| | 180,000 | | | SLM Corp., MTN, 7.250%, 1/25/2022 | | | 190,350 | |
| | 65,000 | | | SLM Corp., Series A, MTN, 5.000%, 6/15/2018 | | | 61,912 | |
| | 217,000 | | | SLM Corp., Series A, MTN, 5.625%, 8/01/2033 | | | 183,365 | |
| | 115,000 | | | SLM Corp., Series A, MTN, 8.450%, 6/15/2018 | | | 128,800 | |
| | 505,000 | | | Springleaf Finance Corp., Series J, MTN, 6.900%, 12/15/2017 | | | 403,051 | |
| | | | | | | | |
| | | | | | | 1,020,553 | |
| | | | | | | | |
See accompanying notes to financial statements.
| 52
Portfolio of Investments – as of June 30, 2012 (Unaudited)
Natixis Diversified Income Fund – (continued)
| | | | | | | | |
Principal
Amount (‡) | | | Description | | Value (†) | |
| | | | | | | | |
| | | | Non-Captive Diversified — 1.3% | | | | |
| $ | 25,000 | | | Aircastle Ltd., 7.625%, 4/15/2020 | | $ | 25,375 | |
| | 480,000 | | | Ally Financial, Inc., 4.625%, 6/26/2015 | | | 482,974 | |
| | 64,000 | | | Ally Financial, Inc., 8.000%, 11/01/2031 | | | 75,040 | |
| | 400,000 | | | General Electric Capital Corp., Series A, (fixed rate to 6/15/2022, variable rate thereafter), 7.125%, 12/15/2049 | | | 422,584 | |
| | 15,000 | | | General Electric Capital Corp., Series A, GMTN, 7.625%, 12/10/2014, (NZD) | | | 12,880 | |
| | 80,000 | | | International Lease Finance Corp., 5.875%, 4/01/2019 | | | 80,077 | |
| | 80,000 | | | International Lease Finance Corp., 6.250%, 5/15/2019 | | | 81,500 | |
| | 35,000 | | | International Lease Finance Corp., 8.250%, 12/15/2020 | | | 40,081 | |
| | 105,000 | | | International Lease Finance Corp., 8.625%, 1/15/2022 | | | 121,598 | |
| | | | | | | | |
| | | | | | | 1,342,109 | |
| | | | | | | | |
| | | | Paper — 0.2% | | | | |
| | 205,000 | | | Weyerhaeuser Co., 6.875%, 12/15/2033 | | | 216,091 | |
| | 5,000 | | | Weyerhaeuser Co., 6.950%, 10/01/2027 | | | 5,412 | |
| | 30,000 | | | Weyerhaeuser Co., 7.375%, 3/15/2032 | | | 33,508 | |
| | | | | | | | |
| | | | | | | 255,011 | |
| | | | | | | | |
| | | | Pharmaceuticals — 0.0% | | | | |
| | 15,000 | | | Valeant Pharmaceuticals International, 6.750%, 8/15/2021, 144A | | | 14,700 | |
| | 10,000 | | | Valeant Pharmaceuticals International, 7.250%, 7/15/2022, 144A | | | 10,025 | |
| | | | | | | | |
| | | | | | | 24,725 | |
| | | | | | | | |
| | | | Pipelines — 0.4% | | | | |
| | 70,000 | | | Energy Transfer Partners LP, 5.200%, 2/01/2022 | | | 74,964 | |
| | 100,000 | | | IFM US Colonial Pipeline 2 LLC, 6.450%, 5/01/2021, 144A | | | 110,083 | |
| | 55,000 | | | NGPL PipeCo LLC, 7.768%, 12/15/2037, 144A | | | 52,525 | |
| | 70,000 | | | NGPL PipeCo LLC, 9.625%, 6/01/2019, 144A | | | 75,075 | |
| | 45,000 | | | Rockies Express Pipeline LLC, 3.900%, 4/15/2015, 144A | | | 43,313 | |
| | 40,000 | | | Rockies Express Pipeline LLC, 6.875%, 4/15/2040, 144A | | | 34,400 | |
| | | | | | | | |
| | | | | | | 390,360 | |
| | | | | | | | |
| | | | Property & Casualty Insurance — 0.5% | | | | |
| | 520,000 | | | White Mountains Re Group Ltd., 6.375%, 3/20/2017, 144A | | | 550,364 | |
| | | | | | | | |
| | | | REITs — Shopping Centers — 0.1% | | | | |
| | 20,000 | | | ProLogis LP, 6.625%, 5/15/2018 | | | 23,069 | |
| | 30,000 | | | ProLogis LP, 6.875%, 3/15/2020 | | | 35,881 | |
| | | | | | | | |
| | | | | | | 58,950 | |
| | | | | | | | |
| | | | Retailers — 1.7% | | | | |
| | 219,239 | | | CVS Pass-Through Trust, 7.507%, 1/10/2032, 144A | | | 272,321 | |
| | 400,000 | | | Dillard’s, Inc., 6.625%, 1/15/2018 | | | 416,500 | |
| | 205,000 | | | Dillard’s, Inc., 7.000%, 12/01/2028 | | | 197,312 | |
| | 45,000 | | | J.C. Penney Corp., Inc., 7.400%, 4/01/2037 | | | 37,688 | |
| | 100,000 | | | Macy’s Retail Holdings, Inc., 6.790%, 7/15/2027 | | | 109,944 | |
| | 225,000 | | | Macy’s Retail Holdings, Inc., 6.900%, 4/01/2029 | | | 266,071 | |
| | 610,000 | | | Toys R Us, Inc., 7.375%, 10/15/2018 | | | 495,625 | |
| | | | | | | | |
| | | | | | | 1,795,461 | |
| | | | | | | | |
See accompanying notes to financial statements.
53 |
Portfolio of Investments – as of June 30, 2012 (Unaudited)
Natixis Diversified Income Fund – (continued)
| | | | | | | | |
Principal
Amount (‡) | | | Description | | Value (†) | |
| | | | | | | | |
| | | | Sovereigns — 0.4% | | | | |
| | 700,000 | | | Republic of Brazil, 8.500%, 1/05/2024, (BRL) | | $ | 379,885 | |
| | | | | | | | |
| | | | Supermarket — 0.2% | | | | |
| | 320,000 | | | New Albertson’s, Inc., Series C, MTN, 6.625%, 6/01/2028 | | | 220,800 | |
| | | | | | | | |
| | | | Supranational — 0.8% | | | | |
| | 560,000 | | | Asian Development Bank, GMTN, 2.500%, 3/15/2016 | | | 596,195 | |
| | 400,000 | | | European Bank for Reconstruction & Development, GMTN,
9.000%, 4/28/2014, (BRL) | | | 209,874 | |
| | | | | | | | |
| | | | | | | 806,069 | |
| | | | | | | | |
| | | | Technology — 0.7% | | | | |
| | 470,000 | | | Alcatel-Lucent USA, Inc., 6.450%, 3/15/2029 | | | 319,600 | |
| | 390,000 | | | Alcatel-Lucent USA, Inc., 6.500%, 1/15/2028 | | | 263,250 | |
| | 30,000 | | | CommScope, Inc., 8.250%, 1/15/2019, 144A | | | 31,725 | |
| | 85,000 | | | First Data Corp., 7.375%, 6/15/2019, 144A | | | 86,700 | |
| | | | | | | | |
| | | | | | | 701,275 | |
| | | | | | | | |
| | | | Treasuries — 14.0% | | | | |
| | 600,000 | | | Canadian Government, 3.000%, 12/01/2015, (CAD)(f) | | | 625,212 | |
| | 255,000 | | | Canadian Government, 3.500%, 6/01/2020, (CAD) | | | 286,671 | |
| | 25,000 | | | Ireland Government Bond, 4.500%, 10/18/2018, (EUR) | | | 28,955 | |
| | 15,000 | | | Ireland Government Bond, 4.500%, 4/18/2020, (EUR) | | | 16,885 | |
| | 165,000 | | | Ireland Government Bond, 5.400%, 3/13/2025, (EUR) | | | 189,991 | |
| | 10,000 | | | Italy Buoni Poliennali Del Tesoro, 5.000%, 8/01/2034, (EUR) | | | 10,827 | |
| | 15,000 | | | Italy Buoni Poliennali Del Tesoro, 5.250%, 11/01/2029, (EUR) | | | 17,294 | |
| | 10,000 | | | Italy Buoni Poliennali Del Tesoro, 5.750%, 2/01/2033, (EUR) | | | 11,905 | |
| | 44,500(††) | | | Mexican Fixed Rate Bonds, Series M-10, 7.750%, 12/14/2017, (MXN) | | | 378,060 | |
| | 5,300(††) | | | Mexican Fixed Rate Bonds, Series M-20, 10.000%, 12/05/2024, (MXN) | | | 55,669 | |
| | 120,000 | | | New Zealand Government Bond, 6.000%, 12/15/2017, (NZD) | | | 110,724 | |
| | 10,000,000 | | | Philippine Government International Bond, 6.250%, 1/14/2036, (PHP) | | | 253,056 | |
| | 195,000 | | | Portugal Obrigacoes do Tesouro OT, 4.950%, 10/25/2023, (EUR) | | | 158,329 | |
| | 4,396,029 | | | U.S. Treasury Inflation Indexed Bond, 0.125%, 4/15/2017(g) | | | 4,640,558 | |
| | 3,389,927 | | | U.S. Treasury Inflation Indexed Bond, 0.125%, 1/15/2022(g) | | | 3,586,703 | |
| | 414,024 | | | U.S. Treasury Inflation Indexed Bond, 0.500%, 4/15/2015(g) | | | 429,873 | |
| | 808,952 | | | U.S. Treasury Inflation Indexed Bond, 2.125%, 2/15/2040(g) | | | 1,148,206 | |
| | 1,628,756 | | | U.S. Treasury Inflation Indexed Bond, 2.500%, 1/15/2029(g) | | | 2,260,280 | |
| | 440,000 | | | U.S. Treasury Note, 0.250%, 3/31/2014 | | | 439,484 | |
| | | | | | | | |
| | | | | | | 14,648,682 | |
| | | | | | | | |
| | | | Wireless — 1.1% | | | | |
| | 4,000,000 | | | America Movil SAB de CV, 8.460%, 12/18/2036, (MXN) | | | 313,556 | |
| | 230,000 | | | American Tower Corp., 4.700%, 3/15/2022 | | | 236,115 | |
| | 420,000 | | | Sprint Capital Corp., 6.875%, 11/15/2028 | | | 338,100 | |
| | 10,000 | | | Sprint Capital Corp., 6.900%, 5/01/2019 | | | 9,400 | |
| | 80,000 | | | Sprint Capital Corp., 8.750%, 3/15/2032 | | | 72,800 | |
| | 125,000 | | | Sprint Nextel Corp., 9.000%, 11/15/2018, 144A | | | 139,687 | |
| | | | | | | | |
| | | | | | | 1,109,658 | |
| | | | | | | | |
See accompanying notes to financial statements.
| 54
Portfolio of Investments – as of June 30, 2012 (Unaudited)
Natixis Diversified Income Fund – (continued)
| | | | | | | | |
Principal
Amount (‡) | | | Description | | Value (†) | |
| | | | | | | | |
| | | | Wirelines — 2.0% | | | | |
| $ | 300,000 | | | Embarq Corp., 7.995%, 6/01/2036 | | $ | 313,378 | |
| | 175,000 | | | Frontier Communications Corp., 7.125%, 3/15/2019 | | | 176,750 | |
| | 70,000 | | | Level 3 Financing, Inc., 8.125%, 7/01/2019 | | | 71,838 | |
| | 85,000 | | | Level 3 Financing, Inc., 8.625%, 7/15/2020 | | | 89,250 | |
| | 135,000 | | | Level 3 Financing, Inc., 8.750%, 2/15/2017 | | | 140,400 | |
| | 400,000 | | | Oi S.A., 9.750%, 9/15/2016, 144A, (BRL) | | | 208,613 | |
| | 15,000 | | | Qwest Capital Funding, Inc., 7.625%, 8/03/2021 | | | 15,509 | |
| | 315,000 | | | Qwest Corp., 7.250%, 10/15/2035 | | | 317,362 | |
| | 234,000 | | | Telecom Italia Capital S.A., 6.000%, 9/30/2034 | | | 179,595 | |
| | 287,000 | | | Telecom Italia Capital S.A., 6.375%, 11/15/2033 | | | 225,295 | |
| | 40,000 | | | Telecom Italia Capital S.A., 7.200%, 7/18/2036 | | | 33,900 | |
| | 45,000 | | | Telecom Italia Capital S.A., 7.721%, 6/04/2038 | | | 39,375 | |
| | 75,000 | | | Telefonica Emisiones SAU, 5.134%, 4/27/2020 | | | 64,604 | |
| | 75,000 | | | Telefonica Emisiones SAU, 5.462%, 2/16/2021 | | | 65,309 | |
| | 75,000 | | | Telefonica Emisiones SAU, 7.045%, 6/20/2036 | | | 65,572 | |
| | 100,000 | | | Telefonica Emisiones SAU, EMTN, 5.597%, 3/12/2020, (GBP) | | | 134,884 | |
| | | | | | | | |
| | | | | | | 2,141,634 | |
| | | | | | | | |
| | | | Total Non-Convertible Bonds
(Identified Cost $43,755,554) | | | 44,292,688 | |
| | | | | | | | |
| | | | | | | | |
| | Convertible Bonds — 2.3% | |
| | | | Automotive — 0.1% | | | | |
| | 20,000 | | | ArvinMeritor, Inc., (Step to Zero Coupon on 2/15/2019), 4.000%, 2/15/2027(h) | | | 14,650 | |
| | 115,000 | | | Ford Motor Co., 4.250%, 11/15/2016 | | | 159,850 | |
| | | | | | | | |
| | | | | | | 174,500 | |
| | | | | | | | |
| | | | Construction Machinery — 0.1% | | | | |
| | 60,000 | | | Ryland Group, Inc. (The), 1.625%, 5/15/2018 | | | 65,700 | |
| | | | | | | | |
| | | | Diversified Manufacturing — 0.2% | | | | |
| | 170,000 | | | Owens-Brockway Glass Container, Inc., 3.000%, 6/01/2015, 144A | | | 162,350 | |
| | 20,000 | | | Trinity Industries, Inc., 3.875%, 6/01/2036 | | | 19,725 | |
| | | | | | | | |
| | | | | | | 182,075 | |
| | | | | | | | |
| | | | Healthcare — 0.1% | | | | |
| | 85,000 | | | Illumina, Inc., 0.250%, 3/15/2016, 144A | | | 75,862 | |
| | | | | | | | |
| | | | Home Construction — 0.3% | | | | |
| | 10,000 | | | Lennar Corp., 2.000%, 12/01/2020, 144A | | | 12,550 | |
| | 5,000 | | | Lennar Corp., 2.750%, 12/15/2020, 144A | | | 7,706 | |
| | 240,000 | | | Lennar Corp., 3.250%, 11/15/2021, 144A | | | 361,500 | |
| | | | | | | | |
| | | | | | | 381,756 | |
| | | | | | | | |
| | | | Independent Energy — 0.0% | | | | |
| | 10,000 | | | Chesapeake Energy Corp., 2.500%, 5/15/2037 | | | 8,563 | |
| | | | | | | | |
| | | | Life Insurance — 0.1% | | | | |
| | 100,000 | | | Old Republic International Corp., 3.750%, 3/15/2018 | | | 90,000 | |
| | | | | | | | |
See accompanying notes to financial statements.
55 |
Portfolio of Investments – as of June 30, 2012 (Unaudited)
Natixis Diversified Income Fund – (continued)
| | | | | | | | |
Principal
Amount (‡) | | | Description | | Value (†) | |
| | | | | | | | |
| | | | Metals & Mining — 0.1% | | | | |
| $ | 95,000 | | | Peabody Energy Corp., 4.750%, 12/15/2066 | | $ | 77,069 | |
| | | | | | | | |
| | | | Pharmaceuticals — 0.2% | | | | |
| | 165,000 | | | Human Genome Sciences, Inc., 3.000%, 11/15/2018 | | | 196,969 | |
| | 25,000 | | | Vertex Pharmaceuticals, Inc., 3.350%, 10/01/2015 | | | 32,656 | |
| | | | | | | | |
| | | | | | | 229,625 | |
| | | | | | | | |
| | | | Technology — 1.1% | | | | |
| | 250,000 | | | Ciena Corp., 0.875%, 6/15/2017 | | | 213,750 | |
| | 65,000 | | | Ciena Corp., 3.750%, 10/15/2018, 144A | | | 72,312 | |
| | 535,000 | | | Intel Corp., 2.950%, 12/15/2035 | | | 605,219 | |
| | 95,000 | | | Lam Research Corp., Series B, 1.250%, 5/15/2018 | | | 93,694 | |
| | 55,000 | | | Micron Technology, Inc., Series B, 1.875%, 8/01/2031, 144A | | | 49,156 | |
| | 95,000 | | | Micron Technology, Inc., Series C, 2.375%, 5/01/2032, 144A | | | 87,519 | |
| | | | | | | | |
| | | | | | | 1,121,650 | |
| | | | | | | | |
| | | | Textile — 0.0% | | | | |
| | 45,000 | | | Iconix Brand Group, Inc., 2.500%, 6/01/2016, 144A | | | 43,369 | |
| | | | | | | | |
| | | | Total Convertible Bonds
(Identified Cost $2,221,522) | | | 2,450,169 | |
| | | | | | | | |
| | | | | | | | |
| | Municipals — 0.0% | | | | |
| | | | Michigan — 0.0% | | | | |
| | 50,000 | | | Michigan Tobacco Settlement Finance Authority Taxable Turbo, Series A, 7.309%, 6/01/2034(e)
(Identified Cost $49,997) | | | 37,048 | |
| | | | | | | | |
| | | | Total Bonds and Notes
(Identified Cost $46,027,073) | | | 46,779,905 | |
| | | | | | | | |
| | | | | | | | |
| Shares | | | | | | |
| | Preferred Stocks — 1.1% | | | | |
| | Convertible Preferred Stocks — 0.8% | | | | |
| | | | Automotive — 0.6% | | | | |
| | 15,950 | | | General Motors Co., Series B, 4.750% | | | 529,540 | |
| | 1,250 | | | Goodyear Tire & Rubber Co. (The), 5.875% | | | 54,000 | |
| | | | | | | | |
| | | | | | | 583,540 | |
| | | | | | | | |
| | | | Banking — 0.1% | | | | |
| | 70 | | | Wells Fargo & Co., Series L, Class A, 7.500% | | | 78,750 | |
| | | | | | | | |
| | | | Construction Machinery — 0.0% | | | | |
| | 145 | | | United Rentals Trust I, 6.500% | | | 7,359 | |
| | | | | | | | |
| | | | Consumer Products — 0.0% | | | | |
| | 725 | | | Newell Financial Trust I, 5.250% | | | 36,431 | |
| | | | | | | | |
| | | | REITs — Shopping Centers — 0.1% | | | | |
| | 1,600 | | | Health Care REIT, Inc., Series I, 6.500% | | | 86,400 | |
| | | | | | | | |
| | | | Total Convertible Preferred Stocks
(Identified Cost $1,019,118) | | | 792,480 | |
| | | | | | | | |
See accompanying notes to financial statements.
| 56
Portfolio of Investments – as of June 30, 2012 (Unaudited)
Natixis Diversified Income Fund – (continued)
| | | | | | | | |
Shares | | | Description | | Value (†) | |
| | | | | | | | |
| | Non-Convertible Preferred Stocks — 0.3% | | | | |
| | | | Banking — 0.1% | | | | |
| | 4,125 | | | Countrywide Capital IV, 6.750% | | $ | 101,310 | |
| | | | | | | | |
| | | | Non-Captive Diversified — 0.2% | | | | |
| | 4,375 | | | Ally Financial, Inc., Series A, (fixed rate to 5/15/2016, variable rate thereafter), 8.500% | | | 100,406 | |
| | 129 | | | Ally Financial, Inc., Series G, 7.000%, 144A | | | 114,927 | |
| | | | | | | | |
| | | | | | | 215,333 | |
| | | | | | | | |
| | | | Total Non-Convertible Preferred Stocks
(Identified Cost $215,037) | | | 316,643 | |
| | | | | | | | |
| | | | Total Preferred Stocks
(Identified Cost $1,234,155) | | | 1,109,123 | |
| | | | | | | | |
| | | | | | | | |
Principal
Amount (‡) | | | | | | |
| | Short-Term Investments — 7.6% | | | | |
| $ | 6,406,057 | | | Tri-Party Repurchase Agreement with Fixed Income Clearing Corporation, dated 6/29/2012 at 0.000% to be repurchased at $6,406,057 on 7/02/2012 collateralized by $4,865,000 Federal Home Loan Mortgage Corp., 4.750% due 11/17/2015 valued at $5,564,344; $845,000 Federal National Mortgage Association, 5.000% due 3/15/2016 valued at $987,602 including accrued interest (Note 2 of Notes to Financial Statements) | | | 6,406,057 | |
| | 1,510,000 | | | U.S. Treasury Bills, 0.081-0.085%, 9/06/2012(i)(j) | | | 1,509,813 | |
| | | | | | | | |
| | | | Total Short-Term Investments
(Identified Cost $7,915,826) | | | 7,915,870 | |
| | | | | | | | |
| | | | | | | | |
| | | | Total Investments — 98.9%
(Identified Cost $98,589,807)(a) | | | 103,626,359 | |
| | | | Other assets less liabilities — 1.1% | | | 1,185,117 | |
| | | | | | | | |
| | | | Net Assets — 100.0% | | $ | 104,811,476 | |
| | | | | | | | |
| | | | | | | | |
| | (‡) | | | Principal Amount stated in U.S. dollars unless otherwise noted. | |
| | (†) | | | See Note 2 of Notes to Financial Statements. | |
| | (††) | | | Amount shown represents units. One unit represents a principal amount of 100. | |
| | (a) | | | Federal Tax Information (Amounts exclude certain adjustments made at the end of the Fund’s fiscal year for tax purposes. Such adjustments are primarily due to wash sales. Amortization of premium on debt securities is excluded for tax purposes.): | |
| | | | At June 30, 2012, the net unrealized appreciation on investments based on a cost of $98,680,212 for federal income tax purposes was as follows: | |
| | | | Aggregate gross unrealized appreciation for all investments in which there is an excess of value over tax cost | | $ | 8,696,994 | |
| | | | Aggregate gross unrealized depreciation for all investments in which there is an excess of tax cost over value | | | (3,750,847 | ) |
| | | | | | | | |
| | | | Net unrealized appreciation | | $ | 4,946,147 | |
| | | | | | | | |
See accompanying notes to financial statements.
57 |
Portfolio of Investments – as of June 30, 2012 (Unaudited)
Natixis Diversified Income Fund – (continued)
| | | | | | |
| | (b) | | | Non-income producing security. |
| | | | | | |
| | (c) | | | Variable rate security. Rate as of June 30, 2012 is disclosed. |
| | (d) | | | The issuer is in default with respect to interest and/or principal payments. Income is not being accrued. |
| | (e) | | | Illiquid security. At June 30, 2012, the value of these securities amounted to $416,915 or 0.4% of net assets. |
| | (f) | | | All or a portion of this security has been designated to cover the Fund’s obligations under open forward foreign currency contracts. |
| | (g) | | | Treasury Inflation Protected Security (TIPS). |
| | (h) | | | Coupon rate is a fixed rate for an initial period then resets at a specified date and rate. |
| | (i) | | | Interest rate represents discount rate at time of purchase; not a coupon rate. |
| | (j) | | | The Fund’s investment in U.S. Treasury Bills is comprised of various lots with differing discount rates. These separate investments, which have the same maturity date, have been aggregated for the purpose of presentation in the Portfolio of Investments. |
| | | | | | |
| | 144A | | | All or a portion of these securities are exempt from registration under Rule 144A of the Securities Act of 1933. These securities may be resold in transactions exempt from registration, normally to qualified institutional buyers. At June 30, 2012, the value of Rule 144A holdings amounted to $5,866,993 or 5.6% of net assets. |
| | ADR | | | An American Depositary Receipt is a certificate issued by a custodian bank representing the right to receive securities of the foreign issuer described. The values of ADRs may be significantly influenced by trading on exchanges not located in the United States. |
| | ABS | | | Asset-Backed Securities | | |
| | EMTN | | | Euro Medium Term Note | | |
| | FNMA | | | Federal National Mortgage Association | | |
| | GMTN | | | Global Medium Term Note | | |
| | MTN | | | Medium Term Note | | |
| | REITs | | | Real Estate Investment Trusts | | |
| | REMIC | | | Real Estate Mortgage Investment Conduit | | |
| | | | | | |
| | AUD | | | Australian Dollar | | |
| | BRL | | | Brazilian Real | | |
| | CAD | | | Canadian Dollar | | |
| | COP | | | Colombian Peso | | |
| | EUR | | | Euro | | |
| | GBP | | | British Pound | | |
| | MXN | | | Mexican Peso | | |
| | NZD | | | New Zealand Dollar | | |
| | PHP | | | Philippine Peso | | |
See accompanying notes to financial statements.
| 58
Portfolio of Investments – as of June 30, 2012 (Unaudited)
Natixis Diversified Income Fund – (continued)
At June 30, 2012, the Fund had the following open forward foreign currency contracts:
| | | | | | | | | | | | | | | | | | |
Contract
to
Buy/Sell | | Delivery
Date | | | Currency | | Units | | | Notional
Value | | | Unrealized
Appreciation
(Depreciation) | |
| Buy1 | | | 9/04/2012 | | | British Pound | | | 23,000 | | | $ | 36,015 | | | $ | 443 | |
| Sell1 | | | 9/04/2012 | | | British Pound | | | 90,000 | | | | 140,930 | | | | (1,214 | ) |
| Buy2 | | | 7/31/2012 | | | Euro | | | 40,000 | | | | 50,631 | | | | 989 | |
| Sell2 | | | 7/31/2012 | | | Euro | | | 470,000 | | | | 594,916 | | | | 21,592 | |
| | | | | | | | | | | | | | | | | | |
| Total | | | | | | | | | | | | | | | | $ | 21,810 | |
| | | | | | | | | | | | | | | | | | |
1 Counterparty is Credit Suisse AG.
2 Counterparty is Barclays Bank PLC.
Industry Summary at June 30, 2012 (Unaudited)
| | | | |
Treasuries | | | 14.0 | % |
REITs - Regional Malls | | | 4.1 | |
REITs - Apartments | | | 4.0 | |
Multi Utilities | | | 3.3 | |
Banking | | | 3.2 | |
REITs - Office Property | | | 3.0 | |
REITs - Healthcare | | | 2.9 | |
REITs - Diversified | | | 2.8 | |
Electric Utilities | | | 2.8 | |
REITs - Shopping Centers | | | 2.4 | |
Wirelines | | | 2.0 | |
REITs - Storage | | | 2.0 | |
Other Investments, less than 2% each | | | 44.8 | |
Short-Term Investments | | | 7.6 | |
| | | | |
Total Investments | | | 98.9 | |
Other assets less liabilities (including open forward foreign currency contracts) | | | 1.1 | |
| | | | |
Net Assets | | | 100.0 | % |
| | | | |
See accompanying notes to financial statements.
59 |
Portfolio of Investments – as of June 30, 2012 (Unaudited)
Natixis U.S. Multi-Cap Equity Fund
| | | | | | | | |
Shares | | | Description | | Value (†) | |
| | | | | | | | |
| | Common Stocks — 96.8% of Net Assets | |
| | | | Aerospace & Defense — 1.6% | | | | |
| | 47,100 | | | Boeing Co. (The) | | $ | 3,499,530 | |
| | 14,644 | | | TransDigm Group, Inc.(b) | | | 1,966,689 | |
| | | | | | | | |
| | | | | | | 5,466,219 | |
| | | | | | | | |
| | | | Air Freight & Logistics — 2.2% | | | | |
| | 42,377 | | | Expeditors International of Washington, Inc. | | | 1,642,109 | |
| | 41,900 | | | FedEx Corp. | | | 3,838,459 | |
| | 27,489 | | | United Parcel Service, Inc., Class B | | | 2,165,033 | |
| | | | | | | | |
| | | | | | | 7,645,601 | |
| | | | | | | | |
| | | | Auto Components — 2.3% | | | | |
| | 36,000 | | | Autoliv, Inc. | | | 1,967,760 | |
| | 74,800 | | | Delphi Automotive PLC(b) | | | 1,907,400 | |
| | 38,012 | | | Lear Corp. | | | 1,434,193 | |
| | 34,300 | | | TRW Automotive Holdings Corp.(b) | | | 1,260,868 | |
| | 21,436 | | | WABCO Holdings, Inc.(b) | | | 1,134,607 | |
| | | | | | | | |
| | | | | | | 7,704,828 | |
| | | | | | | | |
| | | | Automobiles — 0.6% | | | | |
| | 26,400 | | | Toyota Motor Corp., Sponsored ADR | | | 2,124,672 | |
| | | | | | | | |
| | | | Beverages — 2.1% | | | | |
| | 18,067 | | | Beam, Inc. | | | 1,129,007 | |
| | 19,055 | | | Coca-Cola Co. (The) | | | 1,489,911 | |
| | 61,180 | | | Coca-Cola Enterprises, Inc. | | | 1,715,487 | |
| | 2,233 | | | Diageo PLC, Sponsored ADR | | | 230,155 | |
| | 24,132 | | | Monster Beverage Corp.(b) | | | 1,718,198 | |
| | 25,486 | | | SABMiller PLC, Sponsored, ADR | | | 1,032,693 | |
| | | | | | | | |
| | | | | | | 7,315,451 | |
| | | | | | | | |
| | | | Biotechnology — 2.7% | | | | |
| | 26,611 | | | Alexion Pharmaceuticals, Inc.(b) | | | 2,642,472 | |
| | 16,771 | | | Amgen, Inc. | | | 1,224,954 | |
| | 58,635 | | | ARIAD Pharmaceuticals, Inc.(b) | | | 1,009,108 | |
| | 31,648 | | | Incyte Corp. Ltd.(b) | | | 718,410 | |
| | 14,396 | | | Medivation, Inc.(b) | | | 1,315,794 | |
| | 8,277 | | | Onyx Pharmaceuticals, Inc.(b) | | | 550,007 | |
| | 7,023 | | | Regeneron Pharmaceuticals, Inc.(b) | | | 802,167 | |
| | 14,414 | | | Vertex Pharmaceuticals, Inc.(b) | | | 806,031 | |
| | | | | | | | |
| | | | | | | 9,068,943 | |
| | | | | | | | |
| | | | Building Products — 0.4% | | | | |
| | 30,489 | | | Armstrong World Industries, Inc. | | | 1,498,839 | |
| | | | | | | | |
| | | | Capital Markets — 4.5% | | | | |
| | 10,716 | | | Affiliated Managers Group, Inc.(b) | | | 1,172,866 | |
| | 35,820 | | | Franklin Resources, Inc. | | | 3,975,662 | |
| | 26,500 | | | Goldman Sachs Group, Inc. (The) | | | 2,540,290 | |
| | 23,092 | | | Greenhill & Co., Inc. | | | 823,230 | |
| | 33,420 | | | Legg Mason, Inc. | | | 881,285 | |
See accompanying notes to financial statements.
| 60
Portfolio of Investments – as of June 30, 2012 (Unaudited)
Natixis U.S. Multi-Cap Equity Fund – (continued)
| | | | | | | | |
Shares | | | Description | | Value (†) | |
| | | | | | | | |
| | | | Capital Markets — continued | | | | |
| | 46,878 | | | Raymond James Financial, Inc. | | $ | 1,605,103 | |
| | 118,655 | | | SEI Investments Co. | | | 2,360,048 | |
| | 12,901 | | | T. Rowe Price Group, Inc. | | | 812,247 | |
| | 13,528 | | | Virtus Investment Partners, Inc.(b) | | | 1,095,768 | |
| | | | | | | | |
| | | | | | | 15,266,499 | |
| | | | | | | | |
| | | | Chemicals — 1.6% | | | | |
| | 32,322 | | | Cytec Industries, Inc. | | | 1,895,362 | |
| | 21,358 | | | Eastman Chemical Co. | | | 1,075,803 | |
| | 21,508 | | | FMC Corp. | | | 1,150,248 | |
| | 7,420 | | | Quaker Chemical Corp. | | | 342,878 | |
| | 20,025 | | | WR Grace & Co.(b) | | | 1,010,261 | |
| | | | | | | | |
| | | | | | | 5,474,552 | |
| | | | | | | | |
| | | | Commercial Banks — 2.4% | | | | |
| | 199,524 | | | KeyCorp | | | 1,544,316 | |
| | 27,182 | | | Prosperity Bancshares, Inc. | | | 1,142,459 | |
| | 164,700 | | | Wells Fargo & Co. | | | 5,507,568 | |
| | | | | | | | |
| | | | | | | 8,194,343 | |
| | | | | | | | |
| | | | Commercial Services & Supplies — 0.2% | | | | |
| | 23,046 | | | Rollins, Inc. | | | 515,539 | |
| | | | | | | | |
| | | | Communications Equipment — 2.3% | | | | |
| | 165,163 | | | Cisco Systems, Inc. | | | 2,835,849 | |
| | 188,559 | | | Comverse Technology, Inc.(b) | | | 1,097,413 | |
| | 40,517 | | | NETGEAR, Inc.(b) | | | 1,398,242 | |
| | 44,911 | | | QUALCOMM, Inc. | | | 2,500,644 | |
| | | | | | | | |
| | | | | | | 7,832,148 | |
| | | | | | | | |
| | | | Computers & Peripherals — 0.3% | | | | |
| | 65,155 | | | QLogic Corp.(b) | | | 891,972 | |
| | | | | | | | |
| | | | Consumer Finance — 1.9% | | | | |
| | 36,513 | | | American Express Co. | | | 2,125,422 | |
| | 31,500 | | | Capital One Financial Corp. | | | 1,721,790 | |
| | 20,089 | | | Cash America International, Inc. | | | 884,720 | |
| | 54,868 | | | Discover Financial Services | | | 1,897,335 | |
| | | | | | | | |
| | | | | | | 6,629,267 | |
| | | | | | | | |
| | | | Diversified Consumer Services — 0.2% | | | | |
| | 12,108 | | | Ascent Media Corp., Class A(b) | | | 626,589 | |
| | | | | | | | |
| | | | Diversified Financial Services — 2.7% | | | | |
| | 12,800 | | | CME Group, Inc., Class A | | | 3,431,808 | |
| | 106,500 | | | JPMorgan Chase & Co. | | | 3,805,245 | |
| | 87,215 | | | NASDAQ OMX Group, Inc. (The) | | | 1,977,164 | |
| | | | | | | | |
| | | | | | | 9,214,217 | |
| | | | | | | | |
| | | | Electric Utilities — 0.2% | | | | |
| | 7,975 | | | ITC Holdings Corp. | | | 549,557 | |
| | | | | | | | |
See accompanying notes to financial statements.
61 |
Portfolio of Investments – as of June 30, 2012 (Unaudited)
Natixis U.S. Multi-Cap Equity Fund – (continued)
| | | | | | | | |
Shares | | | Description | | Value (†) | |
| | | | | | | | |
| | | | Electrical Equipment — 0.9% | | | | |
| | 58,840 | | | Babcock & Wilcox Co.(b) | | $ | 1,441,580 | |
| | 23,100 | | | Rockwell Automation, Inc. | | | 1,525,986 | |
| | | | | | | | |
| | | | | | | 2,967,566 | |
| | | | | | | | |
| | | | Electronic Equipment, Instruments & Components — 0.9% | | | | |
| | 32,663 | | | Amphenol Corp., Class A | | | 1,793,852 | |
| | 43,508 | | | Avnet, Inc.(b) | | | 1,342,657 | |
| | | | | | | | |
| | | | | | | 3,136,509 | |
| | | | | | | | |
| | | | Energy Equipment & Services — 2.4% | | | | |
| | 11,058 | | | Dril-Quip, Inc.(b) | | | 725,294 | |
| | 34,941 | | | Helix Energy Solutions Group, Inc.(b) | | | 573,382 | |
| | 31,800 | | | National Oilwell Varco, Inc. | | | 2,049,192 | |
| | 60,157 | | | Oceaneering International, Inc. | | | 2,879,114 | |
| | 28,420 | | | Schlumberger Ltd. | | | 1,844,742 | |
| | | | | | | | |
| | | | | | | 8,071,724 | |
| | | | | | | | |
| | | | Food & Staples Retailing — 0.6% | | | | |
| | 22,151 | | | Whole Foods Market, Inc. | | | 2,111,433 | |
| | | | | | | | |
| | | | Food Products — 2.2% | | | | |
| | 174,869 | | | Danone S.A., Sponsored ADR | | | 2,164,878 | |
| | 29,091 | | | Ingredion, Inc. | | | 1,440,587 | |
| | 20,362 | | | J.M. Smucker Co. (The) | | | 1,537,738 | |
| | 26,957 | | | McCormick & Co., Inc. | | | 1,634,942 | |
| | 8,531 | | | Mead Johnson Nutrition Co. | | | 686,831 | |
| | | | | | | | |
| | | | | | | 7,464,976 | |
| | | | | | | | |
| | | | Gas Utilities — 0.3% | | | | |
| | 53,490 | | | Questar Corp. | | | 1,115,801 | |
| | | | | | | | |
| | | | Health Care Equipment & Supplies — 2.7% | | | | |
| | 55,700 | | | CareFusion Corp.(b) | | | 1,430,376 | |
| | 27,535 | | | DENTSPLY International, Inc. | | | 1,041,098 | |
| | 7,264 | | | Edwards Lifesciences Corp.(b) | | | 750,371 | |
| | 2,692 | | | Intuitive Surgical, Inc.(b) | | | 1,490,803 | |
| | 60,113 | | | Medtronic, Inc. | | | 2,328,177 | |
| | 35,739 | | | Zimmer Holdings, Inc. | | | 2,300,162 | |
| | | | | | | | |
| | | | | | | 9,340,987 | |
| | | | | | | | |
| | | | Health Care Providers & Services — 1.7% | | | | |
| | 6,894 | | | Catalyst Health Solutions, Inc.(b) | | | 644,176 | |
| | 23,078 | | | HealthSouth Corp.(b) | | | 536,794 | |
| | 21,704 | | | MEDNAX, Inc.(b) | | | 1,487,592 | |
| | 30,545 | | | Universal Health Services, Inc., Class B | | | 1,318,322 | |
| | 35,687 | | | WellCare Health Plans, Inc.(b) | | | 1,891,411 | |
| | | | | | | | |
| | | | | | | 5,878,295 | |
| | | | | | | | |
| | | | Health Care Technology — 1.3% | | | | |
| | 15,481 | | | athenahealth, Inc.(b) | | | 1,225,631 | |
| | 14,889 | | | Cerner Corp.(b) | | | 1,230,725 | |
See accompanying notes to financial statements.
| 62
Portfolio of Investments – as of June 30, 2012 (Unaudited)
Natixis U.S. Multi-Cap Equity Fund – (continued)
| | | | | | | | |
Shares | | | Description | | Value (†) | |
| | | | | | | | |
| | | | Health Care Technology — continued | | | | |
| | 18,602 | | | SXC Health Solutions Corp.(b) | | $ | 1,845,504 | |
| | | | | | | | |
| | | | | | | 4,301,860 | |
| | | | | | | | |
| | | | Hotels, Restaurants & Leisure — 5.0% | | | | |
| | 109,100 | | | Carnival Corp. | | | 3,738,857 | |
| | 2,766 | | | Chipotle Mexican Grill, Inc.(b) | | | 1,050,942 | |
| | 32,691 | | | Dunkin’ Brands Group, Inc. | | | 1,122,609 | |
| | 36,511 | | | Interval Leisure Group, Inc. | | | 694,074 | |
| | 90,500 | | | Marriott International, Inc., Class A | | | 3,547,600 | |
| | 15,000 | | | McDonald’s Corp. | | | 1,327,950 | |
| | 7,495 | | | Panera Bread Co., Class A(b) | | | 1,045,103 | |
| | 23,094 | | | Six Flags Entertainment Corp. | | | 1,251,233 | |
| | 21,200 | | | Starwood Hotels & Resorts Worldwide, Inc. | | | 1,124,448 | |
| | 43,453 | | | Wyndham Worldwide Corp. | | | 2,291,711 | |
| | | | | | | | |
| | | | | | | 17,194,527 | |
| | | | | | | | |
| | | | Household Durables — 0.5% | | | | |
| | 36,326 | | | Jarden Corp. | | | 1,526,419 | |
| | | | | | | | |
| | | | Household Products — 0.6% | | | | |
| | 11,133 | | | Clorox Co. (The) | | | 806,697 | |
| | 21,262 | | | Procter & Gamble Co. (The) | | | 1,302,298 | |
| | | | | | | | |
| | | | | | | 2,108,995 | |
| | | | | | | | |
| | | | Independent Power Producers & Energy Traders — 0.2% | | | | |
| | 36,700 | | | Calpine Corp.(b) | | | 605,917 | |
| | | | | | | | |
| | | | Internet & Catalog Retail — 1.7% | | | | |
| | 15,112 | | | Amazon.com, Inc.(b) | | | 3,450,825 | |
| | 17,209 | | | Blue Nile, Inc.(b) | | | 511,280 | |
| | 101,295 | | | Liberty Interactive Corp., Class A(b) | | | 1,802,038 | |
| | | | | | | | |
| | | | | | | 5,764,143 | |
| | | | | | | | |
| | | | Internet Software & Services — 2.5% | | | | |
| | 8,688 | | | Equinix, Inc.(b) | | | 1,526,047 | |
| | 28,571 | | | Facebook, Inc., Class A(b) | | | 889,130 | |
| | 5,691 | | | Google, Inc., Class A(b) | | | 3,301,178 | |
| | 21,023 | | | IAC/InterActiveCorp | | | 958,649 | |
| | 17,413 | | | LinkedIn Corp., Class A(b) | | | 1,850,479 | |
| | | | | | | | |
| | | | | | | 8,525,483 | |
| | | | | | | | |
| | | | IT Services — 5.5% | | | | |
| | 14,432 | | | Alliance Data Systems Corp.(b) | | | 1,948,320 | |
| | 15,125 | | | Automatic Data Processing, Inc. | | | 841,858 | |
| | 38,979 | | | Fidelity National Information Services, Inc. | | | 1,328,404 | |
| | 9,800 | | | MasterCard, Inc., Class A | | | 4,215,078 | |
| | 37,541 | | | Teradata Corp.(b) | | | 2,703,327 | |
| | 46,693 | | | Visa, Inc., Class A | | | 5,772,656 | |
| | 33,077 | | | Wright Express Corp.(b) | | | 2,041,512 | |
| | | | | | | | |
| | | | | | | 18,851,155 | |
| | | | | | | | |
See accompanying notes to financial statements.
63 |
Portfolio of Investments – as of June 30, 2012 (Unaudited)
Natixis U.S. Multi-Cap Equity Fund – (continued)
| | | | | | | | |
Shares | | | Description | | Value (†) | |
| | | | | | | | |
| | | | Life Sciences Tools & Services — 0.8% | | | | |
| | 17,925 | | | Mettler-Toledo International, Inc.(b) | | $ | 2,793,611 | |
| | | | | | | | |
| | | | Machinery — 4.7% | | | | |
| | 36,213 | | | Actuant Corp., Class A | | | 983,545 | |
| | 17,700 | | | Caterpillar, Inc. | | | 1,502,907 | |
| | 22,922 | | | CLARCOR, Inc. | | | 1,103,923 | |
| | 17,000 | | | Cummins, Inc. | | | 1,647,470 | |
| | 59,500 | | | Illinois Tool Works, Inc. | | | 3,146,955 | |
| | 66,857 | | | ITT Corp. | | | 1,176,683 | |
| | 21,894 | | | John Bean Technologies Corp. | | | 297,102 | |
| | 24,531 | | | Kadant, Inc.(b) | | | 575,252 | |
| | 8,512 | | | Middleby Corp. (The) (b) | | | 847,880 | |
| | 15,800 | | | Parker Hannifin Corp. | | | 1,214,704 | |
| | 23,907 | | | Timken Co. (The) | | | 1,094,702 | |
| | 66,193 | | | TriMas Corp.(b) | | | 1,330,479 | |
| | 41,692 | | | Xylem, Inc. | | | 1,049,388 | |
| | | | | | | | |
| | | | | | | 15,970,990 | |
| | | | | | | | |
| | | | Marine — 0.3% | | | | |
| | 24,473 | | | Kirby Corp.(b) | | | 1,152,189 | |
| | | | | | | | |
| | | | Media — 3.1% | | | | |
| | 103,500 | | | Comcast Corp., Special Class A | | | 3,249,900 | |
| | 19,173 | | | Liberty Media Corp. - Liberty Capital, Class A(b) | | | 1,685,499 | |
| | 82,018 | | | Live Nation Entertainment, Inc.(b) | | | 752,925 | |
| | 34,000 | | | Omnicom Group, Inc. | | | 1,652,400 | |
| | 55,400 | | | Time Warner, Inc. | | | 2,132,900 | |
| | 22,000 | | | Walt Disney Co. (The) | | | 1,067,000 | |
| | | | | | | | |
| | | | | | | 10,540,624 | |
| | | | | | | | |
| | | | Metals & Mining — 0.5% | | | | |
| | 1,500 | | | Freeport-McMoRan Copper & Gold, Inc. | | | 51,105 | |
| | 32,266 | | | Reliance Steel & Aluminum Co. | | | 1,629,433 | |
| | | | | | | | |
| | | | | | | 1,680,538 | |
| | | | | | | | |
| | | | Multi Utilities — 0.3% | | | | |
| | 48,658 | | | CMS Energy Corp. | | | 1,143,463 | |
| | | | | | | | |
| | | | Multiline Retail — 0.6% | | | | |
| | 39,696 | | | Dollar Tree, Inc.(b) | | | 2,135,645 | |
| | | | | | | | |
| | | | Oil, Gas & Consumable Fuels — 3.2% | | | | |
| | 32,800 | | | Apache Corp. | | | 2,882,792 | |
| | 24,376 | | | Approach Resources, Inc.(b) | | | 622,563 | |
| | 21,441 | | | Cabot Oil & Gas Corp. | | | 844,775 | |
| | 11,649 | | | Clayton Williams Energy, Inc.(b) | | | 563,579 | |
| | 70,601 | | | Cloud Peak Energy, Inc.(b) | | | 1,193,863 | |
| | 12,997 | | | Concho Resources, Inc.(b) | | | 1,106,305 | |
| | 29,100 | | | ExxonMobil Corp. | | | 2,490,087 | |
| | 44,201 | | | QEP Resources, Inc. | | | 1,324,704 | |
| | | | | | | | |
| | | | | | | 11,028,668 | |
| | | | | | | | |
See accompanying notes to financial statements.
| 64
Portfolio of Investments – as of June 30, 2012 (Unaudited)
Natixis U.S. Multi-Cap Equity Fund – (continued)
| | | | | | | | |
Shares | | | Description | | Value (†) | |
| | | | | | | | |
| | | | Personal Products — 0.2% | | | | |
| | 48,423 | | | Prestige Brands Holdings, Inc.(b) | | $ | 765,568 | |
| | | | | | | | |
| | | | Pharmaceuticals — 1.7% | | | | |
| | 25,280 | | | Merck & Co., Inc. | | | 1,055,440 | |
| | 41,988 | | | Mylan, Inc.(b) | | | 897,283 | |
| | 31,361 | | | Novartis AG, ADR | | | 1,753,080 | |
| | 13,445 | | | Perrigo Co. | | | 1,585,569 | |
| | 19,396 | | | Vivus, Inc.(b) | | | 553,562 | |
| | | | | | | | |
| | | | | | | 5,844,934 | |
| | | | | | | | |
| | | | Professional Services — 0.8% | | | | |
| | 55,794 | | | Verisk Analytics, Inc., Class A(b) | | | 2,748,412 | |
| | | | | | | | |
| | | | REITs — Apartments — 0.3% | | | | |
| | 7,339 | | | Essex Property Trust, Inc. | | | 1,129,619 | |
| | | | | | | | |
| | | | REITs — Diversified — 0.8% | | | | |
| | 21,189 | | | Digital Realty Trust, Inc. | | | 1,590,658 | |
| | 35,715 | | | Potlatch Corp. | | | 1,140,737 | |
| | | | | | | | |
| | | | | | | 2,731,395 | |
| | | | | | | | |
| | | | REITs — Healthcare — 0.5% | | | | |
| | 93,426 | | | Sabra Healthcare REIT, Inc. | | | 1,598,519 | |
| | | | | | | | |
| | | | Road & Rail — 1.4% | | | | |
| | 88,960 | | | Avis Budget Group, Inc.(b) | | | 1,352,192 | |
| | 45,033 | | | Celadon Group, Inc. | | | 737,641 | |
| | 18,224 | | | J.B. Hunt Transport Services, Inc. | | | 1,086,150 | |
| | 23,443 | | | Kansas City Southern | | | 1,630,695 | |
| | | | | | | | |
| | | | | | | 4,806,678 | |
| | | | | | | | |
| | | | Semiconductors & Semiconductor Equipment — 6.8% | | | | |
| | 6,052 | | | Altera Corp. | | | 204,800 | |
| | 7,252 | | | Analog Devices, Inc. | | | 273,183 | |
| | 292,000 | | | Applied Materials, Inc. | | | 3,346,320 | |
| | 48,823 | | | ARM Holdings PLC, Sponsored ADR | | | 1,161,499 | |
| | 128,814 | | | Atmel Corp.(b) | | | 863,054 | |
| | 22,844 | | | Hittite Microwave Corp.(b) | | | 1,167,785 | |
| | 260,600 | | | Intel Corp. | | | 6,944,990 | |
| | 102,282 | | | Kulicke & Soffa Industries, Inc.(b) | | | 912,355 | |
| | 33,500 | | | Lam Research Corp.(b) | | | 1,264,290 | |
| | 11,119 | | | Mellanox Technologies Ltd.(b) | | | 787,670 | |
| | 27,835 | | | Microchip Technology, Inc. | | | 920,782 | |
| | 52,127 | | | NXP Semiconductors NV(b) | | | 1,211,953 | |
| | 41,391 | | | Skyworks Solutions, Inc.(b) | | | 1,132,871 | |
| | 99,900 | | | Texas Instruments, Inc. | | | 2,866,131 | |
| | | | | | | | |
| | | | | | | 23,057,683 | |
| | | | | | | | |
| | | | Software — 5.7% | | | | |
| | 43,454 | | | Autodesk, Inc.(b) | | | 1,520,456 | |
| | 30,219 | | | BMC Software, Inc.(b) | | | 1,289,747 | |
| | 14,978 | | | FactSet Research Systems, Inc. | | | 1,392,055 | |
See accompanying notes to financial statements.
65 |
Portfolio of Investments – as of June 30, 2012 (Unaudited)
Natixis U.S. Multi-Cap Equity Fund – (continued)
| | | | | | | | |
Shares | | | Description | | Value (†) | |
| | | | | | | | |
| | | | Software — continued | | | | |
| | 34,401 | | | Fortinet, Inc.(b) | | $ | 798,791 | |
| | 27,009 | | | MICROS Systems, Inc.(b) | | | 1,382,861 | |
| | 48,934 | | | Microsoft Corp. | | | 1,496,891 | |
| | 15,837 | | | NetSuite, Inc.(b) | | | 867,393 | |
| | 212,362 | | | Oracle Corp. | | | 6,307,151 | |
| | 32,052 | | | SolarWinds, Inc.(b) | | | 1,396,185 | |
| | 24,444 | | | Sourcefire, Inc.(b) | | | 1,256,422 | |
| | 54,868 | | | Synopsys, Inc.(b) | | | 1,614,765 | |
| | | | | | | | |
| | | | | | | 19,322,717 | |
| | | | | | | | |
| | | | Specialty Retail — 4.8% | | | | |
| | 2,835 | | | AutoZone, Inc.(b) | | | 1,040,927 | |
| | 41,800 | | | CarMax, Inc.(b) | | | 1,084,292 | |
| | 20,064 | | | Home Depot, Inc. (The) | | | 1,063,191 | |
| | 20,900 | | | Jos. A. Bank Clothiers, Inc.(b) | | | 887,414 | |
| | 30,771 | | | Lowe’s Cos., Inc. | | | 875,127 | |
| | 24,708 | | | PetSmart, Inc. | | | 1,684,591 | |
| | 27,001 | | | Ross Stores, Inc. | | | 1,686,753 | |
| | 113,016 | | | Sally Beauty Holdings, Inc.(b) | | �� | 2,909,032 | |
| | 33,600 | | | Tiffany & Co. | | | 1,779,120 | |
| | 17,660 | | | Tractor Supply Co. | | | 1,466,840 | |
| | 19,453 | | | Ulta Salon, Cosmetics & Fragrance, Inc.(b) | | | 1,816,521 | |
| | | | | | | | |
| | | | | | | 16,293,808 | |
| | | | | | | | |
| | | | Textiles, Apparel & Luxury Goods — 1.1% | | | | |
| | 12,946 | | | Lululemon Athletica, Inc.(b) | | | 771,970 | |
| | 25,429 | | | Michael Kors Holdings Ltd.(b) | | | 1,063,949 | |
| | 10,200 | | | NIKE, Inc., Class B | | | 895,356 | |
| | 12,180 | | | Under Armour, Inc., Class A(b) | | | 1,150,767 | |
| | | | | | | | |
| | | | | | | 3,882,042 | |
| | | | | | | | |
| | | | Trading Companies & Distributors — 0.8% | | | | |
| | 34,049 | | | United Rentals, Inc.(b) | | | 1,159,028 | |
| | 26,088 | | | WESCO International, Inc.(b) | | | 1,501,364 | |
| | | | | | | | |
| | | | | | | 2,660,392 | |
| | | | | | | | |
| | | | Water Utilities — 0.8% | | | | |
| | 82,263 | | | American Water Works Co., Inc. | | | 2,819,976 | |
| | | | | | | | |
| | | | Wireless Telecommunication Services — 0.4% | | | | |
| | 21,456 | | | SBA Communications Corp., Class A(b) | | | 1,224,065 | |
| | | | | | | | |
| | | | Total Common Stocks
(Identified Cost $278,690,509) | | | 330,316,562 | |
| | | | | | | | |
| | | | | | | | |
| | Closed End Investment Companies — 0.5% | |
| | 100,945 | | | Ares Capital Corp.
(Identified Cost $1,361,177) | | | 1,611,082 | |
| | | | | | | | |
See accompanying notes to financial statements.
| 66
Portfolio of Investments – as of June 30, 2012 (Unaudited)
Natixis U.S. Multi-Cap Equity Fund – (continued)
| | | | | | | | |
Shares | | | Description | | Value (†) | |
| | | | | | | | |
| | Purchased Options — 0.0% | |
| | | | Options on Securities — 0.0% | | | | |
| | 44,400 | | | iShares Nasdaq Biotechnology Index Fund, Put expiring September 22, 2012 at 115
(Identified Cost $203,474) | | $ | 68,820 | |
| | | | | | | | |
| | | | | | | | |
Principal
Amount | | | | | | |
| | Short-Term Investments — 2.6% | |
| $ | 8,908,389 | | | Tri-Party Repurchase Agreement with Fixed Income Clearing Corporation, dated 6/29/2012 at 0.000% to be repurchased at $8,908,389 on 7/02/2012 collateralized by $2,865,000 Federal Home Loan Bank 0.370% due 5/01/2013 valued at $2,868,581; $2,145,000 Federal Home Loan Mortgage Corporation, 4.750% due 11/17/2015 valued at $2,453,344; $3,225,000 Federal National Mortgage Association, 5.000% due 3/15/2016 valued at $3,769,251 including accrued interest (Note 2 of Notes to Financial Statements)
(Identified Cost $8,908,389) | | | 8,908,389 | |
| | | | | | | | |
| | | | | | | | |
| | | | Total Investments — 99.9%
(Identified Cost $289,163,549)(a) | | | 340,904,853 | |
| | | | Other assets less liabilities — 0.1% | | | 245,258 | |
| | | | | | | | |
| | | | Net Assets — 100.0% | | $ | 341,150,111 | |
| | | | | | | | |
| | | | | | | | |
| | (†) | | | See Note 2 of Notes to Financial Statements. | | | | |
| | (a) | | | Federal Tax Information (Amounts exclude certain adjustments made at the end of the Fund’s fiscal year for tax purposes. Such adjustments are primarily due to wash sales.): | |
| | | | At June 30, 2012, the net unrealized appreciation on investments based on a cost of $289,163,549 for federal income tax purposes was as follows: | |
| | | | Aggregate gross unrealized appreciation for all investments in which there is an excess of value over tax cost | | $ | 60,688,476 | |
| | | | Aggregate gross unrealized depreciation for all investments in which there is an excess of tax cost over value | | | (8,947,172 | ) |
| | | | | | | | |
| | | | Net unrealized appreciation | | $ | 51,741,304 | |
| | | | | | | | |
| | | | | | | | |
| | (b) | | | Non-income producing security. | | | | |
| | | | | | | | |
| | ADR | | | An American Depositary Receipt is a certificate issued by a custodian bank representing the right to receive securities of the foreign issuer described. The values of ADRs may be significantly influenced by trading on exchanges not located in the United States. | |
| | REITs | | | Real Estate Investment Trusts | | | | |
See accompanying notes to financial statements.
67 |
Portfolio of Investments – as of June 30, 2012 (Unaudited)
Natixis U.S. Multi-Cap Equity Fund – (continued)
Industry Summary at June 30, 2012 (Unaudited)
| | | | |
Semiconductors & Semiconductor Equipment | | | 6.8 | % |
Software | | | 5.7 | |
IT Services | | | 5.5 | |
Hotels, Restaurants & Leisure | | | 5.0 | |
Specialty Retail | | | 4.8 | |
Machinery | | | 4.7 | |
Capital Markets | | | 4.5 | |
Oil, Gas & Consumable Fuels | | | 3.2 | |
Media | | | 3.1 | |
Health Care Equipment & Supplies | | | 2.7 | |
Diversified Financial Services | | | 2.7 | |
Biotechnology | | | 2.7 | |
Internet Software & Services | | | 2.5 | |
Commercial Banks | | | 2.4 | |
Energy Equipment & Services | | | 2.4 | |
Communications Equipment | | | 2.3 | |
Auto Components | | | 2.3 | |
Air Freight & Logistics | | | 2.2 | |
Food Products | | | 2.2 | |
Beverages | | | 2.1 | |
Other Investments, less than 2% each | | | 27.5 | |
Short-Term Investments | | | 2.6 | |
| | | | |
Total Investments | | | 99.9 | |
Other assets less liabilities | | | 0.1 | |
| | | | |
Net Assets | | | 100.0 | % |
| | | | |
See accompanying notes to financial statements.
| 68
Portfolio of Investments – as of June 30, 2012 (Unaudited)
Vaughan Nelson Small Cap Value Fund
| | | | | | | | |
Shares | | | Description | | Value (†) | |
| | | | | | | | |
| | Common Stocks — 89.1% of Net Assets | | | | |
| | | | Air Freight & Logistics — 1.2% | | | | |
| | 106,950 | | | Atlas Air Worldwide Holdings, Inc.(b) | | $ | 4,653,395 | |
| | | | | | | | |
| | | | Building Products — 3.3% | | | | |
| | 144,437 | | | A.O. Smith Corp. | | | 7,061,525 | |
| | 110,575 | | | Lennox International, Inc. | | | 5,156,112 | |
| | | | | | | | |
| | | | | | | 12,217,637 | |
| | | | | | | | |
| | | | Capital Markets — 1.6% | | | | |
| | 181,775 | | | LPL Financial Holdings, Inc. | | | 6,138,542 | |
| | | | | | | | |
| | | | Chemicals — 1.5% | | | | |
| | 124,775 | | | Kraton Performance Polymers, Inc.(b) | | | 2,733,820 | |
| | 73,000 | | | TPC Group, Inc.(b) | | | 2,697,350 | |
| | | | | | | | |
| | | | | | | 5,431,170 | |
| | | | | | | | |
| | | | Commercial Banks — 8.7% | | | | |
| | 472,200 | | | Associated Banc-Corp | | | 6,228,318 | |
| | 90,475 | | | Bank of Hawaii Corp. | | | 4,157,326 | |
| | 400,255 | | | FirstMerit Corp. | | | 6,612,213 | |
| | 138,825 | | | Hancock Holding Co. | | | 4,225,833 | |
| | 128,275 | | | Prosperity Bancshares, Inc. | | | 5,391,398 | |
| | 273,675 | | | Webster Financial Corp. | | | 5,927,801 | |
| | | | | | | | |
| | | | | | | 32,542,889 | |
| | | | | | | | |
| | | | Commercial Services & Supplies — 5.5% | | | | |
| | 329,300 | | | Corrections Corp. of America | | | 9,697,885 | |
| | 378,600 | | | KAR Auction Services, Inc.(b) | | | 6,508,134 | |
| | 160,775 | | | McGrath Rentcorp | | | 4,260,537 | |
| | | | | | | | |
| | | | | | | 20,466,556 | |
| | | | | | | | |
| | | | Computers & Peripherals — 1.8% | | | | |
| | 237,100 | | | QLogic Corp.(b) | | | 3,245,899 | |
| | 219,325 | | | Super Micro Computer, Inc.(b) | | | 3,478,494 | |
| | | | | | | | |
| | | | | | | 6,724,393 | |
| | | | | | | | |
| | | | Construction & Engineering — 0.9% | | | | |
| | 224,700 | | | MasTec, Inc.(b) | | | 3,379,488 | |
| | | | | | | | |
| | | | Consumer Finance — 1.7% | | | | |
| | 162,575 | | | First Cash Financial Services, Inc.(b) | | | 6,530,638 | |
| | | | | | | | |
| | | | Containers & Packaging — 3.5% | | | | |
| | 181,075 | | | Packaging Corp. of America | | | 5,113,558 | |
| | 190,600 | | | Silgan Holdings, Inc. | | | 8,136,714 | |
| | | | | | | | |
| | | | | | | 13,250,272 | |
| | | | | | | | |
| | | | Electronic Equipment, Instruments & Components — 1.8% | | | | |
| | 59,700 | | | Littelfuse, Inc. | | | 3,396,333 | |
| | 107,925 | | | ScanSource, Inc.(b) | | | 3,306,822 | |
| | | | | | | | |
| | | | | | | 6,703,155 | |
| | | | | | | | |
See accompanying notes to financial statements.
69 |
Portfolio of Investments – as of June 30, 2012 (Unaudited)
Vaughan Nelson Small Cap Value Fund – (continued)
| | | | | | | | |
Shares | | | Description | | Value (†) | |
| | | | | | | | |
| | | | Energy Equipment & Services — 1.5% | | | | |
| | 86,730 | | | Oil States International, Inc.(b) | | $ | 5,741,526 | |
| | | | | | | | |
| | | | Food Products — 1.3% | | | | |
| | 160,050 | | | Post Holdings, Inc.(b) | | | 4,921,538 | |
| | | | | | | | |
| | | | Gas Utilities — 2.2% | | | | |
| | 233,550 | | | Atmos Energy Corp. | | | 8,190,598 | |
| | | | | | | | |
| | | | Health Care Equipment & Supplies — 4.7% | | | | |
| | 103,050 | | | Sirona Dental Systems, Inc.(b) | | | 4,638,281 | |
| | 123,350 | | | Teleflex, Inc. | | | 7,513,248 | |
| | 111,875 | | | West Pharmaceutical Services, Inc. | | | 5,648,569 | |
| | | | | | | | |
| | | | | | | 17,800,098 | |
| | | | | | | | |
| | | | Health Care Providers & Services — 1.7% | | | | |
| | 159,400 | | | LifePoint Hospitals, Inc.(b) | | | 6,532,212 | |
| | | | | | | | |
| | | | Hotels, Restaurants & Leisure — 1.2% | | | | |
| | 112,725 | | | Choice Hotels International, Inc. | | | 4,501,109 | |
| | | | | | | | |
| | | | Household Products — 1.1% | | | | |
| | 83,700 | | | WD-40 Co. | | | 4,169,097 | |
| | | | | | | | |
| | | | Insurance — 5.5% | | | | |
| | 333,250 | | | American Equity Investment Life Holding Co. | | | 3,669,083 | |
| | 666,275 | | | CNO Financial Group, Inc. | | | 5,196,945 | |
| | 205,462 | | | HCC Insurance Holdings, Inc. | | | 6,451,507 | |
| | 249,075 | | | Tower Group, Inc. | | | 5,198,195 | |
| | | | | | | | |
| | | | | | | 20,515,730 | |
| | | | | | | | |
| | | | IT Services — 1.5% | | | | |
| | 261,500 | | | Broadridge Financial Solutions, Inc. | | | 5,562,105 | |
| | | | | | | | |
| | | | Machinery — 3.2% | | | | |
| | 216,750 | | | Actuant Corp., Class A | | | 5,886,930 | |
| | 51,525 | | | Valmont Industries, Inc. | | | 6,232,979 | |
| | | | | | | | |
| | | | | | | 12,119,909 | |
| | | | | | | | |
| | | | Media — 1.7% | | | | |
| | 129,475 | | | John Wiley & Sons, Inc., Class A | | | 6,342,980 | |
| | | | | | | | |
| | | | Metals & Mining — 0.7% | | | | |
| | 182,250 | | | Globe Specialty Metals, Inc. | | | 2,447,618 | |
| | | | | | | | |
| | | | Multiline Retail — 1.8% | | | | |
| | 168,525 | | | Big Lots, Inc.(b) | | | 6,874,135 | |
| | | | | | | | |
| | | | Oil, Gas & Consumable Fuels — 1.5% | | | | |
| | 237,339 | | | Oasis Petroleum, Inc.(b) | | | 5,738,857 | |
| | | | | | | | |
| | | | Professional Services — 2.0% | | | | |
| | 125,450 | | | Towers Watson & Co., Class A | | | 7,514,455 | |
| | | | | | | | |
| | | | REITs — Apartments — 0.8% | | | | |
| | 211,050 | | | Associated Estates Realty Corp. | | | 3,155,198 | |
| | | | | | | | |
| | | | REITs — Hotels — 0.8% | | | | |
| | 108,400 | | | LaSalle Hotel Properties | | | 3,158,776 | |
| | | | | | | | |
See accompanying notes to financial statements.
| 70
Portfolio of Investments – as of June 30, 2012 (Unaudited)
Vaughan Nelson Small Cap Value Fund – (continued)
| | | | | | | | |
Shares | | | Description | | Value (†) | |
| | | | | | | | |
| | | | REITs — Office Property — 1.5% | | | | |
| | 163,725 | | | Highwoods Properties, Inc. | | $ | 5,509,346 | |
| | | | | | | | |
| | | | Road & Rail — 1.3% | | | | |
| | 200,025 | | | Werner Enterprises, Inc. | | | 4,778,597 | |
| | | | | | | | |
| | | | Semiconductors & Semiconductor Equipment — 7.7% | | | | |
| | 74,875 | | | Hittite Microwave Corp.(b) | | | 3,827,610 | |
| | 331,625 | | | Microsemi Corp.(b) | | | 6,131,746 | |
| | 137,450 | | | MKS Instruments, Inc. | | | 3,976,428 | |
| | 881,575 | | | RF Micro Devices, Inc.(b) | | | 3,746,694 | |
| | 152,550 | | | Semtech Corp.(b) | | | 3,710,016 | |
| | 302,950 | | | Teradyne, Inc.(b) | | | 4,259,477 | |
| | 96,275 | | | Veeco Instruments, Inc.(b) | | | 3,308,009 | |
| | | | | | | | |
| | | | | | | 28,959,980 | |
| | | | | | | | |
| | | | Software — 2.5% | | | | |
| | 92,325 | | | Manhattan Associates, Inc.(b) | | | 4,220,176 | |
| | 168,350 | | | Verint Systems, Inc.(b) | | | 4,968,008 | |
| | | | | | | | |
| | | | | | | 9,188,184 | |
| | | | | | | | |
| | | | Specialty Retail — 5.0% | | | | |
| | 222,697 | | | Aaron’s, Inc. | | | 6,304,552 | |
| | 91,725 | | | DSW, Inc., Class A | | | 4,989,840 | |
| | 83,925 | | | Group 1 Automotive, Inc. | | | 3,827,819 | |
| | 155,075 | | | Lithia Motors, Inc., Class A | | | 3,574,479 | |
| | | | | | | | |
| | | | | | | 18,696,690 | |
| | | | | | | | |
| | | | Textiles, Apparel & Luxury Goods — 1.6% | | | | |
| | 154,175 | | | Wolverine World Wide, Inc. | | | 5,978,907 | |
| | | | | | | | |
| | | | Thrifts & Mortgage Finance — 1.6% | | | | |
| | 499,850 | | | Capitol Federal Financial, Inc. | | | 5,938,218 | |
| | | | | | | | |
| | | | Trading Companies & Distributors — 3.2% | | | | |
| | 152,925 | | | United Rentals, Inc.(b) | | | 5,205,567 | |
| | 120,875 | | | WESCO International, Inc.(b) | | | 6,956,356 | |
| | | | | | | | |
| | | | | | | 12,161,923 | |
| | | | | | | | |
| | | | Total Common Stocks
(Identified Cost $312,097,978) | | | 334,535,921 | |
| | | | | | | | |
| | | | | | | | |
| | Exchange Traded Funds — 4.5% | | | | |
| | 241,900 | | | iShares Russell 2000 Value Index Fund
(Identified Cost $16,670,238) | | | 17,027,341 | |
| | | | | | | | |
| | | | | | | | |
| | Closed End Investment Companies — 2.6% | | | | |
| | 611,550 | | | Ares Capital Corp.
(Identified Cost $9,618,552) | | | 9,760,338 | |
| | | | | | | | |
See accompanying notes to financial statements.
71 |
Portfolio of Investments – as of June 30, 2012 (Unaudited)
Vaughan Nelson Small Cap Value Fund – (continued)
| | | | | | | | |
Principal
Amount | | | Description | | Value (†) | |
| | | | | | | | |
| | Short-Term Investments — 1.1% | | | | |
| $ | 4,008,804 | | | Tri-Party Repurchase Agreement with Fixed Income Clearing Corporation, dated 6/29/2012 at 0.000% to be repurchased at $4,008,804 on 7/02/2012 collateralized by $3,580,000 Federal Home Loan Mortgage Corp., 4.750% due 11/17/2015 valued at $4,094,625 including accrued interest (Note 2 of Notes to Financial Statements)
(Identified Cost $4,008,804) | | $ | 4,008,804 | |
| | | | | | | | |
| | | | | | | | |
| | | | Total Investments — 97.3%
(Identified Cost $342,395,572)(a) | | | 365,332,404 | |
| | | | Other assets less liabilities — 2.7% | | | 10,253,625 | |
| | | | | | | | |
| | | | Net Assets — 100.0% | | $ | 375,586,029 | |
| | | | | | | | |
| | | | | | | | |
| | (†) | | | See Note 2 of Notes to Financial Statements. | |
| | (a) | | | Federal Tax Information (Amounts exclude certain adjustments made at the end of the Fund’s fiscal year for tax purposes. Such adjustments are primarily due to wash sales.): | |
| | | | At June 30, 2012, the net unrealized appreciation on investments based on a cost of $342,395,572 for federal income tax purposes was as follows: | |
| | | | Aggregate gross unrealized appreciation for all investments in which there is an excess of value over tax cost | | $ | 32,156,017 | |
| | | | Aggregate gross unrealized depreciation for all investments in which there is an excess of tax cost over value | | | (9,219,185 | ) |
| | | | | | | | |
| | | | Net unrealized appreciation | | $ | 22,936,832 | |
| | | | | | | | |
| | | | | | | | |
| | (b) | | | Non-income producing security. | |
| | | | | | | | |
| | REITs | | | Real Estate Investment Trusts | |
Industry Summary at June 30, 2012 (Unaudited)
| | | | |
Commercial Banks | | | 8.7 | % |
Semiconductors & Semiconductor Equipment | | | 7.7 | |
Insurance | | | 5.5 | |
Commercial Services & Supplies | | | 5.5 | |
Specialty Retail | | | 5.0 | |
Health Care Equipment & Supplies | | | 4.7 | |
Exchange Traded Funds | | | 4.5 | |
Containers & Packaging | | | 3.5 | |
Building Products | | | 3.3 | |
Trading Companies & Distributors | | | 3.2 | |
Machinery | | | 3.2 | |
Closed End Investment Companies | | | 2.6 | |
Software | | | 2.5 | |
Gas Utilities | | | 2.2 | |
Professional Services | | | 2.0 | |
Other Investments, less than 2% each | | | 32.1 | |
Short-Term Investments | | | 1.1 | |
| | | | |
Total Investments | | | 97.3 | |
Other assets less liabilities | | | 2.7 | |
| | | | |
Net Assets | | | 100.0 | % |
| | | | |
See accompanying notes to financial statements.
| 72
Portfolio of Investments – as of June 30, 2012 (Unaudited)
Vaughan Nelson Value Opportunity Fund
| | | | | | | | |
Shares | | | Description | | Value (†) | |
| | | | | | | | |
| | Common Stocks — 95.0% of Net Assets | |
| | | | Auto Components — 3.2% | | | | |
| | 124,075 | | | Delphi Automotive PLC(b) | | $ | 3,163,912 | |
| | 25,175 | | | Tenneco, Inc.(b) | | | 675,194 | |
| | 39,400 | | | WABCO Holdings, Inc.(b) | | | 2,085,442 | |
| | | | | | | | |
| | | | | | | 5,924,548 | |
| | | | | | | | |
| | | | Capital Markets — 2.7% | | | | |
| | 278,450 | | | Apollo Investment Corp. | | | 2,138,496 | |
| | 143,050 | | | SEI Investments Co. | | | 2,845,264 | |
| | | | | | | | |
| | | | | | | 4,983,760 | |
| | | | | | | | |
| | | | Chemicals — 3.2% | | | | |
| | 22,625 | | | Airgas, Inc. | | | 1,900,726 | |
| | 33,200 | | | Celanese Corp., Series A | | | 1,149,384 | |
| | 54,000 | | | FMC Corp. | | | 2,887,920 | |
| | | | | | | | |
| | | | | | | 5,938,030 | |
| | | | | | | | |
| | | | Commercial Banks — 6.8% | | | | |
| | 243,400 | | | Fifth Third Bancorp | | | 3,261,560 | |
| | 388,275 | | | First Niagara Financial Group, Inc. | | | 2,970,304 | |
| | 595,200 | | | Huntington Bancshares, Inc. | | | 3,809,280 | |
| | 348,150 | | | Regions Financial Corp. | | | 2,350,012 | |
| | | | | | | | |
| | | | | | | 12,391,156 | |
| | | | | | | | |
| | | | Computers & Peripherals — 2.5% | | | | |
| | 198,150 | | | NCR Corp.(b) | | | 4,503,949 | |
| | | | | | | | |
| | | | Consumer Finance — 1.7% | | | | |
| | 129,925 | | | Ezcorp, Inc., Class A(b) | | | 3,048,041 | |
| | | | | | | | |
| | | | Containers & Packaging — 3.7% | | | | |
| | 122,975 | | | Crown Holdings, Inc.(b) | | | 4,241,408 | |
| | 93,425 | | | Packaging Corp. of America | | | 2,638,322 | |
| | | | | | | | |
| | | | | | | 6,879,730 | |
| | | | | | | | |
| | | | Distributors — 1.7% | | | | |
| | 93,425 | | | LKQ Corp.(b) | | | 3,120,395 | |
| | | | | | | | |
| | | | Electric Utilities — 4.6% | | | | |
| | 67,150 | | | Edison International | | | 3,102,330 | |
| | 147,425 | | | Great Plains Energy, Inc. | | | 3,156,369 | |
| | 126,625 | | | N.V. Energy, Inc. | | | 2,226,068 | |
| | | | | | | | |
| | | | | | | 8,484,767 | |
| | | | | | | | |
| | | | Energy Equipment & Services — 1.7% | | | | |
| | 28,825 | | | Helmerich & Payne, Inc. | | | 1,253,311 | |
| | 95,975 | | | Superior Energy Services, Inc.(b) | | | 1,941,574 | |
| | | | | | | | |
| | | | | | | 3,194,885 | |
| | | | | | | | |
| | | | Food Products — 1.6% | | | | |
| | 58,400 | | | Ingredion, Inc. | | | 2,891,968 | |
| | | | | | | | |
See accompanying notes to financial statements.
73 |
Portfolio of Investments – as of June 30, 2012 (Unaudited)
Vaughan Nelson Value Opportunity Fund – (continued)
| | | | | | | | |
Shares | | | Description | | Value (†) | |
| | | | | | | | |
| | | | Health Care Equipment & Supplies — 0.5% | | | | |
| | 20,800 | | | Sirona Dental Systems, Inc.(b) | | $ | 936,208 | |
| | | | | | | | |
| | | | Health Care Providers & Services — 3.0% | | | | |
| | 133,575 | | | HCA Holdings, Inc. | | | 4,064,687 | |
| | 15,700 | | | Laboratory Corp. of America Holdings(b) | | | 1,453,977 | |
| | | | | | | | |
| | | | | | | 5,518,664 | |
| | | | | | | | |
| | | | Health Care Technology — 1.3% | | | | |
| | 209,475 | | | Allscripts Healthcare Solutions, Inc.(b) | | | 2,289,562 | |
| | | | | | | | |
| | | | Hotels, Restaurants & Leisure — 1.3% | | | | |
| | 45,250 | | | Darden Restaurants, Inc. | | | 2,291,008 | |
| | | | | | | | |
| | | | Household Durables — 1.9% | | | | |
| | 83,925 | | | Jarden Corp. | | | 3,526,529 | |
| | | | | | | | |
| | | | Insurance — 5.8% | | | | |
| | 184,300 | | | Hartford Financial Services Group, Inc. (The) | | | 3,249,209 | |
| | 75,175 | | | Reinsurance Group of America, Inc., Class A | | | 4,000,062 | |
| | 162,400 | | | XL Group PLC | | | 3,416,896 | |
| | | | | | | | |
| | | | | | | 10,666,167 | |
| | | | | | | | |
| | | | Internet Software & Services — 0.6% | | | | |
| | 60,950 | | | Digital River, Inc.(b) | | | 1,012,989 | |
| | | | | | | | |
| | | | IT Services — 5.9% | | | | |
| | 134,300 | | | Broadridge Financial Solutions, Inc. | | | 2,856,561 | |
| | 43,800 | | | Fiserv, Inc.(b) | | | 3,163,236 | |
| | 63,875 | | | Global Payments, Inc. | | | 2,761,316 | |
| | 39,775 | | | MAXIMUS, Inc. | | | 2,058,356 | |
| | | | | | | | |
| | | | | | | 10,839,469 | |
| | | | | | | | |
| | | | Leisure Equipment & Products — 1.3% | | | | |
| | 72,625 | | | Hasbro, Inc. | | | 2,459,809 | |
| | | | | | | | |
| | | | Life Sciences Tools & Services — 2.3% | | | | |
| | 53,275 | | | Agilent Technologies, Inc. | | | 2,090,511 | |
| | 48,175 | | | Life Technologies Corp.(b) | | | 2,167,393 | |
| | | | | | | | |
| | | | | | | 4,257,904 | |
| | | | | | | | |
| | | | Machinery — 4.9% | | | | |
| | 55,100 | | | AGCO Corp.(b) | | | 2,519,723 | |
| | 18,250 | | | Flowserve Corp. | | | 2,094,188 | |
| | 60,225 | | | Navistar International Corp.(b) | | | 1,708,583 | |
| | 43,800 | | | Snap-on, Inc. | | | 2,726,550 | |
| | | | | | | | |
| | | | | | | 9,049,044 | |
| | | | | | | | |
| | | | Media — 3.1% | | | | |
| | 62,050 | | | CBS Corp., Class B | | | 2,033,999 | |
| | 67,150 | | | Discovery Communications, Inc., Class A(b) | | | 3,626,100 | |
| | | | | | | | |
| | | | | | | 5,660,099 | |
| | | | | | | | |
| | | | Multi Utilities — 3.2% | | | | |
| | 108,375 | | | CMS Energy Corp. | | | 2,546,813 | |
See accompanying notes to financial statements.
| 74
Portfolio of Investments – as of June 30, 2012 (Unaudited)
Vaughan Nelson Value Opportunity Fund – (continued)
| | | | | | | | |
Shares | | | Description | | Value (†) | |
| | | | | | | | |
| | | | Multi Utilities — continued | | | | |
| | 83,925 | | | Wisconsin Energy Corp. | | $ | 3,320,912 | |
| | | | | | | | |
| | | | | | | 5,867,725 | |
| | | | | | | | |
| | | | Multiline Retail — 1.6% | | | | |
| | 72,625 | | | Big Lots, Inc.(b) | | | 2,962,374 | |
| | | | | | | | |
| | | | Oil, Gas & Consumable Fuels — 1.3% | | | | |
| | 16,425 | | | Noble Energy, Inc. | | | 1,393,168 | |
| | 12,050 | | | Pioneer Natural Resources Co. | | | 1,062,931 | |
| | | | | | | | |
| | | | | | | 2,456,099 | |
| | | | | | | | |
| | | | Pharmaceuticals — 2.9% | | | | |
| | 53,311 | | | Valeant Pharmaceuticals International, Inc.(b) | | | 2,387,800 | |
| | 168,600 | | | Warner Chilcott PLC, Class A(b) | | | 3,021,312 | |
| | | | | | | | |
| | | | | | | 5,409,112 | |
| | | | | | | | |
| | | | Professional Services — 2.2% | | | | |
| | 67,500 | | | Towers Watson & Co., Class A | | | 4,043,250 | |
| | | | | | | | |
| | | | REITs - Apartments — 1.7% | | | | |
| | 112,775 | | | Apartment Investment & Management Co., Class A | | | 3,048,308 | |
| | | | | | | | |
| | | | Semiconductors & Semiconductor Equipment — 2.1% | | | | |
| | 49,625 | | | Altera Corp. | | | 1,679,310 | |
| | 62,050 | | | Avago Technologies Ltd. | | | 2,227,595 | |
| | | | | | | | |
| | | | | | | 3,906,905 | |
| | | | | | | | |
| | | | Software — 8.7% | | | | |
| | 69,700 | | | BMC Software, Inc.(b) | | | 2,974,796 | |
| | 38,325 | | | Intuit, Inc. | | | 2,274,589 | |
| | 140,500 | | | Nuance Communications, Inc.(b) | | | 3,346,710 | |
| | 111,675 | | | Parametric Technology Corp.(b) | | | 2,340,708 | |
| | 117,150 | | | Rovi Corp.(b) | | | 2,298,483 | |
| | 63,875 | | | Solera Holdings, Inc. | | | 2,669,336 | |
| | | | | | | | |
| | | | | | | 15,904,622 | |
| | | | | | | | |
| | | | Specialty Retail — 1.7% | | | | |
| | 71,525 | | | Signet Jewelers Ltd. | | | 3,147,815 | |
| | | | | | | | |
| | | | Tobacco — 1.6% | | | | |
| | 22,625 | | | Lorillard, Inc. | | | 2,985,369 | |
| | | | | | | | |
| | | | Trading Companies & Distributors — 2.7% | | | | |
| | 78,100 | | | United Rentals, Inc.(b) | | | 2,658,524 | |
| | 40,150 | | | WESCO International, Inc.(b) | | | 2,310,632 | |
| | | | | | | | |
| | | | | | | 4,969,156 | |
| | | | | | | | |
| | | | Total Common Stocks
(Identified Cost $172,336,124) | | | 174,569,416 | |
| | | | | | | | |
| | | | | | | | |
| | Closed End Investment Companies — 1.5% | |
| | 175,525 | | | Ares Capital Corp.
(Identified Cost $2,657,316) | | | 2,801,379 | |
| | | | | | | | |
| | | | | | | | |
See accompanying notes to financial statements.
75 |
Portfolio of Investments – as of June 30, 2012 (Unaudited)
Vaughan Nelson Value Opportunity Fund – (continued)
| | | | | | | | |
Principal
Amount | | | Description | | Value (†) | |
| | | | | | | | |
| | Short-Term Investments — 3.1% | |
| $ | 5,616,449 | | | Tri-Party Repurchase Agreement with Fixed Income Clearing Corporation, dated 6/29/2012 at 0.000% to be repurchased at $5,616,449 on 7/02/2012 collateralized by $5,010,000 Federal Home Loan Mortgage Corp., 4.750% due 11/17/2015 valued at $5,730,187 including accrued interest (Note 2 of Notes to Financial Statements)
(Identified Cost $5,616,449) | | $ | 5,616,449 | |
| | | | | | | | |
| | | | | | | | |
| | | | Total Investments — 99.6%
(Identified Cost $180,609,889)(a) | | | 182,987,244 | |
| | | | Other assets less liabilities — 0.4% | | | 662,873 | |
| | | | | | | | |
| | | | Net Assets — 100.0% | | $ | 183,650,117 | |
| | | | | | | | |
| | | | | | | | |
| | (†) | | | See Note 2 of Notes to Financial Statements. | | | | |
| | (a) | | | Federal Tax Information (Amounts exclude certain adjustments made at the end of the Fund’s fiscal year for tax purposes. Such adjustments are primarily due to wash sales.): | |
| | | | At June 30, 2012, the net unrealized appreciation on investments based on a cost of $180,609,889 for federal income tax purposes was as follows: | |
| | | | Aggregate gross unrealized appreciation for all investments in which there is an excess of value over tax cost | | $ | 12,439,520 | |
| | | | Aggregate gross unrealized depreciation for all investments in which there is an excess of tax cost over value | | | (10,062,165 | ) |
| | | | | | | | |
| | | | Net unrealized appreciation | | $ | 2,377,355 | |
| | | | | | | | |
| | | | | | | | |
| | (b) | | | Non-income producing security. | | | | |
| | | | | | | | |
| | REITs | | | Real Estate Investment Trusts | | | | |
See accompanying notes to financial statements.
| 76
Portfolio of Investments – as of June 30, 2012 (Unaudited)
Vaughan Nelson Value Opportunity Fund – (continued)
Industry Summary at June 30, 2012 (Unaudited)
| | | | |
Software | | | 8.7 | % |
Commercial Banks | | | 6.8 | |
IT Services | | | 5.9 | |
Insurance | | | 5.8 | |
Machinery | | | 4.9 | |
Electric Utilities | | | 4.6 | |
Containers & Packaging | | | 3.7 | |
Chemicals | | | 3.2 | |
Auto Components | | | 3.2 | |
Multi Utilities | | | 3.2 | |
Media | | | 3.1 | |
Health Care Providers & Services | | | 3.0 | |
Pharmaceuticals | | | 2.9 | |
Capital Markets | | | 2.7 | |
Trading Companies & Distributors | | | 2.7 | |
Computers & Peripherals | | | 2.5 | |
Life Sciences Tools & Services | | | 2.3 | |
Professional Services | | | 2.2 | |
Semiconductors & Semiconductor Equipment | | | 2.1 | |
Other Investments, less than 2% each | | | 23.0 | |
Short-Term Investments | | | 3.1 | |
| | | | |
Total Investments | | | 99.6 | |
Other assets less liabilities | | | 0.4 | |
| | | | |
Net Assets | | | 100.0 | % |
| | | | |
See accompanying notes to financial statements.
77 |
This Page Intentionally Left Blank
| 78
Statements of Assets and Liabilities
June 30, 2012 (Unaudited)
| | | | | | | | | | | | |
| | | CGM Advisor
Targeted Equity
Fund | | | Harris
Associates Large
Cap Value Fund | | | Natixis
Diversified
Income Fund | |
ASSETS | | | | | | | | | | | | |
Investments at cost | | $ | 543,486,369 | | | $ | 117,656,023 | | | $ | 98,589,807 | |
Net unrealized appreciation | | | 13,367,805 | | | | 13,923,586 | | | | 5,036,552 | |
| | | | | | | | | | | | |
Investments at value | | | 556,854,174 | | | | 131,579,609 | | | | 103,626,359 | |
Cash | | | — | | | | — | | | | 11,919 | |
Receivable for Fund shares sold | | | 68,534 | | | | 63,780 | | | | 922,890 | |
Receivable for securities sold | | | 18,428,571 | | | | 627,917 | | | | — | |
Dividends and interest receivable | | | 642,103 | | | | 94,921 | | | | 601,302 | |
Unrealized appreciation on forward foreign currency contracts (Note 2) | | | — | | | | — | | | | 23,024 | |
Tax reclaims receivable | | | — | | | | — | | | | 425 | |
| | | | | | | | | | | | |
TOTAL ASSETS | | | 575,993,382 | | | | 132,366,227 | | | | 105,185,919 | |
| | | | | | | | | | | | |
LIABILITIES | | | | | | | | | | | | |
Payable for securities purchased | | | 2,093,990 | | | | 66,500 | | | | 208,817 | |
Payable for Fund shares redeemed | | | 783,875 | | | | 31,377 | | | | 29,111 | |
Unrealized depreciation on forward foreign currency contracts (Note 2) | | | — | | | | — | | | | 1,214 | |
Management fees payable (Note 6) | | | 327,623 | | | | 65,843 | | | | 44,813 | |
Deferred Trustees’ fees (Note 6) | | | 678,585 | | | | 365,971 | | | | 55,904 | |
Administrative fees payable (Note 6) | | | 21,355 | | | | 4,889 | | | | 3,756 | |
Payable to distributor (Note 6d) | | | 3,251 | | | | 687 | | | | 771 | |
Other accounts payable and accrued expenses | | | 154,374 | | | | 75,666 | | | | 30,057 | |
| | | | | | | | | | | | |
TOTAL LIABILITIES | | | 4,063,053 | | | | 610,933 | | | | 374,443 | |
| | | | | | | | | | | | |
NET ASSETS | | $ | 571,930,329 | | | $ | 131,755,294 | | | $ | 104,811,476 | |
| | | | | | | | | | | | |
NET ASSETS CONSIST OF: | | | | | | | | | | | | |
Paid-in capital | | $ | 553,983,497 | | | $ | 127,550,837 | | | $ | 118,215,279 | |
Undistributed (Distributions in excess of) net investment income/Accumulated net investment (loss) | | | (938,808 | ) | | | (11,287 | ) | | | 87,607 | |
Accumulated net realized gain (loss) on investments and foreign currency transactions | | | 5,517,835 | | | | (9,707,842 | ) | | | (18,549,284 | ) |
Net unrealized appreciation on investments and foreign currency translations | | | 13,367,805 | | | | 13,923,586 | | | | 5,057,874 | |
| | | | | | | | | | | | |
NET ASSETS | | $ | 571,930,329 | | | $ | 131,755,294 | | | $ | 104,811,476 | |
| | | | | | | | | | | | |
See accompanying notes to financial statements.
79 |
| | | | | | | | | | | | |
| | | CGM Advisor
Targeted Equity
Fund | | | Harris
Associates Large
Cap Value Fund | | | Natixis
Diversified
Income Fund | |
COMPUTATION OF NET ASSET VALUE AND OFFERING PRICE: | | | | | | | | | | | | |
Class A shares: | | | | | | | | | | | | |
Net assets | | $ | 470,522,220 | | | $ | 111,713,573 | | | $ | 64,586,059 | |
| | | | | | | | | | | | |
Shares of beneficial interest | | | 47,863,679 | | | | 7,457,121 | | | | 5,636,516 | |
| | | | | | | | | | | | |
Net asset value and redemption price per share | | $ | 9.83 | | | $ | 14.98 | | | $ | 11.46 | |
| | | | | | | | | | | | |
Offering price per share (100/[100-maximum sales charge] of net asset value) (Note 1) | | $ | 10.43 | | | $ | 15.89 | | | $ | 12.00 | |
| | | | | | | | | | | | |
Class B shares: (redemption price per share is equal to net asset value less any applicable contingent deferred sales charge) (Note 1) | | | | | | | | | | | | |
Net assets | | $ | 4,006,989 | | | $ | 2,630,756 | | | $ | — | |
| | | | | | | | | | | | |
Shares of beneficial interest | | | 455,553 | | | | 191,347 | | | | — | |
| | | | | | | | | | | | |
Net asset value and offering price per share | | $ | 8.80 | | | $ | 13.75 | | | $ | — | |
| | | | | | | | | | | | |
Class C shares: (redemption price per share is equal to net asset value less any applicable contingent deferred sales charge) (Note 1) | | | | | | | | | | | | |
Net assets | | $ | 41,254,819 | | | $ | 5,999,524 | | | $ | 40,225,417 | |
| | | | | | | | | | | | |
Shares of beneficial interest | | | 4,714,255 | | | | 438,003 | | | | 3,520,590 | |
| | | | | | | | | | | | |
Net asset value and offering price per share | | $ | 8.75 | | | $ | 13.70 | | | $ | 11.43 | |
| | | | | | | | | | | | |
Class Y shares: | | | | | | | | | | | | |
Net assets | | $ | 56,146,301 | | | $ | 11,411,441 | | | $ | — | |
| | | | | | | | | | | | |
Shares of beneficial interest | | | 5,569,874 | | | | 736,059 | | | | — | |
| | | | | | | | | | | | |
Net asset value, offering and redemption price per share | | $ | 10.08 | | | $ | 15.50 | | | $ | — | |
| | | | | | | | | | | | |
See accompanying notes to financial statements.
| 80
Statements of Assets and Liabilities (continued)
June 30, 2012 (Unaudited)
| | | | | | | | | | | | |
| | | Natixis U.S.
Multi-Cap
Equity Fund | | | Vaughan Nelson
Small Cap
Value Fund | | | Vaughan Nelson
Value Opportunity
Fund | |
ASSETS | | | | | | | | | | | | |
Investments at cost | | $ | 289,163,549 | | | $ | 342,395,572 | | | $ | 180,609,889 | |
Net unrealized appreciation | | | 51,741,304 | | | | 22,936,832 | | | | 2,377,355 | |
| | | | | | | | | | | | |
Investments at value | | | 340,904,853 | | | | 365,332,404 | | | | 182,987,244 | |
Cash | | | 43,189 | | | | — | | | | — | |
Receivable for Fund shares sold | | | 156,086 | | | | 491,729 | | | | 1,058,038 | |
Receivable for securities sold | | | 3,108,123 | | | | 13,465,866 | | | | 3,684,483 | |
Dividends receivable | | | 172,737 | | | | 334,262 | | | | 257,956 | |
Tax reclaims receivable | | | 16,584 | | | | — | | | | — | |
| | | | | | | | | | | | |
TOTAL ASSETS | | | 344,401,572 | | | | 379,624,261 | | | | 187,987,721 | |
| | | | | | | | | | | | |
LIABILITIES | | | | | | | | | | | | |
Payable for securities purchased | | | 2,231,097 | | | | 3,077,733 | | | | 3,849,115 | |
Payable for Fund shares redeemed | | | 242,195 | | | | 436,285 | | | | 288,014 | |
Management fees payable (Note 6) | | | 194,776 | | | | 271,064 | | | | 117,405 | |
Deferred Trustees’ fees (Note 6) | | | 397,622 | | | | 152,350 | | | | 32,651 | |
Administrative fees payable (Note 6) | | | 12,704 | | | | 13,981 | | | | 6,771 | |
Payable to distributor (Note 6d) | | | 1,678 | | | | 3,865 | | | | 2,474 | |
Other accounts payable and accrued expenses | | | 171,389 | | | | 82,954 | | | | 41,174 | |
| | | | | | | | | | | | |
TOTAL LIABILITIES | | | 3,251,461 | | | | 4,038,232 | | | | 4,337,604 | |
| | | | | | | | | | | | |
NET ASSETS | | $ | 341,150,111 | | | $ | 375,586,029 | | | $ | 183,650,117 | |
| | | | | | | | | | | | |
NET ASSETS CONSIST OF: | | | | | | | | | | | | |
Paid-in capital | | $ | 281,579,627 | | | $ | 341,042,511 | | | $ | 179,251,052 | |
Accumulated net investment (loss)/Undistributed net investment income | | | (293,572 | ) | | | 374,085 | | | | 389,502 | |
Accumulated net realized gain on investments | | | 8,122,752 | | | | 11,232,601 | | | | 1,632,208 | |
Net unrealized appreciation on investments | | | 51,741,304 | | | | 22,936,832 | | | | 2,377,355 | |
| | | | | | | | | | | | |
NET ASSETS | | $ | 341,150,111 | | | $ | 375,586,029 | | | $ | 183,650,117 | |
| | | | | | | | | | | | |
See accompanying notes to financial statements.
81 |
| | | | | | | | | | | | |
| | | Natixis U.S.
Multi-Cap
Equity Fund | | | Vaughan Nelson
Small Cap
Value Fund | | | Vaughan Nelson
Value Opportunity
Fund | |
COMPUTATION OF NET ASSET VALUE AND OFFERING PRICE: | | | | | | | | | | | | |
Class A shares: | | | | | | | | | | | | |
Net assets | | $ | 288,130,954 | | | $ | 208,140,709 | | | $ | 27,723,895 | |
| | | | | | | | | | | | |
Shares of beneficial interest | | | 11,236,161 | | | | 11,192,281 | | | | 1,887,228 | |
| | | | | | | | | | | | |
Net asset value and redemption price per share | | $ | 25.64 | | | $ | 18.60 | | | $ | 14.69 | |
| | | | | | | | | | | | |
Offering price per share (100/[100-maximum sales charge] of net asset value) (Note 1) | | $ | 27.20 | | | $ | 19.73 | | | $ | 15.59 | |
| | | | | | | | | | | | |
Class B shares: (redemption price per share is equal to net asset value less any applicable contingent deferred sales charge) (Note 1) | | | | | | | | | | | | |
Net assets | | $ | 13,465,086 | | | $ | 3,644,550 | | | $ | — | |
| | | | | | | | | | | | |
Shares of beneficial interest | | | 622,847 | | | | 235,749 | | | | — | |
| | | | | | | | | | | | |
Net asset value and offering price per share | | $ | 21.62 | | | $ | 15.46 | | | $ | — | |
| | | | | | | | | | | | |
Class C shares: (redemption price per share is equal to net asset value less any applicable contingent deferred sales charge) (Note 1) | | | | | | | | | | | | |
Net assets | | $ | 29,906,492 | | | $ | 28,433,496 | | | $ | 2,781,027 | |
| | | | | | | | | | | | |
Shares of beneficial interest | | | 1,382,922 | | | | 1,838,673 | | | | 193,213 | |
| | | | | | | | | | | | |
Net asset value and offering price per share | | $ | 21.63 | | | $ | 15.46 | | | $ | 14.39 | |
| | | | | | | | | | | | |
Class Y shares: | | | | | | | | | | | | |
Net assets | | $ | 9,647,579 | | | $ | 135,367,274 | | | $ | 153,145,195 | |
| | | | | | | | | | | | |
Shares of beneficial interest | | | 346,805 | | | | 7,167,490 | | | | 10,363,060 | |
| | | | | | | | | | | | |
Net asset value, offering and redemption price per share | | $ | 27.82 | | | $ | 18.89 | | | $ | 14.78 | |
| | | | | | | | | | | | |
See accompanying notes to financial statements.
| 82
Statements of Operations
For the Six Months Ended June 30, 2012 (Unaudited)
| | | | | | | | | | | | |
| | | CGM Advisor
Targeted Equity
Fund | | | Harris
Associates Large
Cap Value Fund | | | Natixis
Diversified
Income Fund | |
INVESTMENT INCOME | | | | | | | | | | | | |
Dividends | | $ | 3,544,073 | | �� | $ | 1,236,518 | | | $ | 806,962 | |
Interest | | | 1,524 | | | | — | | | | 1,074,274 | |
Less net foreign taxes withheld | | | (58,503 | ) | | | (2,466 | ) | | | (1,476 | ) |
| | | | | | | | | | | | |
| | | 3,487,094 | | | | 1,234,052 | | | | 1,879,760 | |
| | | | | | | | | | | | |
Expenses | | | | | | | | | | | | |
Management fees (Note 6) | | | 2,197,425 | | | | 471,842 | | | | 241,971 | |
Service and distribution fees (Note 6) | | | 894,855 | | | | 189,933 | | | | 240,609 | |
Administrative fees (Note 6) | | | 141,821 | | | | 30,703 | | | | 20,032 | |
Trustees’ fees and expenses (Note 6) | | | 42,691 | | | | 23,412 | | | | 9,912 | |
Transfer agent fees and expenses (Note 6) | | | 346,699 | | | | 119,429 | | | | 29,253 | |
Audit and tax services fees | | | 23,136 | | | | 20,337 | | | | 22,429 | |
Custodian fees and expenses | | | 18,625 | | | | 10,958 | | | | 24,532 | |
Legal fees | | | 4,769 | | | | 970 | | | | 604 | |
Registration fees | | | 30,810 | | | | 31,008 | | | | 17,474 | |
Shareholder reporting expenses | | | 49,614 | | | | 11,734 | | | | 4,656 | |
Miscellaneous expenses | | | 11,952 | | | | 5,229 | | | | 4,816 | |
| | | | | | | | | | | | |
Total expenses | | | 3,762,397 | | | | 915,555 | | | | 616,288 | |
Less waiver and/or expense reimbursement (Note 6) | | | — | | | | (17,860 | ) | | | — | |
| | | | | | | | | | | | |
Net expenses | | | 3,762,397 | | | | 897,695 | | | | 616,288 | |
| | | | | | | | | | | | |
Net investment income (loss) | | | (275,303 | ) | | | 336,357 | | | | 1,263,472 | |
| | | | | | | | | | | | |
NET REALIZED AND UNREALIZED GAIN (LOSS) ON INVESTMENTS AND FOREIGN CURRENCY TRANSACTIONS | | | | | | | | | | | | |
Net realized gain on: | | | | | | | | | | | | |
Investments | | | 33,329,920 | | | | 1,461,186 | | | | 1,407,377 | |
Foreign currency transactions | | | — | | | | — | | | | 31,568 | |
Net change in unrealized appreciation (depreciation) on: | | | | | | | | | | | | |
Investments | | | (1,052,351 | ) | | | 8,308,399 | | | | 3,843,792 | |
Foreign currency translations | | | — | | | | — | | | | (10,255 | ) |
| | | | | | | | | | | | |
Net realized and unrealized gain on investments and foreign currency transactions | | | 32,277,569 | | | | 9,769,585 | | | | 5,272,482 | |
| | | | | | | | | | | | |
NET INCREASE IN NET ASSETS RESULTING FROM OPERATIONS | | $ | 32,002,266 | | | $ | 10,105,942 | | | $ | 6,535,954 | |
| | | | | | | | | | | | |
See accompanying notes to financial statements.
83 |
| | | | | | | | | | | | |
| | | Natixis U.S.
Multi-Cap
Equity Fund | | | Vaughan Nelson
Small Cap
Value Fund | | | Vaughan Nelson
Value Opportunity
Fund | |
INVESTMENT INCOME | | | | | | | | | | | | |
Dividends | | $ | 2,547,790 | | | $ | 3,222,595 | (a) | | $ | 1,354,791 | (a) |
Less net foreign taxes withheld | | | (23,344 | ) | | | — | | | | — | |
| | | | | | | | | | | | |
| | | 2,524,446 | | | | 3,222,595 | | | | 1,354,791 | |
| | | | | | | | | | | | |
Expenses | | | | | | | | | | | | |
Management fees (Note 6) | | | 1,394,264 | | | | 1,776,015 | | | | 666,270 | |
Service and distribution fees (Note 6) | | | 600,373 | | | | 452,127 | | | | 43,684 | |
Administrative fees (Note 6) | | | 79,389 | | | | 89,905 | | | | 37,913 | |
Trustees’ fees and expenses (Note 6) | | | 27,550 | | | | 17,035 | | | | 9,275 | |
Transfer agent fees and expenses (Note 6) | | | 287,229 | | | | 242,155 | | | | 96,552 | |
Audit and tax services fees | | | 27,633 | | | | 19,364 | | | | 18,769 | |
Custodian fees and expenses | | | 18,397 | | | | 18,370 | | | | 13,232 | |
Legal fees | | | 2,677 | | | | 3,098 | | | | 1,076 | |
Registration fees | | | 36,277 | | | | 40,717 | | | | 37,463 | |
Shareholder reporting expenses | | | 40,860 | | | | 35,203 | | | | 8,279 | |
Miscellaneous expenses | | | 7,977 | | | | 8,958 | | | | 5,149 | |
| | | | | | | | | | | | |
Total expenses | | | 2,522,626 | | | | 2,702,947 | | | | 937,662 | |
Less waiver and/or expense reimbursement (Note 6) | | | (92,100 | ) | | | — | | | | — | |
| | | | | | | | | | | | |
Net expenses | | | 2,430,526 | | | | 2,702,947 | | | | 937,662 | |
| | | | | | | | | | | | |
Net investment income | | | 93,920 | | | | 519,648 | | | | 417,129 | |
| | | | | | | | | | | | |
NET REALIZED AND UNREALIZED GAIN ON INVESTMENTS | | | | | | | | | | | | |
Net realized gain on: | | | | | | | | | | | | |
Investments | | | 10,121,573 | | | | 15,154,406 | | | | 2,968,885 | |
Net change in unrealized appreciation (depreciation) on: | | | | | | | | | | | | |
Investments | | | 18,579,347 | | | | 9,192,680 | | | | 3,250,401 | |
| | | | | | | | | | | | |
Net realized and unrealized gain on investments | | | 28,700,920 | | | | 24,347,086 | | | | 6,219,286 | |
| | | | | | | | | | | | |
NET INCREASE IN NET ASSETS RESULTING FROM OPERATIONS | | $ | 28,794,840 | | | $ | 24,866,734 | | | $ | 6,636,415 | |
| | | | | | | | | | | | |
| (a) | Includes a non-recurring dividend of $376,600 and $186,000 for Vaughan Nelson Small Cap Value Fund and Vaughan Nelson Value Opportunity Fund, respectively. |
See accompanying notes to financial statements.
| 84
Statements of Changes in Net Assets
| | | | | | | | |
| | | CGM Advisor Targeted Equity Fund | |
| | | Six Months Ended
June 30, 2012
(Unaudited) | | | Year Ended
December 31,
2011 | |
FROM OPERATIONS: | | | | | | | | |
Net investment income (loss) | | $ | (275,303 | ) | | $ | 3,279,660 | |
Net realized gain on investments | | | 33,329,920 | | | | 100,088,779 | |
Net change in unrealized appreciation (depreciation) on investments | | | (1,052,351 | ) | | | (243,921,485 | ) |
| | | | | | | | |
Net increase (decrease) in net assets resulting from operations | | | 32,002,266 | | | | (140,553,046 | ) |
| | | | | | | | |
FROM DISTRIBUTIONS TO SHAREHOLDERS: | | | | | | | | |
Net investment income | | | | | | | | |
Class A | | | — | | | | (2,783,146 | ) |
Class Y | | | — | | | | (488,284 | ) |
| | | | | | | | |
Total distributions | | | — | | | | (3,271,430 | ) |
| | | | | | | | |
NET DECREASE IN NET ASSETS FROM CAPITAL SHARE TRANSACTIONS (NOTE 11) | | | (73,117,486 | ) | | | (225,503,135 | ) |
| | | | | | | | |
Net decrease in net assets | | | (41,115,220 | ) | | | (369,327,611 | ) |
NET ASSETS | | | | | | | | |
Beginning of the period | | | 613,045,549 | | | | 982,373,160 | |
| | | | | | | | |
End of the period | | $ | 571,930,329 | | | $ | 613,045,549 | |
| | | | | | | | |
DISTRIBUTIONS IN EXCESS OF NET INVESTMENT INCOME/ACCUMULATED NET INVESTMENT (LOSS) | | $ | (938,808 | ) | | $ | (663,505 | ) |
| | | | | | | | |
See accompanying notes to financial statements.
85 |
| | | | | | | | |
| | | Harris Associates Large Cap Value Fund | |
| | | Six Months Ended
June 30, 2012
(Unaudited) | | | Year Ended
December 31,
2011 | |
FROM OPERATIONS: | | | | | | | | |
Net investment income | | $ | 336,357 | | | $ | 706,958 | |
Net realized gain on investments | | | 1,461,186 | | | | 2,453,610 | |
Net change in unrealized appreciation (depreciation) on investments | | | 8,308,399 | | | | (5,021,499 | ) |
| | | | | | | | |
Net increase (decrease) in net assets resulting from operations | | | 10,105,942 | | | | (1,860,931 | ) |
| | | | | | | | |
FROM DISTRIBUTIONS TO SHAREHOLDERS: | | | | | | | | |
Net investment income | | | | | | | | |
Class A | | | — | | | | (683,171 | ) |
Class B | | | — | | | | (1,388 | ) |
Class C | | | — | | | | (2,052 | ) |
Class Y | | | — | | | | (65,626 | ) |
| | | | | | | | |
Total distributions | | | — | | | | (752,237 | ) |
| | | | | | | | |
NET DECREASE IN NET ASSETS FROM CAPITAL SHARE TRANSACTIONS (NOTE 11) | | | (2,903,881 | ) | | | (14,370,952 | ) |
| | | | | | | | |
Net increase (decrease) in net assets | | | 7,202,061 | | | | (16,984,120 | ) |
NET ASSETS | | | | | | | | |
Beginning of the period | | | 124,553,233 | | | | 141,537,353 | |
| | | | | | | | |
End of the period | | $ | 131,755,294 | | | $ | 124,553,233 | |
| | | | | | | | |
DISTRIBUTIONS IN EXCESS OF NET INVESTMENT INCOME/ACCUMULATED NET INVESTMENT (LOSS) | | $ | (11,287 | ) | | $ | (347,644 | ) |
| | | | | | | | |
See accompanying notes to financial statements.
| 86
Statements of Changes in Net Assets (continued)
| | | | | | | | |
| | | Natixis Diversified Income Fund | |
| | | Six Months Ended
June 30, 2012
(Unaudited) | | | Year Ended
December 31,
2011 | |
FROM OPERATIONS: | | | | | | | | |
Net investment income | | $ | 1,263,472 | | | $ | 1,930,561 | |
Net realized gain on investments and foreign currency transactions | | | 1,438,945 | | | | 1,509,000 | |
Net change in unrealized appreciation (depreciation) on investments and foreign currency translations | | | 3,833,537 | | | | 824,723 | |
| | | | | | | | |
Net increase in net assets resulting from operations | | | 6,535,954 | | | | 4,264,284 | |
| | | | | | | | |
FROM DISTRIBUTIONS TO SHAREHOLDERS: | | | | | | | | |
Net investment income | | | | | | | | |
Class A | | | (714,366 | ) | | | (1,534,282 | ) |
Class C | | | (349,017 | ) | | | (889,904 | ) |
| | | | | | | | |
Total distributions | | | (1,063,383 | ) | | | (2,424,186 | ) |
| | | | | | | | |
NET INCREASE IN NET ASSETS FROM CAPITAL SHARE TRANSACTIONS (NOTE 11) | | | 24,313,718 | | | | 10,043,167 | |
| | | | | | | | |
Net increase in net assets | | | 29,786,289 | | | | 11,883,265 | |
NET ASSETS | | | | | | | | |
Beginning of the period | | | 75,025,187 | | | | 63,141,922 | |
| | | | | | | | |
End of the period | | $ | 104,811,476 | | | $ | 75,025,187 | |
| | | | | | | | |
UNDISTRIBUTED (DISTRIBUTIONS IN EXCESS OF) NET INVESTMENT INCOME | | $ | 87,607 | | | $ | (112,482 | ) |
| | | | | | | | |
See accompanying notes to financial statements.
87 |
| | | | | | | | |
| | | Natixis U.S. Multi-Cap Equity Fund | |
| | | Six Months Ended
June 30, 2012
(Unaudited) | | | Year Ended
December 31,
2011 | |
FROM OPERATIONS: | | | | | | | | |
Net investment income (loss) | | $ | 93,920 | | | $ | (942,993 | ) |
Net realized gain on investments and options written | | | 10,121,573 | | | | 48,680,541 | |
Net change in unrealized appreciation (depreciation) on investments | | | 18,579,347 | | | | (57,782,031 | ) |
| | | | | | | | |
Net increase (decrease) in net assets resulting from operations | | | 28,794,840 | | | | (10,044,483 | ) |
| | | | | | | | |
FROM DISTRIBUTIONS TO SHAREHOLDERS: | | | | | | | | |
Net realized capital gains | | | | | | | | |
Class A | | | — | | | | (10,196,143 | ) |
Class B | | | — | | | | (713,254 | ) |
Class C | | | — | | | | (1,213,844 | ) |
Class Y | | | — | | | | (68,334 | ) |
| | | | | | | | |
Total distributions | | | — | | | | (12,191,575 | ) |
| | | | | | | | |
NET DECREASE IN NET ASSETS FROM CAPITAL SHARE TRANSACTIONS (NOTE 11) | | | (16,440,368 | ) | | | (24,368,296 | ) |
| | | | | | | | |
Net increase (decrease) in net assets | | | 12,354,472 | | | | (46,604,354 | ) |
NET ASSETS | | | | | | | | |
Beginning of the period | | | 328,795,639 | | | | 375,399,993 | |
| | | | | | | | |
End of the period | | $ | 341,150,111 | | | $ | 328,795,639 | |
| | | | | | | | |
ACCUMULATED NET INVESTMENT (LOSS) | | $ | (293,572 | ) | | $ | (387,492 | ) |
| | | | | | | | |
See accompanying notes to financial statements.
| 88
Statements of Changes in Net Assets (continued)
| | | | | | | | |
| | | Vaughan Nelson Small Cap Value Fund | |
| | | Six Months Ended
June 30, 2012
(Unaudited) | | | Year Ended
December 31,
2011 | |
FROM OPERATIONS: | | | | | | | | |
Net investment income | | $ | 519,648 | | | $ | 2,383,062 | |
Net realized gain on investments | | | 15,154,406 | | | | 70,526,494 | |
Net change in unrealized appreciation (depreciation) on investments | | | 9,192,680 | | | | (91,520,839 | ) |
| | | | | | | | |
Net increase (decrease) in net assets resulting from operations | | | 24,866,734 | | | | (18,611,283 | ) |
| | | | | | | | |
FROM DISTRIBUTIONS TO SHAREHOLDERS: | | | | | | | | |
Net investment income | | | | | | | | |
Class A | | | — | | | | (1,089,250 | ) |
Class B | | | — | | | | (280 | ) |
Class Y | | | — | | | | (986,874 | ) |
Net realized capital gains | | | | | | | | |
Class A | | | (3,057,179 | ) | | | (49,424,710 | ) |
Class B | | | (70,338 | ) | | | (1,141,557 | ) |
Class C | | | (507,997 | ) | | | (7,191,157 | ) |
Class Y | | | (1,966,386 | ) | | | (29,760,594 | ) |
| | | | | | | | |
Total distributions | | | (5,601,900 | ) | | | (89,594,422 | ) |
| | | | | | | | |
NET DECREASE IN NET ASSETS FROM CAPITAL SHARE TRANSACTIONS (NOTE 11) | | | (37,180,575 | ) | | | (29,639,917 | ) |
| | | | | | | | |
Net decrease in net assets | | | (17,915,741 | ) | | | (137,845,622 | ) |
NET ASSETS | | | | | | | | |
Beginning of the period | | | 393,501,770 | | | | 531,347,392 | |
| | | | | | | | |
End of the period | | $ | 375,586,029 | | | $ | 393,501,770 | |
| | | | | | | | |
UNDISTRIBUTED (DISTRIBUTIONS IN EXCESS OF) NET INVESTMENT INCOME | | $ | 374,085 | | | $ | (145,563 | ) |
| | | | | | | | |
See accompanying notes to financial statements.
89 |
| | | | | | | | |
| | | Vaughan Nelson Value Opportunity Fund | |
| | | Six Months Ended
June 30, 2012
(Unaudited) | | | Year Ended
December 31,
2011 | |
FROM OPERATIONS: | | | | | | | | |
Net investment income | | $ | 417,129 | | | $ | 141,286 | |
Net realized gain on investments | | | 2,968,885 | | | | 4,262,752 | |
Net change in unrealized appreciation (depreciation) on investments | | | 3,250,401 | | | | (8,855,945 | ) |
| | | | | | | | |
Net increase (decrease) in net assets resulting from operations | | | 6,636,415 | | | | (4,451,907 | ) |
| | | | | | | | |
FROM DISTRIBUTIONS TO SHAREHOLDERS: | | | | | | | | |
Net investment income | | | | | | | | |
Class Y | | | — | | | | (112,793 | ) |
Net realized capital gains | | | | | | | | |
Class A | | | (56,516 | ) | | | (786,318 | ) |
Class C | | | (5,764 | ) | | | (66,223 | ) |
Class Y | | | (312,915 | ) | | | (4,052,804 | ) |
| | | | | | | | |
Total distributions | | | (375,195 | ) | | | (5,018,138 | ) |
| | | | | | | | |
NET INCREASE IN NET ASSETS FROM CAPITAL SHARE TRANSACTIONS (NOTE 11) | | | 44,839,758 | | | | 89,212,415 | |
| | | | | | | | |
Net increase in net assets | | | 51,100,978 | | | | 79,742,370 | |
NET ASSETS | | | | | | | | |
Beginning of the period | | | 132,549,139 | | | | 52,806,769 | |
| | | | | | | | |
End of the period | | $ | 183,650,117 | | | $ | 132,549,139 | |
| | | | | | | | |
UNDISTRIBUTED (DISTRIBUTIONS IN EXCESS OF) NET INVESTMENT INCOME | | $ | 389,502 | | | $ | (27,627 | ) |
| | | | | | | | |
See accompanying notes to financial statements.
| 90
Financial Highlights
For a share outstanding throughout each period.
| | | | | | | | | | | | | | | | | | | | | | | | | | | | |
| | | | | | Income (Loss) from Investment
Operations: | | | Less Distributions: | |
| | | Net asset
value,
beginning
of the
period | | | Net
investment
income
(loss) (a)(b) | | | Net realized
and
unrealized
gain (loss) | | | Total from
investment
operations | | | Dividends
from net
investment
income (b) | | | Distributions
from net
realized
capital
gains | | | Total
distributions (b) | |
CGM ADVISOR TARGETED EQUITY FUND | |
Class A | | | | | | | | | | | | | | | | | | | | | | | | | | | | |
6/30/2012(g) | | $ | 9.36 | | | $ | (0.00 | ) | | $ | 0.47 | | | $ | 0.47 | | | $ | — | | | $ | — | | | $ | — | |
12/31/2011 | | | 11.12 | | | | 0.05 | | | | (1.76 | ) | | | (1.71 | ) | | | (0.05 | ) | | | — | | | | (0.05 | ) |
12/31/2010 | | | 9.54 | | | | 0.05 | (h) | | | 1.58 | | | | 1.63 | | | | (0.05 | ) | | | — | | | | (0.05 | ) |
12/31/2009 | | | 7.66 | | | | 0.05 | | | | 1.88 | | | | 1.93 | | | | (0.05 | ) | | | — | | | | (0.05 | ) |
12/31/2008 | | | 13.01 | | | | 0.09 | | | | (4.94 | ) | | | (4.85 | ) | | | (0.06 | ) | | | (0.44 | ) | | | (0.50 | ) |
12/31/2007 | | | 10.70 | | | | 0.05 | | | | 3.54 | | | | 3.59 | | | | (0.13 | ) | | | (1.15 | ) | | | (1.28 | ) |
Class B | | | | | | | | | | | | | | | | | | | | | | | | | | | | |
6/30/2012(g) | | | 8.41 | | | | (0.04 | ) | | | 0.43 | | | | 0.39 | | | | — | | | | — | | | | — | |
12/31/2011 | | | 10.01 | | | | (0.03 | ) | | | (1.57 | ) | | | (1.60 | ) | | | — | | | | — | | | | — | |
12/31/2010 | | | 8.61 | | | | (0.02 | )(h) | | | 1.42 | | | | 1.40 | | | | (0.00 | ) | | | — | | | | (0.00 | ) |
12/31/2009 | | | 6.92 | | | | (0.01 | ) | | | 1.70 | | | | 1.69 | | | | — | | | | — | | | | — | |
12/31/2008 | | | 11.81 | | | | (0.00 | ) | | | (4.45 | ) | | | (4.45 | ) | | | (0.00 | ) | | | (0.44 | ) | | | (0.44 | ) |
12/31/2007 | | | 9.84 | | | | (0.04 | ) | | | 3.24 | | | | 3.20 | | | | (0.08 | ) | | | (1.15 | ) | | | (1.23 | ) |
Class C | | | | | | | | | | | | | | | | | | | | | | | | | | | | |
6/30/2012(g) | | | 8.37 | | | | (0.04 | ) | | | 0.42 | | | | 0.38 | | | | — | | | | — | | | | — | |
12/31/2011 | | | 9.96 | | | | (0.03 | ) | | | (1.56 | ) | | | (1.59 | ) | | | — | | | | — | | | | — | |
12/31/2010 | | | 8.57 | | | | (0.02 | )(h) | | | 1.41 | | | | 1.39 | | | | (0.00 | ) | | | — | | | | (0.00 | ) |
12/31/2009 | | | 6.89 | | | | (0.01 | ) | | | 1.69 | | | | 1.68 | | | | (0.00 | ) | | | — | | | | (0.00 | ) |
12/31/2008 | | | 11.79 | | | | 0.02 | | | | (4.46 | ) | | | (4.44 | ) | | | (0.02 | ) | | | (0.44 | ) | | | (0.46 | ) |
12/31/2007 | | | 9.84 | | | | (0.03 | ) | | | 3.22 | | | | 3.19 | | | | (0.09 | ) | | | (1.15 | ) | | | (1.24 | ) |
Class Y | | | | | | | | | | | | | | | | | | | | | | | | | | | | |
6/30/2012(g) | | | 9.59 | | | | 0.01 | | | | 0.48 | | | | 0.49 | | | | — | | | | — | | | | — | |
12/31/2011 | | | 11.40 | | | | 0.07 | | | | (1.80 | ) | | | (1.73 | ) | | | (0.08 | ) | | | — | | | | (0.08 | ) |
12/31/2010 | | | 9.78 | | | | 0.07 | (h) | | | 1.63 | | | | 1.70 | | | | (0.08 | ) | | | — | | | | (0.08 | ) |
12/31/2009 | | | 7.84 | | | | 0.06 | | | | 1.96 | | | | 2.02 | | | | (0.08 | ) | | | — | | | | (0.08 | ) |
12/31/2008 | | | 13.32 | | | | 0.13 | | | | (5.09 | ) | | | (4.96 | ) | | | (0.08 | ) | | | (0.44 | ) | | | (0.52 | ) |
12/31/2007 | | | 10.93 | | | | 0.09 | | | | 3.61 | | | | 3.70 | | | | (0.16 | ) | | | (1.15 | ) | | | (1.31 | ) |
| (a) | Per share net investment income (loss) has been calculated using the average shares outstanding during the period. |
| (b) | Amount rounds to less than $0.01 per share, if applicable. |
| (c) | Had certain expenses not been waived/reimbursed during the period, if applicable, total returns would have been lower. |
| (d) | A sales charge for Class A shares and a contingent deferred sales charge for Class B and Class C shares are not reflected in total return calculations. Periods less than one year, if applicable, are not annualized. |
See accompanying notes to financial statements.
91 |
| | | | | | | | | | | | | | | | | | | | | | | | | | | | | | |
| | | | | | | | | | | | |
Ratios to Average Net Assets: | | | | |
Redemption
fees (b) | | |
Net asset
value,
end of
the period | | | Total
return
(%) (c)(d) | | | Net assets,
end of
the period
(000’s) | | | Net
expenses
(%) (e)(f) | | | Gross
expenses
(%) (f) | | | Net investment
income (loss)
(%) (f) | | | Portfolio
turnover
rate (%) | |
| | | | | | | | | | | | | | | | | | | | | | | | | | | | | | |
| | | | | | | | | | | | | | | | | | | | | | | | | | | | | | |
| $ | — | | | $ | 9.83 | | | | 5.02 | | | $ | 470,522 | | | | 1.17 | | | | 1.17 | | | | (0.05 | ) | | | 90 | |
| | — | | | | 9.36 | | | | (15.36 | ) | | | 503,330 | | | | 1.13 | | | | 1.13 | | | | 0.45 | | | | 236 | |
| | — | | | | 11.12 | | | | 17.14 | | | | 753,518 | | | | 1.16 | | | | 1.16 | | | | 0.52 | (h) | | | 146 | |
| | — | | | | 9.54 | | | | 25.19 | | | | 693,386 | | | | 1.19 | | | | 1.19 | | | | 0.69 | | | | 170 | |
| | 0.00 | (i) | | | 7.66 | | | | (38.36 | ) | | | 796,146 | | | | 1.10 | | | | 1.10 | | | | 0.83 | | | | 211 | |
| | 0.00 | | | | 13.01 | | | | 34.42 | | | | 826,867 | | | | 1.17 | | | | 1.17 | | | | 0.45 | | | | 179 | |
| | | | | | | | | | | | | | | | | | | | | | | | | | | | | | |
| | — | | | | 8.80 | | | | 4.64 | | | | 4,007 | | | | 1.92 | | | | 1.92 | | | | (0.81 | ) | | | 90 | |
| | — | | | | 8.41 | | | | (15.98 | ) | | | 5,296 | | | | 1.88 | | | | 1.88 | | | | (0.32 | ) | | | 236 | |
| | — | | | | 10.01 | | | | 16.26 | | | | 9,934 | | | | 1.91 | | | | 1.91 | | | | (0.28 | )(h) | | | 146 | |
| | — | | | | 8.61 | | | | 24.42 | | | | 12,401 | | | | 1.94 | | | | 1.94 | | | | (0.11 | ) | | | 170 | |
| | 0.00 | (i) | | | 6.92 | | | | (38.90 | ) | | | 13,971 | | | | 1.85 | | | | 1.85 | | | | (0.03 | ) | | | 211 | |
| | 0.00 | | | | 11.81 | | | | 33.41 | | | | 32,297 | | | | 1.92 | | | | 1.92 | | | | (0.34 | ) | | | 179 | |
| | | | | | | | | | | | | | | | | | | | | | | | | | | | | | |
| | — | | | | 8.75 | | | | 4.54 | | | | 41,255 | | | | 1.92 | | | | 1.92 | | | | (0.80 | ) | | | 90 | |
| | — | | | | 8.37 | | | | (15.96 | ) | | | 47,416 | | | | 1.88 | | | | 1.88 | | | | (0.32 | ) | | | 236 | |
| | — | | | | 9.96 | | | | 16.22 | | | | 81,291 | | | | 1.91 | | | | 1.91 | | | | (0.23 | )(h) | | | 146 | |
| | — | | | | 8.57 | | | | 24.42 | | | | 75,098 | | | | 1.95 | | | | 1.95 | | | | (0.14 | ) | | | 170 | |
| | 0.00 | (i) | | | 6.89 | | | | (38.85 | ) | | | 59,544 | | | | 1.85 | | | | 1.85 | | | | 0.17 | | | | 211 | |
| | 0.00 | | | | 11.79 | | | | 33.47 | | | | 19,753 | | | | 1.93 | | | | 1.93 | | | | (0.24 | ) | | | 179 | |
| | | | | | | | | | | | | | | | | | | | | | | | | | | | | | |
| | — | | | | 10.08 | | | | 5.11 | | | | 56,146 | | | | 0.92 | | | | 0.92 | | | | 0.21 | | | | 90 | |
| | — | | | | 9.59 | | | | (15.16 | ) | | | 57,003 | | | | 0.87 | | | | 0.87 | | | | 0.62 | | | | 236 | |
| | — | | | | 11.40 | | | | 17.39 | | | | 137,631 | | | | 0.91 | | | | 0.91 | | | | 0.69 | (h) | | | 146 | |
| | — | | | | 9.78 | | | | 25.75 | | | | 265,441 | | | | 0.94 | | | | 0.94 | | | | 0.64 | | | | 170 | |
| | 0.00 | (i) | | | 7.84 | | | | (38.28 | ) | | | 44,240 | | | | 0.85 | | | | 0.85 | | | | 1.21 | | | | 211 | |
| | 0.00 | | | | 13.32 | | | | 34.75 | | | | 17,520 | | | | 0.90 | | | | 0.90 | | | | 0.74 | | | | 179 | |
| (e) | The investment adviser and/or administrator agreed to waive its fees and/or reimburse a portion of the Fund’s expenses during the period. Without this waiver/reimbursement, if applicable, expenses would have been higher. |
| (f) | Computed on an annualized basis for periods less than one year, if applicable. |
| (g) | For the six months ended June 30, 2012 (Unaudited). |
| (h) | Includes a non-recurring dividend. Without this dividend, net investment income (loss) per share would have been $0.02, $(0.05), $(0.05) and $0.05 for Class A, Class B, Class C and Class Y shares, respectively, and the ratio of net investment income (loss) to average net assets would have been 0.23%, (0.53)%, (0.52)% and 0.48% for Class A, Class B, Class C and Class Y shares, respectively. |
| (i) | Effective June 2, 2008, redemption fees were eliminated. |
See accompanying notes to financial statements.
| 92
Financial Highlights (continued)
For a share outstanding throughout each period.
| | | | | | | | | | | | | | | | | | | | | | | | | | | | |
| | | | | | Income (Loss) from Investment
Operations: | | | Less Distributions: | |
| | | Net asset
value,
beginning
of the
period | | | Net
investment
income
(loss) (a) | | | Net realized
and
unrealized
gain (loss) | | | Total from
investment
operations | | | Dividends
from net
investment
income (b) | | | Distributions
from net
realized
capital
gains | | | Total
distributions (b) | |
HARRIS ASSOCIATES LARGE CAP VALUE FUND | |
Class A | | | | | | | | | | | | | | | | | | | | | | | | | | | | |
6/30/2012(g) | | $ | 13.86 | | | $ | 0.04 | | | $ | 1.08 | | | $ | 1.12 | | | $ | — | | | $ | — | | | $ | — | |
12/31/2011 | | | 14.17 | | | | 0.08 | | | | (0.30 | ) | | | (0.22 | ) | | | (0.09 | ) | | | — | | | | (0.09 | ) |
12/31/2010 | | | 12.58 | | | | 0.05 | | | | 1.60 | | | | 1.65 | | | | (0.06 | ) | | | — | | | | (0.06 | ) |
12/31/2009 | | | 8.77 | | | | 0.05 | (i) | | | 3.81 | | | | 3.86 | | | | (0.05 | ) | | | — | | | | (0.05 | ) |
12/31/2008 | | | 14.97 | | | | 0.13 | | | | (6.20 | ) | | | (6.07 | ) | | | (0.13 | ) | | | — | | | | (0.13 | ) |
12/31/2007 | | | 15.49 | | | | 0.05 | | | | (0.48 | )(j) | | | (0.43 | ) | | | (0.09 | ) | | | — | | | | (0.09 | ) |
Class B | | | | | | | | | | | | | | | | | | | | | | | | | | | | |
6/30/2012(g) | | | 12.76 | | | | (0.02 | ) | | | 1.01 | | | | 0.99 | | | | — | | | | — | | | | — | |
12/31/2011 | | | 13.07 | | | | (0.03 | ) | | | (0.28 | ) | | | (0.31 | ) | | | (0.00 | ) | | | — | | | | (0.00 | ) |
12/31/2010 | | | 11.65 | | | | (0.05 | ) | | | 1.48 | | | | 1.43 | | | | (0.01 | ) | | | — | | | | (0.01 | ) |
12/31/2009 | | | 8.16 | | | | (0.02 | )(i) | | | 3.52 | | | | 3.50 | | | | (0.01 | ) | | | — | | | | (0.01 | ) |
12/31/2008 | | | 13.84 | | | | 0.03 | | | | (5.70 | ) | | | (5.67 | ) | | | (0.01 | ) | | | — | | | | (0.01 | ) |
12/31/2007 | | | 14.39 | | | | (0.06 | ) | | | (0.45 | )(j) | | | (0.51 | ) | | | (0.04 | ) | | | — | | | | (0.04 | ) |
Class C | | | | | | | | | | | | | | | | | | | | | | | | | | | | |
6/30/2012(g) | | | 12.72 | | | | (0.02 | ) | | | 1.00 | | | | 0.98 | | | | — | | | | — | | | | — | |
12/31/2011 | | | 13.02 | | | | (0.03 | ) | | | (0.27 | ) | | | (0.30 | ) | | | (0.00 | ) | | | — | | | | (0.00 | ) |
12/31/2010 | | | 11.61 | | | | (0.05 | ) | | | 1.47 | | | | 1.42 | | | | (0.01 | ) | | | — | | | | (0.01 | ) |
12/31/2009 | | | 8.13 | | | | (0.02 | )(i) | | | 3.51 | | | | 3.49 | | | | (0.01 | ) | | | — | | | | (0.01 | ) |
12/31/2008 | | | 13.82 | | | | 0.03 | | | | (5.69 | ) | | | (5.66 | ) | | | (0.03 | ) | | | — | | | | (0.03 | ) |
12/31/2007 | | | 14.37 | | | | (0.06 | ) | | | (0.45 | )(j) | | | (0.51 | ) | | | (0.04 | ) | | | — | | | | (0.04 | ) |
Class Y | | | | | | | | | | | | | | | | | | | | | | | | | | | | |
6/30/2012(g) | | | 14.32 | | | | 0.06 | | | | 1.12 | | | | 1.18 | | | | — | | | | — | | | | — | |
12/31/2011 | | | 14.65 | | | | 0.12 | | | | (0.33 | ) | | | (0.21 | ) | | | (0.12 | ) | | | — | | | | (0.12 | ) |
12/31/2010 | | | 12.99 | | | | 0.08 | | | | 1.67 | | | | 1.75 | | | | (0.09 | ) | | | — | | | | (0.09 | ) |
12/31/2009 | | | 9.05 | | | | 0.08 | (i) | | | 3.93 | | | | 4.01 | | | | (0.07 | ) | | | — | | | | (0.07 | ) |
12/31/2008 | | | 15.47 | | | | 0.19 | | | | (6.42 | ) | | | (6.23 | ) | | | (0.19 | ) | | | — | | | | (0.19 | ) |
12/31/2007 | | | 16.01 | | | | 0.12 | | | | (0.51 | )(j) | | | (0.39 | ) | | | (0.15 | ) | | | — | | | | (0.15 | ) |
| (a) | Per share net investment income (loss) has been calculated using the average shares outstanding during the period. |
| (b) | Amount rounds to less than $0.01 per share, if applicable. |
| (c) | A sales charge for Class A shares and a contingent deferred sales charge for Class B and Class C shares are not reflected in total return calculations. Periods less than one year, if applicable, are not annualized. |
| (d) | Had certain expenses not been waived/reimbursed during the period, if applicable, total returns would have been lower. |
See accompanying notes to financial statements.
93 |
| | | | | | | | | | | | | | | | | | | | | | | | | | | | | | |
| | | | | | | | | | | | |
Ratios to Average Net Assets: | | | | |
Increase from
regulatory
settlements (b) | | |
Net asset
value,
end of
the period | | | Total
return
(%) (c)(d) | | | Net assets,
end of
the period
(000’s) | | | Net
expenses
(%) (e)(f) | | | Gross
expenses
(%) (f) | | | Net investment
income (loss)
(%) (f) | | | Portfolio
turnover
rate (%) | |
| | | | | | | | | | | | | | | | | | | | | | | | | | | | | | |
| | | | | | | | | | | | | | | | | | | | | | | | | | | | | | |
| $ | — | | | $ | 14.98 | | | | 8.08 | | | $ | 111,714 | | | | 1.30 | | | | 1.33 | | | | 0.53 | | | | 18 | |
| | — | | | | 13.86 | | | | (1.56 | ) | | | 107,978 | | | | 1.30 | (h) | | | 1.30 | (h) | | | 0.57 | | | | 36 | |
| | — | | | | 14.17 | | | | 13.08 | | | | 118,938 | | | | 1.30 | | | | 1.39 | | | | 0.36 | | | | 32 | |
| | 0.00 | | | | 12.58 | | | | 44.03 | | | | 113,309 | | | | 1.30 | | | | 1.50 | | | | 0.53 | | | | 131 | |
| | — | | | | 8.77 | | | | (40.45 | ) | | | 85,761 | | | | 1.28 | | | | 1.28 | | | | 1.04 | | | | 38 | |
| | — | | | | 14.97 | | | | (2.94 | ) | | | 172,468 | | | | 1.28 | (k)(l) | | | 1.28 | (k) | | | 0.35 | | | | 30 | |
| | | | | | | | | | | | | | | | | | | | | | | | | | | | | | |
| | — | | | | 13.75 | | | | 7.76 | | | | 2,631 | | | | 2.05 | | | | 2.07 | | | | (0.23 | ) | | | 18 | |
| | — | | | | 12.76 | | | | (2.34 | ) | | | 3,341 | | | | 2.05 | (h) | | | 2.05 | (h) | | | (0.21 | ) | | | 36 | |
| | — | | | | 13.07 | | | | 12.31 | | | | 5,614 | | | | 2.05 | | | | 2.13 | | | | (0.40 | ) | | | 32 | |
| | 0.00 | | | | 11.65 | | | | 42.88 | | | | 7,864 | | | | 2.05 | | | | 2.25 | | | | (0.22 | ) | | | 131 | |
| | — | | | | 8.16 | | | | (40.87 | ) | | | 8,191 | | | | 2.03 | | | | 2.04 | | | | 0.25 | | | | 38 | |
| | — | | | | 13.84 | | | | (3.68 | ) | | | 23,916 | | | | 2.04 | (k)(l) | | | 2.04 | (k) | | | (0.44 | ) | | | 30 | |
| | | | | | | | | | | | | | | | | | | | | | | | | | | | | | |
| | — | | | | 13.70 | | | | 7.70 | | | | 6,000 | | | | 2.05 | | | | 2.08 | | | | (0.22 | ) | | | 18 | |
| | — | | | | 12.72 | | | | (2.28 | ) | | | 5,667 | | | | 2.05 | (h) | | | 2.05 | (h) | | | (0.19 | ) | | | 36 | |
| | — | | | | 13.02 | | | | 12.26 | | | | 7,399 | | | | 2.05 | | | | 2.14 | | | | (0.39 | ) | | | 32 | |
| | 0.00 | | | | 11.61 | | | | 42.91 | | | | 7,208 | | | | 2.05 | | | | 2.25 | | | | (0.22 | ) | | | 131 | |
| | — | | | | 8.13 | | | | (40.90 | ) | | | 6,222 | | | | 2.03 | | | | 2.03 | | | | 0.26 | | | | 38 | |
| | — | | | | 13.82 | | | | (3.69 | ) | | | 15,616 | | | | 2.04 | (k)(l) | | | 2.04 | (k) | | | (0.41 | ) | | | 30 | |
| | | | | | | | | | | | | | | | | | | | | | | | | | | | | | |
| | — | | | | 15.50 | | | | 8.24 | | | | 11,411 | | | | 1.05 | | | | 1.08 | | | | 0.81 | | | | 18 | |
| | — | | | | 14.32 | | | | (1.40 | ) | | | 7,567 | | | | 1.05 | (h) | | | 1.05 | (h) | | | 0.80 | | | | 36 | |
| | — | | | | 14.65 | | | | 13.47 | | | | 9,586 | | | | 1.05 | | | | 1.14 | | | | 0.61 | | | | 32 | |
| | 0.00 | | | | 12.99 | | | | 44.39 | | | | 7,450 | | | | 1.05 | | | | 1.12 | | | | 0.77 | | | | 131 | |
| | — | | | | 9.05 | | | | (40.18 | ) | | | 5,842 | | | | 0.84 | | | | 0.84 | | | | 1.47 | | | | 38 | |
| | — | | | | 15.47 | | | | (2.59 | ) | | | 11,840 | | | | 0.91 | (l) | | | 0.91 | | | | 0.72 | | | | 30 | |
| (e) | The investment adviser and/or administrator agreed to waive its fees and/or reimburse a portion of the Fund’s expenses during the period. Without this waiver/reimbursement, if applicable, expenses would have been higher. |
| (f) | Computed on an annualized basis for periods less than one year, if applicable. |
| (g) | For the six months ended June 30, 2012 (Unaudited). |
| (h) | Includes fee/expense recovery of 0.01%. |
| (i) | Includes a non-recurring dividend of $0.01 per share. |
| (j) | Includes a litigation payment of $0.02 per share. |
| (k) | Includes fee/expense recovery of less than 0.01%, 0.02% and 0.01% for Class A, B and C, respectively. |
| (l) | Effect of voluntary waiver of expenses by adviser was less than 0.005%. |
See accompanying notes to financial statements.
| 94
Financial Highlights (continued)
For a share outstanding throughout each period.
| | | | | | | | | | | | | | | | | | | | | | | | | | | | |
| | | | | | Income (Loss) from Investment
Operations: | | | Less Distributions: | |
| | | Net asset
value,
beginning
of the
period | | | Net
investment
income
(loss) (a) | | | Net realized
and
unrealized
gain (loss) | | | Total from
investment
operations | | | Dividends
from net
investment
income | | | Distributions
from net
realized
capital
gains | | | Total
distributions | |
NATIXIS DIVERSIFIED INCOME FUND | |
Class A | | | | | | | | | | | | | | | | | | | | | | | | | | | | |
6/30/2012(f) | | $ | 10.74 | | | $ | 0.18 | | | $ | 0.69 | | | $ | 0.87 | | | $ | (0.15 | ) | | $ | — | | | $ | (0.15 | ) |
12/31/2011 | | | 10.41 | | | | 0.34 | | | | 0.40 | | | | 0.74 | | | | (0.41 | ) | | | — | | | | (0.41 | ) |
12/31/2010 | | | 9.22 | | | | 0.34 | | | | 1.18 | | | | 1.52 | | | | (0.33 | ) | | | — | | | | (0.33 | ) |
12/31/2009 | | | 7.18 | | | | 0.36 | | | | 1.97 | | | | 2.33 | | | | (0.29 | ) | | | — | | | | (0.29 | ) |
12/31/2008 | | | 10.26 | | | | 0.47 | | | | (2.96 | ) | | | (2.49 | ) | | | (0.49 | ) | | | (0.10 | ) | | | (0.59 | ) |
12/31/2007 | | | 11.15 | | | | 0.41 | | | | (0.71 | ) | | | (0.30 | ) | | | (0.45 | ) | | | (0.14 | ) | | | (0.59 | ) |
Class C | | | | | | | | | | | | | | | | | | | | | | | | | | | | |
6/30/2012(f) | | | 10.71 | | | | 0.13 | | | | 0.70 | | | | 0.83 | | | | (0.11 | ) | | | — | | | | (0.11 | ) |
12/31/2011 | | | 10.39 | | | | 0.26 | | | | 0.39 | | | | 0.65 | | | | (0.33 | ) | | | — | | | | (0.33 | ) |
12/31/2010 | | | 9.20 | | | | 0.27 | | | | 1.17 | | | | 1.44 | | | | (0.25 | ) | | | — | | | | (0.25 | ) |
12/31/2009 | | | 7.17 | | | | 0.30 | | | | 1.97 | | | | 2.27 | | | | (0.24 | ) | | | — | | | | (0.24 | ) |
12/31/2008 | | | 10.24 | | | | 0.40 | | | | (2.95 | ) | | | (2.55 | ) | | | (0.42 | ) | | | (0.10 | ) | | | (0.52 | ) |
12/31/2007 | | | 11.12 | | | | 0.33 | | | | (0.70 | ) | | | (0.37 | ) | | | (0.37 | ) | | | (0.14 | ) | | | (0.51 | ) |
| (a) | Per share net investment income (loss) has been calculated using the average shares outstanding during the period. |
| (b) | A sales charge for Class A shares and a contingent deferred sales charge for Class C shares are not reflected in total return calculations. Periods less than one year, if applicable, are not annualized. |
| (c) | Had certain expenses not been waived/reimbursed during the period, if applicable, total returns would have been lower. |
| (d) | The investment adviser and/or administrator agreed to waive its fees and/or reimburse a portion of the Fund’s expenses during the period. Without this waiver/reimbursement, if applicable, expenses would have been higher. |
See accompanying notes to financial statements.
95 |
| | | | | | | | | | | | | | | | | | | | | | | | | | | | | | |
| | | | | | | | | | | | |
Ratios to Average Net Assets: | | | | |
Increase
from
regulatory
settlements | | |
Net asset
value,
end of
the period | | | Total
return
(%) (b)(c) | | | Net assets,
end of
the period
(000’s) | | | Net
expenses
(%) (d)(e) | | | Gross
expenses
(%) (e) | | | Net investment
income (loss)
(%) (e) | | | Portfolio
turnover
rate (%) | |
| | | | | | | | | | | | | | | | | | | | | | | | | | | | | | |
| | | | | | | | | | | | | | | | | | | | | | | | | | | | | | |
| $ | — | | | $ | 11.46 | | | | 8.11 | | | $ | 64,586 | | | | 1.10 | | | | 1.10 | | | | 3.17 | | | | 20 | |
| | — | | | | 10.74 | | | | 7.21 | | | | 45,211 | | | | 1.13 | | | | 1.13 | | | | 3.17 | | | | 20 | |
| | — | | | | 10.41 | | | | 16.73 | | | | 35,787 | | | | 1.19 | | | | 1.19 | | | | 3.51 | | | | 28 | |
| | — | | | | 9.22 | | | | 33.32 | | | | 33,796 | | | | 1.21 | | | | 1.21 | | | | 4.67 | | | | 22 | |
| | — | | | | 7.18 | | | | (25.26 | ) | | | 31,709 | | | | 1.09 | | | | 1.10 | | | | 5.10 | | | | 23 | |
| | — | | | | 10.26 | | | | (2.80 | ) | | | 54,733 | | | | 1.08 | (g) | | | 1.09 | (g) | | | 3.76 | | | | 50 | |
| | | | | | | | | | | | | | | | | | | | | | | | | | | | | | |
| | — | | | | 11.43 | | | | 7.77 | | | | 40,225 | | | | 1.85 | | | | 1.85 | | | | 2.41 | | | | 20 | |
| | — | | | | 10.71 | | | | 6.33 | | | | 29,814 | | | | 1.88 | | | | 1.88 | | | | 2.42 | | | | 20 | |
| | — | | | | 10.39 | | | | 15.90 | | | | 27,355 | | | | 1.94 | | | | 1.94 | | | | 2.76 | | | | 28 | |
| | — | | | | 9.20 | | | | 32.24 | | | | 25,301 | | | | 1.96 | | | | 1.96 | | | | 3.90 | | | | 22 | |
| | — | | | | 7.17 | | | | (25.78 | ) | | | 30,336 | | | | 1.84 | | | | 1.84 | | | | 4.30 | | | | 23 | |
| | — | | | | 10.24 | | | | (3.52 | ) | | | 70,179 | | | | 1.83 | (g) | | | 1.84 | (g) | | | 3.00 | | | | 50 | |
| (e) | Computed on an annualized basis for periods less than one year, if applicable. |
| (f) | For the six months ended June 30, 2012 (Unaudited). |
| (g) | Includes fee/expense recovery of 0.01%. |
See accompanying notes to financial statements.
| 96
Financial Highlights (continued)
For a share outstanding throughout each period.
| | | | | | | | | | | | | | | | | | | | | | | | | | | | |
| | | | | | Income (Loss) from Investment
Operations: | | | Less Distributions: | |
| | | Net asset
value,
beginning
of the
period | | | Net
investment
income
(loss) (a) | | | Net realized
and
unrealized
gain (loss) | | | Total from
investment
operations | | | Dividends
from net
investment
income | | | Distributions
from net
realized
capital
gains | | | Total
distributions | |
NATIXIS U.S. MULTI-CAP EQUITY FUND | |
Class A | | | | | | | | | | | | | | | | | | | | | | | | | | | | |
6/30/2012(g) | | $ | 23.56 | | | $ | 0.02 | | | $ | 2.06 | | | $ | 2.08 | | | $ | — | | | $ | — | | | $ | — | |
12/31/2011 | | | 25.17 | | | | (0.04 | ) | | | (0.69 | ) | | | (0.73 | ) | | | — | | | | (0.88 | ) | | | (0.88 | ) |
12/31/2010 | | | 20.68 | | | | 0.03 | (i) | | | 4.50 | | | | 4.53 | | | | (0.04 | ) | | | — | | | | (0.04 | ) |
12/31/2009 | | | 15.16 | | | | (0.01 | ) | | | 5.53 | | | | 5.52 | | | | — | | | | — | | | | — | |
12/31/2008 | | | 25.76 | | | | 0.02 | (j) | | | (10.20 | ) | | | (10.18 | ) | | | — | | | | (0.42 | ) | | | (0.42 | ) |
12/31/2007 | | | 22.94 | | | | (0.06 | ) | | | 3.19 | | | | 3.13 | | | | — | | | | (0.31 | ) | | | (0.31 | ) |
Class B | | | | | | | | | | | | | | | | | | | | | | | | | | | | |
6/30/2012(g) | | | 19.93 | | | | (0.07 | ) | | | 1.76 | | | | 1.69 | | | | — | | | | — | | | | — | |
12/31/2011 | | | 21.60 | | | | (0.21 | ) | | | (0.58 | ) | | | (0.79 | ) | | | — | | | | (0.88 | ) | | | (0.88 | ) |
12/31/2010 | | | 17.85 | | | | (0.12 | )(i) | | | 3.87 | | | | 3.75 | | | | — | | | | — | | | | — | |
12/31/2009 | | | 13.19 | | | | (0.12 | ) | | | 4.78 | | | | 4.66 | | | | — | | | | — | | | | — | |
12/31/2008 | | | 22.63 | | | | (0.13 | )(j) | | | (8.89 | ) | | | (9.02 | ) | | | — | | | | (0.42 | ) | | | (0.42 | ) |
12/31/2007 | | | 20.33 | | | | (0.22 | ) | | | 2.83 | | | | 2.61 | | | | — | | | | (0.31 | ) | | | (0.31 | ) |
Class C | | | | | | | | | | | | | | | | | | | | | | | | | | | | |
6/30/2012(g) | | | 19.94 | | | | (0.06 | ) | | | 1.75 | | | | 1.69 | | | | — | | | | — | | | | — | |
12/31/2011 | | | 21.61 | | | | (0.20 | ) | | | (0.59 | ) | | | (0.79 | ) | | | — | | | | (0.88 | ) | | | (0.88 | ) |
12/31/2010 | | | 17.86 | | | | (0.12 | )(i) | | | 3.87 | | | | 3.75 | | | | — | | | | — | | | | — | |
12/31/2009 | | | 13.19 | | | | (0.12 | ) | | | 4.79 | | | | 4.67 | | | | — | | | | — | | | | — | |
12/31/2008 | | | 22.65 | | | | (0.13 | )(j) | | | (8.91 | ) | | | (9.04 | ) | | | — | | | | (0.42 | ) | | | (0.42 | ) |
12/31/2007 | | | 20.36 | | | | (0.22 | ) | | | 2.82 | | | | 2.60 | | | | — | | | | (0.31 | ) | | | (0.31 | ) |
Class Y | | | | | | | | | | | | | | | | | | | | | | | | | | | | |
6/30/2012(g) | | | 25.52 | | | | 0.06 | | | | 2.24 | | | | 2.30 | | | | — | | | | — | | | | — | |
12/31/2011 | | | 27.12 | | | | 0.04 | | | | (0.76 | ) | | | (0.72 | ) | | | — | | | | (0.88 | ) | | | (0.88 | ) |
12/31/2010 | | | 22.27 | | | | 0.05 | (i) | | | 4.90 | | | | 4.95 | | | | (0.10 | ) | | | — | | | | (0.10 | ) |
12/31/2009 | | | 16.29 | | | | 0.04 | | | | 5.94 | | | | 5.98 | | | | — | | | | — | | | | — | |
12/31/2008 | | | 27.58 | | | | 0.07 | (j) | | | (10.94 | ) | | | (10.87 | ) | | | — | | | | (0.42 | ) | | | (0.42 | ) |
12/31/2007 | | | 24.45 | | | | 0.03 | | | | 3.41 | | | | 3.44 | | | | — | | | | (0.31 | ) | | | (0.31 | ) |
| (a) | Per share net investment income (loss) has been calculated using the average shares outstanding during the period. |
| (b) | Amount rounds to less than $0.01 per share, if applicable. |
| (c) | Had certain expenses not been waived/reimbursed during the period, if applicable, total returns would have been lower. |
| (d) | A sales charge for Class A shares and a contingent deferred sales charge for Class B and Class C shares are not reflected in total return calculations. Periods less than one year, if applicable, are not annualized. |
| (e) | The investment adviser and/or administrator agreed to waive its fees and/or reimburse a portion of the Fund’s expenses during the period. Without this waiver/reimbursement, if applicable, expenses would have been higher. |
See accompanying notes to financial statements.
97 |
| | | | | | | | | | | | | | | | | | | | | | | | | | | | | | |
| | | | | | | | | | | | |
Ratios to Average Net Assets: | | | | |
Increase from
regulatory
settlements (b) | | |
Net asset
value,
end of
the period | | | Total
return
(%) (c)(d) | | | Net assets,
end of
the period
(000’s) | | | Net
expenses
(%) (e)(f) | | | Gross
expenses
(%) (f) | | | Net investment
income (loss)
(%) (f) | | | Portfolio
turnover
rate (%) | |
| | | | | | | | | | | | | | | | | | | | | | | | | | | | | | |
| | | | | | | | | | | | | | | | | | | | | | | | | | | | | | |
| $ | — | | | $ | 25.64 | | | | 8.83 | | | $ | 288,131 | | | | 1.30 | | | | 1.35 | | | | 0.15 | | | | 29 | |
| | — | | | | 23.56 | | | | (2.79 | ) | | | 281,467 | | | | 1.34 | (h) | | | 1.38 | | | | (0.15 | ) | | | 97 | |
| | 0.00 | | | | 25.17 | | | | 21.90 | | | | 314,384 | | | | 1.40 | | | | 1.50 | | | | 0.14 | (i) | | | 79 | |
| | — | | | | 20.68 | | | | 36.41 | | | | 280,846 | | | | 1.40 | | | | 1.56 | | | | (0.05 | ) | | | 115 | |
| | — | | | | 15.16 | | | | (40.05 | ) | | | 228,549 | | | | 1.43 | | | | 1.43 | | | | 0.08 | | | | 110 | |
| | — | | | | 25.76 | | | | 13.69 | | | | 407,228 | | | | 1.47 | | | | 1.47 | | | | (0.24 | ) | | | 82 | |
| | | | | | | | | | | | | | | | | | | | | | | | | | | | | | |
| | — | | | | 21.62 | | | | 8.48 | | | | 13,465 | | | | 2.05 | | | | 2.10 | | | | (0.61 | ) | | | 29 | |
| | — | | | | 19.93 | | | | (3.53 | ) | | | 16,820 | | | | 2.10 | (h) | | | 2.13 | | | | (0.94 | ) | | | 97 | |
| | 0.00 | | | | 21.60 | | | | 21.01 | | | | 28,787 | | | | 2.15 | | | | 2.25 | | | | (0.66 | )(i) | | | 79 | |
| | — | | | | 17.85 | | | | 35.33 | | | | 37,406 | | | | 2.15 | | | | 2.31 | | | | (0.80 | ) | | | 115 | |
| | — | | | | 13.19 | | | | (40.47 | ) | | | 40,868 | | | | 2.18 | | | | 2.19 | | | | (0.70 | ) | | | 110 | |
| | — | | | | 22.63 | | | | 12.83 | | | | 119,028 | | | | 2.21 | | | | 2.21 | | | | (1.00 | ) | | | 82 | |
| | | | | | | | | | | | | | | | | | | | | | | | | | | | | | |
| | — | | | | 21.63 | | | | 8.47 | | | | 29,906 | | | | 2.05 | | | | 2.10 | | | | (0.60 | ) | | | 29 | |
| | — | | | | 19.94 | | | | (3.53 | ) | | | 28,462 | | | | 2.09 | (h) | | | 2.13 | | | | (0.90 | ) | | | 97 | |
| | 0.00 | | | | 21.61 | | | | 21.00 | | | | 30,912 | | | | 2.15 | | | | 2.25 | | | | (0.62 | )(i) | | | 79 | |
| | — | | | | 17.86 | | | | 35.41 | | | | 28,580 | | | | 2.15 | | | | 2.31 | | | | (0.80 | ) | | | 115 | |
| | — | | | | 13.19 | | | | (40.53 | ) | | | 24,079 | | | | 2.18 | | | | 2.18 | | | | (0.68 | ) | | | 110 | |
| | — | | | | 22.65 | | | | 12.82 | | | | 47,239 | | | | 2.22 | | | | 2.22 | | | | (0.99 | ) | | | 82 | |
| | | | | | | | | | | | | | | | | | | | | | | | | | | | | | |
| | — | | | | 27.82 | | | | 9.01 | | | | 9,648 | | | | 1.05 | | | | 1.11 | | | | 0.45 | | | | 29 | |
| | — | | | | 25.52 | | | | (2.56 | ) | | | 2,047 | | | | 1.09 | (h) | | | 1.14 | | | | 0.16 | | | | 97 | |
| | 0.00 | | | | 27.12 | | | | 22.21 | | | | 1,317 | | | | 1.15 | | | | 1.24 | | | | 0.22 | (i) | | | 79 | |
| | — | | | | 22.27 | | | | 36.71 | | | | 5,325 | | | | 1.15 | | | | 1.22 | | | | 0.20 | | | | 115 | |
| | — | | | | 16.29 | | | | (39.89 | ) | | | 5,611 | | | | 1.17 | | | | 1.23 | | | | 0.31 | | | | 110 | |
| | — | | | | 27.58 | | | | 14.02 | | | | 16,649 | | | | 1.12 | | | | 1.12 | | | | 0.10 | | | | 82 | |
| (f) | Computed on an annualized basis for periods less than one year, if applicable. |
| (g) | For the six months ended June 30, 2012 (Unaudited). |
| (h) | Effective June 1, 2011, the expense limit decreased to 1.30%. 2.05%, 2.05% and 1.05% for Class A, Class B, Class C and Class Y shares, respectively. |
| (i) | Includes non-recurring dividends. Without this dividend, net investment loss per share would have been $(0.04), $(0.18), $(0.18) and $(0.02) for Class A, Class B, Class C and Class Y shares, respectively, and the ratio of net investment loss to average net assets would have been (0.19)%, (0.98)%, (0.94)% and (0.08)% for Class A, Class B, Class C and Class Y shares, respectively. |
| (j) | Includes a non-recurring dividend of $0.02 per share. |
See accompanying notes to financial statements.
| 98
Financial Highlights (continued)
For a share outstanding throughout each period.
| | | | | | | | | | | | | | | | | | | | | | | | | | | | |
| | | | | | Income (Loss) from Investment
Operations: | | | Less Distributions: | |
| | | Net asset
value,
beginning
of the
period | | | Net
investment
income
(loss) (a) | | | Net realized
and
unrealized
gain (loss) | | | Total from
investment
operations | | | Dividends
from net
investment
income (b) | | | Distributions
from net
realized
capital
gains | | | Total
distributions | |
VAUGHAN NELSON SMALL CAP VALUE FUND | | | | | | | | | | | | | | | | | |
Class A | | | | | | | | | | | | | | | | | | | | | | | | | | | | |
6/30/2012(g) | | $ | 17.74 | | | $ | 0.02 | (l) | | $ | 1.11 | | | $ | 1.13 | | | $ | — | | | $ | (0.27 | ) | | $ | (0.27 | ) |
12/31/2011 | | | 22.69 | | | | 0.10 | | | | (0.83 | ) | | | (0.73 | ) | | | (0.09 | ) | | | (4.13 | ) | | | (4.22 | ) |
12/31/2010 | | | 22.31 | | | | (0.01 | ) | | | 5.27 | | | | 5.26 | | | | — | | | | (4.90 | ) | | | (4.90 | ) |
12/31/2009 | | | 17.42 | | | | 0.05 | (h) | | | 4.88 | | | | 4.93 | | | | (0.04 | ) | | | — | | | | (0.04 | ) |
12/31/2008 | | | 22.11 | | | | 0.03 | | | | (4.69 | ) | | | (4.66 | ) | | | — | | | | (0.03 | ) | | | (0.03 | ) |
12/31/2007 | | | 20.90 | | | | (0.02 | ) | | | 1.23 | | | | 1.21 | | | | — | | | | — | | | | — | |
Class B | | | | | | | | | | | | | | | | | | | | | | | | | | | | |
6/30/2012(g) | | | 14.84 | | | | (0.04 | )(l) | | | 0.93 | | | | 0.89 | | | | — | | | | (0.27 | ) | | | (0.27 | ) |
12/31/2011 | | | 19.73 | | | | (0.07 | ) | | | (0.69 | ) | | | (0.76 | ) | | | (0.00 | ) | | | (4.13 | ) | | | (4.13 | ) |
12/31/2010 | | | 20.06 | | | | (0.17 | ) | | | 4.72 | | | | 4.55 | | | | — | | | | (4.90 | ) | | | (4.90 | ) |
12/31/2009 | | | 15.76 | | | | (0.09 | )(h) | | | 4.39 | | | | 4.30 | | | | — | | | | — | | | | — | |
12/31/2008 | | | 20.15 | | | | (0.14 | ) | | | (4.22 | ) | | | (4.36 | ) | | | — | | | | (0.03 | ) | | | (0.03 | ) |
12/31/2007 | | | 19.19 | | | | (0.17 | ) | | | 1.13 | | | | 0.96 | | | | — | | | | — | | | | — | |
Class C | | | | | | | | | | | | | | | | | | | | | | | | | | | | |
6/30/2012(g) | | | 14.85 | | | | (0.04 | )(l) | | | 0.92 | | | | 0.88 | | | | — | | | | (0.27 | ) | | | (0.27 | ) |
12/31/2011 | | | 19.74 | | | | (0.06 | ) | | | (0.70 | ) | | | (0.76 | ) | | | — | | | | (4.13 | ) | | | (4.13 | ) |
12/31/2010 | | | 20.07 | | | | (0.16 | ) | | | 4.71 | | | | 4.55 | | | | — | | | | (4.90 | ) | | | (4.90 | ) |
12/31/2009 | | | 15.76 | | | | (0.08 | )(h) | | | 4.39 | | | | 4.31 | | | | — | | | | — | | | | — | |
12/31/2008 | | | 20.16 | | | | (0.13 | ) | | | (4.24 | ) | | | (4.37 | ) | | | — | | | | (0.03 | ) | | | (0.03 | ) |
12/31/2007 | | | 19.19 | | | | (0.17 | ) | | | 1.14 | | | | 0.97 | | | | — | | | | — | | | | — | |
Class Y | | | | | | | | | | | | | | | | | | | | | | | | | | | | |
6/30/2012(g) | | | 17.99 | | | | 0.05 | (l) | | | 1.12 | | | | 1.17 | | | | — | | | | (0.27 | ) | | | (0.27 | ) |
12/31/2011 | | | 22.96 | | | | 0.15 | | | | (0.84 | ) | | | (0.69 | ) | | | (0.15 | ) | | | (4.13 | ) | | | (4.28 | ) |
12/31/2010 | | | 22.47 | | | | 0.06 | | | | 5.31 | | | | 5.37 | | | | — | | | | (4.90 | ) | | | (4.90 | ) |
12/31/2009 | | | 17.55 | | | | 0.12 | (h) | | | 4.90 | | | | 5.02 | | | | (0.10 | ) | | | — | | | | (0.10 | ) |
12/31/2008 | | | 22.20 | | | | 0.12 | | | | (4.74 | ) | | | (4.62 | ) | | | — | | | | (0.03 | ) | | | (0.03 | ) |
12/31/2007 | | | 20.91 | | | | 0.04 | | | | 1.25 | | | | 1.29 | | | | — | | | | — | | | | — | |
| (a) | Per share net investment income (loss) has been calculated using the average shares outstanding during the period. |
| (b) | Amount rounds to less than $0.01 per share, if applicable. |
| (c) | A sales charge for Class A shares and a contingent deferred sales charge for Class B and Class C shares are not reflected in total return calculations. Periods less than one year, if applicable, are not annualized. |
| (d) | Had certain expenses not been waived/reimbursed during the period, if applicable, total returns would have been lower. |
| (e) | The investment adviser and/or administrator agreed to waive its fees and/or reimburse a portion of the Fund’s expenses during the period. Without this waiver/reimbursement, if applicable, expenses would have been higher. |
See accompanying notes to financial statements.
99 |
| | | | | | | | | | | | | | | | | | | | | | | | | | | | | | | | | | |
| | | | | | | | | | | | | | | |
Ratios to Average Net Assets: | | | | |
Increase from
regulatory
settlements | | | Redemption
fees (b) | | | Net asset
value, end
of the period | | | Total
return
(%) (c)(d) | | | Net assets,
end of
the period
(000’s) | | | Net
expenses
(%) (e)(f) | | | Gross
expenses
(%) (f) | | | Net investment
income (loss)
(%) (f) | | | Portfolio
turnover
rate (%) | |
| | | | | | | | | | | | | | | | | | | | | | | | | | | | | | | | | | |
| | | | | | | | | | | | | | | | | | | | | | | | | | | | | | | | | | |
| $ | — | | | $ | — | | | $ | 18.60 | | | | 6.34 | (l) | | $ | 208,141 | | | | 1.39 | | | | 1.39 | | | | 0.24 | (l) | | | 38 | |
| | — | | | | — | | | | 17.74 | | | | (3.77 | ) | | | 228,445 | | | | 1.36 | | | | 1.36 | | | | 0.44 | | | | 88 | |
| | 0.02 | | | | — | | | | 22.69 | | | | 23.67 | | | | 267,192 | | | | 1.41 | | | | 1.41 | | | | (0.03 | ) | | | 80 | |
| | — | | | | — | | | | 22.31 | | | | 28.30 | | | | 322,961 | | | | 1.45 | | | | 1.49 | | | | 0.27 | | | | 102 | |
| | — | | | | 0.00 | (i) | | | 17.42 | | | | (21.11 | ) | | | 171,875 | | | | 1.45 | | | | 1.51 | | | | 0.13 | | | | 124 | |
| | — | | | | 0.00 | | | | 22.11 | | | | 5.84 | | | | 103,719 | | | | 1.49 | | | | 1.57 | | | | (0.11 | ) | | | 78 | |
| | | | | | | | | | | | | | | | | | | | | | | | | | | | | | | | | | |
| | — | | | | — | | | | 15.46 | | | | 5.96 | (l) | | | 3,645 | | | | 2.14 | | | | 2.14 | | | | (0.55 | )(l) | | | 38 | |
| | — | | | | — | | | | 14.84 | | | | (4.51 | ) | | | 4,657 | | | | 2.11 | | | | 2.11 | | | | (0.38 | ) | | | 88 | |
| | 0.02 | | | | — | | | | 19.73 | | | | 22.78 | | | | 7,996 | | | | 2.16 | | | | 2.16 | | | | (0.78 | ) | | | 80 | |
| | — | | | | — | | | | 20.06 | | | | 27.28 | | | | 10,630 | | | | 2.20 | | | | 2.24 | | | | (0.56 | ) | | | 102 | |
| | — | | | | 0.00 | (i) | | | 15.76 | | | | (21.67 | ) | | | 11,788 | | | | 2.20 | | | | 2.26 | | | | (0.78 | ) | | | 124 | |
| | — | | | | 0.00 | | | | 20.15 | | | | 5.06 | | | | 25,076 | | | | 2.24 | | | | 2.31 | | | | (0.84 | ) | | | 78 | |
| | | | | | | | | | | | | | | | | | | | | | | | | | | | | | | | | | |
| | — | | | | — | | | | 15.46 | | | | 5.89 | (l) | | | 28,433 | | | | 2.14 | | | | 2.14 | | | | (0.51 | )(l) | | | 38 | |
| | — | | | | — | | | | 14.85 | | | | (4.51 | ) | | | 30,284 | | | | 2.11 | | | | 2.11 | | | | (0.33 | ) | | | 88 | |
| | 0.02 | | | | — | | | | 19.74 | | | | 22.78 | | | | 38,855 | | | | 2.16 | | | | 2.16 | | | | (0.76 | ) | | | 80 | |
| | — | | | | — | | | | 20.07 | | | | 27.35 | | | | 39,238 | | | | 2.20 | | | | 2.24 | | | | (0.48 | ) | | | 102 | |
| | — | | | | 0.00 | (i) | | | 15.76 | | | | (21.71 | ) | | | 21,861 | | | | 2.20 | | | | 2.26 | | | | (0.68 | ) | | | 124 | |
| | — | | | | 0.00 | | | | 20.16 | | | | 5.05 | | | | 21,765 | | | | 2.24 | | | | 2.32 | | | | (0.85 | ) | | | 78 | |
| | | | | | | | | | | | | | | | | | | | | | | | | | | | | | | | | | |
| | — | | | | — | | | | 18.89 | | | | 6.48 | (l) | | | 135,367 | | | | 1.14 | | | | 1.14 | | | | 0.50 | (l) | | | 38 | |
| | — | | | | — | | | | 17.99 | | | | (3.54 | ) | | | 130,115 | | | | 1.10 | | | | 1.10 | | | | 0.65 | | | | 88 | |
| | 0.02 | | | | — | | | | 22.96 | | | | 24.00 | | | | 217,305 | | | | 1.16 | | | | 1.16 | | | | 0.24 | | | | 80 | |
| | — | | | | — | | | | 22.47 | | | | 28.61 | | | | 232,903 | | | | 1.18 | (j) | | | 1.18 | (j) | | | 0.60 | | | | 102 | |
| | — | | | | 0.00 | (i) | | | 17.55 | | | | (20.81 | ) | | | 71,568 | | | | 1.20 | | | | 1.21 | | | | 0.65 | | | | 124 | |
| | — | | | | 0.00 | | | | 22.20 | | | | 6.12 | | | | 1,241 | | | | 1.19 | (k) | | | 1.19 | (k) | | | 0.17 | | | | 78 | |
| (f) | Computed on an annualized basis for periods less than one year, if applicable. |
| (g) | For the six months ended June 30, 2012 (Unaudited). |
| (h) | Includes a non-recurring dividend of $0.03 per share. |
| (i) | Effective June 2, 2008, redemption fees were eliminated. |
| (j) | Includes fee/expense recovery of less than 0.01%. |
| (k) | Includes fee/expense recovery of 0.04%. |
| (l) | Includes a non-recurring dividend. Without this dividend, net investment income (loss) per share would have been $0.00, $(0.06), $(0.05) and $0.03 for Class A , Class B, Class C and Class Y shares, respectively, total return would have been 6.23%, 5.82%, 5.82% and 6.36% for Class A, Class B, Class C and Class Y shares, respectively and the ratio of net investment income (loss) to average net assets would have been 0.05%, (0.73)%, (0.70)% and 0.30% for Class A , Class B, Class C and Class Y shares, respectively. |
See accompanying notes to financial statements.
| 100
Financial Highlights (continued)
For a share outstanding throughout each period.
| | | | | | | | | | | | | | | | | | | | | | | | | | | | |
| | | | | | Income (Loss) from Investment
Operations: | | | Less Distributions: | |
| | | Net asset
value,
beginning
of the
period | | | Net
investment
income (loss) (a) | | | Net realized
and
unrealized
gain (loss) | | | Total from
investment
operations | | | Dividends
from net
investment
income (b) | | | Distributions
from net
realized
capital
gains | | | Distributions
from paid-in
capital | |
VAUGHAN NELSON VALUE OPPORTUNITY FUND | | | | | | | | | | | | | |
Class A | | | | | | | | | | | | | | | | | | | | | | | | | | | | |
6/30/2012(g) | | $ | 13.83 | | | $ | 0.02 | (k) | | $ | 0.87 | | | $ | 0.89 | | | $ | — | | | $ | (0.03 | ) | | $ | — | |
12/31/2011 | | | 14.75 | | | | (0.01 | ) | | | (0.39 | ) | | | (0.40 | ) | | | — | | | | (0.52 | ) | | | — | |
12/31/2010 | | | 12.46 | | | | 0.08 | (i) | | | 2.36 | | | | 2.44 | | | | (0.07 | ) | | | (0.02 | ) | | | (0.06 | ) |
12/31/2009 | | | 9.60 | | | | 0.09 | | | | 2.88 | | | | 2.97 | | | | (0.04 | ) | | | (0.07 | ) | | | — | |
12/31/2008(j) | | | 10.00 | | | | 0.03 | | | | (0.41 | ) | | | (0.38 | ) | | | (0.02 | ) | | | — | | | | — | |
Class C | | | | | | | | | | | | | | | | | | | | | | | | | | | | |
6/30/2012(g) | | | 13.60 | | | | (0.03 | )(k) | | | 0.85 | | | | 0.82 | | | | — | | | | (0.03 | ) | | | — | |
12/31/2011 | | | 14.63 | | | | (0.12 | ) | | | (0.39 | ) | | | (0.51 | ) | | | — | | | | (0.52 | ) | | | — | |
12/31/2010 | | | 12.39 | | | | (0.03 | )(i) | | | 2.36 | | | | 2.33 | | | | (0.04 | ) | | | (0.02 | ) | | | (0.03 | ) |
12/31/2009 | | | 9.59 | | | | (0.02 | ) | | | 2.89 | | | | 2.87 | | | | (0.00 | ) | | | (0.07 | ) | | | — | |
12/31/2008(j) | | | 10.00 | | | | 0.02 | | | | (0.41 | ) | | | (0.39 | ) | | | (0.02 | ) | | | — | | | | — | |
Class Y | | | | | | | | | | | | | | | | | | | | | | | | | | | | |
6/30/2012(g) | | | 13.89 | | | | 0.04 | (k) | | | 0.88 | | | | 0.92 | | | | — | | | | (0.03 | ) | | | — | |
12/31/2011 | | | 14.80 | | | | 0.03 | | | | (0.41 | ) | | | (0.38 | ) | | | (0.01 | ) | | | (0.52 | ) | | | — | |
12/31/2010 | | | 12.49 | | | | 0.12 | (i) | | | 2.37 | | | | 2.49 | | | | (0.09 | ) | | | (0.02 | ) | | | (0.07 | ) |
12/31/2009 | | | 9.60 | | | | 0.10 | | | | 2.90 | | | | 3.00 | | | | (0.04 | ) | | | (0.07 | ) | | | — | |
12/31/2008(j) | | | 10.00 | | | | 0.03 | | | | (0.40 | ) | | | (0.37 | ) | | | (0.03 | ) | | | — | | | | — | |
| (a) | Per share net investment income (loss) has been calculated using the average shares outstanding during the period. |
| (b) | Amount rounds to less than $0.01 per share, if applicable. |
| (c) | A sales charge for Class A shares and a contingent deferred sales charge for Class C shares are not reflected in total return calculations. Periods less than one year, if applicable, are not annualized. |
| (d) | Had certain expenses not been waived/reimbursed during the period, if applicable, total returns would have been lower. |
| (e) | The investment adviser and/or administrator agreed to waive its fees and/or reimburse a portion of the Fund’s expenses during the period. Without this waiver/reimbursement, if applicable, expenses would have been higher. |
| (f) | Computed on an annualized basis for periods less than one year, if applicable. |
See accompanying notes to financial statements.
101 |
| | | | | | | | | | | | | | | | | | | | | | | | | | | | | | |
| | | | | | | | | | | | |
Ratios to Average Net Assets: | | | | |
Total
distributions | | |
Net asset
value,
end of
the period | | | Total
return
(%) (c)(d) | | | Net assets,
end of
the period
(000’s) | | | Net
expenses
(%) (e)(f) | | | Gross
expenses
(%) (f) | | | Net investment
income (loss)
(%) (f) | | | Portfolio
turnover
rate (%) | |
| | | | | | | | | | | | | | | | | | | | | | | | | | | | | | |
| | | | | | | | | | | | | | | | | | | | | | | | | | | | | | |
| $ | (0.03) | | | $ | 14.69 | | | | 6.45 | (k) | | $ | 27,724 | | | | 1.32 | | | | 1.32 | | | | 0.30 | (k) | | | 28 | |
| | (0.52) | | | | 13.83 | | | | (2.71 | ) | | | 21,308 | | | | 1.40 | (h) | | | 1.40 | (h) | | | (0.07 | ) | | | 75 | |
| | (0.15) | | | | 14.75 | | | | 19.64 | | | | 11,268 | | | | 1.40 | | | | 1.69 | | | | 0.62 | (i) | | | 143 | |
| | (0.11) | | | | 12.46 | | | | 30.98 | | | | 3,645 | | | | 1.40 | | | | 5.24 | | | | 0.79 | | | | 45 | |
| | (0.02) | | | | 9.60 | | | | (3.75 | ) | | | 16 | | | | 1.40 | | | | 39.61 | | | | 1.92 | | | | 12 | |
| | | | | | | | | | | | | | | | | | | | | | | | | | | | | | |
| | (0.03) | | | | 14.39 | | | | 6.05 | (k) | | | 2,781 | | | | 2.07 | | | | 2.07 | | | | (0.42 | )(k) | | | 28 | |
| | (0.52) | | | | 13.60 | | | | (3.48 | ) | | | 1,822 | | | | 2.15 | (h) | | | 2.15 | (h) | | | (0.83 | ) | | | 75 | |
| | (0.09) | | | | 14.63 | | | | 18.85 | | | | 824 | | | | 2.15 | | | | 2.46 | | | | (0.23 | )(i) | | | 143 | |
| | (0.07) | | | | 12.39 | | | | 30.01 | | | | 370 | | | | 2.15 | | | | 8.54 | | | | (0.14 | ) | | | 45 | |
| | (0.02) | | | | 9.59 | | | | (3.90 | ) | | | 41 | | | | 2.15 | | | | 40.36 | | | | 1.62 | | | | 12 | |
| | | | | | | | | | | | | | | | | | | | | | | | | | | | | | |
| | (0.03) | | | | 14.78 | | | | 6.64 | (k) | | | 153,145 | | | | 1.07 | | | | 1.07 | | | | 0.55 | (k) | | | 28 | |
| | (0.53) | | | | 13.89 | | | | (2.53 | ) | | | 109,419 | | | | 1.15 | (h) | | | 1.15 | (h) | | | 0.23 | | | | 75 | |
| | (0.18) | | | | 14.80 | | | | 19.96 | | | | 40,715 | | | | 1.15 | | | | 1.43 | | | | 0.92 | (i) | | | 143 | |
| | (0.11) | | | | 12.49 | | | | 31.37 | | | | 8,626 | | | | 1.15 | | | | 7.22 | | | | 0.90 | | | | 45 | |
| | (0.03) | | | | 9.60 | | | | (3.74 | ) | | | 960 | | | | 1.15 | | | | 38.91 | | | | 1.41 | | | | 12 | |
| (g) | For the six months ended June 30, 2012 (Unaudited) |
| (h) | Includes fee/expense recovery of 0.01%. |
| (i) | Includes non-recurring dividends. Without this dividend, net investment income (loss) per share would have been $0.01, $(0.09) and $0.04 for Class A, Class C and Class Y shares, respectively, and the ratio of net investment income (loss) to average net assets would have been 0.07%, (0.74)% and 0.34% for Class A, Class C and Class Y shares, respectively. |
| (j) | From commencement of operations on October 31, 2008 through December 31, 2008. |
| (k) | Includes a non-recurring dividend. Without this dividend, net investment income (loss) per share would have been $0.01, $(0.05) and $0.02 for Class A, Class C and Class Y shares, respectively, total return would have been 6.31%, 5.90% and 6.50% for Class A, Class C and Class Y shares, respectively, and the ratio of net investment income (loss) to average net assets would have been 0.07%, (0.66)% and 0.33% for Class A, Class C and Class Y shares, respectively. |
See accompanying notes to financial statements.
| 102
Notes to Financial Statements
June 30, 2012 (Unaudited)
1. Organization. Natixis Funds Trust I and Natixis Funds Trust II (the “Trusts” and each a “Trust”) are each organized as a Massachusetts business trust. Each Trust is registered under the Investment Company Act of 1940, as amended (the “1940 Act”), as an open-end management investment company. Each Declaration of Trust permits the Board of Trustees to authorize the issuance of an unlimited number of shares of the Trust in multiple series. The financial statements for certain funds of the Trusts are presented in separate reports. The following funds (individually, a “Fund” and collectively, the “Funds”) are included in this report:
Natixis Funds Trust I:
CGM Advisor Targeted Equity Fund (the “Targeted Equity Fund”)
Natixis Diversified Income Fund (the “Diversified Income Fund”)
Natixis U.S. Multi-Cap Equity Fund (the “U.S. Multi-Cap Equity Fund”)
Vaughan Nelson Small Cap Value Fund (the “Small Cap Value Fund”)
Natixis Funds Trust II:
Harris Associates Large Cap Value Fund (the “Large Cap Value Fund”)
Vaughan Nelson Value Opportunity Fund (the “Value Opportunity Fund”)
Each Fund is a diversified investment company.
Each Fund offers Class A and Class C shares. Targeted Equity Fund, U.S. Multi-Cap Equity Fund, Small Cap Value Fund, Large Cap Value Fund and Value Opportunity Fund also offer Class Y shares. Effective October 12, 2007, Class B shares are no longer offered. Existing Class B shareholders may continue to reinvest dividends into Class B shares and exchange their Class B shares for Class B shares of other Natixis Funds subject to existing exchange privileges as described in the prospectus.
Effective July 31, 2009, the Small Cap Value Fund was closed to new investors.
Class A shares are sold with a maximum front-end sales charge of 5.75%, with the exception of Diversified Income Fund which is sold with a maximum front-end sales charge of 4.50%. Class B shares do not pay a front-end sales charge; however, they are charged higher Rule 12b-1 fees, and are subject to a contingent deferred sales charge (“CDSC”) if such shares are redeemed within six years of purchase. After eight years of ownership, Class B shares convert to Class A shares. Class C shares do not pay a front-end sales charge, do not convert to any other class of shares, pay higher Rule 12b-1 fees than Class A shares and may be subject to a CDSC of 1.00% if those shares are redeemed within one year of acquisition, except for reinvested distributions. Class Y shares do not pay a front-end sales charge, a CDSC or Rule 12b-1 fees. Class Y shares are generally intended for institutional investors with a minimum initial investment of $100,000, though some categories of investors are exempted from the minimum investment amount as outlined in the Funds’ prospectus.
Most expenses of the Trusts can be directly attributed to a Fund. Expenses which cannot be directly attributed to a Fund are generally apportioned based on the relative
103 |
Notes to Financial Statements (continued)
June 30, 2012 (Unaudited)
net assets of each of the Funds in the Trusts. Expenses of a Fund are borne pro rata by the holders of each class of shares, except that each class bears expenses unique to that class (including the Rule 12b-1 service and distribution fees). In addition, each class votes as a class only with respect to its own Rule 12b-1 Plan. Shares of each class would receive their pro rata share of the net assets of a Fund if the Fund were liquidated. The Trustees approve separate distributions from net investment income on each class of shares.
2. Significant Accounting Policies. The following is a summary of significant accounting policies consistently followed by each Fund in the preparation of its financial statements. The Funds’ financial statements are prepared in accordance with accounting principles generally accepted in the United States of America which require the use of management estimates that affect the reported amounts and disclosures in the financial statements. Actual results could differ from those estimates. Management has evaluated the events and transactions subsequent to period-end through the date the financial statements were issued and has determined that there were no material events that would require disclosure in the Funds’ financial statements.
a. Valuation. Equity securities, including shares of closed-end investment companies and exchange-traded funds, for which market quotations are readily available are valued at market value, as reported by independent pricing services recommended by the investment adviser and subadvisers and approved by the Board of Trustees. Such independent pricing services generally use the security’s last sale price on the exchange or market where the security is primarily traded or, if there is no reported sale during the day, the closing bid price. Securities traded on the NASDAQ Global Select Market, NASDAQ Global Market and NASDAQ Capital Market are valued at the NASDAQ Official Closing Price (“NOCP”), or if lacking a NOCP, at the most recent bid quotation on the applicable NASDAQ Market. Debt securities (other than short-term obligations purchased with an original or remaining maturity of sixty days or less) and unlisted equity securities are generally valued on the basis of evaluated bids furnished to the Funds by an independent pricing service recommended by the investment adviser and subadvisers and approved by the Board of Trustees, which service determines valuations for normal, institutional-size trading units of such securities using market information, transactions for comparable securities and various relationships between securities which are generally recognized by institutional traders. Broker-dealer bid quotations may also be used to value debt and equity securities where an independent pricing service is unable to price a security or where an independent pricing service does not provide a reliable price for the security. Forward foreign currency contracts are valued utilizing interpolated prices determined from information provided by an independent pricing service. Domestic exchange-traded single equity option contracts are valued at the mean of the National Best Bid and Offer quotations. Investments in other open-end investment companies are valued at their net asset value each day. Short-term obligations purchased with an original or remaining maturity of sixty days or
| 104
Notes to Financial Statements (continued)
June 30, 2012 (Unaudited)
less are valued at amortized cost, which approximates market value. Securities for which market quotations are not readily available are valued at fair value as determined in good faith by the Funds’ investment adviser or subadvisers using consistently applied procedures under the general supervision of the Board of Trustees.
Certain Funds may hold securities traded in foreign markets. Foreign securities are valued at the market price in the foreign market. However, if events occurring after the close of the foreign market (but before the close of regular trading on the New York Stock Exchange) are believed to materially affect the value of those securities, such securities are fair valued pursuant to procedures approved by the Board of Trustees. When fair valuing securities, the Funds may, among other things, use modeling tools or other processes that may take into account factors such as securities market activity and/or significant events that occur after the close of the foreign market and before the Funds calculate their net asset values.
b. Investment Transactions and Related Investment Income. Investment transactions are accounted for on a trade date plus one basis for daily net asset value calculation. However, for financial reporting purposes, investment transactions are reported on trade date. Dividend income is recorded on ex-dividend date, or in the case of certain foreign securities, as soon as a Fund is notified, and interest income is recorded on an accrual basis. Interest income is increased by the accretion of discount and decreased by the amortization of premium. Periodic principal adjustments for inflation-protected securities are recorded to interest income. Negative principal adjustments (in the event of deflation) are recorded as reductions of interest income to the extent of interest income earned, not to exceed the amount of positive principal adjustments on a cumulative basis. Distributions received from investments in securities that represent a return of capital or capital gain are recorded as a reduction of cost of investments or as a realized gain, respectively. The calendar year-end amounts of ordinary income, capital gains, and return of capital included in distributions received from the Funds’ investments in real estate investment trusts (“REITs”) are reported to the Funds after the end of the fiscal year; accordingly, the Funds estimate these amounts for accounting purposes until the characterization of REIT distributions is reported to the Funds after the end of the fiscal year. Estimates are based on the most recent REIT distribution information available. Investment income is recorded net of foreign taxes withheld when applicable. In determining net gain or loss on securities sold, the cost of securities has been determined on an identified cost basis. Investment income, non-class specific expenses and realized and unrealized gains and losses are allocated on a pro rata basis to each class based on the relative net assets of each class to the total net assets of the Fund.
c. Foreign Currency Translation. The books and records of the Funds are maintained in U.S. dollars. The values of securities, currencies and other assets and liabilities denominated in currencies other than U.S. dollars are translated into U.S. dollars based
105 |
Notes to Financial Statements (continued)
June 30, 2012 (Unaudited)
upon foreign exchange rates prevailing at the end of the period. Purchases and sales of investment securities, income and expenses are translated on the respective dates of such transactions.
Since the values of investment securities are presented at the foreign exchange rates prevailing at the end of the period, it is not practical to isolate that portion of the results of operations arising from changes in exchange rates from fluctuations which arise due to changes in market prices of investment securities. Such changes are included with the net realized and unrealized gain or loss on investments.
Net realized foreign exchange gains or losses arise from sales of foreign currency, currency gains or losses realized between the trade and settlement dates on securities transactions and the difference between the amounts of dividends, interest and foreign withholding taxes recorded on the Funds’ books and the U.S. dollar equivalent of the amounts actually received or paid. Net unrealized foreign exchange gains and losses arise from changes in the value of assets and liabilities, other than investment securities, at the end of the fiscal period, resulting from changes in exchange rates.
Each Fund may use foreign currency exchange contracts to facilitate transactions in foreign-denominated investments. Losses may arise from changes in the value of the foreign currency or if the counterparties do not perform under the contracts’ terms.
d. Forward Foreign Currency Contracts. Certain Funds may enter into forward foreign currency contracts, including forward foreign cross currency contracts, to acquire exposure to foreign currencies or to hedge the Funds’ investments against currency fluctuation. A contract can also be used to offset a previous contract. These contracts involve market risk in excess of the unrealized gain or loss reflected in the Funds’ Statements of Assets and Liabilities. The U.S. dollar value of the currencies a Fund has committed to buy or sell represents the aggregate exposure to each currency a Fund has acquired or hedged through currency contracts outstanding at period end. Gains or losses are recorded for financial statement purposes as unrealized until settlement date. Risks may arise upon entering into these contracts from the potential inability of counterparties to meet the terms of their contracts and from unanticipated movements in the value of a foreign currency relative to the U.S. dollar. Certain contracts may require the movement of cash and/or securities as collateral for the Funds’ or counterparty’s net obligations under the contracts.
e. Option Contracts. Certain Funds may enter into option contracts. When a Fund purchases an option, it pays a premium and the option is subsequently marked to market to reflect current value. Premiums paid for purchasing options which expire are treated as realized losses. Premiums paid for purchasing options which are exercised are added to the cost or deducted from the proceeds on the underlying instrument to determine the realized gain or loss. If the Fund enters into a closing sale transaction, the difference between the premium paid and the proceeds of the closing sale
| 106
Notes to Financial Statements (continued)
June 30, 2012 (Unaudited)
transaction is treated as a realized gain or loss. The risk associated with purchasing options is limited to the premium paid.
When a Fund writes an option, an amount equal to the net premium received (the premium less commission) is recorded as a liability and is subsequently adjusted to the current value. Net premiums received for written options which expire are treated as realized gains. Net premiums received for written options which are exercised are deducted from the cost or added to the proceeds on the underlying instrument to determine the realized gain or loss. If the Fund enters into a closing purchase transaction, the difference between the net premium received and any amount paid on effecting a closing purchase transaction, including commission, is treated as a realized gain or, if the net premium received is less than the amount paid, as a realized loss. The Fund, as writer of a written option, bears the risk of an unfavorable change in the market value of the equity underlying the written option.
Exchange-traded options are standardized contracts and are settled through a clearing house with fulfillment supported by the credit of the exchange. Therefore, counterparty credit risks to the Funds are reduced. Over-the-counter options are subject to the risk that the counterparty is unable or unwilling to meet its obligations under the option. For the six months ended June 30, 2012, the Funds were not party to any over-the-counter options.
f. Federal and Foreign Income Taxes. Each Trust treats each Fund as a separate entity for federal income tax purposes. Each Fund intends to meet the requirements of the Internal Revenue Code of 1986, as amended, applicable to regulated investment companies, and to distribute to its shareholders substantially all of its net investment income and any net realized capital gains at least annually. Management has performed an analysis of each Fund’s tax positions for the open tax years as of June 30, 2012 and has concluded that no provisions for income tax are required. The Funds’ federal tax returns for the prior three fiscal years remain subject to examination by the Internal Revenue Service. Management is not aware of any events that are reasonably possible to occur in the next six months that would result in the amounts of any unrecognized tax benefits significantly increasing or decreasing for the Funds. However, management’s conclusions regarding tax positions taken may be subject to review and adjustment at a later date based on factors including, but not limited to, new tax laws and accounting regulations and interpretations thereof.
A Fund may be subject to foreign taxes on income and gains on investments that are accrued based upon the Fund’s understanding of the tax rules and regulations that exist in the countries in which the Fund invests. Foreign governments may also impose taxes or other payments on investments with respect to foreign securities. Such taxes are accrued as applicable.
107 |
Notes to Financial Statements (continued)
June 30, 2012 (Unaudited)
g. Dividends and Distributions to Shareholders. Dividends and distributions are recorded on ex-dividend date. The timing and characterization of certain income and capital gain distributions are determined annually in accordance with federal tax regulations, which may differ from accounting principles generally accepted in the United States of America. Permanent differences are primarily due to differing treatments for book and tax purposes of items such as paydown gains and losses, net operating losses, distribution redesignations, return of capital and capital gain distributions from REITs, foreign currency transactions, distributions in excess of current earnings, trust preferred securities, contingent payment debt instruments, premium amortization, defaulted bonds, non-deductible expenses and expiring capital loss carryforwards. Permanent book and tax basis differences relating to shareholder distributions, net investment income and net realized gains will result in reclassifications to capital accounts. Temporary differences between book and tax distributable earnings are primarily due to deferred Trustees’ fees, wash sales, defaulted bond adjustments, REIT basis adjustments, contingent payment debt instruments, premium amortization, forward foreign currency contract mark to market and trust preferred securities. Distributions from net investment income and short-term capital gains are considered to be distributed from ordinary income for tax purposes.
The tax characterization of distributions is determined on an annual basis. The tax character of distributions paid to shareholders during the year ended December 31, 2011 was as follows:
| | | | | | | | | | | | |
| | | 2011 Distributions Paid From: | |
Fund | | Ordinary Income | | | Long-Term
Capital Gains | | | Total | |
Targeted Equity Fund | | $ | 3,271,430 | | | $ | — | | | $ | 3,271,430 | |
Large Cap Value Fund | | | 752,237 | | | | — | | | | 752,237 | |
Diversified Income Fund | | | 2,424,186 | | | | — | | | | 2,424,186 | |
U.S. Multi-Cap Equity Fund | | | — | | | | 12,191,575 | | | | 12,191,575 | |
Small Cap Value Fund | | | 9,887,166 | | | | 79,707,256 | | | | 89,594,422 | |
Value Opportunity Fund | | | 2,390,222 | | | | 2,627,916 | | | | 5,018,138 | |
Differences between these amounts and those reported in the Statements of Changes in Net Assets are primarily attributable to different book and tax treatment for short-term capital gains.
| 108
Notes to Financial Statements (continued)
June 30, 2012 (Unaudited)
As of December 31, 2011, the capital loss carryforwards and post-October capital losses were as follows:
| | | | | | | | | | | | | | | | | | | | | | | | |
| | | Targeted
Equity Fund | | | Large Cap
Value Fund | | | Diversified
Income Fund | | | U.S. Multi-Cap
Equity Fund | | | Small Cap
Value Fund | | | Value Opportunity Fund | |
Capital loss carryforward: | | | | | | | | | | | | | | | | | | | | | | | | |
Short-term: | | | | | | | | | | | | | | | | | | | | | | | | |
Expires December 31, 2016 | | $ | — | | | $ | — | | | $ | (5,390,183 | ) | | $ | — | | | $ | — | | | $ | — | |
Expires December 31, 2017 | | | (15,907,530 | ) | | | (9,206,549 | ) | | | (14,198,082 | ) | | | — | | | | — | | | | — | |
Expires December 31, 2018 | | | — | | | | (790,094 | ) | | | — | | | | — | | | | — | | | | — | |
| | | | | | | | | | | | | | | | | | | | | | | | |
Total capital loss carryforwards | | $ | (15,907,530 | ) | | $ | (9,996,643 | ) | | $ | (19,588,265 | ) | | $ | — | | | $ | — | | | $ | — | |
| | | | | | | | | | | | | | | | | | | | | | | | |
Post-October capital loss deferrals | | $ | (3,767,300 | ) | | $ | — | | | $ | (36,756 | ) | | $ | (344,971 | ) | | $ | — | | | $ | (785,235 | ) |
| | | | | | | | | | | | | | | | | | | | | | | | |
h. Repurchase Agreements. It is each Fund’s policy that the market value of the collateral for repurchase agreements be at least equal to 102% of the repurchase price, including interest. Certain repurchase agreements are tri-party arrangements whereby the collateral is held in a segregated account for the benefit of the Fund and on behalf of the counterparty. Repurchase agreements could involve certain risks in the event of default or insolvency of the counterparty including possible delays or restrictions upon a Fund’s ability to dispose of the underlying securities.
i. Delayed Delivery Commitments. The Funds may purchase securities, including those designated as TBAs in the Portfolio of Investments, for which delivery or payment will occur at a later date, beyond the normal settlement period. The price of the security and the date when the security will be delivered and paid for are fixed at the time the transaction is negotiated. The security and the obligation to pay for it are recorded by the Funds at the time the commitment is entered into. The actual security that will be delivered to fulfill a TBA trade is not designated at the time of the trade. The security is “to be announced” 48 hours prior to the established trade settlement date. The value of the security may vary with market fluctuations during the time before the Funds take delivery of the security. When the Funds enter into such a transaction, collateral consisting of liquid securities or cash and cash equivalents is required to be segregated or earmarked at the custodian in an amount at least equal to the amount of the Funds’ commitment.
Purchases of delayed delivery securities may have a similar effect on the Funds’ net asset value as if the Funds had created a degree of leverage in the portfolio. Risks may arise upon entering into such transactions from the potential inability of counterparties to meet their obligations under the transactions. Additionally, losses may arise due to changes in the value of the underlying securities.
There were no delayed delivery securities held by the Funds as of June 30, 2012.
109 |
Notes to Financial Statements (continued)
June 30, 2012 (Unaudited)
j. Securities Lending. The Funds have entered into an agreement with State Street Bank and Trust Company (“State Street Bank”), as agent of the Funds, to lend securities to certain designated borrowers. The loans are collateralized with cash or securities in an amount equal to at least 105% or 102% of the market value (including accrued interest) of the loaned international or domestic securities, respectively, when the loan is initiated. Thereafter, the value of the collateral must remain at least 102% of the market value (including accrued interest) of loaned securities for U.S. equities and U.S. corporate debt; at least 105% of the market value (including accrued interest) of loaned securities for non-U.S. equities; and at least 100% of the market value (including accrued interest) of loaned securities for U.S. Government securities, sovereign debt issued by non-U.S. Governments and non-U.S. corporate debt. In the event that the market value of the collateral falls below the required percentages described above, the borrower will deliver additional collateral on the next business day. As with other extensions of credit, the Funds may bear the risk of loss with respect to the investment of the collateral. The Funds invest cash collateral in short-term investments, a portion of the income from which is remitted to the borrowers and the remainder allocated between the Funds and State Street Bank as lending agent.
For the six months ended June 30, 2012, none of the Funds had loaned securities under this agreement.
k. Indemnifications. Under the Trusts’ organizational documents, their officers and Trustees are indemnified against certain liabilities arising out of the performance of their duties to the Funds. Additionally, in the normal course of business, the Funds enter into contracts with service providers that contain general indemnification clauses. The Funds’ maximum exposure under these arrangements is unknown as this would involve future claims that may be made against the Funds that have not yet occurred. However, based on experience, the Funds expect the risk of loss to be remote.
l. New Accounting Pronouncement. In December 2011, Accounting Standards Update (“ASU”) No. 2011-11, “Disclosures about Offsetting Assets and Liabilities,” was issued and is effective for interim and annual periods beginning after January 1, 2013. The ASU enhances disclosure requirements with respect to an entity’s rights of setoff and related arrangements associated with its financial and derivative instruments. Management is currently evaluating the impact the adoption of ASU 2011-11 may have on the Funds’ financial statement disclosures.
3. Fair Value Measurements. In accordance with accounting standards related to fair value measurements and disclosures, the Funds have categorized the inputs utilized in determining the value of each Fund’s assets or liabilities. These inputs are summarized in the three broad levels listed below:
| | • | | Level 1 – quoted prices in active markets for identical assets or liabilities; |
| 110
Notes to Financial Statements (continued)
June 30, 2012 (Unaudited)
| | • | | Level 2 – prices determined using other significant inputs that are observable either directly, or indirectly through corroboration with observable market data (which could include quoted prices for similar assets or liabilities, interest rates, credit risk, etc.); and |
| | • | | Level 3 – prices determined using significant unobservable inputs when quoted prices or observable inputs are unavailable such as when there is little or no market activity for an asset or liability (unobservable inputs reflect each Fund’s own assumptions in determining the fair value of assets or liabilities and would be based on the best information available). |
The inputs or methodology used for valuing securities are not necessarily an indication of the risk associated with investing in those securities.
The following is a summary of the inputs used to value the Funds’ investments as of June 30, 2012, at value:
Targeted Equity Fund
Asset Valuation Inputs
| | | | | | | | | | | | | | | | |
Description | | Level 1 | | | Level 2 | | | Level 3 | | | Total | |
Common Stocks(a) | | $ | 550,355,360 | | | $ | — | | | $ | — | | | $ | 550,355,360 | |
Short-Term Investments | | | — | | | | 6,498,814 | | | | — | | | | 6,498,814 | |
| | | | | | | | | | | | | | | | |
Total | | $ | 550,355,360 | | | $ | 6,498,814 | | | $ | — | | | $ | 556,854,174 | |
| | | | | | | | | | | | | | | | |
| (a) | Details of the major categories of the Fund’s investments are reflected within the Portfolio of Investments. |
For the six months ended June 30, 2012, there were no transfers between Levels 1, 2 and 3.
Large Cap Value Fund
Asset Valuation Inputs
| | | | | | | | | | | | | | | | |
Description | | Level 1 | | | Level 2 | | | Level 3 | | | Total | |
Common Stocks(a) | | $ | 127,596,616 | | | $ | — | | | $ | — | | | $ | 127,596,616 | |
Short-Term Investments | | | — | | | | 3,982,993 | | | | — | | | | 3,982,993 | |
| | | | | | | | | | | | | | | | |
Total | | $ | 127,596,616 | | | $ | 3,982,993 | | | $ | — | | | $ | 131,579,609 | |
| | | | | | | | | | | | | | | | |
| (a) | Details of the major categories of the Fund’s investments are reflected within the Portfolio of Investments. |
For the six months ended June 30, 2012, there were no transfers between Levels 1, 2 and 3.
111 |
Notes to Financial Statements (continued)
June 30, 2012 (Unaudited)
Diversified Income Fund
Asset Valuation Inputs
| | | | | | | | | | | | | | | | |
Description | | Level 1 | | | Level 2 | | | Level 3 | | | Total | |
Common Stocks(a) | | $ | 47,821,461 | | | $ | — | | | $ | — | | | $ | 47,821,461 | |
Bonds and Notes(a) | | | — | | | | 46,779,905 | | | | — | | | | 46,779,905 | |
Preferred Stocks | | | | | | | | | | | | | | | | |
Convertible Preferred Stocks | | | | | | | | | | | | | | | | |
Construction Machinery | | | — | | | | 7,359 | | | | — | | | | 7,359 | |
Consumer Products | | | — | | | | 36,431 | | | | — | | | | 36,431 | |
All Other Convertible
Preferred Stocks(a) | | | 748,690 | | | | — | | | | — | | | | 748,690 | |
| | | | | | | | | | | | | | | | |
Total Convertible Preferred Stocks | | | 748,690 | | | | 43,790 | | | | — | | | | 792,480 | |
| | | | | | | | | | | | | | | | |
Non-Convertible Preferred Stocks(a) | | | 201,716 | | | | 114,927 | | | | — | | | | 316,643 | |
| | | | | | | | | | | | | | | | |
Total Preferred Stocks | | | 950,406 | | | | 158,717 | | | | — | | | | 1,109,123 | |
| | | | | | | | | | | | | | | | |
Short-Term Investments | | | — | | | | 7,915,870 | | | | — | | | | 7,915,870 | |
| | | | | | | | | | | | | | | | |
Total Investments | | | 48,771,867 | | | | 54,854,492 | | | | — | | | | 103,626,359 | |
| | | | | | | | | | | | | | | | |
Forward Foreign Currency Contracts (unrealized appreciation) | | | — | | | | 23,024 | | | | — | | | | 23,024 | |
| | | | | | | | | | | | | | | | |
Total | | $ | 48,771,867 | | | $ | 54,877,516 | | | $ | — | | | $ | 103,649,383 | |
| | | | | | | | | | | | | | | | |
Liability Valuation Inputs
| | | | | | | | | | | | | | | | |
Description | | Level 1 | | | Level 2 | | | Level 3 | | | Total | |
Forward Foreign Currency Contracts (unrealized depreciation) | | $ | — | | | $ | | (1,214) | | $ | — | | | $ | | (1,214) |
| | | | | | | | | | | | �� | | | | |
| (a) | Details of the major categories of the Fund’s investments are reflected within the Portfolio of Investments. |
For the six months ended June 30, 2012, there were no transfers between Levels 1, 2 and 3.
| 112
Notes to Financial Statements (continued)
June 30, 2012 (Unaudited)
U.S. Multi-Cap Equity Fund
Asset Valuation Inputs
| | | | | | | | | | | | | | | | |
Description | | Level 1 | | | Level 2 | | | Level 3 | | | Total | |
Common Stocks(a) | | $ | 330,316,562 | | | $ | — | | | $ | — | | | $ | 330,316,562 | |
Closed End Investment Companies | | | 1,611,082 | | | | — | | | | — | | | | 1,611,082 | |
Purchased Options(a) | | | 68,820 | | | | — | | | | — | | | | 68,820 | |
Short-Term Investments | | | — | | | | 8,908,389 | | | | — | | | | 8,908,389 | |
| | | | | | | | | | | | | | | | |
Total | | $ | 331,996,464 | | | $ | 8,908,389 | | | $ | — | | | $ | 340,904,853 | |
| | | | | | | | | | | | | | | | |
| (a) | Details of the major categories of the Fund’s investments are reflected within the Portfolio of Investments. |
For the six months ended June 30, 2012, there were no transfers between Levels 1, 2 and 3.
Small Cap Value Fund
Asset Valuation Inputs
| | | | | | | | | | | | | | | | |
Description | | Level 1 | | | Level 2 | | | Level 3 | | | Total | |
Common Stocks(a) | | $ | 334,535,921 | | | $ | — | | | $ | — | | | $ | 334,535,921 | |
Exchange Traded Funds | | | 17,027,341 | | | | — | | | | — | | | | 17,027,341 | |
Closed End Investment Companies | | | 9,760,338 | | | | — | | | | — | | | | 9,760,338 | |
Short-Term Investments | | | — | | | | 4,008,804 | | | | — | | | | 4,008,804 | |
| | | | | | | | | | | | | | | | |
Total | | $ | 361,323,600 | | | $ | 4,008,804 | | | $ | — | | | $ | 365,332,404 | |
| | | | | | | | | | | | | | | | |
| (a) | Details of the major categories of the Fund’s investments are reflected within the Portfolio of Investments. |
For the six months ended June 30, 2012, there were no transfers between Levels 1, 2 and 3.
Value Opportunity Fund
Asset Valuation Inputs
| | | | | | | | | | | | | | | | |
Description | | Level 1 | | | Level 2 | | | Level 3 | | | Total | |
Common Stocks(a) | | $ | 174,569,416 | | | $ | — | | | $ | — | | | $ | 174,569,416 | |
Closed End Investment Companies | | | 2,801,379 | | | | — | | | | — | | | | 2,801,379 | |
Short-Term Investments | | | — | | | | 5,616,449 | | | | — | | | | 5,616,449 | |
| | | | | | | | | | | | | | | | |
Total | | $ | 177,370,795 | | | $ | 5,616,449 | | | $ | — | | | $ | 182,987,244 | |
| | | | | | | | | | | | | | | | |
| (a) | Details of the major categories of the Fund’s investments are reflected within the Portfolio of Investments. |
113 |
Notes to Financial Statements (continued)
June 30, 2012 (Unaudited)
For the six months ended June 30, 2012, there were no transfers between Levels 1, 2 and 3.
The following is a reconciliation of Level 3 investments for which significant unobservable inputs were used to determine fair value as of June 30, 2012:
Diversified Income Fund
Asset Valuation Inputs
| | | | | | | | | | | | | | | | | | | | |
Investments in Securities | | Balance as of
December 31,
2011 | | | Accrued
Discounts
(Premiums) | | | Realized
Gain
(Loss) | | | Change in
Unrealized
Appreciation
(Depreciation) | | | Purchases | |
Bonds and Notes | | | | | | | | | | | | | | | | | | | | |
Non-Convertible Bonds | | | | | | | | | | | | | | | | | | | | |
Treasuries | | $ | 94,814 | | | $ | 939 | | | $ | (161,611 | ) | | $ | 169,573 | | | $ | — | |
| | | | | | | | | | | | | | | | | | | | |
| | | | | |
Investments in Securities | | Sales | | | Transfers
into Level 3 | | | Transfers
out of
Level 3 | | | Balance as of
June 30,
2012 | | | Change in
Unrealized
Appreciation
(Depreciation)
from
Investments
Still Held at
June 30, 2012 | |
Bonds and Notes | | | | | | | | | | | | | | | | | | | | |
Non-Convertible Bonds | | | | | | | | | | | | | | | | | | | | |
Treasuries | | $ | (103,715 | ) | | $ | — | | | $ | — | | | $ | — | | | $ | — | |
| | | | | | | | | | | | | | | | | | | | |
4. Derivatives. Derivative instruments are defined as financial instruments whose value and performance are based on the value and performance of another security or financial instrument. Derivative instruments that certain Funds used during the period include forward foreign currency contracts and option contracts.
The Funds are subject to the risk that changes in foreign currency exchange rates will have an unfavorable effect on the value of Fund assets denominated in foreign currencies. Certain Funds may enter into forward foreign currency contracts for hedging purposes to protect the value of the Funds’ holdings of foreign securities. Certain Funds may also use forward foreign currency contracts to gain exposure to foreign currencies, regardless of whether securities denominated in such currencies are held in the Funds. During the six months ended June 30, 2012, Diversified Income Fund engaged in forward foreign currency transactions for hedging purposes.
| 114
Notes to Financial Statements (continued)
June 30, 2012 (Unaudited)
The Funds are subject to the risk of unpredictable declines in the value of individual equity securities and periods of below-average performance in individual securities or in the equity market as a whole. U.S. Multi-Cap Equity Fund may use purchased put options and written call options to hedge against a decline in value of an equity security that it owns and may use written put options to offset the cost of option contracts used for hedging purposes. The Fund may also use purchased call options to gain exposure to an equity security without committing the capital required to buy it, while also limiting the downside risk associated with owning it. During the six months ended June 30, 2012, the Fund engaged in purchased put options for hedging purposes.
Certain Funds are party to agreements with counterparties that govern transactions in forward foreign currency contracts. These agreements contain credit-risk-related contingent features that allow the counterparties to terminate open contracts early if the net asset value of a Fund declines beyond a certain threshold. If such features were to be triggered, the counterparties could request immediate settlement of open contracts at current fair value. As of June 30, 2012, the fair value of derivative positions (including open trades) subject to credit-risk-related contingent features that are in a net liability position by counterparty, and the value of collateral pledged to counterparties for such contracts is as follows:
| | | | | | | | | | |
Fund | | Counterparty | | Derivatives | | | Collateral Pledged | |
Diversified Income Fund | | Credit Suisse AG | | $ | (771 | ) | | | — | |
Forward foreign currency contracts are subject to the risk that the counterparty will be unwilling or unable to meet its obligations under the contracts. Certain Funds have mitigated this risk by entering into master netting agreements with counterparties that allow the Fund and the counterparty to offset amounts owed by each related to derivative contracts to one net amount payable by either the Fund or the counterparty. As of June 30, 2012, the maximum amount of loss that Diversified Income Fund would incur if counterparties failed to meet their obligations is $23,024 and the amount of loss that the Fund would incur after taking into account master netting arrangements is $22,581.
Counterparty risk is managed based on policies and procedures established by each Fund’s adviser and/or subadviser. Such policies and procedures may include, but are not limited to, minimum counterparty credit rating requirements, monitoring of counterparty credit default swap spreads and posting of collateral. Collateral is posted based on the requirements established under International Swap and Derivative Association (“ISDA”) agreements negotiated between each Fund and the derivative counterparties. This risk of loss to a Fund from counterparty default should be limited to the extent a Fund is undercollateralized; however, final settlement of a Fund’s claim against any collateral received may be subject to bankruptcy court proceedings.
115 |
Notes to Financial Statements (continued)
June 30, 2012 (Unaudited)
The following is a summary of derivative instruments for Diversified Income Fund as of June 30, 2012:
| | | | |
Statements of Assets and Liabilities Caption | | Foreign
Exchange
Contracts | |
Assets | | | | |
Unrealized appreciation on forward foreign currency contracts | | $ | 23,024 | |
Liabilities | | | | |
Unrealized depreciation on forward foreign currency contracts | | | (1,214 | ) |
Transactions in derivative instruments for Diversified Income Fund during the six months ended June 30, 2012 were as follows:
| | | | |
Statements of Operations Caption | | Foreign
Exchange
Contracts | |
Net Realized Gain on: | | | | |
Foreign currency transactions* | | $ | 36,230 | |
Net Change in Unrealized Appreciation (Depreciation) on: | | | | |
Foreign currency translations* | | | (16,540 | ) |
| * | Represents realized gain and change in unrealized appreciation (depreciation), respectively, for forward foreign currency contracts during the period. |
The following is a summary of derivative instruments for U.S. Multi-Cap Equity Fund as of June 30, 2012:
| | | | |
Statements of Assets and Liabilities Caption | | Equity
Contracts | |
Assets | | | | |
Investments at value* | | $ | 68,820 | |
| * | Represents purchased options, at value. |
Transactions in derivative instruments for U.S. Multi-Cap Equity Fund during the six months ended June 30, 2012 were as follows:
| | | | |
Statements of Operations Caption | | Equity
Contracts | |
Net Realized Gain (Loss) on: | | | | |
Investments* | | $ | (37,464 | ) |
Net Change in Unrealized Appreciation (Depreciation) on: | | | | |
Investments* | | | (134,654 | ) |
| * | Represents realized loss and change in unrealized appreciation (depreciation), respectively, for purchased options during the period. |
| 116
Notes to Financial Statements (continued)
June 30, 2012 (Unaudited)
As the Funds value their derivatives at fair value and recognize changes in fair value through the Statements of Operations, they do not qualify for hedge accounting under authoritative guidance for derivative instruments. The Funds’ investments in derivatives may represent an economic hedge; however, they are considered to be non-hedge transactions for the purpose of these disclosures.
The volume of forward foreign currency contract activity, as a percentage of net assets, for Diversified Income Fund, based on gross month-end notional amounts outstanding during the period, including long and short positions at absolute value, was as follows for the six months ended June 30, 2012:
| | | | |
Diversified Income Fund | | Forwards | |
Average Notional Amount Outstanding | | | 0.85 | % |
Highest Notional Amount Outstanding | | | 1.08 | % |
Lowest Notional Amount Outstanding | | | 0.64 | % |
Notional Amount Outstanding as of June 30, 2012 | | | 0.78 | % |
The volume of option contract activity, as a percentage of net assets, for U.S. Multi-Cap Equity Fund, based on the month-end market values of equity securities underlying purchased and written options, at absolute value, was as follows for the six months ended June 30, 2012:
| | | | |
U.S. Multi-Cap Equity Fund* | | Put Options
Purchased | |
Average Market Value of Underlying Securities | | | 0.56 | % |
Highest Market Value of Underlying Securities | | | 1.69 | % |
Lowest Market Value of Underlying Securities | | | 0.00 | % |
Market Value of Underlying Securities as of June 30, 2012 | | | 1.69 | % |
| * | Market value of underlying securities is determined by multiplying option shares by the price of the option’s underlying security, as determined by the Fund’s Pricing Policies and Procedures. |
Market value of underlying securities and notional amounts outstanding at the end of the prior period are included in the averages above.
5. Purchases and Sales of Securities. For the six months ended June 30, 2012, purchases and sales of securities (excluding short-term investments and U.S. Government/Agency securities and including paydowns) were as follows:
| | | | | | | | |
Fund | | Purchases | | | Sales | |
Targeted Equity Fund | | $ | 551,805,258 | | | $ | 637,256,580 | |
Large Cap Value Fund | | | 23,370,073 | | | | 25,494,430 | |
Diversified Income Fund | | | 20,092,667 | | | | 4,538,425 | |
U.S. Multi-Cap Equity Fund | | | 98,286,619 | | | | 116,774,398 | |
Small Cap Value Fund | | | 144,699,317 | | | | 186,552,550 | |
Value Opportunity Fund | | | 87,158,510 | | | | 46,082,614 | |
117 |
Notes to Financial Statements (continued)
June 30, 2012 (Unaudited)
For the six months ended June 30, 2012, purchases and sales of U.S. Government/Agency securities by the Diversified Income Fund were $15,958,552 and $11,766,051, respectively.
6. Management Fees and Other Transactions with Affiliates.
a. Management Fees. NGAM Advisors, L.P. (“NGAM Advisors”), serves as investment adviser to each Fund except the Targeted Equity Fund. Capital Growth Management Limited Partnership (“CGM”) is the investment adviser to the Targeted Equity Fund. Under the terms of the management agreements, each Fund pays a management fee at the following annual rates, calculated daily and payable monthly, based on each Fund’s average daily net assets:
| | | | | | | | | | | | | | | | | | | | |
| | | Percentage of Average Daily Net Assets | |
Fund | | First $200 million | | | Next $300 million | | | Next $500 million | | | Next $1 billion | | | Over $2 billion | |
Targeted Equity Fund | | | 0.75 | % | | | 0.70 | % | | | 0.65 | % | | | 0.65 | % | | | 0.60 | % |
Large Cap Value Fund | | | 0.70 | % | | | 0.65 | % | | | 0.60 | % | | | 0.60 | % | | | 0.60 | % |
Diversified Income Fund | | | 0.55 | % | | | 0.55 | % | | | 0.55 | % | | | 0.50 | % | | | 0.50 | % |
U.S. Multi-Cap Equity Fund | | | 0.80 | % | | | 0.80 | % | | | 0.80 | % | | | 0.80 | % | | | 0.80 | % |
Small Cap Value Fund | | | 0.90 | % | | | 0.90 | % | | | 0.90 | % | | | 0.90 | % | | | 0.90 | % |
Value Opportunity Fund | | | 0.80 | % | | | 0.80 | % | | | 0.80 | % | | | 0.80 | % | | | 0.80 | % |
NGAM Advisors has entered into subadvisory agreements for each Fund as listed below.
| | |
Large Cap Value Fund | | Harris Associates L.P. (“Harris”) |
Diversified Income Fund | | AEW Capital Management, L.P. (“AEW”) |
| | Loomis, Sayles & Company, L.P. (“Loomis Sayles”) |
U.S. Multi-Cap Equity Fund | | Harris |
| | Loomis Sayles |
Small Cap Value Fund | | Vaughan Nelson Investment Management, L.P. (“Vaughan Nelson”) |
Value Opportunity Fund | | Vaughan Nelson |
Payments to NGAM Advisors are reduced by the amount of payments to the subadvisers.
NGAM Advisors has given binding undertakings to certain Funds to waive management fees and/or reimburse certain expenses to limit the Funds’ operating expenses, exclusive of acquired fund fees and expenses, brokerage expenses, interest expense, taxes and extraordinary expenses. These undertakings are in effect until April 30, 2013
| 118
Notes to Financial Statements (continued)
June 30, 2012 (Unaudited)
and are reevaluated on an annual basis. Management fees payable, as reflected on the Statements of Assets and Liabilities, is net of waivers and/or expense reimbursements, if any, pursuant to these undertakings.
For the six months ended June 30, 2012, the expense limits as a percentage of average daily net assets under the expense limitation agreements were as follows:
| | | | | | | | | | | | | | | | |
| | | Expense limit
as a Percentage of
Average Daily Net Assets | |
Fund | | Class A | | | Class B | | | Class C | | | Class Y | |
Large Cap Value Fund | | | 1.30 | % | | | 2.05 | % | | | 2.05 | % | | | 1.05 | % |
Diversified Income Fund | | | 1.25 | % | | | — | | | | 2.00 | % | | | — | |
U.S. Multi-Cap Equity Fund | | | 1.30 | % | | | 2.05 | % | | | 2.05 | % | | | 1.05 | % |
Small Cap Value Fund | | | 1.45 | % | | | 2.20 | % | | | 2.20 | % | | | 1.20 | % |
Value Opportunity Fund | | | 1.40 | % | | | — | | | | 2.15 | % | | | 1.15 | % |
NGAM Advisors shall be permitted to recover expenses it has borne under the expense limitation agreements (whether through waiver of its management fees or otherwise) on a class by class basis in later periods to the extent the expenses of a class fall below a class’ expense limits, provided, however, that a class is not obligated to pay such waived/reimbursed fees or expenses more than one year after the end of the fiscal year in which the fees or expenses were waived/reimbursed.
For the six months ended June 30, 2012, the management fees and waivers of management fees for each Fund were as follows:
| | | | | | | | | | | | | | | | | | | | |
Fund | | Gross
Management
Fees | | | Waivers of
Management
Fees1 | | | Net
Management
Fees | | | Percentage
of Average
Daily
Net Assets | |
| | | | | | | | | | | | Gross | | | Net | |
Targeted Equity Fund | | $ | 2,197,425 | | | $ | — | | | $ | 2,197,425 | | | | 0.71 | % | | | 0.71 | % |
Large Cap Value Fund | | | 471,842 | | | | 17,860 | | | | 453,982 | | | | 0.70 | % | | | 0.67 | % |
Diversified Income Fund | | | 241,971 | | | | — | | | | 241,971 | | | | 0.55 | % | | | 0.55 | % |
U.S. Multi-Cap Equity Fund | | | 1,394,264 | | | | 92,100 | | | | 1,302,164 | | | | 0.80 | % | | | 0.75 | % |
Small Cap Value Fund | | | 1,776,015 | | | | — | | | | 1,776,015 | | | | 0.90 | % | | | 0.90 | % |
Value Opportunity Fund | | | 666,270 | | | | — | | | | 666,270 | | | | 0.80 | % | | | 0.80 | % |
| 1Management | fee waivers are subject to possible recovery until December 31, 2013. |
No expenses were recovered for any of the Funds during the six months ended June 30, 2012.
119 |
Notes to Financial Statements (continued)
June 30, 2012 (Unaudited)
Certain officers and directors of NGAM Advisors and its affiliates are also officers or Trustees of the Funds. NGAM Advisors, AEW, CGM, Harris, Loomis Sayles and Vaughan Nelson are subsidiaries of Natixis Global Asset Management, L.P. (“Natixis US”), which is part of Natixis Global Asset Management, an international asset management group based in Paris, France.
b. Service and Distribution Fees. NGAM Distribution, L.P. (“NGAM Distribution”), which is a wholly-owned subsidiary of Natixis US, has entered into a distribution agreement with the Trusts. Pursuant to this agreement, NGAM Distribution serves as principal underwriter of the Funds of the Trusts.
Pursuant to Rule 12b-1 under the 1940 Act, the Trusts have adopted a Service Plan relating to each Fund’s Class A shares (the “Class A Plans”) and a Distribution and Service Plan relating to each Fund’s Class B (if applicable) and Class C shares (the “Class B and Class C Plans”).
Under the Class A Plans, each Fund pays NGAM Distribution a monthly service fee at an annual rate not to exceed 0.25% of the average daily net assets attributable to the Fund’s Class A shares, as reimbursement for expenses incurred by NGAM Distribution in providing personal services to investors in Class A shares and/or the maintenance of shareholder accounts.
Under the Class B (if applicable) and Class C Plans, each Fund pays NGAM Distribution a monthly service fee at an annual rate not to exceed 0.25% of the average daily net assets attributable to the Fund’s Class B (if applicable) and Class C shares, as compensation for services provided by NGAM Distribution in providing personal services to investors in Class B (if applicable) and Class C shares and/or the maintenance of shareholder accounts.
Also under the Class B (if applicable) and Class C Plans, each Fund pays NGAM Distribution a monthly distribution fee at an annual rate of 0.75% of the average daily net assets attributable to the Fund’s Class B (if applicable) and Class C shares, as compensation for services provided by NGAM Distribution in connection with the marketing or sale of Class B (if applicable) and Class C shares.
For the six months ended June 30, 2012, the Funds paid the following service and distribution fees:
| | | | | | | | | | | | | | | | | | | | |
| | | Service Fees | | | Distribution Fees | |
Fund | | Class A | | | Class B | | | Class C | | | Class B | | | Class C | |
Targeted Equity Fund | | $ | 638,148 | | | $ | 6,123 | | | $ | 58,054 | | | $ | 18,369 | | | $ | 174,161 | |
Large Cap Value Fund | | | 144,211 | | | | 3,920 | | | | 7,510 | | | | 11,760 | | | | 22,532 | |
Diversified Income Fund | | | 66,445 | | | | — | | | | 43,541 | | | | — | | | | 130,623 | |
U.S. Multi-Cap Equity Fund | | | 370,615 | | | | 19,611 | | | | 37,828 | | | | 58,835 | | | | 113,484 | |
Small Cap Value Fund | | | 278,303 | | | | 5,337 | | | | 38,119 | | | | 16,010 | | | | 114,358 | |
Value Opportunity Fund | | | 31,017 | | | | — | | | | 3,167 | | | | — | | | | 9,500 | |
| 120
Notes to Financial Statements (continued)
June 30, 2012 (Unaudited)
c. Administrative Fees. NGAM Advisors provides certain administrative services for the Funds and contracts with State Street Bank to serve as sub-administrator. NGAM Advisors is a wholly-owned subsidiary of Natixis US. Pursuant to an agreement among Natixis Funds Trust I, Natixis Funds Trust II, Natixis Funds Trust IV, Gateway Trust (“Natixis Funds Trusts”), Loomis Sayles Funds I, Loomis Sayles Funds II (“Loomis Sayles Funds Trusts”), Hansberger International Series and NGAM Advisors, each Fund pays NGAM Advisors monthly its pro rata portion of fees equal to an annual rate of 0.0575% of the first $15 billion of the average daily net assets of the Natixis Funds Trusts, Loomis Sayles Funds Trusts and Hansberger International Series, 0.0500% of the next $15 billion, 0.0400% of the next $30 billion and 0.0350% of such assets in excess of $60 billion, subject to an annual aggregate minimum fee for the Natixis Funds Trusts, Loomis Sayles Funds Trusts and Hansberger International Series of $10 million, which is reevaluated on an annual basis.
For the six months ended June 30, 2012, each Fund paid the following administrative fees to NGAM Advisors:
| | | | |
Fund | | Administrative
Fees | |
Targeted Equity Fund | | $ | 141,821 | |
Large Cap Value Fund | | | 30,703 | |
Diversified Income Fund | | | 20,032 | |
U.S. Multi-Cap Equity Fund | | | 79,389 | |
Small Cap Value Fund | | | 89,905 | |
Value Opportunity Fund | | | 37,913 | |
d. Sub-Transfer Agent Fees. NGAM Distribution has entered into agreements with financial intermediaries to provide certain recordkeeping, processing, shareholder communications and other services to customers of the intermediaries and has agreed to compensate the intermediaries for providing those services. Certain services would be provided by the Funds if the shares of those customers were registered directly with the Funds’ transfer agent. Accordingly, the Funds have agreed to reimburse NGAM Distribution for a portion of the intermediary fees attributable to shares of the Funds held by the intermediaries (which generally are a percentage of the value of shares held) not to exceed what the Funds would have paid their transfer agent had each customer’s shares been registered directly with the transfer agent instead of being held through the intermediaries.
121 |
Notes to Financial Statements (continued)
June 30, 2012 (Unaudited)
For the six months ended June 30, 2012, the Funds paid the following sub-transfer agent fees, which are reflected in transfer agent fees and expenses in the Statements of Operations:
| | | | |
Fund | | Sub-Transfer
Agent Fees | |
Targeted Equity Fund | | $ | 157,701 | |
Large Cap Value Fund | | | 21,104 | |
Diversified Income Fund | | | 22,968 | |
U.S. Multi-Cap Equity Fund | | | 64,252 | |
Small Cap Value Fund | | | 168,997 | |
Value Opportunity Fund | | | 70,706 | |
As of June 30, 2012, the Funds owe NGAM Distribution the following reimbursements for sub-transfer agent fees:
| | | | |
Fund | | Reimbursements
of Sub-Transfer
Agent Fees | |
Targeted Equity Fund | | $ | 3,251 | |
Large Cap Value Fund | | | 687 | |
Diversified Income Fund | | | 771 | |
U.S. Multi-Cap Equity Fund | | | 1,678 | |
Small Cap Value Fund | | | 3,865 | |
Value Opportunity Fund | | | 2,474 | |
e. Commissions. Commissions (including CDSCs) on Fund shares retained by NGAM Distribution during the six months ended June 30, 2012, were as follows:
| | | | |
Fund | | Commissions | |
Targeted Equity Fund | | $ | 70,470 | |
Large Cap Value Fund | | | 15,175 | |
Diversified Income Fund | | | 133,031 | |
U.S. Multi-Cap Equity Fund | | | 71,446 | |
Small Cap Value Fund | | | 12,044 | |
Value Opportunity Fund | | | 21,337 | |
f. Trustees Fees and Expenses. The Trusts do not pay any compensation directly to their officers or Trustees who are directors, officers or employees of NGAM Advisors, NGAM Distribution, Natixis US or their affiliates. The Chairperson of the Board receives a retainer fee at the annual rate of $265,000. The Chairperson does not receive any meeting attendance fees for Board of Trustees meetings or committee meetings that she attends. Each Independent Trustee (other than the Chairperson) receives, in the aggregate, a retainer fee at the annual rate of $95,000. Each Independent Trustee also receives a meeting attendance fee of $10,000 for each meeting of the Board of Trustees
| 122
Notes to Financial Statements (continued)
June 30, 2012 (Unaudited)
that he or she attends in person and $5,000 for each meeting of the Board of Trustees that he or she attends telephonically. In addition, each committee chairman receives an additional retainer fee at an annual rate of $15,000. Each Contract Review and Governance Committee member is compensated $6,000 for each Committee meeting that he or she attends in person and $3,000 for each meeting that he or she attends telephonically. Each Audit Committee member is compensated $7,500 for each Committee meeting that he or she attends in person and $3,750 for each meeting that he or she attends telephonically. These fees are allocated among the funds in the Natixis Funds Trusts, Loomis Sayles Funds Trusts and Hansberger International Series based on a formula that takes into account, among other factors, the relative net assets of each fund. Trustees are reimbursed for travel expenses in connection with attendance at meetings.
A deferred compensation plan (the “Plan”) is available to the Trustees on a voluntary basis. Deferred amounts remain in the Funds until distributed in accordance with the provisions of the Plan. The value of a participating Trustee’s deferral account is based on theoretical investments of deferred amounts, on the normal payment dates, in certain funds of the Natixis Funds Trusts, Loomis Sayles Funds Trusts and Hansberger International Series as designated by the participating Trustees. Changes in the value of participants’ deferral accounts are allocated pro rata among the funds in the Natixis Funds Trusts, Loomis Sayles Funds Trusts, and Hansberger International Series, and are normally reflected as Trustees’ fees and expenses in the Statements of Operations. The portions of the accrued obligations allocated to the Funds under the Plan are reflected as Deferred Trustees’ fees in the Statements of Assets and Liabilities.
7. Line of Credit. Each Fund, together with certain other funds of Natixis Funds Trusts, Loomis Sayles Funds Trusts and Hansberger International Series, participates in a $200,000,000 committed unsecured line of credit provided by State Street Bank, with an individual limit of $125,000,000 for each fund that participates in the line of credit. Interest is charged to each participating fund based on its borrowings at a rate per annum equal to the greater of the Federal Funds rate or overnight LIBOR, plus 1.25%. In addition, a commitment fee of 0.10% per annum, payable at the end of each calendar quarter, is accrued and apportioned among the participating funds based on their average daily unused portion of the line of credit. Prior to April 19, 2012, the commitment fee was 0.125% per annum.
For the six months ended June 30, 2012, none of the Funds had borrowings under these agreements.
123 |
Notes to Financial Statements (continued)
June 30, 2012 (Unaudited)
8. Brokerage Commission Recapture. Certain Funds have entered into agreements with certain brokers whereby the brokers will rebate a portion of brokerage commissions. All amounts rebated by the brokers are returned to the Funds under such agreements and are included in realized gains on investments in the Statements of Operations. For the six months ended June 30, 2012, amounts rebated under these agreements were as follows:
| | | | |
Fund | | Rebates | |
Targeted Equity Fund | | $ | 143,900 | |
Diversified Income Fund | | | 477 | |
U.S. Multi-Cap Equity Fund | | | 12,587 | |
Small Cap Value Fund | | | 8,464 | |
Value Opportunity Fund | | | 32,111 | |
9. Concentration of Risk. Each Fund’s investments in foreign securities are subject to foreign currency fluctuations, higher volatility than U.S. securities, varying degrees of regulation and limited liquidity. Greater political, economic, credit and information risks are also associated with foreign securities.
10. Concentration of Ownership. From time to time, the Funds may have a concentration of one or more shareholders holding a significant percentage of shares outstanding. Investment activities of these shareholders could have material impacts on the Funds. As of June 30, 2012, certain Funds had shareholders that owned more than 5% of the Funds’ total outstanding shares. The number of shareholders owning more than 5% of total outstanding shares of the Funds, based on accounts that represent more than 5% of an individual class of shares, and the aggregate percentage of net assets represented by such holdings was as follows:
| | | | | | | | |
Fund | | Number of 5% Shareholders | | | Percentage of
Ownership | |
Large Cap Value Fund | | | 1 | | | | 5.89 | % |
Small Cap Value Fund | | | 2 | | | | 24.72 | % |
Value Opportunity Fund | | | 1 | | | | 20.40 | % |
| 124
Notes to Financial Statements (continued)
June 30, 2012 (Unaudited)
11. Capital Shares. Each Fund may issue an unlimited number of shares of beneficial interest, without par value. Transactions in capital shares were as follows:
| | | | | | | | | | | | | | | | |
| |
| Six Months Ended
June 30, 2012 |
| |
| Year Ended
December 31, 2011 |
|
Targeted Equity Fund | | | Shares | | | | Amount | | | | Shares | | | | Amount | |
| Class A | | | | | | | | | | | | | | | | |
Issued from the sale of shares | | | 814,188 | | | $ | 8,298,174 | | | | 3,184,509 | | | $ | 33,232,138 | |
Issued in connection with the reinvestment of distributions | | | — | | | | — | | | | 282,978 | | | | 2,637,355 | |
Redeemed | | | (6,701,659 | ) | | | (68,607,390 | ) | | | (17,448,381 | ) | | | (176,294,304 | ) |
| | | | | | | | | | | | | | | | |
Net change | | | (5,887,471 | ) | | $ | (60,309,216 | ) | | | (13,980,894 | ) | | $ | (140,424,811 | ) |
| | | | | | | | | | | | | | | | |
| Class B | | | | | | | | | | | | | | | | |
Issued from the sale of shares | | | 9,928 | | | $ | 91,102 | | | | 22,290 | | | $ | 209,108 | |
Issued in connection with the reinvestment of distributions | | | — | | | | — | | | | — | | | | — | |
Redeemed | | | (184,151 | ) | | | (1,679,042 | ) | | | (384,942 | ) | | | (3,528,090 | ) |
| | | | | | | | | | | | | | | | |
Net change | | | (174,223 | ) | | $ | (1,587,940 | ) | | | (362,652 | ) | | $ | (3,318,982 | ) |
| | | | | | | | | | | | | | | | |
| Class C | | | | | | | | | | | | | | | | |
Issued from the sale of shares | | | 195,326 | | | $ | 1,741,995 | | | | 896,423 | | | $ | 8,494,213 | |
Issued in connection with the reinvestment of distributions | | | — | | | | — | | | | — | | | | — | |
Redeemed | | | (1,148,063 | ) | | | (10,346,024 | ) | | | (3,391,034 | ) | | | (30,547,401 | ) |
| | | | | | | | | | | | | | | | |
Net change | | | (952,737 | ) | | $ | (8,604,029 | ) | | | (2,494,611 | ) | | $ | (22,053,188 | ) |
| | | | | | | | | | | | | | | | |
| Class Y | | | | | | | | | | | | | | | | |
Issued from the sale of shares | | | 1,676,311 | | | $ | 18,160,092 | | | | 3,063,998 | | | $ | 33,665,698 | |
Issued in connection with the reinvestment of distributions | | | — | | | | — | | | | 24,987 | | | | 238,628 | |
Redeemed | | | (2,050,289 | ) | | | (20,776,393 | ) | | | (9,218,830 | ) | | | (93,610,480 | ) |
| | | | | | | | | | | | | | | | |
Net change | | | (373,978 | ) | | $ | (2,616,301 | ) | | | (6,129,845 | ) | | $ | (59,706,154 | ) |
| | | | | | | | | | | | | | | | |
Increase (decrease) from capital share transactions | | | (7,388,409 | ) | | $ | (73,117,486 | ) | | | (22,968,002 | ) | | $ | (225,503,135 | ) |
| | | | | | | | | | | | | | | | |
125 |
Notes to Financial Statements (continued)
June 30, 2012 (Unaudited)
11. Capital Shares (continued).
| | | | | | | | | | | | | | | | |
| |
| Six Months Ended
June 30, 2012 |
| |
| Year Ended
December 31, 2011 |
|
Large Cap Value Fund | | | Shares | | | | Amount | | | | Shares | | | | Amount | |
| Class A | | | | | | | | | | | | | | | | |
Issued from the sale of shares | | | 223,872 | | | $ | 3,407,515 | | | | 362,434 | | | $ | 5,194,882 | |
Issued in connection with the reinvestment of distributions | | | — | | | | — | | | | 42,241 | | | | 582,465 | |
Redeemed | | | (558,538 | ) | | | (8,544,592 | ) | | | (1,006,523 | ) | | | (14,401,573 | ) |
| | | | | | | | | | | | | | | | |
Net change | | | (334,666 | ) | | $ | (5,137,077 | ) | | | (601,848 | ) | | $ | (8,624,226 | ) |
| | | | | | | | | | | | | | | | |
| Class B | | | | | | | | | | | | | | | | |
Issued from the sale of shares | | | 4,120 | | | $ | 59,910 | | | | 4,821 | | | $ | 64,740 | |
Issued in connection with the reinvestment of distributions | | | — | | | | — | | | | 95 | | | | 1,299 | |
Redeemed | | | (74,564 | ) | | | (1,044,599 | ) | | | (172,664 | ) | | | (2,279,597 | ) |
| | | | | | | | | | | | | | | | |
Net change | | | (70,444 | ) | | $ | (984,689 | ) | | | (167,748 | ) | | $ | (2,213,558 | ) |
| | | | | | | | | | | | | | | | |
| Class C | | | | | | | | | | | | | | | | |
Issued from the sale of shares | | | 28,186 | | | $ | 390,408 | | | | 14,556 | | | $ | 192,169 | |
Issued in connection with the reinvestment of distributions | | | — | | | | — | | | | 74 | | | | 1,019 | |
Redeemed | | | (35,777 | ) | | | (500,146 | ) | | | (137,075 | ) | | | (1,793,043 | ) |
| | | | | | | | | | | | | | | | |
Net change | | | (7,591 | ) | | $ | (109,738 | ) | | | (122,445 | ) | | $ | (1,599,855 | ) |
| | | | | | | | | | | | | | | | |
| Class Y | | | | | | | | | | | | | | | | |
Issued from the sale of shares | | | 335,071 | | | $ | 5,319,549 | | | | 52,358 | | | $ | 787,377 | |
Issued in connection with the reinvestment of distributions | | | — | | | | — | | | | 4,200 | | | | 59,792 | |
Redeemed | | | (127,296 | ) | | | (1,991,926 | ) | | | (182,830 | ) | | | (2,780,482 | ) |
| | | | | | | | | | | | | | | | |
Net change | | | 207,775 | | | $ | 3,327,623 | | | | (126,272 | ) | | $ | (1,933,313 | ) |
| | | | | | | | | | | | | | | | |
Increase (decrease) from capital share transactions | | | (204,926 | ) | | $ | (2,903,881 | ) | | | (1,018,313 | ) | | $ | (14,370,952 | ) |
| | | | | | | | | | | | | | | | |
| | | | |
Diversified Income Fund | | | | | | | | | | | | | | | | |
| Class A | | | | | | | | | | | | | | | | |
Issued from the sale of shares | | | 1,721,964 | | | $ | 19,358,990 | | | | 1,529,920 | | | $ | 16,499,405 | |
Issued in connection with the reinvestment of distributions | | | 52,371 | | | | 588,419 | | | | 119,006 | | | | 1,274,902 | |
Redeemed | | | (347,053 | ) | | | (3,901,993 | ) | | | (876,123 | ) | | | (9,358,069 | ) |
| | | | | | | | | | | | | | | | |
Net change | | | 1,427,282 | | | $ | 16,045,416 | | | | 772,803 | | | $ | 8,416,238 | |
| | | | | | | | | | | | | | | | |
| Class C | | | | | | | | | | | | | | | | |
Issued from the sale of shares | | | 965,640 | | | $ | 10,817,382 | | | | 777,802 | | | $ | 8,318,664 | |
Issued in connection with the reinvestment of distributions | | | 15,964 | | | | 178,988 | | | | 38,746 | | | | 414,491 | |
Redeemed | | | (243,543 | ) | | | (2,728,068 | ) | | | (666,925 | ) | | | (7,106,226 | ) |
| | | | | | | | | | | | | | | | |
Net change | | | 738,061 | | | $ | 8,268,302 | | | | 149,623 | | | $ | 1,626,929 | |
| | | | | | | | | | | | | | | | |
Increase (decrease) from capital share transactions | | | 2,165,343 | | | $ | 24,313,718 | | | | 922,426 | | | $ | 10,043,167 | |
| | | | | | | | | | | | | | | | |
| 126
Notes to Financial Statements (continued)
June 30, 2012 (Unaudited)
11. Capital Shares (continued).
| | | | | | | | | | | | | | | | |
| |
| Six Months Ended
June 30, 2012 |
| |
| Year Ended
December 31, 2011 |
|
U.S. Multi-Cap Equity Fund | | | Shares | | | | Amount | | | | Shares | | | | Amount | |
| Class A | | | | | | | | | | | | | | | | |
Issued from the sale of shares | | | 317,896 | | | $ | 8,181,270 | | | | 1,001,650 | | | $ | 25,954,270 | |
Issued in connection with the reinvestment of distributions | | | — | | | | — | | | | 436,000 | | | | 9,962,606 | |
Redeemed | | | (1,028,968 | ) | | | (26,556,224 | ) | | | (1,980,283 | ) | | | (50,206,150 | ) |
| | | | | | | | | | | | | | | | |
Net change | | | (711,072 | ) | | $ | (18,374,954 | ) | | | (542,633 | ) | | $ | (14,289,274 | ) |
| | | | | | | | | | | | | | | | |
| Class B | | | | | | | | | | | | | | | | |
Issued from the sale of shares | | | 5,794 | | | $ | 127,944 | | | | 23,243 | | | $ | 504,601 | |
Issued in connection with the reinvestment of distributions | | | — | | | | — | | | | 36,272 | | | | 701,492 | |
Redeemed | | | (226,747 | ) | | | (4,902,478 | ) | | | (548,210 | ) | | | (12,060,361 | ) |
| | | | | | | | | | | | | | | | |
Net change | | | (220,953 | ) | | $ | (4,774,534 | ) | | | (488,695 | ) | | $ | (10,854,268 | ) |
| | | | | | | | | | | | | | | | |
| Class C | | | | | | | | | | | | | | | | |
Issued from the sale of shares | | | 57,880 | | | $ | 1,270,101 | | | | 207,100 | | | $ | 4,562,054 | |
Issued in connection with the reinvestment of distributions | | | — | | | | — | | | | 54,243 | | | | 1,049,602 | |
Redeemed | | | (102,173 | ) | | | (2,210,835 | ) | | | (264,427 | ) | | | (5,782,658 | ) |
| | | | | | | | | | | | | | | | |
Net change | | | (44,293 | ) | | $ | (940,734 | ) | | | (3,084 | ) | | $ | (171,002 | ) |
| | | | | | | | | | | | | | | | |
| Class Y | | | | | | | | | | | | | | | | |
Issued from the sale of shares | | | 330,827 | | | $ | 9,444,720 | | | | 116,639 | | | $ | 3,317,946 | |
Issued in connection with the reinvestment of distributions | | | — | | | | — | | | | 2,297 | | | | 56,868 | |
Redeemed | | | (64,236 | ) | | | (1,794,866 | ) | | | (87,289 | ) | | | (2,428,566 | ) |
| | | | | | | | | | | | | | | | |
Net change | | | 266,591 | | | $ | 7,649,854 | | | | 31,647 | | | $ | 946,248 | |
| | | | | | | | | | | | | | | | |
Increase (decrease) from capital share transactions | | | (709,727 | ) | | $ | (16,440,368 | ) | | | (1,002,765 | ) | | $ | (24,368,296 | ) |
| | | | | | | | | | | | | | | | |
127 |
Notes to Financial Statements (continued)
June 30, 2012 (Unaudited)
11. Capital Shares (continued).
| | | | | | | | | | | | | | | | |
| |
| Six Months Ended
June 30, 2012 |
| |
| Year Ended
December 31, 2011 |
|
Small Cap Value Fund | | | Shares | | | | Amount | | | | Shares | | | | Amount | |
| Class A | | | | | | | | | | | | | | | | |
Issued from the sale of shares | | | 717,521 | | | $ | 13,109,923 | | | | 3,643,470 | | | $ | 82,393,516 | |
Issued in connection with the reinvestment of distributions | | | 94,736 | | | | 1,771,559 | | | | 1,590,219 | | | | 30,259,390 | |
Redeemed | | | (2,498,754 | ) | | | (46,820,460 | ) | | | (4,129,370 | ) | | | (90,649,356 | ) |
| | | | | | | | | | | | | | | | |
Net change | | | (1,686,497 | ) | | $ | (31,938,978 | ) | | | 1,104,319 | | | $ | 22,003,550 | |
| | | | | | | | | | | | | | | | |
| Class B | | | | | | | | | | | | | | | | |
Issued from the sale of shares | | | 8,407 | | | $ | 131,742 | | | | 19,113 | | | $ | 365,516 | |
Issued in connection with the reinvestment of distributions | | | 4,496 | | | | 70,006 | | | | 70,308 | | | | 1,130,787 | |
Redeemed | | | (90,922 | ) | | | (1,431,191 | ) | | | (180,896 | ) | | | (3,487,616 | ) |
| | | | | | | | | | | | | | | | |
Net change | | | (78,019 | ) | | $ | (1,229,443 | ) | | | (91,475 | ) | | $ | (1,991,313 | ) |
| | | | | | | | | | | | | | | | |
| Class C | | | | | | | | | | | | | | | | |
Issued from the sale of shares | | | 41,323 | | | $ | 647,475 | | | | 183,324 | | | $ | 3,193,176 | |
Issued in connection with the reinvestment of distributions | | | 23,817 | | | | 371,073 | | | | 325,308 | | | | 5,194,638 | |
Redeemed | | | (266,237 | ) | | | (4,200,005 | ) | | | (437,680 | ) | | | (8,311,014 | ) |
| | | | | | | | | | | | | | | | |
Net change | | | (201,097 | ) | | $ | (3,181,457 | ) | | | 70,952 | | | $ | 76,800 | |
| | | | | | | | | | | | | | | | |
| Class Y | | | | | | | | | | | | | | | | |
Issued from the sale of shares | | | 935,958 | | | $ | 18,401,830 | | | | 1,970,543 | | | $ | 45,319,180 | |
Issued in connection with the reinvestment of distributions | | | 80,651 | | | | 1,530,757 | | | | 1,227,435 | | | | 23,963,566 | |
Redeemed | | | (1,082,613 | ) | | | (20,763,284 | ) | | | (5,430,354 | ) | | | (119,011,700 | ) |
| | | | | | | | | | | | | | | | |
Net change | | | (66,004 | ) | | $ | (830,697 | ) | | | (2,232,376 | ) | | $ | (49,728,954 | ) |
| | | | | | | | | | | | | | | | |
Increase (decrease) from capital share transactions | | | (2,031,617 | ) | | $ | (37,180,575 | ) | | | (1,148,580 | ) | | $ | (29,639,917 | ) |
| | | | | | | | | | | | | | | | |
| 128
Notes to Financial Statements (continued)
June 30, 2012 (Unaudited)
11. Capital Shares (continued).
| | | | | | | | | | | | | | | | |
| |
| Six Months Ended
June 30, 2012 |
| |
| Year Ended
December 31, 2011 |
|
Value Opportunity Fund | | | Shares | | | | Amount | | | | Shares | | | | Amount | |
| Class A | | | | | | | | | | | | | | | | |
Issued from the sale of shares | | | 652,486 | | | $ | 9,844,327 | | | | 1,293,700 | | | $ | 20,064,791 | |
Issued in connection with the reinvestment of distributions | | | 3,712 | | | | 55,677 | | | | 55,637 | | | | 775,015 | |
Redeemed | | | (309,764 | ) | | | (4,660,977 | ) | | | (572,243 | ) | | | (8,442,798 | ) |
| | | | | | | | | | | | | | | | |
Net change | | | 346,434 | | | $ | 5,239,027 | | | | 777,094 | | | $ | 12,397,008 | |
| | | | | | | | | | | | | | | | |
| Class C | | | | | | | | | | | | | | | | |
Issued from the sale of shares | | | 93,931 | | | $ | 1,381,641 | | | | 121,179 | | | $ | 1,857,011 | |
Issued in connection with the reinvestment of distributions | | | 390 | | | | 5,739 | | | | 4,804 | | | | 65,821 | |
Redeemed | | | (35,096 | ) | | | (517,948 | ) | | | (48,298 | ) | | | (678,464 | ) |
| | | | | | | | | | | | | | | | |
Net change | | | 59,225 | | | $ | 869,432 | | | | 77,685 | | | $ | 1,244,368 | |
| | | | | | | | | | | | | | | | |
| Class Y | | | | | | | | | | | | | | | | |
Issued from the sale of shares | | | 4,070,523 | | | $ | 62,256,229 | | | | 6,640,679 | | | $ | 97,980,918 | |
Issued in connection with the reinvestment of distributions | | | 13,516 | | | | 203,823 | | | | 196,859 | | | | 2,756,032 | |
Redeemed | | | (1,596,003 | ) | | | (23,728,753 | ) | | | (1,713,518 | ) | | | (25,165,911 | ) |
| | | | | | | | | | | | | | | | |
Net change | | | 2,488,036 | | | $ | 38,731,299 | | | | 5,124,020 | | | $ | 75,571,039 | |
| | | | | | | | | | | | | | | | |
Increase (decrease) from capital share transactions | | | 2,893,695 | | | $ | 44,839,758 | | | | 5,978,799 | | | $ | 89,212,415 | |
| | | | | | | | | | | | | | | | |
129 |
Item 2. Code of Ethics.
Not applicable.
Item 3. Audit Committee Financial Expert.
Not applicable.
Item 4. Principal Accountant Fees and Services.
Not applicable.
Item 5. Audit Committee of Listed Registrants.
Not applicable.
Item 6. Schedule of Investments.
Included as part of the Report to Shareholders filed as Item 1 herewith.
Item 7. Disclosure of Proxy Voting Policies and Procedures for Closed-End Management Investment Companies.
Not applicable.
Item 8. Portfolio Managers of Closed-End Management Investment Companies
Not applicable.
Item 9. Purchases of Equity Securities by Closed-End Management Investment Companies and Affiliated Purchasers.
Not applicable.
Item 10. Submission of Matters to a Vote of Securities Holders.
There were no material changes to the procedures by which shareholders may recommend nominees to the Registrant’s Board of Trustees.
Item 11. Controls and Procedures.
The Registrant’s principal executive officer and principal financial officer have concluded that the Registrant’s disclosure controls and procedures are sufficient to ensure that information required to be disclosed by the Registrant in this Form N-CSR was recorded, processed, summarized and reported within the time periods specified in the Securities and Exchange Commission’s rules and forms, based upon such officers’ evaluation of these controls and procedures as of a date within 90 days of the filing date of the report.
There were no changes in the Registrant’s internal control over financial reporting that occurred during the Registrant’s last fiscal quarter of the period covered by the report that has materially affected, or is reasonably likely to materially affect, the Registrant’s internal control over financial reporting.
Item 12. Exhibits.
| | | | |
| (a) | | (1) | | Not applicable |
| | |
| (a) | | (2) | | Certifications of Principal Executive Officer and Principal Financial Officer pursuant to 30a-2(a) under the Investment Company Act of 1940 (17 CFR 270.30a-2(a)), filed herewith as Exhibits (a)(2)(1) and (a)(2)(2), respectively. |
| | |
| (a) | | (3) | | Not applicable. |
| | |
| (b) | | | | Certifications of Principal Executive Officer and Principal Financial Officer pursuant to Section 906 of Sarbanes-Oxley Act of 2002 are filed herewith as Exhibit (b). |
SIGNATURES
Pursuant to the requirements of the Securities Exchange Act of 1934 and the Investment Company Act of 1940, the Registrant has duly caused this report to be signed on its behalf by the undersigned, thereunto duly authorized.
| | |
| Natixis Funds Trust II |
| |
| By: | | /s/ David L. Giunta |
| Name: | | David L. Giunta |
| Title: | | President and Chief Executive Officer |
| Date: | | August 21, 2012 |
Pursuant to the requirements of the Securities Exchange Act of 1934 and the Investment Company Act of 1940, this report has been signed by the following persons on behalf of the Registrant and in the capacities and on the dates indicated.
| | |
| By: | | /s/ David L. Giunta |
| Name: | | David L. Giunta |
| Title: | | President and Chief Executive Officer |
| Date: | | August 21, 2012 |
| |
| By: | | /s/ Michael C. Kardok |
| Name: | | Michael C. Kardok |
| Title: | | Treasurer |
| Date: | | August 21, 2012 |