UNITED STATES
SECURITIES AND EXCHANGE COMMISSION
Washington, D.C. 20549
FORM N-CSR
CERTIFIED SHAREHOLDER REPORT OF REGISTERED
MANAGEMENT INVESTMENT COMPANIES
Investment Company Act file number: 811-00242
Natixis Funds Trust II
(Exact name of Registrant as specified in charter)
888 Boylston Street, Suite 800 Boston, Massachusetts 02199-8197
(Address of principal executive offices) (Zip code)
Natalie Wagner, Esq.
Natixis Distribution, LLC
888 Boylston Street, Suite 800
Boston, Massachusetts 02199-8197
(Name and address of agent for service)
Registrant’s telephone number, including area code: (617) 449-2810
Date of fiscal year end: November 30
Date of reporting period: November 30, 2022
Item 1. Reports to Stockholders.
| (a) | The Registrant’s annual report transmitted to shareholders pursuant to Rule 30e-1 under the Investment Company Act of 1940 is as follows: |


Annual Report
November 30, 2022
Loomis Sayles Global Growth Fund
Loomis Sayles Senior Floating Rate and Fixed Income Fund
Vaughan Nelson Select Fund
TABLE OF CONTENTS

LOOMIS SAYLES GLOBAL GROWTH FUND
| | |
| |
| Manager: | | Symbols: |
| |
| Aziz V. Hamzaogullari, CFA® | | Class A LSAGX |
| |
| Loomis, Sayles & Company, L.P. | | Class C LSCGX |
| |
| | Class N LSNGX |
| |
| | Class Y LSGGX |
Investment Goal
The Fund’s investment goal is long-term growth of capital.
Market Conditions
Global equities experienced a meaningful decline and elevated volatility in the past 12 months. Persistently high inflation prompted the US Federal Reserve (Fed) to end its quantitative easing program and raise the federal funds rate by a total of 375 basis points. Other central banks across the globe took similar actions. Furthermore, the high uncertainty surrounding the terminal fed funds rate led to heightened market volatility. Tightening monetary policy, in turn, fueled concerns that the world economy might enter a recession in 2023. While corporate earnings held up relatively well through these challenging conditions, expectations that profits could decline in the year ahead contributed to a compression of valuations.
Geopolitical factors may have also played a key role in equities’ negative return. Russia’s invasion of Ukraine may have weighed on sentiment, as did the supply chain disruptions, higher energy prices, and the slowdown in Europe’s growth that followed in its wake. China was an additional source of concern, as the government’s heightened regulatory focus and zero-Covid policy hindered the country’s economy and acted as a headwind for global growth.
These factors contributed to broad-based weakness across the world equity markets, with outsized losses for Europe, the emerging markets, and mega-cap technology-related companies in the US. Higher-growth stocks were also negatively impacted. On the other hand, energy stocks delivered strong gains behind the rally in crude oil prices.
Performance Results
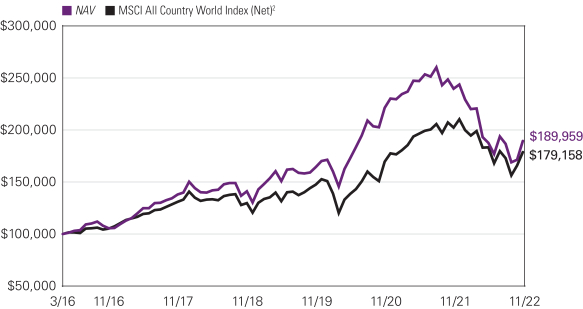
For the 12 months ended November 30, 2022, Class Y shares of the Loomis Sayles Global Growth Fund returned -20.95% at net asset value. The Fund underperformed its benchmark, the MSCI All Country World Index (Net), which returned -11.62%.
Explanation of Fund Performance
We are an active manager with a long-term, private equity approach to investing. Through our proprietary bottom-up research framework, we look to invest in those few high-quality businesses with sustainable competitive advantages and profitable growth when they trade at a significant discount to intrinsic value. Given the rare confluence of quality, growth, and valuation, we may study dozens of companies but may only invest in a select few businesses each year. We believe identifying those few businesses with such characteristics is an art, not a science. As a result of this rigorous approach, ours is a selective, high-conviction portfolio of typically 30-45 names.
The Fund’s positions in Meta Platforms, Amazon, and Alphabet detracted the most from performance. Stock selection in the communication services, information technology, consumer discretionary, and industrials sectors, as well as our allocations in the communication services, energy, consumer discretionary, financials, and information technology sectors, detracted from relative performance.
Meta Platforms operates online social networking platforms that allow people to connect, share, and interact with friends and communities. With over 3.6 billion monthly users and 200 million businesses worldwide using its family of apps – Facebook, Messenger, WhatsApp, and Instagram – the scale and reach of Meta’s network is unrivaled. A Fund holding since inception, Meta reported financial results during the period that were generally mixed with respect to consensus expectations. The company faced headwinds arising from privacy restrictions by Apple, the continuing negative impact of macro factors such as supply chain disruptions on advertising spending, and a transition to a new product format – short-form video – where monetization is currently lower. Management previously addressed the changes by Apple, which it believes decreased the accuracy of Facebook’s ad targeting, increased the difficulty of measuring outcomes, and contributed to underreporting of successful conversions such as sales and app installs by approximately 15% in the third quarter of 2021. The company has already been investing in a number of solutions, including commerce tools to help businesses reach more customers and privacy-enhancing technologies, and believes it has closed a substantial portion of the measurement gap. The company expects to further reduce the amount of underreporting in 2022 but expects the changes will remain a headwind. Apple’s changes impact not just Meta, but the broader mobile advertising ecosystem. As a function of its competitive advantages, we believe Meta remains well positioned relative to its peers, and there are no changes to our
1 |
assessment of the company’s quality or secular growth opportunities. Another near-term headwind is the company’s capital investments in and transition to a new product format – the short-form video. During our ownership of Meta, Facebook has gone through several product transitions including from desktop to mobile platforms, from newsfeed to stories, and now to short-form videos. Each such transition first requires capital expenditures followed by a gradual revenue ramp-up, creating pressures on topline, margins, and earnings. Over time, the required investment decreases and revenues increase. Of note, the Instagram “Reels” product, launched in August 2020, is now Meta’s fastest growing content format and largest contributor to engagement. The company previously reported that Reels was consuming more than 20% of users’ time spent on Instagram, and video, including FB Reels, accounted for 50% of time spent on Facebook. In the most recent quarter, the company reported a further 30% increase in time people spent on Reels across Facebook and Instagram. We believe this is a necessary cycle for maintaining sustainable competitive advantages and long-term growth. Finally, the company continues to invest significantly in its early-stage Reality Labs segment, which includes augmented and virtual reality products that the company views as building its long-term vision for the metaverse. While the company has incurred year-to-date operating expenses of $10.9 billion in the Reality Labs segment, the investment represented only one-third of the operating profit generated by the company’s highly profitable core business. Mark Zuckerberg has always managed the company with a long-term focus and strong strategic vision. Over the past ten years, Meta has spent over $90 billion on research and development and $80 billion on capital expenditures – a level of investment which few firms can match, and which creates high barriers to entry for competitors. And while the successful development of a metaverse is not an explicit part of our investment thesis for Meta, given the potential size of the opportunity, which we estimate could impact over $1 trillion of spending over the long term, and Meta’s positioning with billions of users and hundreds of millions of businesses, we believe Meta’s current balanced approach to its forward-looking investments makes sense. On the basis of its core business alone, we believe the company is substantially undervalued, even accounting for elevated levels of investment. Despite the near-term pressure on financial results, Meta continues to have significant advantages arising from its network of almost 3 billion daily users of its family of apps, 200 million businesses that use its platforms and tools every month, and 10 million advertisers who have consistently paid more per user for access to its rare network. We expect that corporations will continue to allocate an increasing proportion of their advertising spending online, and Meta remains one of very few platforms where advertisers can reach consumers at such scale in such a targeted and effective fashion. We believe Meta’s brands, network, and targeting advantage position the company to take increasing share of the industry’s profit pool and grow its market share from 6% currently to approximately 10% of the total global advertising market over our investment time horizon. We also believe that the expectations embedded in Meta’s current share price show a lack of appreciation for the company’s growth opportunities and the sustainability of its business model. We believe the consensus expectations and current market price reflect assumptions for free cash flow growth that are well below our long-term expectations of high-teens cash flow growth. As a result, we believe the shares trade at a significant discount to our estimate of intrinsic value, creating a compelling reward-to-risk opportunity. We took advantage of near-term market weakness to add to our position on multiple occasions over the past year.
Online retailer Amazon offers millions of products – sold by Amazon or by third parties – with the value proposition to consumers of selection, price, and convenience. Amazon’s enterprise IT business, Amazon Web Services (AWS), offers a suite of secure, on-demand cloud-computing services, with a value proposition to clients of speed, agility, and savings. In both of its core markets, we believe Amazon possesses strong and sustainable competitive advantages that would be difficult for competitors to replicate. A Fund holding since inception, Amazon reported fundamentally solid operating results that were generally above management’s guidance during the period. However, Amazon is facing short-term cost inflation that has contributed to over $10 billion of incremental expense over the past few quarters. While a portion of the additional expense is outside of Amazon’s direct control, including higher shipping, fuel, and labor costs, approximately two-thirds stems from Amazon’s strategic decision to invest in labor to make up for Covid-related employee absences, as well as investments undertaken to ensure that its fulfillment and transportation network remain unconstrained during the pandemic. And while expense pressures are expected to persist for the foreseeable future, Amazon expects them to decline over the coming quarters. Over time, we expect that Amazon will take steps to mitigate external cost inflation, and that it will realize greater productivity and fixed cost leverage from its investments in labor, fulfillment, and distribution. Despite a deceleration of revenue growth in its online retail business from the pandemic-enhanced prior year, we continue to believe Amazon is well positioned for durable long-term growth. Further, the company has added over 50 million Prime members over the past two years and is seeing strong growth in other businesses including AWS and advertising. Earlier this year, the company announced it was increasing the price of Prime membership for the first time since 2018, which we believe reflects its pricing power and ability to offset cost inflation. These near-term challenges do not impact our long-term view of Amazon’s quality, growth, or the attractiveness of its reward-to-risk proposition. We believe Amazon is one of the best-positioned companies in e-commerce and enterprise IT – in each case addressing large, underpenetrated markets experiencing secular growth that is still in its early stages. We believe the current share price shows a lack of appreciation for Amazon’s significant long-term growth opportunities and the sustainability of its business model. As a result, we believe the company is selling at a significant discount to our estimate of intrinsic value and offers a compelling reward-to-risk opportunity.
Alphabet is a holding company that owns a collection of businesses – the largest and most important of which by far is Google. Google is the global leader in online search and advertising, and also offers online cloud solutions to businesses and consumers
| 2
LOOMIS SAYLES GLOBAL GROWTH FUND
globally. We believe Alphabet’s competitive advantages include its scale, brand strength, the power of its network and business ecosystem, and innovative culture that is reinforced by its massive investments in research and development (R&D). A Fund holding since inception, Alphabet reported financial results during the period that were fundamentally solid and generally in line with consensus expectations for revenues and operating profits. After a strong first-half recovery in advertising spending, which had been depressed due to Covid-19 in the prior-year period, still solid growth in advertising revenue decelerated over the past six months due to challenging prior-year comparisons. The company also observed a slowdown from some advertisers in its YouTube and network advertising businesses. For comparison, YouTube growth of -2% in the most recent quarter came on top of 43% growth in the prior-year period. Despite some cyclical softening in advertising, YouTube continues to benefit from strong demand from brand advertisers due to its reach and engagement with over 2 billion monthly users who recently spent over 1 billion hours daily on the platform. As with other platforms, the company is transitioning to short-form videos, where monetization is currently lower. However, the company reported that YouTube Shorts were being watched each month by over 1.5 billion signed-in users, and that they were receiving over 30 billion daily views. Google Cloud revenue represented almost 10% of total revenue, and ended the period with a $28 billion run rate, up almost 40% year over year. We believe Google’s key revenue drivers of mobile search, YouTube, programmatic advertising, and an emerging cloud business that is Google’s fastest growing business, each continue to benefit from secular drivers including increased mobility, video advertising, better use of advertising technology to drive performance, and increased penetration of public cloud services. Google’s attractive financial model generates strong free cash flow and earns high returns on invested capital, enabling it to reinvest significantly in its business. Over the past fifteen years, Google has invested almost $190 billion in R&D and made over $160 billion of capital expenditures, an amount very few companies could replicate, and which creates high barriers to entry for competitors. We believe the global secular shift from traditional advertising to online advertising is the biggest long-term growth driver for Google. Online advertising accounts for approximately $450 billion, or around 25% of the $1.7 trillion annual spending on global advertising and marketing. Over our investment horizon, we believe this penetration will increase to over 40%. We believe investors underestimate Alphabet’s growth opportunities and the intrinsic value of the business given its unique and difficult-to-replicate attributes and business model. As a result, we believe the company’s shares trade at a significant discount to our estimate of intrinsic value and offer a compelling reward-to-risk opportunity.
The Fund’s positions in Vertex Pharmaceuticals, Alnylam Pharmaceuticals, and Novartis contributed the most to performance. Stock selection in the healthcare, consumer staples, energy, and financials sectors, along with our allocation in the healthcare sector, contributed positively to relative performance.
Vertex Pharmaceuticals is the leader in creating therapies for patients suffering from cystic fibrosis (CF), with four currently approved treatments, and the company is building out its capabilities to address related diseases that lever its core expertise in biology and medicinal chemistry. A Fund holding since the second quarter of 2021, Vertex reported financial results during the period that reflected the continued penetration of Trikafta, its latest and most efficacious CF therapy. In the US, the company continues to reach younger patients with newer generation therapies, while also penetrating a broader scope of international markets, both through new patients that did not previously have a therapy available and patients switching from older generations of therapies to the new standard of care. Vertex has now reached reimbursement agreements with 30 countries since Trikafta’s approval in late 2019. Outside of CF, the company has significant clinical efforts targeting type-1 diabetes, non-opioid pain relief, and kidney disease, and expects to start regulatory filings for its Exa-Cel therapy for blood disorders (formerly known as CTX001), co-developed with CRISPR Therapeutics, by year-end 2022. We believe Vertex’s strong and sustainable competitive advantages include its unparalleled understanding of CF, for which it is recognized as setting the standard of care, its partnerships with the CF Foundation and other entities that enhance its solutions capabilities, and its broader understanding of biology and serial approach to drug development. We believe expectations embedded in Vertex’s share price underestimate the defensibility of its dominant CF franchise, the life-changing benefit of its therapies for its growing base of 40,000 patients, and the strength of its science and innovation ability that is contributing to a growing pipeline of potentially transformative therapies outside of CF. We trimmed the position during the period following strong price performance but continue to believe the shares embed expectations for revenue and free cash flow that are below our long-term expectations. As a result, we believe the shares are trading at a discount to our estimate of intrinsic value and offer an attractive reward-to-risk opportunity.
Alnylam Pharmaceuticals is a leader in gene therapies based on its pioneering small-interfering RNA (siRNA) approach to disease treatment. Founded in 2002, Alnylam was one of the first companies to develop and commercialize therapies based on RNA interference (RNAi), a breakthrough discovery in understanding how genes are naturally regulated within cells, which was recognized with the 2006 Nobel Prize in Medicine. We believe Alnylam’s strong and sustainable competitive advantages include its deep, cumulative and compounding knowledge in the science of RNAi therapeutics, in particular its creation and advancement of unique siRNA-based therapies, and the multiple partnerships it has entered on the basis of its technology which provide both external funding and established commercialization avenues. Today, the company’s technology is the basis for five approved therapies, six therapies currently in clinical trials, and a robust pipeline of potential treatments that we expect to enter clinical trials in the coming years, with a focus on genetic diseases, cardiometabolic diseases, infectious diseases, and central nervous system and ocular diseases. A
3 |
Fund holding since the second quarter of 2021, shares jumped almost 50% in August following news that Onpattro, the company’s approved therapy for hATTR amyloidosis, met its primary endpoint in the much larger indication of ATTR with cardiomyopathy, which is estimated to have a patient population approximately ten times as large. The results substantially increase the likelihood that the therapy will receive approval in the new indication, where it would be the first RNAi-based therapy. We believe the uniqueness of Alnylam’s pioneering scientific expertise and technology is evident from both its existing products, which provide meaningful value to previously underserved patient populations, and the numerous partnerships in which world-class global pharmaceutical companies and specialty competitors alike have sought to access its proprietary technology. With its approved therapies and substantial pipeline of significant late-stage clinical programs, we believe the company has now reached the point at which its existing therapies will continue to contribute positively and its subsequent innovations will shift its financial profile from that of an early-stage biotech company to a profitable business with normalized margins, and one able to internally fund its ongoing growth needs. Over our long-term investment horizon, we believe the company can generate substantial revenue growth while turning profitable and generating substantial cumulative free cash flow. We believe Alnylam’s market price continues to substantially undervalue the potential contribution from the company’s clinical-stage assets – which we believe is unsupported by the company’s established track record for producing genetically validated therapeutics. Further, while embedded expectations reflect some success for its currently marketed products, we believe the market is focused on short-term profitability while ignoring the platform the company has built, which we believe will serve as the basis for ongoing innovation over our long-term investment horizon and beyond. As a result, we believe the company is selling at a substantial discount to our estimate of its intrinsic value and offers a compelling reward-to-risk opportunity.
Novartis is a diversified global healthcare company with market leadership in branded and generic pharmaceuticals. The company’s Innovative Medicines division accounts for about 80% of total revenue and 85% of core operating income, while the Sandoz generics and biosimilars division accounts for about 20% of revenue and approximately 15% of core operating income. We believe Novartis’ strong and sustainable competitive advantages include its brand, culture of innovation, product breadth, clinical trials expertise, powerful global manufacturing and distribution network, and the benefits of scale. Decades of investment in innovative R&D and the accumulation of intellectual property has resulted in a broad suite of mature, successful products, as well as newer, differentiated, rapidly growing products, and a large, well-balanced clinical pipeline of approximately 75 new molecular entities and approximately 150 projects in total, which we believe will lay the foundation of growth for the next 10 years. A Fund holding since inception, Novartis reported financial results that were fundamentally solid and generally in line with consensus expectations during the period. We believe the company executed well during the period, which included strong performance in its “growth” portfolio that now accounts for over 50% of sales. The company also continued to streamline its organization to focus on innovation. During the period, this included combining its oncology and non-oncology units into a single focused unit, announcing a spin-off of its Sandoz unit, expected in late 2023, and announcing that the company would use the proceeds from the sale of its ownership interest in Roche to buy back up to $15 billion of Novartis shares. Novartis remains a differentiated business that we believe will benefit from accelerating growth, continued solid execution, a structurally improving business, and a strong management team that is making sound strategic decisions to enable greater focus on the company’s long-term competitive advantages of brand, scale, technology, and innovation. We believe the company is focused on and executing in the right areas of growth to create long-term shareholder value, and the current stock price embeds future growth expectations that are well below our forecasts. As a result, we believe the shares are selling at a discount to our estimate of intrinsic value and offer a compelling reward-to-risk opportunity. We trimmed our position during the period, but Novartis remained our top holding as of November 30.
All aspects of our quality-growth-valuation investment thesis must be present simultaneously for us to make an investment. Often our research is completed well in advance of the opportunity to invest. We are patient investors and maintain coverage of high-quality businesses in order to take advantage of meaningful price dislocations if and when they occur. During the period we initiated new positions in Block, Doximity, Netflix, Shopify, and Tesla. We added to our existing holdings in Ambev, Boeing, CRISPR, Fanuc, Meta, and Under Armour. We trimmed our existing positions in Alibaba, Deere, Nestle, Novartis, Oracle, Reckitt Benckiser, Roche, Unilever, and Vertex Pharmaceuticals. We sold our positions in Colgate Palmolive, Core Laboratories, and Schlumberger.
Outlook
Our investment process is characterized by bottom-up fundamental research and a long-term investment time horizon. The nature of the process leads to a lower-turnover portfolio in which sector positioning is the result of stock selection. The Fund ended the year with overweight positions in the communication services, consumer discretionary, healthcare, information technology, and industrials sectors and underweight positions in the financials and consumer staples sectors. We did not own positions in the energy, materials, utilities or real estate sectors.
| 4
LOOMIS SAYLES GLOBAL GROWTH FUND
Top Ten Holdings as of November 30, 2022
| | | | | | | | |
| | | |
| | | | Security Name | | % of
Net Assets | |
| | 1 | | | Novartis AG | | | 5.18 | % |
| | 2 | | | Alphabet, Inc. | | | 5.01 | |
| | 3 | | | MercadoLibre, Inc. | | | 4.85 | |
| | 4 | | | Amazon.com, Inc. | | | 4.68 | |
| | 5 | | | Boeing Co. (The) | | | 4.36 | |
| | 6 | | | Visa, Inc. | | | 4.29 | |
| | 7 | | | Microsoft Corp. | | | 3.75 | |
| | 8 | | | Adyen NV | | | 3.70 | |
| | 9 | | | Oracle Corp. | | | 3.63 | |
| | 10 | | | Meta Platforms, Inc. | | | 3.58 | |
The portfolio is actively managed and holdings are subject to change. There is no guarantee the Fund continues to invest in the securities referenced. The holdings listed exclude any temporary cash investments, are presented on an individual security basis and do not represent holdings of the issuer.
Hypothetical Growth of $100,000 Investment in Class Y Shares
March 31, 2016 (inception) through November 30, 20223
5 |
Average Annual Total Returns — November 30, 20223
| | | | | | | | | | | | | | | | | | | | | | | | |
| | | | | | | | | | | | | | | Expense Ratios4 | |
| | | 1 Year | | | 5 Years | | | Life of Class | | | Gross | | | Net | |
| | | | | | | |
| Class Y (Inception 3/31/16) | | | | | | | | | | | Class Y/A/C | | | | Class N | | | | | | | | | |
| NAV | | | -20.95 | % | | | 6.57 | % | | | 10.10 | % | | | — | % | | | 1.04 | % | | | 0.95 | % |
| | | | | | | |
| Class A (Inception 3/31/16) | | | | | | | | | | | | | | | | | | | | | | | | |
| NAV | | | -21.08 | | | | 6.31 | | | | 9.83 | | | | — | | | | 1.29 | | | | 1.20 | |
| With 5.75% Maximum Sales Charge | | | -25.60 | | | | 5.06 | | | | 8.85 | | | | — | | | | | | | | | |
| | | | | | | |
| Class C (Inception 3/31/16) | | | | | | | | | | | | | | | | | | | | | | | | |
| NAV | | | -21.71 | | | | 5.51 | | | | 8.99 | | | | — | | | | 2.04 | | | | 1.95 | |
| With CDSC1 | | | -22.44 | | | | 5.51 | | | | 8.99 | | | | — | | | | | | | | | |
| | | | | | | |
| Class N (Inception 3/31/17) | | | | | | | | | | | | | | | | | | | | | | | | |
| NAV | | | -20.87 | | | | 6.61 | | | | — | | | | 9.24 | | | | 0.98 | | | | 0.90 | |
| | | | | | | |
| Comparative Performance | | | | | | | | | | | | | | | | | | | | | | | | |
| MSCI All Country World Index (Net)2 | | | -11.62 | | | | 6.41 | | | | 9.11 | | | | 8.10 | | | | | | | | | |
Performance data shown represents past performance and is no guarantee of, and not necessarily indicative of, future results. Total return and value will vary, and you may have a gain or loss when shares are sold. Current performance may be lower or higher than quoted. For most recent month-end performance, visit im.natixis.com/performance. Performance for other share classes will be greater or less than shown based on differences in fees and sales charges. You may not invest directly in an index. Performance for periods less than one year is cumulative, not annualized. Returns reflect changes in share price and reinvestment of dividends and capital gains, if any. The table(s) do not reflect taxes shareholders might owe on any fund distributions or when they redeem their shares.
| 1 | Performance for Class C shares assumes a 1% contingent deferred sales charge (“CDSC”) applied when you sell shares within one year of purchase. |
| 2 | MSCI All Country World Index (Net) is a free float-adjusted market capitalization weighted index that is designed to measure the equity market performance of developed and emerging markets. |
| 3 | Fund performance has been increased by fee waivers and/or expense reimbursements, if any, without which performance would have been lower. |
| 4 | Expense ratios are as shown in the Fund’s prospectus in effect as of the date of this report. The expense ratios for the current reporting period can be found in the Financial Highlights section of this report under Ratios to Average Net Assets. Net expenses reflect contractual expense limitations set to expire on 3/31/23. When a Fund’s expenses are below the limitation, gross and net expense ratios will be the same. See Note 5 of the Notes to Financial Statements for more information about the Fund’s expense limitations. |
| 6
LOOMIS SAYLES SENIOR FLOATING RATE AND FIXED INCOME FUND
| | |
| |
| Managers: | | Symbols: |
| |
| John R. Bell | | Class A LSFAX |
| |
| Michael L. Klawitter,CFA® | | Class C LSFCX |
| |
| Heather M. Young,CFA® | | Class N LSFNX |
| |
| Loomis, Sayles & Company, L.P. | | Class Y LSFYX |
Investment Goal
The Fund seeks to provide a high level of current income.
Market Conditions
Despite rising interest rates throughout 2022, the loan market was hampered by strong risk-off sentiment during the latter half of the period. Lower-rated loans generally underperformed higher-rated loans, defaults were minimal, and prices were pressured by technical factors. At the end of the period, loan prices generally hovered in the low 90s, indicative of the recession concerns prevailing in the market.
New loan issuance was muted throughout the period, though the total value of loans outstanding continued to grow, ending November at a near-record high of $1.42 trillion. Collateralized loan obligation (CLO) formation remained fairly strong despite higher debt costs, as issuers were able to take advantage of lower loan prices to drive returns. Loan mutual fund flows were positive early in 2022 but switched to outflows as investors sought relative safety in other asset classes.
Performance Results
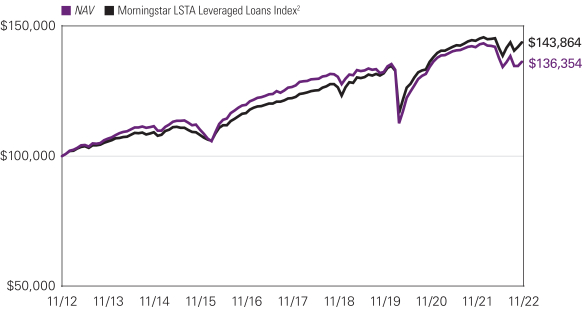
For the 12 months ended November 30, 2022, Class Y shares of the Loomis Sayles Senior Floating Rate and Fixed Income Fund returned -4.04% at net asset value. The Fund underperformed its benchmark, the Morningstar LSTA Leveraged Loan Index, which returned -0.41%.
Explanation of Fund Performance
The Fund underperformed its benchmark for the full period, primarily due to the risk positioning of bank loan holdings given the risk-off tone that persisted during much of the period.
The most significant detractor from performance versus the benchmark was the Fund’s overweight in B-rated loans, followed by its underweighting of higher-quality loans relative to the benchmark. The Fund’s higher-than-average cash balance, maintained for liquidity purposes, contributed slightly to relative performance. Small allocations to high yield bonds and US Treasuries detracted modestly from performance. However, the portfolio experienced no defaults, and its interest income saw strong growth as interest rates increased during the period.
We target a yield advantage for the Fund versus the benchmark in most market conditions. A yield advantage can be enhanced through primary market new issue discounts and by swapping into loans or bonds with more appealing risk/return characteristics as those opportunities arise. Maintaining an appropriate liquidity policy is a primary objective. The Fund is currently positioned with about 81% bank loans, 7% bonds, and 4% Treasury notes and bills, and 8% held in cash on a trade-date basis.
We examine the relative attractiveness of the high yield corporate bond market in relation to bank loans based on potential risk-adjusted return. We judge potential return on high yield bonds in comparison to loans when assessing whether the additional volatility in the bond market is appropriately compensated versus the Fund’s benchmark. Currently, we view that tradeoff as poorly compensated in much of the bond market. We initiated a small position in Treasury bills to enhance yield beyond the short-term rates offered by the Fund’s custodian, which enables us to boost Fund liquidity while earning a return.
Outlook
The environment for loan credit quality remains relatively stable despite the impact of inflation and market uncertainty. Demand for loans has been declining as investors seek relative safety or discounts in other asset classes. We agree with the market’s expectation that default rates are poised to remain low due to both company-specific circumstances (ample liquidity, few loan maturities, successful cost-savings programs, and revenue retention) and capital structures that can withstand current macroeconomic headwinds.
Inflationary cost pressures have, thus far, been well-absorbed by most of the companies to which we lend. We expect these companies will successfully handle increased borrowing costs associated with interest rate increases. We believe that most borrowers have hedged at least some of their rate risk.
7 |
Our macro base case shows odds of a downturn increasing, although we are waiting for profits to decline before making an official call on recession. We think inflation is in the process of reaching a peak. We expect the Federal Reserve to increase rates by 50 basis points at the December meeting, with future interest rate changes dependent on the patterns of jobless claims and employment. Our goal remains to construct a portfolio that can withstand many pressures without suffering significant credit losses.
Hypothetical Growth of $100,000 Investment in Class Y Shares
November 30, 2012 through November 30, 20223
Average Annual Total Returns — November 30, 20223
| | | | | | | | | | | | | | | | | | | | | | | | |
| | | | | | | | | | | | | | | Expense Ratios4 | |
| | | 1 Year | | | 5 Years | | | 10 Years | | | Life of Class | | | Gross | | | Net | |
| | | | | | | |
Class Y | | | | | | | | | | | | | | | Class N | | | | | | | | | |
NAV | | | -4.04 | % | | | 1.48 | % | | | 3.15 | % | | | — | % | | | 1.00 | % | | | 0.81 | % |
| | | | | | | |
Class A | | | | | | | | | | | | | | | | | | | | | | | | |
NAV | | | -4.28 | | | | 1.23 | | | | 2.89 | | | | — | | | | 1.25 | | | | 1.06 | |
With 3.50% Maximum Sales Charge | | | -7.59 | | | | 0.50 | | | | 2.53 | | | | — | | | | | | | | | |
| | | | | | | |
Class C | | | | | | | | | | | | | | | | | | | | | | | | |
NAV | | | -5.04 | | | | 0.46 | | | | 2.28 | | | | — | | | | 2.00 | | | | 1.81 | |
With CDSC1 | | | -5.94 | | | | 0.46 | | | | 2.28 | | | | — | | | | | | | | | |
| | | | | | | |
Class N (Inception 3/31/17) | | | | | | | | | | | | | | | | | | | | | | | | |
NAV | | | -4.00 | | | | 1.51 | | | | — | | | | 1.91 | | | | 1.04 | | | | 0.76 | |
| | | | | | | |
| Comparative Performance | | | | | | | | | | | | | | | | | | | | | | | | |
| Morningstar LSTA Leveraged Loan Index2 | | | -0.41 | | | | 3.30 | | | | 3.70 | | | | 3.36 | | | | | | | | | |
Performance data shown represents past performance and is no guarantee of, and not necessarily indicative of, future results. Total return and value will vary, and you may have a gain or loss when shares are sold. Current performance may be lower or higher than quoted. For most recent month-end performance, visit im.natixis.com/performance. Performance for other share classes will be greater or less than shown based on differences in fees and sales charges. You may not invest directly in an index. Performance for periods less than one year is cumulative, not annualized. Returns reflect changes in share price and reinvestment of dividends and capital gains, if any. The table(s) do not reflect taxes shareholders might owe on any fund distributions or when they redeem their shares.
| 1 | Performance for Class C shares assumes a 1% contingent deferred sales charge (“CDSC”) applied when you sell shares within one year of purchase, and includes automatic conversion to Class A shares after eight years. |
| 2 | Morningstar LSTA Leveraged Loan Index covers loan facilities and reflects the market-value-weighted performance of U.S. dollar-denominated institutional leveraged loans. |
| 3 | Fund performance has been increased by fee waivers and/or expense reimbursements, if any, without which performance would have been lower. |
| 4 | Expense ratios are as shown in the Fund’s prospectus in effect as of the date of this report. The expense ratios for the current reporting period can be found in the Financial Highlights section of this report under Ratios to Average Net Assets. Net expenses reflect contractual expense limitations set to expire on 3/31/23. When a Fund’s expenses are below the limitation, gross and net expense ratios will be the same. See Note 5 of the Notes to Financial Statements for more information about the Fund’s expense limitations. |
| 8
VAUGHAN NELSON SELECT FUND
| | |
| |
| Managers: | | Symbols: |
| |
| Chris D. Wallis, CFA®, CPA | | Class A VNSAX |
| |
| Scott J. Weber, CFA® | | Class C VNSCX |
| |
| Vaughan Nelson Investment Management, L.P. | | Class N VNSNX |
| |
| | Class Y VNSYX |
Investment Goal
The Fund seeks long-term capital appreciation.
Market Conditions
During the fiscal year ended November 30, 2022, equity market performance was initially defined by Russia’s invasion of Ukraine and NATO’s sharp response. These events further supported inflationary pressures and weighed on future economic growth.
The US Federal Reserve (Fed) raised the fed funds rate, kicking off the first Fed hiking cycle since 2018. The high inflation environment proved stickier than expected. With inflation elevated, the cost of capital rising, liquidity conditions deteriorating, and earnings estimates set for negative revisions, heightened equity market volatility led to further downside.
As we moved through the summer months, risk assets continued to be pressured by accelerating inflationary pressures, decelerating economic growth, and tightening financial conditions. Inflationary pressures in the US moved from goods to services and housing, in the form of owners’ equivalent rent. The yield curve flattened with the M2 (a measure of the money supply including cash, checking deposits, and other types of deposits readily convertible to cash) money supply decelerating. The rapid slowdown in economic growth and tightening financial conditions are creating a recessionary environment in the US, Europe, and most export-led economies.
Through the final months of the fiscal year, the exceptional US dollar strength drove markets as the Fed dramatically tightened financial conditions by increasing interest rates and aggressively shrinking its balance sheet. The strong US dollar accelerated the exportation of US inflation to the rest of the world, forcing nearly all global central banks to follow the Fed in raising interest rates. Tighter financial conditions forced global equity and fixed income markets to reduce investment positions and leverage, driving nearly all asset classes lower. To date, equity markets have repriced valuation multiples in line with the higher cost of capital but have not yet priced a potential earnings recession.
Performance Results
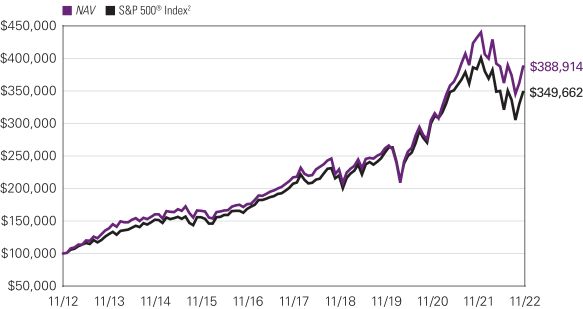
For the 12 months ended November 30, 2022, Class Y shares of the Vaughan Nelson Select Fund returned -10.31% at net asset value. The Fund underperformed its benchmark, the S&P 500® Index, which returned -9.21%.
Explanation of Fund Performance
The Fund underperformed on a relative basis during the period.
The largest detractor was industrials, driven by security selection. Saia, Inc. drove the underperformance due largely to concerns around the macro cycle. We expect their investments building out their national network for the LTL (less-than-truckload) market to improve margins in the company over time.
Selection within consumer staples detracted, with the largest underperformance led by McCormick & Company, Incorporated, who struggled with inflationary costs and supply chain pressures. The supply chain issues should prove to be temporary, and pricing actions by the company will recoup margin over time as inflation slows down.
Healthcare was a slightly negative relative sector for the Fund, and Masimo Corporation was the largest detractor from performance due to management’s misallocation of capital and high valuation.
An underweight to energy, the top performing sector, detracted from relative performance.
Information technology was the top relative performing sector for the Fund due to a strong year from Jack Henry & Associates, Inc., where the company benefited from its stable, growing, defensive business and a relatively strong end market.
In financials the Fund experienced positive attribution, with Berkshire Hathaway Inc. Class B leading the way as they benefited from a volatile macro environment where they could deploy capital as valuations dislocate.
An underweight to the challenged consumer discretionary and communication services sectors helped on a relative basis.
9 |
Both an underweight to and security selection within real estate aided relative performance. Prologis, Inc. was the top performer due to strong pricing growth and strategic capital allocation. Low vacancy rates and higher inflation should lead to high lease marks-to-market over time, and the company is adding ancillary services to enhance the value of their offering.
Finally, overweights to materials and utilities, outperforming sectors, helped throughout the fiscal year.
Outlook
Over the short to medium term, markets will continue to be heavily influenced by the ongoing energy and capital shortages dominating realpolitik. Given the nature of the challenges, there are no short-term solutions, but only tradeoffs driven by the political calendar and responses to crises as they flare up. As these twin crises confront a developing global recession with all major central banks continuing to tighten financial conditions, equity investors’ underlying premise must be that countries do not choose bankruptcy via austerity. We have witnessed pivots by the Bank of England, the European Union Bank, the Bank of Japan, and the Bank of Korea supporting this premise as they have reimplemented forms of liquidity support. Given that the current level of US interest rates would result in the bankruptcy of the US Treasury over the medium term, it will not surprise us to see the Fed also pivot as they are forced to deal with the reality of ensuring the US Treasury’s solvency.
Top Ten Holdings as of November 30, 2022
| | | | | | | | |
| | | |
| | | | Security Name | | % of
Net Assets | |
| | 1 | | | NextEra Energy, Inc. | | | 5.44 | % |
| | 2 | | | Dollar General Corp. | | | 5.16 | |
| | 3 | | | Sherwin-Williams Co. (The) | | | 5.14 | |
| | 4 | | | Wheaton Precious Metals Corp. | | | 5.04 | |
| | 5 | | | Intercontinental Exchange, Inc. | | | 4.76 | |
| | 6 | | | Microsoft Corp. | | | 4.74 | |
| | 7 | | | Danaher Corp. | | | 4.74 | |
| | 8 | | | Motorola Solutions, Inc. | | | 4.36 | |
| | 9 | | | Clorox Co. (The) | | | 4.34 | |
| | 10 | | | McCormick & Co., Inc. | | | 4.21 | |
The portfolio is actively managed and holdings are subject to change. There is no guarantee the Fund continues to invest in the securities referenced. The holdings listed exclude any temporary cash investments, are presented on an individual security basis and do not represent holdings of the issuer.
| 10
VAUGHAN NELSON SELECT FUND
Hypothetical Growth of $100,000 Investment in Class Y Shares
November 30, 2012 through November 30, 20223
Average Annual Total Returns — November 30, 20223
| | | | | | | | | | | | | | | | | | | | | | | | |
| | | | | | |
| | | | | | | | | | | | | | | Expense Ratios4 | |
| | | 1 Year | | | 5 Years | | | 10 Years | | | Life of Class | | | Gross | | | Net | |
| | | | | | | |
| Class Y | | | | | | | | | | | | | | | Class N | | | | | | | | | |
| NAV | | | -10.31 | % | | | 12.32 | % | | | 14.54 | % | | | — | % | | | 0.86 | % | | | 0.85 | % |
| | | | | | | |
| Class A | | | | | | | | | | | | | | | | | | | | | | | | |
| NAV | | | -10.50 | | | | 12.05 | | | | 14.25 | | | | — | | | | 1.11 | | | | 1.10 | |
| With 5.75% Maximum Sales Charge | | | -15.64 | | | | 10.74 | | | | 13.58 | | | | — | | | | | | | | | |
| | | | | | | |
| Class C | | | | | | | | | | | | | | | | | | | | | | | | |
| NAV | | | -11.16 | | | | 11.21 | | | | 13.57 | | | | — | | | | 1.86 | | | | 1.85 | |
| With CDSC1 | | | -11.79 | | | | 11.21 | | | | 13.57 | | | | — | | | | | | | | | |
| | | | | | | |
| Class N (Inception 3/31/17) | | | | | | | | | | | | | | | | | | | | | | | | |
| NAV | | | -10.29 | | | | 12.34 | | | | — | | | | 13.58 | | | | 49.24 | | | | 0.80 | |
| | | | | | | |
| Comparative Performance | | | | | | | | | | | | | | | | | | | | | | | | |
| S&P 500® Index2 | | | -9.21 | | | | 10.98 | | | | 13.34 | | | | 12.08 | | | | | | | | | |
Performance data shown represents past performance and is no guarantee of, and not necessarily indicative of, future results. Total return and value will vary, and you may have a gain or loss when shares are sold. Current performance may be lower or higher than quoted. For most recent month-end performance, visit im.natixis.com/performance. Performance for other share classes will be greater or less than shown based on differences in fees and sales charges. You may not invest directly in an index. Performance for periods less than one year is cumulative, not annualized. Returns reflect changes in share price and reinvestment of dividends and capital gains, if any. The table(s) do not reflect taxes shareholders might owe on any fund distributions or when they redeem their shares.
| 1 | Performance for Class C shares assumes a 1% contingent deferred sales charge (“CDSC”) applied when you sell shares within one year of purchase. |
| 2 | S&P 500® Index is a widely recognized measure of U.S. stock market performance. It is an unmanaged index of 500 common stocks chosen for market size, liquidity, and industry group representation, among other factors. It also measures the performance of the large cap segment of the U.S. equities market. |
| 3 | Fund performance has been increased by fee waivers and/or expense reimbursements, if any, without which performance would have been lower. |
| 4 | Expense ratios are as shown in the Fund’s prospectus in effect as of the date of this report. The expense ratios for the current reporting period can be found in the Financial Highlights section of this report under Ratios to Average Net Assets. Net expenses reflect contractual expense limitations set to expire on 3/31/23. When a Fund’s expenses are below the limitation, gross and net expense ratios will be the same. See Note 5 of the Notes to Financial Statements for more information about the Fund’s expense limitations. |
11 |
ADDITIONAL INFORMATION
All investing involves risk, including the risk of loss. There is no assurance that any investment will meet its performance objectives or that losses will be avoided.
The views expressed in this report reflect those of the portfolio managers as of the dates indicated. The managers’ views are subject to change at any time without notice based on changes in market or other conditions. References to specific securities or industries should not be regarded as investment advice. Because the Fund is actively managed, there is no assurance that they will continue to invest in the securities or industries mentioned.
ADDITIONAL INDEX INFORMATION
This document may contain references to third party copyrights, indexes, and trademarks, each of which is the property of its respective owner. Such owner is not affiliated with Natixis Investment Managers or any of its related or affiliated companies (collectively “Natixis Affiliates”) and does not sponsor, endorse or participate in the provision of any Natixis Affiliates services, funds or other financial products.
The index information contained herein is derived from third parties and is provided on an “as is” basis. The user of this information assumes the entire risk of use of this information. Each of the third party entities involved in compiling, computing or creating index information, disclaims all warranties (including, without limitation, any warranties of originality, accuracy, completeness, timeliness, non-infringement, merchantability and fitness for a particular purpose) with respect to such information.
PROXY VOTING INFORMATION
A description of the Natixis Funds’ proxy voting policies and procedures is available without charge, upon request, by calling Natixis Funds at 800-225-5478; on Natixis Funds’ website at im.natixis.com; and on the Securities and Exchange Commission’s (SEC) website at www.sec.gov. Information regarding how Natixis Funds voted proxies relating to portfolio securities during the most recent 12-month period ended June 30 is available from Natixis Funds’ website and the SEC’s website.
QUARTERLY PORTFOLIO SCHEDULES
The Natixis Funds file a complete schedule of portfolio holdings with the SEC for the first and third quarters of each fiscal year as an exhibit to its reports on Form N-PORT. The Funds’ Form N-PORT reports are available on the SEC’s website at www.sec.gov. First and third quarter schedules of portfolio holdings are also available at im.natixis.com/funddocuments. A hard copy may be requested from the Fund at no charge by calling 800-225-5478.
CFA® and Chartered Financial Analyst® are registered trademarks owned by the CFA Institute.
| 12
UNDERSTANDING FUND EXPENSES
As a mutual fund shareholder, you incur different costs: transaction costs, including sales charges (loads) on purchases and contingent deferred sales charges on redemptions and ongoing costs, including management fees, distribution and/or service fees (12b-1 fees), and other fund expenses. Certain exemptions may apply. These costs are described in more detail in the Funds’ prospectus. The following examples are intended to help you understand the ongoing costs of investing in the Funds and help you compare these with the ongoing costs of investing in other mutual funds.
The first line in the table of each class of Fund shares shows the actual account values and actual Fund expenses you would have paid on a $1,000 investment in the Fund from June 1, 2022 through November 30, 2022. To estimate the expenses you paid over the period, simply divide your account value by $1,000 (for example $8,600 account value divided by $1,000 = 8.60) and multiply the result by the number in the Expenses Paid During Period column as shown below for your class.
The second line in the table for each class of Fund shares provides information about hypothetical account values and hypothetical expenses based on the Fund’s actual expense ratios and an assumed rate of return of 5% per year before expenses, which is not the Fund’s actual return. The hypothetical account values and expenses may not be used to estimate the actual ending account balance or expenses you paid on your investment for the period. You may use this information to compare the ongoing costs of investing in each Fund and other funds. To do so, compare this 5% hypothetical example with the 5% hypothetical examples that appear in the shareholder reports of the other funds.
Please note that the expenses shown reflect ongoing costs only, and do not include any transaction costs, such as sales charges. Therefore, the second line in the table of each Fund is useful in comparing ongoing costs only, and will not help you determine the relative costs of owning different funds. If transaction costs were included, total costs would be higher.
| | | | | | | | | | | | |
| LOOMIS SAYLES GLOBAL GROWTH FUND | | BEGINNING
ACCOUNT VALUE
6/1/2022 | | | ENDING
ACCOUNT VALUE
11/30/2022 | | | EXPENSES PAID
DURING PERIOD*
6/1/2022 – 11/30/2022 | |
| Class A | | | | | | | | | | | | |
| Actual | | | $1,000.00 | | | | $1,008.60 | | | | $6.04 | |
| Hypothetical (5% return before expenses) | | | $1,000.00 | | | | $1,019.05 | | | | $6.07 | |
| Class C | | | | | | | | | | | | |
| Actual | | | $1,000.00 | | | | $1,004.50 | | | | $9.80 | |
| Hypothetical (5% return before expenses) | | | $1,000.00 | | | | $1,015.29 | | | | $9.85 | |
| Class N | | | | | | | | | | | | |
| Actual | | | $1,000.00 | | | | $1,009.20 | | | | $4.53 | |
| Hypothetical (5% return before expenses) | | | $1,000.00 | | | | $1,020.56 | | | | $4.56 | |
| Class Y | | | | | | | | | | | | |
| Actual | | | $1,000.00 | | | | $1,009.20 | | | | $4.78 | |
| Hypothetical (5% return before expenses) | | | $1,000.00 | | | | $1,020.31 | | | | $4.81 | |
| * | Expenses are equal to the Fund’s annualized expense ratio (after waiver/reimbursement): 1.20%, 1.95%, 0.90% and 0.95% for Class A, C, N and Y, respectively, multiplied by the average account value over the period, multiplied by the number of days in the most recent fiscal half-year (183), divided by 365 (to reflect the half-year period). |
13 |
| | | | | | | | | | | | |
| LOOMIS SAYLES SENIOR FLOATING RATE AND FIXED INCOME FUND | | BEGINNING
ACCOUNT VALUE
6/1/2022 | | | ENDING
ACCOUNT VALUE
11/30/2022 | | | EXPENSES PAID
DURING PERIOD*
6/1/2022 – 11/30/2022 | |
| Class A | | | | | | | | | | | | |
| Actual | | | $1,000.00 | | | | $986.80 | | | | $5.23 | |
| Hypothetical (5% return before expenses) | | | $1,000.00 | | | | $1,019.80 | | | | $5.32 | |
| Class C | | | | | | | | | | | | |
| Actual | | | $1,000.00 | | | | $983.00 | | | | $8.95 | |
| Hypothetical (5% return before expenses) | | | $1,000.00 | | | | $1,016.04 | | | | $9.10 | |
| Class N | | | | | | | | | | | | |
| Actual | | | $1,000.00 | | | | $988.30 | | | | $3.74 | |
| Hypothetical (5% return before expenses) | | | $1,000.00 | | | | $1,021.31 | | | | $3.80 | |
| Class Y | | | | | | | | | | | | |
| Actual | | | $1,000.00 | | | | $988.10 | | | | $3.99 | |
| Hypothetical (5% return before expenses) | | | $1,000.00 | | | | $1,021.06 | | | | $4.05 | |
| * | Expenses are equal to the Fund’s annualized expense ratio (after waiver/reimbursement): 1.05%, 1.80%, 0.75% and 0.80% for Class A, C, N and Y, respectively, multiplied by the average account value over the period, multiplied by the number of days in the most recent fiscal half-year (183), divided by 365 (to reflect the half-year period). |
| | | | | | | | | | | | |
| VAUGHAN NELSON SELECT FUND | | BEGINNING
ACCOUNT VALUE
6/1/2022 | | | ENDING
ACCOUNT VALUE
11/30/2022 | | | EXPENSES PAID
DURING PERIOD*
6/1/2022 – 11/30/2022 | |
| Class A | | | | | | | | | | | | |
| Actual | | | $1,000.00 | | | | $998.30 | | | | $5.56 | |
| Hypothetical (5% return before expenses) | | | $1,000.00 | | | | $1,019.50 | | | | $5.62 | |
| Class C | | | | | | | | | | | | |
| Actual | | | $1,000.00 | | | | $994.90 | | | | $9.30 | |
| Hypothetical (5% return before expenses) | | | $1,000.00 | | | | $1,015.74 | | | | $9.40 | |
| Class N | | | | | | | | | | | | |
| Actual | | | $1,000.00 | | | | $999.40 | | | | $4.01 | |
| Hypothetical (5% return before expenses) | | | $1,000.00 | | | | $1,021.06 | | | | $4.05 | |
| Class Y | | | | | | | | | | | | |
| Actual | | | $1,000.00 | | | | $999.40 | | | | $4.31 | |
| Hypothetical (5% return before expenses) | | | $1,000.00 | | | | $1,020.76 | | | | $4.36 | |
| * | Expenses are equal to the Fund’s annualized expense ratio (after waiver/reimbursement): 1.11%, 1.86%, 0.80% and 0.86% for Class A, C, N and Y, respectively, multiplied by the average account value over the period, multiplied by the number of days in the most recent fiscal half-year (183), divided by 365 (to reflect the half-year period). |
| 14
Portfolio of Investments – as of November 30, 2022
Loomis Sayles Global Growth Fund
| | | | | | | | |
Shares | | | Description | | Value (†) | |
| | Common Stocks — 100.0% of Net Assets | |
| | | | Brazil — 8.1% | |
| | 1,002,597 | | | Ambev S.A., ADR | | $ | 3,057,921 | |
| | 4,929 | | | MercadoLibre, Inc.(a) | | | 4,588,825 | |
| | | | | | | | |
| | | | | | | 7,646,746 | |
| | | | | | | | |
| | | | Canada — 2.5% | |
| | 58,050 | | | Shopify, Inc., Class A(a) | | | 2,373,084 | |
| | | | | | | | |
| | | | China — 12.7% | |
| | 16,020 | | | Alibaba Group Holding Ltd., Sponsored ADR(a)(b) | | | 1,402,711 | |
| | 15,534 | | | Baidu, Inc., Sponsored ADR(a)(b) | | | 1,686,992 | |
| | 178,432 | | | Budweiser Brewing Co. APAC Ltd., 144A | | | 517,610 | |
| | 10,493 | | | NXP Semiconductors NV | | | 1,845,089 | |
| | 72,600 | | | Tencent Holdings Ltd.(b) | | | 2,745,463 | |
| | 65,259 | | | Trip.com Group Ltd., ADR(a)(b) | | | 2,085,025 | |
| | 31,624 | | | Yum China Holdings, Inc. | | | 1,743,115 | |
| | | | | | | | |
| | | | | | | 12,026,005 | |
| | | | | | | | |
| | | | Denmark — 2.2% | |
| | 16,969 | | | Novo Nordisk A/S, Class B | | | 2,128,558 | |
| | | | | | | | |
| | | | France — 1.0% | |
| | 9,448 | | | Sodexo S.A. | | | 904,868 | |
| | | | | | | | |
| | | | Japan — 2.5% | |
| | 15,800 | | | FANUC Corp. | | | 2,375,703 | |
| | | | | | | | |
| | | | Netherlands — 3.7% | |
| | 2,220 | | | Adyen NV, 144A(a) | | | 3,497,208 | |
| | | | | | | | |
| | | | Switzerland — 7.3% | |
| | 36,003 | | | CRISPR Therapeutics AG(a) | | | 1,972,604 | |
| | 55,056 | | | Novartis AG, (Registered) | | | 4,897,481 | |
| | | | | | | | |
| | | | | | | 6,870,085 | |
| | | | | | | | |
| | | | United Kingdom — 4.2% | |
| | 73,068 | | | Experian PLC | | | 2,585,237 | |
| | 7,136 | | | Reckitt Benckiser Group PLC | | | 512,104 | |
| | 17,572 | | | Unilever PLC | | | 881,239 | |
| | | | | | | | |
| | | | | | | 3,978,580 | |
| | | | | | | | |
| | | | United States — 55.8% | |
| | 14,378 | | | Alnylam Pharmaceuticals, Inc.(a) | | | 3,171,643 | |
| | 46,976 | | | Alphabet, Inc., Class A(a) | | | 4,744,106 | |
| | 45,869 | | | Amazon.com, Inc.(a) | | | 4,428,193 | |
| | 5,094 | | | Autodesk, Inc.(a) | | | 1,028,733 | |
| | 16,148 | | | Block, Inc.(a) | | | 1,094,350 | |
| | 23,077 | | | Boeing Co. (The)(a) | | | 4,128,014 | |
| | 2,194 | | | Deere & Co. | | | 967,554 | |
| | 39,300 | | | Doximity, Inc., Class A(a) | | | 1,335,807 | |
| | 7,384 | | | Expeditors International of Washington, Inc. | | | 856,987 | |
| | 28,664 | | | Meta Platforms, Inc., Class A(a) | | | 3,385,219 | |
| | 13,924 | | | Microsoft Corp. | | | 3,552,570 | |
| | 11,360 | | | Nestle S.A., (Registered) | | | 1,352,107 | |
| | 9,316 | | | Netflix, Inc.(a) | | | 2,846,318 | |
| | 41,372 | | | Oracle Corp. | | | 3,435,117 | |
| | 12,572 | | | QUALCOMM, Inc. | | | 1,590,232 | |
| | 7,026 | | | Roche Holding AG | | | 2,294,859 | |
| | 11,771 | | | Salesforce, Inc.(a) | | | 1,886,303 | |
| | 15,733 | | | SEI Investments Co. | | | 979,851 | |
| | 10,336 | | | Tesla, Inc.(a) | | | 2,012,419 | |
| | 88,566 | | | Under Armour, Inc., Class A(a) | | | 885,660 | |
| | 6,102 | | | Vertex Pharmaceuticals, Inc.(a) | | | 1,930,673 | |
| | 18,687 | | | Visa, Inc., Class A | | | 4,055,079 | |
| | 6,227 | | | Yum! Brands, Inc. | | | 801,166 | |
| | | | | | | | |
| | | | | | | 52,762,960 | |
| | | | | | | | |
| | | | Total Common Stocks
(Identified Cost $103,405,647) | | | 94,563,797 | |
| | | | | | | | |
| | Short-Term Investments — 0.6% | |
| $ | 581,057 | | | Tri-Party Repurchase Agreement with Fixed Income Clearing Corporation, dated 11/30/2022 at 1.500% to be repurchased at $581,082 on 12/01/2022 collateralized by $556,200 U.S. Treasury Bond, 7.625% due 2/15/2025 valued at $592,722 including accrued interest (Note 2 of Notes to Financial Statements)
(Identified Cost $581,057) | | $ | 581,057 | |
| | | | | | | | |
| | | | | | | | |
| | | | Total Investments — 100.6%
(Identified Cost $103,986,704) | | | 95,144,854 | |
| | | | Other assets less liabilities — (0.6)% | | | (525,055 | ) |
| | | | | | | | |
| | | | Net Assets — 100.0% | | $ | 94,619,799 | |
| | | | | | | | |
| | | | | | | | |
| | (†) | | | See Note 2 of Notes to Financial Statements. | |
| | (a) | | | Non-income producing security. | |
| | (b) | | | Security invests in variable interest entities based in China. See Note 8 of Notes to Financial Statements. | |
| | | | | |
| | 144A | | | All or a portion of these securities are exempt from registration under Rule 144A of the Securities Act of 1933. These securities may be resold in transactions exempt from registration, normally to qualified institutional buyers. At November 30, 2022, the value of Rule 144A holdings amounted to $4,014,818 or 4.2% of net assets. | |
| | ADR | | | An American Depositary Receipt is a certificate issued by a custodian bank representing the right to receive securities of the foreign issuer described. The values of ADRs may be significantly influenced by trading on exchanges not located in the United States. | |
Industry Summary at November 30, 2022
| | | | |
Interactive Media & Services | | | 13.3 | % |
IT Services | | | 11.7 | |
Internet & Direct Marketing Retail | | | 11.1 | |
Software | | | 10.5 | |
Pharmaceuticals | | | 9.8 | |
Biotechnology | | | 7.5 | |
Hotels, Restaurants & Leisure | | | 5.9 | |
Aerospace & Defense | | | 4.4 | |
Beverages | | | 3.7 | |
Semiconductors & Semiconductor Equipment | | | 3.7 | |
Machinery | | | 3.5 | |
Entertainment | | | 3.0 | |
Professional Services | | | 2.7 | |
Automobiles | | | 2.1 | |
Other Investments, less than 2% each | | | 7.1 | |
Short-Term Investments | | | 0.6 | |
| | | | |
Total Investments | | | 100.6 | |
Other assets less liabilities | | | (0.6 | ) |
| | | | |
Net Assets | | | 100.0 | % |
| | | | |
Currency Exposure Summary at November 30, 2022
| | | | |
United States Dollar | | | 74.6 | % |
Swiss Franc | | | 9.0 | |
Euro | | | 5.6 | |
Hong Kong Dollar | | | 3.4 | |
British Pound | | | 3.3 | |
Japanese Yen | | | 2.5 | |
Danish Krone | | | 2.2 | |
| | | | |
Total Investments | | | 100.6 | |
Other assets less liabilities | | | (0.6 | ) |
| | | | |
Net Assets | | | 100.0 | % |
| | | | |
See accompanying notes to financial statements.
15 |
Portfolio of Investments – as of November 30, 2022
Loomis Sayles Senior Floating Rate and Fixed Income Fund
| | | | | | | | |
Principal Amount | | | Description | | Value (†) | |
| | Senior Loans — 81.3% of Net Assets | |
| | | | Aerospace & Defense — 0.1% | |
| $ | 617,000 | | | Spirit Aerosystems, Inc., 2022 Term Loan, 1/15/2027(a) | | $ | 608,775 | |
| | | | | | | | |
| | | | Airlines — 2.5% | |
| | 9,595,000 | | | American Airlines, Inc., 2021 Term Loan, 3-month LIBOR + 4.750%, 8.993%, 4/20/2028(b)(c) | | | 9,528,219 | |
| | 4,791,499 | | | LifeMiles Ltd., 2021 Term Loan B, 3-month LIBOR + 5.250%, 9.985%, 8/30/2026(c)(d) | | | 4,318,338 | |
| | 2,375,000 | | | Mileage Plus Holdings LLC, 2020 Term Loan B, 3-month LIBOR + 5.250%, 8.777%, 6/21/2027(c)(d) | | | 2,440,312 | |
| | 3,065,667 | | | SkyMiles IP Ltd., 2020 SkyMiles Term Loan B, 3-month LIBOR + 3.750%, 7.993%, 10/20/2027(c)(d) | | | 3,106,287 | |
| | 6,067,150 | | | United Airlines, Inc., 2021 Term Loan B, 3-month LIBOR + 3.750%, 8.108%, 4/21/2028(b)(c) | | | 5,982,635 | |
| | | | | | | | |
| | | | | | | 25,375,791 | |
| | | | | | | | |
| | | | Automotive — 1.8% | |
| | 4,000,000 | | | First Brands Group LLC, 2021 2nd Lien Term Loan, 3-month LIBOR + 8.500%, 11.871%, 3/30/2028(c)(d) | | | 3,580,000 | |
| | 5,552,093 | | | First Brands Group LLC, 2021 Term Loan, 3-month SOFR + 5.00%, 8.369%, 3/30/2027(c)(d) | | | 5,348,498 | |
| | 5,419,960 | | | IXS Holdings, Inc., 2020 Term Loan B, 3-month LIBOR + 4.250%, 7.816%, 3/05/2027(b)(c) | | | 4,268,218 | |
| | 7,386,403 | | | Wheel Pros LLC, 2021 Term Loan, 3-month LIBOR + 4.500%, 8.825%, 5/11/2028(b)(c) | | | 4,871,702 | |
| | | | | | | | |
| | | | | | | 18,068,418 | |
| | | | | | | | |
| | | | Banking — 0.5% | |
| | 5,492,400 | | | Novae LLC, 1st Lien Term Loan, 6-month LIBOR + 5.000%, 9.696%, 12/22/2028(b)(c) | | | 4,943,160 | |
| | | | | | | | |
| | | | Brokerage — 4.4% | |
| | 2,000,000 | | | AqGen Ascensus, Inc., 2021 2nd Lien Term Loan, 8/02/2029(a) | | | 1,735,000 | |
| | 1,589,449 | | | AqGen Ascensus, Inc., 2021 2nd Lien Term Loan, 3-month LIBOR + 6.500%, 10.250%, 8/02/2029(c)(e) | | | 1,378,847 | |
| | 4,482,325 | | | Astra Acquisition Corp., 2021 1st Lien Term Loan, 1-month LIBOR + 5.250%, 9.321%, 10/25/2028(c)(e) | | | 4,049,018 | |
| | 3,574,750 | | | DRW Holdings LLC, 2021 Term Loan, 1-month LIBOR + 3.750%, 7.821%, 3/01/2028(c)(f) | | | 3,479,805 | |
| | 8,852,045 | | | Edelman Financial Center LLC, 2018 2nd Lien Term Loan, 1-month LIBOR + 6.750%, 10.821%, 7/20/2026(c)(f) | | | 7,961,352 | |
| | 5,635,558 | | | Eisner Advisory Group LLC, Term Loan, 1-month SOFR + 5.25%, 9.451%, 7/28/2028(b)(c) | | | 5,297,425 | |
| | 4,733,682 | | | HighTower Holdings LLC, 2021 Term Loan B, 3-month LIBOR + 4.000%, 8.278%, 4/21/2028(b)(c) | | | 4,414,159 | |
| | 7,462,500 | | | LHS Borrower LLC, 2022 Term Loan B, 1-month SOFR + 4.750%, 8.937%, 2/16/2029(c)(e) | | | 6,016,641 | |
| | 5,050,808 | | | Resolute Investment Managers, Inc., 2020 Term Loan C, 3-month LIBOR + 4.250%, 7.924%, 4/30/2024(c)(d) | | | 4,204,797 | |
| | 7,153,468 | | | Teneo Holdings LLC, Term Loan, 1-month LIBOR + 5.250%, 9.437%, 7/11/2025(c)(d) | | | 6,838,286 | |
| | | | | | | | |
| | | | | | | 45,375,330 | |
| | | | | | | | |
| | | | Building Materials — 3.7% | |
| | 4,512,299 | | | ACProducts, Inc., 2021 Term Loan B, LIBOR + 4.25%, 7.325%, 5/17/2028(e)(g) | | | 3,266,589 | |
| | 5,300,000 | | | Chamberlain Group, Inc., Term Loan B, 11/03/2028(a) | | | 4,953,857 | |
| | | | Building Materials — continued | | | | |
| $ | 2,693,165 | | | Cornerstone Building Brands, Inc., 2021 Term Loan B, 1-month LIBOR + 3.250%, 7.123%, 4/12/2028(c)(e) | | $ | 2,388,918 | |
| | 2,500,000 | | | CP Atlas Buyer, Inc., 2021 Term Loan B, 11/23/2027(a) | | | 2,196,875 | |
| | 2,550,478 | | | CP Atlas Buyer, Inc., 2021 Term Loan B, 1-month LIBOR + 3.500%, 7.571%, 11/23/2027(c)(e) | | | 2,241,233 | |
| | 3,500,868 | | | Foley Products Co. LLC, 2021 Term Loan, 3-month SOFR + 4.750%, 8.453%, 12/29/2028(c)(e) | | | 3,319,278 | |
| | 3,331,594 | | | LBM Acquisition LLC, Term Loan B, 6-month LIBOR + 3.750%, 7.121%, 12/17/2027(b)(c) | | | 2,859,107 | |
| | 6,492,000 | | | Oscar AcquisitionCo. LLC, Term Loan B, 3-month SOFR + 4.500%, 8.153%, 4/29/2029(c)(e) | | | 5,972,640 | |
| | 4,206,022 | | | Park River Holdings, Inc., Term Loan, 3-month LIBOR + 3.250%, 6.993%, 12/28/2027(b)(c) | | | 3,643,467 | |
| | 4,464,296 | | | Specialty Building Products Holdings LLC, 2021 Term Loan B, 1-month LIBOR + 3.250%, 7.266%, 10/15/2028(c)(e) | | | 3,935,544 | |
| | 3,397,004 | | | U.S. Silica Co., 2018 Term Loan B, 1-month LIBOR + 4.000%, 8.125%, 5/01/2025(c)(d) | | | 3,344,622 | |
| | | | | | | | |
| | | | | | | 38,122,130 | |
| | | | | | | | |
| | | | Cable Satellite — 2.1% | |
| | 13,217,187 | | | DirecTV Financing LLC, Term Loan, 1-month LIBOR + 5.000%, 9.071%, 8/02/2027(b)(c) | | | 12,640,388 | |
| | 4,091,797 | | | Intelsat Jackson Holdings S.A., 2021 Exit Term Loan B, 6-month SOFR + 4.50%, 7.445%, 2/01/2029(c)(e) | | | 3,947,561 | |
| | 5,020,868 | | | ViaSat, Inc., Term Loan, 1-month SOFR + 4.50%, 8.701%, 3/02/2029(c)(e) | | | 4,866,075 | |
| | | | | | | | |
| | | | | | | 21,454,024 | |
| | | | | | | | |
| | | | Chemicals — 3.7% | |
| | 3,275,000 | | | Aruba Investments, Inc., 2020 2nd Lien Term Loan, 1-month LIBOR + 7.750%, 11.794%, 11/24/2028(b)(c) | | | 2,958,406 | |
| | 5,105,205 | | | Bakelite U.S. Holdco, Inc., 2022 Term Loan, 3-month SOFR + 4.00%, 7.669%, 5/29/2029(c)(e) | | | 4,747,841 | |
| | 1,928,520 | | | GEON Performance Solutions LLC, 2021 Term Loan, 1-month LIBOR + 4.500%, 8.174%, 8/18/2028(b)(c) | | | 1,863,432 | |
| | 6,644,686 | | | Groupe Solmax, Inc., Term Loan, 3-month LIBOR + 4.750%, 8.392%, 5/29/2028(b)(c) | | | 5,249,302 | |
| | 3,151,586 | | | Hyperion Materials & Technologies, Inc., 2021 Term Loan B, LIBOR + 4.50%, 9.062%, 8/30/2028(e)(g) | | | 3,029,462 | |
| | 3,611,000 | | | Ineos US Finance LLC, 2022 USD Term Loan B, 11/08/2027(a) | | | 3,559,110 | |
| | 1,913,125 | | | Lonza Group AG, USD Term Loan B, 3-month LIBOR + 4.000%, 7.674%, 7/03/2028(b)(c) | | | 1,752,422 | |
| | 6,184,920 | | | Luxembourg Investment Co. 428 S.a. r.l., Term Loan B, 3-month SOFR + 5.00%, 8.553%, 1/03/2029(c)(e) | | | 4,968,532 | |
| | 3,681,500 | | | Olympus Water U.S. Holding Corp., 2022 Incremental Term Loan, 3-month SOFR + 4.500%, 8.153%, 11/09/2028(c)(e) | | | 3,548,046 | |
| | 5,600,000 | | | PMHC II, Inc., 2022 Term Loan B, 3-month SOFR + 4.250%, 8.494%, 4/23/2029(c)(f) | | | 4,691,288 | |
| | 2,051,588 | | | SCIH Salt Holdings, Inc., 2021 Incremental Term Loan B, 3-month LIBOR + 4.000%, 8.415%, 3/16/2027(b)(c) | | | 1,970,817 | |
| | | | | | | | |
| | | | | | | 38,338,658 | |
| | | | | | | | |
See accompanying notes to financial statements.
| 16
Portfolio of Investments – as of November 30, 2022
Loomis Sayles Senior Floating Rate and Fixed Income Fund – (continued)
| | | | | | | | |
Principal Amount | | | Description | | Value (†) | |
| | | | Construction Machinery — 0.3% | |
| $ | 3,899,268 | | | ASP Blade Holdings, Inc., Initial Term Loan, 3-month LIBOR + 4.000%, 7.674%, 10/13/2028(c)(e) | | $ | 3,197,400 | |
| | | | | | | | |
| | | | Consumer Cyclical Services — 4.5% | |
| | 4,591,000 | | | Galaxy U.S. Opco, Inc., Term Loan, 1-month SOFR + 4.75%, 8.837%, 4/29/2029(c)(e) | | | 4,183,549 | |
| | 743,000 | | | Go Daddy Operating Co. LLC, 2022 Term Loan B5, 1-month SOFR + 3.25%, 7.337%, 10/21/2029(c)(f) | | | 740,318 | |
| | 5,269,761 | | | Inmar Holdings, Inc., 2017 1st Lien Term Loan, 1-month LIBOR + 4.000%, 8.071%, 5/01/2024(c)(d) | | | 4,763,864 | |
| | 2,500,000 | | | Inmar Holdings, Inc., 2017 2nd Lien Term Loan, 1-month LIBOR + 8.000%, 12.071%, 5/01/2025(c)(d) | | | 2,300,000 | |
| | 3,000,000 | | | Latham Pool Products, Inc., 2022 Term Loan B, 2/23/2029(a) | | | 2,722,500 | |
| | 7,989,892 | | | Signal Parent, Inc., Term Loan B, 1-month LIBOR + 3.500%, 7.571%, 4/03/2028(b)(c) | | | 5,050,730 | |
| | 6,659,809 | | | SurveyMonkey, Inc., 2018 Term Loan B, 1-month LIBOR + 3.750%, 7.830%, 10/10/2025(c)(f) | | | 6,426,715 | |
| | 3,355,035 | | | Sweetwater Borrower LLC, Term Loan B, 1-month LIBOR + 4.250%, 8.375%, 8/07/2028(b)(c) | | | 3,103,408 | |
| | 5,079,430 | | | The Knot Worldwide, Inc., 2022 Term Loan, 1-month SOFR + 4.50%, 8.687%, 12/19/2025(c)(f) | | | 4,965,143 | |
| | 4,989,756 | | | Vaco Holdings LLC, 2022 Term Loan, SOFR + 5.000%, 8.720%, 1/21/2029(f)(g) | | | 4,755,886 | |
| | 11,338,759 | | | WW International, Inc., 2021 Term Loan B, 1-month LIBOR + 3.500%, 7.580%, 4/13/2028(c)(e) | | | 6,987,510 | |
| | | | | | | | |
| | | | | | | 45,999,623 | |
| | | | | | | | |
| | | | Consumer Products — 3.3% | |
| | 2,623,425 | | | AI Aqua Merger Sub, Inc., 2021 1st Lien Term Loan B, 1-month SOFR + 3.750%, 7.544%, 7/31/2028(c)(e) | | | 2,487,873 | |
| | 483,333 | | | AI Aqua Merger Sub, Inc., 2022 Delayed Draw Term loan, 7/31/2028(a) | | | 458,359 | |
| | 2,126,667 | | | AI Aqua Merger Sub, Inc., 2022 Term Loan B, 7/31/2028(a) | | | 2,016,782 | |
| | 1,817,523 | | | Callaway Golf Co., Term Loan B, 1-month LIBOR + 4.500%, 8.571%, 1/02/2026(c)(f) | | | 1,812,416 | |
| | 4,179,305 | | | Illuminate Merger Sub Corp., Term Loan, 3-month LIBOR + 3.500%, 6.377%, 7/21/2028(c)(e) | | | 3,831,545 | |
| | 6,015,052 | | | Mattress Firm, Inc., 2021 Term Loan B, 3-month LIBOR + 4.250%, 8.433%, 9/25/2028(b)(c) | | | 5,076,704 | |
| | 1,848,476 | | | Playpower, Inc., 2019 Term Loan, 3-month LIBOR + 5.500%, 9.174%, 5/08/2026(c)(f) | | | 1,409,463 | |
| | 8,190,208 | | | Solis IV BV, USD Term Loan B1, 3-month SOFR + 3.50%, 7.859%, 2/26/2029(c)(f) | | | 7,129,903 | |
| | 5,248,638 | | | Springs Windows Fashions LLC, 2021 Term Loan B, 3-month LIBOR + 4.000%, 7.602%, 10/06/2028(b)(c) | | | 4,098,294 | |
| | 2,723,315 | | | Weber-Stephen Products LLC, 2022 Incremental Term Loan B, 1-month SOFR + 4.25%, 8.437%, 10/30/2027(b)(c) | | | 2,287,584 | |
| | 3,348,475 | | | Weber-Stephen Products LLC, Term Loan B, 1-month LIBOR + 3.250%, 7.321%, 10/30/2027(b)(c) | | | 2,799,325 | |
| | | | | | | | |
| | | | | | | 33,408,248 | |
| | | | | | | | |
| | | | Diversified Manufacturing — 2.7% | |
| | 4,078,700 | | | Arcline FM Holdings LLC, 2021 1st Lien Term Loan, 6-month LIBOR + 4.750%, 7.000%, 6/23/2028(b)(c) | | | 3,925,749 | |
| | | | Diversified Manufacturing — continued | | | | |
| $ | 4,367,952 | | | CMBF LLC, Term Loan, 1-month LIBOR + 6.000%, 9.879%, 8/02/2028(c)(e) | | $ | 3,690,920 | |
| | 1,506,000 | | | Gates Global LLC, 2022 Term Loan B, 11/16/2029(a) | | | 1,478,892 | |
| | 3,000,000 | | | Infinite Bidco LLC, 2nd Lien Term Loan, 3-month LIBOR + 7.000%, 10.674%, 3/02/2029(c)(e) | | | 2,745,000 | |
| | 4,740,000 | | | Project Castle, Inc., Term Loan B, 3-month SOFR + 5.500%, 9.053%, 6/01/2029(c)(e) | | | 3,880,875 | |
| | 2,626,860 | | | Shape Technologies Group, Inc., Term Loan, 1-month LIBOR + 3.000%, 7.071%, 4/21/2025(c)(f) | | | 2,402,474 | |
| | 4,139,375 | | | U.S. Farathane LLC, 2021 Term Loan B, 3-month LIBOR + 4.250%, 7.924%, 12/23/2024(c)(d) | | | 3,725,437 | |
| | 4,465,038 | | | Vertiv Group Corp., 2021 Term Loan B, 1-month LIBOR + 2.750%, 6.555%, 3/02/2027(c)(f) | | | 4,347,830 | |
| | 1,807,000 | | | Watlow Electric Manufacturing Co., 2022 Incremental Term Loan B, 3-month SOFR + 5.000%, 9.269%, 3/02/2028(c)(e) | | | 1,770,860 | |
| | | | | | | | |
| | | | | | | 27,968,037 | |
| | | | | | | | |
| | | | Electric — 0.4% | |
| | 5,074,068 | | | KAMC Holdings, Inc., 2019 Term Loan, 3-month LIBOR + 4.000%, 8.735%, 8/14/2026(c)(f) | | | 4,084,624 | |
| | | | | | | | |
| | | | Environmental – 0.7% | |
| | 4,331,067 | | | Liberty Tire Recycling Holdco LLC, 2021 Term Loan, 3-month LIBOR + 4.500%, 8.174%, 5/05/2028(c)(d) | | | 3,922,344 | |
| | 3,106,969 | | | Northstar Group Services, Inc., 2020 Term Loan B, 1-month LIBOR + 5.500%, 9.571%, 11/12/2026(c)(d) | | | 3,047,409 | |
| | | | | | | | |
| | | | | | | 6,969,753 | |
| | | | | | | | |
| | | | Financial Other — 0.6% | |
| | 4,572,613 | | | GT Polaris, Inc., 2021 Term Loan, 3-month LIBOR + 3.750%, 8.165%, 9/24/2027(b)(c) | | | 4,109,636 | |
| | 619 | | | Mariner Wealth Advisors LLC, Term Loan B, 3-month SOFR + 3.250%, 7.096%, 8/18/2028(c)(e) | | | 592 | |
| | 2,114,839 | | | Mermaid BidCo, Inc., 2021 USD Term Loan, 3-month LIBOR + 3.500%, 7.960%, 12/22/2027(b)(c) | | | 1,977,375 | |
| | | | | | | | |
| | | | | | | 6,087,603 | |
| | | | | | | | |
| | | | Food & Beverage — 1.8% | |
| | 7,014,448 | | | City Brewing Co. LLC, Closing Date Term Loan, 1-month LIBOR + 3.500%, 7.379%, 4/05/2028(b)(c) | | | 4,305,118 | |
| | 3,032,000 | | | Del Monte Foods, Inc., 2022 Term Loan, 1-month SOFR + 4.350%, 8.261%, 5/16/2029(c)(e) | | | 2,934,733 | |
| | 5,000,000 | | | Naked Juice LLC, 2nd Lien Term Loan, 3-month SOFR + 6.000%, 9.653%, 1/24/2030(c)(e) | | | 4,343,750 | |
| | 775,000 | | | Nomad Foods Europe Midco Ltd., 2022 Term Loan B, 3-month SOFR + 3.750%, 8.225%, 11/04/2029(c)(e) | | | 769,025 | |
| | 6,422,806 | | | Triton Water Holdings, Inc., Term Loan, 3-month LIBOR + 3.500%, 7.174%, 3/31/2028(c)(e) | | | 5,908,981 | |
| | | | | | | | |
| | | | | | | 18,261,607 | |
| | | | | | | | |
| | | | Gaming — 0.8% | |
| | 5,639,625 | | | Fertitta Entertainment LLC, 2022 Term Loan B, 1-month SOFR + 4.00%, 8.087%, 1/27/2029(c)(e) | | | 5,370,446 | |
| | 2,717,789 | | | GVC Holdings (Gibraltar) Ltd., 2022 Term Loan B, 10/31/2029(a) | | | 2,685,855 | |
| | | | | | | | |
| | | | | | | 8,056,301 | |
| | | | | | | | |
| | | | Healthcare — 5.7% | |
| | 8,500,000 | | | Aveanna Healthcare LLC, 2021 2nd Lien Term Loan, 1-month LIBOR + 7.000%, 11.016%, 12/10/2029(c)(e) | | | 5,525,000 | |
See accompanying notes to financial statements.
17 |
Portfolio of Investments – as of November 30, 2022
Loomis Sayles Senior Floating Rate and Fixed Income Fund – (continued)
| | | | | | | | |
Principal Amount | | | Description | | Value (†) | |
| | | | Healthcare — continued | | | | |
| $ | 936,374 | | | Carestream Dental Equipment, Inc., 2021 Term Loan, 1-month LIBOR + 4.500%, 8.571%, 9/01/2024(c)(e) | | $ | 902,430 | |
| | 3,500,000 | | | Charlotte Buyer, Inc., 1st Lien Term Loan, 1-month SOFR + 5.25%, 9.046%, 2/11/2028(c)(e) | | | 3,313,345 | |
| | 204,976 | | | Dermatology Intermediate Holdings III, Inc., 2022 Delayed Draw Term Loan, 4.000%, 3/30/2029(h) | | | 199,981 | |
| | 444,774 | | | Dermatology Intermediate Holdings III, Inc., 2022 Delayed Draw Term Loan, 1-month SOFR + 4.250%, 8.336%, 3/30/2029(c)(e) | | | 433,935 | |
| | 3,678,950 | | | Dermatology Intermediate Holdings III, Inc., 2022 Term Loan B, 1-month SOFR + 4.250%, 8.336%, 3/30/2029(c)(e) | | | 3,589,294 | |
| | 1,074,316 | | | Element Materials Technology Group U.S. Holdings, Inc., 2022 USD Delayed Draw Term Loan, 3-month SOFR + 4.250%, 7.904%, 7/06/2029(c)(e) | | | 1,051,938 | |
| | 2,327,684 | | | Element Materials Technology Group U.S. Holdings, Inc., 2022 USD Term Loan, 3-month SOFR + 4.250%, 7.903%, 7/06/2029(c)(e) | | | 2,279,199 | |
| | 4,685,075 | | | EyeCare Partners LLC, 2021 Incremental Term Loan, 3-month LIBOR + 3.750%, 7.424%, 11/15/2028(c)(e) | | | 4,045,890 | |
| | 3,740,338 | | | Heartland Dental LLC, 2021 Incremental Term Loan, 1-month LIBOR + 4.000%, 8.044%, 4/30/2025(c)(f) | | | 3,461,682 | |
| | 1,000,000 | | | MDVIP, Inc., 2021 2nd Lien Term Loan, 1-month LIBOR + 6.500%, 10.516%, 10/15/2029(c)(e) | | | 900,000 | |
| | 910,286 | | | Midwest Physician Administrative Services LLC, 2021 Term Loan, 3-month LIBOR + 3.250%, 6.924%, 3/12/2028(b)(c) | | | 848,386 | |
| | 3,300,129 | | | Midwest Veterinary Partners LLC, Term Loan, LIBOR + 4.00%, 6.401%, 4/27/2028(b)(g) | | | 3,069,120 | |
| | 7,182,450 | | | MPH Acquisition Holdings LLC, 2021 Term Loan B, 3-month LIBOR + 4.250%, 8.985%, 9/01/2028(c)(e) | | | 6,149,973 | |
| | 4,880,091 | | | NAPA Management Services Corp., Term Loan B, 1-month SOFR + 5.25%, 9.369%, 2/23/2029(b)(c) | | | 4,224,353 | |
| | 6,496,987 | | | National Mentor Holdings, Inc., 2021 Term Loan, LIBOR + 3.750%, 7.609%, 3/02/2028(b)(g) | | | 4,589,406 | |
| | 177,172 | | | National Mentor Holdings, Inc., 2021 Term Loan C, 3-month LIBOR + 3.750%, 7.430%, 3/02/2028(b)(c) | | | 125,153 | |
| | 5,787,322 | | | Onex TSG Intermediate Corp., 2021 Term Loan B, 3-month LIBOR + 4.750%, 9.165%, 2/28/2028(b)(c) | | | 5,136,248 | |
| | 1,000,000 | | | Pearl Intermediate Parent LLC, 2018 2nd Lien Term Loan, 1-month LIBOR + 6.250%, 10.321%, 2/13/2026(c)(f) | | | 934,170 | |
| | 1,000,000 | | | Southern Veterinary Partners LLC, 2nd Lien Term Loan, 1-month LIBOR + 7.750%, 11.821%, 10/05/2028(c)(d) | | | 910,000 | |
| | 4,865,878 | | | Southern Veterinary Partners LLC, Term Loan, 1-month LIBOR + 4.000%, 8.071%, 10/05/2027(c)(d) | | | 4,669,199 | |
| | 2,275,710 | | | U.S. Anesthesia Partners, Inc., 2021 Term Loan, 1-month LIBOR + 4.250%, 8.018%, 10/01/2028(c)(e) | | | 2,174,373 | |
| | | | | | | | |
| | | | | | | 58,533,075 | |
| | | | | | | | |
| | | | Independent Energy — 0.7% | |
| | 6,841,704 | | | Matador Bidco S.a.r.l., Term Loan, 1-month LIBOR + 4.500%, 8.571%, 10/15/2026(c)(f) | | | 6,704,870 | |
| | | | | | | | |
| | | | Industrial Other — 1.2% | |
| $ | 5,067,493 | | | Colibri Group LLC, 2022 Term Loan, SOFR + 5.00%, 8.737%, 3/12/2029(b)(g) | | $ | 4,871,128 | |
| | 3,412,259 | | | Gloves Buyer, Inc., 2021 Term Loan, 1-month LIBOR + 4.000%, 8.071%, 12/29/2027(b)(c) | | | 3,099,457 | |
| | 164,002 | | | Service Logic Acquisition, Inc., Delayed Draw Term Loan, 10/29/2027(a) | | | 156,622 | |
| | 78,022 | | | Service Logic Acquisition, Inc., Delayed Draw Term Loan, LIBOR + 4.00%, 8.192%, 10/29/2027(b)(g) | | | 74,511 | |
| | 334,936 | | | Service Logic Acquisition, Inc., Term Loan, 10/29/2027(a) | | | 319,864 | |
| | 4,124,915 | | | Service Logic Acquisition, Inc., Term Loan, LIBOR + 4.000%, 4.750%, 10/29/2027(b)(g) | | | 3,939,294 | |
| | | | | | | | |
| | | | | | | 12,460,876 | |
| | | | | | | | |
| | | | Leisure — 0.7% | |
| | 7,429,500 | | | Thunder Finco Pty Ltd., Term Loan B, 3-month LIBOR + 4.250%, 7.924%, 11/26/2026(b)(c) | | | 7,119,913 | |
| | | | | | | | |
| | | | Media Entertainment — 8.0% | |
| | 6,191,000 | | | ABG Intermediate Holdings 2 LLC, 2021 2nd Lien Term Loan, 1-month SOFR + 6.000%, 10.187%, 12/20/2029(c)(e) | | | 5,695,720 | |
| | 1,500,000 | | | Advantage Sales & Marketing, Inc., 2021 Term Loan, 10/28/2027(a) | | | 1,203,375 | |
| | 6,901,058 | | | Advantage Sales & Marketing, Inc., 2021 Term Loan, 3-month LIBOR + 4.500%, 8.284%, 10/28/2027(b)(c) | | | 5,536,373 | |
| | 2,713,200 | | | AP Core Holdings II LLC, Amortization Term Loan B1, 1-month LIBOR + 5.500%, 9.571%, 9/01/2027(b)(c) | | | 2,401,182 | |
| | 2,856,000 | | | AP Core Holdings II LLC, High-Yield Term Loan B2, 1-month LIBOR + 5.500%, 9.571%, 9/01/2027(b)(c) | | | 2,525,189 | |
| | 5,626,226 | | | Cengage Learning, Inc., 2021 Term Loan B, 6-month LIBOR + 4.750%, 7.814%, 7/14/2026(c)(d) | | | 5,156,436 | |
| | 4,000,000 | | | CMG Media Corp., 2021 Term Loan, 1-month LIBOR + 3.500%, 7.571%, 12/17/2026(c)(f) | | | 3,710,000 | |
| | 7,281,134 | | | Dotdash Meredith, Inc., Term Loan B, 1-month LIBOR + 4.000%, 7.844%, 12/01/2028(c)(e) | | | 6,298,181 | |
| | 2,983,644 | | | Emerald Expositions Holding, Inc., 2017 Term Loan B, 1-month LIBOR + 2.500%, 6.571%, 5/22/2024(c)(f) | | | 2,884,826 | |
| | 2,750,000 | | | iHeartCommunications, Inc., 2020 Term Loan, 1-month LIBOR + 3.000%, 7.071%, 5/01/2026(c)(f) | | | 2,572,735 | |
| | 5,592,934 | | | McGraw-Hill Global Education Holdings LLC, 2021 Term Loan, LIBOR + 4.750%, 8.318%, 7/28/2028(e)(g) | | | 5,332,862 | |
| | 7,400,000 | | | MH Sub I LLC, 2021 2nd Lien Term Loan, 3-month SOFR + 6.250%, 10.649%, 2/23/2029(c)(f) | | | 6,632,250 | |
| | 10,030,200 | | | PUG LLC, USD Term Loan, 1-month LIBOR + 3.500%, 7.571%, 2/12/2027(c)(f) | | | 8,575,821 | |
| | 3,495,056 | | | RLG Holdings LLC, 2021 Term Loan, 1-month LIBOR + 4.000%, 8.071%, 7/07/2028(b)(c) | | | 3,286,821 | |
| | 4,987,500 | | | Sinclair Television Group, Inc., 2022 Term Loan B4, 1-month SOFR + 3.75%, 7.937%, 4/21/2029(c)(f) | | | 4,739,671 | |
| | 5,845,950 | | | Summer (BC) Holdco B S.a.r.l., 2021 USD Term Loan B2, 3-month LIBOR + 4.500%, 8.174%, 12/04/2026(b)(c) | | | 5,369,154 | |
| | 1,647,250 | | | Syndigo LLC, 2020 2nd Lien Term Loan, 1-month LIBOR + 8.000%, 10.510%, 12/15/2028(b)(c) | | | 1,186,020 | |
| | 3,053,500 | | | Syndigo LLC, 2020 Term Loan, 1-month LIBOR + 4.500%, 8.404%, 12/15/2027(b)(c) | | | 2,748,150 | |
See accompanying notes to financial statements.
| 18
Portfolio of Investments – as of November 30, 2022
Loomis Sayles Senior Floating Rate and Fixed Income Fund – (continued)
| | | | | | | | |
Principal Amount | | | Description | | Value (†) | |
| | | | Media Entertainment — continued | | | | |
| $ | 1,965,075 | | | Univision Communications, Inc., 2022 First Lien Term Loan B, 3-month SOFR + 4.250%, 7.790%, 6/24/2029(c)(e) | | $ | 1,935,599 | |
| | 3,863,053 | | | Voyage Digital (NZ) Ltd., USD Term Loan B, 3-month LIBOR + 4.5%, 8.746%, 5/11/2029(c)(e) | | | 3,766,476 | |
| | | | | | | | |
| | | | | | | 81,556,841 | |
| | | | | | | | |
| | | | Paper — 1.6% | |
| | 5,684,817 | | | Domtar Corp., 2021 Term Loan B, 1-month LIBOR + 5.500%, 9.379%, 11/30/2028(b)(c) | | | 5,533,203 | |
| | 7,215,201 | | | Schweitzer-Mauduit International, Inc., 2021 Term Loan B, 1-month LIBOR + 3.750%, 7.875%, 4/20/2028(b)(c) | | | 6,728,175 | |
| | 4,332,246 | | | Spa Holdings 3 Oy, USD Term Loan B, 3-month LIBOR + 3.750%, 7.424%, 2/04/2028(b)(c) | | | 4,115,633 | |
| | | | | | | | |
| | | | | | | 16,377,011 | |
| | | | | | | | |
| | | | Pharmaceuticals — 1.0% | |
| | 818,508 | | | Akorn, Inc., 2020 Take Back Term Loan, 3-month LIBOR + 7.500%, 11.243%, 10/01/2025(c)(d) | | | 772,123 | |
| | 2,967,438 | | | Bausch Health Cos., Inc., 2022 Term Loan B, 1-month SOFR + 5.25%, 9.146%, 2/01/2027(c)(e) | | | 2,202,076 | |
| | 5,302,815 | | | LSCS Holdings, Inc., 2021 1st Lien Term Loan, 3-month LIBOR + 4.500%,
8.174%, 12/16/2028(c)(e) | | | 5,061,537 | |
| | 2,000,000 | | | LSCS Holdings, Inc., 2021 2nd Lien Term Loan, 3-month LIBOR + 8.000%, 11.674%, 12/17/2029(c)(e) | | | 1,780,000 | |
| | | | | | | | |
| | | | | | | 9,815,736 | |
| | | | | | | | |
| | | | Property & Casualty Insurance — 1.7% | |
| | 3,044,990 | | | Acrisure LLC, 2021 First Lien Term Loan B, 1-month LIBOR + 4.250%, 8.321%, 2/15/2027(c)(e) | | | 2,919,384 | |
| | 5,198,939 | | | Amynta Agency Borrower, Inc., 2018 1st Lien Term Loan, 1-month LIBOR + 4.500%, 8.571%, 2/28/2025(c)(f) | | | 4,874,005 | |
| | 5,000,000 | | | Asurion LLC, 2018 Term Loan B7, 11/03/2024(a) | | | 4,786,450 | |
| | 750,000 | | | Asurion LLC, 2020 Term Loan B8, 12/23/2026(a) | | | 654,998 | |
| | 4,686,000 | | | Asurion LLC, 2021 2nd Lien Term Loan B3, 1-month LIBOR + 5.250%, 9.321%, 1/31/2028(c)(f) | | | 3,603,534 | |
| | 904,000 | | | Hub International Ltd., 2022 Term Loan B, 3-month SOFR + 4.00%, 8.220%, 11/10/2029(b)(c) | | | 889,310 | |
| | | | | | | | |
| | | | | | | 17,727,681 | |
| | | | | | | | |
| | | | Refining — 0.4% | |
| | 4,322,000 | | | Delek US Holdings, Inc., 2022 Term Loan B, 11/09/2029(a) | | | 4,141,902 | |
| | | | | | | | |
| | | | REITs – Other — 0.4% | |
| | 4,124,000 | | | Starwood Property Trust, Inc., 2022 Term Loan B, 3-month SOFR + 3.250%, 7.124%, 11/18/2027(c)(e) | | | 4,062,140 | |
| | | | | | | | |
| | | | Restaurants — 1.2% | |
| | 6,900,705 | | | Dave & Buster’s, Inc., 2022 Term Loan B, 1-month SOFR + 5.00%, 9.188%, 6/29/2029(c)(e) | | | 6,836,874 | |
| | 5,999,792 | | | Portillo’s Holdings LLC, 2019 1st Lien Term Loan B3, 3-month LIBOR + 5.500%, 9.571%, 9/06/2024(c)(d) | | | 5,949,813 | |
| | | | | | | | |
| | | | | | | 12,786,687 | |
| | | | | | | | |
| | | | Retailers — 6.3% | |
| | 5,909,310 | | | At Home Group, Inc., Term Loan B, 3-month LIBOR + 4.000%, 7.743%, 7/24/2028(c)(e) | | | 4,680,174 | |
| | 2,779,392 | | | Canada Goose, Inc., 2021 Term Loan, 3-month LIBOR + 3.500%, 7.142%, 10/07/2027(b)(c) | | | 2,699,484 | |
| | | | Retailers — continued | | | | |
| $ | 3,633,030 | | | Container Store, Inc. (The), 2020 Term Loan B3,
3-month LIBOR + 4.750%, 8.424%, 1/31/2026(c)(d) | | $ | 3,306,057 | |
| | 4,213,350 | | | Crocs, Inc., Term Loan B, 3-month SOFR + 3.500%, 7.203%, 2/20/2029(c)(e) | | | 4,060,616 | |
| | 3,000,000 | | | CWGS Group LLC, 2021 Term Loan B, 6/03/2028(a) | | | 2,703,750 | |
| | 7,585,128 | | | Evergreen Acqco 1 LP, 2021 USD Term Loan, 3-month LIBOR + 5.500%, 9.174%, 4/26/2028(b)(c) | | | 7,332,316 | |
| | 4,900,375 | | | Great Outdoors Group LLC, 2021 Term Loan B1, 1-month LIBOR + 3.750%, 7.821%, 3/06/2028(b)(c) | | | 4,703,135 | |
| | 7,828,000 | | | International Textile Group, Inc., 2nd Lien Term Loan, 3-month LIBOR + 9.000%, 12.743%, 5/01/2025(c)(f) | | | 1,996,140 | |
| | 3,926,347 | | | Michaels Cos., Inc., 2021 Term Loan B, 3-month LIBOR + 4.250%, 7.924%, 4/15/2028(b)(c) | | | 2,958,934 | |
| | 3,396,930 | | | Olaplex, Inc., 2022 Term Loan, 1-month SOFR + 3.50%, 7.619%, 2/23/2029(c)(e) | | | 3,227,084 | |
| | 5,728,824 | | | PetSmart, Inc., 2021 Term Loan B, 1-month LIBOR + 3.750%, 7.820%, 2/11/2028(b)(c) | | | 5,497,609 | |
| | 5,250,000 | | | Rent-A-Center, Inc., 2021 First Lien Term Loan B, 3-month LIBOR + 3.250%, 7.688%, 2/17/2028(c)(e) | | | 5,033,437 | |
| | 4,000,000 | | | Restoration Hardware, Inc., 2022 Incremental Term Loan, 10/20/2028(a) | | | 3,771,240 | |
| | 4,187,370 | | | RVR Dealership Holdings LLC, Term Loan B, 1-month SOFR + 3.75%, 7.761%, 2/08/2028(b)(c) | | | 3,789,570 | |
| | 5,309,150 | | | S&S Holdings LLC, Term Loan, 1-month LIBOR + 5.000%, 8.879%, 3/11/2028(c)(e) | | | 4,822,460 | |
| | 4,583,283 | | | Tory Burch LLC, Term Loan B, 1-month LIBOR + 3.250%, 7.321%, 4/16/2028(c)(e) | | | 4,252,920 | |
| | | | | | | | |
| | | | | | | 64,834,926 | |
| | | | | | | | |
| | | | Technology — 15.2% | |
| | 6,975,000 | | | Access CIG LLC, 2018 2nd Lien Term Loan, 3-month LIBOR + 7.750%, 11.821%, 2/27/2026(c)(f) | | | 6,068,250 | |
| | 4,860,000 | | | Altar Bidco, Inc., 2021 2nd Lien Term Loan, 6-month SOFR + 5.60%, 7.355%, 2/01/2030(c)(e) | | | 4,058,100 | |
| | 4,191,216 | | | Aptean, Inc., 2019 Term Loan, 3-month LIBOR + 4.250%, 8.985%, 4/23/2026(c)(f) | | | 3,995,612 | |
| | 6,562,410 | | | Byju’s Alpha, Inc., Term Loan B, 1-month LIBOR + 6.000%, 10.699%, 11/24/2026(b)(c) | | | 5,200,710 | |
| | 4,209,396 | | | Castle U.S. Holding Corp., USD Term Loan B, 1-month LIBOR + 3.750%, 7.821%, 1/29/2027(c)(f) | | | 2,928,182 | |
| | 3,938,000 | | | CDK Global, Inc., 2022 USD Term Loan B, 3-month SOFR + 4.50%, 8.112%, 7/06/2029(c)(e) | | | 3,887,436 | |
| | 5,899,337 | | | Conduent Business Services LLC, 2021 Term Loan B, 1-month LIBOR + 4.250%, 8.321%, 10/16/2028(c)(e) | | | 5,545,377 | |
| | 5,640,654 | | | Constant Contact, Inc., Term Loan, 3-month LIBOR + 4.000%, 7.909%, 2/10/2028(b)(c) | | | 4,949,674 | |
| | 5,680,658 | | | Corel Corp., 2019 Term Loan, 3-month LIBOR + 5.000%, 9.735%, 7/02/2026(c)(f) | | | 5,311,416 | |
| | 4,811,901 | | | CoreLogic, Inc., Term Loan, 1-month LIBOR + 3.500%, 7.625%, 6/02/2028(c)(e) | | | 3,957,788 | |
| | 4,769,500 | | | Cornerstone OnDemand, Inc., 2021 Term Loan, 1-month LIBOR + 3.750%, 7.821%, 10/16/2028(c)(e) | | | 4,259,164 | |
| | 4,537,183 | | | CT Technologies Intermediate Holdings, Inc., 2021 Term Loan B, 1-month LIBOR + 4.250%, 8.321%, 12/16/2025(b)(c) | | | 4,181,286 | |
| | 3,000,000 | | | Dodge Data & Analytics LLC, 2022 2nd Lien Term Loan, 3-month SOFR + 8.250%, 11.230%, 2/22/2030(c)(e) | | | 2,190,000 | |
| | 5,589,458 | | | Dodge Data & Analytics LLC, 2022 Term Loan,
3-month SOFR + 4.750%, 7.730%, 2/23/2029(c)(e) | | | 4,639,250 | |
See accompanying notes to financial statements.
19 |
Portfolio of Investments – as of November 30, 2022
Loomis Sayles Senior Floating Rate and Fixed Income Fund – (continued)
| | | | | | | | |
Principal Amount | | | Description | | Value (†) | |
| | | | Technology — continued | | | | |
| $ | 7,164,559 | | | Endure Digital, Inc., Term Loan, 1-month LIBOR + 3.500%, 7.347%, 2/10/2028(b)(c) | | $ | 6,483,926 | |
| | 6,810,264 | | | Finastra USA, Inc., USD 1st Lien Term Loan, 3-month LIBOR + 3.500%, 6.871%, 6/13/2024(c)(d) | | | 6,147,829 | |
| | 1,958,116 | | | Global Client Solutions LLC, Term Loan B, 1-month LIBOR + 6.000%, 10.194%, 3/16/2026(c)(d) | | | 1,870,001 | |
| | 8,187,010 | | | GoTo Group, Inc., Term Loan B, 1-month LIBOR + 4.750%, 8.766%, 8/31/2027(c)(f) | | | 5,236,248 | |
| | 8,380,829 | | | Hyland Software, Inc., 2021 2nd Lien Term Loan, 1-month LIBOR + 6.250%, 10.321%, 7/07/2025(b)(c) | | | 7,904,211 | |
| | 5,793,681 | | | Loyalty Ventures, Inc., Term Loan B, 1-month LIBOR + 4.500%, 8.571%, 11/03/2027(c)(e) | | | 2,288,504 | |
| | 1,400,000 | | | Magenta Buyer LLC, 2021 USD 1st Lien Term Loan, 7/27/2028(a) | | | 1,256,500 | |
| | 6,186,021 | | | Magenta Buyer LLC, 2021 USD 1st Lien Term Loan, 3-month LIBOR + 4.750%, 9.170%, 7/27/2028(b)(c) | | | 5,551,954 | |
| | 7,621,390 | | | McAfee LLC, 2022 USD Term Loan B, 1-month SOFR + 3.75%, 7.636%, 3/01/2029(c)(f) | | | 7,226,068 | |
| | 8,854,766 | | | NCR Corp., 2019 Term Loan, 3-month LIBOR + 2.500%, 6.920%, 8/28/2026(c)(f) | | | 8,566,986 | |
| | 4,514,000 | | | Open Text Corp., 2022 Term Loan B, 11/16/2029(a) | | | 4,380,476 | |
| | 4,843,610 | | | Physician Partners LLC, Term Loan, 1-month SOFR + 4.00%, 8.187%, 12/23/2028(c)(e) | | | 4,640,808 | |
| | 6,114,675 | | | Quest Software U.S. Holdings, Inc., 2022 Term Loan, 3-month SOFR + 4.250%, 8.494%, 2/01/2029(c)(e) | | | 4,622,327 | |
| | 4,356,000 | | | Redstone Holdco 2 LP, 2021 Term Loan, 3-month LIBOR + 4.750%, 9.108%, 4/27/2028(b)(c) | | | 2,963,910 | |
| | 6,170,373 | | | Seattle Spinco, Inc., 2022 USD Term Loan B5, 1-month SOFR + 4.00%, 8.011%, 2/26/2027(c)(e) | | | 6,062,391 | |
| | 5,110,000 | | | Ultimate Software Group, Inc. (The), 2021 2nd Lien Term Loan, 1-month LIBOR + 5.250%, 8.998%, 5/03/2027(c)(e) | | | 4,675,650 | |
| | 3,904,665 | | | Verifone Systems, Inc., 2018 1st Lien Term Loan, 3-month LIBOR + 4.000%, 8.359%, 8/20/2025(c)(f) | | | 3,519,704 | |
| | 3,000,000 | | | Vision Solutions, Inc., 2021 2nd Lien Term Loan, 3-month LIBOR + 7.250%, 11.608%, 4/23/2029(b)(c) | | | 2,343,750 | |
| | 6,348,810 | | | Vision Solutions, Inc., 2021 Incremental Term Loan, 3-month LIBOR + 4.000%, 8.358%, 4/24/2028(b)(c) | | | 5,213,961 | |
| | 4,320,533 | | | WebHelp, 2021 USD Term Loan, 3-month SOFR + 3.750%, 6.790%, 8/04/2028(c)(f) | | | 4,082,903 | |
| | | | | | | | |
| | | | | | | 156,210,352 | |
| | | | | | | | |
| | | | Transportation Services — 2.1% | |
| | 4,485,690 | | | AIT Worldwide Logistics, Inc., 2021 Term Loan, 3-month LIBOR + 4.750%,
8.491%, 4/06/2028(b)(c) | | | 4,081,978 | |
| | 4,211,504 | | | Carriage Purchaser, Inc., 2021 Term Loan B, 1-month LIBOR + 4.250%, 8.321%, 9/30/2028(b)(c) | | | 3,816,676 | |
| | 4,750,000 | | | KKR Apple Bidco LLC, 2021 2nd Lien Term Loan, 1-month LIBOR + 5.750%, 9.821%, 9/21/2029(c)(e) | | | 4,550,500 | |
| | 6,554,790 | | | LaserShip, Inc., 2021 Term Loan, 6-month LIBOR + 4.500%, 7.377%, 5/07/2028(b)(c) | | | 5,079,962 | |
| | 4,574,015 | | | St. George Warehousing & Trucking Co. of California, Inc., 2022 Term Loan, 1-month SOFR + 6.00%, 10.187%, 3/24/2028(b)(c) | | | 4,322,444 | |
| | | | | | | | |
| | | | | | | 21,851,560 | |
| | | | | | | | |
| | | | Wireless — 0.8% | |
| $ | 4,410,394 | | | CCI Buyer, Inc., Term Loan, 3-month SOFR + 4.00%, 7.553%, 12/17/2027(b)(c) | | $ | 4,257,133 | |
| | 3,576,368 | | | Crown Subsea Communications Holding, Inc., 2021 Term Loan, 1-month LIBOR + 4.750%, 8.518%, 4/27/2027(b)(c) | | | 3,484,741 | |
| | | | | | | | |
| | | | | | | 7,741,874 | |
| | | | | | | | |
| | | | Wirelines — 0.4% | |
| | 4,534,215 | | | Zacapa S.a.r.l, 2022 Term Loan, 3-month SOFR + 4.250%, 7.803%, 3/22/2029(c)(e) | | | 4,350,579 | |
| | | | | | | | |
| | | | Total Senior Loans
(Identified Cost $926,987,690) | | | 832,595,505 | |
| | | | | | | | |
| | | | | | | | |
| | Bonds and Notes — 10.4% | |
| | | | Airlines — 0.4% | |
| | 4,205,000 | | | Allegiant Travel Co., 7.250%, 8/15/2027, 144A | | | 4,096,259 | |
| | | | | | | | |
| | | | Cable Satellite — 0.4% | |
| | 5,000,000 | | | DISH DBS Corp., 7.750%, 7/01/2026 | | | 4,188,000 | |
| | | | | | | | |
| | | | Chemicals — 1.0% | |
| | 5,000,000 | | | Cheever Escrow Issuer LLC, 7.125%, 10/01/2027, 144A | | | 4,675,000 | |
| | 2,985,000 | | | Iris Holdings, Inc., 9.500% PIK or 8.750% Cash, 2/15/2026, 144A(i) | | | 2,537,250 | |
| | 3,405,000 | | | Kobe U.S. Midco 2, Inc., 10.000% PIK or 9.250% Cash, 11/01/2026, 144A(i) | | | 2,501,143 | |
| | | | | | | | |
| | | | | | | 9,713,393 | |
| | | | | | | | |
| | | | Consumer Cyclical Services — 0.3% | |
| | 3,500,000 | | | WASH Multifamily Acquisition, Inc., 5.750%, 4/15/2026, 144A | | | 3,280,620 | |
| | | | | | | | |
| | | | Consumer Products — 1.2% | |
| | 3,250,000 | | | Coty, Inc., 6.500%, 4/15/2026, 144A | | | 3,103,750 | |
| | 8,000,000 | | | Energizer Holdings, Inc., 6.500%, 12/31/2027, 144A | | | 7,575,691 | |
| | 1,965,000 | | | Newell Brands, Inc., 6.375%, 9/15/2027 | | | 1,948,003 | |
| | | | | | | | |
| | | | | | | 12,627,444 | |
| | | | | | | | |
| | | | Finance Companies — 0.3% | |
| | 3,370,000 | | | Oxford Finance LLC/Oxford Finance Co-Issuer II, Inc., 6.375%, 2/01/2027, 144A | | | 3,142,525 | |
| | | | | | | | |
| | | | Media Entertainment — 1.0% | |
| | 5,500,000 | | | iHeartCommunications, Inc., 8.375%, 5/01/2027 | | | 4,895,000 | |
| | 4,650,000 | | | Millennium Escrow Corp., 6.625%, 8/01/2026, 144A | | | 3,348,000 | |
| | 1,845,000 | | | Townsquare Media, Inc., 6.875%, 2/01/2026, 144A | | | 1,711,622 | |
| | | | | | | | |
| | | | | | | 9,954,622 | |
| | | | | | | | |
| | | | Property & Casualty Insurance — 0.6% | |
| | 6,010,000 | | | USI, Inc., 6.875%, 5/01/2025, 144A | | | 5,890,466 | |
| | | | | | | | |
| | | | REITs – Hotels — 0.4% | |
| | 50,000 | | | Service Properties Trust, 3.950%, 1/15/2028 | | | 36,948 | |
| | 1,200,000 | | | Service Properties Trust, 4.750%, 10/01/2026 | | | 989,640 | |
| | 3,710,000 | | | Service Properties Trust, 4.950%, 2/15/2027 | | | 3,055,417 | |
| | | | | | | | |
| | | | | | | 4,082,005 | |
| | | | | | | | |
| | | | REITs – Mortgage — 0.5% | |
| | 4,000,000 | | | Ladder Capital Finance Holdings LLLP/Ladder Capital Finance Corp., 5.250%, 10/01/2025, 144A | | | 3,801,040 | |
| | 2,000,000 | | | Starwood Property Trust, Inc., 4.375%, 1/15/2027, 144A | | | 1,789,320 | |
| | | | | | | | |
| | | | | | | 5,590,360 | |
| | | | | | | | |
See accompanying notes to financial statements.
| 20
Portfolio of Investments – as of November 30, 2022
Loomis Sayles Senior Floating Rate and Fixed Income Fund – (continued)
| | | | | | | | |
Principal Amount | | | Description | | Value (†) | |
| | | | Supermarkets — 0.5% | |
| $ | 5,750,000 | | | Albertsons Cos., Inc./Safeway, Inc./New Albertsons LP/Albertsons LLC, 4.625%, 1/15/2027, 144A | | $ | 5,319,267 | |
| | | | | | | | |
| | | | Technology — 0.4% | |
| | 7,500,000 | | | GoTo Group, Inc., 5.500%, 9/01/2027, 144A | | | 4,387,498 | |
| | | | | | | | |
| | | | Treasuries — 3.4% | |
| | 37,100,000 | | | U.S. Treasury Note, 2.750%, 8/15/2032 | | | 34,363,875 | |
| | | | | | | | |
| | | | Total Bonds and Notes
(Identified Cost $114,664,212) | | | 106,636,334 | |
| | | | | | | | |
| | | | | | | | |
| Shares | | | | | | |
| | Common Stocks — 0.1% | |
| | | | Oil, Gas & Consumable Fuels — 0.0% | |
| | 61,854 | | | Ameriforge Group, Inc.(j)(k) | | | 5,691 | |
| | | | | | | | |
| | | | Pharmaceuticals — 0.1% | |
| | 192,793 | | | Akorn, Inc.(j)(l) | | | 1,108,560 | |
| | | | | | | | |
| | | | Total Common Stocks
(Identified Cost $4,793,325) | | | 1,114,251 | |
| | | | | | | | |
| | | | | | | | |
Principal Amount | | | | | | |
| | Short-Term Investments — 7.9% | |
| $ | 15,298,222 | | | Tri-Party Repurchase Agreement with Fixed Income Clearing Corporation, dated 11/30/2022 at 1.500% to be repurchased at $15,298,860 on 12/01/2022 collateralized by $17,025,900 U.S. Treasury Note, 0.500% due 3/31/2025 valued at $15,604,270 including accrued interest (Note 2 of Notes to Financial Statements) | | | 15,298,222 | |
| | | | | | | | |
| | 66,000,000 | | | U.S. Treasury Bills, 3.947%, 12/27/2022(m) | | | 65,814,577 | |
| | | | | | | | |
| | | | Total Short-Term Investments
(Identified Cost $81,110,082) | | | 81,112,799 | |
| | | | | | | | |
| | | | Total Investments — 99.7%
(Identified Cost $1,127,555,309) | | | 1,021,458,889 | |
| | | | Other assets less liabilities — 0.3% | | | 2,962,595 | |
| | | | | | | | |
| | | | Net Assets — 100.0% | | $ | 1,024,421,484 | |
| | | | | | | | |
| | | | | | | | |
| | (†) | | | See Note 2 of Notes to Financial Statements. | |
| | (a) | | | Position is unsettled. Contract rate was not determined at November 30, 2022 and does not take effect until settlement date. Maturity date is not finalized until settlement date. | |
| | (b) | | | Stated interest rate has been determined in accordance with the provisions of the loan agreement and is subject to a minimum benchmark floor rate of 0.75%, to which the spread is added. | |
| | (c) | | | Variable rate security. Rate as of November 30, 2022 is disclosed. | |
| | (d) | | | Stated interest rate has been determined in accordance with the provisions of the loan agreement and is subject to a minimum benchmark floor rate of 1.00%, to which the spread is added. | |
| | (e) | | | Stated interest rate has been determined in accordance with the provisions of the loan agreement and is subject to a minimum benchmark floor rate of 0.50%, to which the spread is added. | |
| | (f) | | | Stated interest rate has been determined in accordance with the provisions of the loan agreement and is subject to a minimum benchmark floor rate of 0.00%, to which the spread is added. | |
| | (g) | | | Variable rate security. Rate shown represents the weighted average rate of underlying contracts at November 30, 2022. Interest rates on contracts are primarily redetermined either weekly, monthly or quarterly by reference to the indicated base lending rate and spread and the reset period. | |
| | | | | | | | |
| | (h) | | | Unfunded loan commitment. An unfunded loan commitment is a contractual obligation for future funding at the option of the borrower. The Fund receives a stated coupon rate until the borrower draws on the loan commitment, at which time the rate will become the stated rate in the loan agreement. See Note 2 of Notes to Financial Statements. | |
| | (i) | | | Payment-in-kind security for which the issuer, at each interest payment date, may make interest payments in cash and/or additional principal. For the period ended November 30, 2022, interest payments were made in cash. | |
| | (j) | | | Non-income producing security. | |
| | (k) | | | Level 3 security. Value has been determined using significant unobservable inputs. See Note 3 of Notes to Financial Statements. | |
| | (l) | | | Securities subject to restriction on resale. At November 30, 2022, the restricted securities held by the Fund are as follows: | |
| | | | | | | | | | | | | | |
| | | Acquisition
Date | | | Acquisition
Cost | | Value | | | % of
Net Assets | |
| Akorn, Inc. | | | 10/06/2020 | | | $2,530,723* | | $ | 1,108,560 | | | | 0.1 | % |
| | | | | | | | |
| | * | | | Represents basis carried over in a non-taxable restructuring. | |
| | (m) | | | Interest rate represents discount rate at time of purchase; not a coupon rate. | |
| | | | | | | | |
| | 144A | | | All or a portion of these securities are exempt from registration under Rule 144A of the Securities Act of 1933. These securities may be resold in transactions exempt from registration, normally to qualified institutional buyers. At November 30, 2022, the value of Rule 144A holdings amounted to $57,159,451 or 5.6% of net assets. | |
| | LIBOR | | | London Interbank Offered Rate | |
| | PIK | | | Payment-in-Kind | |
| | REITs | | | Real Estate Investment Trusts | |
| | SOFR | | | Secured Overnight Financing Rate | |
Industry Summary at November 30, 2022
| | | | |
Technology | | | 15.6 | % |
Media Entertainment | | | 9.0 | |
Retailers | | | 6.3 | |
Healthcare | | | 5.7 | |
Consumer Cyclical Services | | | 4.8 | |
Chemicals | | | 4.7 | |
Consumer Products | | | 4.5 | |
Brokerage | | | 4.4 | |
Building Materials | | | 3.7 | |
Treasuries | | | 3.4 | |
Airlines | | | 2.9 | |
Diversified Manufacturing | | | 2.7 | |
Cable Satellite | | | 2.5 | |
Property & Casualty Insurance | | | 2.3 | |
Transportation Services | | | 2.1 | |
Other Investments, less than 2% each | | | 17.2 | |
Short-Term Investments | | | 7.9 | |
| | | | |
Total Investments | | | 99.7 | |
Other assets less liabilities | | | 0.3 | |
| | | | |
Net Assets | | | 100.0 | % |
| | | | |
See accompanying notes to financial statements.
21 |
Portfolio of Investments – as of November 30, 2022
Vaughan Nelson Select Fund
| | | | | | | | |
| Shares | | | Description | | Value (†) | |
| | Common Stocks — 98.4% of Net Assets | |
| | | | Auto Components — 0.9% | |
| | 486,465 | | | Luminar Technologies, Inc.(a) | | $ | 3,726,322 | |
| | | | | | | | |
| | | | Biotechnology — 3.4% | |
| | 45,075 | | | Vertex Pharmaceuticals, Inc.(a) | | | 14,261,730 | |
| | | | | | | | |
| | | | Capital Markets — 4.8% | |
| | 185,300 | | | Intercontinental Exchange, Inc. | | | 20,069,843 | |
| | | | | | | | |
| | | | Chemicals — 5.1% | |
| | 86,960 | | | Sherwin-Williams Co. (The) | | | 21,668,693 | |
| | | | | | | | |
| | | | Communications Equipment — 4.4% | |
| | 67,610 | | | Motorola Solutions, Inc. | | | 18,403,442 | |
| | | | | | | | |
| | | | Diversified Financial Services — 2.1% | |
| | 27,770 | | | Berkshire Hathaway, Inc., Class B(a) | | | 8,847,522 | |
| | | | | | | | |
| | | | Diversified Telecommunication Services — 2.7% | |
| | 199,410 | | | Cogent Communications Holdings, Inc. | | | 11,575,750 | |
| | | | | | | | |
| | | | Electric Utilities — 5.4% | |
| | 271,120 | | | NextEra Energy, Inc. | | | 22,963,864 | |
| | | | | | | | |
| | | | Food Products — 4.2% | |
| | 208,520 | | | McCormick & Co., Inc. | | | 17,761,734 | |
| | | | | | | | |
| | | | Health Care Providers & Services — 2.2% | |
| | 17,530 | | | Chemed Corp. | | | 9,115,600 | |
| | | | | | | | |
| | | | Household Products — 4.3% | |
| | 123,155 | | | Clorox Co. (The) | | | 18,306,991 | |
| | | | | | | | |
| | | | Insurance — 3.3% | |
| | 45,075 | | | Aon PLC, Class A | | | 13,895,721 | |
| | | | | | | | |
| | | | Interactive Media & Services — 3.8% | |
| | 160,030 | | | Alphabet, Inc., Class A(a) | | | 16,161,430 | |
| | | | | | | | |
| | | | Internet & Direct Marketing Retail — 3.7% | |
| | 160,485 | | | Amazon.com, Inc.(a) | | | 15,493,222 | |
| | | | | | | | |
| | | | IT Services — 3.9% | |
| | 39,835 | | | Jack Henry & Associates, Inc. | | | 7,542,757 | |
| | 45,530 | | | VeriSign, Inc.(a) | | | 9,097,350 | |
| | | | | | | | |
| | | | | | | 16,640,107 | |
| | | | | | | | |
| | | | Life Sciences Tools & Services — 4.7% | |
| | 73,070 | | | Danaher Corp. | | | 19,978,069 | |
| | | | | | | | |
| | | | Metals & Mining — 5.0% | |
| | 544,740 | | | Wheaton Precious Metals Corp. | | | 21,261,202 | |
| | | | | | | | |
| | | | Multiline Retail — 5.2% | |
| | 85,135 | | | Dollar General Corp. | | | 21,767,317 | |
| | | | | | | | |
| | | | Oil, Gas & Consumable Fuels — 2.6% | |
| | 1,629,445 | | | Kosmos Energy Ltd.(a) | | | 10,835,809 | |
| | | | | | | | |
| | | | Pharmaceuticals — 2.9% | |
| | 67,610 | | | Johnson & Johnson | | | 12,034,580 | |
| | | | | | | | |
| | | | REITs — Warehouse/Industrials — 2.1% | |
| | 74,665 | | | Prologis, Inc. | | | 8,794,790 | |
| | | | | | | | |
| | | | Road & Rail — 6.1% | |
| | 38,470 | | | Saia, Inc.(a) | | | 9,370,907 | |
| | 75,805 | | | Union Pacific Corp. | | | 16,482,281 | |
| | | | | | | | |
| | | | | | | 25,853,188 | |
| | | | | | | | |
| | | | Semiconductors & Semiconductor Equipment — 7.0% | |
| | 86,050 | | | Entegris, Inc. | | | 6,650,804 | |
| | 20,030 | | | Monolithic Power Systems, Inc. | | | 7,650,659 | |
| | 89,005 | | | NVIDIA Corp. | | | 15,062,316 | |
| | | | | | | | |
| | | | | | | 29,363,779 | |
| | | | | | | | |
| | | | Software — 8.6% | |
| | 78,310 | | | Microsoft Corp. | | | 19,980,013 | |
| | | | Software — continued | | | | |
| | 102,210 | | | Salesforce, Inc.(a) | | $ | 16,379,153 | |
| | | | | | | | |
| | | | | | | 36,359,166 | |
| | | | | | | | |
| | | | Total Common Stocks
(Identified Cost $397,448,866) | | | 415,139,871 | |
| | | | | | | | |
| | | | | | | | |
Principal
Amount | | | | | | |
| | Short-Term Investments — 1.1% | |
| $ | 4,580,631 | | | Tri-Party Repurchase Agreement with Fixed Income Clearing Corporation, dated 11/30/2022 at 1.500% to be repurchased at $4,580,822 on 12/01/2022 collateralized by $4,980,000 U.S. Treasury Note, 1.500% due 2/15/2025 valued at $4,672,251 including accrued interest (Note 2 of Notes to Financial Statements)
(Identified Cost $4,580,631) | | | 4,580,631 | |
| | | | | | | | |
| | | | | | | | |
| | | | Total Investments — 99.5%
(Identified Cost $402,029,497) | | | 419,720,502 | |
| | | | Other assets less liabilities — 0.5% | | | 2,081,091 | |
| | | | | | | | |
| | | | Net Assets — 100.0% | | $ | 421,801,593 | |
| | | | | | | | |
| | | | | | | | |
| | (†) | | | See Note 2 of Notes to Financial Statements. | | | | |
| | (a) | | | Non-income producing security. | | | | |
| | | | | | | | |
| | REITs | | | Real Estate Investment Trusts | |
Industry Summary at November 30, 2022
| | | | |
Software | | | 8.6 | % |
Semiconductors & Semiconductor Equipment | | | 7.0 | |
Road & Rail | | | 6.1 | |
Electric Utilities | | | 5.4 | |
Multiline Retail | | | 5.2 | |
Chemicals | | | 5.1 | |
Metals & Mining | | | 5.0 | |
Capital Markets | | | 4.8 | |
Life Sciences Tools & Services | | | 4.7 | |
Communications Equipment | | | 4.4 | |
Household Products | | | 4.3 | |
Food Products | | | 4.2 | |
IT Services | | | 3.9 | |
Interactive Media & Services | | | 3.8 | |
Internet & Direct Marketing Retail | | | 3.7 | |
Biotechnology | | | 3.4 | |
Insurance | | | 3.3 | |
Pharmaceuticals | | | 2.9 | |
Diversified Telecommunication Services | | | 2.7 | |
Oil, Gas & Consumable Fuels | | | 2.6 | |
Health Care Providers & Services | | | 2.2 | |
Diversified Financial Services | | | 2.1 | |
REITs—Warehouse/Industrials | | | 2.1 | |
Auto Components | | | 0.9 | |
Short-Term Investments | | | 1.1 | |
| | | | |
Total Investments | | | 99.5 | |
Other assets less liabilities | | | 0.5 | |
| | | | |
Net Assets | | | 100.0 | % |
| | | | |
See accompanying notes to financial statements.
| 22
Statements of Assets and Liabilities
November 30, 2022
| | | | | | | | | | | | |
| | | Loomis Sayles
Global Growth
Fund | | | Loomis Sayles
Senior Floating
Rate and Fixed
Income Fund | | | Vaughan Nelson
Select Fund | |
ASSETS | | | | | | | | | | | | |
Investments at cost | | $ | 103,986,704 | | | $ | 1,127,555,309 | | | $ | 402,029,497 | |
Net unrealized appreciation (depreciation) | | | (8,841,850 | ) | | | (106,096,420 | ) | | | 17,691,005 | |
| | | | | | | | | | | | |
Investments at value | | | 95,144,854 | | | | 1,021,458,889 | | | | 419,720,502 | |
Cash | | | — | | | | 4,782,989 | | | | 130 | |
Receivable for Fund shares sold | | | 8,936 | | | | 1,073,883 | | | | 2,219,232 | |
Receivable for securities sold | | | — | | | | 48,849,961 | | | | — | |
Receivable for unfunded loan commitments sold (Note 2) | | | — | | | | 350,879 | | | | — | |
Dividends and interest receivable | | | 79,543 | | | | 9,467,430 | | | | 520,417 | |
Tax reclaims receivable | | | 167,459 | | | | — | | | | — | |
Prepaid expenses (Note 7) | | | 566 | | | | 442,302 | | | | 584 | |
| | | | | | | | | | | | |
TOTAL ASSETS | | | 95,401,358 | | | | 1,086,426,333 | | | | 422,460,865 | |
| | | | | | | | | | | | |
LIABILITIES | | | | | | | | | | | | |
Payable for securities purchased | | | — | | | | 56,076,775 | | | | — | |
Unfunded loan commitments (Note 2) | | | — | | | | 297,806 | | | | — | |
Payable for Fund shares redeemed | | | 616,936 | | | | 2,922,605 | | | | 263,862 | |
Distributions payable | | | — | | | | 1,393,684 | | | | — | |
Management fees payable (Note 5) | | | 39,272 | | | | 264,766 | | | | 205,613 | |
Deferred Trustees’ fees (Note 5) | | | 33,643 | | | | 286,045 | | | | 85,602 | |
Administrative fees payable (Note 5) | | | 3,602 | | | | 39,676 | | | | 13,547 | |
Payable to distributor (Note 5d) | | | 539 | | | | 26,854 | | | | 3,055 | |
Audit and tax services fees payable | | | 44,868 | | | | 91,807 | | | | 44,482 | |
Other accounts payable and accrued expenses | | | 42,699 | | | | 604,831 | | | | 43,111 | |
| | | | | | | | | | | | |
TOTAL LIABILITIES | | | 781,559 | | | | 62,004,849 | | | | 659,272 | |
| | | | | | | | | | | | |
NET ASSETS | | $ | 94,619,799 | | | $ | 1,024,421,484 | | | $ | 421,801,593 | |
| | | | | | | | | | | | |
NET ASSETS CONSIST OF: | | | | | | | | | | | | |
Paid-in capital | | $ | 101,602,490 | | | $ | 1,706,573,052 | | | $ | 406,970,326 | |
Accumulated earnings (loss) | | | (6,982,691 | ) | | | (682,151,568 | ) | | | 14,831,267 | |
| | | | | | | | | | | | |
NET ASSETS | | $ | 94,619,799 | | | $ | 1,024,421,484 | | | $ | 421,801,593 | |
| | | | | | | | | | | | |
COMPUTATION OF NET ASSET VALUE AND OFFERING PRICE: | | | | | | | | | | | | |
Class A shares: | | | | | | | | | | | | |
Net assets | | $ | 3,225,400 | | | $ | 188,201,097 | | | $ | 23,652,927 | |
| | | | | | | | | | | | |
Shares of beneficial interest | | | 230,460 | | | | 23,143,429 | | | | 1,372,013 | |
| | | | | | | | | | | | |
Net asset value and redemption price per share | | $ | 14.00 | | | $ | 8.13 | | | $ | 17.24 | |
| | | | | | | | | | | | |
Offering price per share (100/[100-maximum sales charge] of net asset value) (Note 1) | | $ | 14.85 | | | $ | 8.42 | | | $ | 18.29 | |
| | | | | | | | | | | | |
Class C shares: (redemption price per share is equal to net asset value less any applicable contingent deferred sales charge) (Note 1) | | | | | | | | | | | | |
Net assets | | $ | 833,061 | | | $ | 62,569,838 | | | $ | 5,783,913 | |
| | | | | | | | | | | | |
Shares of beneficial interest | | | 62,497 | | | | 7,720,709 | | | | 373,498 | |
| | | | | | | | | | | | |
Net asset value and offering price per share | | $ | 13.33 | | | $ | 8.10 | | | $ | 15.49 | |
| | | | | | | | | | | | |
Class N shares: | | | | | | | | | | | | |
Net assets | | $ | 9,725,449 | | | $ | 2,277,732 | | | $ | 288,675 | |
| | | | | | | | | | | | |
Shares of beneficial interest | | | 684,255 | | | | 280,215 | | | | 16,557 | |
| | | | | | | | | | | | |
Net asset value, offering and redemption price per share | | $ | 14.21 | | | $ | 8.13 | | | $ | 17.43 | * |
| | | | | | | | | | | | |
Class Y shares: | | | | | | | | | | | | |
Net assets | | $ | 80,835,889 | | | $ | 771,372,817 | | | $ | 392,076,078 | |
| | | | | | | | | | | | |
Shares of beneficial interest | | | 5,699,308 | | | | 94,744,367 | | | | 22,489,514 | |
| | | | | | | | | | | | |
Net asset value, offering and redemption price per share | | $ | 14.18 | | | $ | 8.14 | | | $ | 17.43 | |
| | | | | | | | | | | | |
| * | Net asset value calculations have been determined utilizing fractional share and penny amounts. |
See accompanying notes to financial statements.
23 |
Statements of Operations
For the Year Ended November 30, 2022
| | | | | | | | | | | | |
| | | Loomis Sayles
Global Growth
Fund | | | Loomis Sayles
Senior Floating
Rate and Fixed
Income Fund | | | Vaughan Nelson
Select Fund | |
INVESTMENT INCOME | |
Dividends | | $ | 1,080,952 | | | $ | 285,117 | | | $ | 3,294,848 | |
Interest | | | 1,985 | | | | 83,367,622 | | | | 43,344 | |
Less net foreign taxes withheld | | | (91,108 | ) | | | — | | | | (46,794 | ) |
| | | | | | | | | | | | |
| | | 991,829 | | | | 83,652,739 | | | | 3,291,398 | |
| | | | | | | | | | | | |
Expenses | |
Management fees (Note 5) | | | 845,480 | | | | 8,446,989 | | | | 2,090,197 | |
Service and distribution fees (Note 5) | | | 20,684 | | | | 1,300,906 | | | | 111,317 | |
Administrative fees (Note 5) | | | 50,488 | | | | 629,723 | | | | 134,144 | |
Trustees’ fees and expenses (Note 5) | | | 15,560 | | | | 53,937 | | | | 21,005 | |
Trustees’ fees deferred compensation (Note 5) | | | (3,714 | ) | | | (54,892 | ) | | | (14,878 | ) |
Transfer agent fees and expenses (Notes 5 and 6) | | | 95,075 | | | | 986,745 | | | | 131,049 | |
Audit and tax services fees | | | 44,847 | | | | 91,586 | | | | 44,451 | |
Commitment fees (Note 7) | | | 1,372 | | | | 2,483,796 | | | | 3,536 | |
Custodian fees and expenses | | | 30,880 | | | | 178,867 | | | | 12,833 | |
Legal fees (Note 7) | | | 3,769 | | | | 90,540 | | | | 9,817 | |
Registration fees | | | 77,438 | | | | 131,905 | | | | 115,692 | |
Shareholder reporting expenses | | | 23,767 | | | | 135,632 | | | | 35,146 | |
Miscellaneous expenses | | | 50,645 | | | | 773,395 | | | | 33,741 | |
| | | | | | | | | | | | |
Total expenses | | | 1,256,291 | | | | 15,249,129 | | | | 2,728,050 | |
Less waiver and/or expense reimbursement (Note 5) | | | (167,902 | ) | | | (2,686,770 | ) | | | (98,713 | ) |
| | | | | | | | | | | | |
Net expenses | | | 1,088,389 | | | | 12,562,359 | | | | 2,629,337 | |
| | | | | | | | | | | | |
Net investment income (loss) | | | (96,560 | ) | | | 71,090,380 | | | | 662,061 | |
| | | | | | | | | | | | |
NET REALIZED AND UNREALIZED GAIN (LOSS) ON INVESTMENTS AND FOREIGN CURRENCY TRANSACTIONS | |
Net realized gain (loss) on: | |
Investments | | | 4,904,225 | | | | (43,971,877 | ) | | | 426,161 | |
Foreign currency transactions (Note 2c) | | | (12,182 | ) | | | — | | | | — | |
Net change in unrealized appreciation (depreciation) on: | |
Investments | | | (34,072,707 | ) | | | (96,207,311 | ) | | | (29,095,861 | ) |
Foreign currency translations (Note 2c) | | | (5,781 | ) | | | — | | | | — | |
| | | | | | | | | | | | |
Net realized and unrealized loss on investments and foreign currency transactions | | | (29,186,445 | ) | | | (140,179,188 | ) | | | (28,669,700 | ) |
| | | | | | | | | | | | |
NET DECREASE IN NET ASSETS RESULTING FROM OPERATIONS | | $ | (29,283,005 | ) | | $ | (69,088,808 | ) | | $ | (28,007,639 | ) |
| | | | | | | | | | | | |
See accompanying notes to financial statements.
| 24
Statements of Changes in Net Assets
| | | | | | | | | | | | | | | | |
| | | Loomis Sayles Global
Growth Fund | | | Loomis Sayles Senior Floating
Rate and Fixed Income Fund | |
| | | Year Ended
November 30,
2022 | | | Year Ended
November 30,
2021 | | | Year Ended
November 30,
2022 | | | Year Ended
November 30,
2021 | |
FROM OPERATIONS: | |
Net investment income (loss) | | $ | (96,560 | ) | | $ | (258,520 | ) | | $ | 71,090,380 | | | $ | 51,332,430 | |
Net realized gain (loss) on investments and foreign currency transactions | | | 4,892,043 | | | | 8,849,904 | | | | (43,971,877 | ) | | | (24,260,954 | ) |
Net change in unrealized appreciation (depreciation) on investments and foreign currency translations | | | (34,078,488 | ) | | | (244,698 | ) | | | (96,207,311 | ) | | | 43,975,682 | |
| | | | | | | | | | | | | | | | |
Net increase (decrease) in net assets resulting from operations | | | (29,283,005 | ) | | | 8,346,686 | | | | (69,088,808 | ) | | | 71,047,158 | |
| | | | | | | | | | | | | | | | |
FROM DISTRIBUTIONS TO SHAREHOLDERS: | |
Class A | | | (424,756 | ) | | | (302,254 | ) | | | (11,061,592 | ) | | | (7,816,936 | ) |
Class C | | | (94,792 | ) | | | (82,175 | ) | | | (3,435,444 | ) | | | (3,142,482 | ) |
Class N | | | (858,053 | ) | | | (686,183 | ) | | | (133,691 | ) | | | (35,590 | ) |
Class Y | | | (7,451,003 | ) | | | (5,268,903 | ) | | | (59,453,231 | ) | | | (41,173,659 | ) |
| | | | | | | | | | | | | | | | |
Total distributions | | | (8,828,604 | ) | | | (6,339,515 | ) | | | (74,083,958 | ) | | | (52,168,667 | ) |
| | | | | | | | | | | | | | | | |
NET INCREASE (DECREASE) IN NET ASSETS FROM CAPITAL SHARE TRANSACTIONS (NOTE 10) | | | 6,941,153 | | | | 19,288,502 | | | | (372,127,749 | ) | | | 310,703,802 | |
| | | | | | | | | | | | | | | | |
Net increase (decrease) in net assets | | | (31,170,456 | ) | | | 21,295,673 | | | | (515,300,515 | ) | | | 329,582,293 | |
NET ASSETS | |
Beginning of the year | | | 125,790,255 | | | | 104,494,582 | | | | 1,539,721,999 | | | | 1,210,139,706 | |
| | | | | | | | | | | | | | | | |
End of the year | | $ | 94,619,799 | | | $ | 125,790,255 | | | $ | 1,024,421,484 | | | $ | 1,539,721,999 | |
| | | | | | | | | | | | | | | | |
See accompanying notes to financial statements.
25 |
Statements of Changes in Net Assets (continued)
| | | | | | | | |
| | | Vaughan Nelson Select Fund | |
| | | Year Ended
November 30,
2022 | | | Year Ended
November 30,
2021 | |
FROM OPERATIONS: | |
Net investment income | | $ | 662,061 | | | $ | 1,093,299 | |
Net realized gain on investments | | | 426,161 | | | | 71,247,074 | |
Net change in unrealized appreciation (depreciation) on investments | | | (29,095,861 | ) | | | 1,343,536 | |
| | | | | | | | |
Net increase (decrease) in net assets resulting from operations | | | (28,007,639 | ) | | | 73,683,909 | |
| | | | | | | | |
FROM DISTRIBUTIONS TO SHAREHOLDERS: | |
Class A | | | (6,535,289 | ) | | | (924,582 | ) |
Class C | | | (1,628,941 | ) | | | (347,176 | ) |
Class N | | | (628 | ) | | | (112 | ) |
Class Y | | | (66,474,581 | ) | | | (11,428,722 | ) |
| | | | | | | | |
Total distributions | | | (74,639,439 | ) | | | (12,700,592 | ) |
| | | | | | | | |
NET INCREASE (DECREASE) IN NET ASSETS FROM CAPITAL SHARE TRANSACTIONS (NOTE 10) | | | 272,403,248 | | | | (33,464,710 | ) |
| | | | | | | | |
Net increase in net assets | | | 169,756,170 | | | | 27,518,607 | |
NET ASSETS | |
Beginning of the year | | | 252,045,423 | | | | 224,526,816 | |
| | | | | | | | |
End of the year | | $ | 421,801,593 | | | $ | 252,045,423 | |
| | | | | | | | |
See accompanying notes to financial statements.
| 26
Financial Highlights
For a share outstanding throughout each period.
| | | | | | | | | | | | | | | | | | | | |
| | | Loomis Sayles Global Growth Fund—Class A | |
| | | Year Ended
November 30,
2022 | | | Year Ended
November 30,
2021 | | | Year Ended
November 30,
2020 | | | Year Ended
November 30,
2019 | | | Year Ended
November 30,
2018 | |
Net asset value, beginning of the period | | $ | 19.07 | | | $ | 18.78 | | | $ | 14.78 | | | $ | 13.28 | | | $ | 13.44 | |
| | | | | | | | | | | | | | | | | | | | |
INCOME (LOSS) FROM INVESTMENT OPERATIONS: | | | | | | | | | | | | | | | | | | | | |
Net investment income (loss)(a) | | | (0.04 | ) | | | (0.09 | ) | | | (0.05 | ) | | | 0.00 | (b) | | | 0.02 | |
Net realized and unrealized gain (loss) | | | (3.68 | ) | | | 1.52 | | | | 4.88 | | | | 2.03 | | | | 0.26 | (c) |
| | | | | | | | | | | | | | | | | | | | |
Total from Investment Operations | | | (3.72 | ) | | | 1.43 | | | | 4.83 | | | | 2.03 | | | | 0.28 | |
| | | | | | | | | | | | | | | | | | | | |
LESS DISTRIBUTIONS FROM: | | | | | | | | | | | | | | | | | | | | |
Net investment income | | | — | | | | — | | | | — | | | | (0.05 | ) | | | (0.03 | ) |
Net realized capital gains | | | (1.35 | ) | | | (1.14 | ) | | | (0.83 | ) | | | (0.48 | ) | | | (0.41 | ) |
| | | | | | | | | | | | | | | | | | | | |
Total Distributions | | | (1.35 | ) | | | (1.14 | ) | | | (0.83 | ) | | | (0.53 | ) | | | (0.44 | ) |
| | | | | | | | | | | | | | | | | | | | |
Net asset value, end of the period | | $ | 14.00 | | | $ | 19.07 | | | $ | 18.78 | | | $ | 14.78 | | | $ | 13.28 | |
| | | | | | | | | | | | | | | | | | | | |
Total return(d)(e) | | | (21.08 | )% | | | 7.95 | % | | | 34.37 | % | | | 16.25 | % | | | 2.05 | % |
RATIOS TO AVERAGE NET ASSETS: | | | | | | | | | | | | | | | | | | | | |
Net assets, end of the period (000’s) | | $ | 3,225 | | | $ | 6,173 | | | $ | 4,913 | | | $ | 2,832 | | | $ | 1,851 | |
Net expenses(f) | | | 1.20 | % | | | 1.20 | %(g) | | | 1.25 | % | | | 1.26 | %(h) | | | 1.27 | % |
Gross expenses | | | 1.35 | % | | | 1.29 | % | | | 1.44 | % | | | 1.49 | % | | | 1.62 | % |
Net investment income (loss) | | | (0.25 | )% | | | (0.43 | )% | | | (0.33 | )% | | | 0.03 | % | | | 0.16 | % |
Portfolio turnover rate | | | 43 | % | | | 18 | % | | | 44 | % | | | 37 | % | | | 24 | % |
| (a) | Per share net investment income (loss) has been calculated using the average shares outstanding during the period. |
| (b) | Amount rounds to less than $0.01 per share. |
| (c) | The amount shown for a share outstanding does not correspond with the aggregate realized and unrealized gain (loss) on investments for the period due to the timing of sales and redemptions of fund shares in relation to fluctuating market values of investments of the Fund. |
| (d) | A sales charge for Class A shares is not reflected in total return calculations. |
| (e) | Had certain expenses not been waived/reimbursed during the period, total returns would have been lower. |
| (f) | The investment adviser agreed to waive its fees and/or reimburse a portion of the Fund’s expenses during the period. Without this waiver/reimbursement, expenses would have been higher. |
| (g) | Effective December 15, 2020, the expense limit decreased from 1.25% to 1.20%. |
| (h) | Effective July 1, 2019, the expense limit decreased from 1.30% to 1.25%. |
See accompanying notes to financial statements.
27 |
Financial Highlights (continued)
For a share outstanding throughout each period.
| | | | | | | | | | | | | | | | | | | | |
| | | Loomis Sayles Global Growth Fund—Class C | |
| | | Year Ended
November 30,
2022 | | | Year Ended
November 30,
2021 | | | Year Ended
November 30,
2020 | | | Year Ended
November 30,
2019 | | | Year Ended
November 30,
2018 | |
Net asset value, beginning of the period | | $ | 18.36 | | | $ | 18.24 | | | $ | 14.49 | | | $ | 13.06 | | | $ | 13.30 | |
| | | | | | | | | | | | | | | | | | | | |
INCOME (LOSS) FROM INVESTMENT OPERATIONS: | | | | | | | | | | | | | | | | | | | | |
Net investment loss(a) | | | (0.15 | ) | | | (0.22 | ) | | | (0.16 | ) | | | (0.09 | ) | | | (0.09 | ) |
Net realized and unrealized gain (loss) | | | (3.53 | ) | | | 1.48 | | | | 4.74 | | | | 2.00 | | | | 0.26 | (b) |
| | | | | | | | | | | | | | | | | | | | |
Total from Investment Operations | | | (3.68 | ) | | | 1.26 | | | | 4.58 | | | | 1.91 | | | | 0.17 | |
| | | | | | | | | | | | | | | | | | | | |
LESS DISTRIBUTIONS FROM: | | | | | | | | | | | | | | | | | | | | |
Net investment income | | | — | | | | — | | | | — | | | | (0.00 | )(c) | | | — | |
Net realized capital gains | | | (1.35 | ) | | | (1.14 | ) | | | (0.83 | ) | | | (0.48 | ) | | | (0.41 | ) |
| | | | | | | | | | | | | | | | | | | | |
Total Distributions | | | (1.35 | ) | | | (1.14 | ) | | | (0.83 | ) | | | (0.48 | ) | | | (0.41 | ) |
| | | | | | | | | | | | | | | | | | | | |
Net asset value, end of the period | | $ | 13.33 | | | $ | 18.36 | | | $ | 18.24 | | | $ | 14.49 | | | $ | 13.06 | |
| | | | | | | | | | | | | | | | | | | | |
Total return(d)(e) | | | (21.71 | )% | | | 7.15 | % | | | 33.44 | % | | | 15.40 | % | | | 1.25 | % |
RATIOS TO AVERAGE NET ASSETS: | | | | | | | | | | | | | | | | | | | | |
Net assets, end of the period (000’s) | | $ | 833 | | | $ | 1,297 | | | $ | 1,274 | | | $ | 1,079 | | | $ | 606 | |
Net expenses(f) | | | 1.95 | % | | | 1.95 | %(g) | | | 2.00 | % | | | 2.01 | %(h) | | | 2.03 | % |
Gross expenses | | | 2.10 | % | | | 2.04 | % | | | 2.19 | % | | | 2.23 | % | | | 2.37 | % |
Net investment loss | | | (1.03 | )% | | | (1.17 | )% | | | (1.05 | )% | | | (0.69 | )% | | | (0.71 | )% |
Portfolio turnover rate | | | 43 | % | | | 18 | % | | | 44 | % | | | 37 | % | | | 24 | %�� |
| (a) | Per share net investment loss has been calculated using the average shares outstanding during the period. |
| (b) | The amount shown for a share outstanding does not correspond with the aggregate realized and unrealized gain (loss) on investments for the period due to the timing of sales and redemptions of fund shares in relation to fluctuating market values of investments of the Fund. |
| (c) | Amount rounds to less than $0.01 per share. |
| (d) | A contingent deferred sales charge for Class C shares is not reflected in total return calculations. |
| (e) | Had certain expenses not been waived/reimbursed during the period, total returns would have been lower. |
| (f) | The investment adviser agreed to waive its fees and/or reimburse a portion of the Fund’s expenses during the period. Without this waiver/reimbursement, expenses would have been higher. |
| (g) | Effective December 15, 2020, the expense limit decreased from 2.00% to 1.95%. |
| (h) | Effective July 1, 2019, the expense limit decreased from 2.05% to 2.00%. |
See accompanying notes to financial statements.
| 28
Financial Highlights (continued)
For a share outstanding throughout each period.
| | | | | | | | | | | | | | | | | | | | |
| | | Loomis Sayles Global Growth Fund—Class N | |
| | | Year Ended
November 30,
2022 | | | Year Ended
November 30,
2021 | | | Year Ended
November 30,
2020 | | | Year Ended
November 30,
2019 | | | Year Ended
November 30,
2018 | |
Net asset value, beginning of the period | | $ | 19.29 | | | $ | 18.93 | | | $ | 14.85 | | | $ | 13.34 | | | $ | 13.49 | |
| | | | | | | | | | | | | | | | | | | | |
INCOME (LOSS) FROM INVESTMENT OPERATIONS: | | | | | | | | | | | | | | | | | | | | |
Net investment income (loss)(a) | | | (0.00 | )(b) | | | (0.03 | ) | | | (0.01 | ) | | | 0.05 | | | | 0.05 | |
Net realized and unrealized gain (loss) | | | (3.73 | ) | | | 1.53 | | | | 4.92 | | | | 2.03 | | | | 0.26 | (c) |
| | | | | | | | | | | | | | | | | | | | |
Total from Investment Operations | | | (3.73 | ) | | | 1.50 | | | | 4.91 | | | | 2.08 | | | | 0.31 | |
| | | | | | | | | | | | | | | | | | | | |
LESS DISTRIBUTIONS FROM: | | | | | | | | | | | | | | | | | | | | |
Net investment income | | | — | | | | — | | | | — | | | | (0.09 | ) | | | (0.05 | ) |
Net realized capital gains | | | (1.35 | ) | | | (1.14 | ) | | | (0.83 | ) | | | (0.48 | ) | | | (0.41 | ) |
| | | | | | | | | | | | | | | | | | | | |
Total Distributions | | | (1.35 | ) | | | (1.14 | ) | | | (0.83 | ) | | | (0.57 | ) | | | (0.46 | ) |
| | | | | | | | | | | | | | | | | | | | |
Net asset value, end of the period | | $ | 14.21 | | | $ | 19.29 | | | $ | 18.93 | | | $ | 14.85 | | | $ | 13.34 | |
| | | | | | | | | | | | | | | | | | | | |
Total return(d) | | | (20.87 | )% | | | 8.21 | % | | | 34.84 | % | | | 16.61 | % | | | 2.31 | % |
RATIOS TO AVERAGE NET ASSETS: | | | | | | | | | | | | | | | | | | | | |
Net assets, end of the period (000’s) | | $ | 9,725 | | | $ | 12,293 | | | $ | 11,357 | | | $ | 3,319 | | | $ | 2,843 | |
Net expenses(e) | | | 0.90 | % | | | 0.90 | %(f) | | | 0.95 | % | | | 0.98 | %(g) | | | 1.00 | % |
Gross expenses | | | 1.02 | % | | | 0.98 | % | | | 1.13 | % | | | 1.22 | % | | | 1.35 | %�� |
Net investment income (loss) | | | (0.01 | )% | | | (0.14 | )% | | | (0.09 | )% | | | 0.35 | % | | | 0.38 | % |
Portfolio turnover rate | | | 43 | % | | | 18 | % | | | 44 | % | | | 37 | % | | | 24 | % |
| (a) | Per share net investment income (loss) has been calculated using the average shares outstanding during the period. |
| (b) | Amount rounds to less than $0.01 per share. |
| (c) | The amount shown for a share outstanding does not correspond with the aggregate realized and unrealized gain (loss) on investments for the period due to the timing of sales and redemptions of fund shares in relation to fluctuating market values of investments of the Fund. |
| (d) | Had certain expenses not been waived/reimbursed during the period, total returns would have been lower. |
| (e) | The investment adviser agreed to waive its fees and/or reimburse a portion of the Fund’s expenses during the period. Without this waiver/reimbursement, expenses would have been higher. |
| (f) | Effective December 15, 2020, the expense limit decreased from 0.95% to 0.90%. |
| (g) | Effective July 1, 2019, the expense limit decreased from 1.00% to 0.95%. |
See accompanying notes to financial statements.
29 |
Financial Highlights (continued)
For a share outstanding throughout each period.
| | | | | | | | | | | | | | | | | | | | |
| | | Loomis Sayles Global Growth Fund—Class Y | |
| | | Year Ended
November 30,
2022 | | | Year Ended
November 30,
2021 | | | Year Ended
November 30,
2020 | | | Year Ended
November 30,
2019 | | | Year Ended
November 30,
2018 | |
Net asset value, beginning of the period | | $ | 19.27 | | | $ | 18.91 | | | $ | 14.85 | | | $ | 13.33 | | | $ | 13.48 | |
| | | | | | | | | | | | | | | | | | | | |
INCOME (LOSS) FROM INVESTMENT OPERATIONS: | | | | | | | | | | | | | | | | | | | | |
Net investment income (loss)(a) | | | (0.01 | ) | | | (0.04 | ) | | | (0.01 | ) | | | 0.04 | | | | 0.04 | |
Net realized and unrealized gain (loss) | | | (3.73 | ) | | | 1.54 | | | | 4.90 | | | | 2.04 | | | | 0.27 | (b) |
| | | | | | | | | | | | | | | | | | | | |
Total from Investment Operations | | | (3.74 | ) | | | 1.50 | | | | 4.89 | | | | 2.08 | | | | 0.31 | |
| | | | | | | | | | | | | | | | | | | | |
LESS DISTRIBUTIONS FROM: | | | | | | | | | | | | | | | | | | | | |
Net investment income | | | — | | | | — | | | | — | | | | (0.08 | ) | | | (0.05 | ) |
Net realized capital gains | | | (1.35 | ) | | | (1.14 | ) | | | (0.83 | ) | | | (0.48 | ) | | | (0.41 | ) |
| | | | | | | | | | | | | | | | | | | | |
Total Distributions | | | (1.35 | ) | | | (1.14 | ) | | | (0.83 | ) | | | (0.56 | ) | | | (0.46 | ) |
| | | | | | | | | | | | | | | | | | | | |
Net asset value, end of the period | | $ | 14.18 | | | $ | 19.27 | | | $ | 18.91 | | | $ | 14.85 | | | $ | 13.33 | |
| | | | | | | | | | | | | | | | | | | | |
Total return(c) | | | (20.95 | )% | | | 8.22 | % | | | 34.70 | % | | | 16.65 | % | | | 2.27 | % |
RATIOS TO AVERAGE NET ASSETS: | | | | | | | | | | | | | | | | | | | | |
Net assets, end of the period (000’s) | | $ | 80,836 | | | $ | 106,028 | | | $ | 86,950 | | | $ | 63,308 | | | $ | 52,147 | |
Net expenses(d) | | | 0.95 | %�� | | | 0.95 | %(e) | | | 1.00 | % | | | 1.01 | %(f) | | | 1.02 | % |
Gross expenses | | | 1.10 | % | | | 1.04 | % | | | 1.19 | % | | | 1.23 | % | | | 1.37 | % |
Net investment income (loss) | | | (0.08 | )% | | | (0.19 | )% | | | (0.05 | )% | | | 0.30 | % | | | 0.33 | % |
Portfolio turnover rate | | | 43 | % | | | 18 | % | | | 44 | % | | | 37 | % | | | 24 | % |
| (a) | Per share net investment income (loss) has been calculated using the average shares outstanding during the period. |
| (b) | The amount shown for a share outstanding does not correspond with the aggregate realized and unrealized gain (loss) on investments for the period due to the timing of sales and redemptions of fund shares in relation to fluctuating market values of investments of the Fund. |
| (c) | Had certain expenses not been waived/reimbursed during the period, total returns would have been lower. |
| (d) | The investment adviser agreed to waive its fees and/or reimburse a portion of the Fund’s expenses during the period. Without this waiver/reimbursement, expenses would have been higher. |
| (e) | Effective December 15, 2020, the expense limit decreased from 1.00% to 0.95%. |
| (f) | Effective July 1, 2019, the expense limit decreased from 1.05% to 1.00%. |
See accompanying notes to financial statements.
| 30
Financial Highlights (continued)
For a share outstanding throughout each period.
| | | | | | | | | | | | | | | | | | | | |
| | | Loomis Sayles Senior Floating Rate and Fixed Income Fund—Class A | |
| | | Year Ended
November 30,
2022 | | | Year Ended
November 30,
2021 | | | Year Ended
November 30,
2020 | | | Year Ended
November 30,
2019 | | | Year Ended
November 30,
2018 | |
Net asset value, beginning of the period | | $ | 8.96 | | | $ | 8.81 | | | $ | 9.16 | | | $ | 9.62 | | | $ | 9.89 | |
| | | | | | | | | | | | | | | | | | | | |
INCOME (LOSS) FROM INVESTMENT OPERATIONS: | | | | | | | | | | | | | | | | | | | | |
Net investment income(a) | | | 0.43 | | | | 0.32 | | | | 0.43 | | | | 0.57 | | | | 0.53 | |
Net realized and unrealized gain (loss) | | | (0.81 | ) | | | 0.16 | | | | (0.34 | ) | | | (0.45 | ) | | | (0.26 | ) |
| | | | | | | | | | | | | | | | | | | | |
Total from Investment Operations | | | (0.38 | ) | | | 0.48 | | | | 0.09 | | | | 0.12 | | | | 0.27 | |
| | | | | | | | | | | | | | | | | | | | |
LESS DISTRIBUTIONS FROM: | | | | | | | | | | | | | | | | | | | | |
Net investment income | | | (0.45 | ) | | | (0.33 | ) | | | (0.44 | ) | | | (0.58 | ) | | | (0.54 | ) |
| | | | | | | | | | | | | | | | | | | | |
Net asset value, end of the period | | $ | 8.13 | | | $ | 8.96 | | | $ | 8.81 | | | $ | 9.16 | | | $ | 9.62 | |
| | | | | | | | | | | | | | | | | | | | |
Total return(b) | | | (4.28 | )%(c) | | | 5.47 | %(c) | | | 1.19 | %(c) | | | 1.23 | %(c) | | | 2.78 | % |
RATIOS TO AVERAGE NET ASSETS: | | | | | | | | | | | | | | | | | | | | |
Net assets, end of the period (000’s) | | $ | 188,201 | | | $ | 219,989 | | | $ | 208,251 | | | $ | 297,634 | | | $ | 532,551 | |
Net expenses | | | 1.05 | %(d) | | | 1.05 | %(d) | | | 1.07 | %(d)(e) | | | 1.06 | %(d)(f) | | | 1.05 | % |
Gross expenses | | | 1.24 | % | | | 1.24 | % | | | 1.20 | %(e) | | | 1.09 | %(f) | | | 1.05 | % |
Net investment income | | | 5.04 | % | | | 3.56 | % | | | 4.96 | % | | | 6.03 | % | | | 5.42 | % |
Portfolio turnover rate | | | 65 | % | | | 79 | % | | | 65 | % | | | 52 | % | | | 65 | % |
| (a) | Per share net investment income has been calculated using the average shares outstanding during the period. |
| (b) | A sales charge for Class A shares is not reflected in total return calculations. |
| (c) | Had certain expenses not been waived/reimbursed during the period, total returns would have been lower. |
| (d) | The investment adviser agreed to waive its fees and/or reimburse a portion of the Fund’s expenses during the period. Without this waiver/reimbursement, expenses would have been higher. |
| (e) | Includes interest expense. Without this expense the ratio of net expenses would have been 1.05% and the ratio of gross expenses would have been 1.18%. |
| (f) | Includes interest expense. Without this expense the ratio of net expenses would have been 1.05% and the ratio of gross expenses would have been 1.08%. |
See accompanying notes to financial statements.
31 |
Financial Highlights (continued)
For a share outstanding throughout each period.
| | | | | | | | | | | | | | | | | | | | |
| | | Loomis Sayles Senior Floating Rate and Fixed Income Fund—Class C | |
| | | Year Ended
November 30,
2022 | | | Year Ended
November 30,
2021 | | | Year Ended
November 30,
2020 | | | Year Ended
November 30,
2019 | | | Year Ended
November 30,
2018 | |
Net asset value, beginning of the period | | $ | 8.93 | | | $ | 8.78 | | | $ | 9.12 | | | $ | 9.59 | | | $ | 9.86 | |
| | | | | | | | | | | | | | | | | | | | |
INCOME (LOSS) FROM INVESTMENT OPERATIONS: | | | | | | | | | | | | | | | | | | | | |
Net investment income(a) | | | 0.36 | | | | 0.25 | | | | 0.37 | | | | 0.50 | | | | 0.46 | |
Net realized and unrealized gain (loss) | | | (0.80 | ) | | | 0.16 | | | | (0.34 | ) | | | (0.46 | ) | | | (0.26 | ) |
| | | | | | | | | | | | | | | | | | | | |
Total from Investment Operations | | | (0.44 | ) | | | 0.41 | | | | 0.03 | | | | 0.04 | | | | 0.20 | |
| | | | | | | | | | | | | | | | | | | | |
LESS DISTRIBUTIONS FROM: | | | | | | | | | | | | | | | | | | | | |
Net investment income | | | (0.39 | ) | | | (0.26 | ) | | | (0.37 | ) | | | (0.51 | ) | | | (0.47 | ) |
| | | | | | | | | | | | | | | | | | | | |
Net asset value, end of the period | | $ | 8.10 | | | $ | 8.93 | | | $ | 8.78 | | | $ | 9.12 | | | $ | 9.59 | |
| | | | | | | | | | | | | | | | | | | | |
Total return(b) | | | (5.04 | )%(c) | | | 4.69 | %(c) | | | 0.53 | %(c) | | | 0.36 | %(c) | | | 2.02 | % |
RATIOS TO AVERAGE NET ASSETS: | | | | | | | | | | | | | | | | | | | | |
Net assets, end of the period (000’s) | | $ | 62,570 | | | $ | 89,618 | | | $ | 125,909 | | | $ | 233,387 | | | $ | 337,088 | |
Net expenses | | | 1.80 | %(d) | | | 1.80 | %(d) | | | 1.82 | %(d)(e) | | | 1.81 | %(d)(f) | | | 1.80 | % |
Gross expenses | | | 1.99 | % | | | 1.99 | % | | | 1.95 | %(e) | | | 1.84 | %(f) | | | 1.80 | % |
Net investment income | | | 4.22 | % | | | 2.80 | % | | | 4.27 | % | | | 5.28 | % | | | 4.66 | % |
Portfolio turnover rate | | | 65 | % | | | 79 | % | | | 65 | % | | | 52 | % | | | 65 | % |
| (a) | Per share net investment income has been calculated using the average shares outstanding during the period. |
| (b) | A contingent deferred sales charge for Class C shares is not reflected in total return calculations. |
| (c) | Had certain expenses not been waived/reimbursed during the period, total returns would have been lower. |
| (d) | The investment adviser agreed to waive its fees and/or reimburse a portion of the Fund’s expenses during the period. Without this waiver/reimbursement, expenses would have been higher. |
| (e) | Includes interest expense. Without this expense the ratio of net expenses would have been 1.80% and the ratio of gross expenses would have been 1.93%. |
| (f) | Includes interest expense. Without this expense the ratio of net expenses would have been 1.80% and the ratio of gross expenses would have been 1.83%. |
See accompanying notes to financial statements.
| 32
Financial Highlights (continued)
For a share outstanding throughout each period.
| | | | | | | | | | | | | | | | | | | | |
| | | Loomis Sayles Senior Floating Rate and Fixed Income Fund—Class N | |
| | | Year Ended
November 30,
2022 | | | Year Ended
November 30,
2021 | | | Year Ended
November 30,
2020 | | | Year Ended
November 30,
2019 | | | Year Ended
November 30,
2018 | |
Net asset value, beginning of the period | | $ | 8.96 | | | $ | 8.81 | | | $ | 9.17 | | | $ | 9.63 | | | $ | 9.90 | |
| | | | | | | | | | | | | | | | | | | | |
INCOME (LOSS) FROM INVESTMENT OPERATIONS: | | | | | | | | | | | | | | | | | | | | |
Net investment income(a) | | | 0.46 | | | | 0.34 | | | | 0.46 | | | | 0.60 | | | | 0.57 | |
Net realized and unrealized gain (loss) | | | (0.81 | ) | | | 0.16 | | | | (0.36 | ) | | | (0.45 | ) | | | (0.27 | ) |
| | | | | | | | | | | | | | | | | | | | |
Total from Investment Operations | | | (0.35 | ) | | | 0.50 | | | | 0.10 | | | | 0.15 | | | | 0.30 | |
| | | | | | | | | | | | | | | | | | | | |
LESS DISTRIBUTIONS FROM: | | | | | | | | | | | | | | | | | | | | |
Net investment income | | | (0.48 | ) | | | (0.35 | ) | | | (0.46 | ) | | | (0.61 | ) | | | (0.57 | ) |
| | | | | | | | | | | | | | | | | | | | |
Net asset value, end of the period | | $ | 8.13 | | | $ | 8.96 | | | $ | 8.81 | | | $ | 9.17 | | | $ | 9.63 | |
| | | | | | | | | | | | | | | | | | | | |
Total return(b) | | | (4.00 | )% | | | 5.79 | % | | | 1.37 | % | | | 1.54 | % | | | 3.08 | % |
RATIOS TO AVERAGE NET ASSETS: | | | | | | | | | | | | | | | | | | | | |
Net assets, end of the period (000’s) | | $ | 2,278 | | | $ | 2,528 | | | $ | 151 | | | $ | 242 | | | $ | 191 | |
Net expenses(c) | | | 0.75 | % | | | 0.75 | % | | | 0.77 | %(d) | | | 0.76 | %(e) | | | 0.74 | % |
Gross expenses | | | 0.96 | % | | | 1.03 | % | | | 1.24 | %(d) | | | 1.11 | %(e) | | | 0.95 | % |
Net investment income | | | 5.36 | % | | | 3.83 | % | | | 5.31 | % | | | 6.33 | % | | | 5.77 | % |
Portfolio turnover rate | | | 65 | % | | | 79 | % | | | 65 | % | | | 52 | % | | | 65 | % |
| (a) | Per share net investment income has been calculated using the average shares outstanding during the period. |
| (b) | Had certain expenses not been waived/reimbursed during the period, total returns would have been lower. |
| (c) | The investment adviser agreed to waive its fees and/or reimburse a portion of the Fund’s expenses during the period. Without this waiver/reimbursement, expenses would have been higher. |
| (d) | Includes interest expense. Without this expense the ratio of net expenses would have been 0.75% and the ratio of gross expenses would have been 1.22%. |
| (e) | Includes interest expense. Without this expense the ratio of net expenses would have been 0.75% and the ratio of gross expenses would have been 1.09%. |
See accompanying notes to financial statements.
33 |
Financial Highlights (continued)
For a share outstanding throughout each period.
| | | | | | | | | | | | | | | | | | | | |
| | | Loomis Sayles Senior Floating Rate and Fixed Income Fund—Class Y | |
| | | Year Ended
November 30,
2022 | | | Year Ended
November 30,
2021 | | | Year Ended
November 30,
2020 | | | Year Ended
November 30,
2019 | | | Year Ended
November 30,
2018 | |
Net asset value, beginning of the period | | $ | 8.97 | | | $ | 8.82 | | | $ | 9.17 | | | $ | 9.63 | | | $ | 9.90 | |
| | | | | | | | | | | | | | | | | | | | |
INCOME (LOSS) FROM INVESTMENT OPERATIONS: | | | | | | | | | | | | | | | | | | | | |
Net investment income(a) | | | 0.44 | | | | 0.34 | | | | 0.46 | | | | 0.59 | | | | 0.56 | |
Net realized and unrealized gain (loss) | | | (0.79 | ) | | | 0.16 | | | | (0.35 | ) | | | (0.45 | ) | | | (0.26 | ) |
| | | | | | | | | | | | | | | | | | | | |
Total from Investment Operations | | | (0.35 | ) | | | 0.50 | | | | 0.11 | | | | 0.14 | | | | 0.30 | |
| | | | | | | | | | | | | | | | | | | | |
LESS DISTRIBUTIONS FROM: | | | | | | | | | | | | | | | | | | | | |
Net investment income | | | (0.48 | ) | | | (0.35 | ) | | | (0.46 | ) | | | (0.60 | ) | | | (0.57 | ) |
| | | | | | | | | | | | | | | | | | | | |
Net asset value, end of the period | | $ | 8.14 | | | $ | 8.97 | | | $ | 8.82 | | | $ | 9.17 | | | $ | 9.63 | |
| | | | | | | | | | | | | | | | | | | | |
Total return | | | (4.04 | )%(b) | | | 5.73 | %(b) | | | 1.45 | %(b) | | | 1.49 | %(b) | | | 3.03 | % |
RATIOS TO AVERAGE NET ASSETS: | | | | | | | | | | | | | | | | | | | | |
Net assets, end of the period (000’s) | | $ | 771,373 | | | $ | 1,227,587 | | | $ | 875,829 | | | $ | 1,929,869 | | | $ | 3,101,286 | |
Net expenses | | | 0.80 | %(c) | | | 0.80 | %(c) | | | 0.82 | %(c)(d) | | | 0.81 | %(c)(e) | | | 0.80 | % |
Gross expenses | | | 0.99 | % | | | 0.99 | % | | | 0.95 | %(d) | | | 0.84 | %(e) | | | 0.80 | % |
Net investment income | | | 5.11 | % | | | 3.80 | % | | | 5.28 | % | | | 6.28 | % | | | 5.70 | % |
Portfolio turnover rate | | | 65 | % | | | 79 | % | | | 65 | % | | | 52 | % | | | 65 | % |
| (a) | Per share net investment income has been calculated using the average shares outstanding during the period. |
| (b) | Had certain expenses not been waived/reimbursed during the period, total returns would have been lower. |
| (c) | The investment adviser agreed to waive its fees and/or reimburse a portion of the Fund’s expenses during the period. Without this waiver/reimbursement, expenses would have been higher. |
| (d) | Includes interest expense. Without this expense the ratio of net expenses would have been 0.80% and the ratio of gross expenses would have been 0.93%. |
| (e) | Includes interest expense. Without this expense the ratio of net expenses would have been 0.80% and the ratio of gross expenses would have been 0.83%. |
See accompanying notes to financial statements.
| 34
Financial Highlights (continued)
For a share outstanding throughout each period.
| | | | | | | | | | | | | | | | | | | | |
| | | Vaughan Nelson Select Fund—Class A | |
| | | Year Ended
November 30,
2022 | | | Year Ended
November 30,
2021 | | | Year Ended
November 30,
2020 | | | Year Ended
November 30,
2019 | | | Year Ended
November 30,
2018 | |
Net asset value, beginning of the period | | $ | 26.43 | | | $ | 20.00 | | | $ | 18.63 | | | $ | 18.13 | | | $ | 18.59 | |
| | | | | | | | | | | | | | | | | | | | |
INCOME (LOSS) FROM INVESTMENT OPERATIONS: | | | | | | | | | | | | | | | | | | | | |
Net investment income (loss)(a) | | | (0.00 | )(b) | | | 0.07 | (c) | | | 0.06 | | | | 0.14 | | | | 0.07 | |
Net realized and unrealized gain (loss) | | | (1.94 | ) | | | 7.70 | | | | 2.75 | | | | 1.90 | | | | 0.91 | |
| | | | | | | | | | | | | | | | | | | | |
Total from Investment Operations | | | (1.94 | ) | | | 7.77 | | | | 2.81 | | | | 2.04 | | | | 0.98 | |
| | | | | | | | | | | | | | | | | | | | |
LESS DISTRIBUTIONS FROM: | | | | | | | | | | | | | | | | | | | | |
Net investment income | | | — | | | | (0.08 | ) | | | (0.13 | ) | | | — | | | | (0.10 | ) |
Net realized capital gains | | | (7.25 | ) | | | (1.26 | ) | | | (1.31 | ) | | | (1.54 | ) | | | (1.34 | ) |
| | | | | | | | | | | | | | | | | | | | |
Total Distributions | | | (7.25 | ) | | | (1.34 | ) | | | (1.44 | ) | | | (1.54 | ) | | | (1.44 | ) |
| | | | | | | | | | | | | | | | | | | | |
Net asset value, end of the period | | $ | 17.24 | | | $ | 26.43 | | | $ | 20.00 | | | $ | 18.63 | | | $ | 18.13 | |
| | | | | | | | | | | | | | | | | | | | |
Total return(d)(e) | | | (10.50 | )% | | | 41.46 | %(c) | | | 16.21 | % | | | 13.67 | % | | | 5.62 | % |
RATIOS TO AVERAGE NET ASSETS: | | | | | | | | | | | | | | | | | | | | |
Net assets, end of the period (000’s) | | $ | 23,653 | | | $ | 20,382 | | | $ | 13,722 | | | $ | 15,434 | | | $ | 17,703 | |
Net expenses(f) | | | 1.09 | %(g) | | | 1.10 | %(h)(i) | | | 1.13 | % | | | 1.16 | %(j) | | | 1.22 | %(k) |
Gross expenses | | | 1.12 | % | | | 1.14 | % | | | 1.18 | % | | | 1.21 | % | | | 1.27 | % |
Net investment income (loss) | | | (0.02 | )% | | | 0.30 | %(c) | | | 0.37 | % | | | 0.84 | % | | | 0.41 | % |
Portfolio turnover rate | | | 74 | % | | | 93 | % | | | 88 | % | | | 51 | % | | | 54 | % |
| (a) | Per share net investment income (loss) has been calculated using the average shares outstanding during the period. |
| (b) | Amount rounds to less than $0.01 per share. |
| (c) | Includes a non-recurring dividend. Without this dividend, net investment loss per share would have been $(0.06), total return would have been 40.82% and the ratio of net investment loss to average net assets would have been (0.25)%. |
| (d) | A sales charge for Class A shares is not reflected in total return calculations. |
| (e) | Had certain expenses not been waived/reimbursed during the period, total returns would have been lower. |
| (f) | The investment adviser agreed to waive its fees and/or reimburse a portion of the Fund’s expenses during the period. Without this waiver/reimbursement, expenses would have been higher. |
| (g) | Includes additional voluntary waiver of advisory fee of 0.01%. |
| (h) | Includes additional voluntary waiver of advisory fee of 0.03%. |
| (i) | Effective July 1, 2021, the expense limit decreased from 1.15% to 1.10%. |
| (j) | Effective July 1, 2019, the expense limit decreased from 1.20% to 1.15%. |
| (k) | Effective July 1, 2018, the expense limit decreased from 1.25% to 1.20%. |
See accompanying notes to financial statements.
35 |
Financial Highlights (continued)
For a share outstanding throughout each period.
| | | | | | | | | | | | | | | | | | | | |
| | | Vaughan Nelson Select Fund—Class C | |
| | | Year Ended
November 30,
2022 | | | Year Ended
November 30,
2021 | | | Year Ended
November 30,
2020 | | | Year Ended
November 30,
2019 | | | Year Ended
November 30,
2018 | |
Net asset value, beginning of the period | | $ | 24.61 | | | $ | 18.76 | | | $ | 17.56 | | | $ | 17.31 | | | $ | 17.84 | |
| | | | | | | | | | | | | | | | | | | | |
INCOME (LOSS) FROM INVESTMENT OPERATIONS: | | | | | | | | | | | | | | | | | | | | |
Net investment income (loss)(a) | | | (0.12 | ) | | | (0.08 | )(b) | | | (0.07 | ) | | | 0.02 | | | | (0.06 | ) |
Net realized and unrealized gain (loss) | | | (1.75 | ) | | | 7.19 | | | | 2.58 | | | | 1.77 | | | | 0.87 | |
| | | | | | | | | | | | | | | | | | | | |
Total from Investment Operations | | | (1.87 | ) | | | 7.11 | | | | 2.51 | | | | 1.79 | | | | 0.81 | |
| | | | | | | | | | | | | | | | | | | | |
LESS DISTRIBUTIONS FROM: | | | | | | | | | | | | | | | | | | | | |
Net realized capital gains | | | (7.25 | ) | | | (1.26 | ) | | | (1.31 | ) | | | (1.54 | ) | | | (1.34 | ) |
| | | | | | | | | | | | | | | | | | | | |
Net asset value, end of the period | | $ | 15.49 | | | $ | 24.61 | | | $ | 18.76 | | | $ | 17.56 | | | $ | 17.31 | |
| | | | | | | | | | | | | | | | | | | | |
Total return(c)(d) | | | (11.16 | )% | | | 40.44 | %(b) | | | 15.31 | % | | | 12.86 | % | | | 4.77 | % |
RATIOS TO AVERAGE NET ASSETS: | | | | | | | | | | | | | | | | | | | | |
Net assets, end of the period (000’s) | | $ | 5,784 | | | $ | 5,357 | | | $ | 5,246 | | | $ | 6,313 | | | $ | 6,917 | |
Net expenses(e) | | | 1.84 | %(f) | | | 1.86 | %(g)(h) | | | 1.88 | % | | | 1.91 | %(i) | | | 1.96 | %(j) |
Gross expenses | | | 1.88 | % | | | 1.89 | % | | | 1.93 | % | | | 1.96 | % | | | 2.01 | % |
Net investment income (loss) | | | (0.76 | )% | | | (0.39 | )%(b) | | | (0.40 | )% | | | 0.09 | % | | | (0.32 | )% |
Portfolio turnover rate | | | 74 | % | | | 93 | % | | | 88 | % | | | 51 | % | | | 54 | % |
| (a) | Per share net investment income (loss) has been calculated using the average shares outstanding during the period. |
| (b) | Includes a non-recurring dividend. Without this dividend, net investment loss per share would have been $(0.21), total return would have been 39.76% and the ratio of net investment loss to average net assets would have been (1.00)%. |
| (c) | A contingent deferred sales charge for Class C shares is not reflected in total return calculations. |
| (d) | Had certain expenses not been waived/reimbursed during the period, total returns would have been lower. |
| (e) | The investment adviser agreed to waive its fees and/or reimburse a portion of the Fund’s expenses during the period. Without this waiver/reimbursement, expenses would have been higher. |
| (f) | Includes additional voluntary waiver of advisory fee of 0.01%. |
| (g) | Includes additional voluntary waiver of advisory fee of 0.03%. |
| (h) | Effective July 1, 2021, the expense limit decreased from 1.90% to 1.85%. |
| (i) | Effective July 1, 2019, the expense limit decreased from 1.95% to 1.90%. |
| (j) | Effective July 1, 2018, the expense limit decreased from 2.00% to 1.95%. |
See accompanying notes to financial statements.
| 36
Financial Highlights (continued)
For a share outstanding throughout each period.
| | | | | | | | | | | | | | | | | | | | |
| | | Vaughan Nelson Select Fund—Class N | |
| | | Year Ended
November 30,
2022 | | | Year Ended
November 30,
2021 | | | Year Ended
November 30,
2020 | | | Year Ended
November 30,
2019 | | | Year Ended
November 30,
2018 | |
Net asset value, beginning of the period | | $ | 26.63 | | | $ | 20.14 | | | $ | 18.76 | | | $ | 18.26 | | | $ | 18.73 | |
| | | | | | | | | | | | | | | | | | | | |
INCOME (LOSS) FROM INVESTMENT OPERATIONS: | | | | | | | | | | | | | | | | | | | | |
Net investment income(a) | | | 0.08 | | | | 0.13 | (b) | | | 0.11 | | | | 0.19 | | | | 0.13 | |
Net realized and unrealized gain (loss) | | | (2.00 | ) | | | 7.76 | | | | 2.77 | | | | 1.91 | | | | 0.89 | |
| | | | | | | | | | | | | | | | | | | | |
Total from Investment Operations | | | (1.92 | ) | | | 7.89 | | | | 2.88 | | | | 2.10 | | | | 1.02 | |
| | | | | | | | | | | | | | | | | | | | |
LESS DISTRIBUTIONS FROM: | | | | | | | | | | | | | | | | | | | | |
Net investment income | | | (0.03 | ) | | | (0.14 | ) | | | (0.19 | ) | | | (0.06 | ) | | | (0.15 | ) |
Net realized capital gains | | | (7.25 | ) | | | (1.26 | ) | | | (1.31 | ) | | | (1.54 | ) | | | (1.34 | ) |
| | | | | | | | | | | | | | | | | | | | |
Total Distributions | | | (7.28 | ) | | | (1.40 | ) | | | (1.50 | ) | | | (1.60 | ) | | | (1.49 | ) |
| | | | | | | | | | | | | | | | | | | | |
Net asset value, end of the period | | $ | 17.43 | | | $ | 26.63 | | | $ | 20.14 | | | $ | 18.76 | | | $ | 18.26 | |
| | | | | | | | | | | | | | | | | | | | |
Total return(c) | | | (10.29 | )% | | | 41.87 | %(b) | | | 16.50 | % | | | 13.93 | % | | | 5.90 | % |
RATIOS TO AVERAGE NET ASSETS: | | | | | | | | | | | | | | | | | | | | |
Net assets, end of the period (000’s) | | $ | 289 | | | $ | 2 | | | $ | 2 | | | $ | 1 | | | $ | 1 | |
Net expenses(d) | | | 0.80 | % | | | 0.83 | %(e) | | | 0.85 | % | | | 0.87 | %(f) | | | 0.93 | %(g) |
Gross expenses | | | 3.35 | % | | | 49.27 | % | | | 71.85 | % | | | 63.51 | % | | | 13.54 | % |
Net investment income | | | 0.51 | % | | | 0.56 | %(b) | | | 0.61 | % | | | 1.10 | % | | | 0.68 | % |
Portfolio turnover rate | | | 74 | % | | | 93 | % | | | 88 | % | | | 51 | % | | | 54 | % |
| (a) | Per share net investment income has been calculated using the average shares outstanding during the period. |
| (b) | Includes a non-recurring dividend. Without this dividend, net investment income per share would have been $0.01, total return would have been 41.24% and the ratio of net investment income to average net assets would have been 0.02%. |
| (c) | Had certain expenses not been waived/reimbursed during the period, total returns would have been lower. |
| (d) | The investment adviser agreed to waive its fees and/or reimburse a portion of the Fund’s expenses during the period. Without this waiver/reimbursement, expenses would have been higher. |
| (e) | Effective July 1, 2021, the expense limit decreased from 0.85% to 0.80%. |
| (f) | Effective July 1, 2019, the expense limit decreased from 0.90% to 0.85%. |
| (g) | Effective July 1, 2018, the expense limit decreased from 0.95% to 0.90%. |
See accompanying notes to financial statements.
37 |
Financial Highlights (continued)
For a share outstanding throughout each period.
| | | | | | | | | | | | | | | | | | | | |
| | | Vaughan Nelson Select Fund—Class Y | |
| | | Year Ended
November 30,
2022 | | | Year Ended
November 30,
2021 | | | Year Ended
November 30,
2020 | | | Year Ended
November 30,
2019 | | | Year Ended
November 30,
2018 | |
Net asset value, beginning of the period | | $ | 26.63 | | | $ | 20.14 | | | $ | 18.75 | | | $ | 18.25 | | | $ | 18.71 | |
| | | | | | | | | | | | | | | | | | | | |
INCOME (LOSS) FROM INVESTMENT OPERATIONS: | | | | | | | | | | | | | | | | | | | | |
Net investment income(a) | | | 0.05 | | | | 0.13 | (b) | | | 0.11 | | | | 0.19 | | | | 0.13 | |
Net realized and unrealized gain (loss) | | | (1.97 | ) | | | 7.75 | | | | 2.77 | | | | 1.90 | | | | 0.90 | |
| | | | | | | | | | | | | | | | | | | | |
Total from Investment Operations | | | (1.92 | ) | | | 7.88 | | | | 2.88 | | | | 2.09 | | | | 1.03 | |
| | | | | | | | | | | | | | | | | | | | |
LESS DISTRIBUTIONS FROM: | | | | | | | | | | | | | | | | | | | | |
Net investment income | | | (0.03 | ) | | | (0.13 | ) | | | (0.18 | ) | | | (0.05 | ) | | | (0.15 | ) |
Net realized capital gains | | | (7.25 | ) | | | (1.26 | ) | | | (1.31 | ) | | | (1.54 | ) | | | (1.34 | ) |
| | | | | | | | | | | | | | | | | | | | |
Total Distributions | | | (7.28 | ) | | | (1.39 | ) | | | (1.49 | ) | | | (1.59 | ) | | | (1.49 | ) |
| | | | | | | | | | | | | | | | | | | | |
Net asset value, end of the period | | $ | 17.43 | | | $ | 26.63 | | | $ | 20.14 | | | $ | 18.75 | | | $ | 18.25 | |
| | | | | | | | | | | | | | | | | | | | |
Total return(c) | | | (10.31 | )% | | | 41.81 | %(b) | | | 16.52 | % | | | 13.94 | % | | | 5.86 | % |
RATIOS TO AVERAGE NET ASSETS: | | | | | | | | | | | | | | | | | | | | |
Net assets, end of the period (000’s) | | $ | 392,076 | | | $ | 226,305 | | | $ | 205,557 | | | $ | 204,856 | | | $ | 175,017 | |
Net expenses(d) | | | 0.84 | %(e) | | | 0.85 | %(f)(g) | | | 0.88 | % | | | 0.91 | %(h) | | | 0.96 | %(i) |
Gross expenses | | | 0.88 | % | | | 0.89 | % | | | 0.93 | % | | | 0.96 | % | | | 1.01 | % |
Net investment income | | | 0.26 | % | | | 0.56 | %(b) | | | 0.61 | % | | | 1.09 | % | | | 0.68 | % |
Portfolio turnover rate | | | 74 | % | | | 93 | % | | | 88 | % | | | 51 | % | | | 54 | % |
| (a) | Per share net investment income has been calculated using the average shares outstanding during the period. |
| (b) | Includes a non-recurring dividend. Without this dividend, net investment loss per share would have been less than $(0.01), total return would have been 41.17% and the ratio of net investment loss to average net assets would have been less than (0.01)%. |
| (c) | Had certain expenses not been waived/reimbursed during the period, total returns would have been lower. |
| (d) | The investment adviser agreed to waive its fees and/or reimburse a portion of the Fund’s expenses during the period. Without this waiver/reimbursement, expenses would have been higher. |
| (e) | Includes additional voluntary waiver of advisory fee of 0.01%. |
| (f) | Includes additional voluntary waiver of advisory fee of 0.03%. |
| (g) | Effective July 1, 2021, the expense limit decreased from 0.90% to 0.85%. |
| (h) | Effective July 1, 2019, the expense limit decreased from 0.95% to 0.90%. |
| (i) | Effective July 1, 2018, the expense limit decreased from 1.00% to 0.95%. |
See accompanying notes to financial statements.
| 38
Notes to Financial Statements
November 30, 2022
1. Organization. Natixis Funds Trust II (the “Trust”) is organized as a Massachusetts business trust. The Trust is registered under the Investment Company Act of 1940, as amended (the “1940 Act”), as an open-end management investment company. The Declaration of Trust permits the Board of Trustees to authorize the issuance of an unlimited number of shares of the Trust in multiple series. The financial statements for certain funds of the Trust are presented in separate reports. The following funds (individually, a “Fund” and collectively, the “Funds”) are included in this report:
Loomis Sayles Global Growth Fund (the “Global Growth Fund”)
Loomis Sayles Senior Floating Rate and Fixed Income Fund (the “Senior Floating Rate and Fixed Income Fund”)
Vaughan Nelson Select Fund (the “Select Fund”)
Global Growth Fund and Senior Floating Rate and Fixed Income Fund are diversified investment companies. Select Fund is a non-diversified investment company.
Each Fund offers Class A, Class C, Class N and Class Y shares. Class A shares are sold with a maximum front-end sales charge of 5.75% for Global Growth Fund and Select Fund and 3.50% for Senior Floating Rate and Fixed Income Fund. Class C shares do not pay a front-end sales charge, pay higher Rule 12b-1 fees than Class A shares for eight years (at which point they automatically convert to Class A shares) (prior to May 1, 2021, Class C shares automatically converted to Class A shares after ten years) and may be subject to a contingent deferred sales charge (“CDSC”) of 1.00% if those shares are redeemed within one year of acquisition, except for reinvested distributions. Class N and Class Y shares do not pay a front-end sales charge, a CDSC or Rule 12b-1 fees. Class N shares are offered with an initial minimum investment of $1,000,000. Class Y shares are offered with an initial minimum investment of $100,000. Certain categories of investors are exempted from the minimum investment amounts for Class N and Class Y as outlined in the relevant Fund’s prospectus.
Most expenses can be directly attributed to a Fund. Expenses which cannot be directly attributed to a Fund are generally apportioned based on the relative net assets of each of the Funds in Natixis Funds Trust I, Natixis Funds Trust II, Natixis Funds Trust IV and Gateway Trust (“Natixis Funds Trusts”), Loomis Sayles Funds I and Loomis Sayles Funds II (“Loomis Sayles Funds Trusts”) and Natixis ETF Trust and Natixis ETF Trust II (“Natixis ETF Trusts”). Expenses of a Fund are borne pro rata by the holders of each class of shares, except that each class bears expenses unique to that class (such as the Rule 12b-1 fees applicable to Class A and Class C), and transfer agent fees are borne collectively for Class A, Class C and Class Y, and individually for Class N. In addition, each class votes as a class only with respect to its own Rule 12b-1 Plan. Shares of each class would receive their pro rata share of the net assets of a Fund if the Fund were liquidated. The Trustees approve separate distributions from net investment income on each class of shares.
2. Significant Accounting Policies. The following is a summary of significant accounting policies consistently followed by each Fund in the preparation of its financial statements. The Funds’ financial statements follow the accounting and reporting guidelines provided for investment companies and are prepared in accordance with accounting principles generally accepted in the United States of America which require the use of management estimates that affect the reported amounts and disclosures in the financial statements. Actual results could differ from those estimates. Management has evaluated the events and transactions subsequent to year-end through the date the financial statements were issued and has determined that there were no material events that would require disclosure in the Funds’ financial statements.
a. Valuation. Registered investment companies are required to value portfolio investments using an unadjusted, readily available market quotation. Each Fund obtains readily available market quotations from independent pricing services. Fund investments for which readily available market quotations are not available are priced at fair value pursuant to the Funds’ Valuation Procedures. The Board of Trustees has approved a valuation designee who is subject to the Board’s oversight.
Unadjusted readily available market quotations that are utilized for exchange traded equity securities (including shares of closed-end investment companies and exchange-traded funds) include the last sale price quoted on the exchange where the security is traded most extensively. Shares of open-end investment companies are valued at net asset value per share.
Exchange traded equity securities for which there is no reported sale during the day are fair valued at the closing bid quotation as reported by an independent pricing service. Unlisted equity securities (except unlisted preferred equity securities) are fair valued at the last sale price quoted in the market where they are traded most extensively or, if there is no reported sale during the day, the closing bid quotation as reported by an independent pricing service. If there is no last sale price or closing bid quotation available, unlisted equity securities will be fair valued using evaluated bids furnished by an independent pricing service, if available.
Debt securities and unlisted preferred equity securities are fair valued based on evaluated bids furnished to the Funds by an independent pricing service or bid prices obtained from broker-dealers. Senior loans and collateralized loan obligations are fair valued at bid prices supplied by an independent pricing service, if available. Broker-dealer bid prices may be used to fair value debt, unlisted equities, senior loans and collateralized loan obligations where an independent pricing service is unable to price an investment or where an independent pricing service does not provide a reliable price for the investment.
39 |
Notes to Financial Statements (continued)
November 30, 2022
The Funds may also fair value investments in other circumstances such as when extraordinary events occur after the close of a foreign market, but prior to the close of the New York Stock Exchange. This may include situations relating to a single issuer (such as a declaration of bankruptcy or a delisting of the issuer’s security from the primary market on which it has traded) as well as events affecting the securities markets in general (such as market disruptions or closings and significant fluctuations in U.S. and/or foreign markets). When fair valuing a Fund’s investments, the valuation designee may, among other things, use modeling tools or other processes that may take into account factors such as issuer specific information, or other related market activity and/or information that occurred after the close of the foreign market but before the time the Fund’s net asset value (“NAV”) is calculated. Fair valuation by the Fund(s) valuation designee may require subjective determinations about the value of the investment, and fair values used to determine a Fund’s NAV may differ from quoted or published prices, or from prices that are used by others, for the same investments. In addition, the use of fair value pricing may not always result in adjustments to the prices of investments held by a Fund.
b. Investment Transactions and Related Investment Income. Investment transactions are accounted for on a trade date plus one day basis for daily NAV calculation. However, for financial reporting purposes, investment transactions are reported on trade date. Dividend income (including income reinvested) and foreign withholding tax, if applicable, are recorded on the ex-dividend date, or in the case of certain foreign securities, as soon as a Fund is notified, and interest income is recorded on an accrual basis. Dividends reinvested and stock dividends are reflected as non-cash dividends on the Statements of Operations. Loan consent fees, upfront origination fees and/or amendment fees are recorded when received and included in interest income on the Statements of Operations. Interest income is increased by the accretion of discount and decreased by the amortization of premium, if applicable. For securities with paydown provisions, principal payments received are treated as a proportionate reduction to the cost basis of the securities, and excess or shortfall amounts are recorded as income. For payment-in-kind securities, income received in-kind is reflected as an increase to the principal and cost basis of the securities. In determining net gain or loss on securities sold, the cost of securities has been determined on an identified cost basis. Investment income, non-class specific expenses and realized and unrealized gains and losses are allocated on a pro rata basis to each class based on the relative net assets of each class to the total net assets of the Fund.
c. Foreign Currency Translation. The books and records of the Funds are maintained in U.S. dollars. The values of securities, currencies and other assets and liabilities denominated in currencies other than U.S. dollars, if any, are translated into U.S. dollars based upon foreign exchange rates prevailing at the end of the period. Purchases and sales of investment securities, income and expenses are translated into U.S. dollars on the respective dates of such transactions.
Net realized foreign exchange gains or losses arise from sales of foreign currency, changes in exchange rates between the trade and settlement dates on securities transactions and the difference between the amounts of dividends, interest and foreign withholding taxes recorded in the Funds’ books and records and the U.S. dollar equivalent of the amounts actually received or paid. Net unrealized foreign exchange gains or losses arise from changes in the value of assets and liabilities, other than investment securities, as of the end of the fiscal period, resulting from changes in exchange rates. Net realized foreign exchange gains or losses and the net change in unrealized foreign exchange gains or losses are disclosed in the Statements of Operations. For federal income tax purposes, net realized foreign exchange gains or losses are characterized as ordinary income, and may, if the Funds have net losses, reduce or eliminate the amount of income available to be distributed by the Funds.
The values of investment securities are presented at the foreign exchange rates prevailing at the end of the period for financial reporting purposes. Net realized and unrealized gains or losses on investments reported in the Statements of Operations reflect gains or losses resulting from changes in exchange rates and fluctuations which arise due to changes in market prices of investment securities. For federal income tax purposes, a portion of the net realized gain or loss on investments arising from changes in exchange rates, which is reflected in the Statements of Operations, may be characterized as ordinary income and may, if the Funds have net losses, reduce the amount of income available to be distributed by the Funds.
The Funds may use foreign currency exchange contracts to facilitate transactions in foreign-denominated investments. Losses may arise from changes in the value of the foreign currency or if the counterparties do not perform under the contracts’ terms.
d. Federal and Foreign Income Taxes. The Trust treats each Fund as a separate entity for federal income tax purposes. Each Fund intends to meet the requirements of the Internal Revenue Code of 1986, as amended, applicable to regulated investment companies, and to distribute to its shareholders substantially all of its net investment income and any net realized capital gains at least annually. Management has performed an analysis of each Fund’s tax positions for the open tax years as of November 30, 2022 and has concluded that no provisions for income tax are required. The Funds’ federal tax returns for the prior three fiscal years remain subject to examination by the Internal Revenue Service. Management is not aware of any events that are reasonably possible to occur in the next twelve months that would result in the amounts of any unrecognized tax benefits significantly increasing or decreasing for the Funds. However, management’s conclusions regarding tax positions taken may be subject to review and adjustment at a later date based on factors including, but not limited to, new tax laws and accounting regulations and interpretations thereof.
| 40
Notes to Financial Statements (continued)
November 30, 2022
A Fund may be subject to foreign withholding taxes on investment income and taxes on capital gains on investments that are accrued and paid based upon the Fund’s understanding of the tax rules and regulations that exist in the countries in which the Fund invests. Foreign withholding taxes on dividend and interest income are reflected on the Statements of Operations as a reduction of investment income, net of amounts that have been or are expected to be reclaimed and paid. Dividends and interest receivable on the Statements of Assets and Liabilities are net of foreign withholding taxes. Foreign withholding taxes where reclaims have been or are expected to be filed and paid are reflected on the Statements of Assets and Liabilities as tax reclaims receivable. Capital gains taxes paid are included in net realized gain (loss) on investments in the Statements of Operations. Accrued but unpaid capital gains taxes are reflected as foreign taxes payable on the Statements of Assets and Liabilities, if applicable, and reduce unrealized gains on investments. In the event that realized gains on investments are subsequently offset by realized losses, taxes paid on realized gains may be returned to a Fund. Such amounts, if applicable, are reflected as foreign tax rebates receivable on the Statements of Assets and Liabilities and are recorded as a realized gain when received.
e. Dividends and Distributions to Shareholders. Dividends and distributions are recorded on the ex-dividend date. The timing and characterization of certain income and capital gain distributions are determined in accordance with federal tax regulations, which may differ from accounting principles generally accepted in the United States of America. Permanent differences are primarily due to differing treatments for book and tax purposes of items such as foreign currency gains and losses, distributions in excess of income and/or capital gain, premium amortization, paydown gains and losses, defaulted and/or non-income producing securities, deferred Trustees’ fees, distribution re-designations and return of capital distributions received. Permanent book and tax basis differences relating to shareholder distributions, net investment income, and net realized gains will result in reclassifications to capital accounts reported on the Statements of Assets and Liabilities. Temporary differences between book and tax distributable earnings are primarily due to premium amortization, deferred Trustees’ fees, wash sales, passive foreign investment company adjustments, corporate actions, dividends payable and foreign currency gains and losses. Amounts of income and capital gain available to be distributed on a tax basis are determined annually, and at other times during the Funds’ fiscal year as may be necessary to avoid knowingly declaring and paying a return of capital distribution. Distributions from net investment income and net realized short-term capital gains are reported as distributed from ordinary income for tax purposes.
The tax characterization of distributions is determined on an annual basis. The tax character of distributions paid to shareholders during the years ended November 30, 2022 and 2021 was as follows:
| | | | | | | | | | | | | | | | | | | | | | | | |
| | | 2022 Distributions | | | 2021 Distributions | |
Fund | | Ordinary
Income | | | Long-Term
Capital
Gains | | | Total | | | Ordinary
Income | | | Long-Term
Capital
Gains | | | Total | |
Global Growth Fund | | $ | 19,003 | | | $ | 8,809,601 | | | $ | 8,828,604 | | | $ | 140,189 | | | $ | 6,199,326 | | | $ | 6,339,515 | |
Senior Floating Rate and Fixed Income Fund | | | 74,083,958 | | | | — | | | | 74,083,958 | | | | 52,168,667 | | | | — | | | | 52,168,667 | |
Select Fund | | | 38,159,873 | | | | 36,479,566 | | | | 74,639,439 | | | | 2,374,783 | | | | 10,325,809 | | | | 12,700,592 | |
Distributions paid to shareholders from net investment income and net realized capital gains, based on accounting principles generally accepted in the United States of America, are consolidated and reported on the Statements of Changes in Net Assets as Distributions to Shareholders. Distributions paid to shareholders from net investment income and net realized capital gains expressed in per-share amounts, based on accounting principles generally accepted in the United States of America, are separately stated and reported within the Financial Highlights.
41 |
Notes to Financial Statements (continued)
November 30, 2022
As of November 30, 2022, the components of distributable earnings on a tax basis were as follows:
| | | | | | | | | | | | |
| | | Global Growth
Fund | | | Senior
Floating Rate
and Fixed
Income Fund | | | Select Fund | |
Undistributed ordinary income | | $ | 10,433 | | | $ | 181,843 | | | $ | 645,183 | |
Undistributed long-term capital gains | | | 6,039,749 | | | | — | | | | 3,569,669 | |
| | | | | | | | | | | | |
Total undistributed earnings | | | 6,050,182 | | | | 181,843 | | | | 4,214,852 | |
| | | | | | | | | | | | |
Capital loss carryforward: | | | | | | | | | | | | |
Short-term: | | | | | | | | | | | | |
No expiration date | | | — | | | | (133,659,715 | ) | | | — | |
Long-term: | | | | | | | | | | | | |
No expiration date | | | — | | | | (439,906,554 | ) | | | — | |
| | | | | | | | | | | | |
Total capital loss carryforward | | | — | | | | (573,566,269 | ) | | | — | |
| | | | | | | | | | | | |
Unrealized appreciation (depreciation) | | | (12,999,230 | ) | | | (107,087,413 | ) | | | 10,702,017 | |
| | | | | | | | | | | | |
Total accumulated earnings (losses) | | $ | (6,949,048 | ) | | $ | (680,471,839 | ) | | $ | 14,916,869 | |
| | | | | | | | | | | | |
As of November 30, 2022, the tax cost of investments (including derivatives, if applicable) and unrealized appreciation (depreciation) on a federal tax basis were as follows:
| | | | | | | | | | | | |
| | | Global Growth
Fund | | | Senior
Floating Rate
and Fixed
Income Fund | | | Select Fund | |
Federal tax cost | | $ | 108,140,929 | | | $ | 1,128,546,302 | | | $ | 409,018,485 | |
| | | | | | | | | | | | |
Gross tax appreciation | | $ | 5,292,385 | | | $ | 1,481,544 | | | $ | 25,195,497 | |
Gross tax depreciation | | | (18,288,460 | ) | | | (108,568,957 | ) | | | (14,493,480 | ) |
| | | | | | | | | | | | |
Net tax appreciation (depreciation) | | $ | (12,996,075 | ) | | $ | (107,087,413 | ) | | $ | 10,702,017 | |
| | | | | | | | | | | | |
The difference between these amounts and those reported in the components of distributable earnings, if any, is primarily attributable to foreign currency mark-to-market.
f. Senior Loans. Senior Floating Rate and Fixed Income Fund may invest in senior loans to corporate, governmental or other borrowers. Senior loans, which include both secured and unsecured loans made by banks and other financial institutions to corporate customers, typically hold the most senior position in a borrower’s capital structure, may be secured by the borrower’s assets and have interest rates that reset frequently. Senior loans can include term loans, revolving credit facility loans and second lien loans. A senior loan is often administered by a bank or other financial institution that acts as agent for all holders. The agent administers the terms of the senior loan, as specified in the loan agreement. Large loans may be shared or syndicated among several lenders. The Fund may enter into the primary syndicate for a loan or it may also purchase all or a portion of loans from other lenders (sometimes referred to as loan assignments), in either case becoming a direct lender. The settlement period for senior loans is uncertain as there is no standardized settlement schedule applicable to such investments. Senior loans outstanding at the end of the period are listed in the Fund’s Portfolio of Investments.
g. Repurchase Agreements. Each Fund may enter into repurchase agreements, under the terms of a Master Repurchase Agreement, under which each Fund acquires securities as collateral and agrees to resell the securities at an agreed upon time and at an agreed upon price. It is each Fund’s policy that the market value of the collateral for repurchase agreements be at least equal to 102% of the repurchase price, including interest. Certain repurchase agreements are tri-party arrangements whereby the collateral is held in a segregated account for the benefit of the Fund and on behalf of the counterparty. Repurchase agreements could involve certain risks in the event of default or insolvency of the counterparty, including possible delays or restrictions upon a Fund’s ability to dispose of the underlying securities. As of November 30, 2022, each Fund, as applicable, had investments in repurchase agreements for which the value of the related collateral exceeded the value of the repurchase agreement. The gross value of repurchase agreements is included in the Statements of Assets and Liabilities for financial reporting purposes.
h. Unfunded Loan Commitments. Senior Floating Rate and Fixed Income Fund may enter into unfunded loan commitments, which are contractual obligations for future funding at the option of the borrower. Unfunded loan commitments represent a future obligation, in full, even though a percentage of the committed amount may not be utilized by the borrower. Unfunded loan commitments, and the
| 42
Notes to Financial Statements (continued)
November 30, 2022
obligation for future funding, are recorded as a liability on the Statements of Assets and Liabilities at par value at the time the commitment is entered into. Purchases of unfunded loan commitments may have a similar effect on the Fund’s NAV as if the Fund had created a degree of leverage in the portfolio. Market risk exists with these commitments to the same extent as if the securities were owned on a settled basis. Losses may arise due to changes in the value of the unfunded loan commitments.
As of November 30, 2022, the Fund had unfunded loan commitments reflected on the Statement of Assets and Liabilities, which could be extended at the option of the borrower, pursuant to loan agreements with the following borrowers:
| | | | | | | | |
Borrower | | Type | | | Principal Amount | |
Dermatology Intermediate Holdings III, Inc. | | | 2022 Delayed Draw Term Loan | | | $ | 204,976 | |
Refficiency Holdings LLC | | | 2021 Delayed Draw Term Loan | | | | 2,431 | |
VT Topco, Inc. | | | 2021 Delayed Draw Term Loan | | | | 90,399 | |
| | | | | | | | |
| | | | | | $ | 297,806 | |
| | | | | |
Under the terms of the contract, the Fund has the option to assign (sell) all or a portion of the unfunded loan commitment. Upon the completion of such assignment, the Fund is released from its rights and obligations pertaining to the portion of the unfunded loan commitment assigned. When the Fund sells a portion of an unfunded loan commitment, the portion sold is removed from the Portfolio of Investments and the unsettled amount is reflected as unfunded loan commitments sold on the Statement of Assets and Liabilities until settlement date. Once settled, the portion of the unfunded loan commitment assigned is relieved from the Fund’s unfunded loan commitments liability.
As of November 30, 2022, unsettled sales of $350,879 of the unfunded loan commitment is reflected on the Statements of Assets and Liabilities, net of realized loss on the transaction.
i. Indemnifications. Under the Trust’s organizational documents, its officers and Trustees are indemnified against certain liabilities arising out of the performance of their duties to the Funds. Additionally, in the normal course of business, the Funds enter into contracts with service providers that contain general indemnification clauses. The Funds’ maximum exposure under these arrangements is unknown as this would involve future claims that may be made against the Funds that have not yet occurred. However, based on experience, the Funds expect the risk of loss to be remote.
j. New Accounting Pronouncement. In June 2022, the Financial Accounting Standards Board issued Accounting Standards Update 2022-03, “Fair Value Measurement of Equity Securities Subject to Contractual Sale Restrictions” (“ASU 2022-03”). ASU 2022-03 clarifies the guidance in ASC 820 related to the measurement of fair value of an equity security subject to contractual sale restrictions, eliminating the ability to apply a discount to the fair value of such securities, and introducing related disclosure requirements. The guidance is effective for fiscal years, and interim periods within those fiscal years, beginning after December 15, 2023, and allows for early adoption. Management is currently evaluating the impact of applying this update.
In January 2021, the Financial Accounting Standards Board issued Accounting Standard Update 2021-01, Reference Rate Reform (Topic 848) (“ASU 2021-01”). ASU 2021-01 is an update of ASU 2020-04, which was issued in response to concerns about structural risks of interbank offered rates, and particularly the risk of cessation of the London Interbank Offered Rate (“LIBOR”), expected to occur no later than June 30, 2023. Regulators have undertaken reference rate reform initiatives to identify alternative reference rates that are more observable or transaction based and less susceptible to manipulation. ASU 2020-04 provides temporary guidance to ease the potential burden in accounting for (or recognizing the effects of) reference rate reform on financial reporting. ASU 2020-04 is elective and applies to all entities, subject to meeting certain criteria, that have contracts that reference LIBOR or another reference rate expected to be discontinued because of reference rate reform. ASU 2020-04 amendments offer optional expedients for contract modifications that would allow an entity to account for such modifications by prospectively adjusting the effective interest rate, instead of evaluating each contract, in accordance with existing accounting standards, as to whether reference rate modifications constitute the establishment of new contracts or the continuation of existing contracts. ASU 2021-01 clarifies that certain provisions in Topic 848, if elected by an entity, apply to derivative instruments that use an interest rate for margining, discounting, or contract price alignment that is modified as a result of reference rate reform. The amendments are currently effective and an entity may elect to apply its provisions as of any date from the beginning of an interim period that includes or is subsequent to March 12, 2020. Management expects to apply the optional expedients when appropriate.
3. Fair Value Measurements. In accordance with accounting standards related to fair value measurements and disclosures, the Funds have categorized the inputs utilized in determining the value of each Fund’s assets or liabilities. These inputs are summarized in the three broad levels listed below:
| | • | | Level 1 – quoted prices in active markets for identical assets or liabilities; |
43 |
Notes to Financial Statements (continued)
November 30, 2022
| | • | | Level 2 – prices determined using other significant inputs that are observable either directly, or indirectly through corroboration with observable market data (which could include quoted prices for similar assets or liabilities, interest rates, credit risk, etc.); and |
| | • | | Level 3 – prices determined using significant unobservable inputs when quoted prices or observable inputs are unavailable such as when there is little or no market activity for an asset or liability (unobservable inputs reflect each Fund’s own assumptions in determining the fair value of assets or liabilities and would be based on the best information available). |
The inputs or methodology used for valuing securities are not necessarily an indication of the risk associated with investing in those securities.
The Funds’ pricing policies have been approved by the Board of Trustees. Investments for which market quotations are readily available are categorized in Level 1. Other investments for which an independent pricing service is utilized are categorized in Level 2. Broker-dealer bid prices for which the Funds have knowledge of the inputs used by the broker-dealer are categorized in Level 2. All other investments, including broker-dealer bid prices for which the Funds do not have knowledge of the inputs used by the broker-dealer, as well as investments fair valued by the valuation designee, are categorized in Level 3. All Level 2 and 3 securities are defined as being fair valued.
Under certain conditions and based upon specific facts and circumstances, the Fund’s valuation designee may determine that a fair valuation should be made for portfolio investment(s). These valuation designee fair valuations will be based upon a significant amount of Level 3 inputs.
The following is a summary of the inputs used to value the Funds’ investments as of November 30, 2022, at value:
Global Growth Fund
Asset Valuation Inputs
| | | | | | | | | | | | | | | | |
Description | | Level 1 | | | Level 2 | | | Level 3 | | | Total | |
Common Stocks | | | | | | | | | | | | | | | | |
China | | $ | 8,762,932 | | | $ | 3,263,073 | | | $ | — | | | $ | 12,026,005 | |
Denmark | | | — | | | | 2,128,558 | | | | — | | | | 2,128,558 | |
France | | | — | | | | 904,868 | | | | — | | | | 904,868 | |
Japan | | | — | | | | 2,375,703 | | | | — | | | | 2,375,703 | |
Netherlands | | | — | | | | 3,497,208 | | | | — | | | | 3,497,208 | |
Switzerland | | | 1,972,604 | | | | 4,897,481 | | | | — | | | | 6,870,085 | |
United Kingdom | | | — | | | | 3,978,580 | | | | — | | | | 3,978,580 | |
United States | | | 49,115,994 | | | | 3,646,966 | | | | — | | | | 52,762,960 | |
All Other Common Stocks(a) | | | 10,019,830 | | | | — | | | | — | | | | 10,019,830 | |
| | | | | | | | | | | | | | | | |
Total Common Stocks | | | 69,871,360 | | | | 24,692,437 | | | | — | | | | 94,563,797 | |
| | | | | | | | | | | | | | | | |
Short-Term Investments | | | — | | | | 581,057 | | | | — | | | | 581,057 | |
| | | | | | | | | | | | | | | | |
Total | | $ | 69,871,360 | | | $ | 25,273,494 | | | $ | — | | | $ | 95,144,854 | |
| | | | | | | | | | | | | | | | |
| (a) | Details of the major categories of the Fund’s investments are reflected within the Portfolio of Investments. |
Senior Floating Rate and Fixed Income Fund
Asset Valuation Inputs
| | | | | | | | | | | | | | | | |
Description | | Level 1 | | | Level 2 | | | Level 3 | | | Total | |
Senior Loans(a) | | $ | — | | | $ | 832,595,505 | | | $ | — | | | $ | 832,595,505 | |
Bonds and Notes(a) | | | — | | | | 106,636,334 | | | | — | | | | 106,636,334 | |
Common Stocks | | | | | | | | | | | | | | | | |
Oil, Gas & Consumable Fuels | | | — | | | | — | | | | 5,691 | | | | 5,691 | |
Pharmaceuticals | | | — | | | | 1,108,560 | | | | — | | | | 1,108,560 | |
| | | | | | | | | | | | | | | | |
Total Common Stocks | | | — | | | | 1,108,560 | | | | 5,691 | | | | 1,114,251 | |
| | | | | | | | | | | | | | | | |
Short-Term Investments | | | — | | | | 81,112,799 | | | | — | | | | 81,112,799 | |
| | | | | | | | | | | | | | | | |
Total | | $ | — | | | $ | 1,021,453,198 | | | $ | 5,691 | | | $ | 1,021,458,889 | |
| | | | | | | | | | | | | | | | |
| (a) | Details of the major categories of the Fund’s investments are reflected within the Portfolio of Investments. |
| 44
Notes to Financial Statements (continued)
November 30, 2022
Select Fund
Asset Valuation Inputs
| | | | | | | | | | | | | | | | |
Description | | Level 1 | | | Level 2 | | | Level 3 | | | Total | |
Common Stocks(a) | | $ | 415,139,871 | | | $ | — | | | $ | — | | | $ | 415,139,871 | |
Short-Term Investments | | | — | | | | 4,580,631 | | | | — | | | | 4,580,631 | |
| | | | | | | | | | | | | | | | |
Total | | $ | 415,139,871 | | | $ | 4,580,631 | | | $ | — | | | $ | 419,720,502 | |
| | | | | | | | | | | | | | | | |
| (a) | Details of the major categories of the Fund’s investments are reflected within the Portfolio of Investments. |
The following is a reconciliation of Level 3 investments for which significant unobservable inputs were used to determine fair value as of November 30, 2021 and/or November 30, 2022:
Senior Floating Rate and Fixed Income Fund
Asset Valuation Inputs
| | | | | | | | | | | | | | | | | | | | | | | | | | | | | | | | | | | | | | | | |
Investments in Securities | | Balance as of
November 30,
2021 | | | Accrued
Discounts
(Premiums) | | | Realized
Gain (Loss) | | | Change in
Unrealized
Appreciation
(Depreciation) | | | Purchases | | | Sales | | | Transfers
into
Level 3 | | | Transfers
out of
Level 3 | | | Balance as of
November 30,
2022 | | | Change in
Unrealized
Appreciation
(Depreciation)
from
Investments
Still Held at
November 30,
2022 | |
Common Stocks | | | | | | | | | | | | | | | | | | | | | | | | | | | | | | | | | | | | | | | | |
Oil, Gas & Consumable Fuels | | $ | 8,814 | | | $ | — | | | $ | — | | | $ | (3,123 | ) | | $ | — | | | $ | — | | | $ | — | | | $ | — | | | $ | 5,691 | | | $ | (3,123 | ) |
| | | | | | | | | | | | | | | | | | | | | | | | | | | | | | | | | | | | | | | | |
4. Purchases and Sales of Securities. For the year ended November 30, 2022, purchases and sales of securities (excluding short-term investments and including paydowns) were as follows:
| | | | | | | | | | | | | | | | |
| | | U.S. Government/Agency
Securities | | | Other Securities | |
Fund | | Purchases | | | Sales | | | Purchases | | | Sales | |
Global Growth Fund | | $ | — | | | $ | — | | | $ | 48,498,443 | | | $ | 49,793,457 | |
Senior Floating Rate and Fixed Income Fund | | | 34,724,939 | | | | — | | | | 819,258,166 | | | | 1,259,085,770 | |
Select Fund | | | — | | | | — | | | | 412,488,881 | | | | 215,778,649 | |
5. Management Fees and Other Transactions with Affiliates.
a. Management Fees. Loomis, Sayles & Company, L.P. (“Loomis Sayles”) serves as investment adviser to Global Growth Fund and Senior Floating Rate and Fixed Income Fund. Loomis Sayles is a limited partnership whose sole general partner, Loomis, Sayles & Company, Inc., is indirectly owned by Natixis Investment Managers, LLC (“Natixis”), which is part of Natixis Investment Managers, an international asset management group based in Paris, France.
Under the terms of the management agreements, each Fund pays a management fee at the following annual rates, calculated daily and payable monthly, based on each Fund’s average daily net assets:
| | | | |
Fund | | Percentage of Average Daily Net Assets | |
Global Growth Fund | | | 0.75 | % |
Senior Floating Rate and Fixed Income Fund | | | 0.60 | % |
Natixis Advisors, LLC (“Natixis Advisors”) serves as investment adviser to Select Fund. Natixis Advisors is a wholly-owned subsidiary of Natixis. Under the terms of the management agreement, the Fund pays a management fee at the annual rate of 0.70%, calculated daily and payable monthly, based on the Fund’s average daily net assets.
Natixis Advisors has entered into a subadvisory agreement with Vaughan Nelson Investment Management, L.P. (“Vaughan Nelson”). Under the terms of the subadvisory agreement, the Fund pays a subadvisory fee at the annual rate of 0.47%, calculated daily and payable monthly, based on the Fund’s average daily net assets. Payments to Natixis Advisors are reduced by the amount of payments to Vaughan Nelson.
45 |
Notes to Financial Statements (continued)
November 30, 2022
Loomis Sayles and Natixis Advisors have given binding undertakings to the Funds to waive management fees and/or reimburse certain expenses to limit the Funds’ operating expenses, exclusive of acquired fund fees and expenses, brokerage expenses, interest expense, taxes, organizational and extraordinary expenses such as litigation and indemnification expenses. These undertakings are in effect until March 31, 2023, may be terminated before then only with the consent of the Funds’ Board of Trustees, and are reevaluated on an annual basis. Management fees payable, as reflected on the Statements of Assets and Liabilities, is net of waivers and/or expense reimbursements, if any, pursuant to these undertakings. Waivers/reimbursements that exceed management fees payable are reflected on the Statements of Assets and Liabilities as receivable from investment adviser.
For the year ended November 30, 2022, the expense limits as a percentage of average daily net assets under the expense limitation agreements were as follows:
| | | | | | | | | | | | | | | | |
| | | Expense Limit as a Percentage of
Average Daily Net Assets | |
Fund | | Class A | | | Class C | | | Class N | | | Class Y | |
Global Growth Fund | | | 1.20 | % | | | 1.95 | % | | | 0.90 | % | | | 0.95 | % |
Senior Floating Rate and Fixed Income Fund | | | 1.05 | % | | | 1.80 | % | | | 0.75 | % | | | 0.80 | % |
Select Fund | | | 1.10 | % | | | 1.85 | % | | | 0.80 | % | | | 0.85 | % |
Loomis Sayles and Natixis Advisors shall be permitted to recover expenses borne under the expense limitation agreements (whether through waiver of management fees or otherwise) on a class by class basis in later periods to the extent the annual operating expenses of a class fall below both (1) a class’ expense limitation ratio in place at the time such amounts were waived/reimbursed and (2) a class’ current applicable expense limitation ratio, provided, however, that a class is not obligated to pay such waived/reimbursed fees or expenses more than one year after the end of the fiscal year in which the fees or expenses were waived/reimbursed.
For the year ended November 30, 2022, the management fees and waivers of management fees for each Fund were as follows:
| | | | | | | | | | | | | | | | | | | | | | | | |
Fund | | Gross
Management
Fees | | | Contractual
Waivers of
Management
Fees1 | | | Voluntary
Waivers of
Management
Fees2 | | | Net
Management
Fees | | | Percentage of
Average Daily
Net Assets | |
| | Gross | | | Net | |
Global Growth Fund | | $ | 845,480 | | | $ | 166,802 | | | $ | — | | | $ | 678,678 | | | | 0.75 | % | | | 0.60 | % |
Senior Floating Rate and Fixed Income Fund | | | 8,446,989 | | | | 2,685,753 | | | | — | | | | 5,761,236 | | | | 0.60 | % | | | 0.41 | % |
Select Fund | | | 2,090,197 | | | | 76,421 | | | | 21,252 | | | | 1,992,524 | | | | 0.70 | % | | | 0.67 | % |
| 1 | Contractual management fee waivers are subject to possible recovery until November 30, 2023. |
| 2 | In order to ensure that the total annual fund operating expenses after fee waiver and/or expense reimbursement do not exceed limitations, Natixis Advisors may voluntarily waive additional management fees for Select Fund. Voluntary management fee waivers are not subject to recovery under the expense limitation agreement described above. |
No expenses were recovered for any of the Funds during the year ended November 30, 2022 under the terms of the expense limitation agreements.
b. Service and Distribution Fees. Natixis Distribution, LLC (“Natixis Distribution”), which is a wholly-owned subsidiary of Natixis Investment Managers, LLC, has entered into a distribution agreement with the Trust. Pursuant to this agreement, Natixis Distribution serves as principal underwriter of the Funds of the Trust.
Pursuant to Rule 12b-1 under the 1940 Act, the Trust has adopted a Service Plan relating to each Fund’s Class A shares (the “Class A Plans”) and a Distribution and Service Plan relating to each Fund’s Class C shares (the “Class C Plans”).
Under the Class A Plans, each Fund pays Natixis Distribution a monthly service fee at an annual rate not to exceed 0.25% of the average daily net assets attributable to the Fund’s Class A shares, as reimbursement for expenses incurred by Natixis Distribution in providing personal services to investors in Class A shares and/or the maintenance of shareholder accounts.
Under the Class C Plans, each Fund pays Natixis Distribution a monthly service fee at an annual rate not to exceed 0.25% of the average daily net assets attributable to the Fund’s Class C shares, as compensation for services provided by Natixis Distribution in providing personal services to investors in Class C shares and/or the maintenance of shareholder accounts.
Also under the Class C Plans, each Fund pays Natixis Distribution a monthly distribution fee at the annual rate of 0.75% of the average daily net assets attributable to the Fund’s Class C shares, as compensation for services provided by Natixis Distribution in connection with the marketing or sale of Class C shares.
| 46
Notes to Financial Statements (continued)
November 30, 2022
For the year ended November 30, 2022, the service and distribution fees for each Fund were as follows:
| | | | | | | | | | | | |
| | | Service Fees | | | Distribution Fees | |
Fund | | Class A | | | Class C | | | Class C | |
Global Growth Fund | | $ | 10,817 | | | $ | 2,467 | | | $ | 7,400 | |
Senior Floating Rate and Fixed Income Fund | | | 527,026 | | | | 193,470 | | | | 580,410 | |
Select Fund | | | 58,791 | | | | 13,132 | | | | 39,394 | |
c. Administrative Fees. Natixis Advisors provides certain administrative services for the Funds and contracts with State Street Bank and Trust Company (“State Street Bank”) to serve as sub-administrator. Pursuant to an agreement among Natixis Funds Trusts, Loomis Sayles Funds Trusts, Natixis ETF Trusts and Natixis Advisors, each Fund pays Natixis Advisors monthly its pro rata portion of fees equal to an annual rate of 0.0540% of the first $15 billion of the average daily net assets of the Natixis Funds Trusts, Loomis Sayles Funds Trusts and Natixis ETF Trusts, 0.0500% of the next $15 billion, 0.0400% of the next $30 billion, 0.0275% of the next $30 billion and 0.0225% of such assets in excess of $90 billion, subject to an annual aggregate minimum fee for the Natixis Funds Trusts, Loomis Sayles Funds Trusts and Natixis ETF Trusts of $10 million, which is reevaluated on an annual basis.
For the year ended November 30, 2022, the administrative fees for each Fund were as follows:
| | | | |
Fund | | Administrative
Fees | |
Global Growth Fund | | $ | 50,488 | |
Senior Floating Rate and Fixed Income Fund | | | 629,723 | |
Select Fund | | | 134,144 | |
d. Sub-Transfer Agent Fees. Natixis Distribution has entered into agreements, which include servicing agreements, with financial intermediaries that provide recordkeeping, processing, shareholder communications and other services to customers of the intermediaries that hold positions in the Funds and has agreed to compensate the intermediaries for providing those services. Intermediaries transact with the Funds primarily through the use of omnibus accounts on behalf of their customers who hold positions in the Funds. These services would have been provided by the Funds’ transfer agent and other service providers if the shareholders’ accounts were maintained directly at the Funds’ transfer agent. Accordingly, the Funds have agreed to reimburse Natixis Distribution for all or a portion of the servicing fees paid to these intermediaries. The reimbursement amounts (sub-transfer agent fees) paid to Natixis Distribution are subject to a current per-account equivalent fee limit approved by the Funds’ Board of Trustees, which is based on fees for similar services paid to the Funds’ transfer agent and other service providers. Class N shares do not bear such expenses.
For the year ended November 30, 2022, the sub-transfer agent fees (which are reflected in transfer agent fees and expenses in the Statements of Operations) for each Fund were as follows:
| | | | |
Fund | | Sub-Transfer
Agent Fees | |
Global Growth Fund | | $ | 87,807 | |
Senior Floating Rate and Fixed Income Fund | | | 908,406 | |
Select Fund | | | 111,962 | |
As of November 30, 2022, the Funds owe Natixis Distribution the following reimbursements for sub-transfer agent fees (which are reflected in the Statements of Assets and Liabilities as payable to distributor):
| | | | |
Fund | | Reimbursements
of Sub-Transfer
Agent Fees | |
Global Growth Fund | | $ | 539 | |
Senior Floating Rate and Fixed Income Fund | | | 26,854 | |
Select Fund | | | 3,055 | |
Sub-transfer agent fees attributable to Class A, Class C and Class Y are allocated on a pro rata basis to each class based on the relative net assets of each class to the total net assets of those classes.
47 |
Notes to Financial Statements (continued)
November 30, 2022
e. Commissions. Commissions (including CDSCs) on Fund shares retained by Natixis Distribution during the year ended November 30, 2022 were as follows:
| | | | |
Fund | | Commissions | |
Global Growth Fund | | $ | 57 | |
Senior Floating Rate and Fixed Income Fund | | | 17,544 | |
Select Fund | | | 10,771 | |
f. Trustees Fees and Expenses. The Trust does not pay any compensation directly to its officers or Trustees who are directors, officers or employees of Natixis Advisors, Natixis Distribution, Natixis Investment Managers, LLC or their affiliates. The Chairperson of the Board of Trustees receives a retainer fee at the annual rate of $369,000. The Chairperson does not receive any meeting attendance fees for Board of Trustees meetings or committee meetings that he attends. Each Independent Trustee (other than the Chairperson) receives, in the aggregate, a retainer fee at the annual rate of $210,000. Each Independent Trustee also receives a meeting attendance fee of $10,000 for each meeting of the Board of Trustees that he or she attends in person and $5,000 for each meeting of the Board of Trustees that he or she attends telephonically. In addition, the chairperson of the Contract Review Committee, the chairperson of the Audit Committee and the chairperson of the Governance Committee each receive an additional retainer fee at the annual rate of $20,000. Each Contract Review Committee member is compensated $6,000 for each Committee meeting that he or she attends in person and $3,000 for each meeting that he or she attends telephonically. Each Audit Committee member is compensated $6,000 for each Committee meeting that he or she attends in person and $3,000 for each meeting that he or she attends telephonically. These fees are allocated among the funds in the Natixis Funds Trusts, Loomis Sayles Funds Trusts and Natixis ETF Trusts based on a formula that takes into account, among other factors, the relative net assets of each fund. Trustees are reimbursed for travel expenses in connection with attendance at meetings.
Prior to January 1, 2022, each Independent Trustee (other than the Chairperson) received, in the aggregate, a retainer fee at the annual rate of $199,000. All other Trustees fees remained unchanged.
Effective January 1, 2023, each Governance Committee member is compensated $2,500 for each Committee meeting that he or she attends either in person or telephonically.
A deferred compensation plan (the “Plan”) is available to the Trustees on a voluntary basis. The value of a participating Trustee’s deferral account is based on theoretical investments of deferred amounts, on the normal payment dates, in certain funds of the Natixis Funds Trusts, Loomis Sayles Funds Trusts and Natixis ETF Trusts as designated by the participating Trustees. Changes in the value of participants’ deferral accounts are allocated pro rata among the funds in the Natixis Funds Trusts, Loomis Sayles Funds Trusts and Natixis ETF Trusts and are normally reflected as Trustees’ fees and expenses in the Statements of Operations. Deferred amounts remain in the funds until distributed in accordance with the provisions of the Plan. The portions of the accrued obligations allocated to the Funds under the Plan are reflected as Deferred Trustees’ fees in the Statements of Assets and Liabilities.
For the year ended November 30, 2022, net depreciation in the value of participants’ deferral accounts are reflected on the Statements of Operations as a reduction to expenses, as follows:
| | | | |
Fund | | Amount | |
Global Growth Fund | | | $ (3,714) | |
Senior Floating Rate and Fixed Income Fund | | | (54,892 | ) |
Select Fund | | | (14,878 | ) |
Certain officers and employees of Natixis Advisors and Loomis Sayles are also officers and/or Trustees of the Trust.
g. Affiliated Ownership. As of November 30, 2022, Natixis and affiliates and Loomis Sayles Employees’ Profit Sharing Retirement Plan (“Retirement Plan”) held shares of the Funds representing the following percentages of the Funds’ net assets:
| | | | | | |
Fund | | Natixis | | Retirement
Plan | |
Global Growth Fund | | 10.24% | | | 2.58 | % |
Senior Floating Rate and Fixed Income Fund | | — | | | 0.78 | % |
Investment activities of affiliated shareholders could have material impacts on the Funds.
h. Reimbursement of Transfer Agent Fees and Expenses. Natixis Advisors has given a binding contractual undertaking to the Funds to reimburse any and all transfer agency expenses for the Funds’ Class N shares. This undertaking is in effect through March 31, 2023 and is not subject to recovery under the expense limitation agreement described above.
| 48
Notes to Financial Statements (continued)
November 30, 2022
For the year ended November 30, 2022, Natixis Advisors reimbursed the Funds for transfer agency expenses as follows:
| | | | |
| | | Reimbursement of Transfer Agency Expenses | |
Fund | | Class N | |
Global Growth Fund | | $ | 1,100 | |
Senior Floating Rate and Fixed Income Fund | | | 1,017 | |
Select Fund | | | 1,040 | |
6. Class-Specific Transfer Agent Fees and Expenses. Transfer agent fees and expenses attributable to Class A, Class C and Class Y are allocated on a pro rata basis to each class based on the relative net assets of each class to the total net assets of those classes. Transfer agent fees and expenses attributable to Class N are allocated to Class N.
For the year ended November 30, 2022, the Funds incurred the following class-specific transfer agent fees and expenses (including sub-transfer agent fees, where applicable):
| | | | | | | | | | | | | | | | |
| | | Transfer Agent Fees and Expenses | |
Fund | | Class A | | | Class C | | | Class N | | | Class Y | |
Global Growth Fund | | $ | 3,927 | | | $ | 897 | | | $ | 1,100 | | | $ | 89,151 | |
Senior Floating Rate and Fixed Income Fund | | | 148,114 | | | | 54,267 | | | | 1,017 | | | | 783,347 | |
Select Fund | | | 9,966 | | | | 2,291 | | | | 1,040 | | | | 117,752 | |
7. Line of Credit. Global Growth Fund and Select Fund, together with certain other funds of Natixis Funds Trusts, Loomis Sayles Funds Trusts and Natixis ETF Trusts, entered into a $500,000,000 committed unsecured line of credit provided by State Street Bank. Any one Fund may borrow up to $350,000,000 under the line of credit agreement (as long as all borrowings by all Funds in the aggregate do not exceed the $500,000,000 limit at any time), subject to each Fund’s investment restrictions and its contractual obligations under the line of credit. Interest is charged to the Funds based upon the terms set forth in the agreement. In addition, a commitment fee of 0.15% per annum, payable at the end of each calendar quarter, is accrued and apportioned among the participating funds based on their average daily unused portion of the line of credit. The Funds paid certain legal fees in connection with the line of credit agreement, which are being amortized over a period of 364 days and are reflected in legal fees on the Statements of Operations. The unamortized balance is reflected as prepaid expenses on the Statements of Assets and Liabilities.
For the year ended November 30, 2022, Select Fund had an average daily balance on the line of credit (for those days on which there were borrowings) of $3,633,333 at a weighted average interest rate of 1.63%. Interest expense incurred on the line of credit was $987.
Senior Floating Rate and Fixed Income Fund has entered into a syndicated, committed, secured line of credit with Sumitomo Mitsui Banking Corporation (the “Administrative Agent”), the Bank of Nova Scotia, Houston Branch, BNP Paribas and Canadian Imperial Bank of Commerce, New York Branch (each a “Lender” and together with the Administrative Agent “Lenders”) under which it may borrow for investment or liquidity purposes. The commitment of the Lenders to make loans to the Fund shall not exceed $400,000,000 at any one time. Under the terms of the agreement, the Lenders are entitled to a security interest in the assets of the Fund as collateral. Interest is charged to the Fund based upon the terms set forth in the agreement. In addition, a commitment fee of 0.500% per annum payable to the Administrative Agent for the account of each Lender is accrued by the Fund based on the unused portion of the line of credit. The Fund paid the Administrative Agent an upfront fee of $500,000 and an administrative agent fee of $25,000, for a total of $525,000, which are being amortized over a period of 364 days and are reflected in legal fees on the Statements of Operations. The unamortized balance is reflected as prepaid expenses on the Statements of Assets and Liabilities.
Prior to November 10, 2022, Senior Floating Rate and Fixed Income Fund had entered into a syndicated, committed, secured line of credit with Sumitomo Mitsui Banking Corporation (the “Administrative Agent”), the Bank of Nova Scotia, Houston Branch, National Australia Bank Limited and Canadian Imperial Bank of Commerce, New York Branch (each a “Lender” and together with the Administrative Agent “Lenders”) under which it may have borrowed for investment or liquidity purposes. The commitment of the Lenders to make loans to the Fund was not to exceed $500,000,000 at any one time. Under the terms of the agreement, the Lenders were entitled to a security interest in the assets of the Fund as collateral. Interest was charged to the Fund based upon the terms set forth in the agreement. In addition, a commitment fee of 0.500% per annum payable to the Administrative Agent for the account of each Lender was accrued by the Fund based on the unused portion of the line of credit. The Fund paid the Administrative Agent an upfront fee of $625,000 and an administrative agent fee of $25,000, for a total of $650,000, which were being amortized over a period of 364 days and are reflected in legal fees on the Statements of Operations.
For the year ended November 30, 2022, Senior Floating Rate and Fixed Income Fund had no borrowings under these agreements.
49 |
Notes to Financial Statements (continued)
November 30, 2022
8. Risk. Global Growth Fund’s investments in foreign securities may be subject to greater political, economic, environmental, credit/ counterparty and information risks. The Fund’s investments in foreign securities also are subject to foreign currency fluctuations and other foreign currency-related risks. Foreign securities may be subject to higher volatility than U.S. securities, varying degrees of regulation and limited liquidity.
The Global Growth Fund may invest to a significant extent in variable interest entity (“VIE”) structures. VIE structures can vary, but generally consist of a U.S.-listed company with contractual arrangements, through one or more wholly-owned special purpose vehicles, with a Chinese company that ultimately provides the U.S.-listed company with contractual rights to obtain economic benefits from the Chinese company. The VIE structure enables foreign investors, such as the Fund, to obtain investment exposure similar to that of an equity owner in a Chinese company in situations in which the Chinese government has restricted or prohibited the ownership of such company by foreign investors. The Fund’s exposure to VIE structures may pose additional risks because the VIE structure is not formally recognized under Chinese law. The Chinese government may cease to tolerate VIE structures at any time or impose new restrictions. In addition, Chinese companies using the VIE structure, and listed on stock exchanges in the U.S., could also face delisting or other ramifications for failure to meet the expectations and/or requirements of the U.S. Securities and Exchange Commission, the Public Company Accounting Oversight Board, or other U.S. regulators. Any of these risks could reduce the liquidity and value of these investments or render them valueless.
Select Fund is non-diversified, which means that it is not limited under the 1940 Act to a percentage of assets that it may invest in any one issuer. Because the Fund may invest in the securities of a limited number of issuers, an investment in the Fund may involve a higher degree of risk than would be present in a diversified portfolio.
The senior loans in which Senior Floating Rate and Fixed Income Fund expects to invest will generally not be rated investment grade by the rating agencies. Economic downturns generally increase non-payment rates and a senior loan could lose a substantial part of its value prior to default. Senior loans are subject to credit risk, and secured loans may not be adequately collateralized. The interest rates of senior loans reset frequently, and thus senior loans are subject to interest rate risk (including risks associated with the expected transition away from LIBOR by June 30, 2023). There may also be less public information available about senior loans as compared to other debt securities.
Many floating rate loans issued after 2008 include a “LIBOR floor”, or a minimum interest rate to which the loan’s spread is added, to calculate the loan’s overall interest rate. As short-term market rates rise, such loans will not pay higher interest until prevailing rates exceed the floor rate stated in the loan document. If the Fund uses floating rate leverage, its leverage costs may increase before its loan portfolio income increases, and the additional income provided by leverage may diminish until market rates exceed the LIBOR floor level.
Senior loans are generally less liquid than many other debt securities. Transactions in senior loans may settle on a delayed basis, such that the Fund may not receive the proceeds from the sale of a loan for a substantial period of time (greater than seven days) after the sale. As a result, the proceeds related to the sale of senior loans may not be available to make additional investments or to meet the Fund’s redemption obligations until substantial period (greater than seven days) after the sale of the loans.
In addition, Russia’s military invasion of Ukraine in February 2022, the resulting responses by the United States and other countries, and the potential for wider conflict could increase volatility and uncertainty in the financial markets and adversely affect regional and global economies. These and any related events could significantly impact a Fund’s performance and the value of an investment in the Fund, even if the Fund does not have direct exposure to Russian issuers or issuers in other countries affected by the invasion.
9. Concentration of Ownership. From time to time, a Fund may have a concentration of one or more accounts constituting a significant percentage of shares outstanding. Investment activities by holders of such accounts could have material impacts on the Funds. As of November 30, 2022, based on management’s evaluation of the shareholder account base, the Funds had accounts representing controlling ownership of more than 5% of the Fund’s total outstanding shares. The number of such accounts, based on accounts that represent more than 5% of an individual class of shares, and the aggregate percentage of net assets represented by such holdings were as follows:
| | | | | | | | | | | | | | | | |
Fund | | Number of 5%
Non- Affiliated
Account Holders | | | Percentage of
Non- Affiliated
Ownership | | | Percentage
of Affiliated
Ownership
Ownership
(Note 5g) | | | Total
Percentage of
Ownership | |
Global Growth Fund | | | 3 | | | | 47.65 | % | | | 12.82% | | | | 60.47 | % |
Select Fund | | | 3 | | | | 26.55 | % | | | — | | | | 26.55 | % |
| 50
Notes to Financial Statements (continued)
November 30, 2022
Omnibus shareholder accounts for which Natixis Advisors understands that the intermediary has discretion over the underlying shareholder accounts or investment models where a shareholder account may be invested for a non-discretionary customer are included in the table above. For other omnibus accounts, the Funds do not have information on the individual shareholder accounts underlying the omnibus accounts; therefore, there could be other 5% shareholders in addition to those disclosed in the table above.
10. Capital Shares. Each Fund may issue an unlimited number of shares of beneficial interest, without par value. Transactions in capital shares were as follows:
Global Growth Fund
| | | | | | | | | | | | | | | | |
| | | Year Ended
November 30, 2022 | | | Year Ended
November 30, 2021 | |
| | | Shares | | | Amount | | | Shares | | | Amount | |
Class A | | | | | | | | | | | | | | | | |
Issued from the sale of shares | | | 34,564 | | | $ | 530,296 | | | | 116,974 | | | $ | 2,219,531 | |
Issued in connection with the reinvestment of distributions | | | 23,201 | | | | 416,129 | | | | 16,100 | | | | 294,736 | |
Redeemed | | | (150,976 | ) | | | (2,209,227 | ) | | | (71,074 | ) | | | (1,395,205 | ) |
| | | | | | | | | | | | | | | | |
Net change | | | (93,211 | ) | | $ | (1,262,802 | ) | | | 62,000 | | | $ | 1,119,062 | |
| | | | | | | | | | | | | | | | |
Class C | | | | | | | | | | | | | | | | |
Issued from the sale of shares | | | 6,077 | | | $ | 74,299 | | | | 17,440 | | | $ | 325,352 | |
Issued in connection with the reinvestment of distributions | | | 5,510 | | | | 94,792 | | | | 4,631 | | | | 82,175 | |
Redeemed | | | (19,719 | ) | | | (261,615 | ) | | | (21,296 | ) | | | (400,488 | ) |
| | | | | | | | | | | | | | | | |
Net change | | | (8,132 | ) | | $ | (92,524 | ) | | | 775 | | | $ | 7,039 | |
| | | | | | | | | | | | | | | | |
Class N | | | | | | | | | | | | | | | | |
Issued from the sale of shares | | | 102 | | | $ | 1,682 | | | | 157 | | | $ | 3,250 | |
Issued in connection with the reinvestment of distributions | | | 47,237 | | | | 858,053 | | | | 37,161 | | | | 686,183 | |
Redeemed | | | (194 | ) | | | (2,678 | ) | | | (236 | ) | | | (4,801 | ) |
| | | | | | | | | | | | | | | | |
Net change | | | 47,145 | | | $ | 857,057 | | | | 37,082 | | | $ | 684,632 | |
| | | | | | | | | | | | | | | | |
Class Y | | | | | | | | | | | | | | | | |
Issued from the sale of shares | | | 2,534,046 | | | $ | 39,498,284 | | | | 1,914,884 | | | $ | 37,562,396 | |
Issued in connection with the reinvestment of distributions | | | 394,539 | | | | 7,157,460 | | | | 273,013 | | | | 5,036,022 | |
Redeemed | | | (2,732,917 | ) | | | (39,216,322 | ) | | | (1,282,373 | ) | | | (25,120,649 | ) |
| | | | | | | | | | | | | | | | |
Net change | | | 195,668 | | | $ | 7,439,422 | | | | 905,524 | | | $ | 17,477,769 | |
| | | | | | | | | | | | | | | | |
Increase from capital share transactions | | | 141,470 | | | $ | 6,941,153 | | | | 1,005,381 | | | $ | 19,288,502 | |
| | | | | | | | | | | | | | | | |
51 |
Notes to Financial Statements (continued)
November 30, 2022
10. Capital Shares (continued).
Senior Floating Rate and Fixed Income Fund
| | | | | | | | | | | | | | | | |
| | | Year Ended
November 30, 2022 | | | Year Ended
November 30, 2021 | |
| | | Shares | | | Amount | | | Shares | | | Amount | |
Class A | | | | | | | | | | | | | | | | |
Issued from the sale of shares | | | 6,030,711 | | | $ | 52,286,645 | | | | 11,198,760 | | | $ | 100,713,711 | |
Issued in connection with the reinvestment of distributions | | | 1,000,307 | | | | 8,471,705 | | | | 615,096 | | | | 5,528,400 | |
Redeemed | | | (8,428,506 | ) | | | (71,768,362 | ) | | | (10,910,618 | ) | | | (97,668,838 | ) |
| | | | | | | | | | | | | | | | |
Net change | | | (1,397,488 | ) | | $ | (11,010,012 | ) | | | 903,238 | | | $ | 8,573,273 | |
| | | | | | | | | | | | | | | | |
Class C | | | | | | | | | | | | | | | | |
Issued from the sale of shares | | | 1,181,683 | | | $ | 10,329,386 | | | | 1,354,413 | | | $ | 12,140,709 | |
Issued in connection with the reinvestment of distributions | | | 345,552 | | | | 2,917,468 | | | | 288,437 | | | | 2,581,347 | |
Redeemed | | | (3,838,119 | ) | | | (32,784,817 | ) | | | (5,948,394 | ) | | | (53,277,576 | ) |
| | | | | | | | | | | | | | | | |
Net change | | | (2,310,884 | ) | | $ | (19,537,963 | ) | | | (4,305,544 | ) | | $ | (38,555,520 | ) |
| | | | | | | | | | | | | | | | |
Class N | | | | | | | | | | | | | | | | |
Issued from the sale of shares | | | — | | | $ | — | | | | 266,781 | | | $ | 2,403,000 | |
Issued in connection with the reinvestment of distributions | | | 15,795 | | | | 133,691 | | | | 3,956 | | | | 35,590 | |
Redeemed | | | (17,749 | ) | | | (150,540 | ) | | | (5,666 | ) | | | (50,953 | ) |
| | | | | | | | | | | | | | | | |
Net change | | | (1,954 | ) | | $ | (16,849 | ) | | | 265,071 | | | $ | 2,387,637 | |
| | | | | | | | | | | | | | | | |
Class Y | | | | | | | | | | | | | | | | |
Issued from the sale of shares | | | 61,545,349 | | | $ | 540,426,224 | | | | 71,351,144 | | | $ | 642,588,404 | |
Issued in connection with the reinvestment of distributions | | | 5,450,189 | | | | 46,375,759 | | | | 3,527,028 | | | | 31,734,373 | |
Redeemed | | | (109,033,046 | ) | | | (928,364,908 | ) | | | (37,372,397 | ) | | | (336,024,365 | ) |
| | | | | | | | | | | | | | | | |
Net change | | | (42,037,508 | ) | | $ | (341,562,925 | ) | | | 37,505,775 | | | $ | 338,298,412 | |
| | | | | | | | | | | | | | | | |
Increase (decrease) from capital share transactions | | | (45,747,834 | ) | | $ | (372,127,749 | ) | | | 34,368,540 | | | $ | 310,703,802 | |
| | | | | | | | | | | | | | | | |
Select Fund
| | | | | | | | | | | | | | | | |
| | | Year Ended
November 30, 2022 | | | Year Ended
November 30, 2021 | |
| | | Shares | | | Amount | | | Shares | | | Amount | |
Class A | | | | | | | | | | | | | | | | |
Issued from the sale of shares | | | 1,106,092 | | | $ | 21,096,534 | | | | 226,662 | | | $ | 5,364,435 | |
Issued in connection with the reinvestment of distributions | | | 311,491 | | | | 6,067,835 | | | | 44,903 | | | | 855,396 | |
Redeemed | | | (816,595 | ) | | | (14,045,519 | ) | | | (186,594 | ) | | | (4,217,826 | ) |
| | | | | | | | | | | | | | | | |
Net change | | | 600,988 | | | $ | 13,118,850 | | | | 84,971 | | | $ | 2,002,005 | |
| | | | | | | | | | | | | | | | |
Class C | | | | | | | | | | | | | | | | |
Issued from the sale of shares | | | 213,807 | | | $ | 3,394,770 | | | | 32,268 | | | $ | 600,100 | |
Issued in connection with the reinvestment of distributions | | | 90,041 | | | | 1,586,526 | | | | 18,366 | | | | 328,014 | |
Redeemed | | | (148,023 | ) | | | (2,279,674 | ) | | | (112,547 | ) | | | (2,361,919 | ) |
| | | | | | | | | | | | | | | | |
Net change | | | 155,825 | | | $ | 2,701,622 | | | | (61,913 | ) | | $ | (1,433,805 | ) |
| | | | | | | | | | | | | | | | |
Class N | | | | | | | | | | | | | | | | |
Issued from the sale of shares | | | 18,971 | | | $ | 297,023 | | | | — | | | $ | — | |
Issued in connection with the reinvestment of distributions | | | 32 | | | | 628 | | | | 6 | | | | 112 | |
Redeemed | | | (2,532 | ) | | | (39,785 | ) | | | — | | | | — | |
| | | | | | | | | | | | | | | | |
Net change | | | 16,471 | | | $ | 257,866 | | | | 6 | | | $ | 112 | |
| | | | | | | | | | | | | | | | |
Class Y | | | | | | | | | | | | | | | | |
Issued from the sale of shares | | | 17,605,549 | | | $ | 314,106,172 | | | | 1,641,474 | | | $ | 37,234,397 | |
Issued in connection with the reinvestment of distributions | | | 3,204,671 | | | | 62,971,719 | | | | 564,849 | | | | 10,816,866 | |
Redeemed | | | (6,818,076 | ) | | | (120,752,981 | ) | | | (3,915,145 | ) | | | (82,084,285 | ) |
| | | | | | | | | | | | | | | | |
Net change | | | 13,992,144 | | | $ | 256,324,910 | | | | (1,708,822 | ) | | $ | (34,033,022 | ) |
| | | | | | | | | | | | | | | | |
Increase (decrease) from capital share transactions | | | 14,765,428 | | | $ | 272,403,248 | | | | (1,685,758 | ) | | $ | (33,464,710 | ) |
| | | | | | | | | | | | | | | | |
| 52
Report of Independent Registered Public Accounting Firm
To the Board of Trustees of Natixis Funds Trust II and Shareholders of Loomis Sayles Global Growth Fund, Loomis Sayles Senior Floating Rate and Fixed Income Fund, and Vaughan Nelson Select Fund:
Opinions on the Financial Statements
We have audited the accompanying statements of assets and liabilities, including the portfolios of investments, of Loomis Sayles Global Growth Fund, Loomis Sayles Senior Floating Rate and Fixed Income Fund, and Vaughan Nelson Select Fund (three of the funds constituting Natixis Funds Trust II, hereafter collectively referred to as the “Funds”) as of November 30, 2022, the related statements of operations for the year ended November 30, 2022, the statements of changes in net assets for each of the two years in the period ended November 30, 2022, including the related notes, and the financial highlights for each of the five years in the period ended November 30, 2022 (collectively referred to as the “financial statements”). In our opinion, the financial statements present fairly, in all material respects, the financial position of each of the Funds as of November 30, 2022, the results of each of their operations for the year then ended, the changes in each of their net assets for each of the two years in the period ended November 30, 2022 and each of the financial highlights for each of the five years in the period ended November 30, 2022, in conformity with accounting principles generally accepted in the United States of America.
Basis for Opinions
These financial statements are the responsibility of the Funds’ management. Our responsibility is to express an opinion on the Funds’ financial statements based on our audits. We are a public accounting firm registered with the Public Company Accounting Oversight Board (United States) (PCAOB) and are required to be independent with respect to the Funds in accordance with the U.S. federal securities laws and the applicable rules and regulations of the Securities and Exchange Commission and the PCAOB.
We conducted our audits of these financial statements in accordance with the standards of the PCAOB. Those standards require that we plan and perform the audit to obtain reasonable assurance about whether the financial statements are free of material misstatement, whether due to error or fraud.
Our audits included performing procedures to assess the risks of material misstatement of the financial statements, whether due to error or fraud, and performing procedures that respond to those risks. Such procedures included examining, on a test basis, evidence regarding the amounts and disclosures in the financial statements. Our audits also included evaluating the accounting principles used and significant estimates made by management, as well as evaluating the overall presentation of the financial statements. Our procedures included confirmation of securities owned as of November 30, 2022, by correspondence with the custodian, agent banks and brokers; when replies were not received from brokers, we performed other auditing procedures. We believe that our audits provide a reasonable basis for our opinions.
/s/PricewaterhouseCoopers LLP
Boston, Massachusetts
January 23, 2023
We have served as the auditor of one or more investment companies in the Natixis Investment Company Complex since at least 1995. We have not determined the specific year we began serving as auditor.
53 |
2022 U.S. Tax Distribution Information to Shareholders (Unaudited)
Corporate Dividends Received Deduction. For the fiscal year ended November 30, 2022, a percentage of dividends distributed by the Funds listed below qualifies for the dividends received deduction for corporate shareholders. These percentages are as follows:
| | | | |
Fund | | Qualifying
Percentage | |
Global Growth Fund | | | 100.00 | % |
Select Fund | | | 4.55 | % |
Capital Gains Distributions. Pursuant to Internal Revenue Section 852(b), the following Funds paid distributions, which have been designated as capital gains distributions for the fiscal year ended November 30, 2022, unless subsequently determined to be different.
| | | | |
Fund | | Amount | |
Global Growth Fund | | $ | 8,809,601 | |
Select Fund | | | 36,479,566 | |
Qualified Dividend Income. For the fiscal year ended November 30, 2022, the Funds below will designate up to the maximum amount allowable pursuant to the Internal Revenue Code as qualified dividend income eligible for reduced tax rates. These lower rates range from 0% to 20% depending on an individual’s tax bracket. If the Funds pay a distribution during calendar year 2022, complete information will be reported in conjunction with Form 1099-DIV.
|
Fund |
Global Growth Fund |
Select Fund |
| 54
Trustee and Officer Information
The tables below provide certain information regarding the Trustees and officers of Natixis Funds Trust II (the “Trust”). Unless otherwise indicated, the address of all persons below is 888 Boylston Street, Suite 800, Boston, MA 02199-8197. The Funds’ Statement of Additional Information includes additional information about the Trustees of the Trust and is available by calling Natixis Funds at 800-225-5478.
| | | | | | | | |
Name and Year of Birth | | Position(s) Held with the Trust, Length of Time Served and Term of Office1 | | Principal Occupation(s) During Past 5 Years | | Number of Portfolios in Fund Complex Overseen2 and Other Directorships Held During Past 5 Years | | Experience,
Qualifications,
Attributes, Skills for
Board Membership |
| | | |
| INDEPENDENT TRUSTEES | | | | | | |
| | | | |
Edmond J. English
(1953) | | Trustee since 2013 Chairperson of the Governance Committee and Contract Review Committee Member | | Executive Chairman of Bob’s Discount Furniture (retail) | | 54 Director, Burlington Stores, Inc. (retail) and Director, Rue Gilt Groupe, Inc. (e-commerce retail) | | Significant experience on the Board and on the boards of other business organizations (including retail companies and a bank); executive experience (including at a retail company) |
| | | | |
Richard A. Goglia
(1951) | | Trustee since 2015 Audit Committee Member and Governance Committee Member | | Retired | | 54 Formerly, Director of Triumph Group (aerospace industry) | | Significant experience on the Board and executive experience (including his role as vice president and treasurer of a defense company and experience at a financial services company) |
| | | | |
Wendell J. Knox
(1948) | | Trustee since 2009 Chairperson of the Contract Review Committee | | Retired | | 54 Director, Abt Associates Inc. (research and consulting); Director, The Hanover Insurance Group (property and casualty insurance); Formerly, Director, Eastern Bank (bank) | | Significant experience on the Board and on the boards of other business organizations (including at a bank and at a property and casualty insurance firm); executive experience (including roles as president and chief executive officer of a research and consulting company) |
| | | | |
Martin T. Meehan
(1956) | | Trustee since 2012 Contract Review Committee Member and Governance Committee Member | | President, University of Massachusetts | | 54 None | | Significant experience on the Board and on the boards of other business organizations; experience as President of the University of Massachusetts; government experience (including as a member of the U.S. House of Representatives); academic experience |
55 |
Trustee and Officer Information
| | | | | | | | |
Name and Year of Birth | | Position(s) Held with the Trust, Length of Time Served and Term of Office1 | | Principal Occupation(s) During Past 5 Years | | Number of Portfolios in Fund Complex Overseen2 and Other Directorships Held During Past 5 Years | | Experience,
Qualifications,
Attributes, Skills for
Board Membership |
| | | |
| INDEPENDENT TRUSTEES – continued | | | | | | |
| | | | |
Maureen B. Mitchell
(1951) | | Trustee since 2017 Contract Review Committee Member and Governance Committee Member | | Retired | | 54 Director, Sterling Bancorp (bank) | | Significant experience on the Board; financial services industry and executive experience (including role as president of global sales and marketing at a financial services company) |
| | | | |
James P. Palermo
(1955) | | Trustee since 2016 Audit Committee Member | | Founding Partner, Breton Capital Management, LLC (private equity); Partner, STEP Partners, LLC (private equity) | | 54 Director, FutureFuel.io (chemicals and biofuels) | | Significant experience on the Board; financial services industry and executive experience (including roles as chief executive officer of client management and asset servicing for a banking and financial services company) |
| | | | |
Erik R. Sirri
(1958) | | Chairperson of the Board of Trustees since January 2021 Trustee since 2009 Ex Officio member of the Audit Committee, Contract Review Committee and Governance Committee | | Professor of Finance at Babson College | | 54 None | | Significant experience on the Board; experience as Director of the Division of Trading and Markets at the Securities and Exchange Commission; academic experience; training as an economist |
| | | | |
Peter J. Smail
(1952) | | Trustee since 2009 Audit Committee Member | | Retired | | 54 None | | Significant experience on the Board; mutual fund industry and executive experience (including roles as president and chief executive officer for an investment adviser) |
| 56
Trustee and Officer Information
| | | | | | | | |
Name and Year of Birth | | Position(s) Held with the Trust, Length of Time Served and Term of Office1 | | Principal Occupation(s) During Past 5 Years | | Number of Portfolios in Fund Complex Overseen2 and Other Directorships Held During Past 5 Years | | Experience,
Qualifications,
Attributes, Skills for
Board Membership |
| | | |
| INDEPENDENT TRUSTEES – continued | | | | | | |
| | | | |
Kirk A. Sykes
(1958) | | Trustee since 2019 Audit Committee Member and Governance Committee Member | | Managing Director of Accordia Partners, LLC (real estate development); President of Primary Corporation (real estate development); Managing Principal of Merrick Capital Partners (infrastructure finance) | | 54 Advisor Eastern Bank (bank); Director, Apartment Investment and Management Company (real estate investment trust); formerly Director, Ares Commercial Real Estate Corporation (real estate investment trust) | | Experience on the Board and significant experience on the boards of other business organizations (including real estate companies and banks) |
| | | | |
Cynthia L. Walker
(1956) | | Trustee since 2005 Chairperson of the Audit Committee | | Retired; Formerly, Deputy Dean for Finance and Administration, Yale University School of Medicine | | 54 None | | Significant experience on the Board; executive experience in a variety of academic organizations (including roles as dean for finance and administration) |
|
| INTERESTED TRUSTEES |
| | | | |
Kevin P. Charleston3
(1965)
One Financial Center
Boston, MA 02111 | | Trustee since 2015 | | President, Chief Executive Officer and Chairman of the Board of Directors, Loomis, Sayles & Company, L.P. | | 54 None | | Significant experience on the Board; continuing service as President, Chief Executive Officer and Chairman of the Board of Directors of Loomis, Sayles & Company, L.P. |
| | | | |
David L. Giunta4
(1965) | | Trustee since 2011 President and Chief Executive Officer since 2008 | | President and Chief Executive Officer, Natixis Advisors, LLC and Natixis Distribution, LLC | | 54 None | | Significant experience on the Board; experience as President and Chief Executive Officer of Natixis Advisors, LLC and Natixis Distribution, LLC |
| 1 | Each Trustee serves until retirement, resignation or removal from the Board. The current retirement age is 75. The position of Chairperson of the Board is appointed for a three-year term. |
| 2 | The Trustees of the Trust serve as Trustees of a fund complex that includes all series of the Natixis Funds Trust I, Natixis Funds Trust II, Natixis Funds Trust IV, Gateway Trust, Loomis Sayles Funds I, Loomis Sayles Funds II, Natixis ETF Trust and Natixis ETF Trust II (collectively, the “Fund Complex”). |
| 3 | Mr. Charleston is deemed an “interested person” of the Trust because he holds the following positions with an affiliated person of the Trust: President, Chief Executive Officer and Chairman of the Board of Directors of Loomis, Sayles & Company, L.P. |
| 4 | Mr. Giunta is deemed an “interested person” of the Trust because he holds the following positions with an affiliated person of the Trust: President and Chief Executive Officer, Natixis Advisors, LLC and Natixis Distribution, LLC. |
57 |
Trustee and Officer Information
| | | | | | |
Name and Year of Birth | | Position(s) Held with the Trust | | Term of Office1 and Length
of Time Served | | Principal Occupation(s) During Past 5 Years2 |
|
| OFFICERS OF THE TRUST |
| | | |
Matthew Block
(1981) | | Treasurer, Principal Financial and Accounting Officer | | Since 2022 | | Senior Vice President, Natixis Advisors, LLC and Natixis Distribution, LLC; formerly, Vice President, Natixis Advisors, LLC and Natixis Distribution, LLC; Assistant Treasurer of the Fund Complex; Managing Director, State Street Bank and Trust Company |
| | | |
Susan McWhan Tobin
(1963) | | Secretary and Chief Legal Officer | | Since 2022 | | Executive Vice President, General Counsel and Secretary, Natixis Advisors, LLC and Natixis Distribution, LLC; formerly, Executive Vice President and Chief Compliance Officer of Natixis Investment Managers (March 2019 – May 2022) and Senior Vice President and Head of Compliance, US for Natixis Investment Managers (July 2011–March 2019) |
| | | |
Natalie R. Wagner
(1979) | | Chief Compliance Officer, Assistant Secretary and Anti-Money Laundering Officer | | Since 2021 | | Senior Vice President, Natixis Advisors, LLC and Natixis Distribution, LLC; formerly, Vice President, Head of Corporate Compliance, Global Atlantic Financial Group |
| 1 | Each officer of the Trust serves for an indefinite term in accordance with the Trust’s current by-laws until the date his or her successor is elected and qualified, or until he or she sooner dies, retires, is removed or becomes disqualified. |
| 2 | Each person listed above, except as noted, holds the same position(s) with the Fund Complex. Previous positions during the past five years with Natixis Distribution, LLC, Natixis Advisors, LLC or Loomis, Sayles & Company, L.P. are omitted, if not materially different from an officer’s current position with such entity. |
| 58
Item 2. Code of Ethics.
The Registrant has adopted a code of ethics that applies to the Registrant’s principal executive officer, principal financial officer and persons performing similar functions. There have been no amendments or waivers of the Registrant’s code of ethics during the period.
Item 3. Audit Committee Financial Expert.
The Board of Trustees of the Registrant has established an audit committee. Mr. Martin T. Meehan, Ms. Maureen Mitchell, Mr. James Palermo, Mr. Peter Smail, and Ms. Cynthia L. Walker are members of the audit committee and have been designated as “audit committee financial experts” by the Board of Trustees. Each of these individuals is also an Independent Trustee of the Registrant.
Item 4. Principal Accountant Fees and Services.
Fees billed by the Principal Accountant for services rendered to the Registrant.
The table below sets forth fees billed by the principal accountant, PricewaterhouseCoopers LLP, for the past two fiscal years for professional services rendered in connection with a) the audit of the Registrant’s annual financial statements and services provided in connection with regulatory filings; b) audit-related services (including services that are reasonably related to the performance of the audit of the Registrant’s financial statements but not reported under “Audit Fees”); c) tax compliance, tax advice and tax planning; and d) all other fees billed for professional services rendered by the principal accountant to the Registrant, other than the services reported as a part of (a) through (c) of this Item.
| | | | | | | | | | | | | | | | | | | | | | | | | | | | | | | | |
| | | Audit fees | | | Audit-related fees1 | | | Tax fees2 | | | All other fees | |
| | | 12/1/20-
11/30/21 | | | 12/1/21-
11/30/22 | | | 12/1/20-
11/30/21 | | | 12/1/21-
11/30/22 | | | 12/1/20-
11/30/21 | | | 12/1/21-
11/30/22 | | | 12/1/20-
11/30/21 | | | 12/1/21-
11/30/22 | |
| Natixis Funds Trust II- Loomis Sayles Global Growth Fund, Loomis Sayles Senior Floating Rate and Fixed Income Fund and Vaughan Nelson Select Fund | | $ | 146,394 | | | $ | 155,178 | | | $ | 300 | | | $ | 329 | | | $ | 23,969 | | | $ | 25,407 | | | $ | — | | | $ | — | |
| 1. | Audit-related fees consist of: |
2021 & 2022 – performance of agreed-upon procedures related to the Registrant’s deferred compensation plan.
2021 & 2022 – review of Registrant’s tax returns
Aggregate fees billed to the Registrant for non-audit services during 2021 and 2022 were $24,269 and $25,736, respectively.
The following table sets forth the fees billed by the Registrant’s principal accountant for non-audit services rendered to Loomis, Sayles & Company, L.P. (“Loomis”), Natixis Advisors, LLC (“Natixis”) and entities controlling, controlled by or under common control with Loomis and Natixis (“Control Affiliates”) that provide ongoing services to the Registrant, for engagements that related directly to the operations and financial reporting of the Registrant for the last two fiscal years.
| | | | | | | | | | | | | | | | | | | | | | | | |
| | | Audit-related fees | | | Tax fees | | | All other fees | |
| | | 12/1/20-11/30/21 | | | 12/1/21-11/30/22 | | | 12/1/20-11/30/21 | | | 12/1/21-11/30/22 | | | 12/1/20-11/30/21 | | | 12/1/21-11/30/22 | |
Control Affiliates | | $ | — | | | $ | — | | | $ | — | | | $ | — | | | $ | — | | | $ | 50,000 | |
The following table sets forth the aggregate fees billed by the Registrant’s principal accountant for non-audit services rendered to Loomis, Natixis and Control Affiliates that provide ongoing services to the Registrant, for the last two fiscal years, including the fees disclosed in the table above.
| | | | | | | | |
| | | Aggregate Non-Audit Fees | |
| | | 12/1/20-11/30/21 | | | 12/1/21-11/30/22 | |
Control Affiliates | | $ | 972 | | | $ | 50,000 | |
None of the services described above were approved pursuant to (c)(7)(i)(C) of Regulation S-X.
Audit Committee Pre-Approval Policies.
Annually, the Registrant’s Audit Committee reviews the audit, audit-related, tax and other non-audit services together with the projected fees, for services proposed to be rendered to the Registrant and/or other entities for which pre-approval is required during the upcoming year. Any subsequent revisions to already pre-approved services or fees (including fee increases) and requests for pre-approval of new services would be presented for consideration quarterly as needed.
If, in the opinion of management, a proposed engagement by the Registrant’s independent accountants needs to commence before the next regularly scheduled Audit Committee meeting, any member of the Audit Committee who is an Independent Trustee of the Registrant is authorized to pre-approve the engagement, but only for engagements to provide audit, audit related and tax services. This approval is subject to review of the full Audit Committee at its next quarterly meeting. All other engagements require the approval of all the members of the Audit Committee.
Item 5. Audit Committee of Listed Registrants.
Not applicable.
Item 6. Schedule of Investments.
Included as part of the Report to Shareholders filed as Item 1 herewith.
Item 7. Disclosure of Proxy Voting Policies and Procedures for Closed-End Management Investment Companies.
Not applicable.
Item 8. Portfolio Managers of Closed-End Management Investment Companies.
Not applicable.
Item 9. Purchases of Equity Securities by Closed-End Management Investment Companies and Affiliated Purchasers.
Not applicable.
Item 10. Submission of Matters to a Vote of Securities Holders.
There were no material changes to the procedures by which shareholders may recommend nominees to the Registrant’s Board of Trustees.
Item 11. Controls and Procedures.
The Registrant’s principal executive officer and principal financial officer have concluded that the Registrant’s disclosure controls and procedures are sufficient to ensure that information required to be disclosed by the Registrant in this Form N-CSR was recorded, processed, summarized and reported within the time periods specified in the Securities and Exchange Commission’s rules and forms, based upon such officers’ evaluation of these controls and procedures as of a date within 90 days of the filing date of the report.
There were no changes in the Registrant’s internal control over financial reporting that occurred during the period covered by the report that have materially affected, or is reasonably likely to materially affect, the Registrant’s internal control over financial reporting.
Item 12. Disclosure of Securities Lending Activities for Closed-End Management Investment Companies.
Not applicable.
Item 13. Exhibits.
SIGNATURES
Pursuant to the requirements of the Securities Exchange Act of 1934 and the Investment Company Act of 1940, the Registrant has duly caused this report to be signed on its behalf by the undersigned, thereunto duly authorized.
| | |
| Natixis Funds Trust II |
| |
| By: | | /s/ David L. Giunta |
| Name: | | David L. Giunta |
| Title: | | President and Chief Executive Officer |
| Date: | | January 23, 2023 |
Pursuant to the requirements of the Securities Exchange Act of 1934 and the Investment Company Act of 1940, this report has been signed by the following persons on behalf of the Registrant and in the capacities and on the dates indicated.
| | |
| By: | | /s/ David L. Giunta |
| Name: | | David L. Giunta |
| Title: | | President and Chief Executive Officer |
| Date: | | January 23, 2023 |
| |
| By: | | /s/ Matthew Block |
| Name: | | Matthew Block |
| Title: | | Treasurer and Principal Financial and Accounting Officer |
| Date: | | January 23, 2023 |